
Energetics and structures of small clusters: Pt N , N=2–21
19
Energetics and structures of small clusters: Pt N , N ¼ 2–21 Ali Sebetci a, * , Ziya B. G€ uvenc ß b a Department of Computer Engineering, C ß ankaya University, 06530 Balgat Ankara, Turkey b Department of Electronic and Communication Engineering, C ß ankaya University, 06530 Balgat Ankara, Turkey Received 13 April 2002; accepted for publication 27 October 2002 Abstract The Voter and Chen version of an embedded-atom model, derived by fitting to experimental data of both diatomic molecule and bulk platinum simultaneously, has been applied to study the locally stable structures, energies and growth patterns of small platinum clusters in the size range of N ¼ 2–21. Using molecular dynamics and thermal quenching simulations, the global minima and the other locally stable structures have been distinguished from those stationary structures that correspond to saddle points of the potential energy surface. Ten thousand independent initial config- urations generated at high temperatures (about 2600 K) were used to obtain the number of isomers and the proba- bilities of sampling different basins of attractions, for each size of the clusters. Their energy spectra have been analyzed. Comparisons have been made with the results of previous calculations using electronic structure and empirical potential methods. Although many of the lowest energy structures correspond to icosahedral growth, a number of new structures have been identified for N ¼ 15, 16, 17, 18, 20 and 21. It has been found that the lowest energy structures are not always the most probable isomers for each size. Ó 2002 Elsevier Science B.V. All rights reserved. Keywords: Clusters; Platinum 1. Introduction In general, interest on the area of atomic clus- ters has grown rapidly within the last three decades not only because of their unique, size dependent structures and properties different from those of the bulk, but also their central position between molecules, on the one hand, and condensed matter on the other. A systematic study of evolution of these properties with size allows elucidation of the transition from the molecular structure to con- densed matter phase. Clusters, in particular metal clusters, play an important role in many chemical reactions as catalysts. The structure of small metal clusters in a reaction can have a major effect on the rate of formation of products [1]. Because of above reasons there are considerable numbers of experi- mental and theoretical studies on clusters in the literature [2–5]. It is possible to form the transition metal clus- ters in the gas phase, where they can be cooled to low internal energies. After such species have been formed and cooled, their electronic and molecular * Corresponding author. Present address: Department of Physics, Middle East Technical University, 06530 Balgat Ankara, Turkey. Tel.: +90-312-2844500; fax: +90-312-2848043. E-mail addresses: [email protected] (A. Sebetci), [email protected] (Z.B. Gu ¨ venc ¸). 0039-6028/02/$ - see front matter Ó 2002 Elsevier Science B.V. All rights reserved. PII:S0039-6028(02)02502-5 Surface Science 525 (2003) 66–84 www.elsevier.com/locate/susc
Transcript of Energetics and structures of small clusters: Pt N , N=2–21

Energetics and structures of small clusters: PtN , N ¼ 2–21
Ali Sebetci a,*, Ziya B. G€uuvenc� b
a Department of Computer Engineering, C�ankaya University, 06530 Balgat Ankara, Turkeyb Department of Electronic and Communication Engineering, C�ankaya University, 06530 Balgat Ankara, Turkey
Received 13 April 2002; accepted for publication 27 October 2002
Abstract
The Voter and Chen version of an embedded-atom model, derived by fitting to experimental data of both diatomic
molecule and bulk platinum simultaneously, has been applied to study the locally stable structures, energies and growth
patterns of small platinum clusters in the size range of N ¼ 2–21. Using molecular dynamics and thermal quenching
simulations, the global minima and the other locally stable structures have been distinguished from those stationary
structures that correspond to saddle points of the potential energy surface. Ten thousand independent initial config-
urations generated at high temperatures (about 2600 K) were used to obtain the number of isomers and the proba-
bilities of sampling different basins of attractions, for each size of the clusters. Their energy spectra have been analyzed.
Comparisons have been made with the results of previous calculations using electronic structure and empirical potential
methods. Although many of the lowest energy structures correspond to icosahedral growth, a number of new structures
have been identified for N ¼ 15, 16, 17, 18, 20 and 21. It has been found that the lowest energy structures are not always
the most probable isomers for each size.
� 2002 Elsevier Science B.V. All rights reserved.
Keywords: Clusters; Platinum
1. Introduction
In general, interest on the area of atomic clus-
ters has grown rapidly within the last three decades
not only because of their unique, size dependent
structures and properties different from those of
the bulk, but also their central position between
molecules, on the one hand, and condensed matter
on the other. A systematic study of evolution of
these properties with size allows elucidation of thetransition from the molecular structure to con-
densed matter phase. Clusters, in particular metal
clusters, play an important role in many chemical
reactions as catalysts. The structure of small metal
clusters in a reaction can have a major effect on the
rate of formation of products [1]. Because of above
reasons there are considerable numbers of experi-
mental and theoretical studies on clusters in theliterature [2–5].
It is possible to form the transition metal clus-
ters in the gas phase, where they can be cooled to
low internal energies. After such species have been
formed and cooled, their electronic and molecular
*Corresponding author. Present address: Department of
Physics, Middle East Technical University, 06530 Balgat
Ankara, Turkey. Tel.: +90-312-2844500; fax: +90-312-2848043.
E-mail addresses: [email protected] (A. Sebetci),
[email protected] (Z.B. Guvenc).
0039-6028/02/$ - see front matter � 2002 Elsevier Science B.V. All rights reserved.
PII: S0039 -6028 (02 )02502 -5
Surface Science 525 (2003) 66–84
www.elsevier.com/locate/susc

architecture can be probed in detail using various
elegant spectroscopies, such as resonant two-pho-
ton ionization (R2PI) [6–8] and dissociation spec-
troscopies (R2PD) [9], laser-induced fluorescence
(LIF) [10–13], and photoelectron spectroscopy
(PES) [14–16].The theoretical studies of atomic clusters can be
classified into two groups as density functional
(DF) ab initio methods, and the empirical poten-
tials for the simulations. The advantage of the first
group methods is that in principle they can provide
highly accurate results. However, these approaches
are much more computationally expensive than
empirical potentials, as known. The pair interac-tion potentials on the other hand, are not adequate
to characterize the metals. The embedded atom
method (EAM), which requires 2–5 times the work
of a pair potential includes many-body effects that
are important for the description of metallic sys-
tems is more adequate. Therefore in this study the
Pt clusters are characterized by a semi-empirical
Voter and Chen [17] version of the EAM. Thevirtue of Voter and Chen version is that it is de-
rived by fitting the EAM to both the basic bulk
properties of the Pt and to the bond length and
bond energy of the diatomic molecule Pt2 simul-
taneously [18–20]. As a result this EAM may have
a wide range of validity from a few atoms to the
larger sizes of the PtN clusters.
Platinum, rhodium, and palladium have beenused very extensively in heterogeneous catalysis,
especially for the reactions involving CO and H2.
For example, they are used in automotive exhaust
systems to reduce toxic pollutants such as CO,
NO, and hydrocarbons. Platinum clusters have
small hydrogenation energy compared to other
metal clusters [21].
Experimental studies on small Pt clusters arescarce. The only case of small Pt clusters that has
been studied experimentally to our knowledge, is
the Pt2 cluster. Taylor et al. [22] used resonant
two-photon ionization spectroscopy of jet-cooled
Pt2 to find numerous vibronic bands of it. Jansson
and Scullman [23] measured the vibrational spec-
trum of a Pt2 in an Ar matrix. Gupta et al. [24]
were successful in detecting Pt2 over the tempera-ture range 2259–2739 K. On the theoretical side,
Sachdev et al. [25] studied some of the Pt clusters
of 5–60 atoms using the EAM of Daw and Baskes
[26]. They made a stability analysis where they
started with a fixed shape (e.g., an icosahedron)
and did a conjugate gradient (CG) minimization
[27] to calculate a relaxed shape. Garcia-Rodeja
et al. [28] used the Voter and Chen version of theEAM by carrying out molecular dynamics (MD)
simulations to study the structures and melting of
6 fcc transition metals (Ni, Pd, Pt, Cu, Ag, and
Au) in the size range N ¼ 2–23. However, they did
not present neither the stable isomeric forms, nor
their probabilities of sampling. Yang and DePristo
[29] performed the MD/Monte Carlo, corrected
effective medium theory (MD/MC-CEM) [30] tostudy only 13-atom Pt clusters using two different
interatomic potentials. Finally, Doye and Wales
[31] reported the global minima for metal clusters
modelled by the Sutton–Chen [32] family of po-
tentials containing up to 80 atoms, using a Monte
Carlo minimization global optimization algorithm
[33]. They did not present the other low energy
minima, and their probabilities of sampling, either.There are also a few ab initio studies on the
small Pt clusters. Ellis et al. [34] studied the Pt4cluster using an ab initio generalized valence bond
method within the relativistic effective core po-
tential and a double-zeta basis. Complete active
space self consistent-field (CASSCF) calculations
followed by the first-order configuration interac-
tion (FOCI) computations has been performed byBalasubramanian [21] on the Pt2 and by Dai and
Balasubramanian [35] on the Pt4 clusters to study
their electronic structures. Yang et al. [36] applied
the non-self consistent Harris functional version
[37] of the local density approximations (LDA)
within DF theory to obtain minimum energy
structures of the PtN clusters for N ¼ 2–6. Fortu-
nelli [38] has performed DF calculations on thesmall PtN clusters (N ¼ 1–4) by using Amsterdam
density functional (ADF) set of programs [39].
Finally, Apra and Fortunelli [40] have performed
DF calculations on Pt13 and Pt55 cuboctahedral
clusters by using DF theory module of the NW-
Chen computational chemistry package [41].
In this work, we have carried out MD and
thermal quenching (TQ) simulations to study thelowest energy structures of the PtN clusters, and
their number of stable isomers for the size range of
A. Sebetci, Z.B. G€uuvenc� / Surface Science 525 (2003) 66–84 67

N ¼ 2–21. In addition, clusters� growth pathways,
probabilities of sampling the basins of attraction
of the stable isomers, and their energy spectrum
widths (ESW) which are defined by the energy
difference between the most and the least stable
isomers have been analyzed. Further, temperatureeffect on the isomer sampling probabilities of the
Pt9 clusters are discussed. As seen from these ob-
jectives our present study is different from the
theoretical studies which incorporated empirical
potentials discussed in this paper. The interaction
potential and the computational procedure will be
discussed in Section 2. Results and discussions are
presented in Section 3, and conclusions are givenin Section 4.
2. Interaction potential and computational proce-
dure
In any N -scaling energy expression, the total
energy, Etot of a system of N atoms can be writtenas a sum
Etot ¼XNi
Ei: ð1Þ
In the EAM, the configuration energy Ei of each
atom i is represented as
Ei ¼1
2
Xj 6¼i
/ijðrijÞ þ Fið�qqiÞ; ð2Þ
where Fi is the embedding term, /ij is the pairwise-
addition part of the interaction between atoms iand j, rij is the distance between atoms i and j, and�qqi is the total ‘‘host’’ electron density at the posi-
tion of atom i:
�qqi ¼Xj 6¼i
qjðrijÞ: ð3Þ
The sums over neighboring atoms j are limited by
the range of the cutoff for / and q, which is gen-
erally one to four neighbor shells in the perfect
crystal. F ð�qqÞ provides a many-body contribution
to the energy.
All the parameters in the Voter and Chen model
were determined by minimizing the root-mean-square deviation (vrms) between the calculated and
experimental values of three elastic constants (C11,
C12, and C44), and the unrelaxed vacancy forma-
tion energy (Efvac) of the bulk platinum and of the
bond length (Re) and bond strength (De) of the
diatomic molecule. The use of molecular data
leads one to expect the Voter and Chen�s model tobe more suitable for small clusters. The experi-
mental data used in the fitting process along with
the calculated values can be found in Ref. [17].
In this study, the equilibrium structural forms
of PtN , N ¼ 2–21, clusters are obtained using MD
and TQ simulations. Hamilton�s equation of mo-
tion were solved for all the atoms in a cluster using
Hamming�s modified fourth order predictor–cor-rector propagator with a step-size of 10�15 s, which
guarantees conservation of the total energy of the
clusters to within 0.03–0.15%.
In order to obtain isomer statistics, 10,000 in-
dependent initial configurations are generated by
recording phase-space coordinates at every 500
MD simulation steps along high-energy trajecto-
ries. The chosen internal energies (about 2600 K)are much higher than the typical melting temper-
atures of the clusters so that initial configurations
should sample as many points as possible in the 6Ndimensional phase-space. The TQ of these con-
figurations were completed in two phases. In the
first phase, each of the independent initial config-
uration was quenched at every five simulation
steps during initial 10,000-step in order to quenchto the closest phase-space point. This fast quench-
ing does not allow the clusters bypass easily the
high lying local minima. In the second phase,
however, internal kinetic energies of the clusters
are set to zero at every 50 or 100 simulation steps
until the internal kinetic energies are completely
removed. So in this final phase the locally stable
isomers are separated from those metastable ones,saddle points of the potential energy surface
(PES). In this phase, round off errors within 50 or
100 simulation steps rolls over the structure from
saddle points of the PES.
One should also mention that as in all minimi-
zation methods there are some limitations, and one
is not always sure that has explored all minima.
Therefore, in order to minimize the uncertainty onthe number of the stable isomers we have consid-
ered large (10,000) initial configurations.
68 A. Sebetci, Z.B. G€uuvenc� / Surface Science 525 (2003) 66–84

3. Results and discussion
3.1. Structures
The number of isomers (Ni), the lowest bindingenergies per atom (El=atom), the average bond
lengths (Rb), and the ESW are given in Table 1.
The minimum energy geometries of Pt2–Pt21 clus-
ters are presented in Fig. 1. Except the first three
structures, each of these clusters has one or more
of the trigonal, tetragonal, pentagonal or hexago-
nal bipyramid forms as a main sustaining part.
Therefore, it is possible to classify them with re-spect to their backbones. We call Pt2–Pt4 group as
primitive. The Pt5 is the only one belonging to
trigonal bipyramid group. The tetragonal bipyra-
mid group consists of the lowest energy structures
of the Pt6 and Pt8 clusters. In the pentagonal bi-
pyramid group, there are Pt7, Pt9–Pt14 and Pt19clusters. The Pt15–Pt18, Pt20 and Pt21 clusters are in
hexagonal bipyramid group. We now discuss the
structures and energetics of the Pt clusters in 10
steps.
Pt2: We start our discussion with a Pt2 cluster.
The bond energy and the bong length of the Pt
dimer are 3.15 eV and 2.34 �AA, respectively. The
value for the bond energy is in excellent agreementwith the experimental value 3:14� 0:02 eV mea-
sured by Taylor et al. [22], since the properties of a
Pt2 and those of the bulk Pt were considered si-
multaneously in the fitting procedure of the PES.
Yang et al. [36] have calculated the bond strength
and the bond length of the dimer as 3.30 eV and
2.40 �AA, respectively, in their ab initio studies.
Fortunelli [38] has calculated these quantities as3.70 eV and 2.37 �AA, respectively, in his DF study.
Although Yang et al. [36] has reported the disso-
ciation energy of the platinum dimer measured as
3.26 eV, it was the bond strength of the Ptþ2 ion.
Dai and Balasubramanian [35] and Fortunelli [38]
have also referred to 3.15 eV as the correct binding
total energy of the Pt dimer. As seen the bond
energies and the bond lengths are in good agree-ment with the experimental value.
Pt3: The lowest energy structure of a Pt3 cluster
is an equilateral triangle with a bond length of 2.41�AA, and energy of 2.45 eV/atom. Yang et al. [36]
have also found an equilateral triangle for the least
energy structure of the Pt3 with a bond length of
2.58 �AA, and energy of 2.40 eV/atom. But, they have
found two other locally stable structures also: alinear chain, and an isosceles triangle. Fortunelli
[38] has found the bond length of the equilateral
triangle as 2.54 �AA, and the energy as 2.41 eV/atom.
He has also mentioned about a linear arrange-
ment. According to our results, the only stable
structure of three-atom Pt clusters obtained using
the TQ technique in 3-D is the equilateral triangle.
Pt4: Tetrahedral is found to be the lowest energystructure for a Pt4, with a bond length of 2.46 �AA,
and a binding energy of 3.12 eV/atom. Again we
did not find any other stable isomer in 3-D for the
Pt4. Dai and Balasubramanian [35] have also re-
ported that a tetrahedral geometry with the 3T1
electronic state is the ground state of the Pt4. They
have given the bond length as 2.60 �AA and esti-
mated the binding energy as 2.95 eV/atom, whichare in good agreement with our result. They have
also found a rhombus and a square as the other
Table 1
Results of 10,000 independent initial configurations for Pt2–Pt21
N a Nib El=atom
(eV)cRb (�AA)d ESW/atom
(eV)e
2 1 1.58 2.34 0
3 1 2.45 2.41 0
4 1 3.12 2.46 0
5 1 3.44 2.49 0
6 2 3.74 2.50 0.11
7 4 3.89 2.53 0.15
8 8 3.99 2.52 0.18
9 17 4.08 2.56 0.20
10 29 4.16 2.57 0.22
11 59 4.22 2.58 0.19
12 147 4.30 2.60 0.22
13 76 4.43 2.61 0.20
14 322 4.41 2.62 0.21
15 253 4.46 2.64 0.23
16 364 4.49 2.63 0.22
17 423 4.52 2.65 0.22
18 541 4.54 2.64 0.18
19 849 4.57 2.64 0.20
20 1767 4.59 2.63 0.19
21 1847 4.61 2.66 0.16
a Size of the clusters.bNumber of the stable isomers.c Lowest binding energies per atom.dAverage bond lengths.e Energy spectrum widths.
A. Sebetci, Z.B. G€uuvenc� / Surface Science 525 (2003) 66–84 69

locally stable structures similar to the results of
Yang et al. [36] and Fortunelli [38]. On the other
hand, Yang et al. [36] have reported that the most
stable structure for the Pt4 is a rhombus of C2v
symmetry, with a bond length of 2.64 �AA, and a
binding energy of 2.56 eV/atom. However, For-tunelli [38] has reported that the most stable
structure for the Pt4 is a rhombus of D2h geometry,
with a bond length of 2.52 �AA, and a binding energy
of 2.63 eV/atom. In these calculations the tetra-
hedron structure was unstable, which is not in
agreement with the present, and Dai and Bala-
subramanian [35]�s ab initio work.
Pt5: The largest cluster with a single stable
structure in our calculations is the Pt5. A trigonal
bipyramid is found to be the least energy structure.The bond length in the equatorial equilateral tri-
angle is 2.52 �AA, and all other bond lengths are 2.47�AA. The binding energy of the Pt5 cluster is calcu-
lated as 3.44 eV/atom. Yang et al. [36] have found
Fig. 1. Lowest energy structures of Pt2–Pt21 clusters.
70 A. Sebetci, Z.B. G€uuvenc� / Surface Science 525 (2003) 66–84

a planar structure as the minimum energy struc-
ture of the Pt5 clusters. They have also found a
pyramid and a disordered trigonal bipyramid as
the other locally stable structures with the binding
energies of 2.53 and 2.59 eV/atom respectively.
Pt6: The Pt6 is the first size of which we haveobtained more than one locally stable structures in
our calculations. We will discuss the isomers in
Section 3.2. The minimum energy geometry of the
Pt6 cluster is a bipyramid with a bond length of
2.50 �AA, and a binding energy of 3.74 eV/atom. A
bipyramid with a bond length of 2.78 �AA, and a
binding energy of 2.61 eV/atom was also found by
Yang et al. [36] as one of the locally stable struc-tures. They have found five distinct stable struc-
tures of the Pt6. All of these structures are in
planar configurations except the bipyramid, and
the lowest energy structure consists of four small
equilateral triangles, which form a larger equi-
lateral triangle. The lack of some locally stable
structures in our results compared to the ab initio
studies is might be due to that empirical potentials,such as EAM, lack directionality in bonding,
which favors dense packets. This effect decreases
with increasing number of atoms in the cluster but
with the smallest clusters it is influential.
Pt7: A pentagonal bipyramid is the most stable
structure of Pt7 clusters. This structure forms the
backbone of the icosahedral symmetry. The bond
length in the equatorial plane is 2.50 �AA, and thebond length between the poles and any atom in the
equator is 2.53 �AA. The binding energy is calculated
as 3.89 eV/atom.
Pt8: The lowest energy structure of the Pt8 can
be constructed from the minimum energy structure
of the Pt6 by capping the symmetric two faces of
the bipyramid with respect to the equatorial plane,
and its energy is 3.99 eV/atom. The average bondlengths are presented in Table 1.
Pt9–Pt14: The minimum energy structures of Pt9–
Pt14 clusters have the pentagonal bipyramid as
their backbones. It is possible to construct one of
them from the previous size by just adding an
atom without changing the existing structure. The
global minimum energy structures of the first three
of these clusters (Pt9–Pt11) and the icosahedralform of the Pt13 are also presented as the global
minima by Doye and Wales [31]. However, our
results for Pt12 and Pt14–Pt21 are different from
theirs. These differences might be because of the
potentials used, which depend on different type of
methods employed to describe atomic interactions,
and the different computational procedures. Many
of the lowest energy geometries of the Pt14–Pt21clusters given by Doye and Wales [31] are found to
be some energetically higher locally stable isomers.
For instance, the lowest energy structure of the
Pt14 presented by them is found to be the fourth
isomer in our calculations. The lowest energy
structure of N ¼ 13 has a particular importance
since it is the first of so called magic numbers (i.e.,
13, 55, 147, . . .) for icosahedral structures. In anicosahedron with 13 atoms, a central atom is sur-
rounded by 12 atoms, which form a spherical shell.
We have calculated the radius of the shell as 2.52�AA. This number has been calculated as 2.50 �AA by
Sachdev et al. [25]. They have calculated the total
binding energy of this geometry as 57.71 eV which
is very close to our result of 57.58 eV. Yang and
DePristo [29] have also studied the Pt13 clusterswith two semi-empirical interatomic potentials.
One of the potentials predicted the icosahedral
structure with a binding energy of 52.14 eV, the
other predicted an open and fluxional structure
with a binding energy of 65.66 eV. Sachdev et al.
[25] have stated that the magic number icosahedral
structures are stable at 0 K, the lowest energy
structures of the non-magic number clusters maynot be on the icosahedral growth pattern. They
have also claimed that magic number structures
deform into some disordered structures upon an-
nealing at 300 K. Since, we are going to discuss the
dynamical properties and phase transitions of the
small Pt clusters in the future publication, we
postpone this discussion to that one. Finally, Apra
and Fortunelli [40] have studied the Pt13 clustersby starting from crystal geometries, i.e., the posi-
tions that the atoms assume in the clusters con-
sidered as sections of the bulk platinum fcc lattice,
and by imposing cuboctahedral symmetry. For the
cuboctahedral structure, they found 6.9 eV of
binding energy per atom and 2.67 �AA of nearest
neighbor distance.
Pt15–Pt18: In the lowest energy structure of the15-atom Pt cluster there are two hexagonal bipyr-
amids, which share one of their atoms in the polar
A. Sebetci, Z.B. G€uuvenc� / Surface Science 525 (2003) 66–84 71
region. These two hexagonal planes are rotated
with respect to each other like the rotated pentag-
onal rings in the icosahedral form of the Pt13.
Therefore it is not on the icosahedral growth. This
hexagonal bipyramid is another building block of
higher sizes of the Pt clusters, as we see in theminimum energy structures of Pt16–Pt18, Pt20 and
Pt21. As the size increases from N ¼ 15 to 18, the
atoms accumulate in the same polar region. They
form dimer, trimer, and tetramer, respectively.
Pt19–Pt21: When the size of N ¼ 19 is arrived, the
backbone is changed back to the pentagonal bi-
pyramid, and it is structure is a double icosahe-
dron. The central pentagonal bipyramid is sharedby the icosahedral forms. The Pt20 has an addi-
tional atom in its equatorial plane compared to the
structure of the Pt19. This additional atom forms a
disordered equatorial hexagonal bipyramid as
shown in Fig. 1. In Pt21 one of the pentagonal
rings near the polar regions is converted into a
hexagonal bipyramid ring.
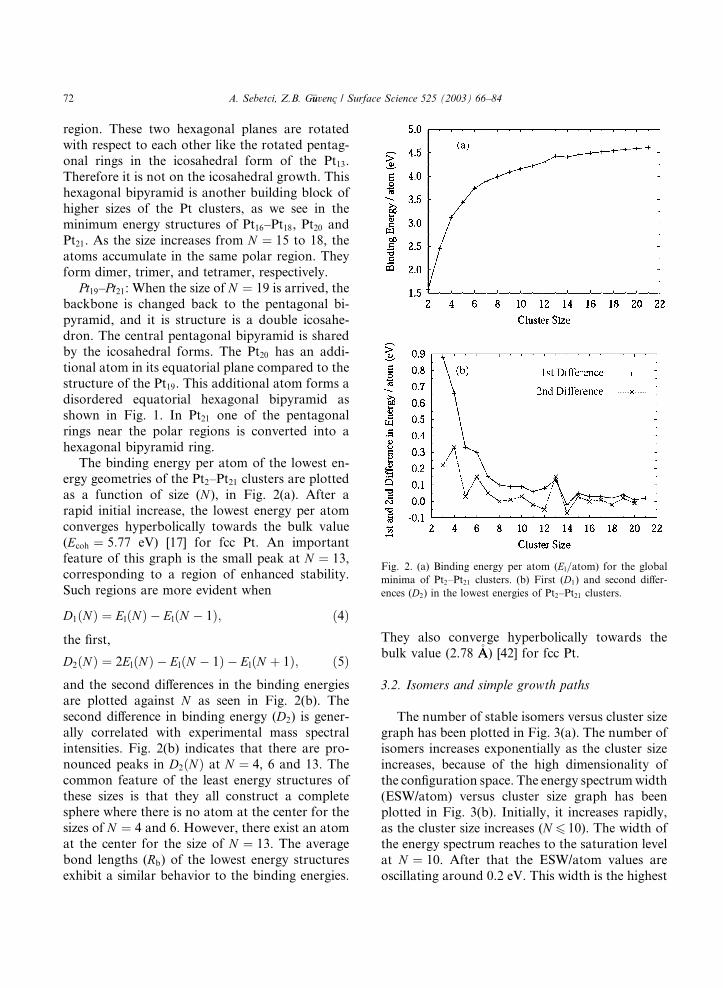
The binding energy per atom of the lowest en-ergy geometries of the Pt2–Pt21 clusters are plotted
as a function of size (N ), in Fig. 2(a). After a
rapid initial increase, the lowest energy per atom
converges hyperbolically towards the bulk value
(Ecoh ¼ 5:77 eV) [17] for fcc Pt. An important
feature of this graph is the small peak at N ¼ 13,
corresponding to a region of enhanced stability.
Such regions are more evident when
D1ðNÞ ¼ ElðNÞ � ElðN � 1Þ; ð4Þ
the first,
D2ðNÞ ¼ 2ElðNÞ � ElðN � 1Þ � ElðN þ 1Þ; ð5Þand the second differences in the binding energies
are plotted against N as seen in Fig. 2(b). The
second difference in binding energy (D2) is gener-
ally correlated with experimental mass spectral
intensities. Fig. 2(b) indicates that there are pro-
nounced peaks in D2ðNÞ at N ¼ 4, 6 and 13. The
common feature of the least energy structures of
these sizes is that they all construct a completesphere where there is no atom at the center for the
sizes of N ¼ 4 and 6. However, there exist an atom
at the center for the size of N ¼ 13. The average
bond lengths (Rb) of the lowest energy structures
exhibit a similar behavior to the binding energies.
They also converge hyperbolically towards the
bulk value (2.78 �AA) [42] for fcc Pt.
3.2. Isomers and simple growth paths
The number of stable isomers versus cluster size
graph has been plotted in Fig. 3(a). The number of
isomers increases exponentially as the cluster size
increases, because of the high dimensionality of
the configuration space. The energy spectrumwidth
(ESW/atom) versus cluster size graph has been
plotted in Fig. 3(b). Initially, it increases rapidly,
as the cluster size increases (N 6 10). The width ofthe energy spectrum reaches to the saturation level
at N ¼ 10. After that the ESW/atom values are
oscillating around 0.2 eV. This width is the highest
Fig. 2. (a) Binding energy per atom (El=atom) for the global
minima of Pt2–Pt21 clusters. (b) First (D1) and second differ-
ences (D2) in the lowest energies of Pt2–Pt21 clusters.
72 A. Sebetci, Z.B. G€uuvenc� / Surface Science 525 (2003) 66–84

at N ¼ 15, 0.23 eV/atom, and the smallest at
the size of N ¼ 21, 0.16 eV/atom, (for N P 8). The
smaller value for N ¼ 21 is might be due to thenumber of independent initial conditions which is
not sufficiently large. For the size range of N P 20
one should use much larger set of initial conditions
for better sampling of the much larger isomer-
phase-space.
We have shown all locally stable structures of
the Pt6–Pt9 clusters other than the global minima
in Fig. 4. We denote the lowest energy structure ofa size as Nð1Þ since it is the first isomer, the second
isomer is denoted by Nð2Þ, and so on. The 2nd–6th
locally stable structures of the Pt10–Pt15, and Pt16–
Pt21 clusters are given in Figs. 5 and 6, respectively.
As an exception, we display the 7th and 54th iso-
mers of the Pt18, and Pt19, respectively in Fig. 6
since they have the highest probability of sam-
pling. It can be seen from the isomer geometries
given in Fig. 1, and Figs. 4–6 that any structure of
a given size can be related to one of the locally
stable geometries of the previous size. This relation
can occur in two different ways: (1) Either, it ispossible to construct the structure of NðlÞ from a
structure of N � 1(l0) by just adding a new atom to
cap one of the faces of existing geometry (e.g.,
N ¼ 6ð2Þ from N ¼ 5ð1Þ, and N ¼ 7ð2Þ from
N ¼ 6ð1Þ). This type of construction nearly pre-
serves the previous interatomic bonds (simple
growth path). But, sometimes a few of the bonds
can be broken and the previous structure can bedisturbed without losing its identity (e.g.,
N ¼ 10ð4Þ from N ¼ 9ð3Þ or from N ¼ 9ð4Þ). (2)Or, instead of going to the top of a face, the new
atom is inserted into the ring of the previous
structure (e.g., from N ¼ 5ð1Þ to N ¼ 6ð1Þ, and
from N ¼ 6ð1Þ to N ¼ 7ð1Þ). Thus, a new building
block is constructed.
Sometimes a structure may have a relation tomore than one structures of the previous size. For
instance, Pt9(17) can be built from both Pt8(7) and
Pt8(8). Using the relations described above, we
developed a tree diagram in Fig. 7 showing how
the locally stable structures grow. In the diagram
the straight lines present the relations of type one,
whereas the dotted lines indicate the relations of
type two. Since we present the geometries of allisomers of the Pt6–Pt9 clusters in this article, this
diagram is complete for this size range. All rela-
tions of 17 different locally stable structures of the
Pt9 have been shown in the diagram. But for the
remaining parts, we have placed only many of
those geometries that we have given in Figs. 5, and
6. They may have some other relations than the
ones shown in the figure. Nevertheless, the dia-gram shows that there are some simple growth
paths such as Pt5(1)–Pt6(2)–Pt7(3)–Pt8(5)–Pt9(13),
or Pt6(1)–Pt7(2)–Pt8(3), or Pt7(1)–Pt8(2)–Pt9(1)–
Pt10(1)–Pt12(1)–Pt13(1)–Pt14(1)–Pt15(2)–Pt16(5) in
which each structure is related to the previous
structure by type one. Simple growth paths can be
considered in the formation of Pt clusters under
the experimental conditions (near room tempera-ture). For instance, when a Pt5(1) cluster meets a
free Pt atom at room temperature, we expect that
Fig. 3. (a) The number of isomers Ni versus cluster size Ngraph. (b) The width of the energy spectrum ESW/atom versus
cluster size N graph.
A. Sebetci, Z.B. G€uuvenc� / Surface Science 525 (2003) 66–84 73

Fig. 4. All locally stable structures of Pt6–Pt9 clusters other than the global minima.
74 A. Sebetci, Z.B. G€uuvenc� / Surface Science 525 (2003) 66–84

Fig. 5. The 2nd–6th locally stable structures of the Pt10–Pt15 clusters.
A. Sebetci, Z.B. G€uuvenc� / Surface Science 525 (2003) 66–84 75

Fig. 6. Some locally stable structures of Pt16–Pt21 clusters.
76 A. Sebetci, Z.B. G€uuvenc� / Surface Science 525 (2003) 66–84

they form the structure of the Pt6(2) first. Because
of the large potential energy difference between the
Pt5(1) and the Pt6(2), the Pt6(2) melts as it forms.
Due to the cooling process it loses its internal ki-netic energy, and eventually it ‘‘falls’’ into the
basin of attraction of the Pt6(1). If both locally
stable structures of the Pt6 clusters near room
temperatures interchange one to another, then
they may both exist under the experimental con-
dition. Similar processes may occur in the forma-
tion of the locally stable structures of the other
sizes under the experimental conditions. Phasechanges will be discussed in detail in the future
work.
The total energies calculated for all isomers of
the Pt6–Pt8 and for the first 10 isomers of the Pt9–
Pt21 are given in Table 2. The differences between
the total binding energies of any successive sizes
are at least on the order of eVs. This quantity
decreases to deVs for the successive isomers of agiven size, if their backbones are different. For
instance, the energy difference between Pt6(1) and
Pt6(2) is 0.647 eV, or it is 0.562 eV between Pt7(2)
and Pt7(3). An exception of this is that the energy
difference between Pt13(1) and Pt13(2) is 1.615 eV,
which is very high because of the highly symmetricstructure of Pt13(1). If the backbones of the suc-
cessive isomers are the same, their energy differ-
ence is even on the order of ceVs. For example, the
energy gap between Pt7(3) and Pt7(4) is only 0.051
eV.
3.3. Probabilities
Probability of sampling different basins of at-
tractions has been calculated by dividing the
number of clusters in the basins by the total
number of initial configurations. We have given
these probabilities for all isomers of the Pt6–Pt8and the first 10 isomers of the Pt9–Pt21 in Table 3.
All probabilities given in Table 3 have been ob-
tained by quenching the high temperature (about2600 K) initial configurations. The total energies
of these samples effect the probability of getting
Fig. 7. Growth pattern of the locally stable structures of small Pt clusters. denotes the most probable isomers.
A. Sebetci, Z.B. G€uuvenc� / Surface Science 525 (2003) 66–84 77

the various isomers, in principle. In order to ana-
lyze this effect, we have performed some calcula-
tions on the sampling probabilities of the Pt9clusters with different total energies, i.e., at differ-
ent temperatures. The probabilities of forming the
various isomers of the Pt9 clusters obtained by
quenching 1900, 2600, 3000, 3500, and 4000 K
have been given in Table 4. Except for the case of
1900 K, the same number (17) of isomers has been
obtained. Thus, 2600 K is high enough to sample
the total number of locally stable structures. Asthe total energies of the clusters increase, the
sampling probabilities of the first two isomers are
decreasing, whereas those of the isomers with
higher energies increase. This situation might be
explained as the following: In our calculations, we
Table 2
Total energies (eV) for all isomers of Pt6–Pt8 and for the first 10 isomers of Pt9–Pt21
N Nð1Þ Nð2Þ Nð3Þ Nð4Þ Nð5Þ Nð6Þ Nð7Þ Nð8Þ Nð9Þ Nð10Þ6 )22.435 )21.7887 )27.219 )26.811 )26.249 )26.1988 )31.888 )31.532 31.189 )31.097 )30.717 )30.652 )30.563 )30.4769 )36.709 )36.574 )36.178 )36.171 )36.137 )36.130 )35.908 )35.845 )35.786 )35.74910 )41.646 )41.248 )41.208 )41.182 )41.180 )41.141 )41.017 )40.998 )40.937 )40.91311 )46.462 )46.162 )46.097 )46.093 )45.949 )45.896 )45.883 )45.846 )45.814 )45.77012 )51.609 )51.080 )50.972 )50.942 )50.909 )50.909 )50.855 )50.760 )50.733 )50.64513 )57.583 )55.968 )55.906 )55.868 )55.825 )55.815 )55.795 )55.793 )55.788 )55.78814 )61.732 )61.617 )61.444 )61.272 )60.924 )60.863 )60.810 )60.790 )60.718 )60.69315 )66.951 )66.785 )66.401 )66.362 )66.073 )66.061 )65.951 )65.908 )65.876 )65.86616 )71.861 )71.827 )71.807 )71.755 )71.690 )71.439 )71.397 )71.303 )71.088 )71.08717 )76.830 )76.824 )76.787 )76.775 )76.770 )76.724 )76.641 )76.537 )76.515 )76.48318 )81.696 )81.686 )81.683 )81.658 )81.647 )81.635 )81.582 )81.569 )81.566 )81.55819 )86.922 )86.527 )86.503 )86.503 )86.493 )86.482 )86.461 )86.424 )86.415 )86.41320 )91.729 )91.723 )91.640 )91.473 )91.440 )91.381 )91.319 )91.286 )91.261 )91.21421 )96.829 )96.642 )96.629 )96.610 )96.609 )96.600 )96.594 )96.528 )96.425 )96.294
Table 3
Probabilities of all isomers of Pt6–Pt8 and the first 10 isomers of Pt9–Pt21
N Nð1Þ Nð2Þ Nð3Þ Nð4Þ Nð5Þ Nð6Þ Nð7Þ Nð8Þ Nð9Þ Nð10Þ6 0.568a 0.432
7 0.423 0.445a 0.111 0.022
8 0.552a 0.375 0.018 0.036 0.007 0.008 0.003 0.000
9 0.357a 0.164 0.153 0.117 0.081 0.010 0.033 0.031 0.025 0.020
10 0.244a 0.055 0.049 0.182 0.164 0.049 0.059 0.011 0.068 0.037
11 0.252a 0.224 0.069 0.047 0.033 0.104 0.060 0.026 0.048 0.011
12 0.188a 0.159 0.011 0.006 0.033 0.057 0.095 0.056 0.034 0.013
13 0.821a 0.055 0.005 0.012 0.008 0.014 0.000 0.008 0.002 0.001
14 0.092 0.532a 0.005 0.052 0.021 0.004 0.018 0.009 0.005 0.010
15 0.673a 0.115 0.032 0.004 0.002 0.022 0.007 0.009 0.003 0.001
16 0.166 0.027 0.217 0.268a 0.097 0.013 0.006 0.001 0.008 0.004
17 0.024 0.283a 0.029 0.076 0.014 0.009 0.050 0.090 0.008 0.047
18 0.016 0.025 0.015 0.097 0.008 0.011 0.157a 0.038 0.041 0.031
19b 0.023 0.008 0.010 0.001 0.013 0.007 0.039 0.009 0.019 0.019
20 0.016 0.117a 0.006 0.024 0.003 0.004 0.001 0.002 0.004 0.004
21 0.230a 0.018 0.001 0.046 0.083 0.016 0.013 0.001 0.005 0.003
a The most probable isomer.b 0.040 is the highest probability belonging to the 54th isomer.
78 A. Sebetci, Z.B. G€uuvenc� / Surface Science 525 (2003) 66–84

prepared 10,000 initial configurations by recordingtheir coordinates at each 500 steps of the MD
trajectory. When the internal kinetic energies of
the particles are relatively small, they cannot go far
away in a limited number of time steps (500) in the
phase space from the starting point. Since the most
stable isomers, in general, occupy larger potential
‘‘wells’’ in the phase space, sampling at relatively
lower temperatures will favor these lowest energystructures. On the other hand, the clusters with
higher internal kinetic energies can travel longer
distances in a given time in the phase space.
Therefore, a larger number of the initial configu-
rations can escape from the lowest energy po-
tential ‘‘wells’’ at higher temperatures. Thus,
energetically higher basins of attractions in PES
are visited more at higher temperatures comparedto the cases of the samplings at relatively lower
temperatures. Nevertheless, the quantitative
changes in probabilities from 2600 to 4000 K are
not big enough to change the trend of the proba-
bility distribution. Namely, even at 4000 K, the
lowest energy structure is still the most probable
one, the probabilities still decrease as the energies
of the isomers increase, and the order of the iso-mers with respect to their probabilities do not
change drastically. These results also indicate that
higher potential ‘‘wells’’, in general, occupy smal-
ler volumes in the phase space. Therefore, the data
given in Table 3 might be used to investigate the
trend of the isomer sampling probability distribu-
tions of small Pt clusters. Here, one should alsomentioned that for the larger clusters (N P 20),
temperatures higher than 2600 K might be re-
quired in order to sample all stable isomers.
The probability distributions of the Pt6–Pt13,
and Pt14–Pt21 clusters obtained by quenching 2600
K clusters are given in Figs. 8 and 9, respectively.
The probability of getting a specific isomer of a
given size highly depends on the energy of theisomer. A common characteristic of all distribu-
tions is that, as the total energies of the isomers
increase, the probabilities decrease. One can fit the
most of the probabilities in a distribution of a gi-
ven size using the form
PðEÞ ¼ a expb
E þ c
� �; ð6Þ
where a > 0: the dimensionless constant, b > 0:
scaling factor in units of eV, 0 < c < jEhj (Eh is theenergy of the energetically highest isomer), and
E < 0 is the internal energy of a quenched isomer
[43,44] (see the probability distribution graphs of
Pt9 and Pt10 in Fig. 8). Thus, for many cluster si-
zes, the most stable structure is the most probable
one. However, there are some exceptions, e.g.,
Pt7(2), Pt14(2), Pt16(4), Pt17(2), Pt18(7), Pt19(54),
and Pt20(2) which are more probable than theirleast energy structures. Similarly, some isomers
have higher probabilities than their less energetic
neighbors. For example, the probability of the
Pt10(4) is higher than the probabilities of the
Pt10(2) and Pt10(3). This means that the energy is
not the only control parameter. The secondary
parameters affecting the probabilities are the sim-
ple growth path, the number of accessibility fromthe structure of the previous size, the backbone
and the symmetry of the cluster. The probability of
formation of Pt7(2) can be given as an example of
the effect of the simple growth path. Although the
total energy of Pt7(1) is less than that of Pt7(2),
sampling probability of the Pt7(2) is higher than
that of the Pt7(1). This is due to the fact that Pt7(2)
is connected to their common parent Pt6(1) by type
Table 4
The probabilities of sampling the isomers of Pt9 clusters ob-
tained by quenching 1900, 2600, 3000, 3500, and 4000 K initial
configurations
Isomer
number
1900 K 2600 K 3000 K 3500 K 4000 K
Nð1Þ 0.496 0.367 0.329 0.299 0.278
Nð2Þ 0.207 0.164 0.143 0.108 0.101
Nð3Þ 0.104 0.153 0.181 0.199 0.201
Nð4Þ 0.062 0.117 0.131 0.144 0.153
Nð5Þ 0.066 0.081 0.073 0.071 0.076
Nð6Þ 0.008 0.010 0.012 0.014 0.013
Nð7Þ 0.019 0.033 0.033 0.048 0.047
Nð8Þ 0.017 0.031 0.037 0.036 0.042
Nð9Þ 0.010 0.025 0.028 0.034 0.036
Nð10Þ 0.009 0.020 0.018 0.022 0.024
Nð11Þ 0.002 0.004 0.006 0.006 0.009
Nð12Þ 0.002 0.002 0.003 0.003
Nð13Þ 0.001 0.002 0.004 0.006
Nð14Þ 0.002 0.003 0.006 0.007
Nð15Þ 0.000 0.002 0.002 0.002
Nð16Þ 0.001 0.001 0.003 0.003
Nð17Þ 0.000 0.000 0.001 0.001
A. Sebetci, Z.B. G€uuvenc� / Surface Science 525 (2003) 66–84 79

1, whereas Pt7(1) is connected by type 2. Namely,
Pt7(2) is on the simple growth path Pt6(1)–Pt7(2),
but Pt7(1) is not. A similar thing occurs at size
N ¼ 17. Since Pt17(2) is on the simple growth path
Fig. 8. The probability distributions of the isomers of Pt6–Pt13 clusters obtained by quenching 2600 K initial configurations.
80 A. Sebetci, Z.B. G€uuvenc� / Surface Science 525 (2003) 66–84

i.e., Pt16(1)–Pt17(2), its sampling probability is
higher than that of Pt17(1). It should be noted that
the effect of being on a simple growth path may
not overcome always the effect of energy as seen on
Fig. 9. The probability distributions of the isomers of Pt14–Pt21 clusters obtained by quenching 2600 K initial configurations.
A. Sebetci, Z.B. G€uuvenc� / Surface Science 525 (2003) 66–84 81

the example of Pt5(1)–Pt6(2). Although Pt6(2) is on
the simple growth path, the sampling probability
of the Pt6(1) is higher than that of the Pt6(2), since
the energy difference is large between them (0.65
eV).The effect of the number of accessibility from
the structure of the previous size can be seen in the
sampling probability differences of the Pt8(3) and
the Pt8(4). Although the total energy of the Pt8(3)
is lower than that of the Pt8(4), and both of them
are connected to a common parent Pt7(2) by type
1, the probability of formation of the Pt8(4) is
twice of that of the Pt8(3). This can be explainedby the fact that the structure of the Pt8(3) can be
obtained from the structure of the Pt7(2) in a single
way: by adding the last atom to cap the symmetric
face of the Pt7(2) with respect to the center of the
tetragonal bipyramid (see Fig. 4). On the other
hand, structure of the Pt8(4) can be obtained from
the structure of Pt7(2) in three ways: by capping
the one of the appropriate three faces of the te-tragonal bipyramid. A similar situation can be
found in the sampling probabilities of the Pt14(1)
and the Pt14(2) clusters.
Effect of the backbone on the sampling proba-
bility is visible for the Pt9(6) and the Pt9(7) iso-
mers. Generally, as the total energy of the locally
stable structures increases, the backbones of the
structures change from the hexagonal, pentagonal,tetragonal to trigonal bipyramids. Sometimes this
order is broken as in the case of the pass from the
Pt9(6) to the Pt9(7). The backbone of the Pt9(6) is a
tetragonal bipyramid but that of the Pt9(7)–Pt9(10)
are pentagonal bipyramids. Thus, the sampling
probability of the Pt9(7)–Pt9(10) are higher than
that of the Pt9(6). The backbones are also re-
sponsible for the energy bands and energy gaps inmany of the probability distribution graphs. There
are some energy bands in which a number of en-
ergetically close isomers with smoothly decreasing
probabilities are present, and there are some en-
ergy gaps in which there are no isomers. Generally,
after an energy gap the probability drops drasti-
cally as in the case of the Pt9(3–6) and the Pt9(7–
11) isomers. This is due to the fact that theirbackbones are different, and also probability of
sampling is a function of the isomer�s energy (Eq.
(6)).
Finally, the effect of the symmetry is best seen in
the size of N ¼ 13. The probability distribution
graph of the Pt13 differs from the others, notice-
ably. In this size, the probability of the lowest
energy structure is much higher than those of the
other isomers because of the perfect sphericalsymmetry of the icosahedron. On the other hand,
however, the probability distribution of the Pt19shows that there are many other isomers having
approximately equal probabilities to that of the
Pt19(1) (one may have to use much larger sampling
size of the initial conditions for larger sizes in or-
der to have converged probabilities).
We denote the highest probable isomers inFig. 7 by an asterisk. It is not surprising that many
of them (Pt9(1)–Pt10(1)–Pt11(1)–Pt12(1)–Pt13(1)–
Pt14(2)) are on the same simple growth path. On
the other hand, the structures such as Pt9(6),
Pt10(3), Pt16(1), Pt16(2), Pt17(1), and Pt20(1), which
are connected to their parents by type 2, have
relatively low probabilities with respect to the
probabilities of their neighbors.It should be noted that probabilities of forma-
tion given here belong to the structures which are
stable at 0 K. Many of these geometries may not
be stable at room temperatures, i.e., potential wells
may be very shallow. Therefore, to find the most
probable structure in the experimental conditions,
one should check the stability of these structures at
room temperatures. The temperature could also bea factor that would influence the path from one
cluster to the other. The stability of the structures
as a function of temperature and the influence of
temperature on the growth paths will be discussed
in detail in the future works.
4. Conclusions
The MD and TQ simulations have been carried
out to search the global and the other locally stable
structures, the simple growth paths, the number of
isomers, isomer statistics, and ESW. Many of the
lowest energy structures correspond to the icosa-
hedral growth, which are also global minima for
Lennard-Jones or Morse potentials. However,some of the global minima (e.g., N ¼ 15, 16, 17,
18, 20, and 21) do not obey the icosahedral growth
82 A. Sebetci, Z.B. G€uuvenc� / Surface Science 525 (2003) 66–84

pattern. All locally stable structures of the PtNclusters (N ¼ 5–21) have either one or more of the
trigonal, tetragonal, pentagonal, or hexagonal bi-
pyramids as their backbones. It is found that, in
general, isomers sampling probability distributions
fall exponentially as the total energies of the iso-mers increase. However, the energy dependence of
the probabilities is not simple. The simple growth
path, the number of accessibility from the struc-
ture of the previous size, the backbone and the
symmetry of the cluster also affect the sampling
probability of a specific isomer. The lowest energy
structures are not the most probable isomers for
some of the sizes (e.g., N ¼ 7, 14, 16–20) at verylow temperatures. The total energy of the initial
configurations affects the probability of sampling
the basins of attractions. However, the trend (ex-
ponential decay) of the sampling probability dis-
tribution remains unchanged.
Many of the results represented in our present
study are in good agreement with those of other
researchers. However, there are also some dis-agreements in the locally stable structures or in the
energies of the clusters. The differences appear due
to two reasons: First, the potentials used depend
on different type of methods employed to describe
atomic interactions, e.g., the EAM is like effective
medium type, whereas Sutton–Chen potential de-
pends on tight-binding theory. Second, the com-
putational procedures are different. Differentminimization techniques with different initial
constraints may produce different results. The low
energy minima found in this study can represent
good starting points for sophisticated, electronic
structure (i.e., DF theory) calculations. Since all
empirical potentials have some uncertainties, it is
necessary to compare the results obtained with
different potentials. Therefore extensive study isnecessary and important to have a good compar-
ison of the potentials. As a result our present work
creates such opportunity for the Pt clusters de-
scribed by Voter and Chen [17] version of the
EAM in the size range of N ¼ 2–21. Finally, the
present study shows that investigating the num-
bers, and the structures of the stable isomers can
provide a deeper understanding of the clusters�growth paths, the ESW, energy bands and gaps
formed by the isomers.
References
[1] J. Jellinek, Z.B. G€uuvenc�, Z. Phys. D 26 (1993) 110;
J. Jellinek, Z.B. G€uuvenc�, in: L.J. Farrugia (Ed.), The
Synergy Between Dynamics and Reactivity at Clusters and
Surfaces, Kluwer, Dordrecht, 1995, p. 217.
[2] H. Haberland (Ed.), Clusters of Atoms and Molecules,
Springer, Berlin, 1994, and references therein.
[3] G. Schmid (Ed.), Clusters and Colloids, VCH, Weinheim,
1994, and references therein.
[4] T.P. Martin (Ed.), Large Clusters of Atoms and Molecules,
Kluwer, Dordrecht, 1996, and references therein.
[5] J. Jellinek (Ed.), Theory of Atomic and Molecular Clusters,
Springer, Berlin, 1999, and references therein.
[6] D.E. Powers, S.G. Hansen, M.E. Geusic, A.C. Puiu, J.B.
Hopkins, T.G. Dietz, M.A. Duncan, P.R.R. Langridge-
Smith, R.E. Smalley, J. Chem. Phys. 86 (1982) 2556.
[7] D.E. Powers, S.G. Hansen, M.E. Geusic, D.L. Michalop-
oulos, R.E. Smalley, J. Chem. Phys. 78 (1983) 2866.
[8] M.D. Morse, G.P. Hansen, P.R.R. Langridge-Smith, L.-S.
Zheng, M.E. Geusic, D.L. Michalopoulos, R.E. Smalley, J.
Chem. Phys. 80 (1984) 5400.
[9] P.J. Brucat, L.-S. Zheng, C.L. Pettiette, S. Yang, R.E.
Smalley, J. Chem. Phys. 84 (1986) 3078.
[10] J.L. Gole, J.H. English, V.E. Bondybey, J. Chem. Phys. 86
(1982) 2560.
[11] D.R. Preuss, S.A. Pace, J.L. Gole, J. Chem. Phys. 71 (1979)
3553.
[12] V.E. Bondybey, G.P. Schwartz, J.H. English, J. Chem.
Phys. 78 (1983) 11.
[13] E.A. Rohlfing, J.J. Valentini, J. Chem. Phys. 84 (1986)
6560.
[14] A.D. Sappey, J.E. Harrington, J.C. Weisshaar, J. Chem.
Phys. 88 (1988) 5243.
[15] D.G. Leopold, J. Ho, W.C. Lineberger, J. Chem. Phys. 86
(1987) 1715.
[16] O. Cheshnovsky, P.J. Brucat, S. Yang, C.L. Pettiette, M.J.
Craycraft, R.E. Smalley, in: P. Jena, B.K. Rao, S.N.
Khanna (Eds.), Physics and Chemistry of Small Clusters,
Plenum, New York, 1987, NATO ASI Series B: Physics,
vol. 158, p. 1.
[17] A.F. Voter, Los Alamos Unclassified Technical Report
#LA-UR 93-3901, 1993.
[18] Z.B. G€uuvenc�, J. Jellinek, Z. Phys. D 26 (1993) 304.
[19] Z.B. G€uuvenc�, J. Jellinek, A.F. Voter, Physics and Chem-
istry of Finite Systems: From Clusters to Crystals, vol. 1, p.
411, Kluwer Academic Publishers, Dordecht, 1992.
[20] M. Boyukata, Z.B. G€uuvenc�, S. €OOzc�elik, P. Durmus�, J.
Jellinek, Int. J. Quant. Chem. 84 (2001) 208.
[21] K. Balasubramanian, J. Chem. Phys. 87 (1987) 6573.
[22] S. Taylor, G.W. Lemire, Y.M. Hamrick, Z. Fu, M.D.
Morse, J. Chem. Phys. 89 (1988) 5517.
[23] K. Jansson, R. Scullman, J. Mol. Spectrosc. 61 (1976) 299.
[24] S.K. Gupta, B.M. Nappi, K.A. Gingerich, Inorg. Chem. 20
(1981) 966.
[25] A. Sachdev, R.I. Masel, J.B. Adams, J. Catal. 136 (1992)
320.
A. Sebetci, Z.B. G€uuvenc� / Surface Science 525 (2003) 66–84 83

[26] M.S. Daw, M.I. Baskes, Phys. Rev. B 29 (1984) 6443.
[27] J.E. Sinclair, R. Fletcher, J. Phys. C 7 (1974) 864.
[28] J. Garcia-Rodeja, C. Rey, L.J. Galleo, J.A. Alonso, Phys.
Rev. B 49 (1994) 8495.
[29] L. Yang, A.E. DePristo, J. Chem. Phys. 100 (1994) 725.
[30] M.S. Stave, D.E. Sanders, T.J. Raeker, A.E. Depristo, J.
Chem. Phys. 93 (1990) 4413.
[31] J.P.K. Doye, D.J. Wales, New J. Chem. 733 (1998).
[32] A.P. Sutton, J. Chen, Philos. Mag. Lett. 61 (1990) 139.
[33] Z. Li, H.A. Scheraga, Proc. Natl. Acad. Sci. USA 84 (1987)
6611.
[34] D.E. Ellis, J. Guo, H.P. Cheng, J.J. Low, Adv. Quant.
Chem. 22 (1991) 125.
[35] D. Dai, K. Balasubramanian, J. Chem. Phys. 103 (1995)
648.
[36] S.H. Yang, D.A. Drabold, J.B. Adams, P. Ordejon, K.
Glassford, J. Phys.: Condens. Matter 9 (1997) L39.
[37] J. Harris, Phys. Rev. B 31 (1987) 1770.
[38] A. Fortunelli, J. Mol. Struct. (Theochem) 493 (1999) 223.
[39] Amsterdam Density Functional (ADF), Revision 2.3.0,
Theoretical Chemistry, Vrije Universiteit, Amsterdam,
1997.
[40] E. Apra, A. Fortunelli, J. Mol. Struct. (Theochem) 501–
502 (2000) 251.
[41] D.E. Bernholt, E. Apra, H.A. Fr€uuchtl, M.F. Guest, R.J.
Harrison, R.A. Kendall, R.A. Kutteh, X. Long, J.B. Fann,
R.J. Littlefield, et al., Int. J. Quant. Chem. Quant. Chem.
Symp. 29 (1995) 475.
[42] C. Kittel, Introduction to Solid State Physics, seventh ed.,
John Wiley and Sons, USA, 1996.
[43] Z.B. G€uuvenc�, D. G€uuvenc�, J. Jellinek, Math. Comput. Appl.
4 (1999) 75.
[44] M. Karabacak, S. €OOzc�elik, Z.B. G€uuvenc�, Surf. Sci. 507
(2002) 634.
84 A. Sebetci, Z.B. G€uuvenc� / Surface Science 525 (2003) 66–84