Wide-Field Survey of Globular Clusters in M31. I. A Catalog of New Clusters
25
arXiv:0706.2904v2 [astro-ph] 21 Jun 2007 DRAFT VERSION DECEMBER 9, 2013 Preprint typeset using L A T E X style emulateapj v. 6/22/04 WIDE-FIELD SURVEY OF GLOBULAR CLUSTERS IN M31. I. A CATALOG OF NEW CLUSTERS SANG CHUL KIM 1,2,3 ,MYUNG GYOON LEE 2,3 ,DOUG GEISLER 3,4 ,ATA SARAJEDINI 3,5 ,HONG SOO PARK 2 ,HO SEONG HWANG 2 , WILLIAM E. HARRIS 6 ,J UAN C. SEGUEL 4,7 ,&TED VON HIPPEL 3,8,9 Draft version December 9, 2013 ABSTRACT We present the result of a wide-field survey of globular clusters (GCs) in M31 covering a 3 ◦ × 3 ◦ field centered on M31. We have searched for GCs on CCD images taken with Washington CMT 1 filters at the KPNO 0.9 m telescope using the following steps: (1) inspection of morphological parameters given by the SExtractor package such as stellarity, full width at half-maximum, and ellipticity; (2) consulting the spectral types and radial velocities obtained from spectra taken with the Hydra spectrograph at the WIYN 3.5 m telescope; and (3) visual inspection of the images of each object. We have found 1164 GCs and GC candidates, of which 605 are newly found GCs and GC candidates and 559 are previously known GCs. Among the new objects there are 113 genuine GCs, 258 probable GCs, and 234 possible GCs, according to our classification criteria. Among the known objects there are 383 genuine GCs, 109 probable GCs, and 67 possible GCs. In total there are 496 genuine GCs, 367 probable GCs and 301 possible GCs. Most of these newly found GCs have T 1 magnitudes of 17.5 - 19.5 mag, [17.9 < V < 19.9 mag assuming ( C - T 1 ) ≈ 1.5], and ( C - T 1 ) colors in the range 1 - 2. Subject headings: galaxies: star clusters — galaxies: spiral — galaxies: individual (M31, NGC 224) — Local Group 1. INTRODUCTION Globular clusters (GCs) are an ideal tool for studying the formation and evolution of nearby galaxies for several rea- sons. First, GCs are one of the brightest objects in galaxies, so it is relatively easy to observe them even in the outer parts of the galaxies where individual stars are too faint to be ob- served. Second, GCs are believed to be among the oldest ob- jects in galaxies (see, e.g., Salaris & Weiss (2002); De Angeli et al. (2005)) giving a lower limit to the ages of their parent galaxies. Third, the stars in GCs are believed to be born es- sentially at the same time and with the same chemical com- position, which makes GCs an ideal laboratory for the study of stellar evolution. Fourth, GCs are distributed much more widely than stars, so they can be used for the study of the halo of their parent galaxy. Finally, since the present GCs have sur- vived since the formation of their parent galaxies, they give information on the formation and evolution of both the clus- ters and the galaxies. The GCs in M31 are especially important, since M31 is the nearest spiral galaxy and has an abundant population of GCs. 1 Korea Astronomy and Space Science Institute, Daejeon 305-348, Korea; [email protected] 2 Astronomy Program, Department of Physics and Astronomy, Seoul National University, Seoul 151-742, Korea; [email protected], [email protected], [email protected] 3 Visiting Astronomer, Kitt Peak National Observatory, National Optical Astronomy Observatory, which is operated by the Association of Universities for Research in Astronomy (AURA), Inc., under cooperative agreement with the National Science Foundation. 4 Grupo de Astronomia, Departamento de Fisica, Universidad de Concepción, Casilla 160-C, Concepción, Chile; [email protected], [email protected] 5 Department of Astronomy, University of Florida, Gainesville, FL 32611, USA; [email protected] 6 Department of Physics and Astronomy, McMaster University, Hamilton, ON L8S 4M1, Canada; [email protected] 7 Cerro Tololo Inter-American Observatory, Casilla 603, La Serena, Chile 8 Department of Astronomy, University of Texas at Austin, 1 University Station C1400, Austin, TX 78712, USA; [email protected] 9 Visiting Scientist, Southwest Research Institute, 1050 Walnut Street, Suite 400, Boulder, CO 80302, USA There have been numerous studies of the GCs in M31 starting as early as 1932. Table 1 shows a list of the previous studies on M31 GCs, focusing primarily on the number of GCs and candidate GCs found. Examples of the most extensive GC surveys are those of Sargent et al. (1977, the M31 Consor- tium), Crampton et al. (1985, the DAO group), and Battistini et al. (1987, the Bologna group). However, these surveys are mostly based on visual searches of the photographic plates. Since the use of CCD detectors in astronomy, there have been efforts to use them for deep photometry to search for new GCs in M31. However, the small field of view (FOV) of the first generation CCDs enabled previous investigators only to perform GC surveys for a limited region of M31, and there has not yet been any wide-field survey of GCs using CCD cameras. It is clear from Table 1 that our new GC survey presented in this study is the first systematic one for the largest area of ∼ 3 ◦ × 3 ◦ centered on M31. Recently several new extended GCs were found in the halo located at 15 R p 116 kpc (where R p is the projected ra- dius) from the center of M31 (Huxor et al. 2005; Martin et al. 2006; Mackey et al. 2007), and Mackey et al. (2006, 2007) presented deep photometry of stars in these clusters based on Hubble Space Telescope (HST) ACS images. Kodaira et al. (2004) found 49 compact star clusters with M V < -5 mag and 0 < (B - V ) < 1.0 in the south-west field (17 ′ .5 × 28 ′ .5) of the M31 disk from CCD images taken at the Subaru 8 m tele- scope, some of which may be GCs. This paper is the first in a series on our wide-field survey of M31 GCs. In this paper we present a catalog of new GCs in M31, and the analyses of the photometric and spectroscopic data of the new and known GCs in M31 will be presented in separate papers. Brief progress reports of this study were given in Lee et al. (2002), Kim et al. (2002), and Seguel et al. (2002), which are superseded by this series of papers. This paper is organized as follows: §2 describes the pho- tometric and spectroscopic observations and data reductions, and §3 the GC search method. Section 4 presents the catalog of new GCs found in this study and some properties of newly found GCs, and finally, a summary is given in §5.
Transcript of Wide-Field Survey of Globular Clusters in M31. I. A Catalog of New Clusters

arX
iv:0
706.
2904
v2 [
astr
o-ph
] 21
Jun
200
7DRAFT VERSIONDECEMBER9, 2013Preprint typeset using LATEX style emulateapj v. 6/22/04
WIDE-FIELD SURVEY OF GLOBULAR CLUSTERS IN M31. I. A CATALOG OF NEW CLUSTERS
SANG CHUL K IM 1,2,3, MYUNG GYOON LEE2,3, DOUG GEISLER3,4, ATA SARAJEDINI3,5, HONG SOO PARK2, HO SEONG HWANG2,WILLIAM E. HARRIS6, JUAN C. SEGUEL4,7, & T ED VON HIPPEL3,8,9
Draft version December 9, 2013
ABSTRACTWe present the result of a wide-field survey of globular clusters (GCs) in M31 covering a 3◦ × 3◦ field
centered on M31. We have searched for GCs on CCD images taken with WashingtonCMT1 filters at the KPNO0.9 m telescope using the following steps: (1) inspection ofmorphological parameters given by the SExtractorpackage such as stellarity, full width at half-maximum, andellipticity; (2) consulting the spectral types andradial velocities obtained from spectra taken with the Hydra spectrograph at the WIYN 3.5 m telescope; and(3) visual inspection of the images of each object. We have found 1164 GCs and GC candidates, of which 605are newly found GCs and GC candidates and 559 are previously known GCs. Among the new objects there are113 genuine GCs, 258 probable GCs, and 234 possible GCs, according to our classification criteria. Amongthe known objects there are 383 genuine GCs, 109 probable GCs, and 67 possible GCs. In total there are 496genuine GCs, 367 probable GCs and 301 possible GCs. Most of these newly found GCs haveT1 magnitudesof 17.5− 19.5 mag, [17.9< V < 19.9 mag assuming (C − T1) ≈ 1.5], and (C − T1) colors in the range 1− 2.Subject headings: galaxies: star clusters — galaxies: spiral — galaxies: individual (M31, NGC 224) — Local
Group
1. INTRODUCTION
Globular clusters (GCs) are an ideal tool for studying theformation and evolution of nearby galaxies for several rea-sons. First, GCs are one of the brightest objects in galaxies,so it is relatively easy to observe them even in the outer partsof the galaxies where individual stars are too faint to be ob-served. Second, GCs are believed to be among the oldest ob-jects in galaxies (see, e.g., Salaris & Weiss (2002); De Angeliet al. (2005)) giving a lower limit to the ages of their parentgalaxies. Third, the stars in GCs are believed to be born es-sentially at the same time and with the same chemical com-position, which makes GCs an ideal laboratory for the studyof stellar evolution. Fourth, GCs are distributed much morewidely than stars, so they can be used for the study of the haloof their parent galaxy. Finally, since the present GCs have sur-vived since the formation of their parent galaxies, they giveinformation on the formation and evolution of both the clus-ters and the galaxies.
The GCs in M31 are especially important, since M31 is thenearest spiral galaxy and has an abundant population of GCs.
1 Korea Astronomy and Space Science Institute, Daejeon 305-348, Korea;[email protected]
2 Astronomy Program, Department of Physics and Astronomy, SeoulNational University, Seoul 151-742, Korea; [email protected],[email protected], [email protected]
3 Visiting Astronomer, Kitt Peak National Observatory, National OpticalAstronomy Observatory, which is operated by the Association of Universitiesfor Research in Astronomy (AURA), Inc., under cooperative agreement withthe National Science Foundation.
4 Grupo de Astronomia, Departamento de Fisica, Universidad deConcepción, Casilla 160-C, Concepción, Chile; [email protected],[email protected]
5 Department of Astronomy, University of Florida, Gainesville, FL 32611,USA; [email protected]
6 Department of Physics and Astronomy, McMaster University,Hamilton,ON L8S 4M1, Canada; [email protected]
7 Cerro Tololo Inter-American Observatory, Casilla 603, La Serena, Chile8 Department of Astronomy, University of Texas at Austin, 1 University
Station C1400, Austin, TX 78712, USA; [email protected] Visiting Scientist, Southwest Research Institute, 1050 Walnut Street,
Suite 400, Boulder, CO 80302, USA
There have been numerous studies of the GCs in M31 startingas early as 1932. Table 1 shows a list of the previous studieson M31 GCs, focusing primarily on the number of GCs andcandidate GCs found. Examples of the most extensive GCsurveys are those of Sargent et al. (1977, the M31 Consor-tium), Crampton et al. (1985, the DAO group), and Battistiniet al. (1987, the Bologna group). However, these surveys aremostly based on visual searches of the photographic plates.
Since the use of CCD detectors in astronomy, there havebeen efforts to use them for deep photometry to search fornew GCs in M31. However, the small field of view (FOV) ofthe first generation CCDs enabled previous investigators onlyto perform GC surveys for a limited region of M31, and therehas not yet been any wide-field survey of GCs using CCDcameras. It is clear from Table 1 that our new GC surveypresented in this study is the first systematic one for the largestarea of∼ 3◦× 3◦ centered on M31.
Recently several new extended GCs were found in the halolocated at 15. Rp . 116 kpc (whereRp is the projected ra-dius) from the center of M31 (Huxor et al. 2005; Martin et al.2006; Mackey et al. 2007), and Mackey et al. (2006, 2007)presented deep photometry of stars in these clusters based onHubble Space Telescope (HST) ACS images. Kodaira et al.(2004) found 49 compact star clusters withMV < −5 mag and0 < (B − V ) < 1.0 in the south-west field (17′.5× 28′.5) ofthe M31 disk from CCD images taken at the Subaru 8 m tele-scope, some of which may be GCs.
This paper is the first in a series on our wide-field survey ofM31 GCs. In this paper we present a catalog of new GCs inM31, and the analyses of the photometric and spectroscopicdata of the new and known GCs in M31 will be presentedin separate papers. Brief progress reports of this study weregiven in Lee et al. (2002), Kim et al. (2002), and Seguel et al.(2002), which are superseded by this series of papers.
This paper is organized as follows: §2 describes the pho-tometric and spectroscopic observations and data reductions,and §3 the GC search method. Section 4 presents the catalogof new GCs found in this study and some properties of newlyfound GCs, and finally, a summary is given in §5.

2 Kim et al.
2. OBSERVATIONS AND DATA REDUCTION
We carried out two kinds of observation for the survey ofM31 GCs. First, photometric observations were made usingthe CCD camera at the KPNO 0.9 m telescope. Second, spec-troscopic observations were performed using the Hydra multi-fiber spectrograph at the WIYN 3.5 m telescope. We describethe details of these observations below.
2.1. Photometry
2.1.1. Observation
We obtained WashingtonC and M and broadband Kron-CousinsR images using the T2KA CCD camera at the KPNO0.9 m telescope on the nights of UT 1996 October 14 – 25and UT 1998 October 19. The pixel scale of the CCD chipis 0.68′′ pixel−1, and the CCD has 2048× 2048 pixels, cor-responding to 23.2′ × 23.2′ on the sky. We used the Kron-CousinsR filter as an alternative to theT1 filter, since theRfilter accurately reproduces theT1 photometry with 3 timesgreater efficiency (Geisler 1996). The resulting calibratedmagnitudes and colors will therefore be in the WashingtonCMT1 system. Geisler (1996) gave a transformation relationbetweenR andT1, R = 0.003+ T1 − 0.017(C − T1), with an rmsof only 0.02 mag derived from the data of 53 standard stars.
We observed 53 fields covering the central region of M31.Figure 1 shows the location of the observed fields, the namesof which are labeled in the upper left corner of each solid box.For most of the fields, one exposure per filter was made. Typi-cal exposure times for the 1996 run were 1500 s forC and 600s forM andR, while those for the 1998 run were 1200 s forCand 500 s forM andR. The seeing was mostly 1.1′′– 2.0′′(1.6– 2.9 pixels in our CCD frames) during the observations, al-though a few fields have a seeing of 2.0′′– 3.0′′. Table 2lists the journal of observation, where column (1) is the nightnumber, column (2) the observation date in UT, column (3)the field numbers, and column (4) the weather condition. Ofthe total of 11 nights of observation, four nights (N5, N8, N9and Oct98) were photometric, three (N3, N4, and N11) weresemi-photometric, and the remaining four nights were non-photometric or even cloudy. The standard star observationswere made in the photometric and semi-photometric nightsindicated in Table 2.
2.1.2. Data Reduction
We processed all the CCD images to apply overscancorrection, bias subtraction and flat fielding using theIRAF10/CCDREDpackage. We derived the calibration trans-formation using the Washington standard stars (Geisler 1996)observed during the observing runs. We obtained the aperturemagnitudes of the standard stars using a 7.5′′ radius aperture(the same as in Geisler (1996)) from the images of the stan-dard stars. Then we used the IRAFPHOTCAL package toderive the calibration equations.
For three out of the four nights of photometric conditions,all three standard calibration coefficients (zeropoint, colorterm, and airmass term) were derived. For the three nights ofsemi-photometric conditions, we adopted the mean values ofthe color and airmass term coefficients of the three photomet-ric nights to derive the zeropoints. Although the night of UT1996 October 22 was believed to be photometric, there were
10 IRAF(Image Reduction and Analysis Facility) is distributed by the Na-tional Optical Astronomy Observatory, which is operated byAURA, Inc.,under cooperative agreement with the National Science Foundation.
not enough standard stars to derive all three calibration coef-ficients independently, so we adopted the color and airmassterm coefficients of the previous photometric night.
For the fields observed on the nights without standardstars, we derived secondary standard transformations usingthe neighboring fields. Since we initially arranged our targetfields to overlap adjacent fields by 1′ – 2′, we could easilyidentify the stars in common between two neighboring fields.On the image of each filter, we first identified the positionsof the common stars in the two adjacent fields, calculated themean magnitude offsets between the standardized magnitudesand instrumental magnitudes, and then applied this magnitudeoffset (together with the color and atmospheric coefficients ofthe standardized field) to transform the instrumental magni-tudes of the nonphotometric frames. There are 14 fields forwhich this secondary transformation method is applied. Thetypical errors of the standard star calibration are 0.020, 0.022,and 0.019 mag forT1, (C − T1), and (M − T1), respectively.
We have derived the photometry of the objects in the tar-get images using the SExtractor package (Bertin & Arnouts1996). SExtractor performs detection of objects in the im-ages and gives position, aperture magnitude, stellarity, thefull width at half-maximum (FWHM), ellipticity, position an-gle, quality of the photometry, and some other parameters.We used the SExtractor parameters DETECT_MINAREA =5 pixel and DETECT_THRESH = 1.5σ above the local back-ground. The results for new GC searches do not dependstrongly on the choice of these values. The instrumental mag-nitudes of the objects obtained using the SExtractor packagewere transformed into the standard system using the calibra-tion equations.
We have obtained plate solutions for each of the CCD im-ages for astrometry of objects using the Guide Star Cata-logue (GSC) provided by the Space Telescope Science Insti-tute (STScI) and the IRAF tasksCCXYMATCH and CCMAP.These plate solutions transform theX andY coordinates of ourR images to/from the celestial equatorial coordinates of epochJ2000.0 by using the IRAFCCTRAN task. The mean rms er-rors in right ascension and declination are 0.064′′ ± 0.023′′
and 0.064′′±0.024′′, respectively.
2.2. Spectroscopy
2.2.1. Observation
For most of the GC candidates selected from the photomet-ric list of the objects to be described in the next section, wecarried out spectroscopic observation using the Hydra multi-fiber bench spectrograph and T2KC CCD at the WIYN 3.5m telescope on the nights of UT 2000 September 7–9 and UT2001 November 2–4. Table 3 lists the journal of spectroscopicobservations. Table 3 shows the observation date in UT, thenumber of target objects, and the exposure time for each Hy-dra configuration marked in Figure 1.
For both the 2000 and 2001 observations, almost the sameinstrumental setup was used. The [email protected] grating and Sim-mons camera were used. This combination with the blue fibercable covers a wavelength range of∼ 3400− 6600 Å in thefirst order and gives a 7.07 Å spectral resolution and 1.56Å pixel−1 dispersion.
During the observing run of 2000, all three nights wereclear and a total of eight Hydra configurations were used forspectroscopy. However, in the run of 2001 only the first nightwas clear, while the two subsequent nights were cloudy orrainy. Only three Hydra configurations were obtained during

Globular Clusters in M31. I. 3
FIG. 1.— Locations of our survey regions overlaied on a 4◦× 4◦ optical image of M31 from the Digitized Sky Survey (image center : R.A.(J2000.0)=
0h 42m 15s, Dec. (J2000.0)=+41◦ 00′ 37′′). North is at the top and east is to the left. The fields for the KPNO 0.9 m photometric imaging are drawn with solidboxes with the field names labeled in the upper left corner of each box. The field of view of each field is 23.′2× 23.′2 and the observations were made so thatthere was some (1′ − 2′) overlap between adjacent fields. Satellite galaxies NGC 205 and M32 are located in fields 19 and 32, respectively. The Hydra fields aredenoted by smooth circles (for 2000) and polygon-like circles (for 2001), and their names are labelled near the center ofeach field.
this run. The total number of targets observed during the ob-serving runs was 748, including 106 previously known GCsobserved in order to quantify our errors and compare our val-ues with previous studies.
2.2.2. Data Reduction
First we performed overscan correction, image trimming,bias subtraction, and flat combining on the spectroscopic datausing the IRAFCCDRED package. We removed cosmic raysin the object images and combined the resulting object im-ages. For the reduction of the Hydra spectroscopic data, weused the Hydra data reduction task, IRAFDOHYDRA, whichwas specifically designed for multifiber spectral reduction(Valdes 1995).
Before doing the main data reduction part, DOHYDRA firstperforms aperture finding using theAPFIND task, and per-
forms fitting and subtracting of the scattered light using theAPSCATTER task. Then DOHYDRA performs aperture ex-traction, flat-fielding, fiber throughput correction, wavelengthcalibration, and sky subtraction. Dome-flat images were usedas a template to extract the one-dimensional object and cali-bration spectra from the two-dimensional images. Cu/Ar cal-ibration lamp spectra were used for wavelength calibration.The rms error of the wavelength calibration is estimated tobe typically 0.2–0.3 Å. Finally, we calibrated the flux of thespectra of the targets using the spectra of the flux standard starBD +40 4032 (R.A.(B1950)= 20h 06m 40s.0, Dec.(B1950)=+41◦ 06′ 15′′, B2 III, m5556 = 10.45 mag; Strom (1977)) us-ing theCALIBRATE task.
We determined the radial velocity of the targets by cross-correlating their spectra against high signal-to-noise ratio(S/N) template spectra using the IRAFFXCOR task (Tonry

4 Kim et al.
FIG. 2.— SExtractor parameter distributions of the 347 confirmed and 514candidate GCs in the catalogs of Galleti et al. (2006, RBC2),Huxor et al.(2005), and Mackey et al. (2007) matched with our photometry. (a) Stellarityvs. T1 magnitude; (b) stellarity vs. FWHM; (c) stellarity vs. ellipticity;(d) histogram of FWHM/seeing distribution. In panels (a), (b), and (c), thecrosses and the open solid histograms show the distributions of all 861 objectswith good photometry, and the filled circles and hatched histograms showthose of the 347 confirmed GCs. In panel (d), the open solid histogram showsthe distribution of the 347 confirmed GCs and the hatched histogram the 147confirmed compact GCs with stellarity> 0.95.
& Davis 1979; Huchra, Brodie, & Kent 1991). We usedtwo bright GCs in M31 as a reference. GCs 020-073 and158-213 are relatively bright clusters withV = 14.91 magand (B − V ) = 0.83 andV = 14.70 mag and (B − V ) = 0.86,respectively, and have well-determined radial velocitiesofVr = −349±2 and−183±4 km s−1, respectively (Barmby etal. 2000). We used the wavelength range of 3900 – 5400Å for velocity measurement, excluding the noisy region ofλ > 5500 Å due to some sky lines not completely eliminatedeven after sky subtraction. Measuring errors of the radial ve-locity are typicallyerr(v) = 35 km s−1. For the objects withsuccessfully measured velocity values, we measured the S/Nvalues atλ ∼ 5000 Å, obtaining 1<S/N< 75. The peak S/Nvalues are 6 – 10 for all these spectra, and 10 – 20 for newlyfound, highest probability GCs.
3. CLUSTER SEARCH METHOD
We have used both photometric and spectroscopic informa-tion to select GCs in M31. First, using photometric data, weinvestigated various photometric parameters and morpholog-ical properties of the objects in the CCD images. Then weassigned spectral classes to bright objects, and used the radialvelocities to determine the M31 membership of the objectswith measured radial velocities. Finally, we performed thefi-nal classification by careful visual inspection of the imageofeach object, after training our eyes with images of the previ-ously known GCs, stars, and galaxies in our own data. Detailsof these steps are described below.
Before starting a survey of M31 GCs, we tried to find thesuitable parameter space to select M31 GC candidates usingthe photometric data of the known M31 GCs. We matched our
FIG. 3.— (a) Color-magnitude diagram; (b) (C − T1) color distribution;(c) T1 LF of the 347 confirmed and 514 candidate GCs in the catalogs ofGalleti et al. (2006, RBC2), Huxor et al. (2005), and Mackey et al. (2007)matched with our photometry. Small dots and thin solid histograms show thedistributions of all 861 objects with good photometry, opensquares and dot-dashed histograms show the distributions of “all GC candidates” from the GCsearch criterion 1, open circles and dotted histograms showthe distributionsof “good GC candidates” from criterion 2, and filled circles and thick solidhistograms show the distributions of the confirmed GCs in thethree papersabove.
photometric catalog of the objects with the previous catalogsof Galleti et al. (2006) (Revised Bologna Catalog ver. 2.0[RBC2] – their confirmed and candidate GCs), Huxor et al.(2005), and Mackey et al. (2007). There are 861 objects (347confirmed GCs and 514 GC candidates) common between theprevious catalogs and our catalog of photometry derived fromour CCD images.
Figure 2 shows the distributions of three SExtractor param-eters (stellarity, FWHM and ellipticity) based on theR im-ages, and Figures 3 and 4 show the photometric diagrams ofthese objects. In Figure 2 (a), (b), and (c), the crosses and theopen solid histograms show the distributions of all 861 ob-jects with good photometry, and the filled circles and hatchedhistograms show those of the confirmed GCs in common be-tween this study and the papers above. As stellarity of 1 cor-responds to a point-source (star), and a stellarity of 0 to a re-solved object. The distribution of stellarity in Figure 2 showsthat most objects have stellarity of 1, few objects have stel-larity between 0.1 and 0.8, and the rest have stellarity∼ 0.Figure 2 (d) shows the histogram of the normalized FWHM,which is the measured FWHM divided by the seeing value ofeach image.
In Figure 2 several features are noted: (1) the distributionof the stellarity of the confirmed GCs shows a strong peakaround 1 with a broad tail extending to about 0.8, and a weakpeak around 0. There are relatively much fewer GCs in therange between 0.1 and 0.8; (2) the distribution of the ellip-ticity of the confirmed GCs shows a broad peak around 0.1with a tail extending to 0.5; and (3) the distribution of the nor-malized FWHM of the confirmed GCs shows a strong peakaround 1.4, which is significantly larger than that of the stars,1.0. Considering the pixel scale of our CCD chip, typical see-

Globular Clusters in M31. I. 5
FIG. 4.— Color-color diagram of the 347 confirmed and 514 candidateGCs in the catalogs of Galleti et al. (2006, RBC2), Huxor et al. (2005),and Mackey et al. (2007) matched with our photometry. Small dots showthe distributions of all 861 objects with good photometry, open squares showthe distributions of “all GC candidates” from the GC search criterion 1, opencircles show the distributions of “good GC candidates” fromcriterion 2, andfilled circles show the distributions of the confirmed GCs in the three papersabove.
ing of 2 pixels (≈ 1.′′4), and the linear size of 1′′ at the dis-tance of M31 (≈ 3.78 pc), it is expected that most of the GCsin M31 will appear point-source-like. Even for these star-likeGCs, Figure 2 (d) shows that the normalized FWHM is greaterthan 1.
Considering the features in Figure 2, we have set up twokinds of criteria for the selection of GC candidates: (1) cri-teria for “all candidates” are (a) all values of stellarity,(b)1.15< FWHM/seeing. 10, and (c) ellipticity< 0.7; and (2)criteria for “good candidates” are (a) stellarity of 0.8−1.0, (b)1.15< FWHM/seeing. 5, and (c) ellipticity< 0.5. “Goodcandidates” are candidates with higher probability among “allcandidates.” Figure 3 shows theT1 − (C − T1) color-magnitude(CM) diagram (Fig 3 (a)), the histograms of (C−T1) color (Fig3 (b)) andT1 magnitude (Fig 3 (c)) of the 861 objects matchedwith the previous catalogs. Figure 4 shows the (C − M)–(C − T1) color-color (CC) diagram of the same objects. No-table features in Figures 3 and 4 are that (1) the colors of theconfirmed GCs are mostly in the range 1< (C − T1) < 2, (2)the luminosity function (LF) of the confirmed GCs shows apeak atT1 ≈ 17 mag, (3) the CM diagram shows a dominantvertical plume of GCs with 1< (C − T1) < 2 extending up toT1 ∼ 13.5, and (4) the CC diagram shows a well-defined linearsequence of star clusters.
In Figures 3 and 4 we also plotted the data for “all candi-dates” and “good candidates”. It is striking that the generalproperties of these candidates seen in these figures are verysimilar to those of the confirmed GCs, noting that no infor-mation of color and magnitude was used for selecting thesecandidates. This indicates that a significant fraction of thesecandidates may be GCs.
We selected the candidates in the best-seeing image among
theC,M, andR images, which are predominantly theR-bandimages. We used objects at least∼ 1 mag brighter than thelimiting magnitude where the stellarity cannot be used to sep-arate stellar/non-stellar objects. The typical limiting magni-tude of the images isT1 = 22− 23 mag, varying from field tofield due to the seeing and the crowding in the field. We set themagnitude cut-off value for the candidate selection 1 – 2 magbrighter than the limiting magnitude of the images, depend-ing on the seeing and the crowding in the images. The mag-nitude cut-off value for the candidate selection ranges fromT1 ∼ 17.5 mag (for the center field) to∼ 19.5 mag (for halofields or good seeing), mostlyT1 ∼ 19 mag. Therefore oursearch is considered to be incomplete atT1 > 19 mag for mostfields (atT1 > 17.5 mag for the central field). Figure 5 showsan example of our application of the above criteria to one ofthe KPNO fields (F56) with a seeing of≈ 1.9 pixels. In thisfield, there are 4894 measured objects with good photometry.Among these we selected 362 “all GC candidates” accordingto criterion (1), and 277 “good GC candidates” according tocriterion (2).
Finally we marked the “all” and “good” GC candidates se-lected above on the images, and visually inspected their im-ages to finalize the GC candidates. We checked contour mapsand radial profiles of the objects as well as the images them-selves. In the contour map, we classified irregular, signifi-cantly elongated, asymmetric, and loosely concentrated ob-jects as galaxies, and round, slightly elongated, stronglycon-centrated objects as star clusters. Although some faint galax-ies look round in the displayed images, in the contour mapstheir outer areas look irregular, while star clusters look verysmooth and round. Inspection of the contour maps was veryefficient in selecting galaxies. In the radial profile, the ob-jects with FWHM larger than the seeing size are consideredas GCs, those with FWHM similar to seeing size as stars, andthose with a large excess in the wing as galaxies. Checkingcolor, position, and/or velocity information was also included.There are some confusing cases: compact elliptical galaxiesversus GCs, compact GCs versus stars, and compact star clus-ters in H II regions versus galaxies. For these cases spec-troscopic information was needed for classification. In theouter areas close to the edge of each CCD image, the FWHMsget larger due to image degradation. Therefore, we carefullycompared potential targets in these areas with other nearbyobjects to see whether they are really extended.
Spectral information was also used for the classification ofbright objects. We have visually classified the flux-calibratedspectra into stars, star clusters, and galaxies, comparingthemwith the template spectra of the spectral library of Santos etal. (2002). We used the continuum of the 4000− 7000 wave-length range as well as various spectral features: Balmer linesbetween 4000 and 5000 for early-type objects; absorptionlines like CA II H and K, CH (G band), MgH+Mgb, and TiOfor late-type objects; and emission lines for galaxies. Figure 6displays sample spectra for confirmed GCs, young star clus-ters, foreground stars (F, G, and K types), and three galaxies(M31, M32 and a background galaxy).
The radial velocities were used as a strong constraint onthe membership of the objects belonging to the Galaxy, M31,or the distant universe. Most of the objects with radial ve-locities less than−200 km s−1 are probably M31 members,while those from−200 to+200 km s−1 could be M31 mem-bers or Galactic foreground stars. We considered all the ob-jects withv < −300 km s−1 to be M31 members. The objectswith v > 300 km s−1 were classified as background galaxies.

6 Kim et al.
FIG. 5.— Example of our application of the GC search criteria to one of the KPNO fields (F56) with seeing of≈ 1.9 pixels. Panels (a) and (b) show theCM diagram and CC diagram of the selected GC candidates, respectively, and panels (c) – (f) show the parameter space for the GC candidate selection (seeSection 3 for details). Small dots represent all measured objects with good photometry (N=4894), squares are “all GC candidates” selected according to criterion1 (N=362), and open circles superimposed on the squares represent “good GC candidates” selected according to criterion2 (N=277).

Globular Clusters in M31. I. 7
FIG. 6.— Sample spectra of (a) M31 globular clusters, (b) M31 young star clusters, (c) foreground stars, and (d) three galaxies (M31, M32 and a backgroundgalaxy). We have followed Huchra, Brodie, & Kent (1991) and Barmby et al. (2000) for the naming convention of M31 GCs. The numbers after T8− and T9−in the parentheses of panels (c) and (d) are the identification numbers in Tables 16− 17 and 18, respectively.

8 Kim et al.
For objects with−300 km s−1 < v < +300 km s−1, we classi-fied each object consulting its spectral class.
Combining both image and spectral inspections was veryefficient and accurate in classifying the objects. For our fieldsF08–F42, we used both image inspection and spectral inspec-tion methods, while for the fields without spectroscopic data(F1–F7, F43–F52, and F56) we used only the image inspec-tion method.
We have classified the final GCs/GC candidates into threeclasses according to probability as follows: (1) class 1, gen-uine GCs that were confirmed by either spectral types andradial velocities or high resolution images (mostlyHST im-ages); (2) class 2, probable clusters that are probably GCsfrom imaging data but without spectral information; and (3)class 3, possible clusters that are possibly GCs, but may beother kinds of objects like background galaxies.
4. RESULTS
4.1. The Catalog of New Globular Clusters in M31
By applying the cluster search method described in the pre-vious Section to the 53 KPNO fields of M31 covering a∼3◦× 3◦ area, we have found a total of 1164 GC candidates.Among these there are 605 new GC candidates found in thisstudy and 559 previously known GCs in the catalogs of pre-vious studies (e.g., Huxor et al. (2005); Galleti et al. (2006);Mackey et al. (2007)). Table 4 lists a summary of the num-bers of the GCs and GC candidates for each class. Among thenew 605 GC candidates there are 113 genuine GCs (class 1),258 probable GCs (class 2) and 234 possible GCs (class 3).Among the known GCs in previous studies we find 383 gen-uine GCs, 109 probable GCs and 67 possible GCs. In totalthere are 496 genuine GCs, 367 probable GCs and 301 possi-ble GCs.
Tables 5− 6, 7− 11, and 12− 15 present the lists of the GCsand GC candidates newly found in this study for genuine GCs,probable GCs, and possible GCs, respectively. In these tablesthe columns give the running number (col. [1]), the coordi-nates in right ascension and declination (J2000.0; cols. [2]and [3]),T1 magnitudes (col. [4]), (M − T1) and (C − T1) col-ors (cols. [5] and [6]), and the radial velocities derived inthisstudy (col. [7]). The magnitudes and colors here are from thesimple aperture photometry derived using SExtractor with anaperture of radius 5′′. Figures 7, 8, and 9 show theR-bandmosaic images of genuine GCs (class 1) with identificationsin Tables 5− 6 labeled.
Tables 16− 17 and 18 present the lists of 111 stars and 21galaxies, respectively, identified in the present study. Thecolumns are the same as those of Tables 5− 6, except the lastcolumn of Table 18, whithc gives the identification matchedwith the RBC2 of Galleti et al. (2006). These lists of starsand galaxies were obtained from the spectral classificationde-scribed in Section 3. We found that 13 objects in these listswere already identified as galaxies or GC candidates withoutmeasured velocities in the RBC2 catalog.
4.2. Properties of New Globular Clusters
Although the detailed properties of the newly foundGCs/GC candidates as well as those of the whole M31 GCsystem including the previously known GCs will be presentedin separate papers, we show a few salient features of the newlyfound objects here.
Figure 10 shows theT1 − (C − T1) CM diagram (Fig. 10 (a)),(C − T1) color distributions (Fig. 10 (b)), andT1 LF (Fig. 10
(c)) of the newly found GCs/GC candidates in Tables 5− 6,7 − 11, and 12− 15 Figure 11 shows the (C − M) − (C − T1)CC diagram of the same objects. Most of the class 1 GCshaveT1 magnitudes of 17.5− 19.5 mag, which would beV ≈
17.9− 19.9 mag assuming (C − T1) ≈ 1.5 (see below) and us-ing the Geisler (1996)’s transformation coefficients betweenUBVRI photometry andCT1 photometry. Figure 12 shows thedirect comparison of the confirmed, previously known GCsand newly found, class 1 GCs in theT1 − (C − T1) CM dia-gram, and it is noted that most of the class 1 GCs newly foundin this study are fainter than most of the confirmed, previouslyknown GCs. The brightest object among the newly foundclass 1 GCs hasT1 ∼ 14.6 (V ∼ 15.0) mag and the faintestone hasT1 ∼ 19.9 (V ∼ 20.1) mag. We checked the colordistributions of the previously known GCs and newly foundGCs, confirming that they are quite similar.
Figure 10 (b) shows that the (C − T1) color distributions ofall three classes encompass the color range of 1< (C −T1) < 2[0.6 . (B − V) . 1.0; Geisler (1996)], in which most of theclass 1 objects reside. There are a rather large number of veryred objects with 2< (C −T1) < 2.5 [(B−V)≈ 1.0−1.3], whichcould be reddened GCs or intrinsically red clusters.
Figure 13 shows the spatial distribution and histograms ofthe newly found GCs and GC candidates. Open circles andfilled histograms are for class 1 GCs in this study, crosses arefor class 2 GCs in this study, and dots and open solid his-tograms are for GCs in the catalogs of Galleti et al. (2006,their class 1), Huxor et al. (2005), and Mackey et al. (2007).Most of the newly found, class 1 GCs are located in the diskarea of M31. Higher spatial resolution imaging and spec-troscopy, and possibly in the near-infrared wavelength band,would be needed to search for GCs in the central region ofM31 where we missed many faint GCs, as seen in Figure 13(top).
5. SUMMARY
We have presented the results of a new systematic wide fieldCCD survey of M31 GCs. Using WashingtonCMT1 CCDimages obtained at the KPNO 0.9 m telescope and spectraobtained using the WIYN 3.5 m telescope and Hydra mul-tifiber bench spectrograph, we have investigated the photo-metric and morphological parameters of the objects, visuallychecked their images, and obtained their spectra and radialve-locities. Finally, we have found 1164 GCs and GC candidates,of which 559 are previously known GCs and 605 are newlyfound GC candidates. Among the new objects there are 113genuine GCs (class 1), 258 probable GCs (class 2), and 234possible GCs (class 3). Among the previously known objectsthere are 383 genuine GCs, 109 probable GCs and 67 possibleGCs. In total there are 496 genuine GCs, 367 probable GCsand 301 possible GCs.
The magnitudes and colors of most of the newly found class1 objects are 17.5< T1 < 19.5 mag and 1< (C − T1) < 2. Thefaintest part of the M31 GC LF is mostly filled with these newGC candidates, although the intrinsically very faint GCs likeAM 4, Palomar 1, E 3, and Palomar 13 in the Galaxy (see, e.g.,van den Bergh & Mackey (2004); Sarajedini et al. (2007))may remain to be detected.

Globular Clusters in M31. I. 9
FIG. 7.— Gray-scale mosaic maps of theR-band CCD images of genuine GCs (class 1) for identificationsfrom 1 to 48 in Tables 5−6. The size of each field is40′′ ×40′′, with north to the left and east at the bottom. The GC is centered in each image, in the center of the circle of 5′′ radius.

10 Kim et al.
FIG. 8.— Same as Figure 7, but for identifications from 49 to 96.

Globular Clusters in M31. I. 11
FIG. 9.— Same as Figure 7, but for identifications from 97 to 113.

12 Kim et al.
FIG. 10.— Photometric diagrams of the three classes of GCs/GC candidates newly found in this study. (a)T1 − (C − T1) diagram; (b) (C − T1) color distribution;(c) T1 LF. Open circles and thin solid histograms are for genuine GCs (class 1), open squares and dotted histograms are for probable GCs (class 2), and opentriangles and dot-dashed histograms are for possible GCs (class 3). Thick solid histograms in panels (b) and (c) are the sum of the numbers of all three classes.

Globular Clusters in M31. I. 13
FIG. 11.— (C − M) − (C − T1) diagram of the three classes of GCs/GCcandidates newly found in this study. Open circles are for genuine GCs (class1), open squares are for probable GCs (class 2), and open triangles are forpossible GCs (class 3).
FIG. 12.—T1 − (C − T1) CM diagram of confirmed, previously known GCsin Figure 3 (a) (crosses) and newly found, class 1 GCs in Figure 10 (a) (opencircles).
We would like to thank the anonymous referee for pro-viding prompt and thoughtful comments that helped improvethe original manuscript. The authors are grateful to the staffmembers of the KPNO for their warm support during our ob-servations and data reduction. The WIYN Observatory is ajoint facility of the University of Wisconsin-Madison, Indi-ana University, Yale University, and the National Optical As-
FIG. 13.— Spatial distribution and histograms of the newly found GCs andGC candidates.X is the distance measured parallel to the major axis of M31increasing to the north-east direction, andY is the distance parallel to theminor axis. The large ellipse is for M31 with position angle 37.7◦(Racine1991). The positional data of the galaxies are from Karachentsev et al.(2004), while those for And VIII are from Morrison et al. (2003). Opencircles are for class 1 GCs in this study, crosses are for class 2 GCs in thisstudy, and dots are for GCs in the catalogs of Galleti et al. (2006, their class1), Huxor et al. (2005), and Mackey et al. (2007). The filled histograms arefor class 1 GCs in this study, and the open solid histograms are for GCs in thethree papers above.
tronomy Observatory. M. G. L. was supported in part by aKorean Research Foundation grant (KRF-2000-DP0450) andABRL (R14-2002-058-01000-0). D. G. gratefully acknowl-edges support from Chilean Centro de Astrofísica FONDAPgrant 15010003. A. S. was supported by NSF CAREER grantAST 00-94048.
REFERENCES
Alloin, D., Pelat, D., & Bijaoui, A. 1976, A&A, 50, 127 (Erratum 1977,A&A, 54, 321)
Aurière, M., Coupinot, G., & Hecquet, J. 1992, A&A, 256, 95Baade, W., & Arp, H. C. 1964, ApJ, 139, 1027Barmby, P., Huchra, J. P., Brodie, J. P., Forbes, D. A., Schroder, L. L., &
Grillmair, C. J. 2000, AJ, 119, 727
Barmby, P., & Huchra, J. P. 2001, AJ, 122, 2458Battistini, P., Bònoli, F., Braccesi, A., Federici, L., Fusi Pecci, F., Marano, B.,
& Börngen, F. 1987, A&AS, 67, 447Battistini, P., Bònoli, F., Casavecchia, M., Ciotti, L., Federici, L., & Fusi
Pecci, F. 1993, A&A, 272, 77Bertin, E., & Arnouts, S. 1996, A&AS, 117, 393

14 Kim et al.
TABLE 1A L IST OF PREVIOUSM31 GC SEARCHES
Reference Plate vs. CCD CCD FOV N(GC) CommentsHubble (1932) plate · · · 140 M31’s disk only
Seyfert & Nassau (1945) plate · · · 101 W. Baade’s discovery, no coordinatesVetešnik (1962) plate · · · (241)a coordinates,V magnitudes and colors
Baade & Arp (1964) plate · · · 30Mayall & Eggen (1953) plate · · · 4 outer parts of M31
Alloin, Pelat, & Bijaoui (1976) plate · · · 5 nuclear region of M31Sargent et al. (1977) plate · · · 355 KPNO 4 m
Crampton et al. (1985) spectra plates · · · 109 CFHT 3.6 m, A catalog of total 509 GCsBattistini et al. (1987) plate · · · 353b Bologna 1.52 m
Wirth, Smarr, & Bruno (1985) video camera 2′×2′ ∼ 50 bulge region
Aurière, Coupinot, & Hecquet (1992) CCD 1′.7×2′.7 16c 7′.7×7′.7 field centered on M31Battistini et al. (1993) CCD 320×512 pixel2 4d R < 5.′5 (R . 1 kpc)
Mochejska et al. (1998) CCD 11′ ×11′ 4e four fields in the M31’s diskBarmby et al. (2000) CCD 22′ ×22′ (435)f A new catalog of “best” photometry
Barmby & Huchra (2001) HST/WFPC2 ∼ 2′.7×2′ .7 32 157 imagesPerrett et al. (2002) spectroscopy · · · (288)g WHT 4.2 m + WYFFOSGalleti et al. (2004) 2MASS/NICMOS3 all sky (693)h Revised Bologna Catalogue of 1035 objectsHuxor et al. (2005) CCD ≈ 0.29deg2 3 INT 2.5 m + WFCGalleti et al. (2006) spectroscopy · · · (42)i Revised Bologna Catalogue V2.0
Mackey et al. (2006, 2007) HST/ACS ∼ 3′.4×3′ .4 14 HST Program GO 10394 (Cycle 13)This study CCD 23.′2×23.′2 605j mapping∼ 3◦ ×3◦ field centered on M31
aNot new discoveries, but studies on the objects found by Hubble (1932) and Seyfert & Nassau (1945).bWith 254 class A, 99 class B, 152 class C, and 218 class D objects, where class A objects are very high-confidence objects, class B objects are high confidence
objects, class C objects are plausible candidates, and class D miscellaneous non-stellar objects with an expected percentage of actual clusters of the order of afew percent.
cWith 12 reliable, 4 possible.dWith 3 class A, 1 class B, 20 class C, and 20 class D objects.eWith 2 class A, 2 class B, 28 class C, and 36 class D objects.fObservations of 13 fields centered on M31, but no GC search. Ofthe 435 objects, 268 have optical photometry in four or more filters, 224 have near-infrared
photometry, 200 have radial velocities, and 188 have spectroscopic metallicities.gSpectroscopy for 288 previously known objects. They presented a spectroscopic database of 321 velocities and 301 metallicities.h2MASS near-infrared photometry for 693 known and candidateGCs. Of 1035 objects, 337 are confirmed GCs, 688 are GC candidates, and 10 are objects with
controversial classification.iConfirmed GC nature from spectroscopy of 76 candidates.jWith 113 class 1, 258 class 2, and 234 class 3, where classes 1,2, and 3 are similar to classes A, B, and C, respectively, in Battistini et al. (1987).
Crampton, D., Cowley, A. P., Schade, D., & Chayer, P. 1985, ApJ, 288, 494De Angeli, F., Piotto, G., Cassisi, S., Busso, G., Recio-Blanco, A., Salaris,
M., Aparicio, A., & Rosenberg, A. 2005, AJ, 130, 116Galleti, S., Federici, L., Bellazzini, M., Fusi Pecci, F., &Macrina, S. 2004,
A&A, 416, 917Galleti, S., Federici, L., Bellazzini, M., Buzzoni, A., & Fusi Pecci, F. 2006,
A&A, 456, 985Geisler, D. 1996, AJ, 111, 480Hubble, E. P. 1932, ApJ, 76, 44Huchra, J. P., Brodie, J. P., & Kent, S. M. 1991, ApJ, 370, 495Huxor, A. P., Tanvir, N. R., Irwin, M. J., Ibata, R., Collett,J. L., Ferguson, A.
M. N., Bridges, T., & Lewis, G. F. 2005, MNRAS, 360, 1007Karachentsev, I. D., Karachentseva, V. E., Huchtmeier, W. K., & Makarov, D.
I. 2004, AJ, 127, 2031Kim, S. C., Lee, M. G., Geisler, D., Seguel, J., Sarajedini, A., & Harris, W.
E. 2002, in IAU Symp. 207, Extragalactic Star Clusters, ed. D. Geisler, E.K. Grebel, & D. Minniti, 143
Kodaira, K., Vansevicius, V., Bridzius, A., Komiyama, Y., Miyazaki, S.,Stonkute, R., Sabelviciute, I., & Narbutis, D. 2004, PASJ, 56, 1025
Lee, M. G., Kim, S. C., Geisler, D., Seguel, J., Sarajedini, A., & Harris, W.E. 2002, in IAU Symp. 207, Extragalactic Star Clusters, ed. D. Geisler, E.K. Grebel, & D. Minniti, 46
Mackey, A. D., Huxor, A., Ferguson, A. M. N., Tanvir, N. R., Irwin, M., Ibata,R., Bridges, T., Johnson, R. A., & Lewis, G. 2006, ApJ, 653, L105
Mackey, A. D., Huxor, A., Ferguson, A. M. N., Tanvir, N. R., Irwin, M., Ibata,R., Bridges, T., Johnson, R. A., & Lewis, G. 2007, ApJ, 655, L85
Martin, N. F., Ibata, R. A., Irwin, M. J., Chapman, S., Lewis,G. F., Ferguson,A. M. N., Tanvir, N., & McConnachie, A. W. 2006, MNRAS, 371, 1983
Mayall, N. U., & Eggen, O. J. 1953, PASP, 65, 24
Mochejska, B. J., Kaluzny, J., Krockenberger, M., Sasselov, D. D., & Stanek,K. Z. 1998, Acta Astronomica, 48, 455
Morrison, H. L., Harding, P., Hurley-Keller, D., & Jacoby, G. 2003, ApJ, 596,L183
Perrett, K. M., Bridges, T. J., Hanes, D. A., Irwin, M. J., Brodie, J. P., Carter,D., Huchra, J. P., & Watson, F. G. 2002, AJ, 123, 2490
Racine, R. 1991, AJ, 101, 865Salaris, M., & Weiss, A. 2002, A&A, 388, 492Santos, J. F. C., Jr., Alloin, D., Bica, E., & Bonatto, C. 2002, in Extragalactic
Star Clusters, IAU Symp. 207, eds. D. Geisler, E. K. Grebel, &D. Minniti,727
Sarajedini, A., Bedin, L. R., Chaboyer, B., Dotter, A., Siegel, M., Anderson,J., Aparicio, A., King, I., Majewski, S., Marín-Franch, A.,Piotto, G., Reid,I. N., & Rosenberg, A. 2007, AJ, accepted (astro-ph/0612598)
Sargent, W. L. W., Kowal, C. T., Hartwick, F. D. A., & van den Bergh, S.1977, AJ, 82, 947
Seguel, J., Geisler, D., Lee, M. G., Kim, S. C., Sarajedini, A., & Harris, W.E. 2002, in IAU Symp. 207, Extragalactic Star Clusters, ed. D. Geisler, E.K. Grebel, & D. Minniti, 146
Seyfert, C. K., & Nassau, J. J. 1945, ApJ, 102, 377Strom, K. M. 1977, Standard Stars for IIDS Observations, Kitt Peak National
ObservatoryTonry, J. T., & Davis, M. 1979, AJ, 84, 1511Valdes, F. 1995, Guide to the HYDRA Reduction Task DOHYDRAvan den Bergh, S., & Mackey, A. D. 2004, MNRAS, 354, 713Vetešnik, M. 1962, Bull. Astr. Inst. Czech, 13, 180Wirth, A., Smarr, L. L., & Bruno, T. L. 1985, ApJ, 290, 140

Globular Clusters in M31. I. 15
TABLE 2SUMMARY OF KPNO 0.9M PHOTOMETRICOBSERVATIONS
Night Obs. Date (UT) Field Weather
(1) (2) (3) (4)
N1 1996 October 14 23(C) 26 cloudy
N2 1996 October 15 16 17 18(long)a 19 20 23(M, T1) 24 25(long)b 27 cloudy
N3 1996 October 16 18(short)a 25(short)b 30 31 32 33 34 35 semi-photometric
N4 1996 October 17 28 36 semi-photometric
N5 1996 October 18 09 10 37 38 39 40 41 photometric
N6 1996 October 19 · · · · · ·
N7 1996 October 20 · · · · · ·
N8 1996 October 21 11 12 13 14 15 29 42 43(M) photometric
N9 1996 October 22 43(C, T1) 44 45c photometric
N10 1996 October 23 (45c) 46 47 48 49 50 non-photometric
N11 1996 October 24 01 02 03 04 05 semi-photometric
N12 1996 October 25 06 non-photometric
Oct98 1998 October 19 07 08 21 22 51 52 56 photometric
NOTE. — The fields with standard transformation data (photometric and semi-photometric nights) are represented with bold letters.a For the field of F18, which is just the northern field of F25, we took two sets of data; long exposures (1500s inC, 600s inM, and 600s inT1) and short exposures(300s inC, 100s inM, and 100s× 2 in T1).b For the field of F25, which includes the M31 central region, wetook of data; long exposures (1500s inC, 600s inM, and 300s× 2 in T1) and short exposures(300s inC, 200s inM, and 200s× 2 in T1).c Field 45 was observed both on N9 and N10 with the same exposuretime setups. Even though the seeing of N10 for F45 was slightly better than that of N9(1.′′6 versus 2.′′0), we primarily used the N9 data for the utilization of N9 standard transformation information.
TABLE 3SUMMARY OF WIYN 3.5 M SPECTROSCOPICOBSERVATIONS
Hydra N(observed)a
Obs. Date (UT) Configuration (=newb + oldc) N(vel)d Exposure Time
2000 September 7 1 68 (= 66+ 2) 38 1800 s× 4 = 7200 s (2h)2000 September 7 2 73 (= 56+17) 66 1800 s× 3 + 900 s = 6300 s (1h 45m)2000 September 8 3 64 (= 64+ 0) 47 1800 s× 4 = 7200 s (2h)2000 September 8 4 62 (= 59+ 3) 34 1800 s× 3 = 5400 s (1h 30m)2000 September 8 5 71 (= 59+12) 56 1800 s× 4 = 7200 s (2h)2000 September 9 6 75 (= 74+ 1) 36 1800 s× 4 = 7200 s (2h)2000 September 9 B 70 (= 67+ 3) 56 1800 s× 4 = 7200 s (2h)2000 September 9 E 70 (= 60+10) 57 1800 s× 3 + 1041 s = 6441 s (1h 47m 21s)
sub-total 552 (=504+48) 3902001 November 2 11 69 (= 54+15) 35 2400 s× 3 = 7200 s (2h)2001 November 2 12 79 (= 45+34) 60 2400 s× 3 = 7200 s (2h)2001 November 2 17 47 (= 38+ 9) 20 2400 s× 1 = 2400 s (40m)
sub-total 195 (=137+58) 115Total 748 (=642+106) 505
aNumber of all observed objects.bGC candidates found from the photometric criteria in this study.cPreviously known GCs.dNumber of objects for which successful velocities were measured.
TABLE 4NUMBER OF GLOBULAR CLUSTERSFOUND IN THIS STUDY
Class Previously found by othersa New GCs Sum
1 383 113 4962 109 258 3673 67 234 301
Sum 559 605 1164
ain Huxor et al. (2005); Galleti et al. (2006); Mackey et al. (2007) and references there in.

16 Kim et al.
TABLE 5A L IST OF NEW GLOBULAR CLUSTERS(CLASS 1)
R.A.a Decl.b vID (J2000.0) (J2000.0) T1 (M − T1) (C − T1) (km s−1)(1) (2) (3) (4) (5) (6) (7)1 00:36:33.54 +40:39:44.3 17.251±0.007 0.650±0.011 1.542±0.015 −239.5±46.72 00:36:34.99 +41:01:08.0 18.805±0.030 0.677±0.047 1.407±0.060 −402.7±92.53 00:37:10.67 +41:41:17.4 17.834±0.011 0.778±0.019 1.787±0.030 −315.9±34.54 00:38:01.31 +42:04:06.0 18.311±0.016 0.708±0.027 1.565±0.040 −27.4±32.85 00:38:59.15 +41:40:27.4 18.848±0.031 0.877±0.077 1.842±0.083 −405.2±43.16 00:39:39.69 +40:33:56.4 18.811±0.045 0.648±0.062 1.456±0.078 −319.9±53.57 00:39:44.03 +40:51:18.4 17.630±0.017 0.204±0.020 −0.068±0.018 −390.4±86.68 00:40:00.39 +40:43:53.5 18.581±0.038 0.769±0.057 1.628±0.070 −108.9±27.99 00:40:05.54 +40:56:14.0 19.374±0.079 0.885±0.125 1.464±0.132 −422.7±90.210 00:40:05.95 +40:35:38.9 18.154±0.025 0.961±0.040 1.365±0.041 −585.0±26.311 00:40:16.82 +40:39:33.7 18.697±0.041 0.652±0.056 1.817±0.087 −581.5±20.012 00:40:18.94 +41:00:50.9 18.125±0.025 0.840±0.039 1.897±0.055 −429.9±61.313 00:40:22.34 +40:50:07.5 18.568±0.038 0.855±0.059 1.831±0.079 −104.5±52.914 00:40:24.79 +40:48:46.4 17.460±0.014 0.495±0.019 0.989±0.019 −495.0±41.015 00:40:26.15 +40:45:31.9 19.716±0.110 0.699±0.158 0.808±0.139 −542.5±55.916 00:40:31.69 +40:46:08.1 19.259±0.070 1.016±0.119 2.319±0.206 −675.6±42.117 00:40:48.20 +41:00:32.2 18.867±0.050 0.456±0.066 0.964±0.067 −510.6±25.418 00:40:53.51 +41:16:14.7 18.701±0.048 0.724±0.063 1.274±0.067 −285.8±24.919 00:41:04.95 +41:28:37.8 18.225±0.029 1.058±0.043 2.450±0.078 −137.7±41.920 00:41:13.34 +41:09:41.6 19.614±0.112 0.698±0.145 0.285±0.122 −513.0±73.221 00:41:14.89 +40:49:38.2 18.251±0.040 0.939±0.060 1.711±0.067 −222.6±39.122 00:41:15.87 +40:28:28.7 18.631±0.025 0.760±0.040 1.329±0.045 −343.0±64.123 00:41:17.83 +40:43:34.5 18.976±0.078 0.944±0.118 1.239±0.105 −548.7±49.024 00:41:19.61 +40:39:29.2 18.987±0.034 1.052±0.065 2.857±0.184 −465.9±38.525 00:41:22.18 +40:49:57.5 19.321±0.104 1.375±0.202 2.889±0.394 −625.0±28.326 00:41:24.58 +40:36:03.2 18.904±0.032 0.780±0.052 2.036±0.090 −568.0±55.227 00:41:24.83 +40:45:19.4 19.167±0.092 1.031±0.146 1.726±0.155 −498.8±46.928 00:41:31.65 +40:59:28.7 18.832±0.066 1.536±0.144 2.733±0.223 −408.2±33.229 00:41:33.26 +40:39:38.6 18.718±0.061 0.755±0.085 1.377±0.087 −537.5±60.030 00:41:33.98 +40:42:22.2 18.882±0.071 0.738±0.098 1.646±0.115 −476.3±38.431 00:41:35.17 +40:53:41.1 19.530±0.128 1.118±0.213 1.649±0.208 −519.3±38.632 00:41:38.42 +40:58:26.0 18.749±0.063 0.630±0.083 1.491±0.094 −448.0±24.633 00:41:40.44 +40:46:08.9 19.017±0.081 0.742±0.112 1.145±0.105 −501.4±36.334 00:41:41.71 +40:52:00.9 18.571±0.054 0.815±0.077 1.051±0.068 −531.8±45.735 00:41:47.25 +41:52:34.0 19.310±0.071 1.084±0.157 3.183±0.789 −385.2±55.836 00:41:47.34 +40:51:07.5 18.871±0.070 0.877±0.102 1.977±0.137 −419.2±65.237 00:41:50.88 +40:45:12.9 19.896±0.183 0.460±0.228 0.516±0.204 −364.4±56.238 00:41:50.89 +40:52:47.1 17.720±0.024 0.916±0.037 1.675±0.041 −383.0±41.639 00:41:51.06 +41:20:14.8 18.114±0.070 0.580±0.093 1.135±0.102 −246.1±35.340 00:41:53.79 +40:54:48.4 18.802±0.066 0.683±0.089 1.478±0.099 −464.5±70.241 00:42:02.26 +40:53:45.5 18.910±0.074 0.381±0.090 0.705±0.085 −453.7±60.742 00:42:03.96 +40:56:51.2 19.614±0.140 1.004±0.220 0.765±0.164 −536.7±26.343 00:42:05.25 +40:48:01.5 18.493±0.049 0.904±0.074 1.780±0.087 −297.0±75.244 00:42:06.33 +40:53:15.6 18.328±0.043 0.829±0.062 1.138±0.056 −490.5±45.545 00:42:09.52 +40:47:43.5 15.497±0.003 0.657±0.005 1.449±0.005 −543.8±52.346 00:42:13.18 +40:46:11.5 18.975±0.077 0.703±0.106 1.289±0.107 −416.6±43.547 00:42:14.27 +40:50:07.0 19.681±0.148 0.629±0.197 1.184±0.196 −434.9±63.448 00:42:17.59 +40:55:15.3 18.129±0.036 0.711±0.049 1.216±0.048 −409.4±42.949 00:42:19.45 +40:52:21.7 19.378±0.112 0.822±0.160 1.541±0.172 −373.5±65.950 00:42:21.54 +41:14:19.9 17.508±0.040 0.891±0.060 1.876±0.087 −347.5±43.151 00:42:32.10 +40:53:34.0 18.869±0.069 1.206±0.121 2.436±0.186 −373.2±34.652 00:42:37.31 +41:50:53.5 18.186±0.027 0.591±0.044 1.135±0.058 −99.1±25.253 00:42:40.78 +40:17:52.0 17.858±0.013 0.784±0.020 1.713±0.028 −347.6±25.954 00:42:45.05 +41:08:15.4 17.702±0.048 0.759±0.068 1.678±0.092 −509.8±25.055 00:42:51.82 +40:44:09.3 18.074±0.034 0.787±0.048 1.734±0.058 −675.9±76.056 00:42:54.27 +41:01:53.0 18.405±0.046 0.606±0.060 1.447±0.068 −442.2±47.157 00:42:58.06 +41:23:03.3 14.627±0.003 0.514±0.004 1.119±0.005 −220.6±19.758 00:43:05.93 +41:50:59.5 18.945±0.054 0.648±0.091 0.855±0.099 −301.0±54.359 00:43:09.87 +41:19:01.2 17.111±0.027 1.059±0.046 2.519±0.096 −165.8±35.360 00:43:11.84 +40:56:04.9 18.561±0.052 1.070±0.085 2.170±0.117 −203.6±68.761 00:43:13.62 +41:38:28.0 18.754±0.075 0.151±0.085 1.069±0.090 −253.4±41.562 00:43:14.46 +41:53:46.6 19.081±0.060 0.588±0.095 1.444±0.155 −50.7±27.663 00:43:16.02 +41:27:57.0 17.644±0.026 1.036±0.040 2.451±0.062 −215.0±40.564 00:43:18.28 +40:59:23.6 19.305±0.051 0.536±0.072 1.634±0.108 −259.0±42.765 00:43:20.01 +41:39:41.5 18.094±0.041 0.655±0.053 1.261±0.052 −373.0±110.566 00:43:24.18 +41:38:42.5 19.808±0.198 0.838±0.275 1.182±0.244 −197.1±25.667 00:43:27.53 +41:35:34.8 17.988±0.036 1.023±0.055 2.249±0.074 −183.8±42.268 00:43:28.10 +41:00:21.2 19.083±0.041 0.783±0.067 1.948±0.109 −342.0±104.569 00:43:34.31 +41:43:38.9 18.222±0.046 0.937±0.067 1.459±0.062 −382.4±64.970 00:43:39.75 +41:29:16.4 18.485±0.057 0.976±0.084 2.369±0.126 −70.3±46.871 00:43:46.52 +41:39:29.1 18.760±0.073 1.017±0.110 2.620±0.192 −149.1±27.672 00:43:46.61 +41:22:28.0 16.973±0.012 0.835±0.017 1.826±0.020 −160.2±38.773 00:43:48.49 +41:07:48.0 17.507±0.019 0.897±0.027 1.924±0.033 −32.8±40.874 00:43:50.26 +41:41:47.9 18.375±0.053 0.823±0.073 1.563±0.075 −90.1±33.875 00:43:52.45 +41:38:30.0 18.873±0.083 0.892±0.119 1.499±0.114 −116.4±39.276 00:43:52.93 +41:45:17.8 18.343±0.051 0.923±0.074 1.646±0.075 −139.5±39.177 00:43:56.29 +41:19:47.9 17.813±0.025 0.633±0.033 1.377±0.034 −149.6±55.678 00:43:58.53 +41:25:02.4 17.687±0.028 0.821±0.039 1.390±0.038 −219.9±38.679 00:44:04.58 +41:32:09.3 18.025±0.038 1.154±0.061 2.175±0.073 −258.4±25.980 00:44:06.81 +41:49:03.7 18.070±0.024 0.361±0.034 1.367±0.058 −145.7±22.181 00:44:07.02 +41:47:52.9 18.676±0.041 1.043±0.084 2.322±0.207 −71.4±29.882 00:44:07.32 +41:47:05.4 19.327±0.075 0.599±0.119 1.377±0.186 −83.8±39.183 00:44:09.96 +41:51:28.2 19.027±0.056 1.240±0.134 2.187±0.257 −139.9±23.684 00:44:12.28 +41:21:11.1 18.192±0.036 0.791±0.049 1.051±0.044 −80.5±61.785 00:44:20.70 +41:41:45.2 18.419±0.056 0.772±0.076 0.882±0.064 −55.3±34.586 00:44:26.03 +41:35:14.4 17.243±0.018 0.895±0.026 2.133±0.035 −68.8±23.287 00:44:27.35 +41:57:56.3 18.084±0.024 0.805±0.043 1.306±0.057 −113.9±25.788 00:44:31.84 +41:52:22.0 18.482±0.033 1.070±0.070 3.470±0.439 −116.8±90.489 00:44:35.89 +41:38:00.3 18.812±0.077 1.009±0.116 2.249±0.158 −86.4±18.590 00:44:42.60 +41:41:10.0 18.915±0.087 0.718±0.115 1.304±0.111 −125.4±30.591 00:44:46.84 +41:46:43.6 18.338±0.030 1.215±0.071 1.501±0.082 40.2±25.092 00:44:51.53 +41:50:56.2 19.299±0.074 0.500±0.112 1.050±0.146 −174.6±25.593 00:44:58.44 +41:56:36.6 18.940±0.053 0.928±0.101 1.505±0.142 −68.8±44.494 00:44:59.30 +41:33:05.1 18.160±0.043 0.774±0.059 1.447±0.059 −8.4±28.995 00:45:02.20 +41:49:39.0 18.741±0.044 1.118±0.096 1.777±0.145 −14.7±42.496 00:45:02.21 +41:23:36.9 17.942±0.029 0.625±0.037 1.327±0.038 −312.9±51.697 00:45:05.17 +41:42:29.7 18.521±0.061 0.599±0.077 1.227±0.076 −131.1±21.298 00:45:07.59 +41:35:16.1 18.553±0.062 0.837±0.087 1.361±0.081 −193.4±59.399 00:45:08.19 +41:56:43.5 18.300±0.030 0.617±0.047 1.135±0.062 −135.4±54.5100 00:45:13.91 +41:31:33.4 18.236±0.046 0.894±0.066 1.569±0.066 −123.2±57.6101 00:45:18.25 +41:49:35.9 18.795±0.045 0.880±0.081 1.769±0.132 −67.7±46.4102 00:45:39.85 +41:52:46.8 18.079±0.024 0.597±0.037 1.213±0.047 −75.8±47.2103 00:45:40.80 +40:39:51.5 17.949±0.011 0.714±0.019 1.625±0.028 −176.2±28.1
Globular Clusters in M31. I. 17
TABLE 5 — Continued
R.A.a Decl.b vID (J2000.0) (J2000.0) T1 (M − T1) (C − T1) (km s−1)(1) (2) (3) (4) (5) (6) (7)104 00:45:44.28 +41:57:27.4 17.367±0.012 0.917±0.023 1.741±0.035 −301.2±17.2105 00:45:51.82 +41:57:41.2 18.497±0.034 0.704±0.056 1.500±0.083 −128.5±25.2106 00:45:52.08 +42:05:26.0 18.939±0.051 1.021±0.101 1.829±0.158 −889.9±38.2107 00:46:50.78 +41:42:27.5 18.055±0.019 0.820±0.029 1.801±0.038 −21.2±58.1108 00:47:14.24 +40:38:12.3 15.657±0.002 0.600±0.003 1.107±0.004 −396.5±37.6109 00:47:16.82 +41:03:11.3 18.852±0.028 0.439±0.041 1.287±0.052 11.8±55.4110 00:47:55.75 +41:27:32.8 19.010±0.038 0.663±0.069 1.509±0.109 −16.2±58.6111 00:48:14.58 +41:29:19.4 18.672±0.027 0.841±0.056 1.894±0.107 −206.2±40.7112 00:48:15.87 +41:23:31.2 15.880±0.002 0.495±0.004 1.072±0.004 −251.9±46.3113 00:48:40.23 +41:55:44.6 17.904±0.015 0.640±0.026 1.262±0.037 −48.8±22.4
NOTE. — Table 5 is published in its entirety in the electronic edition of theAstronomical Journal. A portion is shown here for guidance regarding its form and content.a Right ascension in units of hours, minutes, and seconds.b Declination in units of degrees, arcminutes, and arcseconds.

18 Kim et al.
TABLE 6A L IST OF NEW PROBABLE GLOBULAR CLUSTERS(CLASS 2)
R.A.a Decl.b vID (J2000.0) (J2000.0) T1 (M − T1) (C − T1) (km s−1)(1) (2) (3) (4) (5) (6) (7)1 00:33:23.07 +40:04:40.7 17.784±0.015 0.896±0.036 2.223±0.102 · · ·2 00:33:32.20 +39:51:32.8 17.534±0.010 0.505±0.014 1.009±0.014 · · ·3 00:33:37.03 +39:40:59.0 16.283±0.004 0.794±0.006 1.570±0.007 · · ·4 00:34:34.20 +40:02:49.4 18.777±0.038 1.145±0.106 2.277±0.266 · · ·5 00:35:21.20 +41:55:32.6 17.957±0.013 1.031±0.025 2.646±0.065 · · ·6 00:35:34.24 +41:11:53.0 18.409±0.018 0.883±0.033 1.826±0.050 · · ·7 00:35:45.26 +39:39:21.3 18.334±0.020 0.943±0.036 2.435±0.082 · · ·8 00:35:58.15 +39:37:35.5 17.527±0.010 0.963±0.018 1.938±0.028 · · ·9 00:36:00.23 +40:56:19.2 18.624±0.025 1.249±0.055 2.728±0.132 · · ·10 00:36:01.70 +39:48:50.2 17.916±0.014 0.965±0.025 2.316±0.052 · · ·11 00:36:02.02 +41:14:43.4 18.930±0.029 0.652±0.047 1.144±0.052 · · ·12 00:36:05.08 +40:55:19.6 17.252±0.008 1.288±0.017 2.343±0.029 · · ·13 00:36:31.70 +41:11:41.3 18.042±0.013 1.006±0.026 2.192±0.047 · · ·14 00:36:32.68 +40:37:46.5 19.045±0.034 0.757±0.054 1.673±0.080 · · ·15 00:37:09.75 +40:11:36.0 16.105±0.004 0.488±0.007 1.051±0.010 · · ·16 00:37:19.08 +40:47:48.3 17.802±0.013 0.683±0.020 1.368±0.024 · · ·17 00:37:30.44 +40:36:43.8 17.535±0.012 0.986±0.021 2.450±0.047 · · ·18 00:37:30.82 +40:18:23.9 18.493±0.028 0.807±0.046 1.640±0.063 · · ·19 00:37:33.47 +40:05:28.7 18.213±0.030 1.010±0.066 2.180±0.174 · · ·20 00:37:35.68 +40:35:14.4 18.256±0.022 1.215±0.047 2.625±0.105 · · ·21 00:37:53.16 +41:31:09.3 18.904±0.033 0.764±0.075 1.602±0.075 · · ·22 00:37:54.31 +40:17:26.7 17.886±0.022 1.272±0.059 2.530±0.172 · · ·23 00:38:00.42 +41:34:15.6 18.583±0.025 0.840±0.060 1.462±0.051 · · ·24 00:38:11.00 +40:38:51.4 18.650±0.032 0.748±0.051 1.933±0.088 · · ·25 00:38:43.98 +40:24:58.9 19.373±0.062 0.747±0.099 1.226±0.108 · · ·26 00:38:48.68 +40:31:18.3 18.541±0.030 0.156±0.037 −0.038±0.033 · · ·27 00:39:09.20 +40:28:28.6 16.956±0.007 0.652±0.011 1.387±0.014 · · ·28 00:39:13.65 +41:57:51.6 18.551±0.024 0.555±0.037 1.323±0.049 · · ·29 00:39:23.80 +42:01:37.1 18.892±0.033 0.623±0.052 1.180±0.061 · · ·30 00:39:27.03 +42:06:56.0 19.077±0.039 0.521±0.059 1.187±0.072 · · ·31 00:39:42.04 +40:52:20.6 17.841±0.020 0.359±0.025 0.306±0.023 · · ·32 00:39:44.93 +42:07:04.7 16.924±0.006 0.653±0.009 1.495±0.013 · · ·33 00:39:46.32 +40:53:09.4 18.473±0.035 0.608±0.049 0.619±0.043 · · ·34 00:39:51.16 +40:45:32.8 19.079±0.061 0.501±0.081 0.865±0.079 · · ·35 00:39:58.93 +41:45:40.1 17.846±0.013 0.897±0.024 1.936±0.039 · · ·36 00:40:00.01 +40:22:13.8 17.756±0.018 0.856±0.027 1.027±0.025 · · ·37 00:40:00.35 +40:48:50.8 17.899±0.021 0.663±0.030 1.342±0.033 · · ·38 00:40:03.64 +40:44:04.1 16.834±0.008 0.697±0.012 1.596±0.015 · · ·39 00:40:05.00 +41:47:17.6 18.599±0.025 0.683±0.041 1.207±0.048 · · ·40 00:40:07.53 +41:58:11.4 19.337±0.050 0.546±0.075 1.305±0.098 · · ·41 00:40:10.27 +41:01:23.7 18.601±0.045 0.496±0.054 0.143±0.048 · · ·42 00:40:13.96 +41:41:35.6 19.132±0.066 1.079±0.098 2.134±0.144 · · ·43 00:40:15.32 +40:36:53.7 18.056±0.023 0.384±0.029 0.438±0.027 · · ·44 00:40:18.78 +40:31:14.2 17.611±0.015 0.985±0.025 2.127±0.040 · · ·45 00:40:19.30 +40:32:42.4 14.921±0.002 1.351±0.003 2.986±0.007 · · ·46 00:40:25.04 +40:37:57.7 18.230±0.027 0.775±0.039 1.351±0.043 · · ·47 00:40:28.99 +41:42:17.6 18.594±0.041 0.818±0.054 1.445±0.060 · · ·48 00:40:30.94 +40:39:22.7 17.675±0.016 0.744±0.023 1.127±0.024 · · ·49 00:40:32.34 +42:00:51.9 18.702±0.028 0.662±0.045 1.798±0.077 · · ·50 00:40:35.20 +41:47:32.3 19.019±0.037 0.866±0.067 1.261±0.072 · · ·51 00:40:35.93 +40:39:06.8 18.937±0.053 0.458±0.070 1.176±0.078 · · ·52 00:40:37.95 +40:38:03.7 18.372±0.030 0.786±0.045 1.704±0.060 · · ·53 00:40:42.91 +41:23:39.9 17.812±0.022 0.560±0.027 1.077±0.028 · · ·54 00:40:51.39 +41:42:46.7 18.859±0.051 1.754±0.112 3.538±0.327 · · ·55 00:40:52.60 +41:32:27.5 18.803±0.049 0.492±0.059 0.530±0.056 · · ·56 00:40:54.75 +41:58:46.1 18.184±0.017 1.176±0.038 2.539±0.085 · · ·57 00:40:55.72 +41:28:05.3 17.792±0.020 0.955±0.028 2.024±0.040 · · ·58 00:40:56.49 +41:31:54.2 17.906±0.022 0.693±0.028 1.396±0.032 · · ·59 00:40:57.18 +40:44:31.1 19.761±0.114 0.153±0.135 0.907±0.149 · · ·60 00:40:57.47 +41:00:37.1 18.133±0.026 0.475±0.034 0.838±0.033 · · ·61 00:40:57.92 +41:03:38.4 18.418±0.038 0.289±0.044 −0.013±0.040 · · ·62 00:40:58.44 +41:07:51.3 18.907±0.057 1.073±0.086 2.108±0.125 · · ·63 00:41:01.21 +41:44:29.5 17.768±0.020 0.358±0.023 0.447±0.022 · · ·64 00:41:01.94 +41:08:21.3 18.756±0.050 1.050±0.075 1.832±0.092 · · ·65 00:41:05.05 +41:11:06.1 18.433±0.038 0.805±0.050 1.562±0.060 · · ·66 00:41:05.57 +42:12:55.4 18.115±0.034 0.918±0.076 2.321±0.232 · · ·67 00:41:05.59 +41:07:42.2 17.731±0.020 0.855±0.028 1.278±0.028 · · ·68 00:41:06.38 +41:09:36.8 18.497±0.041 0.300±0.047 0.378±0.045 · · ·69 00:41:07.53 +42:02:47.8 18.514±0.024 0.740±0.040 1.300±0.047 · · ·70 00:41:08.90 +41:09:55.3 16.965±0.010 1.013±0.015 2.094±0.022 · · ·71 00:41:10.87 +40:23:06.0 18.030±0.022 0.764±0.032 1.453±0.038 · · ·72 00:41:12.12 +41:36:10.2 18.257±0.030 0.635±0.038 1.041±0.038 · · ·73 00:41:12.31 +42:14:26.5 17.944±0.029 1.278±0.084 3.236±0.422 · · ·74 00:41:12.67 +41:39:37.6 18.582±0.040 0.573±0.050 0.957±0.050 · · ·75 00:41:14.68 +41:08:44.4 17.217±0.031 0.201±0.037 0.016±0.034 · · ·76 00:41:17.66 +40:52:25.0 19.032±0.081 0.793±0.115 1.798±0.143 · · ·77 00:41:19.15 +40:45:03.3 17.889±0.028 0.848±0.041 1.887±0.053 · · ·78 00:41:25.37 +40:30:52.6 19.018±0.036 1.084±0.069 0.653±0.047 · · ·79 00:41:26.91 +40:47:06.3 19.251±0.100 0.890±0.148 1.410±0.145 · · ·80 00:41:26.97 +40:41:36.0 17.940±0.030 0.498±0.038 0.751±0.036 · · ·81 00:41:37.35 +40:59:18.2 15.199±0.003 0.552±0.004 1.147±0.004 · · ·82 00:41:38.55 +40:52:32.6 16.985±0.013 0.438±0.016 0.743±0.015 · · ·83 00:41:38.65 +40:43:58.3 17.515±0.021 0.732±0.029 0.557±0.023 · · ·84 00:41:40.12 +40:50:05.7 19.874±0.177 0.488±0.224 1.079±0.226 · · ·85 00:41:40.62 +40:58:17.9 17.888±0.028 0.863±0.041 2.067±0.059 · · ·86 00:41:42.63 +40:53:22.5 18.706±0.061 0.609±0.080 1.181±0.080 · · ·87 00:41:48.22 +40:47:31.5 18.396±0.045 0.788±0.064 1.502±0.069 · · ·88 00:41:51.48 +40:47:06.6 16.614±0.009 0.699±0.013 1.236±0.013 · · ·89 00:41:54.70 +40:47:14.6 18.102±0.035 1.373±0.067 1.632±0.056 · · ·90 00:41:56.93 +40:29:41.7 18.807±0.029 1.035±0.055 2.044±0.083 · · ·91 00:41:59.90 +40:46:03.5 16.441±0.008 0.559±0.010 1.023±0.010 · · ·92 00:42:03.77 +40:47:35.9 18.064±0.033 1.064±0.054 1.945±0.064 · · ·93 00:42:06.55 +40:52:01.3 20.020±0.199 0.985±0.310 2.137±0.435 · · ·94 00:42:07.81 +41:01:10.0 17.523±0.020 0.975±0.031 2.183±0.046 · · ·95 00:42:14.58 +40:51:11.5 17.502±0.021 0.435±0.026 0.220±0.022 · · ·96 00:42:16.53 +41:24:46.6 19.916±0.042 1.177±0.086 1.913±0.130 · · ·97 00:42:16.76 +41:24:16.5 19.253±0.024 0.578±0.035 1.074±0.042 · · ·98 00:42:16.83 +40:51:42.7 18.018±0.032 0.750±0.045 1.809±0.057 · · ·99 00:42:19.55 +41:27:02.9 19.272±0.024 0.532±0.035 1.042±0.042 · · ·100 00:42:20.30 +40:51:22.5 17.913±0.030 0.448±0.037 0.536±0.034 · · ·101 00:42:21.51 +41:27:59.2 19.127±0.021 0.596±0.032 1.051±0.037 · · ·102 00:42:22.65 +40:22:22.9 17.947±0.014 0.915±0.024 2.174±0.042 · · ·103 00:42:24.06 +41:37:33.6 17.288±0.005 0.592±0.007 0.979±0.008 · · ·

Globular Clusters in M31. I. 19
TABLE 6 — Continued
R.A.a Decl.b vID (J2000.0) (J2000.0) T1 (M − T1) (C − T1) (km s−1)(1) (2) (3) (4) (5) (6) (7)104 00:42:24.94 +40:36:29.1 21.860±0.481 0.609±0.709 1.239±0.808 · · ·105 00:42:25.06 +41:21:14.1 17.047±0.026 0.664±0.036 1.459±0.045 · · ·106 00:42:28.17 +40:51:36.1 17.252±0.016 0.624±0.022 1.279±0.023 · · ·107 00:42:33.12 +41:10:52.0 17.443±0.038 0.822±0.055 1.647±0.072 · · ·108 00:42:35.14 +40:33:28.0 19.055±0.037 1.028±0.068 1.496±0.072 · · ·109 00:42:35.15 +40:52:22.7 17.543±0.021 0.783±0.030 1.543±0.032 · · ·110 00:42:35.17 +41:30:18.1 19.497±0.030 0.192±0.038 −0.087±0.035 · · ·111 00:42:39.05 +41:16:58.5 16.531±0.016 0.896±0.025 1.525±0.030 · · ·112 00:42:46.36 +41:18:33.0 17.744±0.050 0.826±0.073 1.303±0.078 · · ·113 00:42:55.13 +40:59:44.7 18.221±0.039 0.604±0.052 0.717±0.046 · · ·114 00:42:56.07 +40:59:54.1 17.782±0.026 0.374±0.032 0.631±0.030 · · ·115 00:42:56.47 +40:41:07.3 18.909±0.072 1.379±0.140 2.132±0.156 · · ·116 00:42:56.78 +40:30:11.8 18.847±0.030 0.897±0.052 2.217±0.098 · · ·117 00:42:59.93 +41:14:44.2 16.105±0.011 0.590±0.015 1.257±0.018 · · ·118 00:43:00.00 +41:20:44.0 16.788±0.021 0.787±0.030 1.674±0.041 · · ·119 00:43:05.70 +41:15:58.7 16.610±0.018 0.506±0.023 0.880±0.024 · · ·120 00:43:05.97 +41:23:08.1 18.876±0.017 0.701±0.027 1.564±0.041 · · ·121 00:43:08.88 +41:25:54.6 17.917±0.008 0.868±0.013 1.829±0.022 · · ·122 00:43:09.21 +40:38:11.0 18.822±0.030 0.650±0.045 1.290±0.052 · · ·123 00:43:09.24 +41:34:01.2 19.005±0.019 0.499±0.028 0.668±0.028 · · ·124 00:43:18.30 +42:02:03.3 17.949±0.020 0.727±0.036 1.885±0.076 · · ·125 00:43:18.88 +42:15:11.1 14.978±0.002 0.850±0.004 1.965±0.010 · · ·126 00:43:21.27 +41:19:21.6 18.000±0.030 0.443±0.037 1.012±0.037 · · ·127 00:43:22.55 +41:45:37.8 18.422±0.032 1.134±0.072 2.065±0.134 · · ·128 00:43:22.86 +42:01:42.4 18.311±0.029 0.975±0.058 2.115±0.126 · · ·129 00:43:26.15 +41:18:07.5 18.258±0.039 0.386±0.046 0.610±0.043 · · ·130 00:43:26.32 +41:53:00.3 19.631±0.097 1.013±0.198 2.200±0.452 · · ·131 00:43:26.60 +42:16:19.7 18.487±0.047 1.155±0.123 2.736±0.439 · · ·132 00:43:26.69 +41:40:41.7 19.071±0.101 0.715±0.133 1.122±0.122 · · ·133 00:43:26.86 +40:25:00.7 19.313±0.040 1.086±0.082 1.811±0.109 · · ·134 00:43:27.94 +40:35:59.3 18.485±0.019 0.825±0.033 1.702±0.048 · · ·135 00:43:33.22 +41:34:05.9 17.561±0.025 0.698±0.033 1.427±0.034 · · ·136 00:43:37.89 +41:45:40.2 17.486±0.014 1.217±0.032 2.667±0.092 · · ·137 00:43:39.22 +41:10:19.0 17.934±0.029 0.536±0.036 0.471±0.032 · · ·138 00:43:39.28 +41:10:08.7 15.872±0.005 0.361±0.006 0.514±0.005 · · ·139 00:43:41.37 +41:48:47.5 18.313±0.030 0.759±0.052 1.227±0.066 · · ·140 00:43:42.76 +40:58:57.0 18.859±0.034 1.105±0.066 1.789±0.080 · · ·141 00:43:44.90 +41:45:59.7 19.146±0.063 0.745±0.109 1.722±0.201 · · ·142 00:43:45.07 +41:12:27.0 18.073±0.032 1.124±0.051 1.778±0.051 · · ·143 00:43:51.21 +41:46:49.0 17.639±0.017 0.375±0.024 0.263±0.022 · · ·144 00:43:52.28 +41:42:39.4 17.947±0.035 0.896±0.051 1.775±0.055 · · ·145 00:43:52.78 +41:47:41.7 18.815±0.048 0.540±0.074 0.838±0.083 · · ·146 00:43:52.80 +41:49:49.9 17.951±0.021 0.841±0.038 1.988±0.082 · · ·147 00:43:53.17 +40:19:57.9 18.432±0.018 0.629±0.029 1.172±0.033 · · ·148 00:43:55.11 +41:29:08.3 17.431±0.021 1.311±0.038 3.034±0.077 · · ·149 00:43:56.51 +41:44:51.2 19.344±0.078 0.230±0.104 0.856±0.136 · · ·150 00:43:57.21 +41:45:33.3 17.879±0.034 0.646±0.044 1.069±0.041 · · ·151 00:43:57.83 +41:35:19.9 17.479±0.023 0.739±0.031 1.698±0.035 · · ·152 00:43:59.32 +40:48:03.0 18.442±0.023 0.587±0.034 0.909±0.034 · · ·153 00:44:00.06 +41:48:33.5 17.270±0.012 0.745±0.020 1.848±0.040 · · ·154 00:44:00.11 +41:51:32.9 18.474±0.034 1.173±0.078 1.885±0.123 · · ·155 00:44:01.82 +41:15:01.1 17.709±0.023 0.487±0.029 0.744±0.027 · · ·156 00:44:03.96 +41:37:40.4 19.228±0.119 0.165±0.134 0.449±0.127 · · ·157 00:44:07.97 +41:47:01.9 17.425±0.014 0.388±0.020 0.542±0.021 · · ·158 00:44:09.57 +41:33:58.9 18.126±0.043 0.435±0.052 0.539±0.047 · · ·159 00:44:10.55 +41:17:59.1 17.186±0.015 0.316±0.018 0.547±0.016 · · ·160 00:44:10.88 +41:32:03.6 16.546±0.010 0.277±0.012 −0.062±0.011 · · ·161 00:44:12.19 +41:36:37.6 18.215±0.045 0.841±0.064 1.490±0.062 · · ·162 00:44:12.31 +41:35:16.8 17.222±0.019 0.351±0.022 0.586±0.021 · · ·163 00:44:12.54 +41:17:19.9 17.835±0.026 0.391±0.032 0.251±0.028 · · ·164 00:44:19.59 +41:51:33.3 18.163±0.026 0.668±0.043 1.292±0.060 · · ·165 00:44:20.00 +40:57:58.1 18.413±0.023 0.630±0.034 1.264±0.039 · · ·166 00:44:25.08 +41:20:49.5 15.391±0.003 0.368±0.004 0.441±0.004 · · ·167 00:44:25.12 +40:56:14.4 18.812±0.032 1.169±0.065 2.142±0.098 · · ·168 00:44:26.27 +40:15:04.7 17.247±0.009 0.677±0.017 1.412±0.027 · · ·169 00:44:26.61 +40:42:45.4 18.392±0.022 1.225±0.046 2.645±0.098 · · ·170 00:44:27.23 +41:37:15.9 18.077±0.040 0.618±0.052 1.162±0.050 · · ·171 00:44:28.46 +40:42:23.8 17.498±0.010 1.040±0.019 2.511±0.040 · · ·172 00:44:28.95 +41:20:10.3 17.556±0.021 0.312±0.024 0.441±0.023 · · ·173 00:44:30.88 +41:18:22.0 17.544±0.020 0.834±0.028 1.952±0.035 · · ·174 00:44:34.16 +41:47:44.9 19.168±0.064 1.014±0.130 2.176±0.290 −97.0±51.9175 00:44:35.20 +40:43:52.9 18.324±0.021 0.996±0.038 2.297±0.071 · · ·176 00:44:36.71 +41:52:47.6 18.282±0.029 0.596±0.046 1.556±0.081 · · ·177 00:44:38.88 +41:55:10.6 18.059±0.023 1.179±0.052 2.789±0.171 · · ·178 00:44:42.83 +41:25:05.7 17.982±0.035 1.242±0.060 3.105±0.135 · · ·179 00:44:42.89 +41:33:26.2 17.258±0.019 0.701±0.025 1.312±0.025 · · ·180 00:44:47.36 +41:25:53.8 18.138±0.043 1.038±0.066 0.953±0.050 · · ·181 00:44:48.64 +42:06:08.1 18.486±0.034 1.206±0.079 2.523±0.204 · · ·182 00:44:48.85 +41:47:58.2 18.172±0.026 0.598±0.042 1.268±0.060 · · ·183 00:44:54.31 +41:32:14.2 17.945±0.036 0.704±0.047 1.370±0.047 · · ·184 00:44:54.69 +41:52:31.6 18.772±0.046 0.756±0.079 0.926±0.084 · · ·185 00:44:56.48 +41:52:54.5 18.150±0.025 0.874±0.047 1.848±0.089 · · ·186 00:44:56.90 +41:16:11.5 17.830±0.026 0.708±0.034 1.579±0.038 · · ·187 00:44:58.08 +41:09:42.3 16.080±0.006 0.599±0.007 1.341±0.008 · · ·188 00:44:59.25 +41:53:18.5 18.892±0.051 0.780±0.089 1.156±0.108 · · ·189 00:44:59.29 +40:58:22.0 19.349±0.053 0.628±0.079 1.428±0.099 · · ·190 00:45:01.60 +40:24:11.1 17.312±0.007 1.077±0.014 2.397±0.028 · · ·191 00:45:02.45 +41:59:33.3 18.578±0.038 0.675±0.063 1.456±0.099 · · ·192 00:45:03.80 +40:29:59.3 17.948±0.012 0.677±0.019 1.266±0.023 · · ·193 00:45:04.12 +40:43:07.3 18.058±0.016 0.806±0.027 2.294±0.055 · · ·194 00:45:04.74 +40:30:31.9 18.462±0.019 0.506±0.028 1.011±0.031 · · ·195 00:45:05.78 +41:59:03.6 18.181±0.026 0.817±0.047 1.613±0.077 · · ·196 00:45:05.86 +40:41:07.5 18.820±0.033 0.618±0.049 1.317±0.058 · · ·197 00:45:07.53 +41:00:12.7 18.788±0.032 0.723±0.050 1.039±0.049 · · ·198 00:45:10.50 +41:50:19.6 17.864±0.020 0.604±0.032 0.970±0.038 · · ·199 00:45:24.67 +41:42:56.6 18.862±0.040 0.506±0.053 0.757±0.050 · · ·200 00:45:26.73 +41:39:48.2 22.273±0.976 −1.213±0.993 −1.594±0.981 · · ·201 00:45:26.75 +41:38:41.2 19.057±0.048 0.361±0.060 0.666±0.058 · · ·202 00:45:28.38 +41:30:51.9 18.611±0.031 1.097±0.054 2.210±0.082 · · ·203 00:45:30.09 +41:43:49.0 18.913±0.042 0.285±0.052 0.355±0.048 · · ·204 00:45:30.57 +40:47:58.2 18.667±0.024 0.939±0.046 2.401±0.104 · · ·205 00:45:33.25 +40:17:08.4 18.754±0.023 0.706±0.039 1.528±0.053 · · ·206 00:45:36.90 +41:44:18.3 16.065±0.003 0.819±0.005 1.963±0.008 · · ·207 00:45:39.14 +41:49:55.0 18.241±0.027 0.847±0.049 1.497±0.066 · · ·
20 Kim et al.
TABLE 6 — Continued
R.A.a Decl.b vID (J2000.0) (J2000.0) T1 (M − T1) (C − T1) (km s−1)(1) (2) (3) (4) (5) (6) (7)208 00:45:41.07 +41:55:08.2 18.090±0.024 0.351±0.034 0.326±0.032 · · ·209 00:45:41.70 +41:51:42.6 17.951±0.021 0.697±0.035 0.960±0.037 · · ·210 00:45:47.05 +40:45:18.1 17.597±0.009 0.974±0.018 2.405±0.040 · · ·211 00:45:47.20 +41:39:32.4 19.244±0.056 0.916±0.089 1.273±0.084 · · ·212 00:45:52.10 +41:31:49.9 18.728±0.034 0.906±0.054 1.958±0.077 · · ·213 00:45:53.84 +41:41:11.3 18.572±0.030 0.683±0.043 1.531±0.052 · · ·214 00:45:54.06 +39:56:46.8 18.086±0.019 1.133±0.049 2.431±0.135 · · ·215 00:45:59.57 +41:51:15.0 18.883±0.049 0.794±0.084 1.516±0.120 · · ·216 00:46:02.65 +41:44:52.8 19.057±0.049 −0.051±0.056 −0.533±0.051 · · ·217 00:46:09.34 +41:29:04.3 18.874±0.040 0.669±0.056 1.393±0.064 · · ·218 00:46:10.03 +40:55:13.3 17.843±0.012 0.959±0.022 2.276±0.045 · · ·219 00:46:11.34 +41:38:49.5 19.013±0.045 0.784±0.067 1.482±0.075 · · ·220 00:46:17.78 +41:44:43.5 19.185±0.063 0.910±0.117 2.236±0.269 · · ·221 00:46:19.24 +40:23:42.0 19.792±0.059 0.732±0.100 1.721±0.156 · · ·222 00:46:26.60 +41:38:38.3 19.049±0.047 0.798±0.070 1.502±0.079 · · ·223 00:46:32.88 +40:06:36.5 16.998±0.007 0.833±0.015 1.948±0.034 · · ·224 00:46:38.75 +41:59:31.1 17.482±0.014 0.776±0.023 1.685±0.038 · · ·225 00:46:42.61 +41:58:35.4 18.466±0.034 0.553±0.052 0.634±0.050 · · ·226 00:46:47.82 +42:01:56.3 19.566±0.092 0.942±0.173 1.366±0.203 · · ·227 00:46:54.48 +42:00:47.4 18.305±0.030 0.589±0.046 0.585±0.042 · · ·228 00:46:55.50 +42:20:50.1 17.471±0.020 0.549±0.034 0.470±0.033 · · ·229 00:47:00.31 +40:45:27.8 17.421±0.008 0.719±0.014 1.556±0.019 · · ·230 00:47:02.15 +41:10:55.4 18.549±0.021 0.895±0.039 2.071±0.066 · · ·231 00:47:14.11 +40:22:23.2 18.645±0.021 0.507±0.032 0.827±0.033 · · ·232 00:47:14.43 +40:25:38.8 17.995±0.012 0.930±0.023 2.175±0.043 · · ·233 00:47:15.19 +41:01:12.1 18.311±0.017 0.706±0.028 1.579±0.038 · · ·234 00:47:35.21 +41:01:31.3 18.301±0.019 0.518±0.027 1.225±0.033 · · ·235 00:47:54.06 +41:33:23.9 17.084±0.007 0.612±0.012 1.217±0.016 · · ·236 00:47:57.88 +41:34:32.3 17.671±0.012 0.634±0.021 1.149±0.025 · · ·237 00:47:58.40 +41:31:25.5 18.473±0.023 0.685±0.043 1.286±0.058 · · ·238 00:48:01.66 +41:49:56.9 18.184±0.019 0.542±0.032 0.979±0.040 · · ·239 00:48:09.68 +41:48:36.7 17.535±0.011 0.584±0.018 1.128±0.024 · · ·240 00:48:24.14 +40:06:43.1 18.844±0.039 0.922±0.057 1.693±0.155 · · ·241 00:48:24.77 +41:52:54.0 18.544±0.027 0.646±0.048 0.316±0.039 · · ·242 00:48:26.60 +41:19:47.3 19.217±0.042 1.081±0.081 2.110±0.133 · · ·243 00:48:27.19 +42:02:43.5 16.623±0.005 1.011±0.010 2.510±0.030 · · ·244 00:48:27.39 +41:06:17.2 19.078±0.036 1.036±0.069 2.954±0.226 · · ·245 00:48:30.38 +41:52:49.6 14.455±0.001 1.000±0.002 2.399±0.004 · · ·246 00:48:30.63 +41:55:29.0 17.941±0.015 1.083±0.035 2.129±0.073 · · ·247 00:48:32.16 +41:47:27.7 17.860±0.014 0.574±0.024 1.219±0.035 · · ·248 00:48:32.71 +41:35:36.8 16.517±0.004 0.864±0.009 2.079±0.018 · · ·249 00:48:32.96 +42:02:45.0 17.854±0.014 0.928±0.029 2.543±0.094 · · ·250 00:48:36.64 +41:39:08.3 16.735±0.005 0.527±0.009 1.048±0.011 · · ·251 00:48:40.67 +41:51:54.7 17.977±0.016 0.494±0.026 1.063±0.035 · · ·252 00:48:41.13 +41:31:54.6 18.053±0.016 0.731±0.030 1.562±0.047 · · ·253 00:48:42.18 +41:34:08.7 16.029±0.003 0.580±0.005 1.139±0.006 · · ·254 00:48:50.01 +41:57:07.2 16.966±0.006 0.862±0.013 2.028±0.028 · · ·255 00:49:02.95 +41:54:57.1 17.258±0.008 0.812±0.016 1.639±0.027 · · ·256 00:49:05.38 +41:57:38.3 18.135±0.017 1.096±0.042 2.650±0.132 · · ·257 00:49:15.21 +41:01:29.4 18.331±0.019 0.544±0.028 1.201±0.033 · · ·258 00:50:17.46 +42:06:42.6 18.584±0.026 0.910±0.045 1.949±0.074 · · ·
NOTE. — Table 6 is published in its entirety in the electronic edition of theAstronomical Journal. A portion is shown here for guidance regarding its form and content.a Right ascension in units of hours, minutes, and seconds.b Declination in units of degrees, arcminutes, and arcseconds.
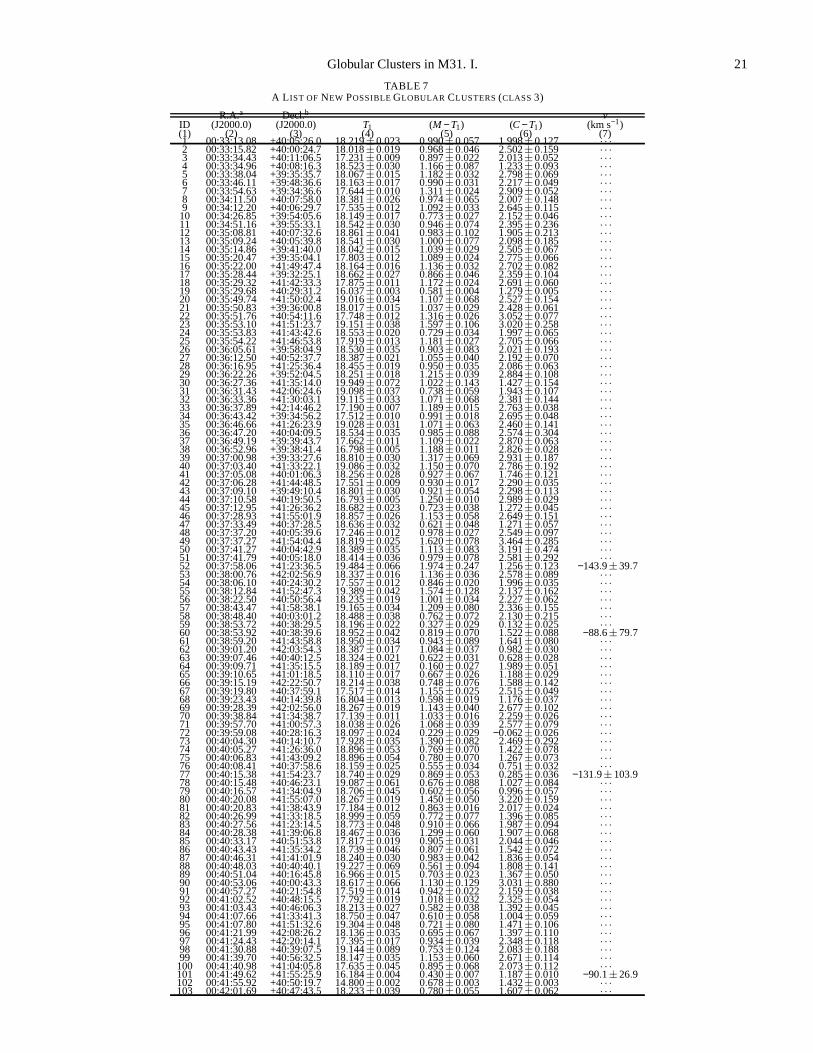
Globular Clusters in M31. I. 21
TABLE 7A L IST OF NEW POSSIBLEGLOBULAR CLUSTERS(CLASS 3)
R.A.a Decl.b vID (J2000.0) (J2000.0) T1 (M − T1) (C − T1) (km s−1)(1) (2) (3) (4) (5) (6) (7)1 00:33:13.08 +40:05:26.0 18.219±0.023 0.990±0.057 1.998±0.127 · · ·2 00:33:15.82 +40:00:24.7 18.018±0.019 0.968±0.046 2.502±0.159 · · ·3 00:33:34.43 +40:11:06.5 17.231±0.009 0.897±0.022 2.013±0.052 · · ·4 00:33:34.96 +40:08:16.3 18.523±0.030 1.166±0.087 1.233±0.093 · · ·5 00:33:38.04 +39:35:35.7 18.067±0.015 1.182±0.032 2.798±0.069 · · ·6 00:33:46.11 +39:48:36.6 18.163±0.017 0.990±0.031 2.217±0.049 · · ·7 00:33:54.63 +39:34:36.6 17.644±0.010 1.311±0.024 2.909±0.052 · · ·8 00:34:11.50 +40:07:58.0 18.381±0.026 0.974±0.065 2.007±0.148 · · ·9 00:34:12.20 +40:06:29.7 17.535±0.012 1.092±0.033 2.645±0.115 · · ·10 00:34:26.85 +39:54:05.6 18.149±0.017 0.773±0.027 2.152±0.046 · · ·11 00:34:51.16 +39:55:33.1 18.542±0.030 0.946±0.074 2.395±0.236 · · ·12 00:35:08.81 +40:07:32.6 18.861±0.041 0.983±0.102 1.905±0.213 · · ·13 00:35:09.24 +40:05:39.8 18.541±0.030 1.000±0.077 2.098±0.185 · · ·14 00:35:14.86 +39:41:40.0 18.042±0.015 1.039±0.029 2.505±0.067 · · ·15 00:35:20.47 +39:35:04.1 17.803±0.012 1.089±0.024 2.775±0.066 · · ·16 00:35:22.00 +41:49:47.4 18.164±0.016 1.136±0.032 2.702±0.082 · · ·17 00:35:28.44 +39:32:25.1 18.662±0.027 0.866±0.046 2.359±0.104 · · ·18 00:35:29.32 +41:42:33.3 17.875±0.011 1.172±0.024 2.691±0.060 · · ·19 00:35:29.68 +40:29:31.2 16.037±0.003 0.581±0.004 1.279±0.005 · · ·20 00:35:49.74 +41:50:02.4 19.016±0.034 1.107±0.068 2.527±0.154 · · ·21 00:35:50.83 +39:36:00.8 18.017±0.015 1.037±0.029 2.428±0.061 · · ·22 00:35:51.76 +40:54:11.6 17.748±0.012 1.316±0.026 3.052±0.077 · · ·23 00:35:53.10 +41:51:23.7 19.151±0.038 1.597±0.106 3.020±0.258 · · ·24 00:35:53.83 +41:43:42.6 18.553±0.020 0.729±0.034 1.997±0.065 · · ·25 00:35:54.22 +41:46:53.8 17.919±0.013 1.181±0.027 2.705±0.066 · · ·26 00:36:05.61 +39:58:04.9 18.530±0.035 0.903±0.083 2.021±0.193 · · ·27 00:36:12.50 +40:52:37.7 18.387±0.021 1.055±0.040 2.192±0.070 · · ·28 00:36:16.95 +41:25:36.4 18.455±0.019 0.950±0.035 2.086±0.063 · · ·29 00:36:22.26 +39:52:04.5 18.251±0.018 1.215±0.039 2.884±0.108 · · ·30 00:36:27.36 +41:35:14.0 19.949±0.072 1.022±0.143 1.427±0.154 · · ·31 00:36:31.43 +42:06:24.6 19.098±0.037 0.738±0.059 1.943±0.107 · · ·32 00:36:33.36 +41:30:03.1 19.115±0.033 1.071±0.068 2.381±0.144 · · ·33 00:36:37.89 +42:14:46.2 17.190±0.007 1.189±0.015 2.763±0.038 · · ·34 00:36:43.42 +39:34:56.2 17.512±0.010 0.991±0.018 2.695±0.048 · · ·35 00:36:46.66 +41:26:23.9 19.028±0.031 1.071±0.063 2.460±0.141 · · ·36 00:36:47.20 +40:04:09.5 18.534±0.035 0.985±0.088 2.574±0.304 · · ·37 00:36:49.19 +39:39:43.7 17.662±0.011 1.109±0.022 2.870±0.063 · · ·38 00:36:52.96 +39:38:41.4 16.798±0.005 1.188±0.011 2.826±0.028 · · ·39 00:37:00.98 +39:33:27.6 18.810±0.030 1.317±0.069 2.931±0.187 · · ·40 00:37:03.40 +41:33:22.1 19.086±0.032 1.150±0.070 2.786±0.192 · · ·41 00:37:05.08 +40:01:06.3 18.256±0.028 0.927±0.067 1.746±0.121 · · ·42 00:37:06.28 +41:44:48.5 17.551±0.009 0.930±0.017 2.290±0.035 · · ·43 00:37:09.10 +39:49:10.4 18.801±0.030 0.921±0.054 2.298±0.113 · · ·44 00:37:10.58 +40:19:50.5 16.793±0.005 1.250±0.010 2.989±0.029 · · ·45 00:37:12.95 +41:26:36.2 18.682±0.023 0.723±0.038 1.272±0.045 · · ·46 00:37:28.93 +41:55:01.9 18.857±0.026 1.153±0.058 2.649±0.151 · · ·47 00:37:33.49 +40:37:28.5 18.636±0.032 0.621±0.048 1.271±0.057 · · ·48 00:37:37.20 +40:05:39.6 17.246±0.012 0.978±0.027 2.549±0.097 · · ·49 00:37:37.27 +41:54:04.4 18.819±0.025 1.620±0.078 3.464±0.285 · · ·50 00:37:41.27 +40:04:42.9 18.389±0.035 1.113±0.083 3.191±0.474 · · ·51 00:37:41.79 +40:05:18.0 18.414±0.036 0.979±0.078 2.581±0.292 · · ·52 00:37:58.06 +41:23:36.5 19.484±0.066 1.974±0.247 1.256±0.123 −143.9±39.753 00:38:00.76 +42:02:56.9 18.337±0.016 1.136±0.036 2.578±0.089 · · ·54 00:38:06.10 +40:24:30.2 17.557±0.012 0.846±0.020 1.996±0.035 · · ·55 00:38:12.84 +41:52:47.3 19.389±0.042 1.574±0.128 2.137±0.162 · · ·56 00:38:22.50 +40:50:56.4 18.235±0.019 1.001±0.034 2.227±0.062 · · ·57 00:38:43.47 +41:58:38.1 19.165±0.034 1.209±0.080 2.336±0.155 · · ·58 00:38:48.40 +40:03:01.2 18.488±0.038 0.762±0.072 2.130±0.215 · · ·59 00:38:53.72 +40:38:29.5 18.196±0.022 0.327±0.029 0.132±0.025 · · ·60 00:38:53.92 +40:38:39.6 18.952±0.042 0.819±0.070 1.522±0.088 −88.6±79.761 00:38:59.20 +41:43:58.8 18.950±0.034 0.943±0.089 1.641±0.080 · · ·62 00:39:01.20 +42:03:54.3 18.387±0.017 1.084±0.037 0.982±0.030 · · ·63 00:39:07.46 +40:40:12.5 18.324±0.021 0.622±0.031 0.628±0.028 · · ·64 00:39:09.71 +41:35:15.5 18.189±0.017 0.160±0.027 1.989±0.051 · · ·65 00:39:10.65 +41:01:18.5 18.110±0.017 0.667±0.026 1.188±0.029 · · ·66 00:39:15.19 +42:22:50.7 18.214±0.038 0.748±0.076 1.588±0.142 · · ·67 00:39:19.80 +40:37:59.1 17.517±0.014 1.155±0.025 2.515±0.049 · · ·68 00:39:23.43 +40:14:39.8 16.804±0.013 0.598±0.019 1.176±0.037 · · ·69 00:39:28.39 +42:02:56.0 18.267±0.019 1.143±0.040 2.677±0.102 · · ·70 00:39:38.84 +41:34:38.7 17.139±0.011 1.033±0.016 2.259±0.026 · · ·71 00:39:57.70 +41:00:57.3 18.038±0.026 1.068±0.039 2.577±0.079 · · ·72 00:39:59.08 +40:28:16.3 18.097±0.024 0.229±0.029 −0.062±0.026 · · ·73 00:40:04.30 +40:14:10.7 17.928±0.035 1.390±0.082 2.469±0.292 · · ·74 00:40:05.27 +41:26:36.0 18.896±0.053 0.769±0.070 1.422±0.078 · · ·75 00:40:06.83 +41:43:09.2 18.896±0.054 0.780±0.070 1.267±0.073 · · ·76 00:40:08.41 +40:37:58.6 18.159±0.025 0.555±0.034 0.751±0.032 · · ·77 00:40:15.38 +41:54:23.7 18.740±0.029 0.869±0.053 0.285±0.036 −131.9±103.978 00:40:15.48 +40:46:23.1 19.087±0.061 0.676±0.088 1.027±0.084 · · ·79 00:40:16.57 +41:34:04.9 18.706±0.045 0.602±0.056 0.996±0.057 · · ·80 00:40:20.08 +41:55:07.0 18.267±0.019 1.450±0.050 3.220±0.159 · · ·81 00:40:20.83 +41:38:43.9 17.184±0.012 0.863±0.016 2.017±0.024 · · ·82 00:40:26.99 +41:33:18.5 18.999±0.059 0.772±0.077 1.396±0.085 · · ·83 00:40:27.56 +41:23:14.5 18.773±0.048 0.910±0.066 1.987±0.094 · · ·84 00:40:28.38 +41:39:06.8 18.467±0.036 1.299±0.060 1.907±0.068 · · ·85 00:40:33.17 +40:51:53.8 17.817±0.019 0.905±0.031 2.044±0.046 · · ·86 00:40:43.43 +41:35:34.2 18.739±0.046 0.807±0.061 1.542±0.072 · · ·87 00:40:46.31 +41:41:01.9 18.240±0.030 0.983±0.042 1.836±0.054 · · ·88 00:40:48.03 +40:40:40.1 19.227±0.069 0.561±0.094 1.808±0.141 · · ·89 00:40:51.04 +40:16:45.8 16.966±0.015 0.703±0.023 1.367±0.050 · · ·90 00:40:53.06 +40:00:43.3 18.617±0.066 1.130±0.129 3.031±0.880 · · ·91 00:40:57.27 +40:21:54.8 17.519±0.014 0.942±0.022 2.159±0.038 · · ·92 00:41:02.52 +40:48:15.5 17.792±0.019 1.018±0.032 2.325±0.054 · · ·93 00:41:03.43 +40:46:06.3 18.213±0.027 0.582±0.038 1.392±0.045 · · ·94 00:41:07.66 +41:33:41.3 18.750±0.047 0.610±0.058 1.004±0.059 · · ·95 00:41:07.80 +41:51:32.6 19.304±0.048 0.721±0.080 1.471±0.106 · · ·96 00:41:21.99 +42:08:26.2 18.136±0.035 0.695±0.067 1.397±0.110 · · ·97 00:41:24.43 +42:20:14.1 17.395±0.017 0.934±0.039 2.348±0.118 · · ·98 00:41:30.88 +40:39:07.5 19.144±0.089 0.753±0.124 2.083±0.188 · · ·99 00:41:39.70 +40:56:32.5 18.147±0.035 1.153±0.060 2.671±0.114 · · ·100 00:41:40.98 +41:04:05.8 17.635±0.045 0.895±0.068 2.073±0.112 · · ·101 00:41:49.62 +41:55:25.9 16.184±0.004 0.430±0.007 1.187±0.010 −90.1±26.9102 00:41:55.92 +40:50:19.7 14.800±0.002 0.678±0.003 1.432±0.003 · · ·103 00:42:01.69 +40:47:43.5 18.233±0.039 0.780±0.055 1.607±0.062 · · ·

22 Kim et al.
TABLE 7 — Continued
R.A.a Decl.b vID (J2000.0) (J2000.0) T1 (M − T1) (C − T1) (km s−1)(1) (2) (3) (4) (5) (6) (7)104 00:42:03.04 +40:03:48.8 18.399±0.055 0.749±0.085 1.813±0.184 · · ·105 00:42:07.12 +41:55:48.3 18.367±0.031 0.872±0.059 1.960±0.124 1.3±24.9106 00:42:08.45 +40:58:03.9 17.740±0.025 0.632±0.034 0.562±0.029 · · ·107 00:42:14.18 +41:34:26.3 19.206±0.023 0.672±0.035 1.515±0.053 · · ·108 00:42:23.35 +40:38:35.5 18.819±0.030 1.450±0.073 1.947±0.079 · · ·109 00:42:30.05 +41:23:26.1 17.449±0.038 0.736±0.054 1.287±0.060 · · ·110 00:42:33.09 +40:04:53.6 18.399±0.055 1.289±0.118 2.319±0.274 · · ·111 00:42:41.72 +40:16:45.0 18.769±0.028 0.784±0.046 1.342±0.051 · · ·112 00:42:44.53 +40:54:28.4 16.688±0.009 1.214±0.017 2.629±0.029 · · ·113 00:42:45.16 +41:17:51.5 17.216±0.031 0.907±0.047 1.664±0.059 · · ·114 00:42:48.13 +40:18:24.1 18.371±0.020 0.746±0.031 1.882±0.050 · · ·115 00:42:49.80 +41:22:36.9 15.499±0.007 0.535±0.009 1.145±0.011 · · ·116 00:42:51.20 +41:23:16.4 17.207±0.030 0.542±0.040 1.480±0.053 · · ·117 00:43:01.16 +40:44:58.6 18.998±0.078 1.094±0.127 2.424±0.207 · · ·118 00:43:05.24 +41:14:28.9 17.635±0.044 1.015±0.072 2.260±0.128 · · ·119 00:43:08.93 +41:07:32.2 16.717±0.019 1.524±0.042 3.132±0.108 · · ·120 00:43:10.21 +41:17:21.1 17.407±0.036 0.995±0.058 2.394±0.115 · · ·121 00:43:15.09 +41:47:25.4 18.775±0.045 1.093±0.097 1.869±0.160 −65.4±48.8122 00:43:15.94 +41:30:33.0 17.910±0.033 1.402±0.062 3.069±0.123 · · ·123 00:43:21.38 +40:23:55.3 17.266±0.007 0.991±0.013 2.486±0.029 · · ·124 00:43:23.90 +41:35:15.9 18.660±0.068 0.947±0.100 1.612±0.098 · · ·125 00:43:27.11 +41:07:54.1 17.796±0.025 0.861±0.036 1.138±0.031 · · ·126 00:43:30.00 +40:17:06.2 18.850±0.026 0.541±0.040 0.991±0.043 · · ·127 00:43:34.36 +41:40:46.2 17.716±0.028 1.182±0.046 2.515±0.069 · · ·128 00:43:41.87 +40:24:01.3 19.042±0.031 0.849±0.056 1.238±0.058 · · ·129 00:43:42.74 +41:46:29.5 17.961±0.021 0.758±0.037 1.884±0.076 · · ·130 00:43:44.36 +41:47:05.0 18.355±0.032 0.166±0.042 0.041±0.040 · · ·131 00:43:45.22 +41:27:56.3 · · · · · · · · · · · ·132 00:43:47.17 +41:27:44.9 17.431±0.021 1.991±0.061 3.355±0.099 · · ·133 00:43:51.72 +40:37:43.2 18.736±0.024 1.062±0.048 2.231±0.088 · · ·134 00:43:52.32 +41:36:22.8 18.686±0.069 1.110±0.109 2.172±0.134 · · ·135 00:44:01.14 +41:04:05.6 17.824±0.025 1.353±0.045 3.087±0.096 · · ·136 00:44:04.43 +40:05:19.6 18.417±0.025 0.704±0.049 1.540±0.086 · · ·137 00:44:05.67 +41:15:51.7 18.045±0.031 1.406±0.057 2.958±0.107 · · ·138 00:44:11.96 +42:11:06.7 17.678±0.022 1.110±0.056 2.898±0.238 · · ·139 00:44:15.54 +41:53:32.0 18.449±0.033 0.879±0.062 1.898±0.121 · · ·140 00:44:16.61 +40:36:26.3 19.223±0.037 1.038±0.073 2.078±0.122 · · ·141 00:44:17.35 +41:49:16.7 17.617±0.016 0.765±0.027 1.635±0.047 · · ·142 00:44:24.52 +41:51:45.5 17.811±0.018 1.474±0.051 3.021±0.164 · · ·143 00:44:27.00 +41:38:34.4 17.963±0.035 1.380±0.065 2.706±0.098 · · ·144 00:44:29.69 +41:55:36.3 18.330±0.031 0.549±0.047 1.115±0.063 · · ·145 00:44:30.20 +41:54:48.8 19.113±0.062 0.962±0.121 1.590±0.177 · · ·146 00:44:31.36 +41:36:49.2 16.326±0.008 0.982±0.012 2.180±0.016 · · ·147 00:44:32.30 +40:16:39.9 17.990±0.012 1.269±0.028 2.655±0.063 · · ·148 00:44:32.48 +40:38:56.3 17.291±0.007 1.082±0.014 2.603±0.032 · · ·149 00:44:34.37 +41:51:18.3 20.502±0.223 1.033±0.463 1.017±0.433 −212.3±62.5150 00:44:36.54 +41:46:46.6 17.863±0.020 0.726±0.034 1.501±0.053 · · ·151 00:44:37.49 +42:08:49.5 18.140±0.034 1.409±0.108 3.284±0.501 · · ·152 00:44:37.88 +41:51:53.4 17.990±0.022 1.142±0.050 1.219±0.049 · · ·153 00:44:38.46 +41:25:11.4 16.057±0.007 0.918±0.010 1.021±0.008 · · ·154 00:44:40.69 +41:56:46.3 18.370±0.032 0.493±0.047 1.261±0.071 · · ·155 00:44:43.52 +41:47:20.1 18.128±0.024 1.375±0.064 2.960±0.209 · · ·156 00:44:45.88 +40:35:19.6 19.162±0.035 1.316±0.084 2.407±0.149 · · ·157 00:44:46.28 +40:33:06.8 19.644±0.054 0.727±0.090 1.426±0.113 · · ·158 00:44:49.97 +40:23:15.4 18.249±0.015 1.280±0.036 2.601±0.076 · · ·159 00:44:53.41 +41:31:56.4 19.577±0.154 0.886±0.219 2.600±0.401 −63.5±47.9160 00:44:54.43 +40:06:44.1 18.307±0.022 1.026±0.054 2.486±0.163 · · ·161 00:44:56.64 +41:54:58.7 18.274±0.028 0.958±0.055 2.169±0.127 · · ·162 00:45:06.74 +40:44:07.4 18.227±0.019 0.939±0.033 2.501±0.076 · · ·163 00:45:06.97 +42:17:47.2 18.452±0.046 0.604±0.083 1.837±0.205 · · ·164 00:45:07.13 +41:23:46.8 18.661±0.068 0.943±0.099 1.934±0.115 · · ·165 00:45:11.00 +40:35:14.7 18.801±0.025 1.045±0.050 2.196±0.091 · · ·166 00:45:13.83 +41:42:34.8 19.119±0.105 0.851±0.147 1.344±0.136 · · ·167 00:45:13.89 +41:42:26.9 18.177±0.045 0.418±0.054 0.560±0.049 · · ·168 00:45:14.87 +41:40:12.5 18.836±0.039 0.403±0.050 0.907±0.051 · · ·169 00:45:15.27 +41:47:40.2 17.693±0.017 0.671±0.027 1.149±0.032 · · ·170 00:45:16.19 +41:43:22.8 20.173±0.286 −0.009±0.315 −0.043±0.295 · · ·171 00:45:16.62 +41:41:02.1 19.104±0.093 1.320±0.168 1.443±0.126 · · ·172 00:45:19.38 +41:22:51.8 18.472±0.027 1.167±0.049 2.721±0.105 · · ·173 00:45:19.55 +41:36:10.9 18.421±0.026 1.054±0.045 1.815±0.053 · · ·174 00:45:21.09 +41:30:01.7 19.152±0.051 0.877±0.079 1.570±0.090 · · ·175 00:45:21.12 +41:40:56.1 18.938±0.043 0.486±0.056 0.649±0.052 · · ·176 00:45:22.62 +42:19:18.3 16.236±0.006 1.426±0.020 3.229±0.084 · · ·177 00:45:22.92 +41:30:17.5 18.519±0.028 0.811±0.043 2.102±0.070 · · ·178 00:45:24.48 +41:27:41.4 18.135±0.019 1.309±0.039 3.125±0.106 · · ·179 00:45:25.33 +40:19:00.3 18.853±0.025 0.700±0.042 1.328±0.051 · · ·180 00:45:26.88 +41:15:45.0 19.111±0.035 0.928±0.066 1.834±0.093 · · ·181 00:45:27.18 +41:41:59.1 19.025±0.045 0.695±0.065 1.446±0.075 · · ·182 00:45:27.26 +41:32:54.0 18.427±0.026 1.217±0.049 2.524±0.087 · · ·183 00:45:27.50 +41:23:23.8 17.197±0.009 0.953±0.014 2.356±0.026 · · ·184 00:45:30.32 +41:37:13.7 17.962±0.018 0.704±0.025 1.372±0.028 · · ·185 00:45:31.70 +41:28:31.7 18.744±0.034 1.074±0.060 2.366±0.103 · · ·186 00:45:33.96 +41:28:06.6 19.163±0.050 1.428±0.109 2.900±0.227 · · ·187 00:45:37.70 +41:54:04.0 18.508±0.035 0.722±0.058 1.184±0.069 · · ·188 00:45:38.72 +41:53:41.0 19.047±0.057 0.717±0.094 1.397±0.129 · · ·189 00:45:40.35 +41:42:15.8 18.662±0.033 0.488±0.044 1.038±0.045 · · ·190 00:45:43.93 +41:54:26.6 17.427±0.013 1.218±0.029 2.343±0.059 · · ·191 00:45:44.13 +41:42:53.7 17.604±0.013 0.370±0.017 0.335±0.015 · · ·192 00:45:47.73 +41:52:17.0 19.374±0.078 0.434±0.112 0.679±0.117 · · ·193 00:45:49.97 +40:05:09.1 16.678±0.005 0.888±0.012 2.306±0.034 · · ·194 00:45:50.08 +41:43:49.9 18.313±0.023 1.223±0.043 3.432±0.159 · · ·195 00:45:51.33 +40:25:45.1 17.890±0.011 1.208±0.024 2.682±0.058 · · ·196 00:45:51.58 +40:04:43.8 18.188±0.020 1.042±0.051 2.094±0.113 · · ·197 00:45:57.63 +40:17:09.5 17.843±0.015 0.723±0.030 1.590±0.056 · · ·198 00:46:02.82 +40:23:04.0 18.902±0.026 1.055±0.054 2.712±0.149 · · ·199 00:46:03.73 +41:36:29.2 18.885±0.040 0.642±0.056 1.392±0.064 · · ·200 00:46:06.09 +40:22:26.0 17.497±0.008 1.061±0.016 2.469±0.035 · · ·201 00:46:17.08 +41:36:35.7 18.442±0.026 1.141±0.047 2.757±0.105 · · ·202 00:46:18.28 +41:47:01.1 18.860±0.047 0.967±0.091 2.033±0.171 · · ·203 00:46:22.78 +40:57:48.8 18.454±0.020 1.077±0.041 2.602±0.101 · · ·204 00:46:22.92 +40:20:42.2 18.660±0.021 0.926±0.040 2.286±0.085 · · ·205 00:46:24.79 +40:35:08.4 17.657±0.009 1.078±0.018 2.610±0.045 · · ·206 00:46:34.67 +40:30:40.9 19.004±0.029 0.659±0.047 1.632±0.072 · · ·207 00:46:36.50 +41:10:31.9 18.684±0.024 0.777±0.041 1.602±0.054 · · ·

Globular Clusters in M31. I. 23
TABLE 7 — Continued
R.A.a Decl.b vID (J2000.0) (J2000.0) T1 (M − T1) (C − T1) (km s−1)(1) (2) (3) (4) (5) (6) (7)208 00:46:36.82 +40:43:01.4 18.386±0.019 1.020±0.038 2.229±0.071 · · ·209 00:46:39.66 +41:51:35.5 19.192±0.064 0.852±0.114 2.200±0.264 · · ·210 00:46:48.19 +41:45:40.2 17.934±0.018 0.232±0.022 0.190±0.020 · · ·211 00:46:49.72 +41:45:44.6 17.759±0.014 0.717±0.021 1.667±0.027 · · ·212 00:46:53.10 +41:22:07.2 18.149±0.015 1.044±0.030 2.588±0.068 · · ·213 00:46:58.77 +42:17:45.3 18.491±0.050 0.819±0.102 1.120±0.126 · · ·214 00:46:58.88 +40:54:02.6 17.472±0.008 1.061±0.017 2.597±0.041 · · ·215 00:47:02.28 +41:03:25.0 18.734±0.025 1.033±0.049 2.481±0.107 · · ·216 00:47:03.73 +41:39:14.5 18.343±0.024 0.983±0.040 2.627±0.087 · · ·217 00:47:07.55 +41:41:18.7 18.583±0.030 0.846±0.047 1.701±0.058 · · ·218 00:47:21.95 +42:26:57.6 17.982±0.031 1.080±0.077 2.158±0.179 · · ·219 00:47:25.25 +41:02:21.0 18.835±0.030 0.786±0.049 1.377±0.057 −86.8±35.6220 00:47:28.75 +41:53:49.7 17.024±0.007 0.577±0.012 1.385±0.018 · · ·221 00:47:58.79 +41:39:33.4 19.014±0.038 0.826±0.076 1.796±0.136 · · ·222 00:47:59.48 +41:54:13.0 19.077±0.042 0.481±0.069 1.280±0.109 −3.4±44.6223 00:48:04.61 +40:08:27.0 17.289±0.009 1.239±0.017 2.381±0.064 · · ·224 00:48:08.61 +41:49:08.1 17.564±0.010 0.974±0.023 2.501±0.070 · · ·225 00:48:31.34 +42:01:05.5 17.027±0.007 0.997±0.015 2.490±0.042 · · ·226 00:48:34.26 +41:54:26.8 17.292±0.008 0.820±0.017 2.103±0.040 · · ·227 00:48:44.05 +42:15:48.8 18.500±0.049 1.008±0.116 3.014±0.582 · · ·228 00:48:46.49 +41:46:45.8 19.456±0.059 0.985±0.132 1.643±0.201 · · ·229 00:49:11.04 +41:57:53.1 19.548±0.065 0.831±0.132 1.104±0.149 · · ·230 00:49:13.31 +41:01:01.4 15.286±0.002 0.513±0.002 1.186±0.003 · · ·231 00:49:14.80 +41:09:08.2 17.503±0.009 0.914±0.016 2.330±0.034 · · ·232 00:49:25.63 +42:06:06.7 17.943±0.015 0.886±0.025 2.253±0.052 · · ·233 00:49:35.65 +42:11:42.8 18.278±0.020 0.916±0.034 2.663±0.096 · · ·234 00:51:08.70 +42:11:27.0 16.686±0.005 0.654±0.008 1.390±0.010 · · ·
NOTE. — Table 7 is published in its entirety in the electronic edition of theAstronomical Journal. A portion is shown here for guidance regarding its form and content.a Right ascension in units of hours, minutes, and seconds.b Declination in units of degrees, arcminutes, and arcseconds.
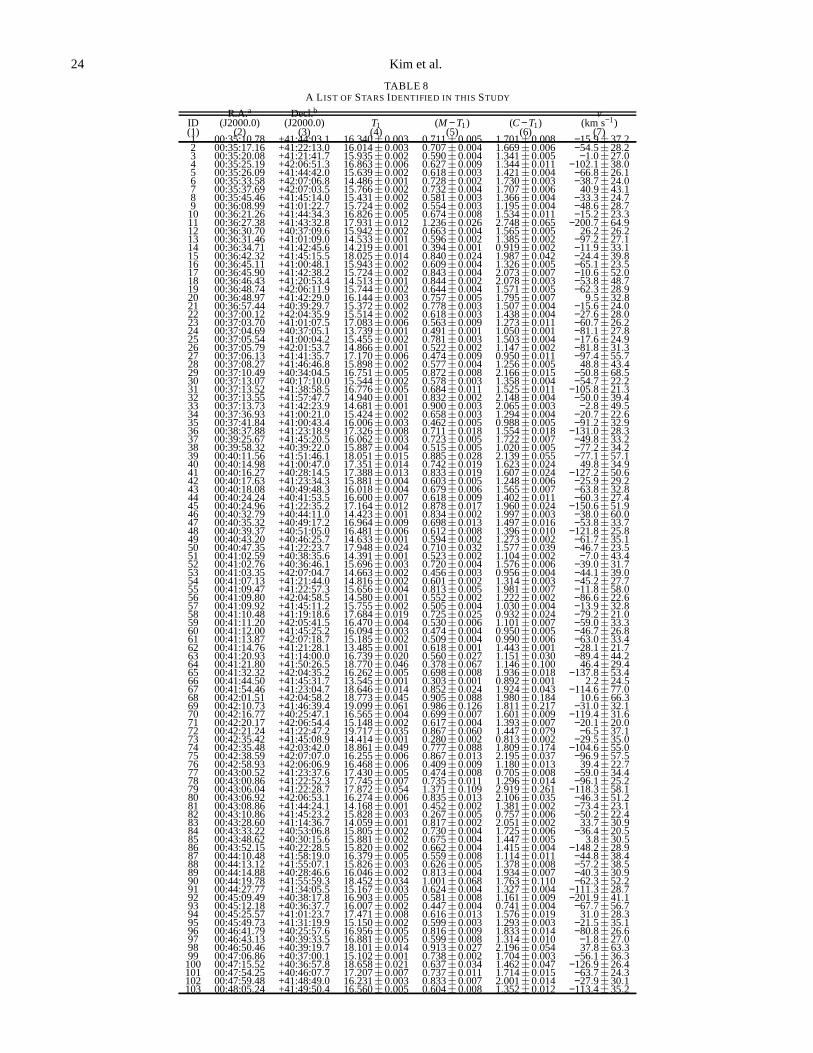
24 Kim et al.
TABLE 8A L IST OF STARS IDENTIFIED IN THIS STUDY
R.A.a Decl.b vID (J2000.0) (J2000.0) T1 (M − T1) (C − T1) (km s−1)(1) (2) (3) (4) (5) (6) (7)1 00:35:10.78 +41:44:03.1 16.340±0.003 0.711±0.005 1.701±0.008 −15.9±37.22 00:35:17.16 +41:22:13.0 16.014±0.003 0.707±0.004 1.669±0.006 −54.5±28.23 00:35:20.08 +41:21:41.7 15.935±0.002 0.590±0.004 1.341±0.005 −1.0±27.04 00:35:25.19 +42:06:51.3 16.863±0.006 0.627±0.009 1.344±0.011 −102.1±38.05 00:35:26.09 +41:44:42.0 15.639±0.002 0.618±0.003 1.421±0.004 −66.8±26.16 00:35:33.58 +42:07:06.8 14.486±0.001 0.728±0.002 1.730±0.003 −38.7±24.07 00:35:37.69 +42:07:03.5 15.766±0.002 0.732±0.004 1.707±0.006 40.9±43.18 00:35:45.46 +41:45:14.0 15.431±0.002 0.581±0.003 1.366±0.004 −33.3±24.79 00:36:08.99 +41:01:22.7 15.724±0.002 0.554±0.003 1.195±0.004 −48.6±28.710 00:36:21.26 +41:44:34.3 16.826±0.005 0.674±0.008 1.534±0.011 −15.2±23.311 00:36:27.38 +41:43:32.8 17.931±0.012 1.236±0.026 2.748±0.065 −200.7±64.912 00:36:30.70 +40:37:09.6 15.942±0.002 0.663±0.004 1.565±0.005 26.2±26.213 00:36:31.46 +41:01:09.0 14.533±0.001 0.596±0.002 1.385±0.002 −97.2±27.114 00:36:34.71 +41:42:45.6 14.219±0.001 0.394±0.001 0.919±0.002 −11.9±33.115 00:36:42.32 +41:45:15.5 18.025±0.014 0.840±0.024 1.987±0.042 −24.4±39.816 00:36:45.11 +41:00:48.1 15.943±0.002 0.609±0.004 1.326±0.005 −65.1±23.517 00:36:45.90 +41:42:38.2 15.724±0.002 0.843±0.004 2.073±0.007 −10.6±52.018 00:36:46.43 +41:20:53.4 14.513±0.001 0.844±0.002 2.078±0.003 −53.8±48.719 00:36:48.74 +42:06:11.9 15.744±0.002 0.644±0.004 1.571±0.005 −62.3±28.920 00:36:48.97 +41:42:29.0 16.144±0.003 0.757±0.005 1.795±0.007 9.5±32.821 00:36:57.44 +40:39:29.7 15.372±0.002 0.778±0.003 1.507±0.004 −15.6±24.022 00:37:00.12 +42:04:35.9 15.514±0.002 0.618±0.003 1.438±0.004 −27.6±28.023 00:37:03.70 +41:01:07.5 17.083±0.006 0.563±0.009 1.273±0.011 −60.7±26.224 00:37:04.69 +40:37:05.1 13.739±0.001 0.491±0.001 1.050±0.001 −81.1±27.825 00:37:05.54 +41:00:04.2 15.455±0.002 0.781±0.003 1.503±0.004 −17.6±24.926 00:37:05.79 +42:01:53.7 14.866±0.001 0.522±0.002 1.147±0.002 −81.8±31.327 00:37:06.13 +41:41:35.7 17.170±0.006 0.474±0.009 0.950±0.011 −97.4±55.728 00:37:08.27 +41:46:46.8 15.898±0.002 0.577±0.004 1.256±0.005 48.8±43.429 00:37:10.49 +40:34:04.5 16.751±0.005 0.872±0.008 2.166±0.015 −50.8±68.530 00:37:13.07 +40:17:10.0 15.544±0.002 0.578±0.003 1.358±0.004 −54.7±22.231 00:37:13.52 +41:38:58.5 16.776±0.005 0.684±0.011 1.525±0.011 −105.8±21.332 00:37:13.55 +41:57:47.7 14.940±0.001 0.832±0.002 2.148±0.004 −50.0±39.433 00:37:13.73 +41:42:23.9 14.681±0.001 0.900±0.003 2.065±0.003 −2.8±49.534 00:37:36.93 +41:00:21.0 15.424±0.002 0.658±0.003 1.294±0.004 −20.7±22.635 00:37:41.84 +41:00:43.4 16.006±0.003 0.462±0.005 0.988±0.005 −91.2±32.936 00:38:37.88 +41:23:18.9 17.326±0.008 0.711±0.018 1.554±0.018 −131.0±28.337 00:39:25.67 +41:45:20.5 16.062±0.003 0.723±0.005 1.722±0.007 −49.8±33.238 00:39:58.32 +40:39:22.0 15.887±0.004 0.515±0.005 1.020±0.005 −77.2±34.239 00:40:11.56 +41:51:46.1 18.051±0.015 0.885±0.028 2.139±0.055 −77.1±57.140 00:40:14.98 +41:00:47.0 17.351±0.014 0.742±0.019 1.623±0.024 49.8±34.941 00:40:16.27 +40:28:14.5 17.388±0.013 0.833±0.019 1.607±0.024 −127.2±50.642 00:40:17.63 +41:23:34.3 15.881±0.004 0.603±0.005 1.248±0.006 −25.9±29.243 00:40:18.08 +40:49:48.3 16.018±0.004 0.679±0.006 1.565±0.007 −63.8±32.844 00:40:24.24 +40:41:53.5 16.600±0.007 0.618±0.009 1.402±0.011 −60.3±27.445 00:40:24.96 +41:22:35.2 17.164±0.012 0.878±0.017 1.960±0.024 −150.6±51.946 00:40:32.79 +40:44:11.0 14.423±0.001 0.834±0.002 1.997±0.003 −38.0±60.047 00:40:35.32 +40:49:17.2 16.964±0.009 0.698±0.013 1.497±0.016 −53.8±33.748 00:40:39.37 +40:51:05.0 16.481±0.006 0.612±0.008 1.396±0.010 −121.8±25.849 00:40:43.20 +40:46:25.7 14.633±0.001 0.594±0.002 1.273±0.002 −61.7±35.150 00:40:47.35 +41:22:23.7 17.948±0.024 0.710±0.032 1.577±0.039 −46.7±23.551 00:41:02.59 +40:38:35.6 14.391±0.001 0.523±0.002 1.104±0.002 −7.0±43.452 00:41:02.76 +40:36:46.1 15.696±0.003 0.720±0.004 1.576±0.006 −39.0±31.753 00:41:03.35 +42:07:04.7 14.663±0.002 0.456±0.003 0.956±0.004 −44.1±39.054 00:41:07.13 +41:21:44.0 14.816±0.002 0.601±0.002 1.314±0.003 −45.2±27.755 00:41:09.47 +41:22:57.3 15.656±0.004 0.813±0.005 1.981±0.007 −11.8±58.056 00:41:09.80 +42:04:58.5 14.580±0.001 0.552±0.002 1.222±0.002 −86.6±22.657 00:41:09.92 +41:45:11.2 15.755±0.002 0.505±0.004 1.030±0.004 −13.9±32.858 00:41:10.48 +41:19:18.6 17.684±0.019 0.725±0.025 0.932±0.024 −79.2±21.059 00:41:11.20 +42:05:41.5 16.470±0.004 0.530±0.006 1.101±0.007 −59.0±33.360 00:41:12.00 +41:45:25.2 16.094±0.003 0.474±0.004 0.950±0.005 −46.7±26.861 00:41:13.87 +42:07:18.7 15.185±0.002 0.509±0.004 0.990±0.006 −63.0±33.462 00:41:14.76 +41:21:28.1 13.485±0.001 0.618±0.001 1.443±0.001 −28.1±21.763 00:41:20.93 +41:14:00.0 16.739±0.020 0.560±0.027 1.151±0.030 −89.4±44.264 00:41:21.80 +41:50:26.5 18.770±0.046 0.378±0.067 1.146±0.100 46.4±29.465 00:41:32.32 +42:04:35.2 16.262±0.005 0.698±0.008 1.936±0.018 −137.8±53.466 00:41:44.50 +41:45:31.7 13.545±0.001 0.303±0.001 0.892±0.001 2.2±24.567 00:41:54.46 +41:23:04.7 18.646±0.014 0.852±0.024 1.924±0.043 −114.6±77.068 00:42:01.51 +42:04:58.2 18.773±0.045 0.905±0.088 1.980±0.184 10.6±66.369 00:42:10.73 +41:46:39.4 19.099±0.061 0.986±0.126 1.811±0.217 −31.0±32.170 00:42:16.77 +40:25:47.1 16.565±0.004 0.699±0.007 1.601±0.009 −119.4±31.671 00:42:20.17 +42:06:54.4 15.148±0.002 0.617±0.004 1.393±0.007 −20.1±20.072 00:42:21.24 +41:22:47.2 19.717±0.035 0.867±0.060 1.447±0.079 −6.5±37.173 00:42:35.42 +41:45:08.9 14.414±0.001 0.280±0.002 0.813±0.002 −29.5±35.074 00:42:35.48 +42:03:42.0 18.861±0.049 0.777±0.088 1.809±0.174 −104.6±55.075 00:42:38.59 +42:07:07.0 16.255±0.006 0.867±0.013 2.195±0.037 −96.9±57.576 00:42:58.93 +42:06:06.9 16.468±0.006 0.409±0.009 1.180±0.013 39.4±22.777 00:43:00.52 +41:23:37.6 17.430±0.005 0.474±0.008 0.705±0.008 −59.0±34.478 00:43:00.86 +41:22:52.3 17.745±0.007 0.735±0.011 1.296±0.014 −96.1±25.279 00:43:06.04 +41:22:28.7 17.872±0.054 1.371±0.109 2.919±0.261 −118.3±58.180 00:43:06.92 +42:06:53.1 16.274±0.006 0.835±0.013 2.106±0.035 −46.3±51.281 00:43:08.86 +41:44:24.1 14.168±0.001 0.452±0.002 1.381±0.002 −73.4±23.182 00:43:10.86 +41:45:23.2 15.828±0.003 0.267±0.005 0.757±0.006 −50.2±22.483 00:43:28.60 +41:14:36.7 14.059±0.001 0.817±0.002 2.051±0.002 33.7±30.984 00:43:33.22 +40:53:06.8 15.805±0.002 0.730±0.004 1.725±0.006 −36.4±20.585 00:43:48.62 +40:30:15.6 15.881±0.002 0.675±0.004 1.447±0.005 3.8±30.586 00:43:52.15 +40:22:28.5 15.820±0.002 0.662±0.004 1.415±0.004 −148.2±28.987 00:44:10.48 +41:58:19.0 16.379±0.005 0.559±0.008 1.114±0.011 −44.8±38.488 00:44:13.12 +41:55:07.1 15.826±0.003 0.626±0.005 1.378±0.008 −57.2±38.589 00:44:14.88 +40:28:46.6 16.046±0.002 0.813±0.004 1.934±0.007 −40.3±30.990 00:44:19.78 +41:55:59.3 18.452±0.034 1.001±0.068 1.763±0.110 −62.3±52.291 00:44:27.77 +41:34:05.5 15.167±0.003 0.624±0.004 1.327±0.004 −111.3±28.792 00:45:09.49 +40:38:17.8 16.903±0.005 0.581±0.008 1.161±0.009 −201.9±41.193 00:45:12.18 +40:36:37.7 16.007±0.002 0.447±0.004 0.741±0.004 −67.7±56.794 00:45:25.57 +41:01:23.7 17.471±0.008 0.616±0.013 1.576±0.019 31.0±28.395 00:45:49.73 +41:31:19.9 15.150±0.002 0.599±0.003 1.293±0.003 −21.5±35.196 00:46:41.79 +40:25:57.6 16.956±0.005 0.816±0.009 1.833±0.014 −80.8±26.697 00:46:43.13 +40:39:33.5 16.881±0.005 0.599±0.008 1.314±0.010 −1.8±27.098 00:46:50.46 +40:39:19.7 18.101±0.014 0.913±0.027 2.196±0.054 37.8±63.399 00:47:06.86 +40:37:00.1 15.102±0.001 0.738±0.002 1.704±0.003 −56.1±36.3100 00:47:15.52 +40:36:57.8 18.658±0.021 0.637±0.034 1.462±0.047 −126.9±26.4101 00:47:54.25 +40:46:07.7 17.207±0.007 0.737±0.011 1.714±0.015 −63.7±24.3102 00:47:59.48 +41:48:49.0 16.231±0.003 0.833±0.007 2.001±0.014 −27.9±30.1103 00:48:05.24 +41:49:50.4 16.560±0.005 0.604±0.008 1.352±0.012 −113.4±35.2

Globular Clusters in M31. I. 25
TABLE 8 — Continued
R.A.a Decl.b vID (J2000.0) (J2000.0) T1 (M − T1) (C − T1) (km s−1)(1) (2) (3) (4) (5) (6) (7)104 00:48:07.05 +41:29:00.5 15.420±0.002 0.643±0.003 1.447±0.005 −7.7±31.4105 00:48:07.63 +41:57:57.5 17.771±0.013 0.832±0.026 1.684±0.044 −28.1±35.9106 00:48:15.84 +41:38:28.6 15.745±0.002 0.590±0.004 1.250±0.005 −17.1±31.8107 00:48:17.30 +41:22:16.6 15.637±0.002 0.497±0.003 1.082±0.004 −36.2±44.5108 00:48:32.47 +41:22:59.2 16.810±0.005 0.515±0.009 1.019±0.011 −78.1±34.1109 00:48:44.97 +41:23:11.5 15.701±0.002 0.566±0.004 1.163±0.005 −136.2±24.9110 00:48:59.44 +41:28:11.5 16.053±0.003 0.598±0.005 1.257±0.007 −31.1±22.1111 00:49:16.87 +41:00:58.1 18.706±0.002 · · · · · · −46.0±43.5
NOTE. — Table 8 is published in its entirety in the electronic edition of theAstronomical Journal. A portion is shown here for guidance regarding its form and content.a Right ascension in units of hours, minutes, and seconds.b Declination in units of degrees, arcminutes, and arcseconds.
TABLE 9A L IST OF GALAXIES IDENTIFIED IN THIS STUDY
R.A.a Decl.b vID (J2000.0) (J2000.0) T1 (M − T1) (C − T1) (km s−1) RBC2 IDc
(1) (2) (3) (4) (5) (6) (7) (8)1 00:36:32.94 +40:24:52.7 16.408±0.004 0.788±0.006 1.849±0.009 10779.3±51.1 B2942 00:40:15.67 +41:48:30.4 17.252±0.008 0.841±0.014 1.835±0.022 53856.7±68.2 B3203 00:40:27.23 +41:29:09.1 17.352±0.014 0.801±0.018 1.705±0.023 41878.8±69.1 B0074 00:40:55.18 +41:57:28.7 17.695±0.011 0.881±0.021 2.174±0.041 35348.9±74.1 · · ·5 00:41:00.13 +41:55:39.8 16.972±0.006 0.951±0.012 2.260±0.023 28551.8±65.7 · · ·6 00:42:49.35 +41:59:06.6 18.392±0.032 0.732±0.056 2.059±0.138 35984.0±100.3 · · ·7 00:43:14.56 +40:22:58.9 18.767±0.028 1.004±0.052 2.532±0.116 38863.2±89.3 · · ·8 00:43:15.67 +42:01:47.9 17.738±0.018 0.759±0.031 2.045±0.075 22246.6±58.1 · · ·9 00:43:47.30 +40:32:54.8 17.900±0.011 0.986±0.022 2.040±0.036 52702.6±99.2 · · ·10 00:44:52.40 +41:46:29.1 19.630±0.095 −0.183±0.112 2.849±0.761 47585.2±41.2 · · ·11 00:45:48.73 +41:02:14.0 17.835±0.011 0.819±0.020 1.939±0.032 33179.9±107.0 · · ·12 00:46:24.87 +41:35:09.1 17.223±0.009 0.640±0.013 1.385±0.015 28367.1±80.7 B38513 00:46:29.20 +40:20:35.0 17.658±0.009 0.869±0.016 2.057±0.029 35611.0±112.8 · · ·14 00:46:43.77 +41:49:09.9 16.840±0.008 1.022±0.015 2.516±0.039 37728.3±85.9 B38915 00:47:00.27 +40:59:38.0 17.011±0.006 0.711±0.010 1.523±0.013 32027.7±60.1 B299D16 00:47:00.33 +40:40:36.7 17.427±0.008 0.872±0.015 2.078±0.027 39567.8±67.8 B300D17 00:47:12.50 +41:30:07.7 17.880±0.016 0.887±0.025 2.164±0.041 32632.9±89.6 · · ·18 00:47:26.23 +41:47:41.4 18.634±0.027 0.942±0.059 2.514±0.187 38498.4±102.2 · · ·19 00:47:31.18 +41:52:59.7 18.501±0.024 0.854±0.050 2.364±0.147 32383.9±105.4 · · ·20 00:47:41.69 +41:46:41.4 17.518±0.010 0.901±0.022 2.089±0.048 32408.5±78.0 · · ·21 00:48:33.48 +41:43:44.4 18.070±0.016 0.855±0.033 2.212±0.079 38208.4±113.9 · · ·
a Right ascension in units of hours, minutes, and seconds.b Declination in units of degrees, arcminutes, and arcseconds.c Identification in the Revised Bologna Catalogue V2.0 of Galleti et al. (2006)