Conservative Christianity, Partnership, Hormones and Sex in ...
Upload
independentCategory
view
0download
0
Research Article
Endogenous Sex Hormones and Breast Densityin Young WomenSeungyoun Jung1, Frank Z. Stanczyk2, Brian L. Egleston3, Linda G. Snetselaar4,Victor J. Stevens5, John A. Shepherd6, Linda Van Horn7, Erin S. LeBlanc5,Kenneth Paris8, Catherine Klifa9, and Joanne F. Dorgan1
Abstract
Background: Breast density is a strong risk factor for breastcancer and reflects epithelial and stromal content. Breast tissue isparticularly sensitive to hormonal stimuli before it fully differ-entiates following the first full-term pregnancy. Few studies haveexamined associations between sex hormones and breast densityamong young women.
Methods: We conducted a cross-sectional study among 180women ages 25 to 29 years old who participated in the DietaryIntervention Study in Children 2006 Follow-up Study. Eighty-fivepercent of participants attended a clinic visit during their lutealphase of menstrual cycle. Magnetic resonance imaging measuredthe percentage of dense breast volume (%DBV), absolute densebreast volume (ADBV), and absolute nondense breast volume(ANDBV). Multiple-linear mixed-effect regression models wereused to evaluate the association of sex hormones and sex hor-mone–binding globulin (SHBG)with%DBV, ADBV, and ANDBV.
Results: Testosterone was significantly positively associatedwith %DBV and ADBV. The multivariable geometric mean of%DBV and ADBV across testosterone quartiles increased from16.5% to 20.3% and from 68.6 to 82.3 cm3, respectively (Ptrend�0.03). Therewas no association of%DBVorADBVwith estrogens,progesterone, non–SHBG-bound testosterone, or SHBG (Ptrend�0.27). Neither sex hormones nor SHBG was associated withANDBV except progesterone; however, the progesterone resultwas nonsignificant in analysis restricted to women in the lutealphase.
Conclusions: These findings suggest a modest positive associ-ation between testosterone and breast density in young women.
Impact:Hormonal influences at critical periodsmay contributeto morphologic differences in the breast associated with breastcancer risk later in life. Cancer Epidemiol Biomarkers Prev; 24(2); 369–78.�2014 AACR.
IntroductionBreast density is ameasure of the relative proportionof glandular
and stromal tissue to fatty tissue in the breasts and is a strongrisk factor for breast cancer (1, 2). In a meta-analysis, women withdense breasts were at a 4-fold excess risk of developing breastcancer (2). Reproductive and menstrual factors (e.g., nulliparity,late menopause, and late first pregnancy; ref. 3) and exogenoushormone use (4, 5) have been associated with greater breastdensity. These findings are consistent with an estrogenichormonal proliferative effect on breast tissue (6–10) that isreflected in the amount of dense tissue and breast density (11).
However, endogenous serum sex hormones have not beenconsistently associated with breast density in premenopausal(12–18) or postmenopausal women (18–28).
Breast tissue differs in its response to stimuli over the life course(29, 30). Most research on breast density in healthypremenopausal women has used screening mammogramsand consequently includes women 40 years and older. Fewstudies have examined endogenous sex hormones in relationto breast density among women younger than 40 years old. In280womenwith amean age of 18 years old, Boyd and colleaguesobserved positive associations of serum estradiol, testosterone,progesterone, and sex hormone–binding globulin (SHBG)concentrations with percentage of breast water, a measure ofthe proportion of the fibroglandular breast tissue to fattytissue, but only SHBG results were statistically significant (31).Chen and colleagues reported a significant positive correlation ofestradiol and progesterone with breast density at the third week ofthe menstrual cycle in a small study (N ¼ 24) of Asian womenwith a mean age of 29.4 years old. When saliva was alternativelyused to measure sex hormones, Frydenberg and colleagues foundthat high mammographic density was significantly associatedwith high progesterone levels among women ages 25 to 35years old (32). We also reported positive associations betweenbreast density and nulliparity and the duration of hormonalcontraceptive use, proxies of higher cumulative estrogenexposure to breast tissue (6, 7, 9), among women ages 25 to29 years (33). In sum, despite some suggestive positiveassociations of sex hormones with breast density among youngwomen, evidence is sparse necessitating further study.
1University of Maryland School of Medicine, Baltimore, Maryland.2University of Southern California Keck School of Medicine, LosAngeles, California. 3Fox Chase Cancer Center, Philadelphia, Pennsyl-vania. 4University of Iowa, IowaCity, Iowa. 5Kaiser Permanente Centerfor Health Research, Portland, Oregon. 6University of California SanFrancisco, San Francisco, California. 7Feinberg School of Medicine,Northwestern University, Chicago, Illinois. 8Louisiana State UniversitySchool of Medicine, New Orleans, Louisiana. 9Dangeard Group, SanFrancisco, California.
Note: Supplementary data for this article are available at Cancer Epidemiology,Biomarkers & Prevention Online (http://cebp.aacrjournals.org/).
Corresponding Author: Joanne F. Dorgan, Department of Epidemiology andPublic Health, University of Maryland School of Medicine, Howard Hall 102E,Baltimore, MD 21201. Phone: 410-706-1602; Fax: 410-706-8013; E-mail:[email protected]
doi: 10.1158/1055-9965.EPI-14-0939
�2014 American Association for Cancer Research.
CancerEpidemiology,Biomarkers& Prevention
www.aacrjournals.org 369
on March 14, 2015. © 2015 American Association for Cancer Research. cebp.aacrjournals.org Downloaded from
Published OnlineFirst November 4, 2014; DOI: 10.1158/1055-9965.EPI-14-0939
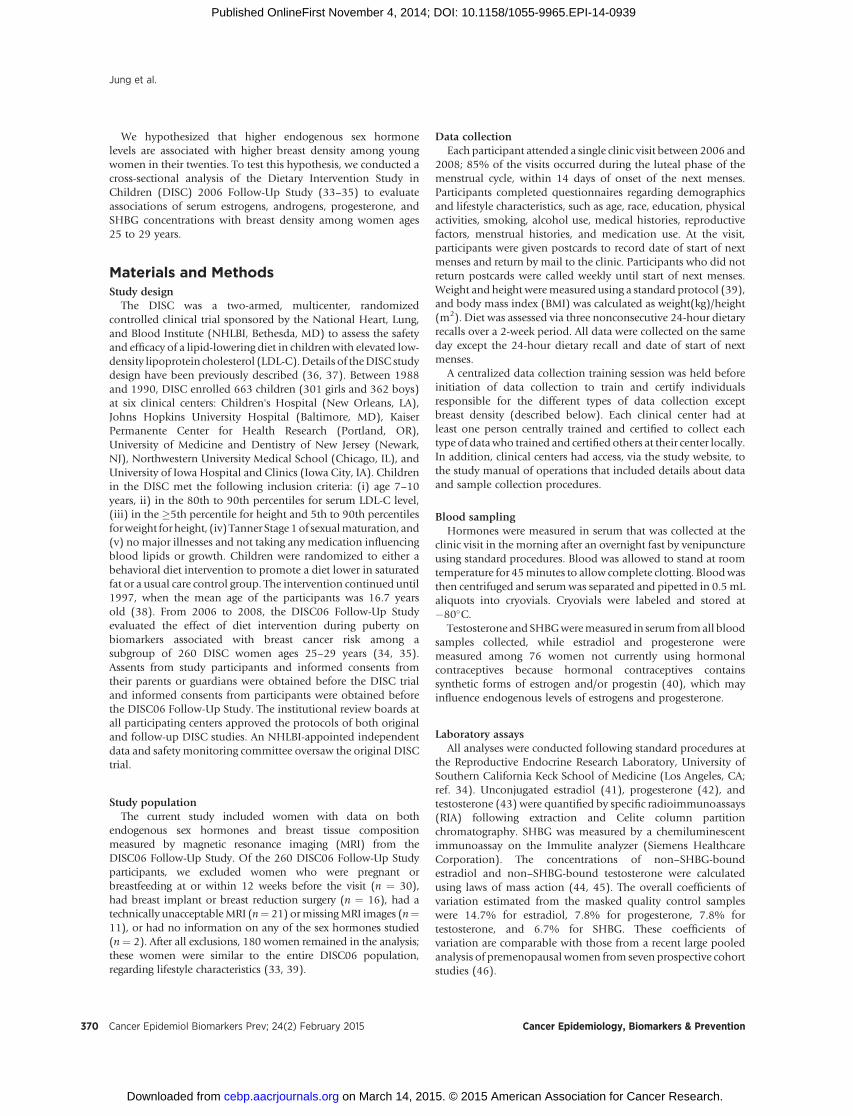
We hypothesized that higher endogenous sex hormonelevels are associated with higher breast density among youngwomen in their twenties. To test this hypothesis, we conducted across-sectional analysis of the Dietary Intervention Study inChildren (DISC) 2006 Follow-Up Study (33–35) to evaluateassociations of serum estrogens, androgens, progesterone, andSHBG concentrations with breast density among women ages25 to 29 years.
Materials and MethodsStudy design
The DISC was a two-armed, multicenter, randomizedcontrolled clinical trial sponsored by the National Heart, Lung,and Blood Institute (NHLBI, Bethesda, MD) to assess the safetyand efficacy of a lipid-lowering diet in children with elevated low-density lipoprotein cholesterol (LDL-C).Details of theDISC studydesign have been previously described (36, 37). Between 1988and 1990, DISC enrolled 663 children (301 girls and 362 boys)at six clinical centers: Children's Hospital (New Orleans, LA),Johns Hopkins University Hospital (Baltimore, MD), KaiserPermanente Center for Health Research (Portland, OR),University of Medicine and Dentistry of New Jersey (Newark,NJ), Northwestern University Medical School (Chicago, IL), andUniversity of Iowa Hospital and Clinics (Iowa City, IA). Childrenin the DISC met the following inclusion criteria: (i) age 7–10years, ii) in the 80th to 90th percentiles for serum LDL-C level,(iii) in the �5th percentile for height and 5th to 90th percentilesforweight for height, (iv) Tanner Stage 1of sexualmaturation, and(v) no major illnesses and not taking any medication influencingblood lipids or growth. Children were randomized to either abehavioral diet intervention to promote a diet lower in saturatedfat or a usual care control group. The intervention continued until1997, when the mean age of the participants was 16.7 yearsold (38). From 2006 to 2008, the DISC06 Follow-Up Studyevaluated the effect of diet intervention during puberty onbiomarkers associated with breast cancer risk among asubgroup of 260 DISC women ages 25–29 years (34, 35).Assents from study participants and informed consents fromtheir parents or guardians were obtained before the DISC trialand informed consents from participants were obtained beforethe DISC06 Follow-Up Study. The institutional review boards atall participating centers approved the protocols of both originaland follow-up DISC studies. An NHLBI-appointed independentdata and safety monitoring committee oversaw the original DISCtrial.
Study populationThe current study included women with data on both
endogenous sex hormones and breast tissue compositionmeasured by magnetic resonance imaging (MRI) from theDISC06 Follow-Up Study. Of the 260 DISC06 Follow-Up Studyparticipants, we excluded women who were pregnant orbreastfeeding at or within 12 weeks before the visit (n ¼ 30),had breast implant or breast reduction surgery (n ¼ 16), had atechnically unacceptableMRI (n¼ 21) ormissingMRI images (n¼11), or had no information on any of the sex hormones studied(n¼ 2). After all exclusions, 180 women remained in the analysis;these women were similar to the entire DISC06 population,regarding lifestyle characteristics (33, 39).
Data collectionEach participant attended a single clinic visit between 2006 and
2008; 85% of the visits occurred during the luteal phase of themenstrual cycle, within 14 days of onset of the next menses.Participants completed questionnaires regarding demographicsand lifestyle characteristics, such as age, race, education, physicalactivities, smoking, alcohol use, medical histories, reproductivefactors, menstrual histories, and medication use. At the visit,participants were given postcards to record date of start of nextmenses and return by mail to the clinic. Participants who did notreturn postcards were called weekly until start of next menses.Weight and height weremeasured using a standard protocol (39),and body mass index (BMI) was calculated as weight(kg)/height(m2). Diet was assessed via three nonconsecutive 24-hour dietaryrecalls over a 2-week period. All data were collected on the sameday except the 24-hour dietary recall and date of start of nextmenses.
A centralized data collection training session was held beforeinitiation of data collection to train and certify individualsresponsible for the different types of data collection exceptbreast density (described below). Each clinical center had atleast one person centrally trained and certified to collect eachtype of datawho trained and certified others at their center locally.In addition, clinical centers had access, via the study website, tothe study manual of operations that included details about dataand sample collection procedures.
Blood samplingHormones were measured in serum that was collected at the
clinic visit in the morning after an overnight fast by venipunctureusing standard procedures. Blood was allowed to stand at roomtemperature for 45minutes to allow complete clotting. Bloodwasthen centrifuged and serumwas separated and pipetted in 0.5mLaliquots into cryovials. Cryovials were labeled and stored at�80�C.
Testosterone and SHBGweremeasured in serum fromall bloodsamples collected, while estradiol and progesterone weremeasured among 76 women not currently using hormonalcontraceptives because hormonal contraceptives containssynthetic forms of estrogen and/or progestin (40), which mayinfluence endogenous levels of estrogens and progesterone.
Laboratory assaysAll analyses were conducted following standard procedures at
the Reproductive Endocrine Research Laboratory, University ofSouthern California Keck School of Medicine (Los Angeles, CA;ref. 34). Unconjugated estradiol (41), progesterone (42), andtestosterone (43) were quantified by specific radioimmunoassays(RIA) following extraction and Celite column partitionchromatography. SHBG was measured by a chemiluminescentimmunoassay on the Immulite analyzer (Siemens HealthcareCorporation). The concentrations of non–SHBG-boundestradiol and non–SHBG-bound testosterone were calculatedusing laws of mass action (44, 45). The overall coefficients ofvariation estimated from the masked quality control sampleswere 14.7% for estradiol, 7.8% for progesterone, 7.8% fortestosterone, and 6.7% for SHBG. These coefficients ofvariation are comparable with those from a recent large pooledanalysis of premenopausal women from seven prospective cohortstudies (46).
Jung et al.
Cancer Epidemiol Biomarkers Prev; 24(2) February 2015 Cancer Epidemiology, Biomarkers & Prevention370
on March 14, 2015. © 2015 American Association for Cancer Research. cebp.aacrjournals.org Downloaded from
Published OnlineFirst November 4, 2014; DOI: 10.1158/1055-9965.EPI-14-0939

Measurement of breast densityBreast densitywasmeasured at the clinic visit usingnoncontrast
MRI (39). Equipment standards were consistent with AmericanCollege of Radiology guidelines for breast MRI (47) and requiredthat imaging beperformedusing awhole-bodyMRI scanner of 1.5Tesla or higher field strength and a dedicated breast imagingradiofrequency coil. A standard image acquisition protocol wasfollowed at all clinics as described previously (39). To insureaccuracy and uniformity of data acquisition at the differentclinical centers, MRI technologists at the sites were individuallytrained (by C. Klifa) to recognize and correct failures due toincomplete fat suppression, motion artifacts, and inadequatebreast coverage. In addition, acceptable image quality on threevolunteerswas required for site certification. Participant scans thatwere inaccurate due to artifacts, motion, or technique wereexcluded (n ¼ 21).
All MRI image data were processed at University of CaliforniaSan Francisco (San Francisco, CA) by the same investigator (C.Klifa) using customized software to identify the chest wall–breasttissue boundary and skin surface, and to separate breastfibroglandular and fatty tissue using a segmentation methodbased on fuzzy C-means clustering (48). In problematic casesthat could not be segmented with automated fuzzy C-meansmethods, manual delineation was used.
Fibroglandular tissue content was estimated as the absolutedense breast volume (ADBV) and fatty tissue content wasestimated as the absolute nondense breast volume (ANDBV)from the MRI image. The percentage of dense breast volume(%DBV) was calculated as ADBV divided by total breast volume.ADBV, ANDBV, and%DBVwere assessed separately for each breastand averaged for analysis; correlations of density parameters ofboth breasts ranged from 0.94 for ADBV to 0.98 for %DBV.
Statistical analysisSummary statistics were used to describe the study population
with means (SDs) or percentages. Hormones and breast densitymeasures were reported as medians with their interquartileranges. Spearman correlation coefficients were calculated toexamine the relationships of all analytes.
%DBV, ADBV, and ANDBV were log-transformed to improvenormality. Associations for %DBV, ADBV, and ANDBV werequantified separately for each hormone; geometric means and95% confidence intervals (CI) of%DBV, ADBV, and ANDBVwerecalculated for each quartile category of the hormones. Because ofthe established association between percent breast densityand breast cancer risk (2), %DBV was the primary outcome ofinterest; ADBV (49) and ANDBV (49, 50) were also analyzed toinvestigate whether a specific breast tissue compartment (densevs. nondense) was responsible for observed associations with%DBV.
To evaluate associations of sex hormones with %DBV, ADBV,and ANDBV, we used multiple linear mixed-effects models (51)with robust SEs; the clinic was included as a random interceptto account for the potential correlation among participantsfrom the same clinic. Other variables that were potentialconfounders, selected a priori based on previous DISC06analyses (33, 39, 52) and on knowledge about breast cancerrisk factors (53), were modeled as fixed effects and includedrace, education, BMI, duration of hormonal contraceptive use,and parity. The number of days from blood draw to next menseswas included as a cubic spline in the analyses of estrogens and
progesterone, which are known to vary over the menstrual cycle(54). Adding other factors, such as assay batch, family history ofbreast cancer, age at menarche, breastfeeding, physical activity,childhood BMI, smoking, drinking status, and intake of fat andfiber into the multivariable model did not change the resultappreciably, but reduced the precision. The age distributionwas narrow (<5 years) and also did not affect the results. Thus,those variables were not included in our final model. No highlyinfluential observations were identified (55). Tests for trend wereconducted on the continuousmeasure of each sex hormone usingthe Wald statistic (56).
In sensitivity analyses, we restricted women to those whowere nulliparous or whose blood was collected during theluteal phase of menstrual cycle (57, 58). Furthermore,stratified analyses were conducted by hormonal contraceptiveuse (5, 59, 60) and treatment assignment. Differences in thesesubgroups' associations were tested using the Wald statistic ofthe cross-product term between continuous sex hormones andstratification variables in the fully adjusted linear mixed-effectsmodel.
Analyses were conducted with SAS version 9.3 and STATAversion 13.0. All P values were two sided and consideredsignificant if <0.05.
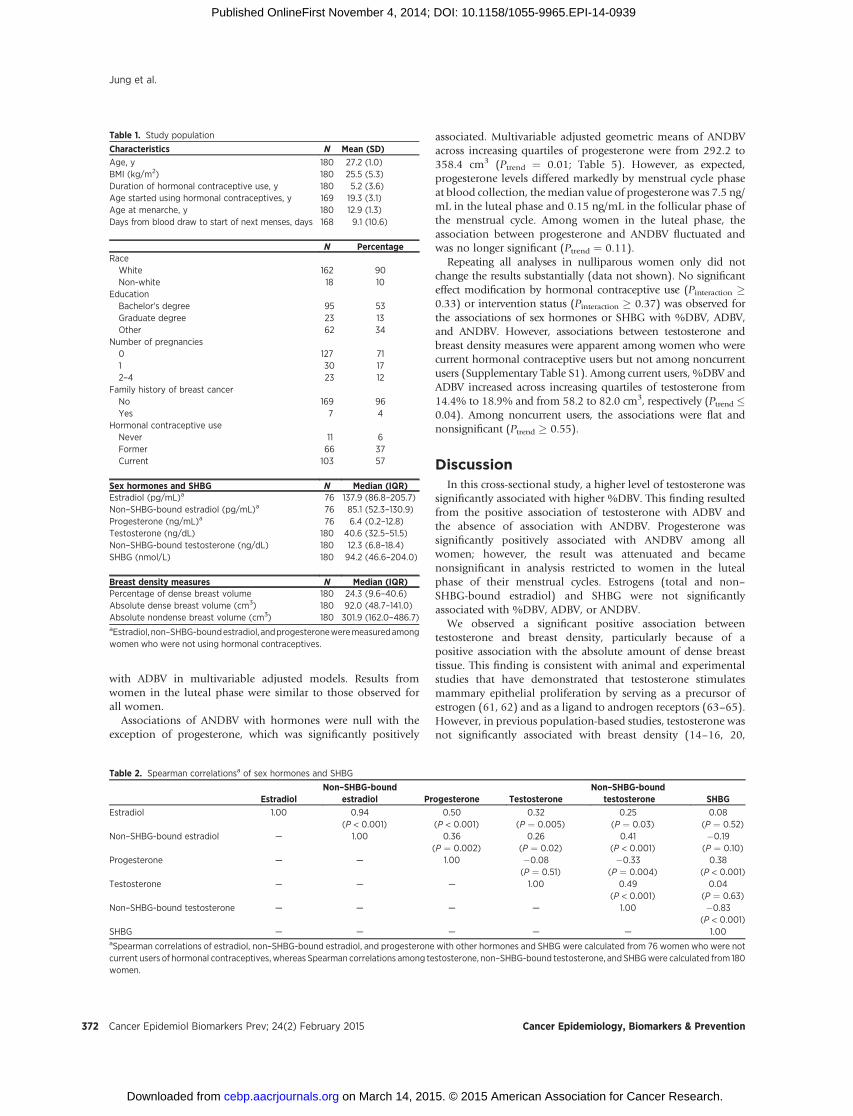
ResultsThis study included 180 young women with a mean age of
27 years (range 25–29 years; Table 1). Their mean BMI was25.5 kg/m2. The majority of women were white (90%), had acollege degree (66%), and had no family history of breast cancer(96%). Seventy-one percent of womenwere nulliparous. Few hadnever used hormonal contraceptives, 37% were past users, and57%were current users. Themedian and interquartile range (IQR)of breast density measures were 24.3% (9.6%–40.6%) for%DBV,92.0 cm3 (48.7–141.0 cm3) for ADBV, and 301.9 cm3 (162.0–486.7 cm3) for ANDBV.
Endogenous sex hormones and SHBG were correlated(Table 2). Estrogens (estradiol and non–SHBG-boundestradiol) were positively correlated with progesterone andandrogens (testosterone and non–SHBG-bound testosterone;r � 0.25; P � 0.03). Progesterone was positively correlated withSHBG (r ¼ 0.38; P < 0.001) and inversely correlated with non–SHBG-bound testosterone (r ¼ �0.33; P ¼ 0.004).
Associations of endogenous sex hormone levels and SHBGwith%DBVare shown inTable 3. In theunadjustedmodel,%DBVwas significantly positively associated with estradiol and SHBG,whereas non–SHBG-bound testosterone was inversely associatedwith %DBV. However, in multivariable models, particularly afteradjustment for BMI, these associations were substantiallyattenuated and no longer significant. Only testosterone wassignificantly positively associated with %DBV in multivariableadjusted models; geometric mean (95% CI) for %DBV increasedfrom16.5% (12.9%–21.1%) in the lowest testosterone quartile to20.3% (14.9%–27.6%) in the highest quartile (Ptrend ¼ 0.03).Restricting analyses to women in the luteal phase of theirmenstrual cycle did not alter results materially.
Similar to the results from %DBV, ADBV was significantlypositively associated with testosterone (Table 4). The multi-variable geometric mean of ADBV across increasing quartiles oftestosterone increased from 68.6 to 82.3 cm3 (Ptrend ¼ 0.001).None of the other sex hormones or SHBG was associated
Endogenous Sex Hormones and Breast Density
www.aacrjournals.org Cancer Epidemiol Biomarkers Prev; 24(2) February 2015 371
on March 14, 2015. © 2015 American Association for Cancer Research. cebp.aacrjournals.org Downloaded from
Published OnlineFirst November 4, 2014; DOI: 10.1158/1055-9965.EPI-14-0939
with ADBV in multivariable adjusted models. Results fromwomen in the luteal phase were similar to those observed forall women.
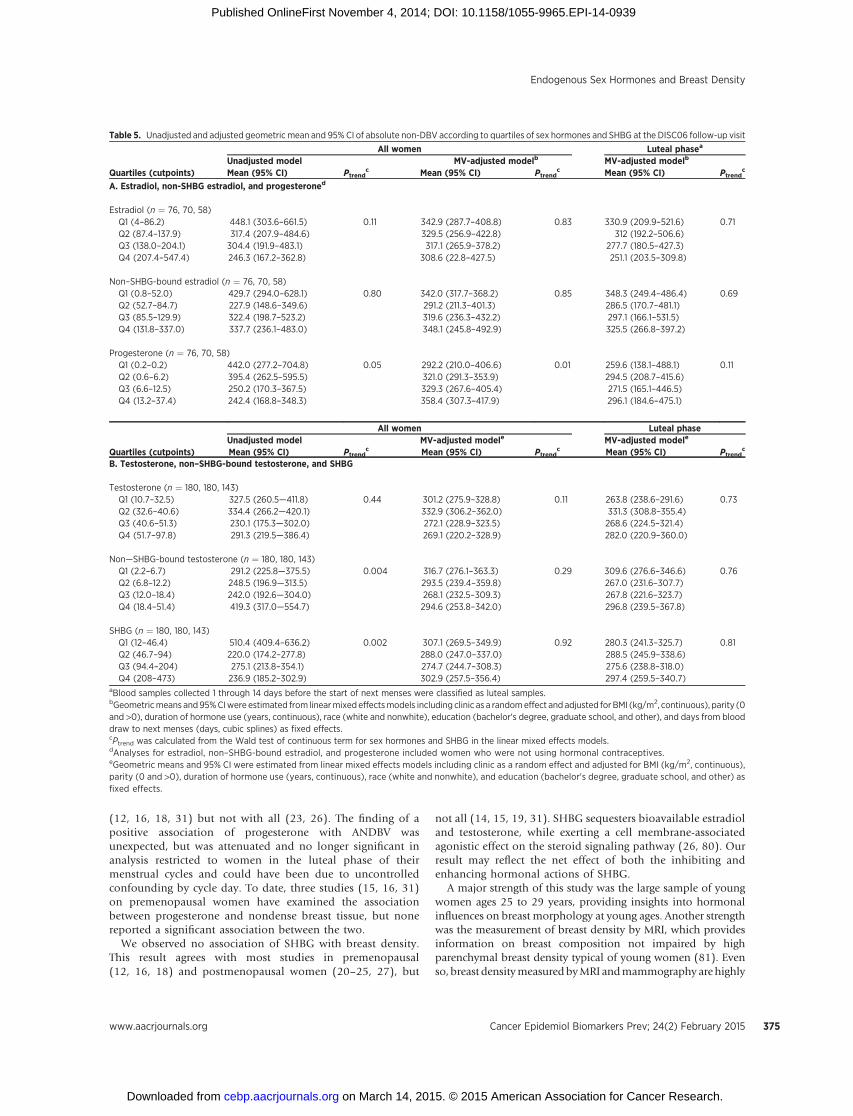
Associations of ANDBV with hormones were null with theexception of progesterone, which was significantly positively
associated. Multivariable adjusted geometric means of ANDBVacross increasing quartiles of progesterone were from 292.2 to358.4 cm3 (Ptrend ¼ 0.01; Table 5). However, as expected,progesterone levels differed markedly by menstrual cycle phaseat blood collection, themedian value of progesterone was 7.5 ng/mL in the luteal phase and 0.15 ng/mL in the follicular phase ofthe menstrual cycle. Among women in the luteal phase, theassociation between progesterone and ANDBV fluctuated andwas no longer significant (Ptrend ¼ 0.11).
Repeating all analyses in nulliparous women only did notchange the results substantially (data not shown). No significanteffect modification by hormonal contraceptive use (Pinteraction �0.33) or intervention status (Pinteraction � 0.37) was observed forthe associations of sex hormones or SHBG with %DBV, ADBV,and ANDBV. However, associations between testosterone andbreast density measures were apparent among women who werecurrent hormonal contraceptive users but not among noncurrentusers (Supplementary Table S1). Among current users, %DBV andADBV increased across increasing quartiles of testosterone from14.4% to 18.9% and from 58.2 to 82.0 cm3, respectively (Ptrend �0.04). Among noncurrent users, the associations were flat andnonsignificant (Ptrend � 0.55).
DiscussionIn this cross-sectional study, a higher level of testosterone was
significantly associated with higher %DBV. This finding resultedfrom the positive association of testosterone with ADBV andthe absence of association with ANDBV. Progesterone wassignificantly positively associated with ANDBV among allwomen; however, the result was attenuated and becamenonsignificant in analysis restricted to women in the lutealphase of their menstrual cycles. Estrogens (total and non–SHBG-bound estradiol) and SHBG were not significantlyassociated with %DBV, ADBV, or ANDBV.
We observed a significant positive association betweentestosterone and breast density, particularly because of apositive association with the absolute amount of dense breasttissue. This finding is consistent with animal and experimentalstudies that have demonstrated that testosterone stimulatesmammary epithelial proliferation by serving as a precursor ofestrogen (61, 62) and as a ligand to androgen receptors (63–65).However, in previous population-based studies, testosterone wasnot significantly associated with breast density (14–16, 20,
Table 1. Study population
Characteristics N Mean (SD)
Age, y 180 27.2 (1.0)BMI (kg/m2) 180 25.5 (5.3)Duration of hormonal contraceptive use, y 180 5.2 (3.6)Age started using hormonal contraceptives, y 169 19.3 (3.1)Age at menarche, y 180 12.9 (1.3)Days from blood draw to start of next menses, days 168 9.1 (10.6)
N PercentageRaceWhite 162 90Non-white 18 10
EducationBachelor's degree 95 53Graduate degree 23 13Other 62 34
Number of pregnancies0 127 711 30 172–4 23 12
Family history of breast cancerNo 169 96Yes 7 4
Hormonal contraceptive useNever 11 6Former 66 37Current 103 57
Sex hormones and SHBG N Median (IQR)Estradiol (pg/mL)a 76 137.9 (86.8–205.7)Non–SHBG-bound estradiol (pg/mL)a 76 85.1 (52.3–130.9)Progesterone (ng/mL)a 76 6.4 (0.2–12.8)Testosterone (ng/dL) 180 40.6 (32.5–51.5)Non–SHBG-bound testosterone (ng/dL) 180 12.3 (6.8–18.4)SHBG (nmol/L) 180 94.2 (46.6–204.0)
Breast density measures N Median (IQR)Percentage of dense breast volume 180 24.3 (9.6–40.6)Absolute dense breast volume (cm3) 180 92.0 (48.7–141.0)Absolute nondense breast volume (cm3) 180 301.9 (162.0–486.7)aEstradiol, non–SHBG-boundestradiol, andprogesteroneweremeasuredamongwomen who were not using hormonal contraceptives.
Table 2. Spearman correlationsa of sex hormones and SHBG
EstradiolNon–SHBG-bound
estradiol Progesterone TestosteroneNon–SHBG-bound
testosterone SHBG
Estradiol 1.00 0.94(P < 0.001)
0.50(P < 0.001)
0.32(P ¼ 0.005)
0.25(P ¼ 0.03)
0.08(P ¼ 0.52)
Non–SHBG-bound estradiol — 1.00 0.36(P ¼ 0.002)
0.26(P ¼ 0.02)
0.41(P < 0.001)
�0.19(P ¼ 0.10)
Progesterone — — 1.00 �0.08(P ¼ 0.51)
�0.33(P ¼ 0.004)
0.38(P < 0.001)
Testosterone — — — 1.00 0.49(P < 0.001)
0.04(P ¼ 0.63)
Non–SHBG-bound testosterone — — — — 1.00 �0.83(P < 0.001)
SHBG — — — — — 1.00aSpearman correlations of estradiol, non–SHBG-bound estradiol, and progesterone with other hormones and SHBG were calculated from 76 women who were notcurrent users of hormonal contraceptives, whereas Spearman correlations among testosterone, non–SHBG-bound testosterone, and SHBGwere calculated from 180women.
Jung et al.
Cancer Epidemiol Biomarkers Prev; 24(2) February 2015 Cancer Epidemiology, Biomarkers & Prevention372
on March 14, 2015. © 2015 American Association for Cancer Research. cebp.aacrjournals.org Downloaded from
Published OnlineFirst November 4, 2014; DOI: 10.1158/1055-9965.EPI-14-0939

22–24, 26, 28, 31, 66) or absolute amount of dense breast tissue(15, 16, 19, 22, 24, 31, 66) in either premenopausal (14–16, 31)or postmenopausal women (20, 22–24, 26, 28, 66).
Several potential explanations can account for the inconsis-tency between our findings and those of other studies. First,previous studies were mostly conducted among middle aged toolder women, whereas our study was conducted in youngerwomen. With aging, women's breasts undergo lobular involu-tion, which replaces epithelium initially with stroma and sub-sequently with fat (67, 68) resulting in decreased breast density(69, 70). The tempo and degree of lobular involution variesconsiderably among women, but the frequency and extent of
involution increases with aging (68). Consequently, the contri-bution of age-related lobular involution to breast density isconsiderably greater in previous studies of older women than inour study of younger women and could, in part, contribute todifferent hormonal associations (71). Second, the majority ofprevious studies measured testosterone using direct RIAs (14,16, 19, 20, 22, 23, 28, 31), electrochemiluminescence immuno-assays (18) or enzyme immunoassays (15), whereas wemeasuredtestosteronebyRIA following solvent extractionandCelite columnpartition chromatography, which improves assay accuracy andprecision (72). Third, previous studies excluded current hormonalcontraceptive users, whereas in our study slightly over half of
Table 3. Unadjusted and adjusted geometric mean and 95% CI of %DBV according to quartiles of sex hormones and SHBG at the DISC06 follow-up visit
All women Luteal phasea
Unadjusted model MV-adjusted modelb MV-adjusted modelb
Quartiles (cutpoints) Mean (95% CI) Ptrendc Mean (95% CI) Ptrend
c Mean (95% CI) Ptrendc
A. Estradiol, non-SHBG estradiol, and progesteroned
Estradiol (n ¼ 76, 70, 58)Q1 (4–86.2) 12.1 (7.3–20.2) 0.02 18 (14.3–22.7) 0.78 22.6 (9.2–55.3) 0.82Q2 (87.4–137.9) 16.2 (10.1–25.9) 16.3 (13.1–20.3) 18.8 (10.6–33.4)Q3 (138.0–204.1) 16.2 (9.6–27.2) 17.3 (13.5–22.3) 20.8 (7.4–58.5)Q4 (207.4–547.4) 26.3 (18.5–37.6) 19.3 (12.8–29.0) 22.2 (8.1–61.4)
Non–SHBG-bound estradiol (n ¼ 76, 70, 58)Q1 (0.8–52.0) 12.1 (7.3–20.2) 0.32 17.1 (11.9–24.6) 0.82 18.9 (6.0–59.8) 0.46Q2 (52.7–84.7) 22.2 (14.4–34.4) 18.7 (12.7–27.4) 19.6 (10.8–35.6)Q3 (85.5–129.9) 16.6 (9.7–28.1) 18.7 (13.1–26.8) 20.2 (6.4–63.4)Q4 (131.8–337.0) 18.7 (12.4–28.3) 16.3 (10.0–26.4) 16.6 (5.8–47.7)
Progesterone (n ¼ 76, 70, 58)Q1 (0.2–0.2) 12.3 (7.2–21.1) 0.10 20.3 (14.0–29.6) 0.48 22.8 (10.5–49.6) 0.08Q2 (0.6–6.2) 13.4 (8.0–22.5) 16 (10.6–24.1) 19.2 (10.1–36.3)Q3 (6.6–12.5) 21.8 (14.3–33.4) 17.5 (12.7–24.3) 19.2 (9.0–41.3)Q4 (13.2–37.4) 23.2 (16.1–33.6) 17.1 (13.8–21.0) 18.7 (8.8–39.8)
All women Luteal phaseUnadjusted model MV-adjusted modele MV-adjusted modele
Quartiles (cutpoints) Mean (95% CI) Ptrendc Mean (95% CI) Ptrend
c Mean (95% CI) Ptrendc
B. Testosterone, non–SHBG-bound testosterone, and SHBG
Testosterone (n ¼ 180, 180, 143)Q1 (10.7–32.5) 15 (11.1–20.4) 0.19 16.5 (12.9–21.1) 0.03 18.1 (13.2–24.8) 0.06Q2 (32.6–40.6) 16.4 (11.8–22.6) 16.6 (11.6–23.7) 15.9 (11.2–22.7)Q3 (40.6–51.3) 24.6 (18.8–32.1) 21.1 (19.1–23.4) 22.8 (19.7–26.4)Q4 (51.7–97.8) 19.4 (14.3–26.3) 20.3 (14.9–27.6) 21.9 (16.7–28.7)
Non–SHBG-bound testosterone (n ¼ 180, 180, 143)Q1 (2.2–6.7) 20.9 (16.0–27.3) 0.01 18.9 (16.7–21.3) 0.86 18.8 (16.2–21.8) 0.60Q2 (6.8–12.2) 22.4 (17.7–28.3) 19.1 (16.5–22.1) 18.8 (14.8–24.0)Q3 (12.0–18.4) 19 (13.8–26.1) 17.6 (13.3–23.4) 20.0 (16.4–24.3)Q4 (18.4–51.4) 13.2 (9.2–19.0) 18.4 (12.6–27.0) 20.5 (14.7–28.6)
SHBG (n ¼ 180, 180, 143)Q1 (12–46.4) 9.1 (6.5–12.8) <0.001 14.7 (9.6–22.3) 0.43 16.4 (11.0–24.4) 0.74Q2 (46.7–94) 26 (20.1–33.6) 20.4 (17.2–24.2) 21.4 (18.6–24.7)Q3 (94.4–204) 20 (15.2–26.1) 20.2 (16.2–25.2) 20.9 (16.1–27.1)Q4 (208–473) 24.9 (19.6–31.7) 19.3 (16.9–22.1) 19.2 (16.3–22.7)
aBlood samples collected 1 through 14 days before the start of next menses were classified as luteal samples.bGeometricmeans and95%CIwere estimated from linearmixed effectsmodels including clinic as a randomeffect and adjusted for BMI (kg/m2, continuous), parity (0and >0), duration of hormone use (years, continuous), race (white and nonwhite), education (bachelor's degree, graduate school, and other), and days from blooddraw to next menses (days, cubic splines) as fixed effects.cPtrend was calculated from the Wald test of continuous term for sex hormones and SHBG in the linear mixed effects models.dAnalyses for estradiol, non–SHBG-bound estradiol, and progesterone included women who were not using hormonal contraceptives.eGeometric means and 95% CI were estimated from linear mixed effects models including clinic as a random effect and adjusted for BMI (kg/m2, continuous),parity (0 and >0), duration of hormone use (years, continuous), race (white and nonwhite), and education (bachelor's degree, graduate school, and other)as fixed effects.
Endogenous Sex Hormones and Breast Density
www.aacrjournals.org Cancer Epidemiol Biomarkers Prev; 24(2) February 2015 373
on March 14, 2015. © 2015 American Association for Cancer Research. cebp.aacrjournals.org Downloaded from
Published OnlineFirst November 4, 2014; DOI: 10.1158/1055-9965.EPI-14-0939

participants were currently using hormonal contraceptives. In ourdata, a positive association of testosterone with breast densitywas consistently observed among current hormone users, but notamong past and never users. The altered steroid environmentof hormonal contraceptive users (73–75) could potentiallymodify responsiveness of the breast to testosterone (76, 77).Even so, test for interaction between hormonal contraceptiveuse and testosterone in relation to breast density was notsignificant, and this may be a chance finding.
Despite strong support for the proliferative and growth-promoting effects of estrogens on mammary epithelial cellsfrom animal and experimental studies (78, 79), previous
studies on the associations between estrogens and breastdensity showed largely null or inconsistent results. Similarto our results, six (12, 14–16, 18, 31) of seven studies(12–16, 18, 31) in premenopausal women reported nosignificant association between estrogens and breast density.Only one small study (n ¼ 24) in premenopausal women (13)found a significant positive association of estradiol with breastdensity. The large fluctuations in estrogen concentration overthe menstrual cycle challenge its characterization by a singlemeasurement, potentially attenuating associations.
The lack of association of progesterone with %DBV orADBV in our study is consistent with several prior studies
Table 4. Unadjusted and adjusted geometric mean and 95% CI of absolute DBV according to quartiles of sex hormones and SHBG at the DISC06 follow-up visit
All women Luteal phasea
Unadjusted model MV-adjusted modelb MV-adjusted modelb
Quartiles (cutpoints) Mean (95% CI) Ptrendc Mean (95% CI) Ptrend
c Mean (95% CI) Ptrendc
A. Estradiol, non-SHBG estradiol, and progesteroned
Estradiol (n ¼ 76, 70, 58)Q1 (4–86.2) 68.9 (46.4–102.4) 0.17 87.5 (59.2–120.2) 0.91 112.9 (48.9–260.3) 0.46Q2 (87.4–137.9) 71.9 (50.4–102.4) 76.2 (65.2–89.0) 85.0 (51.2–141.2)Q3 (138.0–204.1) 72.0 (51.0–101.7) 81.2 (65.0–101.5) 89.7 (34.8–231.5)Q4 (207.4–547.4) 100.2 (76.8–130.8) 82.4 (59.5–114.1) 79.3 (29.4–213.9)
Non–SHBG-bound estradiol (n ¼ 76, 70, 58)Q1 (0.8–52.0) 66 (43.7–99.6) 0.30 81.2 (49.8–132.5) 0.93 95.0 (30.7–293.7) 0.30Q2 (52.7–84.7) 79.1 (58.3–107.4) 80.6 (54.3–119.6) 82.5 (48.1–141.7)Q3 (85.5–129.9) 78.1 (55.7–109.5) 90.2 (65.6–124.1) 94.8 (34.2–252.6)Q4 (131.8–337.0) 87.7 (63.3–121.4) 74.6 (48.1–115.8) 69.6 (23.6–205.9)
Progesterone (n ¼ 76, 70, 58)Q1 (0.2–0.2) 73.3 (51.0–105.3) 0.60 92.8 (75.6–113.9) 0.92 98.0 (44.7–214.6) 0.31Q2 (0.6–6.2) 68.3 (45.7–102.0) 69.5 (44.3–108.9) 80.5 (44.7–130.1)Q3 (6.6–12.5) 81.6 (61.3–108.5) 80.1 (59.5–107.8) 75.7 (44.1–130.1)Q4 (13.2–37.4) 87.2 (62.3–122.1) 84.8 (70.1–102.7) 80.1 (40.2–159.7)
All women Luteal phaseUnadjusted model MV-adjusted modele MV-adjusted modele
Quartiles (cutpoints) Mean (95% CI) Ptrendc Mean (95% CI) Ptrend
c Mean (95% CI) Ptrendc
B. Testosterone, non–SHBG-bound testosterone, and SHBG
Testosterone (n ¼ 180, 180, 143)Q1 (10.7–32.5) 65.6 (49.9–86.2) 0.12 68.6 (53.7–87.7) 0.001 68.7 (50.5–93.4) 0.03Q2 (32.6–40.6) 75.2 (56.3–100.4) 75.6 (47.8–119.5) 71.8 (44.2–116.6)Q3 (40.6–51.3) 91.6 (75.0–111.8) 89.4 (75.8–105.4) 98.8 (80.2–121.8)Q4 (51.7–97.8) 84.4 (66.9–106.5) 82.3 (66.0–102.5) 94.1 (76.4–115.9)
Non–SHBG-bound testosterone (n ¼ 180, 180, 143)Q1 (2.2–6.7) 89.8 (72.6–111.1) 0.35 85.8 (75.5–97.5) 0.84 82.3 (67.8–99.8) 0.19Q2 (6.8–12.2) 82.1 (65.9–102.4) 80.1 (72.4–88.7) 73.4 (60.1–89.5)Q3 (12.0–18.4) 68 (50.3–91.9) 67.6 (48.9–93.6) 80.9 (67.6–97.0)Q4 (18.4–51.4) 76.1 (58.5–98.9) 82.0 (57.4–117.2) 95.2 (68.2–133.0)
SHBG (n ¼ 180, 180, 143)Q1 (12–46.4) 55.8 (41.3–75.4) 0.009 62.1 (42.0–91.9) 0.27 67.0 (45.6–98.6) 0.63Q2 (46.7–94) 92.9 (75.0–115.1) 88.5 (71.2–109.8) 94.8 (75.2–119.5)Q3 (94.4–204) 79.3 (62.0–101.3) 80.9 (67.6–96.8) 85.1 (68.9–105.2)Q4 (208–473) 93.1 (75.3–115.1) 85.8 (70.5–104.5) 83.2 (67.5–102.5)
aBlood samples collected 1 through 14 days before the start of next menses were classified as luteal samples.bGeometricmeans and95%CIwere estimated from linearmixed effectsmodels including clinic as a randomeffect and adjusted for BMI (kg/m2, continuous), parity (0and >0), duration of hormone use (years, continuous), race (white and nonwhite), education (bachelor's degree, graduate school, and other), and days from blooddraw to next menses (days, cubic splines) as fixed effects.cPtrend was calculated from the Wald test of continuous term for sex hormones and SHBG in the linear mixed effects models.dAnalyses for estradiol, non–SHBG-bound estradiol, and progesterone included women who were not using hormonal contraceptives.eGeometric means and 95% CI were estimated from linear mixed effects models including clinic as a random effect and adjusted for BMI (kg/m2, continuous),parity (0 and >0), duration of hormone use (years, continuous), race (white and nonwhite), and education (bachelor's degree, graduate school, and other) asfixed effects.
Jung et al.
Cancer Epidemiol Biomarkers Prev; 24(2) February 2015 Cancer Epidemiology, Biomarkers & Prevention374
on March 14, 2015. © 2015 American Association for Cancer Research. cebp.aacrjournals.org Downloaded from
Published OnlineFirst November 4, 2014; DOI: 10.1158/1055-9965.EPI-14-0939
(12, 16, 18, 31) but not with all (23, 26). The finding of apositive association of progesterone with ANDBV wasunexpected, but was attenuated and no longer significant inanalysis restricted to women in the luteal phase of theirmenstrual cycles and could have been due to uncontrolledconfounding by cycle day. To date, three studies (15, 16, 31)on premenopausal women have examined the associationbetween progesterone and nondense breast tissue, but nonereported a significant association between the two.
We observed no association of SHBG with breast density.This result agrees with most studies in premenopausal(12, 16, 18) and postmenopausal women (20–25, 27), but
not all (14, 15, 19, 31). SHBG sequesters bioavailable estradioland testosterone, while exerting a cell membrane-associatedagonistic effect on the steroid signaling pathway (26, 80). Ourresult may reflect the net effect of both the inhibiting andenhancing hormonal actions of SHBG.
A major strength of this study was the large sample of youngwomen ages 25 to 29 years, providing insights into hormonalinfluences on breast morphology at young ages. Another strengthwas the measurement of breast density by MRI, which providesinformation on breast composition not impaired by highparenchymal breast density typical of young women (81). Evenso, breast densitymeasuredbyMRI andmammography arehighly
Table 5. Unadjusted and adjusted geometric mean and 95% CI of absolute non-DBV according to quartiles of sex hormones and SHBG at the DISC06 follow-up visit
All women Luteal phasea
Unadjusted model MV-adjusted modelb MV-adjusted modelb
Quartiles (cutpoints) Mean (95% CI) Ptrendc Mean (95% CI) Ptrend
c Mean (95% CI) Ptrendc
A. Estradiol, non-SHBG estradiol, and progesteroned
Estradiol (n ¼ 76, 70, 58)Q1 (4–86.2) 448.1 (303.6–661.5) 0.11 342.9 (287.7–408.8) 0.83 330.9 (209.9–521.6) 0.71Q2 (87.4–137.9) 317.4 (207.9–484.6) 329.5 (256.9–422.8) 312 (192.2–506.6)Q3 (138.0–204.1) 304.4 (191.9–483.1) 317.1 (265.9–378.2) 277.7 (180.5–427.3)Q4 (207.4–547.4) 246.3 (167.2–362.8) 308.6 (22.8–427.5) 251.1 (203.5–309.8)
Non–SHBG-bound estradiol (n ¼ 76, 70, 58)Q1 (0.8–52.0) 429.7 (294.0–628.1) 0.80 342.0 (317.7–368.2) 0.85 348.3 (249.4–486.4) 0.69Q2 (52.7–84.7) 227.9 (148.6–349.6) 291.2 (211.3–401.3) 286.5 (170.7–481.1)Q3 (85.5–129.9) 322.4 (198.7–523.2) 319.6 (236.3–432.2) 297.1 (166.1–531.5)Q4 (131.8–337.0) 337.7 (236.1–483.0) 348.1 (245.8–492.9) 325.5 (266.8–397.2)
Progesterone (n ¼ 76, 70, 58)Q1 (0.2–0.2) 442.0 (277.2–704.8) 0.05 292.2 (210.0–406.6) 0.01 259.6 (138.1–488.1) 0.11Q2 (0.6–6.2) 395.4 (262.5–595.5) 321.0 (291.3–353.9) 294.5 (208.7–415.6)Q3 (6.6–12.5) 250.2 (170.3–367.5) 329.3 (267.6–405.4) 271.5 (165.1–446.5)Q4 (13.2–37.4) 242.4 (168.8–348.3) 358.4 (307.3–417.9) 296.1 (184.6–475.1)
All women Luteal phaseUnadjusted model MV-adjusted modele MV-adjusted modele
Quartiles (cutpoints) Mean (95% CI) Ptrendc Mean (95% CI) Ptrend
c Mean (95% CI) Ptrendc
B. Testosterone, non–SHBG-bound testosterone, and SHBG
Testosterone (n ¼ 180, 180, 143)Q1 (10.7–32.5) 327.5 (260.5—411.8) 0.44 301.2 (275.9–328.8) 0.11 263.8 (238.6–291.6) 0.73Q2 (32.6–40.6) 334.4 (266.2—420.1) 332.9 (306.2–362.0) 331.3 (308.8–355.4)Q3 (40.6–51.3) 230.1 (175.3—302.0) 272.1 (228.9–323.5) 268.6 (224.5–321.4)Q4 (51.7–97.8) 291.3 (219.5—386.4) 269.1 (220.2–328.9) 282.0 (220.9–360.0)
Non—SHBG-bound testosterone (n ¼ 180, 180, 143)Q1 (2.2–6.7) 291.2 (225.8—375.5) 0.004 316.7 (276.1–363.3) 0.29 309.6 (276.6–346.6) 0.76Q2 (6.8–12.2) 248.5 (196.9—313.5) 293.5 (239.4–359.8) 267.0 (231.6–307.7)Q3 (12.0–18.4) 242.0 (192.6—304.0) 268.1 (232.5–309.3) 267.8 (221.6–323.7)Q4 (18.4–51.4) 419.3 (317.0—554.7) 294.6 (253.8–342.0) 296.8 (239.5–367.8)
SHBG (n ¼ 180, 180, 143)Q1 (12–46.4) 510.4 (409.4–636.2) 0.002 307.1 (269.5–349.9) 0.92 280.3 (241.3–325.7) 0.81Q2 (46.7–94) 220.0 (174.2–277.8) 288.0 (247.0–337.0) 288.5 (245.9–338.6)Q3 (94.4–204) 275.1 (213.8–354.1) 274.7 (244.7–308.3) 275.6 (238.8–318.0)Q4 (208–473) 236.9 (185.2–302.9) 302.9 (257.5–356.4) 297.4 (259.5–340.7)
aBlood samples collected 1 through 14 days before the start of next menses were classified as luteal samples.bGeometricmeans and95%CIwere estimated from linearmixed effectsmodels including clinic as a randomeffect and adjusted for BMI (kg/m2, continuous), parity (0and >0), duration of hormone use (years, continuous), race (white and nonwhite), education (bachelor's degree, graduate school, and other), and days from blooddraw to next menses (days, cubic splines) as fixed effects.cPtrend was calculated from the Wald test of continuous term for sex hormones and SHBG in the linear mixed effects models.dAnalyses for estradiol, non–SHBG-bound estradiol, and progesterone included women who were not using hormonal contraceptives.eGeometric means and 95% CI were estimated from linear mixed effects models including clinic as a random effect and adjusted for BMI (kg/m2, continuous),parity (0 and >0), duration of hormone use (years, continuous), race (white and nonwhite), and education (bachelor's degree, graduate school, and other) asfixed effects.
Endogenous Sex Hormones and Breast Density
www.aacrjournals.org Cancer Epidemiol Biomarkers Prev; 24(2) February 2015 375
on March 14, 2015. © 2015 American Association for Cancer Research. cebp.aacrjournals.org Downloaded from
Published OnlineFirst November 4, 2014; DOI: 10.1158/1055-9965.EPI-14-0939
correlated (r > 0.75; refs. 82, 83) and high breast density, whetherassessed by a volumetric method or by mammography, issimilarly positively associated with breast cancer risk (2, 84).Additional strengths included using highly sensitive andspecific RIAs that included extraction and chromatographicseparation to measure sex hormones (72), and collectingblood samples on the same day that the breast was imaged byMRI.
Our study also has several limitations. Blood collectionwas nottimed to themenstrual cycle. Nonetheless, 79%of blood sampleswere collected during the luteal phase of the menstrual cycle andwe adjusted for days until start of nextmenses in themultivariablemodel; restricting analyses to the samples collected during theluteal phase did not substantially change the results except forprogesterone. Single hormone measurements may not preciselyrepresent long-term hormone levels. However, measurements ofsex hormones were reported to be reproducible from bloodsamples collected from premenopausal women over 2 to 3years (85). Circulating levels of hormones do not take intoaccount peripheral conversions of hormones in breast tissue,which could attenuate associations between hormones andbreast density measures.
Another limitation is that breast density measures andhormone levels were not collected from all DISC06 parti-cipants. Nonetheless, the distribution of lifestyle characteristicsamong our study participants was similar to that of all DISC06participants (33, 39). Participants had elevated LDL-C and wereslightly heavier than the general population when they wererandomized in the DISC as children (36, 37). However, atthe time of DISC06 visit, only 8% of the study participants hadelevated LDL-C, and the prevalence of overweight in our analyses(44%) was similar to the U.S. average for women in twenties(45.6%; ref. 86). Although the study participants were random-ized to a diet intervention or usual care control group, inter-vention assignmenthadno long-termeffect onbreast density (34)and did not modify associations of sex hormones with breastdensity measures. Although data was obtained at different sites,all our data were collected using standardized procedures toensure data integrity. The power to detect association mighthave been limited due to small sample size. We cannot ruleout residual confounding.
In conclusion, we observed that testosterone was modestlypositively associated with %DBV particularly among hormonalcontraceptive users, and this association appeared to be driven bya positive association with ADBV. Our finding adds to the limitedliterature on hormonal influences on breast density in youngerwomen. Further research iswarranted to confirm and extend thesefindings.
Disclosure of Potential Conflicts of InterestF.Z. Stanczyk is a consultant/advisory board member for Merck and Agile
Therapeutics. No potential conflicts of interest were disclosed by the otherauthors.
Authors' ContributionsConception and design: V.J. Stevens, L. Van Horn, J.F. DorganDevelopment of methodology: J.F. DorganAcquisition of data (provided animals, acquired and managed patients,provided facilities, etc.): F.Z. Stanczyk, L.G. Snetselaar, V.J. Stevens, J.A.Shepherd, L. Van Horn, C. KlifaAnalysis and interpretation of data (e.g., statistical analysis, biostatistics,computational analysis): S. Jung, F.Z. Stanczyk, B.L. Egleston, J.A. Shepherd,C. Klifa, J.F. DorganWriting, review, and/or revision of the manuscript: S. Jung, F.Z. Stanczyk,B.L. Egleston, L.G. Snetselaar, V.J. Stevens, J.A. Shepherd, L. Van Horn, E.S.LeBlanc, K. Paris, C. Klifa, J.F. DorganAdministrative, technical, or material support (i.e., reporting or organizingdata, constructing databases): L.G. Snetselaar, V.J. StevensStudy supervision: L. Van Horn, J.F. Dorgan
AcknowledgmentsThe authors thank all participants in the DISC06 study and collaborators for
their invaluable contributions.Clinical Trials Registration; ClinicalTrials.gov identifier: NCT00458588.
Grant SupportThisworkwas supported byNIHgrants (R03CA167764 andR01CA104670;
to J.F. Dorgan).The costs of publication of this articlewere defrayed inpart by the payment of
page charges. This article must therefore be hereby marked advertisement inaccordance with 18 U.S.C. Section 1734 solely to indicate this fact.
Received August 12, 2014; revised October 16, 2014; accepted October 17,2014; published OnlineFirst November 4, 2014.
References1. BoydNF,Martin LJ, YaffeMJ,Minkin S.Mammographic density and breast
cancer risk: current understanding and future prospects. Breast Cancer Res2011;13:223.
2. McCormack VA, dos Santos Silva I. Breast density and parenchymalpatterns asmarkers of breast cancer risk: ameta-analysis. Cancer EpidemiolBiomarkers Prev 2006;15:1159–69.
3. Vachon CM, Kuni CC, Anderson K, Anderson VE, Sellers TA. Association ofmammographically defined percent breast density with epidemiologic riskfactors for breast cancer (United States). Cancer Causes Control 2000;11:653–62.
4. McTiernan A, Martin CF, Peck JD, Aragaki AK, Chlebowski RT, Pisano ED,et al. Estrogen-plus-progestin use andmammographic density in postmen-opausal women:Women'sHealth Initiative randomized trial. J Natl CancerInst 2005;97:1366–76.
5. Greendale GA, Reboussin BA, Slone S, Wasilauskas C, Pike MC, Ursin G.Postmenopausal hormone therapy and change inmammographic density.J Natl Cancer Inst 2003;95:30–7.
6. Petrakis NL, Wrensch MR, Ernster VL, Miike R, Murai J, Simberg N,et al. Influence of pregnancy and lactation on serum and breast fluid
estrogen levels: implications for breast cancer risk. Int J Cancer 1987;40:587–91.
7. Bernstein L, Lipworth L, Ross RK, Trichopoulos D. Correlation ofestrogen levels between successive pregnancies. Am J Epidemiol 1995;142:625–8.
8. Burger HG, Hale GE, Robertson DM, Dennerstein L. A review of hormonalchanges during the menopausal transition: focus on findings from theMelbourne Women's Midlife Health Project. Hum Reprod Update 2007;13:559–65.
9. Chavez-MacGregor M, van Gils CH, van der Schouw YT, Monninkhof E,vanNoord PA, Peeters PH. Lifetime cumulative number ofmenstrual cyclesand serum sex hormone levels in postmenopausal women. Breast CancerRes Treat 2008;108:101–12.
10. Snedeker SM, Diaugustine RP. Hormonal and environmental factorsaffecting cell proliferation and neoplasia in the mammary gland. ProgClin Biol Res 1996;394:211–53.
11. Martin LJ, Boyd NF. Mammographic density. Potential mechanisms ofbreast cancer risk associated with mammographic density: hypothesesbased on epidemiological evidence. Breast Cancer Res 2008;10:201.
Jung et al.
Cancer Epidemiol Biomarkers Prev; 24(2) February 2015 Cancer Epidemiology, Biomarkers & Prevention376
on March 14, 2015. © 2015 American Association for Cancer Research. cebp.aacrjournals.org Downloaded from
Published OnlineFirst November 4, 2014; DOI: 10.1158/1055-9965.EPI-14-0939
12. Noh JJ, Maskarinec G, Pagano I, Cheung LW, Stanczyk FZ. Mammographicdensities and circulating hormones: a cross-sectional study in premeno-pausal women. Breast 2006;15:20–8.
13. Chen JH, Chen WP, Chan S, Yeh DC, Su MY, McLaren CE. Correlation ofendogenous hormonal levels, fibroglandular tissue volume and percentdensity measured using 3D MRI during one menstrual cycle. Ann Oncol2013;24:2329–35.
14. Yong M, Atkinson C, Newton KM, Aiello Bowles EJ, Stanczyk FZ, Wester-lind KC, et al. Associations between endogenous sex hormone levels andmammographic and bone densities in premenopausal women. CancerCauses Control 2009;20:1039–53.
15. Borugian MJ, Spinelli JJ, Gordon PB, Abanto Z, Brooks-Wilson A, PollakMN, et al. Fasting insulin and endogenous hormones in relation topremenopausal breast density (Canada). Cancer Causes Control 2014;25:385–94.
16. Walker K, Fletcher O, Johnson N, Coupland B, McCormack VA, Folkerd E,et al. Premenopausal mammographic density in relation to cyclic varia-tions in endogenous sex hormone levels, prolactin, and insulin-like growthfactors. Cancer Res 2009;69:6490–9.
17. Meyer F, Brisson J, Morrison AS, Brown JB. Endogenous sex hormones,prolactin, and mammographic features of breast tissue in premenopausalwomen. J Natl Cancer Inst 1986;77:617–20.
18. BoydNF, Stone J, Martin LJ, Jong R, Fishell E, YaffeM, et al. The associationof breast mitogens with mammographic densities. Br J Cancer 2002;87:876–82.
19. Bremnes Y, Ursin G, Bjurstam N, Rinaldi S, Kaaks R, Gram IT. Endogenoussex hormones, prolactin and mammographic density in postmenopausalNorwegian women. Int J Cancer 2007;121:2506–11.
20. Verheus M, Peeters PH, van Noord PA, van der Schouw YT, Grobbee DE,van Gils CH. No relationship between circulating levels of sex steroids andmammographic breast density: the Prospect-EPIC cohort. Breast CancerRes 2007;9:R53.
21. Johansson H, Gandini S, Bonanni B, Mariette F, Guerrieri-Gonzaga A,Serrano D, et al. Relationships between circulating hormone levels, mam-mographic percent density and breast cancer risk factors in postmeno-pausal women. Breast Cancer Res Treat 2008;108:57–67.
22. McCormack VA, Dowsett M, Folkerd E, Johnson N, Palles C, Coupland B,et al. Sex steroids, growth factors and mammographic density: a cross-sectional study of UK postmenopausal Caucasian and Afro-Caribbeanwomen. Breast Cancer Res 2009;11:R38.
23. Sprague BL, Trentham-Dietz A,GangnonRE, Buist DS, Burnside ES, BowlesEJ, et al. Circulating sex hormones and mammographic breast densityamong postmenopausal women. Horm Cancer 2011;2:62–72.
24. Woolcott CG, Courneya KS, BoydNF, YaffeMJ,McTiernan A, Brant R, et al.Association between sex hormones, glucose homeostasis, adipokines, andinflammatory markers and mammographic density among postmeno-pausal women. Breast Cancer Res Treat 2013;139:255–65.
25. Aiello EJ, Tworoger SS, Yasui Y, Stanczyk FZ, Potter J, Ulrich CM, et al.Associations among circulating sex hormones, insulin-like growth factor,lipids, and mammographic density in postmenopausal women. CancerEpidemiol Biomarkers Prev 2005;14:1411–7.
26. Greendale GA, Palla SL, Ursin G, Laughlin GA, Crandall C, Pike MC, et al.The association of endogenous sex steroids and sex steroid bindingproteins with mammographic density: results from the PostmenopausalEstrogen/Progestin Interventions Mammographic Density Study. Am JEpidemiol 2005;162:826–34.
27. Tamimi RM, Hankinson SE, Colditz GA, Byrne C. Endogenous sex hor-mone levels andmammographic density among postmenopausal women.Cancer Epidemiol Biomarkers Prev 2005;14:2641–7.
28. Schoemaker MJ, Folkerd EJ, Jones ME, Rae M, Allen S, Ashworth A, et al.Combined effects of endogenous sex hormone levels and mammographicdensity on postmenopausal breast cancer risk: results from the Break-through Generations Study. Br J Cancer 2014;110:1898–907.
29. Colditz GA, Bohlke K, Berkey CS. Breast cancer risk accumulation startsearly: prevention must also. Breast Cancer Res Treat 2014;145:567–79.
30. Russo J, Tay LK, Russo IH. Differentiation of the mammary gland andsusceptibility to carcinogenesis. Breast Cancer Res Treat 1982;2:5–73.
31. Boyd N, Martin L, Chavez S, Gunasekara A, Salleh A, Melnichouk O,et al. Breast-tissue composition and other risk factors for breastcancer in young women: a cross-sectional study. Lancet Oncol 2009;10:569–80.
32. Frydenberg H, Flote VG, Iversen A, Finstad SE, Furberg AS, Torjesen PA,et al. Insulin-like growth factor-1, growth hormone, and daily cyclingestrogen are associated with mammographic density in premenopausalwomen. Cancer Causes Control 2014;25:891–903.
33. Dorgan JF, Klifa C,Deshmukh S, Egleston BL, Shepherd JA, Kwiterovich POJr, et al. Menstrual and reproductive characteristics and breast density inyoung women. Cancer Causes Control 2013;24:1973–83.
34. Dorgan JF, Liu L, Klifa C, Hylton N, Shepherd JA, Stanczyk FZ, et al.Adolescent diet and subsequent serumhormones, breast density, and bonemineral density in young women: results of the Dietary Intervention Studyin Children follow-up study. Cancer Epidemiol Biomarkers Prev 2010;19:1545–56.
35. Dorgan JF, Liu L, Barton BA, Deshmukh S, Snetselaar LG, VanHorn L, et al.Adolescent diet and metabolic syndrome in young women: results of theDietary Intervention Study in Children (DISC) follow-up study. J ClinEndocrinol Metab 2011;96:E1999–2008.
36. Efficacy and safety of lowering dietary intake of fat and cholesterol inchildren with elevated low-density lipoprotein cholesterol. The DietaryIntervention Study in Children (DISC). The Writing Group for the DISCCollaborative Research Group. JAMA 1995;273:1429–35.
37. Dietary intervention study in children (DISC) with elevated low-density-lipoprotein cholesterol. Design and baseline characteristics. DISC Collab-orative Research Group. Ann Epidemiol 1993;3:393–402.
38. Obarzanek E, Kimm SY, Barton BA, Van Horn LL, Kwiterovich PO Jr,Simons-Morton DG, et al. Long-term safety and efficacy of a cholesterol-lowering diet in childrenwith elevated low-density lipoprotein cholesterol:seven-year results of the Dietary Intervention Study in Children (DISC).Pediatrics 2001;107:256–64.
39. Dorgan JF, Klifa C, Shepherd JA, Egleston BL, Kwiterovich PO Jr, Himes JH,et al. Height, adiposity and body fat distribution and breast density inyoung women. Breast Cancer Res 2012;14:R107.
40. Dragoman MV. The combined oral contraceptive pill- recent develop-ments, risks and benefits. Best Pract Res Clin Obstet Gynaecol 2014;28:825–34.
41. Probst-Hensch NM, Ingles SA, Diep AT, Haile RW, Stanczyk FZ, KolonelLN, et al. Aromatase and breast cancer susceptibility. Endocr Relat Cancer1999;6:165–73.
42. Scott JZ, Stanczyk FZ, Goebelsmann U, Mishell DR Jr. A double-antibodyradioimmunoassay for serum progesterone using progesterone-3-(O-car-boxymethyl) oximino-[125I]-iodo-histamine as radioligand. Steroids1978;31:393–405.
43. Goebelsmann U, Arce JJ, Thorneycroft IH, Mishell DR Jr. Serum testoster-one concentrations in women throughout the menstrual cycle and fol-lowing HCG administration. Am J Obstet Gynecol 1974;119:445–52.
44. Egleston BL, Chandler DW, Dorgan JF. Validity of estimating non-sexhormone-binding globulin bound testosterone and oestradiol from totalhormone measurements in boys and girls. Ann Clin Biochem 2010;47:233–41.
45. Rinaldi S, Geay A, Dechaud H, Biessy C, Zeleniuch-Jacquotte A, Akh-medkhanov A, et al. Validity of free testosterone and free estradioldeterminations in serum samples from postmenopausal women bytheoretical calculations. Cancer Epidemiol Biomarkers Prev 2002;11:1065–71.
46. Key TJ, Appleby PN, Reeves GK, Travis RC, Alberg AJ, Barricarte A, et al. Sexhormones and risk of breast cancer in premenopausal women: a collab-orative reanalysis of individual participant data from seven prospectivestudies. Lancet Oncol 2013;14:1009–19.
47. ACR Practice Guideline for the Performance of Contrast-Enhanced Mag-netic Resonance Imaging (MRI) of the Breast. Available at: http://www.acr.org/�/media/ACR/Documents/PGTS/guidelines/MRI_Breast.pdf.
48. Klifa C, Carballido-Gamio J, Wilmes L, Laprie A, Lobo C, Demicco E, et al.Quantification of breast tissue index from MR data using fuzzy clustering.Conf Proc IEEE Eng Med Biol Soc 2004;3:1667–70.
49. Stone J, Ding J, Warren RM, Duffy SW, Hopper JL. Using mammographicdensity to predict breast cancer risk: dense area or percentage dense area.Breast Cancer Res 2010;12:R97.
50. Pettersson A, Hankinson SE, Willett WC, Lagiou P, Trichopoulos D,Tamimi RM. Nondense mammographic area and risk of breast cancer.Breast Cancer Res 2011;13:R100.
51. Littell RC. In:Cary N.C., editor. SAS for mixed models. 2nd ed. Cary, NC:SAS Institute; 2006.
Endogenous Sex Hormones and Breast Density
www.aacrjournals.org Cancer Epidemiol Biomarkers Prev; 24(2) February 2015 377
on March 14, 2015. © 2015 American Association for Cancer Research. cebp.aacrjournals.org Downloaded from
Published OnlineFirst November 4, 2014; DOI: 10.1158/1055-9965.EPI-14-0939
52. Pettee Gabriel K, Klifa C, Perez A, Kriska AM, High RR, Snetselaar L, et al.Adolescent and young adult exposure to physical activity and breastdensity. Med Sci Sports Exerc 2013;45:1515–23.
53. AdamiH-O,HunterDJ, TrichopoulosD. Textbookof cancer epidemiology.2nd ed. Oxford/New York, NY: Oxford University Press; 2008.
54. HarlowSD, Ephross SA. Epidemiology ofmenstruation and its relevance towomen's health. Epidemiol Rev 1995;17:265–86.
55. Hamilton LC. Statistics with Stata : updated for version 10. Belmont, CA:Brooks/Cole; 2009.
56. Hosmer DW, Lemeshow S. Applied logistic regression. 2nd ed. New York,NY: Wiley; 2000.
57. Buist DS, Aiello EJ, Miglioretti DL,White E.Mammographic breast density,dense area, and breast area differences by phase in the menstrual cycle.Cancer Epidemiol Biomarkers Prev 2006;15:2303–6.
58. MorrowM, Chatterton RT Jr, Rademaker AW, HouN, Jordan VC, HendrickRE, et al. A prospective study of variability in mammographic densityduring the menstrual cycle. Breast Cancer Res Treat 2010;121:565–74.
59. Junkermann H, von Holst T, Lang E, Rakov V. Influence of different HRTregimens on mammographic density. Maturitas 2005;50:105–10.
60. Yaghjyan L, Colditz GA, Rosner B, Tamimi RM. Mammographic breastdensity and breast cancer risk by menopausal status, postmenopausalhormone use and a family history of breast cancer. Cancer Causes Control2012;23:785–90.
61. Sonne-Hansen K, Lykkesfeldt AE. Endogenous aromatization of testoster-one results in growth stimulation of the human MCF-7 breast cancer cellline. J Steroid Biochem Mol Biol 2005;93:25–34.
62. James VH, McNeill JM, Lai LC, Newton CJ, Ghilchik MW, Reed MJ.Aromatase activity in normal breast and breast tumor tissues: in vivo andin vitro studies. Steroids 1987;50:269–79.
63. Bolton EC, So AY,Chaivorapol C,HaqqCM, LiH, Yamamoto KR.Cell- andgene-specific regulation of primary target genes by the androgen receptor.Genes Dev 2007;21:2005–17.
64. NicolasDiaz-Chico B, German Rodriguez F, Gonzalez A, Ramirez R, BilbaoC, Cabrera de Leon A, et al. Androgens and androgen receptors in breastcancer. J Steroid Biochem Mol Biol 2007;105:1–15.
65. Foradori CD, Weiser MJ, Handa RJ. Non-genomic actions of androgens.Front Neuroendocrinol 2008;29:169–81.
66. Tamimi RM, Byrne C, Colditz GA, Hankinson SE. Endogenous hormonelevels, mammographic density, and subsequent risk of breast cancer inpostmenopausal women. J Natl Cancer Inst 2007;99:1178–87.
67. Radisky DC, Hartmann LC. Mammary involution and breast cancer risk:transgenic models and clinical studies. J Mammary Gland Biol Neoplasia2009;14:181–91.
68. Milanese TR,HartmannLC, Sellers TA, FrostMH,Vierkant RA,Maloney SD,et al. Age-related lobular involution and risk of breast cancer. J Natl CancerInst 2006;98:1600–7.
69. Ghosh K, Hartmann LC, Reynolds C, Visscher DW, Brandt KR, Vierkant RA,et al. Association betweenmammographic density and age-related lobularinvolution of the breast. J Clin Oncol 2010;28:2207–12.
70. Maskarinec G, Pagano I, Lurie G, Kolonel LN. A longitudinal investigationof mammographic density: the multiethnic cohort. Cancer EpidemiolBiomarkers Prev 2006;15:732–9.
71. Ginsburg OM, Martin LJ, Boyd NF. Mammographic density, lobularinvolution, and risk of breast cancer. Br J Cancer 2008;99:1369–74.
72. RosnerW, Auchus RJ, Azziz R, Sluss PM, Raff H. Position statement: Utility,limitations, and pitfalls in measuring testosterone: an Endocrine Societyposition statement. J Clin Endocrinol Metab 2007;92:405–13.
73. Zimmerman Y, Eijkemans MJ, Coelingh Bennink HJ, Blankenstein MA,Fauser BC. The effect of combined oral contraception on testosterone levelsin healthy women: a systematic review and meta-analysis. Hum ReprodUpdate 2014;20:76–105.
74. Cho M, Atrio J, Lim AH, Azen C, Stanczyk FZ. Pituitary and ovarianhormone activity during the 7-day hormone-free interval of various com-bined oral contraceptive regimens. Contraception 2014;90:94–6.
75. Thorneycroft IH, Stanczyk FZ, BradshawKD, Ballagh SA, NicholsM,WeberME. Effect of low-dose oral contraceptives on androgenicmarkers and acne.Contraception 1999;60:255–62.
76. Hietala M, Sandberg T, Borg A, Olsson H, JernstromH. Testosterone levelsin relation to oral contraceptive use and the androgen receptor CAG andGGC length polymorphisms in healthy young women. Hum Reprod2007;22:83–91.
77. Shao R, Ljungstrom K, Weijdegard B, Egecioglu E, Fernandez-Rodriguez J,Zhang FP, et al. Estrogen-induced upregulation of AR expression andenhancement of AR nuclear translocation in mouse fallopian tubes invivo. Am J Physiol Endocrinol Metab 2007;292:E604–14.
78. Doisneau-Sixou SF, Sergio CM, Carroll JS, Hui R,Musgrove EA, SutherlandRL. Estrogen and antiestrogen regulation of cell cycle progression in breastcancer cells. Endocr Relat Cancer 2003;10:179–86.
79. Yager JD, Davidson NE. Estrogen carcinogenesis in breast cancer. N Engl JMed 2006;354:270–82.
80. Rosner W, Hryb DJ, Kahn SM, Nakhla AM, Romas NA. Interactions of sexhormone-binding globulin with target cells. Mol Cell Endocrinol 2010;316:79–85.
81. Kerlikowske K, Grady D, Barclay J, Sickles EA, Ernster V. Effect of age, breastdensity, and family history on the sensitivity of first screening mammog-raphy. JAMA 1996;276:33–8.
82. Wei J, Chan HP, Helvie MA, Roubidoux MA, Sahiner B, Hadjiiski LM,et al. Correlation between mammographic density and volumetricfibroglandular tissue estimated on breast MR images. Med Phys 2004;31:933–42.
83. Thompson DJ, Leach MO, Kwan-Lim G, Gayther SA, Ramus SJ, Warsi I,et al. Assessing the usefulness of a novel MRI-based breast density estima-tion algorithm in a cohort of women at high genetic risk of breast cancer:the UK MARIBS study. Breast Cancer Res 2009;11:R80.
84. Shepherd JA, KerlikowskeK,MaL,Duewer F, FanB,Wang J, et al. Volumeofmammographic density and risk of breast cancer. Cancer EpidemiolBiomarkers Prev 2011;20:1473–82.
85. Missmer SA, Spiegelman D, Bertone-Johnson ER, Barbieri RL, Pollak MN,Hankinson SE. Reproducibility of plasma steroid hormones, prolactin, andinsulin-like growth factor levels amongpremenopausalwomenover a 2- to3-year period. Cancer Epidemiol Biomarkers Prev 2006;15:972–8.
86. Ogden CL, Carroll MD, Curtin LR, McDowell MA, Tabak CJ, Flegal KM.Prevalence of overweight and obesity in the United States, 1999–2004.JAMA 2006;295:1549–55.
Cancer Epidemiol Biomarkers Prev; 24(2) February 2015 Cancer Epidemiology, Biomarkers & Prevention378
Jung et al.
on March 14, 2015. © 2015 American Association for Cancer Research. cebp.aacrjournals.org Downloaded from
Published OnlineFirst November 4, 2014; DOI: 10.1158/1055-9965.EPI-14-0939
2015;24:369-378. Published OnlineFirst November 4, 2014.Cancer Epidemiol Biomarkers Prev Seungyoun Jung, Frank Z. Stanczyk, Brian L. Egleston, et al. Endogenous Sex Hormones and Breast Density in Young Women
Updated version
10.1158/1055-9965.EPI-14-0939doi:
Access the most recent version of this article at:
Material
Supplementary
http://cebp.aacrjournals.org/content/suppl/2014/11/05/1055-9965.EPI-14-0939.DC1.html
Access the most recent supplemental material at:
Cited Articles
http://cebp.aacrjournals.org/content/24/2/369.full.html#ref-list-1
This article cites by 81 articles, 29 of which you can access for free at:
E-mail alerts related to this article or journal.Sign up to receive free email-alerts
Subscriptions
Reprints and
To order reprints of this article or to subscribe to the journal, contact the AACR Publications Department
Permissions
To request permission to re-use all or part of this article, contact the AACR Publications Department at
on March 14, 2015. © 2015 American Association for Cancer Research. cebp.aacrjournals.org Downloaded from
Published OnlineFirst November 4, 2014; DOI: 10.1158/1055-9965.EPI-14-0939
Copyright © 2022 FDOKUMEN