Health and endogenous growth
17
Journal of Health Economics 20 (2001) 169–185 Health and endogenous growth Adriaan van Zon a,b,* , Joan Muysken a,b a MERIT, Maastricht Economic Research Institute on Innovation and Technology, P.O. Box 616, 6200 MD Maastricht, The Netherlands b Faculty of Economics and Business Administration, Maastricht University, P.O. Box 616, 6200 MD Maastricht, The Netherlands Received 9 April 1998; received in revised form 19 June 2000; accepted 6 September 2000 Abstract The focus of endogenous growth theory on human capital formation and the physical embodiment of knowledge in people, suggests the integration of the growth supporting character of health production and the growth generating services of human capital accumulation in an endogenous growth framework. We show that a slow down in growth may be explained by a preference for health that is positively influenced by a growing income per head, or by an ageing population. Growth may virtually disappear for countries with high rates of decay of health, low productivity of the health-sector, or high rates of discount. © 2001 Elsevier Science B.V. All rights reserved. JEL classification: I1; O3; O4 Keywords: Health; Endogenous growth 1. Introduction These days total health costs in Western economies are roughly 8–9% of GDP, whereas expenditures on education account for another 6–7%. 1 The expenditures on education are generally motivated by the insight that education provides a strong contribution to economic growth. Health expenditures on the other hand, have been a cause of general concern for some time now, especially because of the seemingly autonomous and permanent character of rises in the corresponding costs. This is due to the fact that a significant part of total health costs are associated with care rather than cure. The former costs have shown a tendency * Corresponding author. Tel.: +33-43-3883890; fax: +33-43-3884905. E-mail address: [email protected] (A. van Zon). 1 See OECD (1999) and The Economist Yearbook (1998), respectively. 0167-6296/01/$ – see front matter © 2001 Elsevier Science B.V. All rights reserved. PII:S0167-6296(00)00072-2
-
Upload
maastrichtuniversity -
Category
Documents
-
view
5 -
download
0
Transcript of Health and endogenous growth
Journal of Health Economics 20 (2001) 169–185
Health and endogenous growth
Adriaan van Zona,b,∗, Joan Muyskena,ba MERIT, Maastricht Economic Research Institute on Innovation and Technology,
P.O. Box 616, 6200 MD Maastricht, The Netherlandsb Faculty of Economics and Business Administration, Maastricht University,
P.O. Box 616, 6200 MD Maastricht, The Netherlands
Received 9 April 1998; received in revised form 19 June 2000; accepted 6 September 2000
Abstract
The focus of endogenous growth theory on human capital formation and the physical embodimentof knowledge in people, suggests the integration of the growth supporting character of healthproduction and the growth generating services of human capital accumulation in an endogenousgrowth framework. We show that a slow down in growth may be explained by a preference forhealth that is positively influenced by a growing income per head, or by an ageing population.Growth may virtually disappear for countries with high rates of decay of health, low productivityof the health-sector, or high rates of discount. © 2001 Elsevier Science B.V. All rights reserved.
JEL classification:I1; O3; O4
Keywords:Health; Endogenous growth
1. Introduction
These days total health costs in Western economies are roughly 8–9% of GDP, whereasexpenditures on education account for another 6–7%.1 The expenditures on education aregenerally motivated by the insight that education provides a strong contribution to economicgrowth. Health expenditures on the other hand, have been a cause of general concern forsome time now, especially because of the seemingly autonomous and permanent characterof rises in the corresponding costs. This is due to the fact that a significant part of total healthcosts are associated with care rather than cure. The former costs have shown a tendency
∗ Corresponding author. Tel.:+33-43-3883890; fax:+33-43-3884905.E-mail address:[email protected] (A. van Zon).
1 See OECD (1999) and The Economist Yearbook (1998), respectively.
0167-6296/01/$ – see front matter © 2001 Elsevier Science B.V. All rights reserved.PII: S0167-6296(00)00072-2
170 A. van Zon, J. Muysken / Journal of Health Economics 20 (2001) 169–185
to rise, largely due to the ageing of the population.2 However, one should not forget thathealth is also a very important factor in economic growth.
The impact of education on economic growth has been recognised for more than a decadenow in economic theory. In his pioneering endogenous growth model, Lucas (1988) un-derlines the principal importance of human capital formation for growth and developmentin a relatively straightforward manner.3 But, paradoxically, in this and subsequent growthmodels, it is generally overlooked that human capital formation as a source of growth isquite literally embodied in people.4 Nonetheless, people can provide effective human cap-ital services only if they are alive and healthy. Therefore, the general acceptance of humancapital formation as a source of growth also warrants a closer look at how changes in thehealth-state of the population may influence growth and hence total welfare.5
As observed by Grossman (1972, p. xiii), health contributes to well-being and economicperformance in several ways. From a growth perspective, the positive contribution of a ‘goodhealth’ to labour productivity is particularly important. However, the provision of healthrequires resources. As a consequence, there seems to be a direct trade-off between healthand human capital accumulation: an expansion of the health sector may promote growththrough increased health of the population, while a contraction of the health sector couldalso free the resources necessary to promote growth by means of an increase in humancapital accumulation activities.6 Moreover, this trade-off is complicated because of theasymmetries in the productivity characteristics of health generation and the accumulationof human capital. Baumol (1967), for instance, takes the health sector as an example of asector which permits “. . . only sporadic increases in productivity” because “. . . there is nosubstitute for the personal attention of a physician. . . ”, as opposed to human capital accu-mulation activities, which give rise to “. . . technologically progressive activities in whichinnovations, capital accumulation, and economies of large scale make for a cumulative risein output per man hour”.7
2 For instance, according to Polders et al. (1997, p. xii), roughly 50% of the total rise in health costs between1988 and 1994 in the Netherlands was due to both an ageing population and factors like technical change anddemand shifts. And according to Centraal Planbureau (1999, p. 5), more than one-third of total health expendituresin 1997 in the Netherlands was directly associated with care for the elderly and the (mentally) handicapped. Thisdoes not include cure expenditures for these groups of patients.
3 See also Romer (1990) and Aghion and Howitt (1992) for examples of human capital formation or knowledgegeneration as the source of economic growth.
4 A notable exception is Ehrlich and Lui (1991), who focus on the way in which subsequent generations andthe trade between them influence human capital formation, longevity and growth in an overlapping generationssetting.
5 In Muysken et al. (1999) we show how this point has been recognized in many empirical growth studies, inparticular on economic convergence — see for instance Knowles and Owen (1997) — but not in theoretical growthmodels.
6 This provides an interesting contrast to microeconomic analysis that suggests the existence of complementaritybetween health and education. Fuchs (1982), for instance, argues that increases in health investment would lengthenone’s life span, ceteris paribus, and hence increase the returns on investment in education. An alternative explanationwould be that a higher level of education would go hand in hand with increases in the preference for health (possiblydue to the rise in the opportunity costs of not being healthy).
7 Baumol (1967, pp. 416, 423, 415, respectively). It is these differences in productivity that are the cause ofBaumol’s disease.
A. van Zon, J. Muysken / Journal of Health Economics 20 (2001) 169–185 171
In terms of the growth model, this implies that we assume that the generation of healthservices is characterised by decreasing returns, whereas human capital accumulation isgenerally modelled using increasing returns.8 Another asymmetry between health andhuman capital which should be recognised in the analysis is that health directly affectswelfare and therefore should be included in the utility function next to consumption —at least in Western economies. As a consequence, there is also a direct trade-off betweenresources used in the health sector and the final goods sector.9
In order to analyse both trade-offs and their consequences for economic growth, weextend the endogenous growth framework of Lucas (1988).10 We take into account thathealth influences intertemporal decision-making in three different ways. First, it serves asthe ‘conditio sine qua non’ to the provision of human capital services. Second, the provisionof health services directly competes with the provision of labour services allocated to theproduction of output and time spent on human capital accumulation. The third way in whichhealth influences intertemporal decision-making follows from the observation that healthcan generate positive utility of its own. In addition to this, we take account of the intertem-poral welfare effects of providing health services through the positive impact on longevity.
Our model shares some features with Barro (1990), who looks at the contribution ofgovernment expenditures to welfare directly and through government expenditures inducedproductivity growth in anAK-setting.11 However, unlike Barro (1990), we focus on theembodiment of human capital in people, and the role of the provision of health services inenabling society to reap both the productive effects and the direct welfare effects of havinga healthy population. The ‘labour augmentation framework’ of the Lucas (1988) modeltherefore provides a ‘natural’ point of departure for our analysis.
In our model, we distinguish between the active part of the population and the inactivepart. The latter may increase with longevity because of increased health — but this alsoexpands the demand for health services. We assume that the provision of labour services bythe active part of the population depends both on the average level of health of the work forceand on the amount of human capital per (health-) worker. The idea is that a deteriorationof health reduces the number of effective working days embodied in a person and hencein the population. From that perspective, health and human capital are complements, inthat a low health status will lead to a low supply of human capital services, ceteris paribus.However, from the perspective of the generation of effective human capital services, the
8 Decreasing returns in health services are used in Forster (1989), Ehrlich and Chuma (1990) and Johansson andLofgren (1995), increasing returns in human capital generation appear in the growth models mentioned above.
9 This is reflected for instance in the fact that, in Western economies at least, a significant part of total health costsare associated with care rather than cure — mainly because of the ageing of the population. See also Footnote 2.10 Grossman (1972), followed up by, for instance, Muurinen (1982), Forster (1989) and Ehrlich and Chuma(1990) have concentrated on the provision of health services from a micro economic demand perspective. Meltzer(1997), using ‘intertemporal cost effectiveness analysis’ at the micro-level, even goes as far as defining a lifetimeutility maximization problem that internalizes all future costs (medical and non-medical) of medical interventions,through changes in survival probabilities. Our analysis integrates both costs (in terms of consumption foregone)and benefits (in terms of productivity and longevity effects) at the macro-level.11 TheAK-model is the simplest endogenous growth model that exhibits the key property underlying endogenousgrowth, namely the absence of diminishing returns to capital. This property is implied by the use of the linearproduction functionY = AK, whereY is output,K capital andA (fixed) capital productivity. See further Barro andSala-i-Martin (1995) for an extensive discussion of theAK-framework.
172 A. van Zon, J. Muysken / Journal of Health Economics 20 (2001) 169–185
provision of health services is also a direct substitute for the generation of human capital.We show that our model defines an optimal mix of the provision of health and humancapital accumulation that depends on the parameters describing the characteristics of theentire economy, including the health sector.
Our approach has three distinct features. First, following Lucas (1988), we concentrateon the ‘social planner solution’ of the model. In the absence of externalities, this solutioncoincides with the ‘market solution’ where agents are consuming, producing and accumu-lating in response to market prices. However, in this model several externalities are presentwhich would be ignored in individual decision making.12 We therefore, concentrate on the‘social planner solution’.
The second feature of our approach is that we only analyse steady-state situations withbalanced growth. That is, we show how the trade-offs mentioned above lead to a situation inthe long run in which growth and health depend on the fundamental parameters reflectingtechnology and taste. The emphasis on differences in steady-state situations is in line with aquite impressive history of comparative growth studies that taught us that conditional con-vergence — in which different steady-state situations can occur — is much more plausiblethan absolute convergence.13 The transition to the steady-state situation is not part of ouranalysis. This is analytically impossible without resorting to numerical methods, whereasthe insights gained from such an exercise will contribute very little to our present analysisof the consequences of the trade-offs.14
Finally, and in line with the second feature, we assume that in the steady-state both theaverage health and the age of population are constant. However, they are generated by themodel and depend on the fundamental parameters that reflect technology and taste. We canthen analyse how differences in technology or taste lead to differences not only in growthperformance, but also in the health-state and age of population. As a consequence, exogenousproductivity increases in the generation of health services, next to the endogenous efficiencyincreases in human capital accumulation, or an exogenous rise in the preference for health,can be used to explain long-term changes in the health-state and age of population. At thisstage, however, we leave the endogenisation of the processes underlying these parameterchanges for further research.15
The remainder of the paper is organised as follows. Section 2 introduces our model ofpopulation growth and longevity, while Section 3 describes the health generation processthat we want to integrate with the Lucas (1988) model. Section 4 provides an overview of theextended Lucas (1988) model and presents the steady-state solution, while Section 5 showshow changes in the fundamental parameters of the model would affect the steady-state
12 The generation of health services have an impact on productivity that would tend to be ignored in individualdecision making.13 For an overview, see for instance, Barro and Sala-i-Martin (1995).14 In a much simpler model, Muysken et al. (1999) analyze the impact of health generation in an exogenousgrowth model. They use numerical methods to obtain the market solution. With respect to the dynamics of themodel, their main finding is that, depending on the initial sizes of the stocks of physical capital and health, duringthe transition process optimal expenditures on health are lower or higher than in the steady-state.15 An example is the explanation of the observation of Lapre and Rutten (1993, p. 32) that the value share ofexpenditures on health in national income rises with national income per head. This can be ‘explained’ by meansof a positive relation between the preference for health and GDP.
A. van Zon, J. Muysken / Journal of Health Economics 20 (2001) 169–185 173
solution. In Section 6 some (policy) implications of the model are discussed, while Section7 provides a summary.
2. Longevity and population size
We introduce longevity in the model since this enables us to mimic the impact of ageing ongrowth and welfare by increasing the share of old people in the population. The populationmodel we present here is designed in such a way that longevity can be introduced in thebasic Lucas (1988) framework as simply as possible.
The population is subdivided into two parts: a part that is actively engaged in producingoutput, health services and human capital (‘the young’), and a part that only consumesoutput and health services (‘the old’). People live up to ageT, but are actively involved inproductive activities till ageA. In order to simplify things even more, we assume that eachyearn persons are born that live forT years with healthg(t) and human capitalh(t), wheretis a time index. At ageT, people leave the population through sudden death. Consequently,the population is uniformly distributed overTyear-classes withnpersons in each year-class— and with identical health levelg(t) and human capitalh(t) per person over the wholepopulation.
We now assume that the ageA at which persons will retire from active participation inproductive activities is fixed. Moreover, it seems reasonable to assume that longevityT isproportional to the average health levelg of the population.16 We therefore have
T = µg (1)
whereµ is a constant factor of proportion.From the above, it follows that the number of inactive people is equal to(T−A)n. A rise in
longevity will therefore increase the number of inactive people in the economy, thus leadingto a rise in the consumptive uses of the health sector, ceteris paribus. Consequently, the totalpopulation will increase with longevity. However, when the health level of the populationstabilises, the number of births per period exactly matches the number of deaths, so that thepopulation remains constant in the steady-state.
A good health may be also be expected to influence utility directly.17 In our case, thishappens through the link between health, longevity and the size of the total population, usingthe following CIES (Constant Intertemporal Elasticity of Substitution) utility function:18
U =∫ ∞
0e−ρτ
(gγ(C
L
)1−γ)1−θL
(1 − θ)dτ, 0< θ < 1 (2)
16 Since we concentrate on problems associated with an ageing population, we abstract from the impact of wealthor health on the birth rate. Therefore, the number of births per period does not depend on the health-state of theactive population, nor on Malthusian economic circumstances.17 This is noted by Grossman (1972, p. xiii), who says “. . .what consumers demand when they purchase medicalservices are not these services per se but rather ‘good health”’.18 In the context of the CIES function, we ignore the possibility thatθ = 1, in which case we arrive at Eq. (2).Others have used a utility function like this too. See, for instance, Barro (1990, p. S117) and Barro and Sala-i-Martin(1995, p. 323) where government consumption services and leisure, respectively, take the place of health.
174 A. van Zon, J. Muysken / Journal of Health Economics 20 (2001) 169–185
whereρ is the rate of discount, and 1/θ is the intertemporal elasticity of substitution, 0≤γ ≤ 1 measures the relative contribution of health to intertemporal utility, compared to percapita consumption. Timet = 0 refers to the present, total private consumption isC, whileL = nT is the size of the population.
Since(C/L)(1−γ )(1−θ)L = C(1−γ )(1−θ)L1−(1−γ )(1−θ), longevityT is an implicit argu-ment (throughL) of the utility function that contributes positively to utility (cf. Eq. (1)),next to the direct contribution of health in caseγ > 0.19
3. The generation of health services
Because we want to integrate health and growth in an endogenous growth framework, weuse a specification of the production characteristics of the health sector and its impact onhealth, that is as simple as possible. In order to integrate the notion of productivity increasesdue to human capital accumulation and decreasing returns, it is instructive to link up withsome of the features of the Romer (1990) model. We describe our model of the generation ofhealth services in dynamic terms. Since in the steady-state health will be constant, however,we will just use the implied steady-state relationship between health services inputs andhealth output as an implicit health production function. This paragraph provides the notionsunderlying that production function.
As mentioned above, we assume that the labour force consists of active people, andmeasured in physical units, it is constant. We assume furthermore that the amount of effectivelabour services that a person can supply is directly proportional to his average health leveland human capital. Therefore, the supply of labour measured in efficiency units equalshgnA.
In the medical profession, there are two kinds of productivity gains: those from special-isation and those associated with individual specialisations becoming more productive dueto increased knowledge within the field, or improved medical practices. Let us assume thatthe number of relevant specialisationsΩ grows with the same rate as the human capitalindex, i.e.Ω = πh. Knowledge within the field is assumed to grow with the rate of growthof human capital per person. However, the provision of health services takes place underconditions of decreasing returns — see, for instance, Forster (1989), Ehrlich and Chuma(1990), and Johansson and Lofgren (1995). Hence, the average health level of the populationrises less than proportionally with the amount of health services rendered per person.
Let a fractionvi of effective labour services be used as the sole input into the healthgeneration process for specialisationi. Then vihgnA/(nT) will measure the number ofhealthy hours spent on providing health services for specialisationi per person. Then,following the specialisation argument put forward in Romer (1990), the gross increase inthe average health level of the population is given by20
19 Because 0< θ < 1 and 0<= γ <= 1, it follows that 1− (1 − γ )(1 − θ) >= 0.20 Note that this specification assumes that the demand for health services is the same for all age-classes, which isgenerally not true in practice. However, as long as the distribution of the population across age-classes is relativelystable, the mechanism described here also applies to a population that is heterogeneous (by age-class) in terms ofits demand for health services. In order to simplify matters, we stick to Eqs. (3) and (4), however.
A. van Zon, J. Muysken / Journal of Health Economics 20 (2001) 169–185 175
dg
dt=∫ πh
0ψ
(hgvi
nA
nT
)βdi = ψπh
(hgvA
πhµg
)β= ψ
(A
µ
)βπ1−βvβh (3)
whereψ is a productivity parameter andv represents the share of total effective laboursupply employed in the health sector. The condition 0< β ≤ 1 reflects the assumption ofdecreasing returns in health generation.
Technological change does not only have positive effects on health, though. It is quiteconceivable that increases in the technological content of an average workers’ job has ledto higher incidences of burn-out due to stress, etc. Moreover, demand for medical care,i.e. the perception of health deterioration, will increase with the average level of medicaltechnology in a society.21 We take this into account by assuming that the percentageloss of labour time due to these technology related factors is proportional to the level oftechnologyπhwith factor of proportionς .The net increase in the average health level is nowgiven by
dg
dt=[ψ
(A
µ
)βπ1−βvβ − ςπg
]h (4)
An interesting feature of the health generation process is that it is inherently stable in thelong run. It can easily be observed that for any given positive value of the share of thehealth sector in total employmentv, the health levelg will converge tog∗. The latter can beobtained by setting dg/dt = 0 in Eq. (3), which yields
g∗ = ψ
ς
(A
πµ
)βvβ = z0v
β (5)
wherez0 is implicitly defined by the equivalence of the right most part of Eq. (5) andits middle part. As one might expect, a higher share of employment in the health sectorwill result in a higher equilibrium health levelg∗, while human capital formation as suchincreases the speed of adjustment towards that equilibrium level.
4. Health and the Lucas model
As we mentioned earlier, health enters the intertemporal decision framework in threedifferent ways.First, a fall in the average health level of the population may be expectedto cause a fall of the amount of effective labour services that the population can supply.22
Second, the generation of health takes scarce resources that have alternative uses (like theproduction of output or human capital), whilethird, a good health may be expected toinfluence utility directly. As we have discussed above, the latter includes the link betweenhealth, longevity and the size of the total population.
21 This argument is also used in Fuchs (1982).22 Grossman (1972, p. xiii) states: “. . . the level of ill-health measured by the rates of mortality and morbidity,influences the amount and productivity of labour supplied to an economy”.
176 A. van Zon, J. Muysken / Journal of Health Economics 20 (2001) 169–185
Using the description of the health sector as given in the previous sections, the Lucas(1988) framework can be extended in a straightforward manner. The production structureis represented by
Y = B[(1 − u− v)hgnA
]αK1−α (6)
whereYmeasures total output,K the capital stock andB is a constant productivity parameter.Note that a fraction (1− u− v) of the supply of labour in terms of efficiency units is usedin final output production, and the remaining fractionsu andv are spent on human capitalaccumulation and health services production, respectively.
The human capital accumulation process has the same properties as in Lucas (1988) —the only difference is that we take health explicitly into account. Hence
dh
dt= δugh (7)
whereδ is a productivity parameter. Finally, the accumulation of physical capital is givenby
dK
dt= Y − C (8)
As we explained in the introduction, we follow Lucas and concentrate on the so-called‘social planner solution’. To solve the model, intertemporal utility (2) should be maximisedwith respect toC, the allocation of consumption over time, andu andv, the allocation oflabour over its different uses, subject to the conditions (6), (7), (8) and (4).23 Using themethod of optimal control, it turned out to be impossible to find a closed form solution to theoptimisation problem. In order to simplify matters therefore, we use the insight presentedabove that, for a constant steady-state allocation of effective labour services as we find inLucas (1988), the health generation process is inherently stable in the long run. This impliesthat the health level will always converge tog∗ defined in Eq. (5). We therefore replace theconstraint of Eq. (4) by that ofg = g∗ defined in Eq. (5). This is consistent with the focus ofour analysis on long-term developments and balanced growth situations. Consequently, theout of steady-state behaviour of the health-state of the population will not be analysed, asstated in the introduction. And although the revised system still doesn’t allow us to obtaina closed form solution, we can rearrange it in such a way that we can employ a graphicalsolution method instead.
The first order conditions that the steady-state growth solution of the revised model hasto obey can now be condensed into the following simultaneous equation system:24
f = c2 − αc (9.A)
v = f + α(1 − α)(1 − θ)(1 − γ )/(θ + (1 − θ)2γ )
f + ((1 + β)/β)α(1 − α)(1 − θ)(1 − γ )/(θ + (1 − θ)2γ )(9.B)
23 We simplify the original Lucas model somewhat by dropping the knowledge spill-over effect, which is not anessential ingredient of endogenous growth. The original Lucas model (without the knowledge externality) can beobtained by dropping (4) and settingv = 0, g = 1 andA = L in (6) and (7).24 See the Technical Annex for more details.
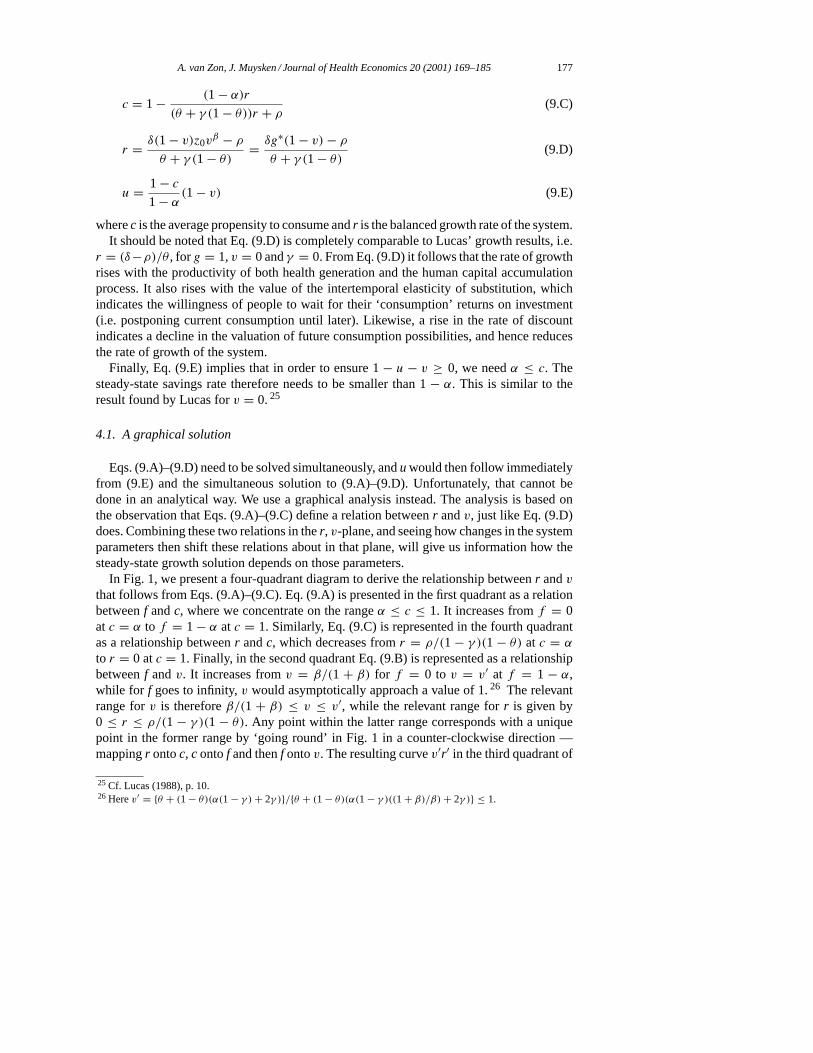
A. van Zon, J. Muysken / Journal of Health Economics 20 (2001) 169–185 177
c = 1 − (1 − α)r
(θ + γ (1 − θ))r + ρ(9.C)
r = δ(1 − v)z0vβ − ρ
θ + γ (1 − θ)= δg∗(1 − v)− ρ
θ + γ (1 − θ)(9.D)
u = 1 − c
1 − α(1 − v) (9.E)
wherec is the average propensity to consume andr is the balanced growth rate of the system.It should be noted that Eq. (9.D) is completely comparable to Lucas’ growth results, i.e.
r = (δ−ρ)/θ , forg = 1,v = 0 andγ = 0. From Eq. (9.D) it follows that the rate of growthrises with the productivity of both health generation and the human capital accumulationprocess. It also rises with the value of the intertemporal elasticity of substitution, whichindicates the willingness of people to wait for their ‘consumption’ returns on investment(i.e. postponing current consumption until later). Likewise, a rise in the rate of discountindicates a decline in the valuation of future consumption possibilities, and hence reducesthe rate of growth of the system.
Finally, Eq. (9.E) implies that in order to ensure 1− u − v ≥ 0, we needα ≤ c. Thesteady-state savings rate therefore needs to be smaller than 1− α. This is similar to theresult found by Lucas forv = 0.25
4.1. A graphical solution
Eqs. (9.A)–(9.D) need to be solved simultaneously, anduwould then follow immediatelyfrom (9.E) and the simultaneous solution to (9.A)–(9.D). Unfortunately, that cannot bedone in an analytical way. We use a graphical analysis instead. The analysis is based onthe observation that Eqs. (9.A)–(9.C) define a relation betweenr andv, just like Eq. (9.D)does. Combining these two relations in ther, v-plane, and seeing how changes in the systemparameters then shift these relations about in that plane, will give us information how thesteady-state growth solution depends on those parameters.
In Fig. 1, we present a four-quadrant diagram to derive the relationship betweenr andvthat follows from Eqs. (9.A)–(9.C). Eq. (9.A) is presented in the first quadrant as a relationbetweenf andc, where we concentrate on the rangeα ≤ c ≤ 1. It increases fromf = 0at c = α to f = 1 − α at c = 1. Similarly, Eq. (9.C) is represented in the fourth quadrantas a relationship betweenr andc, which decreases fromr = ρ/(1 − γ )(1 − θ) at c = α
to r = 0 atc = 1. Finally, in the second quadrant Eq. (9.B) is represented as a relationshipbetweenf andv. It increases fromv = β/(1 + β) for f = 0 to v = v′ at f = 1 − α,while for f goes to infinity,v would asymptotically approach a value of 1.26 The relevantrange forv is thereforeβ/(1 + β) ≤ v ≤ v′, while the relevant range forr is given by0 ≤ r ≤ ρ/(1 − γ )(1 − θ). Any point within the latter range corresponds with a uniquepoint in the former range by ‘going round’ in Fig. 1 in a counter-clockwise direction —mappingr ontoc, c ontof and thenf ontov. The resulting curvev′r′ in the third quadrant of
25 Cf. Lucas (1988), p. 10.26 Herev′ = θ + (1 − θ)(α(1 − γ )+ 2γ )/θ + (1 − θ)(α(1 − γ )((1 + β)/β)+ 2γ ) ≤ 1.
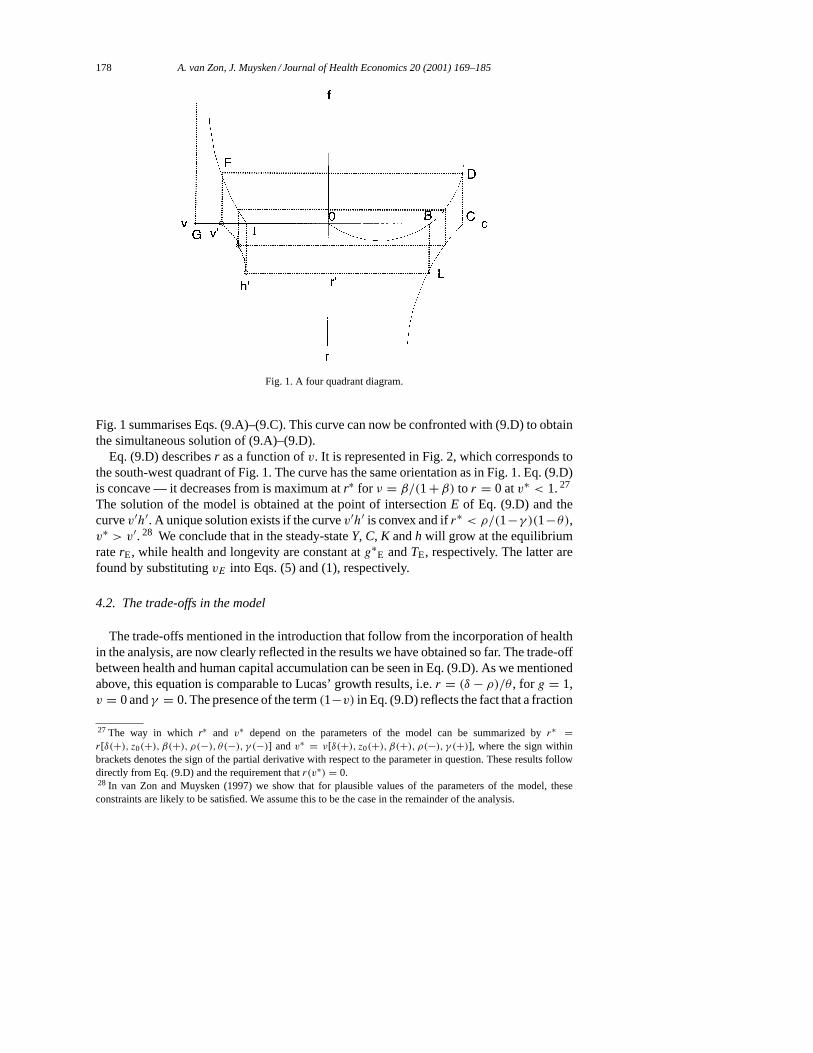
178 A. van Zon, J. Muysken / Journal of Health Economics 20 (2001) 169–185
Fig. 1. A four quadrant diagram.
Fig. 1 summarises Eqs. (9.A)–(9.C). This curve can now be confronted with (9.D) to obtainthe simultaneous solution of (9.A)–(9.D).
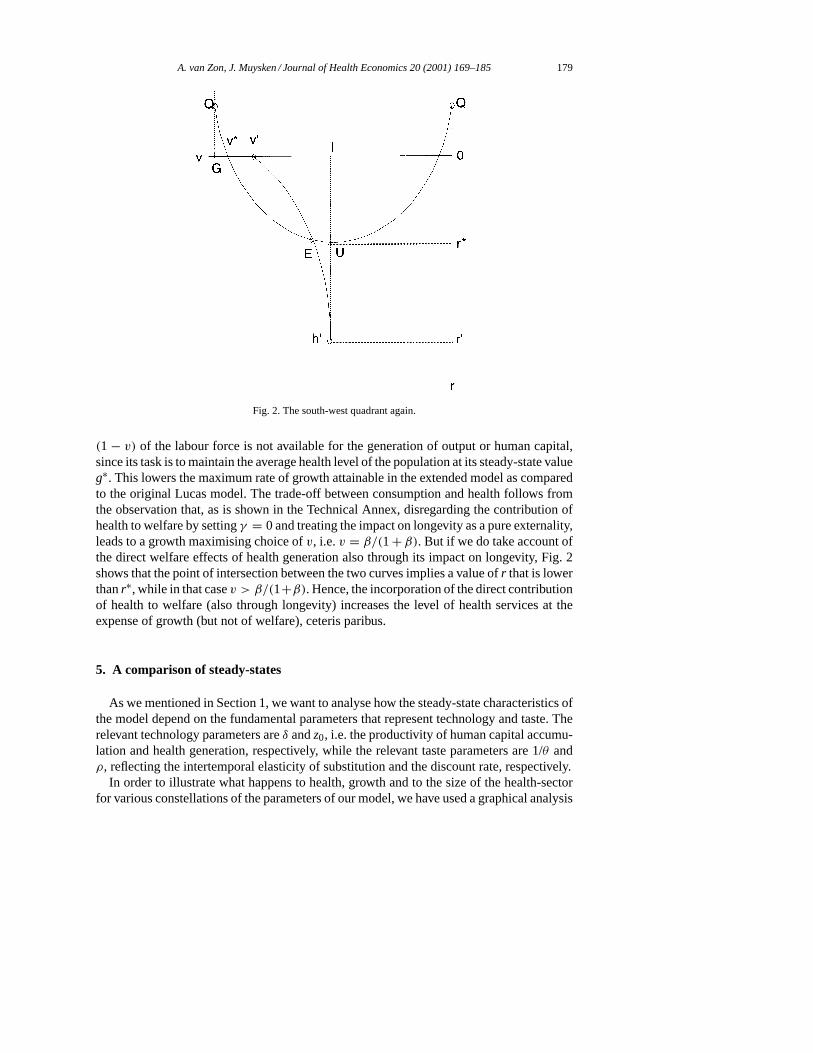
Eq. (9.D) describesr as a function ofv. It is represented in Fig. 2, which corresponds tothe south-west quadrant of Fig. 1. The curve has the same orientation as in Fig. 1. Eq. (9.D)is concave — it decreases from is maximum atr∗ for ν = β/(1+β) to r = 0 atv∗ < 1.27
The solution of the model is obtained at the point of intersectionE of Eq. (9.D) and thecurvev′h′. A unique solution exists if the curvev′h′ is convex and ifr∗ < ρ/(1−γ )(1−θ),v∗ > v′. 28 We conclude that in the steady-stateY, C, K andh will grow at the equilibriumraterE, while health and longevity are constant atg∗
E andTE, respectively. The latter arefound by substitutingvE into Eqs. (5) and (1), respectively.
4.2. The trade-offs in the model
The trade-offs mentioned in the introduction that follow from the incorporation of healthin the analysis, are now clearly reflected in the results we have obtained so far. The trade-offbetween health and human capital accumulation can be seen in Eq. (9.D). As we mentionedabove, this equation is comparable to Lucas’ growth results, i.e.r = (δ − ρ)/θ , for g = 1,v = 0 andγ = 0. The presence of the term(1−v) in Eq. (9.D) reflects the fact that a fraction
27 The way in which r∗ and v∗ depend on the parameters of the model can be summarized byr∗ =r[δ(+), z0(+), β(+), ρ(−), θ(−), γ (−)] and v∗ = ν[δ(+), z0(+), β(+), ρ(−), γ (+)], where the sign withinbrackets denotes the sign of the partial derivative with respect to the parameter in question. These results followdirectly from Eq. (9.D) and the requirement thatr(v∗) = 0.28 In van Zon and Muysken (1997) we show that for plausible values of the parameters of the model, theseconstraints are likely to be satisfied. We assume this to be the case in the remainder of the analysis.
A. van Zon, J. Muysken / Journal of Health Economics 20 (2001) 169–185 179
Fig. 2. The south-west quadrant again.
(1 − v) of the labour force is not available for the generation of output or human capital,since its task is to maintain the average health level of the population at its steady-state valueg∗. This lowers the maximum rate of growth attainable in the extended model as comparedto the original Lucas model. The trade-off between consumption and health follows fromthe observation that, as is shown in the Technical Annex, disregarding the contribution ofhealth to welfare by settingγ = 0 and treating the impact on longevity as a pure externality,leads to a growth maximising choice ofv, i.e.v = β/(1+ β). But if we do take account ofthe direct welfare effects of health generation also through its impact on longevity, Fig. 2shows that the point of intersection between the two curves implies a value ofr that is lowerthanr∗, while in that casev > β/(1+β). Hence, the incorporation of the direct contributionof health to welfare (also through longevity) increases the level of health services at theexpense of growth (but not of welfare), ceteris paribus.
5. A comparison of steady-states
As we mentioned in Section 1, we want to analyse how the steady-state characteristics ofthe model depend on the fundamental parameters that represent technology and taste. Therelevant technology parameters areδ andz0, i.e. the productivity of human capital accumu-lation and health generation, respectively, while the relevant taste parameters are 1/θ andρ, reflecting the intertemporal elasticity of substitution and the discount rate, respectively.
In order to illustrate what happens to health, growth and to the size of the health-sectorfor various constellations of the parameters of our model, we have used a graphical analysis
180 A. van Zon, J. Muysken / Journal of Health Economics 20 (2001) 169–185
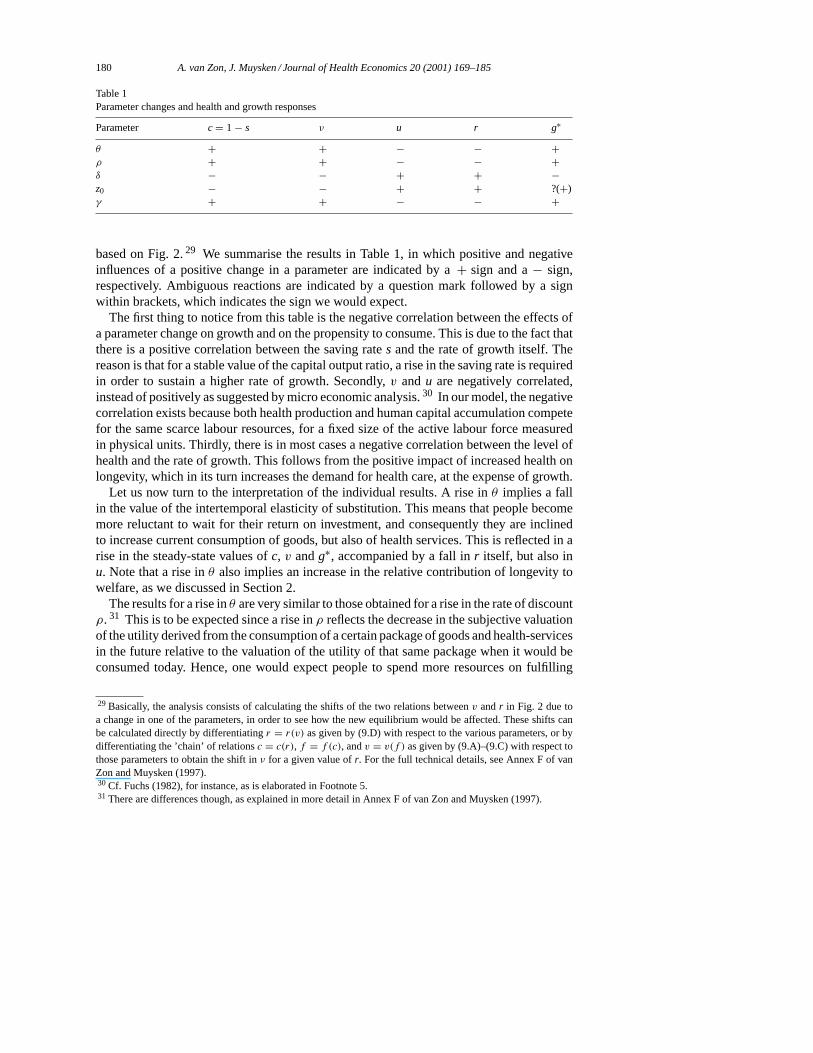
Table 1Parameter changes and health and growth responses
Parameter c = 1 − s ν u r g∗
θ + + − − +ρ + + − − +δ − − + + −z0 − − + + ?(+)γ + + − − +
based on Fig. 2.29 We summarise the results in Table 1, in which positive and negativeinfluences of a positive change in a parameter are indicated by a+ sign and a− sign,respectively. Ambiguous reactions are indicated by a question mark followed by a signwithin brackets, which indicates the sign we would expect.
The first thing to notice from this table is the negative correlation between the effects ofa parameter change on growth and on the propensity to consume. This is due to the fact thatthere is a positive correlation between the saving rates and the rate of growth itself. Thereason is that for a stable value of the capital output ratio, a rise in the saving rate is requiredin order to sustain a higher rate of growth. Secondly,v andu are negatively correlated,instead of positively as suggested by micro economic analysis.30 In our model, the negativecorrelation exists because both health production and human capital accumulation competefor the same scarce labour resources, for a fixed size of the active labour force measuredin physical units. Thirdly, there is in most cases a negative correlation between the level ofhealth and the rate of growth. This follows from the positive impact of increased health onlongevity, which in its turn increases the demand for health care, at the expense of growth.
Let us now turn to the interpretation of the individual results. A rise inθ implies a fallin the value of the intertemporal elasticity of substitution. This means that people becomemore reluctant to wait for their return on investment, and consequently they are inclinedto increase current consumption of goods, but also of health services. This is reflected in arise in the steady-state values ofc, v andg∗, accompanied by a fall inr itself, but also inu. Note that a rise inθ also implies an increase in the relative contribution of longevity towelfare, as we discussed in Section 2.
The results for a rise inθ are very similar to those obtained for a rise in the rate of discountρ. 31 This is to be expected since a rise inρ reflects the decrease in the subjective valuationof the utility derived from the consumption of a certain package of goods and health-servicesin the future relative to the valuation of the utility of that same package when it would beconsumed today. Hence, one would expect people to spend more resources on fulfilling
29 Basically, the analysis consists of calculating the shifts of the two relations betweenv andr in Fig. 2 due toa change in one of the parameters, in order to see how the new equilibrium would be affected. These shifts canbe calculated directly by differentiatingr = r(v) as given by (9.D) with respect to the various parameters, or bydifferentiating the ’chain’ of relationsc = c(r), f = f (c), andv = v(f ) as given by (9.A)–(9.C) with respect tothose parameters to obtain the shift inν for a given value ofr. For the full technical details, see Annex F of vanZon and Muysken (1997).30 Cf. Fuchs (1982), for instance, as is elaborated in Footnote 5.31 There are differences though, as explained in more detail in Annex F of van Zon and Muysken (1997).
A. van Zon, J. Muysken / Journal of Health Economics 20 (2001) 169–185 181
current needs, by redirecting labour input to activities that increase present consumptionpossibilities, rather than future ones. Consequently,c, v andg∗ rise, whiler andu fall.
A rise in the productivity of human capital accumulation, i.e.δ, has quite different effects.Since the latter increases the marginal benefits of investing in human capital accumulation,a reallocation takes place of labour from activities that increase current utility to activitiesthat increase future utility. Consequently, growth is positively affected. In order to makethis possible,c andv fall, while u andr increase. Alsog∗ falls because of the reduction inv.
The previous results are very similar to those obtained for an increase in the productivityof the health sector, i.e.ψ , which corresponds to an increase inz0 (see Eq. (5)). This corrobo-rates the ‘engine-like’ features of the health sector that we pointed out in Section 1. Becausean increase inψ would tend to increaseg∗ for a givenv, it would also permanently increasethe productivity of the human capital accumulation process. The productivity increase in thehealth sector then enables a contraction of the allocation of labour resources to that sector(v falls). The net effect ong∗ is therefore ambiguous, but one would expectg∗ to rise,32
which in turn makes investment in human capital accumulation more profitable because ofits intertemporal spill-over effects. Henceu rises, and so doesr. Similar results are readilyobtained for the other structural parameters that definez0. We do not repeat them here.
A rise in the direct impact of health on utilityγ has all the expected effects. It reducesgrowth and raises average health by changing the allocation of human capital in the directionof health production. In addition to this, the average propensity to consume can rise, becauseof the slow down in growth.
Finally, it is worth mentioning that the effective productivity of the health sector may bethat low (either due to a high value ofς or low values ofβ,ψ orA/µ), that the curve given byEq. (9.D) describes just a few instances ofv that generate (moderately) positive growth.33
Such parameter constellations may be relevant for the poorer developing countries, forexample. In that case, aid aimed at changing the system parameters mentioned above,may well help growth to take off. Growth may even become self-sustaining if medical aidsucceeds in raising life expectancy, and lowering the rate of discount which, by shiftingEq. (9.D), would lead to more promising growth potentials. It should be noted that for thericher countries too, a rise inγ would result in a reduction in growth performance. However,in the latter case that would be choice rather than fate.
6. Model implications
The model has a number of interesting implications. Before pointing these out, how-ever, we would like to stress again that our analysis applies to long-term developments
32 In the decreasing returns setting we have defined, one would expect a reaction to an exogenous shock not tobe able to wipe out all the effects of such a shock, because such a reaction would involve the re-allocation ofresources which were initially allocated in such a way as to generate maximum overall benefits for a given stockof scarce irreproducible labour resources. In fact that is exactly what we found during exploratory simulationswith our model using ‘reasonable’ parameter values, where we observed a fall ing∗ despite the rise inv which isrequired to counter the effects of a rise inς . Note that a rise inς would have the same effect as a fall inψ . Seevan Zon and Muysken (1997) for more details.33 This might also be caused by a high value of the rate of discountρ or a high value of the relative contributionof health to welfareγ .
182 A. van Zon, J. Muysken / Journal of Health Economics 20 (2001) 169–185
and balanced growth situations. The phenomena we discuss here — like the productivityslow-down — could be interpreted to occur in the transition to a steady-state growth sit-uation, in which case they would have to be explained from the transitional dynamics ofthe growth model. However, they could also be explained as the outcome of a process ofbalanced growth, where different situations correspond to different parameter constellationsregarding technologies and tastes. We present the latter explanation in this analysis.
First of all, the fact that we have a decreasing returns health sector which level of activitydefines the effective availability of human capital within the economy, makes the efficiencyof this sector one of the central determinants of economic performance. Indeed, the no-tion that effective inputs of human capital and labour into the various production processesdepend on one’s health status, makes health a complement to growth from a supply per-spective. Moreover, a change inψ or ς (and to a lesser extentA andµ depending on thevalue ofβ (cf. Eq. (5)) is as important for growth as an equal proportional change inδ. Thisstresses the importance of health as a determinant of both the level and the growth of labourproductivity, quite apart from the direct positive welfare effects induced by changes in theproductivity of the health sector.
Second, the influence of the decreasing returns nature of the health sector on growthprovides an interesting alternative explanation for the productivity slow-down. If, as seemsreasonable to assume, the preference of people for a good health rises with the standard ofliving, i.e.γ rises with output per head, then growth would automatically slow down in theprocess.
Third, the average age of the population in Western European economies has shown atendency to rise during the last decades. This introduces a wedge between the two functionsof the population in our model. It is the active population that determines labour supply, andhence the scale of all economic activities which rely on the use of labour services, whilethe total population determines the scale of the demand for health-services. Hence, techno-logical breakthroughs in medicine could be expected not only to boost overall productivity,but also to provide a brake on productivity growth, although not necessarily on the growthof welfare, through rises in longevity.
Fourth, in the case of high values of the rate of decay of health, due to malnutrition forinstance, people may have such a high preference for consumption now, reflected by a lowvalue of the intertemporal elasticity of substitution (i.e. a high value ofθ ), that they couldbecome stuck in a ‘no growth’, ‘low health’ situation because there are only very few, if any,instances ofv with positive growth. This suggests that policies aimed at furthering growthby means of reducingζ , or increasingδH , through direct aid in the form of technology orincome transfer, may induce growth which is sufficiently high to lower the rate of discountρ and increase the intertemporal elasticity of substitution 1/θ to such an extent, that savingswill arise that will allow growth to take-off and become self-sustaining.
7. Summary and conclusion
In this paper, we have presented a simple model of endogenous growth based on theLucas (1988) model, in which a good health functions as a necessary condition for peopleto be able to provide labour services. At the same time, health is produced under conditions
A. van Zon, J. Muysken / Journal of Health Economics 20 (2001) 169–185 183
of decreasing returns, whereas human capital is produced under conditions of increasingreturns. If we regard the impact of health on longevity as an externality, we find that thehealth sector has a size that is consistent with maximum economic growth. In that case,health is a pure complement to growth, and any re-allocation of labour from the healthsector towards human capital accumulation activities would cause a decline in growth.
In our model, however, we internalise the impact of health on longevity, because part oftotal welfare at the population level comes in the form of longevity itself. In order to solvethe resulting steady-state values of growth and health, we devised a graphical procedurethat enables us to show that increases in the demand for health services caused by an ageingpopulation, will now adversely affect growth; next to being complements, as mentionedabove, health and growth have also become substitutes. This provides a dynamic version ofBaumol’s disease with respect to the health sector — in particular when the preference ofpeople for a good health rises with the standard of living.
We also concluded that, since the steady-state growth rate rises linearly in the averagehealth-level of the population, the productivity of the health-sector is as important a deter-minant of growth as the productivity of the human capital accumulation process itself.
Finally, we have arrived at the conclusion that there may be circumstances regarding theprovision of health-services and life expectancy, in which it may be hard for growth to takeplace at all. Aid meant to improve the productivity of the health-sector or the net availabilityof human capital resources for non-health activities in the poorer developing countries, couldactually lead to growth taking off on its own. Growth can even become self-sustaining ifthe rate of discount would fall and the intertemporal elasticity of substitution would rise inthe face of structural gains in life expectancy.
Appendix A. Technical annex
The Hamiltonian of the revised system can be written as
H = e−ρtCγ1(nµ)γ2(g∗)γ3/(1 − θ)
+λ(B((1 − u− v)g∗hnA)αK1−α − C)+ ξδug∗h (A.1)
whereC, u andv are the control variables, andK andh are the state variables that growwith the balanced growth rate in equilibrium.g∗ = z0v
β is a ‘quasi’-state variable, sinceit must be constant in the steady-state. Moreover,γ1 = (1 − γ )(1 − θ), γ2 = 1 − γ1 andγ3 = 1 − (1 − 2γ )(1 − θ). Note that for a value ofγ ≥ 1/2 we haveγ3 ≥ 1.
The first order conditions with respect to the control variables are
∂H
∂C= (1 − γ )e−ρtCγ1−1(nµ)γ2(g∗)γ3 − λ = 0 (A.2)
∂H
∂u= − λαY
(1 − u− v)+ ξδg∗h = 0 (A.3)
∂H
∂v= γ3βe−ρtCγ1(nµ)γ2(g∗)γ3
(1 − θ)v− λαY
1 − u− v+ λαYβ
v+ ξδuβg∗h
v= 0 (A.4a)

184 A. van Zon, J. Muysken / Journal of Health Economics 20 (2001) 169–185
If we would ignore the direct influence of health on welfare as well as the influencethrough longevity, i.e. treatL as given in the welfare function and not substituting (1) in thewelfare function while settingγ = 0, Eq. (A.4a) is reduced to
∂H
∂v= − λαY
1 − u− v+ λαYβ
v+ ξδuβg∗h
v= 0 (A.4b)
Substituting (A.3) into (A.4b) and then solving forv, gives usv = β/(1 + β). But if wedo take account of (1) and substituteC = (1 − s)Y , wheres is the saving rate, as well as(A.2) and (A.3) into (A.4a), we get
(1 − s)γ3β
(1 − γ )(1 − θ)v− α
1 − u− v+ αβ
v+ αuβ
(1 − u− v)v= 0 (A.5)
Substitution of (A.3) in the first order condition∂H/∂h = −dξ/dt leads to the followingresult
−ξ = δg∗(1 − v) (A.6)
Assuming the existence of a steady-state, we can use (A.6), (A.2) and the underlying pro-duction function in order to obtain
r = Y = K = h = C = − (ξ + ρ)
θ + γ (1 − θ)=(δg∗(1 − v)− ρ
θ + γ (1 − θ)
)(A.7)
which is the same as Eq. (9.D). The rate of growth of human capital accumulation is givenby
h = δug∗ (A.8)
Moreover, from the condition that∂H/∂h = −dλ/dt and (A.2) in combination with thedefinition,s = (dK/dt)/Y = K(K/Y ) andC = K, it follows directly that
s = (1 − c) = (1 − α)r
(r(θ + γ (1 − θ))+ ρ (A.9)
which is equivalent to Eq. (9.C). Substituting (A.8) into the numerator of (A.9) and (A.7)into the denominator of (A.9), we have
(1 − c) = (1 − α)u
(1 − v)⇒ u = (1 − c)(1 − v)
(1 − α)(A.10)
(A.10) is the same as Eq. (9.E). Substitution ofc = 1− s and (A.10) into (A.5) and solvingfor v, results in
v = c(c − α)+ α(1 − α)(1 − θ)(1 − γ )/(θ + (1 − θ)2γ )
c(c − α)+ ((1 + β)/β)α(1 − α)(1 − θ)(1 − γ )/(θ + (1 − θ)2γ )(A.11)
which is the same as Eq. (9.B) after substitutingf = c(c− α). The latter relation betweenf andc is the same as Eq. (9.A).

A. van Zon, J. Muysken / Journal of Health Economics 20 (2001) 169–185 185
References
Aghion, P., Howitt, P., 1992. A model of growth through creative destruction. Econometrica 60, 323–351.Barro, R.J., 1990. Government spending in a simple model of endogenous growth. Journal of Political Economy
98, S103–S125.Barro, R.J., Sala-i-Martin, X., 1995. Economic Growth. McGraw-Hill, New York.Baumol, W.J., 1967. Macroeconomics of unbalanced growth: the anatomy of urban crisis. American Economic
Review 57, 415–426.Centraal Planbureau, 1999. Ramingsmodel Zorgsector. Eindrapport tweede fase, Den Haag.Ehrlich, I., Chuma, H., 1990. A model of the demand for longevity and the value of life extension. Journal of
Political Economy 98, 761–782.Ehrlich, I., Lui, F.T., 1991. Intergenerational trade, longevity, and economic growth. Journal of Political Economy
99, 1029–1059.Forster, B.A., 1989. Optimal health investment strategies. Bulletin of Economic Research 41, 45–57.Fuchs, V.R., 1982. in: Fuchs, V.R. (Ed.), Time Preference and Health: An Exploratory Study, Economic Aspects
of Health. Conference Report NBER, University of Chicago Press.Grossman, M., 1972. The Demand for Health: A Theoretical and Empirical Investigation. NBER, Occasional
Paper 119, Columbia University Press.Johansson, P.O., Lofgren, K.G., 1995. Wealth from optimal health. Journal of Health Economics 14, 65–79.Knowles, S., Owen, D.P., 1997. Education and health in an effective-labour empirical growth model. The Economic
Record 73, 314–328.Lapre, R.M., Rutten, F.F.H., 1993. Economie van de Gezondheidszorg, Leerboek voor universitair en hoger
beroepsonderwijs, tweede herziene druk. Uitgeverij Lemma BV, Utrecht.Lucas, R.E., 1988. On the mechanics of economic development. Journal of Monetary Economics 22, 3–42.Meltzer, D., 1997. Accounting for future costs in medical cost-effectiveness analysis. Journal of Health Economics
16, 33–64.Muysken, J., Yetkiner, I.H., Ziesemer, T., 1999. Health, Labour Productivity and Growth. MERIT Research
Memorandum, 99-030.Muurinen, J.M., 1982. Demand for health: a generalised grossman model. Journal of Health Economics 1, 5–28.OECD, 1999. Health data 1999: A Comparative Analysis of 29 Countries. OECD, Paris.Polders, J.J., Meerding, W.J., Koopmanschap, M.A., Bonneux, L., van der Maas, P.J., 1997. Kosten van Ziekten in
Nederland 1994. Instituut Maatschappelijke Gezondheidszorg, Instituut voor Medische Technology Assesment,Erasmus Universiteit, Rotterdam.
Romer, P.M., 1990. Endogenous technological change. Journal of Political Economy 5, 71–102.van Zon, A.H., Muysken, J., 1997. Health, education and endogenous growth. MERIT Research Memorandum,
97-009.