Clusters of invention, life cycle of technologies and endogenous growth
33
Journal of Economic Dynamics & Control 30 (2006) 687–719 Clusters of invention, life cycle of technologies and endogenous growth Murat Iyigun a,b, a Department of Economics, University of Colorado at Boulder, Campus Box 256, Boulder, CO 80309-0256, USA b Department of Economics, Sabanci University, Orhanli, 34956, Istanbul, Turkey Received 6 October 2004; accepted 19 February 2005 Available online 24 June 2005 Abstract This paper combines learning-by-doing with R&D activity that can be directed to either the discovery of new technologies (inventions) or the improvement of the quality of machines without altering their underlying technology (innovations). By doing so, it establishes that learning-by-doing is an important determinant of the relative share of resources allocated to inventive versus innovative activities. The dynamics of the model generates endogenous economic growth driven by cycles of technological change, where the pattern and timing of technological improvements are consistent with the historical evidence: (a) inventions and innovations play complementary roles in expanding the technology frontier; (b) when inventions occur they tend to arrive in clusters; and (c) all new technologies go through a life cycle, during the early stages of which a discovery is followed by a period of rapid economic growth and innovation and the late stages of which dwindling innovations and slower growth set the stage for new discoveries. r 2005 Elsevier B.V. All rights reserved. JEL classification: I20; J24; O11; O31; O40 Keywords: Inventions; Innovations; Learning-by-doing; Human capital ARTICLE IN PRESS www.elsevier.com/locate/jedc 0165-1889/$ - see front matter r 2005 Elsevier B.V. All rights reserved. doi:10.1016/j.jedc.2005.02.007 Tel.: +1 303 492 6653; fax: +1 303 492 8622. E-mail address: [email protected].
-
Upload
independent -
Category
Documents
-
view
3 -
download
0
Transcript of Clusters of invention, life cycle of technologies and endogenous growth

ARTICLE IN PRESS
Journal of Economic Dynamics & Control 30 (2006) 687–719
0165-1889/$ -
doi:10.1016/j
�Tel.: +1 3
E-mail ad
www.elsevier.com/locate/jedc
Clusters of invention, life cycle of technologiesand endogenous growth
Murat Iyiguna,b,�
aDepartment of Economics, University of Colorado at Boulder, Campus Box 256, Boulder,
CO 80309-0256, USAbDepartment of Economics, Sabanci University, Orhanli, 34956, Istanbul, Turkey
Received 6 October 2004; accepted 19 February 2005
Available online 24 June 2005
Abstract
This paper combines learning-by-doing with R&D activity that can be directed to either the
discovery of new technologies (inventions) or the improvement of the quality of machines
without altering their underlying technology (innovations). By doing so, it establishes that
learning-by-doing is an important determinant of the relative share of resources allocated to
inventive versus innovative activities. The dynamics of the model generates endogenous
economic growth driven by cycles of technological change, where the pattern and timing of
technological improvements are consistent with the historical evidence: (a) inventions and
innovations play complementary roles in expanding the technology frontier; (b) when
inventions occur they tend to arrive in clusters; and (c) all new technologies go through a life
cycle, during the early stages of which a discovery is followed by a period of rapid economic
growth and innovation and the late stages of which dwindling innovations and slower growth
set the stage for new discoveries.
r 2005 Elsevier B.V. All rights reserved.
JEL classification: I20; J24; O11; O31; O40
Keywords: Inventions; Innovations; Learning-by-doing; Human capital
see front matter r 2005 Elsevier B.V. All rights reserved.
.jedc.2005.02.007
03 492 6653; fax: +1 303 492 8622.
dress: [email protected].

ARTICLE IN PRESS
M. Iyigun / Journal of Economic Dynamics & Control 30 (2006) 687–719688
1. Introduction
This paper presents an endogenous economic growth model which combineslearning-by-doing with R&D activity that can generate two types of technologicalprogress: inventions and innovations. The novelty of this approach lies in the fact thatdisembodied technological progress, in the form of learning-by-doing, is combinedwith differentiated R&D that can generate both major and minor embodiedtechnological change.1
All types of technical advance embedded into this model have been shown toinfluence economic growth in the long run.2 It is also well documented that technicalprogress is clustered and economic growth is cyclical—two aspects of economicdevelopment that are not readily explained. In existing related work, in which at leastone type of technical progress is omitted, some additional mechanism related to thetiming and nature of R&D activity is usually invoked in order to derive the episodicand cyclical features of development.3 The theory advanced below identifies that thedynamic interplay between learning-by-doing and R&D incentives can by itselfaccount for the clusters of innovative and inventive activity, and hence, the cycles ofendogenous growth.
Furthermore, incorporating learning-by-doing into a model of directed R&D withmajor and minor technological breakthroughs helps to explain some other well-established empirical regularities. For instance, Tratjenberg (1989, 1990) documentsthat the societal welfare gains of product innovations follow an inverted-U shapepattern over time. Relying on the introduction of tomography scanners in the 1970sand the refinements introduced in later generation CAT scanners, he shows that thegains start high with the introduction of a first commercial application, rise furtherstill during the early and medium stages (during which newer generation machinesare introduced), and then decline rapidly in the final maturity phase. He concludes,‘‘Such a pattern...may be accounted for by an initial phase of scale economies,promptly followed by the setting-in of sharply diminishing returns.’’ As the modelbelow will show, one can conjecture that the initial phase of scale economies kickstarts with the invention of new technologies while the subsequent gains and declinesin welfare can be ascribed to the roles of innovations and bounded learning-by-doingin total factor productivity. In addition, a model of directed R&D with two types ofembodied technical change, such as the one below, would predict that the amount ofinnovative R&D activities relative to that of inventive activities would also follow an
1Hereafter, I define inventions to encompass all kinds of major discoveries or leaps up the quality ladder
a la Grossman and Helpman (1991) and Aghion and Howitt (1992). And I define innovations as
Schumpeterian improvements in machine or production-process quality–neither of which profoundly alter
the underlying sophistication of existing technologies.2For the role of learning-by-doing, Arrow (1962) and Lucas (1988), for models of invention, Romer
(1990), Grossman–Helpman (1991), and Aghion–Howitt (1992), and for the effect of innovations on the
process of technological change and growth, Schumpeter (1934) are some of the leading examples of
relevant work.3For specific references, see Section 2.

ARTICLE IN PRESS
M. Iyigun / Journal of Economic Dynamics & Control 30 (2006) 687–719 689
inverted-U shape pattern. This would be consistent with Tratjenberg’s mainobservation regarding the societal welfare gains of product innovations.
Embedding learning-by-doing into a model of directed R&D with inventions andinnovations also helps to interpret how technical change influences the wagedynamics in general and the experience premium in particular. Schultz (1975), andJuhn–Murphy–Pierce (1993) find that returns to experience declines and those ofadaptability and education rises in periods of rapid technological advance. In asimilar vein, Bartel and Lichtenberg (1991), Bartel and Sicherman (1999), andBerman–Bound–Griliches (1994) show that industries with cutting-edge technologiespay higher skill premiums and that they reward less tenure and experience. Themodel below would help to account for such findings because it suggests that returnsto experience ought to increase with the vintage of technologies.
Although rapid and sustained technological change is a relatively recentphenomenon, the history of technological progress reveals three distinct empiricalregularities. First, there exists a strong complementarity between inventions andinnovations in expanding the technology frontier. Without inventions, theinnovative process would eventually be subject to decreasing returns, and absentproductivity-enhancing innovations, technological progress could come to a halt.Second, major breakthroughs in technology arrive infrequently and in clusters. It iswell documented, for example, that the height of the ancient Greek civilizationbetween 400 BC and 100 AD, the Sung dynasty rule in China between the 10th andthe 13th centuries, and more recently, the Industrial Revolution of the 18th centurywere periods during which many new and path-breaking discoveries were made.4
Finally, in yielding the complementarity between inventions and innovations,most—but due to clustering, not all—new technologies appear to go through a three-period life cycle: the early stages, during which the newly discovered technologies areadopted and the potential benefits of learning-by-doing are largest, the improvement
phase in which rapid innovations make the existing technology more efficient andaccessible, and maturity during which dwindling innovative activity and slowingproductivity gains set the stage for the discovery of other more advancedtechnologies.5
4For references on these episodes, see Rosenberg (1982, pp. 55–70), Mokyr (1990, p. 298), and Easterly
(2001, p. 176).5Take James Watt’s steam engine. It was invented in 1765, but until numerous subsequent
improvements were made in its design, it remained a crudely engineered piston used principally as a
water pump. In 1776, John Wilkinson’s boring eliminated the gaps between the cylinders and the pistons.
In 1781, William Murdock’s sun and planter gearing system provided a means of converting vertical
motion into rotary force. (See Mokyr pp. 290–302 for more details.)
Or take the development of the automotive turbo-charger. ‘‘A Swiss engineer, Alfred J. Beuchi, invented
the turbocharger, the basic patent dating from 1905...The first design prototypes for diesel engines were
large, bulky machines with cumbersome rotating assemblies containing a number of parts. Moreover, they
were low on component efficiency...Several U.S. manufacturers, in particular Schwitzer, undertook the
development of commercial turbochargers for high-speed diesels in the early fifties...The application of the
turbocharger to high-speed diesels necessitated changes in the unit’s design. Manufacturers developed
sleeve bearings suitable for extremely high rotating speeds. Moreover, using wheel designs suitable for
mass production from precision castings, they developed centripetal, radial in-flow turbines, which had

ARTICLE IN PRESS
M. Iyigun / Journal of Economic Dynamics & Control 30 (2006) 687–719690
In the model below, learning-by-doing alters the R&D incentives for the discoveryof new technologies (inventions) differently from those for improving existing ones(innovations). This is due to the fact that productivity gains from learning-by-doingare high but unrealized for newly discovered technologies. Thus, new inventions spurR&D effort aimed at the discovery of even more sophisticated technologies asproductivity remains relatively low in periods immediately following the introduc-tion and adoption of new technologies. This raises the likelihood that a newinvention will be made soon after the invention of a superior technology, andtherefore, that there will be a clustering of inventions.
If entrepreneurial efforts fail to generate such a clustering, however, productivityrises rapidly as a result of learning-by-doing with an existing technology.Consequently, the economic reward to embodying this knowledge into a newmachine which uses the existing technology increases. That is, as learning-by-doingoccurs, the incentives to innovate and improve existing technologies—by introducingnewer generation more efficient machines without altering the underlyingtechnology—rise relative to the incentives to develop new technologies. This impliesthat, when the episode of new discoveries comes to an eventual end, the likelihood ofentering a phase of intensified innovative activity rises. Nonetheless, the productivitygains and the expected entrepreneurial profits associated with the introduction ofnew generation machines are bounded from above as they are constrained by theunderlying sophistication of the technology in use. While monopoly profits of a newinvention remains positive in the long run, those of innovation monotonicallyapproach zero with the introduction of each new generation machine. Thus when atechnological breakthrough is made long after the introduction of an existingtechnology, it is likely to be in the form of a new discovery.
In sum, the dynamics of the model below is such that they generate endogenousand stochastic growth cycles, which are driven at times by discovery and inventionepisodes and at others by spurts of innovative activity. While the stochastic nature ofthe model allows long periods of technological stagnation during which neither newtechnologies are invented nor existing older ones are improved upon, the distinctionbetween inventive versus innovative R&D activities and the impact of learning-by-doing on R&D incentives help to generate empirically consistent patterns oftechnological change.
2. Related literature
This paper is related to two existing strands in the literature. The first strandincludes papers that model the distinction between inventions and innovationswithout explicitly incorporating learning-by-doing. Most notable among them is
(footnote continued)
advantages in terms of design simplicity and cost. In addition, manufacturers developed compressors of
different flow ranges and characteristics. Most important, the development work in the early fifties led to
standardization of parts.’’ (See Abernathy and Ronan, 1979.)

ARTICLE IN PRESS
M. Iyigun / Journal of Economic Dynamics & Control 30 (2006) 687–719 691
Jovanovic and Rob (1990) who show that R&D effort is driven by explorers’ beliefswhich trade off the prospect of major new discoveries against the rewards to refiningpast discoveries. Using four axioms borrowed from optimal geological search,Jovanovic and Rob demonstrate that there exists a range of parameter values underwhich cycles of inventions and innovations are possible. Matsuyama (1999) developsa model of growth cycles in which innovations are clustered. He demonstrates thatintroducing new goods at a time when others do raises monopoly rents because ofthe partial substitutability of new products with existing varieties. Francois andLloyd-Ellis (2003) also develop a model of R&D-based growth in which innovationsin productivity arrive clustered across different industries. The mechanism thatdelivers clustering in their model is similar to that of Matsuyama: entrepreneurs indifferent sectors try to time their implementations so as to ensure that their profitsarrive when aggregate economic activity is robust. Helpman and Tratjenberg (1998)develop a cyclical growth model in which the development of each new majordiscovery prompts investment in complementary inputs. The cyclicality of their long-run dynamics arises because productivity gains start to accumulate only after enoughcompatible inputs become available. In a similar vein, Aghion and Howitt (1996)distinguish research that produces fundamental knowledge from development whichgenerates secondary knowledge. They demonstrate that economic growth ispositively correlated with research even in extreme cases where fundamentalknowledge is created indirectly by secondary knowledge. Galor and Tsiddon (1997)consider a model in which there exists cycles of invention followed by epochs ofinnovation and how these affect the pace economic growth via occupational choices.Their primary focus is on the interplay between inventions and innovations on theone hand, and the returns to different dimension of skills (such as innate ability andtechnology-specific human capital) and intergenerational economic mobility on theother. In a more recent piece, Waelde (forthcoming) reconciles the cyclicalendogenous growth models, most of which predict countercyclical R&D investment,with the empirical findings that suggest procyclical investment in R&D. Whatgenerates procyclicality in R&D investment in his model is the stochastic nature oftechnological advance due to R&D.
The second strand to which this paper is related combines learning-by-doing andeconomic growth with either inventions or innovations. In Young (1993), newinventions are initially implemented inefficiently but production experience enablessmall innovations to take place. By combining inventions with learning-by-doing,Young shows that learning experience and inventive activity can alternate to imposeconstraints on an economy’s ability to grow. Stein (1997) emphasizes a model ofinnovations with knowledge spillovers where firm-specific learning-by-doing on thepart of incumbent firms gives them an advantage over would-be entrants. His modelgenerates clusters of innovation because, when a new firm displaces an incumbent,an industrial shake-up occurs, thus enabling other potential entrants to more easilydisplace the new firm, which has less cumulative learning advantage than theprevious incumbent. Stokey (1988) incorporates the introduction of newer goodsinto a model of learning-by-doing. She shows how the set of goods produced variesaccording to the economy’s knowledge stock and cumulative production experience.
ARTICLE IN PRESS
M. Iyigun / Journal of Economic Dynamics & Control 30 (2006) 687–719692
The model here differs from existing work because it combines inventions andinnovations with learning-by-doing. By focusing on the inextricable link betweenlearning-by-doing and directed R&D, the model identifies learning-by-doing to be animportant determinant of growth cycles. While this model—like that of Jovanovicand Rob—generates clustering of innovative and inventive activities in the presenceof endogenous growth cycles, the mechanism it relies on is the plausible interactionbetween embodied and disembodied technical change. As it will become apparent,cumulative learning experience with an existing technology is a prime determinant ofwhether, at any given point in time, the economic incentives to invent or to innovatedominate. And these incentives in turn affect the source and pace of economicgrowth.
3. The building blocks and empirical support
The model presented below rests on four features, all of which find empirical andhistorical support.
(I) Embodied technological progress is due to inventions and innovations. Mokyr(1990, p. 297) notes, ‘‘The main reason why I have dwelled so long on the distinctionbetween micro- [innovations] and macro-inventions [inventions] is that both werevery much part of the story. Here, then, is the most fundamental complementarity ofthe economic history of technological change. Without big new ideas, the drift ofcumulative small inventions will start to run into diminishing returns.’’ Rosenberg(1982, p. 62) also addresses this issue when he declares, ‘‘improvements inproductivity often continue to come long after the initial [invention] as the productgoes through innumerable minor modifications and alterations...’’
(II) R&D resources can be directed to either inventive or innovative research activity.
A number of economic historians have documented that both major technologicalbreakthroughs and minor technical innovations have resulted historically fromdeliberate search and R&D effort, and that both of the latter were guided, at least tosome extent, by the laws of supply and demand and by the signals of priceadjustment.6
(III) Learning-by-doing is technology specific.7 Hence, it predominantly affects the
incentives to innovate. Rosenberg (pp. 123–124) distinguishes ‘‘learning-by-using’’ asa distinct form of learning-by-doing that eventually leads to embodied as well asdisembodied technological change.
In discussing this phenomenon with respect to the aircraft industry, Rosenbergnotes ‘‘...the early experience with a new technology leads to a better understandingof the relationship between specific design characteristics and performance thatpermit subsequent improvements in design. In this case, the result is an appropriate
6See Mokyr (p. 295), Ruttan (1959) and Usher (1929).7Technology-specific learning-by-doing does not rule out firm-specific learning-by-doing. However, in a
model where final goods producers are identical and demand for machines is iso-elastic, they will be strictly
monotonically and positively related. I discuss this in more detail below.
ARTICLE IN PRESS
M. Iyigun / Journal of Economic Dynamics & Control 30 (2006) 687–719 693
design modification. Optimal design often involves many iterations...Learning-by-using in aircraft generates highly specialized knowledge concerning the optimaldesign of aircraft components. This knowledge flows into a growing pool atthe product development stage...[out of which] comes a steady flow of smallimprovements that can be embodied in new hardware.’’
There also exists a number of historical case studies of various other industrieswhich, at least implicitly, support such a role.8
(IV) Productivity gains from learning-by-doing are bounded from above. Empiricalsupport is provided by Levhari and Sheshinki (1973) who show that the elasticity ofoutput with respect to production experience is a strictly concave function of thelevel of experience. Also, Epple et al. (1991) find that the gains from learning isdecreasing in the level of knowledge.9
In the model below, these four building blocks interact as follows. Due to (I) and(II), the R&D resources of an economy will be allocated to efforts aimed at bothinvention and innovation. Given (III), the relative share of resources allocated toinnovation will increase the longer an existing invention stays in use and the moregains from learning-by-doing accrue. As a result of (IV), the more these gains areembodied in newer machines that introduce minor innovations, the smaller will bethe expected profits from further innovation. Thus, due to (III) and (IV), the share ofresources allocated to the discovery of new technologies (inventions) will be highwhen the technology in use is either relatively new or relatively old.
The remainder of the paper is organized as follows. Section 4 describes the model.Section 5 discusses its dynamic behavior. Section 6 provides a couple of numericalexamples to highlight the main results and Section 7 concludes.
4. The economy
4.1. Production
Consider an economy in which real economic activity extends over infinite discretetime. Production is carried out by a continuum of firms indexed by j, j 2 ½0; 1�. Eachfirm produces a single homogenous good, y
jt, using a machinery aggregate, M
jt, and a
labor aggregate, Ljt, with the following constant returns to scale (CRS) production
technology:
yjt ¼ AtðM
jtÞaðL
jtÞ1�a; 0oao1, (1)
where At denotes an endogenously determined productivity variable for theunderlying level of technology of vintage t, 0ptpt. The productivity parameter,At; is related to learning-by-doing, while the machinery aggregate M
jt is influenced by
the underlying sophistication and quality of machines in use. (I elaborate on the
8For other related historical accounts, also see Hunter (1949) and Atack and Passell (1994). For case
studies from the auto industry, see Abernathy and Ronan (1979).9For more details on this point, see Young (1993).
ARTICLE IN PRESS
M. Iyigun / Journal of Economic Dynamics & Control 30 (2006) 687–719694
determination of At in more detail in Section 4.3.) By definition, aggregate output attime t, Y t, equals the sum of output produced by all firms.
The labor market is competitive. Thus, the wage rate paid to labor, wt, equals itsmarginal product:
wt ¼ ð1� aÞAt
Mt
Lt
� �a
, (2)
where Mt and Lt denote the sum of the machinery and labor input of all firms.
4.2. Individuals
Individuals live for two periods in overlapping generations. They are endowedwith one unit of time in each period. In the first period, individuals work and save. Inthe second period, they consume. In both periods, individuals supply their laborinelastically. Preferences are represented by a utility function that is linear inconsumption in the second period.10 There is no population growth.
4.3. The technology and potential vs. actual productivity
Firms must purchase new machines in every period t because machines depreciatefully in one period. Let zt and qt, respectively, denote the quality and quantity ofmachines utilized in production at time t, and let ft represent the underlying level oftechnological sophistication in the same period. One can think of the term ftzt as theoverall quality of a given machine. With this formulation, I am essentially adoptingthe notion that changes in a machine’s overall quality can be decomposed into twocomponents: one that is conditional on the level of the existing technology, zt, and aresidual which is directly determined by the technology itself, ft.
I assume that the machinery aggregate used in production at time t, Mt, is given bythe following:
Mt ¼ftztqt
a1=a. (3)
This equation implies that the machinery aggregate, Mt, is an increasing functionof the number and quality of machines used in production.11
According to Eqs. (1) and (3), there are three sources of potential productivitygrowth. Inventions and innovations, which represent embodied technological changeand respectively determine the values of ft and zt in Eq. (3). And learning-by-doing,
10Neither a utility function that is non-linear in consumption nor the existence of individuals who also
consume in the first period would materially affect the main results.11As will become apparent below, the fact that the productivity parameter in (3) is a particular function
of a is what generates isoelastic demand for machines. I borrow this specification from Acemoglu (1998)
and Iyigun and Owen (2005). The qualitative nature of the results below would remain intact under
alternative specifications in which the quality and quantity of machines jointly determine the machinery
aggregate.

ARTICLE IN PRESS
M. Iyigun / Journal of Economic Dynamics & Control 30 (2006) 687–719 695
which represents disembodied technological change and influences the productivityvariable At in Eq. (1).
More formally, consider the following:(a) Inventions: The process is such that a new invention moves the underlying
technological sophistication of machines one step up the quality ladder. That is, ifthere is an invention in any given period t, the technology level ft rises such thatft ¼ gft�1, where g41.12 Otherwise, the technology parameter stays unchanged sothat ft ¼ ft�1. In what follows, this specification shall represent the standard qualityladders approach to technological change a la Grossman–Helpman and Aghion–Howitt.
(b) Innovations: For any given level of underlying technology, ft, there exists amaximum attainable machine quality which I will denote by z. The introduction ofeach new generation machine brings the actual machine quality closer to thismaximum z. Thus, the process of innovation is such that
zt ¼ z exp �1
xt
� �, (4)
where xt, xt ¼ 1; 2; 3 . . .1, is an index that identifies the machine generation used inproduction.
The fact that the introduction of new generation machines occurs with decreasingmarginal product, whereas the invention of new machines does not, is intended tocapture the notion that innovations are made to existing technologies. Hence, thesophistication of technologies in use is what bounds from above the productivityimprovements associated with innovations. As stated at the end of Section 1,Tratjenberg (1989, 1990) provides evidence that the welfare gains of innovativeactivities start high with the introduction of a first commercial application butdecline as the underlying technology matures. Eq. (4) is intended to capture suchdiminishing returns to innovative R&D investment. While the general nature of theresults that I present below would be invariant to some modification, the crucialassumption necessary for the results below is for the returns to innovation to declinefaster than those to invention.
Given that xt denotes the generation of machines which embed a certaintechnology, ft, improvements in the quality of machines are decreasing in theirvintage. In particular, the specification in (4) implies that
limxt!1
zt ¼ z expð�1Þ and limxt!1
zt ¼ z4z expð�1Þ. (5)
(c) Learning-by-doing: Even when there are no new inventions or innovations thatraise the quality of machines available to the final-goods producers, actual pro-ductivity can still improve due to disembodied technical change. Learning-by-doing
12For simplicity, I assume that, whenever a discovery is made, the leap up the ladder is by the same
proportion (i.e. without diminishing marginal product). Under a more realistic setup in which the size of
the jump or the number of jumps up the technology ladder in any one period is allowed to vary (without
the decreasing marginal product property setting in), the qualitative nature of the results presented below
would not be changed.

ARTICLE IN PRESS
M. Iyigun / Journal of Economic Dynamics & Control 30 (2006) 687–719696
allows more efficient use of existing machines of a given technology vintage. Thus,the older the technology, the more efficient its use:
At ¼ A exp �1
1þ t� t
� �, (6)
where t� t is the length of time machines with underlying technology level of vintaget have remained in use.13
The fact that learning-by-doing occurs with decreasing marginal product allowsthe learning curve to be a concave function of time in use. Put differently, Eq. (6)ensures that productivity gains from learning-by-doing are bounded from above. AsI have alluded to in Section 3, this specification is in line with the empirical findingsof Levhari and Sheshinki (1973), who show that the elasticity of output with respectto production experience is a strictly concave function of the level of experience, aswell as those of Epple et al. (1991), who document that the gains from learning isdecreasing in the level of knowledge. While Eq. (6) is one way of generating boundedlearning-by-doing, the results presented below are immune to alternative specifica-tions where learning-by-doing depends on the levels of production (a la Young) orinvestment (a la Arrow).
The specification in (6) implies that
limðt�tÞ!0
At ¼ A expð�1Þ and limðt�tÞ!1
At ¼ A4A expð�1Þ. (7)
Thus, to the extent that a given technology of vintage t stays in use and does notbecome obsolete, learning-by-doing allows the productivity derived from the use of atechnology, At, to converge to its potential, A.
Fig. 1 shows the effect of learning-by-doing on the productivity parameter At.Fig. 2 shows how the introduction of a newer generation machine improves machinequality zt.
Based on the three channels of embodied and disembodied technological changejust described, we can make three observations. First, since a first generationmachine is introduced with each new invention that moves the underlyingtechnological sophistication level up one notch, t� t ¼ 0) xt ¼ 1: Put differently,a new invention can be interpreted as the introduction of the very first generationmachine which utilizes a new technology. Second, note the distinction between t� tand xt: the former increases every period as long as the existing technology stays in
13Before we proceed further, it is worthwhile to eloborate on how to interpret and evaluate the role of
learning-by-doing in this model. The OLG framework and the discrete-time setup implies that each period
corresponds roughly to 15–35 years (with the lower and higher figures, respectively, representing the
midlife mark during the pre-modern and the modern eras). Hence, we can interpret learning-by-doing in
two distinct ways in this model: First, to the extent that Eq. (4) applies within each time period, learning-
by-doing would apply at the individual level and could be proxied by workers’ labor market experience.
Second, in the context of this model, learning by doing has an implicit inter-generational aspect, as a result
of which productivity could improve due to the transmission of knowledge across generations. As we show
in Iyigun and Owen (2005), such knowledge transmission from the old generation to the young would be
more experience-based in environments in which the technology in use remains the same and progress
comes via small innovations.

ARTICLE IN PRESS
zt
z
z e-1/x
z e-1
1 xt
Fig. 2. Changes in machine quality due to innovations.
At
A
Ae -1/(1+ t -τ)
A e-1
0 t - τ
Fig. 1. Changes in productivity due to learning-by-doing (LBD).
M. Iyigun / Journal of Economic Dynamics & Control 30 (2006) 687–719 697
use (i.e. when no new invention is made and adopted), but the latter increases only inperiods in which a newer generation machine of a given technology is introduced (i.e.when an innovation is made and adopted).14 Third, while I assume that learning-by-doing is technology specific, it is imperative to identify that this framework does notrule out learning-by-doing that is firm specific. As I demonstrate below, monopolistsprice machines that embody newly invented technologies so as to ensure that, inequilibrium, all final goods producers choose to utilize such machines only. Hence,even if learning-by-doing occurs predominantly at the firm level, the process of
14This is the reason why xt ¼ 1Rt� t ¼ 0.

ARTICLE IN PRESS
M. Iyigun / Journal of Economic Dynamics & Control 30 (2006) 687–719698
learning-by-doing starts anew with the invention of a new technology and thesubsequent purchase of new machines by all firms. Of course, in a richer model wherethere exists heterogeneity among the final goods producers in production technologiesor other characteristics, it is possible that the existence of a firm-specific component tolearning-by-doing could influence the amount resources devoted to R&D. Then, thedistribution of final goods producers in the heterogenous characteristics would be anadditional determinant of the amount of resources allocated to R&D.
4.4. Adoption of new technologies and next generation machines
The decision of a firm j, j 2 ½0; 1�, is
maxfj
t;zjt;q
jt;L
jt
AtðMjtÞaðL
jtÞ1�a� ptq
jt � wtL
jt, (8)
subject to (3), (4) and (6).
In (8), pt denotes the price of a machine which the firm takes as given. The solutionto this problem yields, 8j 2 ½0; 1�,
qjt ¼ A exp �
1
1þ t� t
� �ðfj
tzjtÞ
aðL
jtÞ1�a
pt
" #1=ð1�aÞ. (9)
According to (9), the demand for machines is strictly increasing in the vintage oftheir underlying technology, t� t, and the number of times new machines with thatunderlying technology has been introduced, xt (which, as (4) shows, is embedded inthe term zi
t). This is formally noted in the following result:
Result 1. qqjt=qðt� tÞ40 and qq
jt=qxt40.
Proof. See appendix, Section A.1. &
If in any period t machines embed a brand new invention or an innovation, a singlefirm owns the patent for them. This, of course, is a critical assumption. It relies on thepremise that institutions that promote technological change, such as physical andintellectual property rights, are securely in place. (In this context, it is important toemphasize that the framework discussed here applies most closely to the experience oftoday’s advanced economies in the last several hundred years: after all, it is highlyquestionable that the required institutional setting was in place during earlier times.)
For machines that embody older vintages of technology, I assume that any priorpatents have expired, the blueprints are readily available, and firms can produce suchmachines at a constant marginal cost c, c40.15
Since machines with older technologies are available at marginal cost, there is noguarantee that firms will prefer to buy machines that incorporate the newest inventions
15I have chosen to maintain constant marginal cost to keep the analysis focused on the relevant
dynamics. If the cost of machine production was allowed to vary over time, increased sophistication of the
technology would argue for an increasing cost but higher production efficiency could have a potentially
offsetting effect.

ARTICLE IN PRESS
M. Iyigun / Journal of Economic Dynamics & Control 30 (2006) 687–719 699
or innovations at a monopoly markup. They will be willing to pay a premium for newtechnology only if the resulting increase in efficiency is large enough. Even when thenet efficiency gains warrant final-goods producers to switch to the newest technologymachines, however, the monopolist may not be able to charge c=a, which is theunconstrained optimal monopoly markup given the iso-elastic demand for machinesdefined by (9). Hence, the monopolist’s markup would equal the smaller of c=a and aprice over markup that would make final goods producers indifferent between buyingnew machines at monopoly markups and older machines at marginal cost.
More formally, let pxt denote the monopoly price in period t of a new generation
machine of vintage t and let pft represent that of a machine with a new technology
invented in period t. Then, we establish
Result 2. (i)
pxt ¼ min
c
a; c exp
1
xtð1þ xtÞ
� �� �Xc. (10)
(ii)
pft ¼ min
c
a; cga exp�
xt � 1
xt
þ1
at� t
1þ t� t
� �� �Xc. (11)
Proof. See appendix, Section A.2. &
Note that the monopoly price of machines that embody new innovations, pxt , as
well as the price of machines with newly invented technologies, pft , are non-
increasing in the number of times a given technology machine has been improved viainnovations (i.e. xt). The reason for this is that machines that embody oldertechnologies become more productive with the introduction of each new generationmachine. Consequently, regardless of whether the newest machines embody a totallynew invention or they belong to a newer generation of existing machines, themonopolist’s price declines as existing alternative machines become more productive.Note also that the monopoly price of machines with newly invented technologies isnon-increasing in the length of time the previously superior older technology hasremained in production (i.e. t� t). This is due to the fact that learning-by-doingimproves the productivity of technologies that have stayed in use longer (regardlessof how many different generation of machines with a common underlying level oftechnology have been introduced during a technology’s tenure).
Result 3. (i) 8xtX �x � ½ð1� 4= ln aÞ12 � 1�=2,
qpxt
qðt� tÞ¼ 0 and
qpxt
qxt
o0.
(ii) 8xtXxt � 1=½1� ln a� a ln g� ðt� tÞ=ð1þ t� tÞ�,
qpft
qðt� tÞo0;
qpft
qxt
o0 andqp
ft
qg40.
Proof. See appendix, Section A.3. &

ARTICLE IN PRESS
M. Iyigun / Journal of Economic Dynamics & Control 30 (2006) 687–719700
Results 2 and 3 imply that monopolists’ profits are smaller when they cannotcharge the unconstrained optimal monopoly markup. And because the optimalmarkup equals c=a, their profits – either from the invention of a new technology orthe introduction of newer machines – depend strictly positively on monopoly priceswhen the latter are below c=a.
Let qxt and q
ft , respectively, denote the aggregate demand for newly innovated
machines and new-technology machines. And let pxt and pft , respectively, represent
the monopoly profits from the sale of those machines.
Result 4. (i) 8xtX �x,
qpxt
qpxt
40;
(ii) 8xtXxt,
qpftqp
ft
40.
Proof. See appendix, Section A.4. &
Before moving on to how resources are allocated to R&D activity, it isilluminating to examine the evolution of the economy described so far under threeexogenously determined, non-stochastic regimes. First, consider a world in whichthere is no embodied technological change (either in the form of new inventions or inthe innovation of newer, more efficient machines) but there exists only learning-by-doing. In such a world, economic growth will be driven purely by learning-by-doingand the dynamic evolution of the economy will be fully described by the only statevariable of the economy: time in use, t� t. Given that t ¼ 0 and the initialtechnology stays in use indefinitely, 8tX0, t� t ¼ t. Thus, 8tX0, the underlyingproductivity of the machines, At, improves according to Atþ1 ¼ At exp½1=ðtþ 1Þðtþ 2Þ� ¼ A exp½�1=ðtþ 2Þ�. In such an economy, the rate of economic growth,Dyt=yt � ðytþ1 � ytÞ=yt, equals ð1þ aÞ fexp½1=ðtþ 1Þðtþ 2Þ� � 1gX0. It is clear thatDyt=yt is positive and that it monotonically decreases over time and asymptoticallyconverges to zero as the exogenously given level of technology constrains andexhausts the potential for learning-by-doing.16,17
Second, consider the version of the model in which learning-by-doing andinnovations occur in every period. In this case, there will be two sources of economicgrowth: one driven by learning-by-doing and the resulting gains in productivity, andthe other via the introduction of more productive and efficient machines. Thedynamic evolution of this economy will be guided by the evolution of the two state
16To derive the economic growth rates discussed here and below, use Eqs. (3), (4), and (9). Assume that
machines are produced at marginal cost c under the first regime and that monopolists charge the
unconstrained monopoly markup c=a for the two other regimes discussed below. Then, plug these in Eq.
(1), take the log of the resulting equality, and differentiate with respect to time.17Note that the dynamic evolution of an economy can be characterized by no R&D and just learning-
by-doing provided that parameters like g and 1� a that affect the monopoly returns to invention and
innovation are relatively small. For more details, see the discussion in Section 5.

ARTICLE IN PRESS
M. Iyigun / Journal of Economic Dynamics & Control 30 (2006) 687–719 701
variables, t� t, and xt. As in the previous case, 8tX0, ft ¼ f0, t ¼ 0, and the initialtechnology stays in use indefinitely. Thus, 8tX0, t� t ¼ t, and the underlyingproductivity of the machines in use, At, continues to improve according to Atþ1 ¼
A exp½�1=ðtþ 2Þ�. Moreover, since a new generation machine is introduced in everyperiod t, 8tX0; xt ¼ tþ 1, and ztþ1 ¼ zt exp½1=ðtþ 1Þðtþ 2Þ� ¼ z exp½�1=ðtþ 2Þ�. Insuch an economy, the rate of economic growth, Dyt=yt, equals exp½1=ðtþ 1Þðtþ 2Þ�f1þ a exp½1=ðtþ 1Þðtþ 2Þ�g � ð1þ aÞX0. Not surprisingly, this economygrows faster than the one described above as both learning-by-doing and theintroduction of more efficient machines raise productivity in every period t. Despitethat, growth monotonically decreases and asymptotically converges to zero in thiscase as well.
Finally, consider a world in which learning-by-doing and inventions – instead ofinnovations – take place in every period. The dynamic behavior of this economy willbe different from those described above as the invention of new technologies in everyperiod t allows the economy to grow at a constant rate. In this case, 8tX0, t ¼ t,xt ¼ 1, and t� t ¼ 0. In words, the discovery of a new technology in every perioddoes not allow the economy to benefit from learning-by-doing and the dynamicevolution of the economy is fully described by the state variable ft only. And sincethe technology improves in every period t such that, 8tX0, ft ¼ gft�1, the constantpositive growth rate in output, Dyt=yt ¼ a½ðgÞ1=ð1�aÞ � 1�40, is sustained and theeconomy follows a Balanced Growth Path (BGP) in the long run.
4.5. Equilibrium R&D resources
Inventions and innovations are the result of R&D carried out by research firmsthat use the final consumption good as their only input. In all periods, there are afinite number of exogenously given R&D firms, N, who behave competitively.18 AnR&D firm n, n 2 N, invests ox;n
t amount of resources in the effort to discover thenext generation machine and invests the amount of;n
t in the effort to make a newtechnological invention. Thus, the aggregate amount of R&D resources devoted to
development of the next generation machine is given byP
n ox;nt � ox
t and that
allocated to the discovery of a new invention is equal toP
n of;nt � of
t .
Let Ift denote the economywide probability that a new invention will occur in
period t and let Ixt denote the probability that a newly innovated machine will be
introduced in t. I assume that there exists a positive relationship between theaggregate amount of resources devoted to inventive and innovative R&D activitiesand the economywide probabilities of invention and innovation:
I�t ¼ Io�t
1þ o�t
� �g
; � ¼ f; x; 0oIp1; 0ogo1, (12)
18The qualitative and quantitative nature of my main conclusions are not dependent on the assumption
that all firms engage in R&D for the purposes of both invention and innovation. In other words, allowing
for specialization in R&D would not alter the basic results.

ARTICLE IN PRESS
M. Iyigun / Journal of Economic Dynamics & Control 30 (2006) 687–719702
where o�t is the aggregate amount of resources spent on R&D in period t for thepurpose of innovating or inventing and where I , 0oIp1; denotes the maximumattainable economywide probability of invention or innovation in period t.
Given the formulation employed here, neither the odds nor the cost of inventing anew technology depends on the vintage of the technology, t� t. Similarly, the oddsand cost of innovating a new machine design is also not dependent on the currentgeneration of machines in use, xt. Thus, R&D firms always find it optimal to devoteall of their resources to improving the latest technologies—those invented in periodt—and to innovations aimed at improving the most sophisticated machines that arein use—those of generation xt.
Let the probability that any given R&D firm lands the monopoly rights to sellmachines with a new technology (or those with new innovations) depend on therelative share of resources the firm spends on R&D, o�;nt =o�t , n 2 N. Then, for eachR&D firm n, n 2 N, the product ðo�;nt =o�t ÞI
�t , � ¼ f, x, would equal the expected
probability of making a new discovery (either in the form of a next generationmachine or a new invention).
Monopolists’ patents expire after one period.19 Thus, if a technology does notbecome obsolete after one period, final-goods producers can replace existingmachines at marginal cost c (recall that, because machines depreciate fully in oneperiod, producers must purchase new machines in every period). The decision of anR&D firm, n, n 2 N, is
maxof;n
t ;ox;nt
Ift ð1� Ix
t Þpft
of;nt
oft
þ Ixt ð1� I
ft Þp
xt
ox;nt
ozt
� Bðof;nt þ ox;n
t Þ
( ), (13)
subject to (12) and p�t ¼ ðp�t � cÞq�t , � ¼ f, x.
In (13), Ift ð1� Ix
t Þpft ðo
f;nt =of
t Þ and Ixt ð1� I
ft Þpx
t ðox;nt =ox
t Þ, respectively, denote the
expected monopoly profits from inventions and innovations, B, B40, is the marginalcost of R&D effort in terms of the consumption good,20 and q�t denotes the sum ofmachine demand by all final-goods producers. Implicit in (13) is the notion thatwhen a new invention and an innovation are made simultaneously, the monopolisticcompetition in setting prices generates a Bertrand–Nash equilibrium outcome inwhich p
ft ¼ px
t ¼ c. As a consequence, the expected monopoly payoff from aninvention when there is also an innovation, I
ft Ix
t pft , and the expected monopoly
payoff from an innovation when there is also an invention, Ixt I
ft px
t , are both zero.
19One period in this OLG model corresponds to roughly about 15–35 years. This is due to the fact that
individuals live for two periods. In fact, the current World Trade Organization (WTO) patent laws, which
are intended to harmonize intellectual property protection across all the signatories, require a minimum
term of 20 years in the case of inventions and less in the case of innovations. Historically, while there has
been a significant degree of variation in the extent of protection across the Western hemisphere, the terms
of protection were for the most part less than those mandated by the current WTO laws. For more details,
see Maskus (2000).20The main results are not dependent on the constant marginal cost assumption either. As in a number
of other related papers, one could assume that the marginal cost of R&D effort is related the level of the
technology in use based on the notion that, as the underlying technology improves, it gets more or less
costly in terms of the final consumption good to improve it.
ARTICLE IN PRESS
M. Iyigun / Journal of Economic Dynamics & Control 30 (2006) 687–719 703
The optimal amount of resources allocated to inventive and innovative R&Dactivities are such that, 8n ¼ 1; 2; 3; . . . ;N,
~of;nt ¼
Ift ð1� Ix
t Þpft
BNand ~ox;n
t ¼Ix
t ð1� Ift Þpx
t
BN, (14)
where (14) defines ~of;nt and ~ox;n
t implicitly since Ift ¼ I ½N ~of;n
t =ð1þN ~of;nt Þ� and
Ixt ¼ I ½N ~ox;n
t =ð1þN ~ox;nt Þ�.
21According to Eq. (14), aggregate equilibrium R&Dresources allocated to inventive or innovative activities, ~o�t , ~o
�t ¼ N ~o�;nt , � ¼ f; x,
are increasing in monopoly profits from invention or innovation. As also implied by(14), the intensification of research and development activity might be related tomore firms deciding to invest in R&D. This result would be consistent with Sokoloffand Khan (1990) who discuss the historical pattern of entrepreneurial activity whicheventually led to inventions. Late-18th and early-19th century patent data indicatethat it was the broadening of the entrepreneurial pool, rather than the concentrationof inventions in the hands of a limited group of researchers and professionalinventors, that led to rapid technological change in the United States in the 19thcentury.
Given (14), 8n 2 N,
qo�;nt
qp�t
����o�t¼ ~o
�t
40; � ¼ f; x. (15)
To summarize, there exists a positive probability of observing an invention or aninnovation in every period because R&D firms choose to allocate resources to bothkinds of R&D activity. And when an invention or an innovation is actually made,only one firm is awarded a patent. Given that all R&D firms allocate resources toboth kinds of R&D activity, there are two ways to interpret how a particular firmlands a patent. One, it could be that when a new discovery is made or a nextgeneration machine is developed, only the firm with the highest R&D share in thatparticular type of R&D activity makes the discovery or the improvement and thusowns the patent. Or two, it could be that all firms that allocate resources to R&Dmake the new discovery or develop the next generation machine simultaneously, butonly the firm with the highest R&D share wins the patent race. With eitherinterpretation, all R&D firms have identical odds of landing a patent in any givenperiod, because in equilibrium they expend the same amount of resources on the twotypes of R&D activity. In line with these interpretations, when an invention and aninnovation are made simultaneously, one firm is awarded a patent for the newdiscovery and another one is awarded a patent for the next generation machine. Theprice competition among the two monopolists then leads to a zero markup.
Recall that, as the discussion Section 4.4 suggests, the pace of economic growth isslower when technological progress is driven by learning-by-doing and innovationsonly. And as discussed above, innovations alone cannot sustain positive economicgrowth in the long run because learning-by-doing is bounded from above. A positiverate of long-run economic growth can only be attained if there are periodic
21For the derivations of Eqs. (14) and (15), See appendix, Sections A.5 and A.6.

ARTICLE IN PRESS
M. Iyigun / Journal of Economic Dynamics & Control 30 (2006) 687–719704
inventions (i.e., the endogeneity of economic growth is attained by the processof inventions). Moreover, by comparing the economic growth rates derived inSection 4.4, we can verify that, if the jump up the quality ladder when there is aninvention, g, is large enough, then devoting all of the R&D resources to inventiveR&D activities (that is the discovery of new technologies) is optimal even in theshort run.
Keeping this in mind, it is worthwhile to comment on how the equilibriumamount of R&D we have just derived compares with one that would yield optimaleconomic growth. First, by assumption, there is free entry into research anddevelopment by relatively small firms. Those firms ignore their impact on boththe economywide probability of success in generating new inventions and thetotal number of R&D firms (which in turn affect the conditional odds of landingmonopoly rights). If there had been one large firm engaged in R&D, it wouldhave taken into account the effect of changes in its R&D resources, o�t , on theprobability of invention, I t.
22 Second, patents last one period where, given thatindividuals live for two periods in overlapping generations, a time periodcorresponds to anywhere between 15 and 35 years. I make this assumptionnot only because it is realistic,23 but also because it helps to keep the analysistractable. Nonetheless, this assumption too leads to an equilibrium allocation that islower than that consistent with optimal growth. This is because, when patents lastfor only one period, R&D firms do not take into account the stream of potentialprofits that would have accrued to them had they had longer patents. These issuesnoted, modifying the model to consider patents that last for more than one periodor having fewer number of large R&D firms would not alter the main qualitativeresults.
5. The dynamics
In this model, the length of time a technology of vintage t has stayed in use, t� t,and the number of times higher-quality machines of that technology have beenintroduced, xt, determine the relative amounts of R&D expenditure. As mentionedabove, the longer an existing technology stays in use or the more machines with agiven level of underlying technology are improved, the higher is the opportunity costof giving up the use of existing machines. The demand for machines given by Eq. (9)reflects both these effects. Moreover, given that the learning curve is steeper fornewly discovered technologies, the impact of t� t and xt on the amount of R&Dresources spent on inventions and innovations are different.
In order to characterize the dynamics of the model more formally, I now focus ona restricted set of parameter values that satisfy the following:
22Similarly if there had been barriers to entry into the R&D sector which would have restricted the
number of firms engaged in research and development, I would have had to consider a game-theoretic
solution but the qualitative nature of the main results would have remained intact.23See footnote 19.

ARTICLE IN PRESS
M. Iyigun / Journal of Economic Dynamics & Control 30 (2006) 687–719 705
Assumption 1. ln g4ð1þ aÞ=a2 and � ln ap16: (A.1)
(A.1) ensures two things. First, leaps up the quality ladder via the invention of newtechnologies, g, is sufficiently large that the constrained monopoly markup given by(11), ga exp�½ðxt � 1Þ=xt þ ðt� tÞ=að1þ t� tÞ�, is strictly greater than 1 even whenthe length of time a previously superior technology of vintage t has stayed in use,t� t, and the number of times machines with a given technology has been improved,xt, approach infinity. The implication of this is that, 8tX0, the monopoly profitsfrom the invention of new technologies, pft , remains strictly positive. Second,� ln ap1=6, ensures that �xX2. More explicitly, the second term in (A.1) guaranteesthat the productivity of newly innovated early generation machines which rely onrelatively young technologies are large enough that monopolists who innovate andintroduce early-generation machines can actually charge the unconstrainedmonopoly markup, c=a:24
Regardless of parameter restrictions, the dynamic evolution of the economy will bedetermined by those of the three state variables defined above: the underlying level oftechnology, ft, the length of time a technology of vintage t stays in use, t� t, andthe number of times machines utilizing a certain technology has been improved, xt.
Let T, TXtX0, represent the time period in which a new-generation machine isintroduced. Then, we can state the following:
ft ¼gft�1 if t ¼ t;
ft�1 if tat;
((16)
and
xt ¼
1 if t ¼ t;
xt�1 þ 1 if t ¼ T ;
xt�1 if tat;T :
8><>: (17)
In any given period tþ 1, an economy will be in one of three possible regimesdepending on the value of its state variables xt and t� t in the previous period.
(I) xt þ 1o �x and t� t ¼ 0: Period tþ 1 follows one in which a new invention wasjust made. Thus, t ¼ t and xt ¼ 1. Under this regime, which covers only the periodfollowing a new invention, the demand for and the profits from the introduction ofthe next-generation machines are at their lowest. The reason is twofold. First,because the technology is very new, potential productivity gains from learning-by-doing have not yet materialized. Second, available machines belong to the earliestgeneration, which for the given new technology level ft, are of the lowest quality. Inaddition, according to Result 1, time in use and the introduction of newer machinesraise the demand for machines with a given level of underlying technology, but theydo not influence the demand for machines with newly invented technologies (i.e.qqx
tþ1=qðt� tÞ40, qqxtþ1=qxtþ140, qq
ftþ1=qðt� tÞ ¼ 0, and qq
ftþ1=qxtþ1 ¼ 0). This
implies that the share of resources devoted to inventive R&D activity relative to thatallocated to innovative activity is relatively high under (I).
24For the derivation of these parameter restrictions, see appendix, Section A.7.

ARTICLE IN PRESS
M. Iyigun / Journal of Economic Dynamics & Control 30 (2006) 687–719706
(II) xt þ 1p �x and t� t40: Regime (II) follows (I) chronologically. Anyperiod tþ 1 under this regime is such that the underlying technology level, ft,has been in use for some time, t� t40, but the number of times machines utilizingthat technology has been improved remains low enough that xtp �x. Given the latter,the productivity gains that can be generated from the introduction of newer-generation machines remain high enough that a monopolist owning a patent for suchmachines can charge the unconstrained monopoly markup c=a. Thus, whencombined with Result 1, this suggests that the monopoly profits from theintroduction of the next-generation machine, px
tþ1 ¼ ½ð1� aÞ=a�cqxtþ1, is strictly
increasing in time in use and the introduction of new-generation machines (i.e.qpx
tþ1=qðt� tÞ40 and qpxtþ1=qxtþ140). In addition, since due to Results 2 and 3 the
profitability of an invention in period tþ 1 is either flat (when xtpxt) or strictlydecreasing in xtþ1 and t� t (when xt4xt), the share of R&D resources devotedto inventive efforts relative to that devoted to innovative activities is decliningunder regime (II).
(III) xt þ 14 �x and t� t40: Regime (III) follows (II) chronologically. Thus, thelength of time the existing technology has stayed in use, t� t, is longer than thatunder (II). Any given period tþ 1 is such that the underlying technology level, ft,has been in use for some time, t� t40, and machines utilizing that technology hasbeen improved sufficiently many times so that xt4 �x. There are two implications ofthese observations. First, given that the existing technology has remained in use arelatively long time, most of the efficiency gains from learning-by-doing with thattechnology have been realized. Second, since R&D firms have updated the quality ofmachines numerous times, innovations have also led to greater efficiency in the useof the underlying level of technology, ft. Thus, in this maturity phase, theproductivity of machines in use is higher than that of machines in the two otherregimes, and the marginal productivity gains that would result from the adoption ofa newer-generation machine or a newly invented technology is relatively low. As aresult, a monopolist who has a patented innovation can no longer charge theunconstrained monopoly markup c=a. When combined with Results 2 and 3, thissuggests that the monopoly profits from innovation are strictly decreasing in theintroduction of newer generation machines (i.e. qpx
tþ1=qxtþ1o0). Most important,however, is the fact that because of (A.1) the monopoly profits of a new inventionremains positive in the long run but those of innovation monotonically approachzero with the introduction of each new generation machine. That is, 8tXt,limxt!1 px
tþ1 ¼ 0 and limxt!1 pftþ140. Consequently, the longer the economy staysin this regime, the higher is the relative share of R&D resources devoted to inventiveversus innovative activities and the higher is the likelihood that, when atechnological breakthrough does materialize, it is likely to be in the form of a newdiscovery.
Figs. 3 and 4 plot monopoly profits from inventions and innovations, respectively,as a function of the length of time a technology of vintage t has stayed in use, t� t,and the number of times machines with a given level of underlying technology hasbeen improved, xt. Proposition 1 formalizes the long-run dynamic properties of themodel.

ARTICLE IN PRESS
πt
(1-α)[Ae-1(αφtzt/c)α]1/(1-α)
αφ t z t /c)α]1/(1-α){g e[-α((x t-1)/x t) -1] -1}[A(
0 αln(g) + lnα− α [(xt - 1)/xt] t -τ
1 - αln(g) - lnα + α[(xt - 1)/xt]
(1-α)[Ae-1(αφtze-1/c)α ]1/(1-α)
[gαe-(1+α)-1][A(αφt z/c)α]1/(1-α)
1 xt
1 - αα
ln(g) - lnα + α[(xt - 1)/xt]
α
φ
πtφ
Fig. 3. Profits from new inventions as a function of LBD and innovations.
M. Iyigun / Journal of Economic Dynamics & Control 30 (2006) 687–719 707
Proposition 1. 8tX0, the state variables ðft;xt; t� tÞ determine the stochastic
dynamic evolution of the economy. For any given ft, if xt and t are s.t. (i) xt þ 1o �xand t� t ¼ 0, the probability of an invention, I
ft , relative to that of an innovation, Ix
t , is
at its maximum; (ii) xt þ 1p �x and t� t40, the probability of an invention, Ift , relative
to that of an innovation, Ixt , is strictly decreasing in the generation of machines, xt, and
the vintage of the technology in use, t� t; (iii) xt þ 14 �x and t� t40, the probability
of an invention, Ift , relative to that of an innovation, Ix
t , is strictly decreasing in the
vintage of the technology in use, t� t, but non-decreasing in the generation of
machines, xt.
Proof. See appendix, Section A.8. &

ARTICLE IN PRESS
πtx
πtx
(1-α)[A(αφtzt/c) ]1/(1-α)
(1 -α)[Ae-1/(1+t-τ)(αφtzt/c)
0 t -τ
(1-α)[Ae-1/(1+t-τ)(αφtzt /c) ]1/(1-α)
[eα/xt(1+xt)-1][Ae-1/(1+t-τ)(αφtzt/ceα/xt(1+xt)) ]1/(1-α)
1 [1 - 4(α /lnα)]1/2 - 1 xt
2
α
]1/(1-α)α
α
α
Fig. 4. Profits from new innovations as a function of LBD and prior innovations.
M. Iyigun / Journal of Economic Dynamics & Control 30 (2006) 687–719708
The clustering of inventive activity occurs in this model because relatively moreR&D resources are channeled to inventive rather than innovative activities whentechnologies are rather young. As the proposition above summarizes, when suchtechnologies are first put in use, xt þ 1o �x and t� t ¼ 0. These are times whenneither the productivity gains from learning-by-doing nor innovations that makemachines more productive have yet materialized.
6. Numerical examples
In this section I provide a quantitative analysis of the model to illustrate some ofits main implications. Before I do so, however, some qualifications and minormodifications need to be made.

ARTICLE IN PRESS
M. Iyigun / Journal of Economic Dynamics & Control 30 (2006) 687–719 709
First, in order to focus on how the relationship between learning-by-doing anddifferentiated R&D affect the patterns of technological progress and economicgrowth, I abstract from population dynamics. Nonetheless, as some recent paperslike Lucas (1998), Jones (2001), Galor and Weil (2000) and Galor and Moav (2002)demonstrate, there exists a strong interaction between population size and thediscovery of new ideas and technologies. As a result, the quantitative analysis belowcannot fully capture the magnitude and timing of improvements in the standards ofliving over the very long run. That noted, the exercise should still be helpful indemonstrating how the interactions between learning-by-doing and directed R&Dinvestment can help to create empirically consistent patterns of technological changeover the long run.
Second, I also assume that institutions that promote technological change, such asphysical and intellectual property rights, are securely in place. In fact, as Jonesdemonstrates, one needs to incorporate exogenous variations in the security ofproperty rights to match better the long-term evolution of the world consumptionand output growth. Again, I do not take this step to keep the focus solely on theinterplay between learning-by-doing, directed and differentiated R&D andendogenous growth cycles.
Third, the model above applies most closely to the experience of today’s advancedeconomies in the last several hundred years since it is questionable that the requiredinstitutional setting was in place during earlier times. Yet I have chosen aconsiderably longer simulation horizon. The reason for this is quite simple:by focusing on a length of time longer than any suggested by the historicalexperience, it should be easier to identify the patterns of technological change andeconomic progress which, according to the results presented above, ought be cyclicalin nature.
Finally, in order to keep the simulation tractable and somewhat more consistentwith the magnitude of historical world real GDP growth over the last severalhundred years, I let the asymptotic probability of inventions, I
f, be less than that
of innovations, Ix. While this modification can be justified based purely on the
definitions of inventions and innovations—with the former being the emergenceof rather cumbersome and difficult path-breaking new ideas or methods, and thelatter being the relatively easier productivity-enhancing refinements to existingtechniques—it is also supported by the historical evidence which shows thatinnovations were far more ubiquitous than inventions.25 I will also let themarginal cost of inventive and innovative R&D effort, B, be an increasing functionof the level of technology. In other words, I will adopt the notion that it is morecostly to expand the technology frontier when the existing technology is alreadysophisticated. This final modification will serve two purposes. It will help to ruleout explosive paths in which resources devoted to R&D in either inventionsor innovations converge to infinity. It will also demonstrate the robustness ofthe main results to modifications in the R&D cost function, as I alluded to earlier infootnote 20.
25For a relevant discussion, return to footnote 5.

ARTICLE IN PRESS
Table 1
Parameter choices
Parameter Value (I) Value (II)
A 1 1
z 1 1
If 0.10 0.05
Ix 0.90 0.75
c 10 10
B 10 10
f0 10�20 10�20
g 10 20
a 0.875 0.675
g 0.10 0.10
M. Iyigun / Journal of Economic Dynamics & Control 30 (2006) 687–719710
I simulate the above-described economy for 300 model periods.26 There are 10variables that need to be parameterized and I simulate the economy for two differentsets of parameter specifications. Table 1 presents the parameter choices.
In both simulations, most parameter values such as the asymptotic technology andmachine quality levels, A and z, and the marginal cost of machine production, c, arearbitrary; they are set at their chosen values for convenience. The initial level of thetechnology, f0, is deliberately set very close to zero. In the first simulation, theasymptotic probabilities of invention and innovation, I
fand I
x, are set at 10 and 90
percent, respectively. That is, when resources devoted to R&D for invention andinnovation are infinite, the economywide odds of a commercially successfulinvention are 10 and percent those of innovation are 90 percent. The magnitudeof quality jumps, g, and the parameter a are chosen such that (A.1) is satisfied.Specifically, ln g ¼ 2:34ð1þ aÞ=a ¼ 2:14 and � ln a=a ¼ 0:145o1=6. As a result ofthe latter, a monopolist who holds a patent for a newly innovated machine ofgeneration 3 or less can charge the unconstrained monopoly markup c=a. And giventhat ln g ¼ 2:3 in the first simulation, the invention of a new technology leads to anapproximately tenfold increase in the parameter f, holding constant machinequality, zt, and vintage, t� t. However, due to the effects of learning-by-doing andmachine vintage on actual productivity, this does not imply a tenfold increase inmachine productivity immediately after the introduction of a new technology. Forexample, by the end of its first-period existence (which, as noted in footnotes 13 and19, corresponds to roughly between 15 and 35 years) the productivity of a newtechnology will be only about 30 percent higher than that of existing older vintage 20machines (i.e. for which xt ¼ t� t ¼ 20Þ.
26For reference, the available historical data on the evolution of the world per capita income suggest
that starting only around the late 16th century there has been steady and substantial improvements in
world per capita income. Maddison (1982, 1995) estimates, for example, that, after stagnating for over one
thousand years, average world per capita income has risen close to tenfold since 1500.

ARTICLE IN PRESS
M. Iyigun / Journal of Economic Dynamics & Control 30 (2006) 687–719 711
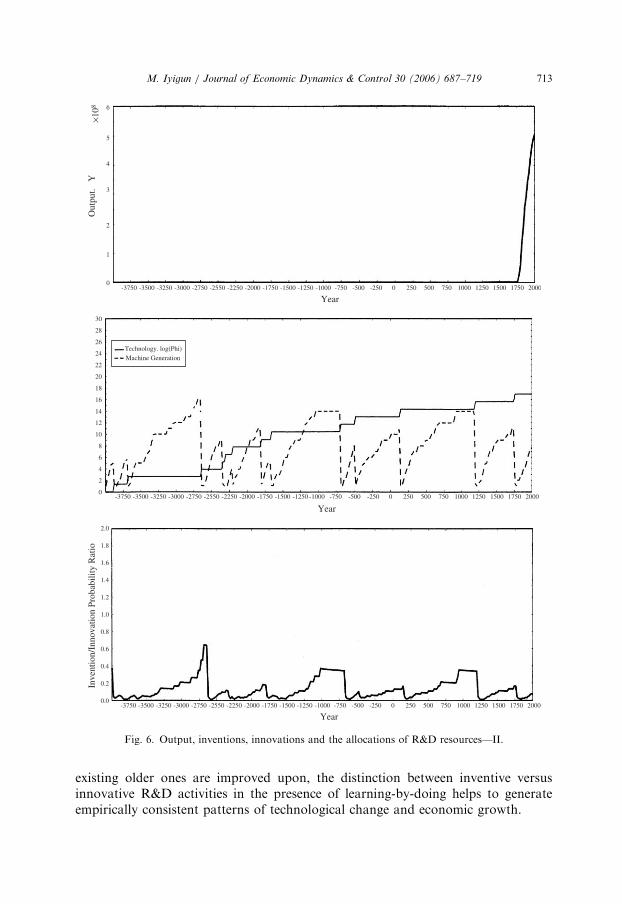
The simulations highlight the model’s main implications. First, as shown in thefirst and second panels of Fig. 5, the sophistication of technologies does not improveconsistently until much later in the process. Second, as depicted in the second panel,there exist periods during which inventions are clustered together as well as longstretches during which technological change comes mostly in the form of smallinnovations. There are also two very long periods of time over which technologiesessentially remain the same and progress, if there is any, is solely due to innovations.Both of these episodes last very long (over fifty simulation periods), and during eachepisode 29 new generation machines are introduced. These long periods of ‘‘inventivestagnation’’ come to an end because the marginal productivity gains of learning-by-doing and newer machines, which remain high in the early stages of a new invention,decline rapidly when technologies become more mature. Thus, as shown in thebottom panel of Fig. 5, the odds of invention relative to that of innovation risesduring the maturity phase of a technology as the gains from the introduction ofnewer generation machines are exhausted and more and more R&D resources getdirected to inventive activities.
In the second simulation, the asymptotic probabilities of invention andinnovation, I
fand I
x, are chosen to be lower at 5 percent and 75 percent
respectively. In addition, a is now set at 0:67 and g at 20. One implicationof this is that (A.1) is no longer fully satisfied as ln g ¼ 34ð1þ aÞ=a ¼ 2:48but � ln a=a ¼ 0:60�1=6. Thus, a monopolist who holds a patent for a newlyinnovated machine can only charge the constrained monopoly markupc exp½a=xtð1þ xtÞ�. In general, the results of this simulation match those dis-cussed above. The primary difference from the earlier simulation is that, given thelower asymptotic probabilities of invention and innovation, there are fewerinventions as well as improvements in machine quality for a given technology.(Fig. 6)
7. Conclusion
In the model above, I combine learning-by-doing with R&D activity that can bedirected to either the discovery of new technologies or the improvement of existingones without fundamentally altering the underlying technology. This endogenousgrowth model is the first of its kind to combine learning-by-doing with differentiatedR&D that generates two kinds of embodied technological progress. Inventions (thediscovery of profoundly different technologies) and innovations (relatively minorimprovements in machine quality that do not meaningfully alter the underlyingtechnologies). The main implication of the theory advanced here is that learning-by-doing can play a crucial role in generating cycles of technological change andendogenous growth.
I find that, because the learning curve is steeper for newly discovered technologies,the existence of learning-by-doing alters R&D incentives for the discovery of newtechnologies differently compared to those for improving existing ones. Conse-quently, the model’s dynamics lead to stochastic and endogenous growth cycles

ARTICLE IN PRESS
Machine Generation
Technology. log(Phi)
Year0 250-250 500-500 750-750 1000 1250 1500 1750 2000-1000-1250-1500-1750-2000-2250-2550-2750-3000-3250-3500-3750
Year0 250-250 500-500 750-750 1000 1250 1500 1750 2000-1000-1250-1500-1750-2000-2250-2550-2750-3000-3250-3500-3750
Year0 250-250 500-500 750-750 1000 1250 1500 1750 2000-1000-1250-1500-1750-2000-2250-2550-2750-3000-3250-3500-3750
30
28
26
24
22
20
18
16
14
12
10
8
6
4
2
2.0
1.8
1.6
1.4
1.2
1.0
0.8
0.6
0.4
0.2
0.0
0
0
1
2
Inve
ntio
n/In
nova
tion
Prob
abili
ty R
atio
Out
put.
Y
3
4
×108
5
6
Fig. 5. Output, inventions, innovations and the allocations of R&D resources—I.
M. Iyigun / Journal of Economic Dynamics & Control 30 (2006) 687–719712
which are driven at times by discovery and invention episodes and at others by spurtsof innovative activity. While the stochastic nature of the model allows long periodsof technological stagnation during which neither new technologies are invented nor
ARTICLE IN PRESS
-3750 -3500 -3250 -3000 -2750 -2550 -2250 -2000 -1750 -1500 -1250 -1000 20001750150012501000-750 750-500 500-250 2500
Year
-3750 -3500 -3250 -3000 -2750 -2550 -2250 -2000 -1750 -1500 -1250 -1000 20001750150012501000-750 750-500 500-250 2500
Year
-3750 -3500 -3250 -3000 -2750 -2550 -2250 -2000 -1750 -1500 -1250 -1000 20001750150012501000-750 750-500 500-250 2500
Year
Technology. log(Phi)
Machine Generation
30
28
26
24
22
20
18
16
14
12
10
8
6
4
2
2.0
1.8
1.6
1.4
1.2
1.0
0.8
0.6
0.4
0.2
0.0
0
0
1
2
Inve
ntio
n/In
nova
tion
Prob
abili
ty R
atio
Out
put.
Y
3
4
×108
5
6
Fig. 6. Output, inventions, innovations and the allocations of R&D resources—II.
M. Iyigun / Journal of Economic Dynamics & Control 30 (2006) 687–719 713
existing older ones are improved upon, the distinction between inventive versusinnovative R&D activities in the presence of learning-by-doing helps to generateempirically consistent patterns of technological change and economic growth.

ARTICLE IN PRESS
M. Iyigun / Journal of Economic Dynamics & Control 30 (2006) 687–719714
Acknowledgements
Without implicating, I would like to thank the editor Peter Ireland and twoanonymous referees for detailed and constructive comments. I have also benefitedfrom discussions with Daron Acemoglu, David Bowman, Ann Carlos, Jon Faust,Andrew Levin, Ann Owen and Randall Walsh.
Appendix A
A.1. Proof of Result 1
qqjt
qxt
¼1
1� aq
jt
ð1þ t� tÞ240, (A.1)
and
qqjt
qðt� tÞ¼
a1� a
qjt
x2t
40: & (A.2)
A.2. Proof of Result 2
(i) If the innovator charges the price pxt and all final goods producers buy this
machine, then the equilibrium wage will be given by the factor-price frontier as thesolution to
pxt ¼
1� aa
� �ð1�aÞ=awða�1Þ=at A
1=at ftzt. (A.3)
The final goods producers will be just indifferent between buying this new machine atprice px
t and the previous generation machine at the price c if and only if the price c
and the wage rate wt satisfy the following:
c ¼1� aa
� �ð1�aÞ=awða�1Þ=at A
1=at ftzt�1. (A.4)
Dividing (A.3) by (A.4) yields
pxt ¼ c exp
1
xtð1þ xtÞ
� �. (A.5)
(ii) If the innovator charges the price pft and all final goods producers buy this
machine, then the equilibrium wage will be given by the factor-price frontier as thesolution to
pft ¼
1� aa
� �ð1�aÞ=awða�1Þ=at A
1=at ftzt. (A.6)

ARTICLE IN PRESS
M. Iyigun / Journal of Economic Dynamics & Control 30 (2006) 687–719 715
The final goods producers will be just indifferent between buying this new machine atprice p
ft and the previous generation machine at the price c if and only if the price c
and the wage rate wt satisfy the following:
c ¼1� aa
� �ð1�aÞ=awða�1Þ=at A
1=at�1ft�1zt�1. (A.7)
Dividing (A.6) by (A.7) yields
pft ¼ cga exp�
xt � 1
xt
þ1
at� t
1þ t� t
� �: & (A.8)
A.3. Proof of Result 3
(i) 8xtX �x, pxt ¼ c expð1=ðxtð1þ xtÞÞÞ and
qpxt
qðt� tÞ¼ 0,
qpxt
qxt
¼ �1þ 3xt
x2t ð1þ xtÞ
2apx
t;to0. (A.9)
(ii) 8xtXxt, pft ¼ cga exp�ððxt � 1Þ=xt þ 1=aðt� tÞ=ð1þ t� tÞÞ and
qpft
qðt� tÞ¼ �
pft
ð1þ t� tÞ2o0,
qpft
qxt
¼ �ap
ft
x2t
o0,
qpft
qg¼
apft
g40: & (A.10)
A.4. Proof of Result 4
(i) pxt ¼ ðp
xt � cÞqx
t and 8xtX �x,
qpxt
qpxt
¼ �a
1� aqx
t
pxt
pxt;t �
c
a
� �40, (A.11)
(ii) pft ¼ ðpft � cÞq
ft and 8xtXxt,
qpftqp
ft
¼ �a
1� aqft
pft
pft �
c
a
� �40: & (A.12)

ARTICLE IN PRESS
M. Iyigun / Journal of Economic Dynamics & Control 30 (2006) 687–719716
A.5. Deriving (14)
For each firm, n, n 2 N, which takes as given the aggregate amount of resourcesdevoted to R&D in inventive and innovative activities, o�t , � ¼ f, x, the followinghold:
oft
¼ 0 if Ift ð1� Ix
t Þpft oBof
t ;
2 ð0;1Þ if Ift ð1� Ix
t Þpft ¼ Bof
t ;
¼ 1 if Ift ð1� Ix
t Þpft 4Bof
t
8>><>>: (A.13)
and
oxt
¼ 0 if Ixt ð1� I
ft Þpx
t;toBoxt ;
2 ð0;1Þ if Ixt ð1� I
ft Þpx
t;t ¼ Boxt ;
¼ 1 if Ixt ð1� I
ft Þpx
t;t4Boxt :
8>>><>>>:
(A.14)
Given that all R&D firms are identical, o�t ¼ 0 and o�t ¼ 1, � ¼ f, x, cannot hold inequilibrium, and o�t 2 ð0;1Þ, � ¼ f, x, has to hold. And o�t ¼ No�;nt , o�t 2 ð0;1Þ,� ¼ f, x, is a non-trivial equilibrium outcome. &
A.6. Deriving (15)
Using (14) and invoking the implicit function theorem,
qof;nt
qpft
�����of
t ¼ ~oft
¼1
N
Ift ð1� Ix
t Þ
B� pft Ið1� Ix
t Þ
ð1þ of;nt Þ
2þ
Ift
ð1þ ox;nt Þ
2
qox;nt
qof;nt
" # , (A.15)
and
qox;nt
qpxt
����ox
t¼ ~oxt
¼1
N
Ixt ð1� I
ft Þ
B� pxt Ið1� I
ft Þ
ð1þ ox;nt Þ
2þ
Ixt
ð1þ of;nt Þ
2
qof;nt
qox;nt
" # . (A.16)
In equilibrium R&D resources devoted to inventions and innovations are such thatIft ð1� Ix
t Þpft � Bof
t ¼ Ixt ð1� I
ft Þpx
t � Boxt ¼ 0. This, together with the properties of
I�t , � ¼ f, x; suggests that
B� pft Ið1� Ix
t Þ
ð1þ of;nt Þ
2þ
Ift
ð1þ ox;nt Þ
2
qox;nt
qof;nt
" #
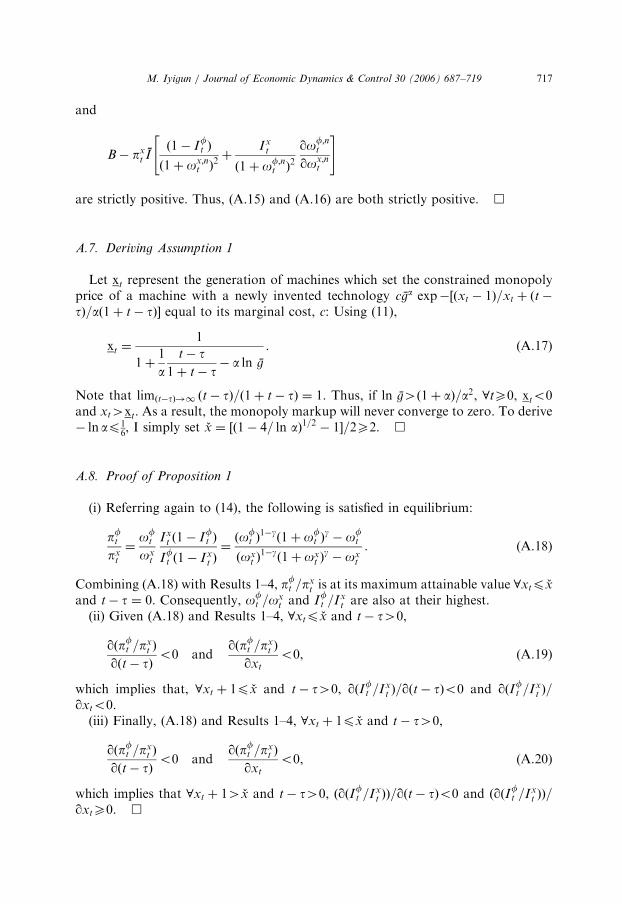
ARTICLE IN PRESS
M. Iyigun / Journal of Economic Dynamics & Control 30 (2006) 687–719 717
and
B� pxt Ið1� I
ft Þ
ð1þ ox;nt Þ
2þ
Ixt
ð1þ of;nt Þ
2
qof;nt
qox;nt
" #
are strictly positive. Thus, (A.15) and (A.16) are both strictly positive. &
A.7. Deriving Assumption 1
Let xt represent the generation of machines which set the constrained monopolyprice of a machine with a newly invented technology cga exp�½ðxt � 1Þ=xt þ ðt�
tÞ=að1þ t� tÞ� equal to its marginal cost, c: Using (11),
xt ¼1
1þ1
at� t
1þ t� t� a ln g
. (A.17)
Note that limðt�tÞ!1 ðt� tÞ=ð1þ t� tÞ ¼ 1. Thus, if ln g4ð1þ aÞ=a2, 8tX0, xto0and xt4xt. As a result, the monopoly markup will never converge to zero. To derive� ln ap1
6, I simply set �x ¼ ½ð1� 4= ln aÞ1=2 � 1�=2X2. &
A.8. Proof of Proposition 1
(i) Referring again to (14), the following is satisfied in equilibrium:
pftpx
t
¼of
t
oxt
Ixt ð1� I
ft Þ
Ift ð1� Ix
t Þ¼ðof
t Þ1�gð1þ of
t Þg� of
t
ðoxt Þ
1�gð1þ ox
t Þg� ox
t
. (A.18)
Combining (A.18) with Results 1–4, pft =pxt is at its maximum attainable value 8xtp �x
and t� t ¼ 0. Consequently, oft =ox
t and Ift =Ix
t are also at their highest.(ii) Given (A.18) and Results 1–4, 8xtp �x and t� t40,
qðpft =pxt Þ
qðt� tÞo0 and
qðpft =pxt Þ
qxt
o0, (A.19)
which implies that, 8xt þ 1p �x and t� t40, qðIft =Ixt Þ=qðt� tÞo0 and qðIft =Ix
t Þ=qxto0.
(iii) Finally, (A.18) and Results 1–4, 8xt þ 1p �x and t� t40,
qðpft =pxt Þ
qðt� tÞo0 and
qðpft =pxt Þ
qxt
o0, (A.20)
which implies that 8xt þ 14 �x and t� t40, ðqðIft =Ixt ÞÞ=qðt� tÞo0 and ðqðIft =Ix
t ÞÞ=qxtX0. &

ARTICLE IN PRESS
M. Iyigun / Journal of Economic Dynamics & Control 30 (2006) 687–719718
References
Abernathy, W., Ronan, L., 1979. The Development and Introduction of the Automotive Turbocharger: A
Case of Innovation in Response to Fuel Economy Regulation. The Government Printing Office,
Washington, DC.
Acemoglu, D., 1998. Why do new technologies complement skills? Directed technical change and wage
inequality. Quarterly Journal of Economics 113 (4), 1055–1089.
Aghion, P., Howitt, P., 1992. A model of growth through creative destruction. Econometrica 60, 323–351.
Aghion, P., Howitt, P., 1996. Research and development in the growth process. Journal of Economic
Growth 1 (1), 49–73.
Arrow, K.J., 1962. The economic implications of learning-by-doing. Review of Economic Studies 29,
155–173.
Atack, J., Passell, P., 1994. A New Economic View of American History. W. W. Norton & Co., New
York.
Bartel, A.P., Lichtenberg, F.R., 1991. The age of technology and its impact on employee wages. Economic
Innovation: New Technology 1 (3), 215–231.
Bartel, A.P., Sicherman, N., 1999. Technological change and wages: an interindustry analysis. Journal of
Political Economy 107 (2), 285–325.
Berman, E., Bound, J., Griliches, Z., 1994. Changes in the demand for skilled labor within U. S.
Manufacturing. Quarterly Journal of Economics 109 (2), 367–397.
Easterly, W., 2001. The Elusive Quest for Growth: Economists’ Adventures and Misadventures in the
Tropics. The MIT Press, Cambridge, MA.
Epple, D., Argote, L., Devadas, R., 1991. Organizational learning curves: a method for investigating intra-
plant transfer of knowledge acquired through learning-by-doing. Organization Science 2, 58–70.
Francois, P., Lloyd-Ellis, H., 2003. Animal spirits meets creative destruction. American Economic Review
93 (3), 530–550.
Galor, O., Moav, O., 2002. Natural selection and the origin of economic growth. Quarterly Journal of
Economics, November.
Galor, O., Tsiddon, D., 1997. Technological progress, mobility and economic growth. American
Economic Review 87 (3), 363–382.
Galor, O., Weil, D.N., 2000. Population, technology and growth: from the Malthusian regime to the
demographic transition. American Economic Review 90 (4), 806–828.
Grossman, G.M., Helpman, E., 1991. Quality ladders in the theory of growth. Review of Economic
Studies 58, 43–61.
Helpman, E., Tratjenberg, M., 1998. A time to sow and a time to reap: growth based on general purpose
technologies. In: Helpman, E. (Ed.), General Purpose Technologies and Economic Growth. MIT
Press, Cambridge, MA.
Hunter, L., 1949. Steamboats on the Western Rivers. Harvard University Press, Cambridge, MA.
Iyigun, M., Owen, A., 2005. Experiencing change and the evolution of adaptive skills: implications for
economic growth. European Economic Review, forthcoming.
Jones, C.I., 2001. Was an industrial revolution inevitable? Economic growth over the very long run. B.E.
Journal in Macroeconomics, Advances in Macroeconomics 1(2), Article 1.
Jovanovic, B., Rob, R., 1990. Long waves and short waves: growth through intensive and extensive search.
Econometrica 58 (6), 1391–1409.
Juhn, C., Murphy, K.M., Pierce, B., 1993. Wage inequality and the rise in returns to skill. Journal of
Political Economy 101 (3), 410–442.
Levhari, D., Sheshinki, E., 1973. Experience and productivity in the Israel diamond industry.
Econometrica 41, 239–253.
Lucas, R.E., 1988. On the mechanics of economic development. Journal of Monetary Economics 22, 3–42.
Lucas, R.E., 1998. The industrial revolution: past and future. Mimeo, University of Chicago.
Maddison, A., 1982. Phases of Capitalist Development. Oxford University Press, New York.
Maddison, A., 1995. Monitoring the World Economy 1820–1992. Organization for Economic
Cooperation and Development, Paris.

ARTICLE IN PRESS
M. Iyigun / Journal of Economic Dynamics & Control 30 (2006) 687–719 719
Maskus, K.E., 2000. Intellectual Property Rights in the Global Economy. Institute for International
Economics, Washington, DC.
Matsuyama, K., 1999. Growing through cycles. Econometrica 67 (2), 335–347.
Mokyr, J., 1990. The Lever of Riches. Oxford University Press, New York.
Romer, P.M., 1990. Endogenous technological change. Journal of Political Economy 98 (5), 571–602.
Rosenberg, N., 1982. Inside the Black Box: Technology and Economics. Cambridge University Press,
Cambridge.
Ruttan, V., 1959. Usher and Schumpeter on invention, innovation, and technological change. Quarterly
Journal of Economics 73 (4), 596–606.
Schultz, T.W., 1975. The value of the ability to deal with disequilibria. Journal of Economic Literature 13
(3), 827–846.
Schumpeter, J.A., 1934. The Theory of Economic Development. Geoffrey Lumberlege, Oxford University
Press, London.
Sokoloff, K.L., Khan, B.Z., 1990. The democratization of invention during early industrialization:
evidence from the United States, 1790–1846. Journal of Economic History 50 (2), 363–378.
Stein, J., 1997. Waves of creative destruction: firm-specific learning-by-doing and the dynamics of
innovation. Review of Economic Studies 64, 265–288.
Stokey, N.L., 1988. Learning-by-doing and the introduction of new goods. Journal of Political Economy
96 (4), 701–717.
Tratjenberg, M., 1989. The welfare analysis of product innovations, with an application to computed
tomography scanners. Journal of Political Economy 97 (2), 444–779.
Tratjenberg, M., 1990. Economic Analysis of Product Innovation: The Case of CT Scanners. Harvard
University Press, Cambridge, MA.
Usher, A.P., 1929. A History of Mechanical Inventions. Dover, New York.
Waelde, K. (forthcoming). Endogenous growth cycles. International Economic Review.
Young, A., 1993. Invention and bounded learning-by-doing. Journal of Political Economy 101 (3),
443–472.