Environmental quality and pollution-augmenting technological change in a two-sector endogenous...
23
ELSEVIER Journal of Public Economics 57 (1995) 369-391 Environmental quality and pollution-augmenting technological change in a two-sector endogenous growth model A. Lans BovenbergaybyCT*,Sjak Smuldersd “CentER for Economic Research, Tilburg Universiry,P.O. Box 90153, 5wO LE Tilburg, Netherlands bResearch Centre for Economic Policy (OCFEB), Erasmus University, P.O. Box 1738, 3ooO DR Rotterdam, Netherlands ‘Centre for Economic Policy Research (CEPR), London, UK ‘Department of Economics, Tilburg University,P.O. Box 90153, 5ooO LE Tilburg, Netherlands Received November 1993, revised version received April 1994 Abstract This paper explores the link between environmental quality and economic growth in an endogenous growth model that incorporates pollution-augmenting technologi- cal change. It examines the conditions under which sustainable growth is both feasible and optimal. We explore also how the government should intervene to ensure the optimal levels of natural and knowledge capital, which share a public- goods character. We establish the conditions for a more ambitious environmental policy to raise long-run growth. Keywords: Environmental quality; Endogenous economic growth; Two-sector model; Pollution-augmenting technology; Pollution tax; Public spending JEL classification: 041; Q20; H41 1. Introduction The link between environmental policy and economic growth is a controversial issue. Industrialists typically argue that environmental policy * Corresponding author. 0047-2727/95/$09.50 0 1995 Elsevier Science B.V. All rights reserved SSDI 0047-2727(94)01463-9
-
Upload
tilburguniversity -
Category
Documents
-
view
1 -
download
0
Transcript of Environmental quality and pollution-augmenting technological change in a two-sector endogenous...
ELSEVIER Journal of Public Economics 57 (1995) 369-391
Environmental quality and pollution-augmenting technological change in a two-sector endogenous
growth model
A. Lans BovenbergaybyCT*, Sjak Smuldersd
“CentER for Economic Research, Tilburg Universiry, P.O. Box 90153, 5wO LE Tilburg, Netherlands
bResearch Centre for Economic Policy (OCFEB), Erasmus University, P.O. Box 1738, 3ooO DR Rotterdam, Netherlands
‘Centre for Economic Policy Research (CEPR), London, UK ‘Department of Economics, Tilburg University, P.O. Box 90153, 5ooO LE Tilburg,
Netherlands
Received November 1993, revised version received April 1994
Abstract
This paper explores the link between environmental quality and economic growth in an endogenous growth model that incorporates pollution-augmenting technologi- cal change. It examines the conditions under which sustainable growth is both feasible and optimal. We explore also how the government should intervene to ensure the optimal levels of natural and knowledge capital, which share a public- goods character. We establish the conditions for a more ambitious environmental policy to raise long-run growth.
Keywords: Environmental quality; Endogenous economic growth; Two-sector model; Pollution-augmenting technology; Pollution tax; Public spending
JEL classification: 041; Q20; H41
1. Introduction
The link between environmental policy and economic growth is a controversial issue. Industrialists typically argue that environmental policy
* Corresponding author.
0047-2727/95/$09.50 0 1995 Elsevier Science B.V. All rights reserved SSDI 0047-2727(94)01463-9

370 A.L. Bovenberg, S. Smulders I Journal of Public Economics 57 (1995) 369-391
harms growth by raising production costs. Environmentalists, in contrast, maintain that environmental policy is needed to ensure that growth is sustainable. In order to investigate the connection between environmental quality and growth, we develop a two-sector endogenous growth model in which economic activity depends on the extractive use of the natural environment, which is modeled as a renewable resource.
We contribute to the literature on growth and the environment in three major ways. First, we explore the conditions under which growth in physical output is sustainable and compatible with a stable quality of the natural environment. In this context we allow-in the spirit of the so-called ‘new’ growth theory z reproducible factors to feature constant returns to scale so that the long-run growth rate is determined endogenously by preferences, technologies, and policy. In most neoclassical models that have been employed to study the link between environmental policy and economic growth (see, for example, Forster, 1973; van der Ploeg and Withagen, 1991; and Tahvonen and Kuuluvainen, 1991), in contrast, reproducible factors exhibit diminishing returns. Hence, if the reproducible inputs grow relative to the non-reproducible factors, their marginal products eventually fall back to zero. The long-run growth rate in these models is thus exogenously determined by the growth rate of the non-reproducible inputs (e.g. labor, natural resources).
The second extension of the literature on growth and the environment involves the modeling of endogenous pollution-augmenting technological progress. Building on the work of Lucas (1988) and Rebel0 (1991), we model the development of new technical knowledge that enables production to occur in a less polluting way and to use renewable resources more efficiently. Within this framework, there are two reasons for government intervention, namely that both environmental quality and pollution-aug- menting knowledge have a public good character. We find that, on an optimal balanced growth path, the revenues from pollution taxes (or pollution permits) exceed public expenditures on the development of pollution-augmenting technology, and that the optimal size of the govern- ment budget tends to increase with growing environmental concern.
The final major contribution of the paper is to. investigate how, if the conditions for balanced growth are met, a more ambitious environmental policy affects the long-term equilibrium. In particular, we explore the long-run effects of a more ambitious environmental policy on growth, the income share of the public sector, and the direction of technological progress. We show that two opposing forces affect the long-run rate of growth. On the one hand, a lower level of polluting inputs and harvested resources implies a fall in the productivity of reproducible inputs, thereby hurting growth. On the other hand, a reduction in pollution improves the quality of the environment, which positively affects productivity and growth.
A.L. Bovenberg, S. Smulders I Journal of Public Economics 57 (1995) 369-391 371
The second effect may outweigh the first if environmental quality not only enters utility but also has an important productive role.
The paper is structured as follows. Section 2 presents the model and derives the optimum conditions for a command economy. The feasibility and optimality of balanced growth requires particular conditions on technol- ogy and preferences. These conditions are derived in Section 3. Section 4 explores how the government should intervene in a market economy to ensure optimal allocation. Section 5 examines the steady-state effects of a more ambitious environmental policy, which is associated with a decline in economy-wide pollution, on growth, the direction of technological change, and the ratio of public to private spending. Finally, Section 6 contains the conclusions.
2. The model
2.1. Environmental quality
Economic activity is embedded in the natural environment, which is modeled as a renewable resource. The quality of the natural environment N, which is the stock of natural capital, accumulates due to the regenerative capacity of nature, while it depreciates on account of the damaging effects of pollution P. Here, N evolves over time according to the following function (see Tahvonen and Kuuluvainen, 1991):
N+=E(N,P),
Ep<o, E,,<O, E,,<O, &p>O, (2.1) E@(P), P) = 0.
A dot over a variable represents a time derivative. The subscripts attached to the function symbol E denote partial derivatives.
For each level of pollution (or emissions) P, a stable level of environmen- tal quality R exists for which the regenerative capacity of nature compen- sates for the adverse effects of pollution such that environmental quality remains constant over time. Raising the level of pollution, which can be interpreted as increasing the rate of harvest of the renewable resource, reduces the regenerative and pollution-absorbing capacity of the environ- ment, causing N to decline (Ep < 0). N will reach a lower level (dN(P)l dP < 0) as illustrated in Fig. 1. fi is a stable equilibrium, since it is assumed that E,(N, P) <O around N(P). This implies that the larger is N, i.e. the more abundant the stock of natural resources is, the more difficult it is to maintain or increase this stock through natural growth processes. Intuitively,

372 A.L. Bovenberg, S. Smulders I Journal of Public Economics 57 (1995) 369-391
Fig. 1. The regeneration of the environment.
the flow of (solar) energy that reaches the earth acts as a fixed factor causing decreasing returns in the accumulation of natural capital.
If environmental quality is high, nature can easily absorb pollution and a change in pollution affects regeneration capacity only little (E,, > 0). Higher levels of po!lution affect nature at an increasing rate, or, to put it the other way around, the benefits from further reductions in pollution are diminishing (E,, < 0). The maximal steady-state quality of the environment, assumed to be finite, is reached in the ‘virgin state’, where pollution is zero [Pax = R(O) <co].
2.2. Production
Two sectors make up the production side of the economy (as in Lucas, 1988, and Rebelo, 1991). One sector produces a final output that can be either consumed or invested for the purpose of accumulating capital. Accordingly, we call this sector the final- or consumption-goods sector or, alternatively, the capital-producing sector. The second sector, which we name the knowledge or environmental R&D sector, generates knowledge about pollution-augmenting techniques. It is a pure ‘investment sector’

A.L. Bovenberg, S. Smulders I Journal of Public Economics 57 (1995) 369-391 373
because the output is not used for consumption but only for the purpose of accumulating technological knowledge.
The final good, Y, is produced according to the following technology:
Y = Y(N, KY, 2,) . (2.2)
The first input is the aggregate stock of natural capital (N). Clean soil and air provide public non-extractive productive services to economic activities (the carrier services of the environment, which supply physical and mental support to productive activities, e.g. the impact of soil and air quality on productivity in the agricultural sector and on labor productivity, more generally). The second input, K,, represents the stock of private ‘man- made’ capital allocated to the final goods sector. Capital K is interpreted as a broad measure of capital. It includes all capital that can be produced and accumulated by allocating resources to economic activities, such as physical capital and human capital. However, it excludes knowledge capital directly related to pollution. For convenience we label K as physical capital.
The third input, Z,, represents effective input of ‘harvested’ environmen- tal resources in the consumption goods sector. The extractive use of the environment is called pollution. No production is feasible without pollution. However, pollution-augmenting technical progress is possible. In particular, the productive content of pollution depends on the available knowledge about pollution-augmenting techniques, represented by h. Therefore, Z, can be written as r&P, where P stands for the economy-wide level of pollution (which affects the quality of the environment, see Eq. (2.1)), hP = Z represents the ‘effective’ level of pollution that is productive in economic activities, and v is the share of effective pollution for which the final goods sector is responsible.
The stock of knowledge h is separated from the kinds of ‘man-made’ capital included in K, so that we can explicitly study the role of pollution- augmenting technology. The accumulation of pollution-augmenting knowl- edge requires investment in the learning sector. In particular, the following technology. describes the growth of technical knowledge:
h=W=H(K,,Z,). (2.3)
Theinputs into the knowledge sector are physical capital (&) and effective pollution (Z, = (1 - v)hP).
Summing up, the model incorporates three kinds of capital: natural capital (N), ‘physical’ capital (K), and pollution-augmenting knowledge capital (h). N and h are accumulated according to Eqs. (2.1) and (2.3), respectively, while a standard accumulation equation (ignoring depreciation) links the evolution of the stock of economy-wide physical capital to investment, Y - c:
374 A.L. Bovenberg, S. Smulders / Journal of Public Economics 57 (1995) 369-391
k=Y-c. (2.4)
where c denotes consumption. Besides distinguishing between natural capital (N) and ‘man-made’ capital (h and K), one can distinguish between rival capital (K) and non-rival capital (N and h). Physical capital, K, (as well as pollution, P) is rival in the sense that each unit can be employed in only one of the two sectors. The allocation of the total stock K = KH + K, is characterized by u = KY/K (cf. u = 2,/Z). Technological knowledge h is non-rival; it increases production in both sectors.
2.3. Preferences
Identical infinitely-lived individuals exhibit preferences over consumption goods and environmental quality (representing, for example, the effect of air quality on health, the aesthetic value of unspoiled landscapes):
m
5 e-“‘U(c(t), N(t)) dt ,
0
(2.5)
where 8 represents the rate of time preference. As a non-rival features in both production (2.2) and individual utility (2.5)’
good, N A social
planner maximizes intertemporal utility in (2.5) subject to the accumulation equations (2.1), (2.3) and (2.4) and the resource constraints K = KY + KH and 2 = Z, + Z,. Appendix A derives the optimality conditions, which we will discuss in the rest of this section.
2.4. Optimal static allocation
Given the total amount of capital (K = K, + KH) and effective pollution (Z = Z, + Z,), the optimal sectoral allocation of both rival factors at any moment in time is governed by
aY aH -=qh aK, 3
6 (2.6)
aY aH -=qh a-2” 7 az, (2.7)
where qh denotes the shadow price of knowledge relative to physical capital. The first (second) condition states that the marginal product of physical
1 Consumption, in contrast, is a rival good and thus per capita consumption enters (2.5). However, we abstract from population growth so that we need not distinguish between aggregate and per capita consumption.

A.L. Bovenberg, S. Smulders I Journal of Public Economics 57 (1995) 349-391 375
capital (effective pollution), measured in terms of units of physical capital, should be the same in the two sectors.
The decision on the optimal level of pollution, given the optimal allocation, is also of a static nature. Optimality requires that the marginal benefit of pollution (in both sectors) equals its marginal cost, which is the deterioration of the quality of the environment N:
gh = -EPqN, Y
(2.8)
where qN stands for the shadow price of N relative to that of K.
2.5. Optimal dynamic allocation
Investment in the three kinds of capital (K, h, and N) should be traded off against each other and against consumption:
aY aH r=aK,=az,P+q,
u($/z+g)+g+$, (2.9)
(2.10)
Arbitrage condition (2.9) reveals that K, h, and N should yield the same return. The return on capital amounts to its marginal product (i.e. the dividends or current benefits, which are equal in both sectors as required by the optimal sectoral allocation (2.6)). Dividends also feature in the return on knowledge, but here also changes in the relative price (i.e. capital gains) should be taken into account. Futhermore, the marginal product of effective pollution is multiplied by economy-wide pollution, P. This reflects the non-rival nature of knowledge. Also the return on natural capital consists of dividends and capital gains. Since natural capital is non-rival in nature, dividends amount to the sum of the marginal benefits of natural capital in individual utility, production, and ecological regeneration processes.
Eq. (2.10) stands for the well-known Ramsey rule representing the trade-off between investment and consumption. Postponement of consump- tion must be rewarded by a rate of return that compensates for the pure rate of time preference, and the change over time in the (marginal) value of consumption (UC).
3. Conditions for balanced endogenous growth
Growth in output can be achieved by investing in knowledge as well as in natural and physical capital and by increasing pollution. We focus on

376 A.L. Bovenberg, S. &udders I Journal of Public Economics 57 (1995) 369-391
balanced growth, defined as a situation in which allocative variables (u = K,IK, u = Z,/Z, c/Y) are constant and in which all other variables change at constant (possibly zero) rates. This requires some restrictions on ecologi- cal relationships, technology, and preferences.
3.1. Ecological relationships
Under the assumptions imposed on Eq. (2.1), which describes how the environment evolves over time, the quality of the environment, N, and the aggregate level of pollution, P, have to be constant on a balanced growth path. N cannot grow forever at a constant positive rate since it cannot exceed the virgin state. Furthermore, N would decline at an accelerating rate if pollution P were to increase at a constant rate.
3.2. Technology
With P, N, c/Y, u, and v constant, growth in output is fuelled by sustained increases in knowledge and physical capital. The relative change in the growth rates of these two assets can be written as
gh
gh=h K K+(hZH-l);,
$(h,y-l)XfA&
(3.1)
(3.2)
where gj denotes the growth rate of j and Ai stands for the production elasticity of factor i. Balanced growth requires & = gK = 0 or equivalently (cf. Mulligan and Sala-i-Martin, 1993):
(3.3)
This condition has implications for the elasticities of substitution and the degrees of economies of scale in both sectors. In a situation of balanced growth, natural capital becomes scarcer relative to the production factors KY and Z,, since it remains constant while K and h grow steadily. If natural capital is a production factor in the Y-sector (aYlaN>O, see (2.2)), the production elasticities hKy and AZ, change over time unless the elasticity of substitution between, on the one hand, natural capital and, on the other hand, physical capital and effective pollution is unity. Since balanced growth requires (3.3) to be satisfied at each moment in time, production elasticities should be constant. Accordingly, the elasticity of substitution between natural capital and the other production factors should equal one.

A.L. Bovenberg, S. Smulders I Journal of Public Economics 57 (1995) 369-391 377
As far as economies of scale are concerned, either both sectors should exhibit constant returns to scale (CRS) with respect to physical capital and effective pollution, or decreasing returns to scale (DRS) in one sector should be compensated by increasing returns to scale (IRS) in the other (e.g. if the ratio (3.3) exceeds 1, and the growth of knowledge thus exceeds growth of physical capital, the knowledge sector exhibits IRS, AKH + AZ, > 1, while the consumption good sector features DRS, hKy + AZ, < 1). If both sectors were to exhibit DRS, the marginal productivity of both factors would decline and growth would thus vanish. With IRS in both sectors, in contrast, growth rates would accelerate.
With CRS in both sectors, capital and knowledge grow at a common rate (i.e. g,/g,, = 1). H ence, the production elasticities Ai remain constant over time, irrespective of the elasticity of substitution between effective pollution and capital in the Y-sector (denoted by or) and the corresponding elasticity in the H-sector (denoted by gH). However, if one sector exhibits IRS and the other DRS, capital and knowledge grow at different rates (i.e. g,/g,, # 1). Consequently, the production elasticities Ai would change over time, thereby violating (3.3), unless 0, = 0, = 1. Therefore, production functions in both sectors should be of the Cobb-Douglas type for balanced growth to be feasible. If the substitution elasticities were to exceed unity, factors of production would be good substitutes and the factor produced in the sector exhibiting IRS would gradually replace the other factor. Intuitively, the IRS sector dominates the DRS sector, which implies an accelerating growth rate in the long run.” If the substitution elasticities were to fall short of unity, in contrast, factors of production would be poor substitutes. Consequently, the factor produced in the sector exhibiting DRS cannot easily be replaced by the other factor and growth would thus slow down.
We focus on the case with CRS (with respect to physical capital and effective pollution)3 in both sectors and substitution elasticities between physical capital and effective pollution (vy and gH) below or equal to one. This represents the case where production cannot take place without pollution (pollution is essential: c+, o, G 1). Hence, sustained pollution- augmenting technological progress is necessary to keep the economy growing. The production functions in (2.2) and (2.3) can now be specified as
’ If we would require only asymptotically balanced growth, we could have CRS in one sector and DRS in the other with elasticities of substitution larger than one. Asymptotically the DRS sector vanishes, the CRS sector dominates, and growth approximates a constant rate. This is the case explored by Jones and Manuelli (1990). In our setting, we could assume that pollution-augmenting knowledge can be accumulated only subject to DRS, or - as an extreme case - that it cannot be accumulated at all. In this case, growth could be sustained if pollution is nonessential (a,, > 1) and growth would be asymptotically constant if the Y-sector exhibits CRS. However, pollution would not play any productive role in the long run.
3 If N enters the Y-sector, the production function for Y features IRS in N, Z,, and K,.

3’78 A.L. Bovenberg, S. Snudders I Journal of Public Economics 57 (1995) 369-391
Y=A.(N)-F(K,,Z,), A+O,A;<O, (3.4)
~=H=A,-G(K,,z,). (3.5)
If both sectors exhibit CRS, capital and knowledge grow at a common rate, say g. At the same time the marginal products of these two factors and the relative price q,, remain constant (see (2.7)). However, the fixed factors N and P become scarcer as the economy grows, and the marginal prod- uctivities of these factors thus grow at rate g. Also, the relative price of the natural environment (qN) grows at that rate. Hence, balanced growth is characterized by
kkcPcj, . . -=-=-=_=_= K h c y qN g, N=P=h=O. (3.6)
3.3. Preferences
While the restrictions on technology guarantee that a balanced growth path is feasible, restrictions on preferences are required to guarantee that balanced growth is optimal. Optimal growth is balanced if the rate of return is constant. If c grows at rate g and N remains constant, this requires that
(i) the marginal utility of consumption declines at a constant rate (see the Ramsey rule (2.10));
(ii) the ratio ((iWleN)l(XJl&)) increases at the same rate (g) as qN and aY/aN ((see the arbitrage condition for N on the right-hand side of (2.9)).
Marginal utility evolves over time according to
(3.7)
where subscripts denote the partial derivatives of the instantaneous utility function. Marginal utility grows at a constant rate if the intertemporal substitution elasticity (- U, / Uoc = a, see the term in the first parentheses) is constant, i.e. independent of the scale of consumption and independent of the ratio of N to c. This requires a time-separable constant-relative-risk- aversion (CRRA) utility function. Since c grows at rate g, the second restriction on preferences requires that U,NIU,c remains constant in the steady state. Accordingly, the elasticity of U,lU, with respect. to c must be unity. As shown by Ring et al. (1988), this implies that the elasticity of substitution in utility between consumption and some index of environmen- tal services should equal unityP Intuitively, in a growing economy the
4 These authors explore a utility function with consumption and leisure (which should be constant in the steady state as N in our case) as arguments. Instantaneous utility that satisfies the required restrictions looks like: V = (~/(a - 1))~‘~I’” . n(N), with n’ 5 0 and n” 2 0 if (T 5 1.

A.L. Bovenberg, S. Smulders I Journal of Public Economics 57 (1995) 369-391 379
shadow price of environmental services rises, thereby providing an incentive to substitute consumption of produced goods for environmental services. The optimal stock of natural capital remains constant only if this negative substitution effect on the demand for environmental services is exactly offset by the positive income effect triggered by output growth.
4. Market equilibrium
Without government intervention, the decentralized market economy suffers from two market failures, which are associated with the public-good character of the environment N and knowledge h. These goods are not provided in a pure market economy. With respect to the natural environ- ment, each individual consumer and each individual producer in the final goods sector benefits from the quality of the environment (i.e. XJlaN > 0 and aYlaN 3 0). However, since this quality depends on aggregate pollu- tion, individual consumers and producers ignore the effects of their deci- sions on N. Indeed, without government intervention, producers would face no cost at all associated with pollution, but only a benefit (aY/aZ, > 0 and aH/aZ, > 0). Therefore, they would select an infinitely large level of pollution. As a consequence of the tragedy of the commons, the quality of the environment would decline to unsustainably low levels and neither production nor life would be possible. Social mechanisms are needed to prevent this. For example, the government may levy a tax on emissions. Alternatively, it may create the missing market for pollution permits by auctioning off such permits.
Knowledge h is a non-rival and thus a public good (cf. Romer, 1990). The cost of developing (the blueprint for) a new pollution-augmenting technolo- gy is independent of the scale at which this technology is subsequently applied, or the time period during which it is used. The resulting economies of scale imply that perfect competition is not viable. Or, put another way, if perfect competition were present, after the rival factors of production were paid their marginal product (including the tax on pollution), no quasi-rent would be left to pay for h. Hence, pollution-augmenting technological innovation would not be rewarded and thus no research would be under- taken. Accordingly, the government should pay for the development of new technology and freely provide the knowledge to firms.
The government thus needs to intervene to ensure the optimal levels of the two public goods N and h. The provision of N yields public revenue, as the government charges a cost for the use of the environment. The development of pollution-augmenting knowledge, in contrast, absorbs public means. It is of some interest to explore the relative magnitudes of revenues and expenditures associated with optimal environmental policy.

380 A.L. Bovenberg, S. Smulders I Journal of Public Economics 57 (1995) 369-391
Firms equate the marginal product of pollution, given the available pollution-augmenting technology, to the cost of pollution:
gh=+, Y
(4.1)
where TV denotes the pollution tax, which can alternatively be interpreted as the price of pollution permits. In the steady state, the optimal tax rises at a rate h/h = g to prevent pollution from rising and the environment from deteriorating. Sustained innovation raises the marginal productivity of pollution. This provides an incentive to increase pollution unless the pollution tax rises at the same rate.
The price (in terms of final goods) that the government pays for new technology equals the shadow price qh. Hence, total public spending amounts to qhH. This yields the following ratio between research spending and tax revenues (see Appendix B):
%lH Hlh
T = (aHIdZ,)P = $ ’ (4.2)
Since the interest rate exceeds the growth rate r >g, revenues from pollution taxes (or auctioned pollution permits) are more than sufficient to finance research subsidies. The intuition is as follows. Pollution and publicly provided khowledge are perfect substitutes in production. Hence, the pollution tax, which corresponds to the shadow price of pollution, directly measures the return on the stock of knowledge. At the same time, the optimal subsidy corresponds to the cost of investing in this stock. As a kind of golden rule for the stock of knowledge, it is optimal to invest only part of the returns and, thus, tax revenues should exceed R&D spending on the optimal balanced-growth path. Accordingly, the government should ear- mark only part of the pollution tax revenue for developing pollution- augmenting knowledge capital. No additional, possibly distortionary, taxes are needed to finance public spending.
5. Environmental policy
This section discusses how a more ambitious environmental policy, which is associated with a cut in economy-wide pollution, affects the steady-state solutions.5 A reduction in pollution may be interpreted in two alternative
5 In Bovenberg and Smulders (1994) we show that the steady-state solution is locally stable. Our model can be considered as an extension of the model without externalities in Charnley (1993) and the model in Cabellt and Santos (1993) who prove global stability.

A.L. Bovenberg, S. Smulders I Journal of Public Economics 57 (1995) 369-391 381
ways. First, it can be an endogenous response to a change in preferences towards more environmental concern. On a balanced-growth path, such a preference shift impacts only the arbitrage equation for natural capital (2.9) determining the optimal level of pollution through its effect on the shadow price of natural capital (see (2.8)). Hence, a ‘green’ preference shock affects the equilibrium values for the other endogenous variables only through its impact on the flow of pollution.
An alternative interpretation of the decline in pollution is that on the initial balanced growth path the pollution tax is not set optimally according to (2.8), but rather set exogenously at too low a level from a social welfare point of view:
7p < - E,q, . (5-l)
Hence, the social costs of pollution (i.e. the right-hand side of (5.1)) exceed the social benefits (i.e. the left-hand side). The tightening of environmental policy in the form of a reduction in pollution thus moves the economy closer to a social optimum.
Pollution reduction affects the balanced-growth equilibrium because it changes the productivity of man-made assets in two ways. On the one hand, less extractive use of the environment directly reduces the productivity of reproducible inputs. On the other hand, it enhances the quality of the environment, which improves factor productivity in the consumption goods sector (A y). The importance of the second effect is governed by the ecological regeneration function and the production function in the con- sumption goods sector (see Appendix C):
A.=a,N=-a, (5.2)
(5.3)
where a tilde denotes a relative change, and ay represents the positive elasticity of A y with respect to N.
The rest of this section discusses the long-run solutions for the real rate of return and growth (Subsection 5.1), the ratio of public to private spending (Subsection 5.2), and the direction of technological change as measured by the capital-knowledge ratio K/h (Subsection 5.3). To separate the two driving forces behind these results, the solutions are characterized by the changes in P (indicating the direct adverse productivity effect) and A y (indicating the productivity improvements that arise indirectly through a higher environmental quality, see (5.2) and (5.3)). Moreover, we show the impact of (exogenous) productivity shocks in the environmental R&D sector

382 A.L. Bovenberg, S. Smulders I Journal of Public Economics 57 (1995) 369-391
(A”,) in. order to illustrate the similarity between the (direct) effects of pollution reduction (p < 0) and adverse productivity shocks ( iY, A, < 0).
5.1. Real return and growth
The steady-state version of the Ramsey rule (2.10) governing the intertemporal allocation of consumption links the real return r to growth g:
r=O+$.
Log-linearizing this expression, we find6
(5.4
(5.5)
The effect on economic growth is directly related to the impact on the real return. Growth is especially sensitive to the real return if the intertemporal elasticity, a, and the rate of time preference, 8, are large. The effect on the real return is given by (see Appendix C)
(5.6)
where the shares of capital in the production of final goods and knowledge in the initial equilibrium are denoted by, respectively, cr = (K,IF)(PIX,) and p = (K,IG)(~GI~K,). The effect of productivity shocks on the real return (5.6) is closely related to the result derived by Rebel0 (1991) for the case of Cobb-Douglas production functions. Rebel0 found that the long-run real return depends on the geometric average of the two productivity parameters A, and A, with the same weights as in (5.6). Expression (5.6) generalizes Rebelo’s result to production functions with non-unitary substi- tution elasticities.
The condition for an improved growth performance is (from (5.2), (5.5) and (5.6))
ay z P>(l-a). ( > (5.7)
Growth improves if the positive impact of a higher environmental quality on productivity is large (i.e. ay large). Moreover, a cut in pollution should
6 Differentiating (5.4), one finds dr = dg/a or rF= gg”/u (since r”= drlr). Substitution of the FU-IS of (5.4) for r yields (5.5).

A.L. Bovenberg, S. Smulders I Journal of Public Economics 57 (1995) 369-391 383
substantially improve steady-state environmental quality. This is the case if lower pollution strongly enhances the absorption capacity of nature (-EP large) and if the negative feedback of a higher stock of natural capital on the absorption capacity is small (-EN small). Furthermore, the share of capital in the knowledge-producing sector, j?, should be large relative to the share of pollution in the capital-producing sector, (1 - (Y). Intuitively, the positive impact of environmental quality on productivity A, should dominate its adverse effect on the absorption capacity of the environment. Furthermore, capital K and environmental quality N should be relatively important in production (i.e. /3 and aY should be large), while pollution should feature only small production shares (i.e. 1 - a and 1 - p should be small). Hence, the positive effect on the production sector of more abundant (natural and produced) capital dominates the adverse effect of lower pollution.
Environmental policy unambiguously raises growth if pollution does not enter the production of capital (i.e. (Y = 1). In this case, growth in final goods output can be sustained without pollution and knowledge inputs from the knowledge-producing sector, or in other words: the ‘core’ of the model consists only of the capital-producing sector. Since a tighter environmental policy affects the ‘core’ only through the positive productivity effect of better environmental quality, it improves growth. The ‘core’ of the model is limited to the knowledge-producing sector if capital does not impact the production of effective pollution (i.e. /I = 0), because then growth in final goods output can be sustained without growth in capital K (provided that (Y < 1). In that case, growth declines because a more ambitious environmen- tal policy affects the core only through the adverse productivity impact of a lower flow of pollution.
5.2. The production structure: The income share of the public sector
A tighter environmental policy changes the production structure in terms of the distribution of economic activity over the two production sectors. In particular, the long-run impact on the ratio of public to private spending, q,,HlY, is7
(5.8)
7 See Appendix D. This appendix also provides an expression for an alternative indicator of the intersectoral structure of production, namely the share of effective pollution allocated to the consumption-goods sector. See, in particular, expression (D.3).

384 A.L. Bovenberg, S. Smulders I Journal of Public Economics 57 (1995) 369-391
The first term on the right-hand side of (5.8) represents the impact of relative productivity shocks, which affect the relative scarcity of the two rival production factors (i.e. capital and effective pollution). A more ambitious environmental policy causes effective pollution to become scarcer c_ompared with capital, for two reasons. First, it reduces pollution (i.e. P < 0). Second, it raises the supply of capital by boosting the productivity of the capital-producing sector (i.e. sY >O). In response to the increased scarcity of polluting inputs, resources move to the knowledge sector in order to develop more pollution-augmenting technologies. The intersectoral relocation of resources towards the public sector is smaller if intrasectoral substitution between capital and effective pollution is easy. Intuitively, intrusectoral substitution between the two rival inputs substitutes for intersectoral relocation. However, if intrasectoral substitution elasticities are below unity, pollution-augmenting knowledge is a better substitute for pollution than capital. Hence, intersectoral substitution dominates intrasec- toral substitution so that the public sector expands.
The second term on the right-hand side of (5.8) stands for the impact of shocks in aggregate productivity. Higher growth corresponding to a higher return (i.e. g, r”> 0) makes investment more important compared with con- sumption. Accordingly, economic activity shifts away from the consumption- goods sector towards the pure ‘investment’ sector (i.e. the environmental R&D sector). The aggregate productivity effect becomes more powerful in affecting the intersectoral allocation if a large intertemporal substitution elasticity, U, implies a substantial response of growth to changes in aggregate productivity.
If environmental policy raises growth, both productivity effects work in the direction of boosting the public sector. The public sector thus unambigu- ously expands compared with the private sector. If long-run growth declines, however, the aggregate productivity effect causes the public sector to contract as the economy becomes more oriented towards consumption. Nevertheless, if intertemporal substitution in consumption and intrasectoral substitution in production are difficult, a lower level of pollution raises the income share of the public sector as factors move to that sector. Intuitively, to substitute for pollution, the economy invests mainly in knowledge instead of either investing in physical capital (which would have happened if intrasectoral substitution in production were easy) or consuming (which would have happened if intertemporal substitution in consumption were easy).
5.3. The direction of technological progress
The overall knowledge-intensity of production, K/h, indicates the bias of technological progress. The long-run effect on this variable can be written as (see Appendix E):
A.L. Bovenberg, S. Smulders I Journal of Public Economics 57 (1995) 369-391 385
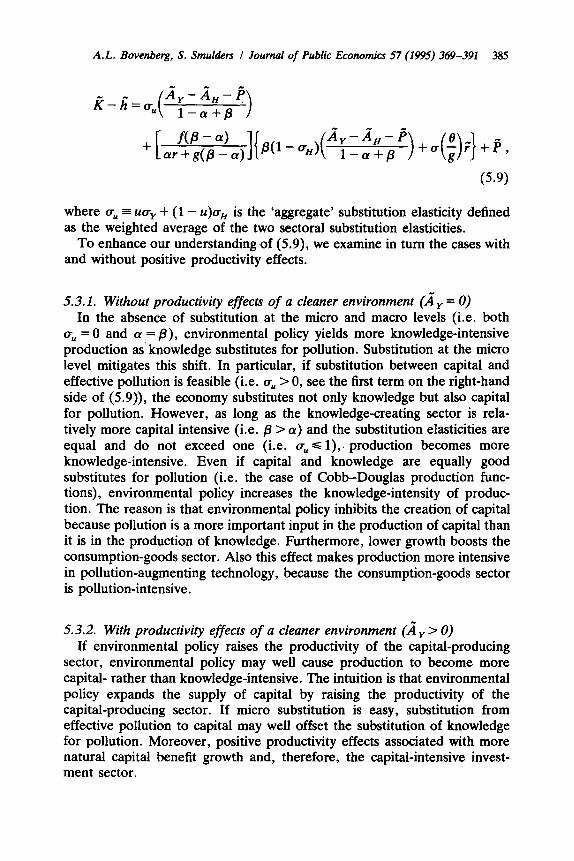
[ f@ - a)
+ ar+g@-a) ][kw%)( y:,“)+u(;)F}+P,
where a,, = UU, + (1 - u)aH is the ‘aggregate’ substitution elasticity defined as the weighted average of the two sectoral substitution elasticities.
To enhance our understanding of (5.9) we examine in turn the cases with and without positive productivity effects.
5.3.1. Without productivity effects of a cleaner environment (Ay = 0) In the absence of substitution at the micro and macro levels (i.e. both
u,, = 0 and (Y = j?), environmental policy yields more knowledge-intensive production as knowledge substitutes for pollution. Substitution at the micro level mitigates this shift. In particular, if substitution between capital and effective pollution is feasible (i.e. a, > 0, see the first term on the right-hand side of (5.9)), the economy substitutes not only knowledge but also capital for pollution. However, as long as the knowledge-creating sector is rela- tively more capital intensive (i.e. p > (Y) and the substitution elasticities are equal and do not exceed one (i.e. a,, d l), production becomes more knowledge-intensive. Even if capital and knowledge are equally good substitutes for pollution (i.e. the case of Cobb-Douglas production func- tions), environmental policy increases the knowledge-intensity of produc- tion. The reason is that environmental policy inhibits the creation of capital because pollution is a more important input in the production of capital than it is in the production of knowledge. Furthermore, lower growth boosts the consumption-goods sector. Also this effect makes production more intensive in pollution-augmenting technology, because the consumption-goods sector is pollution-intensive.
53.2. With productivity effects of a cleaner environment (Ay > 0) If environmental policy raises the productivity of the capital-producing
sector, environmental policy may well cause production to become more capital- rather than knowledge-intensive. The intuition is that environmental policy expands the supply of capital by raising the productivity of the capital-producing sector. If micro substitution is easy, substitution from effective pollution to capital may well offset the substitution of knowledge for pollution. Moreover, positive productivity effects associated with more natural capital benefit growth and, therefore, the capital-intensive invest- ment sector.
3% A.L. Bovenberg, S. Smulders I Journal of Public Economics 57 (1995) 369-391
6. Conclusions
This paper has developed an endogenous growth model that incorporates pollution-augmenting technological change and, at the same time, includes the natural environment as a renewable resource. The model simultaneously determines the time paths for three types of assets: renewable resources, physical capital, and knowledge. The accumulation of these three asset stocks is affected by the endogenous flows of, respectively, pollution, saving, and inputs into the R&D sector.
Section 3 derived the conditions under which sustainable balanced growth is not only feasible but also optimal. In such a situation, consumption and man-made inputs (knowledge and physical capital) are growing, while the flow of pollution and the stock of natural capital remain constant. This implies that the shadow price of natural resources rises over time, thereby encouraging substitution away from environmental services toward con- sumption and the input of man-made factors of production. Constant environmental quality is feasible and optimal only if these substitution effects offset exactly the income effects due to the growth in productivity. Hence, balanced optimal growth requires unitary elasticities of substitution between environmental services and material consumption in the utility function and between environmental services and man-made factors of production in the production functions, Furthermore, it must be excluded that technologies with decreasing (increasing) returns to scale in the man- made factors become dominant in the economy as a whole, since this would imply ever-falling (increasing) rates of growth. , How the government should intervene to achieve optimal growth was investigated in Section 4. Private agents do not internalize the adverse effect of pollution on the aggregate stock of natural capital; a tax on pollution is therefore necessary. This tax should rise at the growth rate of pollution- augmenting knowledge, since the development of new technology raises the productivity of polluting inputs and provides ceteris paribus an incentive to increase pollution. Pollution-augmenting knowledge is a public good and should thus be provided by the government. We found that the government should earmark only part of the revenues from the pollution tax for investing in pollution-augmenting knowledge. Intuitively, the tax revenues measure the return on pollution-augmenting knowledge. As a kind of golden rule, the government should ‘consume’ part of this return.
Section 5 explored the link between, on the one hand, long-run growth and, on the other hand, a more ambitious environmental policy, which is associated with a smaller aggregate flow of pollution. Long-run growth rises if lower pollution exerts a strong positive long-run impact on the sustainable stock of natural capital, while natural and physical capital account for large production shares. Increased environmental concern typically raises activity

A.L. Bovenberg, S. Smulders I Journal of Public Economics 57 (1995) 369-391 387
in the environmental R&D sector, thereby expanding the relative impor- tance of public spending. Intersectoral relocation is particularly large if substitution between capital and knowledge is difficult and if the environ- ment enhances the productivity of the capital-producing sector. Technology becomes more pollution augmenting (indicated by a smaller capital-to- knowledge ratio), the more difficult substitution is between capital and polluting inputs and the smaller is the productive role of the environment. However, if substitution is easy and the environment is directly productive in the capital-goods sector, the supply of capital is boosted and the economy relies more on physical capital and less on knowledge to replace pollution.
An obvious extension of this paper is to study the transitional dynamics of the model. The short-term effects of environmental policy on growth are likely to be negative as the reduction in polluting inputs dominates. Only in later stages may the stock of environmental services rise enough to boost growth (see Bovenberg and Smulders, 1994). Another valuable extension involves the incorporation of public spending on abatement. In that case, distortionary taxes may be required to finance public spending if lump-sum taxes are not available.
Appendix A: Optimality conditions
The Hamiltonian for the maximization problem reads:
x = U(c, N) + O,[Y(N, K,, Z,) - c] + O*H(K,, Z,) + O,E(N, P)
+ A,[K - KY - KH] + h,[hP - zy - Z,] ) (A.1)
where O,, 0, and 0, denote the costate variables associated with the accumulation of physical capital, knowledge capital, and natural capital, respectively, and where A, and A, are the Lagrange multipliers associated with the resource constraints for physical capital and effective pollution, respectively. In the main text, we use the costate variable 0, as numeraire:
From the first-order condition XWdc = 0, we find
0, = UC . (A-3)
The conditions for optimal static allocation, (2.6)-(2.8) follow from the other first-order conditions. In particular, (2.6) follows from aX/aK, = a%‘laK, = 0, (2.7) from XWaZ, = aX/aZ, = 0, and (2.8) from aXlaP = 0.
The condition for optimal dynamic allocation (2.9) follows from the canonical conditions aWaK = M3, - d,,,, ax/ah = 00, - &, and dX/aN = 00, - $. To arrive at the Ramsey rule (2.10), we differentiate (A.3) with respect to time and substitute the canonical condition aX/aK = t@, - &,,,

388 A.L. Bovenberg, S. Smulders I Journal of Public Economics 57 (1995) 369-391
which can be written as r = 8 - &llOl if we apply the definition of r in (A.2).
Appendix B: Steady-state ratios
Eliminating qh from (2.6) and (2.7), we find
-aY/dK, aH/aK, aylaz, = afuaz, *
The initial steady-state version of (B. 1) is
P (1-d f-$=-- (1 -.P) Cl- u> ’
(B-1)
(B.2)
where & = K,(aFIaK,)IF and j3 = K,(dGIaK,)IG. On a balanced growth path (i.e. g,, = 0), the optimal choice between investing in capital and technological knowledge is characterized by (see (2.9))
r = aY/aK, = qafziaz,) . (B-3)
Noting that in the steady state YIK = clK + g and that hlh = k/K = g, we can write (B.3) as
(1-P) r=%(g+c/K)=(l-;rg. (B.4)
Solving (B.2) and (B.4) for V, u, and clK, we find
1 ’ y= (r-g)+@ r ’ (B-5)
C -= K [
r-g+& a(r-g)+pg r-g= 1 [ r+w4q(r_g).
a(r-g)+/3g (B.6)
Since the Inada conditions require c > 0, expression (B.6) implies that r > g. The steady-state ratio q,Hh,P is found by using (2.7) and (4.1) to eliminate q,, and rP:
ChH Hlh
7pp= (aHlaz,)P * (‘3.7)
we arrive at (4.2) by substituting r = (aHlaZ,)P (see (B.3)) and H/h = hlh = g.

A.L. Bovenberg, S. Smulders 1 Journal of Public Economics 57 (1995) 369-391 389
Appendix C: Environmental quality and rate of return
In the long run, environmental quality is_constant, Setting (2.1) equal to zero and log-linearizing, we arrive at ENNN + EpPP = 0. Hence, the long- run relationship between the flow of pollution and the stock of natural capital is given by
I?=-($gF. We find (5.2) and (5.3) by log-linearizing A, = A.(N) and (C.1).
Log-linearizing (B.l) and (B.3), we find
$,(zy-8y)=$$j-&f), A” +(1--a) -
Y ,-(zy-~y)=d,+B-~(~~-r?,)=~. These two equations yield the solutions for the sectoral factor
(C.1)
substituting
(C-2)
(C.3)
intensities:
(C.4)
Substituting these solutions in (C.3) we find expression (5.6) for 7.
Appendix D: sectoral allocation
Using (3.5) we can write the growth rate of knowledge as g,, = H/h = (A,G(K,, 2,)/2,)(2,/h). Substituting Z, = (1 - v)hP and log-lineariz- ing, we arrive at
&=&+d+&&)+$ (D-1)
Substitution of the solution for & - ZH from (C-4) and using & = g” yields:
V 3 iiy-ti,-F l-v
v”=&+F-r”+po, ( 1-a+p >
+?-i.
Substituting (5.5) and (5.6), we find
V v”-= -P(l
l-v - UH) ( iiy-jl,-F 8 1-(Y+j3 > 0 -a-r”.
g
(D.2)
(D-3)

390 A.L. Bovenberg, S. Smulders I Journal of Public Economics 57 (1995) 369-391
We arrive at (5.8) by log-linearization of (2.6), (3.4), and (3.5) which yields:
(D.4)
~==~+[h”+~+v”]+a(K,-2,), (D-5)
,., _ .., - _ a, H=A,+ h+P-/v; +/3(KH-ZH) 1 P.6)
After substituting (C.4) and employing (D.3) to eliminate c, we find (5.8).
Appendix E: Knowledge-capital ratio
Noting from the definition of v and u that K, = UK and Z, = vhP, we find
&-&)=[U”+K]-[V”+h”+F]=(k-q-F+u”-v”. (E-1)
Similarly, noting that (1 - v)hP = Z, and (1 - u)K = KH, we may write
Substitution of (E.2) into (E.l) to eliminate u” and rewriting yields:
(E-3)
We find (5.9) by substituting (C.4) and (D.3) into (E.3) and using (from (B.5)):
v-u g(P - a> -= crr+g@ -a) * V (E.4)
References
Bovenberg, A.L. and S. Smulders, 1994, Transitional impacts of environmental policy in an endogenous growth model, CentER Discussion paper No. 9450, Tilburg University.
Cabal& J. and M.S. Santos, 1993, On endogenous growth with physical and human capital, Journal of Political Economy 101, 1042-1067.
Charnley, C., 1993, Externalities and dynamics in models of ‘learning or doing’, International Economic Review 34, 583-610.
Forster, B.A., 1973, Optimal capital accumulation in a polluted environment, Southern Economic Journal 39, 544-547.
Jones, L. and R. Manuelli, 1990, A convex model of equilibrium growth: Theory and policy implications, Journal of Political Economy 98, 1008-1038.

A.L. Bovenberg, S. Smulders ! Journal of Public Economics 57 (1995) 369-391 391
King, R., C. Plosser and S. Rebelo, 1988, Production, growth and business cycles, I: The basic neoclassical model, Journal of Monetary Economics 21, 195-232.
Lucas, R.E., 1988, On the mechanics of economic development, Journal of Monetary Economics 22, 3-42.
Mulligan, C. and X. &la-i-Martin, 1993, Transitional dynamics in two-sector models of endogenous growth, Quarterly Journal of Economics 108, 739-773.
Ploeg, F. van der and C. Withagen, 1991, Pollution control and the Ramsey problem, Environmental and Resource Economics 1, 215-236.
Rebelo, S., 1991, Long-run policy analysis and long-run growth, Journal of Political Fonomy 99, 500-521.
Romer, P.M., 1990, Endogenous technological change, Journal of Political Economy 98, s71-s102.
Tahvonen, 0. and J. Kuuluvainen, 1991, Optimal growth with renewable resources and pollution, European Economic Review 35, 650-661.