Globalization and technological growth: a model for technological diffusion in Mexico
35
Globalization and Technological Growth: A Model for Technology Diffusion in Mexico, 1996-2000 Dr. Jorge Eduardo Mendoza 1 El Colegio de la Frontera Norte Mtro. Victor Hugo Torres Universidad Autonóma de Guadalajara Abstract The study shows that the generation of innovations presented a moderate increasing trend in Mexico during the period 1996-2000. However, there was a divergence process between national and foreign innovation. The results of a panel data model showed a positive effect of the existing human capital within each state on the innovation process. The variables representing the impact of out-of–the-state innovation and the stock of foreign knowledge showed a negative effect on the process of innovation of the states. When including both the stock of foreign innovation and the out-of-the-state stock of innovations, the productivity of human capital decreased. Resumen El estudio muestra que el proceso de innovación en México tuvó un crecimiento moderado durante el periodo 1996-2000. Sin embargo, la participación de las innovaciones nacionales decreció y la de las extranjeras se elevó. Se aplicó un modelo de datos de panel, cuyos resultados muestran un efecto positivo del capital humano disponible al nivel estatal. Las variables que representan las patentes de otros estados y las patentes extranjeras mostraron signos negativos respecto a la generación de patentes. Cuando se incluyen ambas variables el efecto de la productividad del capital humano para generar innovaciones decreció. 1. Introduction Several theoretical and empirical studies have analyzed the problem of technological change. The analysis of the determinants of innovation has 1 Director del Departamento de Estudios Económicos en El Colegio de la Frontera Norte. México. Dirección: Blvd. Abelardo L. Rodríguez 2925, Zona del Río, BC, 22320, México. US Address : P.O. Box “L”, Chula Vista, CA, 91912-1257, USA. Email: [email protected]
Transcript of Globalization and technological growth: a model for technological diffusion in Mexico

Globalization and Technological Growth: A Model for Technology Diffusion
in Mexico, 1996-2000
Dr. Jorge Eduardo Mendoza1 El Colegio de la Frontera Norte
Mtro. Victor Hugo Torres Universidad Autonóma de Guadalajara
Abstract
The study shows that the generation of innovations presented a moderate increasing trend in Mexico during the period 1996-2000. However, there was a divergence process between national and foreign innovation. The results of a panel data model showed a positive effect of the existing human capital within each state on the innovation process. The variables representing the impact of out-of–the-state innovation and the stock of foreign knowledge showed a negative effect on the process of innovation of the states. When including both the stock of foreign innovation and the out-of-the-state stock of innovations, the productivity of human capital decreased.
Resumen El estudio muestra que el proceso de innovación en México tuvó un crecimiento moderado durante el periodo 1996-2000. Sin embargo, la participación de las innovaciones nacionales decreció y la de las extranjeras se elevó. Se aplicó un modelo de datos de panel, cuyos resultados muestran un efecto positivo del capital humano disponible al nivel estatal. Las variables que representan las patentes de otros estados y las patentes extranjeras mostraron signos negativos respecto a la generación de patentes. Cuando se incluyen ambas variables el efecto de la productividad del capital humano para generar innovaciones decreció. 1. Introduction
Several theoretical and empirical studies have analyzed the problem of
technological change. The analysis of the determinants of innovation has
1 Director del Departamento de Estudios Económicos en El Colegio de la Frontera Norte. México. Dirección: Blvd. Abelardo L. Rodríguez 2925, Zona del Río, BC, 22320, México. US Address : P.O. Box “L”, Chula Vista, CA, 91912-1257, USA. Email: [email protected]

1
1
developed based on economic growth theory. Solow (1956) pointed out the
importance of technological change in the rate of growth of the economy.
Following that approach, Romer (1990) set up a model including technological
innovation as endogenous variable, by assuming that it was a function of human
capital devoted to research and development and of the stock of knowledge.
Other studies that have contributed to the theoretical aspects of the
analysis of technological change are Jones (1995) and Aghion y Howitt (1998).
However, only a few studies have focused on the empirical analysis of
technological change. Among those papers two stand out. The first, by Lucas
(1988), introduced the concept of human capital, although he did not present any
specific conclusions regarding the relationship technology-growth. The second,
by Barro and Sala i Martín (1996), presented a growth model with human capital
as an explanatory variable in the convergence process.
Recently, Porter et. al. (1999) and Stern et. al. (1999) have focused on
the empirical analysis of technological change. The first paper estimated the
production function of innovation proposed by Romer, with the objective of
understanding the positive influence of both the human capital devoted to
research and the technological spillovers on economic growth. Stern et. al.
proposed the concept of national capacity as a synthesis of the theoretical work
of Porter, Nelson (1993) and Romer. Under this approach microeconomic factors
emerge from the cluster activities.
The studies regarding technological globalization have mainly focused on
the empirical process, with few contributions from the theoretical perspective

2
2
(Estay, 1995). Studies have been published on the process of globalization and
its influence on the regions within a country (Dávila, 1995) and (Manchón, 1995)
and its relationship with the process of technological innovation (Dávila, 1995)
and (Váldez, 1995). There are also studies related to the fragmentation of
technological innovation among different countries, according to the strategies of
the multinational firms located there.
During the decade of the eighties, several papers focused on the evolution
of science and technology in Latin America. They pointed out the dispersion of
research and development spending and patents production among developed
and developing economies (Sagasti, 1987). Other studies researched
technological capacity, considering that technology transference is a factor that
increases the national capacity to generate technology and stressed the need for
developing a broad base of researchers who can contribute to the production of
patents (Segal, 1987). Finally, another paper has stressed the importance of
inventions as a dynamic engine of economic activity (Tsur, 1989). Inventions are
the result of applied technology, which is derived from scientific knowledge. It
also underlined the potential of patents as instruments for developing
technology. It is important to stress that those papers acknowledge the
relevance of technology in regards to economic growth by regions. However,
they do not analyze the phenomenon with a formal and consistent theoretical
framework.
For the case of Mexico, there is a tendency to produce empirical studies
regarding technological change. Aditionally, those studies have not address

3
3
innovation activity as a crucial element for the economic growth of the country.
One such study focuses on innovation at the national level, by analyzing
statistical information about patents (Aboites, 1999).
The present paper seeks to analize national innovation activity from a
regional perspective, within the context of the globalization of technology. When
analyzing the technological innovation in Mexico, three characteristics stand out:
a) There is a high sensibility of both the foreign and domestic innovations
to the business cycle.
b) Foreign innovation showed an increasing trend during the decade of
the nineties.
c) There is a decline in the rate of growth of national innovations, in the
same period.
Taking into consideration the characteristics of technological innovation in
Mexico, the present paper analyzes the interrelationship of both the foreign and
domestic innovations and estimates the impact of technological globalization on
the domestic capacity to produce innovations. The context of analysis
incorporates regional dynamics in the process of innovation by assuming that
technological innovation is developed under a framework of regional
relationships.
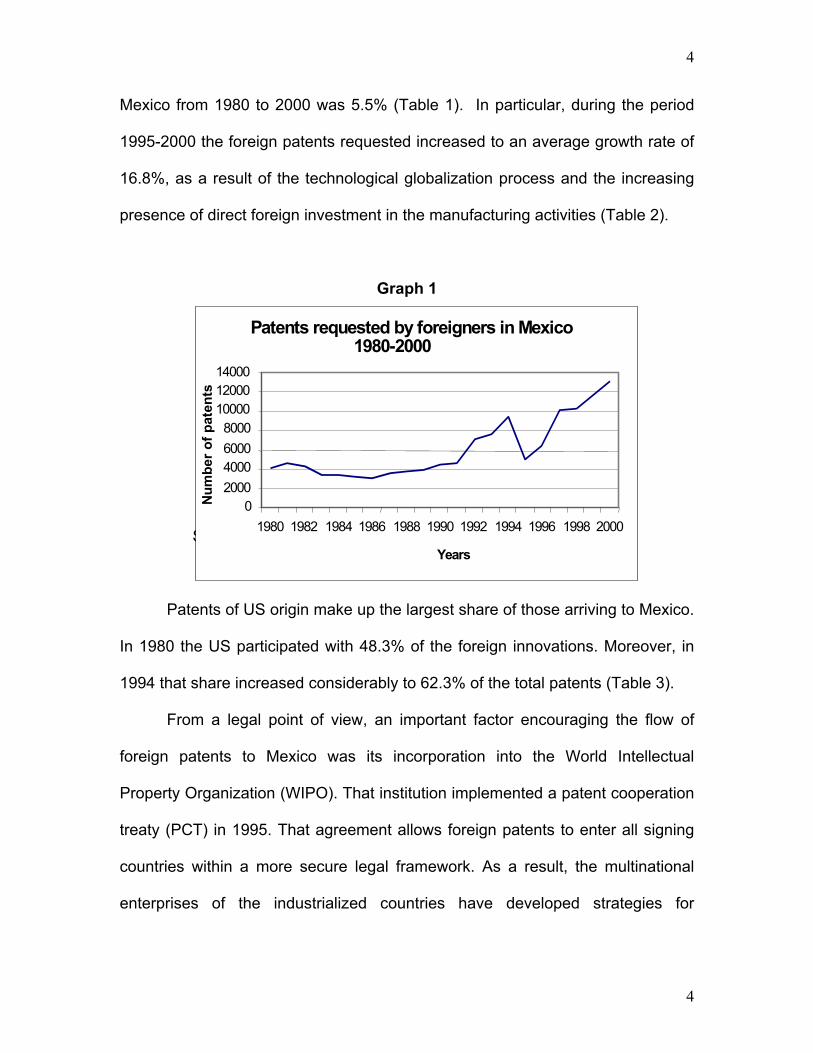
2. The globalization of the technological Innovation 2.2.1 Innovation and foreign patents in Mexico The liberalization of the Mexican economy was characterized by the rapid growth
of foreign patents (see Graph 1). The annual average growth of foreign patents in
4
4
Mexico from 1980 to 2000 was 5.5% (Table 1). In particular, during the period
1995-2000 the foreign patents requested increased to an average growth rate of
16.8%, as a result of the technological globalization process and the increasing
presence of direct foreign investment in the manufacturing activities (Table 2).
Graph 1
Source: Own elaboration with data fro Table 12.
Patents of US origin make up the largest share of those arriving to Mexico.
In 1980 the US participated with 48.3% of the foreign innovations. Moreover, in
1994 that share increased considerably to 62.3% of the total patents (Table 3).
From a legal point of view, an important factor encouraging the flow of
foreign patents to Mexico was its incorporation into the World Intellectual
Property Organization (WIPO). That institution implemented a patent cooperation
treaty (PCT) in 1995. That agreement allows foreign patents to enter all signing
countries within a more secure legal framework. As a result, the multinational
enterprises of the industrialized countries have developed strategies for
Patents requested by foreigners in Mexico
1980-2000
0 2000 4000 6000 8000
10000 12000 14000
1980 1982 1984 1986 1988 1990 1992 1994 1996 1998 2000 Years
Num
ber o
f pat
ents

5
5
extending legal and market protection to their technological innovations in order
to prevent the expansion of new local competitors.
The increasing flow of patents into the Mexican economy has resulted in a
higher technological capacity because the introduction of new products has
enlarged the stock of knowledge available to research and development
activities. However, the rapid growth of foreign patents has also determined a
gap between the Mexican economy and the economies that have developed
technology innovations. This technological gap decreases as a result of the
positive impact of technological spillovers on other economic sectors, and on the
other hand, increases because of difficulties in adopting foreign knowledge.
Finally, it is important to point out that, in 1991, the foreign patents in
Mexico were concentrated on the chemical and metallurgic industries (35.7%).
Other important receptors of technology were the industrial and consumer goods,
and the electricity sector, with shares of 18.7%, 16.7% and 8.8% (Table 4). In
1999, the shares of patents were concentrated in the electricity and consumer
goods sectors.
2.2.2 National innovations and patents In Mexico, the domestic generation of technology, as measured by the number of
requested patents, decreased during the last decade. The aggregate production
of innovations presented an annual average rate of growth of 2% for the period
1980-2000. The number of patents requested by Mexican nationals decreased
from 665 in 1980 to 431 in 2000 (Table 5).
It is worth noting that during the period 1985-1990 the rate of growth of
patents was positive (1.3%). In contrast, from 1990 to 1995 the rate of growth of

6
6
patents became negative at –6.8 (Table 1). However, the next 5 year period
(1995-2000) was characterized by a rapid process of economic liberalization and
reactivation, but even so, the rate of growth was stagnant, while foreign patents
experience very rapid growth ( see Graph 2).
Graph 2
Source: Own elaboration with data from Table 12.
In order to evaluate the interaction of the inputs required to develop
technological change, it is important to analyze the impact of human capital. In
the present study, this variable is specified as the number of researchers that
belong to the National Research System (SNI).
In 1991 and 1992 the rates of growth of members of the SNI were 7.9% and
7.3% respectively. However, during the period 1993-1995 negative rates of
growth were experienced, probably impacted by the economic recession. During
1997-1999 the growth rate recovered its dynamism to levels above 7%. Even
though its growth trend showed clear fluctuations, the positive growth of
researchers for the period 1991-1999 could be positively affecting the innovation
process (Table 6).
Patents requested by residents of Mexico
1980-2000
0
200
400 600
800
1980 19821984198619881990199219941996 1998 2000 Years
Num
ber o
f pat
ents

7
7
Patents are important indicators of technological change. The
accumulation of the stock of innovations can be mainly observed through the
accumulated stock of patents. For the case of Mexico the growth of the patent
stock has been decreasing as a result of the diminishing number of national
patents requested. Thus, the annual rate of growth of patents decreased from
38.4% in 1982 to 3.7% in 2000 (see Table 6). It is assumed that the larger the
stock of patents the greater is the access to knowledge by researchers and their
productivity in the innovation process.
2.3 Regional innovation structure and dynamics The structure of the regional production of innovations reflects the diversity of this
activity in the Mexican economy and the existence of different conditions under
which the innovation process is undertaken. Its implications are exhibited in the
heterogeneous contribution of the states to the innovation process.
In the year 2000, the regions that had a larger participation in the process
of national innovation were Distrito Federal (with its greater technological
infrastructure), state of Mexico, Jalisco, Nuevo Leon, Puebla and Queretaro, with
shares greater than 4%. The states with lower shares were Aguascalientes, Baja
California, Baja California Sur, Campeche, Chiapas, Durango, Guerrero, Hidalgo,
Michoacan, Nayarit and Oaxaca (see Table 7).
The importance of the diversity of innovations among states is related to
the fact that regions with weaker technological innovations can be affected by
those regions with greater technological innovation. On one hand, the possibility
of positive effects of technological spillovers among states could encourage the
production of innovation in comparatively weaker regions. However, the disparity

8
8
in the technological change at the regional level suggests the lack of interaction
among innovation activities in the states of Mexico. This phenomenon could be
the result of the restrictions to inter-regional technological spillovers.
Apparently, the innovation process in Mexico has been characterized by a
limited relationship between the availability of human capital potentially able to
participate in research and development activities and the production of patents.
Therefore, the higher number of researchers (SNI) has not implied, in many
cases, a greater rate of technological innovation growth.
According to information on SNI researchers, there exists a high possibility
that those researchers have a tendency to move to regions with better conditions
in terms of technological infrastructure and access to knowledge. The highest
concentration of researchers for the year 2000 have been located in Distrito
Federal, state of Mexico, Morelos, Puebla, Jalisco, Guanajuato and Baja
California. Since 1996, Baja California, Estado de Mexico, Morelos and Puebla
have increased their stock of human capital (see Table 8).
3. Theoretical aspects of the innovation process under the globalization of technology This approach to the evaluation of the impact of the globalization of technology
on the production of innovation in Mexico is based on the endogenous economic
growth model developed by Romer (1990). This approach considers that
technological innovation is a function of new knowledge or ideas that, in turn, are
9
9
endogeneized, since they depend on the human capital devoted to research and
development and on the existing stock of knowledge2. Therefore, according to
this model, there are spillover effects from the stock of ideas, which can be used
by the human capital in the production of new ideas.
The conclusions derived from the Romer model are that, in equilibrium,
the rate of growth of per capita production yg , the rate of growth of capital per
worker kg , and the rate of growth of ideas Ag , increase at the same rhythm.
Therefore, production growth depends on the production of ideas, which in turn
depends on the number of researchers. The other important implication is related
to the positive effect of ideas spillovers on the average productivity of
researchers (−
δ ), which can allow for a growing expansion of innovation even if
the number of researchers remains constant.
Porter et. al. (1999), developed a model based on Romer’s approach to
evaluate the effect of domestic innovation spillovers (within each country) and
international spillovers (from the rest of the world). He relates the international
patents to a national production function of ideas and considers that there are
few national patents that, in a given point in time, are new or at the cutting edge
at the international level, and only the ones that go beyond the knowledge
frontier are relevant at the international level.
2 AδHA A
.= is thecnological change, where
.A ≈ A∆ , depends on the flow of new ideas, A is the stock
of ideas. The parameterδ represents the human capital research productivity. A non-rivalry environment is assumed (A can be used by all the researchers).

10
10
For that reason, the stock of international ideas has a double effect. On
one hand, it has a diffusion effect on the national growth of technology, and on
the other hand, it also functions as a barrier or negative diffusion due to the
existence of technological competition to be on the cutting edge of technology.
However, the assumption of non-rivalry and partial exclusivity remain, which
imply that national reserachers have access to the international knowledge in
their own country.
By the same token, this assumption is also applied to the world stock of
knowledge. The increasing stock of knowledge acquired within a country implies
that another country could not patent it, although it can have access to it. In that
sense there is a competition to patent year by year and there are different
propensities to patent.
3.1 The model to evaluate the impact of international patents at the regional
level
The model for the evaluation of the impact of foreign patents on the national
production of patents at the state level is based on a national production function
of ideas:
)1.........(........................................AAδHA sAλ
.αψβψϕ −−
−= xs A
Where:
.A = growth of new ideas, including the ones discovered in other countries
and that have not been used in country j
AλH = human capital devoted to research and development

11
11
ϕsA = accumulated production of national ideas in the state s
βψ −
−sA = stock of ideas discovered in other states of the country that have
not been discovered in the state s (out-of-state innovation)
αψ −
xA = stock of foreign ideas
Therefore, the production of innovation results from the interaction
between the innovation within each individual state and from out of the states.
When the parameters show the following characteristic ψ > β , the impact is
positive, and it would be negative if ψ < β . In order to take into account the
effects of the globalization of innovations, a variable representing the stock of
international innovations is included. Its impact can be divided into two parts. The
first one is positive and it derives from the effect of diffusion that the stock of
international ideas has in *.
A . However, there is a barrier effect or negative
diffusion when the new ideas in the country are not new at the international level
(α > ψ ).
It is assumed that there is a non-rival or partial exclusivity environment,
which implies that the human capital has access to the stock of international
knowledge both in the state sAφ and in the rest of the regions that make up the
national economy βψ -s-A .
The present study is based on the following hypotheses:
• The regional human capital devoted to research and development at the state
level (HAs) has a positive influence on the production of regional patents. This

12
12
implies that the research effort undertaken in Mexico is an important factor
leading to the increase in technological innovation.
• The stock of regional individual patents (As) has a positive effect on the
regional production of individual patents. Therefore, there are innovation
spillovers from knowledge acquired previously in each region, which is used
by researchers to generate new ideas.
• The stock of out-of-state patents (A-s) has a negative impact on the
production of regional individual patents. This is caused by barriers to the
diffusion of knowledge acquired by the states, which in turn reveals a weak
link between the innovation activities among the states and problems of
adaptation and technology transfer.
• The stock of foreign patents (Ax) has a negative effect on the production of
regional individual patents. Thechnological globalization, expressed by the
increasing production of foreign technological innovation, seems to be related
to limited national innovation activities and problems in the diffusion of
international knowledge.
4. The empirical model of technological change The theoretical model presented above is based on the use of patents as a proxy
for innovation activities. The data from patents has frequently been used as an
economic indicator in applied economic research (Grilichez, 1990). Moreover, the
use of patents as a proxy for technological knowledge has been accepted by
empirical researchers such as Romer (1990), Jones (2000), Porter et. al. (1999)

13
13
and Stern et. al. (2001). However, it must be acknowledged that patents are an
imperfect indicator of technological innovation, since not all innovation is
patented.
Since the states of Mexico showed different rates of growth in the
production of innovation, it is important to be able to estimate the impact of
innovation activity at the regional level. The estimation of the econometric model
will be based on a fixed effects panel regression applied to a cross section
database that encompasses several years. By estimating a production function
using states as decision units, we will be able to evaluate the national production
of innovation as a result of the state innovation activity.
The empirical model extends the methodology proposed by Porter (1999)
to analyze the evolution of regional technological innovation in Mexico by
estimating the following two empirical equations:
1) st stAstY ηφlnAλlnHγc
sδ tlnPatsst ++++=
Where sPats represents the innovation produced and patented in the period t in
all the states of Mexico in the year t, AstH is the human capital devoted to the
production of ideas (research and development) for each of the states of Mexico
in the year t, AstH is the stock of innovation accumulated (requested patents) that
have been discovered in other states of Mexico and that have not yet been
discovered in the state s, in the year t (out-of-state patents).
There are two dummy variables to control for state and year. They are
introduced to take into account the differences in the propensity to patent

14
14
resulting from the different industrial composition of states γcj , and also to
evaluate the variation of that propensity over the yearsδ tY ,
2) ηAXα)(ψAβ)(ψφlnAλlnHγcsδ tPatsln st ststststAst
Y +−−++++= −
Where AXst is the stock of foreign innovation (foreign patents requested)
that flow to Mexico and affect the state s in the year t. The impact of this variable,
at the regional level, is calculated as the ratio of foreign patents requested to the
total of all patents requested in the state.
In order to be able to evaluate the effects of the globalization of
technology on the innovation growth at the state level over a period of years, we
chose to apply a fixed effects panel economteric model to a cross sectional and
times series database.
4.1 Data Base
The number of patents by state was obtained from the matrix of patents
requested from 1991 to 2000, published by El Consejo Nacional de Ciencia y
Tecnología (CONACYT). The stock of patents at the state level and the stock of
patents of the rest of the states were constructed from the data of patents at the
state level. The proxy of human capital devoted to research and development
was obtained from the data of the Sistema Nacional de Investigadores (SNI) by
state, for the year 1996 and 20003.
3 The SNI stands for the National Researchers System and it was created by CONACYT in order to organize the researchers in the country and to strengthen the scientific and technological research of the country.

15
15
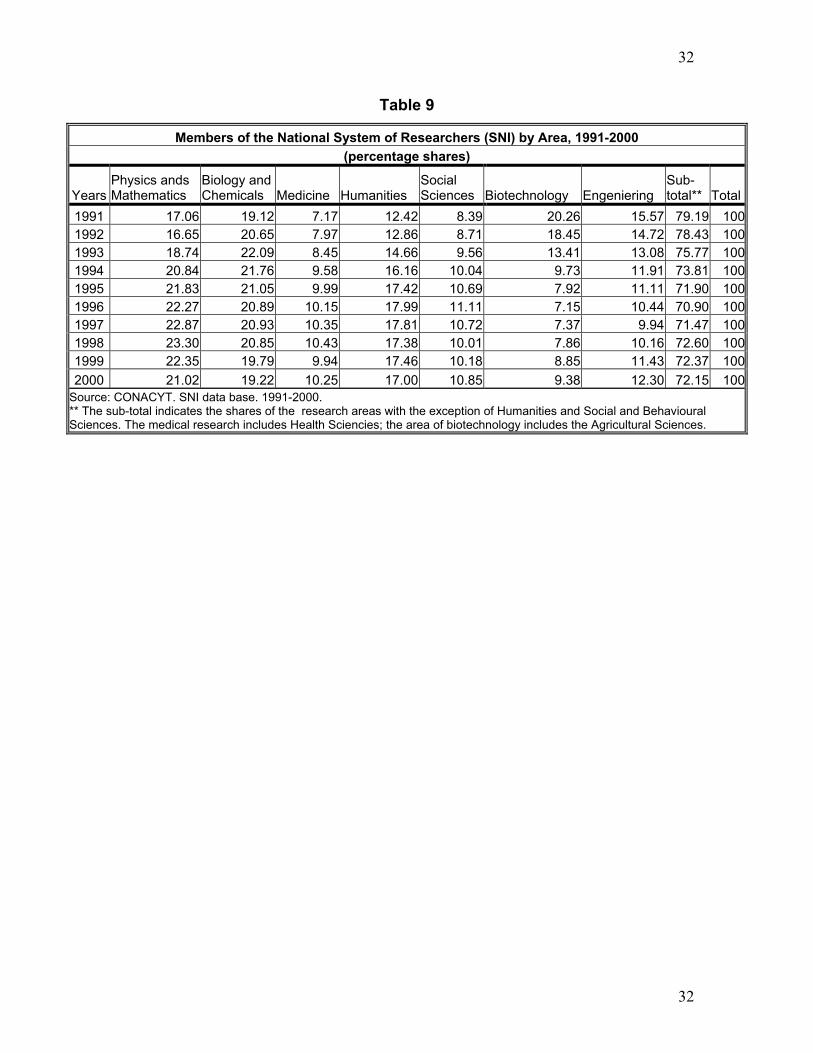
The SNI classifies its researchers into the following groups: physics and
mathematics, medicine and health sciences, biology and chemistry, humanities
and behavioral sciences, agricultural sciences and engineering.
Even though it is not possible to disaggregate human capital by activity
and region at the same time, it is important to stress that the researchers
dedicated to research and development in those sciencies (excluding social
sciences), make up a large proportion of the members of the SNI (Table 9).
Finally, the foreign patents requested information is published by CONACYT and
includes data beginning with1963.
5. Results The innovation activity showed a continuous decline in the period studied, in a
context of globalization of technological innovations. By estimating the
parameters of the production function of innovation, this decline can be explained
at the regional level, according to the endogenous growth theory.
The first econometric model showed an acceptable goodness of fit of the
adjusted R square. The DW statistic did not show autocorrelation, and the
coefficients were statistically significant at the 99% level of confidence.
Additionally, an F test was applied to the models, with a null hypothesis that fixed
effects are equal among states4, and that there are no differences among states.
The results rejected that hypothesis (Table 10).
According to Romer (1990) the parameter of human capital devoted to the
production of ideasλ and the parameter of the stock of knowledge φ are
4 Using the sum of the squared residuals we tested the null hypothesis that α1= α2 = α3 …= αn, the estimated F was higher that the F statistic in the tables, and the null hypothesis was rejected.
16
16
assumed to be equal to 1. Therefore, an increment in the stock of knowledge
determines a proportional increment in the productivity of the researcher.
For the case of Mexico, the regression results showed that both
coefficients were statistically significant, and φ presented a value of 1.07 and λ a
value of 0.16. Hence, the coefficient φ suggests that there are conditions within
the states that allow for a proportional increase in research productivity.
The positive effect of a value greater than 1 of the coefficient φ implies
that within each state there are positive effects of the stock of patents that
encourage innovation activity. The effect of stock spillovers is an externality in
each state, resulting from innovations and experiences that were developed in
some activities, and that are used by other innovation efforts. Therefore, within
each state there is a process of sharing of information. Since the study is using
patents as a proxy of innovation, the diffusion effect consists of the use of
previous patents as technological information to create new patents.
On the other hand, the coefficient of human capitalλ had a value less than
1, implying the existence of a duplication of research effort (Jones, 2000); this
effect reduces the growth of ideas resulting from an increase in the number of
researchers. Therefore, according to Jones (1995) and (2000), the value of this
parameter (λ < 1), suggests the possibility of having a weak but positive growth
in the production of ideas.
Therefore, a positive value of φ implies that there are internal conditions
within the states that encourage the development of technological innovation. It is
possible that there are also difficulties in the use of those favorable conditions,

17
17
which in turn are restricting the growth of innovation. In the case of Mexico, the
low value of the human capital coefficient suggests that external effects such as
the national competition from the rest of the states and the foreign competition
are reducing the possibility of increasing the stock of patents at the state level.
Besides, due to the heterogeneity in the characteristics of production activities
and industrial structure, it is possible that the states are not able to incorporate
the stock of knowledge from other states in the innovation process.
A second model was estimated in order to quantify the effect of innovation
in other states on the growth of the technological innovation of each state. The
impact of the innovation from the rest of the states also explains the difficulties in
the research effort (λ < 1) and the decreasing participation in the national
innovations at the state level.
The results are consistent with the first model. The coefficient φ is
statistically significant at the 99 level of confidence and had a value of 1.60. The
coefficient of the variable rest of the states is expressed as (ψ-β), and it can have
a positive range when ψ > β (diffusion effect), and a negative range when ψ < β
(barrier effects from competition). Table 15 shows a negative coefficient of 1.29,
which is statistically significant at the 99% level of confidence. Therefore, the
results suggest the possibility of barriers to technological spillovers. In fact
according to the value of the coefficient (close to 1), the increase of the
innovation activity in the rest of the states is negatively affecting the innovation
process at the single state level. Therefore, the coefficient of the variable rest of
the states helps to explain the decreasing trend of the national innovation activity.
18
18
The analysis of the coefficients representing the fixed effects of the
regression allow the estimation of the impact of the barrier effect on human
capital and on the existent stock of knowledge, at the state level. The states
showing a higher impact from technological competition were Quintana Roo,
Campeche, Chiapas, Durango, Tabasco, Colima, Nayarit, Baja California Sur,
Chihuahua and San Luis Potosi. It is worth mentioning that these states are
characterized by having low levels of technological innovation.
The 10 states with lower barrier effects were Puebla, Coahuila, Queretaro,
Hidalgo, Morelos, Veracruz, Yucatan, Jalisco, Nuevo Leon and Distrito Federal.
With the exception of Veracruz and Yucatan, these states are characterized by
relatively higher levels of technological innovation (Table 11).
These results suggest that the states with a higher production of
innovation are experiencing lower barrier effects and that those states negatively
impact the technological innovation of the states with low innovation activity. This
negative impact could be derived from competition (patents can not be registered
twice), the Law of Patents in Mexico and the technical difficulties of absorbing the
knowledge from the more developed states. Therefore, the existence of negative
diffusion effects are related to the process of convergence in the production of
innovations in Mexico, which is is based on the high rates of innovation growth of
a few states, Mendoza and Torres (2002).
In order to estimate the impact of technological globalization on the
production of national innovations in Mexico, a third model including the foreign
patents requested was estimated. According to Table 5 the parameter φ

19
19
exhibited a value of 1.66, the coefficient λ was 0.07, the coefficient ψ-β had a
value of -11.27 (higher than the regression without foreign patents) and the
coefficient showing the effect of the foreign patents (ψ - α) presented a negative
value of -0.11. All of the coefficients shown were significant at the 99% level of
confidence. The R square has an acceptable goodness of fit and the Durbin
Watson did not point out any autocorrelation problem.
It is important to point out that when incorporating the variable foreign
patents, the previous coefficients increased their values. Therefore, the results
suggest that the availability of foreign patents supports the existence of regional
conditions that increase the productivity of human capital and that increase the
innovation activities at the state level in Mexico. However, the value of the
coefficient of human capital (λ < 1) again shows difficulties for the human capital
in the development of innovation activities at the state level. From that
perspective, the results suggest the existence of barrier effects determined not
only by the lack of technological spillovers among states but also among the
domestic and the foreign patents.
As a result, innovation activity in Mexico, evaluated at the state level, has
been relatively weak, and in the long run, is translated into a reduction of the
national accumulated knowledge. The models estimated provide information
about the trend of the innovation process in Mexico. In particular, since 1995
foreign innovations have shown an accelerated growth while national innovation
activities have been relatively stagnant.

20
20
The effects of the foreign patents on the coefficients of the fixed effects by
states showed a barrier to diffusion for the states of Campeche, Durango,
Tabasco, Colima, Nayarit, Baja California Sur, Chihuahua, Guanajuato, Sonora
and San Luis Potosi. As it was mentioned above, a low level of innovation
characterizes these states. With respect to the states with less negative impact,
the same pattern emerges as the previous model. The states were Puebla,
Veracruz, Querétaro, Guerrero, Coahuila, Morelos, Hidalgo, Nuevo León and
Distrito Federal (Table 12).
6. Concluding Remarks Technological globalization is characterized by a rapid growth of foreign
innovation and an increasing share in the total creation of technology of the
receptor countries. This phenomenon is experienced in both the more
technologically advanced countries and in the developing countries. Mexico is a
net receptor of foreign technology, which represents a larger share of the total
national innovation.
The analysis of the evolution of innovation in Mexico, within the context of
the technological globalization experienced during the decade of the nineties,
shows two different results. On one hand, there is an important diminishing trend
in the process of innovation at the national level, expressed in the decline of the
national patents requested. However, the foreign patents requested exhibited an
increasing rate of growth.
In order to provide explanations of this dichotomy in the process of
innovation within the Mexican economy, a model of technological growth at the

21
21
regional level was established. The different econometric models presented
interesting findings with respect to the specific conditions, at the state level, in
which the human capital devoted to research and development, the regional and
international technological competition, and the stock of innovations are affecting
technology growth in Mexico.
The most important results are the following:
1. The coefficient of the impact of the stock of patents on the productivity
of research and development activity (φ ), supports the conclusion of the
existence of available knowledge that facilitates the generation of new patents.
2. The duplication effect (λ <1), implies that there are difficulties in using
the stock of patents available. An increase of the stock of knowledge generates
an increase less than proportional to the potential. Therefore, this result explains
part of the problems causing slow growth of domestic patents at the state level.
3. The variable out-of-state innovation helps to estimate the effect that the
other states have on the individual states in regards to innovation. The estimation
(ψ-β< 0) shows negative effects among states due to the technological
competition (the patents requested in one state precludes that other states
request a patent for the same technological development). Therefore,
technological innovation depends increasingly on the innovation activities
developed within each state,
4. The model, which includes the variable of the stock of foreign patents
available in Mexico, suggests the existence of a negative effect on national
innovation activity, derived from the competition that blocks the creation of new

22
22
national patents, and the resulting diminishing average productivity of the
research and development activities −
δ . In addition, the negative effect of foreign
patents reflects the weak technological integration of economic activities carried
out by national and foreign firms, and the wide technological gap between local
and foreign innovation.
Bibliography Aboites A., Jaime (1995). Cambio Institucional e Innovación Tecnológica. UAM-
Xochimilco. México.

23
23
Aboites A., Jaime y Soria L., Manuel (1999). Innovación, Propiedad Intelectual y Estrategias Tecnológicas, la Experiencia de la Economía Mexicana. UAM-Xochimilco. México.
Acs, Zoltan, de la Mothe, John and Paquet, Gilles (2000). “Regional Innovation: In
Search of an Enabling Strategy”, in Zoltan J. (comp.), Regional Innovation, Knowledge and Global Change. Series in Science, Technology and International Political Economy. Great Britain.
Aghion, Philippe and Howitt, Peter (1998). Endogenous Growth Theory, The MIT
PRESS. USA. Archibiugui, Daniele and Michie, Jonathan (1997). “The Globalization of Technology: A
New Taxonomy”, in Technology, Globalization and Economic Performance, Cambridge University Press. Great Britain.
Arrow, K. (1962). “The Economic Implications of Learning by Doing”, Review of
Economics Studies, 29, pp. 155-173. Barro, Robert and Xavier Sala-i-Martin (1996). “Convergence Across States and
Regions”, Brookings Papers on Economic Activity, 1, pp. 107-182. Cantwell, J. (1989). Technological Innovation and Multinational Corporatio”, Basil
Blackwell. Capdevielle, M., Corona, J.M. and Hernández C. (2000). “Production System and
Technological Patterns”, in Mario Cimoli (comp.), Developing Innovations Systems: Mexico in a Global Context. London.
Cimolli, Mario (2000). “Macroeconomic Setting and Production System”, in Mario Cimoli
(comp.) Developing Innovations Systems: Mexico in a Global Context. London. Consejo Nacional para la Ciencia y Tecnología (1999). Indicadores de Actividades
Científicas y Tecnológicas, México. Dávila Aldás, Francisco R (1995). “Cambios Tecnológicos, Globalización Económica y Regionalización”, in Globalización y Bloques Económicos: Realidades y Mitos,
U.A.P. and U. de G, México. Dunning, H. John (1993). Multinational Enterprises and The Global Economy, Addison-
Wesley Publishing Company, Great Britain. Estay, Jaime (1995). “Globalización y sus Significados”, in Globalización y Bloques
Económicos: Realidades y Mitos,U.A.P. and U. de G. México.

24
24
Griliches, Zvi (1990). “Patent Statistics as Economic Indicators: A Survey Part I”. NBER, Working Paper 330, Cambridge.
Jones I., Charles (1995). “R&D-Based Models of Economic Growth”, Journal of Political
Economy, 103, pp. 759-784. Jones I., Charles. (1999). Sources of U.S. Economic Growth in a World of Ideas,
Stanford. USA 1999. Judge, George G., Griffiths, W.E., Carter, Hill R., Lutkepohl, Helmuth and Lee, Tsoung
Chao (1985). The Theory and Practice of Econometrics, John Wiley and Sons, inc.
Lucas, Robert (1988). “On the Mechanics of Development Planning”, Journal of
Monetary Economics, 22, pp. 3-42 . Manchón, Federico (1995). “Globalización, Regionalización y Comportamiento
Financiero”, in Globalización y Bloques Económicos: Realidades y Mitos, U.A.P. and U. de G, México.
Mendoza Eduardo y Torres Victor (2002), “Innovación tecnológica y crecimiento regional en México”, Revista Mexicana de Economía y Finanzas, Centro de Finanzas, Instituto Tecnológico de Estudios Superiores de Monterrey, vol. 1, no. 3, pp. 187-201.
Nelson, Richard (1993). National System of Innovation: A Comparative Analysis,
University Press. New York. Organization for Economic Cooperation and Development (1998, 2000, 2001). Main
Economic Indicators. Porter E. Michael and Stern Scott (1999). “Measuring The Ideas Production Function:
Evidence from International Patent Output”. NBER, Working Paper 7891. Cambridge.
Posada, Pedro de la Concha (1998). El Sistema de Patentes en México, Consejo
Nacional de Ciencia y Tecnología, Dirección Ajunta de Política Científica y Tecnológica. Serie Documentos de Trabajo. México.
Romer, P. (1990), “Endogenous Technological Change”, Journal of Political Economy,
vol. 98, pp. S71-S102. Romer, Paul (1986). “Increasing Returns and Long Run Growth”, Journal of Political
Economy, vol. 94, no. 5, pp. 1002-1037.

25
25
___________(1989). “Increasing Returns and New Developments in The Theory of Growth”, NBER, Working Paper 3098. Cambridge.
___________(1990), “Endogenous Technological Change”, Journal of Political
Economy, vol. 98, pp. S71-S102. ___________(1994). “The Origins of Endogenous Growth”, Journal of Economic
Perspectives, 8, pp. 3-22. Sagasti, Francisco R. y Cook, Cecilia (1987). “La Ciencia y la Tecnología en América
Latina durante los Ochenta”, Comercio Exterior, vol. 37, no. 12. Scott Stern, Michael E. Porter, y Jeffrey L. Furman (2000). “The Determinants of
national Innovative Capacity”. National Bureau of Economic Research, Working Paper 7876.
Segal, Aarón (1987). “De la Transferencia de Tecnología a la Institucionalización de la
Ciencia y Tecnología”, Comercio Exterior, vol. 37, núm. 12. Shaiken, Harley (1990). “México in the Global Economy, High Technology and Work
Organization in Export Industries”, Monograph Series, 33. Center for U.S.-Mexican Studies, University of California.
Solow, R. M. (1956): “A Contribution to the Theory of Economic Growth”, Quarterly
Journal of Economics, vol. 70, no. 1, S. 65-94. Solow, Robert M (1957). “Technical Change and The Aggregate Production Function”,
Review of Economics and Statistics, 39, 312-320. Stern, S. M.E. Porter and J.L. Furman (1999). “The Determinants of National
Innovative Capacity”, HBS Working Paper. Tsur, Yoel (1989). “Las Patentes: Reflexiones sobre Tecnología y Desarrollo”,
Comercio Exterior, vol. 39, no. 4. Unger, Kurt y Oloriz, M (2000). “Globalization of Production and Technology”, in Mario
Cimoli (comp.), Developing Innovation Systems: Mexico in a Global Contex. Unger, Kurt y Saldaña, Luz Consuelo (1984). “México, Transferencia de Tecnología y
Estructura Industrial”, Centro de Investigación y Docencia Económica (CIDE), México.
Váldez Fernández, Ma. Teresa (1995). “Cambio Tecnológico, Globalización y Nuevo
Orden Mundial”, in Globalización y Bloques Económicos: Realidades y Mitos, UAP, U. de G, México.

26
26
World Intellectual Property Organization (1999). Industrial Property, Statistics B, Part 1, Switzerland. Electronic addresses http://www.conacyt.mx http://www.siicyt.com http://www.inegi.gob.mx

27
27
ANNEX Table 1
Annual Average Rate of Growth of Requested Patents in México
Period National Foreign 1980-1985 -1.4 -3.9 1985-1990 1.3 5.2 1990-1995 -6.8 2.0 1995-2000 0.0 16.8 1980-2000 -2.0 5.5 Source: Own elaboration with data from CONACYT. Indicadores de Actividades Científicas y Tecnológicas, 1999.
Table 2
Foreign Investment in the Manufacturing Industry in Mexico (Millions of dollars)
Years 1988 1994 1997 AARG 88-97 Food and beberages 125 700 347 11.0%Textiles and Apparel 45 151 595 29.0%Oil, Chemicals and Plastic 394 871 1459 14.0%Metallic products 109 339 807 22.0%Computers 48 165 145 12.0%Cars and trasportation equipment 243 2754 1890 23.0%Subtotal 964 4980 5243 18.0%AARG: Annual average rate of growth Source: OECD. 1998. Main Economic Indicators.
Table 3
Foreign Patents Requested in Mexico 1980-2000 Percentage Structure (%)
Years Mexico Germany USA France Italy Japan UK Spain Other 1980 13.86 8.11 48.28 5.44 2.71 3.59 3.88 1.40 12.741983 17.07 5.01 55.90 4.37 1.78 2.30 2.98 1.17 9.431985 15.83 5.30 56.27 3.54 2.35 2.72 3.10 0.85 10.011990 13.06 6.88 55.80 3.93 1.82 2.25 4.25 0.63 11.381994 5.01 7.46 62.26 2.82 1.57 2.63 3.91 0.71 13.631995 8.01 9.51 58.24 4.95 1.65 3.89 1.28 1.02 11.441999 3.76 9.53 56.68 5.15 1.31 3.27 3.40 0.77 16.13
Source:Own elaboration with data from: CONACYT. Indicadores de Actividades Científicas y Tecnológicas 1999.

28
28
Table 4
Domestic and Foreign Patents Requested by Sector 1991-1999 Percentage Structure
Year Origin
Consumption goods
Industrial goods
Chemical and
MettalurgyTextile
and paper Construction Transportation Scientific equipment Electricity
1991 Domestic 27.84 21.10 15.96 1.60 12.77 9.75 6.91 4.08 Foreign 16.72 18.70 35.71 3.04 3.82 7.63 5.59 8.801995 Domestic 21.53 20.60 16.67 1.62 14.12 12.50 5.09 7.87
Foreign 14.86 21.83 26.51 2.60 2.78 8.83 8.45 14.151999 Domestic 22.64 18.90 15.16 1.76 10.11 14.07 9.01 8.35
Foreign 21.62 17.17 31.14 2.47 2.65 5.62 7.30 12.03Source: Own elaboration with data form: CONACYT. Indicadores de Actividades Científicas y Tecnológicas. 1999.
Table 5
Domestic and Foreign Patents Requested in Mexico 1980-2000Years Domestic Foreign 1980 665 4,132 1981 704 4,624 1982 526 4,280 1983 699 3,396 1984 642 3,361 1985 612 3,253 1986 629 3,071 1987 742 3,509 1988 652 3,748 1989 757 3,817 1990 661 4,400 1991 564 4,707 1992 565 7,130 1993 553 7,659 1994 498 9,446 1995 432 4,961 1996 386 6,365 1997 420 10,111 1998 453 10,440 1999 455 11,655 2000 431 12,628
TMCA -2.0 5.5 Source: Own elaboration with data from CONACYT, Indicadores de Actividades Científicas y Tecnológicas, 1999.

29
29
Table 6
Evolution of the Accumulated Patents and SNI Members Year Accumuted Patents Rates of Growth (%) Researchers Rates of Growth (%)1980 665 1981 1,369 105.9% 1982 1,895 38.4% 1983 2,594 36.9% 1984 3,236 24.7% 1985 3,848 18.9% 1986 4,477 16.3% 1987 5,219 16.6% 1988 5,871 12.5% 1989 6,628 12.9% 1990 7,289 10.0% 5,704 1991 7,853 7.7% 6,155 7.9%1992 8,418 7.2% 6,602 7.3%1993 8,971 6.6% 6,233 -5.6%1994 9,469 5.6% 5,879 -5.7%1995 9,901 4.6% 5,868 -0.2%1996 10,287 3.9% 5,969 1.7%1997 10,707 4.1% 6,278 5.2%1998 11,160 4.2% 6,742 7.4%1999 11,615 4.1% 7,252 7.6%2000 12,046 3.7% 7,466 3.0%
Source: Own elaboration with data from: CONACYT, Indicadores de Actividades Científicas y Tecnológicas 1999.

30
30
Table 7
Requested Patents by States, 1994-2000
Percentage Structure and Annual Average Rate of Growth 1994 1995 1996 1997 1998 1999 2000 AARG 94-00Aguascalientes 0.2% 0.9% 1.0% 1.9% 0.9% 0.7% 0.7% 17.0% Baja California 1.4% 2.1% 1.6% 1.4% 2.0% 2.4% 0.9% -7.7% Baja California Sur 0.8% 0.0% 0.3% 0.2% 0.2% 0.2% 0.0% -100.0% Campeche 0.0% 0.5% 0.3% 0.0% 0.0% 0.2% 0.2% - Coahuila 1.8% 2.3% 3.1% 3.8% 3.1% 2.9% 1.6% -3.5% Colima 1.2% 0.2% 0.0% 0.5% 0.9% 0.2% 1.2% -2.6% Chiapas 0.0% 0.5% 0.3% 0.0% 0.2% 0.0% 0.0% - Chihuahua 0.4% 1.6% 0.5% 0.5% 1.1% 2.0% 2.1% 24.0% Distrito Federal 34.7% 44.9% 42.7% 34.0% 32.7% 39.8% 38.5% -0.6% Durango 0.6% 1.2% 0.5% 0.0% 0.0% 0.2% 0.2% -14.5% Guanajuato 2.0% 3.2% 1.8% 2.1% 2.2% 3.3% 2.8% 2.6% Guerrero 0.4% 0.0% 0.8% 0.2% 0.0% 0.2% 0.2% -9.4% Hidalgo 0.4% 0.2% 0.5% 1.4% 2.6% 0.2% 0.5% 0.0% Jalisco 7.0% 7.6% 6.7% 5.0% 5.5% 7.3% 9.0% 1.6% Edo. Mexico 14.7% 5.6% 7.8% 11.7% 15.5% 9.7% 14.4% -2.3% Michoacan 1.6% 0.5% 1.8% 0.2% 1.1% 0.4% 0.7% -13.1% Morelos 2.8% 2.5% 2.3% 6.4% 3.3% 3.1% 2.6% -3.4% Nayarit 0.2% 0.0% 0.3% 0.5% 0.2% 0.0% 0.2% 0.0% Nuevo Leon 9.4% 12.5% 11.1% 13.3% 10.4% 8.4% 6.3% -7.6% Oaxaca 0.4% 0.2% 1.6% 0.5% 0.7% 0.7% 0.5% 0.0% Puebla 4.6% 1.6% 2.6% 2.6% 3.3% 3.5% 4.4% -2.7% Queretaro 4.4% 2.5% 4.1% 4.0% 3.3% 5.3% 4.4% -2.1% Quintana Roo 0.2% 0.2% 0.0% 0.0% 0.0% 0.4% 0.2% 0.0% San Luis Potosi 0.8% 0.5% 0.8% 0.7% 0.9% 2.2% 1.9% 10.4% Sinaloa 0.4% 0.9% 1.0% 0.7% 1.3% 0.7% 1.9% 21.9% Sonora 1.8% 0.2% 1.0% 0.7% 0.4% 0.7% 0.9% -10.9% Tabasco 0.4% 0.7% 0.0% 0.7% 0.7% 0.2% 1.2% 14.0% Tamaulipas 0.6% 1.4% 1.0% 1.7% 1.3% 0.9% 0.7% 0.0% Tlaxcala 1.4% 0.0% 0.3% 0.0% 0.0% 0.0% 0.0% -100.0% Veracruz 1.8% 1.9% 1.3% 2.4% 2.0% 1.1% 0.9% -10.9% Yucatan 1.0% 1.6% 1.0% 0.7% 0.7% 0.9% 0.9% -3.1% Zacatecas 0.2% 0.0% 0.0% 0.0% 0.2% 0.0% 0.0% -100.0% Total 97.8% 98.1% 98.2% 98.1% 96.7% 97.6% 100.0% Sin Clasificar 2.2% 1.9% 1.8% 1.9% 3.3% 2.4% 0.0% Total 100.0% 100.0% 100.0% 100.0% 100.0% 100.0% 100.0%
Source: Own elaboration with data from: CONACYT, Indicadores de Actividades Científicas y Tecnológicas.

31
31
Table 8
SNI Researchers by States, 1994-2000
Percentage Structure and Annual Average Rate of Growth 1996 1997 1998 1999 2000 AARG 97-00 Aguascalientes 0.00% 0.26% 0.29% 0.36% 0.70% 0.63% Baja California 3.02% 2.94% 3.03% 0.03% 3.27% 0.08% Baja California Sur 0.00% 1.18% 1.29% 1.36% 1.18% 0.06% Campeche 0.00% 0.08% 0.09% 0.11% 0.14% 0.22% Coahuila 0.00% 0.52% 0.63% 0.67% 0.84% 0.19% Colima 0.00% 0.63% 0.65% 0.62% 0.51% 0.00% Chiapas 0.00% 1.28% 1.28% 1.31% 1.45% 0.09% Chihuahua 0.00% 0.53% 0.50% 0.59% 0.62% 0.10% Distrito Federal 56.04% 54.91% 53.43% 52.42% 50.64% 0.04% Durango 0.00% 0.26% 0.24% 0.25% 0.34% 0.13% Guanajuato 2.97% 5.74% 5.67% 3.06% 3.23% -0.08% Guerrero 0.00% 2.97% 3.03% 0.17% 0.17% -0.48% Hidalgo 0.00% 0.18% 0.18% 0.36% 0.34% 0.13% Jalisco 3.70% 0.18% 0.26% 3.87% 3.66% 1.25% Edo. Mexico 5.46% 3.64% 3.75% 5.85% 6.45% 0.22% Michoacan 0.00% 1.71% 1.85% 1.97% 1.75% 0.06% Morelos 5.75% 5.79% 5.85% 5.85% 6.03% 0.07% Nayarit 0.00% 0.10% 0.12% 0.10% 0.10% 0.07% Nuevo Leon 2.55% 2.57% 2.67% 2.46% 2.36% 0.03% Oaxaca 0.00% 0.40% 0.41% 0.42% 0.40% 0.06% Puebla 4.32% 4.35% 4.62% 4.53% 4.47% 0.06% Queretaro 0.00% 1.76% 2.07% 2.17% 1.83% 0.07% Quintana Roo 0.00% 0.27% 0.27% 0.34% 0.31% 0.09% San Luis Potosi 0.00% 1.05% 1.14% 1.08% 1.08% 0.06% Sinaloa 0.00% 0.58% 0.62% 0.62% 0.68% 0.10% Sonora 0.00% 1.58% 1.53% 1.62% 1.52% 0.05% Tabasco 0.00% 0.06% 0.03% 0.03% 0.03% -0.16% Tamaulipas 0.00% 0.52% 0.42% 0.39% 0.44% 0.02% Tlaxcala 0.00% 0.19% 0.24% 0.24% 0.26% 0.14% Veracruz 1.74% 1.75% 1.68% 1.87% 1.75% 0.06% Yucatan 0.00% 1.58% 1.67% 1.80% 2.01% 0.12% Zacatecas 0.00% 0.44% 0.53% 0.53% 0.64% 0.16% Sin Clasificar 14.46% 0.00% 0.00% 0.00% 0.00% Total 100.00% 100.00% 100.00% 100.00% 100.00% 0.06%
Source: Own elaboration with data from: CONACYT, Indicadores de Actividades Científicas y Tecnológicas.
32
32
Table 9
Members of the National System of Researchers (SNI) by Area, 1991-2000 (percentage shares)
Years Physics ands Mathematics
Biology and Chemicals Medicine Humanities
Social Sciences Biotechnology Engeniering
Sub-total** Total
1991 17.06 19.12 7.17 12.42 8.39 20.26 15.57 79.19 1001992 16.65 20.65 7.97 12.86 8.71 18.45 14.72 78.43 1001993 18.74 22.09 8.45 14.66 9.56 13.41 13.08 75.77 1001994 20.84 21.76 9.58 16.16 10.04 9.73 11.91 73.81 1001995 21.83 21.05 9.99 17.42 10.69 7.92 11.11 71.90 1001996 22.27 20.89 10.15 17.99 11.11 7.15 10.44 70.90 1001997 22.87 20.93 10.35 17.81 10.72 7.37 9.94 71.47 1001998 23.30 20.85 10.43 17.38 10.01 7.86 10.16 72.60 1001999 22.35 19.79 9.94 17.46 10.18 8.85 11.43 72.37 1002000 21.02 19.22 10.25 17.00 10.85 9.38 12.30 72.15 100
Source: CONACYT. SNI data base. 1991-2000. ** The sub-total indicates the shares of the research areas with the exception of Humanities and Social and Behavioural Sciences. The medical research includes Health Sciencies; the area of biotechnology includes the Agricultural Sciences.

33
33
Table 10
Dependent Variable: Log PATSst Coefficients
LogH Ast 0.16* 0.09* 0.07* (2.02) (2.13) (4.40) LogAst 1.07* 1.60* 1.66* (12.29) (17.94) (10.61) LogA –st -1.29 -11.27 (-12.06) (-'8.30) Log AX st -3 -0.11 (-5.36)
Control Variables Trend -0.46* -0.10* 2.08*
(-9.53) (-2.61) (6.09) Log(Prod?) -0.21* 0.03 -0.23*
(-2.42) (0.41) (-6.84)
Statistics R2 0.94 0.95 0.99R2 adjusted 0.92 0.92 0.96Durbin-Watson 2.59 2.4 1.88Observations 114 114 50* Significative at 1% t statistics in paréntesis Log PATSst: annually requested patents by states
Table 11
Fixed Effects by Selected States *
States Effect Average Patents 1996-2000 States Effect Average Patents 1996-
2000 Quintana Roo 8.7 0.6 Puebla 5.7 14.2 Campeche 8.4 0.6 Coahuila 5.5 12.4 Chiapas 7.8 0.4 Querétaro 5.5 18.2 Druango 7.8 0.8 Hidalgo 5.5 28.8 Tabasco 7.5 2.4 Morelos 5.4 15.2 Colima 7.3 2.4 Veracruz 5.4 6.6 Nayarit 7.3 1 Yucatán 5.2 3.6 Baja C. Sur 7.2 0.8 Jalisco 5.0 51 Chihuahua 7.0 5.4 Nuevo León 4.6 42.2 San Luis P. 6.7 5.6 Distrito Federal 3.2 160.6 * When including the variable “out-of-the-state patents.”

34
34
Table 12
Fixed Effects by Selected States*
States Effect Average Patents 1996-2000 States Effect Average Patents
1996-2000
Campeche 76.0 0.6 Puebla 72.4 14.2 Druango 75.1 0.8 Veracruz 72.3 6.6 Tabasco 74.9 2.4 Guerrero 72.2 4.6 Colima 74.8 2.4 Querétaro 72.1 18.2 Nayarit 74.7 1.0 Coahuila 72.1 12.4 Baja C. Sur 74.6 0.8 Morelos 71.8 15.2 Chihuahua 74.2 5.4 Hidalgo 71.7 28.8 Guanajuato 74.0 1.2 Nuevo León 70.2 42.2 Sonora 73.8 3.2 Jalisco 69.9 51.0 San Luis P. 73.8 5.6 Distrito Federal 65.3 160.6 * When including the variable "foreign patents"