Endesa Chile - IR Presentation - Enel
35
Endesa Chile IR Presentation 9M 2015
-
Upload
khangminh22 -
Category
Documents
-
view
3 -
download
0
Transcript of Endesa Chile - IR Presentation - Enel

Endesa Chile IR Presentation
9M 2015
Endesa Chile Investor Presentation 9M15
USE: Public, Investor Relations 2
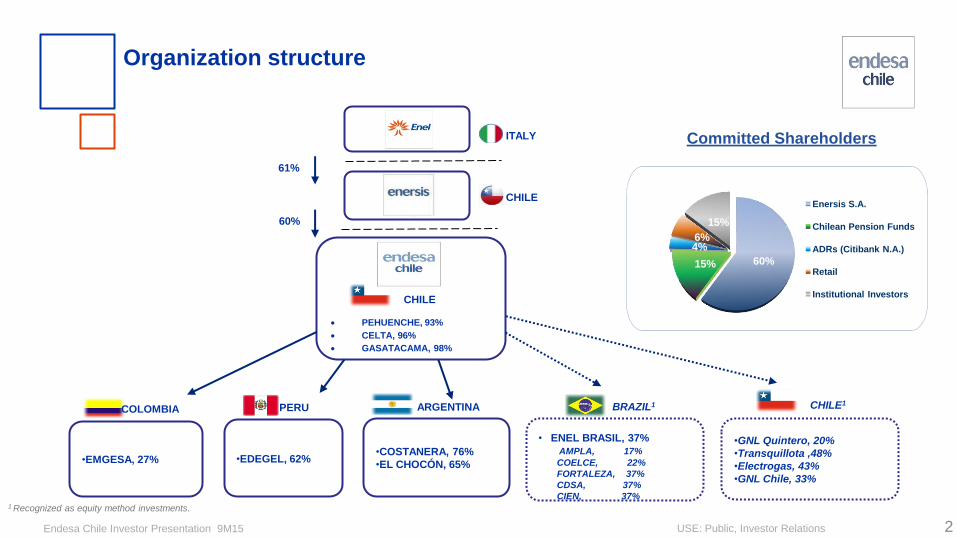
PEHUENCHE, 93%
CELTA, 96%
GASATACAMA, 98%
•COSTANERA, 76%
•EL CHOCÓN, 65% •EDEGEL, 62% •EMGESA, 27%
• ENEL BRASIL, 37%
AMPLA, 17%
COELCE, 22%
FORTALEZA, 37%
CDSA, 37%
CIEN, 37%
61%
60%
COLOMBIA PERU ARGENTINA BRAZIL1
Organization structure
CHILE
Committed Shareholders ITALY
CHILE
1 Recognized as equity method investments.
•GNL Quintero, 20%
•Transquillota ,48%
•Electrogas, 43%
•GNL Chile, 33%
CHILE1
60% 15%
4% 6%
15%
Enersis S.A.
Chilean Pension Funds
ADRs (Citibank N.A.)
Retail
Institutional Investors
Endesa Chile Investor Presentation 9M15
USE: Public, Investor Relations 3
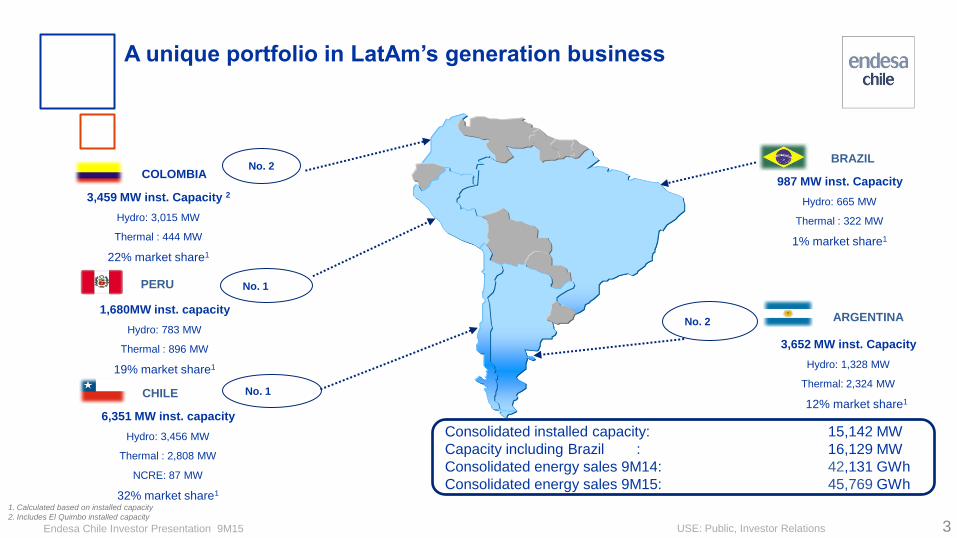
COLOMBIA
3,459 MW inst. Capacity 2
Hydro: 3,015 MW
Thermal : 444 MW
22% market share1
No. 2
6,351 MW inst. capacity
Hydro: 3,456 MW
Thermal : 2,808 MW
NCRE: 87 MW
32% market share1
PERU
1,680MW inst. capacity
Hydro: 783 MW
Thermal : 896 MW
19% market share1
CHILE
BRAZIL
987 MW inst. Capacity
Hydro: 665 MW
Thermal : 322 MW
1% market share1
Consolidated installed capacity: 15,142 MW
Capacity including Brazil : 16,129 MW
Consolidated energy sales 9M14: 42,131 GWh
Consolidated energy sales 9M15: 45,769 GWh
3,652 MW inst. Capacity
Hydro: 1,328 MW
Thermal: 2,324 MW
12% market share1
ARGENTINA No. 2
No. 1
No. 1
1. Calculated based on installed capacity
2. Includes El Quimbo installed capacity
A unique portfolio in LatAm’s generation business

Endesa Chile Investor Presentation 9M15
USE: Public, Investor Relations 4
Hydro: 9,247 MW
Chile:
3,456 MW Argentina:
1,328 MW
Brazil1:
665 MW
Peru:
783 MW
Colombia:
3,015 MW 1
Chile:
636 MW
Colombia:
236 MW
Chile:
2,173 MW Argentina:
2,324 MW
Peru:
896 MW
Colombia:
208 MW
Chile:
87 MW
NCRE2: 87 MW
Well diversified generation assets throughout the region
Coal: 872 MW
Oil-Gas: 5,923 MW
1 Brazilian assets are recognized as equity method investments. 2 Non Conventional Renewable Energy.
Installed Capacity: 16,129 MW
57% of Endesa Chile´s installed capacity
corresponds to hydro resources
Brazil1:
322 MW
8,840
872
5,923
87
HYDRO
COAL
OIL-GAS
NCRE
1. Includes El Quimbo installed capacity

Endesa Chile 9M15 Results
USE: Public, Investor Relations 5
Total Installed Capacity1:
15,142 MW
EBITDA 9M15
US$ 1,306 million
Total Generation:
39,002 GWh
Enel Brasil
• Endesa Chile’s ownership: 37.1%.
• Net Attributable Income2:
US$ 44 million.
1 Excludes the proportional assets of Enel Brasil (987 MW). 2 Considers the total contributions of Enel Brasil recognized by Endesa Chile as an equity method investment.
* Includes El Quimbo installed capacity
Diversified source of EBITDA
Endesa Chile 9M15 Results
USE: Public, Investor Relations
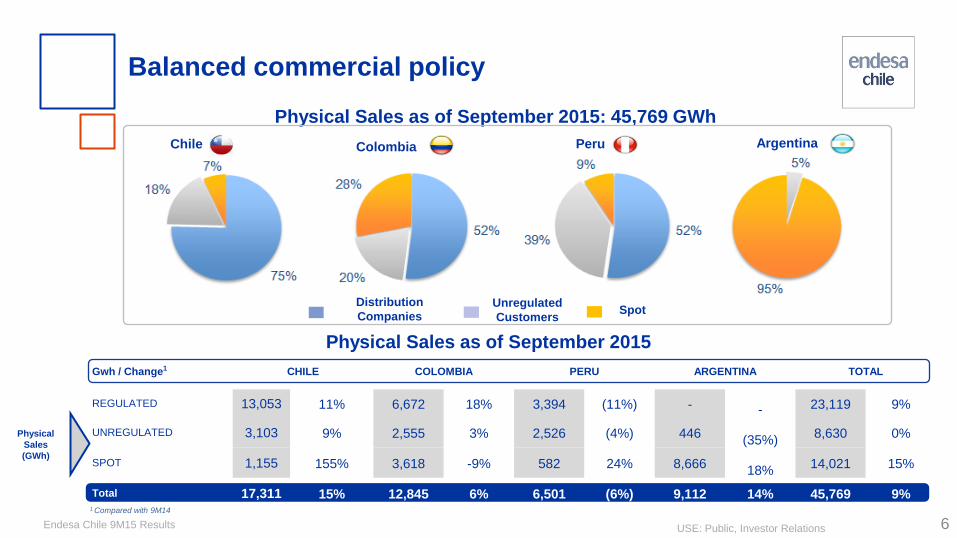
Gwh / Change1 CHILE COLOMBIA PERU ARGENTINA TOTAL
REGULATED 13,053 11% 6,672 18% 3,394 (11%) - - 23,119 9%
UNREGULATED 3,103 9% 2,555 3% 2,526 (4%) 446 (35%)
8,630 0%
SPOT 1,155 155% 3,618 -9% 582 24% 8,666 18%
14,021 15%
Total 17,311 15% 12,845 6% 6,501 (6%) 9,112 14% 45,769 9%
6
Chile Colombia Peru
Distribution
Companies Spot
Unregulated
Customers
Argentina
Physical Sales as of September 2015: 45,769 GWh
Balanced commercial policy
Physical Sales as of September 2015
Physical
Sales
(GWh)
1 Compared with 9M14
Endesa Chile 9M15 Results
USE: Public, Investor Relations
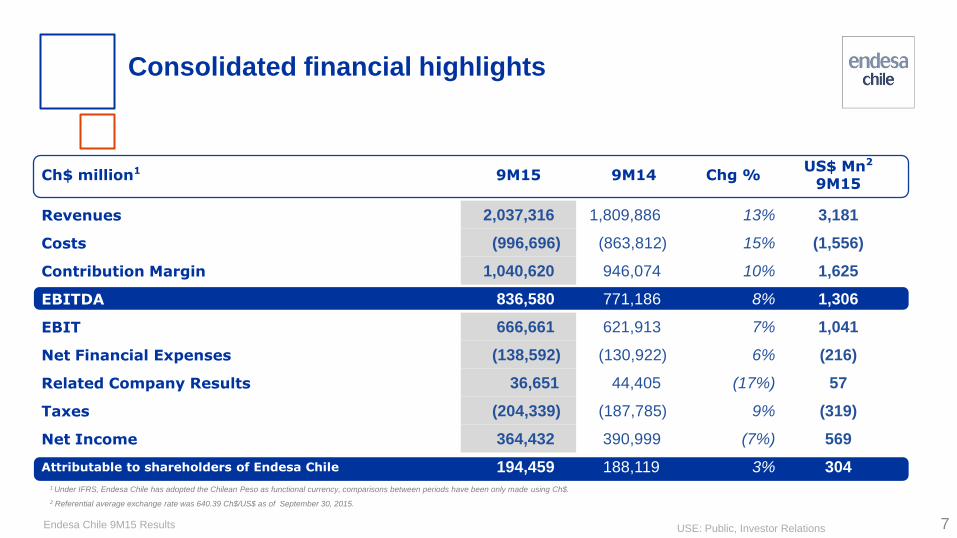
1 Under IFRS, Endesa Chile has adopted the Chilean Peso as functional currency, comparisons between periods have been only made using Ch$.
2 Referential average exchange rate was 640.39 Ch$/US$ as of September 30, 2015.
Consolidated financial highlights
7
Ch$ million1
9M15 9M14 Chg %
US$ Mn2
9M15
Revenues 2,037,316 1,809,886 13% 3,181
Costs (996,696) (863,812) 15% (1,556)
Contribution Margin 1,040,620 946,074 10% 1,625
EBITDA 836,580 771,186 8% 1,306
EBIT 666,661 621,913 7% 1,041
Net Financial Expenses (138,592) (130,922) 6% (216)
Related Company Results 36,651 44,405 (17%) 57
Taxes (204,339) (187,785) 9% (319)
Net Income 364,432 390,999 (7%) 569
Attributable to shareholders of Endesa Chile 194,459 188,119 3% 304
Endesa Chile Investor Presentation 9M15
USE: Public, Investor Relations
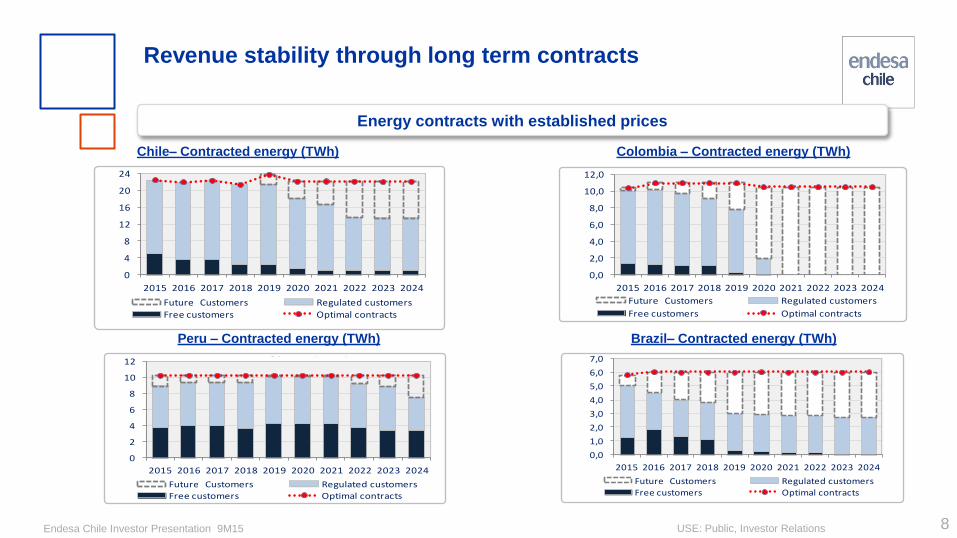
Revenue stability through long term contracts
Colombia – Contracted energy (TWh) Chile– Contracted energy (TWh)
Peru – Contracted energy (TWh) Brazil– Contracted energy (TWh)
8
Energy contracts with established prices
0
4
8
12
16
20
24
2015 2016 2017 2018 2019 2020 2021 2022 2023 2024
Contrated energy Chile (TWh)
Futures Customers Regulated customers
Free customers Optimal contracts
0,0
1,0
2,0
3,0
4,0
5,0
6,0
7,0
2015 2016 2017 2018 2019 2020 2021 2022 2023 2024
Contrated energy Brazil (TWh)
Futures Customers Regulated customers
Free customers Optimal contracts
0,0
2,0
4,0
6,0
8,0
10,0
12,0
2015 2016 2017 2018 2019 2020 2021 2022 2023 2024
Contrated energy Colombia (TWh)
Futures Customers Regulated customers
Free customers Optimal contracts
0
2
4
6
8
10
12
2015 2016 2017 2018 2019 2020 2021 2022 2023 2024
Contrated energy Peru (TWh)
Futures Customers Regulated customers
Free customers Optimal contracts
Endesa Chile 9M15 Results
USE: Public, Investor Relations
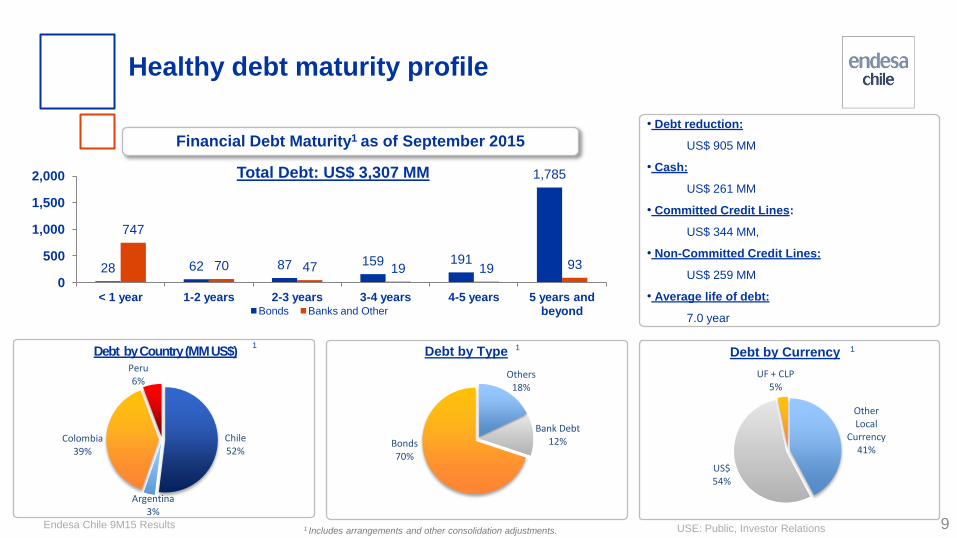
• Debt reduction:
US$ 905 MM
• Cash:
US$ 261 MM
• Committed Credit Lines:
US$ 344 MM,
• Non-Committed Credit Lines:
US$ 259 MM
• Average life of debt:
7.0 year
Debt by Type Debt by Currency Debt by Country (MM US$)
1 Includes arrangements and other consolidation adjustments.
1 1 1
Total Debt: US$ 3,307 MM
9
Financial Debt Maturity1 as of September 2015
Healthy debt maturity profile
Other Local
Currency 41%
US$ 54%
UF + CLP 5%
Chile 52%
Argentina 3%
Colombia 39%
Peru 6%
Others 18%
Bank Debt 12% Bonds
70%
28 62 87 159 191
1,785
747
70 47 19 19 93
0
500
1,000
1,500
2,000
< 1 year 1-2 years 2-3 years 3-4 years 4-5 years 5 years and beyond Bonds Banks and Other
Endesa Chile 9M15 Results
USE: Public, Investor Relations 10
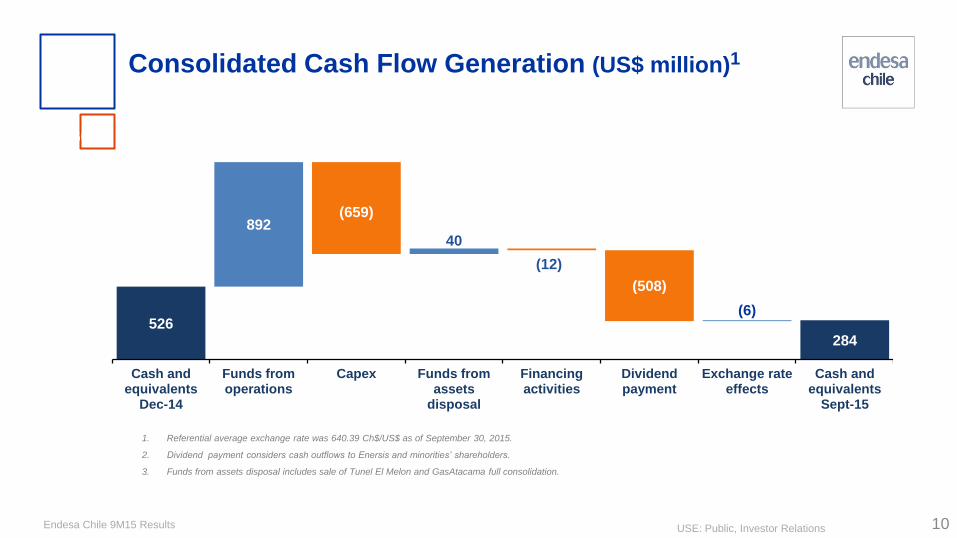
Consolidated Cash Flow Generation (US$ million)1
1. Referential average exchange rate was 640.39 Ch$/US$ as of September 30, 2015.
2. Dividend payment considers cash outflows to Enersis and minorities’ shareholders.
3. Funds from assets disposal includes sale of Tunel El Melon and GasAtacama full consolidation.
892 (659)
40
(12)
(508)
(6) 526
284
0
200
400
600
800
1,000
1,200
1,400
1,600
Cash and equivalents
Dec-14
Funds from operations
Capex Funds from assets
disposal
Financing activities
Dividend payment
Exchange rate effects
Cash and equivalents
Sept-15
Endesa Chile Investor Presentation 9M15
USE: Public, Investor Relations
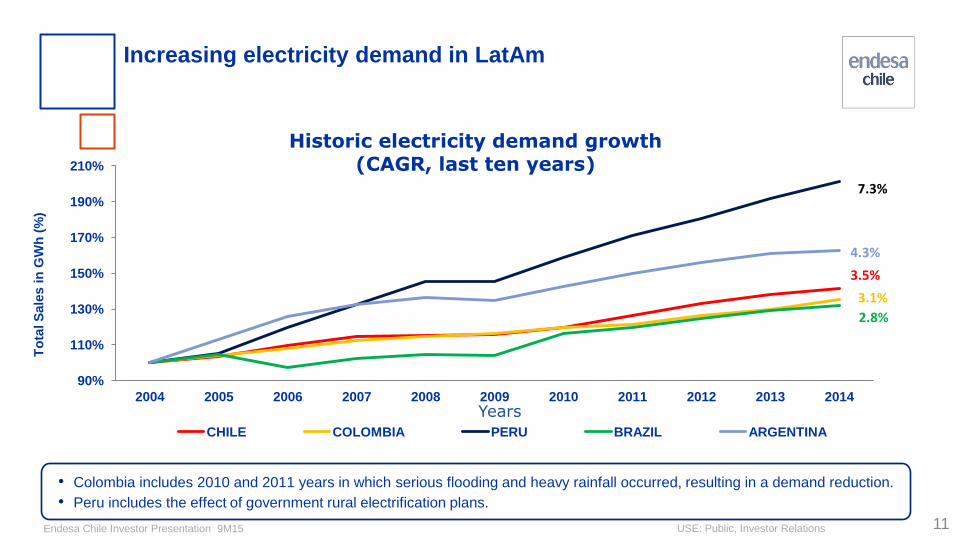
Increasing electricity demand in LatAm
• Colombia includes 2010 and 2011 years in which serious flooding and heavy rainfall occurred, resulting in a demand reduction.
• Peru includes the effect of government rural electrification plans.
11
90%
110%
130%
150%
170%
190%
210%
2004 2005 2006 2007 2008 2009 2010 2011 2012 2013 2014
To
tal S
ale
s i
n G
Wh
(%
)
Years
Historic electricity demand growth (CAGR, last ten years)
CHILE COLOMBIA PERU BRAZIL ARGENTINA
3.5%
3.1%
7.3%
4.3%
2.8%

Endesa Chile Investor Presentation 9M15
USE: Public, Investor Relations
ARGENTINA
AUSTRALIA
AUSTRIA
BOLIVIA
BRAZIL
CANADA
CHILECHINA
COLOMBIA
FINLAND
FRANCE GERMANY
GREECE
INDIA IRELAND
ITALY
JAPAN
MEXICO
PERU
RUSSIA
SPAIN UNITED KINGDOM
UNITED STATES
0
2,000
4,000
6,000
8,000
10,000
12,000
14,000
16,000
18,000
0 10,000 20,000 30,000 40,000 50,000 60,000
Ele
ctrici
ty c
onsu
mption,
per
capita (
Kw
h p
er
year)
GDP per capita (current PPP, US$)Data source: The World Bank.
Direct relation between GDP and electricity demand
Markets with high potential for growth
12
• Chile aims to be in the group of developed countries.
• There is no development without energy.
Endesa Chile Investor Presentation 9M15
USE: Public, Investor Relations
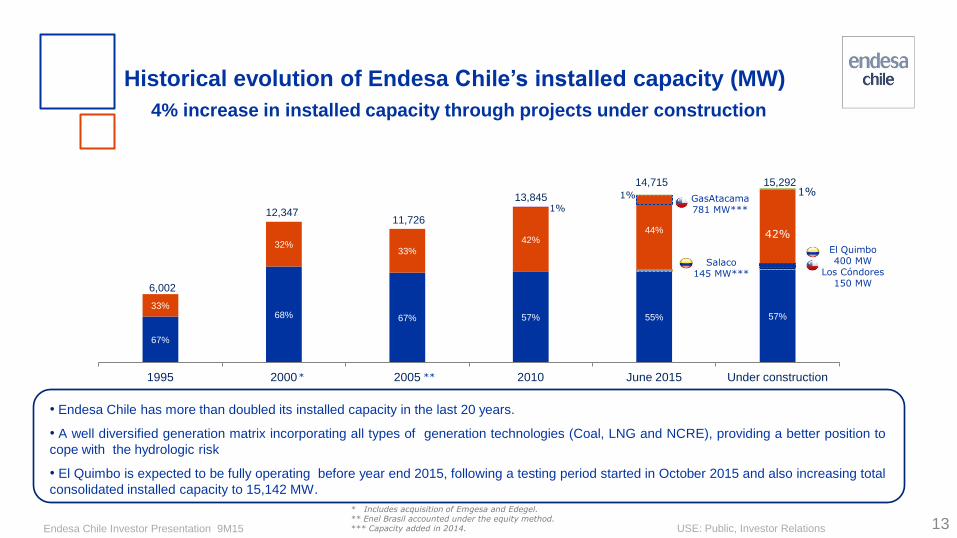
67%
68% 67% 57% 55% 57% 33%
32% 33%
42% 44%
1%
1%
42%
1%
1995 2000 2005 2010 June 2015 Under construction
6,002
12,347 11,726
13,845
14,715 15,292
13
Historical evolution of Endesa Chile’s installed capacity (MW)
4% increase in installed capacity through projects under construction
• Endesa Chile has more than doubled its installed capacity in the last 20 years.
• A well diversified generation matrix incorporating all types of generation technologies (Coal, LNG and NCRE), providing a better position to
cope with the hydrologic risk
• El Quimbo is expected to be fully operating before year end 2015, following a testing period started in October 2015 and also increasing total
consolidated installed capacity to 15,142 MW.
* **
* Includes acquisition of Emgesa and Edegel. ** Enel Brasil accounted under the equity method. *** Capacity added in 2014.
GasAtacama 781 MW***
Salaco 145 MW***
El Quimbo 400 MW
Los Cóndores 150 MW

Endesa Chile 9M15 Results
USE: Public, Investor Relations
• Hydro power plant, located in the Huila Department, Colombia
• Utilizes the flow coming from the Magdalena River.
• 97% progress as of September, 2015 .
• Estimated: generation of 2,093 GWh/year, Load factor: 60%
• Total CAPEX of US$ 1,231 million*.
14
El Quimbo (400 MW)
* In constant US dollars of 2010.
Started its testing period in October and will become available for economic dispatch during November
2015, increasing by 13% our installed capacity in Colombia.
El Quimbo
Endesa Chile 9M15 Results
USE: Public, Investor Relations
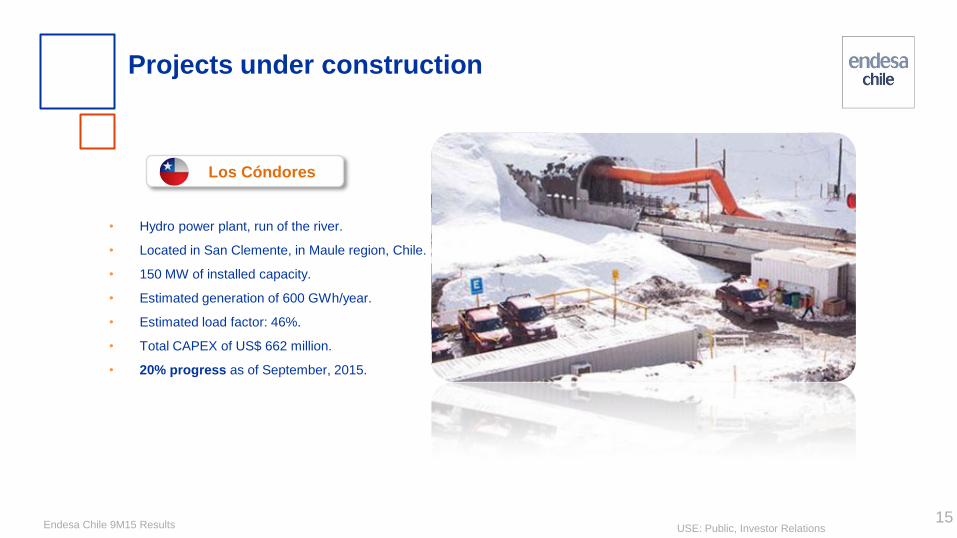
• Hydro power plant, run of the river.
• Located in San Clemente, in Maule region, Chile.
• 150 MW of installed capacity.
• Estimated generation of 600 GWh/year.
• Estimated load factor: 46%.
• Total CAPEX of US$ 662 million.
• 20% progress as of September, 2015.
15
Projects under construction
Los Cóndores
Endesa Chile Investor Presentation 9M15
USE: Public, Investor Relations
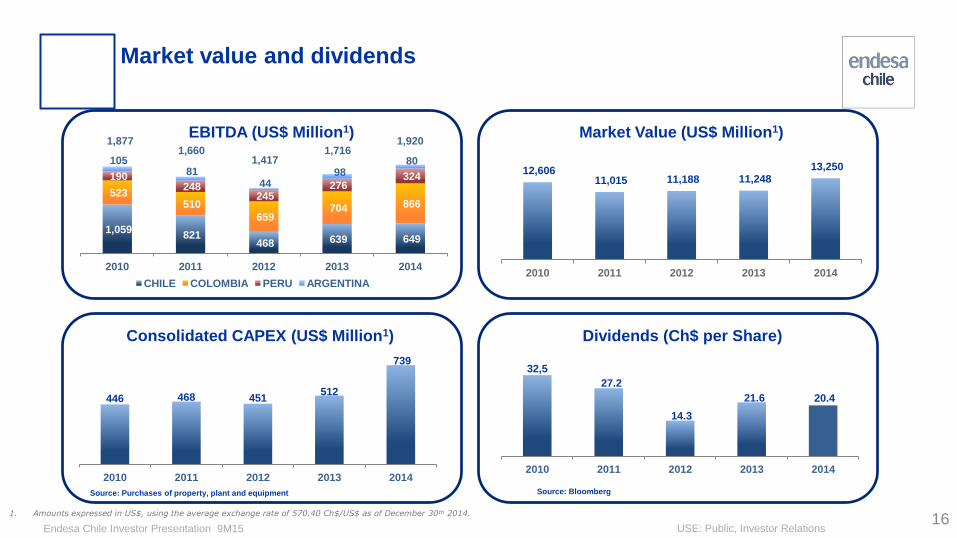
12,606 11,015 11,188 11,248
13,250
2010 2011 2012 2013 2014
1,059 821
468 639 649
523 510
659 704 866
190 248
245 276
324
105 81
44 98
80
2010 2011 2012 2013 2014
CHILE COLOMBIA PERU ARGENTINA
1,877 1,660
1,417 1,716
1,920
Dividends (Ch$ per Share)
EBITDA (US$ Million1) Market Value (US$ Million1)
Market value and dividends
Source: Bloomberg
1. Amounts expressed in US$, using the average exchange rate of 570.40 Ch$/US$ as of December 30th 2014.
Consolidated CAPEX (US$ Million1)
Source: Purchases of property, plant and equipment
16
446 468 451 512
739
2010 2011 2012 2013 2014
32,5
27.2
14.3
21.6 20.4
2010 2011 2012 2013 2014

Endesa Chile Investor Presentation 9M15
USE: Public, Investor Relations
BBB+ Baa2 BBB+
Since:
Affirmed:
Credit Risk Agencies recognition
Jan. 2010 Apr. 2011 Feb. 2010
Jun. 2015 Dec. 2014 Nov. 2014
AA (cl) AA
Jan. 2010 Apr. 2010
Jun. 2015 Jul. 2015
International market Chilean market
RATINGS BASED UPON:
• Well diversified and efficient assets
• Leading market share in the four countries where we operate
• Transparent and favorable regulatory framework in Chile
• Solid financials, good cash flow generation and prudent financial management
• Conservative commercial policy
17
Endesa Chile Investor Presentation 9M15
USE: Public, Investor Relations
Endesa Chile’s Investor Relations Team
18
Contact us at:
Susana Rey Head of Investor Relations
(56) 22630 9606 [email protected]
Catalina Gonzalez Investor Relations Senior Analyst
(56) 22630 9603 [email protected]
Guillermo Berguecio Investor Relations Analyst
(56) 22630 9506 [email protected]
Francisco Basauri Investor Relations Analyst
(56) 22630 9585 [email protected]
Endesa Chile Investor Presentation 9M15
USE: Public, Investor Relations 19
EXHIBITS
Endesa Chile Investor Presentation 9M15
USE: Public, Investor Relations
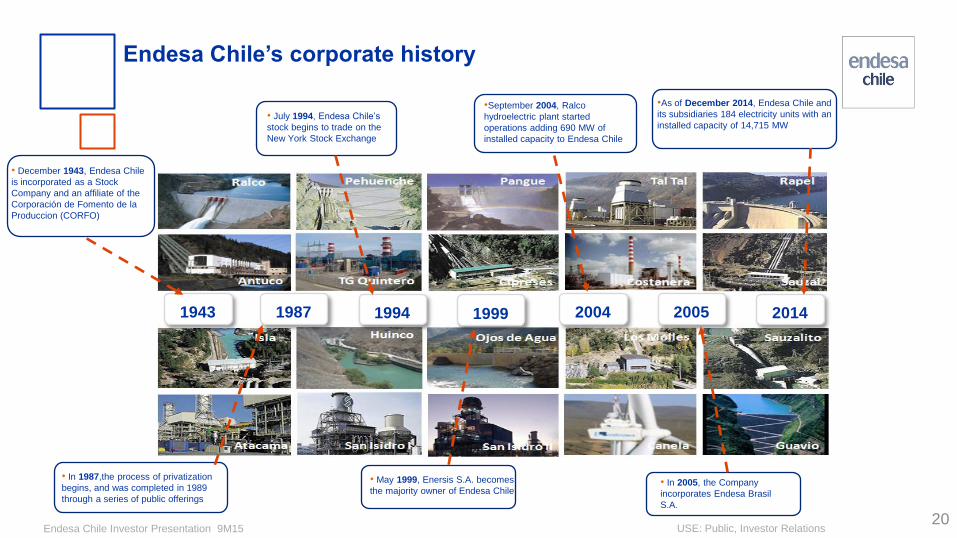
1943 1987 1994 1999 2004 2005 2014
Endesa Chile’s corporate history
• December 1943, Endesa Chile
is incorporated as a Stock
Company and an affiliate of the
Corporación de Fomento de la
Produccion (CORFO)
• July 1994, Endesa Chile’s
stock begins to trade on the
New York Stock Exchange
•September 2004, Ralco
hydroelectric plant started
operations adding 690 MW of
installed capacity to Endesa Chile
•As of December 2014, Endesa Chile and
its subsidiaries 184 electricity units with an
installed capacity of 14,715 MW
• In 1987,the process of privatization
begins, and was completed in 1989
through a series of public offerings
• May 1999, Enersis S.A. becomes
the majority owner of Endesa Chile • In 2005, the Company
incorporates Endesa Brasil
S.A.
20
Endesa Chile Investor Presentation 9M15
USE: Public, Investor Relations 21
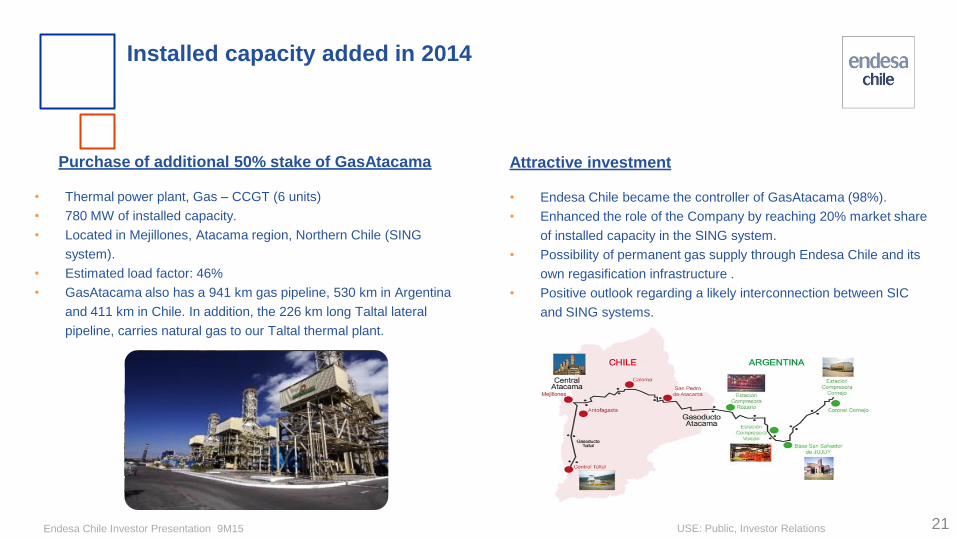
Purchase of additional 50% stake of GasAtacama
• Thermal power plant, Gas – CCGT (6 units)
• 780 MW of installed capacity.
• Located in Mejillones, Atacama region, Northern Chile (SING
system).
• Estimated load factor: 46%
• GasAtacama also has a 941 km gas pipeline, 530 km in Argentina
and 411 km in Chile. In addition, the 226 km long Taltal lateral
pipeline, carries natural gas to our Taltal thermal plant.
Attractive investment
• Endesa Chile became the controller of GasAtacama (98%).
• Enhanced the role of the Company by reaching 20% market share
of installed capacity in the SING system.
• Possibility of permanent gas supply through Endesa Chile and its
own regasification infrastructure .
• Positive outlook regarding a likely interconnection between SIC
and SING systems.
Installed capacity added in 2014

Endesa Chile Investor Presentation 9M15
USE: Public, Investor Relations 22
Colombia
Salaco Chain (optimization)
• Upgraded the minor plants to reach 221 MW capacity.
• Located in the Bogotá River system, Colombia.
• Total CAPEX of US$ 44 million.
• Optimization works started in January 2013 and were
completed in December 2014.
• 145 MW of capacity added through 6 units entering into
service, generating an additional 324 GWh in 2014.
Installed capacity added in 2014
Endesa Chile 9M15 Results
23
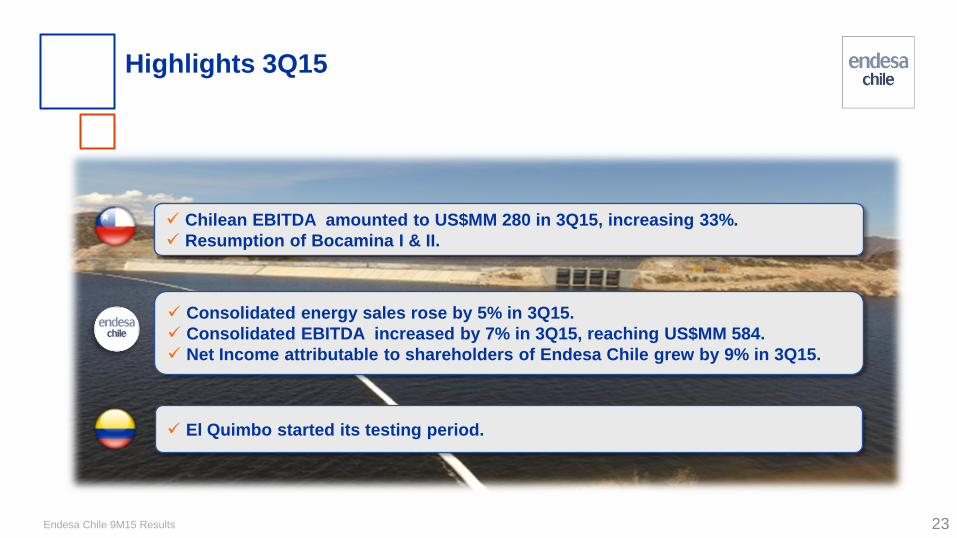
Highlights 3Q15
Chilean EBITDA amounted to US$MM 280 in 3Q15, increasing 33%.
Resumption of Bocamina I & II.
Consolidated energy sales rose by 5% in 3Q15.
Consolidated EBITDA increased by 7% in 3Q15, reaching US$MM 584.
Net Income attributable to shareholders of Endesa Chile grew by 9% in 3Q15.
El Quimbo started its testing period.
Endesa Chile 9M15 Results
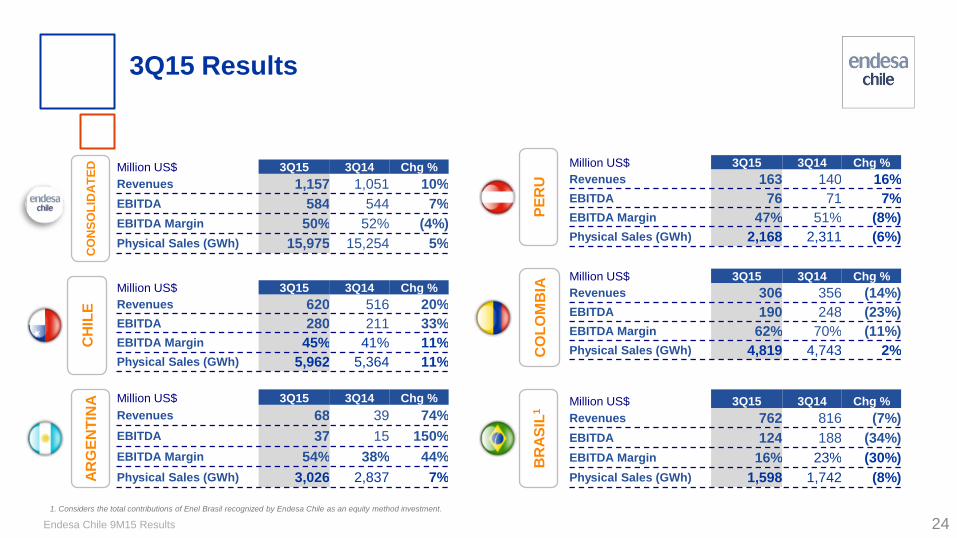
Million US$ 3Q15 3Q14 Chg %
Revenues 762 816 (7%)
EBITDA 124 188 (34%)
EBITDA Margin 16% 23% (30%)
Physical Sales (GWh) 1,598 1,742 (8%)
24
3Q15 Results C
HIL
E
AR
GE
NT
INA
C
ON
SO
LID
AT
ED
CO
LO
MB
IA
PE
RU
BR
AS
IL1
Million US$ 3Q15 3Q14 Chg %
Revenues 1,157 1,051 10%
EBITDA 584 544 7%
EBITDA Margin 50% 52% (4%)
Physical Sales (GWh) 15,975 15,254 5%
Million US$ 3Q15 3Q14 Chg %
Revenues 620 516 20%
EBITDA 280 211 33%
EBITDA Margin 45% 41% 11%
Physical Sales (GWh) 5,962 5,364 11%
Million US$ 3Q15 3Q14 Chg %
Revenues 68 39 74%
EBITDA 37 15 150%
EBITDA Margin 54% 38% 44%
Physical Sales (GWh) 3,026 2,837 7%
Million US$ 3Q15 3Q14 Chg %
Revenues 306 356 (14%)
EBITDA 190 248 (23%)
EBITDA Margin 62% 70% (11%)
Physical Sales (GWh) 4,819 4,743 2%
Million US$ 3Q15 3Q14 Chg %
Revenues 163 140 16%
EBITDA 76 71 7%
EBITDA Margin 47% 51% (8%)
Physical Sales (GWh) 2,168 2,311 (6%)
1. Considers the total contributions of Enel Brasil recognized by Endesa Chile as an equity method investment.
Endesa Chile 9M15 Results
USE: Public, Investor Relations 25
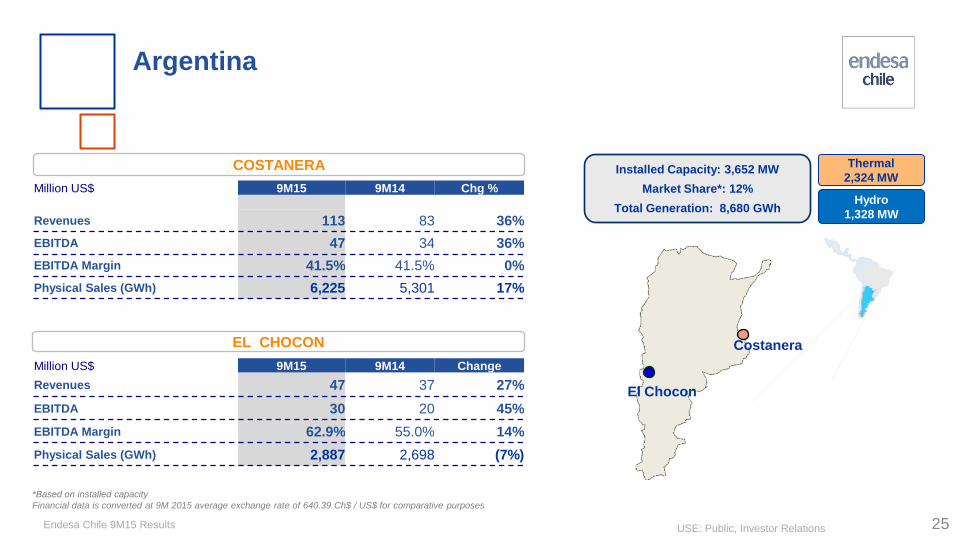
Hydro
1,328 MW
Thermal
2,324 MW
*Based on installed capacity
Financial data is converted at 9M 2015 average exchange rate of 640.39 Ch$ / US$ for comparative purposes
Argentina
Installed Capacity: 3,652 MW
Market Share*: 12%
Total Generation: 8,680 GWh
EL CHOCON
COSTANERA
El Chocon
Costanera
Million US$ 9M15 9M14 Chg %
Revenues 113 83 36%
EBITDA 47 34 36%
EBITDA Margin 41.5% 41.5% 0%
Physical Sales (GWh) 6,225 5,301 17%
Million US$ 9M15 9M14 Change
Revenues 47 37 27%
EBITDA 30 20 45%
EBITDA Margin 62.9% 55.0% 14%
Physical Sales (GWh) 2,887 2,698 (7%)
Endesa Chile 9M15 Results
USE: Public, Investor Relations 26
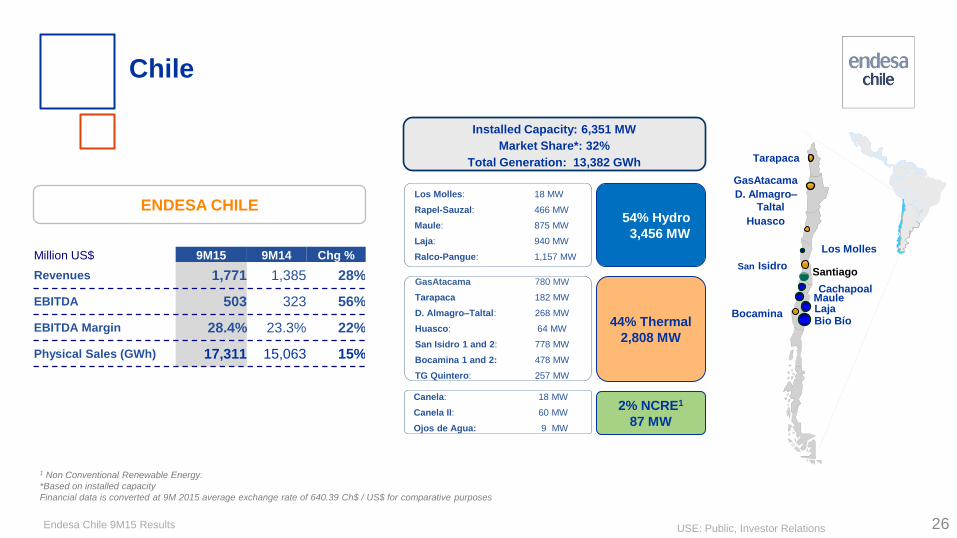
Los Molles: 18 MW
Rapel-Sauzal: 466 MW
Maule: 875 MW
Laja: 940 MW
Ralco-Pangue: 1,157 MW
54% Hydro
3,456 MW
44% Thermal
2,808 MW
GasAtacama 780 MW
Tarapaca 182 MW
D. Almagro–Taltal: 268 MW
Huasco: 64 MW
San Isidro 1 and 2: 778 MW
Bocamina 1 and 2: 478 MW
TG Quintero: 257 MW
2% NCRE1
87 MW
Canela: 18 MW
Canela II: 60 MW
Ojos de Agua: 9 MW
1 Non Conventional Renewable Energy.
*Based on installed capacity
Financial data is converted at 9M 2015 average exchange rate of 640.39 Ch$ / US$ for comparative purposes
ENDESA CHILE
Installed Capacity: 6,351 MW
Market Share*: 32%
Total Generation: 13,382 GWh
Chile
D. Almagro–
Taltal
Bocamina Laja Maule
Bio Bío
Tarapaca
Huasco
San Isidro
Los Molles
Cachapoal
Santiago
GasAtacama
Million US$ 9M15 9M14 Chg %
Revenues 1,771 1,385 28%
EBITDA 503 323 56%
EBITDA Margin 28.4% 23.3% 22%
Physical Sales (GWh) 17,311 15,063 15%
Endesa Chile 9M15 Results
USE: Public, Investor Relations
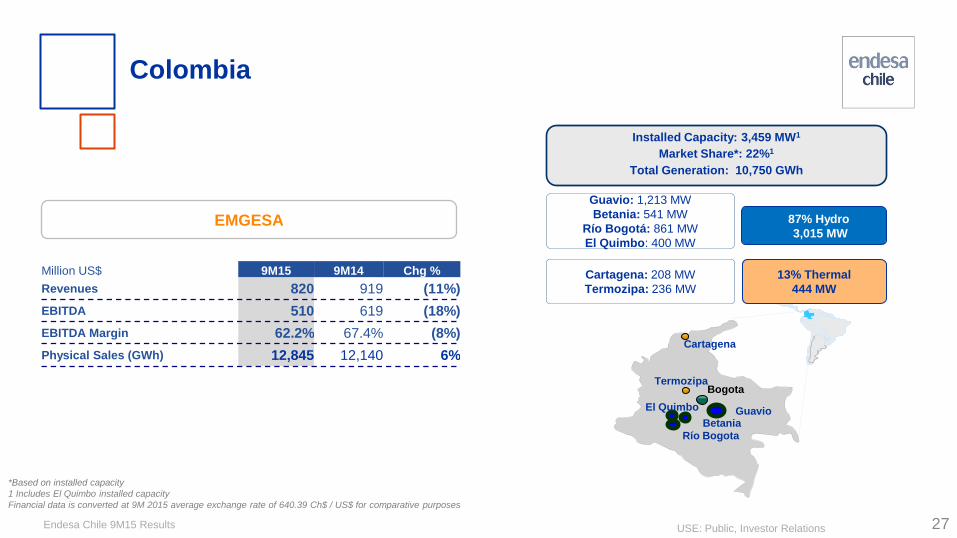
Cartagena
Bogota
27
Guavio: 1,213 MW
Betania: 541 MW
Río Bogotá: 861 MW
El Quimbo: 400 MW
87% Hydro
3,015 MW
13% Thermal
444 MW
Cartagena: 208 MW
Termozipa: 236 MW
*Based on installed capacity
1 Includes El Quimbo installed capacity
Financial data is converted at 9M 2015 average exchange rate of 640.39 Ch$ / US$ for comparative purposes
Termozipa
Guavio Betania
Río Bogota
EMGESA
Installed Capacity: 3,459 MW1
Market Share*: 22%1
Total Generation: 10,750 GWh
Colombia
Million US$ 9M15 9M14 Chg %
Revenues 820 919 (11%)
EBITDA 510 619 (18%)
EBITDA Margin 62.2% 67.4% (8%)
Physical Sales (GWh) 12,845 12,140 6%
El Quimbo

Endesa Chile 9M15 Results
USE: Public, Investor Relations 28
Ventanilla: 484 MW
Santa Rosa: 413 MW
53% Thermal
896 MW
Cuenca Río Rímac: 588 MW
Yanango: 43 MW
Chimay: 152 MW
47% Hydro
783 MW
*Based on installed capacity
Financial data is converted at 9M 2015 average exchange rate of 640.39 Ch$ / US$ for comparative purposes
Sta Rosa
Ventanilla
Lima
Río Rimac
Yanango
Chimay
EDEGEL
Installed Capacity: 1,680 MW
Market Share*: 19%
Total Generation: 6,190 GWh
Peru
Million US$ 9M15 9M14 Chg %
Revenues 432 403 7%
EBITDA 217 207 5%
EBITDA Margin 50.2% 51.5% (2%)
Physical Sales (GWh) 6,501 6,929 (6%)
Endesa Chile 9M15 Results
USE: Public, Investor Relations 29
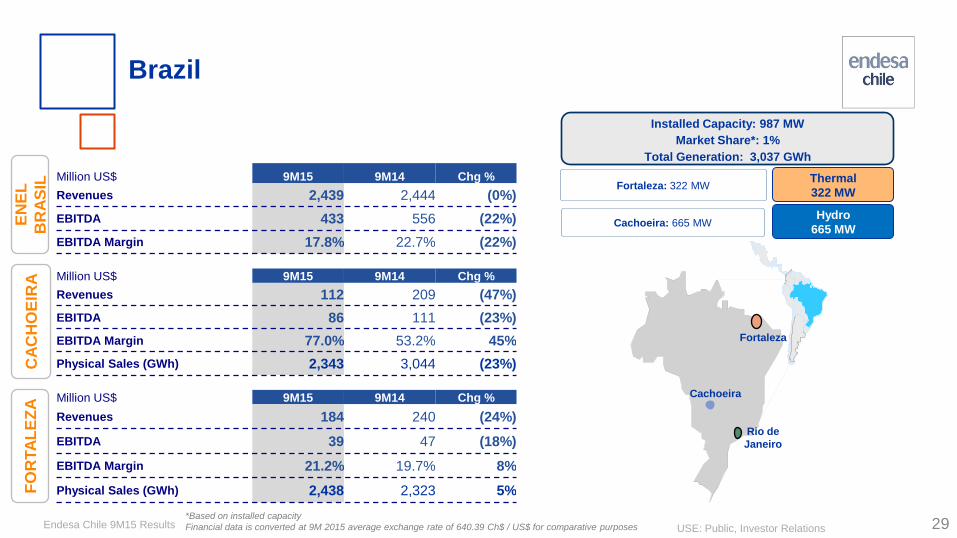
Fortaleza: 322 MW Thermal
322 MW
Cachoeira: 665 MW Hydro
665 MW
*Based on installed capacity
Financial data is converted at 9M 2015 average exchange rate of 640.39 Ch$ / US$ for comparative purposes
CA
CH
OE
IRA
Installed Capacity: 987 MW
Market Share*: 1%
Total Generation: 3,037 GWh
FO
RTA
LE
ZA
Brazil
Fortaleza
Rio de
Janeiro
Cachoeira
Million US$ 9M15 9M14 Chg %
Revenues 112 209 (47%)
EBITDA 86 111 (23%)
EBITDA Margin 77.0% 53.2% 45%
Physical Sales (GWh) 2,343 3,044 (23%)
Million US$ 9M15 9M14 Chg %
Revenues 184 240 (24%)
EBITDA 39 47 (18%)
EBITDA Margin 21.2% 19.7% 8%
Physical Sales (GWh) 2,438 2,323 5%
EN
EL
BR
AS
IL Million US$ 9M15 9M14 Chg %
Revenues 2,439 2,444 (0%)
EBITDA 433 556 (22%)
EBITDA Margin 17.8% 22.7% (22%)

Endesa Chile 9M15 Results
USE: Public, Investor Relations 30
Higher energy sales of 9% due to increasing electric demand
Consolidated generation grew by 4%
Consolidated EBITDA increased by 8%
Summary
El Quimbo is currently in testing period
Bocamina I and II resumed operations
Endesa Chile 9M15 Results
USE: Public, Investor Relations
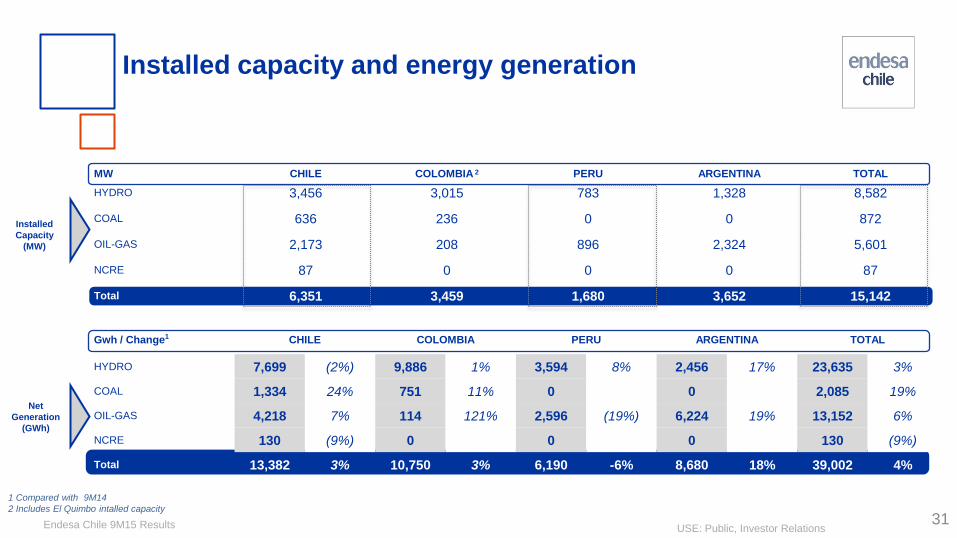
Gwh / Change1 CHILE COLOMBIA PERU ARGENTINA TOTAL
HYDRO 7,699 (2%) 9,886 1% 3,594 8% 2,456 17% 23,635 3%
COAL 1,334 24% 751 11% 0 0 2,085 19%
OIL-GAS 4,218 7% 114 121% 2,596 (19%) 6,224 19% 13,152 6%
NCRE 130 (9%) 0 0 0 130 (9%)
Total 13,382 3% 10,750 3% 6,190 -6% 8,680 18% 39,002 4%
MW CHILE COLOMBIA 2 PERU ARGENTINA TOTAL
HYDRO 3,456 3,015 783 1,328 8,582
COAL 636 236 0 0 872
OIL-GAS 2,173 208 896 2,324 5,601
NCRE 87 0 0 0 87
Total 6,351 3,459 1,680 3,652 15,142
31
Installed capacity and energy generation
Installed
Capacity
(MW)
Net
Generation
(GWh)
1 Compared with 9M14
2 Includes El Quimbo intalled capacity
Endesa Chile 9M15 Results
USE: Public, Investor Relations 32
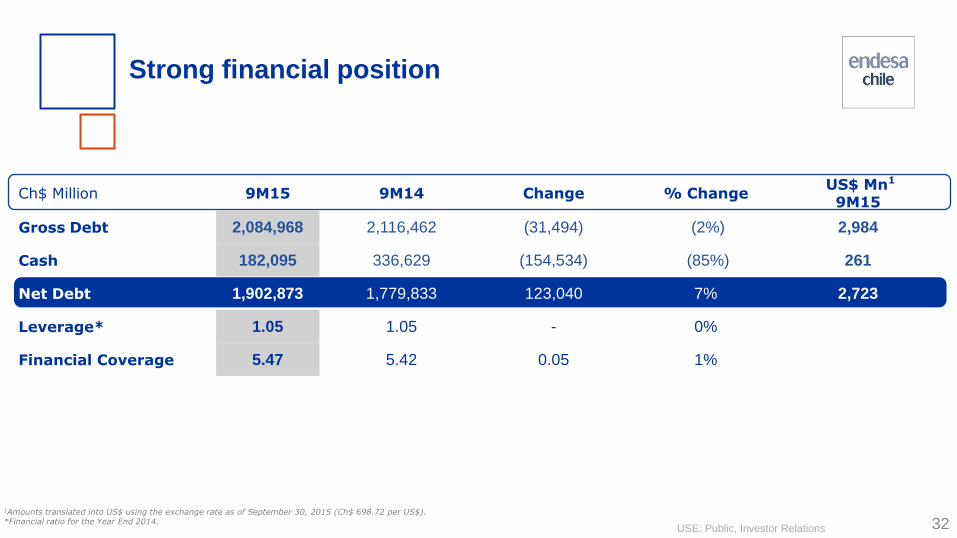
1Amounts translated into US$ using the exchange rate as of September 30, 2015 (Ch$ 698.72 per US$). *Financial ratio for the Year End 2014.
Strong financial position
Ch$ Million 9M15
9M14
Change
% Change
US$ Mn1
9M15
Gross Debt 2,084,968 2,116,462 (31,494) (2%) 2,984
Cash 182,095 336,629 (154,534) (85%) 261
Net Debt 1,902,873 1,779,833 123,040 7% 2,723
Leverage* 1.05 1.05 - 0%
Financial Coverage 5.47 5.42 0.05 1%

Endesa Chile 9M15 Results
USE: Public, Investor Relations
33
Healthy debt maturity profile in each country
1 Includes arrangements and other consolidation adjustments. 2 May not total exactly due to rounding.
US$ million 2015
2016
2017
2018 2019
Balance
TOTAL
Chile 442 10 10 10 110 1,134 1,718
Argentina 13 47 11 3 2 34 110
Peru 5 75 27 37 16 28 188
Colombia 87 125 68 83 129 800 1,291
TOTAL2 547 257 116 133 258 1,996 3,307
Financial Debt Maturity1, as of September 2015
Endesa Chile Investor Presentation 9M15
USE: Public, Investor Relations
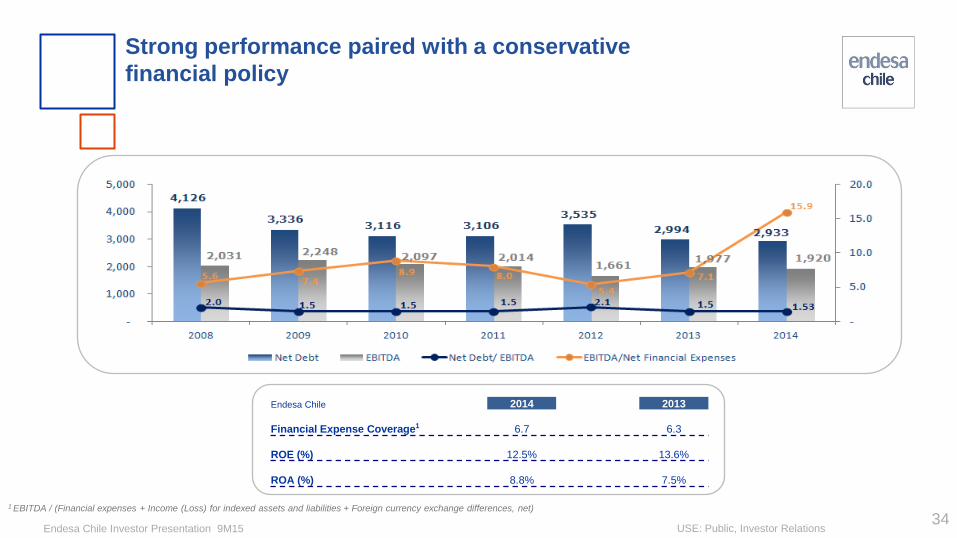
1 EBITDA / (Financial expenses + Income (Loss) for indexed assets and liabilities + Foreign currency exchange differences, net)
Endesa Chile 2014 2013
Financial Expense Coverage1 6.7 6.3
ROE (%) 12.5% 13.6%
ROA (%) 8.8% 7.5%
Strong performance paired with a conservative
financial policy
34
Endesa Chile Investor Presentation 9M15
USE: Public, Investor Relations 35
This presentation contains statements that could constitute forward-looking statements within the meaning of the Private Securities Litigation Reform Act of 1995. These statements appear
in a number of places in this announcement and include statements regarding the intent, belief or current expectations of Endesa Chile and its management with respect to, among other
things: (1) Endesa Chile’ business plans; (2) Endesa Chile’ cost-reduction plans; (3) trends affecting Endesa Chile’ financial condition or results of operations, including market trends in the
electricity sector in Chile or elsewhere; (4) supervision and regulation of the electricity sector in Chile or elsewhere; and (5) the future effect of any changes in the laws and regulations
applicable to Endesa Chile or its subsidiaries. Such forward-looking statements are not guarantees of future performance and involve risks and uncertainties. Actual results may differ
materially from those in the forward-looking statements as a result of various factors. These factors include a decline in the equity capital markets of the United States or Chile, an increase
in the market rates of interest in the United States or elsewhere, adverse decisions by government regulators in Chile or elsewhere and other factors described in Endesa Chile’ Annual
Report on Form 20-F. Readers are cautioned not to place undue reliance on those forward-looking statements, which state only as of their dates. Endesa Chile undertakes no obligation to
release publicly the result of any revisions to these forward-looking statements.