
Price_DG.pdf - NWU-IR Home
216
Modelling the antecedents of mobile gaming brand loyalty amongst Generation Y students DG Price orcid.org/0000-0003-4669-8072 Thesis accepted in fulfilment of the requirements for the degree Doctor of Philosophy in Marketing Management at the North-West University Promoter: Dr C Synodinos Co-promoter: Prof AL Bevan-Dye Graduation: April 2019 Student number: 23403802
-
Upload
khangminh22 -
Category
Documents
-
view
8 -
download
0
Transcript of Price_DG.pdf - NWU-IR Home

Modelling the antecedents of mobile gaming brand loyalty amongst Generation Y students
DG Price
orcid.org/0000-0003-4669-8072
Thesis accepted in fulfilment of the requirements for the degree Doctor of Philosophy in Marketing Management
at the North-West University
Promoter: Dr C Synodinos
Co-promoter: Prof AL Bevan-Dye
Graduation: April 2019
Student number: 23403802

i
DECLARATION
I, DG Price, declare that MODELLING THE ANTECEDENTS OF MOBILE GAMING
BRAND LOYALTY AMONGST GENERATION Y students is my own work and that all
the sources I have used or quoted have been indicated and acknowledged by means of
complete references and that this thesis has not previously been submitted for a degree
at any other university.
Signature:
Date:

ii
ETHICAL CLEARANCE

iii
LETTER FROM THE LANGUAGE EDITOR

iv
ACKNOWLEDGEMENTS
The first word of acknowledgement is to Jesus Christ, my Lord and Saviour who blesses
me with love, strength and guidance. Without whom none of this would have been
possible. A special word of thanks to the following persons who have supported and
assisted me in completing this study:
• To my wife, Kirstin Price, for her unconditional love, always encouraging me to
exceed expectations, and constantly supporting me in everything that I do.
• To my angel in heaven, Carol de la Rey, who shaped me into the man I am today
and for always encouraging me to dream big.
• To my parents, Kim Breed and James Price, and my parents-in-law, Mike and Linda
Theron, for their ongoing guidance, love and encouragement.
• To my immediate family, Attie de la Rey, Dorothy Espin, Erin Price, Ruhan Breed
and Jackie Price for their love, encouragement and patience.
• To my closest friends, David and Candice Looyen, for their continuous support.
• To my promoters, Dr Costa Synodinos and Prof Ayesha Bevan-Dye, for their hard
work, unwavering support, constant motivation, guidance and expertise in assisting
me to complete the study.
• To Angeliki Albanis for her professionalism in the language editing of this study.
• To the Generation Y students (and the lecturers who assisted me) who participated
in the pilot test, as well as the main survey questionnaire of the final study.
• To the rest of my family, friends and colleagues who gave additional support and
advice in assisting me to complete this study.
• To the ProGenY research group at North-West University (Vaal Triangle Campus)
for their support and on-going commitment to profiling the consumer behaviour of
the Generation Y cohort.

v
ABSTRACT
Keywords: Mobile gaming, satisfaction, challenge, game identification, flow,
psychological commitment, brand loyalty, Generation Y, South Africa
The rapid dissemination of smartphones amongst consumers over the past decade has
led to a plethora of mobile services being available. Of all mobile services available,
mobile application games (hereafter referred to as mobile games) have experienced the
most success. Mobile gaming has become a major success in the South African market,
with mobile gaming surpassing console video gaming in terms of revenue generated in
2016. A mobile game, as a type of video game, is described as an interactive
entertainment that can be played on a mobile device such as a smartphone or tablet. The
object of a video game, particularly a mobile game, is to create a pleasurable experience
for a player, which is attained by accomplishing certain objectives set out in the game.
Mobile games have become ubiquitous amongst smartphone users due to their
portability, as well as them being interactive, challenging and fun to play. Internationally,
mobile games have become a lucrative business, with consumer expenditure exceeding
$35 billion. Players who enjoy the game will either purchase the full-version, make
repeated in-game purchases (in-app purchases) to speed up their gameplay progress or
download other mobile games from the same company. This type of consumer behaviour
is typically linked to brand loyalty, and the success of these mobile gaming brands can
be attributed to their ability to attract and retain brand loyal consumers.
The primary objective of this study was to determine the antecedents of mobile gaming
brand loyalty amongst Generation Y students within the South African context. The
empirical objectives included determining Generation Y students’ psychological
commitment and behavioural loyalty toward their favourite mobile game, together with
their level of satisfaction, perceptions of challenge, level of flow experienced and level of
identification with their favourite mobile game. The second empirical objective determined
if mobile gaming brand loyalty is a six-factor model comprising mobile gaming
satisfaction, challenge, game identification, flow, psychological commitment and
behavioural loyalty. The third empirical objective tested a proposed model on the
influence of mobile gaming satisfaction, challenge, game identification and flow on

vi
Generation Y students’ psychological commitment and behavioural loyalty towards their
favourite mobile game. The final empirical objective sought to determine if there are any
gender differences in terms of Generation Y students’ mobile gaming satisfaction,
challenge, game identification, flow, psychological commitment and behavioural loyalty
towards their favourite mobile game.
The sampling frame for this study comprised 26 public registered South African
universities. From this initial sampling frame, non-probability judgement sampling was
applied to select a campus from a traditional university, one from a university of
technology and one from a comprehensive university. A non-probability convenience
sample of 600 students was taken across these three campuses during 2017. The
statistical techniques used to analyse the data collected from the 464 completed
questionnaires returned included factor analysis, descriptive statistics, structural equation
modelling and an independent samples t-test.
The findings in this study indicate that South African Generation Y students experience
satisfaction when playing their favourite mobile game, respond positively to challenges
posed and identify with their favourite game in terms of in-game characters, social
communities and the virtual worlds they present. Furthermore, Generation Y students
respond strongest to games that evoke a state of flow. Moreover, they are brand loyal
towards their favourite mobile game in terms of both psychological commitment and
behavioural loyalty. The study also determined that mobile gaming brand loyalty amongst
Generation Y students in South Africa is a six-factor model.
The empirically-tested model indicates that satisfaction, challenge and game
identification have a significant direct positive influence on Generation Y students’ flow,
which, in turn, is a significant positive predictor of psychological commitment. In turn,
Generation Y students’ psychological commitment towards their favourite mobile game
was found to be a significant positive predictor of their behavioural loyalty towards that
game. Game identification, in addition to having an indirect influence on psychological
commitment via its direct influence on flow, also had a direct influence on psychological
commitment. In terms of gender difference, female Generation Y students were found to
experience a statistically significant higher level of satisfaction, challenge and sense of
flow with their favourite mobile game than their male counterparts.

vii
This study contributes towards to the literature concerning brand loyalty toward mobile
gaming in both the South African and global context. This study determined which
antecedents contribute to making Generation Y students brand loyal when playing mobile
games. In addition, the study demonstrates the underlying relationships between mobile
gaming satisfaction, challenge, game identification, flow, psychological commitment and
behavioural loyalty amongst Generation Y students.

viii
TABLE OF CONTENTS
DECLARATION .............................................................................................................. I
ETHICAL CLEARANCE................................................................................................. II
LETTER FROM THE LANGUAGE EDITOR ................................................................. III
ACKNOWLEDGEMENTS ............................................................................................. IV
ABSTRACT V
TABLE OF CONTENTS .............................................................................................. VIII
LIST OF TABLES ...................................................................................................... XVI
LIST OF FIGURES .................................................................................................... XVII
CHAPTER 1 INTRODUCTION AND BACKGROUND TO THE STUDY ........................ 1
1.1 INTRODUCTION ....................................................................................... 1
1.2 PROBLEM STATEMENT .......................................................................... 3
1.3 OBJECTIVES OF THE STUDY................................................................. 5
1.3.1 Primary objective ....................................................................................... 5
1.3.2 Theoretical objectives ................................................................................ 5
1.3.3 Empirical objectives ................................................................................... 6
1.4 HYPOTHESES .......................................................................................... 6
1.5 RESEARCH DESIGN AND METHODOLOGY ......................................... 7
1.5.1 Literature review ........................................................................................ 8
1.5.2 Empirical study .......................................................................................... 8
1.5.2.1 Target population....................................................................................... 8
1.5.2.2 Sampling frame ......................................................................................... 8
1.5.2.3 Sample method ......................................................................................... 8

ix
1.5.2.4 Sample size ............................................................................................... 9
1.5.2.5 Measuring instrument and data collection method .................................... 9
1.5.3 Statistical analysis ................................................................................... 10
1.6 DEMARCATION OF THE STUDY .......................................................... 11
1.7 CHAPTER CLASSIFICATION ................................................................ 11
1.8 CONCLUSION ........................................................................................ 12
CHAPTER 2 THE RISE OF MOBILE GAMES AND THEIR MARKETING
POTENTIAL ............................................................................................ 13
2.1 INTRODUCTION ..................................................................................... 13
2.2 MOBILE GAMES .................................................................................... 14
2.2.1 Video gaming history ............................................................................... 14
2.2.2 Video game categories ............................................................................ 15
2.2.2.1 Sport simulation ....................................................................................... 15
2.2.2.2 Adventure, role-playing and fantasy ........................................................ 15
2.2.2.3 Puzzlers ................................................................................................... 15
2.2.2.4 Platformers .............................................................................................. 16
2.2.2.5 Fighting .................................................................................................... 16
2.2.2.6 Shooters .................................................................................................. 16
2.2.2.7 Modern day video games ........................................................................ 16
2.2.3 The origin of mobile games ..................................................................... 17
2.2.4 First generation mobile telephones and mobile gaming .......................... 18
2.2.5 Second generation mobile telephones and mobile gaming ..................... 20
2.2.6 Third generation mobile telephones and mobile gaming ......................... 23
2.2.7 Types of third generation mobile games .................................................. 26
2.2.7.1 Touch-based mobile games .................................................................... 26
x
2.2.7.2 Location-based mobile games ................................................................. 26
2.2.7.3 Voice-controlled mobile games ............................................................... 26
2.2.7.4 Augmented-reality mobile games ............................................................ 27
2.2.7.5 Accelerometer-based mobile games ....................................................... 27
2.2.7.6 Pokémon Go and other unique mobile games ........................................ 28
2.3 MOBILE GAMING BUSINESS MODELS ............................................... 29
2.3.1 Free-to-play ............................................................................................. 30
2.3.2 Pay-to-play .............................................................................................. 31
2.3.3 Paymium apps ......................................................................................... 31
2.3.4 Reasons to choose a freemium model .................................................... 32
2.3.5 The influence of brand loyalty theory and flow theory on mobile
gaming business models ......................................................................... 33
2.4 GLOBAL PERFORMANCE OF MOBILE GAMES ................................. 33
2.4.1 Mobile games in South Africa .................................................................. 34
2.4.2 Policy barriers that mobile game development faces in the South
African context ......................................................................................... 35
2.5 MARKETING POTENTIAL OF MOBILE GAMES................................... 36
2.5.1 Branded merchandising ........................................................................... 36
2.5.2 Films and television series ...................................................................... 37
2.5.3 Product placement................................................................................... 37
2.5.4 Augmented reality.................................................................................... 38
2.6 CONCLUSION ........................................................................................ 39
CHAPTER 3 ANTECEDENTS OF MOBILE GAMING BRAND LOYALTY AND
THE GENERATION Y COHORT............................................................. 40
3.1 INTRODUCTION ..................................................................................... 40
3.2 THE IMPORTANCE OF A BRAND ......................................................... 41

xi
3.2.1 Brand strategies adopted in mobile gaming ............................................ 42
3.2.1.1 Social media marketing and online brand communities........................... 42
3.2.1.2 Psychological marketing techniques........................................................ 44
3.2.1.3 Celebrity endorsements ........................................................................... 45
3.2.1.4 Co-branding ............................................................................................. 46
3.2.1.5 Brand extension ...................................................................................... 48
3.3 BRAND EQUITY AND BRAND LOYALTY ............................................. 50
3.3.1 Measuring a brand through brand equity ................................................. 50
3.3.2 What is brand loyalty? ............................................................................. 52
3.3.2.1 Behavioural stochastic approach to brand loyalty ................................... 53
3.3.2.2 Attitudinal deterministic approach to brand loyalty .................................. 54
3.3.2.3 Measuring brand loyalty from a behavioural and attitudinal
perspective .............................................................................................. 55
3.3.3 Brand loyalty in mobile games ................................................................. 56
3.4 ANTECEDENTS OF MOBILE GAMING BRAND LOYALTY ................. 57
3.4.1 Satisfaction .............................................................................................. 58
3.4.1.1 Satisfaction as a predictor of mobile gaming flow .................................... 59
3.4.2 Challenge ................................................................................................ 59
3.4.2.1 Satisfaction and challenge as predictors of mobile gaming flow .............. 60
3.4.3 Game identification .................................................................................. 60
3.4.3.1 Game identification as a predictor of mobile gaming flow and brand
loyalty ...................................................................................................... 61
3.4.4 Flow ......................................................................................................... 62
3.4.4.1 Flow as a predictor of mobile gaming brand loyalty ................................. 63
3.4.5 Psychological commitment ...................................................................... 63

xii
3.4.6 Psychological commitment as a predictor of mobile gaming
behavioural loyalty ................................................................................... 64
3.5 BRAND LOYALTY AMONGST GENERATIONAL COHORTS .............. 65
3.5.1 Generation Y ........................................................................................... 66
3.5.2 Generation Y in South Africa ................................................................... 68
3.5.3 Gender differences in Generation Y brand loyalty towards video
games ...................................................................................................... 68
3.6 PROPOSED MODEL TO PREDICT MOBILE GAMING BRAND
LOYALTY ................................................................................................ 69
3.7 CONCLUSION ........................................................................................ 70
CHAPTER 4 RESEARCH DESIGN AND METHODOLOGY ....................................... 72
4.1 INTRODUCTION ..................................................................................... 72
4.2 RESEARCH PARADIGMS ..................................................................... 73
4.2.1 Constructivist ........................................................................................... 73
4.2.2 Transformative ........................................................................................ 74
4.2.3 Pragmatic ................................................................................................ 74
4.2.4 Post-positivist .......................................................................................... 74
4.3 RESEARCH DESIGN .............................................................................. 75
4.4 SAMPLING PROCEDURE ...................................................................... 77
4.4.1 Define the target population .................................................................... 78
4.4.2 Determine the sampling frame ................................................................ 79
4.4.3 Select a sampling technique(s) ............................................................... 79
4.4.4 Determine the sampling size ................................................................... 81
4.5 DATA COLLECTION METHOD .............................................................. 82
4.5.1 Questionnaire design ............................................................................... 82
4.5.2 Questionnaire content ............................................................................. 83
xiii
4.5.3 Layout of the questionnaire ..................................................................... 84
4.5.4 Pre-testing and pilot testing of the questionnaire ..................................... 84
4.6 QUESTIONNAIRE ADMINISTRATION ................................................... 85
4.7 DATA PREPARATION ........................................................................... 86
4.7.1 Step 1: Editing ......................................................................................... 86
4.7.2 Step 2: Coding ......................................................................................... 86
4.7.3 Step 3: Tabulation ................................................................................... 88
4.8 STATISTICAL ANALYSIS ...................................................................... 88
4.8.1 Factor analysis ........................................................................................ 89
4.8.1.1 Method of factor analysis ......................................................................... 89
4.8.1.2 Number of factors .................................................................................... 90
4.8.1.3 Factor rotation ......................................................................................... 90
4.8.1.4 Factor loadings and communalities ......................................................... 91
4.8.2 Descriptive statistics ................................................................................ 91
4.8.2.1 Measures of location ............................................................................... 91
4.8.2.2 Measures of variability ............................................................................. 92
4.8.2.3 Measure of shape .................................................................................... 92
4.8.3 Structural equation modelling .................................................................. 93
4.8.3.1 Defining individual constructs .................................................................. 94
4.8.3.2 Developing the measurement model ....................................................... 95
4.8.3.3 Designing a study to produce empirical results ....................................... 95
4.8.3.4 Assessing measurement model reliability and validity ............................. 96
4.8.3.5 Specifying the structural model ............................................................... 98
4.8.3.6 Assessing structural model validity .......................................................... 98
4.8.4 Two independent-samples t-test ............................................................. 99

xiv
4.8.5 Cohen’s D-statistic................................................................................... 99
4.9 CONCLUSION ........................................................................................ 99
CHAPTER 5 DATA ANALYSIS AND INTERPRETATION OF FINDINGS ................ 101
5.1 INTRODUCTION ................................................................................... 101
5.2 PILOT TESTING OF QUESTIONNAIRE ............................................... 102
5.3 DATA GATHERING PROCESS............................................................ 103
5.4 PRELIMINARY DATA ANALYSIS ........................................................ 103
5.4.1 Coding ................................................................................................... 103
5.4.2 Data Cleaning ........................................................................................ 105
5.4.3 Tabulation of variables .......................................................................... 105
5.5 DEMOGRAPHIC ANALYSIS ................................................................ 107
5.6 EXPLORATORY FACTOR ANALYSIS ................................................ 114
5.7 DESCRIPTIVE STATISTICS ................................................................. 116
5.8 NOMOLOGICAL VALIDITY AND COLLINEARITY DIAGNOSTICS .... 118
5.9 HYPOTHESIS TESTING ....................................................................... 120
5.10 STRUCTURAL EQUATION MODELLING ............................................ 121
5.10.1 Measurement model specification ......................................................... 121
5.10.2 Reliability and validity of the measurement model ................................. 125
5.10.3 Structural model .................................................................................... 126
5.11 TWO INDEPENDENT-SAMPLES T-TEST ........................................... 131
5.12 CONCLUSION ...................................................................................... 133
CHAPTER 6 CONCLUSIONS AND RECOMMENDATIONS ..................................... 135
6.1 INTRODUCTION ................................................................................... 135
6.2 OVERVIEW OF THE STUDY ................................................................ 136
6.3 MAIN FINDINGS OF THE STUDY ........................................................ 139

xv
6.4 CONTRIBUTIONS OF THE STUDY ..................................................... 142
6.5 RECOMMENDATIONS ......................................................................... 142
6.5.1 Design brand strategies around the social aspect of playing mobile
games to enhance game identification .................................................. 142
6.5.2 Satisfaction from playing mobile games will not induce brand loyalty
unless flow is achieved .......................................................................... 143
6.5.3 Mobile games must present a challenge to enhance flow experience ... 144
6.5.4 Creating an optimal flow experience for mobile gamers fosters strong
brand loyalty .......................................................................................... 145
6.5.5 Target the tech-savvy, brand loyal Generation Y cohort ........................ 145
6.5.6 Implement a free-to-play business model to attract and retain loyal
video game players ............................................................................... 146
6.5.7 Incorporate attitudinal metrics when measuring mobile gaming brand
loyalty .................................................................................................... 147
6.6 LIMITATIONS AND FUTURE RESEARCH OPPORTUNITIES ............ 147
6.7 CONCLUDING REMARKS ................................................................... 148
BIBLIOGRAPHY ........................................................................................................ 149
ANNEXURE A QUESTIONNAIRE ............................................................................. 189
ANNEXURE B STRUCTURAL MODELS ................................................................ 1945
STRUCTURAL MODEL A ........................................................................................ 1956
STRUCTURAL MODEL B ........................................................................................ 1967
STRUCTURAL MODEL C ........................................................................................ 1978

xvi
LIST OF TABLES
Table 4-1: Coding information .............................................................................. 87
Table 5-1: Pilot testing results ............................................................................ 102
Table 5-2: Coding information at the main study ................................................ 104
Table 5-3: Frequency table of responses ........................................................... 106
Table 5-4: Exploratory principle components analysis ....................................... 115
Table 5-5: Descriptive statistics .......................................................................... 117
Table 5-6: Correlation matrix .............................................................................. 118
Table 5-7: Collinearity diagnostics ...................................................................... 119
Table 5-8: Estimated standardised coefficients of the measurement model ...... 123
Table 5-9: Fit indices for the measurement model ............................................. 124
Table 5-10: Correlation matrix, CR values, AVE values, square roots of AVE
values ................................................................................................ 125
Table 5-11: Structural model comparison ............................................................. 131
Table 5-12: Gender difference ............................................................................. 132
xvii
LIST OF FIGURES
Figure 2-1: The earliest mobile telephones ........................................................... 19
Figure 2-2: Snake and Tetris: The first mobile games ........................................... 20
Figure 2-3: Java-enabled mobile games ............................................................... 21
Figure 2-4: Popular 3D mobile games: Ridge Racer and Air Snowboarding ......... 23
Figure 2-5: The revolutionary multi-touch screen Apple iPhone ............................ 24
Figure 2-6: Third-generation mobile telephone games .......................................... 29
Figure 2-7: In-game purchases from Angry Birds 2 and Candy Crush .................. 30
Figure 3-1: Aaker’s illustration of brand equity ...................................................... 51
Figure 3-2: Keller’s illustration of brand equity ....................................................... 52
Figure 3-3: A stochastic and deterministic approach to brand loyalty .................... 55
Figure 3-4: Proposed model of the antecedents of mobile gaming brand
loyalty amongst Generation Y students ............................................... 70
Figure 4-1: Illustration of the marketing research designs ..................................... 76
Figure 4-2: Sampling design process .................................................................... 78
Figure 4-3: Probability and non-probability sampling techniques .......................... 80
Figure 4-4: Six stages in Structural Equation Modelling ........................................ 94
Figure 5-1: Response rate of Institutions ............................................................. 108
Figure 5-2: Respondents’ current year of study ................................................... 109
Figure 5-3: Gender profile of respondents ........................................................... 110
Figure 5-4: Race distribution of respondents ....................................................... 111
Figure 5-5: Respondents’ province of origin ........................................................ 112
Figure 5-6 Respondents’ home language ........................................................... 113

xviii
Figure 5-7: Age distribution of respondents ......................................................... 114
Figure 5-8: Specified measurement model .......................................................... 122
Figure 5-9: Structural Model A ............................................................................. 127
Figure 5-10: Structural Model B ............................................................................. 128
Figure 5-11: Structural Model C............................................................................. 129
Figure 6-1: Model of the antecedents of mobile gaming brand loyalty amongst
Generation Y students ....................................................................... 141

1
CHAPTER 1
INTRODUCTION AND BACKGROUND TO THE STUDY
1.1 INTRODUCTION
The rapid dissemination of smartphones amongst consumers over the past decade has
led to a plethora of mobile services being available. Of all mobile services available,
mobile application games (hereafter referred to as mobile games) have experienced the
most success (Liu & Li, 2011:890). Mobile gaming is also a major success in the South
African market, with mobile gaming overtaking console video gaming in terms of revenue
generated in 2016 (PricewaterhouseCoopers, 2016:36). A mobile game, as a type of
video game, is described as an interactive entertainment that can be played on a mobile
device such as a smartphone or tablet. The object of a video game, particularly a mobile
game, is to create a pleasurable experience for a player, which is attained by
accomplishing certain objectives set out in the game (Granic, Lobel & Engels, 2014:67;
Jeong & Kim, 2009:186). Mobile games have become ubiquitous amongst smartphone
users due to their portability, as well as them being interactive, challenging and fun to
play (Hill, 2014).
Internationally, mobile games have become a lucrative business with consumer
expenditure exceeding $35 billion (Statista, 2016a). The three giants of the mobile gaming
industry, Rovio (Angry Birds), King (Candy Crush Saga) and Supercell (Clash of Clans)
are at the forefront of this success with their flagship mobile games becoming burgeoning
brands (Loveday, 2015; Takahashi, 2014; Newzoo, 2013; Sinha, 2012; Cheshire, 2011).
These mobile games are able to attract a large following of video gamers by allowing
them to download the mobile game for free. Thereafter, players who enjoy the game will
either purchase the full-version, make repeated in-game purchases (in-app purchases)
to speed up their gameplay progress or download other mobile games from the same
company (Davidovici-Nora, 2014:83). This type of consumer behaviour is typically linked
to brand loyalty, and the success of these mobile gaming brands can be attributed to their
ability to attract and retain brand loyal consumers (video game players) (Teng, 2013:884).

2
Brand loyal consumers are defined as people who commit themselves to one particular
brand and possess a strong resistance to change their loyalty from one brand to another
(Clow & Baack, 2014:52). The importance of brand loyalty to an organisation’s success
has been widely acknowledged by multiple academics in research that is closely related
to mobile games (mobile gamification, online games, video games and mobile phones)
(Wu & Chien, 2015; Teng, Chen, Chen & Li, 2012; Lin, 2010; Gaur & Arora, 2014). Bauer,
Stockburger- Sauer and Exler (2008:207) state that brand loyalty must be conceptualised
as a two-dimensional construct comprising psychological commitment and behavioural
loyalty. Psychological commitment represents the attitudinal component of brand loyalty.
It manifests as an emotional commitment to a brand that is characterised by a consumer’s
willingness to support the success of a brand and a resistance towards switching brands
(Lu & Wang, 2008:504). Behavioural loyalty represents a consumer’s intention to
continue engaging with a brand. This includes past and future purchase behaviour, as
well as intentions to buy additional products related to the brand (Lii & Sy, 2009:772).
Amine (1998:307) posits that higher psychological commitment to a brand typically leads
to increased behavioural loyalty.
Limited research aimed at determining potential antecedents of consumer loyalty towards
video games has revealed flow to be a significant predictor (Teng, 2013; Choi & Kim,
2004). Flow is described as a holistic experience that occurs when a player becomes
cognitively absorbed while playing a video game (Ha, Yoon & Choi, 2007:279). A study
done by Teng (2013:885) found that flow has a positive and statistically significant impact
on consumer loyalty towards a video game. The study also found that challenge predicts
flow. Challenges posed by a video game encourage players to use cognitive skills to
overcome them, which increases the cognitive concentration required when playing that
game (Teng, 2013:884). In video games research, the term cognitive concentration has
become interchangeable with flow (Jung et al., 2009:125).
There are two other popular antecedents of consumer video game loyalty that have been
identified in the literature, namely satisfaction (Lu & Wang, 2008:500) and game
identification (Van Looy, Courtois & De Vocht, 2012:129). Research conducted by Lu and
Wang (2008) revealed that satisfaction has a positive significant impact towards
consumer loyalty. Game identification is the conceptualisation of brand identification for

3
video games, and was utilised by Van Looy et al. (2012). It is defined as the extent to
which a player can identify himself/herself with their favourite video game and with other
people playing the same game. Brand identification is considered a salient predictor of
brand loyalty (Lin, 2010:7). The literature pertaining to brand loyalty has shown that
consumers who perceive a level of connectedness to a particular brand may become
psychologically committed and behaviourally loyal to that brand (Parker, 2005:27).
However, a study by Van Looy et al. (2012) did not explore the possibility of a player’s
game identification predicting their loyalty towards that video game. As such, further
research is needed to prove if game identification can be used to predict mobile gaming
brand loyalty, as is the case with satisfaction, challenge and flow.
Targeting potential brand loyal consumers is of the utmost importance to marketers (Clow
& Baack, 2014:102). A study conducted by Price (2017:114) revealed that South African
Generation Y students – also known as today’s youth or the Millennials – display positive
attitudes towards mobile games and have positive behavioural intentions towards playing
them. The Generation Y cohort includes any individual born between 1986 and 2005
(Markert, 2004:21) and, in South Africa, represented an estimated 40 percent of the
population in 2017 (Statistics South Africa, 2017:12). Moreover, Generation Y members
who are students at higher education institutes (HEIs) are of particular importance, as
they tend to develop into opinion leaders and trend setters amongst their peers (Bevan-
Dye & Surujlal, 2011:49). As such, their perceptions of and engagement with mobile
games, be it positive or negative, is likely to influence the wider Generation Y market.
Therefore, understanding South African Generation Y university students’ perceptions of
and engagement with mobile games may be fruitful for marketers seeking to develop and
grow mobile gaming brands aimed at members of the country’s wider Generation Y
market segment.
1.2 PROBLEM STATEMENT
Mobile games have become a lucrative market in South Africa, given that close to six
million active players with an average revenue per user estimated at R67 generated
consumer expenditure approaching R500 million in 2017 (Statista, 2017a). The revenue
generated by popular mobile games stems from a freemium business strategy, whereby
the majority of income earned is from in-game purchases and repeat purchases (Moreira,

4
Filho & Ramalho, 2014:3). Much of the success of well-known mobile games, such as
Angry Birds, Candy Crush Saga and Clash of Clans, can be attributed to brand loyal
consumers who engage in repeat in-game or branded merchandise purchases (Verto
Analytics, 2015). Despite this, the literature aimed at understanding how they attract such
a loyal following is scarce, particularly in the South African context.
There are only a few studies that exist concerning consumer loyalty towards online video
games (Teng, 2013; Choi & Kim, 2004), with no study conducted on consumer loyalty
towards mobile games. Moreover, the studies alluded to in the introduction predicted
loyalty as a one-dimensional concept and not as two-dimensional concept, as indicated
by Bauer et al. (2008:207). This suggests that there is a gap in the literature concerning
brand loyalty towards video games and, in particular, brand loyalty towards mobile games
amongst a specific target market.
Generation Y students’ positive attitudes and behavioural intentions toward mobile games
(Price, 2017:114), together with their potential to be opinion leaders and trendsetters
amongst their peers (Bevan-Dye & Surujlal, 2011:49) renders them an important target
population for investigating the factors that influence Generation Y individuals’ two-
dimensional brand loyalty towards mobile games. The wider Generation Y cohort
represents a large size of the total South African population (40 percent) (Statistics South
Africa, 2017:12), making the Generation Y cohort – particularly South African Generation
Y university students - an important target market for marketers seeking to build mobile
gaming brands.
As such, this study endeavoured to bridge the gap in the literature by developing and
testing a model of potential predictors of mobile gaming brand loyalty amongst Generation
Y students in South Africa. The findings of this study may assist local marketers and video
game developers in understanding the antecedents of brand loyalty in mobile games and
how to incorporate them into a sustainable business model.
The following section outlays the objectives for the study.

5
1.3 OBJECTIVES OF THE STUDY
This study aimed to enlighten video game organisations and marketers on brand loyalty
as a theoretical dimension and how it can be successfully incorporated to build a
sustainable business model for mobile games.
The proceeding subsections detail the primary, theoretical and empirical objectives
formulated for the study.
1.3.1 Primary objective
The primary objective of this study was to determine the antecedents of mobile gaming
brand loyalty amongst Generation Y students in South Africa.
1.3.2 Theoretical objectives
In line with the primary objective of this study, a relevant literature review was conducted
according to the following theoretical objectives:
• Review the literature on mobile gaming.
• Discuss the marketing potential of mobile games.
• Introduce and discuss the notion of a mobile game as a brand.
• Review the literature on brand equity and brand loyalty.
• Review the literature on satisfaction, challenge and game identification as possible
antecedents of mobile gaming brand loyalty.
• Review the literature on flow as a significant predictor of mobile gaming brand
loyalty.
• Discuss psychological commitment and behavioural loyalty as dimensions of mobile
gaming brand loyalty.
• Conduct a review on the literature pertaining to Generation Y as a target market.

6
• Propose a model on the influence of mobile gaming satisfaction, challenge, game
identification and flow on Generation Y students’ psychological commitment and
behavioural loyalty towards their favourite mobile game.
1.3.3 Empirical objectives
After considering the theoretical objectives, the following empirical objectives were
formulated in order to achieve the primary objective of the study:
• Determine Generation Y students’ psychological commitment and behavioural
loyalty toward their favourite mobile game, together with their level of satisfaction,
perceptions of challenge, level of flow experienced and level of identification with
their favourite mobile game.
• Determine whether Generation Y students’ mobile gaming brand loyalty is a six-
factor model comprising mobile gaming satisfaction, challenge, game identification,
flow, psychological commitment and behavioural loyalty.
• Empirically test a proposed model on the influence of mobile gaming satisfaction,
challenge, game identification and flow on Generation Y students’ psychological
commitment and behavioural loyalty towards their favourite mobile game.
• Determine if there are any gender differences in terms of Generation Y students’
mobile gaming satisfaction, challenge, game identification, flow, psychological
commitment and behavioural loyalty towards their favourite mobile game.
1.4 HYPOTHESES
In line with the empirical objectives, the following five hypotheses were promulgated:
Ho1: Antecedents of mobile gaming brand loyalty is not a six-factor structure
comprising mobile gaming satisfaction, challenge, game identification, flow,
psychological commitment and behavioural loyalty.
Ha1: Antecedents of mobile gaming brand loyalty is a six-factor structure comprising
mobile gaming satisfaction, challenge, game identification, flow, psychological
commitment and behavioural loyalty.
7
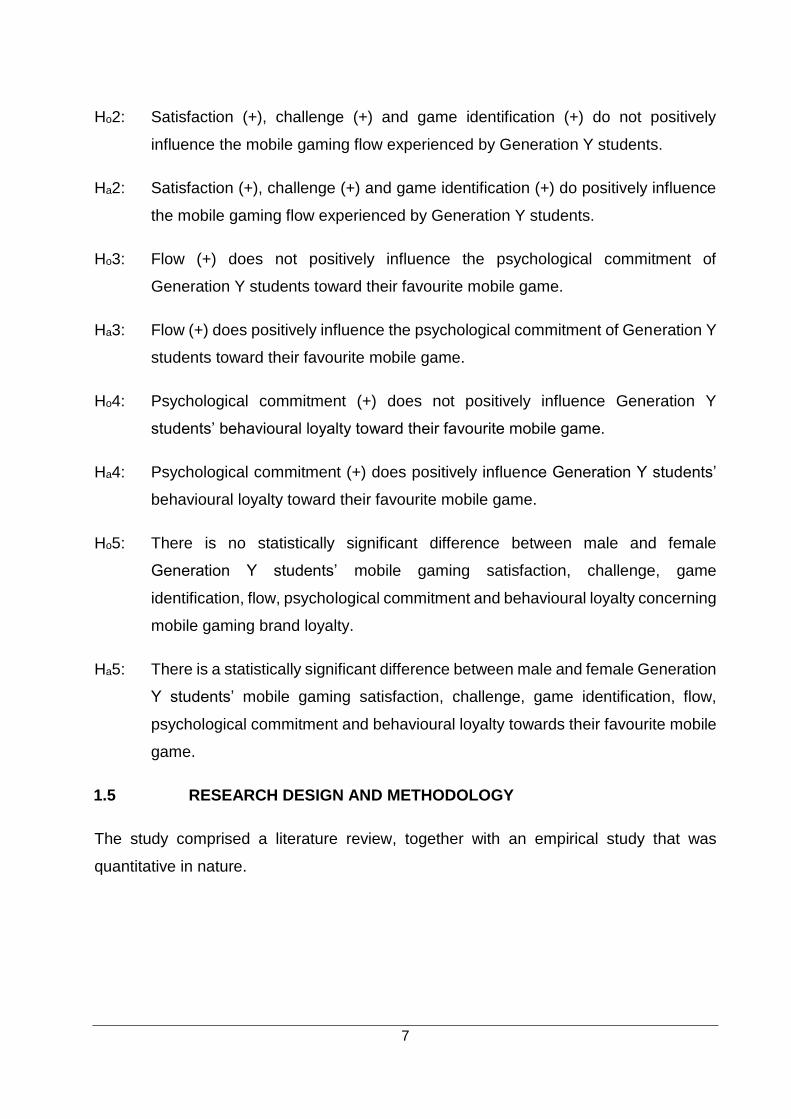
Ho2: Satisfaction (+), challenge (+) and game identification (+) do not positively
influence the mobile gaming flow experienced by Generation Y students.
Ha2: Satisfaction (+), challenge (+) and game identification (+) do positively influence
the mobile gaming flow experienced by Generation Y students.
Ho3: Flow (+) does not positively influence the psychological commitment of
Generation Y students toward their favourite mobile game.
Ha3: Flow (+) does positively influence the psychological commitment of Generation Y
students toward their favourite mobile game.
Ho4: Psychological commitment (+) does not positively influence Generation Y
students’ behavioural loyalty toward their favourite mobile game.
Ha4: Psychological commitment (+) does positively influence Generation Y students’
behavioural loyalty toward their favourite mobile game.
Ho5: There is no statistically significant difference between male and female
Generation Y students’ mobile gaming satisfaction, challenge, game
identification, flow, psychological commitment and behavioural loyalty concerning
mobile gaming brand loyalty.
Ha5: There is a statistically significant difference between male and female Generation
Y students’ mobile gaming satisfaction, challenge, game identification, flow,
psychological commitment and behavioural loyalty towards their favourite mobile
game.
1.5 RESEARCH DESIGN AND METHODOLOGY
The study comprised a literature review, together with an empirical study that was
quantitative in nature.

8
1.5.1 Literature review
In order to fully explore the subject of mobile gaming brand loyalty, secondary data
sources were incorporated that included relevant textbooks, journal articles, newspaper
articles, online academic databases and Internet sources.
1.5.2 Empirical study
The empirical portion of this study followed a descriptive research design and utilised the
single cross-sectional survey method for data collection. The study comprised several
methodology dimensions, which are discussed in the sections below.
1.5.2.1 Target population
For this study, the target population comprised full-time South African Generation Y
students registered at public South African HEIs located within the province of Gauteng.
The target population was defined as follows:
• Element: Full-time Generation Y students
• Sampling unit: Publicly registered South African HEIs
• Extent: Gauteng, South Africa
• Time frame: 2017
1.5.2.2 Sampling frame
The sampling frame for this study comprised 26 public registered South African HEIs
(Universities South Africa, 2018). Non-probability judgement sampling was used to
narrow the selection down to three HEI campuses. The chosen HEIs included one
traditional university, one university of technology and one comprehensive university.
1.5.2.3 Sample method
Following the selection of the sampling frame, a non-probability convenience sample of
full-time Generation Y students was drawn from the three campuses.
9
1.5.2.4 Sample size
A sample size of 600 full-time Generation Y students was chosen for the study. The
sample size is in line with similar studies conducted by Billieux et al. (2013:1) (sample
size: 690), Van Looy (2012:126) (sample size: 544) and Park et al. (2011:748) (sample
size: 556), and adheres to the minimum requirements set out to conduct factor analysis
on 29 scaled response questions (Pallant, 2016:184) and structural equation modelling
(SEM) for complex models containing six constructs (Hair, Black, Babin & Anderson,
2010:662). This sample size of 600 full-time Generation Y students was split equally
between the three chosen HEI campuses, with a sample size of 200 participants per
campus.
1.5.2.5 Measuring instrument and data collection method
The study utilised a self-administered questionnaire to gather the primary data. The
questionnaire comprised two sections, namely Section A, which contained demographical
questions and Section B, which included the mobile gaming brand loyalty scales.
The antecedents of brand loyalty were measured using scales from previously published
literature. The constructs of satisfaction (five items), challenge (four items), game
identification (five items), and flow (six items) were measured using adapted scales from
studies conducted by Lu and Wang (2008:518-519), Teng (2013:887), Van Looy et al.
(2012:134), and Choi and Kim (2004:16-17).
Brand loyalty, conceptualised as psychological commitment (four items) and behavioural
loyalty (five items), was measured using adapted scales from research conducted by
Prichard, Havitz and Howard (1999:345) and Bauer et al. (2008:225). Furthermore, the
fifth item added to the behavioural loyalty scale: “I would follow the latest news and
updates about my favourite mobile game on social media platforms (Facebook, Twitter,
Instagram, etc.)”, was done so due to the relevance and popularity of social media
amongst Generation Y (Barton, Fromm & Egan, 2012:4). The questionnaire measured
these scaled responses using a six-point Likert scale ranging from 1 = strongly disagree
to 6 = strongly agree.

10
Owing to the limitations of convenience sampling, demographic questions concerning
respondents’ age, gender, home province and home language were included in Section
A to determine the degree to which the sample represented the chosen target population.
The questionnaire also included a cover letter explaining the nature of the study, as well
as providing relevant contact details. This cover letter also explained that the data would
be handled in a confidential manner.
Ethical clearance for the questionnaire was sought from the Ethics Committee of the
Faculty of Economic Sciences and Information Technology at the North-West University
(Vaal Triangle Campus). The Ethics Committee classified the questionnaire as a low risk
status and issued the following ethical clearance number: ECONIT 2017-003.
Thereafter, lecturers at the chosen HEI campuses were contacted in order to obtain
permission to distribute the questionnaires at a time that was convenient for them. The
lecturers who agreed to allow their students to partake in the study were shown the ethical
clearance certificate that was obtained. Importantly, participants were informed that their
participation in the study was strictly voluntary and that their identities would remain
anonymous. Thereafter, self-administered questionnaires were distributed to the full-time
Generation Y students after their respective lecturer’s class had concluded. The empirical
portion of the study took place between February and April in 2017.
1.5.3 Statistical analysis
Self-administered questionnaires were used to collect primary data, which were captured
and analysed using IBM’s statistical package for Social Sciences (SPSS) and Analysis of
Moment Structures (AMOS) Version 25.0 for Windows. The following statistical methods
were used on the empirical data sets:
• Exploratory factor analysis
• Descriptive analysis
• Structural equation modelling (SEM)
• Two independent-samples t-test

11
1.6 DEMARCATION OF THE STUDY
This research study was undertaken amongst full-time Generation Y students aged
between 18 and 24 years. The participating students were registered at a South African
HEI in 2017. The study was limited to three public HEI campuses located in the Gauteng
Province of South Africa, and included a campus from a university of technology, one
from a comprehensive university and one from a traditional university.
1.7 CHAPTER CLASSIFICATION
Chapter 1: Introduction and background to the study
This chapter introduced the topic of mobile gaming brand loyalty, which included a brief
introduction and background on brand loyalty and mobile gaming. This was followed by
the problem statement, which identified a gap in the literature pertaining to mobile gaming
brand loyalty amongst the Generation Y cohort in South Africa. In accordance with the
problem statement, one primary objective, nine theoretical objectives and four empirical
objectives were formulated to guide this study. The research methodology followed in this
study was briefly outlined. The chapter concluded with the contribution and structure of
the study.
Chapter 2: The rise of mobile games and their marketing potential
The purpose of Chapter 2 is to discuss mobile games and the marketing opportunities
they present. It includes a review of the history and development of mobile games and
outlines the various mobile gaming business models. The global performance of mobile
games is briefly discussed, and the chapter concludes with an examination of the
marketing potential for mobile games.
Chapter 3: Antecedents of mobile gaming brand loyalty and the Generation Y
cohort
Chapter 3 reviews the literature regarding branding, the emergence of mobile gaming
brands, and brand strategies. Brand equity theory and brand loyalty are also defined and
discussed. Thereafter, the antecedents of mobile gaming brand loyalty are presented and
include satisfaction, challenge and game identification. The brand loyalty construct is

12
conceptualised as a two-dimensional construct comprising psychological commitment
and behavioural loyalty. This is followed by an in-depth discussion of the Generation Y
cohort and their value to marketers in the field of mobile gaming. Lastly, a model is
proposed at the end of the chapter containing antecedents of mobile gaming brand loyalty
amongst Generation Y students.
Chapter 4: Research design and methodology
This chapter discusses the research paradigm, research design, and methodology
followed in the study. It includes an outline of the target population, sampling method,
sample frame and data collection method. The statistical procedures used to analyse
primary data, namely exploratory factor analysis, descriptive analysis, SEM and a two
independent-samples t-test are explained in detail.
Chapter 5: Analysis and interpretation of the empirical findings
In accordance with Chapter 4, the results from the empirical portion of the study were
analysed and the results are presented and interpreted in Chapter 5.
Chapter 6: Conclusions and recommendations
This chapter comprises a review of Chapters 1 to 5. It provides conclusions and
recommendations derived from the main findings of the study. The limitations and
contributions of the study, as well as suggestions for further research are also discussed
in this chapter.
1.8 CONCLUSION
This chapter encompassed the context and background of the study. In addition, the
chapter identified the research problem in the problem statement, outlined the studies
objectives and research methodology. The chapter concludes with a brief overview of the
chapters that make up the thesis.
The proceeding chapter, Chapter 2, aims to address the first two theoretical objectives
and reviews the literature on mobile gaming and the marketing potential thereof.

13
CHAPTER 2
THE RISE OF MOBILE GAMES AND THEIR MARKETING POTENTIAL
2.1 INTRODUCTION
In accordance with the first two theoretical objectives outlined in Chapter 1, Chapter 2
presents an insight into mobile gaming and its marketing potential. Moreover, this chapter
provides a theoretical background for mobile gaming, which will aid in the discussion of
mobile gaming brands, brand loyalty and antecedents of mobile gaming brand loyalty
amongst Generation Y students, as laid out in Chapter 3.
Since their introduction into the mobile services market nearly a decade ago, mobile
games have continued to grow in popularity and usage each year (Browne & Anand,
2012:1-2). By the end of 2016, mobile games were leading download charts on mobile
application stores, with consumer expenditure exceeding $35 billion worldwide (Statista,
2016a; App Annie, 2016). The dominance of mobile games is evident throughout the
entertainment industry, with revenue trends suggesting that mobile gaming is on track to
overtake traditional video games (Console and Computer video games) as market
leaders (Kar, 2016). Heightened consumer interest coupled with the rapid adoption of
mobile games have greatly increased their marketing potential (Erlichman, 2015). As
such, organisations have spent billions of dollars on in-game advertising to promote their
brands through a mobile technology platform (Amuzo, 2015). This underpins the
importance that mobile games - beyond revenue generation – could have towards
organisations who aim to advertise, promote and/or build their brands.
The purpose of this chapter is to discuss mobile games and the marketing opportunities
they present. As such, Section 2.2 discusses the history and development of mobile
games, whilst Section 2.3 outlines the various mobile gaming business models. The
global performance of mobile games is briefly discussed in Section 2.4. The chapter
concludes with an examination of the marketing potential for mobile games.

14
2.2 MOBILE GAMES
A mobile game is a type of video game that can be played on a hand-held mobile device,
such as a smartphone or a tablet (Jeong & Kim, 2009:186). Mobile games have fast
become the dominant player in the video gaming industry (Granic, Lobel & Engels,
2014:66). Their success can be attributed to the popularity of traditional arcade and
console video games (Waldron, 2014).
Video games can be traced as far back as the early 1960s and 1970s, with games such
as Space Wars and Pong, of which the latter kick-started the video games revolution. The
objective in Pong was to hit a digitalised ball between two rectangular paddles and the
winner was determined when the opposing player or computer missed the ball. Pong was
played on a coin operated arcade machine and became the first commercialised video
game in 1972. The game became wildly popular and its success propelled the video game
industry into what is now known as the mobile game industry, nearly four decades later
(Postigo, 2003:193; Anderson & Bushman, 2001:354; Kent, 2001).
2.2.1 Video gaming history
The popularity of Video games boomed throughout the 1970s and 1980s due to big hits
such as Pong, Pac Man, Donkey Kong and Super Mario Bros. (Kent, 2001). However,
these games were restricted to arcade machines until Nintendo and Sega introduced
home video game entertainment systems into the market (Gallagher & Park, 2002:70).
These video game consoles contained more processing power than that of arcade
machines and allowed for video game developers to create more sophisticated video
games for consumers that could be enjoyed in the comfort of their homes (Granic et al.,
2014:67; Anderson & Bushman, 2001:354). Console video games such as Doom,
Wolfenstein, and Sonic the Hedgehog dominated the market in the early 1990s,
transforming video games into one of the most highly lucrative products in the
entertainment industry during that period (Williams, 2002:43; Kent, 2001). This success
was compounded by the introduction of more sophisticated video game consoles such
as Sony PlayStation and Microsoft Xbox in the late 1990s and early 2000s. Today,
PlayStation and Xbox remain the premium platforms for console video gaming (Lendino,
2015).
15
The success and on-going development of video games has resulted in the emergence
of various types of video gaming categories (Hurst, 2015). These categories include the
traditional “Beat ‘em up” concept games like Tekken and Mortal Kombat, to the more
complex “Puzzler” games like Super Monkey Ball and Columns (Lambie, 2014; Vas,
2013). According to Vince (2018), there are multiple categories and sub-categories into
which video games can be classified. These video game categories are explained in more
detail in the following section.
2.2.2 Video game categories
There are several categories of video games, including sport simulation, adventure, role-
playing and fantasy, puzzlers, platformers, fighting, shooters, and the modern video
gaming category, as discussed in the following sections.
2.2.2.1 Sport simulation
Sport simulation refers to the video game category in which one plays real-world sports
such as football, basketball, rugby, golf, and even racing. These games present
objectives that require the player to progress and level up by mirroring real
athletes/vehicles and their movements, and are often based on popular competitions or
tournaments within that sporting code (Vince, 2018; Hurst, 2015).
2.2.2.2 Adventure, role-playing and fantasy
Adventure, role-playing and fantasy refer to video games that allow players to assume
the role of a character exploring a fictional world with various tasks to complete. Every
decision the player makes affects the game’s storyline and the main character’s narrative.
The difficulty increases as a player progresses in the game and in-game tasks are usually
complemented by complex puzzles or mysteries that need to be solved (Moore, 2016).
2.2.2.3 Puzzlers
Puzzlers are video games that challenge the mind of the player by having them solve
intricate puzzles or complete difficult tasks within the game. The tasks become more
complicated as the game progresses and tests the limits of one’s thinking ability. The best

16
puzzler video games are able to bamboozle players, often leaving them stranded for
hours, and even days, on a particular level (Petite, 2017; Hurst, 2015).
2.2.2.4 Platformers
Platformers are video games that are known for having many buildings/platforms that
need to be climbed in order to progress. These games are strongly influenced by the
discipline of parkour, whereby the controllable character can move rapidly through
environments by running, jumping and climbing (Klappenbach, 2018).
2.2.2.5 Fighting
Fighting video games or Beat ‘Em Ups, refer to one of the more popular video game
categories which usually involve close combat between controllable in-game characters.
Typically, fights take place in a virtual arena and are broken down into multiple rounds,
with each character having his/her own unique skill set or fighting moves (Vas, 2013).
2.2.2.6 Shooters
Shooters refer to video games that use weapons and militaristic settings as part of their
gameplay. Shooters are one of the more successful video gaming categories and are
characterised by frenetic pace and action, particularly first-person shooters (Jensen,
2017). First-person shooters offer a unique gameplay experience for players, whereby
one’s entire TV screen represents an in-game character’s field of vision. As such, players
feel as if they are at the centre of the action and their ability to react with instinctive
precision is constantly tested by the game (Beekman, 2014).
2.2.2.7 Modern day video games
The emergence of Sony PlayStation and Microsoft Xbox allowed video game developers
to create more sophisticated video games, compared to the earlier arcade video games
which were simpler and focused on one main category of gameplay (Minotti, 2015;
Peckham, 2014). The new generation of video games incorporated multiple gaming
categories into their gameplay and required more skill from players wanting to progress
(Griffiths, 1999:210).

17
Grand Theft Auto, a highly successful video game franchise developed by Rockstar
games, is a good example of a modern video game comprising multiple gameplay
categories. In Grand Theft Auto, players are presented with an ‘open-world’ type of
gameplay that allows users to assume the role of a criminal with a variety of missions to
complete, most surrounding crime-related activities. The core gameplay elements of
Grand Theft Auto contain a mixture of the Adventure, Puzzler, Beat ‘em up, Shooters and
Sport simulation categories. By incorporating multiple gaming categories into an open-
world setting, Rockstar games have managed to create a highly profitable and successful
video game franchise that has spanned the past two decades (Klappenbach, 2017). It is
important to note that successful video games like Grand Theft Auto quickly became a
valuable medium for marketers wanting to showcase their brands through realistic brand
placement (Krishan, 2016).
2.2.3 The origin of mobile games
While traditional console video games dominated the video games industry during the
1980s and 1990s, another innovation was introduced into the market called the Nintendo
Game Boy. In 1989, Nintendo Game Boy released the world’s first hand-held, non-colour,
portable console, which operated with batteries and utilised cartridges to play video
games (Greenberg, Sherry, Lachlan, Lucas & Holmstrom, 2010; Rosas, Nussbaum,
Cumsille, Marianov, Correa, Flores, Grau, Lagos, Lopez, Lopez & Rodriguez, 2003:77).
The Nintendo Game Boy was the gateway concept from which “mobile games” ensued,
as video games could now be played ‘on-the-go’. This unique selling proposition, in
conjunction with the success of console video games at the time, made the Nintendo
Game Boy a significant success in the video game market and set the benchmark for
future mobile games (Wong, 2015).
Technological advancements allowed for Nintendo to release the Game Boy Colour in
1998. It was the first hand-held, portable console to display video games in colour and
was even more successful than its predecessor. The Game Boy Colour gave video game
developers the freedom to create more expansive and colourful game worlds that were
not previously seen in mobile games (Villapaz, 2014). As such, mobile games rapidly
integrated into the video games market and were fast becoming a viable alternative to
traditional home console video games (Keating, 2015).

18
It is noteworthy to highlight that the initial success of Nintendo Game Boy can be
attributed to the wildly popular Pokémon series. Pokémon, short for Pocket Monsters,
was originally conceptualised as a video game for Nintendo Game Boy and was released
in 1996 (Falconer, 2014). It is a role-playing video game in which players assume the role
of a Pokémon trainer, whereby they attempt to catch (“catch ‘em all” - the Pokémon catch
phrase) and train various Pokémon creatures for battle against other Pokémon trainers,
with the goal of becoming the ‘Pokémon Gym’ champion in various regions contained
within the game’s world. The video game became an instant sensation, turning Pokémon
into a multibillion dollar franchise. A television anime series was created shortly after the
game’s initial release, which also went on to become a major success (Stuart, 2014;
Shinn, 2004). Pokémon’s popularity continued to grow throughout the 1990s and 2000s,
becoming a powerful entertainment brand. It even led to various spin-offs being created,
such as trading card games, Japanese mangas, movies, musicals, and even theme
parks. As such, Pokémon can be considered as the first successful mobile gaming brand
(IHS Market Insight, 2016; Russel, 2012).
2.2.4 First generation mobile telephones and mobile gaming
Rapid technological advancements in the communications field, around the same period
of the earliest video games, led to the creation of the world’s first hand-held mobile
telephone. In 1973, the telecommunications company, Motorola, created the world’s first
functional prototype of the mobile telephone: The Motorola Dyna TAC. The Motorola Dyna
TAC weighed 1.1kg, measured 228.6mm x 127mm x 44.4mm, and allowed for up to 30
minutes of talk time before needing to be charged for 10 hours. It was a revolutionary
breakthrough that would prove to be paramount for the future of mobile gaming (Deffree,
2018; Goodwin, 2017; Waldron 2014; Alfred, 2008).
After a decade of research and development on the initial prototype, Motorola released
the first commercial telephone called the Motorola Dyna TAC 8000X. The new and
improved Dyna TAC 8000X had a talk-time for up to 30 minutes, with six hours of standby
power and could store around 30 phone numbers in its on-board memory capacity.
However, as was the case with the earliest Nokia telephones that competed with Motorola
in the late 1980s and early 1990s, the average consumer struggled to afford these mobile
telephones. These handsets were priced around $4000 per device (Goodwin, 2017; Fox

19
News, 2013; Seward, 2013). The earliest mobile telephones, the Motorola Dyna TAC
8000X and the Nokia Mobira Cityman 900, are depicted in Figure 2-1.
Figure 2-1: The earliest mobile telephones
Source: Wolpin (2014)
As technology advanced through the years, organisations began placing more emphasis
on improving mobile telephones by their design, portability, and reducing their cost
through economies of scale (Goodwin, 2017). In 1997, Nokia released the more
affordable 6110 mobile telephone that became popular amongst consumers and proved
to be a major success in the telecommunications market (Munoz, 2018). More
importantly, it was the first mobile telephone to have pre-loaded mobile games on the
device, thus becoming the pioneering device for video games on mobile telephones. It
contained one of the most well-known mobile games in telephone game history, ‘Snake’
(Wright, 2016). Snake is a video game where the player manoeuvres a line that grows in
length every time the line swallows a virtual “mouse”, with the line itself being a primary
obstacle (Walton & Palitt, 2012:354).
Another popular and successful mobile game, Tetris, is a puzzler video game that
requires players to manoeuvre and rotate randomly spawned geometric shapes
(containing four square blocks) to fit into one another in order to create a continuous
horizontal line. Thereafter, the line/lines disappear, and the player progresses to another
Motorola DynaTAC 8000X Nokia MobiraCityman 900

20
level; failure to create these lines results in a player having to retry the level due to a loss
of space to manoeuvre any newly spawned shapes (Anthony, 2014: Levy 2014). Both
Snake and Tetris were highly successful games that form part of the first generation of
mobile games. These games are depicted graphically below in Figure 2-2.
Figure 2-2: Snake and Tetris: The first mobile games
Source: Wright (2016)
By 1999, mobile telephone technology continued its technological escalation and saw the
introduction of WAP (Wireless Application Protocol). The Nokia 7110 was the first device
to incorporate this new technology into its operating systems. WAP games could be
downloaded from the web onto a mobile telephone and offered the ability to play
multiplayer games over the internet (Wright, 2016). This created exciting new
opportunities for developers wanting to create more innovative games with greater
interactivity. For example, the ability to play multiplayer games over the internet meant
that players no longer needed to be in the same room, as was the case with infrared-
enabled games such as Snake II. Therefore, multiplayer mobile gaming was open to a
global community for the first time (Crews, 2016; Microsoft Devices Team, 2013).
2.2.5 Second generation mobile telephones and mobile gaming
From 1999 to 2002, mobile games developed steadily, but never made any significant
penetration into the mainstream video games market. The WAP platform became
outdated quickly and could not run advanced fast-paced games. As such, mobile games
Tetris Snake I

21
were restricted to being either simple card-based multiplayer games or board game-
themed, such as Noughts and Crosses (Wright, 2016). The breakthrough came towards
the end of 2002, when Java software was made available for mobile phones. Java is a
platform that provides flash support (a type of multi-media software platform) and greatly
increased the functionality of mobile telephones released from that year onwards
(Lawton, 2002). This meant that developers could now move away from WAP, which was
fast becoming obsolete, and utilise Java to create even better mobile games. This
advancement coincided with the release of mobile telephones, like the Nokia 3510, which
came equipped with a colour screen and more advanced processing capabilities that
could support Java (Mayra, 2015:3).
Well-known video game organisations such as Sega, Namco, and Gameloft began
testing and developing video games solely for mobile phones. Even popular traditional
console video games, like Sega’s Super Monkey Ball and Ubisoft’s Splinter Cell, were
reworked into mobile games and made available for download on mobile telephones with
Java-enabled support (Crews, 2016; Wright, 2016; Langshaw, 2011). Figure 2-3 shows
a snapshot of three popular java-enabled mobile games: Splinter Cell, Super Monkey
Ball, and Bounce which is still played today and is considered a classic.
Splinter Cell Bounce Super Monkey Ball
Figure 2-3: Java-enabled mobile games
Source: Purewal (2011)
Mobile moguls Nokia took notice of the ever-increasing success of mobile gaming and
took the opportunity to capitalise on this growing market. In 2003, Nokia developed and
launched the Nokia “N-Gage”, which was the world’s first mobile phone-based gaming

22
system (Mayra, 2015:3). The Nokia N-Gage is an amalgamation of Nintendo’s Game Boy
and Nokia’s series 60 mobile telephone. The N-Gage was a combination of a successful
mobile video game system and an advanced telecommunications device. Nokia aimed to
take control of the portable video games market whilst remaining at the forefront of the
telecommunications industry (Langshaw, 2011). However, Sony and Nintendo
announced the arrival of two new portable video gaming consoles that would be Nokia’s
direct competition - the Sony PlayStation Portable (PSP) and Nintendo DS. At the time,
Sony was dominating the console video games market with the PlayStation 2 and the
prospect of having a PlayStation ‘in your pocket’ was a unique selling point that could not
be matched by either Nokia or Nintendo (Brachmann, 2014; Schreier, 2011). Therefore,
Nokia’s N-Gage never gained much traction in the market and consumers were drawn
away from mobile games and opted to purchase portable video game consoles instead
(Keane, 2015; Toor, 2014; Patsuris, 2004).
The success of the Sony PSP proved to be a setback for the mobile games industry;
however, developers continued to invest their time and money into the development of
more competitive mobile games (Beaudette, 2011). Between 2003 and 2005,
organisations began testing and developing 3D mobile games on new and improved
mobile telephones – including the Nokia N90, which was one of the earliest mobile
telephones to have a camera. The most significant 3D mobile game released during this
period was Namco’s Ridge Racer 3D (DHCC, 2016). Ridge Racer 3D was a racer-type
video game that was based on the popular Ridge Racer franchise from Sony PlayStation,
and was met with high adoption rates when released on the mobile telephone platform
(Wright, 2016). This success was vital for the mobile game industry as it gave rise to the
possibility that traditional console video game players could make the change-over to
playing mobile games (Langshaw, 2011). Two of the most popular 3D mobile games at
the time, Ridge Racer 3D and Extreme Air Snowboarding, are depicted in Figure 2-4.

23
Namco’s Ridge Racer 3D Extreme Air Snowboarding
Figure 2-4: Popular 3D mobile games: Ridge Racer and Air Snowboarding
Source: Wright (2016)
Despite having 3D capabilities, mobile telephones still lacked the hardware capabilities
needed to run more complex video games in order to compete with console video games.
The breakthrough finally came in 2007 when Apple launched the iPhone; this proved to
be the catalyst for a third generation of mobile games that would go on to dominate the
video games market (Langshaw, 2011).
2.2.6 Third generation mobile telephones and mobile gaming
In 2007, the mobile telecommunications market took a massive stride forward with an
innovation that changed the way consumers perceived mobile phones. This time it was
not Nokia, the company that dominated the mobile telephone market for the past decade,
but Apple Inc., led by innovator Steve Jobs, who introduced the world’s first multi-touch
interface ‘smartphone’ called the Apple iPhone (Chen, 2009; Cusumano, 2008:22). The
iPhone allowed users to “pinch-to-zoom”, while providing physics-based interactivity that
“included inertial scrolling and rubber banding”. The multi-tasking features allowed users
to navigate easily between multiple functions, such as switching from listening to music
to taking a call or accessing the web and then seamlessly reverting back to music.
The iPhone combined all the capabilities of the Apple Mac computer, the music
functionality provided by the Apple iPod, as well as the basic features of a camera-
enabled mobile telephone all in one device (Ritchie, 2017). Apple’s iPhone kick-started a
new generation of ‘smart phones’ which were not just communication devices but also

24
functioned as personal computers with internet connectivity. As such, consumers could
access emails, shop online, participate in social media activities, and gain instant access
to a plethora of information available online (Kim, 2013:42-43). These complex
capabilities stem from advanced operating systems, processing systems, and hardware
components that are embedded into the smartphone (Bhojan, Akhihebbal, Chan & Balan,
2012:21). The original Apple iPhone is depicted in Figure 2-5.
Apple iPhone (2007)
Figure 2-5: The revolutionary multi-touch screen Apple iPhone
Source: Ritchie (2017)
Smartphones were an instant success and experienced high adoption rates amongst
consumers (Canalys, 2010). As such, the sheer size of the growing smartphone-user
market and the advanced capabilities of smartphones made them an ideal platform for a
new era of mobile games (Silva, Hjorth, 2009:603).
Video game developers needed to respond quickly to the rapid changes experienced in
the mobile telecommunications market. The introduction of the revolutionary smartphone
resulted in the dissipation of WAP games and preloaded mobile games (Lescop &
Lescop, 2014:104). As a result, new multi-media platforms were needed for developers
to convey their mobile service applications to consumers. Apple responded to this need
by creating the application or ‘app’ store for iPhones (iOS). Competitors shortly followed
suit with versions of their own such as Google’s Play Store, Samsung’s Galaxy Apps and
LG’s Smart World for Android-enabled smartphones. The iOS app store and Google Play
Store are the two largest app stores available for smartphones (Ranger, 2015; Sims,
2015).

25
An app store is defined as a digital distribution platform containing mobile service
applications created by various developers that can be downloaded by consumers onto
an iOS, Windows, or Android-enabled smartphone (Noyons, Macqueen, Johnstone,
Robertson, Palm, Point &Behrmann, 2012:10). This platform bridges the gap between
developers and consumers by providing an easy and secure way for developers to sell
their applications to smartphone users anywhere in the world, in an instant. Consumers
can purchase these applications by means of electronic payments using application store
vouchers or credit card payments (Liu, Au & Choi, 2014:327; Liu, Au & Choi, 2012:2).
Mobile games truly made an impact in 2009, with the release of Angry Birds (Cheng,
2012:50). Angry Birds is a third-generation mobile game in which a player must catapult
‘angry’ multi-coloured birds at various objects, while exposing and eliminating the green-
coloured pigs who try to steal the birds’ eggs. Progression to the next level is attained by
eliminating all the pigs and obtaining a minimum of a one-star rating out of a possible
three stars (Feijoo, Gomez-Barroso, Aguado & Ramos, 2011:213). Shortly after the
game’s release it became a global success and video gaming sensation. By 2011, Angry
Birds players had amassed over 648 million downloads and had 200 million active
monthly users, this netted over $100 million in revenue for the creators of the game, Rovio
(Cheng, 2012:52; Zibreg, 2012).
Another highly successful mobile game that dominated the market between 2012 and
2017 is Candy Crush Saga, more commonly known as Candy Crush (Chen, 2014:3).
Candy Crush was released in 2012 and is a simple puzzle game that challenges players
to match three or more coloured pieces of candy; once matched, they are removed from
play and replaced with new ones that help create further matches (Filipowicz, 2017). To
pass a level, players are required to complete various challenges, such as obtaining high
scores or eliminating certain candies before time runs out (Jones, 2013). A mere one year
after the game’s release, Candy Crush had approximately 90 million players and
contributed significantly towards a total profit of $560 million for King Games (creator of
Candy Crush) in 2013. The profound success of third-generation mobile games like Angry
Birds and Candy Crush has been attributed to their portability and simplicity, as well as
the rapid adoption rate of smartphones (Jeong & Kim, 2009:290).

26
2.2.7 Types of third generation mobile games
The focus of video gaming organisations quickly shifted into the mobile games market,
with a considerable amount of time and money being invested in mobile game
development. As such, five main mobile gaming categories emerged as unique mobile
games were being released into the market. Each one tapped into one or more of the
advanced capabilities offered in modern day smartphones (Curran & George, 2012:25-
26; Joselli & Clua, 2009:136).
2.2.7.1 Touch-based mobile games
All mobile games or apps require some sort of touch-based input. This can be basic input
such as tapping on the screen to select something, or more complex input such as
swiping fingers across the screen to control movement in a certain direction (Thomas,
2015a).
2.2.7.2 Location-based mobile games
One of the most-used features of a smartphone is the Global Positioning System (GPS).
GPS receiver technology is used to provide the position of your smartphone on a map in
accordance with satellites. This function is used in conjunction with built-in map software
to help people find nearby locations or provide directions to their next destination (Wilson,
2006). Popular mobile games like Geocaching and Ingress use the location of a
smartphone to alter the gameplay in accordance with a player’s movement patterns and
physical location (Avouris & Yiannoutsou, 2012:2120).
2.2.7.3 Voice-controlled mobile games
Advancements in speech technology and speech recognition software coincided with the
release of smartphones. This technology was quickly integrated into smartphones to help
simplify day-to-day tasks, such as allowing people to action tasks or send messages
using their voice (Kilic, 2018). Speech recognition software was also used to create
unique mobile games that require players to “speak” in order to progress (Van der Velde,
2018). These mobile games recognise speech and voice commands and gameplay is
influenced accordingly. Popular games include My Talking Tom Cat and My Talking
Angela, whereby the in-game character can replicate what was said and repeat it back to

27
the player in a different tone of voice (Zyda, Thukral, Ferrans, Engelsma & Hans,
2008:143-144).
2.2.7.4 Augmented-reality mobile games
Augmented-reality (AR) technology uses the camera of a smartphone to project or create
a virtual or ‘augmented’ reality on a phone’s display. An AR mobile game uses real
imagery combined with creative content to create a virtual playing experience (Capin,
Haro, Setlur & Wilkinson, 2006:765-773). For many years, the revolutionary concept of
AR technology was believed to be highly experimental and would not be seen for the
foreseeable future (Bajarin, 2017). This changed in 2016, when Niantic released
Pokémon Go for smartphones. Pokémon Go contained elements of both AR and GPS
technology (See Section 2.2.7.6), and the game’s success proved to be the catalyst in
AR technology for smartphones (Jansen, 2018). One year later, Apple’s AR Kit and
Google’s AR Core were released for developers, which allowed the creation of AR apps
using a streamlined development framework. Since then, the market has been inundated
with innovative AR apps and mobile games that continue to push the boundaries of
smartphones (Stolyar, 2017).
2.2.7.5 Accelerometer-based mobile games
Smartphones are pre-equipped with various motion sensors such as gyroscopes and
accelerometers. Gyroscopes track the rotation or twist of the smartphone, while
accelerometers detect orientation. When combined, these sensors accurately measure
the rate of change in directional movement and orientation of a device (Sundar, 2011).
This allows developers to create immersive apps that detect motion that is
upwards/downwards, left/right, forward/backward, as well as rotational, such as swing or
tilt (Baek, Jang, Park, Kang & Yun, 2006:510). Mobile games that use this technology
detect motion and gestures made by a player, and simulate the input to play the game.
This can include moving around a room to find objects in shooting games, shaking or
tilting the device to cause a change of direction in racing games, or even cast a rod in a
fishing game (Joselli & Clua, 2009:137).

28
2.2.7.6 Pokémon Go and other unique mobile games
As with traditional video games, some mobile games incorporate multiple gameplay
categories to increase the challenge and uniqueness of a gameplay experience (Joselli
& Clua, 2009:137). For example, Temple Run is an ‘endless’ running mobile game that
contains elements of both accelerometer and touch-based gameplay. The aim of the
game is to keep the main character alive by dodging obstacles in his path, while he is on
the run. The longer the main character stays alive, the faster the game becomes and
more points are rewarded to the player (Holt, 2014). The player can dodge oncoming
obstacles such as rocks or branches by swiping the display screen up or down, left or
right. By using the accelerometer, players can also turn corners by tilting their
smartphones in different directions (Kohler, 2012).
Even more complex is Pokémon Go, which many consider to be the pioneer game for
Augmented Reality (Hobbs, 2016). Pokémon Go is a mobile game based on the popular
Pokémon video game series and incorporates elements of Location-based, Camera-
based, Accelerometer-based and Touch-based gameplay into the overall gaming
experience. Players can catch Pokémon that spawn in real world locations and in real
time utilising a smartphones’ GPS for location and camera for AR. Thereafter,
accelerometer- and touch-based controls are used to catch and train Pokémon and battle
other Pokémon trainers at a location designated as a Pokémon Gym (Gilbert, 2016;
Russel, 2012).
A few of the popular third-generation mobile games are depicted below in Figure 2-6.
Angry Birds Candy Crush

29
Temple Run Pokémon Go
Figure 2-6: Third-generation mobile telephone games
Mobile games, like the ones seen above, are being rapidly adopted by smartphone users
due to their unique, simple, and fun gameplay (Hill, 2014).
2.3 MOBILE GAMING BUSINESS MODELS
Most third-generation mobile games, including the ones mentioned above, are available
for consumers to download and play free of charge from the app store. Despite this,
organisations are still able to generate large profits by implementing a freemium business
model (Cassell, 2013). These ‘free of charge’ mobile games mislead consumers into
thinking the entire mobile game is free to play. However, when playing these mobile
games, it is noticeable that certain gameplay elements - even some that are critical for
progression - are locked and require a monetary purchase transaction from players before
becoming available (Nash, 2014). These are known as in-app or in-game purchases. In-
app purchases involve the inexpensive or expensive purchase of virtual goods inside a
mobile game that assist in gameplay progression. Often these virtual goods include the
unlocking of certain missions/levels in order to progress further, or provide players with
gameplay ‘tools’ that can be used during missions/levels to gain an advantage (Moreira
et al., 2014:3). Examples of in-game purchases from Angry Birds and Candy Crush are
depicted in Figure 2-7.

30
Angry Birds 2 ‘Pink Gems’ Candy Crush’s Candy Shop
Figure 2-7: In-game purchases from Angry Birds 2 and Candy Crush
Figure 2-7 shows in-game items that boost a player’s progression in Angry Birds and
Candy Crush which can range in price from a relatively inexpensive amount of R6.99, to
an amount up to R149.99.
The freemium business model has become common practice in the mobile games
industry. It has been implemented by organisations wanting to generate revenue even if
a mobile game is free to play (Schoger, 2014). This has led to three distinct kinds of
mobile gaming apps, namely Free-to-play, Pay-to-play and Paymium apps.
2.3.1 Free-to-play
Free-to-play apps give consumers a chance to experience the app without having to pay
an initial fee to download it. More often than not, these apps have limited functionality and
provide users with only a partial experience, with additional features becoming available
through an in-app purchase or micro-transaction (Nations, 2017). Free-to-play mobile
games will initially experience mass exposure to a multitude of first-time players.
Thereafter, those who enjoy the game may be required to purchase in-game items to help
speed up progression or improve overall experience. As seen in Figure 2-8, these

31
purchases range anything from inexpensive (R6.99) to expensive (R149.99), in some
cases mobile games can require purchases exceeding that of R149.99 (Hall-Stigerts,
2013).
Another technique used to generate revenue from free-to-play games involves the
insertion of interactive pop-up advertisements. This marketing technique known as pop-
up advertising contains promotional information about a brand in the form of a ‘pop-up’
window (Boone, Secci & Gallant, 2010:244). These small windows are placed at the top
or bottom of the screen while the user is playing a mobile game. The earliest free-to-play
mobile games were notoriously inundated with pop-up advertisements, which, in turn,
negatively affected the overall playing experience (King Jnr, 2016). However, this was
the only way developers could generate revenue from free-to-play games aside from in-
game purchases (Truong & Simmons, 2010:241).
In recent times, free-to-play mobile games have experienced a backlash from non-paying
players due to their perceived “pay-to-win” systems. Developers have responded by
introducing restrictions which include preventing players from using purchased items in
certain missions or in matches between players. These restrictions help balance the
gameplay for both paying and non-paying players (Torres, 2014).
2.3.2 Pay-to-play
In contrast to free-to-play, pay-to-play apps offer the full experience without restrictions
for a once-off fee. The pay-to-play mobile game model is very similar to traditional console
video games, whereby the mobile game in its entirety is available to play after one makes
a purchase. These mobile games are devoid of obtrusive in-game advertising and/or in-
app purchases (Dredge, 2014). Although the model is preferred by traditional video game
players, it is rarely implemented by developers as it fails to attract casual players and only
generates short-term revenue (Thomas, 2015b).
2.3.3 Paymium apps
Paymium apps characteristically adopt elements of both free-to-play and pay-to-play. An
initial purchase is needed to download the app, with further in-app purchases required to
further enrich the overall experience. This allows developers to not only generate revenue
32
from an initial download, but continually generate money over the lifetime of the app
(Torres, 2014). Paymium mobile games usually require a small fee to download and have
additional elements and items that are only available through in-game purchases. These
mobile games will generate money even after the initial purchase, thus increasing their
longevity in the market (Lovell, 2011).
2.3.4 Reasons to choose a freemium model
Freemium models have become the best way for organisations to earn profits via internet
and digital-based content (Wagner, Benlian & Hess, 2014:260). When comparing the
three models used in mobile games, free-to-play remains the most popular, contributing
more than 90 percent of all revenue generated. Free-to-play mobile games are also
popular because of their ability to attract a multitude of casual and serious players, who
can freely play the game without being forced to pay upfront (Davidovici-Nora, 2014:83;
Lescop & Lescop, 2014:104). Research by Liu et al. (2012:13) into freemium apps
revealed that free-to-play titles are vitally important for increasing app awareness and
developing player retention, which can lead to increased sales revenue. Furthermore, the
study found that a positive free-to-play gaming experience will likely influence a player to
consider purchasing the pay-to-play or paymium version of that game.
Freemium models also have the ability to convert casual trial users into consumers who
are comfortable in making in-app purchases. In most cases, these games present a risk-
free scenario for first time players who do not have to make a monetary commitment to
play the game (Kumar, 2014). Players who enjoy the game and are ‘sold’ by the
experience are often presented with a ‘limited time only’ offer to purchase the game at a
discounted price (Sukhraj, 2017). Alternatively, they are only given access to a portion of
the game with the rest being locked behind an in-game purchase. Often the fear of loss
or missing out will compel these players to buy the full version or purchase an in-game
item. This segment of video game players often becomes brand loyal and are very
valuable to organisations (discussed in Chapter 3) (Teng, 2013:884).

33
2.3.5 The influence of brand loyalty theory and flow theory on mobile
gaming business models
Understanding consumer behaviour is an important part of any business strategy. As with
the freemium business model, the success is reliant on a consumers’ initial reaction and
acceptance of the ‘technology’ (Jung et al., 2008:124). Mobile games, as a form of mobile
service, is created for entertainment purposes and the most popular games have been
developed into major brands (See Chapter 3, Section 3.2.1). Therefore, it is prudent to
consider both brand loyalty and theory flow theory to predict consumer adoption and
loyalty behaviour towards mobile gaming (Alzahrani, Mahmud, Ramayah, Alfarraj &
Alalwan, 2017:242; Chang, 2013:311; Teng, 2013: 884; Van Looy et al., 2010:127; Choi,
2004:13).
Brand loyalty, as a central concept of brand equity theory, is a major asset to any
organisation and is the driving force behind creating brand value (Choi, 2013:54; Severi
& Ling, 2013:128). This places the brand at the forefront of consumers’ minds and greatly
influences their intention to continually purchase a product or service offered by their
favourite brand (Javadein, Khanlari & Estiri, 2008:4). Furthermore, flow theory posits that
the quality of an experience is determined by the challenges imposed and the skills
required to overcome the predetermined challenges (Jung et al., 2009:124). When
individuals overcome these challenges, master’s new skills, and becomes cognitively
absorbed in the experience, they achieve a state flow. Flow theory is often integrated into
studies focusing on mobile services created to illicit fun and enjoyment, much like mobile
games (Zhou & Lu, 2011: 883-884; Zaman, Anandarajan & Dai, 2010:1011). As brand
loyalty theory and flow theory underpins the current study, it is discussed in further detail
in Chapter 3.
2.4 GLOBAL PERFORMANCE OF MOBILE GAMES
Today, there are over 1.2 billion people playing mobile games worldwide, which is more
than an eighth of the earth’s total population. In the United States of America, the average
lifetime spend per user is approximately $42, with the overall mobile gaming revenue
surpassing $4.7 billion (Statista, 2017b; Worldometers, 2017). Importantly, mobile
phones have become more affordable and accessible over the past few years, which has

34
led to a more balanced demographic of consumers playing mobile games (Bezerra,
2015). As such, the number of males (51%) and females (49%) playing mobile games
were almost equal in 2017. Also, the rapid rise and growth of mobile games is attributed
to more casual gamers being attracted to mobile games as opposed to traditional video
games, with hardcore gamers also making the switch due to the accessibility and
popularity thereof (Mediakix, 2017; Nielsen Entertainment, 2016). Total global revenue
generated from mobile games was estimated at $46.1 billion at the end of 2017 (Newzoo,
2017).
2.4.1 Mobile games in South Africa
Mobile games have been available on worldwide app stores since 2007. Despite this,
they have only been available for download in South Africa since 2010, with iOS games
only becoming officially available in 2013. The delay was attributed to strict government
regulations and policy constraints regarding online content distribution. Initially, South
African consumers accessed mobile games on Android-enabled smartphones by
downloading them illegally from mirror sites, while on Apple smartphones they were
downloaded by logging onto the American app store with false address information.
However, not all consumers had the time or the technical know-how to go through these
processes. As such, most consumers had to wait until the Film and Publications Board
(FPB) released new policies allowing mobile games to be launched on South African app
stores (Vermeulen, 2013a, Vermeulen 2013b, Vermeulen, 2012; Vermeulen, 2011).
The impact of mobile games was immediately noticeable in the local entertainment sector.
Within a span of two years, mobile gaming accounted for 32 percent of the South African
local video game market and was projected to continue to grow at an annual growth rate
of 56 percent (PwC, 2013). At the end of 2015, PwC (2015) reported that mobile games
had surpassed traditional console games in terms of revenue generated and market
share in South Africa. The same report also revealed that Clash of Clans and Candy
Crush topped the download charts - with nine of the top ten downloaded apps for that
year being mobile games.
According to a report published by Statista (2018a), local mobile gaming revenue totalled
half a billion rand in 2018, revealing that mobile gaming revenue has increased at over

35
25 percent year-on-year between 2013 and 2018. In addition, revenue generated from
mobile games overtook traditional video games (both PC and Console video games
combined) in South Africa – a trend which is being experienced globally. Mcilhone (2015)
states that the rapid dissemination of smartphones amongst the South African population
along with the low-cost simplicity and accessibility of mobile games are the keys to their
overwhelming success in the local market.
From a developer’s point of view, South Africa was officially put on the map during June
2018 when teenager Brandon Kynoch released his new mobile game called Torus (Bratt,
2018). Points are accumulated by connecting dots to progress, and the player loses when
he/she misses a dot (Oberholzer, 2018). The mobile game became an instant hit, and
was downloaded over 100 000 times within 24 hours of going live on the app store. Torus
made it as the ‘app of the day’ and was wildly popular among gamers (Timeslive, 2018).
As with Angry Birds and Candy Crush, Torus is known for its simple yet addictive
gameplay that has only one objective for players: to score as many points as possible.
2.4.2 Policy barriers that mobile game development faces in the South
African context
South Africa is experiencing a loss in the video games economy, with an estimated 99
percent of mobile gaming revenue generated from local consumers being distributed to
international video game developers (Fripp, 2016). Consequently, the half a billion-rand
revenue is not directly benefitting the local economy of South Africa. A major contributing
factor to this stems from the regulatory policies which are restricting the creative freedom
of video game developers. This makes it difficult for potential investors to invest in the
South African local video game industry (News24 Wire, 2016).
Alfreds (2016) states that the FPB’s draft bill on content distribution continues to be a
major barrier for developers and investors alike. The bill states that video game content
must be classified correctly and approved by FPB before distribution, and failing to do so
may lead to a jail sentence. The process can be time-consuming and costly, while the jail
sentence for non-compliance is a great concern for local video game developers.
The significance of this policy constraint presents a needless barrier when compared to
other countries that do not have rigid regulations in place for content classification. In

36
contrast to the South African context, international video game developers are free to
create and distribute video games without incurring high costs or waiting extended
periods of time for approval (Alfreds, 2016; News24 Wire, 2016). The general perception
of local organisations is that government lacks both knowledge and understanding of the
video game industry and its ever-growing importance in the economy, which is why there
are inadequate or obsolete policies in place (Alfreds, 2016; Usmani, 2016). Research into
the significance of video games and mobile games in the South African context is vital to
bring awareness to the South African government on how the video game industry can
benefit the local economy (Oxford, 2014).
The following section provides an in-depth look at the marketing potential of mobile
games.
2.5 MARKETING POTENTIAL OF MOBILE GAMES
The success and vast reach of mobile games has greatly increased their marketing
potential (Amuzo, 2015). As such, organisations have been exploring ways in which to
leverage the success of mobile games to promote and grow their brands (Lawlor, 2015).
There are various marketing opportunities presented by mobile games, with many already
being successfully practiced. These include merchandising, films and TV series, product
placement, and Augmented Reality.
2.5.1 Branded merchandising
Merchandising refers to the activity of promoting and selling products in a visually
appealing manner, within a retail environment, to entice customers to purchase those
items (Kotler & Armstrong, 2018:392). Branded merchandise aims to authentically include
an image, logo, or company name on promotional materials; for example, caps, t-shirts,
bags, pens, or any other material capable of showcasing a brand in an appealing manner
(England, 2015).
Following the success of Angry Birds, Rovio implemented branded merchandising to
further develop and grow the Angry Birds brand. This included releasing a line of Hasbro
toys, various clothing items, accessories, books, and board games (Ciabai, 2017;
Greene, 2015; Cheshire, 2011). This formula was followed by other popular games such

37
as Candy Crush and Clash of Cans, and led to major co-branding deals such as the one
between Angry Birds and Star Wars. This marketing technique is discussed further in
Section 3.2.1.4.
2.5.2 Films and television series
The past two decades has seen popular video games being developed into films and/or
TV series to further assert their success and expand their respective brands in the retail
world. Franchises such as Warcraft, Tomb Raider, Prince of Persia, and Resident Evil
have experienced great success when these games were introduced into the film
industry. The result has seen these brands gross millions of dollars in revenue through
loyal gaming fans (Mertes, 2018).
Notably, mobile games have not been adapted to film as often as traditional video games.
However, Pokémon is a prime example of a mobile gaming franchise having
accomplished this feat during the late 1990s and early 2000s, with the Pokémon Anime
TV series and films (Falconer, 2014). The anime TV series is often considered one of the
most successful adaptions of a video game, as it has been airing on TV for the past 20
years (Bailey, 2016). Another noteworthy mention is Rovio and the Angry Birds franchise,
with the Angry Birds Toons TV series and the Angry Birds movie, both experiencing
massive success and critical acclaim. In particular, the Angry Birds movie grossed $349
million worldwide from movie ticket sales, making it the second highest-grossing video
game movie of all-time (McNary, 2017).
2.5.3 Product placement
Product placement or in-game advertising is commonly used in video games as it has the
ability to promote brand recall and brand recognition months after a video game has been
played (Hang, 2014:193). For mobile games, product placement often comes in the form
of pop-up advertisements which generally leads to negative responses from gamers
(Lewis & Porter, 2010:55). However, there are different strategies that companies could
implement; for example, Honda avoided the use of pop-up ads by collaborating with
Zynga in 2013 to promote the new Honda Accord motor vehicle. Zynga included words
related to the vehicle in their popular Scrabble With Friends mobile game. This strategy

38
was further reinforced by rewarding players with in-game tokens whenever they found
words such as ‘accord’, ‘luxury’, and ‘new’ (Erik, 2017).
A study conducted by Lin (2015:37) revealed that gamers respond positively to high-
familiarity brands showcased as an integral part of a game, as opposed to low-familiarity
brands that are simply added to the background during gameplay. This was observed in
the success of the Angry Birds Star Wars spin-off mobile game. The game included Star
Wars product placement and went a step further by adapting the Angry Birds storyline
and gameplay and aligning it with the Star Wars films. Angry Birds Star Wars proved to
be a massive hit in 2012; it was downloaded over 100 million times in under a year
(McCorvey, 2013; Dredge, 2012; McCorvey, 2012).
2.5.4 Augmented reality
Augmented reality (AR) is artificially and/or digitally altering one’s current reality in order
to induce a particular experience. Using GPS or an advanced camera, a person’s reality
can be ‘augmented’ by virtual objects that are combined with a real landscape. Simply
put, computer-generated AR graphics can change or enhance someone’s entire
experience of a location or environment (Taş, 2017; Vise, 2017). AR presents exciting
new opportunities for marketers within the mobile marketing landscape, where
consumers are able to interact more freely with marketing content. This leads to increased
brand awareness and promotes brand recall, as consumers who engage directly with a
brand tend to be more receptive to that brand’s promotional content (Dajee, 2017). More
importantly, interactive marketing of this nature allows consumers to have a more
personal connection to a brand, while creating a fun and enjoyable experience (Levski,
2017; Olilla, 2017).
Examples of AR marketing is evident in games such as Pokémon Go and Ingress from
Niantic or Jurassic World™ Alive from Ludia Games, whereby real-world locations, such
as shopping centres and fast-food restaurants, are used alongside in-game elements
(Section 2.2.5.6). These games create vast amounts of foot traffic at or nearby business
locations (Gilbert, 2016). For example, McDonald’s Japan paid Niantic millions of dollars
(approximately $900 000 per day) to have all 3 000 of their local Japanese restaurants
become the location for Pokémon Gyms (Constine, 2017). The influx of Japanese players

39
to various McDonald’s restaurants to battle for control of these Pokémon Gyms led to a
major increase in food sales, as players consumed food and drinks while playing the
game (Russel, 2016; Smith 2016; Soble, 2016; Vizard, 2016).
A market analysis conducted by Reuters (2018) predicts that the AR mobile gaming
market could reach $285 billion by the end of 2023. Furthermore, Statista (2017c)
forecasts that global advertising expenditure in mobile games will reach $50 billion by
2020, which is a massive 42 percent increase on advertising and promotion expenditure
at the end of 2015. This is attributed to organisations recognising the value and potential
of mobile games as a medium to market their respective brands.
2.6 CONCLUSION
Despite their relatively short life-span in the market, mobile games have become the
leading video game platform in South Africa. This has been experienced in international
markets, where global expenditure on mobile games has exceeded $46 billion. The
increasing accessibility, affordability and rapid adoption of smartphones is a major
contributing factor to the success of mobile games. The prevalence of mobile gaming is
such that one in every eight people on the planet are currently playing at least one mobile
game, with an almost equal constitution of male and female players. The popularity and
sheer reach of mobile games has made them a valuable marketing medium for
organisations that wish to promote their brands on a mobile technology platform.
Forecasts suggest that advertising expenditure in mobile games will reach $50 billion by
2020. As such, mobile games are extremely lucrative products to the developers who
create them, and are an important marketing medium for organisations wishing to
promote their products and services through a social technology platform.
In Chapter 3, branding, brand loyalty and mobile gaming brands and are extensively
discussed in order to propose a model of the antecedents of mobile gaming brand loyalty
amongst Generation Y students. Chapter 3 also includes an in-depth review of the
Generation Y cohort, their characteristics, and their importance to marketers within the
mobile gaming landscape.

40
CHAPTER 3
ANTECEDENTS OF MOBILE GAMING BRAND LOYALTY
AND THE GENERATION Y COHORT
3.1 INTRODUCTION
Chapter 2 addressed the first and second theoretical objectives set out in Chapter 1.
Wherein the chapter provided a theoretical background explaining mobile games and
acted as a precursor towards the antecedents of brand loyalty and the Generation Y
cohort. Therefore, Chapter 3 addresses theoretical objectives three to nine outlined for
this study.
The ability to build and maintain a strong brand is crucial to the long-term success of an
organisation (Iacobucci, 2013:78). Brand management has become an important
marketing strategy for organisations seeking to differentiate themselves in saturated
markets, where new start-ups and innovations lead to an increased level of competition
on a daily basis (Hsiao & Chen, 2016:18). In addition, an interconnected online society
results in savvy consumers that are quick to dismiss false advertising and/or inadequate
products and services. As such, managing and developing a strong and trustworthy brand
is vital for any organisation (Nisar & Whitehead, 2016:743). A strong brand attracts loyal
consumers who are known to be less price sensitive and who are not easily persuaded
by competition (Nam, Ekinci & Whyatt, 2011:1009). Ultimately, the goal of building a
strong brand is to foster authentic brand loyalty, whereby consumers prefer to consume
products and services related to one brand (Clow & Baack, 2014:52-52). The same holds
true for mobile gaming brands, as game developers spend large amounts of money (often
millions) on marketing programmes aimed at attracting and retaining brand loyal
players/consumers (Teng, 2013:884).
In accordance with Chapter 1, the purpose of this study was to propose and empirically
test a model of factors that determine mobile gaming brand loyalty amongst Generation
Y students in the South African context. Section 3.2 describes the importance of brands
and outlines various brand strategies, while Section 3.3 provides an in-depth discussion
of brand equity and brand loyalty, as well as brand loyalty in mobile gaming. Thereafter,

41
Section 3.4 discusses the antecedents of mobile gaming brand loyalty and Section 3.5
outlines the literature on the Generational Y cohort. The chapter concludes by proposing
a model of antecedents of mobile gaming brand loyalty amongst Generation Y students,
in Section 3.6.
3.2 THE IMPORTANCE OF A BRAND
A brand is built around an associative name, logo, design or symbol attached to a product
or service that clearly differentiates itself from other products within the same category
(Nisar & Whitehead, 2016:743; Schiffman et al., 2014:7; Chaudhuri & Holbrook, 2001:81).
Successful brands create a perception of quality and value through unique features,
attributes and benefits that appeal to a particular target market. If conveyed correctly by
an organisation, these qualities create a distinct association with the brand and places it
at the forefront of consumers’ minds during the purchasing phase (Schiffman et al.,
2014:9; Jang, Ko & Koh, 2007:1). Essentially, a brand is more than just a product or
service, it is an organisation’s promise to consistently deliver on unique offerings in terms
of features and benefits. The ability to uphold this promise is crucial for organisations
wishing to establish a strong bond between brand and consumer, which ultimately leads
to enhanced brand loyalty and profitability (Hudson, Huang, Roth & Madden, 2016:28).
Modern-day society is technologically driven; new start-ups and new innovations flood
the market on a daily basis. This has created barriers for organisations to effectively
differentiate their product offerings (Hsiao & Chen, 2016:18). In a similar vein, consumers
are well-informed and have access to a plethora of information over products and services
and are quick to dismiss false advertising (Nisar & Whitehead, 2016:743). Therefore,
building a strong trustworthy brand is imperative for any organisation to become
successful in today’s saturated markets. This attracts loyal consumers who are known to
be less price sensitive and who are not easily persuaded by competition (Nam, et al.,
2011:1009). For example, like many other organisations, Apple Inc. has spent billions of
dollars to persuade consumers to become emotionally attached to their brand (Wijaya,
2013:55). The Apple brand is associated with luxury and invokes a sense of quality,
innovation and elegance. This perception has attracted millions of loyal consumers and
was developed through an umbrella branding approach, which continually delivers
excellent product functionality and quality through all of Apple’s product categories

42
(Montgomerie & Roscoe, 2013:290). The approach taken by Apple is one of many
branding strategies available to organisations. It is vital that organisations adopt an
appropriate branding approach into their overall marketing strategy. This will allow
organisations to determine how brand equity will be measured as well as how their brand
will stand out from that of competitors (Clow & Baack, 2014:48-49).
3.2.1 Brand strategies adopted in mobile gaming
Global mobile gaming revenue is expected to make up a staggering 76 percent of the
expected $92.1 billion mobile app revenue in 2018 (Taylor, 2018). Moreover, mobile
gaming has a 42 percent share of the entire video gaming market and will represent more
than half of the total games market by 2020 (Brightman, 2017; McDonald, 2017). At the
forefront of their success are the ‘big’ mobile gaming brands that lead the video games
market; namely, Angry Birds (Rovio Entertainment), Candy Crush (King), Clash of Clans
(Supercell), Pokémon Go (Niantic), Mobile Strike (Common Sense Media), and Toon
Blast (Peak Games) (Statista, 2018b).
Each of these brands have followed a distinct branding blueprint utilising various
marketing strategies. These techniques and examples of their implementation are
outlined below.
3.2.1.1 Social media marketing and online brand communities
Understanding the sociology of consumers can help marketers identify what makes them
loyal amongst themselves and towards a brand (Iacobucci, 2013:173). Consumers
identify with certain communities due to the cognitive significance of being associated
with or adopted into a social entity (So, King, Sparks and Wang, 2013:7). Social media
networks have made it possible for consumers to belong to certain groups without being
physically present, while making it easier for people to build relationships and connect
with one another. Social media comprises user-generated content, social networking
sites, virtual game worlds, online review sites, video sharing platforms, and online
communities (Bolton et al., 2013:255). Marketers incorporate social media into their
integrated marketing communications strategy due to its social and human-driven
element. Social media provides a platform for instant, open dialogue between consumers

43
and a brand. Thus, eliminating one-way communication (monologue) that is prevalent
through more traditional media channels (Hoffman & Fodor, 2010:41-43).
The creators of the popular Clash of Clans mobile game, Supercell, follow their own
distinct social media branding strategy. The key ingredient to their strategy is a focus on
the players rather than the game itself (Yeoman, 2016). The gameplay mechanics of
Clash of Clans requires players to build war bases and train armies to battle against other
players. An important element is the inclusion of social ‘clans’ that are made up of players
from around the world, with these clans battling each other in ‘clan wars’ (Desmond,
2017). The ‘social’ element is most likely the biggest success factor for Clash of Clans
and has successfully attracted millions of players. Supercell encourage players to share
their gameplay experiences and tips on the Clash of Clans official website. This creates
a plethora of user-generated content that Supercell push through social media platforms
such as Facebook, Instagram, and YouTube. As such, a highly interactive connection is
formed between players and the Clash of Clans brand (Suckley, 2017; Tanasoiu, 2017).
Supercell have also made use of YouTube successfully to grow the Clash of Clans brand.
Supercell hand pick players who have gained a large following on their YouTube
channels. These players are likely to have a significant influence over other their fellow
players (Orlanski, 2015). Thereafter, the chosen players are given access to new Clash
of Clans gaming content before it is officially released to the general public. In turn, they
are required to create and share videos of their experience for other players to view and
comment on, which creates anticipation and hype in the Clash of Clans community
(Ernest, 2016). This is further compounded by Supercell’s cross-platform marketing
approach, whereby additional ‘snippets’ or previews of new content is also promoted on
Facebook and the Clash of Clans website (Yeoman, 2016). Another unique approach
followed in some of their commercials is to incorporate the real life ‘stories’ or gameplay
moments of players that have been shared on the official website. This shows how
Supercell value the input and engagement of the Clash of Clans community. Jang et al.
(2007:1) state that the establishment of a brand community greatly contributes to long-
term success as it allows consumers to express themselves through the brand and builds
a strong emotional attachment.

44
The fun of playing Clash of Clans with/against friends, coupled with the level of brand
engagement and interactivity, is crucial to the success of the Clash of Clans mobile game
(Riolfi, 2016). Importantly, players who can socially identify with the brand will display
higher levels of loyalty and may be driven to obtain high scores, progress rapidly, and
gather in-game symbols of success which, in turn, may lead players to share their game
experience with their friends and family online (Moon, Hossain, Sanders, Garrity & Jo,
2013:6; Van Looy et al., 2012:132). According to TMD (2017), Supercell spend
approximately $1 million per day on marketing Clash of Clans and return over $5 million
in revenue during that same period.
3.2.1.2 Psychological marketing techniques
It is not uncommon for marketers to utilise psychological marketing techniques to
influence consumer behaviour (Miller, 2014). These techniques evoke emotional
responses and stem from advertising that promotes emotion, exclusivity, fear, scarcity,
uncertainty and even doubt (Rosenthal, 2014). Marketing of this nature often causes
consumers to stop and rethink their current behavioural patterns.
Candy Crush (King Games) is most likely the largest proponent of using psychological
techniques. This has led many of its users to become known as ‘crush-a-holics’:
consumers who are addicted to playing the game (Dooley, 2013). The game itself has
simple graphics and basic gameplay elements and is available as a free-to-play title. As
a player completes a level the difficulty increases slightly, but the ‘lives’ and ‘moves’ are
limited and only replenish after a certain period of time (Brockes, 2014). Once the moves
are finished or the player’s lives are up, the game prompts the player to buy more moves
or lives through in-game purchases. Scarcity is a popular psychological marketing
technique that leads to increased desire to react. This gameplay mechanic has led
millions of users to constantly want more, even if it means making in-game purchases
(Miller, 2014; Baruchin, 2013).
During 2016, Candy Crush had over 93 million active players, with the average player
spending a total of $25 on in-game purchases; this equates to approximately R260
(Pahwa, 2016). This statistic is made more significant by the fact that Candy Crush is free
to download. From a psychological perspective, consumers are known to react positively

45
to items that are free (Dooley, 2008). Thus, Candy Crush uses a freemium business
strategy alongside scarcity to entice crush-a-holic players to make in-game purchases
(Pahwa, 2018). The players who become crush-a-holics are encouraged to be product
champions who promote the game to their friends and family members through social
media. They are also contacted to provide feedback on how to improve the overall Candy
Crush experience (Digital Eye Media, 2017). These factors build and maintain the
‘likability’ of the Candy Crush brand. It also generates a perception of ‘social proof’
(wherein people’s actions are deemed appropriate due to the actions of others), which
leads to a positive perception toward the brand. Both likability and social proof are
components of psychological marketing (Bhashin, 2017).
3.2.1.3 Celebrity endorsements
Celebrity endorsements feature a popular public figure who acts as a spokesperson or
‘influencer’ on behalf of a brand. Endorsements of this nature are a powerful marketing
tool, as celebrities are recognised by consumers all over the world (Money, Shimp &
Shakano, 2006:882). For this reason, marketers must ensure that an endorser personifies
and complements their brand, thus transferring the celebrity’s existing credibility over to
the brand (Spry, Pappu & Cornwell, 2011:885). It is also important that the celebrity who
is used to endorse the brand has positive associations linked to their personal brand. This
will lead to an “affect transfer” or “association transfer” (Iacobucci, 2013:152). However,
a brand’s image can be tarnished if the celebrity endorser is perceived negatively in
society. As such, extensive marketing research is required to select a celebrity who best
fits the desired image portrayed by the brand (Bush, Martin & Bush, 2004:110-111).
The Clash of Clans brand is widely-known for creating quirky TV commercials and video
advertisements based off popular in-game characters. These commercials are used to
promote new content and have featured popular celebrity actors like Liam Neeson and
Christoph Waltz (Tanasoiu, 2017). The advert that featured Liam Neeson proved to be a
great success and was selected as the top trending gaming video of 2015. Supercell
spent an estimated $9 million to have the commercial aired at the 2015 America Super
Bowl and it has over 165 million views on YouTube as of 2018 (Dredge, 2015).

46
A similar strategy was employed in the game, Mobile Strike (Epic Games). Arnold
Schwarzenegger, famous for his role as The Terminator, was used to endorse Mobile
Strike in a commercial at the 2015 America Super Bowl. The advert boosted awareness
around the Mobile Strike brand, helping it become one of the top grossing mobile games
in 2015 (Grubb, 2017).
In a unique approach to celebrity endorsement, Peak Games kick-started the “first ever”
celebrity-driven performance marketing campaign in 2018 (Bennet, 2018). The campaign
utilised one of the most recognisable actors of Hollywood, Ryan Reynolds, as a brand
ambassador. The campaign involved releasing 30 different video commercials
simultaneously which were assessed within a 24-hour period by Peak Games (Lopez,
2018). Thereafter, the videos which proved most popular amongst audiences were
shown. This created a highly focused campaign with video content that is almost perfectly
matched with the target audiences’ preferences (Diaz, 2018). According to the Director
of Strategy at Peak Games, Ryan Reynolds was selected because of his celebrity status
and signature humour, which were believed to make the Toon Blast brand more relatable
to consumers. The advertisements centre around Ryan Reynold being a famous movie
star who cannot focus on his job, as he is distracted by the addictive nature of Toon Blasts
gameplay (Zanger, 2018).
It is evident that celebrity endorsements are a popular marketing technique for mobile
games wanting to raise brand awareness and enhance their brand image. However,
celebrity endorsements should not be viewed as a singular marketing mechanism that
leads to instant success. Instead, Lazarevic (2012:45) states that marketers need to be
able to successfully integrate branding, marketing communications, and celebrity
endorsements in order to convince individuals to become more brand loyal.
3.2.1.4 Co-branding
Co-branding involves the strategic coming together of multiple brands to promote a
singular product or service. This is also referred to as dual branding and is undertaken
with the aim of leveraging the equity of the existing brands to enhance a new brand’s
reputation (Kotler, 2000:194). According to Clow and Baack (2014:50), co-branding can

47
be divided into three forms: ingredient branding, cooperative branding, and
complementary branding.
Ingredient branding involves a secondary brand being used to add value to an already
existing ‘primary brand’. Iacobucci (2013:85) states that the secondary brand does not
overshadow the primary brand but merely complements it. For example, when a car
manufacturer, like BMW, recommends only using Bridgestone tyres for performance
purposes or only Brembo brake callipers should be fitted for quality purposes (Maverick,
2017). However, ingredient branding is not common in mobile games.
Cooperative branding is the strategic alliance between two or more brands, where the
brands are equally represented in a new product or service (Kotler & Armstrong,
2017:269). A good business case involving successful cooperative branding for mobile
gaming took place during 2012 and 2014: Rovio (creators of Angry Birds) announced it
had successfully secured a co-branding deal with one of the biggest franchises in the
world, Star Wars (from LucasFilm) (Gaudiosi, 2012). Together, LucasFilm and Rovio
created a mobile game that incorporated characters and story elements of Star Wars and
combined it with the gameplay elements of Angry Birds, which was aptly called Angry
Birds Star Wars (Dredge, 2012). It proved to be a massive hit with both Angry Birds and
Star Wars fans and was downloaded over 100 million times in under a year. This led to a
sequel being released less than a year later: Angry Birds Star Wars II. The profound
success and popularity of Angry Birds Star Wars led to the unveiling of an “Angry Birds
Space Encounter” by NASA (National Aeronautics and Space Administration). It was an
interactive space-themed park located at the Kennedy Space Center Visitor Complex and
was created to promote the release of Angry Birds Star Wars II (McCorvey, 2013;
McCorvey, 2012).
Lastly, complimentary branding is when two or more brands combine to promote co-
consumption or co-purchase of their product and/or services (Clow & Baack, 2014:50). In
2016, Pokémon Go teamed up with McDonald’s on a global scale. McDonald’s Japan
paid Niantic (creators of Pokémon Go) millions of dollars to have all 3 000 of their local
Japanese restaurants become ‘Pokémon Gyms’, thus encouraging players to play the
game at their restaurants. This proved to be a major success, as the influx of Japanese
players to various McDonald’s restaurants led to a major increase in food sales, as

48
players consumed food and drinks while playing (Russel, 2016; Smith 2016; Soble, 2016;
Vizard, 2016).
3.2.1.5 Brand extension
Robust branding creates opportunities for organisations to grow current offerings by
introducing new products and services. This is a common marketing strategy known as
brand or product extension (Clow & Baack, 2014:49). Brand extensions rely on an
organisation’s ability to clearly convey information to consumers about new products. This
information must include an offer of quality assurance and the promise of distinctive status
in line with the existing brand (Iacobucci, 2013:83). Effectively communicating this will
reduce advertising costs and increase sales, whilst lowering consumer risk. The
consumer decision-making process is also made easier, as consumers already know
what to expect from the product offering (Baig, Zia-Ur-Rehman, Saud, Javed, Aslam &
Shafique, 2015:2). Moreover, consumers with no prior experience with the parent brand
may be persuaded to switch brands if they have a positive experience with an extension
product. There are two forms of brand extensions, namely, line extensions or category
extensions (Riley, Pina & Bravo, 2015:2).
The strategy employed by Rovio was to create various spin-off games and sequels that
allowed the Angry Birds brand to grow and reach various markets outside of mobile
gaming (Gunelius, 2017). Rovio implemented a category extension approach when
transforming Angry Birds beyond an ordinary mobile game by leveraging its popularity
and success and extending the Angry Birds offering over into other markets (Darabiha,
2016). It was re-released as a computer and console video game and entered the
traditional video game market. Thereafter, it entered the film market as a cartoon TV
series, the toy market as a line of Hasbro toys, the clothing market with various clothing
merchandise (T-shirts, jackets etc.), the literature market with various book adaptations,
and it was even fashioned into a board game (Ciabai, 2017; Greene, 2015; Cheshire,
2011).
In addition, Rovio officially announced that an Angry Birds movie was going to be
produced and distributed by Sony Pictures Entertainment, with a release date set for the
second quarter of 2016. This would be the first movie based off a third-generation mobile
49
game (Makuch, 2013; Rovio, 2013). In May 2016, The Angry Birds Movie was released
worldwide and had an estimated filming budget of $80 million. Although it received mixed
reviews from critics, it proved to be a box-office success and grossed $349 million
worldwide, making it the second highest-grossing video game movie of all-time (McNary,
2017; Berman, 2016). The success of the Angry Birds movie had a profound effect on
Rovio’s latest mobile games - Angry Birds 2, Angry Birds Friends, and Battle Bay - with
sales increasing over 76 percent during its release (Reuters, 2017; Dredge, 2015). Rovio
announced that a sequel to the Angry Birds Movie will be released in 2019. Rovio has
since listed Angry Birds on the stock market, with shares floating on the Helsinki stock
exchange shortly after the first movie (Makuch, 2017; McGoogan, 2017).
According to Kim, Park and Kim (2014:2), a line extension is defined as the use of an
established brand name for a new product and/or service in the same product category.
King Games implemented a line extension strategy when developing a wide range of
mobile games similar to Candy Crush, with each of their names aptly ending with ‘Saga’.
Mobile games such as Candy Crush Soda Saga, Bubble Witch Saga, Pet Rescue Saga,
and Farm Heroes Saga have become popular amongst gamers (Tassi, 2015). King
Games leveraged the success and brand power of Candy Crush to cross promote these
games to their loyal following of players (Seufert, 2014). This strategy has helped the
King Games brand equity grow exponentially, while greatly reducing advertising and
acquisition costs (Nouch, 2012). By the end of 2017, the King Games brand was
estimated to be worth $7.1 billion (Digital Eye Media, 2017).
In conclusion, organisations must adopt an appropriate brand strategy into their overall
marketing plan to build strong brands. Brand strategies provide a benchmark for
measuring brand equity and help set the precedent for how the brand will stand out from
competitors (Kotler & Armstrong, 2017:265-270; Clow & Baack, 2014:48-49).
The following section discusses the theory of brand equity and the concept of brand
loyalty, which is conceptualised from a behavioural stochastic and attitudinal deterministic
approach.

50
3.3 BRAND EQUITY AND BRAND LOYALTY
The increased importance of branding and its function as part of the marketing mix has
led to marketers trying to uncover how much a brand is worth (Iacobucci, 2013).
Marketers perceive a brand as being an intangible asset that adds value to a product or
service through brand equity. Brand equity is the encompassment of brand reputation,
brand performance, brand connection and brand meaning that adds value to the product
and the organisation (Odin, Odin & Valette-Florence, 2001:76). Aaker (1991:15) defines
brand equity as a “set of brand assets and liabilities linked to a brand, its name and
symbol, that add or detract from the value provided by a product or service to a firm and/or
to that firm’s customers”. Keller (2001:3) states that a brand with significant equity
provides a host of benefits to an organisation, with the most important being brand loyalty.
3.3.1 Measuring a brand through brand equity
Brand equity is the inherent value assigned to a brand. It is formed through a consumer’s
trust, identification, and perception of a brand (Chaudhuri & Holbrook, 2011:81). Brand
equity is a key driver in creating greater value for the brand name, which is one of the
most valuable assets to an organisation (Datta, Ailawadi & van Heerde, 2017:1).
Developing and growing a brand name is of utmost importance for marketers due to the
incremental value it adds to a product and/or service (Dehgan, 2011:2). Organisations
strive to create a strong brand identity through the brand name component, which is
known as the vocalisation of a brand (Huang & Sarigollu, 2014:113).
Brand equity is measured through two levels of marketing outcomes, namely,
organisational-level outcomes and consumer-level outcomes (Datta et al., 2017:1).
Marketers analyse metrics such as a brand’s market share, revenue, and premium price
when measuring organisational-level outcomes. Consumer-level outcomes are measured
using attitudinal associations such as a consumer’s brand awareness, knowledge,
attitude, and behavioural intention towards the brand (Cifci, Ekinci, Whyatt, Japutra,
Molinillo & Siala, 2016:3742). Therefore, brand equity is viewed from two separate but
related perspectives: a financial perspective (organisational) and a consumer perspective
(Farquhar, 1989:25-27). Neal and Strauss (2008:10) explain that changes from a financial
perspective, such as pricing structure, sales volume, or profit levels will likely result in

51
changes in perception of brand equity from a consumer’s perspective, such as perceived
brand image and attitude toward the brand.
A thorough review of brand equity literature revealed two widely recognised authors,
namely Aaker (1991) and Keller (1993). Aaker’s (1991:13-15) study proposed a model of
brand equity that includes brand loyalty, brand name awareness, the perceived quality of
the brand, and brand associations. The model illustrates the importance of these
dimensions in creating brand equity which, in turn, will lead to increased consumer value
and organisational value. Aaker’s model of brand equity is depicted in Figure 3-1.
Brand loyalty Brand awareness Perceived quality Brand associations
Brand equity
Customer value Organisational value
Figure 3-1: Aaker’s illustration of brand equity
Source: Aaker (1991:15)
Keller (1993:1) defines brand equity as the “differential effect of brand knowledge on
consumer response to the marketing of the brand”. Keller (1993:8) posits that increased
brand awareness and a positive brand image will positively influence consumer loyalty
and help detract competition. A simplified version of Keller’s model of brand equity is
presented in Figure 3-2.

52
Brand recallBrand
recognition
Types of
brand
association
Favourability
of brand
association
Strengths of
brand
association
Uniqueness
of brand
association
Brand awareness Brand image
Brand knowledge
Figure 3-2: Keller’s illustration of brand equity
Source: Keller (1993:7)
According to Aaker (1991:16) and Keller (1993:8), brand loyalty is a key driver of brand
equity and organisations must attract and retain brand loyal consumers to ensure long-
term success.
3.3.2 What is brand loyalty?
Brand loyalty remains one of the most extensively researched topics within marketing
(Cleff, Walter & Xie, 2018; Nisar & Whitehead, 2016; Kim & Ko, 2012; Bauer et al., 2008;
Jang et al., 2007; Gounaris & Stathakopoulos, 2004; Chaudhuri & Holbrook, 2001; Amine,
1998; Fournier & Yao, 1997; Krishnamurthi & Raj, 1991). Brand loyalty is loosely defined
as the act of loyalty shown by a consumer towards a brand, demonstrated by their
intention to buy the products offered by the brand as their primary choice (Baig et al.,
2015:1). Brand loyal consumers drive brand profitability as they are willing to pay more
for their favourite products due to their belief that no alternative brand can match the
offering and benefits of their favourite brand (Nisar & Whitehead, 2016:745). Loyal
consumers require less frequent advertising, which greatly reduces costs to an
organisation while contributing to significant increases in sales generated from repeat
purchases.
Developing brand loyalty amongst consumers is imperative for any organisation, as it can
have a positive effect on profitability and long-term success (Hsiao & Chen, 2016:18). It
is an important business strategy because the cost of acquiring new customers often

53
outweighs the cost of maintaining an existing customer base (Keller, 2003:3). Chaudhari
and Holbrook (2001:82) state that despite the existence of situational constraints and
competitor marketing, brand loyal consumers will continue to exhibit repeat purchase
behaviour and resist switching due to their trust in the brand. As such, Jacoby and
Chestnut (1978:1) state that the long-term success of a brand lies not in the number of
consumers that purchase its products once, but rather loyal consumers who believe and
purchase the brand on a regular basis.
Based on the seminal works of Day (1969) and Jacoby and Chestnut (1978), brand loyalty
is conceptualised into two philosophical approaches, namely, an attitudinal deterministic
approach and a behavioural stochastic (behavioural loyalty) approach. The two
approaches are discussed in the proceeding sub-sections.
3.3.2.1 Behavioural stochastic approach to brand loyalty
The behavioural stochastic approach views brand loyalty as being a consumer’s
propensity to exhibit repeated purchase behaviour (Keller, 2003:42). This type of
behaviour suggests that consumers’ inclination to repurchase products stems from their
satisfaction and past experiences of the brand (Bauer et al., 2008:207). Nisar and
Whitehead (2016:746) suggest that satisfaction is a key driver of loyalty where there is
evidence of repeat purchase behaviour. This downstream approach suggests that loyalty
is predicted through repeat purchase behaviour and by assessing purchase frequency or
probability distribution (Nam et al., 2011:1011).
A common concern with the stochastic approach is that it does not consider personal
motivations behind the purchase, as marketers are unable to accurately predict the
reasoning behind consistent purchasing behaviours, especially within monopolistic
markets or niche markets (Jacoby & Kyner, 1973:1). Gounaris and Stathakopoulos
(2004:284) state that stochastic measures place too much emphasis on the most
regularly purchased brands in a product category, whereas a deterministic approach
measures actual overall brand value and uniqueness. For this reason, many researchers
believe that brand loyalty must be seen as a dynamic process that is not limited to a
singular behavioural response or by frequency of purchase and it should include an

54
attitudinal component (Cleff et al., 2018:12; Laroche, Habibi & Richard 2013:78; Teng,
2013:885; Lin, 2010:6; Bauer et al., 2008:207; Keller, 2003:15).
3.3.2.2 Attitudinal deterministic approach to brand loyalty
An attitudinal deterministic approach assumes that an individual’s predisposition to exhibit
repeat purchase behaviour is a biased expression of that individual’s preference (Keller,
2003:15). As such, this view criticises a stochastic approach for focusing on arbitrary
factors that do not provide a true reflection of brand loyalty (Amine, 1998:307). Nisar and
Whitehead (2016:745) posit that in order to distinguish between spurious loyalty and true
brand loyalty, one should focus on the effect of antecedents, such as an individual’s
attitude, beliefs, feelings, and intentions in order to engage in repeat purchase behaviour.
As such, Day (1969:30) states that a deterministic approach is assumed when an
individual’s attitude, including the independent variables affecting attitude, is studied
along with behavioural intention when measuring brand loyalty.
The theory behind a deterministic approach typically views a true brand loyal consumer
as one who is wholly committed to one brand (Bloemer & Kasper, 1995:313). This
conceptualisation helps discern true brand loyalty from that of repeat purchase behaviour,
by focusing on brand commitment and attitudinal attachment (Baig et al., 2015:5).
Consumers who display a high level of commitment become psychologically dependent
on the brand to satisfy their needs, which leads to a strong resistance to switch brands
(Cleff et al., 2018:8). Furthermore, Mabkhot, Shaari, and Salleh (2017:4) posit that a
consumer’s commitment to purchase their favourite brand will grow stronger if they
continue to hold a positive attitude towards that brand or organisation. This has led to the
attitudinal dimension of brand loyalty being commonly referred to as psychological
commitment (Huang, 2017:5; Yeh, Wang & Yieh, 2016:245; Liu, Wu, Yeh, & Chen,
2015:144; Lee & Kyle, 2014:657; Nam et al., 2011:1015; Lin, 2010:6; Bauer et al.,
2008:27; Kim, Walsh & Ross, 2008:52; Chaudhuri & Holbrook, 2001:82; Gahwiler &
Havits, 1998:7). Ultimately, consumers who are psychologically committed will exhibit
consistent attitudinal responses when faced with similar situations in future, whilst
remaining unhindered by competitive stimuli (Lin, 2010:6).

55
3.3.2.3 Measuring brand loyalty from a behavioural and attitudinal
perspective
According to Huang (2017:3), marketers should not only focus on purchase behaviour,
as it does not always provide a reflection of true brand loyalty. Instead, brand loyalty must
be conceptualised as a two-dimensional construct that includes both attitudinal and
behavioural loyalty to be able to distinguish between true brand loyalty and repeat
purchasing behaviour (Bauer et al., 2008:207). Jacoby and Kyner (1973:1) describe
brand loyalty as non-random and manifests as a consumer’s behavioural commitment to
purchase the same brand despite the existence of alternatives which, over time, leads to
a significant increase in psychological commitment to that brand. As such, Amine
(1998:306) posits that marketers should consider both an attitudinal deterministic and
behavioural stochastic approach when trying to predict, track and assess true brand
loyalty. This will ultimately lead to the identification of salient predictors of loyalty that can
be used to develop strategies to improve the current brand offering (Yeh et al., 2016:245).
Figure 3-3 illustrates both approaches to brand loyalty.
Psychological and affective
commitment to the brand
Attitudinal deterministic approach
True brand loyalty
Behavioural stochastic approach
Past and future behavioural
intentions to engage with the brand
Figure 3-3: A stochastic and deterministic approach to brand loyalty
Source: Kabiraj and Shanmugan (2011:288)
The above conceptualisation of brand loyalty assumes an attitudinal deterministic
approach alongside a behavioural stochastic approach (Cleff et al., 2018; Keller, 2013;

56
Laroche et al., 2013; Kabiraj & Shanmugan, 2011; Lin, 2010; Bauer et al., 2008; Keller,
2003; Chaudhuri & Holbrook, 2001; Amine, 1998; Jacoby & Kyner, 1973).
3.3.3 Brand loyalty in mobile games
Mobile gaming brand loyalty is demonstrated by a player’s intention to continually make
in-app purchases in their favourite mobile game (Hsiao & Chen, 2016:18). Park and Kim
(2013:1353) posit that players who have an optimal experience (Section 3.4.4) are known
to exhibit strong loyalty towards the game and drive profitability as they are willing to make
multiple in-app purchases and share their positive experience with other players. Loyal
players tend to pay more for in-app purchases and display a strong resistance to switch
as they believe no alternative mobile game can match the value and benefits offered in
their favourite mobile game (Merikivi, Tuunainen & Nguyen, 2017:411). The advantage
of attracting and retaining brand loyal players is that they require less frequent advertising,
which greatly reduces costs while contributing to significant increases in sales generated
from repeat purchases (Teng, 2013:885).
Developing brand loyalty amongst consumers is an important business strategy because
the cost of acquiring new customers often outweighs the cost of maintaining an existing
customer base (Keller, 2003:3). Su, Chiang, Lee and Chang (2016:240) believe it is
imperative for video game developers to retain loyal players in order to meet long-term
goals and ensure sustainability in the market. Understanding the attitudinal and
behavioural tendencies of video game players has helped popular brands such as Angry
Birds, Candy Crush Saga, and Clash of Clans to thrive in the market for numerous years.
The developers of these mobile games spend millions of dollars on marketing
programmes aimed at attracting and retaining brand loyal players and are well-positioned
as premium mobile gaming brands (Loveday, 2015; Takahashi, 2014; Newzoo, 2013;
Teng 2013; Sinha, 2012; Cheshire, 2011). As discussed in Section 2.3, the developers of
these mobile gaming brands utilise a freemium business strategy, which has allowed
them to build strong brand communities and generate millions of dollars from in-game
purchases (Moreira et al., 2014:3). In addition, these brands ensure that gaming content
is constantly improved upon and updated through feedback obtained from loyal players;
thus, greatly extending their life-span in the market (Teng, 2013:884).

57
Despite the growing importance of mobile games branding, limited research exists to
explain why video game players become brand loyal to their favourite mobile game. The
next section identifies and discusses potential antecedents that may be used to predict
mobile gaming brand loyalty.
3.4 ANTECEDENTS OF MOBILE GAMING BRAND LOYALTY
As discussed in Section 3.3.2, brand loyalty is a key component for any organisation
wishing to achieve long-term success. However, consumer behaviour surrounding mobile
services (such as mobile games) has become increasingly difficult to predict. This is
attributed to rapid technological change and the impact of context-based usage (Wu &
Chien, 2015:6; Venkatesh, Thong & Xu, 2012:159). Consumers have become more tech-
savvy and have access to a plethora of information at their fingertips allowing them to
make well-informed decisions (Alzahrani et al., 2017:242; Chen, Shing-Han & Chien-Yi,
2011:125). From a relationship marketing perspective, brand loyalty is a key indicator of
strong customer relations (Lee & Kyle, 2014:657). As such, researchers have strived to
predict various antecedents of brand loyalty within academic literature (Nisar &
Whitehead, 2016:744).
After an extensive review of the literature, six pertinent factors were identified as vital to
predict brand loyalty in mobile games. These factors include flow (Kaur, Dhir, Chen &
Raja, 2016; Teng, 2013; Liu & Li, 2011; Jung et al., 2009; Ha et al., 2007; Hsu & Lu, 2004;
Koufaris, 2002; Moon & Kim, 2001; Ghani & Deshpande, 1994), satisfaction (Yang, Yang,
Chang & Chien, 2017; Hsiao et al., 2016; Hsu, Chang & Chen, 2012; Lee, Shin, Park,
Kwon, 2010; Lu & Wang, 2008; Yang & Peterson, 2004), challenge (Shim, Forsythe &
Kwon, 2015; Teng, 2013; Zhou, 2012; Koo, 2009; Hsu & Lu, 2004; Choi & Kim, 2004),
game identification (Nikhashemi, Paim, Osman and Sidin, 2015; Moon et al., 2013; Blake,
Hefner, Roth, Klimmt & Vorderer, 2012; Van Looy et al., 2012; Bauer et al., 2008; Hefner,
Klimmt & Vorderer, 2007), psychological commitment (Huang, 2017; Datta et al., 2017;
Nisar & Whitehead, 2016; Lin, 2010; Bauer et al., 2008; Keller, 2003), and behavioural
loyalty (Cleff et al., 2018; Teng, 2013; Bauer et al., 2008; Lu & Wang, 2008; Choi & Kim,
2004).
These factors are discussed in the proceeding sub-sections.

58
3.4.1 Satisfaction
The goal of any marketing strategy is to satisfy the needs and desires of the targeted
consumer (Teng, 2013:884). This is equally true when it comes to a brand strategy.
Consumer satisfaction is deeply rooted in the consumer orientation principle of marketing
philosophy (Yang et al., 2017:2287). Bloemer and Kasper (1995:314) define satisfaction
as the positive feeling one experiences after consuming a product and/or service which
meets or exceeds one’s expectations. The level of satisfaction experienced is evaluated
in the difference between consumer expectation and actual brand performance. Hsiao et
al. (2016:344) state that consumer expectation is formed from a multitude of aspects
including buying motivations, past consumption experiences, and the advertising efforts
of the organisation. This creates a reference point in which a product and/or service can
be evaluated. Lee et al. (2010:61) state that a positive consumption experience directly
impacts consumers’ attitudes towards a brand and, in turn, increases the likelihood of
repeat purchase behaviour and brand loyalty. Conversely, when brand performance does
not meet expectations, consumers are more likely to express dissatisfaction towards the
brand and switch to an alternative brand (Lee at al., 2010:61).
According to Yang and Pietersen (2004:803), consumer satisfaction is grouped into two
dimensions, namely, transaction-specific and cumulative (overall) satisfaction. The
transaction-specific dimension defines consumer satisfaction as an emotional evaluation
made by the consumer during the initial experience with an organisation or brand. Lu and
Wang (2008:504) state that the response occurs at a specific time during the post-
purchase phase and is dependent upon various situational variables. In contrast, the
second dimension of satisfaction is defined by Lee et al., (2010:61) as an overall affective
state formed by the cumulative evaluation of transactions with an organisation or brand
over time. Hsu et al. (2012:554) describes transactional-specific satisfaction as the
immediate affective response to a specific purchase, whereas overall satisfaction
represents a consumers’ long-term consumption experience with an organisation.
Bloemer and Kasper (1995:316) emphasise that positive cumulative satisfaction has a
direct positive influence on a consumer’s commitment towards a brand, which is a
prerequisite for true brand loyalty.

59
3.4.1.1 Satisfaction as a predictor of mobile gaming flow
For the purpose of this study, satisfaction is defined as a gamer’s cumulative evaluation
of the fulfilment provided by his/her favourite mobile game. According to Liu and Li
(2011:892), the goal of any mobile game is to create an immersive experience that can
be measured based on flow and usage context. Prior research has revealed a significant
correlation between flow (Section 3.4.4) and satisfaction, where both have a positive
impact on consumers’ psychological commitment (Section 3.4.5) and behavioural loyalty
(Section 3.4.6) towards a brand (Chang, 2013; Zhou, 2013:266; Hsu et al., 2012:550).
A study conducted by Chang (2013:318) on social network games found that satisfaction
has a significant positive impact on flow. The study further elaborated on the importance
of positive cumulative satisfaction in maintaining a constant state of flow which, in turn,
leads to continued use and brand loyalty. This finding was reciprocated by Teng
(2010:1549), who suggested that satisfaction and flow are interlinked. The author posits
that true flow is achieved when a player is satisfied with the feeling of total immersion.
Brand loyalty research carried out by Baig et al. (2015:12) and Hsu et al. (2012:563)
reported similar findings. The research of Zaman et al. (2010:1012) showed that
satisfaction and challenge are interlinked as a consequence of flow. The authors also
state that players derive satisfaction from overcoming challenges, with their overall
satisfaction strengthened through in-game rewards, such as special in-game items or
new levels. This is explored further in the next sub-section.
3.4.2 Challenge
Flow theory posits that the quality of an experience is determined by the challenges
presented and the level of skills required to overcome those challenges (Zhou, 2012:29).
A person may be required to develop new skills to overcome new challenges, thus,
growing from the experience and gaining knowledge at the same time. The reward for
overcoming the challenge is progression to the next level and this accomplishment leads
to an overall sense of satisfaction (Zaman et al., 2010:1012). Video games are designed
to present varying degrees of challenges which are dependent on the level of difficulty
chosen by the player. These challenges manifest as specific goals that need to be met
for a player to progress to the next stage (Choi & Kim, 2004:11).

60
Closely linked to challenge is goal setting theory, whereby concrete goals are set within
manageable rules; the aim being to test the ability of the user. These goals are achieved
when the user becomes motivated enough to expend the right amount of skill and ability
required (Jin, 2012:170). Goal setting theory from a video gaming perspective proposes
that goals must be achievable, challenging, and provide appropriate rewards that induce
maximum effort from players (Teng, 2012:491). If this is achieved, players will be
motivated to play a game repeatedly which, in turn, manifests into loyalty (Teng,
2013:884-885). However, players will cease playing the game if they perceive it to have
a low probability of overcoming challenges. In this case, a state of flow is not achieved
and players will respond negatively to the experience provided by the video game (Shim
et al., 2015:57-58). This outcome is reciprocated when players view challenges as
inconsequential or overly easy, which quickly leads to a decrease in concentration and,
ultimately, the motivation to play (Liao, Huang, Teng, 2016:65).
3.4.2.1 Satisfaction and challenge as predictors of mobile gaming flow
It is imperative for a video game to evoke a constant state of flow by providing an optimal
balance between skill and challenge which, in turn, encourages a repeated use of the
game and stimulates brand loyalty (Jin, 2012:183). This provides evidence of a distinct
link between satisfaction, challenge, and flow from a video gaming perspective when
inducing brand loyalty (Hamari, Shernoff, Rowe, Coller, Asbell-Clarke & Edwards, 2016;
Teng, 2013; Jin, 2012;169; Teng et al., 2012; Koo, 2009; Hsu & Lu, 2004).
3.4.3 Game identification
As stipulated in section 3.2, brand identification is one of the key drivers of brand loyalty.
Nikhashemi et al. (2015:183) posit that brand identification roots in social psychology and
can be described as the consumption of a brand to alter one’s self-perception or fulfil
one’s need for social identity. Simply, identification theory focuses on the study of ‘the
self’ and how one can be influenced by society (Hefner, 2007:40). This suggests that
consumers’ brand preference is not entirely rooted in utilitarian value but rather considers
symbolic value (Bauer et al., 2008:212). As such, a brand is often selected as a statement
of social status and the level of brand identification is determined by the degree to which
a brand can satisfy the egotistical need of the consumer. A higher level of brand
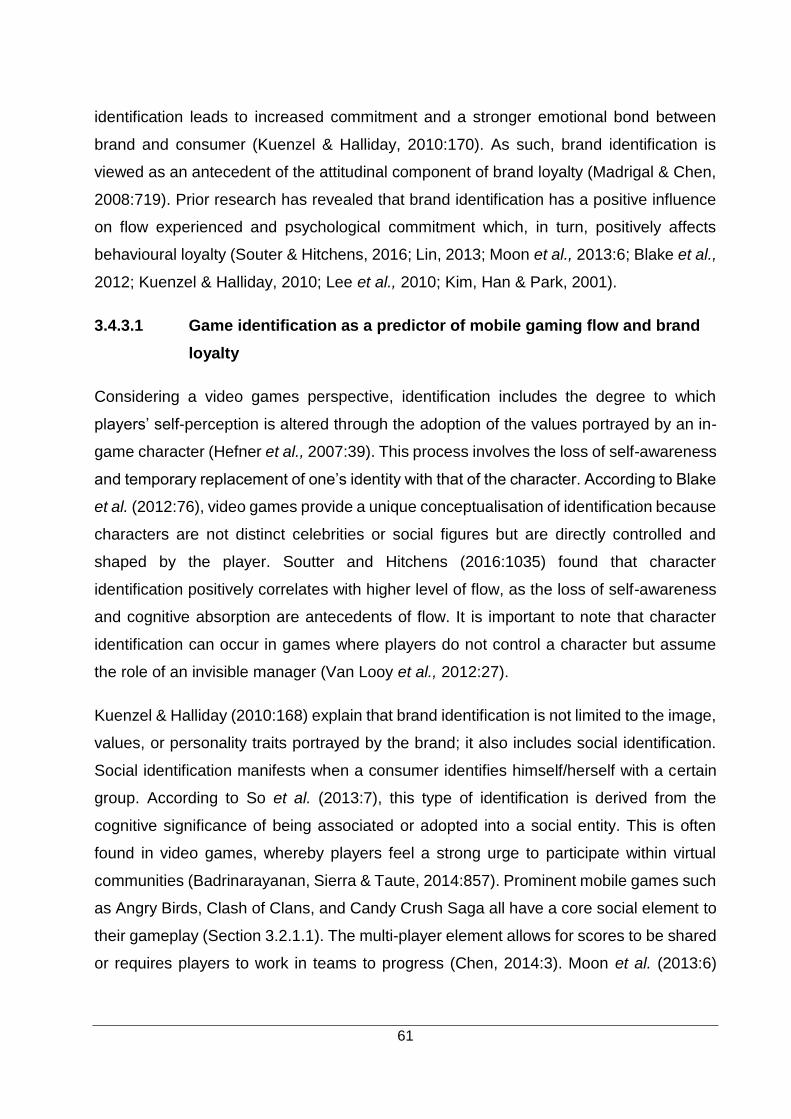
61
identification leads to increased commitment and a stronger emotional bond between
brand and consumer (Kuenzel & Halliday, 2010:170). As such, brand identification is
viewed as an antecedent of the attitudinal component of brand loyalty (Madrigal & Chen,
2008:719). Prior research has revealed that brand identification has a positive influence
on flow experienced and psychological commitment which, in turn, positively affects
behavioural loyalty (Souter & Hitchens, 2016; Lin, 2013; Moon et al., 2013:6; Blake et al.,
2012; Kuenzel & Halliday, 2010; Lee et al., 2010; Kim, Han & Park, 2001).
3.4.3.1 Game identification as a predictor of mobile gaming flow and brand
loyalty
Considering a video games perspective, identification includes the degree to which
players’ self-perception is altered through the adoption of the values portrayed by an in-
game character (Hefner et al., 2007:39). This process involves the loss of self-awareness
and temporary replacement of one’s identity with that of the character. According to Blake
et al. (2012:76), video games provide a unique conceptualisation of identification because
characters are not distinct celebrities or social figures but are directly controlled and
shaped by the player. Soutter and Hitchens (2016:1035) found that character
identification positively correlates with higher level of flow, as the loss of self-awareness
and cognitive absorption are antecedents of flow. It is important to note that character
identification can occur in games where players do not control a character but assume
the role of an invisible manager (Van Looy et al., 2012:27).
Kuenzel & Halliday (2010:168) explain that brand identification is not limited to the image,
values, or personality traits portrayed by the brand; it also includes social identification.
Social identification manifests when a consumer identifies himself/herself with a certain
group. According to So et al. (2013:7), this type of identification is derived from the
cognitive significance of being associated or adopted into a social entity. This is often
found in video games, whereby players feel a strong urge to participate within virtual
communities (Badrinarayanan, Sierra & Taute, 2014:857). Prominent mobile games such
as Angry Birds, Clash of Clans, and Candy Crush Saga all have a core social element to
their gameplay (Section 3.2.1.1). The multi-player element allows for scores to be shared
or requires players to work in teams to progress (Chen, 2014:3). Moon et al. (2013:6)
62
found that players with a strong social identity will display higher levels of loyalty toward
games.
Van Looy et al. (2012:128) state that character identification and social identification form
part of a three-dimensional concept of identification in video games, which includes game
identification. Game identification refers to the degree to which a player identifies with the
world presented by the video game and the community that encompasses it (van Rooij,
Schoenmakers, Vermulst, van den Eijnden & van de Mheen, 2011:206). Van Looy et al.
(2012:132) found players’ identification in online games revealed that those who develop
a strong sense of game identification become driven to obtain high scores, progress
rapidly, and gather in-game symbols of success. They are also more likely to make in-
app purchases to speed up their progress (Hamari, 2015:306). Research conducted by
Soutter and Hitchens (2016:1035) and Moon et al. (2013:6) found that players with a
strong social identity will display higher levels of loyalty toward games and that the game
identification will manifest into higher levels of flow.
3.4.4 Flow
Flow, as a construct, has often been linked to research which relates to products or
services created for entertainment purposes. Flow is often incorporated into renowned
behavioural models such as the Theory of Reasoned Actioned (TRA) and Technology
Acceptance Model (TAM) to predict consumer adoption tendencies (Kaur et al., 2016; Liu
& Li, 2011; Ha et al., 2007; Hsu & Lu, 2004; Koufaris, 2002; Moon & Kim, 2001; Ghani &
Deshpande, 2001). Csikszentmihalyi and LeFevre (1989:816) describe flow as the
process of optimal experience that manifests from various interrelated factors such as
goal-setting and feedback, challenge and skill, concentration, focus, sense of control, and
loss of self-awareness. A simpler conceptualisation posits flow being a state of total
cognitive absorption achieved through intrinsic enjoyment (Jung et al., 2009:124).
Video games create a sense of enjoyment from the overall experience (Alzahrani et al.,
2017:242). This perception of enjoyment is compounded by the experience of
successfully overcoming a challenge to progress further. This creates value for players
as they can learn new skills while enjoying the overall gameplay experience (Wu & Chien,
2015:3). Players who become fully immersed enter a state of ‘flow’, where they become

63
oblivious to their surroundings and are compelled to continue playing for an extended
period of time (Teng, 2013:885). According to Su et al. (2016:247), players who
experience a state of flow are more likely to succumb to in-app purchases to enhance
their gaming experience and are most likely to recommend a game to their friends and
family.
3.4.4.1 Flow as a predictor of mobile gaming brand loyalty
Merikivi et al. (2017:412) state that when studying mobile games, the importance of flow
cannot be overstated as games are enjoyed more by consumers when they become
cognitively absorbed during play. A study by Liu and Li (2011:896) revealed that evoking
a state of flow is imperative when creating a positive attitude towards a mobile game. This
will lead to repeated use of the game and increase brand loyalty. Teng (2013:889) found
similar results and posits that flow has a positive significant influence on game brand
loyalty. Furthermore, Hamari’s (2015:306) study on why people purchase virtual goods
revealed that continued use of a mobile game has a positive effect on a player’s intention
to make in-app purchases. The study also noted that free-to-play mobile games that
provide an enjoyable experience do not automatically foster purchase intentions, instead
purchase intentions are manifested from continued use. This underpins the importance
of correctly implementing a freemium business model (refer to section 2.3) in conjunction
with a mobile game which evokes a state of flow (Georgieve, Arnab, Romero & de Freitas,
2015:29; Mantymaki, 2015:125). Ultimately, players who become fully immersed (enter a
state of flow) in a gaming experience will become psychologically committed, which leads
to increased behavioural loyalty towards the game and/or the game’s developer (Choi &
Kim, 2004:12).
3.4.5 Psychological commitment
Day (1969:30) states that true brand loyalty occurs when a consumer displays a positive
attitude toward the brand in addition to repeat purchase behaviour. Contrastingly,
consumers who display spurious loyalty are characteristically non-committal and will
easily switch to another brand should the opportunity arise. These consumers will
purchase a brand repeatedly, but typically switch brands when a competing brand offers
a discount or a better deal (Mabkhot et al., 2017:73). Therefore, the psychological

64
commitment dimension of brand loyalty helps discern true brand loyalty from that of
repeat purchase behaviour and places greater emphasis on brand commitment and
attitudinal attachment.
A consumer who is truly brand loyal is wholly committed to the brand and will only
purchase that brand in future due to their level of commitment (Bloemer & Kasper,
1995:313). This level of commitment illustrates one’s desire to remain loyal to their
favourite brand and an ability to develop a lasting attachment because of the value
provided by the brand (Datta et al., 2017:6). Their loyalty preference will continue to grow
if they hold a positive attitude towards a brand or organisation (Baig et al., 2015:5). These
consumers are not swayed by incongruous information about their favourite brand (Teng,
2013:885; Lin, 2010:6; Bauer et al., 2008:2007; Keller, 2003:15). When distinguishing
between inauthentic loyalty and true brand loyalty, it is recommended to evaluate a
consumer’s beliefs, feelings, and intentions (Nisar & Whitehead, 2016:745).
3.4.6 Psychological commitment as a predictor of mobile gaming
behavioural loyalty
Psychological commitment in mobile games manifests as a resistance to switch to
another mobile game despite the marketing efforts of competitors or recommendations
from friends and family (Lin, 2010:13). Teng (2013:884) states that video games often
integrate seamlessly into consumers’ daily lives because of the optimal experience
presented through challenging and addictive gameplay. This often leads to excessive
gameplay and a preference to play video games from the same developer. According to
Lu and Wang (2008:500), consumers become psychologically dependent on their
favourite video game due to its ability to create a state of flow (refer to Section 3.4.4).
Another study by Choi and Kim (2004:12) indicates that players who achieve flow will
become psychologically committed which will likely result in increased behavioural loyalty
towards the mobile game or the mobile game’s developer.
The behavioural dimension of mobile games brand loyalty includes past loyal behaviour
as well as future intended behaviour (Teng, 2013:884). Such behaviour is shown by
making in-app purchases while playing, purchasing game-related merchandise, engaging
with online communities, participating in discussions in online blogs, or following the latest

65
news and updates on social media platforms (Hsiao & Chen, 2016:19; Lu & Wang,
2008:503; Choi & Kim, 2004:12). Retaining behavioural loyalty amongst gamers is
imperative for any mobile gaming organisation, as it has a positive effect on profitability
and long-term success (Hsiao & Chen, 2016:18). Behaviourally loyal players require less
frequent advertising, which greatly reduces costs, while contributing to significant
increases in sales generated by recommending the game to their friends and family or
from repeatedly making in-app purchases (Teng, 2013:885).
The next section provides an in-depth discussion on brand loyalty amongst generational
cohorts with a specific focus on Generation Y, as it is the target group for the current
study.
3.5 BRAND LOYALTY AMONGST GENERATIONAL COHORTS
It is imperative for any organisation to correctly identify a suitable target market for a
product or service which they wish to sell or promote (Iacobucci, 2013:43). The needs of
consumers can greatly differ due to their demographical and socio-cultural backgrounds,
therefore, not all products and services offered by an organisation will appeal to every
consumer (Burgess, 2011:38). As such, marketers segment consumers into
homogeneous groups according to their age (typically generational cohorts), gender,
income levels, personality traits, morals, values, social standings, and cultural differences
(Jansen van Rensburg, 2014:132). Marketers strive to group consumers together that are
best suited to a product or service in order to improve targeting effectiveness (Burgess,
2011:38).
It has become common practice for marketers to segment consumers into generational
cohorts. Consumers who form part of a generational cohort have underlying similarities
due to having grown up during the same time period (Debevec, Schewe, Madden &
Diamond, 2013:20). The consensus amongst researchers is that significant societal
events, such as wars, economic change, popular culture, globalisation, and technological
development that occur during certain time periods are pivotal in shaping consumers’
attitudes, values, and beliefs (Fernandez-Duran, 2016:435). However, there are varying
opinions as to which time period a generational cohort should belong. Markert (2004:21)
postulates that a 20-year time period exists between generational cohorts, during which

66
any major events that occur will distinguish one generation from the next. According to
Markert (2004:21), there are currently three distinct generational cohorts in existence
today; namely, Baby Boomers (born between 1946 and 1965), Generation X (born
between 1966 and 1985), and Generation Y (born between 1986 and 2005). The three
generational cohorts are summarised as follows:
Baby Boomers are individuals who were born after World War II, between 1946 and 1965.
They are characterised as having rejected and redefined many of the traditional values
held before the Second World War. They are characterised typically as late adopters;
heeding caution before making any decisions (Debevec et al., 2013:21). This may be
attributed to their age coupled with experience gained over many years, allowing for
informed rational decisions to be made (Parment, 2013:191). Most Baby Boomers
currently are preparing for retirement and are making use of assets they have built up
over many years, such as retirement annuities, to fund their lifestyle. As such, they often
have more time and disposable income than their generational counterparts, making
them a lucrative market, particularly for the healthcare industry (Migliaccio, 2018:27).
Following Baby Boomers is the Generation X cohort, comprising individuals born between
1966 and 1985 (Markert, 2004:15). This generational cohort has been defined by harsh
economic times following the Second World War. Tough economic periods meant that
Generation X parents had to work exceptionally hard in order to live a sustainable lifestyle
(Yang & Jolly, 2008:274). As such, Generation X individuals were often separated from
their parents during their childhood and adolescent years. This disconnect endorsed the
development of independence and self-reliance within the cohort (Dhanapal, Vashu &
Subramaniam, 2015:109). In addition, the Generation X cohort are characterised as being
highly educated, sceptical, and pragmatic individuals (Lissitsa & Kol, 2016:304).
The target market for this study are the Generation Y cohort. This cohort is discussed at
length in proceeding subsections.
3.5.1 Generation Y
Generation Y, also known as Millennials, is the largest cohort of the three generations
and comprises individuals born between 1986 and 2005 (Markert, 2004:21). As of 2018,
the Generation Y cohort consists of individuals between the ages of 13 and 32 years old.

67
The Generation Y cohort are characterised as ‘tech-savvy’ individuals, having grown up
during the rapid technological advancement era (Au-Yong-Oliveira, Goncalves, Martins
& Branco, 2018:955). The prevalence of social media and the importance that society
places on social influences has shaped them into image-conscious individuals whose
decisions are driven largely by emotional connotations (Balakrishnan, Dahnil & Yi,
2014:179).
Globalisation has played an integral part in the shaping of the typical Generation Y
consumer. Innovations such as the Internet, mobile telephones, social media, and reality
television have made the world an instantaneously interconnected habitat (Hamidi &
Chavoshi, 2018:1053-1054). Consequently, this rapid dissemination of smart phones and
portable computers has exposed this cohort to a plethora of readily available sources of
information (Bilgihan, 2016:103). Having information accessible at their fingertips has
increased the buying power of Generation Y individuals. As a result, this cohort is quick
to dismiss false advertising and is less likely to respond to outdated common marketing
techniques (Chuah, Marimuthu, Kandampully & Bilgihan, 2017:125). Moreover, this
cohort is not particularly brand loyal and does not hesitate to switch brands if a new trend
presents itself. This is particularly evident on social media or reality TV, as popular
celebrities have the power to influence the purchasing decisions of this cohort (Lissitsa &
Kol, 2016:305). A study by Lazarevic (2012:45) concerning the encouragement of brand
loyalty revealed that marketers need to successfully integrate branding, marketing
communications, and celebrity endorsements in order to induce Generation Y individuals
to become more brand loyal.
Despite their resistance to traditional marketing strategies, Generation Y individuals still
display higher adoption rates of new technologies than their counterparts, Baby Boomer
and Generation X cohorts (Mostert, Petzer & Weideman, 2016:25). Witt, Massman and
Jackson (2011:763) found that an average member of the Generation Y cohort spends
up to 12 hours a day using various technologies such as smartphones, personal
computers, or playing video games. Baby Boomers and Generation Xers are not as
technology inclined, thus Generation Y’s opinions on various technological
advancements are sought after by marketers and video gaming developers (Zhang, Lu &
Kizildag, 2017:489-490).

68
3.5.2 Generation Y in South Africa
The Digital market outlook released in 2016 revealed that South African mobile gamers
are predominantly between the ages 16 and 34 (Statista, 2016a). This result suggests
that a large share of South Africa’s mobile game market falls within the Generation Y
cohort range. At the end 2017, members of the Generation Y cohort made up
approximately 36.2 percent of the South African population, making it the largest
represented cohort in the country (Statistics South Africa, 2017).
Over the past decade, the influx of low-cost mobile phones and prepaid subscriptions has
greatly increased internet access for the wider Generation Y cohort in South Africa
(Matangira, 2018). As such, this cohort has been known to consume large amounts of
digital media which they share via mobile phones using social media platforms (Kreutzer,
2009:1). Previously, video games were only accessed by higher income groups who
could afford expensive consoles such as Xbox and Sony PlayStation consoles. However,
today’s affordable mobile telephones have made mobile gaming an easily accessible
gaming platform for the wider South African population (Walton & Pallitt, 2012:6).
According to the 2017 Global Mobile Consumer Survey released by Deloitte (2017:11),
68 percent of respondents aged between 18 and 25 years (Generation Y) indicated that
they use their mobile phone to play mobile games. This age range is typically associated
with university students and various scholars have noted the importance of studying these
members of the Generation Y cohort (Chuah et al., 2017; Price, 2017; Akpojivi & Bevan-
Dye, 2015; Synodinos, 2014; Amory & Molomo, 2012). Generation Y university students
are highly valuable in terms of market potential because individuals who obtain higher
educational qualifications through a tertiary institution have a higher future earning
potential, greater social influence, and more disposable income than their peers that do
not possess a tertiary qualification (Sharp & Bevan-Dye, 2014:88).
3.5.3 Gender differences in Generation Y brand loyalty towards video
games
Consumers generally tend to display similar characteristics and traits, however, gender
differences remain apparent within generational cohorts (Pentecost & Andrews, 2010:45).
Prior literature dictates that the typical video gamer is most likely an adolescent male and

69
least like a female (Witt et al., 2011:768; Lucas & Sherry 2004:500). However, the
inundation of smartphones into the market, coupled with globalisation, has led to an
almost equal representation of both male and female players of mobile games (Knoke,
2017).
Two studies conducted on Generation Y South African video gamers revealed non-
significant gender differences, whereby the majority of male and female participants
played similar video games, evaluated their experiences in the same manner, and
displayed equally positive attitudes and adoption intentions towards mobile games (Price,
2017:108; Amory & Molomo, 2012:193). Marketers can equally promote both male and
female oriented products in mobile games and careful consideration needs to be taken of
both genders when planning marketing campaigns. This study will further investigate if
gender differences exist in mobile gaming brand loyalty
3.6 PROPOSED MODEL TO PREDICT MOBILE GAMING BRAND
LOYALTY
This chapter reviewed the literature on branding, brand strategies adopted by mobile
games, brand equity, brand loyalty, and mobile gaming brand loyalty. It also included a
discussion on the antecedents of mobile gaming brand loyalty and the Generation Y
cohort in South Africa. This section incorporates the reviewed literature to propose a
model that explains the antecedents affecting mobile gaming brand loyalty. This section,
thus, addresses the last theoretical objective formulated in Chapter 1.
The model proposes that satisfaction, challenge, and game identification are significant
predictors of mobile gaming flow and that flow has a significant influence on psychological
commitment which, in turn, has a direct effect towards behavioural loyalty. Figure 3-4
presents the proposed model and the hypothesised antecedents of mobile gaming brand
loyalty, as outlined in the literature review.

70
Satisfaction
Challenge
Game
identification
FlowPsychological
commitment
Behavioural
Loyalty
{Brand loyalty}
Figure 3-4: Proposed model of the antecedents of mobile gaming brand
loyalty amongst Generation Y students
The proposed antecedents of mobile gaming brand loyalty presented in Figure 3-4 will be
empirically tested in Chapter 5, with the results and recommendations thereof reported in
Chapter 6.
3.7 CONCLUSION
The purpose of this chapter was to review the literature on mobile gaming brand loyalty
and the Generation Y cohort in order to propose a model of antecedents affecting mobile
gaming brand loyalty amongst Generation Y students in the South African context.
Mobile games remain at the forefront of the video game market. It has become evident
that video gaming organisations must build a strong mobile gaming presence, to both
enhance their brand and stay current within today’s gaming industry needs. The longevity
and success of mobile game franchises such as Angry Birds, Candy Crush Saga, and
Clash of Clans is a testament to their ability to nurture and grow a brand and successfully
attract and retain a massive following of loyal video gamers. In turn, these mobile gaming
brands effectively leverage the loyalty of these players to expand their brand portfolio
beyond video games and into various other markets. Gaining an in-depth understanding
of how these mobile gaming franchises have successfully created strong brands is of
utmost importance to new video game organisations and their marketing teams who aim
to make a noticeable mark in the industry.

71
In accordance with the literature, the antecedents of mobile gaming brand loyalty include
satisfaction, challenge, game identification, flow, psychological commitment, and
behavioural loyalty. Flow refers to a state of optimal experience and was identified as a
salient predictor of psychological commitment and consequent behavioural loyalty. The
literature also revealed that flow is mediated by the satisfaction a consumer derives from
playing mobile games, the challenge of the overall gameplay experience, and the level
that one identifies with the game.
The Generation Y cohort, as the focus group of this study, was discussed in depth. This
cohort is characterised as having grown up in a time of rapid technological development
and growing social influence, which has shaped them into tech savvy individuals and
made their opinions on various technologies sought after by marketers. Furthermore, the
South African Generation Y cohort makes up around 36.2 percent of the total population,
with research showing that most of the mobile game players in the country can be
grouped into this cohort. The literature revealed that the focus should be on university
students making up the Generation Y cohort, as they have a higher future earning
potential and have a greater social influence on other members of the Generation Y
cohort. Importantly, when targeting this cohort, marketers should avoid using
conventional marketing techniques, as members of this cohort are quick to reject them.
The research methodology followed in collecting and analysing the data used to test the
model proposed in this chapter is fully discussed in the following chapter, Chapter 4.

72
CHAPTER 4
RESEARCH DESIGN AND METHODOLOGY
4.1 INTRODUCTION
Marketing research connects members of the external business environment to the
marketer through crucial information, which is used to identify and define potential
opportunities and problems that may exist in the market (Malhotra, 2010:39). Thereafter,
marketers analyse market opportunities and problems through data analysis and present
the relevant findings in the form of managerial applications (Smith & Albaum, 2010:1).
This makes marketing research essential for any organisation, as it allows for both
effective and efficient decision-making and the creation of optimised strategies aimed at
the organisation’s target market (Kent, 2007:3-4).
The marketing research process consists of a number of interrelated elements that
function sequentially (Shukla, 2010:15). The first step in marketing research is to identify
and define the problem (Berndt & Petzer, 2011:26). In this study, the problem was defined
in Chapter 1 (Section 1.2) and it led to one primary objective that guided the study (refer
to Section 1.3.1). The primary objective was then translated into four empirical objectives
(refer to section 1.3.3) that required the collection of the following data:
• Generation Y students’ satisfaction with their favourite mobile game.
• Generation Y students’ perceptions of the level of challenge experienced when
playing their favourite mobile game.
• Generation Y students’ level of identification with their favourite mobile game.
• Generation Y students’ perceived state of flow when playing their favourite mobile
game.
• Generation Y students’ psychological commitment towards their favourite mobile
game.
• Generation Y students’ behavioural loyalty towards their favourite mobile game.

73
The next step was to pursue a suitable research paradigm (Section 4.2), which
underpinned the selection of an appropriate research design (Section 4.3), sampling
procedure and data collection method (Section 4.4 & Section 4.5), questionnaire
administration (Section 4.6), data preparation method (Section 4.6) and data analysis
techniques (Section 4.8) (Creswell, 2014:3-11; Peter & Donnelly, 2012:30-38; Berndt &
Petzer, 2011:25-26; Malhotra, 2010:41-42; Smith & Albaum, 2010:5-12; Blythe,
2005:102-103).
4.2 RESEARCH PARADIGMS
A research philosophy, often referred to as a research paradigm, is described as the
researcher’s general philosophical view of the world in which the research will be carried
out. It encompasses participants who form part of that world, the methodology followed
to gather and interpret data collected from the participants, the relationship between the
participants and the researcher and the objective of the research project (Creswell &
Clark, 2007:38). In other words, the beliefs of the individual carrying out the research will
influence the overall design of that research. According to Creswell (2014:3), all research
must be grounded within a philosophical worldview, which guides the specific methods
and procedures followed by the researcher. This is critical in ensuring all elements of the
research project fit together to achieve the research objectives of the study (Johnson &
Onwuegbuzie, 2004:14). The proceeding subsections describe the four philosophical
world views identified by Creswell (2014:4-6), namely constructivism, transformative,
pragmatism and post-positivism.
4.2.1 Constructivist
A constructivist research paradigm, which incorporates an interpretivist view, is defined
as one where individuals seek to understand the world in which they live or work. It relies
on an individual’s subjective view of their experiences related to an object or variable.
This approach leads to the collection of complex views for analysis and seeks to avoid
diluting meanings into narrow categories (Nieuwenhuis, 2016a:60-62; Creswell, 2009:37-
38). As such, social constructivists prefer asking participants open-ended questions, as
these tend to generate broad answers that provide an unhindered subjective view of the
situation. These questions often deal with situations involving social interactions between

74
individuals within a specific cultural setting. The researcher inserts himself/herself into the
middle of the study when interpreting findings in order to better understand (interpret) how
others view the world they live in (Lincoln, Lynham & Guba, 1994:113).
4.2.2 Transformative
Nieuwenhuis (2016a:63-65) describes a transformative worldview as being grounded in
social reality that is historically developed, produced and reproduced by people.
Transformative research is action-based and focusses on marginalised individuals in
society and deals with issues such as social power and justice, inequality, discrimination
and oppression (Creswell, 2014:38). The purpose of this type of research is to provide
actionable outcomes that can be used to improve the lives of the marginalised individuals
who from part of the target population of the study. Such individuals include, but are not
limited to, racial minorities, disabled persons and members of the lesbian, gay, bisexual,
and transgender (LGBT) community (Mertens, 2007:212).
4.2.3 Pragmatic
The pragmatic worldview is concerned with developing practical solutions to ‘real world’
problems. Pragmatists believe that the world should not be viewed from a one-
dimensional approach, but rather from multiple perspectives free from any constraints or
‘tainted’ worldviews (Feilzer, 2010:8). As such, Creswell (2009:39-40) states that
pragmatists are not bound by a particular research method or technique but have the
freedom of choice to select any method they deem appropriate and credible to solve the
research problem.
4.2.4 Post-positivist
Post-positivist research assumptions follow a scientific methodology and are typically
found in research that is quantitative in nature as opposed to qualitative (Creswell,
2014:36). Creswell (2009:36) and Nieuwenhuis (2016a:59) describe the post-positivist
paradigm as an approach where reality is multifaceted, subjective and mentally
constructed by individuals. Reality is not fixed, but a creation of the individuals involved
in the research. In addition, knowledge is based on careful observations that exist “out
there” in the world. Therefore, developing numeric measures of observations and

75
studying the behaviour of individuals is of the utmost importance for a post-positivist.
According to Guba and Lincoln (1994:110), positivist researchers condense ideas into
discrete variables represented by hypotheses or research questions, which are then
tested and verified through empirical research.
The purpose of this study was to propose and test a model of antecedents that may be
used to predict mobile gaming brand loyalty among Generation Y students. Therefore,
following a quantitative approach that is rooted within a post-positivist research paradigm
was deemed suitable. This approach allows for the researcher to remain neutral and
objective as he/she assumes a non-interactive role in the study (Orlikowski & Baroudi,
1990:11). Maintaining this level objectivity is what makes post-positivistic research
valuable, as it allows for findings to interpreted in a manner that is rational, precise, clear
and robust (Creswell, 2014:37).
4.3 RESEARCH DESIGN
A research design is a comprehensive blue-print or plan utilised to address the research
problem or question in a research study (Kotler & Armstrong, 2017:133; Clow & James,
2014:34). A different systematic approach is followed in each research design, which is
dictated according to the various methods or procedures outlined by that specific research
design (Smith & Albaum, 2010:21). Malhotra (2010:103) states that research designs are
either exploratory or conclusive in nature and must be selected according to the type of
research conducted. Figure 4-1 provides a detailed composition of the two research
designs.

76
Research design
Conclusive
research design
Exploratory
research design
Causal research
Single cross-
sectional design
Longitudinal
design
Cross-sectional
design
Multiple cross-
sectional designDescriptive
research
Figure 4-1: Illustration of the marketing research designs
Source: Malhotra (2010:103)
An exploratory research design is employed to gain more insight into a specific research
problem (Bradley, 2013:509). It is qualitative in nature and focuses on a small non-
representative sample size (Smith & Albaum, 2010:21). The findings of this type of
research are generally regarded as tentative and are used as an input for more conclusive
research (Malhotra, 2010:103).
Conclusive research is a two-sided mechanism consisting of causal research and
descriptive research (McDaniel & Gates, 2015:54). Kotler and Armstrong (2017:131)
explain that causal research is used to test cause-and-effect relationships between
variables, whereas descriptive research aims to provide further insight and understanding
into an observed variable. Hair, Bush and Ortinau (2002:50) state that descriptive
research follows a pre-calculated and structured approach to collect data on existing
characteristics of a target population, such as attitudes, intentions, preferences and
purchase behaviours. Shukla (2010:35) further asserts that descriptive research can also
be used to validate and further understand findings derived from exploratory research.
Generally, this type of research is quantitative in nature and is drawn from large
representative samples of the target population (Clow, 2014:28; Malhotra, 2010:106). In
marketing, descriptive research is commonly used for product research, promotion
research, distribution research and pricing research, with the findings used to make
predictions and for strategic optimisation (Smith 2010:23). Given the nature of this
research project, a descriptive research design was followed.

77
Descriptive research can be carried out in two main ways namely, longitudinal studies or
cross-sectional studies. In a longitudinal study, a fixed sample of participants is used
repeatedly to measure the same variables. This gives insight into whether participants’
opinions on a subject have changed over time or remained consistent throughout the
allocated time (Creswell, 2014:203). Owing to time restrictions and financial constraints,
it was not deemed feasible to conduct a longitudinal research design for the purpose of
this study. As such, a single cross-sectional design was employed in this study. This is
commonly used when researchers aim to collect information from a sample of participants
only once and provides researchers and marketers with a snapshot in time of the
subject/s under study (Shukla, 2010:38).
The following section describes the sampling procedure utilised for this study.
4.4 SAMPLING PROCEDURE
Sampling is the process of selecting a smaller sub-group from the total population. This
sub-group, also known as population elements, needs to be representative of the total
population (Blythe, 2005:108). Kotler and Armstrong (2017:138) state that it is imperative
to select a sample that is representative of the population because it is not always feasible
to reach an entire target population. Malhotra (2010:372) opines that a five-step
systematic sampling process should be applied when selecting a suitable sample. This
process is depicted in Figure 4-2 below.

78
Define the target population
Determine the sampling frame
Execute the sampling process
Select a sampling technique(s)
Determine the sampling size
Figure 4-2: Sampling design process
Source: Malhotra (2010:372)
The following sub-sections detail the steps of the sampling design process.
4.4.1 Define the target population
Correctly defining the desired target population is a vital component in the sampling
design process. It is by no means a rudimentary definition of participants that will form
part of the study, in that it should also specify if any limitations or boundaries of exclusion
are present (Clow & James, 2014:226). Entire populations are too large to include into a
total sample (Maree & Pietersen, 2016:192). Smith and Albaum (2010:10-11) conclude
that small and manageable sample groups should be drawn from a target population that
best represents that target population. Malhotra (2010:370-371) adds that a target
population consists of sample groups or “population elements” that share homogenous
attributes or traits that can be affiliated with the research problem. Bernd and Petzer
(2011:65) further describe population elements as variables, objects or people that are a
researcher’s specific target for data collection.

79
The target population of this study comprised full-time Generation Y students ranging
between the ages of 18 and 24 years who were enrolled at public registered South African
HEIs in 2017.
4.4.2 Determine the sampling frame
According to Bradley (2013:155), a sample frame contains a summary of key information
associated with population elements and forms the basis on which participants are
selected. Typically, researchers identify an appropriate sampling frame for a study by
specifying a procedure to be followed in order to select a list of population elements
(McDaniel & Gates, 2015:56). However, Malhotra (2010:373) cautions that such a list
may include certain population elements that are not part of the sampling frame and
advises researchers to screen potential participants during the data-collection phase in
order to avoid any sampling frame errors.
The sample frame selected for this study included the 26 publicly registered South African
HEIs (Universities South Africa, 2018). From the initial sample frame, judgement sampling
was used to select three campuses located within the Gauteng province. The three HEIs
comprised one from a comprehensive university, one from a traditional university and one
from a university of technology.
4.4.3 Select a sampling technique(s)
There are several sampling techniques that aid in selecting a representative sample.
These sampling techniques are grouped into two main categories, namely probability and
non-probability sampling (Zikmund & Babin, 2010:311).
Probability sampling relies on random selection, whereby every member, object or
variable of the target population has an unbiased chance of being selected within the final
sample (Blythe, 2005:109). Samples are drawn through precise estimations, thus
allowing for the generalisation of findings drawn from that sample (Berndt & Petzer,
2011:175). Probability sampling comprises the following techniques, namely simple
random sampling, systematic sampling, stratified sampling, and cluster sampling
(Iacobucci & Churchill, 2010:285).

80
In contrast, samples drawn using non-probability sampling are not estimated but are
selected based on the subjective judgement of the researcher (Malhotra, 2010:376). This
can lead to desirable results; however, Maree and Pietersen (2016:197) caution that
these findings may not be as precise and unbiased as those derived from samples chosen
in probability sampling. This creates an opening for problematic generalisations when
reporting to the entire target population. That being said, it is not always feasible to obtain
a complete sampling frame from which to draw a probability sample and sometimes, as
was the case in this study, the only pragmatic approach it to use a non-probability
sampling method. The main techniques of non-probability sampling consist of
judgemental sampling, snowball sampling, quota sampling, and convenience sampling
(Sarstedt & Mooi, 2014:40).
The sampling techniques associated with probability and non-probability are depicted in
Figure 4-3 below.
SAMPLING PROCEDURES
Probability sampling
Snowball sampling
Systematic sampling
Simple random sampling
Stratified sampling
Cluster sampling
Judgmental sampling
Quota sampling
Convenience sampling
Non-probability sampling
Figure 4-3: Probability and non-probability sampling techniques
Source: Sarstedt and Mooi (2014:40)

81
In this study, judgemental sampling was used to narrow down the sampling frame to the
selected three HEI campuses. Burns and Bush (2014:260) indicate that judgmental
sampling relies solely on the personal judgment of the researcher selecting the sample.
In addition, this study made use of convenience sampling, a technique in which
participants are selected by chance because they are in the right place and time when a
research study is being conducted (Berndt & Peter, 2011:174). Malhotra (2010:377)
warns that the findings derived from these sampling techniques need to be interpreted
cautiously due to possible selection bias. However, convenience sampling remains a
commonly used technique in studies such as the current one, where both financial
constraints and time restrictions make it the only practical method to gather the required
data (Sarstedt & Mooi, 2014:42).
In order to overcome the limitations associated with non-probability sampling, the
questionnaire utilised in this study included demographic questions pertaining to the
participants’ gender, ethnic group, province of origin and home language. These
questions assisted in determining the extent to which the sample was representative of
the target population.
4.4.4 Determine the sampling size
Sample size is simply defined as the total number of population elements or individuals
that will be measured during a research study (Kotler, 2000:112). Malhotra (2010:374)
describes several factors that need to be considered when selecting sample size. These
factors include resource limitations, intended statistical analysis, the research design,
size of samples used in similar studies, completion rates and the ease of access to
population elements (Zikmund & Babin 2010:301-303). For the purpose of this study, a
sample size of 600 full-time Generation Y students was chosen.
The chosen sample size was validated by means of previously published studies similar
in nature with comparable sample sizes. Such studies include Billieux et al. (2013:1)
(sample size: 690), Van Looy (2012:126) (sample size: 544) and Park et al. (2011:748)
(sample size: 556). In terms of conducting successful SEM, Hair et al. (2010:662) assert
that studies comprising seven or less constructs should have a minimum sample size of
300 participants. Furthermore, Pallant (2016:184) suggests having 10 responses per

82
variable for factor analysis. This study contained six constructs with 29 variables
necessitating a minimum sample size of between 290 and 300 valid responses. There
seems to be consensus amongst researchers that a larger sample size typically produces
greater reliability, accuracy, precision and generalisability of a study (Hair et al., 2014:22;
Malhotra, 2010:374). Based on these arguments, it was deemed that the selected sample
size of 600 full-time Generation Y students was sufficient and would be split equally
amongst the three chosen campuses (200 questionnaires per campus).
The following section details the data collection method carried out in this study.
4.5 DATA COLLECTION METHOD
Once the research design had been selected, the appropriate method of data collection
was chosen. Within descriptive research, there are two common methods used for
collecting data, namely, the observation method and the survey method (Clow & James,
2014:35). The observation method involves directly observing people in a natural
environment and recording their natural responses, whilst the survey method utilises self-
administered questionnaires, mail surveys or online surveys to collect data from
participants regarding their beliefs, thoughts or attitudes towards an observed variable or
phenomenon (Kotler, 2000:107-109).
This study utilised the survey method in the form of a self-administered questionnaire,
which was used to collect data pertaining to the factors that influence South African
Generation Y students’ mobile gaming brand loyalty. The questionnaire was submitted to
the Ethics Committee of the North-West University (Vaal Triangle Campus) for ethical
clearance before distribution took place. The Ethics Committee classified the
questionnaire as a low risk status and issued the following ethical clearance number:
ECONIT 2017-003.
4.5.1 Questionnaire design
Questionnaires consist of statements or questions aimed at drawing specific information
from responding participants (Shukla, 2010:43). It is a popular research instrument
amongst researchers and is commonly used to collect primary data. Questionnaires are
popular research instruments due to their flexibility, inexpensiveness and ease of

83
implementation (McDaniel & Gates, 2015:128-129). However, their construction must be
done carefully. They must be tested and cleared of any errors before their administration
(Kotler, 2000:110). Questions need to be formulated in line with the research objectives
of a study to allow for relevant data to be collected (Sarstedt & Mooi, 2014:61). Burns and
Bush (2014:217-220) stress that questionnaires should flow effectively, be brief and
understandable and void of any double-barrelled or ambiguous questions. In addition, a
questionnaire should contain a cover letter to explain the purpose of the study and
stipulate how the information provided by the participants will be used (Bradley, 2013:193-
194).
In this study, the questionnaire underwent rigorous assessment to ensure it adhered to
the prescribed guidelines of a good quality questionnaire. Questions were designed
according to the empirical objectives set out in Chapter 1, Section 1.3.3. A cover letter,
which explained the purpose of the study and provided brief instructions on how to answer
the questions, accompanied the questionnaire. A pilot test was conducted on students
who did not form part of the final sample in order to determine whether the language used
throughout the questionnaire was consistent and easy to understand. The questionnaire
was then distributed amongst Generation Y students who formed part of the prescribed
sample set out in Section 4.3.1.
4.5.2 Questionnaire content
The questionnaire content was carefully formulated in line with the empirical objectives
set out in Chapter 1, Section 1.3.3. This was done to ensure data collected from
participants were relevant in answering the empirical objectives set out for the study. This
study made use of previously published scales, which were identified whilst perusing the
literature in Chapters 2 and 3, and were carefully adapted to suit the nature of this study.
The scales measured both the antecedents of brand loyalty and brand loyalty itself.
Furthermore, the questionnaire used nominal scales aimed at obtaining demographical
information from the participants.
To analyse the antecedents of brand loyalty, the following scales were used, namely
satisfaction (five items) (Lu & Wang, 2008:518-519), challenge (four items) (Teng,
2013:887), game identification (five items) (Van Looy et al., 2012:134), and flow (six

84
items) (Choi and Kim, 2004:16-17). As per the literature, brand loyalty around mobile
gaming was conceptualised as a two-dimensional scale comprising psychological
commitment (four items) (Prichard, 1999:345) and behavioural loyalty (five items) (Bauer
et al., 2008:225).
The questionnaire utilised a six-point Likert-type scale ranging from “1 = strongly
disagree” to “6 = strongly agree” in order to measure scaled responses. McDaniel and
Gates (2015:253) describe a Likert-type scale as an instrument comprising a series of
questions aimed at determining participants’ level of favourable or unfavourable attitude
towards a topic under study. Likert-type scales are popular amongst researchers as they
lack complexity and are easy to construct (Zikmund & Babin, 2010:255). The six-point
Likert scale was chosen because it excludes a neutral response, which Pallant (2016:5)
indicates is an indecisive and redundant option. Furthermore, McDaniel and Gates
(2015:260) indicate that a neutral response presents an easy way out for participants and
the exclusion thereof compels one to concentrate more deeply on their perception
towards an object or variable before answering. It follows that the resulting response
provides more valuable insight for the researcher.
The following section details the layout of the questionnaire.
4.5.3 Layout of the questionnaire
According to Burns and Bush (2014:22), researchers should take special care when
structuring a questionnaire to rank the questions according to their difficulty. This aids in
guiding the participants through the topic at hand, and to understanding and completing
the questionnaire.
The self-administered questionnaire (refer to Appendix A) used for this research study
comprised two sections. The first section, Section A, contained simple and easy-to-
answer demographic questions. Section B contained questions aimed at measuring the
influential factors driving mobile gaming brand loyalty amongst Generation Y students.
4.5.4 Pre-testing and pilot testing of the questionnaire
McDaniel and Gates (2015:128) stress the importance of conducting a pre-test of a
questionnaire to assess the clarity of the questions posed and it offers an opportunity to

85
revise them, if necessary. Zikmund and Babin (2013:302) state that a pre-test should be
conducted on participants who possess similar characteristics to that of the main target
population in order to gauge the performance of the questionnaire under actual data-
gathering conditions. According to Bernd and Petzer (2011:146), this allows researchers
the opportunity to rectify any problematic errors before the pilot test is conducted. Failure
to do so could result in financial loss and/or a loss of time.
Once the pre-test has provided satisfactory results, the questionnaire undergoes the pilot
test. The pilot test should be conducted on a small sample (≤50) of participants who are
similar to the target population, but who do not form part of the main study (Zikmund &
Babin, 2010:179-180). The purpose of the pilot test is to assess the internal-consistency
of the scaled responses and to identify any errors that may have been overlooked
(Malhotra, 2010:354).
The pre-test for this study was carried out on two experienced academics and four
university students who were representative of the target population. The results obtained
from the pre-test allowed for the refinement of the comprehensibility and efficiency of the
questionnaire.
Thereafter, a pilot test was carried out on a convenience sample of 50 Generation Y
university students that did not form part of the final sample in the study. The results were
analysed using IBM’s SPSS for Windows, Version 25.0, to test the reliability and validity
of the measurement instrument. The questionnaire was deemed to have adequate
reliability and validity and was used for the main study (see Chapter 5, Section 5.2).
The proceeding section describes the questionnaire administration process.
4.6 QUESTIONNAIRE ADMINISTRATION
This study utilised a self-administered questionnaire to gather requisite data from a
sample of 600 participants, and was distributed evenly amongst the three selected
campuses (200 per HEI). The main survey was carried out between April and July 2017.
Lecturers at the chosen HEI campuses were contacted in order to obtain permission to
distribute the questionnaires at a time that was convenient for them. The lecturers who
agreed to allow their students to partake in the study were shown the ethical clearance

86
certificate that was obtained. Participants were informed that their participation in the
study was strictly voluntary and that their identities would remain anonymous. Thereafter,
self-administered questionnaires were distributed to the full-time Generation Y students
after their respective lecturer’s class had concluded. Students were presented a copy of
the questionnaire, with a cover letter informing them of the process to be followed, and
requesting their consent to participate. Once the questionnaires were completed, they
were returned to the fieldworker.
4.7 DATA PREPARATION
The data preparation stage of the research process consists of editing, coding and
tabulation of the collected data. This ensures that data can be correctly contextualised
and interpreted in a meaningful manner (Nieuwenhuis, 2016b:114; Blythe, 2005:111).
4.7.1 Step 1: Editing
The editing of returned questionnaires involves conducting a thorough analysis to ensure
that there are no response errors or omissions (Malhotra, 2010:453). The purpose of the
editing process is to safeguard data quality by identifying inconsistent, ambiguous,
unclear or incomplete responses in a questionnaire before it is used for data capturing
(Berndt & Petzer, 2011:33-34).
In this study, the minimum quality standards entailed discarding all questionnaires that
had more than 10 percent of the responses missing, as well as those where participants
fell outside of the age bracket of 18 to 24 years.
4.7.2 Step 2: Coding
After the editing process, data is coded by assigning numerical values to all responses
contained within a questionnaire (Clow & James, 2014:365). Thereafter, responses are
placed into demarcated groups (tabulation), thus, enabling effective data capture that is
then used for further analysis (Shukla, 2010:40).
The codes assigned in the questionnaire are presented in Table 4-1.

87
Table 4-1: Coding information
Section A: Demographical data
Question Code Target Variable Value assigned to responses
Question 1 A1 Name of institution A (1), B (2), C (3)
Question 2 A2 Year of study 1st year (1), 2nd year (2), 3rd year (3), Post-graduate (4)
Question 3 A3 Gender Female (1), Male (2)
Question 4 A4 Ethnicity African (1), Coloured (2), Indian/Asian (3), White (4)
Question 5 A5 Home province Eastern Cape (1), Free State (2), Gauteng (3), KwaZulu-Natal (4), Limpopo (5), Mpumalanga (6), North West (7), Northern Cape (8), Western Cape (9)
Question 6 A6 Home Language Afrikaans (1), English (2), IsiNdebele (3), IsiXhosa (4), IsiZulu (5), Sesotho sa Leboa (6), Sesotho (7), Setswana (8), SiSwati (9), Tshivenda (10), Xitsonga (11)
Question 7 A7 Age Younger than 18 years (1) 18 years (2), 19 years (3), 20 years (4), 21 years (5), 22 years (6), 23 years (7), 24 years (8), Older than 24 years (9)
Question 8 A8 Smart Phone usage experience (years)
Less than 1 (1); 1-2 (2); 2-3 (3); 3-4 (4); 4-5 (5); More than 5 (6)
Section B: Antecedents of mobile gaming brand loyalty
Item Code Construct measured
Value assigned to responses
Items 1-5 B1-B5 Satisfaction Strongly disagree (1), Disagree (2), Slightly disagree (3), Slightly agree (4), Agree (5), Strongly agree (6)
Items 6-9 B6-B9 Challenge Strongly disagree (1), Disagree (2), Slightly disagree (3), Slightly agree (4), Agree (5), Strongly agree (6)
Items 10-14 B10-B14 Game identification Strongly disagree (1), Disagree (2), Slightly disagree (3), Slightly agree (4), Agree (5), Strongly agree (6)

88
Table 4-1: Coding information (continued …)
Section B: Antecedents of mobile gaming brand loyalty
Question Code Target Variable Value assigned to responses
Items 15-20 B15-B20 Flow Strongly disagree (1), Disagree (2), Slightly disagree (3), Slightly agree (4), Agree (5), Strongly agree (6)
Items 21-24 B21-B24 Psychological commitment
Strongly disagree (1), Disagree (2), Slightly disagree (3), Slightly agree (4), Agree (5), Strongly agree (6)
Items 25-29 B25-B29 Behavioural loyalty Strongly disagree (1), Disagree (2), Slightly disagree (3), Slightly agree (4), Agree (5), Strongly agree (6)
4.7.3 Step 3: Tabulation
Once the questionnaires have been edited and coded, the final step is to tabulate the
data. In simple terms, tabulation is the process of tallying the number of responses found
within each group or variable as outlined in the data coding. Tabulation exists in two
forms, namely univariate tabulation and multivariate tabulation (Malhotra, 2010:466; Hair
et al., 2002:511). This study utilised univariate tabulation, in which the number of
responses or observations found under each variable is calculated and presented in the
form of a frequency table (Sarstedt & Mooi, 2014:99-100).
The statistical techniques employed to analyse the prepared data are discussed in the
following section.
4.8 STATISTICAL ANALYSIS
The captured data in this study was analysed using IBM’s SPSS and AMOS (Version
25.0) statistical programs for Microsoft Windows. The following sub-sections provide a
detailed discussion of the statistical methods applied to the data set.

89
4.8.1 Factor analysis
Given that this study made use of several different scales, albeit validated scales, it was
deemed prudent to do an exploratory factor analysis in order to check for any items that
cross-loaded of loaded on the incorrect factor.
In order for an exploratory factor analysis to be conducted, Pallant (2016:184) advises on
selecting a suitable sample size - a larger sample size tends to produce more reliable
results. Malhotra (2010:639) further suggests the use of a rule of thumb, where there
should be at least five observations for each item to be factor analysed. Thereafter,
factorability of the data is assessed through two components, namely the Bartlett’s Test
of Sphericity, which is used to test the significance of correlations within a correlation
matrix and the Kaiser-Meyer-Olkin (KMO) measure of sample adequacy, which tests the
applicability and appropriateness of conducting a factor analysis (Hair et al., 2014:90-91).
The sample size is proven adequate and factor analysis appropriate when the KMO
produces a value greater than 0.6 and the Bartlett’s Test of Sphericity is significant at the
a=0.05 level (Pallant, 2016:126; Field, 2009:647).
4.8.1.1 Method of factor analysis
When conducting a factor analysis, there are two basic approaches that can be used,
namely common factor analysis and principle components analysis.
In principle components analysis, large sets of correlating variables are reduced into a
minimum number of factors, while all communalities are initially set at 1.0 so that the total
variance of the variables are still accounted for (Hair et al., 2014:105). This indicates a
no-error variance, creating an optimal number of factors to be extracted that best
represents the interrelations between a set of variables (Pallant, 2016:126). For the sake
of simplicity, it can be said that a principle components analysis is used to break down
large datasets by grouping highly correlated variables into factors. Factors are not
tangible or visible, but can be used to describe “a joint meaning” of the correlated
variables (Sarstedt, 2014:238). A potential limitation to this method is the size of the
sample needed to conduct the analysis. Pallant (2016:126;180) suggests the use of larger
sample sizes in order to achieve higher component reliability. In contrast, a common

90
factor analysis is more complicated in that it assumes each variable has a degree of
variance and error variance related to measurement error.
This study utilised the principle components analysis approach, which is, generally
speaking, the most commonly used technique (Malhotra, 2010:643).
4.8.1.2 Number of factors
Factors can range from one up to as many factors as there are variables. However, the
more factors are extracted, the more difficult they become to interpret (Sarstedt,
2014:248). When determining the optimal number of factors to be extracted, Malhotra
(2010:643-644) suggests using several methods, namely specifying the number of factors
using prior knowledge of the expected number of factors, only retaining factors with
eigenvalues greater than 1.0, utilising a scree plot, considering the level of cumulative
percentage of variance by the factors extracted (must be ≥60%), retaining factors with
high-correspondence based on split-half reliability or using significance tests to retain
statistically significant factors only.
This study used the prior knowledge approach to guide the number of factors to extract.
As such, six factors were extracted.
4.8.1.3 Factor rotation
At first, extracted factors can be difficult to interpret and may need to be rotated into a
simpler structure for easier interpretation. Factor rotation is especially important in studies
that have a large number of items, as it optimally categorises factors to facilitate easier
interpretation (Sarstedt & Mooi, 2014:249). There are two main categories of rotation,
those being orthogonal rotation and oblique rotation. Orthogonal rotation includes
varimax, quartimax and equamax rotation, while oblique rotation includes direct oblimin
and promax rotation (Pallant, 2010:185). In this study, oblique promax rotation was
utilised.

91
4.8.1.4 Factor loadings and communalities
According to Bradley (2013:321), factor loadings show how closely related a variable is
to its factor. It is the degree to which each variable correlates with a factor and is assessed
as follows:
• A loading of 0.50 and higher indicates a significant and practical factor loading.
• A loading between 0.30 and 0.50 indicates an acceptable factor loading, but is not
recommended.
• A loading below 0.30 suggests that the variable does not contribute significantly to
the factor and should be ignored.
Sarstedt and Mooi (2014:251) indicate that communalities must also be considered when
assessing factor loadings. Communalities indicate how much variance in each variable is
explained by the factor solution (Pallant 2016:137). In this regard, Hair et al. (2014:117)
state that variables with communality values below 0.50 should not be included in the
final analysis. Likewise, items that cross-load across more than one factor should be
deleted, unless its exclusion alters the intended purpose of the factor significantly. For
the purpose of this study only items that achieved factor loadings and communalities
above 0.5 were accepted, this ensured a high standard of data quality.
4.8.2 Descriptive statistics
Descriptive statistics involves the summation of findings from each of the questions found
within a questionnaire. This study made use of three descriptive statistical techniques,
namely, measures of location (mean), measures of variability (standard deviation) and
measures of shape (skewness and kurtosis).
4.8.2.1 Measures of location
Malhotra (2010:486) states that measures of location or central tendency, are used to
indicate where the central point of a frequency distribution lies. The mean, median and
mode are common measures of location (Zikmund & Babin, 2010:328). For the purpose
of this study, the mean values of all scaled response items were computed.

92
The mean, or average value, is one of the most commonly used measures of location
and involves simply adding up all the response values of an item and then dividing that
answer by the total number of responses for that item (Hair et al., 2002:533). Even though
this is a simple procedure, Malhotra (2010:486) believes it is a robust measure that is not
easily affected when response values are added or deleted.
4.8.2.2 Measures of variability
Measures of variability allow one to quantify the spread of a distribution over a range of
values or to determine the degree to which data-scores group together (Pietersen &
Maree, 2016:208). Variability measures include the range, interquartile range, variance,
standard deviation and coefficient of variation, which are calculated on interval or ratio
data (Malhotra, 2010:487). This study made use of the standard deviation measure.
The standard deviation is loosely defined as the average distance of each variable from
the mean score, making it the most appropriate measure of spread whenever the mean
is used as the measure of location (Bradley, 2013:268).
4.8.2.3 Measure of shape
The shape or normality of any distribution is described by two numerical measures called
the degree of skewness and the degree of kurtosis (Pietersen & Maree, 2016:210). Hair
et al. (2014:69) state that the kurtosis and skewness of a normal distribution are assigned
values of zero and any values recorded above +2 or below -2 indicate a strong deviation
from normality. Measures of kurtosis and skewness can help one understand the nature
of distribution of the data, and are best represented by using a graph whereby an upside
bell that is relatively symmetric in shape is considered normally distributed (Malhotra,
2010:488-489).
Skewness comprises two types of distributions, namely symmetrical distributions and
skewed distributions. In symmetrical distributions, the mean, median, and mode of data
values are all equal, thus, having equal data values on both sides of the centre of the
distribution (Malhotra, 2010:488). In contrast, skewed distributions do not have equal data
values on both sides. In this case, the standard deviation from the mean is larger in one
direction than in another (Shukla, 2010:45). Pietersen and Maree (2016:211) describe

93
skewness to the right as a positively skewed distribution, and skewness to the left as a
negatively skewed distribution.
The relative “peakedness” or “flatness” observed in a distribution is referred to as kurtosis
(Hair et al., 2014:69). Kurtosis, which is closely linked to the standard deviation of a
distribution, is classified into three main types of distributions. The first is a normal
distribution where data values are near or equal to zero. The second is an abnormally
peaked distribution, which contains a positive kurtosis value, and the third is an
abnormally flat distribution, which contains a negative kurtosis value (Pietersen & Maree,
2016:211; Malhotra, 2010:488).
The following section details the process to be followed when conducting SEM.
4.8.3 Structural equation modelling
SEM combines multiple statistical techniques into one unified approach aimed at
answering formulated hypotheses. SEM can be deconstructed into two procedures,
namely confirmatory factor analysis and path analysis (Malhotra, 2010:726-727).
According to Hair et al. (2014:565), there are six stages that need to be followed in order
to conduct SEM successfully. The procedure is outlined in Figure 4-4.
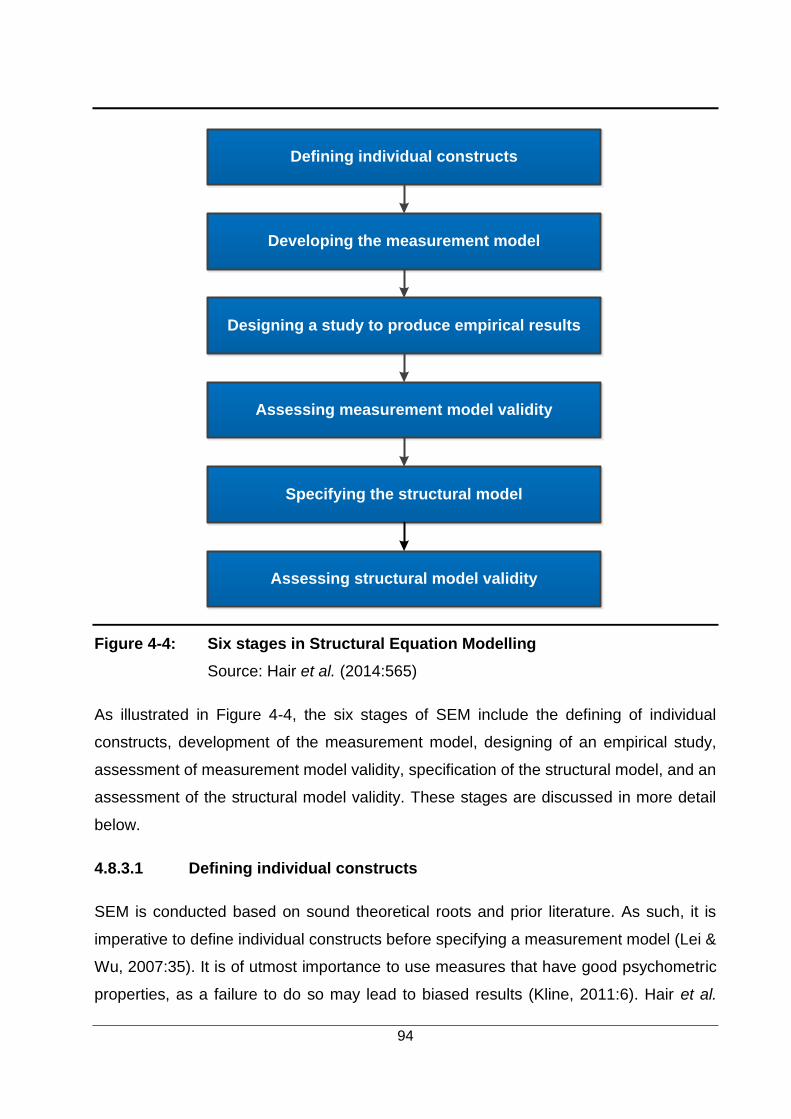
94
Defining individual constructs
Developing the measurement model
Specifying the structural model
Designing a study to produce empirical results
Assessing measurement model validity
Assessing structural model validity
Figure 4-4: Six stages in Structural Equation Modelling
Source: Hair et al. (2014:565)
As illustrated in Figure 4-4, the six stages of SEM include the defining of individual
constructs, development of the measurement model, designing of an empirical study,
assessment of measurement model validity, specification of the structural model, and an
assessment of the structural model validity. These stages are discussed in more detail
below.
4.8.3.1 Defining individual constructs
SEM is conducted based on sound theoretical roots and prior literature. As such, it is
imperative to define individual constructs before specifying a measurement model (Lei &
Wu, 2007:35). It is of utmost importance to use measures that have good psychometric
properties, as a failure to do so may lead to biased results (Kline, 2011:6). Hair et al.

95
(2014:567) stress the use of a validated measurement theory when defining constructs
in order to achieve optimal results. Taking this into account, the study made use of
previously validated scales as per prior literature that have been found to be valid and
reliable measures.
4.8.3.2 Developing the measurement model
The measurement model is developed and specified once the constructs have been
defined. Through a confirmatory factor analysis, the measurement model tests
hypothesised constructs as specified by the literature (Malhotra, 2010:729). In other
words, a measurement model is used to confirm if previously unexpressed relationships
between observed variables and latent (unobserved) factors are valid (In’namie &
Koizumi, 2013:25). This is done by assigning the relevant observed variables to each
latent factor and is represented graphically by arrows leading from defined constructs
(latent factors) to each of the observed correlated variables assigned to those constructs
(Teo, Tsai & Yang, 2013:6; Kline, 2011:95). The parameters of the measurement model
consist of loading estimates, error estimates, and latent factor correlations; whilst the first
loading of each of the latent factors is fixed at 1.0 (Teo et al., 2013:8-9).
Once the parameters of the measurement model have been set, the model must be
scrutinised for any problematic estimates. Any standardised factor loadings above 1.0 or
below -1.0 must be avoided, as well as any problematic Heywood cases, which are
negative error variances. If problematic estimates do occur, the corresponding loading(s)
may need to be excluded to rectify the measurement model (Hair et al., 2014:616;
Malhotra, 2010:735).
4.8.3.3 Designing a study to produce empirical results
According to Hair et al. (2014:569), it is important to select an appropriate research design
to avoid unexpected issues or errors when carrying out SEM. Undesirable results often
occur due to the chosen sample size and/or model estimation technique(s). Therefore, it
is prudent to avoid such issues before assessing the validity of the measurement model.
As such, Byrne (2010:76) indicates that smaller sample sizes (≤100) must be avoided as
they generally produce unreliable results.

96
When model estimation takes place, various techniques are used to determine the value
of the unknown parameters and the error associated with the estimated value (Teo et al.,
2013:12). The selection of an appropriate technique is vitally important and Hair et al.
(2014:575) opines the use of the maximum likelihood estimation (MLE). MLE is an
estimation technique that is popular amongst researchers as it is both effective and
efficient in assuming multivariate normality.
This study had a sample size of 600 Generation Y students and made use of the MLE
technique to assess multivariate normality.
4.8.3.4 Assessing measurement model reliability and validity
When assessing measurement model reliability and validity, it is necessary to consider
the internal-consistency and composite reliability, and the construct validity.
The Cronbach’s alpha coefficient is the most commonly used measure for testing internal-
consistency reliability and was the measure utilised in this study. Sarstedt and Mooi
(2014:256) indicate that scales producing Cronbach’s alpha values of ≥0.60 are deemed
acceptable, but ideally should not fall below 0.70. Moreover, scales that are larger
(contain ten or more items) and more complex usually lead to higher Cronbach’s alpha
values being produced. In this case, it is recommended that scales produce Cronbach’s
alpha values of ≥0.80. Hair et al. (2014:90) state that scales are deemed as having
excellent reliability when producing values of ≥0.90.
Malhotra (2010:733) defines composite reliability as the relationship between true score
variance and total score variance extracted from the variables. According to Hair et al.
(2014:619), a measurement model’s latent factors that obtain CR values above 0.70 are
deemed reliable, while any values ranging between 0.60 and 0.70 are also acceptable.
The formula to calculate CR is as follows:
[(Fl1+Fl2+Fl3+...)2 / (Fl1+Fl2+Fl3+...)2 + (err1+err2+err3+...)]
In construct validity, one tests if the constructs clearly measure what they intended to
measure based on the theory (Malhotra, 2010:30). Therefore, construct validity bridges
the gap between the theoretical background and the measurement scale. There are three

97
types of construct validity. These are convergent validity, discriminant validity and
nomological validity.
Nomological validity tests the degree of correlation between constructs in the measuring
instrument, revealing relatable constructs (Shukla, 2010:27). In this study, nomological
validity was assessed using Pearson’s Product-Moment correlation coefficient.
Clow and James (2014:271) describe convergent validity as the degree of correlation
between measures of a construct and if those measures were meant to be correlated.
Malhotra (2010:734) states that convergent validity is assessed through SEM by looking
at two measures, namely the size of the factor loadings and by estimating the average
variance extracted (AVE). Hair et al. (2014:618-619) indicate that factor loadings and AVE
values calculated at 0.50 or above are considered acceptable for construct convergence.
The AVE is calculated using the following formula:
[(Fl12+Fl22+Fl32+...) / (Fl12+Fl22+Fl32+...) + (err1+err2+err3+...)]
Discriminant validity indicates how measures are uniquely associated to one construct,
with no signs of high correlation with other constructs (Zikmund & Babin, 2010:251).
Through SEM, discriminate validity is evaluated by comparing correlation coefficients of
the measurement model to the square root of the construct AVE values (Byrne, 2010:290-
291). Discriminant validity is proven when the square root of the AVE of one construct is
higher than the correlation coefficients of the remaining constructs (Hair et al., 2014:620).
Once all three types of validity have been proven, the measurement model must be
assessed for acceptable levels of goodness-of-fit indices. Hair et al. (2014:576) state that
goodness-of-fit indicators determine “how well the measurement model reproduces the
covariance matrix amongst the indicator items”. There are three goodness-of-fit
measures, namely, absolute fit indices, incremental fit indices and parsimony fit indices
(Malhotra, 2010:731). Absolute fit indices determine the degree to which a measurement
model recreates observed data. Incremental fit indices compare the improvement in fit of
the measurement model with a baseline model, and parsimony fit indices are used to
compare models of different complexity (Teo et al., 2013:14; Kline, 2011:196; Malhotra,
2010:731).

98
This study made use of both absolute fit indices and incremental fit indices. The absolute
fit indices used include the chi-square, degrees of freedom, standardised root mean
residual (SRMR), and the root mean square error of approximation (RMSEA). The
incremental fit indices used include the goodness-of-fit index (GFI), comparative fit index
(CFI), incremental fit index (IFI), and Tucker-Lewis index (TLI). Hair et al. (2014:631)
state that values greater than 0.90 are considered acceptable for GFI, CFI, IFI and TLI,
and Malhotra (2010:732) indicates that a value of less than 0.08 for SRMR and RMSEA
suggests an acceptable model fit.
4.8.3.5 Specifying the structural model
Once reliability and validity is proven and the measurement model displays acceptable
goodness-of-fit, a structural model may be specified. Specification of a structural model
involves drawing path arrows from one construct to another, thereby indicating a
relationship between them as defined by the literature (Hair et al., 2014:631). This is
known as path analysis and is used to determine a pattern of relationships between
constructs. These patterns indicate the direct or indirect effect of independent constructs
on other dependant constructs (Seker, 2013:159). The individual paths observed
between constructs represent hypothesised relationships that are based on existing
literature (Hair et al., 2014:585).
4.8.3.6 Assessing structural model validity
As with the measurement model, the validity of the structural model must be assessed
once it has been specified. This last stage in SEM commences once the validity and
reliability of the measurement model was deemed acceptable. The hypothesised
theoretical relationships specified through path analysis are typically tested at the a=0.01
level. It is also necessary to assess the model fit indices outlined in Section 4.8.3.4.
In addition, Malhotra (2010:736) states that the structural model should be compared with
competing models to assess whether or not it represents the best possible fit. Kline
(2011:220) indicates that one must consider both the Akaike’s information criterion
(denoted as AIC) and Bozdogan’s consistent version of the AIC (denoted as CAIC) when
comparing two or more models, where smaller values between competing models
suggest better fit.

99
4.8.4 Two independent-samples t-test
A t-test utilises the t-distribution to determine if there are any statistically significant
differences between two groups or samples. It was created as an alternative to the
previously popular Z-test (Malhotra, 2010:504-505; Hair et al., 2002:542). The Z-test,
which is used to determine the location of a distribution in a data set, is based on rigid
assumptions and produces results that are difficult to justify (Smith & Albaum, 2010:299).
The t-test eliminates this by focusing only on sample means and variances (Hair et al.,
2002:542).
There are three main types of t-tests, namely, the one sample t-test, the two independent-
samples t-test, and the paired sample t-test (Zikmund & Babin, 2010:378-382). This study
made use of the two independent-samples t-test to test if there are any significant
differences in gender in terms of Generation Y students’ mobile gaming brand loyalty.
The main aim of the two independent-samples t-test is to determine if incongruences
observed are indeed significant and not attributed to random sampling error (Clow &
James, 2014:300)
4.8.5 Cohen’s D-statistic
After conducting a t-test, Pallant (2016:144) suggests using the Cohen’s D-statistic
(denoted as D) to determine the practicality and size of any statistically significant
difference. Cohen’s D-statistic categorises the levels of practical significance as follows:
• 0.20 ≤ d ≤ 0.50: indicates a small practical significance
• 0.50 ≤ d ≤ 0.80: indicates a medium practical significance
• 0.80 ≤ d: indicates a large practical significance.
4.9 CONCLUSION
The primary purpose of Chapter 4 was to discuss, in detail, the research methodology
followed in obtaining and analysing requisite data for the empirical portion of this study.
A descriptive research design using the single cross-sectional survey method was
employed to achieve the research objectives formulated in Chapter 1.

100
The sample frame comprised three publicly registered HEI campuses: one traditional
university, one university of technology, and one comprehensive university. The survey
method, specifically using a self-administered questionnaire, was chosen as the most
appropriate technique for collecting the required primary data. The questionnaire was
distributed to a convenience sample of 600 Generation Y students located at each of the
three campuses (200 students per campus). The data was captured and analysed using
the statistical programmes Microsoft SPSS and AMOS versions 25. The statistical
methods applied to the data set included exploratory factor analysis, reliability and validity
analysis, descriptive statistical analysis, SEM and a two independent-samples t-test.
In Chapter 5, the empirical findings from the pilot test and main study are analysed and
interpreted, with conclusions drawn based on the formulated hypotheses.
101
CHAPTER 5
DATA ANALYSIS AND INTERPRETATION OF FINDINGS
5.1 INTRODUCTION
In accordance with the research methods and data collection procedures outlined in
Chapter 4, the objective of this chapter is to report and interpret the empirical findings of
the study. These findings are linked to the primary objective of this research study, which
is to determine the antecedents of mobile gaming brand loyalty amongst Generation Y
students in South Africa.
The data analysis presented in this chapter involved a two-stage process. The first stage
analysed the pilot test results (Section 5.2) of the questionnaire and the data gathering
process (Section 5.3), preliminary data analysis (Section 5.4) and concluded with a
demographic profile of the participants (Section 5.5). The latter provided meaningful
background and context to the sample, as well as displaying the extent to which the
sample is representative of the total population.
The second stage of the data analysis reported the findings from the main survey. Once
the pilot test revealed acceptable results and the acquired data was thoroughly analysed
and cleaned, statistical analysis was carried out using an exploratory factor analysis
(Section 5.6), a descriptive statistical analysis (Section 5.7), nomological validity analysis
and a collinearity diagnostics assessment (Section 5.8). The hypotheses are outlined in
Section 5.9. Thereafter, SEM was carried out (Section 5.10), which included specifying a
measurement model through confirmatory factor analysis and specifying structural
models. The measurement model was evaluated by scrutinising various model fit indices
and was tested for reliability and validity using Cronbach alphas, CR, AVE, squared root
of the AVE values and the correlation coefficients of the model. Competing models were
introduced to test the formulated hypotheses using path analysis after the measurement
model displayed acceptable levels of fit, reliability and validity. The final section (Section
5.11) presents the findings of the two independent-samples t-test, which was used to test
the hypothesis concerning gender differences related to Generation Y students’ mobile
gaming brand loyalty and the antecedents thereof.

102
5.2 PILOT TESTING OF QUESTIONNAIRE
To assess the internal-consistency reliability of the measuring instrument, a pilot study
was conducted before implementing the main study. The test was conducted on 50
Generation Y students at a South African HEI campus that did not form part of the
sampling frame stipulated in Chapter 4. Of the 50 questionnaires that were distributed,
41 viable questionnaires remained for analysis after data cleaning. Table 5-1 provides a
summary of the pilot test results.
Table 5-1: Pilot testing results
Constructs Number of
items Mean
Std. Deviation
N Cronbach’s
alpha coefficient (α)
Satisfaction 5 4.56 0.77 41 0.64
Challenge 4 4.30 0.99 41 0.77
Game identification
5 3.43 1.31 41 0.87
Flow 6 4.48 0.85 41 0.78
Psychological commitment
4 3.79 1.13 41 0.82
Behavioural loyalty
5 3.30 1.15 41 0.80
As indicated in Table 5-1, there is evidence that all constructs with scaled responses
achieved Cronbach’s alpha coefficients values above the acceptable limit of 0.60 (Hair et
al. 2014:90). In terms of the six-point Likert scale used, the mean values of the responses
were close to or greater than 3.5 for all six constructs; therefore, suggesting a slight level
of agreement amongst Generation Y students pertaining to the antecedents of mobile
gaming brand loyalty.
As such, the constructs used during the pilot test displayed acceptable internal-
consistency reliability and the measurement instrument was deemed suitable for the main
study.
The next section summarises the data gathering process followed during the main study.

103
5.3 DATA GATHERING PROCESS
The final questionnaire utilised in the study contained 29 scaled response items, seven
demographic questions and one question pertaining to smartphone usage. These
questions were grouped into two sections (see Section 5.4.1). The data was collected
from registered full-time students who were enrolled at one of three HEI campuses
located in the Gauteng province. Lecturers at each of the participating HEIs were asked
to act as a custodian for the students, and were presented with a copy of the questionnaire
and the ethical clearance certificate. Upon their confirmation that the study was not in
breach of any ethical code, fieldworkers distributed questionnaires at a time specified by
the lecturer in order to avoid any unintended disruptions to learning sessions.
The students were informed that their participation was strictly voluntary and that all
information they provided, including the name of the HEI they were registered at, would
remain in anonymity. As indicated by the sampling method set out in Chapter 4 (Section
4.3.4), 600 questionnaires were distributed equally between the three HEI campuses
chosen.
5.4 PRELIMINARY DATA ANALYSIS
A preliminary data analysis undertaken in this study included the coding, cleaning and
tabulation of the collected data.
5.4.1 Coding
The questionnaire used in the main study comprised two sections, namely Section A,
which contained eight demographical questions, and Section B, which measured the
antecedents of mobile gaming brand loyalty. The latter comprises the constructs of
satisfaction, challenge, identification, flow, psychological commitment and behavioural
loyalty. All respondents received the same questionnaire. Table 5-2 presents the variable
codes and assigned values.

104
Table 5-2: Coding information at the main study
Section A: Demographical data
Question Code Target Variable Value assigned to responses
Question 1 A1 Name of institution
A (1), B (2), C (3)
Question 2 A2 Year of study 1st year (1), 2nd year (2), 3rd year (3), Post-graduate (4)
Question 3 A3 Gender Female (1), Male (2)
Question 4 A4 Ethnicity African (1), Coloured (2), Indian/Asian (3), White (4)
Question 5 A5 Home province Eastern Cape (1), Free State (2), Gauteng (3), KwaZulu-Natal (4), Limpopo (5), Mpumalanga (6), North West (7), Northern Cape (8), Western Cape (9)
Question 6 A6 Home Language Afrikaans (1), English (2), IsiNdebele (3), IsiXhosa (4), IsiZulu (5), Sesotho sa Leboa (6), Sesotho (7), Setswana (8), SiSwati (9), Tshivenda (10), Xitsonga (11)
Question 7 A7 Age Younger than 18 years (1) 18 years (2), 19 years (3), 20 years (4), 21 years (5), 22 years (6), 23 years (7), 24 years (8), Older than 24 years (9)
Question 8 A8 Smart phone usage experience (years)
Less than 1 (1); 1-2 (2); 2-3 (3); 3-4 (4); 4-5 (5); More than 5 (6)
Section B: Antecedents of mobile gaming brand loyalty
Item Code Construct measured
Value assigned to responses
Items 1-5 B1-B5 Satisfaction Strongly disagree (1), Disagree (2), Slightly disagree (3), Slightly agree (4), Agree (5), Strongly agree (6)
Items 6-9 B6-B9 Challenge Strongly disagree (1), Disagree (2), Slightly disagree (3), Slightly agree (4), Agree (5), Strongly agree (6)
Items 10-14 B10-B14 Game identification
Strongly disagree (1), Disagree (2), Slightly disagree (3), Slightly agree (4), Agree (5), Strongly agree (6)

105
Table 5-2: Coding information at the main study (continued …)
Section B: Antecedents of mobile gaming brand loyalty
Item Code Construct measured
Value assigned to responses
Items 15-20 B15-B20 Flow Strongly disagree (1), Disagree (2), Slightly disagree (3), Slightly agree (4), Agree (5), Strongly agree (6)
Items 21-24 B21-B24 Psychological commitment
Strongly disagree (1), Disagree (2), Slightly disagree (3), Slightly agree (4), Agree (5), Strongly agree (6)
Items 25-29 B25-B29 Behavioural loyalty
Strongly disagree (1), Disagree (2), Slightly disagree (3), Slightly agree (4), Agree (5), Strongly agree (6)
The data cleaning carried out on the data set is described in the following section.
5.4.2 Data Cleaning
For the purpose of this study, questionnaires that contained more than 10 percent of
missing responses were discarded. Furthermore, in the case of questionnaires that had
less than 10 percent missing responses, the missing responses were replaced by using
the mode of the total responses for those items.
5.4.3 Tabulation of variables
Following the coding and cleaning of data, came its organisation into response categories
using the tabulation process. Table 5-3 displays the frequencies of the scaled responses
observed in the study.

106
Table 5-3: Frequency table of responses
Scale item Strongly disagree
Disagree Slightly disagree
Slightly agree
Agree Strongly
agree
1 2 3 4 5 6
Construct 1: Satisfaction
B1 11 19 39 114 170 111
B2 16 29 52 135 161 71
B3 17 17 47 114 167 102
B4 37 64 52 105 119 87
B5 8 16 31 87 181 141
Construct 2: Challenge
B6 16 25 50 129 141 103
B7 14 27 63 116 149 95
B8 16 39 70 128 145 66
B9 35 52 68 114 126 69
Construct 3: Game identification
B10 64 66 76 109 96 53
B11 41 58 67 122 121 55
B12 75 68 89 95 83 54
B13 96 83 63 84 92 46
B14 85 72 76 99 90 42

107
Table 5-3: Frequency table of responses (continued …)
Scale item Strongly disagree
Disagree Slightly disagree
Slightly agree
Agree Strongly
agree
1 2 3 4 5 6
Construct 4: Flow
B15 26 28 61 114 158 77
B16 13 10 32 74 189 146
B17 39 58 59 108 120 80
B18 9 23 35 85 133 179
B19 18 21 58 90 166 111
B20 34 46 67 134 123 60
Construct 5: Psychological commitment
B21 28 39 83 123 137 54
B22 38 63 67 128 109 59
B23 46 63 76 99 122 58
B24 44 66 76 106 100 72
Construct 6: Behavioural loyalty
B25 78 71 65 99 101 50
B26 70 77 60 100 100 57
B27 92 68 64 93 102 45
B28 119 71 63 90 67 54
B29 74 66 53 97 107 67
The next section provides an analysis of the demographic data obtained from the
participants observed in this study.
5.5 DEMOGRAPHIC ANALYSIS
This section presents a detailed analysis of the sample’s characteristics. Of the 600
questionnaires that were distributed, 540 were returned, of which, only 464 were viable

108
for use after data cleaning. This equals a response rate of 86 percent. Note that the
percentages in the figures that follow have been rounded off to the nearest whole number
for easier interpretation.
As illustrated in Figure 5-1, there was almost an equal response rate amongst the
selected HEI campuses. University A made up 35 percent of the sample, followed by
University B with 33 percent and University C made up the remaining 32 percent.
Figure 5-1: Response rate of Institutions
Figure 5-2 displays the respondents’ current year of study. It shows that 39 percent of the
sample was first year students, which was the same amount recorded for second year
35%
33%
32%
Institutions
University A - Traditional
University B - Technical
University C - Comprehensive

109
students. Third year students constituted a further 21 percent, and the final 1 percent was
made up from post-graduate students.
Figure 5-2: Respondents’ current year of study
As seen in Figure 5-3, there were slightly more female respondents (53%) than male
respondents (47%) within the sample.
39%
39%
21%
1%
Year of Study
1st Year
2nd Year
3rd Year
Post-Graduate

110
Figure 5-3: Gender profile of respondents
Figure 5-4 depicts the designated ethnic groups of respondents in the sample. The
majority of respondents indicated their designated group as being African (86%), followed
by White (11%), Coloured (2%) and Indian/Asian (1%).
47%53%
Gender
Male Female
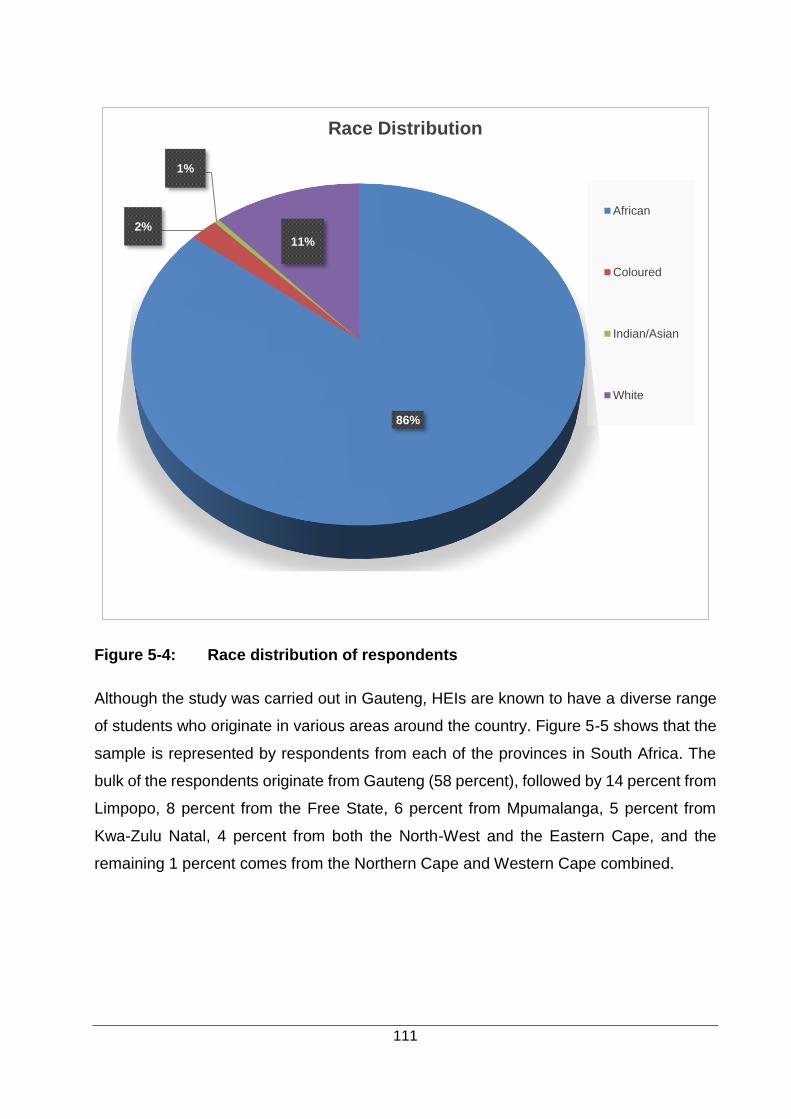
111
Figure 5-4: Race distribution of respondents
Although the study was carried out in Gauteng, HEIs are known to have a diverse range
of students who originate in various areas around the country. Figure 5-5 shows that the
sample is represented by respondents from each of the provinces in South Africa. The
bulk of the respondents originate from Gauteng (58 percent), followed by 14 percent from
Limpopo, 8 percent from the Free State, 6 percent from Mpumalanga, 5 percent from
Kwa-Zulu Natal, 4 percent from both the North-West and the Eastern Cape, and the
remaining 1 percent comes from the Northern Cape and Western Cape combined.
86%
2%
1%
11%
Race Distribution
African
Coloured
Indian/Asian
White

112
Figure 5-5: Respondents’ province of origin
Figure 5-6 indicates the respondents’ home language. Results show 21 percent of
respondents indicated that their home language is isiZulu, followed by Sesotho (20%),
Afrikaans (10%) and Setswana (10%), Xhosa (9%), Xitsonga (8%) and Sesotho sa Leboa
(8%), English (4%) and SiSwati (4%), Tshivenda (3%), and Ndebele (2%). As such, all of
South Africa’s 11 official languages were represented in the sample.
4%
8%
58%
5%
14%
6%
4%
1%
Province of origin
Eastern Cape
Free State
Gauteng
Kwa-Zulu Natal
Limpopo
Mpumalanga
North-West
Northern Cape
Western Cape

113
Figure 5-6 Respondents’ home language
As illustrated by Figure 5-7, the respondents’ age distribution ranged from 18 to 24. This
indicates a representative sample of the target population as outlined in Chapter 4
(Section 4.3.1). The respondents aged 21 (24%) and 20 (22%) make up most of the
sample size, but are closely followed by respondents of the age of 19 (16%). The rest of
the age distribution is as follows: 22 years old (15%), 23 years old (12%), 18 years old
(7%), and 24 years old (4%).
10%
4%
2%
9%
21%
8%
20%
10%
4%
3%
8% 1%
Mother tongue language
Afrikaans
English
Ndebele
Xhosa
Zulu
Sesotho sa Leboa
Sesotho
Sestswana
Siswati
Tshivenda
Xitshonga
Other

114
Figure 5-7: Age distribution of respondents
The proceeding section outlines the exploratory factor analysis conducted.
5.6 EXPLORATORY FACTOR ANALYSIS
In this study, an exploratory principle components analysis using oblique promax rotation
was followed to determine if any items loaded on the incorrect factor or cross-loaded. As
the point of departure, the Kaizer-Meyer-Olkin (KMO) test of sampling adequacy and
Bartlett’s Test of Sphericity were performed on the data. The tests returned satisfactory
values with a KMO=0.940 and chi square Bartlett test=6750 (df=351) at a significance
level of p=0.000<0.05.
Once the factorability of the data was established, communalities emanating from the
exploratory principle components analysis were assessed and items with values below
0.50 were excluded from the final factor analysis as indicated by Hair et al. (2014:117).
These items include B17 (0.44) and B20 (0.49) from the construct flow. Thereafter, six
7%
16%
22%
24%
15%
12%4%
Age
18 Years
19 Years
20 Years
21 Years
22 years
23 Years
24 Years

115
factors were specified for extraction based on prior literature. Based on the results from
the extraction, the six factors explained 66.30 percent of total variance. Problematic
cross-loadings were observed in the items B1 and B5 in the satisfaction scale (Lu &
Wang, 2008:518-519) and B15 in the flow scale (Choi & Kim, 2004:16-17). Upon careful
examination, it was decided that these items could be deleted without altering the
intended purpose of the original constructs. As such, satisfaction and flow then become
three-itemed scales.
The exploratory factor analysis was then rerun excluding the aforementioned items. The
analysis produced a KMO of 0.934 and a Bartlett’s test score of 5811.810 (df=276;
p=0.000 < 0.05), which explained 68.30 percent of the variance. Table 5-4 below depicts
the rotated factors from the pattern matrix, communalities of the factors and the
percentage variance extracted.
Table 5-4: Exploratory principle components analysis
Items Factor loadings Communalities
1 2 3 4 5 6
B2 .704 .645
B3 .800 .672
B4 .784 .595
B6 .851 .715
B7 .839 .678
B8 .829 .660
B9 .703 .569
B10 .695 .645
B11 .615 .602
B12 .849 .742
B13 .938 .751
B14 .712 .663

116
Table 5-5: Exploratory principle components analysis (continued…)
Items Factor loadings Communalities
1 2 3 4 5 6
B16 .790 .711
B18 .965 .805
B19 .578 .585
B21 .827 .685
B22 .808 .752
B23 .856 .692
B24 .854 .729
B25 .825 .726
B26 .755 .719
B27 .856 .710
B28 .833 .662
B29 .810 .680
Percentage variance
39.48 9.44 5.90 5.27 4.54 3.67
As is evident in Table 5-4, in the second exploratory factor analysis the factors aligned
with the specified constructs indicating that the variables loaded as expected and were
all above the 0.50 cut-off level. Furthermore, the factors explained 68.30 percent of the
total variance (Hair et al., 2014:117).
The subsequent section, Section 5.7, provides a summary of the descriptive statistics
derived from the acquired data.
5.7 DESCRIPTIVE STATISTICS
This section addresses the first empirical objective of the study. Given that this study
employed a six-point Likert scale that ranged from “strongly disagree” (1) to “strongly
agree” (6), mean values of ≥3.5 are associated with a positive agreement towards the

117
antecedents of mobile gaming brand loyalty amongst the sampled Generation Y students.
As such, descriptive statistics is used to address the first empirical objective of this study
(refer to Section 1.3.3 in Chapter 1). The results are presented in Table 5-5.
Table 5-6: Descriptive statistics
Factors Valid N Mean Std.
Deviation Skewness Kurtosis
Satisfaction 464 4.30 1.05 -0.67 0.40
Challenge 464 4.24 1.07 -0.54 0.07
Game identification 464 3.50 1.29 -0.17 -0.80
Flow 464 4.72 1.03 -1.10 1.29
Psychological commitment 464 3.90 1.24 -0.34 -0.62
Behavioural loyalty 464 3.50 1.38 -0.14 -0.99
As seen in Table 5-5, means of ≥3.5 were recorded for all constructs, with satisfaction
(mean=4.30), challenge (mean=4.24), game identification (mean=3.50), flow
(mean=4.72), psychological commitment (mean=3.90) and behavioural loyalty
(mean=3.50). This indicates that Generation Y students exhibit both positive
psychological commitment and behavioural loyalty toward their favourite mobile game,
meaning they are brand loyal to their favourite mobile game. Moreover, Generation Y
students experience satisfaction with their favourite mobile game, while responding
positively to the challenges posed in their favourite mobile game. Generation Y students
also identify positively with their favourite mobile game, in terms of in-game characters,
social communities and/or the virtual worlds they present. Lastly, the strongest positive
response displayed by Generation Y students is concerning the flow construct, meaning
that their favourite mobile game has created an optimal gaming experience for them.
Data normality is assumed as the kurtosis values provide no indication of irregularity and
all skewness values fall within the range of -2 and +2, as recommended (Berndt & Petzer,
2011). The negatively skewed values are indicative of high scores in the distribution,
which means that the distribution falls into the agreement area of the scale. The highest
standard deviation was recorded for behavioural loyalty (Std. Deviation=1.38), thereby
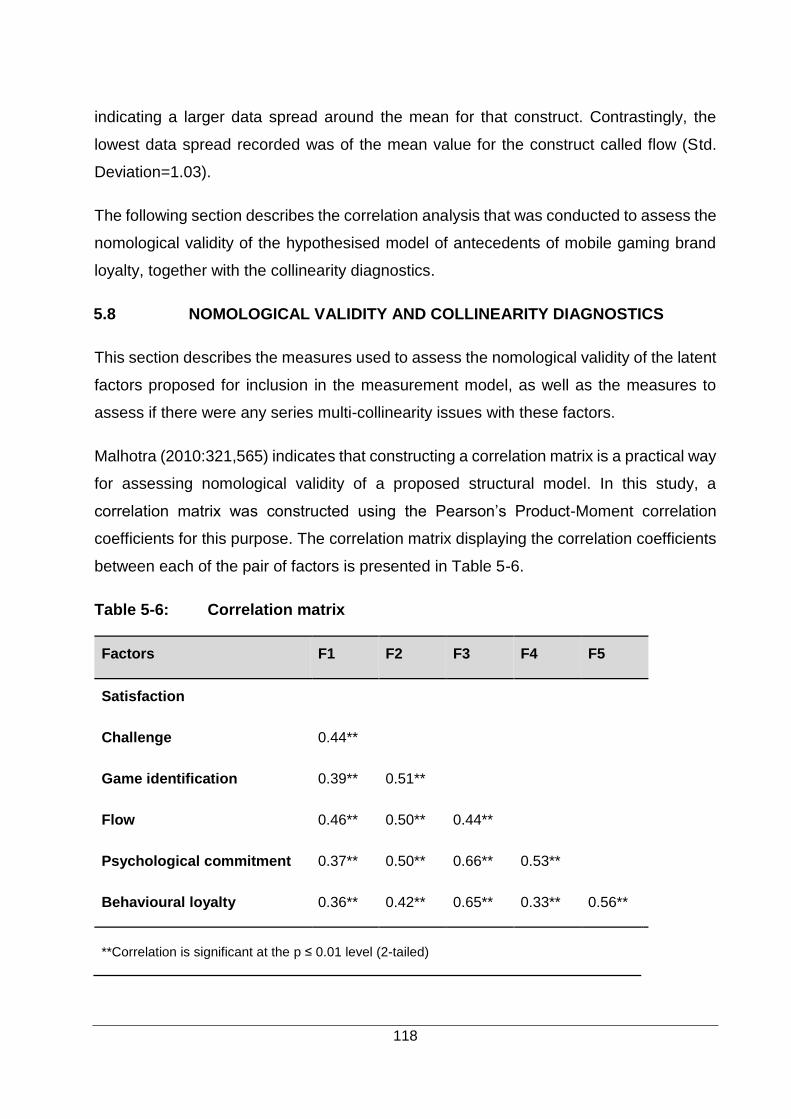
118
indicating a larger data spread around the mean for that construct. Contrastingly, the
lowest data spread recorded was of the mean value for the construct called flow (Std.
Deviation=1.03).
The following section describes the correlation analysis that was conducted to assess the
nomological validity of the hypothesised model of antecedents of mobile gaming brand
loyalty, together with the collinearity diagnostics.
5.8 NOMOLOGICAL VALIDITY AND COLLINEARITY DIAGNOSTICS
This section describes the measures used to assess the nomological validity of the latent
factors proposed for inclusion in the measurement model, as well as the measures to
assess if there were any series multi-collinearity issues with these factors.
Malhotra (2010:321,565) indicates that constructing a correlation matrix is a practical way
for assessing nomological validity of a proposed structural model. In this study, a
correlation matrix was constructed using the Pearson’s Product-Moment correlation
coefficients for this purpose. The correlation matrix displaying the correlation coefficients
between each of the pair of factors is presented in Table 5-6.
Table 5-6: Correlation matrix
Factors F1 F2 F3 F4 F5
Satisfaction
Challenge 0.44**
Game identification 0.39** 0.51**
Flow 0.46** 0.50** 0.44**
Psychological commitment 0.37** 0.50** 0.66** 0.53**
Behavioural loyalty 0.36** 0.42** 0.65** 0.33** 0.56**
**Correlation is significant at the p ≤ 0.01 level (2-tailed)

119
As is evident from Table 5-6, all corresponding factors recorded positive significant
correlation coefficients (p≤0.01). The strongest coefficients were between game
identification and psychological commitment (r = 0.66, p<0.01), and between
psychological commitment and behavioural loyalty (r = 0.56, p<0.01). These results are
indicative that the proposed constructs to be included in the measurement model display
nomological validity.
Checking for multi-collinearity between independent factors is a necessity when
conducting multivariate statistical techniques. As such, SPSS Statistics Collin instruction
was used to evaluate if any multi-collinearity was present between the independent
constructs. The case number was set as the dummy dependent variable. The collinearity
diagnostics output is reported in Table 5-7.
Table 5-7: Collinearity diagnostics
Dimension Condition
index Constant F2 F3 F4 F5 F6
1 1.000 0.0 .00 .00 .00 .00 .00
2 8.42 .08 .05 .01 .36 .02 .09
3 12.55 .00 .19 .00 .45 .05 .60
4 13.68 .00 .42 .72 .00 .00 .09
5 14.60 .53 .33 .26 .17 .04 .07
6 16.72 .39 .01 .01 .02 .89 .15
Tolerance .71 .61 .51 .60 .48
VIF 1.40 1.64 1.96 1.67 2.10
Table 5-7 shows no evidence of multi-collinearity between the independent variables of
satisfaction, challenge, game identification, flow and psychological commitment, owing to
the last root has a condition index below 0.30 and none of the factors have more than
one variance proportion greater than 0.50 (Field, 2009:242). In addition, tolerance values
indicate the level of variance in the independent variable, which has not been accounted
for by the remaining independent variables. Using the formula 1-R2, tolerance levels of
120
≤0.10 and variance inflation factor (VIF) values of ≥10 are problematic (Orme & Combs-
Orme, 2009:27).
The formulated hypotheses, which were tested using SEM and a two independent-
samples t-test, are outlined in the next section.
5.9 HYPOTHESIS TESTING
This section reiterates the hypotheses set out in Chapter 1 (Section 1.3.3). Hypothesis
formulation occurred after the literature was comprehensively reviewed in Chapter 2 and
Chapter 3. For this study, the significance level was fixed at the 99 percent confidence
interval; that is, a=0.01. The following decision rule was applied:
If P-value ≥ α, then conclude H0.
If P-value < α, then conclude Ha.
The following five hypotheses were formulated and tested:
Ho1: Antecedents of mobile gaming brand loyalty is not a six-factor structure
comprising mobile gaming satisfaction, challenge, game identification, flow,
psychological commitment and behavioural loyalty.
Ha1: Antecedents of mobile gaming brand loyalty is a six-factor structure comprising
mobile gaming satisfaction, challenge, game identification, flow, psychological
commitment and behavioural loyalty.
Ho2: Satisfaction (+), challenge (+) and game identification (+) do not positively
influence the mobile gaming flow experienced by Generation Y students.
Ha2: Satisfaction (+), challenge (+) and game identification (+) do positively influence
the mobile gaming flow experienced by Generation Y students.
Ho3: Flow (+) does not positively influence the psychological commitment of
Generation Y students toward their favourite mobile game.
Ha3: Flow (+) does positively influence the psychological commitment of Generation Y
students toward their favourite mobile game.

121
Ho4: Psychological commitment (+) does not positively influence Generation Y
students’ behavioural loyalty toward their favourite mobile game.
Ha4: Psychological commitment (+) does positively influence Generation Y students’
behavioural loyalty toward their favourite mobile game.
Ho5: There is no statistically significant difference between male and female
Generation Y students’ mobile gaming satisfaction, challenge, game
identification, flow, psychological commitment and behavioural loyalty concerning
mobile gaming brand loyalty.
Ha5: There is a statistically significant difference between male and female Generation
Y students’ mobile gaming satisfaction, challenge, game identification, flow,
psychological commitment and behavioural loyalty towards their favourite mobile
game.
The following section details the SEM process used to test the proposed model of
antecedents that affect the Generation Y students’ mobile gaming brand loyalty.
5.10 STRUCTURAL EQUATION MODELLING
In this study, SEM was conducted to test the formulated hypotheses, Ho1 to Ho4.
5.10.1 Measurement model specification
Confirmatory factor analysis was conducted in order to address the second empirical
objective set out in Chapter 1. In accordance with the literature reviewed in Chapter 2 and
Chapter 3 and the factor analysis in this chapter, the hypothesised measurement model
was specified as a six-factor structure comprising the following latent or unobserved
factors, namely satisfaction (F1) (three indicators), challenge (F2) (four indicators), game
identification (F3) (five indicators), flow (F4) (three indicators), psychological commitment
(F5) (four indicators) and behavioural loyalty (F6) (five indicators). The MLE method was
applied in both CFA (measurement model) and path analysis (structural model)
procedures, as advised by Hair et al. (2014:575). The hypothesised measurement model
is specified in Figure 5-8.

122
Figure 5-8: Specified measurement model
For model identification purposes, the first loading of all six factors were fixed at 1.0.
There are 300 distinct sample moments and 63 parameters to estimate, thus, giving a
total of 237 degrees of freedom (df) based on the over-identified model. A chi-square
value of 502 was returned at a probability level of p=0.000<0.05. The measurement model
was scrutinised for any problematic estimates by evaluating the standardised factor
loadings and error variance estimates. Hair et al. (2014:618) state that negative error
variances (Heywood cases) must be avoided, while factors should load above 0.50 and
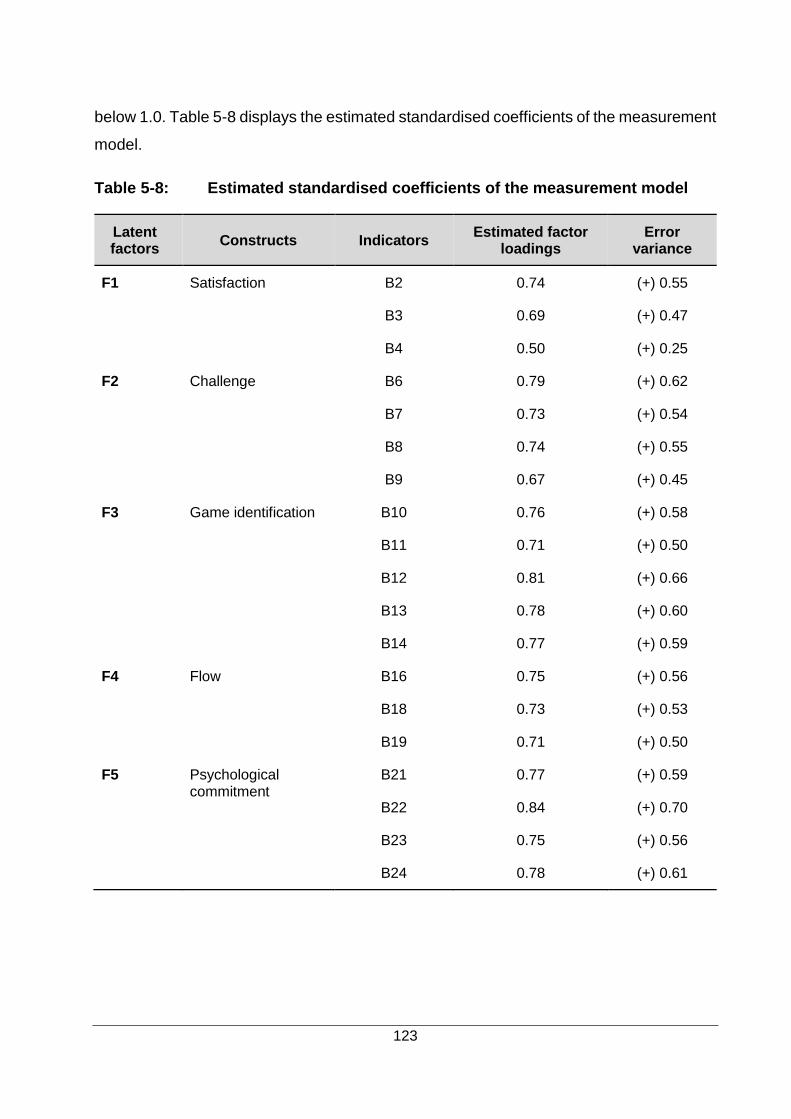
123
below 1.0. Table 5-8 displays the estimated standardised coefficients of the measurement
model.
Table 5-8: Estimated standardised coefficients of the measurement model
Latent factors
Constructs Indicators Estimated factor
loadings Error
variance
F1 Satisfaction B2 0.74 (+) 0.55
B3 0.69 (+) 0.47
B4 0.50 (+) 0.25
F2 Challenge B6 0.79 (+) 0.62
B7 0.73 (+) 0.54
B8 0.74 (+) 0.55
B9 0.67 (+) 0.45
F3 Game identification B10 0.76 (+) 0.58
B11 0.71 (+) 0.50
B12 0.81 (+) 0.66
B13 0.78 (+) 0.60
B14 0.77 (+) 0.59
F4 Flow B16 0.75 (+) 0.56
B18 0.73 (+) 0.53
B19 0.71 (+) 0.50
F5 Psychological commitment
B21 0.77 (+) 0.59
B22 0.84 (+) 0.70
B23 0.75 (+) 0.56
B24 0.78 (+) 0.61

124
Table 5-8: Estimated standardised coefficients of the measurement model
(continued …)
Latent factors
Constructs Indicators Estimated factor
loadings Error
variance
F6 Behavioural loyalty B25 0.82 (+) 0.68
B26 0.83 (+) 0.69
B27 0.78 (+) 0.61
B28 0.71 (+) 0.51
B29 0.75 (+) 0.56
As seen in Table 5-8, there is no evidence of any problematic estimates or negative error
variances; all factor loadings were above the 0.50 threshold and no negative error
variance estimates were recorded. The model fit was assessed using the fit indices
specified in Chapter 4, namely the chi-square, the SRMR, the RMSEA, the GFI, the IFI,
the CFI and the TLI. The significant chi-square value of 502 (df:237), with a probability
level equal to p=0.000 suggested a poor fit model. This is not uncommon as the chi-
square statistic is known to be a highly sensitive to large sample sizes (Byrne, 2010:76;
Malhotra, 2010:732). Despite this, the remaining fit indices produced by AMOS displayed
an acceptable degree of fit and are displayed in Table 5-9.
Table 5-9: Fit indices for the measurement model
Fit indices SRMR RMSEA GFI IFI CFI TLI
Recommended value ≤ 0.08 ≤ 0.08 ≥ 0.90 ≥ 0.90 ≥ 0.90 ≥ 0.90
Measurement model result
0.05 0.05 0.92 0.95 0.95 0.95
Conclusion √ √ √ √ √ √
As indicated in Table 5-9, SRMR and RMSEA values were below the recommended ≤
0.08, while values for the GFI, IFI, CFI and TLI were all recorded above the 0.90 cut-off
level. Therefore, the measurement model displayed an acceptable model fit. The next
step is to assess the reliability and validity of the measurement model.

125
5.10.2 Reliability and validity of the measurement model
Before proceeding to the structural model, it is important to verify the reliability and validity
of the factors making up the model for mobile gaming brand loyalty. Nomological validity
was established in Section 5.8. In this section, internal-consistency and composite
reliability, as well as convergent and discriminant validity are assessed. This process
involves reporting on the Cronbach alphas, CR, AVE, square root of AVE and the
correlation coefficient values calculated in the measurement model. Table 5-9 displays
the calculated values of the Cronbach alphas, CRs, AVEs, the square root of the AVEs,
and the correlation coefficients.
Table 5-10: Correlation matrix, CR values, AVE values, square roots of AVE
values
Correlation constructs
Factors CR
Cro
nb
ach
alp
ha
AVE √AVE
Sa
tis
facti
on
Ch
all
en
ge
Ga
me
iden
tifi
cati
on
Flo
w
Ps
yc
ho
log
ical
co
mm
itm
en
t
Satisfaction 0.75 0.89 0.50 0.71
Challenge 0.80 0.87 0.50 0.71 0.59
Game identification
0.83 0.86 0.50 0.71 0.45 0.58
Flow 0.80 0.82 0.50 0.71 0.67 0.66 0.77
Psychological commitment
0.80 0.77 0.50 0.71 0.47 0.58 0.76 0.70
Behavioural loyalty
0.83 0.68 0.50 0.71 0.44 0.48 0.74 0.47 0.65
As indicated in Table 5-10, internal-consistency reliability is evident as all factors
displayed satisfactory Cronbach’s alpha values ranging from 0.68 to 0.89, which are
above the acceptable level of ≥0.60 (Hair et al., 2014:90; Malhotra, 2010:319). In addition,
all CR values fell between 0.75 and 0.83, and are above the recommended cut-off level

126
of 0.70, which indicates acceptable composite reliability. Moreover, the AVE values were
all calculated at 0.50, which is equal to the recommended cut-off level of 0.50, thereby
indicating convergent validity (Hair et al., 2014:632-633). For discriminant validity, all
correlation coefficients were smaller than the square root of the AVE, except for three out
of the 15 cases. However, a certain degree of inter-correlation is to be expected as the
six-dimension model is measuring similar aspects of brand loyalty. A similar result was
observed in the studies by Teng (2013:887) and Bauer et al. (2008:217). In addition, the
amount by which the three violations exceeded the square root value of the AVE (0.03,
0.05 and 0.06) were considered to be miniscule and may also have occurred through
chance due to the large size of the correlation matrix.
In conclusion, the specified measurement model displayed acceptable levels of reliability,
convergent validity, discriminant validity and nomological validity, as well as
demonstrating an acceptable model fit. Based on this evidence, it is concluded that the
null hypothesis, Ho1, should be rejected and the alternate hypothesis, Ha1, be accepted.
As such, antecedents of mobile gaming brand loyalty can be considered to be a six-factor
structure. Therefore, statistical accuracy of the measurement model is proven and path
analysis can be carried out.
In the following section, the hypothesised structural model and the results of path analysis
are presented.
5.10.3 Structural model
This section addresses the third empirical objective set out in Chapter 1. The first
hypothesised structural model (Structural Model A) was used to test hypotheses Ho2 to
Ho4. As such, it hypothesised that satisfaction (F1), challenge (F2) and game
identification (F3) have a direct positive influence on flow (F4). Thereafter, it was theorised
that flow (F4) has a direct positive influence on psychological commitment (F5), which, in
turn, positively influences behavioural loyalty (F6). Note that the covariance lines between
the interdependent variables, the residuals of the interdependent variable and the
indicator variables of the latent factors have been omitted from all structural models in
this chapter to allow for improved visual representation and interpretation. The complete
detailed models can be perused in Annexure B, which is included at the end of the thesis.

127
Figure 5-9 depicts the regression path estimates (denoted as β) for Structural Model A.
Figure 5-9: Structural Model A
In terms of model fit, Structural Model A provided an expected problematic chi-square
value of 708.96 with 244 degrees of freedom at a probability level of p=0.000<0.05. The
fit indices for GFI=0.88 fell just below the acceptable level, while the remaining fit indices
computed acceptable values of RMSEA=0.06, SRMR=0.08, IFI=0.92, CFI=0.92 and
TLI=0.91.
The results from Structural Model A revealed that satisfaction (F1) (β=0.33,
p=0.000<0.01), challenge (F2) (β=0.26, p=0.000<0.01), and game identification (β=0.44,
p=0.000<0.01) have a significant positive influence on the flow (F4) experienced by
Generation Y students playing their favourite mobile game. This infers that null hypothesis
Ho2 is rejected and the alternate hypothesis Ha2 is accepted. In addition, flow (F4)
(β=0.82, p=0.000<0.01) displayed a strong and significantly positive influence on
Generation Y students’ psychological commitment towards their favourite mobile game.
As such, null hypothesis Ho3 is rejected and the alternate hypothesis Ha3 is accepted.
Lastly, psychological commitment (F5) (β=0.67, p=0.000>0.01) also displayed a strong
and positive significant influence on the behavioural loyalty (F6) of Generation Y students
towards their favourite mobile game. Therefore, the null hypothesis Ho4 is rejected and
the alternate hypothesis Ha4 is accepted.
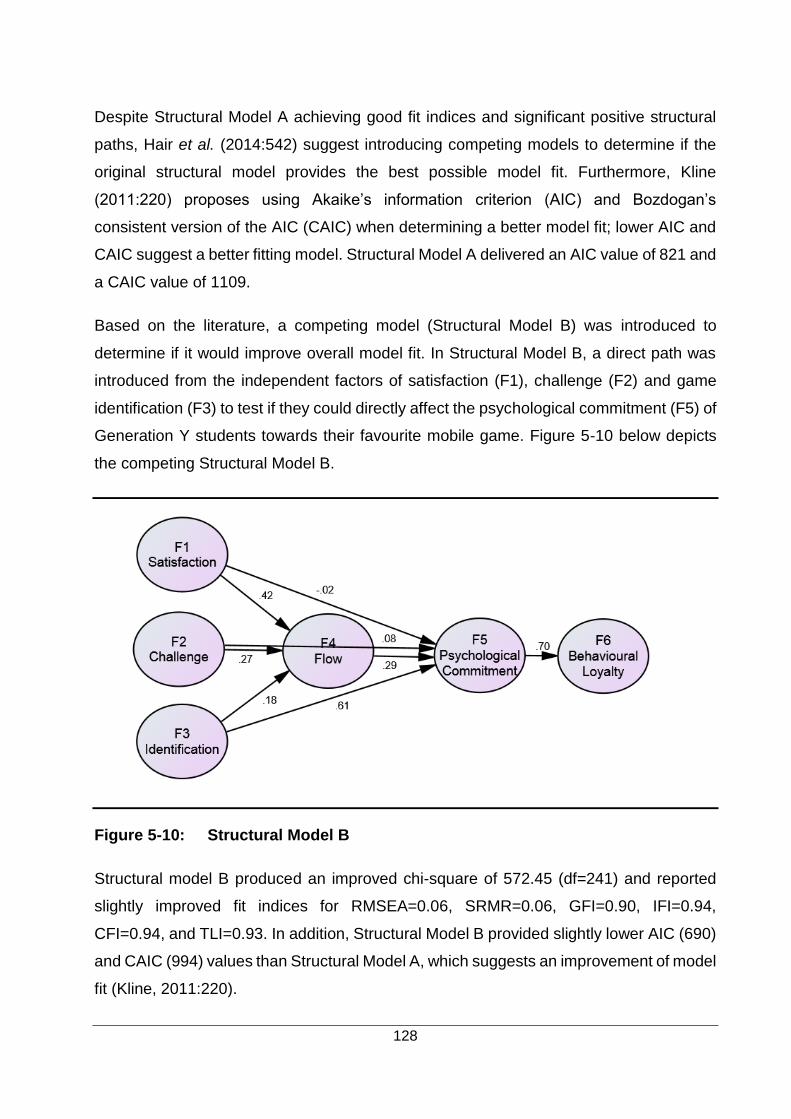
128
Despite Structural Model A achieving good fit indices and significant positive structural
paths, Hair et al. (2014:542) suggest introducing competing models to determine if the
original structural model provides the best possible model fit. Furthermore, Kline
(2011:220) proposes using Akaike’s information criterion (AIC) and Bozdogan’s
consistent version of the AIC (CAIC) when determining a better model fit; lower AIC and
CAIC suggest a better fitting model. Structural Model A delivered an AIC value of 821 and
a CAIC value of 1109.
Based on the literature, a competing model (Structural Model B) was introduced to
determine if it would improve overall model fit. In Structural Model B, a direct path was
introduced from the independent factors of satisfaction (F1), challenge (F2) and game
identification (F3) to test if they could directly affect the psychological commitment (F5) of
Generation Y students towards their favourite mobile game. Figure 5-10 below depicts
the competing Structural Model B.
Figure 5-10: Structural Model B
Structural model B produced an improved chi-square of 572.45 (df=241) and reported
slightly improved fit indices for RMSEA=0.06, SRMR=0.06, GFI=0.90, IFI=0.94,
CFI=0.94, and TLI=0.93. In addition, Structural Model B provided slightly lower AIC (690)
and CAIC (994) values than Structural Model A, which suggests an improvement of model
fit (Kline, 2011:220).

129
However, when looking at Structural Model B, the new paths from satisfaction (F1)
(β=0.02, p=0.732>0.01) and challenge (F2) (β=0.08, p=0.166>0.01) to psychological
commitment (F5) are not significant. The finding for satisfaction contradicts previous
brand loyalty literature (Baig, 2015:2; Nam et al., 2011:1022; Amine, 2008:311; Lu &
Wang, 2004:504). Despite this, satisfaction still has an indirect influence on psychological
commitment via its direct influence on flow, which is in line with prior theories of flow
(Alzahrhani et al., 2017:248; Chang, 2013:319; Lee & Tsai, 2010:613; Lee, 2009:849).
The finding for challenge is in line with a study conducted by Teng (2013:889) on
customer loyalty towards online video games, which revealed that it does not directly
affect loyalty but invokes a state of flow, which, in turn, leads to consumer loyalty. Note
that the above findings are new for mobile gaming brand loyalty and require further
research investigation.
Taking the above into account, a third structural model, Structural Model C, was
introduced, which omitted the two insignificant paths (F1→F5, p=0.732>0.01; F2→F5,
p=0.166>0.01) seen in Structural Model B. As such, Structural Model C is depicted in
Figure 5-11.
Figure 5-11: Structural Model C
In terms of model fit, Structural Model C produced a slightly higher chi-square of 574
(df=243) when compared to Structural Model B. However, it reported improved fit indices
for RMSEA=0.05 and GFI=0.91, while the fit indices for SRMR=0.06 IFI=0.94 CFI=0.94

130
and TLI=0.93 remained the same. Crucially, Structural Model C displayed the best model
fit thus far, with the lowest recorded values of the three models, for AIC (688) and CAIC
(981).
All path estimates in Structural Model C are significant, much like in Structural Model A.
The difference being the additional path from game identification (F3) (β=0.63,
p=0.000<0.01) to psychological commitment (F5), which proves to be positively
significant. With game identification being a conceptualisation of brand identification, this
finding is not new in brand loyalty and identification literature, and is in line with previous
studies (Gabbiadini, Riva, Andrighetto, Volpato & Bushman, 2016:11; Badrinarayanan et
al., 2014:886; Bauer et al., 2008:212; Hefner et al., 2007:39-40; Chaudhari & Holbrook,
2001:81; Amine, 1998:308). In addition, the positively significant influence of flow (F4)
(β=0.32, p=0.000<0.01) on psychological commitment (F5) was also found in the study
done on online video games, conducted by Choi and Kim (2004:22). However, Choi and
Kim’s (2004:22) study viewed loyalty as a one-dimensional construct and not two-
dimensional, as is the case in this study. As such, this is a new finding in mobile gaming
brand loyalty and warrants further investigation. Lastly, psychological commitment (F5)
(β=0.70, p=0.000<0.01) displayed a strong positive significant influence on behavioural
loyalty (F6). Although this finding is new for mobile gaming brand loyalty, it is consistent
with previous studies and brand loyalty literature (Bauer et al., 2008:212; Amine,
1999:308).
In terms of the squared multiple correlation coefficient, satisfaction, challenge and game
identification explain 54 percent of the variance in flow experienced by Generation Y
students when playing their favourite mobile game. In turn, flow and game identification
explain 72 percent of the variance in Generation Y students’ psychological commitment
towards their favourite mobile game. Lastly, psychological commitment explains 50
percent of the variance in Generation Y students’ mobile gaming behavioural loyalty.
A comparison of the results produced from Structural Model A, B, and C is provided in
Table 5-11 below.

131
Table 5-7: Structural model comparison
Measures Recommended value Model A Model B Model C
Chi-square (X2) Low X2 value 709 573 574
GFI ≥0.90 0.88 0.90 0.91
IFI ≥0.90 0.92 0.94 0.94
TLI ≥0.90 0.91 0.93 0.93
CFI ≥0.90 0.92 0.94 0.94
RMSEA ≤0.08 0.06 0.06 0.05
SRMR ≤0.08 0.08 0.06 0.06
AIC Small positive values 821 690 688
CAIC Small positive values 1109 994 981
Table 5-11 shows that fit indices improved from Model A to Model B and then to Model
C. In addition, Structural Model C has the best fit indices, with the exception of X2.
Although Structural Model B had a lower final X2 value, the AIC and CAIC values for
Structural Model C show a better fit when compared to Structural Model B. As such, the
results suggest that the competing Structural Model C demonstrates a better model fit
than the initial hypothesised Structural Model A and the first revised model, Structural
Model B.
The outcome of the two independent-samples t-test is detailed in the next section.
5.11 TWO INDEPENDENT-SAMPLES T-TEST
In this section, the fourth empirical objective is addressed. This study utilised a two
independent-samples t-test to determine if any significant differences exist between male
and female respondents on the constructs measured in this study. The two independent-
samples t-test tested the last hypothesis, Ho5.
Table 5-12 reports on the mean, standard deviation, t-statistic, and p-value for male and
female Generation Y students’ satisfaction, challenge, game identification, flow,

132
psychological commitment, and behavioural loyalty concerning mobile gaming brand
loyalty.
Table 5-12: Gender difference
As is evident in Table 5-12, there were no statistical significant (p≤0.01) differences
between male and female Generation Y students’ game identification, psychological
commitment and behavioural loyalty concerning mobile gaming brand loyalty. As such,
the null hypothesis, Ho5, cannot be rejected for these four constructs. However,
statistically significant differences were observed for satisfaction, challenge and flow,
whereby female Generation Y students were found to experience a statistically significant
higher level of satisfaction, challenge and sense of flow with their favourite mobile game
than their male counterparts. Therefore, the null hypothesis, Ho5, is rejected for
satisfaction, challenge and sense of flow, and the alternative, Ha5, concluded.
The Cohen’s D-statistic was calculated to determine if the differences of female
Generation Y students’ satisfaction, challenge and flow had any practical significance.
The results indicated that the effects of these differences were practically non-significant,
according to the Cohen’s D-statistic.
Constructs Male Mean N=218
Male Std. Dev.
Female Mean N=246
Female Std. Dev.
t-value p-
value Cohen’s
D
Satisfaction 4.10 1.07 4.43 1.00 3.42 0.001 0.32*
Challenge 4.10 1.11 4.37 1.02 2.68 0.008 0.25*
Game identification
3.45 1.28 3.54 1.31 0.77 0.444 ****
Flow 4.59 1.09 4.84 0.97 2.52 0.012 0.24*
Psychological commitment
3.86 1.19 3.84 1.28 -0.22 0.827 ****
Behavioural intention
3.56 1.30 3.34 1.44 -1.76 0.078 ****
* Small effect, practically non-significant
** Medium effect and moving towards practical significance
*** Large effect, practically significant
**** Cohen’s D-statistic not calculated as the variable was not statistically significant

133
5.12 CONCLUSION
The purpose of this chapter was to report and interpret the empirical findings of the study.
The chapter provides a discussion of the results derived from the pilot test with specific
focus on reliability and validity measuring instrument. The results proved that the scale to
be used in the main study was both reliable and valid. The preliminary data analysis
comprising the coding, cleaning, and tabulation of data is also discussed. The
demographic profile of the sample is illustrated and reported on. An exploratory factor
analysis was conducted to determine the factorability of the data, and items that loaded
poorly were removed. Thereafter, descriptive statistics were computed on the data set.
This included reporting on the mean, standard deviation, skewness, and kurtosis values.
Data normality was proven and means of ≥3.5 were recorded, indicating a positive
agreement towards the scales. Moreover, nomological validity of the scales was tested
using Pearson’s Product-Moment correlation coefficient to determine if there are any
significant relationships between the constructs in the scale. All constructs displayed
significant positive correlations at a significance level of p ≤ 0.01 (2-tailed) and no serious
signs of multi-collinearity were evident.
Based on the aforementioned results, SEM was then implemented. A hypothesised
measurement model was tested for reliability and validity using correlation coefficients,
CR values, AVE values, and square root of the AVE values. Model fit was also assessed,
and the results revealed that the antecedents of mobile gaming brand loyalty are defined
by a six-factor structure. Once this was established and path analysis was carried out,
Structural Model A was specified and resulted in null hypotheses Ho2, Ho3, and Ho4 being
rejected and their alternatives accepted. A competing model, Structural Model B, was
introduced to determine if the original Structural Model A provided the best fit. Structural
Model B provided improved fit indices over structural Model A, but contained two
insignificant paths. A third structural model, Structural Model C, was then concluded
where the two insignificant paths were omitted. As such, Structural Model C produced the
best model fit of the three structural models. In conclusion, Structural Model C was the
accepted model for this research study as it is both theoretically justified and empirically
validated through hypothesis confirmation.

134
Finally, a two-independent samples t-test was carried out to test if any significant gender
differences exist concerning Generation Y students mobile gaming brand loyalty. The test
revealed no statistical significant differences between male and female Generation Y
students’ game identification, psychological commitment, and behavioural loyalty
concerning mobile gaming brand loyalty. Therefore, the null hypothesis, Ho5, was not
rejected for these three aspects. Interestingly, female Generation Y students displayed a
stronger positively significant stance towards satisfaction, challenge and flow, leading to
the rejection of null hypothesis Ho5, and the alternative Ha5 being concluded for those
three aspects. However, the effects of these differences were deemed practically non-
significant according to Cohen’s D-statistic.
The next chapter presents the main findings, recommendations, limitations, contributions,
and concluding remarks emanating from this study. The findings are presented in line
with the initial objectives set out in Chapter 1 of this study.

135
CHAPTER 6
CONCLUSIONS AND RECOMMENDATIONS
6.1 INTRODUCTION
The rapid dissemination of smartphones into global markets over the past decade has
given rise to many popular mobile service applications. None have been as popular, or
as successful, as mobile games. A report released by market intelligence organisation,
Newzoo, revealed that mobile games will contribute a staggering 76 percent of the
expected $92.1 billion mobile app revenue in 2018 (Taylor, 2018) (Section 2.1). The most
popular mobile games such as Angry Birds, Candy Crush Saga, and Clash of Clans have
been transformed into thriving mobile gaming brands that have crossed over into other
markets. The developers of these mobile games have successfully implemented
freemium business models, whereby these games generate significant amounts of
revenue through in-app purchases from loyal video game players (Section 2.3). Retention
of loyal players is critical to the ongoing success of these mobile gaming brands (Section.
3.3.3). As such, developers spend billions of dollars on consumer-centric marketing
programmes to build and maintain brand loyalty across all extensions of their mobile
gaming brands (Section 3.2.1).
A key factor in building strong brand equity and brand loyalty is being able to correctly
identify, attract and retain a suitable target market (Section 3.3). In South Africa, the
average consumer playing mobile games ranges between 16 and 34 years old (Section
3.5.2). This range falls predominantly under the Generation Y consumer classification, a
generation that made up approximately 40 percent of the South African population in
2017, making it the largest represented age cohort in the country. Generation Y
individuals are the most tech-savvy of all generations to date, and spend half their day
using modern technologies. This has made the opinions of Generation Y members on
various technologies highly sought after by marketers (Section 3.5.1). Members of this
generation who attend a tertiary institution are of particular value to marketers due to their
market potential, high future earning potential, and significant social influence on the
wider Generation Y segment (Section 3.5.2).

136
Understanding the antecedents of mobile gaming brand loyalty amongst the Generation
Y cohort is likely to make a valuable contribution towards current brand strategies. The
primary objective of this study was to develop and empirically test the influence of
satisfaction, challenge, game identification and flow on South African Generation Y
students’ mobile gaming brand loyalty. The findings may provide further insight into this
phenomenon which, in turn, marketers and video game developers can adapt into future
strategies aimed at this cohort.
The purpose of Chapter 6 is to summarise the entirety of the study and it begins with an
overview of the previous chapters (Section 6.2). The main findings of the empirical portion
of this study are presented in Section 6.3, while the contributions of the study are
discussed in Section 6.4. The recommendations are outlined in Section 6.5, followed by
the limitations and future research opportunities in Section 6.6. Lastly, Section 6.7
concludes the chapter with brief remarks.
6.2 OVERVIEW OF THE STUDY
The purpose of this section is to outline the observations concluded from the preceding
five chapters. Additionally, this section serves as a backdrop to the final recommendations
based on the findings of this study.
Chapter 1 introduced the topics of mobile gaming and brand loyalty (Section 1.1) and
outlined the need to develop a model of antecedents of mobile gaming brand loyalty
(Section 1.2). This formed the basis of the study’s primary objective in Section 1.3.1,
which was to determine the antecedents of mobile gaming brand loyalty amongst
Generation Y students. The primary objective was broken down into nine theoretical
objectives and four empirical objectives set out in Section 1.3.2 and Section 1.3.3,
respectively. In line with the four empirical objectives, five hypotheses were formed and
presented in Section 1.4. Thereafter, the proposed research methodology and research
design used to achieve these objectives were outlined in Section 1.5. The methodology
included following a descriptive research design that used a cross-sectional survey
method for data collection. Section 1.6 covered the demarcation of the study. The chapter
classifications were discussed in Section 1.8, concluding the chapter.
137
In Chapter 2, a literature review was carried out in line with the first two theoretical
objectives that were set out in Section 1.3.2. The chapter provided theoretical background
and insight into mobile gaming and its marketing potential. Section 2.2 provided an in-
depth review of mobile gaming literature and revealed that mobile games have eclipsed
traditional video games in terms of revenue and market share. Section 2.3 outlined the
various mobile gaming business models and illustrated how successful the freemium
game model has become in attracting and converting first-time players into brand loyal
consumers, who possibly may make in-app purchases. This section also conceptualised
the prediction of brand loyal behaviour by exploring flow and brand loyalty theory. These
theories may greatly influence how an organisation implements their mobile gaming
business model. The global and local performance of mobile games is briefly outlined in
Section 2.4, followed by an in-depth discussion of their marketing potential in Section 2.5.
This revealed that global advertising expenditure in mobile games could reach $50 billion
by 2020. The high advertising expenditure can be attributed to mobile gaming’s value and
potential as a marketing medium. Moreover, there are over 1.2 billion people currently
playing mobile games that contributed towards an estimated $46.1 billion of revenue
generated from mobile games in 2017.
Following the theoretical background provided in Chapter 2, the remaining seven
theoretical objectives were addressed in Chapter 3. The importance of branding and the
various branding strategies adopted by mobile gaming brands were discussed in Section
3.2. This was followed by the introduction of the concept of brand equity and how it is
used to measure a brand’s worth, in Section 3.3. Based on the seminal works of Aaker
(1991) and Keller (1993), brand loyalty proved to be the most significant driver of brand
equity and maintaining brand loyal consumers is critical to the long-term success of any
organisation. Brand loyalty theory posits two theoretical approaches, namely an
attitudinal deterministic approach (psychological commitment) and a behavioural
stochastic (behavioural loyalty) approach. Section 3.3.2.3 discussed incorporating both
approaches, which, according to Day (1969), will allow researchers to clearly distinguish
between spurious loyalty and true brand loyalty. Thereafter, Section 3.4 introduced and
discussed the six factors identified in the literature as being pertinent antecedents of
mobile gaming brand loyalty. These factors include satisfaction (Section 3.4.1), challenge
(Section 3.4.2), game identification (Section 3.4.3), flow (Section 3.4.4), psychological
138
commitment (Section 3.4.5) and behavioural loyalty (Section 3.4.6). Flow was revealed
to be a major predictor of positive attitude, repeated game use and, consequent loyalty,
while satisfaction, challenge and game identification are all key drivers in creating a state
of flow. Section 3.5 reviewed the literature on generational theory and provided
justification for the selection of South African Generation Y students as the target group.
Furthermore, Section 3.5.1 outlined the characteristics and technologically-driven nature
of Generation Y, while Section 3.5.2 revealed that the typical South African mobile gamer
belongs to Generation Y. Mobile games were found to be gender-neutral for this particular
generation, which greatly increases their marketability (Section 3.5.3). The final section,
Section 3.6, proposed a model of the antecedents of mobile gaming brand loyalty
amongst South African Generation Y students in Figure 3-3. This model was in
accordance with the literature review. The model hypothesised that the factors of
satisfaction, challenge and game identification induce mobile gaming flow, and that
mobile gaming flow significantly influences psychological commitment towards mobile
games. This, in turn, has a significant influence on behavioural loyalty toward mobile
games.
Chapter 4 presented the theory and rationale in following a post-positivist research
paradigm, and the consequent research design followed in the empirical portion of this
study. Section 4.2 outlined the various research paradigms and justifies the selection of
a post-positivist approach, followed by Section 4.3, which explained the theory of a
descriptive single cross-sectional research design. The sampling procedure employed
was described in Section 4.4, from which a non-probability convenience sample of 600
full-time Generation Y students registered at one of three selected South African HEI
campuses, was selected as the target population. This was validated by means of
previously published studies, and was within the boundaries required to conduct SEM
(Section 4.4.4). Section 4.5 outlined the data collection method, the formulation of a self-
administered questionnaire, as well as the pre-test and pilot procedures that were
conducted in the study. Section 4.6 detailed the administration of the questionnaire, while
Section 4.7 described the data preparation process. The chapter concluded with Section
4.8, which detailed the statistical techniques utilised to analyse the cleaned data set.

139
Chapter 5 reported on the empirical findings on the study. These findings address the
four empirical objectives set out in Section 1.3.3 and are discussed in detail the following
section.
6.3 MAIN FINDINGS OF THE STUDY
In this section, the main findings of the study are presented in line with the empirical
objectives set out in Chapter 1 (Section 1.3.3).
The first empirical objective sought to determine Generation Y students’ level of
satisfaction, challenge, game identification, flow, psychological commitment and
behavioural loyalty towards mobile games. Descriptive statistics were used to address
this objective. Means calculated equal to or above 3.5 are indicative of positive
associations. As shown in Table 5-5 in Section 5.7, means equal to or above 3.5 were
recorded for all factors. This suggests that Generation Y students experience satisfaction
when playing their favourite mobile game, respond positively to the challenges posed,
and can identify with their favourite game in terms of in-game characters, social
communities and the virtual worlds they present. The strongest positive indicator was that
of flow (mean=4.72). This result suggests that Generation Y students respond strongest
to games that evoke a state of flow, thus creating an optimal experience for them. Finally,
the results indicate that Generation Y students are brand loyal towards their favourite
mobile game in terms of both psychological commitment and behavioural loyalty.
The second empirical objective was to test whether mobile gaming brand loyalty amongst
Generation Y students is a six-factor model comprising mobile gaming satisfaction,
challenge, game identification, flow, psychological commitment and behavioural loyalty.
The outcome from the confirmatory factor analysis indicated that the antecedents of
Generation Y Students’ mobile gaming loyalty is indeed a six-factor structure.
Furthermore, the six-factor model demonstrates acceptable internal-consistency and
composite reliability, as well as construct validity. The model was also found to have
acceptable model fit.
The third empirical objective was aimed at empirically testing a proposed model of mobile
gaming brand loyalty amongst Generation Y students. In accordance with the literature
review discussed in Chapter 3, a structural model was specified to test hypotheses 2 to

140
4 found in Section 1.4 and Section 5.9. The results from Structural Model A (refer to
Figure 5-9) show that satisfaction (F1), challenge (F2) and game identification (F3) have
a significant direct positive influence on flow (F4), which, in turn, was found to be a
significant positive predictor of psychological commitment (F5). Psychological
commitment (F5) also displayed a positive significant influence on behavioural loyalty
(F6) (Section 5.10.3). In addition, Structural Model A concluded acceptable model fit
indices and represented a working structural model.
Despite Structural Model A producing acceptable fit indices (refer to Table 5-10) that are
indicative of working a structural model, Hair et al. (2014:542) propose introducing
competing models to ascertain if the original model provides the best possible fit.
Structural Model B (refer to Figure 5-10) was introduced to test if the latent factors of
satisfaction (F1), challenge (F2) and game identification (F3) have a significant direct
positive influence on psychological commitment. Although Structural Model B provided a
better model fit than Structural Model A, the paths of satisfaction (F1) and challenge (F2)
towards psychological commitment (F5) were not significant. Despite this, satisfaction
(F1) and challenge (F2) have a significant indirect positive influence on psychological
commitment (F5) via their significant direct positive influence on flow (F4). These results
are in keeping with previous studies (Alzahrhani et al., 2017:248; Chang, 2013:319; Teng,
2013:889; Lee & Tsai, 2010:613; Lee, 2009:849).
As such, a third model (Structural Model C as per Figure 5-11) was introduced that
omitted the two insignificant paths (F1→F5 and F2→F5). Crucially, Structural Model C
displayed the best model fit of all three models and produced lower AIC and CAIC values
(refer to Table 5-10). In Structural Model C, satisfaction (F1), challenge (F2) and game
identification (F3) had a significant positive direct influence on flow (F4), with game
identification also having a significant direct positive influence on psychological
commitment (F5). Flow (F4) was found to have a statistically significant positive influence
on psychological commitment (F5), which, in turn, is a significant positive predictor of
behavioural loyalty (F6). These findings are in accordance with prior brand loyalty
literature (Alzahrhani et al., 2017:248; Gabbiadini et al., 2016:11; Baig, 2015:2;
Badrinarayanan et al., 2014:886; Chang, 2013:319; Teng, 2013:889; Lee & Tsai,
2010:613; Lee, 2009:849; Bauer et al., 2008:212; Choi & Kim, 2004:22; Amine,

141
1999:308). The additional path (F3→F5) from game identification (F3) to psychological
commitment (F5) that was found to be positively significant is a finding was echoed in the
literature (Chung & Park, 2017:58; Yeh et al., 2016:253; Badrinarayanan et al., 2014:886;
Bauer et al., 2008:212; Hefner et al., 2007:39-40; Chaudhari & Holbrook, 2001:81; Amine,
1999:308).
Taking the above findings into account, this study proposes that the antecedents of
mobile gaming brand loyalty amongst Generation Y students in South Africa may be
explained by the model presented in Figure 6-1.
Satisfaction
Challenge
Game identification
Behavioural
loyalty
Psychological
commitmentFlow
Figure 6-1: Model of the antecedents of mobile gaming brand loyalty amongst
Generation Y students
The fourth and final empirical objective focused on determining if there were any gender
differences concerning Generation Y students’ satisfaction, challenge, game
identification, flow, psychological commitment and behavioural loyalty towards their
favourite mobile game. To address this objective and the final hypothesis (see Section
1.4 and Section 5.9), a two independent-samples t-test and Cohen’s D-statistic were
carried out (Section 5.11). The results revealed that no statistical significant differences
were observed between male and female Generation Y students’ game identification,
psychological commitment and behavioural loyalty. However, female Generation Y
students showed a stronger statically significant positive stance towards satisfaction,
challenge and flow. Despite this, the Cohen’s D-statistic computation revealed that the
effect of these differences were practically non-significant. These findings have been
reciprocated in previous studies conducted by Price (2017) and Amory & Molomo (2012)
relating to video games preference among young male and female South Africans.

142
The proceeding section outlines the contributions of the study.
6.4 CONTRIBUTIONS OF THE STUDY
This study contributes towards the current dearth of literature regarding brand loyalty
toward mobile gaming in both the South African and global context. Through empirical
testing, a six-factor model for antecedents of mobile gaming brand loyalty was developed
to assist in predicting the behaviour of Generation Y students in the South African mobile
video games market. This study also contributes to existing Generation Y literature and
may provide marketers with a more coherent understanding of this cohort’s propensity to
be loyal consumers. The findings emanating from this study further underpin the
importance of mobile games as a marketing medium. Furthermore, this study provides
insight to organisations seeking to utilise mobile games as a platform to directly serve the
lucrative Generation Y market segment. Marketers and video game developers may
tentatively use this model to predict brand loyalty for other generational cohorts but should
proceed with caution until additional generational studies have been conducted on this
topic. This study also forms part of and contributes towards the ProGenY (profiling the
consumer behaviour of Generation Y in South Africa) project at North-West University
(Vaal Triangle Campus).
The following section encompasses recommendations that can be incorporated by
marketers and video game developers when building their mobile gaming brands and/or
optimising their marketing campaigns.
6.5 RECOMMENDATIONS
This study found that Generation Y students are brand loyal toward mobile games. As
such, the following recommendations have been established:
6.5.1 Design brand strategies around the social aspect of playing mobile
games to enhance game identification
Top mobile gaming brands such as Pokémon Go, Clash of Clans and Candy Crush Saga
all have a core social element to their gameplay which has made them successful. Their
brand strategies are consumer-centric and encourage two-way engagement between
video game players and the brand itself. The development of brand communities has

143
been crucial to their success. Jang et al. (2007:1) state that the establishment of a brand
community allows consumers to identify with the brand and build a strong emotional
attachment. This study found that Generation Y students positively identify with their
favourite mobile game, whether it is in terms of in-game characters, social communities,
or virtual worlds presented in them. In addition, game identification had a positive
significant influence on flow and psychological commitment. This finding was reciprocated
by Soutter and Hitchens (2016:1035) and Moon et al. (2013:6) who found players with a
strong social identity will display higher levels of loyalty toward games, and that their
identification with a mobile game will manifest into higher levels of flow. Van Looy et al.
(2012:132) and Hamari (2015:306) agree that gamers develop a strong sense of game
identification by being able to share high scores or in-game symbols of success with their
friends or virtual communities, and are more likely to make in-app purchases to speed up
their progress.
In order for mobile gaming brands to become a success, marketers need to ensure that
brand strategies are consumer-centric in their approach and encourage interaction
between loyal followers and the brand. As observed through the success of Candy Crush
and Clash of Clans titles, marketers must engage with players via social media platforms
and utilise the feedback from those loyal players to continually improve overall gameplay
experience. This creates a strong brand community and may lead to increased
behavioural loyalty. As such, mobile games should always include a core social element
in their gameplay to ensure success.
6.5.2 Satisfaction from playing mobile games will not induce brand loyalty
unless flow is achieved
This study found that Generation Y students experience positive levels of satisfaction
when playing their favourite mobile game. It also found that satisfaction is the strongest
predictor of flow which, in turn, induces psychological commitment towards mobile
games. Liu and Li (2011:892) state that the goal of mobile games is to create an
immersive, satisfactory experience. This positive cumulative satisfaction will sustain a
constant state of flow, which leads to continued use and fosters brand loyalty (Chang,
2013:318). As such, video game developers must focus on creating mobile games that
will satisfy the needs of players over a long period of time. This strategy is employed by

144
Angry Birds and Candy Crush Saga, whereby the game is continually updated with fresh
content and new levels after seeking input from their loyal players. In addition, this study
found satisfaction does not have a direct positive significant influence on psychological
commitment. Therefore, transactional-specific satisfaction must be avoided, as it does
not induce flow. Finally, developers should strive to continually update their mobile game
offerings to ensure positive cumulative satisfaction and long-term success. These
findings are supported by similar studies conducted by Hsu et al. (2012:563) and Baig et
al. (2015:12).
6.5.3 Mobile games must present a challenge to enhance flow experience
Challenge is considered a precursor to a sustained flow experience (Section 3.4.2). Prior
research indicates that a player is highly likely to stop playing a mobile game if there is
no challenge, or low probability of overcoming challenges (Section 3.4.2). As a result, a
state of flow is not achieved, and players will respond negatively to the experience
provided by the mobile game (Shim et al., 2015:57-58; Teng, 2013:884-885). This study
concluded that Generation Y students respond positively to challenges posed in their
favourite mobile game. In other words, the challenge motivates Generation Y students to
continue playing as they believe the challenge can be overcome and this induces
maximum effort. This study found challenge to have a positive significant influence
towards the state of flow. As such, Generation Y students’ favourite mobile games are
challenging enough to motivate them to play repeatedly. This creates a constant state of
flow as they overcome challenges and stimulates brand loyalty, simultaneously. This
finding is in accordance with a study conducted by Teng (2013:884-885), which posits
that challenge evokes a state of flow resulting in a positive direct influence on loyalty.
Therefore, video game developers must ensure their mobile games provide realistic
challenges which elicit the necessary effort to overcome them, allowing players to
progress further in the game. It is essential that the reward given for progress in the game
is worthy of the effort exerted by the player. This ensures that players will continue to
revisit the game on a regular basis. Rewards can be anything from free in-game lives to
a limited-edition version of an in-game character. Examples of these psychological
marketing techniques can be found in popular games such as Candy Crush Saga and
Pokémon Go (Russel, 2016; Dooley, 2013; Dooley, 2008).

145
6.5.4 Creating an optimal flow experience for mobile gamers fosters strong
brand loyalty
Flow remains an important predictor when studying consumer behaviour in video games
(Merikivi et al., 2016:412). In this study, flow recorded the highest mean value of all factors
indicating that Generation Y students react positively towards mobile games which
evokes a state of flow. Moreover, flow displayed a strong positive influence on Generation
Y students’ psychological commitment towards their favourite mobile gaming which, in
turn, displayed a positively significant influence on behavioural loyalty. These findings
further underpin the importance of including flow as a predictor of loyalty in the study of
video and mobile games (Section 3.4.4). Mobile games that are both challenging and
addictive will lead to an optimal gaming experience (flow) and consumers may develop a
preference towards playing other mobile games from the same developer as a result
(Teng, 2013:884.)
Choi and Kim (2004:12) posit that players who become fully immersed (enter a state of
flow) in a gaming experience will become psychologically dependent on the game, which
leads to increased behavioural loyalty towards the game and/or the game’s developer.
The authors denote further that Generation Y students perceive flow as being created
from a combination of cumulative satisfaction, the challenges posed, and their social
identification with their favourite mobile game and its brand community. As such, mobile
game developers should consider these factors when creating mobile games or when
formulating brand strategies (Alzahrhani et al., 2017; Chang, 2013; Lee & Tsai, 2010;
Lee, 2009; Bauer et al., 2008; Hefner et al., 2007; Choi & Kim, 2004). Developers must
ensure total immersion is achieved when playing a mobile game, which will induce
psychological commitment from Generation Y members that may translate into long-term
behavioural loyalty.
6.5.5 Target the tech-savvy, brand loyal Generation Y cohort
The success of a brand lies in its ability to adequately convey a unique market offering
that is unmatched by competitors to its intended target audience (Hudson et al., 2016:28).
The ability to attract and retain an appropriate audience has become increasingly difficult
in saturated markets, as consumers possess more buying power and are quick to dismiss

146
false advertising (Nisar & Whitehead, 2016:743). Therefore, an organisation’s brand
strategy must focus on attracting loyal consumers who are less price sensitive and not
easily persuaded by competitor offerings (Section 3.2.1). The findings of this study
revealed that Generation Y students are psychologically committed and behaviourally
loyal towards their favourite mobile game. Despite Generation Y being characteristically
fickle (Section 3.5.1), the findings suggest that marketers and/or video game developers
should pursue this cohort when developing, improving, or promoting their mobile games.
This is in accordance with studies conducted by Price (2017) and Amory & Molomo
(2012).
In terms of gender differences, there was no practical significant difference observed
between male and female Generation Y students’ brand loyalty towards mobile games.
Therefore, marketers can appeal equally to both male and female individuals when
promoting their products (Knoke, 2017). In addition, marketers should avoid or limit the
use of pop-up advertisements within mobile games as this marketing approach can foster
negative attitudes among players (Kim et al., 2015). Marketers should rather implement
a cross-platform approach and make use of various platforms such as websites, social
media, and television to promote and encourage engagement with their mobile game/s
(Section 3.2.1.1).
6.5.6 Implement a free-to-play business model to attract and retain loyal
video game players
Of the three freemium business models, free-to-play contributes more than 90 percent of
the global revenue generated by mobile games (Section 2.3.4). Free-to-play mobile
games attract casual video game players because no monetary commitment is required
to play. This is crucial according to Liu et al. (2012); the authors emphasise that a positive
free-to-play gaming experience is likely to influence a player to adopt the pay-to-play or
paymium version of that specific game. As such, video game developers can follow the
free-to-play business model while incorporating the proposed brand loyalty model
presented in Figure 6-1. The model will aid in predicting attitudinal and behavioural loyalty
and increase the chance of the mobile gaming brand becoming a success. Shi, Xia and
Huang (2016:197) echo the importance of fostering social groups (virtual communities),

147
as they attract first time players and greatly influence their purchase propensity in
freemium games.
6.5.7 Incorporate attitudinal metrics when measuring mobile gaming brand
loyalty
Prior video game studies (Balakrishnan & Griffiths, 2018; Teng, 2013; Lu & Wang, 2008;
Choi & Kim, 2004) focus on loyalty from a behavioural stochastic viewpoint. This
approach is found often in the literature and suggests that loyalty is solely predicted by
repeat purchase behaviour. Marketers should heed caution when focusing on brand
loyalty in terms of behavioural commitment, as it does not consider personal motivations
behind the purchase (Section 3.3.2). This is of particular importance when targeting the
Generation Y cohort who are known to exhibit repeat purchase behaviour, yet switch
brands at an instant when a new trend presents itself (Section 3.5.1). Huang (2017:3)
stresses the importance of including an attitudinal component to brand loyalty that would
help distinguish between spurious loyalty and true brand loyalty.
This study found that Generation Y students are both psychologically committed and
behaviourally loyal toward their favourite video game. Additionally, psychological
commitment has a strong positive influence towards behavioural commitment for this
generational cohort (Figure 5-11). From a mobile games perspective, psychological
commitment acts as a resistance to switch to another mobile game despite the marketing
efforts of competitors or recommendations from friends and family. Strong psychological
commitment leads to behavioural loyalty which includes both past and future intended
purchase behaviour, such as making in-game purchases, buying gaming merchandise,
engaging in online communities, participating on social blogs, and/or following the latest
news and updates on social media platforms (refer to Section 3.5 and Section 3.6).
Therefore, these findings warrant the inclusion of an attitudinal deterministic approach
alongside a behavioural stochastic approach to predict and better understand mobile
gaming brand loyalty in Generation Y consumers.
6.6 LIMITATIONS AND FUTURE RESEARCH OPPORTUNITIES
As with all studies, there are limitations that must be accounted for. A shortcoming of this
study was that it followed a non-probability sampling method to select the sample. Various

148
demographic questions were included to enhance the representativeness of the sample
and minimise the effect of convenience sampling. Despite this, one should proceed with
caution when attempting to generalise the findings of this study to the wider population.
Although attitudinal commitment and behavioural loyalty are believed to be strong and
enduring, rapid technological innovation and increased competition have made it
increasingly difficult to retain existing customers (Yeh et al., 2016:245). As this study
followed a single cross-sectional research design, which provides a single snapshot in
time, there is a possibility of shifting situational contexts that may influence attitudes and
behavioural loyalty. Therefore, future research could adopt a longitudinal design to
measure predictors of mobile gaming brand loyalty that may develop over an extended
time period, which may provide more accurate findings. Another research opportunity
may be to include the other generational cohorts as well as the non-student members of
the Generation Y cohort, and determine their level of brand loyalty toward mobile games.
Finally, due to the rapid adoption of mobile phones and success of mobile games, it may
be prudent for future researchers to study the effect of gamification as a form of mobile
marketing for businesses seeking to promote non-game products and strengthen loyalty.
6.7 CONCLUDING REMARKS
Mobile games have officially surpassed traditional video games as the leading video
gaming platform and account for almost 80 percent of the total revenue generated from
mobile apps. They are fast becoming the most important advertising platform with a reach
of over 1.2 billion people and an equal gender ratio of players. The most successful
mobile games have developed into powerful brands that extend into various consumer
markets such as TV, literature, and film. Despite this, limited studies exist that explain the
phenomena surrounding mobile gaming brands and how they have established a vast
following of brand loyal video gamers. This study proposed to bridge this gap by
empirically testing a model comprising antecedents of mobile gaming brand loyalty
amongst Generation Y students. The model can help video game developers and
marketers predict brand loyal behaviour of a targeted segment in order to develop
proactive strategies that foster this loyalty, and build sustainable mobile gaming brands.

149
BIBLIOGRAPHY
Aaker, D.A. 1991. Managing Brand Equity: Capitalizing on the Value of a Brand Name.
New York: Free Press.
Afari, E. 2013. The effects of psychosocial learning environment on students’ attitudes
towards Mathematics. (In Khine, M.S., ed. Application of structural equation modelling
in educational research and practice. Rotterdam: Sense Publishers. p. 91-114).
Akpojivi, U. & Bevan-Dye, A. 2015. Mobile advertisements and information privacy
perception amongst South African Generation Y students. Telematics and Informatics,
32(1):1-10.
Alfreds, D. 2016. SA gaming industry 'suffering' under regulation. http://www.fin24.
com/Tech/News/sa-gaming-industry-suffering-under-regulation-20160516 Date of
access: 24 Oct. 2016.
Alfred, R. 2008. April 3, 1973: Motorola Calls AT&T ... by Cell. https://www.wired.
com/2008/04/dayintech-0403/ Date of access: 8 June 2018.
Alzahrani, A.I., Mahmud, I., Ramayah, T., Alfarraj, O. & Alalwan, N. 2017. Extending
the theory of planned behavior (TPB) to explain online game playing among Malaysian
undergraduate students. Telematics and Informatics, 34(4):239-251.
Amine, A. 1998. Consumers' true brand loyalty: the central role of commitment.
Journal of strategic marketing, 6(4):305-319.
Amory, A. & Molomo, B. 2012. Gendered play and evaluation of computer video
games by young South Africans. Gender, Technology and Development, 16(2):177-
196.
Amuzo. 2015. The power of play: using mobile games to power up your marketing
strategy. http://www.thedrum.com/industryinsights/2015/10/01/power-play-using-
mobile-games-power-your-marketing-strategy Date of access: 16 Nov. 2017.

150
Anderson, C., & Bushman, B. 2001. Effects of violent video games on aggressive
behaviour, aggressive cognition, aggressive affect, physiological arousal, and prosocial
behaviour: a meta-analytic review of the scientific literature. Psychological Science,
12(5):353-359.
Anthony, S. 2014. Tetris is 30 years old today: the history of the world’s most
successful game. http://www.extremetech.com/gaming/183822-tetris-is-30-years-old-
today-the-history-of-the-worlds-most-successful-game Date of access: 11 Oct. 2016.
Au-Yong-Oliveira, M., Gonçalves, R., Martins, J. & Branco, F. 2018. The social impact
of technology on millennials and consequences for higher education and leadership.
Telematics and Informatics, 35(4):954-963.
Avouris, N. &Yiannoutsou, N. 2012. A review of mobile location-based games for
learning across physical and virtual spaces. Journal of Universal Computer Science,
18(15):2120-2142.
Badrinarayanan, V.A., Sierra, J.J. & Taute, H.A. 2014. Determinants and outcomes of
online brand tribalism: exploring communities of massively multiplayer online role
playing games (MMORPGs). Psychology & Marketing, 31(10):853-870.
Baek, J., Jang, I.J., Park, K., Kang, H.S. & Yun, B.J. 2006. Human computer
interaction for the accelerometer-based mobile game. (In International Conference on
Embedded and Ubiquitous Computing. Berlin, Heidelberg: Springer. p. 509-518).
Baig, S.A., Zia-Ur-Rehman, M., Saud, Javed, E., Aslam, T. & Shafique, A. 2015.
Mediating roles of customer satisfaction and customer trust in building brand loyalty: An
empirical study in Pakistan. Business Management Dynamics, 4(10):1-29.
Bailey, K. 2016. Why the Pokémon anime is the most successful adaptation of a
videogame ever. https://www.usgamer.net/articles/the-pokemon-tv-show-is-the-most-
successful-adaptation-of-a-videogame-ever Date of access: 13 Aug. 2018.
Bajarin, T. 2017. Why this futuristic tech will be the future of computing.
http://www.time. com/4761298/augmented-reality/ Date of access: 30 Jul. 2018

151
Barton, C., Fromm, J. & Egan, C. 2012. The Millennial consumer: debunking
stereotypes. https://www.bcgperspectives.com/content/articles/consumer-insight-
marketing-millennial-consumer/ Date of access: 21 Feb. 2017
Baruchin, U. 2013. The keys to the candy shop: how Candy Crush offers a
masterclass in marketing. http://www.thedrum.com/opinion/2013/08/07/keys-candy-
shop-how-candy-crush-offers-masterclass-marketing Date of access: 20 Oct. 2017.
Bauer, H.H., Stokburger-Sauer, N.E. & Exler, S. 2008. Brand image and fan loyalty in
professional team sport: a refined model and empirical assessment. Journal of sport
Management, 22(2):205-226.
Beaudette, K. 2011. A history of mobile gaming. http://www.charlatan.ca/2011/07/
history-mobile-gaming/ Date of access: 9 Nov. 2011.
Beekman, C. 2014. The history of video games and the military.
https://taskandpurpose.com/us-militarys-close-history-video-games/ Date of access: 12
June 2018.
Balakrishnan, B.K., Dahnil, M.I. & Yi, W.J. 2014. The impact of social media marketing
medium toward purchase intention and brand loyalty among generation Y. Procedia-
Social and Behavioral Sciences, 148:177-185.
Bennet, B. 2018. Ryan Reynolds, 'performance marketer' joins Peak Games ‘first-ever'
mobile ad campaign. https://www.thedrum.com/news/2018/07/24/ryan-reynolds-
performance-marketer-joins-peak-games-first-ever-mobile-ad-campaign Date of
access: 15 Oct. 2018.
Berman, J. 2016. 16 highest-grossing video game movies of all time.
https://screenrant.com/highest-grossing-video-game-movies-warcraft/ Date of access:
31 Oct. 2017.
Berndt, A. & Petzer, D. 2011. Marketing research. Pinelands, Cape Town:
Heinemann.

152
Bevan-Dye, A.L. & Surujlal, J. 2011. Attitudes towards materialism in sport and
materialism tendencies amongst Black Generation Y students. African Journal for
Physical, Health Education, Recreation and Dance, 1(1):43-55.
Bezerra, J., Bock, W., Candelon, F., Chai, S., Choi, E., Corwin, J., DiGrande, S.,
Gulshan, R., Michael, D. &Varas, A. 2015. The mobile revolution: how mobile
technologies drive a trillion-dollar impact. https://www.bcg.com/en-
za/publications/2015/telecom munications-technology-industries-the-mobile-
revolution.aspx Date of access: 31 July 2018.
Bhojan, A., Akhihebbal, A.L., Chan, M.C. &Balan, R.K. 2012. Arivu: making networked
mobile games green. Mobile Networks and Applications, 17(1):21-28.
Bilgihan, A. 2016. Gen Y customer loyalty in online shopping: an integrated model of
trust, user experience and branding. Computers in Human Behavior, 61:103-113.
Blake, C., Hefner, D., Roth, C., Klimmt, C. & Vorderer, P. 2012. Cognitive processes
involved in video game identification. International Conference on Entertainment
Computing, 75-84.
Bloemer, J.M. & Kasper, H.D. 1995. The complex relationship between consumer
satisfaction and brand loyalty. Journal of economic psychology, 16(2):311-329.
Blythe, J. 2005. Essentials of marketing. 3rd ed. Harlow, Essex: Pearson Education
Limited.
Bolton, R.N., Parasuraman, A., Hoefnagels, A., Migchels, N., Kabadayi, S., Gruber, T.,
Loureiro, Y.K. & Solnet, D. 2013. Understanding Generation Y and their use of social
media: a review and research agenda. Journal of Service Management, 24(3):245-267.
Boone, G., Secci, J. & Gallant, L. 2010. Emerging trends in online advertising.
DoxaCommunicacion, 5(1):241-253.
Brachmann, S. 2014. The Sony PlayStation: a story of video game dominance.
http://www.ipwatchdog.com/2014/11/24/the-sony-playstation-a-story-of-video-game-
dominance/id=52232/ Date of access: 28 Oct. 2016.
153
Bradley, N. 2013. Marketing research: tools & techniques. 3rd ed. Oxford, UK: Oxford
University Press.
Bratt, M. 2018. Young South African mobile game developer’s Torus. a global hit on
App Store. http://themediaonline.co.za/2018/06/young-south-african-mobile-game-
developers-torus-a-global-hit-on-app-store/ Date of access: 10 July 2018
Brightman, J. 2017. Mobile games booming as global games market hits $108.9B in
2017 –Newzoo. http://www.gamesindustry.biz/articles/2017-04-20-mobile-games-
booming-as-global-games-market-hits-usd108-9b-in-2017-newzoo Date of access: 20
Sept. 2017.
Brockes, E. 2014. The never-ending Candy Crush Saga.
https://www.nytimes.com/2014/02/16/opinion/sunday/the-never-ending-candy-crush-
saga.html?_r=0 Date of access: 20 Oct. 2017.
Browne, K. & Anand, C. 2012. An empirical evaluation of user interfaces for a mobile
video game. Entertainment Computing, 3(1):1-10.
Burgess, S.M. 2011. Marketing strategy across borders. (In Bothma, C & Burgess, S.,
eds. International marketing. 2nd ed. Cape Town: Oxford University Press. p. 22-57).
Burns, A.C. & Bush, R.F. 2014. Marketing research. 7th ed. Harlow, Essex: Pearson
Education Limited.
Bush, A.J., Martin, C.A. & Bush, V.D. 2004. Sports celebrity influence on the
behavioral intentions of generation Y. Journal of Advertising Research, 44(1):108-118.
Byrne, B.M. 2010. Structural equation modelling with AMOS: basic concepts,
applications, and programming. 2nd ed. New York, NY: Taylor & Francis Group.
Canalys. 2010. Majority of smart phones now have touch screens. http://www.canalys.
com/newsroom/majority-smart-phones-now-have-touch-screens Date of access: 25
Oct. 2016.

154
Capin, T., Haro, A., Setlur, V. & Wilkinson, S. 2006. Camera-based virtual environment
interaction on mobile devices. (In International Symposium on Computer and
Information Sciences. p. 765-773).
Cassell, A. 2013. Premium vs. Freemium: how mobile games make money.
http://www.fullsailblog.com/premium-vs-freemium-how-mobile-games-make-money
Date of access: 20 Sept. 2017.
Chaudhuri, A. & Holbrook, M.B. 2001. The chain of effects from brand trust and brand
affect to brand performance: the role of brand loyalty. Journal of marketing, 65(2):81-
93.
Chen, B.X. 2009. June 29, 2007: iPhone, you phone, we all wanna iPhone.
http://www.wired.com/2009/06/dayintech_0629/ Date of access: 25 Oct. 2016.
Chen, C. 2014. Are you addicted to Candy Crush Saga? an exploratory study linking
psychological factors to mobile social game addiction. Hong Kong: Chinese University
of Hong Kong. (Thesis - Masters).
Cheng, C.W. 2012. The system and self-reference of the app economy: the case of
Angry Birds. Westminster Papers in Communication and Culture, 9(1):47-66.
Cheshire, T. 2011. In depth: How Rovio made Angry Birds a winner (and what's next).
http://www.wired.co.uk/article/how-rovio-made-angry-birds-a-winner Date of access: 30
Oct. 2017.
Choi, D. & Kim, J. 2004. Why people continue to play online games: in search of
critical design factors to increase customer loyalty to online contents. Cyber
Psychology & Behavior, 7(1):11-24.
Chuah, S.H.W., Marimuthu, M., Kandampully, J. & Bilgihan, A. 2017. What drives Gen
Y loyalty? Understanding the mediated moderating roles of switching costs and
alternative attractiveness in the value-satisfaction-loyalty chain. Journal of Retailing and
Consumer Services, 36:124-136.

155
Ciabai, C. 2017. The freemium model, themed parks and dopamine action: how Angry
Birds changed gaming. https://www.unigamesity.com/the-freemium-model-themed-
parks-and-dopamine-action-how-angry-birds-changed-gaming/ Date of access: 21
Sept. 2017.
Çifci, S., Ekinci, Y., Whyatt, G., Japutra, A., Molinillo, S. & Siala, H. 2016. A cross
validation of Consumer-Based Brand Equity models: driving customer equity in retail
brands. Journal of Business Research, 69(9):3740-3747.
Cleff, T., Walter, N. & Xie, J. 2018. The effect of online brand experience on brand
loyalty: a web of emotions. IUP Journal of Brand Management, 15(1):7-24.
Clow, K.E. & James, K.E. 2014. Essentials of marketing research: putting research
into practice. 1st ed. California: Sage Publications.
Constine, J. 2017. Pokémon Go reveals sponsors like McDonald’s pay it up to $0.50
per visitor. https://techcrunch.com/2017/05/31/pokemon-go-sponsorship-price/ Date of
access: 31 July 2018.
Creswell, J.W. 2009. Research Design: Qualitative, Quantitative, and Mixed Method
Approaches. 3rd ed. California: Sage Publications.
Creswell, J.W. 2014. Research Design: Qualitative, Quantitative, and Mixed Method
Approaches. 4th ed. California: Sage Publications.
Creswell, J.W. & Clark, V.L.P. 2007. Designing and Conduction Mixed Methods
Research. 2nd ed. California: Sage Publications.
Crews, E. 2016. A short history of mobile games. http://www.geekinsider.com/short-
history-mobile-games/ Date of access: 26 Oct. 2016.
Csikszentmihalyi, M. & LeFevre, J. 1989. Optimal experience in work and leisure.
Journal of Personality and Social Psychology, 56(5):815-822.
Curran, K. & George, C. 2012. The future of web and mobile game development.
International Journal of Cloud Computing and Services Science, 1(1):25-34.

156
Cusumano, M. 2008. Technology strategy and management: the puzzle of Apple.
Communications of the ACM, 51(9):22-24.
Dajee, J. 2017. Why the potential for augmented reality is greater than you think.
https://singularityhub.com/2017/02/24/why-the-potential-of-augmented-reality-is-greater-
than-you-think/ Date of access: 8 Nov. 2017.
Darabiha, R. 2016. How Rovio builds a brand to last. https://readwrite.com/
2016/02/08/rovio-branding/ Date of access: 30 Oct. 2017.
Datta, H., Ailawadi, K.L. & van Heerde, H.J. 2017. How well does consumer-based
brand equity align with sales-based brand equity and marketing-mix response? Journal
of Marketing, 81(3):1-20.
Davidovici-Nora, M. 2014. Paid and free digital business models innovations in the
video game industry. Digiworld Economic Journal, 94:83-102.
Day, G.S. 1969. A two-dimensional concept of brand loyalty. Journal of Advertising
Research, 9:29-35.
Debevec, K., Schewe, C.D., Madden, T.J. & Diamond, W.D. 2013. Are today's
Millennials splintering into a new generational cohort? Maybe! Journal of Consumer
Behaviour, 12(1):20-31.
Deffree, S. 2018. 1st mobile phone call is made, April 3, 1973. https://www.edn.
com/electronics-blogs/edn-moments/4411258/1st-mobile-phone-call-is-made--April-3—
1973 Date of access: 18 June 2018.
Deloitte, 2017. Global mobile consumer survey 2017: the South African cut.
https://www2.deloitte.com/content/dam/Deloitte/za/Documents/technology-media-
telecommunications/Deloitte%20South%20Africa%20Mobile%20Consumer%20Survey
%202017%20-%20Mobile.pdf Date of access: 1 Nov. 2018
Desmond, N. 2017. The secrets behind a $5m + per day game (Clash of Clans
marketing). https://buckfiftymba.com/clash-of-clans/ Date of access: 1 Nov. 2017.

157
Dhanapal, S., Vashu, D. & Subramaniam, T. 2015. Perceptions on the challenges of
online purchasing: a study from “baby boomers”, generation “X” and generation “Y”
point of views. Contaduría y Administración, 60:107-132.
DHCC. 2016. Why mobile gaming matters - a history of then and now. http://dailyhive.
com/montreal/leovagas-history-of-mobile-gaming Date of access: 2 Aug. 2017.
Diaz, A-C. 2018. Ryan Reynolds gives star power to Peak Games' performance
marketing campaign. https://adage.com/article/cmo-strategy/ryan-reynolds-secret-
weapon-gaming-company-peak-s-performance-marketing-campaign/314396/ Date of
access: 12 Oct. 2018.
Digital Eye Media. 2017. How Candy Crush used Social Media to become marketing
genius’. http://www.digitaleyemedia.com/blog/how-candy-crush-used-social-media-to-
become-marketing-genius Date of access: 30 Oct. 2017.
Dooley, R. 2013. Five marketing lessons from Candy Crush Saga. https://www.forbes.
com/sites/rogerdooley/2013/11/19/candy-crush-lessons/#64084d3f5938 Date of
access: 20 Oct. 2017.
Dorfman, A. 2016. How Pokémon Go will level up local advertising.
http://www.marketingland.com/pokemon-go-will-level-local-advertising-184373 Date of
Access: 28 Jul. 2016.
Dredge, S. 2012. The Force is strong (and feathery) with new iPhone, iPad, Android
and Windows Phone app. https://www.theguardian.com/technology/appsblog/2012/nov/
08/angry-birds-star-wars-review Date of access: 21 Sept. 2017.
Dredge, S. 2014. Sick of freemium? here are 20 paid iOS and Android games worth
supporting. https://www.theguardian.com/technology/2014/may/15/android-ios-paid-
games-free-to-play-freemium Date of access: 9 July 2018.
Dredge, S. 2015. Angry Birds revenues fell in 2014 due to sharp decline in
merchandise sales. https://www.theguardian.com/technology/2015/mar/19/angry-birds-
revenues-2014-rovio Date of access: 31 Oct. 2017.

158
England, M. 2015. 4 tips for a branded merchandise strategy.
https://www.mytotalretail. com/article/4-tips-branded-merchandise-strategy/all/ Date of
access: 12 Aug. 2018.
Erik, A. 2017. Product placement in online games. http://brandsandfilms.com/2017/07
/product-placement-online-games/ Date of access: 12 Aug. 2018.
Erlichman, J. 2015. A new approach to marketing mobile games.
https://gameanalytics.com/blog/new-approach-marketing-mobile-gamesseriously.html
Date of access: 28 May 2018
Ernest. 2016. YouTube success stories: Clash of Clans’ unique YouTube views
strategy. https://buyviews.co/clash-of-clans-unique-youtube-views-strategy/ Date of
access: 1 Nov. 2017.
Falconer, J. 2014. Nintendo's Gameboy celebrates its 25th birthday.
http://www.gizmag. com/gameboy-celebrates-25th-birthday/31804/ Date of access: 25
Jul. 2016.
Farquhar, P.H. 1989. Managing brand equity. Marketing Research, 1(3).
Feijoo, C., Gomez-Barroso, J-L., Aguado, J-M.& Ramos, S. 2011. Mobile gaming:
Industry challenges and policy implications. Telecommunications Policy, 36(3):212–
221.
Feilzer, M.Y. 2010. Doing mixed methods research pragmatically: implications for the
rediscovery of pragmatism as a research paradigm. Journal of Mixed Methods
Research, 4(1):6-16.
Fernández-Durán, J.J. 2016. Defining generational cohorts for marketing in Mexico.
Journal of Business Research, 69(2):435-444.
Field, A. 2009. Discovering statistics using SPSS. 3rd ed. London: Sage Publications.
Filipowicz, L. 2017. Candy Crush Saga — everything you need to know!
https://www.imore.com/candy-crush-saga Date of access: 9 July 2018.
159
Fournier, S. and Yao, J.L. 1997. Reviving brand loyalty: a reconceptualization within
the framework of consumer-brand relationships. International Journal of research in
Marketing, 14(5):451-472.
Fox News. 2013. The first mobile phone call was placed 40 years ago today.
http://www.foxnews.com/tech/2013/04/03/first-mobile-phone-call-was-placed-40-years-
ago-today.html Date of access: 31 Jul. 2017.
Frank, A. 2017. Gyms in Pokémon Go: How to train, claim and win.
https://www.polygon.com/guides/2017/6/23/15865464/pokemon-go-gyms-how-to-win-
tips Date of access: 8 Nov. 2017.
Fripp, C. 2016. Why game developers are ditching South Africa. http://www.htxt.co.za/
2016/05/06/why-game-developers-are-ditching-south-africa/ Date of access: 23 Oct.
2016.
Gabbiadini, A., Riva, P., Andrighetto, L., Volpato, C. & Bushman, B.J. 2016. Acting like
a tough guy: violent-sexist video games, identification with game characters, masculine
beliefs, & empathy for female violence victims. Plos One, 11(4):1-14.
Gahwiler, P. & Havitz, M.E. 1998. Towards a relational understanding of leisure social
worlds, involvement, psychological commitment, and behavioural loyalty. Leisure
Sciences, 20:1-23.
Gallagher, S & Park, S.H. 2002. Innovation and competition in standard-based
industries: an historical analysis of the U.S. home video market. The Transactions on
Engineering Management, 49(1):67-82.
Gao, T., Sultan, F. & Rohm, A.J. 2010. Factors influencing Chinese youth consumers'
acceptance of mobile marketing. Journal of Consumer Marketing, 27(7):574-583.
Gaudiosi, J. 2012. Angry Birds Star Wars' Game: Rovio and Lucasfilm Team Up.
http://www.hollywoodreporter.com/news/angry-birds-star-wars-rovio-lucas-team-up-
377049 Date of access: 30 Oct. 2017.

160
Gaur, A. & Arora, N. 2014. Effect of age and gender on brand loyalty and customer
satisfaction: a study of mobile phone user. SIES Journal of Management, 10(2):22-30.
Ghani, J.A. & Deshpande, S.P. 1994. Task characteristics and the experience of
optimal flow in human—computer interaction. The Journal of Psychology, 128(4):381-
391.
Gilbert, D. 2016. Augmented Reality marketing: Pokémon Go shows huge potential of
new technology. https://www.insights.samsung.com Date of Access: 28 Jul. 2016.
Goodwin, R. 2017. The history of mobile phones from 1973 to 2008: the handsets that
made it all happen. http://www.knowyourmobile.com/nokia/nokia-3310/19848/history-
mobile-phones-1973-2008-handsets-made-it-all-happen Date of access: 31 Jul. 2017.
Gounaris, S. & Stathakopoulos, V. 2004. Antecedents and consequences of brand
loyalty: an empirical study. Journal of Brand Management, 11(4):283-306.
Granic, I., Lobel, A. & Engels, R. 2014. The benefits of playing video games.
American Psychologist, 69(1):66-78.
Greenberg, B.S., Sherry, J., Lachlan, K., Lucas, K. & Holmstrom, A. 2010. Orientations
to video games among gender and age groups. Simulation & Gaming, 41(2):238-259.
Greene, G. 2015. Rovio reveals the key to Angry Birds' success: brand partners.
https://venturebeat.com/2015/08/18/rovio-reveals-the-key-to-angry-birds-success-
brand-partners/ Date of access: 30 Oct. 2017.
Guba, E.G. & Lincoln, Y.S. 1994. Competing paradigms in qualitative research. (In
Denzin, N.K. & Lincoln, Y.S., ed. Handbook of qualitative research. London: Sage
Publications. p. 105-117).
Gunelius, S. 2017. Angry Birds Success Follows 3 Core Steps of Brand Building.
https://aytm.com/blogresearch-junction/angry-birds-success-brand-building/ Date of
access: 17 Oct. 2017.

161
Ha, I., Yoon, Y. & Choi, M. 2007. Determinants of adoption of mobile games under
mobile broadband wireless access environment. Information & Management,
44(3):276-286.
Hair, J., Bush, R. & Ortinau, D. 2002. Marketing research: within a changing
environment. 2nd ed. New York City, NY: McGraw-Hill/Irwin.
Hair, J., Black, W., Babin, B. & Anderson, R. 2010. Multivariate data analysis: a global
perspective. 7th ed. Upper Saddle River, N.J.: Pearson.
Hair, J., Black, W., Babin, B. & Anderson, R. 2014. Multivariate data analysis. 7th ed.
Harlow, Essex: Pearson.
Hall-Stigerts, L. 2013. What’s the deal with free-to-play games.
http://www.bigfishgames.com/blog/what-are-free-to-play-games/ Date of access: 25
Oct. 2016.
Hamari, J. 2015. Why do people buy virtual goods? Attitude toward virtual good
purchases versus game enjoyment. International Journal of Information Management,
35(3):299-308.
Hamari, J., Shernoff, D.J., Rowe, E., Coller, B., Asbell-Clarke, J. & Edwards, T. 2016.
Challenging games help students learn: An empirical study on engagement, flow and
immersion in game-based learning. Computers in Human Behavior, 54:170-179.
Hamidi, H. & Chavoshi, A. 2018. Analysis of the essential factors for the adoption of
mobile learning in higher education: a case study of students of the University of
Technology. Telematics and Informatics, 35(4):1053-1070.
Hang, H. 2014. Brand-placement effectiveness and competitive interference in
entertainment media: brand recall and choice in kids’ video-game advertisements.
Journal of Advertising Research, 54(2):192-199.
Hefner, D., Klimmt, C. & Vorderer, P. 2007. Identification with the player character as
determinant of video game enjoyment. (In Entertainment Computing. Berlin,
Heidelberg: Springer. p. 39-48).

162
Hill, S. 2014. Common traits of successful casual mobile games. https://crowdsourced
testing.com/resources/mobile-games/ Date of access: 17 Oct. 2016.
Hobbs, T. 2016. Why Pokémon Go is a game changer for augmented reality and
marketers. http://www.marketingweek.com Date of Access: 28 Jul. 2016.
Hoffman, D.L. & Fodor, M. 2010. Can you measure the ROI of your social media
marketing? MIT Sloan Management Review, 52(1):41-49.
Holt, C. 2014. Behind the success of Temple Run. http://www.macworld.com/
article/2361426/behind-the-success-of-temple-run.html Date of access: 21 Oct. 2016.
Hsiao, K-L. & Chen, C-C. 2016. What drives in-app purchase intention for mobile
games? An examination of perceived values and loyalty. Electronic Commerce
Research and Applications, 16:18-29.
Hsu, C.L. & Lu, H.P. 2004. Why do people play on-line games? An extended TAM with
social influences and flow experience. Information & management, 41(7):853-868.
Hsu, C.L., Chang, K.C. & Chen, M.C. 2012. The impact of website quality on customer
satisfaction and purchase intention: perceived playfulness and perceived flow as
mediators. Information Systems and e-Business Management, 10(4):549-570.
Huang, R. & Sarigöllü, E. 2014. How brand awareness relates to market outcome,
brand equity, and the marketing mix. (In Fashion Branding and Consumer Behaviors.
New York, NY: Springer. p. 113-132).
Huang, C.C. 2017. The impacts of brand experiences on brand loyalty: mediators of
brand love and trust. Management Decision, 55(5):915-934.
Hudson, S., Huang, L., Roth, M.S. & Madden, T.J. 2016. The influence of social media
interactions on consumer–brand relationships: a three-country study of brand
perceptions and marketing behaviors. International Journal of Research in Marketing,
33:27-41.

163
Hurst, J. 2015. 12 types of computer games every gamer should know about.
https://thoughtcatalog.com/jane-hurst/2015/02/12-types-of-computer-games-every-
gamer-should-know-about/ Date of access: 28 May 2018.
Iacobucci, D. 2013. Marketing Management 3. Mason, OH: South-Western Cengage
Learning.
Iacobucci, D. & Churchill, G.A. 2010. Marketing research: methodological foundations.
Mason, Ohio: South-Western Cengage Learning.
IHS Market Insight. 2016. Early success for Pokémon Go demonstrates the power of
brand on mobile. https://technology.ihs.com/581080/early-success-for-pokmon-go-
demonstrates-the-power-of-brand-on-mobile Date of access: 18 June 2016.
In’nami, Y. & Koizumi, R. 2013. Structural equation modelling in educational research.
(In Khine, M.S., ed. Application of structural equation modelling in educational research
and practice. Rotterdam: Sense Publishers. p. 23-54).
Jacoby, J. & Kyner, D.B. 1973. Brand loyalty vs. repeat purchase behaviour. Journal
of Marketing Research, 10:1-9.
Jacoby, J. & Chestnut, R.W. 1978. Brand Loyalty. New York: Wiley.
Jang, H.Y., Ko, I.S. & Koh, J. 2007. The influence of online brand community
characteristics on community commitment and brand loyalty. International Journal of
Electronic Commerce, 12(3):57-80.
Jansen van Rensburg, V. 2014. Strategic marketing: theory and application for
competitive advantage. 2nd ed. Goodwood, Cape Town: Oxford University Press.
Jansen, M. 2018. Escape reality with the best augmented reality apps for Android and
iOS. https://www.digitaltrends.com/mobile/best-augmented-reality-apps/ Date of
access: 21 May 2018.
Javadein, S.R.S., Khanlari, A. & Estiri, M. 2008. Customer loyalty in the sport services
industry: the role of service quality, customer satisfaction, commitment and trust.
Journal of Human Sciences, 5(2):1-19.

164
Jensen, K.T. 2017. The complete history of first person shooters.
https://www.geek.com/games/the-complete-history-of-first-person-shooters-1713135/
Date of access: 12 June 2018
Jeong, E.J & Kim, D.J. 2009. Definitions, key characteristics, and generations of
mobile games. Encyclopedia of mobile computing and commerce, 1(1):185-189.
Jin, S.A.A. 2012. Toward integrative models of flow: Effects of performance, skill,
challenge, playfulness, and presence on flow in video games. Journal of Broadcasting
& Electronic Media, 56(2):169-186.
Johnson, R.B. & Onwuegbuzie, A.J. 2004. Mixed methods research: a research
paradigm whose time has come. Educational Researcher, 33(7):14-26.
Jones, D. 2016. Augmented reality mobile game puts Pokémon in real world.
https://www.technewsworld.com/story/83680.html Date of access: 8 Nov. 2017.
Jones, E. 2013. What is Candy Crush Saga? top 10 facts you need to know.
http://www.heavy.com/games/2013/07/what-is-candy-crush-saga-facebook-mobile-
puzzle-game/ Date of access: 21 Oct. 2016.
Joselli, M. & Clua, E. 2009. Grmobile: a framework for touch and accelerometer
gesture recognition for mobile games. (In SB Games VIII Brazilian Symposium on
Games and Digital Entertainment. IEEE. p. 136-142).
Jung, Y., Perezmira, B. & Wileypatton, S. 2009. Consumer adoption of mobile TV:
examining psychological flow and media content. Computers in Human Behaviour,
25(1):123–129.
Kabiraj, S. & Shanmugan, J. 2011. Development of a conceptual framework for brand
loyalty: a Euro-Mediterranean perspective. Journal of Brand Management, 18(4-5):285-
299.
Kaur, P., Dhir, A., Chen, S. & Rajala, R. 2016. Flow in context: development and
validation of the flow experience instrument for social networking. Computers in Human
Behavior, 59:358-367.

165
Keane, J. 2015. Before mobile gaming exploded, there was the Nokia N-Gage.
https://www.pastemagazine.com/articles/2015/12/before-the-mobile-gaming-explosion-
there-was-the-n.html Date of access: 18 June 2018.
Keating, L. 2015. Gaming on-the-go: the future of mobile gaming vs. consoles.
http://www.techtimes.com/articles/57048/20150604/gaming-go-future-mobile-vs-
consoles.htm Date of access: 26 Oct. 2016.
Keller, K.L. 1993. Conceptualizing, measuring, and managing customer-based brand
equity. The Journal of Marketing, 1-22.
Keller, K.L. 2001. Building Customer-Based Brand Equity: A Blueprint for Creating
Strong Brands. Cambridge, MA: Marketing Science Institute.
Kent, R. 2007. Marketing research: approaches, methods, and applications in Europe.
1st ed. London: Thomson Learning.
Kent, S. 2001. The ultimate history of video games: from pong to pokémon and
beyond: the story behind the craze that touched our lives and changed the world. New
York City, NY: Three Rivers Press.
Kilic, I. 2018. All you need to know about voice-enabled mobile apps.
https://appsamurai.com/all-you-need-to-know-about-voice-enabled-mobile-apps/ Date
of access: 16 May 2018.
Kim, C.K., Han, D. & Park, S.B. 2001. The effect of brand personality and brand
identification on brand loyalty: applying the theory of social identification. Japanese
Psychological Research, 43(4):195-206.
Kim, Y., Walsh, P. & Ross, S.D. 2008. An examination of the psychological and
consumptive behaviors of sport video gamers. Sport Marketing Quarterly, 17(1):44-53.
Kim, H.M. 2013. Mobile media technology and popular mobile games in contemporary
society. International Journal of Mobile Marketing, 8(2):42-54.
Kim, K., Park, J. & Kim, J. 2014. Consumer–brand relationship quality: when and how
it helps brand extensions. Journal of Business Research, 67(4):591-597.

166
Kim, S., Lee, J., Hwang, Y. & Jeong, S.H. 2015. Effects of prominent advertising in
mobile games on cognitive, affective and behavioural outcomes: the moderating role of
persuasion knowledge. (In Proceedings of the American Academy of Advertising.
Lubbock: American Academy of Advertising. p. 68).
King Jnr, B. 2016. Why you’ll never stop seeing ads & IAPs in mobile apps.
http://www.makeuseof.com/tag/youll-never-stop-seeing-ads-iaps-mobile-apps/ Date of
access: 22 Oct. 2016.
Klappenbach, M. 2017. Grand Theft Auto series. https://www.lifewire.com/grand-theft-
auto-series-812461 Date of access: 26 Jul. 2017
Klappenbach, M. 2018. What is a platform video game?
https://www.lifewire.com/what-is-a-platform-game-812371 Date of access: 28 May
2018.
Kline, R.B. 2011. Principles and practice of structural equation modelling. 3rd ed.
New York, NY: The Guilford Press.
Kohler, C. 2012. Temple Run and the rise of the free, profitable videogame.
https://www.wired.com/2012/03/free-games-temple-run/ Date of access: 20 Oct. 2016.
Koo, D.M. 2009. The moderating role of locus of control on the links between
experiential motives and intention to play online games. Computers in Human
Behavior, 25(2):466-474.
Kotler, P. 2000. Marketing management: millennium edition. 10th ed. Upper Saddle
River, New Jersey: Pearson Education.
Kotler, P. & Armstrong, G. 2018. Principles of marketing. 17th ed. Harlow, UK:
Pearson Education Limited.
Kreutzer, T. 2009. Generation mobile: online and digital media usage on mobile
phones among low-income urban youth in South Africa. Retrieved on March, 30:903-
920.

167
Krishan, J. 2016. Real-world products are entering game worlds - but where's the line
between creating and breaking the illusion of reality? https://www.standard.co.uk/
stayingin/tech-gaming/why-product-placement-is-moving-into-games-like-uncharted-
and-quantum-break-a3225106.html Date of access: 13 June 2018.
Krishnamurthi, L. & Raj, S.P. 1991. An empirical analysis of the relationship between
brand loyalty and consumer price elasticity. Marketing Science, 10(2):172-183.
Kuenzel, S. & Halliday, S.V. 2010. The chain of effects from reputation and brand
personality congruence to brand loyalty: the role of brand identification. Journal of
Targeting, Measurement and Analysis for Marketing, 18(3-4):167-176.
Kumar, A. & Lim, H. 2008. Age differences in mobile service perceptions: comparison
of Generation Y and baby boomers. Journal of Services Marketing, 22(7):568-577.
Kumar, V. 2014. Making “freemium” work. https://hbr.org/2014/05/making-freemium-
work Date of access: 31 Jul. 2018.
Lambie, R. 2014. The top 50 underappreciated Sega Mega Drive games.
http://www.denofgeek.com/games/sega-mega-drive/29578/the-top-50-under
appreciated-sega-mega-drive-games Date of access: 27 Jul. 2017
Langshaw, M. 2011. Feature: the history of mobile gaming. http://www.digitalspy.com/
gaming/news/a313439/feature-the-history-of-mobile-gaming/ Date of access: 26 Oct.
2016.
Laroche, M., Habibi, M.R. & Richard, M.O. 2013. To be or not to be in social media:
how brand loyalty is affected by social media? International Journal of Information
Management, 33(1):76-82.
Lawlor, U. 2015. Mobile game advertising: how brands can play to win.
https://xtremepush.com/mobile-game-advertising-how-brands-can-play-to-win/ Date of
access: 2 Nov. 2017.
Lawton, G. 2002. Moving Java into mobile phones. Computer, 35(6):17-20.

168
Lazarevic, V. 2012. Encouraging brand loyalty in fickle generation Y consumers.
Young Consumers, 13(1):45-61.
Lee, M.C. 2009. Understanding the behavioural intention to play online games: An
extension of the theory of planned behaviour. Online information review, 33(5):849-872.
Lee, M.C. & Tsai, T.R. 2010. What drives people to continue to play online games? An
extension of technology model and theory of planned behaviour. International Journal of
Human–Computer Interaction, 26(6):601-620.
Lee, J. & Kyle, G.T. 2014. Segmenting festival visitors using psychological
commitment. Journal of Travel Research, 53(5):656-669.
Lee, S., Shin, H., Park, J.J. & Kwon, O.R. 2010. A brand loyalty model utilitizing team
identification and customer satisfaction in the licensed sports product industry. Journal
of Research, 60-67.
Lei, P. & Wu, Q. 2007. Introduction to structural equation modeling: issues and
practical considerations. Educational measurement: issues and practice, 26(3):33-43.
Lendino, J. 2015. Xbox One vs. PlayStation 4: which game console is the best?
http://www.extremetech.com/gaming/156273-xbox-720-vs-ps4-vs-pc-how-the-hardware-
specs-compare Date of access: 28 Jul. 2017.
Lescop, D. & Lescop, E. 2014. Exploring mobile gaming revenues: the price tag of
impatience, stress and release. Digiworld Economic Journal, 94(2):103-122.
Levski, Y. 2017. 10 examples of augmented reality marketing campaigns.
https://appreal-vr.com/blog/10-augmented-reality-marketing-examples/ Date of access:
8 Nov. 2017.
Levy, K. 2014. The complicated history of 'Tetris,' which celebrates its 30th
anniversary today. http://www.businessinsider.com/tetris-history-2014-6 Date of
access: 8 Nov. 2016.

169
Lewis, B. & Porter, L. 2010. In-game advertising effects: examining player perceptions
of advertising schema congruity in a massively multiplayer online role-playing game.
Journal of Interactive Advertising, 10(2):46-60.
Liao, G.Y., Huang, H.C. & Teng, C.I. 2016. When does frustration not reduce
continuance intention of online gamers? The expectancy disconfirmation perspective.
Journal of Electronic Commerce Research, 17(1):65-79.
Lii, Y.S. & Sy, E. 2009. Internet differential pricing: effects on consumer price
perception, emotions, and behavioral responses. Computers in Human Behavior,
25(3):770-777.
Lin, H.F. 2015. The effect of product placement on persuasion for mobile phone
games. International Journal of Advertising, 33(1)37-60.
Lin, L.Y. 2010. The relationship of consumer personality trait, brand personality and
brand loyalty: an empirical study of toys and video games buyers. Journal of Product &
Brand Management, 19(1):4-17.
Lissitsa, S. & Kol, O. 2016. Generation X vs. Generation Y: a decade of online
shopping. Journal of Retailing and Consumer Services, 31(1):304-312.
Liu, C.R., Wu, T.C., Yeh, P.H. & Chen, S.P. 2015. Equity-based customer loyalty
mode for the upscale hotels—alternative models for leisure and business travels.
Tourism Management Perspectives, 16:139-147.
Liu, C.Z., Au, Y.A. & Choi, H.S. 2012. An empirical study of the freemium strategy for
mobile apps: evidence from the googleplay market. (In Thirty Third International
Conference on Information Systems. Orlando: ICIS. p. 1-17).
Liu, C.Z., Au, Y.A. & Choi, H.S. 2014. Effects of freemium strategy in the mobile app
market: an empirical study of Google play. Journal of Management Information
Systems, 31(3):326-354.

170
Liu, Y. & Li, H. 2011. Exploring the impact of use context on mobile hedonic services
adoption: an empirical study on mobile gaming in China. Computers in Human
Behaviour, 27(2):890–898.
Lopez, M. 2018. Ryan Reynolds, Peak Games partner on video campaign for new
mobile game. https://www.thewrap.com/members/2018/07/25/ryan-reynolds-peak-
games-partner-on-video-campaign-for-new-mobile-game/ Date of access: 12 Oct.
2018.
Loveday, S. 2015. King bolsters Candy Crush brand with three new agents.
http://www.licensing.biz/news/read/king-bolsters-candy-crush-brand-with-three-new-
agents/041581 Date of access: 16 Nov. 2016.
Lovell, N. 2011. Move over freemium: paymium is the new game in town.
http://www.gamesbrief.com/2011/10/move-over-freemium-paymium-is-the-new-game-
in-town/ Date of access: 24 Oct. 2016.
Lu, H.P. & Wang, S.M. 2008. The role of Internet addiction in online game loyalty: an
exploratory study. Internet Research, 18(5):499-519.
Mabkhot, H.A., Shaari, H. & Salleh, S.M. 2017. The influence of brand image and
brand personality on brand loyalty, mediating by brand trust: an empirical study. Jurnal
Pengurusan, 50:71-82.
Makuch, E. 2013. Sony gets rights for Angry Birds movie. https://www.gamespot.com
/articles/sony-gets-rights-for-angry-birds-movie/1100-6408440/ Date of access: 31 Oct.
2017.
Malhotra, N.K. 2018. Marketing research: an applied orientation. 7th ed. New Jersey:
Pearson.
Malhotra, N.K. 2010. Marketing research: an applied orientation. 6th ed. Upper
Saddle River, New Jersey: Pearson Education.
Maree, K. & Pietersen, J. 2016. Sampling. (In Maree, K., ed. First steps in research.
Pretoria: Van Schaik. p. 191-203).

171
Markert, J. 2004. Demographics of age: generational and cohort confusion. Journal of
Current Issues and Research in Advertising, 26(2):11-25.
Matangira, L. 2018. Nearly 60% of South Africans now have access to the internet.
https://ewn.co.za/2018/02/05/nearly-60-of-south-africans-now-have-access-to-the-
internet Date of Access: 1 Nov. 2018.
Maverick, J.B. 2017. Who are BMW's main suppliers? https://www.investopedia.
com/ask/answers/060115/who-are-bmws-main-suppliers.asp Date of access: 1 Oct.
2018.
Mayra, F. 2015. Mobile games. http://www.people.uta.fi/~tlilma/Mobile_Games.pdf
Date of access: 10 Oct. 2016.
McCarthy, J. 2017. Did Pokémon Go really change how marketers view augmented
reality? http://www.thedrum.com/news/2017/07/07/did-pokemon-go-really-change-how-
marketers-view-augmented-reality Date of access: 8 Nov. 2017.
McCorvey, J.J. 2012. Rovio teases Nov. 8 launch of “Angry Birds Star Wars,” toys to
debut monday. https://www.fastcompany.com/3001942/rovio-teases-nov-8-launch-of-
angry-birds-star-wars-toys-to-debut-monday Date of access: 21 Sept. 2017.
McCorvey, J.J. 2013. They’re Back! Rovio Announces Angry Birds Star Wars II.
https://www.fastcompany.com/3014285/theyre-back-rovio-announces-angry-birds-star-
wars-ii Date of access: 21 Sept. 2017.
McDaniel, Jr, C. & Gates, R. 2015. Marketing research. 10th ed. Hoboken, New
Jersey: Wiley & Sons, Inc.
McDonald, E. 2017. The global games market will reach $108.9 billion in 2017 with
Mobile taking 42%. https://newzoo.com/insights/articles/the-global-games-market-will-
reach-108-9-billion-in-2017-with-mobile-taking-42/ Date of access: 20 Sept. 2017.
McGoogan, C. 2017. Angry Birds maker Rovio plans float following blockbuster
success. http://www.telegraph.co.uk/technology/2017/09/05/angry-birds-maker-rovio-
plans-float-following-blockbuster-success/ Date of access: 30 Oct. 2017.
172
Mcilhone, M. 2015. The growth of mobile gaming in South Africa. http://africanbrains.
net/2015/02/25/the-growth-of-mobile-gaming-in-south-africa/ Date of access: 18 Oct.
2016.
McNary, D. 2017. Sony Sets ‘Angry Birds 2’ Movie for Landing in September, 2019.
http://variety.com/2017/film/news/sony-angry-birds-2-movie-september-2019-
1202439770/ Date of access: 31 Oct. 2017.
Mediakix. 2017. The 9 mobile gaming statistics that everyone should see.
http://mediakix.com/2017/05/mobile-gaming-statistics-gaming-apps/#gs.yI4lfDE Date of
access: 8 Nov. 2017.
Merikivi, J., Tuunainen, V. & Nguyen, D. 2017. What makes continued mobile gaming
enjoyable? Computers in Human Behavior, 68:411-421.
Mertes, M. 2018. Video game movies: the best and worst, and highest-grossing and
hardest-flopping. https://www.omaha.com/go/video-game-movies-the-best-and-worst-
and-highest-grossing/article_9570bd55-c34a-55d6-92d4-cab97d4baab7.html Date of
access: 13 Aug. 2018.
Microsoft Devices Team. 2013. 10 things you didn’t know about mobile gaming.
http://www.blogs.windows.com/devices/2013/01/16/10-things-you-didnt-know-about-
mobile-gaming-2/#EH3T7VLZeOFyvKqH.97 Date of access: 29 Oct. 2016.
Migliaccio, J.N. 2018. Call me anything you want... just don't call me a millennial.
Journal of Financial Service Professionals, 72(4):24-29.
Miller, F. 2014. Take it to another level: what Candy Crush can teach marketers.
http://www.campaignlive.co.uk/article/level-candy-crush-teach-marketers/1313120 Date
of access: 20 Oct. 2017.
Minotti, M. 2015. 3 ways the original PlayStation changed gaming forever.
https://venturebeat.com/2015/09/11/3-ways-the-original-playstation-changed-gaming-
forever/ Date of access: 26 Jul. 2017.

173
Money, R.B., Shimp, T.A. & Sakano, T. 2006. Celebrity endorsements in Japan and
the United States: Is negative information all that harmful? Journal of Advertising
Research, 46(1):113-123.
Montgomerie, J. & Roscoe, S. 2013. Owning the consumer - getting to the core of the
Apple business model. Accounting Forum, 37:290-299.
Moon, J.W. & Kim, Y.G. 2001. Extending the TAM for a World-Wide-Web context.
Information & Management, 38(4):217-230.
Moon, J., Hossain, M.D., Sanders, G.L., Garrity, E.J. & Jo, S. 2013. Player
commitment to massively multiplayer online role-playing games (MMORPGs): an
integrated model. International Journal of Electronic Commerce, 17(4):7-38.
Moore, T. 2016. The 12 best epic fantasy games you can play right now.
http://www.syfy.com/syfywire/12-best-epic-fantasy-games-you-can-play-right-now Date
of access: 28 May 2018.
Moreira, Á.V., Filho, V.V. & Ramalho, G.L. 2014. Understanding mobile game success:
a study of features related to acquisition, retention and monetization. SBC Journal on
Interactive, 5(2):2-13.
Mostert, P.G., Petzer, D.J. & Weideman, A. 2016. The interrelationships between
customer satisfaction, brand loyalty and relationship intentions of Generation Y
consumers towards smart phone brands. South African Journal of Business
Management, 47(3):25-34.
Munoz, R. 2018. The 15 Most Notable Mobile Phones That Started It All.
https://www.mobilecon2012.com/the-15-most-notable-mobile-phones-that-started-it-all/
Date of access: 18 June 2018.
Nam, J., Ekinci, Y. & Whyatt, G. 2011. Brand equity, brand loyalty and consumer
satisfaction. Annals of Tourism Research, 38(3):1009-1030.
Nash, T. 2014. Are freemium apps killing game developers? https://www.developer
economics.com/freemium-apps-killing-game-developers Date of access: 25 Jul. 2016.

174
Nations, D. 2017. What is freemium? and is free-to-play actually good for gaming?
https://www.lifewire.com/what-is-freemium-1994347 Date of access: 9 July 2018.
Neal, W. & Strauss, R. 2008. A framework for measuring and managing brand equity.
Marketing Research, 20(2).
News24 Wire. 2016. South African government is hurting local video game
development. http://mybroadband.co.za/news/gaming/165168-south-african-
government-is-hurting-local-video-game-development.html Date of access: 8 Nov.
2016.
Newzoo. 2013. Supercell vs King: how do Clash of Clans and Candy Crush gamers
compare? https://newzoo.com/insights/articles/supercell-vs-king-how-do-their-gamers-
compare/ Date of access: 20 Oct. 2017.
Newzoo. 2017. The global games market will reach $108.9 billion in 2017 with mobile
taking 42%. https://newzoo.com/insights/articles/the-global-games-market-will-reach-
108-9-billion-in-2017-with-mobile-taking-42 Date of access: 7 Nov. 2017.
Nielsen Entertainment. 2016. Mobile esports and VR expand and increase gaming
engagement. http://www.nielsen.com/us/en/insights/news/2016/mobile-esports-and-vr-
expand-and-increase-gaming-engagement/ Date of access: 7 Nov. 2017.
Nieuwenhuis, J. 2016a. Introducing qualitative research. (In Maree, K., ed. First
steps in research. Pretoria: Van Schaik. p. 50-69).
Nieuwenhuis, J. 2016b. Analysing qualitative data. (In Maree, K., ed. First steps in
research. Pretoria: Van Schaik. p. 103-132).
Nikhashemi, S.R., Paim, L., Osman, S. & Sidin, S. 2015. The significant role of
customer brand identification towards brand loyalty development: an empirical study
among Malaysian hypermarkets customer. Procedia-Social and Behavioral Sciences,
207:182-188.
175
Nisar, T.M. & Whitehead, C. 2016. Brand interactions and social media: Enhancing
user loyalty through social networking sites. Computers in Human Behavior, 62:743-
753.
Nouch, J. 2012. Casual gamers play multiple games at once making cross-promotion
key, says King. http://www.pocketgamer.biz/interview/46928/casual-gamers-play-
multiple-games-at-once-making-cross-promotion-key-says-kingcoms-alex-dale/ Date of
access: 31 Oct. 2017.
Noyons, M., Macqueen, D., Johnstone, B., Robertson, E., Palm, T., Point, J-C.&
Behrmann, M. 2012. Mobile games architecture: state of the art European mobile
games industry.
http://cordis.europa.eu/docs/projects/cnect/2/288632/080/deliverables/001-
MobileGameArchD3121122011PU.pdf Date of access: 24 Jul. 2016.
Oberholzer, E. 2018. Johannesburg teen’s mobile games goes global on App store.
https://www.thesouthafrican.com/brandon-kynoch-game-developer-scores-big-on-app-
store/ Date of access: 10 July 2018.
Odin, Y., Odin, N & Valette-Florence, P. 2001. Conceptual and operational aspects of
brand loyalty: An empirical investigation. Journal of Baseness Research, 53:75-84.
Olilla, M. 2017. The augmented reality-fuelled future of mobile marketing.
http://www.pocketgamer.biz/interview/66150/the-augmented-reality-fueled-future-of-
mobile-marketing/ Date of access: 8 Nov. 2017.
Orlanski, B. 2015. Why King and Supercell spend nearly $500m marketing their games
– and how you can spend way less. https://venturebeat.com/2015/04/27/why-king-and-
supercell-spent-nearly-500m-marketing-their-games-and-how-you-can-spend-way-less/
Date of access: 1 Nov. 2017.
Orlikowski, W.J. & Baroudi, J.J. 1990. Studying information technology in organizations:
research approaches and assumptions. Information Systems Research, 2(1):1-28.
Orme, J. G. & Combs-Orme, T. 2009. Multiple regression with discrete dependent
variables. 1st ed. New York: Oxford Press.

176
Oxford, A. 2014. Gaming remains fastest growing part of South African media market.
http://www.htxt.co.za/2014/09/18/gaming-remains-fastest-growing-part-of-south-african-
media-market/ Date of access: 24 Oct. 2016.
Pahwa, A. 2016. Candy Crush success case study: marketing + psychology =
success. https://www.feedough.com/success-candy-crush-case-study-psychology-
marketing/ Date of access: 18 Oct. 2017.
Pallant, J. 2016. SPSS survival manual: a step by step guide to data analysis using
IBM SPSS. 6th ed. Maidenhead: Open University/McGraw-Hill.
Park, H.J. & Kim, S.H. 2013. A Bayesian network approach to examining key success
factors of mobile games. Journal of Business Research, 66(9):1353-1359.
Parker, B.T. 2005. This brand’s for me: Brand personality and user imagery based
self-congruity. Florida: University of Florida. (Dissertation - PhD).
Parment, A. 2013. Generation Y vs. Baby Boomers: shopping behaviour, buyer
involvement and implications for retailing. Journal of Retailing and Consumer Services,
20(2):189-199.
Patsuris, P. 2004. Sony PSP vs. Nintendo DS. http://www.forbes.com/2004/06/
07/cx_pp_0607mondaymatchup.html Date of access: 10 Aug. 2016.
Peckham, M. 2014. The first Sony PlayStation changed everything about gaming.
http://www.time.com/3613610/sony-playstation/ Date of access: 26 Jul. 2017.
Pentecost, R. & Andrews, L. 2010. Fashion retailing and the bottom line: the effects of
generational cohorts, gender, fashion fanship, attitudes and impulse buying on fashion
expenditure. Journal of Retailing and Consumer Services, 17(1):43-52.
Perlow, J. 2016. Pokémon Go: an AR marketing experiment monster.
http://www.zdnet.com Date of access: 20 Oct. 2017.
Peter, J. & Donnelly, J. 2012. Marketing management: knowledge and skills. 11th ed.
New York City, NY: McGraw-Hill/Irwin.

177
Petite, S. 2017. Put your thinking cap on: here are the 10 best puzzle games available
today. https://www.digitaltrends.com/gaming/best-puzzle-games/ Date of access: 28
May 2018.
Pietersen, J. & Maree, K. 2016. Statistical analysis i: descriptive statistics. (In Maree,
K., ed. First steps in research. Pretoria: Van Schaik. p. 204-217).
Pluralsight. 2014. What made Clash of Clans so insanely successful and what can we
learn from it? https://www.pluralsight.com/blog/film-games/made-clash-clans-insanely-
successful-can-learn/ Date of access: 1 Nov. 2017.
Postigo, H. 2003. From pong to planet quake: post-industrial transitions from leisure to
work. Information, Communication & Society, 6(4):593-607.
Price, D.G. 2017. Drivers of mobile game adoption amongst Generation Y students.
Vanderbijlpark: NWU. (Dissertation - Masters).
Pricewaterhouse Coopers (PwC). 2013. South African entertainment and media
outlook: 2013-2017. http://www.pwc.co.za Date of access: 20 Oct. 2017.
Pricewaterhouse Coopers (PwC). 2015. PwC’s South African entertainment and media
outlook: 2015-2019. http://www.pwc.co.za Date of access: 6 Nov. 2017.
Pritchard, M.P., Havitz, M.E. & Howard, D.R. 1999. Analyzing the commitment-loyalty
link in service contexts. Journal of the Academy of Marketing Science, 27(3):333-348.
Purewal. 2011. Timeline: cellphone games from Snake to Angry Birds.
https://www.pcworld.com/article/220374/Cellphone_Games_Through_the_Years.html#s
lide7 Date of access: 15 May. 2018.
Ranger, S. 2015. iOS versus Android. Apple App Store versus Google Play: here
comes the next battle in the app wars. http://www.zdnet.com/article/ios-versus-android-
apple-app-store-versus-google-play-here-comes-the-next-battle-in-the-app-wars/ Date
of access: 20 Sept. 2017.
178
Reuters. 2017. Angry Birds maker Rovio's sales jump on movie boost. http://www.cetus
news.com/tech/Angry-Birds-maker-Rovio-s-sales-jump-on-movie-boost.BJgm33WeO-
.html Date of access: 31 Oct. 2017.
Reuters. 2018. Augmented Reality (AR) gaming market 2017-2023: industry analysis
by drivers, restraints, opportunities, trends, and forecasts to 2023. https://www.reuters.
com/brandfeatures/venture-capital/article?id=12766 Date of access: 16 Aug. 2018.
Riley, F., Pina, J.M. & Bravo, R. 2015. The role of perceived value in vertical brand
extensions of luxury and premium brands. Journal of Marketing Management, 31:881-
913.
Riolfi, M. 2016. Clash of Clans and the death of companies that fail to build products
people love. https://medium.com/@mriolfi/can-clash-of-clans-build-a-global-brand-that-
transcends-gaming-35e7126b50a4/ Date of access: 1 Nov. 2017.
Ritchie, R. 2017. 10 years ago today, Apple and iPhone changed our world.
https://www.imore.com/history-iphone-original Date of access: 7 August 2017
Rosas, R., Nussbaum, M., Cumsille, P., Marianov, V., Correa, M., Flores, P., Grau, V.,
Lagos, F., López, X., López, V. & Rodriguez, P. 2003. Beyond Nintendo: design and
assessment of educational video games for first and second grade students.
Computers & Education, 40(1):71-94.
Rovio. 2013. Rovio's Angry Birds feature film nests at Sony Pictures Entertainment.
https://www.prnewswire.com/news-releases/rovios-angry-birds-feature-film-nests-at-
sony-pictures-entertainment-207569121.html Date of access: 1 Oct. 2017.
Russel, J. 2016. Pokémon Go finally goes live in Japan with McDonald’s the first
sponsored location. http://www.techcrunch.com/2016/07/21 Date of Access: 28 Jul.
2016.
Russel, K. 2012. How did Pokémon become one of the most successful video
game/media franchises in the world. http://www.quora.com/How-did-Pokémon-become-
one-of-the-most-successful-video-game-media-franchises-in-the-world Date of access:
11 Oct. 2016.

179
Sarstedt, M. & Mooi, E. 2014. A concise guide to market research: the process, data,
and method using IBM SPSS statistics. 2nd ed. Heidelberg, Berlin: Springer.
Schifmann, L. & Kanuk, L. 2014. Consumer Behaviour: Global and South African
Perspectives. Parow, Cape Town: Pearson Education.
Schoger, C. 2014. How the most successful apps monetize globally.
http://www.lateledipenelope.it/public/54c9162c2ddfc.pdf Date of access: 25 Jul. 2016.
Schreier, J. 2011. PSP 2, PSP, PSP Go, NGP: a history of Sony's PlayStation
portables. http://www.g4tv.com/thefeed/blog/post/710043/psp-2-psp-psp-go-ngp-a-
history-of-sonys-playstation-portables/ Date of access: 25 Oct. 2016.
Seker, H. 2013. In/out-of-school learning environment and SEM analyses on attitude
towards school. (In Khine, M.S., ed. Application of structural equation modelling in
educational research and practice. Rotterdam: Sense Publishers. p. 135-168).
Seufert, EB. 2014. Cross-promotion in Candy Crush Soda Saga. https://mobiledev
memo.com/candy-crush-soda-saga-cross-promotion/ Date of access: 31 Oct. 2017.
Severi, E. & Ling, K.C. 2013. The mediating effects of brand association, brand loyalty,
brand image and perceived quality on brand equity. Asian Social Science, 9(3):125.
Seward, Z.M. 2013. The first mobile phone call was made 40 years ago today.
https://www.theatlantic.com/technology/archive/2013/04/the-first-mobile-phone-call-was-
made-40-years-ago-today/274611/ Date of access: 31 Jul. 2017.
Sharp, K.L. & Bevan-Dye, A.L. 2014. African Generation Y students’ mobile
advertising usage. Mediterranean Journal of Social Sciences, 5(21):85-92.
Shim, S.I., Forsythe, S. & Kwon, W.S. 2015. Impact of online flow on brand experience
and loyalty. Journal of Electronic Commerce Research, 16(1):56.
Shinn, G. 2004. Case study: first generation Pokèmon games for the Nintendo Game
Boy. http://www.stanford.edu Date of access: 16 Jul. 2016.
180
Shukla, P. 2010. Essentials of marketing research. http://bookboon.com/en/business-
ebooks/marketing-ebooks/essentials-of-marketing-research-part-i Date of access: 18
Apr. 2016.
Silva, A.D.S. &Hjorth, L. 2009. Playful urban spaces a historical approach to mobile
games. Simulation & Gaming, 40(5):602-625.
Sims, G. 2015. Google Play Store vs the Apple App Store: by the numbers.
http://www.androidauthority.com/google-play-store-vs-the-apple-app-store-601836/
Date of access: 20 Sept. 2017.
Sinha, C. 2012. Whats Dopamine got to do with Angry Birds? http://www.chlorophyll
blog.com/branding/whats-dopamine-got-to-do-with-angry-birds/ Date of access: 16
Nov. 2016.
Smith, C. 2016. Pokémon Go is live in Japan with a feature you can’t have yet.
http://www.bgr.com/2016/07/22/pokemon-go-ads-mcdonalds/ Date of access: 28 Jul.
2016.
Smith, S. & Albaum, G. 2010. An introduction to marketing research.
http://www.cloudfront.qualtrics.com/q1/wp-content/uploads/2012/02/IntrotoMarket
Research.pdf Date of access: 25 Apr. 2016.
So, K.K.F., King, C., Sparks, B.A. & Wang, Y. 2013. The influence of customer brand
identification on hotel brand evaluation and loyalty development. International Journal
of Hospitality Management, 34:31-41.
Soble, J. 2016. Pokémon Go, with a corporate tie-in, debuts in Japan.
http://www.mobile.nytimes.com/2016/07/23/business/international/pokemon-go-japan-
mcdonalds.html?_r=1 Date of access: 29 Jul. 2016.
Soutter, A.R.B. & Hitchens, M., 2016. The relationship between character identification
and flow state within video games. Computers in Human Behavior, 55:1030-1038.
Spry, A., Pappu, R. & Bettina Cornwell, T. 2011. Celebrity endorsement, brand
credibility and brand equity. European Journal of Marketing, 45(6):882-909.
181
Statista. 2016a. Digital market outlook.
http://www.statista.com/outlook/211/112/mobile-games/south-africa Date of access: 26
Jul. 2016.
Statista. 2016b. Mobile gaming app revenue worldwide in 2015, 2016 and 2020 (in
billion U.S. dollars). http://www.statista.com/statistics/511639/global-mobile-game-app-
revenue/ Date of access: 16 Nov. 2016.
Statista. 2017a. Digital market outlook.
http://www.statista.com/outlook/211/112/mobile-games/south-africa Date of access: 31
Aug. 2017.
Statista. 2017b. Mobile games – United States. https://www.statista.com/
outlook/211/109/mobile-games/united-states# Date of access: 7 Nov. 2017.
Statista. 2017c. Worldwide in-app advertising and app store revenues of mobile apps
and games in 2015 and 2020 (in billion U.S. dollars). https://www.statista.com/statistics/
293636/app-store-composition-business-models/ Date of access:18 Nov. 2017.
Statista. 2018a. Digital market outlook. https://www.statista.com/outlook/211/112/
mobile-games/south-africa Date of access: 31 July 2018.
Statista. 2018b. Top grossing iPhone mobile gaming apps in the United States as of
August 2018, ranked by daily revenue (in U.S. dollars). https://www.statista.com/
statistics/263988/top-grossing-mobile-ios-gaming-apps-ranked-by-daily-revenue/ Date
of access: 8 Sept. 2018.
Statistics South Africa. 2017. Mid-year population estimates, 2017.
http://www.statssa.gov.za Date of access: 4 Oct. 2017.
Stolyar, B. 2017. 9 ARKit apps to try on your iPhone or iPad using iOS 11.
https://www.digitaltrends.com/mobile/best-apple-arkit-apps/ Date of access: 21 May
2018.

182
Stuart, K. 2014. Nintendo Game Boy: 25 facts for its 25th anniversary.
https://www.theguardian.com/technology/2014/apr/21/nintendo-game-boy-25-facts-for-
its-25th-anniversary Date of access: 12 Oct. 2016.
Su, Y.S., Chiang, W.L., Lee, C.T.J. & Chang, H.C. 2016. The effect of flow experience
on player loyalty in mobile game application. Computers in Human Behavior, 63:240-
248.
Suckley, M. 2017. Five years on: Supercell on the evolution of Clash of Clans.
http://www.pocketgamer.biz/interview/66328/five-years-on-supercell-evolution-of-clash-
of-clans/ Date of access: 30 Oct. 2017.
Sukhraj, R. 2017. 5 ways to convert loyal freemium & trial users into happy paying
customers. https://www.impactbnd.com/blog/5-ways-to-convert-your-loyal-freemium-
users-into-happy-paying-customers Date of access: 31 Jul. 2018
Sundar, S. 2011. Mobile games: gyroscope & accelerometer. http://www.boston-
technology.com/mobile-games-gyroscope-accelerometer/ Date of access: 23 May
2018.
Synodinos, C. 2014. Antecedents of green purchase behaviour amongst black
Generation Y students. Vanderbijlpark: NWU. (Thesis - PhD).
Takahashi, D. 2014. Tactile Entertainment wants to join Supercell, Rovio, and King as
a Nordic mobile-gaming wonder. http://venturebeat.com/2014/08/14/tactile-
entertainment-wants-to-be-the-next-nordic-mobile-gaming-wonder/ Date of access: 16
Nov. 2016.
Tanasoiu, F. 2017. Mobile success story: how Clash of Clans did it.
https://appsamurai. com/mobile-app-success-story-how-clash-of-clans-did-it/ Date of
access: 30 Oct. 2017.
Taş, Y. 2017. What augmented reality brings to mobile marketing world.
https://appsamurai.com/what-augmented-reality-brings-to-mobile-marketing-world/
Date of access: 6 Nov. 2017.

183
Tassi, P. 2015. From 'Candy Crush' to 'Bubble Witch,' King has never had an original
idea. https://www.forbes.com/sites/insertcoin/2015/11/03/from-candy-crush-to-bubble-
witch-king-has-never-had-an-original-idea/#5c472a65c27f Date of access: 2 Oct. 2018.
Teng, C.I. 2010. Customization, immersion satisfaction, and online gamer loyalty.
Computers in Human Behavior, 26(6):1547-1554.
Teng, C.I., Chen, M.Y., Chen, Y.J. & Li, Y.J. 2012. Loyalty due to others: the
relationships among challenge, interdependence, and online gamer loyalty. Journal of
Computer‐Mediated Communication, 17(4):489-500.
Teng, C.I. 2013. How do challenges increase customer loyalty to online games?
Cyberpsychology, Behavior, and Social Networking, 16(12):884-891.
Teo, T., Tsai, T.T. & Yang, C-C. 2013. Applying structural equation modelling (SEM) in
educational research: an introduction. (In Khine, M.S., ed. Application of structural
equation modelling in educational research and practice. Rotterdam: Sense Publishers.
p. 3-22).
Thomas, L.M. 2015a. 6 mobile games with incredible touch controls.
http://www.ign.com/articles/2015/12/04/6-mobile-games-with-incredible-touch-controls
Date of access: 23 May 2018.
Thomas, L.M. 2015b. 7 of the best buy once and play mobile games.
http://www.ign.com/articles/2015/12/11/the-best-buy-once-and-play-mobile-games Date
of access: 24 Oct. 2016.
Timeslive. 2018. Joburg teen scores on app store: his game picked for game of the
day. https://www.timeslive.co.za/news/sci-tech/2018-06-07-joburg-teen-scores-on-app-
store-his-game-picked-for-game-of-the-day/ Date of access: 10 July 2018.
TMD. 2016. Clash of Clans spends soooo much on marketing! http://tmdwinnipeg.ca/
clash-of-clans-spends-soooo-much-on-marketing/ Date of access: 1 Nov. 2017.

184
Toor, M. 2014. The Nokia N-Gage: What happened to the handheld console?
http://www.phonecruncher.com/features/00944/the-nokia-n-gage-what-happened-to-
the-handheld-console/ Date of access: 18 June 2018.
Torres, M.A. 2014. App monetization statistics: freemium vs premium vs paymium.
http://thinkapps.com/blog/post-launch/paid-vs-freemium-app-monetization-statistics/
Date of access: 16 Oct. 2016.
Truong, Y. & Simmons, G. 2010. Perceived intrusiveness in digital advertising:
strategic marketing implications. Journal of Strategic Marketing, 18(3):239-256.
Universities South Africa. 2018. http://www.universitiessa.ac.za/public-universities-
south-africa. Date of access: 30 Jul. 2018.
Usmani, B. 2016. The game industry of South Africa.
https://www.polygon.com/features/2016/2/3/10781618/the-game-industry-of-south-africa
Date of access: 16 Nov. 2017.
Van der Velde, N. 2018. Voice controlled games: the rise of speech technology in
gaming. https://www.globalme.net/blog/voice-controlled-games Date of access: 16
May. 2018.
Van Looy, J., Courtois, C., De Vocht, M. & De Marez, L. 2012. Player identification in
online games: validation of a scale for measuring identification in MMOGs. Media
Psychology, 15(2):197-221.
Van Rooij, A.J., Schoenmakers, T.M., Vermulst, A.A., Van Den Eijnden, R.J. & Van De
Mheen, D. 2011. Online video game addiction: identification of addicted adolescent
gamers. Addiction, 106(1):205-212.
Vas, G. 2013. The best looking beat 'em up games from the 16-Bit era.
http://kotaku.com/5990092/the-best-looking-beat-em-up-games-from-the-16-bit-era
Date of access: 27 Jul. 2017.
Venkatesh, V., Thong, J. & Xu, X. 2012. Technology acceptance model and the unified
theory of acceptance and use of technology. MIS Quarterly, 36(1):157-178.
185
Vermeulen, J. 2011. iTunes online store remains limited in SA.
https://mybroadband.co. za/news/internet/28542-itunes-online-store-remains-limited-in-
sa.html Date of access: 16 Nov. 2017.
Vermeulen, J. 2012. App store games in SA soon. https://mybroadband.co.za/news/
software/62664-app-store-games-in-sa-soon.html Date of access: 16 Nov. 2017.
Vermeulen, J. 2013a. iOS games now in SA. https://mybroadband.co.za/news/
internet/89157-ios-games-now-in-south-africa.html Date of access: 16 Nov. 2017.
Vermeulen, J. 2013b. App store games for SA progress. https://mybroadband.co.za/
news/software/76958-app-store-games-for-sa-progress.html Date of access: 16 Nov.
2017.
Verto Analytics. 2015. Which Mobile Games Generate the Most Loyalty?
http://www.vertoanalytics.com/which-mobile-games-generate-the-most-loyalty/ Date of
access: 17 Nov. 2016.
Villapaz, L. 2014. Nintendo Game Boy: 25th anniversary of the handheld console that
shaped a generation of gamers. https://www.ibtimes.com/nintendo-game-boy-25th-
anniversary-history-handheld-console-shaped-generation-gamers-1574211%3famp=1
Date of access: 26 Jul. 2017.
Vince. 2018. The many different types of video games & their subgenres.
https://www.idtech.com/blog/different-types-of-video-game-genres/ Date of access: 16
May 2018
Vise, S. 2017. Pokémon Go & the surprising business potential of augmented reality.
https://www.mondo.com/augmented-reality-business-potential/ Date of access: 16 Nov.
2017.
Vizard, S. 2016. McDonald’s on Pokémon Go: “we are enjoying what it is doing for our
business”. http://www.marketingweek.com Date of access: 28 Jul. 2016.

186
Wagner, T.M., Benlian, A. & Hess, T. 2014. Converting freemium customers from free
to premium: the role of the perceived premium fit in the case of music as a service.
Electronic Markets, 24(4):259-268.
Waldron, V. 2014. The rise of mobile games: factors contributing to their success.
http://www.lib.umich.edu/blogs/eaten-grue/rise-mobile-games-factors-contributing-their-
success Date of access: 25 Oct. 2016.
Walton, M. &Pallitt, N. 2012. Grand theft South Africa: games, literacy and inequality in
consumer childhoods. Language and Education, 26(4):347-361.
Waracle. 2016. Why Pokémon Go is a game changer for marketers.
https://waracle.net/pokemon-go-game-changer-marketers/ Date of access: 16 Nov.
2017.
Wijaya, B.S. 2013. Dimensions of brand image: A conceptual review from the
perspective of brand communication. European Journal of Business and Management,
5(31):55-65.
Williams, D. 2002. Structure and competition in the US home video game industry.
International Journal on Media Management, 4(1):41-54.
Wilson, T.V. 2006. How GPS phones work. https://electronics.howstuffworks.com/gps-
phone3.htm Date of access:21 May 2018
Witt, E.A., Massman, A.J. & Jackson, L.A. 2011. Trends in youth’s videogame playing,
overall computer use, and communication technology use: the impact of self-esteem
and the Big Five personality factors. Computers in Human Behaviour, 27(2):763-769.
Wolpin, S. 2014. The first cellphone went on sale 30 years ago for $4,000.
http://www.mashable.com/2014/03/13/first-cellphone-on-sale/#ZqPVkpbFMsq5 Date of
access: 31 Jul. 2017.
Wong, K. 2015. Why the Nintendo Game Boy was so successful.
http://www.denofgeek. com/us/games/nintendo/247991/why-the-nintendo-game-boy-
was-so-successful Date of access: 24 Jul. 2016.

187
Worldometers. 2017. World population clock. http://www.worldometers.info/world-
population/ Date of access: 7 Nov. 2017.
Wright, C. 2016. A brief history of mobile games. http://pocketgamer.biz Date of
access: 25 Jul. 2016.
Wu, Y.L. & Chien, W.J. 2015. The effect of mobile gamification on brand loyalty. (In
Proceedings of the twenty-first Americas conference on Information Systems. Puerto
Rico. p. 1-14).
Yang, Z. & Peterson, R.T. 2004. Customer perceived value, satisfaction, and loyalty:
the role of switching costs. Psychology & Marketing, 21(10):799-822.
Yang, K. & Jolly, L.D. 2008. Age cohort analysis in adoption of mobile data services:
gen Xers versus baby boomers. Journal of Consumer Marketing, 25(5):272-280.
Yang, K.F., Yang, H.W., Chang, W.Y. & Chien, H.K. 2017. The effect of service quality
among customer satisfaction, brand loyalty and brand image. Industrial Engineering
and Engineering Management, 2286-2290.
Yeh, C.H., Wang, Y.S. & Yieh, K. 2016. Predicting smartphone brand loyalty:
consumer value and consumer-brand identification perspectives. International Journal
of Information Management, 36(3):245-257.
Yeoman, M. 2016. Clash of Clans users are their marketing stars. http://hotinsocial
media.com/clash-of-clans-users-are-their-marketing-stars/ Date of access: 1 Nov. 2017
Zaman, M., Anandarajan, M. & Dai, Q. 2010. Experiencing flow with instant messaging
and its facilitating role on creative behaviors. Computers in Human Behavior,
26(5):1009-1018.
Zanger, D. 2018. Deadpool deadpan reigns as Ryan Reynolds snarks it up for Toon
Blast. https://www.adweek.com/creativity/deadpool-deadpan-reigns-as-ryan-reynolds-
snarks-it-up-for-toon-blast/ Date of access: 10 Oct. 2018.
Zhang, T., Lu, C. & Kizildag, M. 2017. Engaging Generation Y to co-create through
mobile technology. International Journal of Electronic Commerce, 21(4):489-516.

188
Zhou, T. & Lu, Y. 2011. Examining mobile instant messaging user loyalty from the
perspectives of network externalities and flow experience. Computers in Human
Behaviour, 27(2):883-889.
Zhou, T. 2012. Examining mobile banking user adoption from the perspectives of trust
and flow experience. Information Technology and Management, 13(1):27-37.
Zhou, T. 2013. The effect of flow experience on user adoption of mobile TV. Behavior
& Information Technology, 32(3):263-272.
Zibreg, C. 2012. Angry Birds clocks 648M downloads in 2011, has 200M active
monthly users. http://www.idownloadblog.com/2012/05/07/rovio-2011-revenue/ Date of
access: 9 July 2018.
Zikmund, W.G. & Babin, B.J. 2010. Essentials of marketing research. 4th ed. South-
Western, Cengage Learning.
Zyda, M.J., Thukral, D., Ferrans, J.C., Engelsma, J. & Hans, M. 2008. Enabling a voice
modality in mobile games through voicexml. (In Proceedings of the 2008 ACM
SIGGRAPH symposium on Video games. ACM. p. 143-147).

189
ANNEXURE A
QUESTIONNAIRE

190
Modelling the antecedents of mobile gaming brand loyalty amongst Generation Y students
Dear Student
My name is Dylan Price. I am registered as a full-time student for a PhD in Marketing Management at the North-West University (Vaal Triangle Campus) and I am currently working towards my thesis under the supervision of Dr C. Synodinos and Prof A.L. Bevan-Dye. The purpose of this study is to determine what influences mobile gaming brand loyalty amongst Generation Y students. Generation Y refers to any individual born between 1986 and 2005.
A mobile game is a video game that can be played on a smartphone or tablet device. Mobile gaming has become highly profitable in the South African market with consumer expenditure estimated at over R500 million. The companies of the wildly popular mobile games such as Angry Birds, Candy Crush Saga, Clash of Clans, Mobile Strike and Pokémon Go are able to make millions worldwide through their ability to attract and retain a loyal following of video game players. In turn, loyal video gamers make repeated in-app purchases, buy branded merchandise and promote their favourite mobile game to their friends and family members. As such, the abovementioned mobile games have become thriving brands and loyal video game players are crucial to their success.
Interesting fact: Candy Crush Saga generates about $400 000 (R5.5 million) per day from merchandise sales, advertising income and in-app purchases.
Please take a few minutes to assist me and complete the attached questionnaire. It should not take you longer than 10 minutes to complete. All responses are confidential and will merely be outlined in the form of statistical data in the analysis. All data will only be used for research purposes. The questionnaire has gone through the North West Universities ethical committee and passed ethical clearance. The ethical clearance number is: ECONIT 2017-003.
Thank you for your important contribution to this study.
Dylan Price
North-West University
______________________________________________________________________________

191
Questionnaire
Section A: Demographical information
Please mark each question with a cross (X) in the appropriate box.
A1 Name of institution
Traditional University
University of Technology
Comprehensive University
A2 Year 1st year 2nd year 3rd year Post-graduate
A3 Gender Female Male
A4 Race African Coloured Indian/Asian White
A5 Home province Eastern Cape Free state Gauteng KwaZulu-Natal Limpopo
Mpumalanga North West
Northern Cape
Western Cape Other
A6 Please indicate your mother tongue language:
Afrikaans English IsiNdebele IsiXhosa IsiZulu Sesotho sa
Leboa
Sesotho Setswana SiSwati Tshivenda Xitsonga Other
A7 Please indicate your current age:
Younger than 18
18 years old
19 years old
20 years old
21 years old
22 years old
23 years old
24 years old
Older than 24
A8 How often do you play mobile games?
Everyday 3-4 times a
week Twice a
week Once a week
Not often Never

192
Section B: Antecedents of mobile gaming brand loyalty
Please indicate the extent to which you agree or disagree with each of the following statements using a cross (X) where 1= Strongly disagree and 6= Strongly agree.
Antecedents of mobile gaming brand loyalty
Str
on
gly
dis
ag
ree
Dis
ag
ree
Slig
htl
y
dis
ag
ree
Slig
htl
y
ag
ree
Ag
ree
Str
on
gly
ag
ree
B1 I like the game content (environment, characters and story) of my favourite mobile game
1 2 3 4 5 6
B2 I am pleased with the level of service received from the creators of my favourite mobile game (news feeds, forums, updates, daily challenges and rewards).
1 2 3 4 5 6
B3 I am pleased with the rewards I receive when I progress in my favourite mobile game.
1 2 3 4 5 6
B4 I am satisfied with the ability to link my social media accounts with my favourite mobile game.
1 2 3 4 5 6
B5 Overall, I am satisfied with my favourite mobile game. 1 2 3 4 5 6
B6 The gameplay of my favourite mobile game challenges me to the best of my ability.
1 2 3 4 5 6
B7 The gameplay of my favourite mobile game provides a good test of my skills.
1 2 3 4 5 6
B8 The gameplay of my favourite mobile stretches my capabilities to the limit.
1 2 3 4 5 6
B9 The gameplay of my favourite mobile game challenges me more than other things I do on my mobile phone.
1 2 3 4 5 6
B10 My favourite mobile game means a lot to me. 1 2 3 4 5 6
B11 My favourite mobile game is not just a normal, average video game.
1 2 3 4 5 6
B12 Playing my favourite mobile game is more than just a hobby for me.
1 2 3 4 5 6
B13 Playing my favourite mobile game has become a way of life (A part of my daily routine).
1 2 3 4 5 6
B14 I feel I have become personally attached to my favourite mobile game (A part of who I am).
1 2 3 4 5 6
B15 I am very interested in playing my favourite mobile game. 1 2 3 4 5 6
B16 My favourite mobile game is fun to play. 1 2 3 4 5 6
B17 I do not think of other things while playing my favourite mobile game.
1 2 3 4 5 6
B18
After completing a stage/level, I become curious to see the next stage/level that my favourite mobile game has to offer.
1 2 3 4 5 6
B19 I feel in control when I play my favourite mobile game. 1 2 3 4 5 6

193
Antecedents of mobile gaming brand loyalty
Str
on
gly
dis
ag
ree
Dis
ag
ree
Slig
htl
y
dis
ag
ree
Slig
htl
y
ag
ree
Ag
ree
Str
on
gly
ag
ree
B20 I become entirely absorbed/engrossed when playing my favourite mobile game.
1 2 3 4 5 6
B21 My preference to play my favourite mobile game will not be easily changed.
1 2 3 4 5 6
B22 It will be difficult to change my beliefs about my favourite mobile game.
1 2 3 4 5 6
B23 Even if close friends recommend another mobile game, I would not stop playing my favourite mobile game.
1 2 3 4 5 6
B24 To stop playing my favourite mobile game in favour of another mobile game would require major rethinking.
1 2 3 4 5 6
B25
I would follow the latest news and updates about my favourite mobile game in the media (TV, magazines, newspapers, online news websites etc.).
1 2 3 4 5 6
B26
I would follow the latest news and updates about my favourite mobile game on social media platforms (Facebook, Twitter, Instagram etc.).
1 2 3 4 5 6
B27
I would make in-app purchases while playing my favourite mobile game (to unlock new items and speed up the game’s progression).
1 2 3 4 5 6
B28
I would wear or use merchandise related to my favourite mobile game (shirts, watches, phone covers, headphones etc.)
1 2 3 4 5 6
B29 I would participate in discussions about my favourite mobile game (on blogs, online forums or with friends).
1 2 3 4 5 6
Thank you for your cooperation
Ethical Clearance Number: ECONIT 2017-003

194
ANNEXURE B
STRUCTURAL MODELS

195
STRUCTURAL MODEL A

196
STRUCTURAL MODEL B

197
STRUCTURAL MODEL C