User Manual - NWU-IR Home
94
i Embedding an activity-driven operational accounting framework in a fertiliser company Marne van der Linde Honours B. Comm. 12567353 Mini-dissertation submitted in partial fulfilment of the requirements for the degree Magister Commercii at the North-West University (Potchefstroom Campus) November 2011 Supervisor: Prof. P.W. Buys
-
Upload
khangminh22 -
Category
Documents
-
view
0 -
download
0
Transcript of User Manual - NWU-IR Home
i
Embedding an activity-driven operational
accounting framework in a fertiliser
company
Marne van der Linde
Honours B. Comm.
12567353
Mini-dissertation submitted in
partial fulfilment of the requirements for the degree
Magister Commercii at the North-West University (Potchefstroom
Campus)
November 2011
Supervisor: Prof. P.W. Buys

Certificate from Language editor
2
ACKNOWLEDGEMENTS
First and foremost I wish to thank my supervisor, Prof. P.W. Buys of the North-West
University, for his support, guidance and patience throughout the completion of this mini-
dissertation. Thank you to the staff at Ferdinand Postma Library for the literature and
searches, to the linguists for the editing and all the respondents for completing the survey. I
wish to thank my colleagues at ACME Fertilizer for all your willingness to assist in so many
ways.
My deepest gratitude goes to my dearest parents for all the love, support and
encouragement, not only through this study, but always. To Jacques, thank you for all your
love and patience.
Last, but not least, I want to thank my dear God for the wisdom and perseverance that He
has bestowed upon me.
3
SUMMARY
Activity-based Costing is a management tool which both covers the shortcomings of
traditional costing methods and provides better cost information. There is a lot of competition
in the economic environment where only the “fittest will survive”. The overall picture of ABC
will bring operational processes to financial figures more visibly and accurately. Operational
processes have changed dramatically over the past centuries, therefore we need to change
our old way of doing things. Processes get more automated, thus there are higher
percentages of variable and indirect costs.
When costs are visible, ACME Fertilizer can compete with confidence because they will
know when a transaction is not financially beneficial any more. The actual cost of the final
product or output is of critical importance. Activities which are not adding value to the
process must be identified and eliminated or else costs will be inflated unnecessarily.
Competitors will get a higher market share and sales because they might be able to enter
the market at a lower price. The end user is extremely price-sensitive, and will accept the
lower monetary value offer if the quality is equivalent.
It is of critical importance that companies understand and be aware of the true costs of their
products. ABC has the ability to assist companies to strive for cost-competitive excellence.
In this mini-dissertation, a comparison between ABC and the traditional costing method in a
fertilizer company attempts to investigate the distortion of cost. The same scenario is used
for the two different costing methodologies: ABC versus the traditional method. The results
are discussed and a conclusion with recommendations is made. By analysing the results,
the non-value adding processes can be eliminated and management can shift their focus to
the relevant activities. This will assist ACME Fertilizer’s management towards better
decision-making and better competitiveness.
ACME manufactures and blends different mixes of fertilizer. The manufacturing of a product
consists of various processes and activities from where the raw material enters the factory
premises to the manufacturing, bagging and distribution of the final product. The cost of the
raw material can be affected by fluctuating commodity prices, exchange rates and other
unforeseen circumstances, for example the recent instances of Somali Piracy and so forth.
Overheads and indirect costs get allocated based on the activities required to manufacture
the final product. Products will not absorb costs which do not have a direct impact on the
manufacturing of the final product or intermediates. The first step of the implementation of an
ABC system is to identify the output or the product of which costing needs to be done. The
4
process and activities must be identified as well as the costs applicable to these activities.
Costs then get allocated to the cost pools based on the activity driver per cost pool. The final
cost can be calculated and assigned, per cost driver, to the final product or output.
The main objective of this study was to determine the feasibility of implementing an ABC
system within ACME Fertilizer. The results proved that with the traditional costing method, all
the costs are not visible and may be distorted. Thus, the cost of a product will be
understated - in other words all the actual costs occurred were higher than the budgeted
costs and will not be recovered through the cost of sales. Instead it will take a bite out of the
annual profit! On the other hand, should the cost of a final product be overstated, more costs
are to be recovered and this becomes a snowball effect. Companies have to either
contribute its margin to remain competitive or increase the price of the product and the risk
of lost sales and market share increases.
ABC is a useful tool to use to control and have visibility of the costs, improved decision-
making abilities and the possibility of closely shaven profits to ensure that the necessary
volumes get manufactured. The right product, at the right quantity, at the right price!
5
OPSOMMING
Aktiwiteitsgebaseerde Kosteberekening (ABC) is 'n bestuursmetode gemik daarop om die
tekortkominge van tradisionele kostemetodes aan te spreek. Die mark is baie kompeterend
en maatskappye moet altyd daardie een stap voor hul kompetisie wees. ABC sal die
operasionele prosesse koppel aan finansiële syfers, en dus sal die kostes van finale
produkte meer sigbaar en akkuraat wees. Operasionele prosesse het dramaties verander in
die afgelope jare, daarom moet die ou manier van dinge doen ook verander om aan te pas
by die nuwe era. Prosesse word geoutomatiseer en minder hande-arbeid is nodig - dus is
veranderlike en indirekte kostes hoër.
Wanneer kostes duidelik uiteengesit is, kan ACME Kunsmis met vertroue meeding, want
hulle sal weet wanneer 'n transaksie nie finansieel voordelig is nie. Die werklike koste van
die finale produk is van kardinale belang. Aktiwiteite wat nie waarde toevoeg tot die proses
nie, moet geïdentifiseer en geëlimineer word sodat hulpbronkostes nie onnodig aangegaan
sal word nie. Die eindgebruiker is baie prys-sensitief, en sal die laagste prys verkies indien
die kwaliteit dieselfde is. Mededingers sal neig na meer verkope en 'n hoër markaandeel
omdat hulle in staat is om die mark teen ‘n laer prys te betree.
Dit is van kritieke belang dat maatskappye die kostes in detail moet verstaan en weet
hoekom elke koste aangegaan is. ABC help die maatskappy om te streef na optimale
kostemededinging en –besluitneming.
In hierdie skripsie word 'n vergelyking tussen ABC en die tradisionele kosteberekenings-
metode gedoen om te bewys dat die kostetoedeling met die tradisionele
kosteberekeningsmetode nie akkuraat is nie. Dieselfde scenario word gebruik, maar deur
middel van die twee verskillende kosteberekeningsmetodologieë; ABC teenoor die
tradisionele metode. Die resultate word bespreek word en 'n slot met aanbevelings word
gemaak. Deur die analise van die resultate kan die aktiwiteite wat nie waarde toevoeg nie,
geëlimineer word en bestuur kan fokus op probleemareas. Dit sal ACME Kunsmis se
bestuur help met beter besluitneming en meer kompeterende mededinging.
ACME vervaardig en meng verskillende kunsmismengsels. Die vervaardiging van 'n produk
bestaan uit verskillende prosesse en aktiwiteite. Die koste van die roumateriaal kan
beïnvloed word deur wisselende kommoditeitspryse, wisselkoerse en ander onvoorsiene
omstandighede. Bokoste en indirekte koste word geallokeer gebaseer op die aktiwiteite wat
nodig is om die finale produk te vervaardig. Produkte sal nie kostes absorbeer wat glad nie
'n impak het op die vervaardiging van die finale produk nie. Die eerste stap van die
6
implementering van 'n ABC-stelsel is om die finale produk te identifiseer, en dan die
prosesse. Koste word dan geallokeer na die aktiwiteit, en dan geallokeer na kostepoele
gebaseer op die aktiwiteitsgebruik per kostepoel. Die finale koste van ‘n produk kan nou
akkuraat geallokeer word deur kostedrywers.
Die belangrikste doel van hierdie studie is om die lewensvatbaarheid van 'n ABC stelsel in
ACME kunsmis te bepaal. Die resultate is ’n duidelike bewys dat alle kostes nie altyd in
berekening gebring word nie, en dat die syfers nie akkuraat is nie. Dit kan lei tot ‘n
onderverhaling van kostes, m.a.w die begrote koste van ‘n produk is minder as sy werklike
koste. Dit beteken minder wins! Aan die ander kant, indien die kostes oorverhaal word, sal
die maatskappy die prys van produkte moet verhoog, en dit kan lei tot ‘n verlaging in
markaandeel.
ABC is ‘n handige stelsel wat ‘n mens in staat stel om beheer en sigbaarheid oor die kostes
te kan hê om beter besluite te neem, te weet wanneer winste minimaal is en ook wat die
optimale produksiehoeveelhede is.
7
TABLE OF CONTENTS
ACKNOWLEDGEMENTS ......................................................................................................... 2
SUMMARY ........................................................................................................................... 3
OPSOMMING ....................................................................................................................... 5
TABLE OF CONTENTS ........................................................................................................... 7
LIST OF FIGURES ............................................................................................................... 11
LIST OF TABLES ................................................................................................................ 12
CHAPTER 1: INTRODUCTION .............................................................................................. 14
1.1. Background ....................................................................................................... 14
1.2. Field of research ................................................................................................ 15
1.3. Problem statement and hypothesis .................................................................... 17
1.4. Research objectives .......................................................................................... 18
1.5. Method of investigation and research ................................................................ 19
1.5.1. Research methodology .................................................................................. 19
1.5.2. Research studies and design ......................................................................... 20
1.5.3. Research method .......................................................................................... 20
1.5.4. Literature study .............................................................................................. 21
1.5.5. Empirical study .............................................................................................. 21
1.6. Terminology ...................................................................................................... 22
1.7. Chapter overview .............................................................................................. 24
CHAPTER 2: PRINCIPLES OF ACTIVITY-BASED COSTING ...................................................... 26
2.1. Introduction ....................................................................................................... 26
8
2.2. Activity-based Costing ....................................................................................... 27
2.2.1. Background ................................................................................................... 27
2.2.2. Key components of Activity-based Costing .................................................... 27
2.2.3. Fundamentals of Activity-based Costing ........................................................ 28
2.2.4. Advantages .................................................................................................... 29
2.2.5. Disadvantages ............................................................................................... 30
2.3. The implementation of Activity-based Costing ................................................... 32
2.3.1. Introduction .................................................................................................... 32
2.3.2. Conditions prior to implementation ................................................................. 33
2.2.3. Steps for implementation ............................................................................... 36
2.3. Case studies – Activity-based Costing implementation ...................................... 37
2.4. Other Activity-based Costing methodologies ..................................................... 39
2.4.1. Traditional costing methods vs. Activity-based Costing .................................. 39
2.5.2. Activity-based Costing and accounting systems ............................................. 40
2.5.3. Activity-based Management ........................................................................... 41
2.5.4. Time-driven Activity-based Costing defined ................................................... 42
2.6.1. Time-driven Activity-based Costing vs. conventional Activity-based Costing .. 43
2.6.2. Advantages of Time-driven Activity-based Costing ........................................ 44
2.6.3. Disadvantages of Time-driven Activity-based Costing .................................... 45
2.6.4. Implementation of Time-driven Activity-based Costing ................................... 45
2.6.5. Influence of Time-driven Activity-based Costing ............................................. 46
2.7. Summary ........................................................................................................... 46
9
CHAPTER 3: ACME BUSINESS OPERATION -FERTILIZER BUSINESS OVERVIEW ..... 48
3.1. Introduction ....................................................................................................... 48
3.2. Porter’s Value Chain ......................................................................................... 48
3.2.1. Inbound logistics ............................................................................................ 49
3.2.2. Operations ..................................................................................................... 50
3.2.3. Outbound logistics ......................................................................................... 53
3.2.4. Marketing and sales ....................................................................................... 54
3.2.5. Service........................................................................................................... 55
3.2.6. Secondary/support activities of the value chain .............................................. 55
3.2.7. Inter-company transfer orders ........................................................................ 56
3.3. Current costing model ....................................................................................... 56
3.4. Methodologies of rival similar companies .......................................................... 57
3.5. Pilot study .......................................................................................................... 58
3.5.1. General .......................................................................................................... 58
3.5.2. Manufacturing ................................................................................................ 59
3.5.3. Accounting system ......................................................................................... 59
3.6. Factors which can influence costs of different products ..................................... 59
3.7. Summary ........................................................................................................... 60
CHAPTER 4: EMPIRICAL CASE STUDY BASED ON ACTIVITY-BASED COSTING VS. THE CURRENT
STANDARD COSTING METHOD ............................................................................................ 62
4.1. Introduction ....................................................................................................... 62
4.2. Empirical case study ......................................................................................... 62
10
4.2.1. Product demand ............................................................................................ 62
4.2.2. Raw materials ................................................................................................ 63
4.2.3. Bill of materials .............................................................................................. 63
4.2.4. Raw material cost estimation ......................................................................... 65
4.2.5. Labour costs .................................................................................................. 65
4.2.6. Overheads (factory) ....................................................................................... 67
4.2.7. Total cost per product .................................................................................... 72
4.3. Current situation ................................................................................................ 73
4.4. Summary ........................................................................................................... 77
CHAPTER 5: FINDINGS AND RECOMMENDATIONS ................................................................. 80
5.1. Introduction ....................................................................................................... 80
5.2. Research objectives - results ............................................................................. 80
5.3. Research synopsis ............................................................................................ 82
5.4. Recommendation .............................................................................................. 84
5.5. Limitations of this study ..................................................................................... 85
5.6. Recommendations for further research ............................................................. 85
APPENDIX: PILOT STUDY QUESTIONNAIRE .......................................................................... 86
BIBLIOGRAPHY ................................................................................................................. 89
11
LIST OF FIGURES
Figure 1.1: Building blocks of product cost – ACME conventional costing method .............. 16
Figure 2.1: Costing basic structure of an Activity-based Costing system ............................. 28
Figure 2.2: Costing basic structure of an Activity-based Costing system ............................. 28
Figure 2.3: Activity-based Costing’s primary use ................................................................. 38
Figure 2.4: Activity-based Costing is more process-driven and in line with the cost structure
........................................................................................................................................... 39
Figure 2.5: Traditional costing systems’ more vertical cost structure ................................... 40
Figure 2.6: Time-driven Activity-based Costing parameters ................................................ 42
Figure 3.1: Porter’s Value Chain ......................................................................................... 49
Figure 3.2: Raw material ordering process .......................................................................... 50
Figure 3.3: Production process ........................................................................................... 52
Figure 3.4: Raw material handling process – dry products .................................................. 53
Figure 3.5: Raw material handling process – gas ................................................................ 54
Figure 3.6: Sales order process .......................................................................................... 55
Figure 3.7: Inter-company transfer process ......................................................................... 56
Figure 3.8: Structure of the current costing of a manufactured product ............................... 56
Figure 3.9: Average raw material costs ............................................................................... 60
Figure 4.1: Activity-based Costing vs. traditional costing ..................................................... 74
12
LIST OF TABLES
Table 3.1: Costing methods of competitors ......................................................................... 58
Table 4.1: Demand for fertilizer for FY2010 ......................................................................... 63
Table 4.2: Costed bill of materials of products – 1, 2, 3, 4, 5 & 6. ........................................ 53
Table 4.3: Total production hours ........................................................................................ 66
Table 4.4: Labour cost per ton ............................................................................................ 66
Table 4.5: Suggestion for ACME Fertilizer’s possible activity dictionary .............................. 67
Table 4.6: Allocation of overheads to activities .................................................................... 67
Table 4.7: Activity utilization per product (units) .................................................................. 68
Table 4.8: Rate per activity.................................................................................................. 69
Table 4.9.1: Cost per activity, per product 1 ........................................................................ 69
Table 4.9.2: Cost per activity, per product 2 ........................................................................ 70
Table 4.9.3: Cost per activity, per product 3 ........................................................................ 70
Table 4.9.4: Cost per activity, per product 4 ........................................................................ 71
Table 4.9.5: Cost per activity, per product 5 ........................................................................ 71
Table 4.9.6: Cost per activity, per product 6 ........................................................................ 72
Table 4.10: Cost per activity summary ................................................................................ 72
Table 4.11: Cost of sales per product (Activity-based Costing method) ............................... 73
Table 4.12.1: Cost of sales differences - product 1 ............................................................. 74
Table 4.12.2: Cost of Sales differences – product 2 ............................................................ 75
Table 4.12.3: Cost of Sales differences – product 3 ............................................................ 76
Table 4.12.4: Cost of sales differences – product 4 ............................................................. 76
13
Table 4.12.5: Cost of sales differences – product 5 ............................................................. 77
Table 4.12.6: Cost of sales differences – product 6 ............................................................. 77
Table 4.13: Cost of sales differences – operating margin loss ............................................. 78

14
CHAPTER 1: INTRODUCTION
1.1. BACKGROUND
Companies in today’s global economy are under pressure to optimize and reduce costs,
determine product costs more accurately and improve overall customer profitability (Fei &
Isa, 2010). Companies that achieved success in the past are now doing everything they can
to maintain their growth and sustainability by adopting new management tools and
techniques to be able to deliver products or services faster, better and cheaper without
compromising quality (Chen & Jones, 2007). A high-demand product can potentially show
good profits and provide a low cost of sale. However, if the product’s cost of sales is
overstated, the product won’t be as profitable as it can be (Wang, Goa & Lin, 2010).
Management focus should therefore shift to business processes and value chains of
products that are more advantageous to manufacture and those that do not add value
should be eliminated (Fei & Isa, 2010; Walters & Lancaster, 2000). This principle creates the
need for a system which can focus on the value chain and business performance, which will
lead to better cost control as well as an understanding of which activities and mechanisms
drive the cost of manufacturing the product (Furniss & Spencer, 2005; Fei & Isa, 2010;
Poggenpoel, 2004).
A managerial/operational accounting system should generate solid support, factual
information, allocate costs to the right product and provide accurate reports to assist
managers to make better decisions, thus providing relevant information for planning, control
and performance management purposes (Garrison, Noreen & Brewer, 2011; Cokins,
2001a). Decision-making relies on incremental analysis (cost behaviour analysis) which
analyses revenues and costs that increase (or decrease) if a decision is made (Drury, 2008;
Jiambalvo, 2004).
In order to succeed, companies need to focus more on making their products and customers
more profitable and to eliminate those products that are not adding value. One of the major
challenges that most manufacturing organisations face, is the “disconnect” between what
actually happens in the manufacturing environment and the methodology which the finance
department follows when determining the product costs. In many cases, financial data is
based on operational assumptions and often the easiest and most convenient option is
selected to determine the costs of manufacturing products or delivery of services. Thus,
accountants often assume, for simplicity reasons, that all products require equivalent
resource inputs (labour and overheads) to manufacture.
15
Accountants may not always be aware of all the inputs during the manufacturing and
administration processes which will lead to products carrying unnecessary costs (Tardivo &
Di Montezemolo, 2009). It is important to determine the cost of running the factory and costs
associated with each job function or activity within the manufacturing process. When broad
averages are used for the allocation of costs of resources utilized by products in an
unsustainable way, it is called cost smoothing or peanut-butter costing (Horngren, Datar &
Foster, 2003). This will have the result that for some products the labour and overhead cost
factors are overstated, while for others it might be understated (Wang et al., 2010). Costing
of products is not always based on the operational facts, but is done on the financial
information that is available and then allocated based on the bill of materials which will lead
to distorted results. If costs get allocated to a product based on the actual manufacturing
activities, that product will reflect a much more accurate and reliable cost (Vercio &
Shoemaker, 2007).
To increase the accuracy of the information, an activity-driven operational accounting
framework will reduce the chance of allocating unnecessary costs to a particular product and
the true cost of resource consumption can be allocated to the products utilizing the resource
(Chen & Jones, 2007; Horngren et al., 2003; Poggenpoel, 2004). This will bring operational
information into the accounting framework and provide adequate information, necessary to
improve the quality of decisions affecting operational and/or environmental processes
(Bennett, Rikhardson & Schaltegger, 2003; Burrit, Hahn & Schaltegger, 2002; Garrison et
al., 2011; Tardivo & Di Montezemolo, 2009).
This leaves the question of what effect the activity-driven costing methodology will have on
profitability and price of certain products.
1.2. FIELD OF RESEARCH
ACME Fertilizer is a South African-based listed company which grew out of a family
business distributing agricultural limestone (calcium carbonate). Currently its operations
extend into Africa, but the main operation is in South Africa. After some recent product
expansions and new facilities the company has seen substantial growth and it is expected
that such growth will continue in the foreseeable future.
It is forecast by the International Fertilizer Industry Association (IFA) that the world fertilizer
demand will increase by 4.8% from 2010 to 2011 which brings the total demand to 170.4
million metric tons (Prud’homme & Heffer, 2011). The International Grains Council (IGC)
estimated that the global maize demand will reach 825 million metric tons in 2010/2011 and
wheat may reach 650 million tons (IGC, 2011). The demand for fertilizer is growing daily due
16
to various factors, some of which include the price of crops, price of fertilizer and other input
costs, pollution fallout, soil type, the fast growing global population, etc. Fertilizer helps to the
restore the nutrient balance of the soil and to speed up the growth process of crops in order
to have good harvests at the end of the season. ACME Fertilizer currently follows a basic
costing methodology in the form of a standard-/hybrid costing framework.
There are four factors which are included in the cost of sales of the products they sell:
Raw material costs;
Fixed and variable costs;
Labour and overheads; and
Transportation costs.
ACME costs the main raw material based on the market value and the rest of the raw
materials costs are based on historical information. The labour and overhead rate is based
on a broad average calculation made annually by dividing the budgeted overhead costs by
the forecast production tons. To achieve a competitive advantage, a crucial strategy to follow
is the concept of product differentiation in which costing plays a vital role.
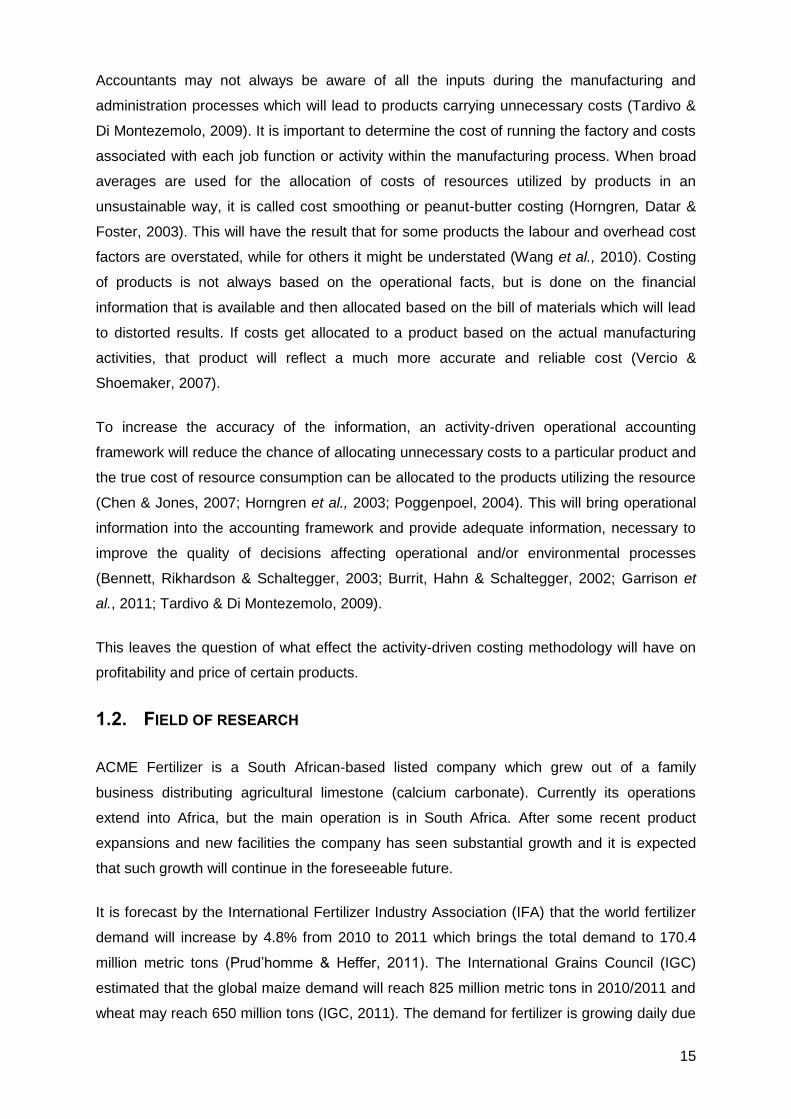
Figure 1.1: Building blocks of product cost – ACME conventional costing method
Source: Own research
ACME Fertilizers is currently faced with several challenges in respect of its costing
methodologies, including the following (Ferrara, 2007):
Forecast costs that are often overstated and forecast tons of produced fertilizer,
which are understated with the resultant incorrect recovery rates per ton.
17
Cost allocation information that is based on assumptions, e.g. resource availability
and that all fertilizers use the same resources and time to manufacture, which may
result in questioning the reliability of price fluctuations.
The same labour and overhead rate is used to allocate costs to the products, without
considering the relevant and actual effort to manufacture the various products and
the fact that input costs and resources are less than others.
The value, or cost, of a product needs to be set at a “balanced price”. If a product’s
cost is set too high, the company will lose market share and if the cost is under-
estimated, profits will be negatively influenced. Because of the increase in costs
associated with the manufacturing of fertilizer it is necessary to make provision for
those increases over the forward cover, as well as for imported products. Therefore it
is important to provide a more accurate costing method to increase the profitability
and to reduce waste (Tatikonda & Tatikonda, 2001).
In order to determine the feasibility of an activity-driven operational accounting system within
ACME Fertilizer, the following must be done:
Identify a range of products to be included in the study;
Determine the costs of these products, based on their operational activity
requirements; and
Compare the costs based on the activities they consume, against the current costs
as per standard costing method.
This will determine what the effect will be of the different costing frameworks on the
profitability per product.
1.3. PROBLEM STATEMENT AND HYPOTHESIS
As highlighted above, a key challenge for many manufacturing companies is the lack of a
proficient and robust cost accounting system that is able to provide managerial information
about the company’s operations and to control its overhead costs efficiently. Such a system
combined with reliable information feed can be considered as a good starting point for
getting a competitive advantage, which is essential especially when the competition is strong
and powerful.
The primary research problem to be considered is whether an activity-driven accounting
framework in the ACME Fertilizers will provide better and more relevant management
information.

18
The consideration of the following aspects will contribute to addressing the above problem:
The impact that the activity-driven operational accounting framework will have on
decision-making and financial structure;
Current performance of operational activities;
The utilization of activities to produce individual jobs or products;
Accurate costs, through covering all direct and indirect costs associated with the
manufacturing of products;
Management of fluctuating cost driver mechanisms;
Ensuring that risks are minimized and calculations are correct and realistic;
Eliminating irrelevant, non-value adding costs without substituting the quality of
products; and
Effective resource utilization and control.
Blumberg, Cooper and Schindler (2008) defined hypotheses as the proposition for an
empirical testing that must be uncertain and of an academic nature. A hypothesis is
described by Crowther and Lanchester (2009) as uncertain proposed assumptions which are
subject to justification through subsequent investigations. The hypothesis of this study is that
the allocation of direct and indirect costs, based on consumption of activities and resources,
will provide a much more accurate costing and cost recovery. The working hypothesis of this
study is therefore that by allocating not only the direct costs, but also indirect costs based on
consumption of activities, the method will be more advantageous and the cost hierarchy of
the various products will be visible. This will eliminate the over- or under-estimation of
indirect costs of a product.
1.4. RESEARCH OBJECTIVES
According to an independent research firm, Gartner (quoted by Furnis & Spencer, 2005)
Activity-based Costing is an important decision support tool which enables a company to
deal with the challenges regarding product, customer or channel profitability, as well as the
cost of doing business.
Considering all the above, the primary objective of this research project is therefore to
determine the feasibility of an activity-driven operational accounting framework within a
manufacturing organisation and therefore defined as follows:
To determine, compare and analyse the product costs, including the labour and
overheads based on the current costing method and comparing the results to a
19
situation where costs get allocated based on an activity-driven operational
accounting framework with resource and activity utilization as basis.
In addition to the above primary objective, this study will also lead to identifying the following
secondary objectives:
Ensure the lowest possible cost per ton of fertilizer and thus establish a higher
margin, but a high profit at the end as well; and
More effective and efficient utilization of available resources thus irrelevant costs will
be eliminated and processes can be amended.
Other objectives for ACME Fertilizer which also contribute to this study are:
Recovering full absorption costs on mainstream operations;
Setting standard procedures for costing purposes;
Maintaining the competitive position; and
Embarking on best practices.
The application of Activity-based costing with special reference to planning, control,
decision-making and more accurate and reliable costing will be evaluated within the
company.
1.5. METHOD OF INVESTIGATION AND RESEARCH
To achieve the above objectives, the proposed research method will be a case study and will
be concluded by means of a literature as well as an empirical study.
1.5.1. Research methodology
Blumberg et al. (2008) defined business research as a “…systematic inquiry whose objective
is to provide the information that will allow managerial problems to be solved.” Research
methodology is defined as the category of research approach used in a research study and
relates to the data collection (Crowther & Lanchester, 2009). Research is done for this study
to be able to provide information and assistance in cost management and decision-making.
Blumberg et al. (2008:195) defined research design as an activity- and time-based plan and
it is based on research questions. It guides the selection of sources and types of information
and as a framework in specifying the relationships among the study’s variables. The design
gives direction to and sets procedures for the research activities.
20
1.5.2. Research studies and design
There are four different types of research studies namely reporting, descriptive, explanatory
and predictive.
Reporting research is an uncomplicated level of research where an account or
summary of data is given (Blumberg et al., 2008). This research method is employed
for this research project on the current situation in the ACME case study.
A descriptive study will answer the “who”, “what”, “when”, “where” and (sometimes)
“how” questions. By creating a group of problems or people, the subject will get some
meaning and definition (Blumberg et al., 2008).
An explanatory study will provide reasons for the results of the descriptive study
(Blumberg et al., 2008).
Predictive research will ensure that should you be able to provide an explanation for
the event after it has occurred. It is preferred to give a prediction of when and in what
situation a similar event might occur (Blumberg et al., 2008).
According to Blumberg et al. (2008) the criteria of research include a good desirable
decision-oriented research.
1.5.3. Research method
Quantitative studies rely on quantitative information like numbers and figures, and are more
objective and scientific (Blumberg et al., 2008; Crowther & Lanchester, 2009). Qualitative
determination is more driven towards qualitative information like words, sentences and
narratives (Blumberg et al., 2008) and is more applicable to phenomena which are difficult to
quantify (Crowther & Lanchester, 2009). For this study, both qualitative and quantitative
studies have been done. Chapters 1 to 3 are based mainly on quantitative studies, and in
Chapter 4, there is a mixture of qualitative and quantitative studies. With the empirical case
study, qualitative studies have been used.
Case study research is a crucial and widely used method of research. It follows replication
logic, in other words, the results of case studies are not generalized to populations (sampling
logic) but to theoretical propositions (Blumberg et al., 2008). It emphasizes the possible
implementation of concept in its real life context (Blumberg et al., 2008). Case studies rely
on multiple sources for evidence (Blumberg et al., 2008) and include interviews, documents
and/or archives and observation. In the case of ACME Fertilizer, a case study was done to
prove the hypothesis of this study.
21
Questionnaires are very commonly used and are a valuable way of data-gathering (Crowther
& Lanchester, 2009). Self-administered surveys and questionnaires are used to gather
information. Using a survey is the approach to collect data from a large number of
respondents to identify a specific trend (Crowther & Lanchester, 2009). The
surveys/questionnaires can be delivered per hand, e-mail, courier or post, whichever is the
preferred method. For the purpose of this study, a questionnaire (see Appendix 1, p 77) of
20 questions was either delivered by hand or via e-email. Participants completed the
questionnaire without assistance from the interviewer, and this could be done on their own,
either in their offices or at home.
Valuable information can be gathered through looking and noting (Crowther & Lanchester,
2009) as the event occurs (Blumberg et al., 2008). Observation can generate data based on
what is actually happening and what is not according to what people claim they are doing or
how processes are supposed to be working (Crowther & Lanchester, 2009). Non-
behavioural observation will include process (activity) analysis and includes time/motion
studies of manufacturing processes and the traffic flow in a distribution system (Blumberg et
al., 2008). Behavioural observation includes body movements, motor expressions, etc. This
is not included in this study (Blumberg et al., 2008). For this study, an observation at
ACME’s main factory in Sasolburg was done in order to note the processes and procedures
when manufacturing fertilizer.
1.5.4. Literature study
A literature study has been conducted through gathering theoretical information by means of
a review of the relevant text books, relevant articles from academic journals, subject-specific
magazines and case studies. The foundation of the case study will be based on basic
information and theory of Activity-based Costing and the implementation thereof.
1.5.5. Empirical study
An empirical study will be carried out to measure the results of the current traditional costing
method versus an activity-driven operational accounting framework method within the
company. Firstly, interviews were held with the stakeholders who include finance, supply
chain, planning and operational management teams, factory managers and accountants. All
had a possible influence on the cost of a product, whether it was raw material procurement,
handling of the stock (raw materials, intermediates and/or final products) or the
manufacturing process.
22
Secondly, an exploratory survey was also conducted by a third party, managers, cost and
management accountants, etc. of related industries. The sample was chosen randomly and
the objective was to find out more about their costing methodologies. The questionnaire is
attached (see Appendix 1, p 77). Direct competitors could not be approached directly
because of current competition commission investigations. Their financial statements of
2008 were published and made publicly available, and some information on their costing
methodologies could be deduced from there.
Thirdly, ACME fertilizer’s management reports and other internal reports for the financial
year 2008 were also analysed to provide a clear perspective as to what their current
situation is and how an activity-driven operational accounting framework would affect profit
margins on certain products. Labour, overheads and other cost drivers were taken into
account based on the financial information from 2008. Information was also gathered
through daily activity observation within respective departments and factories, and the
correct application of relevant cost management techniques in the workplace.
1.6. TERMINOLOGY
ABC terminology is very work-centric, not like the traditional costing terminology which is
more transaction-centric. Definitions of commonly used terminologies relating to Activity-
based Costing include the following:
Activities: An activity is a unit of work performed in a process. An activity consumes
the resources available as well as the applicable costs such as setting up the
machine and processing invoices (Christie, 2008; Stout & Bedenis, 2007; Tatikonda
& Tatikonda, 2001).
Activity-based Costing: This is where activities get monitored and costing is done by
means of resource consumption, and the costing of the final product gets done.
Resources are assigned to activities and activities to cost objects (based on resource
consumption estimates) (CIMA Terminologies, 2010; Fabozzi, Drake & Polimeni,
2007; Tardivo & Di Montezemolo, 2009).
Activity-based Management: Actions that increase effectiveness, reduce costs and/or
to improve resource utilisation (CIMA Terminology, 2005; Christie, 2008; Tardivo & Di
Montezemolo, 2009).
Activity Driver: CIMA Terminology (2005) defines an activity driver as an activity
caused by a transaction, for example receipt of a sales order sets in train the order
processing activity (Christie, 2008; Tatikonda & Tatikonda, 2001).

23
Bill of Material: This is a detailed specification, for a final product or output, of the
materials, other projected costs and scrap factors required (CIMA Terminologies,
2010; Herzner, 2009).
Costs: Expenditures can be classified into two different costs, viz. product costs and
period costs. Product costs can then be classified as direct (traceable) and indirect
(shared) costs. Indirect costs can be allocated to product by a chosen basis, such as
machine hours (Drury, 2008; Horngren et al., 2003; Tatikonda & Tatikonda, 2001).
Cost Centres: Costs traceable to the central unit of tasks in a company (CIMA
Terminology, 2005; Drury, 2008; Garrison et al., 2011).
Cost Driver: Any factor than causes a change in the cost of an activity (CIMA
Terminology, 2005; Tardivo & Di Montezemolo, 2009) and is the source of the activity
cost (Fabozzi et al., 2007).
Cost Object: The final result or output which all the above costs get linked to (Stout &
Bedenis, 2007). All ‘work’ and processes are done because of the cost object and
can be a customer or a product (Tardivo & Di Montezemolo, 2009). This will be the
identifiable products or services.
Relevant Cost: Incremental costs (or relevant cost) are the additional costs incurred
as a result of selecting one decision alternative over another (Jiambalvo, 2004).
Relevant costs are those costs that will be considered in making a decision and will
be affected by that decision. Relevant costs are those costs which will be influenced
by future decisions and are valued at their market value (Drury, 2008).
Resources: Expenses (in the general ledger of a company) incurred by the company
to help in delivering the final product (Tatikonda & Tatikonda, 2001). Resources are
devoted to the performance of activities, and are the source of costs (Stout &
Bedenis, 2007). These expenses include salaries, utilities, depreciation, raw material
costs, etc.
Sunk Cost: This is a cost which has already occurred and a future decision cannot
influence this cost (CIMA Terminology, 2005). This cost is the opposite of relevant
cost (Drury, 2008). Sunk cost is a cost which you cannot do anything about any
more.
Time-Driven ABC (TDABC): An approach to ABC by calculating the time required for
each unit of activity. The method is easier to implement and maintain. It avoids the
use of costly interviews with employees to determine the percentage of time spent on
different areas of work and unutilized capacity can be visible (CIMA Terminology,
2005; Max, 2007; McGowen, 2009).
24
1.7. CHAPTER OVERVIEW
To provide structure for the research project, the following chapter layout was chosen:
Chapter 1: Introduction
This chapter consists of a background to this study, the rationale and motivation, problem
statement, hypothesis, research objectives and aims, method of investigation and the
chapter overview.
Chapter 2: Activity-based Costing focused theory
Theoretical research related to Activity-based Costing (ABC) has been the aim of this
chapter. ‘Activity-based Costing’ and other related terms are defined, as well as the
applicable advantages, disadvantages and fundamentals. Implementation of the activity-
driven framework is addressed, as well as the implications and supporting systems thereof.
A comparison between ABC and the traditional methodology is also included in this chapter.
Chapter 3: Fertilizer business synopsis
This chapter covers the summary of the fertilizer industry in general and the specifics of
ACME’s business. It also covers topics such as sales reporting, the manufacturing process,
current costing methodology and factors which can influence the costs of different products
within ACME’s business model and operations.
Chapter 4: Empirical research at different business units
The purpose of this study is to compare the current standard costing method ACME fertilizer
follows, to the possibility of implementing an activity driven operational accounting
framework. A scenario is given where the two methodologies are brought into perspective by
means of a case study. One scenario, two methodologies, and the outcome thereof are
analysed and recommendations made accordingly.
Chapter 5: Findings and recommendations
Following the investigation into the method currently in use by ACME fertilizer and the
embedding of an activity-driven operational accounting framework, recommendations are
made to ACME fertilizer. The best practices are identified and recommended to ACME
fertilizer for further consideration.
25
The next chapter provides a précis of the theory of ABC and includes definitions, applicable
advantages, disadvantages and fundamentals. Implementation of the activity-driven
framework is addressed, as well as the implications and supporting systems thereof.
26
CHAPTER 2: PRINCIPLES OF ACTIVITY-BASED COSTING
2.1. INTRODUCTION
The purpose of this chapter is to summarise the theoretical research relating to ABC. ABC is
defined and the applicable advantages, disadvantages, key components and fundamentals
are discussed. Implementation of an activity-driven framework is addressed, as well as a
comparison between traditional methods of costing vs. the ABC method.
One of the main reasons why companies fail is because somewhere in the past, bad
decisions have been made. The solution is not to cut costs only, but to retain a good cash
flow and liquidity (Dwyer, 2009). As the costs increase, their cash flow and profit margins are
decreasing. This is seen more often in the business world than ever. The price of goods sold
is not inclining as fast as the input costs, thus we are facing a recession where only the
‘fittest’ companies will survive. “Fittest” companies are not necessarily big companies, but
rather the great ones (Collins, 2009). High interest rates, increased fuel prices and other
costs are the reason for the steep price increases, and if we do not take remedial action,
these high costs and poor economic circumstances will strangle more companies globally.
In any company it is very important to control and manage costs (Narong, 2009). ABC is a
management tool which should provide managers with strategies for pursuing possible
growth (Stout & Bedenis, 2007) and cost management. By making use of ABC, the
management of ACME Fertilizer might get a better understanding of the costs of the product,
simplified products and processes, financial management, eliminating waste and idle times,
cost reduction, lead time reduction, better resource and overhead allocation, improved
quality, added value, better customer satisfaction to name but a few as it is the order of the
day (Narong, 2009). Costly and non-value adding activities could be identified, and
managers could focus on these activities to reduce or eliminate the costs (Stratton,
Desroches, Lawson & Hatch, 2009). These are all critical issues when the focus is on
improved profitability and better decision-making. The ABC methodology supports continued
improvement, a balanced scorecard and performance measurement. In this chapter, ABC is
discussed under the following headings:
Background;
Key components of Activity-based Costing;
Fundamentals of Activity-based Costing;
Advantages of Activity-based Costing;
Disadvantages of Activity-based Costing;
27
Implementation of the Activity-based Costing approach (Introduction, Conditions and
Steps); and
Other ABC-based methodologies.
2.2. ACTIVITY-BASED COSTING
2.2.1. Background
During the late 1980s a new method of costing was developed by academic researchers,
Professors Robert Kaplan and Robin Cooper (Kennett et al., 2007), to overcome some
problems that the traditional method had. The traditional method allocated overheads to
products based on only one volume-sensitive driver, which distorted cost estimates (Christie,
2008; Kennett et al., 2007; Roztocki & Scultz, 2003).
ABC has proved positive results for companies who succeeded in the implementation of the
process. In a recent study done by Stratton et al. (2009) 70% of the respondents who
already implemented ABC had noted the benefits and they now have accurate costs of
activities. The implementation process is described in detail later in this chapter.
ABC is not limited to manufacturing costs only but includes non-manufacturing and other
overhead costs such as selling, marketing, distribution and administrative costs that can be
traced to the product through activities (Garrison et al., 2011; Christie, 2008). Products get
charged for the cost of capacity it actually uses, and idle time is not taken into consideration
(Kaplan & Anderson, 2007). Identifying and allocating costs based on an activity rate assist
in making decisions not only about product costs, but also distribution and customer related
decisions (Cokins, 2001b; Friedl, Kűpper & Pedell, 2005; Stratton et al., 2009).
2.2.2. Key components of Activity-based Costing
It is important to understand the meaning of the often used terms in ABC methodology.
Turney (2005) defined ABC as a technique to measure the cost and performance of
activities and cost objects (see figure 2.2). Costs are assigned to activities based on
resource consumption, and to cost objects based on the usage of these activities (Garrison
et al., 2011) (see figure. 2.2). CIMA Terminology (2005) states that ABC is where the costing
of activities is done and monitored by means of resource consumption in order to cost the
final product accurately. Resources are allocated to the various activities, and these
activities will be allocated to cost objects based on consumption estimates. Activity-based
Costing is a costing method which can trace cost to activities which take place based on
resource consumption and/or capacity usage, and then furthermore to the product which

28
caused the activity (Kennett et al., 2007; Stratton et al., 2009; Tardivo & Di Montezemolo,
2009; Turney, 2005). Its ability to identify cost cutback opportunities may be very helpful in
today’s economic environment of cost saving attitude amongst companies. If the expected
benefits are more than the expected cost, ABC must be definitely considered (Kennett et al.,
2007).
Cost objects will have a certain percentage of usage of each activity. Various costs from the
general ledger will be allocated to a specific activity and based on the percentage consumed
per cost object will be allocated to the final products costing.
Figure 2.1: Costing basic structure of an Activity-based Costing system
Cost
(Resources)Cost Object
Source: Cokins 2001a:60.
Figure 2.2: Costing basic structure of an Activity-based Costing system
Source: (Modified) Turney, 2005.
2.2.3. Fundamentals of Activity-based Costing
The fundamentals of using the ABC methodology are to estimate the costs where the project
is sub-divided into activities or work units. The activities must be performed where the
productivity can be measured in units. The cost of performing that activity is estimated by
summing all relevant costs to that activity such as labour, materials, equipment,
29
subcontracting costs etc. and accumulate in the cost pool (Christie, 2008; Garrison et al.,
2011; Kennett et al., 2007; Stratton et al., 2009). The total cost of the final product/service
will be the sum of all the activity costs based on the consumption of the activities (Kennett et
al., 2007). This will contribute to giving much more accurate estimates of the actual cost of
products, and is an important step towards increasing profits.
The motivation behind ABC is to be in control of the costs and overheads in an operation. It
is highly recommended when indirect costs of a product make up a high proportion of the
total cost. It is advisable to analyse ABC as a possibility when the above-mentioned criteria
are applicable. Should the financial benefits of applying an ABC system to ACME Fertilizer
be greater than the financial cost of the implementation thereof, it will most definitely be
advantageous to implement ABC (Kennett et al., 2007). Companies with little or no product
differentiation and which have labour-intensive operations will not gain much from ABC
(Tatikonda, 2003), but if the company has significant overheads, ABC will warrant serious
consideration (Kennett et al., 2007; Stratton et al., 2009). Because of different production
methods and technology that play a big role in today’s production environment, a much
higher proportion of overhead costs will be allocated to indirect cost. For example, labour in
the traditional method consisted of a huge proportion of the total product cost (Garrison et
al., 2011). In the modern business environment most production processes get automated,
which leads to lower physical labour costs, but a higher indirect overhead cost. Because of
this situation, the indirect costs need to be allocated to the product to recover all costs
otherwise the costs may be distorted. ABC will resolve this problem that traditional
accounting methods face in this changing world.
2.2.4. Advantages
The first important issue why ABC will be advantageous is measurement. The way a
company is measured will determine the results. You cannot improve what you cannot
measure. Whether it is profit, market share, or materials consumed, the end result will be
dependent on what drives the company. Some of the most common measurements are
customer and product profitability and cost management (Kaplan & Anderson, 2007). To
achieve higher profits your first step will be to optimise cost rather than just cutting costs of
products without forfeiting the quality (Tatikonda, 2003). Traditional costing methods might
not be the most reliable source of the true costs. The objective of this study is to investigate
the possibility of implementing an ABC system, and the effect it will have on the costing of a
product and the profitability of ACME Fertilizer.
If ABC is implemented correctly and all the necessary data captured with special care, it can
hold significant advantages for ACME Fertilizer. Here are a few of the advantages:
30
ABC gives a more visible and accurate calculation of the true costs of a product,
which can help in better allocating resources and decision-making especially in
today’s globally competitive market (Christie, 2008:70; Garrison et al., 2011; Needy,
Nachtmann, Roztocki, Warner & Bidanda, 2003; Stratton et al., 2009). This means
that there will be a better understanding of overheads allocated to a product, and
substance as to why it’s been allocated (Stratton et al., 2009).
With ABC the total activity costs and work processes can be directly assigned to the
cost object (Christie, 2008; Stratton et al., 2009).
Productive resource utilization is a common inadequacy in the operational side of
business, but with ABC scarce resources can be maximized and distributed
throughout the manufacturing process as well as other operational improvements
opportunities can be identified and executed (Stratton et al., 2009; Stout & Bendenis,
2007).
ABC provides better cost control and management, more accurate decision-making,
performing budgeting, planning and performance evaluation (Stratton et al., 2009).
Thus, it creates better public and customer relations, because selling prices are
based on more reliable costing (Christie, 2008).
Performance measures are crucial in any company and the ABC model can identify
most (and least) profitable customers, products and resources (Christie, 2008;
Furniss & Spencer, 2005; Stratton et al., 2009).
The main reasons for poor financial performance can be pointed out (Furniss &
Spencer, 2005) and it will be evident on which areas to focus on or to improve.
Non-value adding, redundant and under-utilised resources can easily be identified
and eliminated which means only the necessary costs will be allocated to the outputs
(Tatikonda & Tatikonda, 2001).
2.2.5. Disadvantages
Because of the volatility in commodity prices that we face today, it’s important that ACME
manage their cost with care. ACME Fertilizer faces huge risks buying high volumes of raw
material stock at a certain price, which can fall drastically within a few days, depending on
the market supply and demand of that product. If the cost of the final product is overstated
by not having an accurate costing system or knowledge of the costs, this might lead to
unfavourable situations (Vercio & Shoemaker, 2007). These situations can be either
unrealized sales because of a too high selling price or on the other hand they might sell the
products at a loss only to get it out of stock and avoiding further losses.
31
ABC can be beneficial and should not be a “nice to have” system. It should be used to its
fullest potential. If a commitment towards ABC is present, ABC will ensure that costs are
allocated accurately and that the true costs of products/services can be visible. Thus,
accurate margins at year end, which means no nasty surprises which can lead to a
downward spiral in a company.
Therefore it is evident that an accurate, proper costing methodology is crucial in any
competitive market, and that a feasibility study of the different options must be done in order
to be able to choose the best possible one where the financial benefits outweighs the cost
involved.
Some of the disadvantages reported with ABC are that the implementation and the
maintenance thereof are time-consuming and too costly, especially the expensive employee
surveys that are required and the cost of additional staff needed (Christie, 2008:70; Kaplan &
Anderson, 2007). If employees are not informed about ABC, they will feel confused, thus
they will not be eager to support and maintain the ABC system (Tatikonda, 2003). To
process the raw data, gathered through several channels, can take up to 30 days to prepare
a useful report, which will be outdated when management needs the information (Kaplan &
Anderson, 2007; Stratton et al., 2009). Management needs information that is timely and
relevant (Garrison et al., 2011). There will always be a delay in delivering the final results.
Inaccurate input and results may occur if information is not 100% correct (Garrison et al.,
2011). The accuracy of the results is based on the correctness information given by this
model (Christie, 2008). The model is dependent on the feed of information by employees
whom can make human errors and is not always correct. There can be problems integrating
the current legacy system with ABC. ABC can block accounting systems, thus misleading
cost reports can be given to management, which will lead to poor decision-making and will
destroy the integrity of the ABC system (Tatikonda, 2003). Manual collection of inputs must
be done with care; otherwise the result will be false.
ABC perceives activities and resources to be linear, absolute and certain (Geri & Ronen,
2005), and internal limitations or constraints are not considered. Overheads are difficult to
assign to the activities, and are thus applied arbitrarily (Garrison et al., 2011). The
identification of cost drivers is difficult, and sometimes has little or no relevance to the activity
(Adkins, 2008; Christie, 2008; Geri & Ronen, 2005). Many companies left ABC unconsidered
because it did not recognize the complexity of their operations (Stratton et al., 2009). An
ABC system should be altered according to the company’s needs and goals.
When following an ABC methodology, an unprofitable product on the income statement can
be eliminated although the recovery of the fixed operating costs thereof will remain
32
unavoidable (Baxendale & Raju, 2004). Additional documentation and record-keeping might
be required (Christie, 2008) to support the ABC model. This will lead to unnecessary storage
and labour cost and time wasted.
Historically it was financially not viable to consider ABC because it had the reputation that it
was very costly and time-consuming to implement and maintain (Stratton et al., 2009).
However, before a company rejects ABC they should first be sure that ABC is not the best
system for their needs and that the cost of implementing and maintaining ABC cannot justify
the benefits of ABC (Kennett et al., 2007). If a company is not fully committed to ABC, and
isn’t willing to spend the necessary resources (operational and human resources), cost and
time ABC will not be as successful. ABC can be misleading and too wide. A lot of effort will
go into maintaining the information and system, with regular updates of operational changes.
The ABC system can’t be run alone and should be run parallel with a proper ERP system to
ensure best results.
2.3. THE IMPLEMENTATION OF ACTIVITY-BASED COSTING
2.3.1. Introduction
There are a few strategic implications of the current costing system that needs to be
addressed which will determine the outcome of the implementation of ABC. Firstly, ABC
focuses on medium to long-term planning and decision-making and must provide managers
with relevant and accurate product cost information. This is important when new products
and markets are considered as well as other management decisions (Tatikonda, 2003).
ACME Fertilizer must compete with global companies who might have lower labour costs,
manufacturing overheads and stronger currencies (Lowder, 2006). Imported raw materials
are volatile especially with the rand/dollar fluctuations that South Africa is facing these days.
Thus, the supply chain in companies can have a lack in continuity and therefore it is crucial
that there is focus on its value chain (Kannegiesser, Gunther, Van Beek, Grunow & Habla,
2009; Walters & Lancaster, 2000). Companies can’t afford to make the wrong decisions that
have an impact on product mix, price quotes, inaccurate costing of products, etc. (Cokins,
2001b; Stratton et al., 2009). Throughput evaluation addresses the production throughput
(Lowder, 2006). Bottlenecks or constraints must be eliminated because they slow down the
production throughput and have huge costs associated with plant down times.
The one certain factor in any business is change. Therefore the cost-accounting system
must be accurate, relevant, flexible and comprehensive. No ownership in a department
confuses the employees, thus not supporting the system. After implementation employees
33
will lose interest, the maintenance thereof becomes hard work and will be extended to
employees at a lower level (Tatikonda, 2003). This can also lead to unsuccessful
implementations (Stratton et al., 2009).
Secondly, because ABC is focused on medium to long-term results and decisions, some
decisions may affect the company’s reaction at a global level and operational throughput
which will have a huge impact on ACME Fertilizer’s financial performance. To help achieve
success, ownership should be transparent and employees should know their responsibility
and where they fit it in making ABC work efficiently. The ABC model and the accounting
system should be maintained and changed regularly (Garrison et al., 2011).
The implementation of ABC will improve visibility of the costs to managers and employees.
Continuous improvement is the attribute of analysing of costs and cost structures (Needy et
al., 2003), to reduce or eliminate non-value added activities and to achieve overall efficiency,
without affecting the quality of products. A company can have a cost system which is
integrated with its current system where the ABC information is used outside the accounting
function for decision-making and performance measurements (Baxendale & Raju, 2004;
Searchy & Roberts, 2007). ABC should therefore be seen as a superb supplement to, rather
than a replacement of, a company’s current system (Adkins, 2008; Garrison et al., 2011).
External reporting requires that production costs must be allocated to the cost object for
income and asset reporting purposes. On the other hand, other costs from the internal value
chain get allocated to the product for operational cost control, strategic decision-making and
performance measurement (Kannegiesser et al., 2007; Stratton et al., 2009; Walters &
Lancaster, 2000).
Should operational improvements be implemented, and ABC data can be maintained and
managed regularly, benefits can realize and ACME Fertilizer can strive towards continuous
improvement and more accurate cost control.
2.3.2. Conditions prior to implementation
To be successful in the implementation process, it is necessary to determine whether the
company complies with several conditions before the process can start. The most critical
issues include informational, technical, design, behavioural, financial, competitiveness, and
managerial issues.
Informational issues: It is crucial that there should be management commitment
present from the implementing company and all levels of management must be fully
informed about the advantages ABC will provide to the company and how this
34
method will work for them, i.e. assist in decision-making processes, cost control, etc.
(Christie, 2008; Needy et al., 2003; Tatikonda & Tatikonda, 2001). The current
costing system must be assessed, a process plan of all shortcomings must be
conducted and a detailed report of what is needed in order to successfully implement
the new costing system (Needy et al., 2003). Potential data sources that can assist in
data gathering must be identified. A customer profile must be developed (Needy et
al., 2003) in order to determine the ratio of your clientele which make up a significant
percentage of your total sales, e.g. 80% of ACME Fertilizer sales are made up by
only 20% of all its customers.
Technical issues: All employees should get efficient training to operate the system
and to understand and actually use the information provided by an ABC system
(Christie, 2008; Tatikonda, 2003). The implementing company must be willing to
appoint an expert with the necessary qualifications and experience in this field to
manage this system (Christie, 2008; Tatikonda, 2003). Rather spend sufficient
money in the development phase than incurring higher costs later to fix what wasn’t
done properly earlier.
Design issues: To give proper direction, the practical requirements, objectives and
specifications of an ideal proposed costing system must be identified and/or
developed (Needy et al., 2003). A cost accumulation model must be developed to
assist in the prototype of the system on software like MS Excel (Needy et al., 2003).
Compare product costs on the old/current system with the new prototyped costing
system (Needy et al., 2003). Because the design is a very important process the
implementing company must be willing to spend the necessary money on the
implementation and maintenance. The activity-driven operating system should not
replace the ERP system, but rather run parallel with it.
Behavioural issues: Users of the ABC system must understand that the
implementation might take time before providing results, but will be worth the wait
(Christie, 2008:70; Tatikonda, 2003). They should stay committed and not lose
interest. Sufficient training must be provided to the users until they are comfortable.
Management must inform and force the users to manage and use the data, otherwise
they might lose interest, and the project will fail (Christie, 2008:70; Tatikonda, 2003).
By employing a committed team who will only be responsible to manage ABC will
ensure better commitment and success.
Financial Issues: A financial feasibility study must be done to determine whether the
benefits will outweigh the costs of implementing the ABC systems (Kennett et al.,
2007). The non-volume overheads must be significant (Christie, 2008:70; Tatikonda,
2003). Distorted costs are given by the current costing system (Christie, 2008:70;
35
Tatikonda, 2003) and the ABC system should improve cost control and the
management thereof. A fixed-to-variable ratio needs to be calculated (Needy et al.,
2003) in order to determine whether the current circumstances will comply with ABC.
Furthermore a thorough analysis of the financial statements must be conducted
(Needy et al., 2003). This will be very helpful when setting goals and measuring the
value of the change, as well show on which areas you should focus. Very
importantly, the implementing company must be financially capable to pull off such a
project and to support it afterwards (Christie, 2008:70; Kaplan & Norton, 2008;
Tatikonda, 2003). If the company is not in such a strong financial position all research
cost and time will be wasted, because of the high input cost of implementing ABC.
Competitiveness Issues: Determine whether ABC is already implemented by
competitors (Christie, 2008:70; Tatikonda, 2003), or whether they are considering it.
Do this research at other companies’ similar industries and sizes who might share
this information more easily than competitors. Ask how they experience the new ABC
systems and what recommendations they have.
Managerial Issues: Top Management must be committed to and willing to support the
implementation process (Christie, 2008:70; Garrison et al., 2011; Tatikonda, 2003).
Their buy-in is very important to the success of the implementation and maintenance
of an activity-driven costing system.
If ACME Fertilizer is complying with the above-mentioned conditions and have the financial
ability and senior management’s commitment on the project, they can consider implementing
an ABC system. Sufficient research, training and expertise must be considered. ABC should
be used as a supplement to the current ERP system. Activities get classified at four levels.
Unit-level activities are activities which are performed every time a unit is manufactured, and
assume that inputs are consumed in direct proportion of units manufactured (Garrison et al.,
2011). Batch-level activities are activities which are performed every time a batch is
manufactured and assume that inputs are consumed in direct proportion to batches
manufactured, without the size of the batch having an effect on it (Garrison et al., 2011;
Vercio & Shoemaker, 2007). Product-level activities are activities which are performed as
needed to support the production of each type of product and assume that inputs are
consumed to allow production of a product. Facility-level activities are necessary to maintain
the facility’s functionality. These costs are randomly allocated, if at all. These costs include
head office costs, salaries of directors, etc. (Tatikonda & Tatikonda, 2001).
36
2.2.3. Steps for implementation
After a thorough analysis and feasibility studies have been done, and it has been decided to
implement ABC, there is a basic set of steps that needs to be followed. When designing an
ABC model, the following steps are required to assign the activity costs to cost objects:
Identify the object for which costing has to be done, or the output. These are the
desired end results or product. Cost objects are the sum of all individual unit costs
(Garrison et al., 2011; Krumwiede & Roth 1997; Tatikonda & Tatikonda, 2001).
Identify the process involved and the major activities as well as the costs associated
with each activity (Unit, batch, product, facility and customer level activities) (Christie,
2008:68; Garrison et al., 2011; Krumwiede & Roth 1997; Vercio & Shoemaker, 2007).
Determine the cost pools as well as the primary and secondary cost driver per
activity pool. Indirect and direct resource costs get allocated to cost pools (Garrison
et al., 2011; Krumwiede & Roth, 1997; Tatikonda & Tatikonda, 2001).
Calculate the cost per unit of cost driver applicable per each activity and assign these
rates to the cost object (output) (Garrison et al., 2011; Krumwiede & Roth, 1997).
Analyse the result to determine what the most costly aspect is in this process, which
activities can be eliminated or added (unutilized capacity) and advise on what will be
the most cost-effective solution. Managers must be able to make operating and
strategic decisions based on the information given (Christie, 2008:68; Garrison et al.,
2011; Tatikonda & Tatikonda, 2001).The implementation process will be discussed in
detail in Chapter 4 by means of an empirical case study on ACME Fertilizer.
The proposal that ABC implementation is basic and uncomplicated is the message that gets
sent out in many articles and journals, but to implement a system that in reality works and
deliver the expected benefits is very convoluted (Searcy & Roberts, 2007).
Tatikonda (2003) stated that a costing system need not necessarily be complex. The data
needed for ABC can be sourced from interviews at the operation, and data which is already
available. Though this data is not precise, this is sufficient for managerial decision-making.
One must be careful not to go in to much detail, but only necessary and relevant data must
be used, maintained and always kept up to date.
The organizational structure and financial status of the company will have an effect on the
duration of ABC implementation process. Internal factors which have an effect on ABC’s
ability to influence the decision-making process in a company include the corporate culture,
available information systems and current financial performance (Stout & Bedenis, 2007).

37
There are two phases in which overheads get allocated to the cost objects (or outputs) with
ABC (Cooper, 1990) (See figure 2.2). The first stage requires tracing all costs that resources
consume and allocate these costs to the activity cost pools (Baxendale & Raju, 2004). In the
second stage, all overhead costs from activity cost pools get allocated to the cost object
(output). In traditional costing methods, the costs get directly allocated to the cost object (see
figure 2.4) (Vercio & Shoemaker, 2007).
Resource - First, the meaning of a resource needs to be understood. It is the
beginning point of all costs to produce the final product. The expenses can be
gathered through the general ledger and include raw material costs, salaries, storage
fees, research and development costs, etc. (Stout & Bedenis, 2007; Tatikonda &
Tatikonda, 2001). The costs traceable to the activities are therefore sum of the
resources consumed to perform any processes to add value to the cost object or
output (Gonzalez & Morini, 2006). To get the amount of resources consumed, an
analysis of the data from the general ledger can trace the costs back to the activities.
These costs can then be classified through a level hierarchy according to the level of
direct costs, indirect costs and general and admin expenses incurred.
Activities - An activity is a unit of work performed by people and machines (Christie,
2008:68). Activities can be organized by creating a master list called the “Activity
Dictionary” (Stout & Bedenis, 2007; Tatikonda & Tatikonda, 2001). Once one has that
information, the outputs which used the resources and activities can be determined.
2.3. CASE STUDIES – ACTIVITY-BASED COSTING IMPLEMENTATION
Needy et al. (2003) concluded a study on the implementation of an ABC system on small
manufacturing companies and identified 3 out of 30 potentially good candidate companies
for the implementing of and benefiting by ABC. Company names remain anonymous. They
found that 22% of service companies and 19% of manufacturing companies interviewed had
already implemented ABC. Those companies which implemented ABC was overall bigger
companies and had a diverse product mix (Roztoki & Schultz, 2003). Their accountants were
also more familiar with ABC than those of smaller companies. Needy et al. (2003) predict
that should smaller companies become more familiar with ABC that they will definitely
consider implementing it (Roztoki & Schultz, 2003). Results of a recently published study,
“Activity-based Costing: How Activity-based Management is used in the Organisation”
(Better Management, 2005) proved that Activity-based management is contributing to the
improvement of performance management results. This survey was done in July 2005 and
included 528 participants across all industries worldwide. The results showed that 89% of
the participating companies has already implemented or is considering implementation of
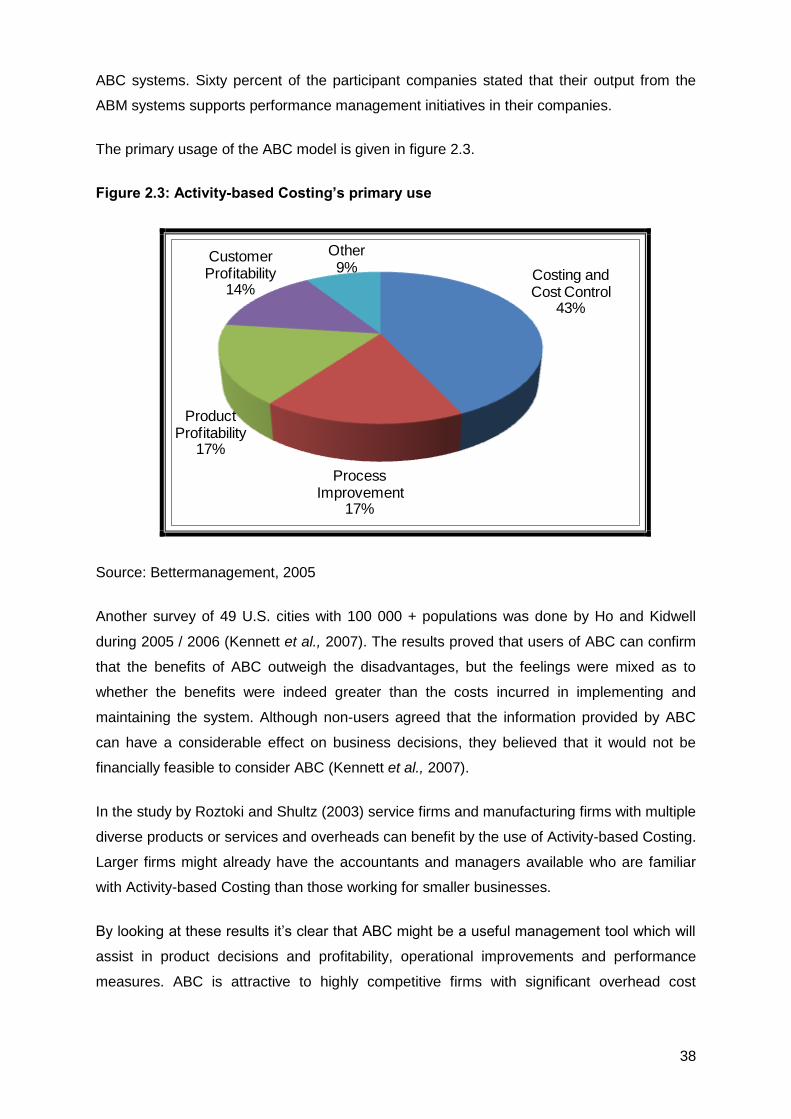
38
ABC systems. Sixty percent of the participant companies stated that their output from the
ABM systems supports performance management initiatives in their companies.
The primary usage of the ABC model is given in figure 2.3.
Figure 2.3: Activity-based Costing’s primary use
Costing and Cost Control
43%
Process Improvement
17%
Product Profitability
17%
Customer Profitability
14%
Other9%
Source: Bettermanagement, 2005
Another survey of 49 U.S. cities with 100 000 + populations was done by Ho and Kidwell
during 2005 / 2006 (Kennett et al., 2007). The results proved that users of ABC can confirm
that the benefits of ABC outweigh the disadvantages, but the feelings were mixed as to
whether the benefits were indeed greater than the costs incurred in implementing and
maintaining the system. Although non-users agreed that the information provided by ABC
can have a considerable effect on business decisions, they believed that it would not be
financially feasible to consider ABC (Kennett et al., 2007).
In the study by Roztoki and Shultz (2003) service firms and manufacturing firms with multiple
diverse products or services and overheads can benefit by the use of Activity-based Costing.
Larger firms might already have the accountants and managers available who are familiar
with Activity-based Costing than those working for smaller businesses.
By looking at these results it’s clear that ABC might be a useful management tool which will
assist in product decisions and profitability, operational improvements and performance
measures. ABC is attractive to highly competitive firms with significant overhead cost
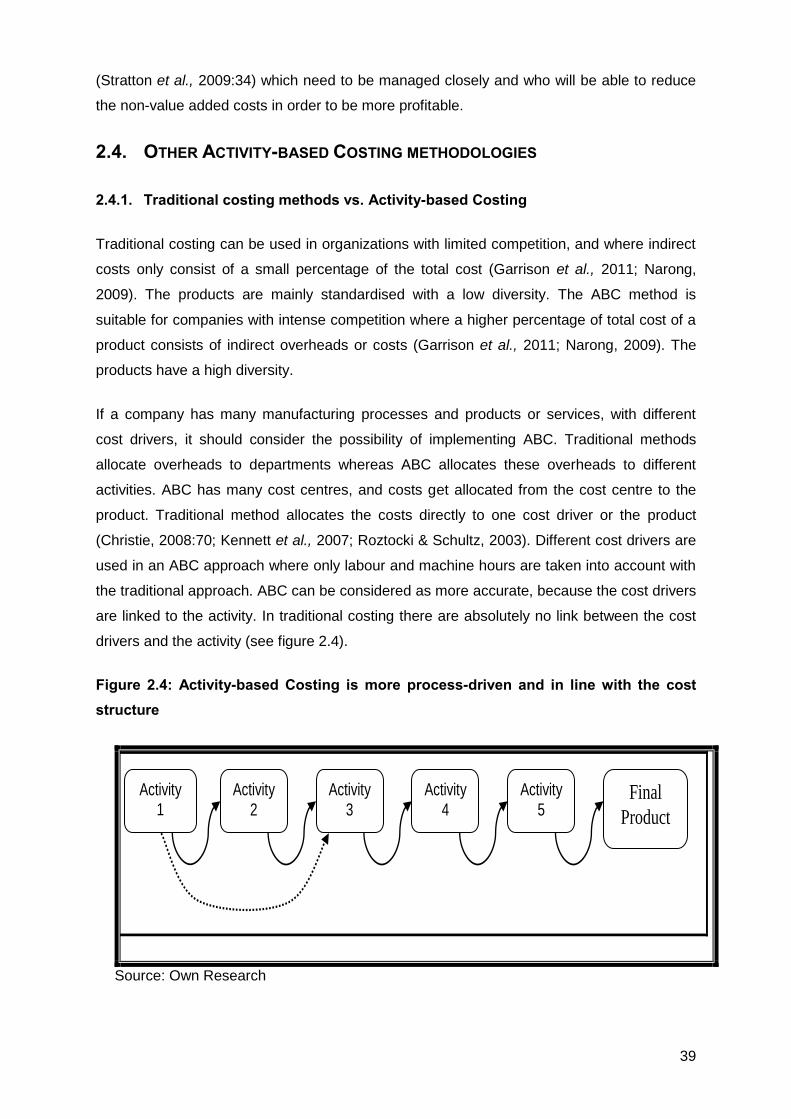
39
(Stratton et al., 2009:34) which need to be managed closely and who will be able to reduce
the non-value added costs in order to be more profitable.
2.4. OTHER ACTIVITY-BASED COSTING METHODOLOGIES
2.4.1. Traditional costing methods vs. Activity-based Costing
Traditional costing can be used in organizations with limited competition, and where indirect
costs only consist of a small percentage of the total cost (Garrison et al., 2011; Narong,
2009). The products are mainly standardised with a low diversity. The ABC method is
suitable for companies with intense competition where a higher percentage of total cost of a
product consists of indirect overheads or costs (Garrison et al., 2011; Narong, 2009). The
products have a high diversity.
If a company has many manufacturing processes and products or services, with different
cost drivers, it should consider the possibility of implementing ABC. Traditional methods
allocate overheads to departments whereas ABC allocates these overheads to different
activities. ABC has many cost centres, and costs get allocated from the cost centre to the
product. Traditional method allocates the costs directly to one cost driver or the product
(Christie, 2008:70; Kennett et al., 2007; Roztocki & Schultz, 2003). Different cost drivers are
used in an ABC approach where only labour and machine hours are taken into account with
the traditional approach. ABC can be considered as more accurate, because the cost drivers
are linked to the activity. In traditional costing there are absolutely no link between the cost
drivers and the activity (see figure 2.4).
Figure 2.4: Activity-based Costing is more process-driven and in line with the cost
structure
Activity 1
Final
Product
Activity 4
Activity 5
Activity 3
Activity 2
Source: Own Research
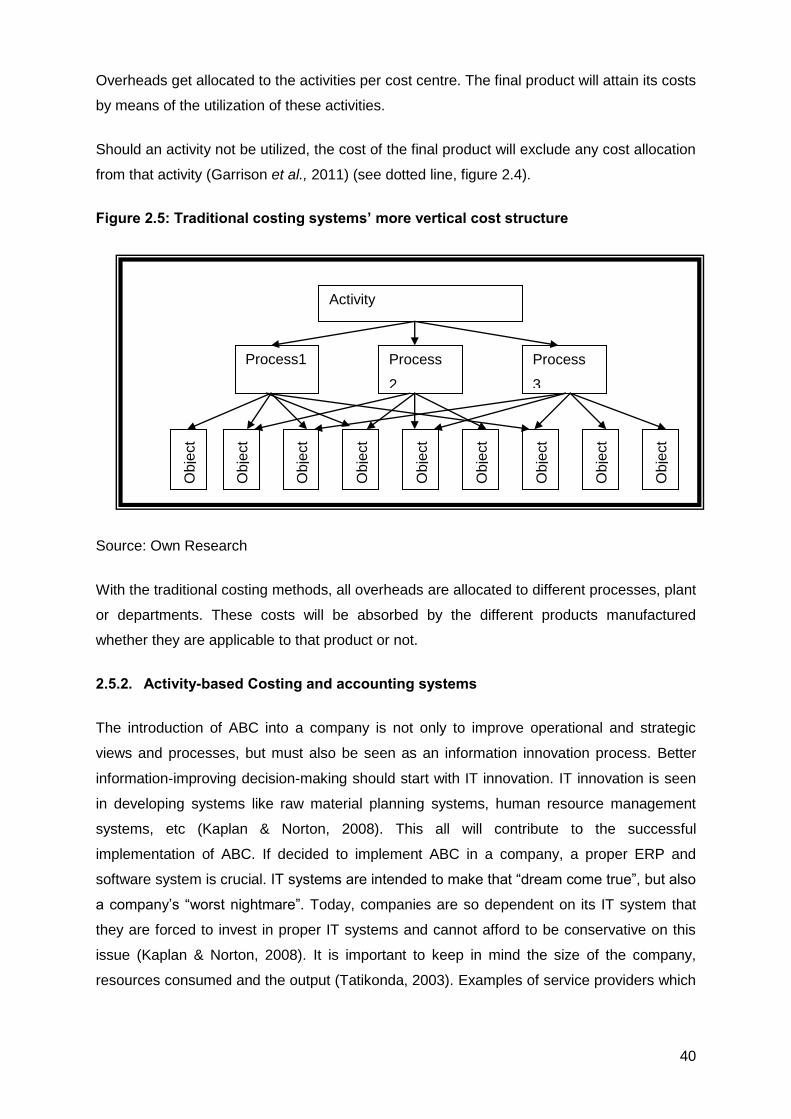
40
Overheads get allocated to the activities per cost centre. The final product will attain its costs
by means of the utilization of these activities.
Should an activity not be utilized, the cost of the final product will exclude any cost allocation
from that activity (Garrison et al., 2011) (see dotted line, figure 2.4).
Figure 2.5: Traditional costing systems’ more vertical cost structure
Source: Own Research
With the traditional costing methods, all overheads are allocated to different processes, plant
or departments. These costs will be absorbed by the different products manufactured
whether they are applicable to that product or not.
2.5.2. Activity-based Costing and accounting systems
The introduction of ABC into a company is not only to improve operational and strategic
views and processes, but must also be seen as an information innovation process. Better
information-improving decision-making should start with IT innovation. IT innovation is seen
in developing systems like raw material planning systems, human resource management
systems, etc (Kaplan & Norton, 2008). This all will contribute to the successful
implementation of ABC. If decided to implement ABC in a company, a proper ERP and
software system is crucial. IT systems are intended to make that “dream come true”, but also
a company’s “worst nightmare”. Today, companies are so dependent on its IT system that
they are forced to invest in proper IT systems and cannot afford to be conservative on this
issue (Kaplan & Norton, 2008). It is important to keep in mind the size of the company,
resources consumed and the output (Tatikonda, 2003). Examples of service providers which
Activity
Ob
ject
4
Ob
ject
5
Ob
ject
8
Ob
ject
5
Process
3
Process
2
Process1
Ob
ject
3
Ob
ject
7
Ob
ject
6
Ob
ject
2
Ob
ject
1
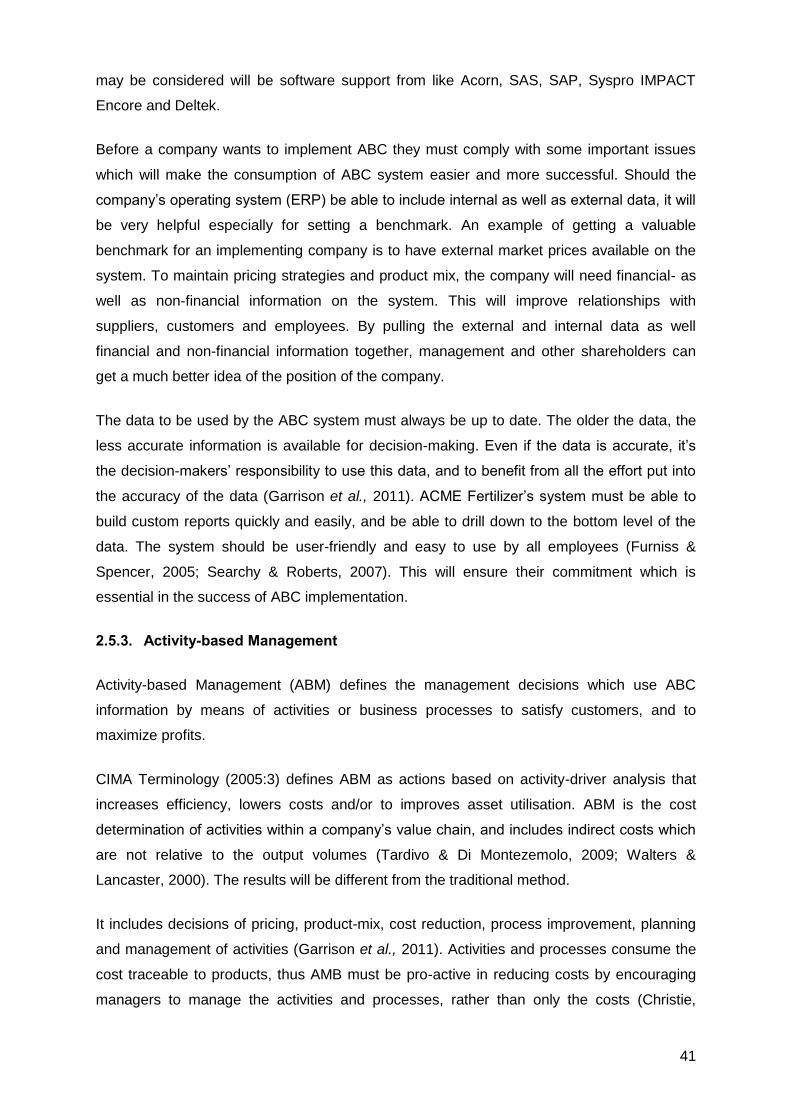
41
may be considered will be software support from like Acorn, SAS, SAP, Syspro IMPACT
Encore and Deltek.
Before a company wants to implement ABC they must comply with some important issues
which will make the consumption of ABC system easier and more successful. Should the
company’s operating system (ERP) be able to include internal as well as external data, it will
be very helpful especially for setting a benchmark. An example of getting a valuable
benchmark for an implementing company is to have external market prices available on the
system. To maintain pricing strategies and product mix, the company will need financial- as
well as non-financial information on the system. This will improve relationships with
suppliers, customers and employees. By pulling the external and internal data as well
financial and non-financial information together, management and other shareholders can
get a much better idea of the position of the company.
The data to be used by the ABC system must always be up to date. The older the data, the
less accurate information is available for decision-making. Even if the data is accurate, it’s
the decision-makers’ responsibility to use this data, and to benefit from all the effort put into
the accuracy of the data (Garrison et al., 2011). ACME Fertilizer’s system must be able to
build custom reports quickly and easily, and be able to drill down to the bottom level of the
data. The system should be user-friendly and easy to use by all employees (Furniss &
Spencer, 2005; Searchy & Roberts, 2007). This will ensure their commitment which is
essential in the success of ABC implementation.
2.5.3. Activity-based Management
Activity-based Management (ABM) defines the management decisions which use ABC
information by means of activities or business processes to satisfy customers, and to
maximize profits.
CIMA Terminology (2005:3) defines ABM as actions based on activity-driver analysis that
increases efficiency, lowers costs and/or to improves asset utilisation. ABM is the cost
determination of activities within a company’s value chain, and includes indirect costs which
are not relative to the output volumes (Tardivo & Di Montezemolo, 2009; Walters &
Lancaster, 2000). The results will be different from the traditional method.
It includes decisions of pricing, product-mix, cost reduction, process improvement, planning
and management of activities (Garrison et al., 2011). Activities and processes consume the
cost traceable to products, thus AMB must be pro-active in reducing costs by encouraging
managers to manage the activities and processes, rather than only the costs (Christie,
42
2008;68). In other words, where ABC identifies product or customer profitability and true
costs, ABM identifies opportunities to eliminate non-value adding activities and improve
product profitability.
2.5.4. Time-driven Activity-based Costing defined
According to Atchity work is infinite; time is finite - therefore, you must manage your time, not
your work (Stout & Bedenis, 2007). When a company is implementing ABC, the available
time on hand must be managed carefully. This can be done by the monitoring of access,
flow and level of information (Stout & Bedenis, 2007).
CIMA Terminology (2005:3) defines time-driven ABC as an approach to ABC, but is based
on the time required to perform each unit activity. Costly interviews with operating managers
to determine the percentage of work spent per area is being ignored with this method. It is
reckoned that the installation and maintenance of a time-driven ABC is less complicated and
unutilized capacity and resources can be identified.
Time-driven ABC has a concept of ‘available capacity’. It takes the unused or idle capacity
into account which is important to cost products in line with the activity consumption. This
can be a supplement to the ABC approach, but not a complete replacement. Time-driven
ABC has 2 parameters. The cost of supplying the resource capacity, and the time spent per
product per resource (Kaplan & Anderson, 2003).
Figure 2.6: Time-driven Activity-based Costing parameters
Source: (Adapted) Kaplan and Anderson, 2007
Time-Driven
Activity-based
Costing
Time to carry
out activities
Cost of supplying
resource
Total Overhead Expenses
= Total Employee Time Available
Direct observation / estimation
(As a rule of thumb: 80% of available
hours)
43
Managers can have a better sense of the total time needed to perform an action and the
actual time employees have available. This will lead to better capacity management. No
more expensive employee surveys are necessary. Implementation time and cost will be
significantly reduced (Kaplan & Anderson, 2007; Kennett et al., 2007). Kennet et al. (2007)
state that this is not only a more cost-effective method but also a more accurate way of
costing as well as giving management better cost information. Kaplan and Anderson (2007)
went further with the statement they made above, and imply that the results will only be
accurate if the data can be processed timely, even within a few days after the month end.
Kaplan believes that it was the inability of companies to maintain relevance in the data which
made them abandon ABC (quoted by Gilbert, 2007).
Charles Schwab, a leading provider of investment services, implemented Time-driven ABC
data sourced directly from their enterprise resource planning (ERP) system and results were
delivered within a few days after month end. The system’s results could verify the profit
outcome on 50 million transactions conducted by 3 million (+) customers within the specific
month (Kaplan & Anderson, 2007). Kaplan and Anderson (2003) stated in their article “Time-
Driven Activity-based Costing" in the November issue of the Harvard Business Review that
as a rule of thumb, the assumption can be made that the total full capacity will only be 80%
used. This method makes provision for idle times, tea breaks and lunch times. With Time-
driven ABC the idle or unused time of the resource should also be accounted for (Kennett et
al., 2007), which is not the case with ABC.
The accuracy of information available for decision-making depends on the accuracy of the
data being used (Kaplan & Anderson, 2007). If any assumptions are made, the final result
might not be as accurate.
2.6.1. Time-driven Activity-based Costing vs. conventional Activity-based Costing
Time-driven ABC is ‘married’ to Activity-based Costing. This new approach intends to
eliminate the difficulties experienced with the implementation of the conventional Activity-
based Costing method (Kaplan & Anderson, 2003; Kaplan & Anderson, 2007; Max, 2007;
McGowan, 2009). It is a simpler way to cost products, without high data storage, processing
and reporting costs as associated with the conventional ABC method (Kaplan & Anderson,
2007). The conventional ABC model requires much effort and time in updating and
maintaining the model, as well as costly surveys and interviews with employees (Kaplan &
Anderson, 2004; Kaplan & Anderson, 2007; Kennett et al., 2007, Max, 2007; McGowan,
2009).
44
The conventional ABC method might work well when roles remain relatively torpid over time
and where services are relatively consistent (Kennett et al., 2007), but the data remains
subjective and theoretically incorrect for the reason that no provision was made for idle
capacity (Kaplan & Anderson, 2007). Processes and resource spending are heterogeneous,
new activities are added, the diversity and complexity of orders, channels and customers
increase (Garrison et al., 2011; Kaplan & Anderson, 2004). These are some of the key
issues that require specific focus when implementing ABC to ensure easier management
and sustainability. Robert S. Kaplan, father of Activity-based Costing and Steven R.
Anderson introduced the simpler, cheaper and far more powerful Time-driven ABC method
which makes provision for volatility within an organization and the industry. The ABC method
is a “push” model of costing. You determine the total expenditure of resources and by
allocating these costs as a proportion consumed by activities, the final costs consumed by
the cost object can be determined (Adkins, 2008). Time-driven ABC on the other hand is a
“pull” model of costing. You have 2 parameters, unit of time to perform an activity, and cost
per unit of time (Adkins, 2008; Kennett et al., 2007). With ABC they failed to recognize the
critical role that capacity plays when estimating the cost driver rates. With the Time-Driven
approach, existing process documentation and resources are used to determine the effort
which goes into each stage of the process (Kennett et al., 2007; Max, 2007; McGowan,
2009).
2.6.2. Advantages of Time-driven Activity-based Costing
An accurate Time-driven ABC model can be built quickly and easily. Changes in processes
can effortlessly be updated (Kaplan & Anderson, 2007; Kennett et al., 2007) as frequently as
necessary. The model can be validated through direct observation of unit time estimations,
and costs. Time-driven ABC integrates well with high volumes of data (Kaplan & Anderson,
2007), and still delivering fast processing times, and “live” reporting. Time equations can
identify variation in activities without increasing the difficulty of the model. Cost and capacity
utilization of processes, product and customer profitability and unused or non-value added
resources can be identified, on which management can take action (Kaplan & Anderson,
2003; Kaplan & Anderson, 2007). Costs are highly transparent and management can see
the true cost consumption model/“Bottom-up” model (Kennett et al., 2007). Time-driven ABC
simplifies the conventional ABC approach by eliminating timely and costly processes, e.g.
interviews and regular maintenance that are prone to error (Kaplan & Anderson, 2007; Max,
2007; McGowan, 2009).
It needs only two parameters for the allocation of costs, cost of resources and activity
consumption of these resources. This makes the approach far simpler, but more accurate
45
(Kennett et al., 2007). Two benefits from the ability to compute the cost of non-value adding
activities is that excess capacity can be managed and measured and unit cost variances
exclude the impact of volume against fixed cost (Kennett et al., 2007). The total direct and
indirect costs can be allocated to the different resources used to manufacture a certain
product to give a total cost per unit per resource (Kennett et al., 2007).
Updates can be performed easily to reflect changes in costs and processes. High volumes of
data can be sourced from the ERP system, which makes it more relevant and accurate than
ABC (Max, 2007; McGowan, 2009). Direct observation of time resources is used and this
can be validated by the model by means of process documentation and unused capacity can
be identified. This model allows more heterogeneity in activities, orders and customer
behaviour without the need to go and recalculate activity, product and customer costs
(Kaplan & Anderson, 2003; Kennett et al., 2007).
2.6.3. Disadvantages of Time-driven Activity-based Costing
It’s difficult and costly to extend the Time-driven ABC model to all applications of a company.
Time-driven ABC will not be suitable if there is little differentiation or complexity in work
effort, if costs are mainly fixed and if the outputs are homogeneous (Kennett et al., 2007).
When the hours can’t be projected and vary from project to project, Time–driven ABC might
also not be the answer, and a more formal time-tracking system may be required (Kennett et
al., 2007). The problem of updating or scaling the data still remains, and costly interviews
still need to take place to have accurate and relevant information (Kaplan & Anderson,
2003). The accuracy of information depends fully on the information given above.
2.6.4. Implementation of Time-driven Activity-based Costing
The resource expense can be traced to the activity by time logs, interviews, direct
observation of time spent per activity, in other words, process documentation and an ERP
system. Because Time-driven ABC is driven by process performance times instead of time
allocations, the regularity of model updates is greatly reduced. Data can be imported from
the general ledger, production schedule and customer order file, or ERP if available (Kaplan
& Anderson, 2007, Max, 2007; McGowan, 2009).
The first step to implement the Time-driven ABC model is to identify resources and the
activities that they perform (Kaplan & Anderson, 2007; Max, 2007; McGowan, 2009). To
assign the expenses of activities, rates of the cost drivers need to be calculated. This model
works well in a typical single facility or plant, especially if the company has a high investment

46
in plant and equipment. Accurate times of resource consumption are critical as activity,
process and manufacturing costs make up a huge percentage of the total cost of a product.
2.6.5. Influence of Time-driven Activity-based Costing
Previously, consultants forced their customers to choose to see either the Strategic
information from an ABC model, or operational information, but not both. According to
Kennett et al. (2007) time-driven ABC shows that both approaches, strategic and
operational, should be incorporated. Because of the “bottom-up” approach, information
gathered from the operational level (“Bottom-up” or Upside-Down model) should be used in
strategic cost analysis. ABC is embarking on the identification of the work which was
performed to get the final product (Euske & Vercio, 2007:50).
2.7. SUMMARY
The purpose of this chapter was to précis the theory of Activity-based Costing, including the
definition, advantages, disadvantages, key components, fundamentals and implementation
of the activity-driven framework will be addressed, as well as the implications and supporting
systems thereof. Activity-based Costing was developed to refine the traditional standard
costing with limited cost drivers and to assign a much truer and more realistic value to goods
and services, especially those with a high percentage of variable costs. The aim was that a
product should only carry the costs of the resources utilized, and not absorb the total running
cost based on volumes manufactured. With ABC, costs of the resources captured in the
general ledger get allocated to activities, and proportionally get allocate further down to the
cost object based on the utilization of the activity. Activity-based management is the
management of the activities in order to be more efficient, less costly and ultimate utilization
which will satisfy the customer. The main driver beyond ABC is the measurement of
products and/or services and assists in decision-making processes for management. This
can build or break a company. The information provided by ABC is only as reliable as the
source it comes from.
Unprofitable products, bottlenecks or non-value adding resources can easily be identified,
and eliminated or changed so that they can become profitable. This will come at a high price
(financially) and maintenance is crucial in the success of ABC. ABC is only beneficial if the
financial benefit outweighs the financial cost involved in implementation and maintenance
thereof. Time-driven ABC is a ‘push’ method of costing and is based on the costs of
resources and allocated according to the time it takes to complete that activity. This method
is much easier and less costly to implement and maintain than ABC.

47
The next chapter will provide an overview of the fertilizer business and ACME Fertilizer’s key
operations and processes will be discussed based on Porter’s Value Chain. The production
process of ACME Fertilizer will be mapped out and described accordingly. ACME’s current
costing methodology will be compared to the various costing methodologies followed by its
rival companies to gain a view of what the industry is doing. The results of a pilot study of
questionnaires sent to 14 similar companies will be analysed and discussed.

48
CHAPTER 3: ACME BUSINESS OPERATION -FERTILIZER
BUSINESS OVERVIEW
3.1. INTRODUCTION
This chapter serves to provide an overview of the fertilizer business, and then especially of
ACME Fertilizer’s key operations. ACME Fertilizer trades in the agricultural industry and
primarily manufactures various kinds of fertilizers which are vital to the growth and
production of different kinds of crops. Raw materials are imported and then blended into
different types of fertilizer in accordance with the specifications and requirements of
chemical engineers, farmers and agronomists.
A bill of material (BOM) is formulated to serve as the basis of ingredients or recipe for a
specific product. BOMs are formulated according to the total standard Nitrogen, Phosphorus
and Potassium (NPK) values of the raw materials of the final product. The factories can
amend or substitute products in the BOM, providing that the final analysis reflects the same
NPK values as per original BOM.
3.2. PORTER’S VALUE CHAIN
Professor Michael Porter introduced the Value Chain model during 1985 in his book ‘The
Competitive Advantage’ (Porter, 1985). The value chain is a process during which products
will gain value as they go through different activities which run at optimal levels (Fei & Isa,
2010; Porter, 1985).
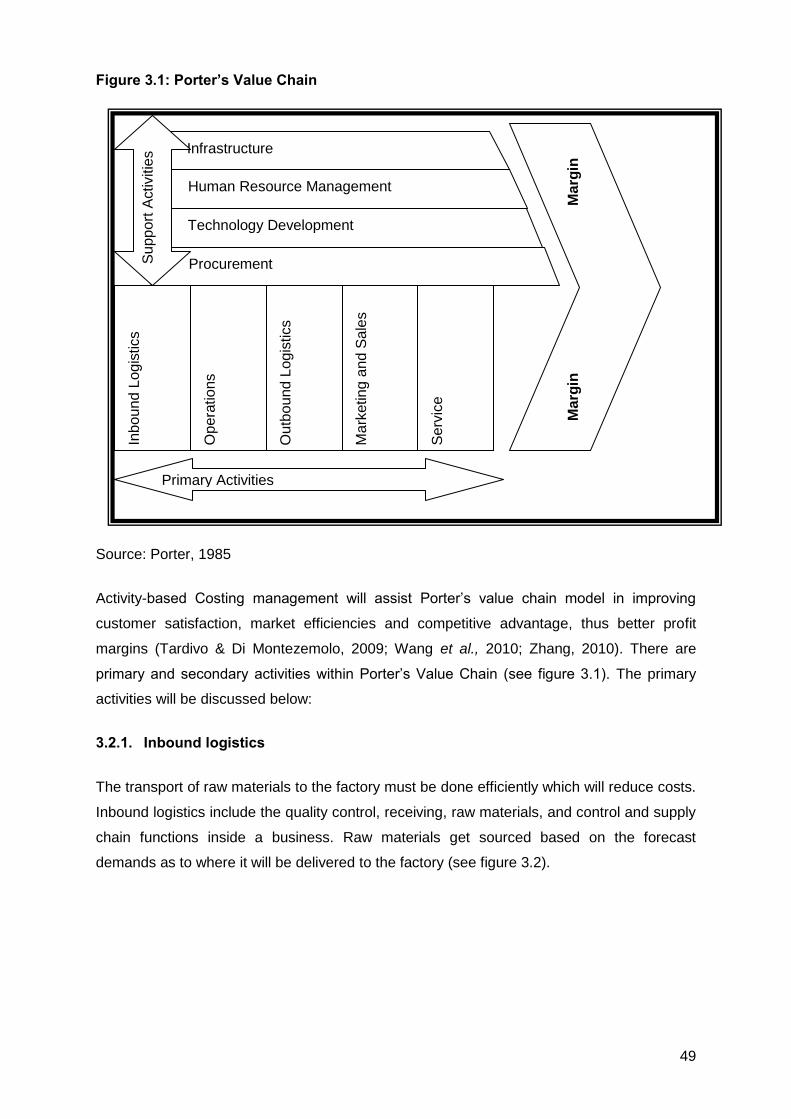
49
Figure 3.1: Porter’s Value Chain
Source: Porter, 1985
Activity-based Costing management will assist Porter’s value chain model in improving
customer satisfaction, market efficiencies and competitive advantage, thus better profit
margins (Tardivo & Di Montezemolo, 2009; Wang et al., 2010; Zhang, 2010). There are
primary and secondary activities within Porter’s Value Chain (see figure 3.1). The primary
activities will be discussed below:
3.2.1. Inbound logistics
The transport of raw materials to the factory must be done efficiently which will reduce costs.
Inbound logistics include the quality control, receiving, raw materials, and control and supply
chain functions inside a business. Raw materials get sourced based on the forecast
demands as to where it will be delivered to the factory (see figure 3.2).
Inbo
un
d L
og
istics
Op
era
tio
ns
Ou
tbo
und L
og
istics
Ma
rketin
g a
nd S
ale
s
M
arg
in
M
arg
in
Se
rvic
e
Procurement
Technology Development
Human Resource Management
Infrastructure
Primary Activities
Su
pp
ort
Activitie
s

50
Figure 3.2: Raw material ordering process
Source: Own Research
The forecast and planning model will keep track of the raw materials to be obtained, and by
when. If a raw material is needed, an order will be placed by the procurement department on
the supplier. The raw material will then be shipped/delivered to the factory.
3.2.2. Operations
Because the fertilizer industry is very seasonal, outsourced services and contract workers
will assist in keeping costs low.
Production processes (see figure 3.3): In respect of the production processes, the business
units and their accountants must see that for every type of product they manufacture, there
is a BOM in the system. The BOM gets approved by chemical engineers at the factory, who
make sure that the NPK values are up to the required standards. The BOM and its routing
(labour and overheads rate) are loaded onto the system from where the standard cost of the
final product gets calculated. The typical cost of the product is made up of:
Raw material price;
The labour and overheads, and
The transport cost to the different factories.
The BOM can be amended providing the NPK value remains unchanged. In other words,
input products can be substituted as and when required, depending on the cost and
availability of raw materials. By making use of cheaper substitute raw materials and efficient
processes a usage variance (UV) will be calculated per plant. A usage variance is the
difference between the amount of material which was actually used to make a final product
and the amount of material that was budgeted to make the final product (as per BOM).
Annually, each plant gets measured on these Usage Variance’s (UV) profit and loss results.
Sourcing
Place order
with the
Supplier
Shipped /
Delivered to
Factories
51
When all the raw materials have been blended into the final product (bagged or bulk), a
sample is taken to the laboratory for the chemical engineer to analyse and confirm that the
NPK values are true and correct. For every load of fertilizer which gets dispatched out of the
plant, a sample is kept for a set period of time, in accordance to fertilizer industry laws and
regulations.

52
Figure 3.3: Production process
Gypsum
Lime
Pipe
AMSO4
Supers
MAP
KCL
Zinc
Pipe
AMSO4
ANO
Ammonia
Koalien
Galyrol
BINS
Bagging
Plant
Loaded on
Truck
S
C
A
L
E
Bagged?
Yes No
Bags
Massa
M
E
T
E
R
Weigh-
bridge
Transferred
to depots,
other
factories or
clients
Manufacturing
Drum
Source: Own Research
The flow of the production process as per figure 3.3 is as follows:
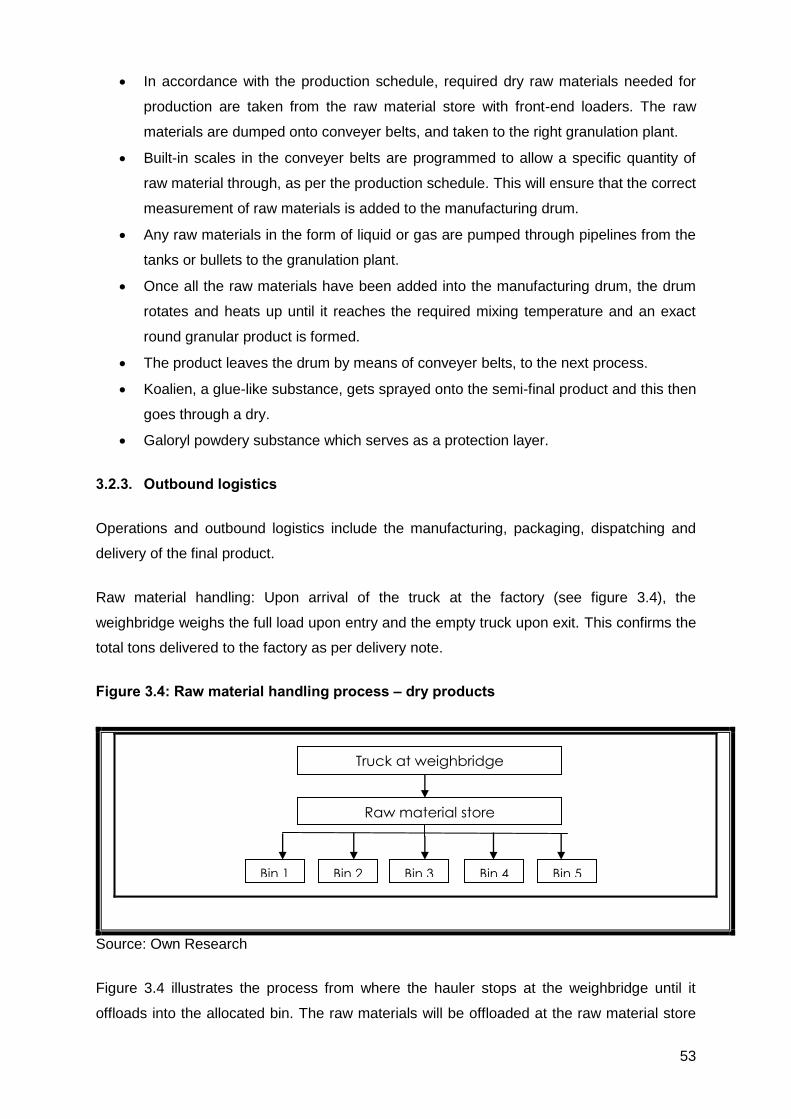
53
In accordance with the production schedule, required dry raw materials needed for
production are taken from the raw material store with front-end loaders. The raw
materials are dumped onto conveyer belts, and taken to the right granulation plant.
Built-in scales in the conveyer belts are programmed to allow a specific quantity of
raw material through, as per the production schedule. This will ensure that the correct
measurement of raw materials is added to the manufacturing drum.
Any raw materials in the form of liquid or gas are pumped through pipelines from the
tanks or bullets to the granulation plant.
Once all the raw materials have been added into the manufacturing drum, the drum
rotates and heats up until it reaches the required mixing temperature and an exact
round granular product is formed.
The product leaves the drum by means of conveyer belts, to the next process.
Koalien, a glue-like substance, gets sprayed onto the semi-final product and this then
goes through a dry.
Galoryl powdery substance which serves as a protection layer.
3.2.3. Outbound logistics
Operations and outbound logistics include the manufacturing, packaging, dispatching and
delivery of the final product.
Raw material handling: Upon arrival of the truck at the factory (see figure 3.4), the
weighbridge weighs the full load upon entry and the empty truck upon exit. This confirms the
total tons delivered to the factory as per delivery note.
Figure 3.4: Raw material handling process – dry products
Raw material store
Truck at weighbridge
Bin 5 Bin 3 Bin 2 Bin 1 Bin 4
Source: Own Research
Figure 3.4 illustrates the process from where the hauler stops at the weighbridge until it
offloads into the allocated bin. The raw materials will be offloaded at the raw material store
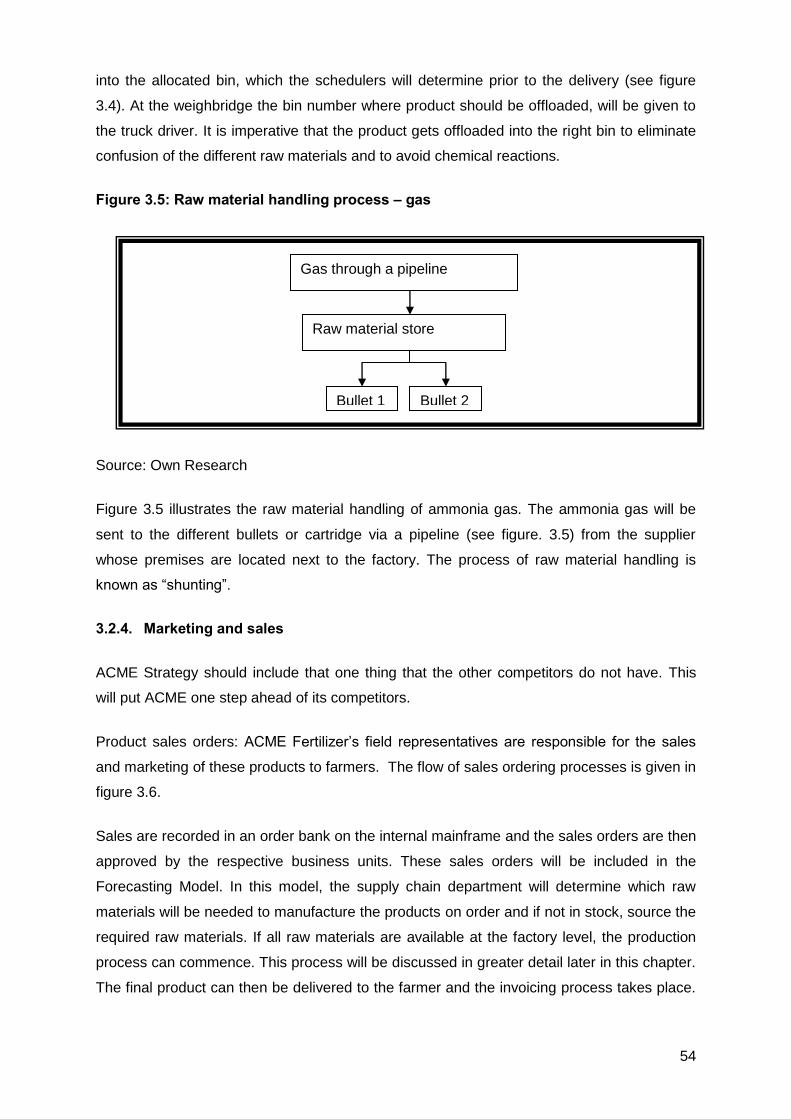
54
into the allocated bin, which the schedulers will determine prior to the delivery (see figure
3.4). At the weighbridge the bin number where product should be offloaded, will be given to
the truck driver. It is imperative that the product gets offloaded into the right bin to eliminate
confusion of the different raw materials and to avoid chemical reactions.
Figure 3.5: Raw material handling process – gas
Source: Own Research
Figure 3.5 illustrates the raw material handling of ammonia gas. The ammonia gas will be
sent to the different bullets or cartridge via a pipeline (see figure. 3.5) from the supplier
whose premises are located next to the factory. The process of raw material handling is
known as “shunting”.
3.2.4. Marketing and sales
ACME Strategy should include that one thing that the other competitors do not have. This
will put ACME one step ahead of its competitors.
Product sales orders: ACME Fertilizer’s field representatives are responsible for the sales
and marketing of these products to farmers. The flow of sales ordering processes is given in
figure 3.6.
Sales are recorded in an order bank on the internal mainframe and the sales orders are then
approved by the respective business units. These sales orders will be included in the
Forecasting Model. In this model, the supply chain department will determine which raw
materials will be needed to manufacture the products on order and if not in stock, source the
required raw materials. If all raw materials are available at the factory level, the production
process can commence. This process will be discussed in greater detail later in this chapter.
The final product can then be delivered to the farmer and the invoicing process takes place.
Raw material store
Gas through a pipeline
Bullet 2 Bullet 1

55
The farmer will receive value adding service by the support of the agronomist’s technical
knowledge even after the sale has been closed.
Figure 3.6: Sales order process
Raw Material
Purchases
Field
Representatives
Manufacturing
Process
Business Unit
Order-bank
Forecasting
Model
Client
Farmers
Value adding service
Source: Own Research
3.2.5. Service
Intended to provide training so that the employees are comfortable and can perform
optimally.
3.2.6. Secondary/support activities of the value chain
Procurement: ACME must keep up a good relationship with suppliers in order to
receive timely deliverables.
Technological development: The systems should be updated and available in
order to ensure optimal usage.
Human Resources Management: ACME must recruit the correct people for a job.
Firm Infrastructure: ACME has six different factories which are located nationally.
The support activities, for example administrative and finance infrastructure, human
resources, technology development and procurement will contribute toward the value-adding
opportunities within the primary objectives. ACME Fertilizer’s primary activities will follow.
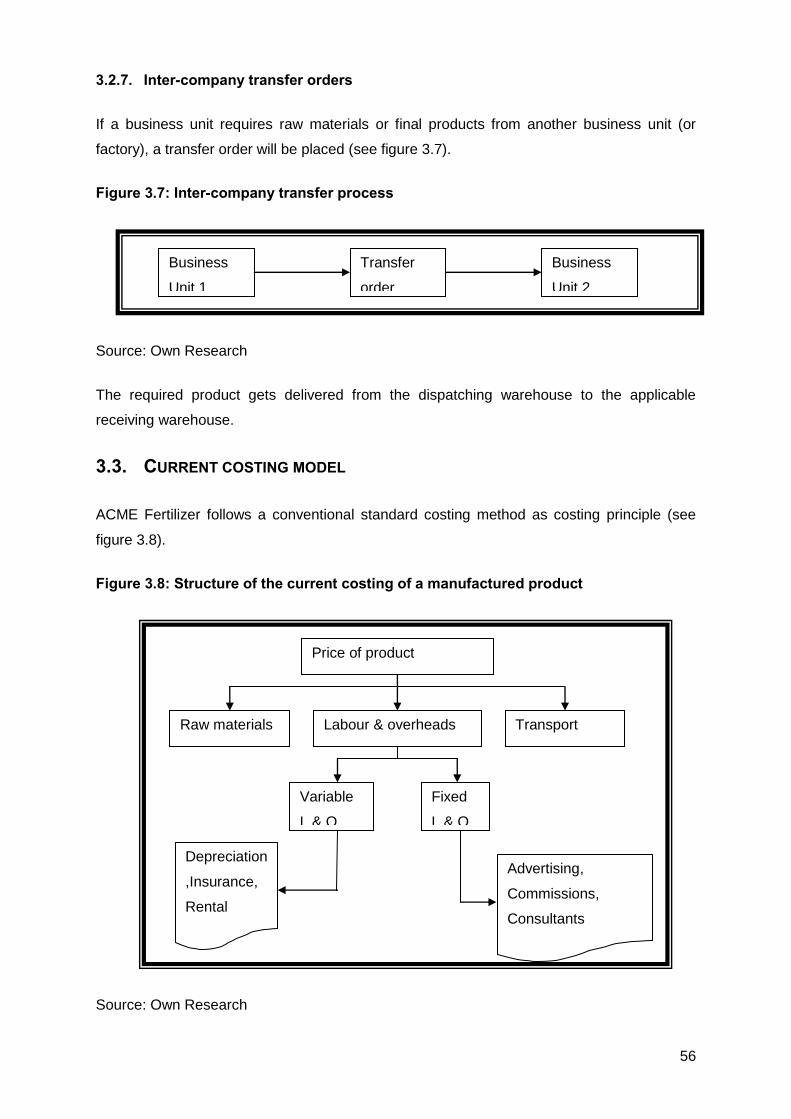
56
3.2.7. Inter-company transfer orders
If a business unit requires raw materials or final products from another business unit (or
factory), a transfer order will be placed (see figure 3.7).
Figure 3.7: Inter-company transfer process
Source: Own Research
The required product gets delivered from the dispatching warehouse to the applicable
receiving warehouse.
3.3. CURRENT COSTING MODEL
ACME Fertilizer follows a conventional standard costing method as costing principle (see
figure 3.8).
Figure 3.8: Structure of the current costing of a manufactured product
Source: Own Research
Raw materials Labour & overheads Transport
Price of product
Variable
L & O
Fixed
L & O
Advertising,
Commissions,
Consultants
Consumables
Contractors
Energy and water
Handling fees
Depreciation
,Insurance,
Rental
Salaries
Wages
Business
Unit 1
Business
Unit 2
Transfer
order
57
The total cost of a product consists of raw material price, labour cost, overheads (fixed and
variable overheads) and a transport component, as illustrated in figure 3.8. The cost of the
main raw materials used in manufacturing is based on the weighted average costs, while the
other raw materials costs get updated based on historical financial information. The current
costing system at ACME Fertilizer assumes that all processes are the same and only tracks
against budget compliance.
Costs are allocated on a single volume basis. The model assumes that all processes per
work centre consume the same activities, in the same proportions, when in fact some
products are more expensive to manufacture than others, although its manufacturing
processes are done in the same plant.
ACME Fertilizer’s senior management has little knowledge of product costing. Costing of
products is done on the assumption that it costs the same to manufacture all products.
The purpose of this study is to evaluate the current costing strategy and to compare it with
the possibility of implementing an Activity-based Costing model.
3.4. METHODOLOGIES OF RIVAL SIMILAR COMPANIES
SASOL, FOSKOR and AEL, rival companies of ACME Fertilizer costing methodologies were
researched by analysing their published annual financial statements and it was evident that
the overall costing strategies are very similar to ACME Fertilizer’s (SASOL, 2008; FOSKOR,
2009, AEL, 2008). Due to a current case being investigated by the competition commission,
it was not allowed to approach the direct competition for confidential information.
SASOL: Chemicals Storefront, one of SASOL’s business markets, provide polymers,
solvents, ammonia, nitro and other fertilizer products. Their costs include all other
costs in obtaining, manufacturing (pro rata overheads based on actual production) as
well as the transportation of all raw materials at that specific point where it currently
sits at.
FOSKOR: Foskor specializes in one element of a fertilizer, and mainly manufactures
products high in phosphates. Their manufacturing process is basic, and labour and
overhead cost on all products is the similar. They don’t include transport in their cost
of sales, because they sell all their products ex works, and their customers need to
arrange transport.
AEL: They produce mostly Nitrogen products which are used as an explosive and the
raw materials get valued through the LILO method and the final products value is
based on the weighted average cost.

58
A comparison between the costing methodologies of ACME Fertilizer’s rivals is summarized
below:
Table 3.1: Costing methods of competitors
Company Cost Object Costing Methodology
ACME Fertilizer Raw Materials LIFO / Weighted Average
ACME Fertilizer W-I-P & Finished Goods LIFO / Weighted Average
SASOL Raw Materials, WIP and Finished Goods FIFO
FOSKOR Raw Materials Weighted Average
FOSKOR W-I-P & Finished Goods Standard Costing / Actual
AEL Raw Materials FIFO
Source: Own Research
3.5. PILOT STUDY
A study was done by sending a questionnaire to fourteen (14) different companies in similar
industries, of which there was a response ratio of 71.43%. Ten (10) responded before the
deadline given. The questionnaires were hand-delivered, and the sample was chosen
conveniently. The questionnaire (see Appendix 1, p 77) contained 20 questions in total and
was categorized under the headings: “General”; “Manufacturing”; “Accounting Systems” and
“Other”. Their feedback was analysed, and a recommendation was made.
The questionnaire was sent to different companies dealing with similar processes. They
were guaranteed anonymity. The primary objective of this research method was to
determine whether there are any similar companies using ABC, and whether they were
aware of ABC. ACME Fertilizer’s direct competitors could not be included in the survey
because of the current investigation being done by the Competition Commission.
3.5.1. General
It was found that 70% of the companies who participated were within the FMCG industry and
were familiar with Activity-based Costing. 50% of the respondents felt that their top
management could be convinced to consider ABC. Not one of the 10 conveniently sampled
companies has implemented ABC, and 30% was certain that their Senior Management
would consider implementation. Half of the participant companies confirmed that they are
aware of non-value adding activities in their manufacturing processes. They were all
exchange-rate sensitive.
59
3.5.2. Manufacturing
BOMs are used in 60% of the companies. Most of the companies change their cost of sales
quarterly (40%) and/or per purchase (40%). ACME Fertilizer’s strategy about not having
different labour and overhead rates for different products was also followed by 60% of the
companies, although all of the participating companies’ management were concerned about
managing these costs. Only 20% of the participating companies could say that they were in
control and their current processes work very well.
3.5.3. Accounting system
All the companies represented by respondents said that their company had a chart of
accounts. 90% of these companies have sub-accounts set up in their ledger and only 50% of
the companies’ accounting systems had a project cost general ledger where all the
expenditures can be recorded per project.
The recommendation regarding this study is that ACME Fertilizer’s general costing strategy
was in line with similar successful companies, but they need to consider a new way of
thinking to get a competitive advantage in the market. ABC is a very good starting point in
achieving their competitive advantage. If ABC can be implemented and managed in ACME
Fertilizer, it may have huge advantages to follow. To prove this, a case study will be
conducted in chapter 4.
3.6. FACTORS WHICH CAN INFLUENCE COSTS OF DIFFERENT PRODUCTS
In today’s global economy, especially with commodity prices, supply and demand, there can
be major fluctuations in the price of raw materials. The risk of vessel piracy increases the
insurance costs on vessels, which directly influence the cost of raw materials (see figure
3.9). The volatile market needs some security to manage economic risks, for example,
hedging of funds, contracts and exchange rates, insurance premiums, economies of scale
and minimising the stock by following a J-I-T stock management system.
Examples of the main raw materials used in manufacturing with drastic price increases over
the past few months include DAP, MAP, ammonium sulphate, potassium sulphate, rock
phosphate, etc.

60
Figure 3.9: Average raw material costs
Average Raw Material Price
R 0.00R 1,000.00R 2,000.00R 3,000.00R 4,000.00R 5,000.00R 6,000.00R 7,000.00R 8,000.00R 9,000.00
R 10,000.00
Jun 0
6
Aug 0
6
Oct
06
Dec 0
6
Feb 0
7
Apr
07
Jun 0
7
Aug 0
7
Oct
07
Dec 0
7
Feb 0
8
Apr
08
Jun 0
8
Date
R /
To
n
Urea
DAP
MOP (KCl)
NH3 (Yuzny)
R / $
Actual NH3
Source: FMB STATS via e-mail on 18 July 2008.
3.7. SUMMARY
The purpose of this chapter is to provide an overview of the fertilizer business and ACME
Fertilizer’s key operations and processes are discussed based on Porter’s value chain. The
production process of ACME Fertilizer is mapped out and described accordingly. ACME’s
current costing methodology is compared to the various costing methodologies followed by
its rival companies to get a view of what the industry is doing. The results of a pilot study of
questionnaires sent to 14 similar companies will be analysed and discussed.
ACME Fertilizer needs to broaden its ways of thinking and doing things. With reference to
Michael Porter’s value chain ACME Fertilizer’s primary activities can be identified under the
inbound logistics (raw material purchasing and procurement), operation, outbound logistics
(raw material handling and production processes), sales and marketing (product sales
orders and inter-company transfer orders) and servicing (extra value-added service of
assisting farmers for the whole farming season, and not only selling the fertilizer) (Walters &
Lancaster, 2000). By cutting the unnecessary or non-value adding activities and costs, they
can gain a competitive advantage in this extremely volatile and competitive industry. Proper
planning is of crucial importance to contribute to successful stock and cost management.
Every expense incurred should be adding value to the processes and products. If ACME
Fertilizer can manage to do that, they will be a step ahead of their competitors.

61
With the pilot study (see Appendix 1, p 77), 14 companies were conveniently sampled and
questionnaires were completed by an employee of 10 of the 14 companies. It was evident
that most of the companies know what ABC is, or have heard about it before, but none has
implemented it yet. Half of the respondents knew that there was space for improvement by
eliminating the non-value adding activities. The general feeling which was gained through
this pilot study is that companies are very interested in ABC, but because it is outside their
paradigm, they are too scared to consider. The effect of the possibility of implementing
costing system driven by activities will be done by means of a case study in Chapter 4.
The next chapter will include the empirical study, with one scenario, but from two different
perspectives. The cost of the final products will be calculated following the traditional
Standard Costing method and then by following ABC steps. The results will be analysed and
recommendations will be made based on the results of the two different methodologies.
62
CHAPTER 4: EMPIRICAL CASE STUDY BASED ON
ACTIVITY-BASED COSTING VS. THE CURRENT
STANDARD COSTING METHOD
4.1. INTRODUCTION
The main purpose of this chapter is to look at one scenario, but from two different
perspectives. Firstly, the cost of the different products is calculated, where the results based
on the current standard method which ACME Fertilizer follow and secondly the proposed
ABC method will be compared to the aforementioned results. After the results have been
analysed, recommendations will be made.
4.2. EMPIRICAL CASE STUDY
There are a few good reasons why ACME Fertilizer should look at the option of
implementing ABC. The production process can be mapped out and alternative options can
be identified. Product cost can reflect the true cost of the process of manufacturing. It will
reflect the maximum cost (overhead) per product. By eliminating the non-value adding
activities or resources, money can be saved and the remaining resources will be allocated
more accurately to maximize optimal utilization. ABC reflects a more accurate way of costing
a product, which means that full cost recovery may be achieved and the visibility of the cost
traced to each product. Unprofitable products can be discontinued while focussing on those
that are profitable. ABC should therefore help ACME management in making better business
and financial decisions.
For the purpose of this study, the assumption is made that ACME Fertilizer manufactures 6
different fertilizers; product 1, product 2, product 3, product 4, product 5 and product 6. Raw
materials are imported or sourced from local suppliers, based on the forecast given by the
planning and forecasting model managed by the Planning - and Procurement department
within ACME Fertilizer. Another assumption is that the budgeted demand in tons is correct
and true, and that the overheads will remain unchanged for both scenarios. Rounding errors
may occur in the calculations.
4.2.1. Product demand
According to the planning and forecasting model, the demand in tons for the 6 different
products is given in table 4.1.
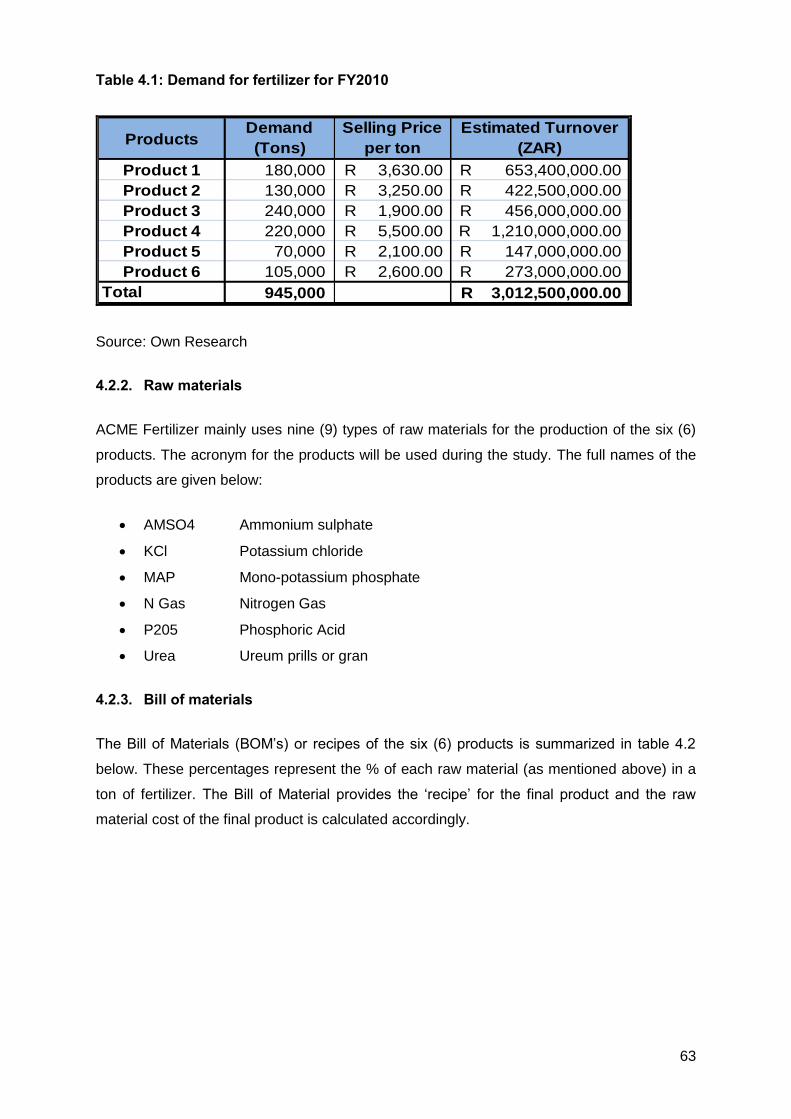
63
Table 4.1: Demand for fertilizer for FY2010
ProductsDemand
(Tons)
Estimated
Selling Price
per ton
Estimated Turnover
(ZAR)
Product 1 180,000 3,630.00R 653,400,000.00R
Product 2 130,000 3,250.00R 422,500,000.00R
Product 3 240,000 1,900.00R 456,000,000.00R
Product 4 220,000 5,500.00R 1,210,000,000.00R
Product 5 70,000 2,100.00R 147,000,000.00R
Product 6 105,000 2,600.00R 273,000,000.00R
Total 945,000 3,012,500,000.00R
Source: Own Research
4.2.2. Raw materials
ACME Fertilizer mainly uses nine (9) types of raw materials for the production of the six (6)
products. The acronym for the products will be used during the study. The full names of the
products are given below:
AMSO4 Ammonium sulphate
KCl Potassium chloride
MAP Mono-potassium phosphate
N Gas Nitrogen Gas
P205 Phosphoric Acid
Urea Ureum prills or gran
4.2.3. Bill of materials
The Bill of Materials (BOM’s) or recipes of the six (6) products is summarized in table 4.2
below. These percentages represent the % of each raw material (as mentioned above) in a
ton of fertilizer. The Bill of Material provides the ‘recipe’ for the final product and the raw
material cost of the final product is calculated accordingly.
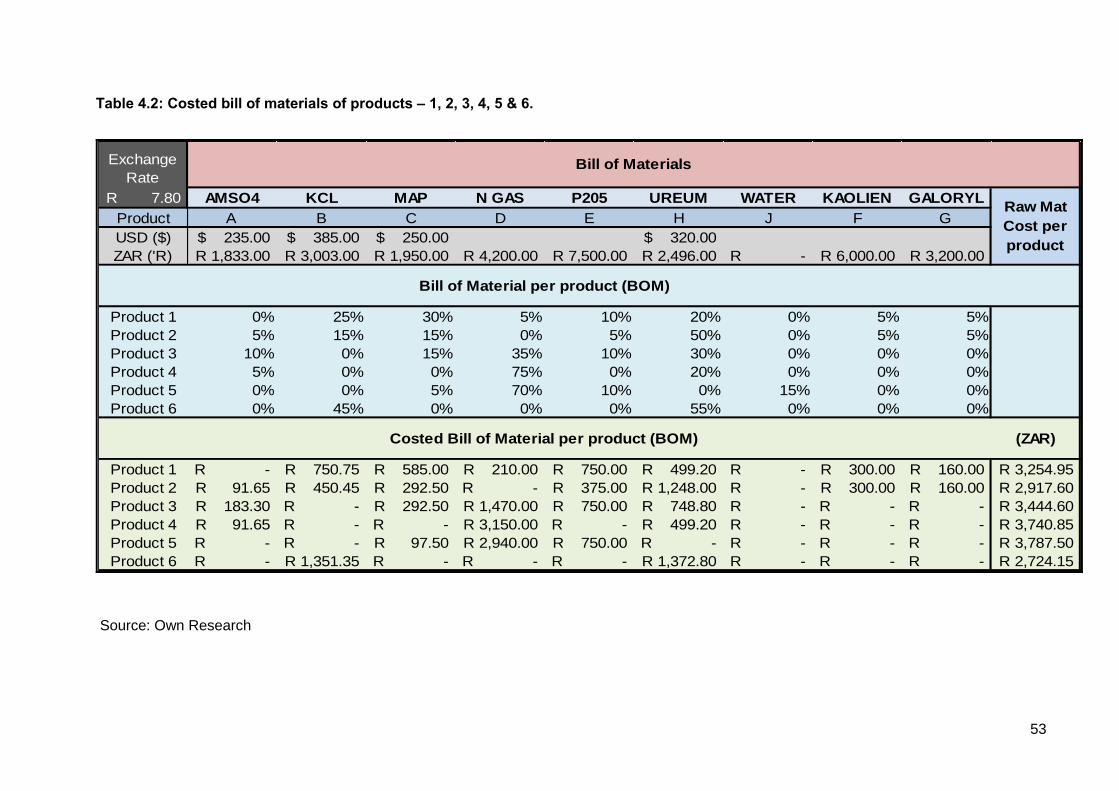
53
Table 4.2: Costed bill of materials of products – 1, 2, 3, 4, 5 & 6.
Exchange
Rate
7.80R AMSO4 KCL MAP N GAS P205 UREUM WATER KAOLIEN GALORYL
Product A B C D E H J F G
USD ($) 235.00$ 385.00$ 250.00$ 320.00$
ZAR ('R) 1,833.00R 3,003.00R 1,950.00R 4,200.00R 7,500.00R 2,496.00R -R 6,000.00R 3,200.00R
Product 1 0% 25% 30% 5% 10% 20% 0% 5% 5%
Product 2 5% 15% 15% 0% 5% 50% 0% 5% 5%
Product 3 10% 0% 15% 35% 10% 30% 0% 0% 0%
Product 4 5% 0% 0% 75% 0% 20% 0% 0% 0%
Product 5 0% 0% 5% 70% 10% 0% 15% 0% 0%
Product 6 0% 45% 0% 0% 0% 55% 0% 0% 0%
(ZAR)
Product 1 -R 750.75R 585.00R 210.00R 750.00R 499.20R -R 300.00R 160.00R 3,254.95R
Product 2 91.65R 450.45R 292.50R -R 375.00R 1,248.00R -R 300.00R 160.00R 2,917.60R
Product 3 183.30R -R 292.50R 1,470.00R 750.00R 748.80R -R -R -R 3,444.60R
Product 4 91.65R -R -R 3,150.00R -R 499.20R -R -R -R 3,740.85R
Product 5 -R -R 97.50R 2,940.00R 750.00R -R -R -R -R 3,787.50R
Product 6 -R 1,351.35R -R -R -R 1,372.80R -R -R -R 2,724.15R
Bill of Material per product (BOM)
Costed Bill of Material per product (BOM)
Raw Mat
Cost per
product
Bill of Materials
Source: Own Research
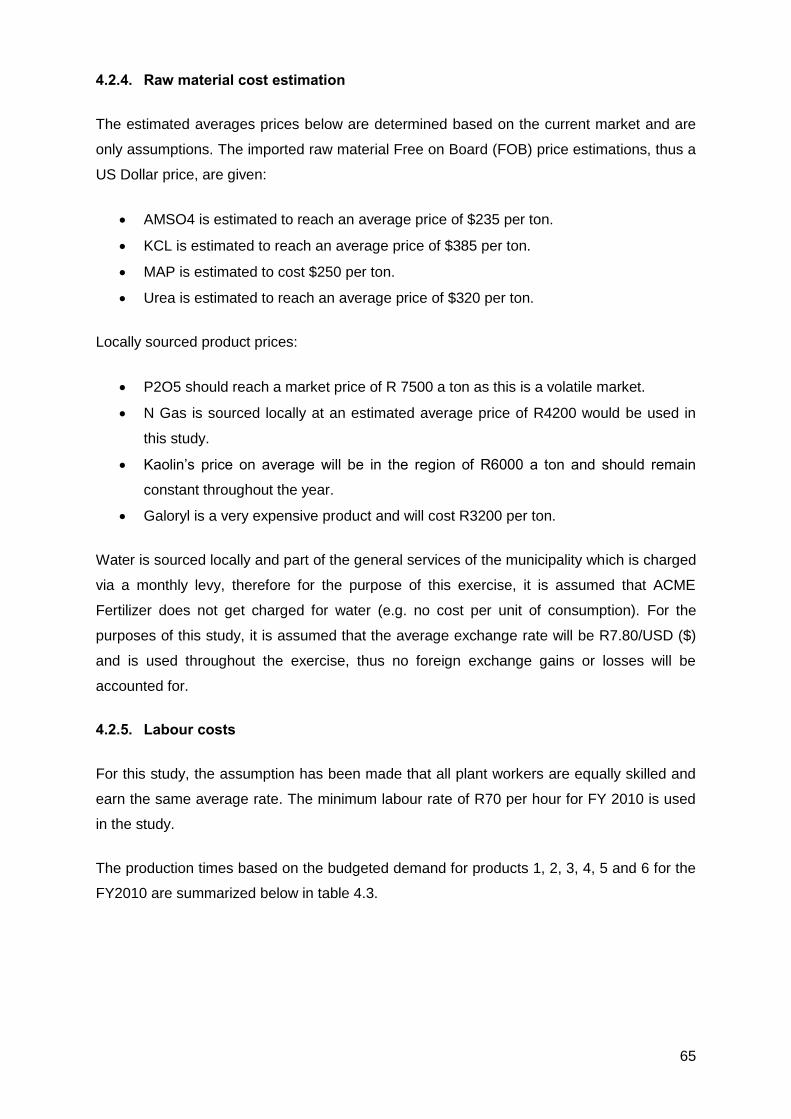
65
4.2.4. Raw material cost estimation
The estimated averages prices below are determined based on the current market and are
only assumptions. The imported raw material Free on Board (FOB) price estimations, thus a
US Dollar price, are given:
AMSO4 is estimated to reach an average price of $235 per ton.
KCL is estimated to reach an average price of $385 per ton.
MAP is estimated to cost $250 per ton.
Urea is estimated to reach an average price of $320 per ton.
Locally sourced product prices:
P2O5 should reach a market price of R 7500 a ton as this is a volatile market.
N Gas is sourced locally at an estimated average price of R4200 would be used in
this study.
Kaolin’s price on average will be in the region of R6000 a ton and should remain
constant throughout the year.
Galoryl is a very expensive product and will cost R3200 per ton.
Water is sourced locally and part of the general services of the municipality which is charged
via a monthly levy, therefore for the purpose of this exercise, it is assumed that ACME
Fertilizer does not get charged for water (e.g. no cost per unit of consumption). For the
purposes of this study, it is assumed that the average exchange rate will be R7.80/USD ($)
and is used throughout the exercise, thus no foreign exchange gains or losses will be
accounted for.
4.2.5. Labour costs
For this study, the assumption has been made that all plant workers are equally skilled and
earn the same average rate. The minimum labour rate of R70 per hour for FY 2010 is used
in the study.
The production times based on the budgeted demand for products 1, 2, 3, 4, 5 and 6 for the
FY2010 are summarized below in table 4.3.
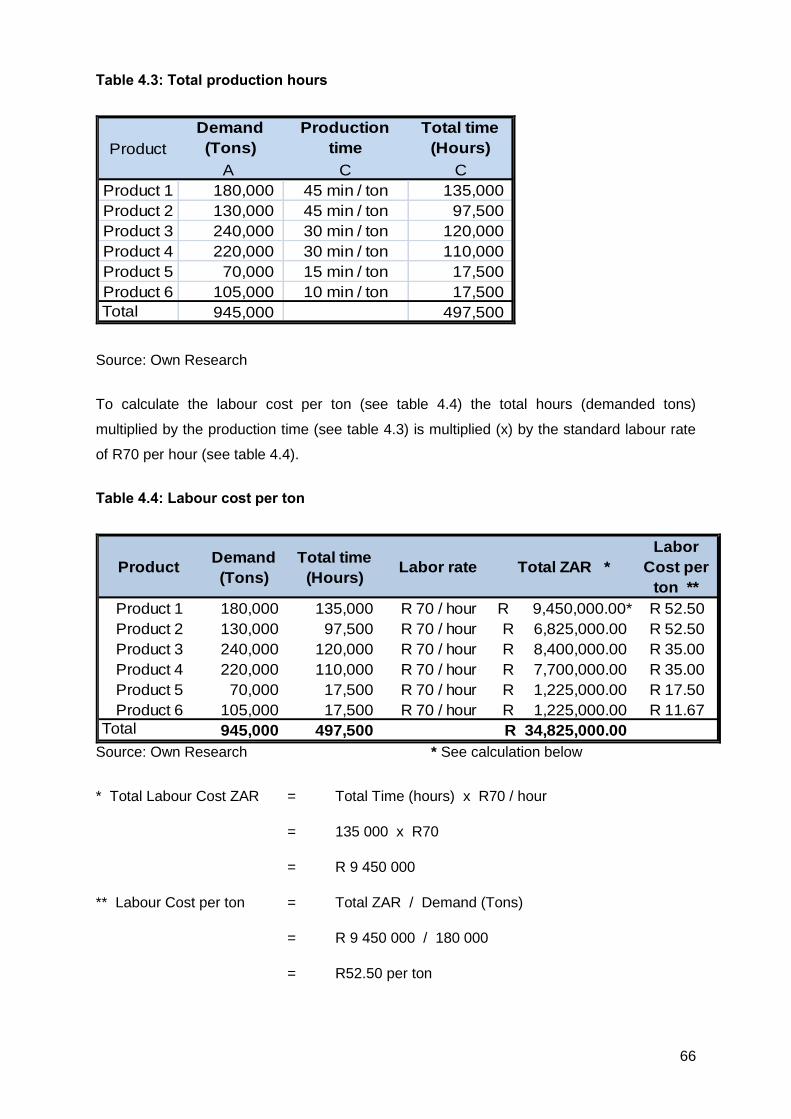
66
Table 4.3: Total production hours
Demand
(Tons)
Production
time
Total time
(Hours)
A C C
Product 1 180,000 45 min / ton 135,000
Product 2 130,000 45 min / ton 97,500
Product 3 240,000 30 min / ton 120,000
Product 4 220,000 30 min / ton 110,000
Product 5 70,000 15 min / ton 17,500
Product 6 105,000 10 min / ton 17,500
Total 945,000 497,500
Product
Source: Own Research
To calculate the labour cost per ton (see table 4.4) the total hours (demanded tons)
multiplied by the production time (see table 4.3) is multiplied (x) by the standard labour rate
of R70 per hour (see table 4.4).
Table 4.4: Labour cost per ton
ProductDemand
(Tons)
Total time
(Hours)Labor rate Total ZAR *
Labor
Cost per
ton **
Product 1 180,000 135,000 R 70 / hour R 9,450,000.00* R 52.50
Product 2 130,000 97,500 R 70 / hour 6,825,000.00R R 52.50
Product 3 240,000 120,000 R 70 / hour 8,400,000.00R R 35.00
Product 4 220,000 110,000 R 70 / hour 7,700,000.00R R 35.00
Product 5 70,000 17,500 R 70 / hour 1,225,000.00R R 17.50
Product 6 105,000 17,500 R 70 / hour 1,225,000.00R R 11.67
Total 945,000 497,500 34,825,000.00R
Source: Own Research * See calculation below
* Total Labour Cost ZAR = Total Time (hours) x R70 / hour
= 135 000 x R70
= R 9 450 000
** Labour Cost per ton = Total ZAR / Demand (Tons)
= R 9 450 000 / 180 000
= R52.50 per ton
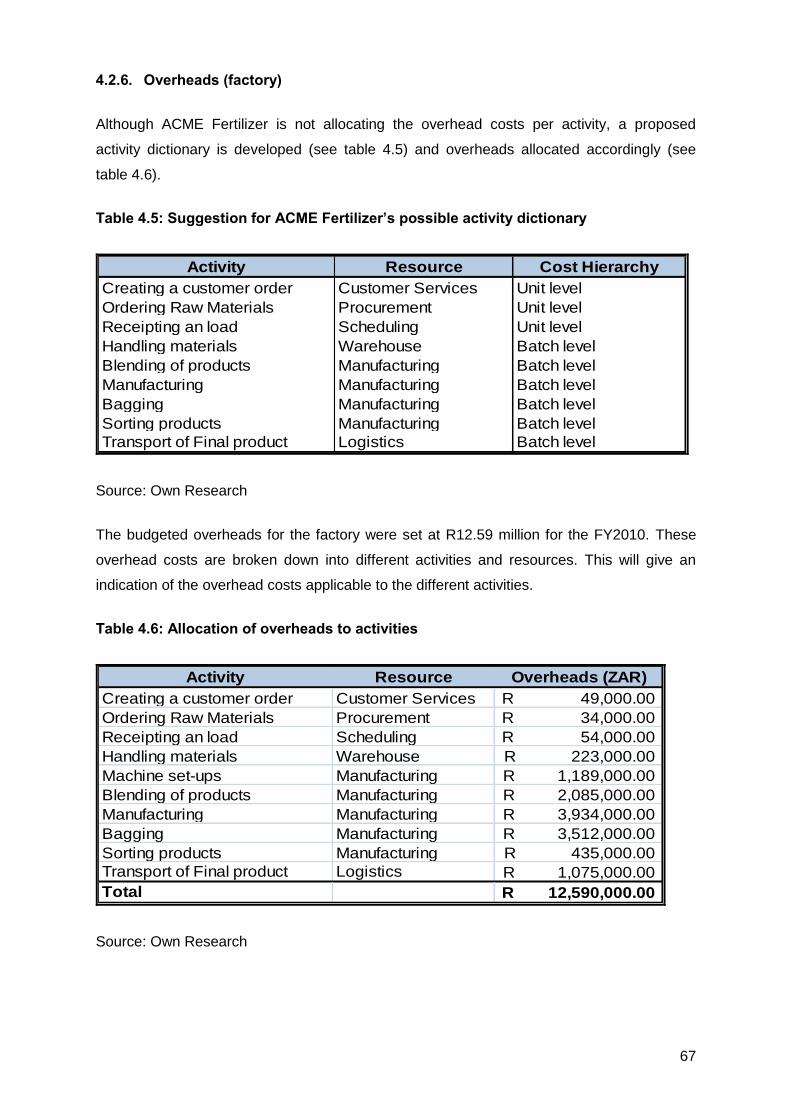
67
4.2.6. Overheads (factory)
Although ACME Fertilizer is not allocating the overhead costs per activity, a proposed
activity dictionary is developed (see table 4.5) and overheads allocated accordingly (see
table 4.6).
Table 4.5: Suggestion for ACME Fertilizer’s possible activity dictionary
Activity Resource Cost Hierarchy
Creating a customer order Customer Services Unit level
Ordering Raw Materials Procurement Unit level
Receipting an load Scheduling Unit level
Handling materials Warehouse Batch level
Blending of products Manufacturing Batch level
Manufacturing Manufacturing Batch level
Bagging Manufacturing Batch level
Sorting products Manufacturing Batch level
Transport of Final product Logistics Batch level
Source: Own Research
The budgeted overheads for the factory were set at R12.59 million for the FY2010. These
overhead costs are broken down into different activities and resources. This will give an
indication of the overhead costs applicable to the different activities.
Table 4.6: Allocation of overheads to activities
Activity Resource Overheads (ZAR)
Creating a customer order Customer Services 49,000.00R
Ordering Raw Materials Procurement 34,000.00R
Receipting an load Scheduling 54,000.00R
Handling materials Warehouse 223,000.00R
Machine set-ups Manufacturing 1,189,000.00R
Blending of products Manufacturing 2,085,000.00R
Manufacturing Manufacturing 3,934,000.00R
Bagging Manufacturing 3,512,000.00R
Sorting products Manufacturing 435,000.00R
Transport of Final product Logistics 1,075,000.00R
Total 12,590,000.00R
Source: Own Research
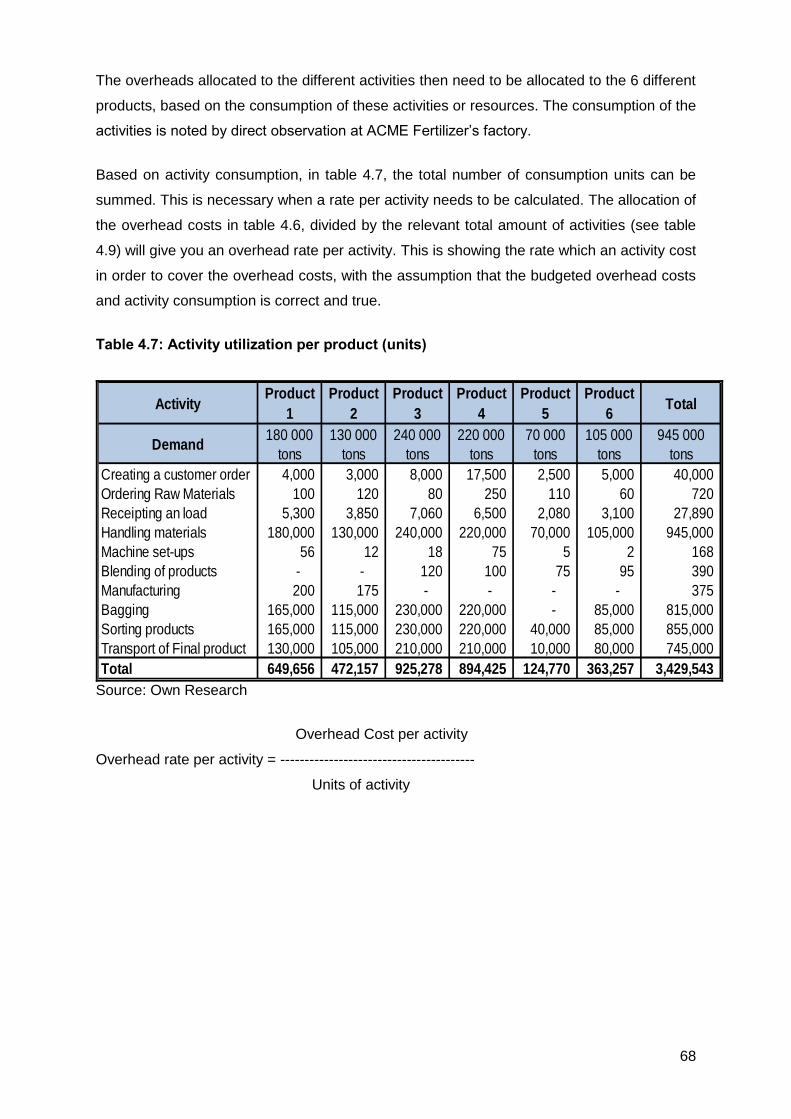
68
The overheads allocated to the different activities then need to be allocated to the 6 different
products, based on the consumption of these activities or resources. The consumption of the
activities is noted by direct observation at ACME Fertilizer’s factory.
Based on activity consumption, in table 4.7, the total number of consumption units can be
summed. This is necessary when a rate per activity needs to be calculated. The allocation of
the overhead costs in table 4.6, divided by the relevant total amount of activities (see table
4.9) will give you an overhead rate per activity. This is showing the rate which an activity cost
in order to cover the overhead costs, with the assumption that the budgeted overhead costs
and activity consumption is correct and true.
Table 4.7: Activity utilization per product (units)
ActivityProduct
1
Product
2
Product
3
Product
4
Product
5
Product
6Total
Demand180 000
tons
130 000
tons
240 000
tons
220 000
tons
70 000
tons
105 000
tons
945 000
tons
Creating a customer order 4,000 3,000 8,000 17,500 2,500 5,000 40,000
Ordering Raw Materials 100 120 80 250 110 60 720
Receipting an load 5,300 3,850 7,060 6,500 2,080 3,100 27,890
Handling materials 180,000 130,000 240,000 220,000 70,000 105,000 945,000
Machine set-ups 56 12 18 75 5 2 168
Blending of products - - 120 100 75 95 390
Manufacturing 200 175 - - - - 375
Bagging 165,000 115,000 230,000 220,000 - 85,000 815,000
Sorting products 165,000 115,000 230,000 220,000 40,000 85,000 855,000
Transport of Final product 130,000 105,000 210,000 210,000 10,000 80,000 745,000
Total 649,656 472,157 925,278 894,425 124,770 363,257 3,429,543
Source: Own Research
Overhead Cost per activity
Overhead rate per activity = ----------------------------------------
Units of activity
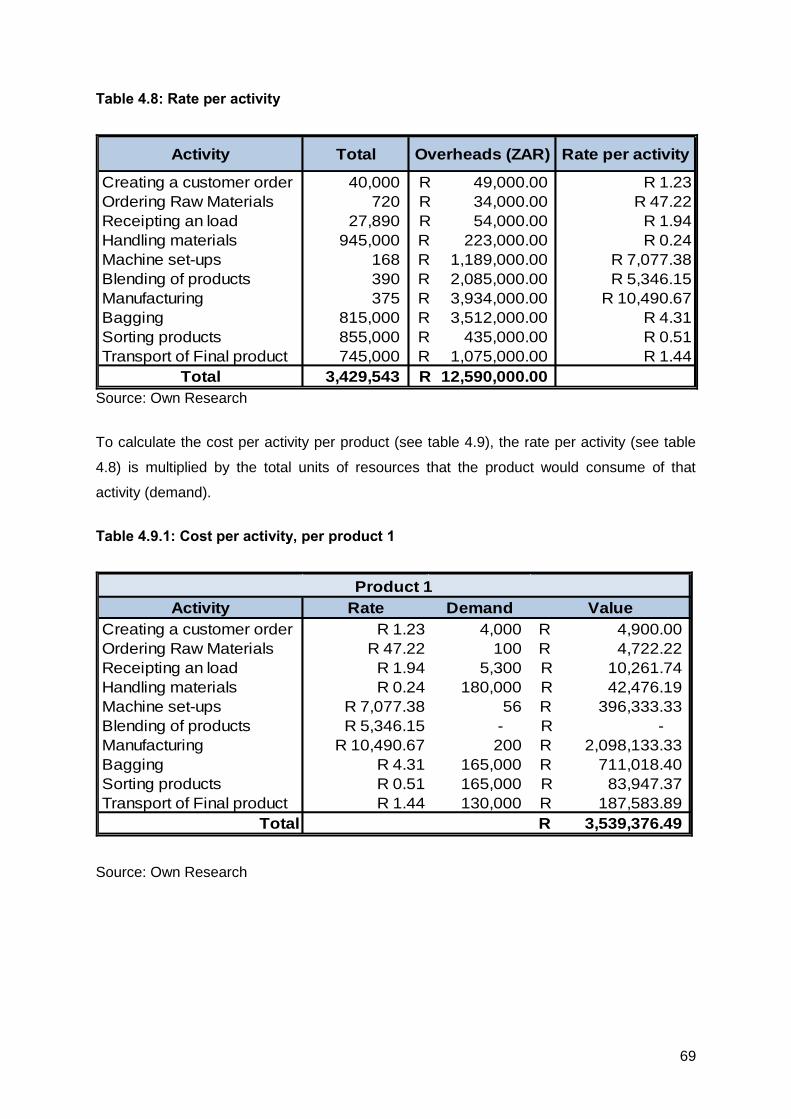
69
Table 4.8: Rate per activity
Activity Total Overheads (ZAR) Rate per activity
Creating a customer order 40,000 49,000.00R R 1.23
Ordering Raw Materials 720 34,000.00R R 47.22
Receipting an load 27,890 54,000.00R R 1.94
Handling materials 945,000 223,000.00R R 0.24
Machine set-ups 168 1,189,000.00R R 7,077.38
Blending of products 390 2,085,000.00R R 5,346.15
Manufacturing 375 3,934,000.00R R 10,490.67
Bagging 815,000 3,512,000.00R R 4.31
Sorting products 855,000 435,000.00R R 0.51
Transport of Final product 745,000 1,075,000.00R R 1.44
Total 3,429,543 12,590,000.00R
Source: Own Research
To calculate the cost per activity per product (see table 4.9), the rate per activity (see table
4.8) is multiplied by the total units of resources that the product would consume of that
activity (demand).
Table 4.9.1: Cost per activity, per product 1
Activity Rate Demand Value
Creating a customer order R 1.23 4,000 4,900.00R
Ordering Raw Materials R 47.22 100 4,722.22R
Receipting an load R 1.94 5,300 10,261.74R
Handling materials R 0.24 180,000 42,476.19R
Machine set-ups R 7,077.38 56 396,333.33R
Blending of products R 5,346.15 - -R
Manufacturing R 10,490.67 200 2,098,133.33R
Bagging R 4.31 165,000 711,018.40R
Sorting products R 0.51 165,000 83,947.37R
Transport of Final product R 1.44 130,000 187,583.89R
Total 3,539,376.49R
Product 1
Source: Own Research
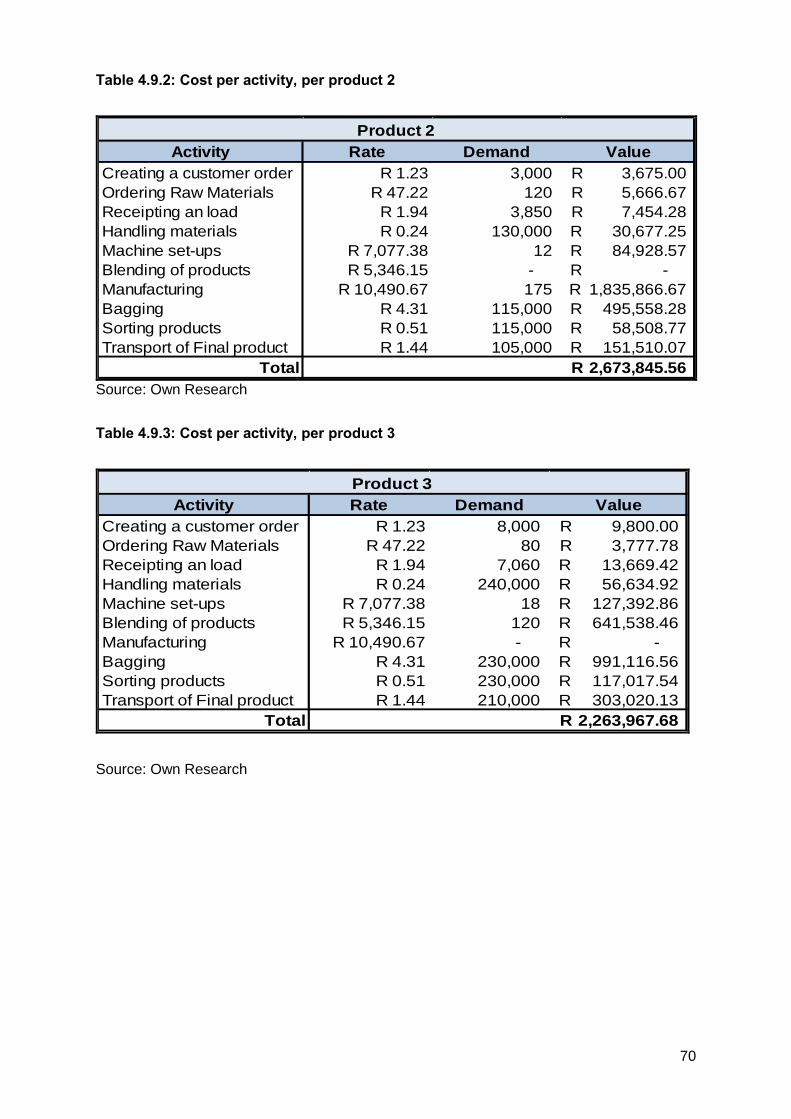
70
Table 4.9.2: Cost per activity, per product 2
Activity Rate Demand Value
Creating a customer order R 1.23 3,000 3,675.00R
Ordering Raw Materials R 47.22 120 5,666.67R
Receipting an load R 1.94 3,850 7,454.28R
Handling materials R 0.24 130,000 30,677.25R
Machine set-ups R 7,077.38 12 84,928.57R
Blending of products R 5,346.15 - -R
Manufacturing R 10,490.67 175 1,835,866.67R
Bagging R 4.31 115,000 495,558.28R
Sorting products R 0.51 115,000 58,508.77R
Transport of Final product R 1.44 105,000 151,510.07R
Total 2,673,845.56R
Product 2
Source: Own Research
Table 4.9.3: Cost per activity, per product 3
Activity Rate Demand Value
Creating a customer order R 1.23 8,000 9,800.00R
Ordering Raw Materials R 47.22 80 3,777.78R
Receipting an load R 1.94 7,060 13,669.42R
Handling materials R 0.24 240,000 56,634.92R
Machine set-ups R 7,077.38 18 127,392.86R
Blending of products R 5,346.15 120 641,538.46R
Manufacturing R 10,490.67 - -R
Bagging R 4.31 230,000 991,116.56R
Sorting products R 0.51 230,000 117,017.54R
Transport of Final product R 1.44 210,000 303,020.13R
Total 2,263,967.68R
Product 3
Source: Own Research
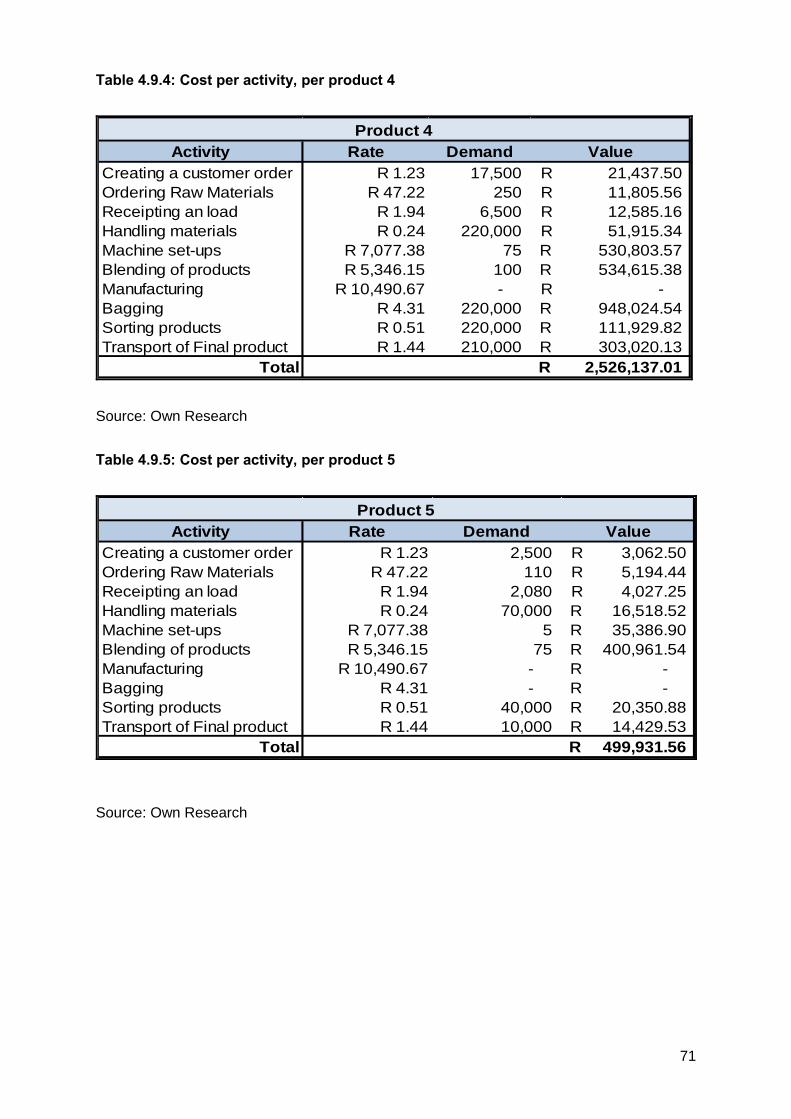
71
Table 4.9.4: Cost per activity, per product 4
Activity Rate Demand Value
Creating a customer order R 1.23 17,500 21,437.50R
Ordering Raw Materials R 47.22 250 11,805.56R
Receipting an load R 1.94 6,500 12,585.16R
Handling materials R 0.24 220,000 51,915.34R
Machine set-ups R 7,077.38 75 530,803.57R
Blending of products R 5,346.15 100 534,615.38R
Manufacturing R 10,490.67 - -R
Bagging R 4.31 220,000 948,024.54R
Sorting products R 0.51 220,000 111,929.82R
Transport of Final product R 1.44 210,000 303,020.13R
Total 2,526,137.01R
Product 4
Source: Own Research
Table 4.9.5: Cost per activity, per product 5
Activity Rate Demand Value
Creating a customer order R 1.23 2,500 3,062.50R
Ordering Raw Materials R 47.22 110 5,194.44R
Receipting an load R 1.94 2,080 4,027.25R
Handling materials R 0.24 70,000 16,518.52R
Machine set-ups R 7,077.38 5 35,386.90R
Blending of products R 5,346.15 75 400,961.54R
Manufacturing R 10,490.67 - -R
Bagging R 4.31 - -R
Sorting products R 0.51 40,000 20,350.88R
Transport of Final product R 1.44 10,000 14,429.53R
Total 499,931.56R
Product 5
Source: Own Research
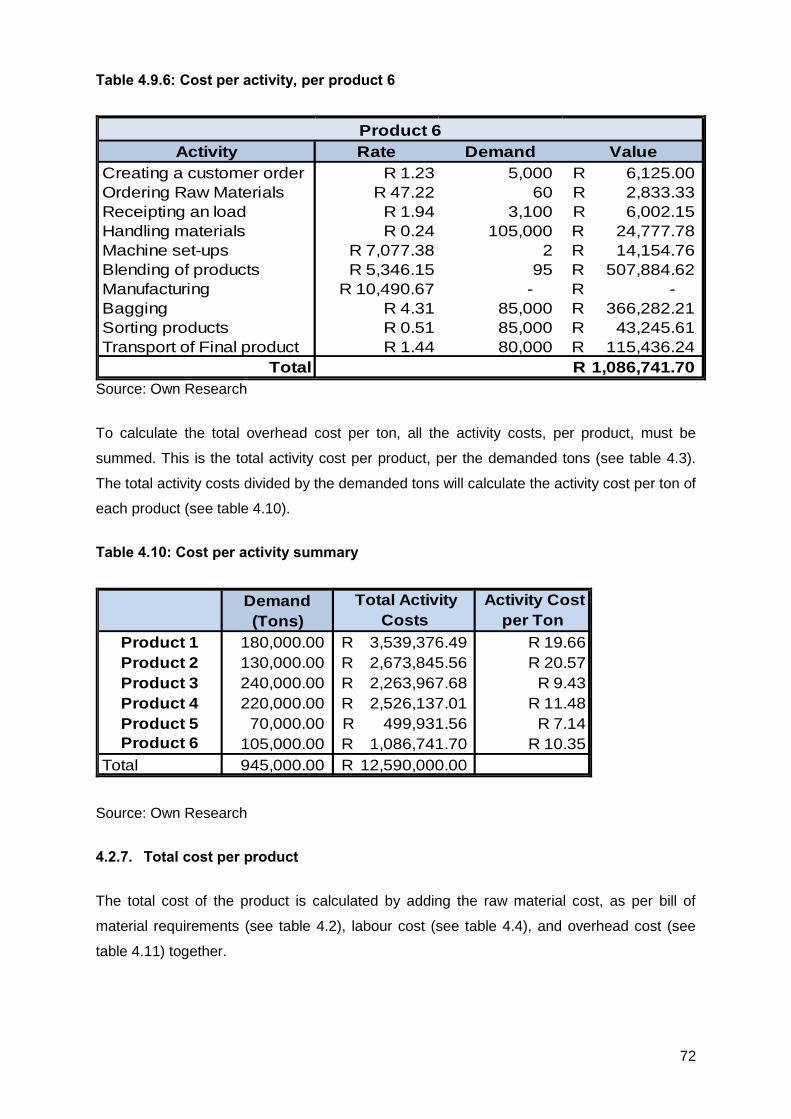
72
Table 4.9.6: Cost per activity, per product 6
Activity Rate Demand Value
Creating a customer order R 1.23 5,000 6,125.00R
Ordering Raw Materials R 47.22 60 2,833.33R
Receipting an load R 1.94 3,100 6,002.15R
Handling materials R 0.24 105,000 24,777.78R
Machine set-ups R 7,077.38 2 14,154.76R
Blending of products R 5,346.15 95 507,884.62R
Manufacturing R 10,490.67 - -R
Bagging R 4.31 85,000 366,282.21R
Sorting products R 0.51 85,000 43,245.61R
Transport of Final product R 1.44 80,000 115,436.24R
Total 1,086,741.70R
Product 6
Source: Own Research
To calculate the total overhead cost per ton, all the activity costs, per product, must be
summed. This is the total activity cost per product, per the demanded tons (see table 4.3).
The total activity costs divided by the demanded tons will calculate the activity cost per ton of
each product (see table 4.10).
Table 4.10: Cost per activity summary
Demand
(Tons)
Total Activity
Costs
Activity Cost
per Ton
Product 1 180,000.00 3,539,376.49R R 19.66
Product 2 130,000.00 2,673,845.56R R 20.57
Product 3 240,000.00 2,263,967.68R R 9.43
Product 4 220,000.00 2,526,137.01R R 11.48
Product 5 70,000.00 499,931.56R R 7.14
Product 6 105,000.00 1,086,741.70R R 10.35
Total 945,000.00 12,590,000.00R
Source: Own Research
4.2.7. Total cost per product
The total cost of the product is calculated by adding the raw material cost, as per bill of
material requirements (see table 4.2), labour cost (see table 4.4), and overhead cost (see
table 4.11) together.
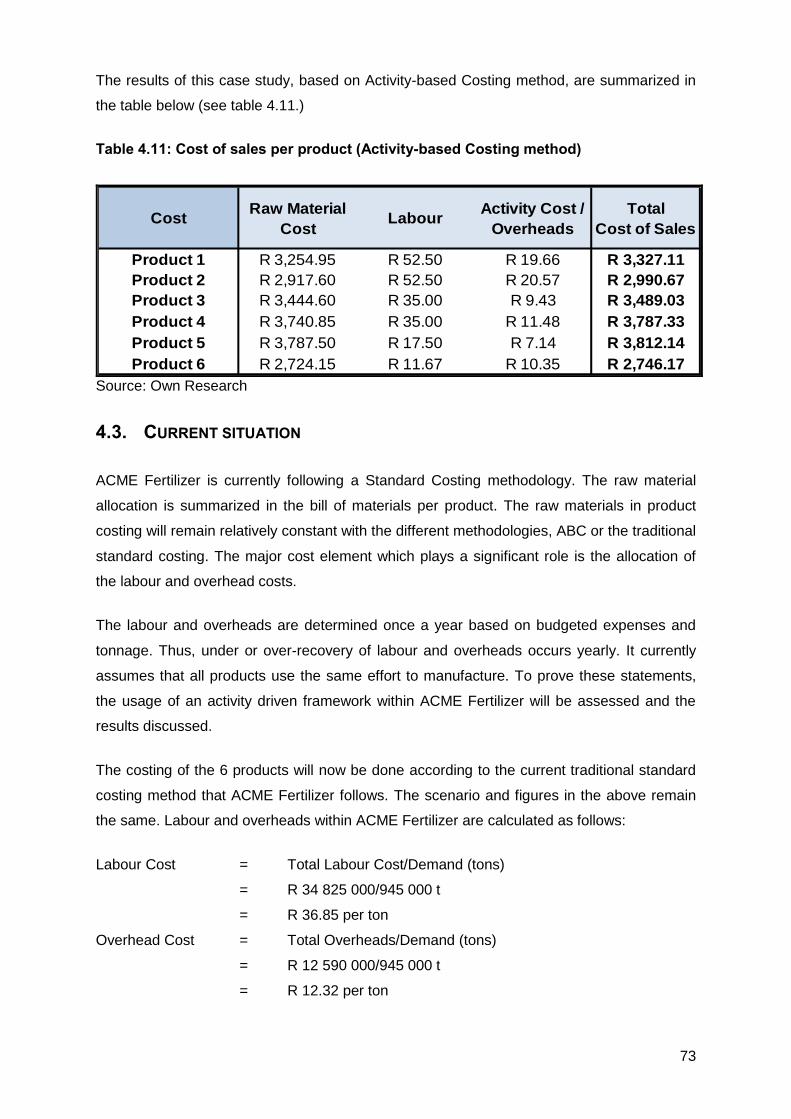
73
The results of this case study, based on Activity-based Costing method, are summarized in
the table below (see table 4.11.)
Table 4.11: Cost of sales per product (Activity-based Costing method)
CostRaw Material
CostLabour
Activity Cost /
Overheads
Total
Cost of Sales
Product 1 R 3,254.95 R 52.50 R 19.66 R 3,327.11
Product 2 R 2,917.60 R 52.50 R 20.57 R 2,990.67
Product 3 R 3,444.60 R 35.00 R 9.43 R 3,489.03
Product 4 R 3,740.85 R 35.00 R 11.48 R 3,787.33
Product 5 R 3,787.50 R 17.50 R 7.14 R 3,812.14
Product 6 R 2,724.15 R 11.67 R 10.35 R 2,746.17
Source: Own Research
4.3. CURRENT SITUATION
ACME Fertilizer is currently following a Standard Costing methodology. The raw material
allocation is summarized in the bill of materials per product. The raw materials in product
costing will remain relatively constant with the different methodologies, ABC or the traditional
standard costing. The major cost element which plays a significant role is the allocation of
the labour and overhead costs.
The labour and overheads are determined once a year based on budgeted expenses and
tonnage. Thus, under or over-recovery of labour and overheads occurs yearly. It currently
assumes that all products use the same effort to manufacture. To prove these statements,
the usage of an activity driven framework within ACME Fertilizer will be assessed and the
results discussed.
The costing of the 6 products will now be done according to the current traditional standard
costing method that ACME Fertilizer follows. The scenario and figures in the above remain
the same. Labour and overheads within ACME Fertilizer are calculated as follows:
Labour Cost = Total Labour Cost/Demand (tons)
= R 34 825 000/945 000 t
= R 36.85 per ton
Overhead Cost = Total Overheads/Demand (tons)
= R 12 590 000/945 000 t
= R 12.32 per ton
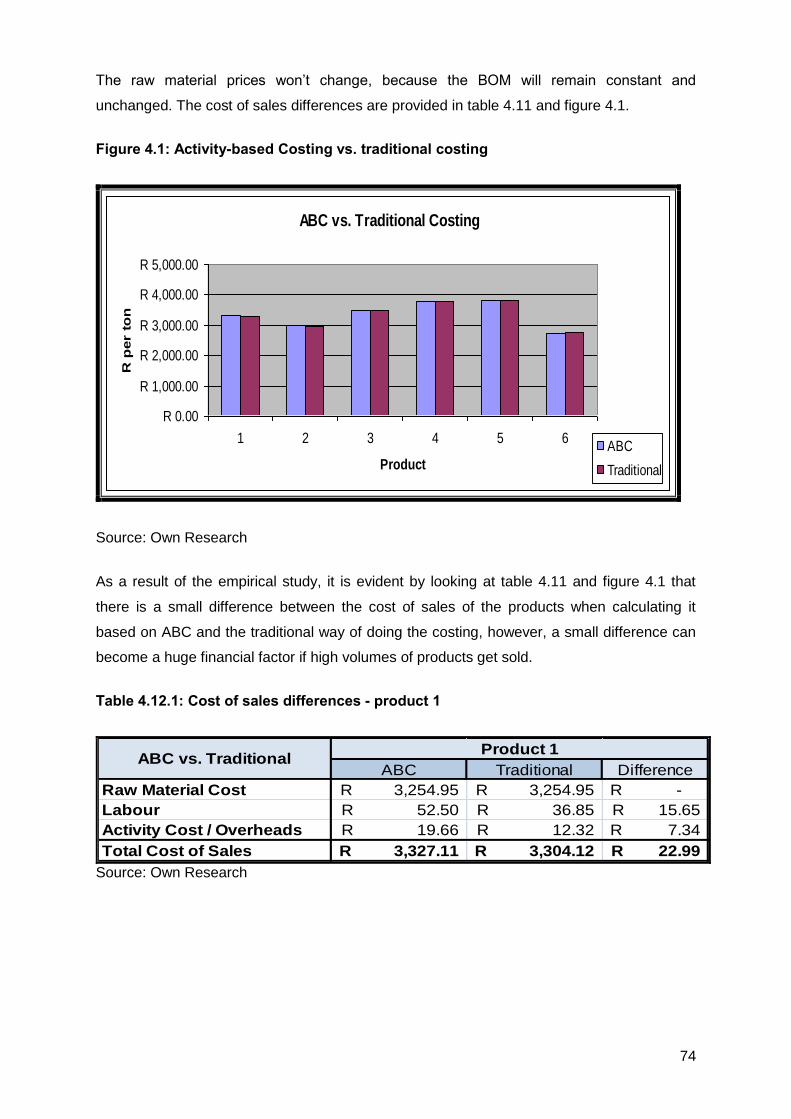
74
The raw material prices won’t change, because the BOM will remain constant and
unchanged. The cost of sales differences are provided in table 4.11 and figure 4.1.
Figure 4.1: Activity-based Costing vs. traditional costing
ABC vs. Traditional Costing
R 0.00
R 1,000.00
R 2,000.00
R 3,000.00
R 4,000.00
R 5,000.00
1 2 3 4 5 6
Product
R p
er t
on
ABC
Traditional
Source: Own Research
As a result of the empirical study, it is evident by looking at table 4.11 and figure 4.1 that
there is a small difference between the cost of sales of the products when calculating it
based on ABC and the traditional way of doing the costing, however, a small difference can
become a huge financial factor if high volumes of products get sold.
Table 4.12.1: Cost of sales differences - product 1
ABC Traditional Difference
Raw Material Cost 3,254.95R 3,254.95R -R
Labour 52.50R 36.85R 15.65R
Activity Cost / Overheads 19.66R 12.32R 7.34R
Total Cost of Sales 3,327.11R 3,304.12R 22.99R
Product 1ABC vs. Traditional
Source: Own Research

75
Table 4.12.2: Cost of Sales differences – product 2
ABC Traditional Difference
Raw Material Cost 2,917.60R 2,917.60R -R
Labour 52.50R 36.85R 15.65R
Activity Cost / Overheads 20.57R 12.32R 8.25R
Total Cost of Sales 2,990.67R 2,966.77R 23.90R
Product 2ABC vs. Traditional
Source: Own Research
With Product 1 and 2, the cost of sales based on ABC was just over R20 more than when
costing was done according to the traditional method (see table 4.12.1 and table 4.12.2). It is
not always beneficial to have a lower cost of sales. With these two products, it means that
the margins will be slightly more with the traditional method, but your L&O is under-
recovered, therefore the under-recovered amount will be seen as an expense and will
reduce the profits.
The disadvantage if the cost of sales is lower with the traditional method than with ABC, as it
means another product is carrying the loss in labour and overheads. This might create an
unavoidable issue when the other product which might be carrying product 1’s under
recovered L&O, might not do too well in that year and the budgeted tonnage might not be
made. ACME Fertilizer will suffer losses because of this product, but won’t know why. Thus,
the losses per product as well as the overall loss effect will be greater, and other financial
implications might have a huge effect.
When looking at the current way of how things are done at ACME Fertilizer compared with
calculating the cost of sales of each product under the same circumstances and costs
occurred, the following cost of sales variances is identified. By making use of the current
standard costing, the following value in overheads will be under-recovered; meaning cost of
sales was too low.
* Product 1 = Difference in cost of sales x demand
(L&O recovery) = - R22.99 x 180 000 tons
= - R 4 138 776.49 (under recovery)
** Product 2 = Difference in cost of sales x demand
(L&O recovery) = - R23.90 x 130 000 tons
= - R 3 106 745.56 (under recovery)

76
Table 4.12.3: Cost of Sales differences – product 3
ABC Traditional Difference
Raw Material Cost 3,444.60R 3,444.60R -R
Labour 35.00R 36.85R -1.85R
Activity Cost / Overheads 9.43R 12.32R -2.89R
Total Cost of Sales 3,489.03R 3,493.77R -4.74R
Product 3ABC vs. Traditional
Source: Own Research
Table 4.12.4: Cost of sales differences – product 4
ABC Traditional Difference
Raw Material Cost 3,740.85R 3,740.85R -R
Labour 35.00R 36.85R -1.85R
Activity Cost / Overheads 11.48R 12.32R -0.84R
Total Cost of Sales 3,787.33R 3,790.02R -2.69R
Product 4ABC vs. Traditional
Source: Own Research
The costing methodologies’ costing seems to be close to each other, especially when
looking at Product 3 and 4 in table 4.12.3 and 4.12.4. This does not seem like a big
difference, but when the demand is met, it will have a huge variance. Because the above two
products are high volume products, it makes them extremely price-sensitive. Product 3 and 4
will have a R1.1 million* and R600k** respectively loss in margin when the traditional
standard costing methodology is followed (as currently being done at ACME Fertilizer). In
the end this is a huge amount of money considering that there was only a R4.74 (Product 3)
and R2.69 (Product 4) cost of sales difference between the two costing methodologies.
* Product 3 = Difference in cost of sales x demand
(L&O recovery) = R4.74 x 240 000 t
= R 1 136 832.32 (over recovery)
** Product 4 = Difference in cost of sales x demand
(L&O recovery) = R2.69 x 220 000 t
= R 591 262.99 (over recovery)
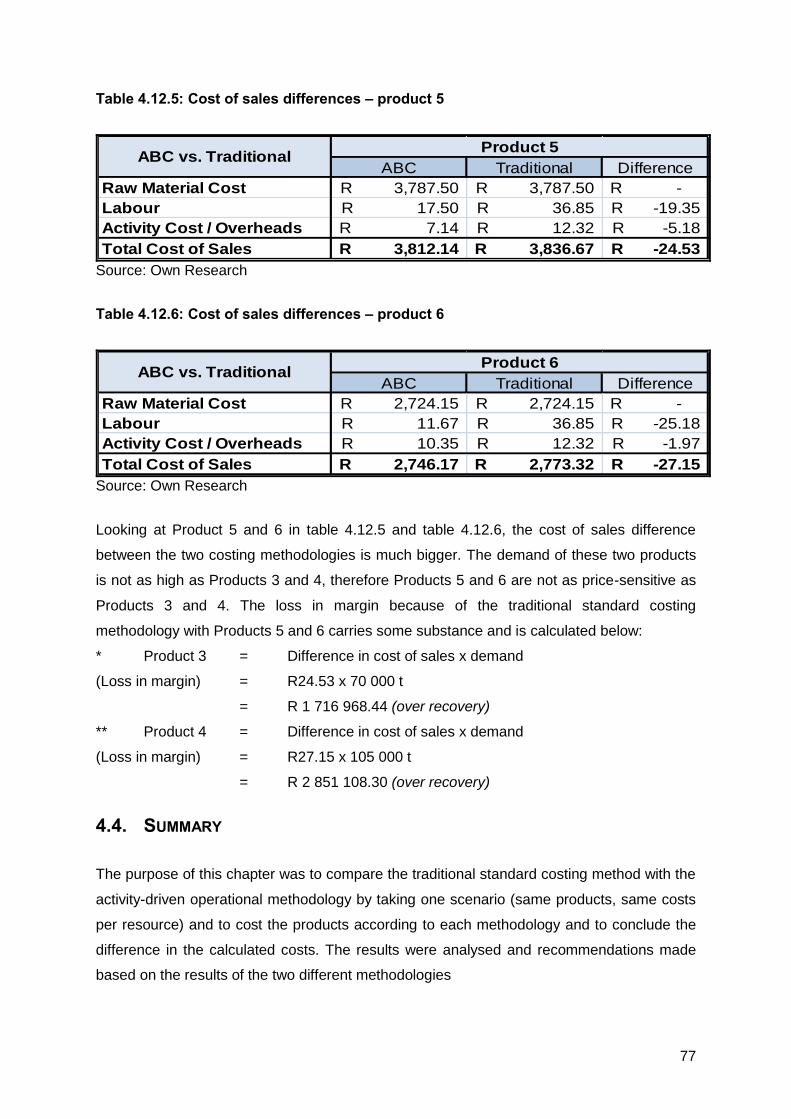
77
Table 4.12.5: Cost of sales differences – product 5
ABC Traditional Difference
Raw Material Cost 3,787.50R 3,787.50R -R
Labour 17.50R 36.85R -19.35R
Activity Cost / Overheads 7.14R 12.32R -5.18R
Total Cost of Sales 3,812.14R 3,836.67R -24.53R
Product 5ABC vs. Traditional
Source: Own Research
Table 4.12.6: Cost of sales differences – product 6
ABC Traditional Difference
Raw Material Cost 2,724.15R 2,724.15R -R
Labour 11.67R 36.85R -25.18R
Activity Cost / Overheads 10.35R 12.32R -1.97R
Total Cost of Sales 2,746.17R 2,773.32R -27.15R
Product 6ABC vs. Traditional
Source: Own Research
Looking at Product 5 and 6 in table 4.12.5 and table 4.12.6, the cost of sales difference
between the two costing methodologies is much bigger. The demand of these two products
is not as high as Products 3 and 4, therefore Products 5 and 6 are not as price-sensitive as
Products 3 and 4. The loss in margin because of the traditional standard costing
methodology with Products 5 and 6 carries some substance and is calculated below:
* Product 3 = Difference in cost of sales x demand
(Loss in margin) = R24.53 x 70 000 t
= R 1 716 968.44 (over recovery)
** Product 4 = Difference in cost of sales x demand
(Loss in margin) = R27.15 x 105 000 t
= R 2 851 108.30 (over recovery)
4.4. SUMMARY
The purpose of this chapter was to compare the traditional standard costing method with the
activity-driven operational methodology by taking one scenario (same products, same costs
per resource) and to cost the products according to each methodology and to conclude the
difference in the calculated costs. The results were analysed and recommendations made
based on the results of the two different methodologies
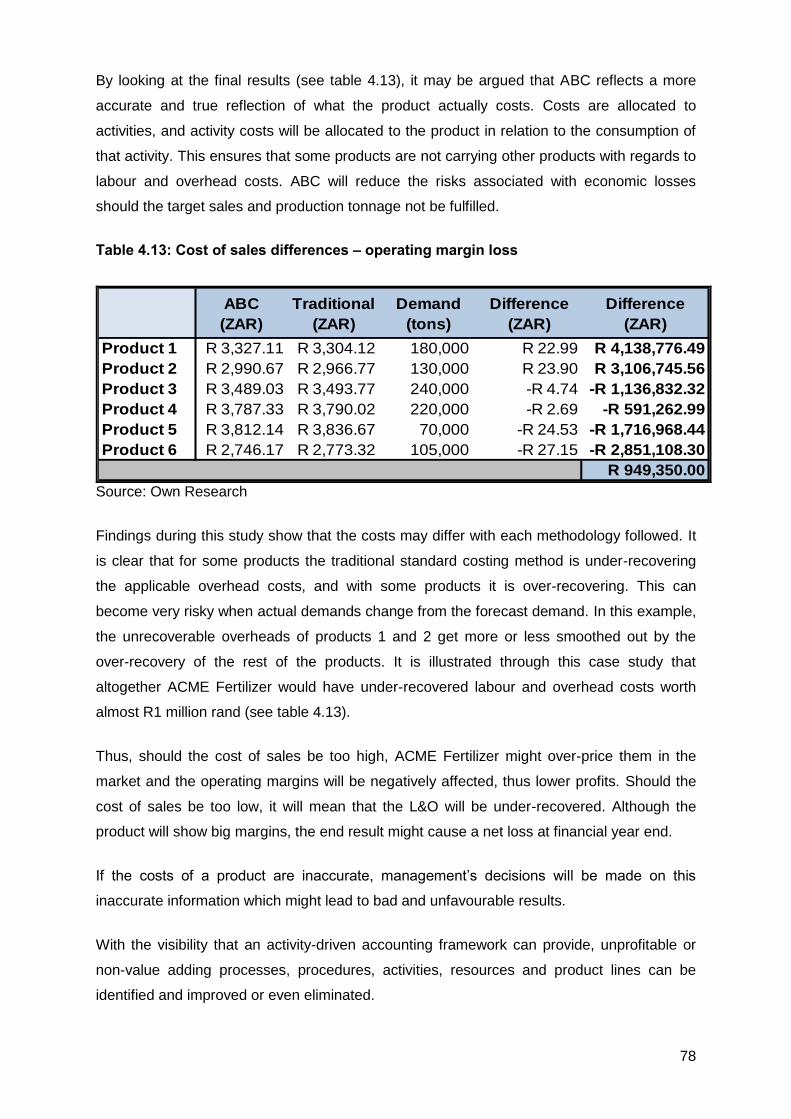
78
By looking at the final results (see table 4.13), it may be argued that ABC reflects a more
accurate and true reflection of what the product actually costs. Costs are allocated to
activities, and activity costs will be allocated to the product in relation to the consumption of
that activity. This ensures that some products are not carrying other products with regards to
labour and overhead costs. ABC will reduce the risks associated with economic losses
should the target sales and production tonnage not be fulfilled.
Table 4.13: Cost of sales differences – operating margin loss
ABC
(ZAR)
Traditional
(ZAR)
Demand
(tons)
Difference
(ZAR)
Difference
(ZAR)
Product 1 R 3,327.11 R 3,304.12 180,000 R 22.99 R 4,138,776.49
Product 2 R 2,990.67 R 2,966.77 130,000 R 23.90 R 3,106,745.56
Product 3 R 3,489.03 R 3,493.77 240,000 -R 4.74 -R 1,136,832.32
Product 4 R 3,787.33 R 3,790.02 220,000 -R 2.69 -R 591,262.99
Product 5 R 3,812.14 R 3,836.67 70,000 -R 24.53 -R 1,716,968.44
Product 6 R 2,746.17 R 2,773.32 105,000 -R 27.15 -R 2,851,108.30
R 949,350.00
Source: Own Research
Findings during this study show that the costs may differ with each methodology followed. It
is clear that for some products the traditional standard costing method is under-recovering
the applicable overhead costs, and with some products it is over-recovering. This can
become very risky when actual demands change from the forecast demand. In this example,
the unrecoverable overheads of products 1 and 2 get more or less smoothed out by the
over-recovery of the rest of the products. It is illustrated through this case study that
altogether ACME Fertilizer would have under-recovered labour and overhead costs worth
almost R1 million rand (see table 4.13).
Thus, should the cost of sales be too high, ACME Fertilizer might over-price them in the
market and the operating margins will be negatively affected, thus lower profits. Should the
cost of sales be too low, it will mean that the L&O will be under-recovered. Although the
product will show big margins, the end result might cause a net loss at financial year end.
If the costs of a product are inaccurate, management’s decisions will be made on this
inaccurate information which might lead to bad and unfavourable results.
With the visibility that an activity-driven accounting framework can provide, unprofitable or
non-value adding processes, procedures, activities, resources and product lines can be
identified and improved or even eliminated.

79
This study demonstrated the theoretical and practical advantages of ABC. These
advantages will include better cost calculations, quality improvement (operational and with
intellectual property) and decision-making at various management levels. It will also leave
management, sales and marketing personnel with a better understanding of where to walk
away from business if the market price is lower than the actual cost of sales of a product. It
will also be beneficial to know to what levels you can drop your margins in order to remain
competitive and achieve that competitive advantage and market share.
The next chapter will discuss the overall findings and recommendations from this study. It
will include the aims and objectives of the study as well as what the findings were of those
objectives by referring back to previous chapters.

80
CHAPTER 5: FINDINGS AND RECOMMENDATIONS
5.1. INTRODUCTION
Following a thorough investigation into the method currently in use by ACME fertilizer and
the embedding of an activity driven operational accounting framework the following has been
found and recommendations are made to ACME fertilizer for further consideration.
With the application of Activity-based Costing the planning, control, decision-making and
more accurate and reliable costing will be evaluated within the company. By using the
results of costing products based on activity consumption, it means that the sales prices can
be determined with much more confidence, as the true cost of products is now visible,
without unforeseen or surprise costs that will absorb all the profits (Chapter 4, table 4.11, p
63). These days are tough for any business, but if you know the true cost, marketing and
sales personal will know up to where to give discounts and when to walk away from
business.
The problem statement of the study therefore considers whether the cost implementation
process as well as maintenance thereafter is worth it? If the financial benefits are greater
than the costs associated with the implementation of an ABC system, it should be
considered (Kennet et al., 2007). The primary research problem considered throughout this
study (Chapter 1, p 6.) was to prove that it will provide better and more relevant
management information.
For this study, six products were used to demonstrate the difference in prices, to the time
when cost is calculated based on the activities consumed vs. the traditional method which
ACME Fertilizer currently uses.
The hypothesis of this study was proved, and by referring to the results in Chapter 4,
Activity-based Costing is indeed a very helpful and supportive tool when calculating the cost
of producing goods accurately and to limit the over or under-recovery of labour and
overheads (Chapter 4, table 4.13).
5.2. RESEARCH OBJECTIVES - RESULTS
The current costing method was identified, analysed and the results compared against those
of an activity-driven framework. The major difference in costs was due to the way the labour
and overheads are calculated (see table 4.4). This will cause a over or under-recovery of the
budgeted costs, as well as the possible over-pricing of themselves in the market or, on the
81
other hand, surprise costs leading to cause high margins, but a very low net profit even a
loss.
Primary objective: The primary objective of this research was to assess the feasibility
of an activity-driven operational accounting framework (Chapter 1, p. 6). To address
the above primary objective, the difference in unit rates, calculated on the basis of
ABC and traditional costing, highlights the difference that a change in costing can
have on the cost of the cost object (Chapter 4, table 4.13, p.68). ABC allocates costs
based on the resource and utility consumption, but traditional costing assumes that
all products take exactly the same time and effort to manufacture. Therefore ABC
brings the actual cost more in line with reality. The cost of a product was determined,
compared and analysed, including the labour and overheads based on the current
costing method and then compared to the results when costs get allocated based on
an Activity-based Costing (Chapter 1, p. 6). The result of the above was tested in
Chapter 4. The financial impact of an ABC system will vary. For some products it
may cost more when using ABC than with traditional methods. The effect will be
either an under-recovery of the labour and overheads or unforeseen expenses only
noticed during the financial year end. Looking at product 1, the effect will be a
difference of R4.1 million rand which was not brought into the calculation (Chapter 4,
table 4.13, p 68). Product 2 will have a R3.1 million unrecoverable costs should the
traditional method be used (Chapter 4, table 4.13, p 68). On the other hand products
3, 4, 5 and 6 would have shown a R1.1 million, R590k, R1.7 million and R2.85
million, each respectively, having the higher margin through using the traditional
method (Chapter 4, table 4.13, p 68). Thus, ACME Fertilizer could have been over-
priced in the market if it was a rigidly competitive market in which they compete. The
risk of over-pricing is extremely high, especially in a price-sensitive market.
Other objectives achieved throughout this study are that an activity-driven operational
framework is a very supportive supplement to the current system. It gives a better picture of
the operational side of the business and unnecessary activities can be visible. Best practices
can be followed, as the operational processes and activities are much more visible, with a
financial value.
Secondary objective #1: Ensure the lowest possible cost per ton of fertilizer and thus
establish a higher margin, but a high profit at the end as well (Chapter 1, p 6). ABC
proved that it won’t necessarily provide the lowest cost of sale (Chapter 4, table 4.13,
p 68), but rather a more accurate cost of sale – for example the cost of Products 1 &
2 is higher if calculated following the ABC method, than with the traditional method.
82
Hence, previously the sale of these products could have taken a huge chunk out of
the profit.
Secondary objective #2: More effective and efficient utilization of available resources
hence the irrelevant costs will be eliminated and processes can be amended
(Chapter 1, p. 6). By benchmarking the Rate per Activity, the problem activities can
be identified and looked into. With the current scenario used in Chapter 4, it is
evident by looking at the data in chapter 4 that ACME Fertilizer should review its
activities (Chapter 4, table 4.8, p 59). The purchasing of raw materials is costing
ACME Fertilizer too much, and the current way the company does procurement is not
cost-effective. They should look at buying more quantities at a time, thus they can
benefit from economies of scale and reducing activities, which will lead to lower cost
of production. The best way to save cost, when not reducing productivity, is to
streamline and automate processes in order to carry fewer operational expenses.
Sorting of products can be eliminated if the process at the bagging plant can be
maximized. This process was never seen as an activity which can cost a lot, but only
as a ‘nice to have’. By looking at the data from the activity-driven cost methodology,
unnecessary activities can be identified and costs can be reduced.
Methods of investigation. During the literature study, all the key components,
fundamentals, advantages, disadvantages, implementation procedures and other
issues of an activity-driven framework were identified and explained (Chapter 2, p 13-
24). All the theoretical information was gathered through articles, magazines,
textbooks, financial statements of ACME Fertilizer, SAFOL and FOSKOR, then
analysed and commented on. Other internet-sourced documents as well as other
case studies all contributed to the final outcome. A pilot study was designed where
the general need for an ABC was determined. The sample consisted of fourteen (14)
similar companies, of which ten (10) responded (56% response rate).
In order to complete the empirical study, interviews were conducted where information
regarding time spent; activities in use and other valuable information was gathered. The
information was taken and compared between the two different costing methods. The results
were very close, with not a huge financial effect. The assumption was made that all
budgeted tonnage was produced and sold, as well as that all budgeted expenses were
accurate.
5.3. RESEARCH SYNOPSIS
The study initially highlighted the importance of cost control and the management thereof.
Management should focus on streamlining and improving efficiencies and eliminating non-
83
value adding activities and processes which will result in lower costs. ACME Fertilizer’s
background, challenges and cost structure were explained throughout Chapter 1. The
research problem was whether an activity-driven accounting framework will provide better
and more accurate management information. The primary objective is to determine the
feasibility of activity-driven operational accounting framework within the manufacturing
industry. The secondary objectives were to get the unit cost lower, and the margin and profit
higher and secondly, to reach effective and efficient resource utilization by eliminating non
value adding activities. The research method of this study was concluded by means of a
literature and empirical study.
As a foundation for the empirical study covered the theory of ABC was identified and
discussed by means of the key components, fundamentals, advantages, disadvantages,
implementation and other ABC methodologies. It is important that the costs be managed and
that process constraints be identified and streamlined. ABC was introduced by Robert
Kaplan and Robin Cooper during the late 1980s to overcome the issue of traditional costing
methods which only used one cost driver to determine costs. The ABC methodology
prescribes that costs must be allocated to activities, and a rate per activity calculated and
then passed on to the cost object by means of the resource utilization of the activities. If the
financial benefit of implementing ABC is greater than the implementation cost and
maintenance thereof, ABC should be definitely considered. The cost of the implementation
of an ABC system is at this stage unknown and it can’t be confirmed whether the benefit of
implementation will be greater than the cost thereof. The cost benefit analysis for ABC for
Company O will remain a possibility for future research. ABC is especially useful in
companies where a high percentage of the operating costs are indirect, because of process
automation and improvements. Although the implementation and maintenance of ABC is a
time-consuming and costly process other advantages include visible and more accurate
costs, which will help in the decision-making process. ABM is the use of ABC information to
assist in management decisions by means of processes and costs in order to satisfy the end
customer and increase profits. Another costing methodology married to ABC is Time-driven
ABC which is an efficient, quicker and less costly method which will also deliver good
results.
The study also considered ACME Fertilizer’s business model and costing methodology in
accordance with Porter’s Value Chain. The focus of this chapter is on the Value Chain and it
explains how products must go through different channels in order to add value to the end
product. ACME Fertilizer’s current costing methodology is analysed and by comparing it to
the rival company’s costing methodology it is evident that ACME Fertilizer must review their
current costing methodology. A pilot study, in which 14 companies responded, indicated that
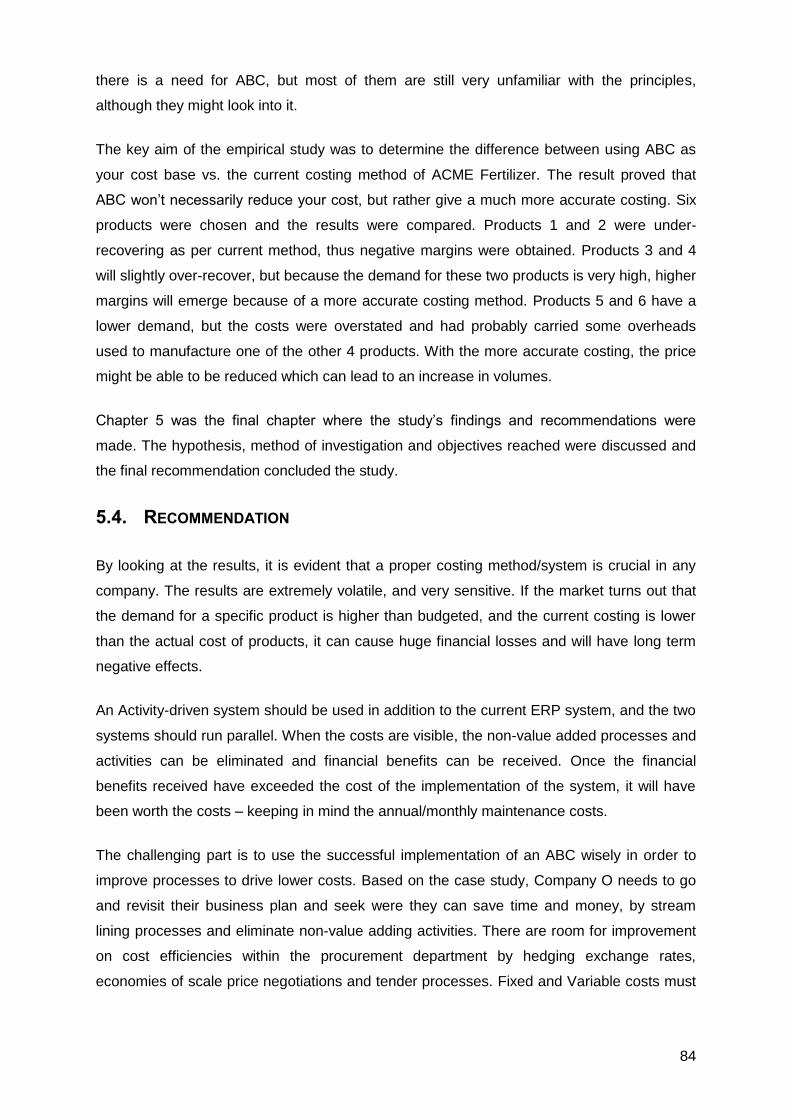
84
there is a need for ABC, but most of them are still very unfamiliar with the principles,
although they might look into it.
The key aim of the empirical study was to determine the difference between using ABC as
your cost base vs. the current costing method of ACME Fertilizer. The result proved that
ABC won’t necessarily reduce your cost, but rather give a much more accurate costing. Six
products were chosen and the results were compared. Products 1 and 2 were under-
recovering as per current method, thus negative margins were obtained. Products 3 and 4
will slightly over-recover, but because the demand for these two products is very high, higher
margins will emerge because of a more accurate costing method. Products 5 and 6 have a
lower demand, but the costs were overstated and had probably carried some overheads
used to manufacture one of the other 4 products. With the more accurate costing, the price
might be able to be reduced which can lead to an increase in volumes.
Chapter 5 was the final chapter where the study’s findings and recommendations were
made. The hypothesis, method of investigation and objectives reached were discussed and
the final recommendation concluded the study.
5.4. RECOMMENDATION
By looking at the results, it is evident that a proper costing method/system is crucial in any
company. The results are extremely volatile, and very sensitive. If the market turns out that
the demand for a specific product is higher than budgeted, and the current costing is lower
than the actual cost of products, it can cause huge financial losses and will have long term
negative effects.
An Activity-driven system should be used in addition to the current ERP system, and the two
systems should run parallel. When the costs are visible, the non-value added processes and
activities can be eliminated and financial benefits can be received. Once the financial
benefits received have exceeded the cost of the implementation of the system, it will have
been worth the costs – keeping in mind the annual/monthly maintenance costs.
The challenging part is to use the successful implementation of an ABC wisely in order to
improve processes to drive lower costs. Based on the case study, Company O needs to go
and revisit their business plan and seek were they can save time and money, by stream
lining processes and eliminate non-value adding activities. There are room for improvement
on cost efficiencies within the procurement department by hedging exchange rates,
economies of scale price negotiations and tender processes. Fixed and Variable costs must
85
be reviewed, and eliminated if it is not adding value. Company O must investigate which of
their products are not profitable and those should be discontinued.
5.5. LIMITATIONS OF THIS STUDY
In order to complete this study, a questionnaire survey was completed (see Appendix 1, p
77), and it was assumed that the results were correct and not misleading. The sample used
was not based on statistical information and was too small to determine the actual impact it
will have on the company, thus the study remains limited. The interviews held with ACME
Fertilizer’s financial and operational representatives were restricted to their knowledge.
Competitors could not be approached as there was an investigation pending, by the
Competitions Commission, within this industry. For the purpose of this study, it was assumed
that all commodity prices (supply and demand) as well as any foreign currencies remain
consistent and that there were no fluctuations, thus averages were used for calculation
purposes.
5.6. RECOMMENDATIONS FOR FURTHER RESEARCH
This study leaves the following opportunities for further research:
The impact of alternative costing methodologies in service industries on the costing
of services. Other costing methodologies like TDABC can be investigated in order to
overcome current issues that are too complex to be dealt with within the ABC model.
A stronger focus on the financial benefit vs. the cost of implementation by increasing
the sample size based on statistical information can be beneficial and will prove the
benefits to companies who are considering ABC.
Alternative but relative costing methodologies like TDABC can be investigated in
order to overcome current issues that are too complex within the ABC model.
86
APPENDIX: PILOT STUDY QUESTIONNAIRE
Marne van der Linde
APPENDIX 1
Student number: 12567353
North-West University
Embedding an Activity Driven Operational Accounting Framework: A case study
Questionnaire
Introduction
I am a Master Student at the North-West University. I am doing research on costing
systems within organisations, especially within the Manufacturing Industry. You have been
selected to contribute to my research project by providing data about your company, your
insight, processes and procedures, etc. Herewith, I promise that all information will be
treated strictly confidential, and that your name and the company's name will not be
published.
I will be most grateful if you would take a few minutes to complete this questionnaire of 20
questions and return it to me before 31 March 2010. Your responses will be used -
anonymously - to analyse the need for an Activity Driven Operational Accounting Framework
for South African Manufacturers. Please answer as clearly and honestly as possible.
Should you have any queries, please contact me (082 305 3371).
Thank you
Kind Regards
Marne van der Linde

87
Questions
GENERAL
1 Is your company in the FMCG industry? Yes No Not sure
2 If no, please specify which industry. ______________________________________________________
3 What is your current posistion in the Company? ______________________________________________________
4 Are you familiar with the term "Activity-Based Costing"? Yes No Not sure
5 Will it be difficult to get the managements buy-in should
ABC be implemented?
6 Will you say that your company is exchange rate
sensitive?
7 Is there any non value adding activities that you know
of?
MANUFACTURING OF GOODS
8 Do you make use of "Bill of Materials" for products
manufactured?
9 How often do you change the Cost of Sale of products? Weekly Monthly Quarterly Yearly
10 What are the components of the Cost of Sales of a product? Raw Material Labour Overheads
Tranport Other
12 Do you allocate different Labour and Overhead charges
to different products?
13 Is the management of overheads within operating units a
major concern for the business?
14 Do you know which processes are followed in the plants,
eg process flow chart?
Yes No Not sure
Yes No Not sure
Yes No Not sure
Yes No Not sure
Yes No N/A
Yes No Not sure
Yes No Not sure
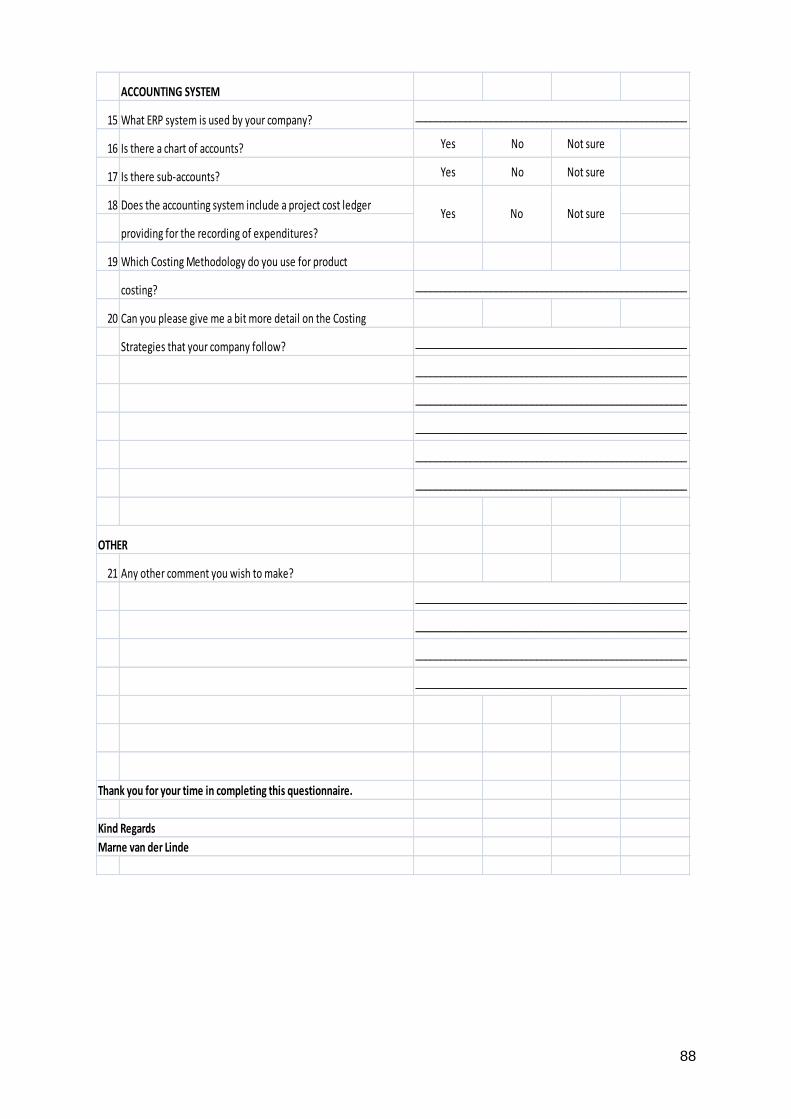
88
ACCOUNTING SYSTEM
15 What ERP system is used by your company? ______________________________________________________
16 Is there a chart of accounts? Yes No Not sure
17 Is there sub-accounts? Yes No Not sure
18 Does the accounting system include a project cost ledger
providing for the recording of expenditures?
19 Which Costing Methodology do you use for product
costing? ______________________________________________________
20 Can you please give me a bit more detail on the Costing
Strategies that your company follow? ______________________________________________________
______________________________________________________
______________________________________________________
______________________________________________________
______________________________________________________
______________________________________________________
OTHER
21 Any other comment you wish to make?
______________________________________________________
______________________________________________________
______________________________________________________
______________________________________________________
Thank you for your time in completing this questionnaire.
Kind Regards
Marne van der Linde
Yes No Not sure

89
BIBLIOGRAPHY
ADKINS, T. 2008. Activity-Based Costing under fire – five myths about Activity-Based
Costing. SAS.com magazine. March, 10.
http://www.sascom/news/sascom/2008q2/feature_abc.html Date of access: 8 May 2011.
AFRICAN EXPLOSIVES LIMITED (AEL). 2008. Annual financial statements, 31 March
2009. Johannesburg. 169 p. http://www.aeci.co.za/Financial/2008_annual_report/pdf/full.pdf
Date of access: 15 Sept. 2009.
BAXENDALE, S.J. & RAJU, P.S. 2004. Using ABC to enhance throughput accounting: a
strategic perspective. Cost management, 18(1):31-38, Jan/Feb.
BENNETT, M., RIKHARDSON, P. & SCHALTEGGER, S., eds. 2003. Environmental
management accounting - Purpose and progress. Kluwer, Rotterdam; Springer. 420 p.
BETTERMANAGEMENT REPORT. 2005. Activity-Based Costing: how activity-based
management is used in the organisation.
http://www.sas.com/offices/europe/switzerland/romandie/pdf/actualites/abm_survey_result.p
df Date of access: 4 Apr. 2010.
BLUMBERG, B., COOPER, D. & SCHINDLER. P. 2008. Business research methods.
Berkshire, UK: McGraw-Hill. 770 p.
BURRIT, R., HAHN, T. & SCHALTEGGER, S. 2002. Towards a comprehensive framework
for environmental management accounting - Links between business actors and
environmental management accounting tools. Australian accounting review, 12(2):39-50, 1
Jul.
CHEN, C.C. & JONES, K.T. 2007. Management tools. Who uses them, and how effective
are they? The certified public accountant journal, 77(7):50-55, Aug.
CHRISTIE, S. 2008. Activity-Based Costing, budgeting & management. The key to your
organisation’s way forward. (Paper delivered as part of a workshop on ABC from Globus
Prospectus Training at Southern Sun - Grayston on 24 and 25 July 2008.) Sandton. 68 p.
(Unpublished.)
CIMA (Chartered Institute of Management Accounting). 2005. Official terminology. 2nd ed.
Oxford: CIMA Publishing. 156 p.

90
COKINS, G. 2001. A management accounting framework. Journal of corporate accounting &
finance, 12(6):73-82, Oct.
COKINS, G. 2001. Activity-based management: an executive’s guide. Rev. ed. San
Francisco, C.A.: Wiley. 60 p.
COLLINS, J. 2009. How the Mighty Fall: and why some companies never give in. 1st ed.
HarperCollins Publishers Inc., N.Y., p 240, Jun.
COOPER, R. 1990. Implementing an Activity-based Cost system. Journal of cost
management, 4(1):33-42, Spring.
CROWTHER, D. & LANCHESTER, G. 2009. Research methods. Oxford, UK: Butterworth –
Heinemann. 304 p.
DRURY, C. 2008. Management and cost accounting. 7th ed. London: Pat Bond. 775 p.
DWYER, J. 2009. The cost of failure. Engineering & technology, 4(7):70-73. Available:
Academic Search Premier. Date of access: 3 Nov. 2010.
EUSKE, K.J. & VERCIO, A. 2007. Enhancing the ABC cross. Management accounting
quarterly, 8(4):48-61, Summer.
FABOZZI, F.J. DRAKE, PP & POLIMENI, R.S. 2007. The complete CFO handbook – from
accounting to accountability. Hoboken, New Jersey: Wiley. 864 p.
FERRARA, D. 2007. Activity-Based Costing software. Ezine Articles. January 17, 2007.
http://EzineArticles.com/?expert=Dominic_Ferrara Date of access: 12 Nov. 2007.
FEI, Z.Y. & ISA, C.R. 2010. Behavioural and organizational variables affecting the success
of ABC success in China. African journal of business management, 4(111):2302-2308, 4
Sept. Available: www.academicjournals.org/AJBM
FOSKOR. 2008. Annual financial report,2009. http://www.foskor.co.za/library/FOSKOR%
20ANNUAL%20REPORT%202009.pdf Date of access: 15 Sept 2009.
FRIEDL, G., KűPPER, H. & PEDELL, B. 2005. Relevance Added: Combining ABC with
German cost accounting. Strategic Finance, 56 – 61 p. Jun.
FURNISS, T. & SPENCER, M. 2005. Activity-Based Costing: from a provider’s perspective.
Official journal of the institute of municipal finance officers, 5(3):27-28, Fall.
91
GERI, G. & RONEN, B. 2005. Relevance Lost: The rise and fall of activity based costing.
Human Systems Management. 24(1)133-144. Investopedia
www.investopedia.com/terms/p/paybackperiod/asp Date of access: 25 November 2009.
GONZALEZ-GOMEZ, J.I. & MORINI, S. 2006. Activity-Based Costing of wine. Journal of
wine research, 17(3):195-203, Dec.
HERZNER, H. 2009. Project management – a systems approach to planning, scheduling
and controlling. 10th ed. Berea, Ohio: Wiley. 1120 p.
HORNGREN, C.T., DATAR, S.M. & FOSTER, G. 2003. Cost accounting – a managerial
emphasis. 13th ed. New Jersey: Prentice Hall. 856 p.
INTERNATIONAL GRAINS COUNCIL. 2008. Latest supply and demand.
http://www.igc.org.uk/en/grainsupdate/igcsd.aspx Date of access: 15 Aug. 2008.
JIAMBALVO, J. 2004. Managerial accounting. 2nd ed. Washington, United States of
America: Wiley. 512 p.
KANNEGIESSER, M., GUNTHER, H.O., VAN BEEK, P., GRUNOW, M. & HABLA C. 2009.
Value chain management for commodities: a case study from the chemical industry.
Operations research spectrum, 31(1):63-93.
KAPLAN, R.S. & ANDERSON, S.R. 2003. Time-driven Activity-Based Costing. Harvard
business review, 82(11):1-20, Nov.
KAPLAN, R.S. & ANDERSON, S.R. 2007. The innovation of time-driven ABC. Cost
management, 21(2):5-26, Mar/Apr. Abstract in ProQuest.
KAPLAN, R. & NORTON, D.P. 2008. Mastering the management system. Harvard business
review. 10(1):63-77, Jan.
KENNETT, D.L., DURLER, M.G. & DOWNS, A. 2007. Activity-Based Costing in large U.S.
cities: costs & benefits. The journal of government financial management, 56(1):1-20,
Spring.
KRUMWIEDE, K.R. & ROTH, H.P. 1997. Implementing information technology innovations:
the Activity-Based Costing example.. DSM advanced management journal, 62(4):4-9, Fall.
92
LOWDER, B.T. 2006. The legacy of Activity-Based Costing”. Addressing the need for a
hybrid methodology for cost allocation. Journal of accounting research. 44(3)485-531,
March.
MAX, M. 2007. Leverage process documentation for time-driven Activity-Based Costing.
Journal of Performance management, 20(3):16-28, Nov.
McGOWAN, C. 2009. Time-driven Activity-Based Costing – a new way to drive profitability.
Accountancy Ireland, 41(6)60-61, Dec.
NARONG, D.K. 2009. Activity-Based Costing and management solutions to traditional
shortcomings of cost accounting. Cost engineering, (51)8:11-22, Aug.
NEEDY, K.L., NACHTMANN, H., ROZTOCKI, N., WARNER, R.C. & BIDANDA, B. 2003.
Implementing Activity-Based Costing systems in small manufacturing firms: a field study.
Engineering management journal, (15)1:3-10, Mar.
POGGENPOEL, J.P. 2004. Die implementering van 'n aktiwiteitsgebaseerde kostestelsel in
'n finansiële diensmaatskappy. Johannesburg: RAU. (Dissertation – M.Com) 144 p.
PORTER, M.E., 1985. Competitive advantage: creating and sustaining superior
performance: with a new introduction. New York, United States of America: The Free Press.
592 p.
PRUD’HOMME, M. & HEFFER, P. 2011. Medium Term Outlook for World Fertilizer Demand,
Supply and Supply/Demand Balances. International Fertilizer Industry Association.
http://www.fertilizer.org/ifa/HomePage/LIBRARY/Publication-database.html/Medium-Term-
Outlook-for-World-Fertilizer-Demand-Supply-and-Supply/Demand-Balances.html Date of
access: 12 July 2011.
ROZTOKI, N. & SCHULTZ, S.A. 2003. Adoption and implementation of Activity-Based
Costing: a web-based survey. http://www2.newpaltz.edu/~roztockn/portland03.pdf Date of
access: 28 Sept. 2009.
SASOL. 2008. Annual financial statements. Johannesburg. 220p.
http://www.sasol.com/sasol_internet/downloads/Sasol_AFS_1223445134134.pdf Date of
access: 15 Sept. 2009.
SEARCHY, D.L. & ROBERTS, D. 2007. Will your ABC system have what it takes?
Management accounting quarterly, 8(3):23-26, Spring.
93
STOUT, D.E. & BEDENIS, G.P. 2007. Cost-system redesign at a medium-sized company:
Getting the right numbers to drive improvements in business performance. Management
accounting quarterly, 8(4)9-19, Summer.
STRATTON, W.O., DESROCHES, D., LAWSON, R.A. & HATCH, T. 2009. Activity-Based
Costing: is it still relevant? Management accounting quarterly, 10(3):31-40, Spring.
TARDIVO, G. & DI MONTEZEMOLO, G.C. 2009. Using Activity-based management to
achieve excellence. Journal of financial management and analysis. 22(1):67-84, Jan–Jun.
TATIKONDA, L.U. 2003. Critical issues to address before you embark on an ABC journey.
The national public accountant. 2(5):5-8, Sep.
TATIKONDA, L.U. & TATIKONDA, R.J. 2001. Activity-Based Costing for Higher Education
Institutions. Management accounting quarterly, 2(2)19-27, Winter.
TURNEY, P.B.B. 2005. Common cents: how to succeed with Activity-based Costing and
activity based management. Rev. ed. New York: McGraw-Hill. 95 p.
VERCIO, A. & SHOEMAKER, B. 2007. ABC’s of batch processing. Journal of accountancy.
204(2):40-45, Aug.
WALTERS, D. & LANCASTER, G. 2000. Implementing value strategy through the value
chain. Management decision. (38)3:160-178, Mar.
WANG, G., GOA, Z. & LIN, T.W. 2010. Using ABC to improve the logistics value chain in a
Chinese food product company. Cost management. 24(1):39-46, Jan/Feb. Available:
Proquest. Date of access: 15 May 2011.
ZHANG, H. 2010. Research Hewlett Packard through its value chain. International journal of
business and management. 5(8)179-190, Aug.