the impact of thinking maps to enhance the - NWU-IR Home
403
THE IMPACT OF THINKING MAPS TO ENHANCE THE DEVELOPMENT OF CRITICAL THINKING SKILLS AMONG FIRST YEAR PRE-SERVICE LIFE SCIENCE TEACHERS Francois Gysbertus Minnie B.Sc. (UFS), B.Sc. Hons. (UFS) A dissertation submitted in fulfilment of the requirements for the degree MAGISTER EDUCATIONIS in Learning and Teaching Faculty of Humanities North-West University (Vaal Triangle Campus) Vanderbijlpark Study Leader: Prof. MM Grösser 2017
-
Upload
khangminh22 -
Category
Documents
-
view
0 -
download
0
Transcript of the impact of thinking maps to enhance the - NWU-IR Home

THE IMPACT OF THINKING MAPS TO ENHANCE THE
DEVELOPMENT OF CRITICAL THINKING SKILLS AMONG
FIRST YEAR PRE-SERVICE LIFE SCIENCE TEACHERS
Francois Gysbertus Minnie
B.Sc. (UFS), B.Sc. Hons. (UFS)
A dissertation submitted in fulfilment of the requirements for the degree
MAGISTER EDUCATIONIS
in
Learning and Teaching
Faculty of Humanities
North-West University
(Vaal Triangle Campus)
Vanderbijlpark
Study Leader: Prof. MM Grösser
2017

i
DECLARATION
I, FRANCOIS GYSBERTUS MINNIE, solemnly declare that this work is original and the result of
my own labour. It has never, on any previous occasion, been presented in part or whole to any
institution or board for the awarding of any degree.
I further declare that all information used and quoted has been duly acknowledged by complete
reference.
SIGNATURE DATE

ii
LANGUAGE EDITING
Rita van Wyk
Language Practitioner Taalpraktisyn
084 5484177
DECLARATION
28 October 2016
I herewith declare that I was responsible for the language editing of the dissertation:
The impact of thinking maps to enhance the development of critical thinking skills among first
year pre-service life science teachers, by Francois Gysbertus Minnie.
M. J. van Wyk M.J. van Wyk BA (Unisa) Advanced Dipl. in Translation and Interpreting (UFS) Accredited member of the SA Translators’ Institute

iii
DEDICATION
This dissertation is dedicated to all the people who challenged, inspired and
encouraged me to commence the study and supported me throughout the course
of the study: especially my wife, Rentia, who offered me love and support
throughout the course of the study.

iv
ACKNOWLEDGEMENTS
I thank the following people for their advice, guidance, motivation and support during this study:
My support system at home: My wife Rentia and children, Rinis and Niël, for their love,
support and understanding during the completion of this study.
My mother, Jeanette Minnie, and mother-in-law, Ina de Jager, and all my family and friends
for their love and support.
My study leader, Professor M.M. Grösser, for her guidance, advice, patience and helping
me to focus, and especially for believing in me.
Mrs. Aldine Oosthuyzen for the capturing of the data, her assistance in the statistical
analysis, advice, support and the technical editing of this dissertation.
Mrs. Rita van Wyk for the professional language editing of the dissertation.
Mrs. Martie Esterhuizen of the Vaal Triangle Campus library, for helping me to find the
literature needed for my research.
Mrs. Daphne Strauss who assisted during the recruitment of students and supervision
during the pre- and post-tests.
My colleagues at the School of Educational Sciences for their valued advice and support.
All the LIFE 111 students of 2016 who participated in this research study.
The University of North-West for allowing me to conduct this study.

v
SUMMARY
The National Curriculum and Assessment Policy Statement (CAPS) Grades R-12 continues to
support teaching and learning that should nurture critical thinking skills among learners1. This
research investigated the impact of Thinking Maps as a teaching strategy to enhance the
development of critical thinking skills among first year pre-service Life Science2 teachers at a
university in South Africa.
The literature review explains the multidimensional nature of critical thinking that involves the
development of cognitive and metacognitive skills and strategies, dispositions/behavioural traits,
intellectual traits, as well as universal intellectual standards of reasoning that are applied to the
elements of thought. The importance of critical thinking for teacher training was explored by
emphasising its importance to cope with the challenges of the 21st century. Moreover, the
development of critical thinking skills stands central to achieving the objectives of CAPS.
Nationally and internationally, the development of the critical thinking skills of pre-service
teachers appears to be fragile, and political, educational, personal, behavioural, cultural and
language factors seem to play an important role in influencing the development of critical
thinking skills. A number of commercially available tests exist to assess the development of
critical thinking skills. As none of these tests focus on assessing critical thinking in subject
content, the researcher decided to construct his own closed multiple choice test, strengthened
by open questions, to assess the application of the critical thinking skills analysis, synthesis and
evaluation in the context of Life Sciences.
In order to identify a suitable theoretical framework for developing the Thinking Maps
intervention that was implemented in the study, important learning theories and related teaching
styles, teaching methods and teaching strategies were clarified. It appeared that teaching
framed within a cognitive and constructivist approach would be more apposite for enhancing the
development of critical thinking, as these approaches provide opportunities for active and social
construction of knowledge and problem-solving that hold benefits for the development of critical
thinking.
The role and importance of visual learning, in particular Thinking Maps, for enhancing the
development of critical thinking were clarified by means of a literature review. Thinking Maps is
1 In the context of the study, “learners” will be used in the context of school-level teaching, and “students” in the context of teaching at higher-education level.
2 The term “Life Sciences” will be used when referring to the subject Life Sciences. In all other instances reference will be made to “Life Science” teachers/classrooms/content/students (Department of Basic Education, 2011:6, 17).

vi
a programme that consists of a set of eight visual tools designed to help students3 develop
critical thinking processes and habits in a multidisciplinary and an integrated fashion, such as
describing, comparing, categorising, identifying cause and effect relationships, sequencing and
ordering, analysing part-whole relationships and seeing analogies. In the context of the study,
the researcher employed the Circle Map, Tree Map and Multi-Flow Map to enhance the
development of the critical thinking skills’ analysis, synthesis and evaluation, that are central to
achieving the objectives of Life Science subject content.
The empirical research design employed in the study comprised a quantitative, quasi-
experimental research design in which a Thinking Maps intervention was implemented on a
rotation basis in two experiments with experimental and control groups with a purposively
selected group of first year pre-service teachers (n = 56) at a South African university. The
twelve-week Thinking Maps intervention programme, also presented on a rotational basis, was
underpinned by cognitive and constructivist learning theory and implemented Thinking Maps as
a teaching strategy that supported the facilitation of independent teaching and learning. The
study aimed to determine if a Thinking Maps intervention could enhance the development of
critical thinking.
Descriptive and inferential statistical procedures were employed to analyse pre-test and post-
test data, and data obtained through the Thinking Maps constructed by the students. The pre-
test results obtained for Experiment 1 and Experiment 2 revealed that the students’ critical
thinking skills to analyse, synthesise and evaluate, were in need of development. After a twelve
week Thinking Maps intervention with Experimental group 1 and 2 on a rotation basis, the
latent potential for enhancing critical thinking skills through Thinking Maps was observed.
Normal lecturing apparently also contributed to some extent to enhancing the development of
the critical thinking skills. Although some improvement in the application of the participants’
critical thinking skills was noticed, the students still appeared to be beginning thinkers with an
average ability to apply critical thinking. More continuous and purposeful development of the
critical thinking skills seem to be necessary to sustain the development and application of the
skills to enable the students to become master thinkers. Moreover, the universal intellectual
standards of reasoning involved in critical thinking apparently did not benefit from the Thinking
Maps intervention. The study is concluded with recommendations to further enhance the
development of critical thinking.
3 In the context of this research, first year prospective education students will be the focus of the study, and will therefore focus on using the term “students”. The information provided in the study could however also include “learners” at school.

vii
TABLE OF CONTENTS
DECLARATION ......................................................................................................................... i
LANGUAGE EDITING .............................................................................................................. ii
DEDICATION ........................................................................................................................... iii
ACKNOWLEDGEMENTS ........................................................................................................ iv
SUMMARY ................................................................................................................................ v
TABLE OF CONTENTS .......................................................................................................... vii
LIST OF TABLES .................................................................................................................. xiv
LIST OF FIGURES ................................................................................................................. xvi
CHAPTER 1 INTRODUCTION AND STATEMENT OF THE PROBLEM .................................. 1
1.1 INTRODUCTION AND STATEMENT OF THE PROBLEM ......................................... 1
1.2 PURPOSE STATEMENT ............................................................................................ 4
1.3 CONCEPTUAL FRAMEWORK ................................................................................... 5
1.3.1 Critical thinking ......................................................................................................... 5
1.3.2 Thinking Maps ........................................................................................................... 5
1.3.3 Other concept clarifications...................................................................................... 6
1.4 THEORETICAL FRAMEWORK .................................................................................. 8
1.5 RESEARCH QUESTION ............................................................................................. 8
1.5.1 Central question ........................................................................................................ 8
1.5.2 Secondary research questions ................................................................................. 8
1.6 AIM AND OBJECTIVES OF THE STUDY ................................................................... 9
1.7 HYPOTHESES AND VARIABLES ............................................................................ 10
1.8 EMPIRICAL RESEARCH .......................................................................................... 11
1.8.1 Literature study ....................................................................................................... 11
1.8.2 Research paradigm ................................................................................................. 11
1.8.3 Research design ...................................................................................................... 11
1.8.4 Research strategy .................................................................................................... 11
1.8.5 Research participants ............................................................................................. 11
1.9 METHODS OF DATA COLLECTION ........................................................................ 12
1.9.1 Tests ......................................................................................................................... 12
1.9.2 Student Thinking Maps ........................................................................................... 12
1.10 QUALITY CRITERIA: VALIDITY AND RELIABILITY ............................................... 12
1.10.1 Validity ...................................................................................................................... 12
1.10.1.1 Validity of the quantitative research design ................................................................ 13

viii
1.10.1.2 Validity of the tests ..................................................................................................... 13
1.10.1.3 Validity of the experimental research strategy ............................................................ 13
1.10.2 Reliability ................................................................................................................. 13
1.11 DATA ANALYSIS...................................................................................................... 14
1.11.1 Tests ......................................................................................................................... 14
1.11.2 Thinking Maps ......................................................................................................... 14
1.12 ETHICAL CONSIDERATIONS .................................................................................. 14
1.13 DATA COLLECTION PROCESS .............................................................................. 14
1.14 THINKING MAPS INTERVENTION ........................................................................... 16
1.15 CHAPTER DIVISION ................................................................................................. 16
1.16 CHAPTER SUMMARY .............................................................................................. 17
CHAPTER 2 CRITICAL THINKING IN LIFE SCIENCES: A CONCEPT CLARIFICATION ..... 19
2.1 INTRODUCTION ....................................................................................................... 19
2.2 CRITICAL THINKING: A CONCEPT CLARIFICATION ............................................ 20
2.2.1 The nature of critical thinking ................................................................................. 20
2.2.2 Core critical thinking skills and metacognitive strategies .................................... 23
2.2.3 Critical thinking dispositions/behavioural traits ................................................... 23
2.2.4 Universal intellectual standards of reasoning ....................................................... 25
2.2.5 Elements of thought ................................................................................................ 26
2.2.6 Intellectual traits ...................................................................................................... 26
2.3 THE IMPORTANCE OF CRITICAL THINKING ......................................................... 27
2.3.1 The importance of critical thinking at school level: The CAPS Curriculum ........ 28
2.3.2 Critical thinking and teaching and learning in the 21st century ............................ 29
2.3.3 Critical thinking as a life skill .................................................................................. 32
2.3.4 Critical thinking and its role in Life Sciences ........................................................ 33
2.4 THE CRITICAL THINKING ABILITIES OF PRE-SERVICE TEACHERS .................. 35
2.4.1 An international perspective ................................................................................... 35
2.4.2 A national perspective............................................................................................. 36
2.5 ASSESSING CRITICAL THINKING SKILLS ............................................................. 36
2.5.1 Introduction .............................................................................................................. 36
2.5.2 Multiple-choice tests ............................................................................................... 37
2.5.3 Open-ended information assessment .................................................................... 40
2.5.4 Commercially available critical thinking tests (Published tests).......................... 41
2.5.5 Assessing the development of critical thinking in the context of the research ................................................................................................................... 43
2.6 FACTORS INFLUENCING THE DEVELOPMENT OF CRITICAL THINKING SKILLS ...................................................................................................................... 44
2.6.1 Political factors ........................................................................................................ 44

ix
2.6.2 Educational factors ................................................................................................. 44
2.6.3 Personal and behavioural factors .......................................................................... 46
2.6.4 Cultural factors ........................................................................................................ 46
2.6.5 Language factors ..................................................................................................... 47
2.7 TEACHING FOR CRITICAL THINKING .................................................................... 48
2.7.1 Teaching and learning theories and their relation to the development of critical thinking ........................................................................................................ 48
2.7.1.1 Behaviourism ............................................................................................................. 48
2.7.1.2 Cognitivism ................................................................................................................ 49
2.7.1.3 Constructivism ........................................................................................................... 49
2.7.1.4 Transformative learning theory .................................................................................. 51
2.7.1.5 Experiential learning .................................................................................................. 52
2.7.2 Teaching methods, teaching strategies to develop critical thinking ................... 53
2.7.2.1 Direct teaching methods and related strategies ......................................................... 55
2.7.2.2 Indirect teaching methods and related strategies ....................................................... 56
2.7.2.3 Independent teaching methods and related strategies ............................................... 57
2.7.2.4 Interactive/participative teaching methods and related strategies .............................. 64
2.8 CHAPTER SUMMARY .............................................................................................. 68
CHAPTER 3 DEVELOPING CRITICAL THINKING THROUGH VISUAL LEARNING: THE ROLE OF THINKING MAPS ............................................................................. 70
3.1 INTRODUCTION ....................................................................................................... 70
3.2 CHARACTERISTICS OF EFFECTIVE LEARNING ................................................... 71
3.3 LEARNING STYLES ................................................................................................. 73
3.3.1 Introduction .............................................................................................................. 73
3.3.2 Visual learning ......................................................................................................... 73
3.3.3 Auditory learning ..................................................................................................... 73
3.3.4 Kinaesthetic learning .............................................................................................. 73
3.3.5 Learning through reflection .................................................................................... 73
3.4 TYPES OF VISUAL LEARNING STRATEGIES ........................................................ 74
3.4.1 Mind Maps ................................................................................................................ 74
3.4.2 Concept Maps .......................................................................................................... 75
3.4.3 Graphic Organisers ................................................................................................. 76
3.4.4 Charts and diagrams ............................................................................................... 77
3.5 THINKING MAPS AS VISUAL TEACHING AND LEARNING STRATEGY TO ENHANCE THE DEVELOPMENT OF CRITICAL THINKING.................................... 79
3.5.1 The difference between Thinking Maps and other visual strategies .................... 79
3.5.2 Thinking Maps: A concept clarification ................................................................. 80
3.5.3 Types of Thinking Maps and their related functions ............................................. 80
3.5.3.1 Circle Maps................................................................................................................ 81

x
3.5.3.2 Bubble Maps .............................................................................................................. 82
3.5.3.3 Double Bubble Map ................................................................................................... 84
3.5.3.4 Tree Maps ................................................................................................................. 85
3.5.3.5 Brace Map ................................................................................................................. 86
3.5.3.6 Flow Map ................................................................................................................... 87
3.5.3.7 Multi-Flow Map .......................................................................................................... 88
3.5.3.8 Bridge Map ................................................................................................................ 89
3.5.3.9 The Frame of Reference ............................................................................................ 90
3.5.4 The role and place of Thinking Maps in Life Sciences to enhance the development of critical thinking ............................................................................. 91
3.5.5 Assessing students’ Thinking Maps ...................................................................... 92
3.6 CHAPTER SUMMARY .............................................................................................. 95
CHAPTER 4 EMPIRICAL RESEARCH DESIGN .................................................................... 97
4.1 INTRODUCTION ....................................................................................................... 97
4.2 RESEARCH PARADIGM .......................................................................................... 97
4.2.1 What is a research paradigm? ................................................................................ 97
4.2.2 Types of research paradigms ................................................................................. 98
4.2.2.1 Positivism .................................................................................................................. 98
4.2.2.2 Interpretivism/Socio-constructivism ............................................................................ 98
4.2.2.3 Pragmatism ............................................................................................................... 98
4.2.2.4 Critical theory ............................................................................................................. 98
4.2.2.5 Advocacy participatory view ....................................................................................... 99
4.3 RESEARCH AIM, OBJECTIVES, HYPOTHESES AND VARIABLES ....................... 99
4.4 RESEARCH METHODOLOGY ............................................................................... 101
4.4.1 Research design .................................................................................................... 101
4.4.1.1 Quantitative research design ................................................................................... 102
4.4.2 Research strategy .................................................................................................. 103
4.4.2.1 Quasi-experimental research ................................................................................... 103
4.4.3 Data collection methods ....................................................................................... 105
4.4.3.1 Pre- and Post-testing ............................................................................................... 105
4.4.3.2 Student Thinking Maps ............................................................................................ 111
4.4.4 Sampling ................................................................................................................ 111
4.4.5 Data analysis and interpretation ........................................................................... 112
4.4.5.1 Multiple-choice test items ......................................................................................... 112
4.4.5.2 Open questions ....................................................................................................... 114
4.4.6 Quality criteria ....................................................................................................... 114
4.4.6.1 Validity ..................................................................................................................... 114
4.4.6.2 Reliability ................................................................................................................. 118

xi
4.4.7 Ethical considerations........................................................................................... 118
4.4.7.1 Research problem ................................................................................................... 118
4.4.7.2 Purpose of research ................................................................................................ 119
4.4.7.3 Data collection ......................................................................................................... 119
4.4.7.4 Data analysis and interpretation ............................................................................... 120
4.4.7.5 Writing and disseminating research ......................................................................... 120
4.5 CHAPTER SUMMARY ............................................................................................ 120
CHAPTER 5 THE THINKING MAPS INTERVENTION PROGRAMME ................................. 123
5.1 INTRODUCTION ..................................................................................................... 123
5.2 INTERVENTION RESEARCH ................................................................................. 123
5.2.1 Definition ................................................................................................................ 123
5.2.2 The purpose of intervention research .................................................................. 124
5.2.3 The stages of intervention research ..................................................................... 124
5.2.3.1 Stage 1: Problem analysis and project planning ..................................................... 124
5.2.3.2 Stage 2: Information gathering and synthesis .......................................................... 127
5.2.3.3 Stage 3: Design ....................................................................................................... 128
5.2.3.4 Stage 4: Early development and pilot testing .......................................................... 129
5.2.3.5 Stage 5: Evaluation and advanced development .................................................... 130
5.2.3.6 Stage 6: Dissemination ........................................................................................... 130
5.2.4 The stages of intervention research applicable to the study ............................. 130
5.3 THE TWELVE-WEEK INTERVENTION PROGRAMME FOR LIFE SCIENCES ...... 131
5.3.1 The theoretical framework for the intervention programme ............................... 132
5.3.1.1 The learning theory underpinning the intervention programme ................................ 132
5.3.1.2 The teaching method and strategies underpinning the intervention programme ...... 132
5.3.1.3 The Thinking Maps used in the context of the intervention ....................................... 133
The interrelated application of the Thinking Maps that was promoted during the intervention, is explained below. .............................................................................. 133
5.3.2 The six-week intervention with Experimental Group 1 and 2 ............................. 133
5.4 CHAPTER SUMMARY ............................................................................................ 147
CHAPTER 6 DATA ANALYSIS AND INTERPRETATION .................................................... 148
6.1 INTRODUCTION ..................................................................................................... 148
6.2 RELIABILITY OF THE TEST DATA ........................................................................ 149
6.2.1 Skewness and kurtosis ......................................................................................... 149
6.3 BIOGRAPHIC INFORMATION OF THE PARTICIPANTS ....................................... 150
6.3.1 Biographic information of students ..................................................................... 151
6.4 DATA ANALYSIS AND INTERPRETATION: PRE- AND POST-TESTS ................. 154
6.4.1 Introduction ............................................................................................................ 154
6.4.2 Data analysis and interpretation: Experimental group 1 .................................... 156

xii
6.4.3 Data analysis and interpretation: Experimental group 2 .................................... 162
6.5 DATA ANALYSIS AND INTERPRETATION: COMPARISON BETWEEN PARTICIPANTS – EXPERIMENTAL GROUP 1 AND 2 ......................................... 167
6.6 DATA ANALYSIS AND INTERPRETATION: THINKING MAPS WORKSHEETS -EXPERIMENT 1 AND 2 .......................................................................................... 175
6.7 DATA ANALYSIS AND INTERPRETATION: OPEN RESPONSES – PRE- AND POST-TESTS .......................................................................................................... 179
6.7.1 Open responses Experimental group 1 and 2 ..................................................... 180
6.7.1.1 Pre-test 1 and Post-test 1 B ..................................................................................... 180
6.7.1.2 Post-test 1 ............................................................................................................... 182
6.7.1.3 Pre-test 2 and post-test 2B ..................................................................................... 184
6.7.1.4 Post-test 2 ............................................................................................................... 186
6.8 CHAPTER SUMMARY ............................................................................................ 190
CHAPTER 7 SUMMARY, FINDINGS AND RECOMMENDATIONS ..................................... 192
7.1 INTRODUCTION ..................................................................................................... 192
7.2 OVERVIEW OF THE STUDY .................................................................................. 193
7.2.1 Chapter 1 ................................................................................................................ 193
7.2.2 Chapter 2 ................................................................................................................ 194
7.2.3 Chapter 3 ................................................................................................................ 196
7.2.4 Chapter 4 ................................................................................................................ 197
7.2.5 Chapter 5 ................................................................................................................ 198
7.2.6 Chapter 6 ................................................................................................................ 199
7.3 FINDINGS FROM THE LITERATURE REVIEW ...................................................... 201
7.4 FINDINGS FROM THE EMPIRICAL RESEARCH ................................................... 203
7.4.1 Experimental group 1 ............................................................................................ 203
7.4.2 Experimental group 2 ............................................................................................ 204
7.5 FINDINGS IN RELATION TO THE AIM AND OBJECTIVES OF THE STUDY ........ 210
7.6 ACCEPTING OR REJECTING HYPOTHESES ....................................................... 216
7.7 RECOMMENDATIONS ........................................................................................... 219
7.7.1 Recommendations: Enhancing critical thinking ................................................. 219
7.7.2 Recommendations: Using Thinking Maps as a teaching strategy ..................... 221
7.7.3 Researcher’s view of classrooms conducive to the development of critical thinking .................................................................................................................. 224
7.8 LIMITATIONS OF THE STUDY ............................................................................... 228
7.9 SUGGESTIONS FOR FURTHER RESEARCH ....................................................... 229
7.10 CONTRIBUTIONS OF THE STUDY ........................................................................ 230
7.11 CONCLUSIONS ...................................................................................................... 231
BIBLIOGRAPHY ................................................................................................................... 233
APPENDIX A ETHICAL CLEARANCE ................................................................................. 250

xiii
APPENDIX B LETTERS OF CONSENT ............................................................................... 252
LETTER OF CONSENT TO ADMINISTRATIVE PERIOD ..................................................... 253
LEARNERS (ENGLISH) ....................................................................................................... 254
LEARNERS (AFRIKAANS) .................................................................................................. 269
PARENTS (ENGLISH) .......................................................................................................... 284
PARENTS (AFRIKAANS) ..................................................................................................... 299
APPENDIX C PRE- AND POST-TESTS ............................................................................... 314
APPENDIX D THINKING MAPS OF PARTICIPANTS .......................................................... 347
APPENDIX E OPEN RESPONSES TO QUESTIONS ........................................................... 368

xiv
LIST OF TABLES
Table 2.1: Objectives of the CAPS Grades R-12 and links to the elements of critical thinking ........................................................................................................ 28
Table 2.2 Skills expected from learners in Life Sciences and links to the elements of critical thinking ......................................................................................... 34
Table 2.3: Multiple-choice critical thinking tests in Life Sciences (Adapted from Norris & Ennis, 1989:107) ............................................................................ 38
Table 2.4: The different open-ended approaches and possible critical thinking outcomes ..................................................................................................... 40
Table 2.5: Commercially developed critical thinking tests ............................................. 42
Table 2.6: Direct teaching strategies ............................................................................. 55
Table 2.7: Indirect teaching strategies .......................................................................... 56
Table 2.8: Independent strategies ................................................................................. 58
Table 2.9: Steps during problem-solving ....................................................................... 60
Table 2.10: Different kinds of open procedural questions used during teaching .............. 64
Table 2.11: Cooperative learning methods ..................................................................... 65
Table 2.12 Additional cooperative learning strategies. ................................................... 66
Table 3.1: Differences between Thinking Maps and other visual strategies .................. 79
Table 3.2: Thinking Maps Checklist .............................................................................. 93
Table 3.3: Thought processes and Thinking Maps applicable in the research ............... 94
Table 3.4: Checklist for assessing the Thinking Maps in terms of relevancy and elaboration (detail) ....................................................................................... 95
Table 4.1: Procedural program for the first semester .................................................. 109
Table 5.1: Procedural programme .............................................................................. 129
Table 5.2: Visual summary of the intervention research .............................................. 131
Table 5.3: The six-week intervention programme with Experimental group 1 .............. 135
Table 5.4: The six-week intervention programme with Experimental Group 2 ............. 141
Table 6.1: Skewness and kurtosis .............................................................................. 150
Table 6.2: Home language .......................................................................................... 151
Table 6.3: Gender ....................................................................................................... 152
Table 6.4 Type of school ............................................................................................ 152
Table 6.5: Cultural Group ............................................................................................ 153
Table 6.6: Time line for various tests .......................................................................... 156
Table 6.7: Test data: Participants Experimental group 1 ............................................. 157

xv
Table 6.8: Test data: Participants Experimental group 2 ............................................. 163
Table 6.9: Test data: Comparison Experimental group 1 (E1) and Experimental group 2 (E2) ............................................................................................... 169
Table 6.10: Comparison Participants Experiment 1 and 2: Thinking Maps worksheets ................................................................................................. 176
Table 6.11: Breakdown of test questions ...................................................................... 180
Table 6.12: Pre-test 1 and Post-test 1B – Examples of motivations .............................. 181
Table 6.13: Post-test 1 – Examples of motivations........................................................ 183
Table 6.14: Pre-test 2 and post-test 2B – Examples of motivations .............................. 185
Table 6.15: Post-test 2 – Examples of motivations........................................................ 187

xvi
LIST OF FIGURES
Figure 1.1: Thinking Maps and associated thought processes ......................................... 6
Figure 2.1: Good critical thinking (Adapted from Grosser, 2016b (in press); Paul & Elder, 2006:21) ............................................................................................ 22
Figure 2.2: From the agricultural age to the conceptual age (Pink, 2006:49) .................. 31
Figure 2.3 Teaching styles and specific methods (adapted from Grosser, 2009:4)........ 54
Figure 2.5: The scientific method (Gebhart et al., 2012:4) .............................................. 63
Figure 3.1: Mind Map ..................................................................................................... 75
Figure 3.2: Concept Map (Novak, 2006:1) ..................................................................... 76
Figure 3.3: Graphic Organisers (Figueras, 2013) ........................................................... 77
Figure 3.4: Chart and diagrams (Google images)........................................................... 78
Figure 3.5: Circle Map:Describing the scientific method (Adapted from Hyerle & Yeager, 2007:24) ......................................................................................... 82
Figure 3.6: Bubble Map: Characteristics of the prokaryotic cell (Adapted from Hyerle & Yeager, 2007:30) ...................................................................................... 83
Figure 3.7: Double Bubble Map: Comparing the eukaryotic cell and the prokarytotic cell (Adapted from Hyerle & Yeager, 2007:36) ............................................. 84
Figure 3.8: Tree Map: Classifying microscopes (Adapted from Hyerle & Yeager, 2007:42) ....................................................................................................... 85
Figure 3.9: Brace Map : Analysing the eukaryotic cell (Adapted from Hyerle & Yeager, 2007:48) ......................................................................................... 86
Figure 3.10: Flow Map: Steps in the scientific method (Adapted from Hyerle & Yeager, 2007:54) ......................................................................................... 87
Figure 3.11: Multi-Flow Map: The effect of stains (Adapted from Hyerle & Yeager, 2007:60) ....................................................................................................... 89
Figure 3.12: Bridge Map: Reagents and food tests(Adapted from Hyerle & Yeager, 2007:66) ....................................................................................................... 90
Figure 6.1: Home Language ........................................................................................ 151
Figure 6.2: Gender ....................................................................................................... 152
Figure 6.3: Type of school ............................................................................................ 153
Figure 6.4: Cultural group ............................................................................................ 154
Figure 6.5: Comparison of test results: Experimental group 1 ..................................... 156
Figure 6.6: Comparison of test results: Experimental group 2 .................................... 162
Figure 6.7: Comparison of test results: Experimental group 1 and 2 .......................... 168
Figure 6.8: Lesson structure during the Thinking Maps intervention ............................. 175

xvii
Figure 7.1: A visual representation of the development of critical thinking in Life Sciences as conceptualised by the researcher ........................................... 224
Figure 7.2: Five-step model to move students towards critical thinking (Duron et al., 2006:161) ................................................................................................... 226

Chapter 1: Introduction and statement of the problem 1
CHAPTER 1
INTRODUCTION AND STATEMENT OF THE PROBLEM
1.1 INTRODUCTION AND STATEMENT OF THE PROBLEM
In this research the researcher determined the impact of Thinking Maps to enhance the
development of critical thinking skills among first year pre-service Life Science teachers at a
university in South Africa.
According to the pioneers in the field of critical thinking research, critical thinking is
multidimensional in nature (Ennis, 2001:44; Facione, 2009:5, 6; McPeck, 1981:20; Paul,
1993:58). Critical thinking comprises the development of core critical cognitive skills and
metacognitive strategies, dispositions/attitudes/habits of mind/behavioural traits, intellectual
traits, and universal intellectual standards of reasoning that are applied to the elements of
thought (Ennis, 2001:44; Facione, 2009:5, 6; McPeck, 1981:20; Paul, 1993:58) (cf. 2.2). The
cognitive skills involve, among others, problem-solving, formulating inferences, decision-making,
logical and cohesive reasoning, analysis, synthesis, questioning, evaluation/judgement,
identifying assumptions and inductive and deductive reasoning. The metacognitive strategies
involve self-regulation of thought and explanation (Dewey & Bento, 2009:335). The
dispositions/behavioural traits, attitudes or habits of mind comprise intellectual
curiosity/inquisitiveness, scepticism/seeking the truth, desiring to obtain the best understanding
of a given situation, being open-minded, analytical, systematic and judicious, and having self-
confidence in reasoning, desiring to obtain the best understanding of a given situation and being
open-minded to allow others to voice opinions (Ennis, 2001:44; Facione, 2009:8; Grosser,
2016a:68; Halpern, 2007:10; Paul & Elder, 2006:14, 14). The intellectual traits refer to the
unique qualities and patterns of thinking that include humility, courage, empathy, autonomy,
integrity and perseverance (Paul & Elder, 2006:13, 14).
In the context of the research, the researcher mainly focused on three core critical thinking skills
which stand central to the mastering of learning content in B.Ed. Life Sciences at school and at
first year pre-service teacher-training level, namely: analysis, synthesis and evaluation
(Department of Basic Education, 2011:14-18). In addition, although not the main focus of the
study, the researcher also explored whether the universal intellectual standards of reasoning
could benefit from the Thinking Maps intervention.
The development of critical thinking skills has been on the agenda of South African education
since 1997. The new National Curriculum and Assessment Policy Statement (CAPS) Grades R-
12 continues to support teaching and learning that should nurture the cognitive and

Chapter 1: Introduction and statement of the problem 2
metacognitive processes as well as intellectual dispositions that are important for critical
thinking. Learners should be able to:
identify and solve problems and make decisions using critical and creative thinking;
work effectively as individuals and with others as members of a team;
organise and manage themselves and their activities responsibly and effectively;
collect, analyse, organise and critically evaluate information;
communicate effectively using visual, symbolic and/or language skills in various modes;
use science and technology effectively and critically, showing responsibility towards the
environment and the health of others; and
demonstrate an understanding of the world as a set of related systems by recognising that
problem-solving contexts do not exist in isolation (Department of Basic Education, 2011:4,
5).
Against the background of the aforementioned CAPS objectives, it seems reasonable to
assume that teachers should be key role-players in ensuring that learners at school develop
good critical thinking skills. Completed national and international research studies, however,
report the opposite. These studies point to the fact that the development of critical thinking skills
among pre-service teachers appears to be fragile and deficient (Allamnakhrah, 2013; Hashim,
2010; Lombard & Grosser, 2008; Scholtz et al., 2008; Zascavage, 2010). The likelihood of pre-
service Life Science teachers lacking effective critical thinking skills is therefore a reality. The
researcher argues that developing and/or improving the application of critical thinking skills
among pre-service teachers in Life Sciences is important, as teachers first have to possess
critical thinking skills before they can teach and develop the skills among learners at school.
The use of Thinking Maps as a teaching strategy to develop critical thinking processes
dispositions/behavioural traits, intellectual traits and universal intellectual standards of
reasoning is highlighted in the literature as a programme that consists of a set of eight visual
maps (Hyerle & Yeager, 2007:2). Each map is designed to represent a specific cognitive
process that can be used in a multidisciplinary and integrated fashion across age groups in any
subject field (Hudson, 2013:9).
Qualitative and quantitative research projects on improving critical thinking skills by means of
intervention programmes with various teaching strategies have been conducted nationally and
internationally among a variety of participants at all school levels, learners with special needs,
and undergraduate students. The focus areas of the completed research include Technology
(Arencibia, 2013:2), special needs (Boucher, 2010:9), Life Sciences (Avia, 2010:1), Natural

Chapter 1: Introduction and statement of the problem 3
Sciences (Naidoo, 2011:1), Mathematics (Slater, 1995:1), Web Design (Botha, 2004:1),
Physical Sciences (Galyam, 2004:1), and Computer Science (Jordaan, 1998:1). None of the
aforementioned studies evaluated the impact of Thinking Maps for enhancing the development
of critical thinking skills among pre-service Life Science teachers.
Only three research studies conducted internationally (Hudson, 2013; Russell, 2010; Sunseri,
2011) that determine the effectiveness of Thinking Maps could be located. Mixed method
research by Russell (2010:4) determined the impact of Thinking Maps on the reading
comprehension of elementary fourth and fifth grade learners. The findings revealed there was
no statistical significant difference between the groups receiving Thinking Maps and those not
receiving Thinking Maps instruction.
Two quantitative research studies by Hudson (2013:10) and Sunseri (2011:8) respectively,
determined the impact of Thinking Maps on fourth and fifth grade students’ expository texts.
According to Sunseri (2011:99), the main findings indicate that Thinking Maps do not have a
statistically significant impact on improving students’ writing. Secondly, research by Hudson
(2013:3) determined the effect of Thinking Maps on fifth grade Science achievement, and the
findings suggest that the students who did not use Thinking Maps performed better than those
who used Thinking Maps (Hudson, 2013:3).
Furthermore, many research studies related to the development and improvement of the critical
thinking skills of pre-service teachers have been conducted. Various intervention studies
document the effects of specific teaching strategies on the development of critical thinking skills
of pre-service teachers. The implementation of inquiry-based learning (Qing et al., 2010),
philosophy of inquiry (Daniel, 2001), active learning (Burbach et al., 2010), blended learning
(Akyüz & Samsa, 2009), cognitive apprenticeship (Osana & Seymour, 2004), discussion-forums
(Umar & Ahmad, 2010) and cooperative learning (Goyak, 2009; Grosser, 1999) have all
delivered advantages and gains in terms of promoting the development of critical thinking skills
among pre-service teachers. However, despite these efforts, the critical thinking skills of pre-
service teachers still appear to be fragile and in need of development.
Statement of the problem
Teachers play an important role in developing critical thinking skills among learners in order to
achieve the outcomes of the CAPS. It is however clear from completed research that the critical
thinking skills of pre-service teachers seem to be fragile and not well-developed. As it is
reasonable to assume that teachers have to possess critical thinking skills themselves before
they can cultivate these skills among learners, eductors-training is faced with a challenge to
develop critical thinking skills among pre-service teachers. It is clear from the completed

Chapter 1: Introduction and statement of the problem 4
research studies cited above that none of these involved pre-service Life Science teachers and
did not establish the effects of Thinking Maps on enhancing the development of critical thinking
in the context of first year pre-service teachers. This research therefore wished to address a
contextual gap by focusing on pre-service teachers in South Africa, as well as a theoretical
gap by establishing the merits of Thinking Maps as teaching strategy for enhancing the
development of critical thinking.
The significance of conducting a study that would determine the impact of Thinking Maps for
enhancing critical thinking among pre-service Life Science teachers can be motivated as
follows:
The CAPS (Department of Basic Education, 2011:5) aims to produce learners who are able
to identify and solve problems and make decisions using critical and creative thinking.
Therefore, student teachers need to be equipped with strategies to enable them to achieve
the stated aim.
Thinking Maps are visual representations that provide a framework for students to construct
meaning and enhance the development of their critical thinking skills. Becoming acquainted
with the application of Thinking Maps can benefit the development of the students’ critical
thinking and provide them with a strategy to use that could enhance the quality of their own
teaching practice.
Suggestions flowing from this research could influence the future training of Life Science
teachers to become capable of applying a teaching strategy like Thinking Maps to enhance
critical thinking during their own teaching.
Findings related to the implementation and use of Thinking Maps could help schools in
adopting an effective instructional strategy that could assist teachers in achieving the
cognitive objectives of the CAPS curriculum.
Based on the introduction and formulation of the problem, the researcher formulated the
purpose of the study.
1.2 PURPOSE STATEMENT
The purpose of this quantitative, quasi-experimental study was, firstly, to determine how
effective first year pre-service Life Science teachers were at applying the critical thinking skills to
analyse, synthesise and evaluate information. Secondly, based on the pre-test results, the
researcher determined how a Thinking Maps intervention can enhance the development of
deficient and fragile critical thinking skills. By means of pre-testing and post-testing, and the

Chapter 1: Introduction and statement of the problem 5
construction of Thinking Maps, improvement in the application of the deficient and fragile critical
thinking skills was established.
Based on the aforementioned discussion, the researcher conceptualised the study as follows:
1.3 CONCEPTUAL FRAMEWORK
The key concepts that stood central to the study was critical thinking and Thinking Maps.
The researcher briefly clarifies the conceptualization for both concepts as they relate to the
context of the study, in the following sections, and extends the clarification in sections 2.2 and
3.5.
1.3.1 Critical thinking
Since the days of Socrates, Plato and Aristotle, critical thinking has been an important item on
the education agenda. Since the 1980s, pioneers in the field, Beyer (1983:45), Ennis (1985:46),
Norris (1985:42) and Paul (1988:50), have defined critical thinking. In general, these definitions
view critical thinking as the application of cognitive processes that are reflective and evaluative
in nature. Critical thinking skills have also been conceptualised according to the viewpoints of
more recent pioneers in the field of critical thinking research, namely Duron et al. (2006:160),
Paul (1985:37) and Paul and Elder (2006:4). According to Duron et al. (2006:160), Paul
(1985:37), and Paul and Elder (2006:4), critical thinking is, among other things, the ability to
answer questions of analysis, synthesis and evaluation about information. Critical thinkers raise
vital questions and problems, formulate them clearly, gather and assess relevant information,
use abstract ideas, think open-mindedly, and communicate effectively with others (Duron et al.,
2006:160).
1.3.2 Thinking Maps
Thinking Maps were conceptualised according to the viewpoint of Hyerle and Yeager (2007:1-
7). Thinking Maps is a teaching strategy consisting of a set of eight visual tools designed to help
students develop critical thinking processes and habits (Hyerle & Yeager, 2007:2). The eight
graphic organisers and the cognitive skills they address are summarised in Figure 1:1

Chapter 1: Introduction and statement of the problem 6
Figure1.1: Thinking Maps and associated thought processes
In this research, the researcher concentrated on the following maps: the Circle Map, the Tree
Map and the Multi-flow Map, as these maps provided opportunities for acquiring the skills to
analyse, synthesise and evaluate (cf. 3.5).
1.3.3 Other concept clarifications
A brief definition of other concepts central to the study is provided below.
Pre-service teacher – a student teacher who has not yet completed training.
Life Sciences – the subject Life Sciences is “the scientific study of living things from
molecular level to their interactions with one another and their environments” (Department of
Basic Education, 2011:8). According to the CAPS, Life Sciences, Grades 10-12 have three
broad subject-specific aims which relate to the purpose of learning science, namely knowing
the subject content, doing science or practical work and investigations and understanding
the applications of Life Sciences.
To achieve the aforementioned aims, learners must be able to apply the following critical
thinking skills:
organise or reorganise knowledge (analyse and synthesise);
develop flow charts and diagrams (synthesise);
recognise patterns and trends (analyse);
evaluate and categorise information;
use information in a new way (synthesise);
analyse and synthesise information/data;

Chapter 1: Introduction and statement of the problem 7
recognise relationships (analyse); and
hypothesise and identify variables (analyse and synthesise).
It is clear from the aforementioned that the critical thinking skills to analyse, synthesise and
evaluate are particularly important. This research focused on the interrelated applicaton of these
three critical thinking skills, that are briefly defined below.
Analysis – Analysis is the ability to identify and infer relationships among facts, ideas,
concepts, information and opinions (Facione, 2009:5).
Synthesis – Synthesis is defined as combining a number of different parts, ideas or pieces
of information to come up with a new idea or theory. Synthesis thus requires original or
creative thinking in order to recognise new problems and develop new strategies to solve
them or to create new plans, models and hypotheses (Nieman & Pienaar, 2010:81).
Evaluation – Evaluation is the ability to determine the significance, worth or credibility of
statements, perceptions, experiences, judgements, beliefs or opinions, and to assess the
logical strength of an argument, statement or description (Facione, 2009:5).
The following three Thinking Maps were used in the intervention to enhance the critical thinking
skills, and the choice is briefly defined according to Hyerle and Yeager (2007:24-60).
Circle Map – The Circle Map consists of two circles, a small inner circle and a larger outside
circle. Words, numbers, pictures, signs or symbols defining or trying to understand the
object, person or idea, are written in the inner circle. Context information that define the idea
or concept are written in the larger outside circle. The Circle Map enables one to organise
and reorganise knowledge, thus applying the skills of analysis and synthesis (cf. Figure 1.1,
Figure 3.5).
Tree Map – The Tree Map focuses on the skills to analyse and synthesise information by
means of classification. The category name or main idea is written on the top line with a
connecting line down to individual sub-categories or supporting ideas. Details for the sub-
categories or supporting ideas can be added to the Tree Map (cf. Figure 1.1, Appendix D).
Multi-Flow Map – The Multi-Flow Map is used for analysing and evaluating cause and
effect relationships. An important event is written in the middle rectangle, with the causes of
this event written on the left side of the event and the effects on the right side. All arrows
must point to the right, indicating how the causes lead into the event and the effects lead out
of the event (cf. Figure 1.1, Figure 3.11).
Chapter 1: Introduction and statement of the problem 8
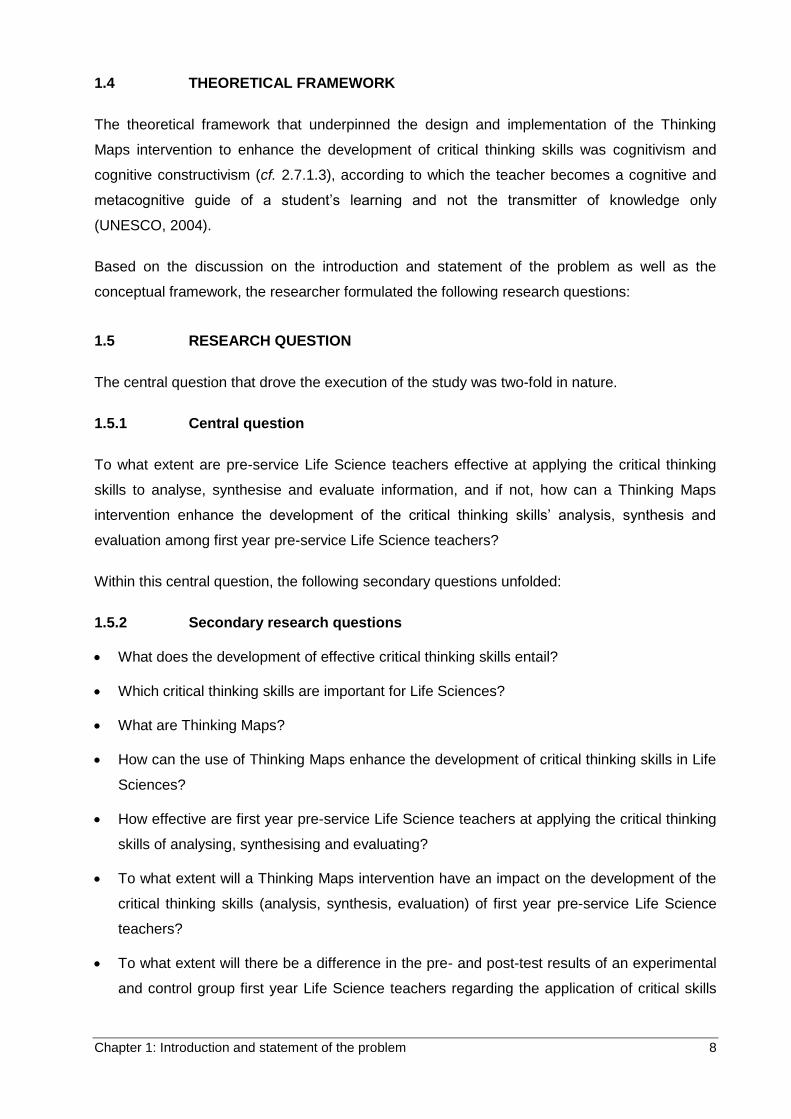
1.4 THEORETICAL FRAMEWORK
The theoretical framework that underpinned the design and implementation of the Thinking
Maps intervention to enhance the development of critical thinking skills was cognitivism and
cognitive constructivism (cf. 2.7.1.3), according to which the teacher becomes a cognitive and
metacognitive guide of a student’s learning and not the transmitter of knowledge only
(UNESCO, 2004).
Based on the discussion on the introduction and statement of the problem as well as the
conceptual framework, the researcher formulated the following research questions:
1.5 RESEARCH QUESTION
The central question that drove the execution of the study was two-fold in nature.
1.5.1 Central question
To what extent are pre-service Life Science teachers effective at applying the critical thinking
skills to analyse, synthesise and evaluate information, and if not, how can a Thinking Maps
intervention enhance the development of the critical thinking skills’ analysis, synthesis and
evaluation among first year pre-service Life Science teachers?
Within this central question, the following secondary questions unfolded:
1.5.2 Secondary research questions
What does the development of effective critical thinking skills entail?
Which critical thinking skills are important for Life Sciences?
What are Thinking Maps?
How can the use of Thinking Maps enhance the development of critical thinking skills in Life
Sciences?
How effective are first year pre-service Life Science teachers at applying the critical thinking
skills of analysing, synthesising and evaluating?
To what extent will a Thinking Maps intervention have an impact on the development of the
critical thinking skills (analysis, synthesis, evaluation) of first year pre-service Life Science
teachers?
To what extent will there be a difference in the pre- and post-test results of an experimental
and control group first year Life Science teachers regarding the application of critical skills

Chapter 1: Introduction and statement of the problem 9
(analysis, synthesis, evaluation) after a Thinking Maps intervention, and in the absence of a
Thinking Maps intervention, respectively?
To what extent will a Thinking Maps intervention contribute to the development of the
universal intellectual standards of reasoning involved in critical thinking?
The last question was not a main focus of the study, but the researcher wanted to obtain initial
data for a future study in relation to whether students could apply the intellectual standards of
reasoning to the motivations they provide for test answers.
Based on the research questions, the following main aim and objectives were formulated:.
1.6 AIM AND OBJECTIVES OF THE STUDY
The main aim of the study was to determine to what extent first year pre-service Life Sciences
teachers are effective at applying the critical thinking skills to analyse, synthesise and evaluate
information, and if not, to establish how Thinking Maps can enhance the development of the
critical thinking skills analysis, synthesis and evaluation among first year pre-service Life
Science teachers.
The main aim was operationalised in the following objectives.
To determine what the development of critical thinking skills entails by means of a literature
review.
To determine which critical thinking skills are important for Life Sciences by means of a
literature review.
To explain what Thinking Maps are by means of a literature review.
To investigate how Thinking Maps can enhance the development of critical thinking skills in
Life Sciences by means of a literature review.
To determine how effective first year pre-service Life Science teachers are in applying the
critical thinking skills of analysing, synthesising and evaluating by means of a pre-test.
To examine to what extent a Thinking Maps intervention can develop the critical thinking
skills of analysing, synthesising and evaluating among first year pre-service Life Science
teachers by means of a post-test, and the Thinking Maps constructed by the pre-service
teachers during the intervention.
To examine to what extent there will be a difference in the pre- and post-test results of an
experimental and control group regarding the application of critical skills, after a Thinking

Chapter 1: Introduction and statement of the problem 10
Maps intervention, and in the absence of a Thinking Maps intervention, respectively, by
comparing the pre-and post-test results of the different groups.
To establish to what extent a Thinking Maps intervention would contribute to the
development of the universal intellectual standards of reasoning involved in critical thinking
by means of open pre-test and post-test questions.
As the study would be determining cause and effect relationships, the following tentative
hypotheses guided the execution of the study.
1.7 HYPOTHESES AND VARIABLES
The following tentative research hypotheses regarding the impact of Thinking Maps to enhance
the development of critical thinking skills among first year pre-service Life Science teachers
were proposed:
H01: There will be no statistically significant difference in the application of critical thinking skills
between the pre- and post-test results of participants in Experimental groups 1 and 2 after
completion of the Thinking Maps intervention.
Ha1: There will be a statistically significant difference in the application of critical thinking skills
between the pre- and post-test results of participants in Experimental groups 1 and 2 after
completion of the Thinking Maps intervention.
H02: There will be no statistically significant difference in the application of critical thinking skills
between the pre- and post-test results of participants in Experimental groups 1 and 2 after
normal classroom teaching/lecturing (in the absence of teaching with Thinking Maps).
Ha2: There will be a statistically significant difference in the application of critical thinking skills
between the pre- and post-test results of participants in Experimental groups 1 and 2 after
normal classroom teaching/lecturing (in the absence of teaching with Thinking Maps).
In the context of the study, the interrelated application of the critical thinking skills analysis,
synthesis, evaluation, was regarded as the dependent variable (Creswell, 2012:115) and the
Thinking Maps intervention as the treatment or independent variable (Creswell, 2012:116, 117).
Moreover, biographic variables such as gender, home language, culture and type of school
attended could be regarded as control variables (Creswell, 2012:117) that could have
influenced the research results. The various subgroups of the biographical variables however
did not contain sufficient participants for statistical analyses (cf. 6.3). It was therefore not
possible for the researcher to control for the influence of these variables (McMillan &
Schumacher, 2006:129).

Chapter 1: Introduction and statement of the problem 11
The researcher explains the empirical research design that was employed in the study in the
next section.
1.8 EMPIRICAL RESEARCH
1.8.1 Literature study
A literature study was undertaken to identify and define critical thinking skills, as well as the
meaning and value of Thinking Maps to enhance critical thinking. The literature study informed
the conceptual and theoretical frameworks of the study and guided the construction of the pre-
tests and post-tests used for data collection and the design and development of the Thinking
Maps intervention.
1.8.2 Research paradigm
The research was framed within a positivistic paradigm as the researcher gathered numerical
data objectively from the research participants (Jansen, 2010:21). Positivistic paradigms are
concerned with measurement, numerical data and statistical analysis (McMillan & Schumacher,
2008:254). Chapter 4 explains the research paradigm in detail (cf. 4.2).
1.8.3 Research design
The researcher used a quantitative, quasi-experimental research design in this research, as
manipulation of a dependent variable (critical thinking skills) took place with a group of
participants who were not randomly selected (Creswell, 2012:307). The research was
structured and planned, and numerical data were collected and statistically analysed (Creswell,
2009:145, Maree & Pietersen, 2010a:145). The quantitative, quasi-experimental research
design is further explored in detail in sections 4.4.1 and 4.4.2.1.
1.8.4 Research strategy
In this research the researcher used the non-equivalent groups (assignment to groups was not
random) pre-test-post-test control and comparison group design as strategy of inquiry in a
double experiment (Experiment 1 and Experiment 2) that was conducted on a rotation basis.
Chapter 4 of this research elaborates on the research strategy (cf. 4.4.2).
1.8.5 Research participants
In the context of the study non-probability, convenient and purposive sampling of the 2016 first
year Life Science pre-service teachers (n = 56) at a South African university was utilised. The
sampling procedure is further explored in Chapter 4 (cf. 4.4.4).

Chapter 1: Introduction and statement of the problem 12
The next section briefly refers to the methods of data collection applied in this research.
1.9 METHODS OF DATA COLLECTION
1.9.1 Tests
To generate data, the researcher used pre- and post-testing as a primary measure of data
collection to determine the extent to which the participants acquired the skills to execute critical
thinking (analysis, synthesis, evaluation) in Life Sciences content prior to and after a twelve-
week Thinking Maps intervention. The tests were norm-referenced, as comparisons were drawn
between the achievements of participants within and across the experimental and control
groups in Experiment 1 and 2. The tests were piloted and refined before being administered to
the study participants. Chapters 2 (cf. 2.5) and 4 (cf. 4.4.3.1) of this research outline discussions
pertaining to the construction of tests, with specific focus on multiple-choice questions,
supported by open questions, as well as the nature of the tests, respectively. The open
questions were included to provide some initial insight into the participants’ application of the
universal standards of reasoning, and was not regarded as a primary data collection method.
1.9.2 Student Thinking Maps
Based on the pre-test results, the Thinking Maps intervention was developed to address the
deficiencies noted in the pre-test results at the onset of the first six weeks (Experiment 1) and
second six weeks of the first semester of 2016 (Experiment 2). During the implementation of the
intervention, the student participants worked independently to select and construct relevant
Thinking Maps that would synthesise the subject content dealt with during lectures and to
complete activities or solve problems in Life Sciences. The researcher assessed (cf. Table 3.2,
Table 3.3) the student generated Thinking Maps (cf. 3.5), which allowed him to monitor and
gauge students’ progress in becoming familiar with the application of the critical thinking skills
on which the study focused.
How the researcher adhered to quality criteria during the execution of the research is elucidated
in the following section.
1.10 QUALITY CRITERIA: VALIDITY AND RELIABILITY
1.10.1 Validity
Validity refers to the accuracy of research data (McMillan & Schumacher, 2006:134-142). In the
context of the study, the researcher considered criteria to uphold the validity of the research
design, the data collection instrument and the experimental research strategy.

Chapter 1: Introduction and statement of the problem 13
1.10.1.1 Validity of the quantitative research design
The validity of the quantitative research design was ensured by adhering to criteria for internal,
external, construct and statistical conclusion validity (Creswell, 2012:162; Leedy & Ormrod,
2013:89-103; McMillan & Schumacher, 2008:134). How the researcher complied with each of
these aspects is clarified in Chapter 4 (cf. 4.4.6.1).
1.10.1.2 Validity of the tests
Validity of the test items was guaranteed by addressing various forms of validity, namely face,
content, construct and criterion validity (Delport & Roestenburg, 2011:173; Leedy & Ormrod,
2013:89; Pietersen & Maree, 2010c:217). How the researcher adhered to the aforementioned
criteria is discussed in Chapter 4 (cf. 4.4.6.1).
1.10.1.3 Validity of the experimental research strategy
To ensure validity of the experimental design, criteria for internal and external validity were
adhered to (Cohen et al., 2007:156-159; Lodico et al., 2010:244-249). How the researcher
dealt with these criteria is explained in Chapter 4 (cf. 4.4.6.1).
1.10.2 Reliability
To ensure reliability of the tests, a range of measures was applied.
The researcher ensured that:
The tests were bilingual.
As part of a pilot study, three experienced colleagues in the field of Life Sciences verified the
content of the tests in terms of suitability to assess critical thinking as well as the difficulty
level of the content. The researcher incorporated their suggestions and recommendations in
the final versions of the tests used to collect data.
Marking, adding and transfer of marks were double-checked by a colleague.
He was the only marker, to avoid problems with interrater reliability.
Objective tests were used to avoid inconsistency in marking.
He avoided the Halo effect by not giving participants who did well or badly in one
assessment undeserved favourable or unfavourable assessment in a follow-up assessment.
The double-checking of the marking of tests by an independent person avoided the
influence of the Halo effect (Cohen et al., 2007:159).
Reliability measures are further explained in Chapter 4 (cf. 4.4.6.2).

Chapter 1: Introduction and statement of the problem 14
The following section pays attention to the procedures used for analysing data.
1.11 DATA ANALYSIS
The data gathered by means of the tests and the Thinking Maps were analysed by means of
descriptive and inferential statistics.
1.11.1 Tests
The data analysis of the tests made use of both descriptive and inferential parametric statistics
(Creswell, 2012:182; Leedy & Ormrod, 2013:279; Pietersen & Maree, 2010a:183; Pietersen &
Maree, 2010b:198). The explanations of the statistical procedures follow in Chapter 4 (cf. 4.4.5).
The open questions used in the tests enabled the participants to motivate and explain their
answers to the closed questions. The open responses were merely checked for the application
of the universal intellectual standards of reasoning, namely clarity, logic, depth, breadth,
accuracy, significance and precision in thinking.
1.11.2 Thinking Maps
Descriptive statistical procedures were used to analyse the Thinking Maps that the student
participants constructed during the intervention.
1.12 ETHICAL CONSIDERATIONS
All the various ethical considerations pertaining to the research are discussed in detail in
Chapter 4 (cf. 4.4.7). The various ethical considerations that the researcher adhered to were:
Ethical issues in the research problem.
Ethical issues in the purpose of research.
Ethical issues in data collection.
Ethical issues in data analysis and interpretation.
Ethical issues in writing and disseminating research (Creswell, 2009:88-91; Strydom,
2011a:113-126).
The chronological execution of the data collection process is highlighted in the following section.
1.13 DATA COLLECTION PROCESS
The data collection process took place as follows:

Chapter 1: Introduction and statement of the problem 15
Ethical clearance was firstly sought from the Ethics Committee of the North-West University
(NWU), Vaal Triangle Campus. The study was approved and received an ethical clearance
number: NWU-HS-2015-0194 (cf. Appendix A).
Written consent was obtained from all the participants in the research (cf. Appendix B).
A literature review on critical thinking skills and Thinking Maps was conducted and guided
the setting of pre-test 1 and 2 and post-test 1 and 2 as well as the design and
implementation of the Thinking Maps intervention (cf. Appendix C).
A pilot study was conducted to determine the reliability and validity of the tests.
Experiment 1 commenced with pre-test 1, based on the Life Science content that the
student participants dealt with at Grade 12 level. The data were analysed, and based on the
data, the Thinking Maps intervention was compiled to address the deficiencies noted during
pre-test 1.
The Thinking Maps intervention (cf. Chapter 5) was implemented during the first semester of
2016 with the experimental group of Experiment 1 for a period of six weeks, after which
post-test 1 was written to determine the impact of the intervention. The intervention focused
on the application of critical thinking to content that emphasised working according to the
scientific method and problem-based learning. Post-test 1 was based on the content
covered with the implementation of the Thinking Maps intervention during the first six weeks
of semester 1. During this time, the control group received normal classroom lecturing for six
weeks, and also wrote post-test 1 to determine the impact of normal classroom lecturing on
the application of their critical thinking skills. The student participants who received the
Thinking Maps intervention, generated Thinking Maps during classroom lecturing and after
classroom lecturing for homework. Post-test 1B, a repetition of pre-test 1, was written
simulatenously with post-test 1.
Pre-test 2, based on the Life Science content of semester 1, that mainly emphasised the
application of critical thinking to problem-based content and content related to working
according to the scientific method dealt with in the first six weeks of the semester, was
administered during week 7 (start of semester 2). Based on the data, the Thinking Maps
intervention for Experimental group 2 was developed, linked to the problem-based content
and content related to working according to the scientific method, that would be dealt with in
weeks 7 – 12 of the 1st sememster. Thereafter, Experiment 2 followed, where the control
group (the experimental group of Experiment 1) received normal classroom lecturing for six
weeks, and the experimental group (the control group of Experiment 1) received the
Thinking Maps intervention. On completion of the Thinking Maps intervention, post-test 2
followed to determine the impact of the Thinking Maps intervention. Post-test 2 only focused

Chapter 1: Introduction and statement of the problem 16
on the application of critical thinking to content involving problem-based learning dealt with
in weeks 7-12 of the intervention. Post-test 2B, a repetition of pre-test 2, was written
simulatenously with post-test 2.
The repetition of pre-test 1 and pre-test 2 served the purpose to establish transfer and
retention of the skills acquired during the Thinking Maps intervention to different subject
content.
The data obtained by the pre-tests and post-tests and the Thinking Maps constructed by the
student participants were captured by an independent statistician at the NWU, Vaal Triangle
campus, and analysed and interpreted with the assistance of the independent statistician
and the researcher’s study leader.
The open questions in the pre-and post-tests were checked by the researcher to gather
initial data for a future study on the application of the universal intellectual standards of
reasoning involved in critical thinking (cf. 6.7).
1.14 THINKING MAPS INTERVENTION
The six stages of the intervention research model are described in Chapter 5 (cf. 5.2.3). In the
context of the study, the researcher implemented four stages, namely problem analysis and
project planning; information gathering and synthesis; design, and early development and pilot
testing.
The twelve-week intervention programme (cf. 5.3.2) was underpinned by the cognitive and
constructivist learning theory (cf. 2.7.1.3), and utilised the independent teaching method (cf.
2.7.2.3) with Thinking Maps as a teaching strategy to enhance the development of critical
thinking through problem-solving and inquiry-based learning (cf. 2.7.2.3)
1.15 CHAPTER DIVISION
The layout of this research is as follows:
Chapter 1: Introduction and statement of the problem.
Chapter 2: Literature review: Critical thinking in Life Sciences: A concept clarification.
Chapter 3: Literature review: Developing critical thinking in Life Sciences through visual
learning: The role of Thinking Maps.
Chapter 4: Empirical research design.
Chapter 5: The Thinking Maps intervention programme.
Chapter 6: Data analysis and interpretation.
Chapter 7: Summary, findings and recommendations.

Chapter 1: Introduction and statement of the problem 17
Bibliography
Appendixes
1.16 CHAPTER SUMMARY
This chapter began with a brief discussion to clarify what critical thinking is, and emphasised its
importance to achieve the objectives of the South African CAPS and the subject Life Sciences.
Completed national and international research studies reported that the development of critical
thinking skills among pre-service teachers appears to be fragile and deficient. The use of
Thinking Maps as a teaching strategy seemed to be a possible solution to enhance the critical
thinking development of pre-service teachers (cf. 1.1). The focus of this research dealt with
critical thinking and Thinking Maps as a teaching strategy to enhance critical thinking; therefore
a number of research studies was consulted to verify research on the topic of critical thinking
and Thinking Maps as a teaching strategy for enhancing critical thinking. Completed research in
the field of enhancing critical thinking skills has not yet established the effects of Thinking Maps
on enhancing the development of critical thinking among pre-service Life Science teachers.
Therefore, a gap in terms of specific research linked to Life Sciences as well as Thinking Maps
for enhancing critical thinking was identified (cf. 1.1).
The research question and secondary research questions of the study were formulated and
aligned with the aim and objectives of the study, which entailed determining to what extent pre-
service Life Science teachers are effective at applying the critical thinking skills to analyse,
synthesise and evaluate information, and if not, to investigate to what extent a Thinking Maps
intervention could enhance the development of critical thinking skills among first year pre-
service Life Science teachers (cf. 1.5).
The research for this research was framed within a positivistic paradigm (cf. 1.8.2), and
employed a quantitative, quasi-experimental research (cf. 1.8.3) with a non-equivalent, pre-test-
post-test control group strategy of inquiry in a double experiment (cf. 1.8.4). The research
participants and sampling (cf. 1.8.5) were also addressed and involved non-probability
convenient and purposive sampling of first year pre-service Life Science teachers (n = 56) at a
South African university. Data were collected by means of researcher-developed pre-tests and
post-tests based on the content of first year Life Sciences (cf. 1.9.1), that comprised closed and
open test items, and the Thinking Maps generated by the student participants during the
intervention and for homework (cf. 1.11.2).
Criteria for upholding reliability of the research were adhered to (cf. 1.10.1), and the validity of
this quantitative research design was secured by complying with the four aspects of internal,
external, construct and statistical validity (cf. 1.10.1.1). The tests were subjected to criteria for

Chapter 1: Introduction and statement of the problem 18
validity, and focused on ensuring face, content, construct and criterion validity (cf. 1.10.1.2). The
validity of the experimental research design was ensured by adhering to criteria for internal and
external validity (cf. 1.10.1.3).
The data analysis procedures involved descriptive and inferential statistics (cf. 1.11.1). Based
on the pre-test and post-test results comparisons were made within and across experimental
and control groups to establish the effect of the Thinking Maps intervention to enhance the
development of critical thinking skills. Only descriptive statistics were used to analyse the
Thinking Maps constructed by the student participants (cf. 1.11.2). The answers to the open test
questions were checked for the application of the universal intellectual standards of reasoning
(cf. 1.11.1). Throughout the research principles for conducting ethical research were upheld (cf.
1.12).
The following chapter, Chapter 2, focuses on a conceptualisation of critical thinking, its
importance in Life Sciences, factors that could influence the development of critical thinking,
and an overview of suitable teaching and learning theories, teaching methods, and teaching
strategies to enhance the development of critical thinking in Life Sciences.

Chapter 2: Critical thinking in life sciences: a concept clarification 19
CHAPTER 2
CRITICAL THINKING IN LIFE SCIENCES: A CONCEPT CLARIFICATION
2.1 INTRODUCTION
This chapter aims to provide a comprehensive overview of what critical thinking entails, and how
it could be enhanced. The chapter addresses the following issues:
2.2 Critical thinking: A concept clarification
The nature of critical thinking
Core critical thinking skills
Critical thinking dispositions/behavioural traits
Universal intellectual standards
Elements of thought
Intellectual traits
2.3 The importance of critical thinking
The importance of critical thinking at school level: The CAPS Curriculum
Critical thinking and teaching and learning in the 21st century
Critical thinking as a life skill
Critical thinking and its role in Life Sciences
2.4 The critical thinking abilities of pre-service teachers
An international perspective
A national perspective
2.5 Assessing critical thinking skills
Introduction
Multiple-choice tests
Open-ended information assessment
Commercially available critical thinking tests
Assessing the development of critical thinking in the context of the research

Chapter 2: Critical thinking in life sciences: a concept clarification 20
The first section in this chapter provides an extended discussion of what critical thinking entails.
As this research focused on the development of critical thinking skills, it is necessary to provide
a conceptualisation of critical thinking, in order to clearly delineate the focus of this research.
2.2 CRITICAL THINKING: A CONCEPT CLARIFICATION
2.2.1 The nature of critical thinking
The development of critical thinking has been regarded as an important outcome and ideal of
education since the days of Socrates, Plato and Aristotle (Grosser, 2016a:68). Critical thinking
in this research is conceptualised according to the viewpoints of pioneers in the field of critical
thinking research. In 1933, John Dewey (1933:15) argued that the purpose of education is to
learn and think critically. Beyer (1983:45) continued by asserting that critical thinking involves
the assessment of the authenticity, accuracy and worth of any claims made about
knowledge/information. Norris (1985:42) emphasised the metacognitive nature of critical
thinking by concluding that critical thinking refers to the application and the evaluation of one’s
own thinking. Ennis (1985:46) formulated the definition that most widely characterises critical
thinking, as thinking that is reasonable and reflective thinking, and Paul (1988:50) added that
critical thinking involves the ability to reach sound conclusions based on observations and
information. According to Duron et al. (2006:160), Paul (1985:37), and Paul and Elder (2006:4),
critical thinking involves the ability to analyse, synthesise and evaluate information. Analysis,
synthesis and evaluation are defined as critical thinking skills focusing respectively on parts of
information and their functionality in the whole, putting parts together to form a new and original
2.6 Factors influencing the development of critical thinking
Political factors
Educational factors
Personal and behavioural factors
Cultural factors
Language factors
2.7 Teaching for critical thinking
Teaching and learning theories and their relation to the development of critical thinking
Teaching methods and strategies to develop critical thinking
Researcher’s view of classrooms conducive to the development of critical thinking
2.8 Chapter summary

Chapter 2: Critical thinking in life sciences: a concept clarification 21
whole and valuing and making judgements based upon information (Brookhart, 2010:40; Ijaiya
et al., 2010:383). In addition, critical thinkers raise vital questions and problems, formulate the
questions and problems clearly, gather and assess relevant information, use abstract ideas,
think open-mindedly, and communicate effectively with others (Brookhart, 2010:40; Duron et al.,
2006:160; Ijaiya et al., 2010:383).
In essence, the researcher is of the opinion that all the cited definitions emphasise that critical
thinking entails the application of reflective and evaluative thinking processes. For the purpose
of this research the conceptualisation of critical thinking mainly supported the viewpoints of
Facione (2009:4) and Paul and Elder (2006:4) that will be elucidated below.
Facione (2009:5-6) describes critical thinking as being multidimensional in nature. Critical
thinking comprises the development of the following elements: cognitive skills and
metacognitive strategies, dispositions/attitudes/habits of mind/behavioural traits,
intellectual traits, and universal intellectual standards of reasoning that are applied to the
elements of thought (Ennis, 2001:44; Epstein & Kernberger, 2006:10; Facione, 2009:5, 6;
McPeck, 1981:20; Moore, 2011:508; Paul, 1993:58; Paul & Elder, 2006:5; Vieira et al.,
2011:45).
According to Paul and Elder (2006:21), good “critical thinkers routinely apply the intellectual
standards to the elements of reasoning in order to develop intellectual traits”. A second opinion
held by Facione (2000:64) and Profetto-McGrath (2003:572), indicate that dispositions are
prerequisites for the application of critical thinking skills, as there must be a willing mental effort
to apply the skills. Dispositions are regarded as crucial for critical thinking and according to
Facione (2000:64) and Profetto-McGrath (2003:572), critical thinking will not take place or will
be inferior if these dispositions are not regarded as important. The researcher however has a
different opinion, and argues that the core cognitive skills, metacognitive strategies,
dispositions, intellectual traits and universal intellectual standards of reasoning have to be
applied in unison, to qualify thinking as good critical thinking, as illustrated in Figure 2.1.

Chapter 2: Critical thinking in life sciences: a concept clarification 22
Elements of thought
Purpose of thinking
Obtain relevant
information
Elements of thought
Core cognitive skills and
meta-cognitive skills
strategies
Clarifying point of view
Explaining concepts/
ideas
Making inferences or
interpretations
Identifying implications
and consequences
Universal intellectual
standards of
reasoning
Clarity
Accuracy
Precision
Relevancy
Significance
Breadth
Logic
Interpretation
Analysis
Evaluation -credibility
Making inferences
Explanation
Self-regulation
Dispositions/traits
Curiosity/inquisitiveness
Scepticism/truth-seeking
Open-minded
Analytical
Seeing the big picture
Systematic
Judicious/integrity
Self-confidence in reasoning
Humility
Courage
Perseverance
Figure 2.1: Good critical thinking (Adapted from Grosser, 2016b (in press); Paul &
Elder, 2006:21)
Figure 2.1 illustrates the argument of the researcher that supports the interrelated application of
all the elements of critical thinking when engaged in the elements of thought. For example,
during problem-solving that focuses on a number of elements of thought (cf. Figure 2.1), the
effectiveness of the problem-solving process will not only depend on the application of the
cognitive critical thinking skills and the metacognitive critical thinking strategies. Dispositions
such as accuracy and persistence and intellectual traits such as open-mindedness and
perseverance, and universal intellectual standards of reasoning, such as precision, clarity and
relevancy will also play a role in ensuring that the problem is solved effectively.

Chapter 2: Critical thinking in life sciences: a concept clarification 23
The various elements that comprise good critical thinking are elucidated below.
2.2.2 Core critical thinking skills and metacognitive strategies
According to Brookhart (2010:40) and Facione (2009:5, 6) the cognitive skills at the very core of
critical thinking are: interpretation, analysis, evaluation, synthesis and inference.
Interpretation refers to understanding and expressing the meaning or significance of
experiences, situations, data, events, judgements, conventions, beliefs, rules, procedures or
criteria.
Analysis focuses on identifying relationships among information and comparing information
to identify similarities and differences.
Evaluation involves judging the value of statements, beliefs, opinions, situations or
experiences; making claims about the worth of something and explaining reasons for or
motivating making claims.
Synthesis involves breaking down information into parts and joining different pieces of
information together to constitute a new whole.
Inference involves drawing conclusions flowing from data, statements, principles, evidence,
judgments, beliefs, opinions, concepts, descriptions, questions, or other forms of
representation.
Metacognitive strategies comprise the following:
Explanation refers to the ability to present in a coherent way the results of one’s thinking.
Self-regulation involves reflection and is defined to mean self-monitoring and evaluating
one’s own thinking in order to confirm or rectify it.
According to Arsal (2015:141) and Facione et al. (2000:61), critical thinkers not only possess
cognitive skills and metacognitive strategies, but also have affective dimensions of critical
thinking or dispositions, such as a “willingness to suspend judgement and being open-minded,
self-confident and analytical and willing to engage in sustained critical thinking”. In this research,
the researcher focused on the interrelated application of three core critical thinking skills,
namely analysis, synthesis and evaluation.
2.2.3 Critical thinking dispositions/behavioural traits
Most researchers agree that in addition to the core critical skills and metacognitive strategies
critical thinking also involves dispositions (Facione, 2009:8). Facione et al. (2000:61) define
critical thinking dispositions as “a person’s constant internal motivations to act toward, or

Chapter 2: Critical thinking in life sciences: a concept clarification 24
respond to, persons, events, or circumstances in habitual, yet potentially malleable ways.” A
close analysis of the dispositions, behavioural traits and intellectual traits reveals many areas of
overlapping between the two (Costa, 2009:54). When we use everyday language when talking
of dispositions, we think of traits such as open-mindedness or reflectiveness as marking trends
but not strict laws. The dispositions, also referred to as attitudes, habits of mind (Costa &
Kallick, 2014:84) or behavioural traits comprise intellectual curiosity, to be systematic, judicious,
analytical, sceptic, confident in reasoning, desiring to obtain the best understanding of a given
situation and being open-minded to allow others to voice opinions with which one may or may
not agree (Ennis, 2001:44; Facione, 2009:5, 6). Facione (2009:8) suggests that “a strong
disposition toward critical thinking, specifically an inclination toward intellectual curiosity and
inquisitiveness, is indicative of one’s ability to think critically and act intellectually.” Tsui
(2002:743) asserts that critical thinking behavioural habits are enhanced by volunteering
answers, posing questions, challenging statements, identifying and analysing arguments,
querying evidence, conjecturing alternatives, stating results, justifying procedures and
presenting arguments. Open-mindedness would call for respect of others’ opinions, as well as
being alert to alternatives and the consequences of decisions (Facione, 2011:5,6).
Inquisitiveness or intellectual curiosity (Facione, 2011:7) is necessary to obtain background
information for solving problems for which a systematic approach is needed (Fradkin et al.,
2010:37), and focused and persistent working ways are required to complete the problem-
solving process (Ricketts et al., 2003:59-62). Moreover, distinguishing between important and
unimportant facts (Facione, 2011:7), as well as reflecting on the decisions made to solve
problems are important dispositions that could affect the successfulness of the outcome of the
problem-solving process. Judiciousness as disposition drives the evaluation of decisions to
solve problems (Facione, 2011:7). The researcher concurs that if students do not work
systematically, are not open-minded and do not seek the truth, it will be difficult for them to
apply the higher order thinking skills required in Life Sciences (such as to gather, analyze,
organize and evaluate information).
Costa and Kallick (2014:84) refer to the dispositions as habits of mind, defined as 16 different
dispositions employed skilfully and mindfully by characteristically intelligent people when
confronted with problems, to which the solutions are not immediately apparent (Anderson,
2010:14; Costa, 2009:15). Habits of mind build learners’ creativity, capacity for teamwork and
ability to become life-long, self-regulated learners, and emerge in dispositions such as thinking
interdependently, striving for accuracy, persistence, being open to continuous learning,
communicating with clarity and precision, and taking responsible risks.

Chapter 2: Critical thinking in life sciences: a concept clarification 25
Researchers such as Ennis (2001:44), Facione (2009:5, 6), Halpern (2007:3) and Perkins et al.
(2000:270) tend to identify similar sets of dispositions as relevant to critical thinking. For
example, the most commonly cited critical thinking dispositions include
open-mindedness;
fair-mindedness;
the propensity to seek reason;
inquisitiveness;
the desire to be well-informed;
flexibility; and
respect for, and willingness to entertain others’ viewpoints. (Ennis, 2001:44; Facione,
2009:5, 6; Halpern, 2007:3; Perkins et al., 2000:270).
According to Arsal (2015:141), dispositions can be intentionally taught to become powerful
intellectual resources that demonstrate good critical thinking.
Critical thinking also involves the development and application of a number of universal
intellectual standards of reasoning, which are explained below.
2.2.4 Universal intellectual standards of reasoning
According to Paul and Elder (2006:10), intellectual standards must be applied to critical thinking
so as to enhance it and therefore be infused in the development of students’ critical thinking
through consistent use by the teacher. To think critically, students must have a good command
of the following intellectual standards:
Clarity is an important gateway standard to clarify statements by improved elaborations or
expressions. Accuracy is needed to check if something is really true. If a statement is clear and
accurate but lacks precision, specific detail will be missing. Relevance is needed to determine
whether information is connected or applicable to a question. Without significance, the central
idea or consideration of the most important problem will be lost. The depth refers to the
complexities or difficulties of a question, while breadth is important to get another viewpoint or
perspective of the problem. Finally, if ideas that are put together make sense, then the thinking
complied with the intellectual standard of logic (Paul & Elder, 2006:12).
All thinking (including critical thinking) is always applied to a particular element of thought. The
elements of though are explained in the next section.

Chapter 2: Critical thinking in life sciences: a concept clarification 26
2.2.5 Elements of thought
The above-mentioned intellectual standards should be applied to the following elements of
thought (Paul & Elder, 2006:6):
Purpose: Good thinking always has a significant and realistic purpose which is stated
clearly. During thinking/reasoning one should check constantly, and monitor whether one is
on track to reach the purpose.
Question: Good thinking always involves questioning to figure out something and to solve
problems.
Assumptions: Clearly identified assumptions should underpin good thinking and one
should determine whether they are justifiable in shaping one’s point of view.
Point of view: Good thinking requires a point of view and the consideration of others’ points
of view; their strengths as well as weaknesses. It involves being open- minded in evaluating
all points of view.
Information: Good thinking is built on solid, sufficient, clear, accurate and relevant
information.
Concepts and ideas: Involvement in thinking requires the identification of key concepts and
ideas and using them with care and precision. Thinking and reasoning are always
expressed through concepts and ideas. Consideration of alternative concepts or definitions
of concepts is necessary to shape one’s thinking.
Inferences or interpretations: All inferences or interpretations made during thinking should
be based on evidence gained and from the interpretations, conclusions drawn and meaning
given to the information.
Implications and consequences: Consideration should be given to all possible
consequences, negative or positive, that may arise from one’s reasoning (Paul & Elder,
2006:6, 7).
Good critical thinking also involves the development of a number of intellectual traits that are
briefly explained below.
2.2.6 Intellectual traits
The following section clarifies the intellectual traits (Paul & Elder, 2006:16, 17) that qualify
good critical thinking:
Intellectual humility: Intellectual humility implies having a consciousness of the limits of
one’s knowledge.

Chapter 2: Critical thinking in life sciences: a concept clarification 27
Intellectual courage: Displaying intellectual courage means to be active and critical when
information is presented and to see some truth in ideas that are regarded as dangerous or
absurd and to recognise one’s own misleading beliefs.
Intellectual empathy: Having intellectual empathy refers to the ability to reconstruct
accurately the viewpoints and critical thinking of others and to reason with viewpoints other
than one’s own. This trait correlates with a willingness to remember times when one was
wrong despite one’s own convictions.
Intellectual autonomy: Intellectual autonomy refers to learning to think for oneself and
having command over one’s thought processes.
Intellectual integrity: Displaying intellectual integrity means to stand by one’s own thinking
and to be true to one’s own beliefs.
Intellectual perseverance: Intellectual perseverance implies being conscious of the
necessity to use intellectual insights and truths in spite of problems one may encounter.
Confidence in reasoning: Good critical thinking reflects characteristics of autonomy,
confidence and courage to come to one’s own conclusions and to formulate rational
viewpoints.
Fair-mindedness: When involved in thinking/reasoning, one has to adhere to intellectual
standards without reference to one’s own feelings or viewpoints (Paul & Elder, 2006:16, 17).
In the context of the research, the researcher focused on enhancing the development of the
core critical thinking skills analysis, synthesis and evaluation purposively, and did not attempt to
enhance the development of the dispositions/behavioural traits, intellectual traits or the
universal intellectual standards of reasoning purposively. The researcher however assessed the
work of the student participants during the implementation of the intervention with the purpose
to establish whether the Thinking Maps intervention would sensitise student participants to
become more aware of applying the universal intellectual standards of reasoning as well, when
involved in tasks that required the application of critical thinking.
2.3 THE IMPORTANCE OF CRITICAL THINKING
“By becoming a critical and inspiring teacher expects a figure that is able to motivate
and to inspire the students, so that students are able to optimize the potential of
their critical thinking that is useful for the future” (Uksw, 2014:161).
The aforementioned quote underscores the importance of teachers who need to have well
developed critical thinking skills before they can enhance the development of these skills among

Chapter 2: Critical thinking in life sciences: a concept clarification 28
their learners. The following section explores the importance of critical thinking at school-level
and teacher-training level with specific reference to Life Science teachers.
2.3.1 The importance of critical thinking at school level: The CAPS Curriculum
The development of critical thinking skills has been on the agenda of South African Education
since 1997. The new CAPS Grades R-12 continues to support teaching and learning that
should nurture the elements of critical thinking. In addition, Du Plessis (2013:3) asserts that:
“CAPS are encouraging an active and critical approach to learning, rather than rote and
uncritical learning of given truths.”
The following table provides the objectives of the CAPS Grades R-12 and explains the link
between the objectives and the researcher’s view on how the various elements of critical
thinking that are implied in achieving the objective.
Table 2.1: Objectives of the CAPS Grades R-12 and links to the elements of critical
thinking
Objectives of the CAPS Elements of critical thinking implied in achieving the objectives (cf. 2.2)
Identify and solve problems and make decisions using critical and creative thinking
Intellectual curiosity and autonomy, analyticity, systematicity, self-confidence, questioning, interpreting, evaluating, making inferences; accuracy, logic, relevancy, breadth.
Work effectively as individuals and with others as members of a team.
Being: open-minded, self-confident, analytical, purposeful, sceptical and judicious; demonstrating intellectual humility and courage
Organise and manage themselves and their activities responsibly and effectively.
Being systematic, thinking logically and being relevant when reasoning.
Collect, analyse, organise and critically evaluate information.
Being relevant, analytical, logical and systematic when evaluating information.
Communicate effectively using visual, symbolic and/or language skills in various modes.
Being explanative, clear, self-confident; and having a point of view.
Use science and technology effectively and critically showing responsibility towards the environment and the health of others.
Having intellectual empathy and integrity.

Chapter 2: Critical thinking in life sciences: a concept clarification 29
Objectives of the CAPS Elements of critical thinking implied in achieving the objectives (cf. 2.2)
Demonstrate an understanding of the world as a set of related systems by recognising that problem-solving contexts do not exist in isolation.
Being analytical, reflective, having intellectual empathy.
(Department of Basic Education, 2011:4, 5).
Given the aforementioned objectives, it is clear that prospective teachers need to be trained in
order to know how to enhance the development of the different elements that comprise critical
thinking in order to ensure that they will be able to achieve the objectives as indicated by the
CAPS.
As critical thinking is also regarded as an important life skill to cope with the challenges of the
21st century, the importance of its development cannot be underscored.
2.3.2 Critical thinking and teaching and learning in the 21st century
Ijaiya et al. (2010:385) state that the world faces many paradoxes; on the one side is knowledge
explosion in science and technology and on the other side are countries getting poorer
economically with less peace. Globalisation, technology, migration, international competition,
changing markets, population expansion, poverty, famine and transnational environmental and
political challenges add a new urgency to develop the critical thinking skills students need for
success in dealing with challenges in the 21st century context (Saavedra & Opfer, 2012:2).
Crockett (2015:2), Saavedra and Opfer (2012:5) and Wagner (2008:17) propose that students
need the following survival skills to be prepared to deal with the 21st century life challenges as
mentioned above. It is noteworthy that many of these survival skills comprise the elements of
critical thinking.
Critical thinking and problem-solving: Students who can apply higher order thinking to
provide solutions to real-world problems might be more successful than those who are not
effective at critical thinking and problem-solving.
Collaboration and leadership: Students need the ability to connect and collaborate with
others; which is essential to their learning, but also to their mental and emotional health.
Ethics, action and accountability: Students need to be well-rounded and responsible global
citizens who act responsibly towards creating a better world for everyone.

Chapter 2: Critical thinking in life sciences: a concept clarification 30
Effective oral and written communication: Students need to communicate visually and with
text and speech to enable them to interact and pass information to others with clarity and
precision.
Accessing and analysing information: Students need the ability to think analytically, which
includes proficiency when comparing, contrasting, evaluating and synthesising information.
Creativity: Students need to be able to think and work out of the box in both digital and non-
digital environments to develop unique and useful solutions (problem-solving).
According to Saavedra and Opfer (2012:6), there are compelling economic and civic reasons for
education systems to develop students’ 21st century skills. Firstly, the economic rationale is that
computers and machines can cost-effectively do the jobs that people with only routine
knowledge and skills can do. This implies that fewer people with only basic skills are employed
and more people with higher-order thinking skills are required. Furthermore, there is increasing
competition for the supply and demand of people who can add value through applying non-
routine, complex thinking and communication skills to new problems and environments.
Secondly, a civic rationale for education institutions is to increase their focus on developing
students’ 21st century skills, because although students need a foundation of basic knowledge,
they also need to learn how and why to be engaged citizens who think critically, so that they
can, for example, analyse news items, identify biases, evaluate current issues, and propose
solutions in an educated way. Students need to be able to solve problems so that they can
propose or review policies to address social challenges (Saavedra & Opfer, 2012:6). In this
regard, Gardner (2010:9-31), argues that the 21st century learner will need five kinds of minds to
function effectively, namely:
the disciplined mind that refers to the mastery of information;
the synthesising mind that implies the ability to integrate ideas from different disciplines into
a coherent whole and to communicate the integration to others;
the creating mind that holds the capacity to uncover and clarify new problems and
questions;
the respectful mind that involves an awareness and appreciation of differences among
people; and
the ethical mind that refers to the fulfilment of one’s responsibilities as worker and citizen
with integrity.

Chapter 2: Critical thinking in life sciences: a concept clarification 31
The development of the above-mentioned minds clearly points to the importance of developing
critical thinking skills, such as creating and synthesising, as well as dispositions and intellectual
traits such as respect, responsibility and ethical conduct.
According to Pink (2006:49), we need to prepare our students, whose lives are controlled by
automation, increasingly developing technologies, abundance in some areas and at the same
time poverty in others, for the conceptual age (21st century). Pink (2006:49-67) provides an
alternative to the teaching and learning of the 21st century. According to Pink, there has been an
evolution from the agricultural age to the current conceptual age, as illustrated in Figure 2.2
below.
Conceptual age
Information age
Industrial age
Agricultural age
18th century 19th century 20th century 21st century
Figure 2.2: From the agricultural age to the conceptual age (Pink, 2006:49)
Figure 2.2 indicates a progression in development that took place from farmers to creators and
empathisers. Pink (2006:49) argues that this progression involves the left brain and increasingly
the right brain as well. In the context of Pink’s arguments, one could argue that the left brain
refers to the development of the core critical thinking skills and metacognitive strategies, and the
right brain to the development of the critical thinking dispositions/behavioural traits and
intellectual traits.
According to Pink (2006:61), the left brain associated with “high-concept aptitudes” (higher
order thinking skills: function, argument, focus, logic, seriousness, argument), remains
necessary but is no longer sufficient and should be complemented by students’ right brain in
order to obtain “high-touch aptitudes” (design, story, symphony, empathy, play, meaning) that
have become essential for the 21st century. Pink (2006:61) explains the balance between these
six high-concept and six high-touch senses as follows:

Chapter 2: Critical thinking in life sciences: a concept clarification 32
Not just function but also design: In order to create a cleaner and better environment, it is
essential to create something beautiful engaging one’s emotions instead of merely creating
functional items.
Not just argument but also story: In order to use the abundance of information, students
need to use effective communication skills to rebut a good argument with persuasive
counterpoints.
Not just focus but also symphony: In order to use the automation and abundance of
technology available, students not only need to analyse but also synthesise, combining a
number of different parts, ideas or pieces of information to come up with a whole new idea
or theory.
Not just logic but also empathy: In order to use the information and analytic tools
available, students cannot use logic alone, but have to take their fellowmen into
consideration in building relationships and taking care of others.
Not just seriousness but also play: Laughter, light-heartedness and humour have proven
to be advantageous to one’s health, and there should be a balance between work and play.
Not just accumulation but also meaning: Although we live in a world of extremes, wealth
does not necessarily result in health and one should pursue spiritual growth (Pink, 2006:65-
67).
Pink (2006:65-67) concludes that the above-mentioned six senses that include the application
of the cognitive skills and metacognitive strategies as well as critical thinking
dispositions/behavioural traits and intellectual traits involved in critical thinking, will increasingly
influence our lives and shape our world, resulting in a whole new mind. Critical thinking could
therefore also be regarded as an important life skill, which will be clarified in the following
section.
2.3.3 Critical thinking as a life skill
Thinking is a natural process, but when left to itself can often be biased, distorted, partial,
uninformed and potentially prejudiced. Excellence in thought must be systematically cultivated
and enhanced (Duron et al., 2006:160; Paul & Elder, 2006:4). The quality of our life and that of
what we produce, make, or build depends precisely on the quality of our thought. Shoddy
thinking is costly, both in money and in quality of life. Facione (2009:6) states that good critical
thinkers are not only able to interpret, analyse, evaluate and infer, but can also explain what
they think and how they draw conclusions by applying self-reflection and judgement on their
own opinions and improve on their previous opinions.

Chapter 2: Critical thinking in life sciences: a concept clarification 33
Brookhart (2010:5), Hager and Kaye (1992:27) and Jacobson (2014:31) provide the following
reasons why people need to acquire critical thinking as a life skill.
People will be better equipped to compete for opportunities and jobs and perform better at
the work place.
Critical thinking is seen as a prerequisite for good citizenship, to enable people to distinguish
between lies and truth.
The ability to think well contributes to a person’s psychological well-being and good critical
thinkers are more likely to be well adjusted.
As a society that faces some complex and threatening problems, we must learn to be better
thinkers in a broader sense, to contribute to the solution of problems.
Thinking is at the heart of what it means to be human, and failure to develop one’s thinking
potential is to preclude the full expression of humanity.
Furthermore, as Beyer (1995:28) and Brookhart (2010:5) state, critical thinking enables
individuals to make decisions and evaluate information related to personal, social, economic
and political issues. Brookfield therefore argues that “critical thinking is a survival skill that you
need to make your way through life” (cited by Johanson, 2010:27).
In order for critical thinking to become a life skill, students have to develop through different
phases, namely unreflective thinkers who are unaware of problems in their thinking,
challenged thinkers who are faced with significant problems in their thinking, beginning
thinkers who try to improve their thinking with regular practice, practicing thinkers who
recognise the need to regularly practice thinking, advanced thinkers who keep on practicing
thinking, and finally master thinkers who have developed good habits of thought that become
second nature (Paul & Elder, 2006:19).
In the context of teacher training it is acknowledged that the teacher will have a profound
influence on a learner’s ability to learn and think critically. The following section focuses on the
important role of Life Science teachers in nurturing critical thinking.
2.3.4 Critical thinking and its role in Life Sciences
According to CAPS, the subject “Life Sciences is the scientific study of living things from
molecular level to their interactions with one another and their environments. To be accepted as
a science, it is necessary to use certain methods for broadening existing knowledge, or
discovering new things. These methods must lend themselves to replication and a systematic
approach to scientific inquiry. The methods include formulating hypotheses and carrying out

Chapter 2: Critical thinking in life sciences: a concept clarification 34
investigations and experiments as objectively as possible to test these hypotheses. Repeated
investigations are carried out and adapted. The methods and results are analysed, evaluated
and debated before the community of scientists accepts them as valid” (Department of Basic
Education, 2011:8).
By studying and learning about Life Sciences, learners will develop:
their knowledge of key biological concepts, processes, systems and theories; and
an ability to critically evaluate and debate scientific issues and processes (Department of
Basic Education, 2011:8).
In the process of learning Life Sciences, learners must be able to perform certain skills in
mastering the subject content. The next table,Table 2.2, illustrates the skills learners have to
acquire and the researcher’s view regarding the elements of critical thinking that are implied in
acquiring the skills expected in Life Sciences.
Table 2.2 Skills expected from learners in Life Sciences and links to the elements of
critical thinking
Life Sciences: Skills Elements of critical thinking (cf. 2.2)
Analyse information/data. Being relevant, analytical, logical, systematic when analysing information.
Recognise relationships between existing knowledge and new ideas.
Being analytical, systematic, relevant;
having courage, reasoning with significance.
Critically evaluate scientific information. To synthesise; being analytical, logical, relevant; reasoning with significance.
Identify assumptions. Purposeful reasoning, questioning assumptions, making inferences, identifying implications.
Categorise information. Being relevant, accurate, precise, logical when reasoning.
(Department of Basic Education, 2011:13).
It is clear from Table 2.2 that critical thinking skills and and metacognitive strategies as well as
critical thinking dispositions/traits and universal intellectual standards of reasoning play a role
when mastering subject content in Life Sciences.
Critical thinking is often compared to the working according to the scientific method (cf. Figure
2.5) used in Life Sciences because it involves a systematic and procedural approach to the

Chapter 2: Critical thinking in life sciences: a concept clarification 35
process of thinking. Just as students learn the process of the scientific method in Life Sciences
they must also learn the process of thinking critically (Snyder & Snyder, 2008:92).
If teachers purposively and persistently provide opportunities for learners to practise higher
order thinking skills, for example dealing in class with real-world problems, encouraging open-
ended class discussions, and fostering inquiry-oriented experiments, there is a good chance for
the consequent development of the elements of critical thinking (Stedman & Adams, 2012:9).
McCollister and Sayler (2010:42), Pithers and Soden (2000:243) and Qing et al. (2010:4598)
support the notion that such critical thinking skills can be developed more effectively in the
course of teaching subject matter content and concepts.
It is reasonable to assume that teachers themselves need to be good critical thinkers before
they can teach students to think critically. In order to establish to what extent pre-service
teachers are able to think critically, the following section will explore an international and
national perspective regarding the development of critical thinking among pre-service teachers.
2.4 THE CRITICAL THINKING ABILITIES OF PRE-SERVICE TEACHERS
Walsh and Paul (1986:49) state that “critical thinking skills should be thoroughly integrated into
all aspects of the teacher education programmes and prepare future teachers to be models of
effective critical thinking strategies”. The subsequent sections will provide a succinct overview of
the status quo in terms of the development of critical thinking among pre-service teachers.
2.4.1 An international perspective
According to Ijaiya et al. (2010:383), Africa struggles to improve access to education, mainly
due to overpopulation and underfunding of the sector by many communities. This has led to the
lowering of standards and many teachers being produced with limited intellectual skills,
especially critical thinking skills. This viewpoint is supported by the Finn Report released in
Australia, which states that “teachers will have to update and expand their knowledge and
critical thinking abilities and modify their pedagogy in quite major ways” (Hager & Kaye,
1992:27).
Many other studies conducted by Mergler (1997), Owu-Ewie (2007), Paul (1997) and Williams
(2005) (all cited by Allamnakhrah, 2013:199) in different countries have investigated the
development of critical thinking among pre-service teachers. These studies show that the pre-
service teachers in the following countries, namely Ghana, California, Australia and the United
States of America, lack critical thinking skills. Allamnakhrah (2013:200) argues that the
development of critical thinking skills is unlikely unless pre-service teachers and their lecturers
are themselves the products of critical thinking.

Chapter 2: Critical thinking in life sciences: a concept clarification 36
2.4.2 A national perspective
Grosser and Lombard (2008:1364) found that a significant number of pre-service teachers in
South Africa are not yet on Grade 12 level with regard to the functioning and execution of critical
thinking skills.
According to Lombard and Grosser (2008:573), prospective teachers have an apparent inability
to apply critical thinking which, according to Potterton (2008:15), could be linked to the
continuous use of teacher-centered, non-critical approaches to teaching. Lombard and Grosser
(2004:213) support this view by stating that teachers themselves are products of a poor
education system which did not emphasise cognitive development and the development of
critical thinking skills and therefore do not know how to teach these skills.
The problem of developing critical thinking skills at school level is compounded at tertiary level.
Lectures have become increasingly one-sided and teacher-centered. There is limited interaction
between the teacher/lecturer and learners/students and among learners/students themselves in
large classes, and opportunities for questioning and classroom discussions are severely
hampered (Uksw, 2014:163).
Based on the aforementioned international and national perspectives one could conclude that
school learning apparently does not prepare pre-service teachers to have well-developed critical
thinking skills. It is therefore imperative that teacher-training accepts a two-folded challenge,
namely to create opportunities to nurture the development of pre-service teachers’ critical
thinking skills, and to assist them to become effective at nurturing critical thinking among the
learners whom they will teach.
As the present study focused on assessing the development of pre-service Life Science
teachers’ critical thinking skills, it was important for the researcher to familiarise himself with
ways in which critical thinking skills can be assessed effectively.
2.5 ASSESSING CRITICAL THINKING SKILLS
2.5.1 Introduction
Having a defensible elaborated definition of critical thinking, assessing these critical skills need
a clear idea of the purpose for which the assessment will be used. In order to assess critical
thinking skills, a variety of commercially developed critical thinking tests are available. Literature
suggests that if the commercially available critical thinking tests are not adequate, one could
alternatively compile one’s own closed multiple-choice tests or make use of open-ended

Chapter 2: Critical thinking in life sciences: a concept clarification 37
information-gathering assessment (essay and short-answer testing, interviewing and monitoring
classroom discussions) (Norris & Ennis, 1989:101).
The following sections provide information on possible ways to assess the development of
critical thinking skills.
2.5.2 Multiple-choice tests
According to Norris and Ennis (1989:101), the following aspects should be adhered to when
constructing one’s own multiple-choice critical thinking tests:
Identifying the purpose of the test
Identification of a specific purpose (other than to test critical thinking) is necessary. The
following purposes may apply:
o Testing for transfer: Testing student’s critical thinking abilities in subject contexts and
other related contexts.
o Testing for critical thinking in specific subjects: Used to test whether students have
learned subject-content.
o Preparing students for multiple-choice testing: Teachers often use standardised multiple-
choice tests to prepare students explicitly for certain types of tests.
o Judging students versus judging programmes: If students must be appraised, the test
must be more reliable and valid for each student as will be the case when programmes
must be appraised.
o Summative versus formative evaluation: Formative evaluations are carried out to
establish growth and development while an intervention programme to enhance the
development of critical thinking skills is in progress, while summative evaluations are
conducted after a programme or course has been conducted.
o Aspect-specific versus comprehensive testing: If you need to identify students’ strengths
and weaknesses regarding specific aspects of critical thinking, you need data on each of
these aspects. In comprehensive tests, different sections will test specific aspects.
o Norm-referenced testing versus criterion-referenced testing: A student’s scores are
compared to those of other students.
o Testing for grading: Teachers may use multiple-choice tests for norm-referencing and
grading (Norris & Ennis, 1989:101).
Making a table of specifications
After a test purpose has been chosen, the specific aspects of critical thinking on which the
focus should be must be included. If the test is subject-specific, certain elements of the

Chapter 2: Critical thinking in life sciences: a concept clarification 38
subject should be included. The table should reflect the weighting of the different aspects of
critical thinking and elements of the subject (Norris & Ennis, 1989:105).
The following table, Table 2.3, indicates how the critical thinking skills were tested by the
researcher in all pre- and post-tests.
Table 2.3: Multiple-choice critical thinking tests in Life Sciences (Adapted from Norris
& Ennis, 1989:107)
Aspects of critical thinking
Analysis Synthesis Evaluation Total %
10% 10% 10% 30%
5% 5% 5% 15%
5% 5% 5% 15%
5% 5% 5% 15%
5% 5% 5% 15%
4% 3% 3% 10%
34% 33% 33% 100%
Table 2.3 illustrates balancing of the critical thinking skills analysis, synthesis and evaluation, in
equal proportions, in all the pre-tests and post-tests used in the research.
Norris and Ennis (1989:106) conclude that this table is idealised, since all elements and aspects
are interrelated and interdependent. Consequently, one must make judgements based on one’s
thoughts regarding the predominant emphasis of an item, in order to roughly satisfy the table of
specifications.
Drafting items
Following are some guidelines for writing test items, based upon a set of guidelines prepared by
Jason Millmans of Cornell University (cited by Norris & Ennis, 1989:108, 109), combined with
suggestions from Cohen et al. (2007:427).
o Constructing each item with only one correct or best answer.
o Testing for the intended knowledge and abilities.
o Avoiding “none of the above” and “all of the above” as choices.
o Using either a direct question or an incomplete statement as the item stem.
o Writing items in clear and simple language.

Chapter 2: Critical thinking in life sciences: a concept clarification 39
o Stating the central problem of the item clearly and completely in the stem.
o Including most of the reading in the stem.
o Basing each item on a single, central problem.
o Constructing options homogeneous in grammatical form.
o Including in the stem any words that would otherwise need repeating in each option.
o Emphasising negative words or words of exclusion and avoiding such words when
possible.
o Placing options at the end of the item stem.
o Arranging options in a logical order, if one exists.
o Avoiding unintended hints based on:
grammatical consistency or inconsistency between the stem and the option,
repetition of key words in the stem and keyed option, or
rote or other verbal associations between key words in the stem and the keyed
option.
o Avoiding hints based on the:
unusual length of the keyed option,
degree of qualification stated in the keyed option or use of terms such as “never” and
“always” in the unkeyed options,
lack of independence and mutual exclusivity of the options,
frequency with which the keyed option is placed in a given option position, or
pattern of the location of the keyed position.
o Avoiding hints from one item to another.
Multiple-choice questions should be scored with one mark for a correct answer and no mark for
an incorrect answer, and must be designed in such a way that higher-order thinking is required
(Brookhart, 2010:33).
In the context of the research, the researcher’s multiple-choice tests were purposefully
developed to test for specific aspects of critical thinking, namely the ability to analyse,
synthesise and evaluate when reasoning about an answer, as shown in Table 2.3.
According to Norris and Ennis (1989:127), a major problem answering the multiple-choice
questions is differences among participants related to background beliefs and levels of worldly
wisdom. In order to take the various background beliefs into account, the researcher included
an open-ended question for each of the multiple-choice test items, and student participants had
to motivate and defend chosen answers. This provided the possibility to the researcher to gain
an initial understanding of the participants’ application of the universal intellectual standards of
reasoning, and would possibly eliminate guessing (Norris & Ennis, 1989:115).

Chapter 2: Critical thinking in life sciences: a concept clarification 40
2.5.3 Open-ended information assessment
Norris and Ennis (1989:129), cite the following advantages that open-ended questions have
over multiple-choice critical thinking testing:
They provide the researcher with the opportunity to consider the effects of different
background beliefs and levels of worldly wisdom.
They provide clearer insight into critical thinking dispositions or intellectual traits and the
application of the universal intellectual standards of reasoning.
They give a better indication of critical thinking in different tasks, making their ecological
validity greater.
In designing open-ended critical thinking assessment items the following general guidelines
may be used and can be adjusted according to specific situations:
Piloting the assessment with a sample of students to ensure it provides an interesting
context and that the students understand the task or questions in the way intended.
Asking the students to justify answers as part of the assessment.
Being generous, but not overly, when student’s answers are interpreted.
Only giving credit when answers are true and relevant.
Making notes of all strengths and weaknesses within individual responses from students.
Making inferences on the presence or absence of critical thinking dispositions/traits and
universal intellectual standards of reasoning from the students’ responses and make notes
of them (Norris & Ennis, 1989:131).
Table 2.4 below, summarises the different open-ended approaches for assessing critical
thinking, and the researcher indicates which of the critical thinking elements (cf. 2.2) could be
addressed with open-ended assessment approaches.
Table 2.4: The different open-ended approaches and possible critical thinking
outcomes
Open-ended approach Possible critical thinking outcome
1. Short-answer tests
Suitable for asking students to infer conclusions, make credibility judgments, and to identify assumptions.
Remaining relevant; being analytical, open-minded, judicious, self-confident and sceptic; reason with clarity, make inferences; being able to evaluate and explain.

Chapter 2: Critical thinking in life sciences: a concept clarification 41
Open-ended approach Possible critical thinking outcome
2. Argumentative essays
Display a process of reasoning (thinking) and discussion.
Less useful on specific areas of critical thinking.
Start with the type of critical thinking you want to access.
Reasoning that is inference-related, clarity-related, orderly(logic). Being able to communicate effectively and becoming analytical and judicious when reasoning.
3. Interviews
Acquire very detailed information on critical thinking skills.
Students can express their ideas easier and in a more coherent manner than in written form.
Evaluator has options like asking the student to clarify or explain or defend conclusions.
Some students might feel threatened or embarrassed when being interviewed.
Remaining relevant, being analytical, open-minded, judicious, self-confident, sceptic; making inferences; to evaluate, and explain, reason with clarity.
4 Classroom discussions
Allowing students to take part in extended discussions will encourage students’ critical thinking abilities and dispositions.
Used to compare students’ progress over time.
Remaining relevant; being analytical, open-minded, judicious, self-confident, sceptic; making inferences; to evaluate and explain; to reason with clarity, and communicate effectively.
(Brookhart, 2010:33; Norris & Ennis, 1989:132-154).
Norris and Ennis (1989:157) conclude that open-ended approaches complement the multiple-
choice critical thinking testing as:
Multiple-choice testing can provide detailed information on specific aspects of critical
thinking as it is embedded purposively into the tests but cannot provide information on
critical thinking dispositions/traits and the universal intellectual standards of reasoning.
Open-ended testing can provide information on critical thinking dispositions/traits and the
universal intellectual standards of reasoning but not on specific aspects of critical thinking.
2.5.4 Commercially available critical thinking tests (Published tests)
Table 2.5 summarises the available commercially developed tests that focus on assessing the
application of critical thinking in general scenarios. Ennis (1993:182) states that existing
multiple-choice critical thinking tests do not test directly for all the elements of critical thinking
and therefore evaluators should be open-minded when drawing conclusions.

Chapter 2: Critical thinking in life sciences: a concept clarification 42
Table 2.5: Commercially developed critical thinking tests
Published test Aspects of critical thinking assessed
1. The California critical thinking test
Aimed at tertiary students.
Interpretation, argument analysis, appraisal, deductive and inductive reasoning.
2. Cornell critical thinking test, Level X
Aimed at Gr. 4 to tertiary level.
Requires participants to decide whether there is sufficient evidence or reasons to draw certain inferences or conclusions.
Making inferences and conclusions, inductive reasoning, assessing credibility, deductive reasoning and identifying assumptions.
3. Cornell critical thinking test, Level Y
Aimed at gifted secondary, tertiary students and adults.
Requires participants to decide whether there is sufficient evidence or reasons to draw certain inferences or conclusions.
Making inferences and conclusions, inductive reasoning, assessing credibility, deductive reasoning, making predictions and experimental planning, identifying fallacies, formulating definitions and assumption identification.
4. Ennis-Weir critical thinking essay test
Aimed at secondary and tertiary students.
Focuses on argumentation.
Can be used as teaching material.
More comprehensive.
Identifing a purpose; reasons and assumptions, stating one’s viewpoint, offering good reasons, and seeing other possibilities and explanations.
5. Watson-Glaser Critical Thinking Appraisal
The inferences and conclusions which participants are asked to examine are drawn from mini-case studies or exercises.
Inductive reasoning, assumption identification; deductive reasoning, judging conclusions, argument evaluation.
(Brookhart, 2010:33; Ennis, 1993:183; Hager & Kaye, 1992:27; Şeker & Kömür, 2008:395)
Based on the aforementioned table and to the best knowledge of the researcher, there is no test
commercially available for researchers to determine the impact of Thinking Maps for enhancing
critical thinking skills in Life Sciences in the South African context. This lack of subject-specific
critical thinking tests is supported by Ennis (1993:182) who states that there are no subject-
specific critical thinking tests which primary purpose is to assess critical thinking in a specific
subject area. Therefore, the researcher developed multiple-choice tests with closed and open
question for pre- and post-test purposes that address Life Science subject content to establish
transfer of the application of critical thinking skills to subject content (cf. 4.4.5).

Chapter 2: Critical thinking in life sciences: a concept clarification 43
2.5.5 Assessing the development of critical thinking in the context of the
research
The researcher took into account the following above-mentioned suggestions (cf. 2.5.2, 2.5.3)
when he developed multiple-choice tests for the research. The tests used in the context of this
research adhered to the following criteria:
Having a purpose:
o The researcher tested for transfer of critical thinking skills to different subject content
contexts, as the pre-tests and post-tests were based on different topics in the Life
Science curriculum of the LIFE 111 module (cf. 2.5.2).
o The researcher also tested whether student participants mastered subject-content (cf.
2.5.2).
o Summative evaluation was used after the Thinking Maps intervention.
Identified test specifications (cf. Table 2.3):
o The tests addressed the Life Sciences (LIFE 111) programme outcomes and subject
content.
o The elements of the subject content and the application of critical thinking skills
(analysis, synthesis and evaluation) were addressed in equal proportions.
Drafting items:
o The researcher adhered to all the above-mentioned guidelines in 2.5.2 for drafting the
test items.
o Student participants scored one mark for each correct answer (cf. 2.5.2).
o Higher order thinking was required from the student participants (cf. 2.5.2).
o The tests were purposively developed to test for specific aspects, namely the
application of skills to analyse, synthesise and evaluate information (cf. 2.5.2).
General:
o A pilot study was conducted by asking three experienced colleagues in the field of
teaching Life Sciences to pre-service teachers to comment on the suitability and difficulty
level of the tests in order to enhance the reliability and validity of the tests.
o In order to take the various backgrounds of students into account, student participants
had to provide an open-ended motivation for each test item.
As this research assumed that the applyication of a teaching strategy, namely Thinking Maps,
culd enhance the development of critical thinking, it was important for the researcher to identify
to what extent teaching practices could be regarded as an important factor that could hamper

Chapter 2: Critical thinking in life sciences: a concept clarification 44
the development of critical thinking skills. In order to achieve this, a brief overview of all the
possible factors which may have a negative influence on the development of critical thinking
skills are explored below.
2.6 FACTORS INFLUENCING THE DEVELOPMENT OF CRITICAL THINKING
SKILLS
“The most important single factor influencing learning is
what the learner already knows”
David Ausubel (1978:58)
Researchers such as Grosser and Lombard (2008:1367), Lun et al. (2010:606), Pithers and
Soden (2000:241), Snyder and Snyder (2008:92) and, more recently, Illeris (2015:30) have
discussed factors which tend to inhibit or enhance the development of students’ critical thinking
skills. The factors include political, educational, personal, behavioural, cultural and language
factors. Each of these factors is briefly elucidated below.
2.6.1 Political factors
According to Ijaiya et al. (2010:383), Africa struggles to improve access to education under the
yoke of overpopulation and under-funding as education (Colleges of Education and universities)
gets commercialised for internally generated revenue. This has resulted in lowering of
standards, consequently producing teachers who are limited in knowledge and the application
of critical thinking skills.
2.6.2 Educational factors
Research conducted by Ijaiya et al. (2010:384) indicated that in many African countries the
curriculum lacks emphasis on the development of and promotion of critical thinking skills. In
this regard, Snyder and Snyder (2008:92) suggest that the current trend to standardise curricula
and focusing on test scores undermine the ability of teachers/lecturers to address and practise
critical thinking at school/university level. Other educational factors that inhibit the development
of critical thinking include:
Over-emphasis on knowledge and recall.
Excessive use of objective questions and lately a shift to computer-based testing which
encourages factual questions.
The belief that assessing critical thinking skills is more difficult than factual knowledge.

Chapter 2: Critical thinking in life sciences: a concept clarification 45
Over-crowded classrooms, which limit useful interaction and questioning that stimulate the
development of critical thinking.
Lack of emphasis of critical thinking skills in subject content. Students do not learn the
critical thinking skills because they are not explicitly taught. Students are not familiar with
critical thinking skills and lack the ability to practise it.
Poor knowledge of critical thinking by teachers/lecturers.
Over-emphasis on certification of learning rather than on the critical skills required for
effective learning (Ijaiya et al., 2010:384; Saavedra & Opfer, 2012:7; Snyder & Snyder,
2008:92).
According to Snyder and Snyder (2008:93), time constraints are barriers to integrating critical
thinking into teaching. Teaching/lecturing is faster and easier than problem-based or inquiry-
based learning. Objective tests that require one correct answer are faster to administer and
grade than subjective assessment where students have to provide their own answers and
motivate their answers. In the process of lecturing and assessment through objective tests, the
practice of critical thinking skills is lost.
The presence of learning barriers (Illeris, 2015:30) can affect the acquisition process of critical
thinking skills when intended learning is not understood or understood in a distorted or
insufficient way. Illeris (2015:30) identified three dimensions of learning barriers, namely:
Mislearning: Mislearning is related to subject-content and includes misunderstandings, lack
of concentration, lack of prior learning and unclear communication.
Learning defence: Learning defence is related to rejected or distorted learning and
conflicting learning.
Learning resistance: Learning resistance refers mainly to interaction between
teacher/lecturer and student and includes values, preferences and understandings, and the
students’ personal dispositions and preconditions (cf. 2.6.3).
Tsui (2002:742) found that classroom involvement, such as a paper critiqued by an teacher,
conducting independent research, working on a group project, giving a class presentation and
taking essay exams have a positive effect on academic skills, including the development of
critical thinking. To the contrary, according to Saavedra and Opfer (2012:7) and Tsui
(2002:742), taking multiple-choice exams and exposure to traditional lecturing (transmission
model) through which teachers transmit factual knowledge via lectures and textbooks, are
negatively related to the development of critical thinking skills.

Chapter 2: Critical thinking in life sciences: a concept clarification 46
2.6.3 Personal and behavioural factors
Teachers/lecturers and students may have preconceptions about the subject content that inhibit
their ability to think critically about the subject content. Preconceptions, such as a personal bias,
could inhibit critical thinking due to a lack of analytical skills and dispositions such as being fair,
open-minded, and inquisitive about a topic/subject matter (Snyder & Snyder, 2008:93).
According to Pithers and Soden (2000:241) and Sternberg (1987:458), the following behavioural
patterns in students inhibit good thinking:
Acting without thinking (impulsiveness).
Needing help at each step (overly dependent).
Using inappropriate goals that cannot be reached (not perceiving cause-effect
relationships).
Having difficulty with comprehension (missing meaning).
Being convinced of the rightness of their beliefs (lack of fair-mindedness).
Operating within narrow mindsets (being rigid and inflexible).
Being fearful to voice an opinion (not confident).
Condemning good thinking as a waste of time (anti-intellectual) (cited by Pithers & Soden,
2000:242).
According to Pithers and Soden (2000:242) the following types of teacher/lecturer behaviours
inhibit good thinking:
Teachers/lecturers who simply agree or disagree without solid arguments to justify their
actions.
Teachers/lecturers who just demonstrate and explain without learner-centered actions.
Teachers/lecturers who cut off student responses without proper reasoning.
Teachers/lecturers who use reproof (disapproval) rather than praise.
Teachers/lecturers who shake the learner’s confidence in the value of new ideas.
Teachers/lecturers who use only recall types of questions.
2.6.4 Cultural factors
Grosser and Lombard (2008:1364) found that the various cultural backgrounds of pre-service
teachers have not prepared them to address and practise critical thinking. This conclusion is

Chapter 2: Critical thinking in life sciences: a concept clarification 47
supported by Nisbett and Norenzayan (2002:3) who state that cultural differences that exist
among different cultures affect peoples’ beliefs about the world and the nature of their cognitive
abilities. In this regard they assert that cognitive and metacognitive abilities develop from
practical activity that is “culturally constrained and historically developing” (Nisbett &
Norenzayan, 2002:10). They are of the opinion that variation in cultural cognition arises
because of different background and historical development of societies, which lead to different
thought processes (Nisbett & Norenzayan, 2002:11).
According to Vygotsky (1986:58), cultural development is the driving force of all development.
All things cultural and social construct the understanding of humans’ cognition and learning.
Research indicates that cognitive actions of people coming from a culture that focuses on
collective thought, such as Ubuntu (African culture/lifestyle which emphasises respect and
dignity), could stifle critical thinking abilities (Nisbett & Norenzayan, 2002:11). Western culture is
characterised by individuals who focus on personal freedom, choice, criticism, debate, open-
minded, curiosity, freedom of speech and diversity, who are likely to have analytical and critical
thought (Nisbett & Norenzayan, 2002:11).
2.6.5 Language factors
Several international studies (Lun et al., 2010:606; Qing et al., 2010:4598) have shown that the
use of English as a second language may explain cultural differences in critical thinking skills.
Students using English as their second language usually possess lower level of English
proficiency when using English in tasks requiring critical thinking. Limited English proficiency
could influence the understanding of information that could lead to a cognitive overload that
results in a temporary decline to be effective at applying thinking skills (Lun et al., 2010:606).
The researcher took notice of the above-mentioned factors that could inhibit the development of
critical thinking skills during the course of the research. In particular, the researcher focused on
how teaching practices could enhance the development of critical thinking skills.
As this research focused on teaching critical thinking skills to pre-service teachers by means of
a Thinking Maps intervention, it was important for the researcher to identify a theoretical
framework to underpin the application of the Thinking Maps intervention. He therefore
familiarised himself with ways in which critical thinking skills could be taught effectively, before
constructing the intervention. The researcher wanted to ensure that he created the most
effective opportunities for enhancing the development of critical thinking skills. The next section
therefore explores a number of teaching and learning frameworks, teaching styles, teaching
methods and teaching strategies, in order to identify the teaching framework/s, teaching style,
teaching method/s and teaching strategy/ies most apposite for the researcher’s intervention.

Chapter 2: Critical thinking in life sciences: a concept clarification 48
2.7 TEACHING FOR CRITICAL THINKING
2.7.1 Teaching and learning theories and their relation to the development of
critical thinking
Learning is defined as a process that brings together personal and environmental experiences
and influences for acquiring, enriching or modifying one’s knowledge, skills, values, attitudes,
behaviour and world views (Ertmer & Newby, 2013:45; UNESCO, 2004). The major theories
that underpin the teaching and learning of knowledge, skills, values and attitudes include,
among others, behaviourism, cognitivism, constructivism, transformative learning and
experiential learning. Each of these theories is briefly explained below with the aim to clarify
how and why the researcher identified a theory or theories that would underpin his Thinking
Maps intervention.
2.7.1.1 Behaviourism
The basic idea of behaviourism is that learning consists of a change in behaviour due to the
acquisition, repetition and application of associations between stimuli from the environment and
the individual’s responses to it (McNeeley, 2007:2). Behaviourists are mainly concerned with
observable and measurable changes in behaviour, stimuli and responses and the formulation of
rules that help to explain the relationships between the observable components and behaviour
(Ertmer & Newby, 2013:45). Thorndike, a leading behaviourist theorist, conclude that (1) a
response to a stimulus is reinforced when followed by rewarding the student, and (2) a
response to a stimulus becomes stronger by exercise and is more likely to recur with repetition
(UNESCO, 2004). This view of learning is characterised by the “drill-and-practice” programmes
that are still at the order of the day in many educational institutions.
It seems reasonable to assume that behaviourists believe that specific ways of behaving are
learned through stimuli and responses that can be reinforced or discouraged by applying
respectively reward or punishment. The student is characterised according to his reactions to
conditions in the environment and the focus is on acquisition of knowledge (Ertmer & Newby,
2013:48).
Since critical thinking is viewed by researchers like Brookhart, (2010:40), Duron et al.
(2006:160), Paul (1985:37) and Paul and Elder (2006:4) as the ability to answer questions of
analysis, synthesis and evaluation, solving problems and being creative, the researcher argues
that one can expect problems when adopting a passive, teacher-centered, behaviourist
approach to teaching to enhance the application of critical thinking. This argument is supported
by Schunk (2000:118) who states that it is generally agreed that behavioural principles “cannot

Chapter 2: Critical thinking in life sciences: a concept clarification 49
adequately explain the acquisition of higher level skills” like development of language, solving
problems, generating inferences or other critical thinking skills.
2.7.1.2 Cognitivism
Cognitivism focuses on the student as an “active processor of information who is trying to make
sense of the information given to him through lecturing and reading text books” (UNESCO,
2004). This viewpoint is supported by Ertmer and Newby (2013:50), who concur that learning is
understood to be the acquisition of knowledge where the learner is an information-processor
who absorbs information, applies cognitive processes such as thinking, problem-solving,
language, decision-making, information processing and concept formation, and stores the
information in his memory. The major difference between cognitivists and behaviourists is the
locus of control over the learning activity. Learners are equipped with cognitive skills to select,
analyse and evaluate information, where behaviourists emphasise the manipulation of the
learning environment (Wallace et al., 2007:128).
Cognitive theories provide a clear shift from behavioural stimuli and response theory to people
who are regarded as information processors (Pintrich & Schunk, 2002:143; Schunk, 2000:119).
This view is supported by McNeeley (2007:4), who argues that cognitive learning theories
include thought, previous experience as a foundation to gain and organise new information, and
the social environment to acquire and practise new information. This move away from the
behaviourists’ viewpoint to that of cognitivism, coincides with the emergence of the computer as
an information-processing device (Ertmer & Newby, 2013:51).
In the process of conveying knowledge to students, mainly through lecturing and reading
textbooks, the instructional design system is used to present procedures for guiding learning
and understanding (Greeno et al., 1993:19). According to Ertmer and Newby (2013:51),
cognitivism is concerned with how students gain and process knowledge, namely by applying
higher level critical thinking skills such as being analytical, making inferences, and solving
problems.
2.7.1.3 Constructivism
Constructivists argue that students should actively construct their own knowledge and are not
merely passive recipients of knowledge. Construction of knowledge should take place by
interacting with the environment and through the reorganisation of existing thinking structures
(UNESCO, 2004). This view is shared by Ertmer and Newby (2013:55), Illeris (2015:31),
McNeeley (2007:6) and Slavin (2003:260), who argue that constructivism is a combination of
learning with creating meaning from the acquired knowledge. Students are therefore viewed as
sense-makers, not simply gaining information but interpreting it and creating meaning. This view

Chapter 2: Critical thinking in life sciences: a concept clarification 50
of learning led to the shift from “acquiring knowledge” to “creating meaning” metaphor (Ertmer &
Newby, 2013:55).
Both Piaget and Bruner, earlier influential theorists of constructive learning, identified certain
stages through which a human’s mental development goes from infancy to adulthood (Illeris,
2015:31). Piaget (1969:26) viewed the student’s active interaction with the physical and social
environment as the most important factor in the stimulation of mental growth and development.
According to Duminy et al. (1990:270), Bruner proposed the theory of discovery learning where
students are given a wide variety of facts and information and are encouraged to discover the
answer through underlying rules and principles. The provision of a classroom atmosphere, in
which mistakes are seen as learning opportunities and students are encouraged to think
creatively to take guesses, solve problems, formulate hypothesis and be analytical, are
essential. Both Piaget and Bruner viewed the student as constantly interacting with the
environment and the representation of the world by using new information (Illeris, 2015:31).
Bloom’s taxonomy of the cognitive domain also underlines this sequence of progressive
contextualisation of information. Only when students learn and understand are they able to
apply, analyse and then synthesise and evaluate information (cited by Du Preez & Van Wyk,
2006:49).
Two major types of constructivism will be discussed in the following sections, namely socio-
constructivism and cognitive constructivism (Powell & Kalina, 2009:241). Both have a student-
centered, inquiry-based approach whereby the teacher becomes a cognitive and metacognitive
guide of students’ learning and not the transmitter of knowledge only (UNESCO, 2004).
Socio-constructivism
According to Powell and Kalina (2009:241), socio-constructivism involves ideas constructed in
individuals through a personal process. Knowledge is considered as self-sufficient and
independent of the contexts in which it finds itself. According to socio-constructivits, thinking and
learning involve interactions between an individual and a situation/context. Knowledge
acquisition is therefore considered as a product of the interaction and the situation/context in
which it is acquired and utilised. This view gives way to a new metaphor for learning as
“participation” and “social negotiation” (UNESCO, 2004).
The theory of socio-constructivism was constructed by Lev Vygotsky, who, although himself a
cognitivist, rejected the assumption made by other cognitivists such as Piaget and Perry, who
stated that learning can be separated from its social context (GSI Teaching & Resource Center,
2015a:1; Slavin, 2003:61). According to Vygotsky (1978:123), the role of language and culture
should be emphasised in human intellectual development and how humans see the world.

Chapter 2: Critical thinking in life sciences: a concept clarification 51
Vygotsky (1978:123) argues that language and culture are the building blocks through which
students experience, communicate and understand. This co-constructed knowledge by the
student depends on the student’s internal motivation to understand and promote learning (GSI
Teaching & Resource Center, 2015a:3). Vygotsky (1978:84) states that learning is a
collaborative process under guidance of teachers or in collaboration (collaborative learning) with
fellow students, by giving students opportunities to discover, apply new information and solve
problems to enhance critical thinking.
Cognitive constructivism
In cognitive constructivism, ideas are constructed from experience in individuals through a
personal process to make meaning for the student, as opposed to social constructivism where
ideas are constructed through interaction with the teacher and other students (Powell & Kalina,
2009:241).
Piaget’s theory of cognitive constructivism has to do with the individual and how he constructs
knowledge (Piaget, 1969:26). Cognitive constructivism implies that humans cannot be given
information which they immediately understand and use. Instead, they have to construct their
own knowledge based on their existing cognitive structures (GSI Teaching & Resource Center,
2015b:1). This viewpoint is supported by Slavin (2003:64-65), who states that each student
interprets experiences and information in the light of their existing knowledge, their level of
cognitive development, cultural background and personal history. According to Powell and
Kalina (2009:242), Piaget rejected the idea that learning is a passive process where the student
assimilates given knowledge. He instead proposed that learning is a dynamic process where
students are actively involved by creating and testing their own hypotheses, discovering new
information and solving problems through the application of higher order thinking skills.
From the above discussions of constructivism, it is reasonable to assume that learning is much
more than memory. To enable students to really understand and learn, they must apply
knowledge, work to solve problems and discover information which will lead to the development
of higher order cognitive and metacognitive skills.
2.7.1.4 Transformative learning theory
According to Howie and Bagnall (2015:349) and Jarvis (2015:83), the transformative learning
theory is a combination of processes throughout one’s lifetime whereby the whole person, body
(genetic, physical and biological) and mind (knowledge, skills, attitudes, values, emotions,
meaning, beliefs and senses) change because of disjuncture, into a more experienced person.
Mezirow (1991:167) defines transformative learning as a “process of becoming critically aware
of how and why our assumptions have come to constrain the way we perceive, understand and

Chapter 2: Critical thinking in life sciences: a concept clarification 52
feel”; and a way to change our habits of mind through critical self-reflection and act upon these
new understandings and knowledge.
Transformative learning theory postulates that dynamic relationships between teachers/lecturers
and learners/students during teaching learning promote learning, personal development and
growth. Transformative learning requires an environment that encourages and rewards
intellectual openness and open-mindedness to allow others to voice opinions with which one
may not agree (McGonigal, 2005:1).
A cooperative teaching and learning environment promotes intellectual openness, as it
enhances interaction between teachers and learners, creating opportunities for learners to
engage in critical discourse with other students and to evaluate and change perspectives about
issues (Brown & Brown, 2015:136). Transformative learning involves the institutions of learning,
the students’ life situations, the teachers and their situations, how the curriculum might unfold,
but also the social systems such as families and peer groups. It involves critical reflection of
one’s own assumptions and knowledge, using rational interventions, self-examining,
justification, but also reflection through discussion and conversation with others about
viewpoints and perspectives (Brown & Brown, 2015:136; Howie & Bagnall, 2015:350;
McGonigal, 2005:2).
2.7.1.5 Experiential learning
Experiential learning theories build on social and constructivist theories of learning, but situates
experience at the core of the learning process, and aims to understand the ways in which
experiences, whether first- or second-hand, motivate learners and promote their learning (Killen,
2007:50; Steffens, 2015:41). Therefore, learning is about meaningful experiences in everyday
life, that lead to a change in an individual’s knowledge and behaviours (UNESCO, 2004:2). In
this regard Kolb (1983:38) defines learning as “the process whereby knowledge is created
through the transformation of experience”.
Kolb’s assumptions of learning centres around the following concepts:
Learning is best conceived as a holistic continuous process of creating knowledge grounded
in experience, and not conceived in terms of outcomes.
Learning requires the resolution of conflicts between dialectically opposed modes of
adaption to the world.
Learning involves transactions between the person and the environment (Kolb, 1983:38-40).

Chapter 2: Critical thinking in life sciences: a concept clarification 53
Experiential learning involves the application of information received from the teacher to the
student’s experiences in real life, also outside the classroom (Steffens, 2015:41-45). The
student acquires new knowledge inside and outside the class, but also from other sources. The
student learns through the process of testing whereby new information derived in or out of class
is tested against the student’s accustomed real-life experiences. In the process, the student
transforms both the information and the experience into new knowledge (Steffens, 2015:41-45).
Mayer, cited by Browne and Freeman (2000:304) states, “The key to developing critical thinking
lies in creating conditions for participation rather than passivity, and in providing opportunities
for emotional engagement with the materials”.
From the above discussions of the learning theories the researcher argues that it is reasonable
to conclude that the principles of cognitivism and cognitive constructivism appear to be the
most appropriate to consider when teaching for the development of critical thinking. Cognitivism
and cognitive constructivism postulate that students need to be involved in independent
meaning-making and thinking that could contribute to better understanding and learning. All of
these activities create opportunities for the development of higher order cognitive and
metacognitive critical thinking skills and strategies. The social nature of learning as postulated
by social constructivism also provides opportunities to develop the important critical thinking
skills, strategies, dispositions and intellectual traits. In the context of this research, the
researcher however mainly focused on the principles of cognitive constructivism that promote
independent meaning-making.
The skill to think critically needs to be strengthened and reinforced by teachers through the
teaching methods and strategies that they use during teaching. According to Stedman and
Adams (2012:9), the presentation of learning material has a large effect on whether or not
critical thinking takes place. Most teachers tend to use a lecture format in their classrooms, but
this approach does not encourage or provide learners with the opportunity to master critical
thinking (Duron et al., 2006:161). The following section explores different teaching styles,
teaching methods as well as teaching strategies, with specific emphasis on the methods and
strategies that could develop students’ critical thinking skills.
2.7.2 Teaching methods, teaching strategies to develop critical thinking
Against the background of the CAPS objectives (cf. Table 2.1), teachers should be key role-
players in ensuring that learners at school develop good critical thinking skills, which will imply
that teaching needs to become less teacher-centered and more student-centered (Kruger,
2002:109). It is important that teachers have adequate knowledge of a variety of teaching
styles, methods and strategies to ensure that they will employ relevant approaches during
teaching that would enhance the development of critical thinking.

Chapter 2: Critical thinking in life sciences: a concept clarification 54
Grosser (2009:22) asserts that a teaching style (transmission-reception style (teacher-
centered) or facilitation style (student-centered)), refers to overarching characteristics, or a
manner or way of presenting information and knowledge to students. Within each teaching style
teachers employ teaching methods, which are procedures the teacher can use when
presenting the learning content to students. Within each teaching method a variety of
strategies, which are regarded as broad plans of action or activities which an teacher designs
to ensure that students learn what they are supposed to learn (Jacobs, 2008:72; Mahaye &
Jacobs, 2008:175), can be employed.
Figure 2.3 illustrates the different teaching styles and specific methods within each teaching
style:
Teaching Styles
Transmission
reception style
Educator centered
Method
Direct instruction
Facilitation styles
Student- centered Independent Interactive
Method Method Method
Inquiry-based
Problem-basedIndirect instruction
Cooperative
learning
Figure 2.3 Teaching styles and specific methods (adapted from Grosser, 2009:4)
Figure 2.3 illustrates the two main teaching styles, namely the transmission-reception, teacher-
centered and facilitation/student-centered styles, and the methods which can be used to teach,
through direct, indirect, independent or interactive teaching. The following section explores the
four methods of teaching within the two teaching styles, as well as strategies applicable to each
of the methods.

Chapter 2: Critical thinking in life sciences: a concept clarification 55
2.7.2.1 Direct teaching methods and related strategies
Direct teaching is an teacher-centered approach where the teacher takes a central role,
spending most of the time talking, explaining and communicating knowledge. The students
normally have to listen passively without given a chance to react, ask questions or discover
knowledge for themselves. The students seldom apply or practise their newly acquired
knowledge (Arends, 2004:293; Kruger, 2002:109). Burden and Byrd (2010:120) assert that the
teacher is in full control of the subject content and skills to be learned. Direct teaching is useful
to introduce new skills or concepts in a short time period, therefore direct teaching is
behaviouristic in nature (cf. 2.7.1.1) academically focused with the teacher controlling the pace
and setting the goals (Gunter et al., 2003:64). Burden and Byrd (2010:120) support the
effectiveness of direct teaching to learn basic skills more rapidly as it tends to increase the
academic instructional time during which students attend to the task.
Table 2.6 lists some strategies of direct teaching.
Table 2.6: Direct teaching strategies
Strategies Method
Lectures Teacher presents lesson with visual aids. Students listen/take notes.
Presentation Teacher disseminates information, explains difficult concepts, stimulates students’ learning or explains tasks.
Demonstration Teacher presents visual lesson/experiment to examine processes.
Questioning Teacher guides students by using questions, moving from lower to higher level.
Recitations Teacher asks students questions on previous work done.
Practice and drill Teacher goes over material just learned and students repeat information until content is established in their minds.
Reviews Opportunity for students to look at a topic another time (reteaching).
Guided practice Students use and practise the knowledge and skills addressed in class step by step through work sheets.
Homework Students study at home (assignments, work sheets).
Expert presentations
Teacher who specialises in a field provides a lecture as a guest speaker.
Dictation Teacher reads or speaks and students write down the exact words.
(Burden & Byrd, 2010:120-134; Kramer, 2006:100)

Chapter 2: Critical thinking in life sciences: a concept clarification 56
According to Kramer (2006:100), direct teaching is not useful in building higher order skills such
as analysis, synthesis, evaluation, problem-solving or understanding, but is effective in teaching
cognitive objectives related to recall and knowledge.
It is essential that teachers practise direct teaching strategies to transfer important knowledge or
information such as concepts, definitions, morphological and physiological information in order
to stimulate students’ understanding, because only then will they be able to apply the higher
order skills of analysis, synthesis and evaluation.
2.7.2.2 Indirect teaching methods and related strategies
Indirect teaching is a student-centered approach, underpinned by cognitive and constructivist
learning theory (cf. 2.7.1.2, 2.7.1.3) where students are active participants with a high degree of
involvement and the students are more in control of their own learning by observing,
investigating and drawing inferences. Moreover, indirect teaching stimulates learners’ curiosity
and encourage learners to produce alternatives to solve problems (Borich, 2003:94; Kramer,
2006:100; Kruger, 2002:110). Teachers provide students with opportunities to discover facts for
themselves and to apply their newly acquired knowledge. Students are asked for input and two-
way communication is promoted (Kruger, 2002:110). However, as Grosser (2009:27) asserts,
indirect teaching is not effective for learning facts, complex concepts, or processes that need
understanding. According to Rüütmann and Kipper (2011:110), indirect teaching involves
teaching and learning in which concepts, patterns and abstractions are taught in the context of
strategies that include concept learning, inquiry and problem-based learning. Indirect teaching
includes the strategies listed in Table 2.7.
Table 2.7: Indirect teaching strategies
Strategies Method
Class activities Use activities that relate to the real lives of the students.
Bookmark notes Teacher distributes full-length paper to be used as a bookmark; on which prompts and questions are recorded. Students are required to record notes and observations.
Concept maps Students create visual, topic-based concept maps (cf. 3.4.2).
Harvesting Students must reflect after an experiment/activity in class on “what” they learned, and what to learn next.
Chain notes Teacher pre-distributes index cards and they are passed around; students write a brief answer to a question related to the learning.
Case studies Students are given a real fictitious situation; students answer questions in order to understand facts, principles and concepts.

Chapter 2: Critical thinking in life sciences: a concept clarification 57
Strategies Method
Micro-lessons Students act as teachers in planning and delivering a micro-lesson.
Posters and collages
Students create an educational poster or collage to illustrate issues related to subject content.
Simulations Students prepare and simulate situations and characters to enable problem-based learning; students making decisions and facing consequences.
Field trips and site visits
Students undertake practical experiments outside the classroom; students visit authentic sites related to the curriculum.
Chalk and talk Students assigned to multiple boards around the room to brainstorm answers to an assignment.
Investigations and experiments
Students assigned to develop their own investigation/experiment to investigate a topic/theme.
Interviews Students gather data from people and specialists on various topics/themes.
Students’ self-evaluation
Engaging students in critical evaluation of their own responses and thereby taking responsibility for their own learning.
(Kramer, 2006:101; Rüütmann & Kipper, 2011:110; VanGundy, 2005:169-340)
Real-world activities involve analysis, synthesis, evaluation and decision-making behaviours in
the cognitive (thinking) domain, organisation and characterisation behaviours in the affective
domain, and articulation and naturalisation behaviours in the psychomotor (doing) domain.
These behaviours are not learned by memorising facts and information. Instead, they must be
constructed by students’ own attempts to use personal experiences and past learning to bring
meaning to and make sense out of the content provided. Teaching for higher order thinking
requires instructional strategies that represent indirect instruction (Burden & Byrd, 2010:139;
Rüütmann & Kipper, 2011:110).
In addition to the direct method of teaching to convey important information, ideas and concepts
(knowledge), teachers must make use of several indirect strategies (such as case studies, field
trips, experiments, investigations and simulations) that would create opportunities to foster and
enhance students’ higher order thinking skills.
2.7.2.3 Independent teaching methods and related strategies
Independent teaching methods are those in which students work by themselves and each
student relies on his/her own efforts to accomplish a task or an assignment to enhance
individual learner initiative, self-reliance and self-improvement (Borich, 2007:17; Philpott,
2009:38). The teacher may be involved in some way in the identification of the problem or

Chapter 2: Critical thinking in life sciences: a concept clarification 58
observation (Burden & Byrd, 2010:157), but the students must plan and execute the task
without close management by the teacher (Borich, 2007:17). According to Grosser (2009:37),
the teacher’s role in independent teaching is to direct and assist the students. Independent
learning is effective in identifying weaknesses students may have and which the teacher may
help in solving.
Table 2.8 lists some strategies that promote independent teaching and learning.
Table 2.8: Independent strategies
Strategies Method
Learning centres/stations
Designated area in the class where students go to find and use resources/materials for tasks.
Contracts Structure that provides the teacher and student to agree on tasks to allow students to work on their own.
Video/movie clips Students provided with URL/hyperlinks to websites with curriculum-related content; students must provide answers/explanations to given questions.
Blogs Teachers use blogs to “push” questions and discussion prompts to students; students work through problems on their own.
Homework Students work outside the classroom.
Research projects Students collect information on a topic; projects must be submitted to get marks.
Report projects Students perform project (investigation or experiment) outside the classroom and submit a report (example: scientific method).
Interviews Students conduct interviews and present results in class.
Assignments Students answer question-related subject content, case studies, experiments etc.
Equipment-assisted learning
Students use computers, mobile phones, iPod etc. for learning; students acquire individual practice of skills.
Worksheets Students work through investigative/experimental worksheets on their own; students acquire analytic and evaluation skills.
One-on-one debates
Students prepare a topic and discuss with their peers.
(Borich, 2007:17; Burden & Byrd, 2010:157-158; VanGundy, 2005:169-340)
The following sections are devoted to two specific strategies that form part of independent
teaching and learning, namely problem-based learning and inquiry-based learning, which

Chapter 2: Critical thinking in life sciences: a concept clarification 59
formed part of the subject content in Life Sciences that was addressed during the Thinking
Maps intervention.
Problem-based learning
According to Snyder and Snyder (2008:93), critical thinking requires more than engagement; it
involves students’ personal discovery of information and knowledge. Problem-based learning
(PBL) is a heuristic, student-centered method which encourages students to “learn, discover,
understand, or solve problems on their own, as by experimenting, evaluating possible answers
or solutions, or by trial and error” (Snyder & Snyder, 2008:93). In addition, Hmelo-Silver et al.
(2007:100) concur that in problem-based learning students “learn content, strategies and self-
directed learning skills through collaboratively solving problems, reflecting on their experiences,
and engaging in self-directed inquiry” and that it involves hypothetically deductive reasoning.
Figure 2.4 represents the sequence of problem-based learning.
Problem
assigned
Learn and apply it to solve the problem
Identify what needs to be
known
Figure 2.4: The sequence of problem-based learning
Figure 2.4 illustrates ways to solve problems. According to Spence (2001:4), in solving the
problem assigned by the teacher, students will be unsure about the proceedings and what new
knowledge is needed for a solution. Spence (2001:4) therefore suggests that students must
work backwards by starting with an acceptable solution and then search for the necessary
knowledge and evidence to support it. Spence (2001:4) asserts that nearly all the experts
agree that cooperative learning group work is ideal for solving problems.
The goals of PBL are to help the learners develop flexible knowledge, effective problem- solving
skills, self-directed learning, effective collaboration skills and intrinsic motivation (Dostál, 2015;
Hmelo-Silver, 2004:235). The following steps apply when doing problem-based learning (cf.
Table 2.9): (i) learners work in small groups (four learners per group), and firstly have to grasp
the nature and scope of the problem and postulate possible explanations for the problem. Each
learner plays a specific role in the group in relation to the completion of the task.
Table 2.9 summarises the steps during problem-solving.

Chapter 2: Critical thinking in life sciences: a concept clarification 60
Table 2.9: Steps during problem-solving
Steps Students’ reaction
1. Explore the issues. What do I already know and believe about this topic and how can I share that with my teammates?
2. Define the problem. What do I think is the problem we have to solve and how can my team agree on a problem statement?
3. Investigate solutions.
What do we have to know and do to solve this problem?
Discuss problem statement, their knowledge and experience.
4. Research the knowledge and data that support the solution.
Plan; assign tasks; set deadlines.
5. Write the solution and submit. Use communication skills to state solution clearly; support solution with plausible arguments and evidence.
6. Review the performance. Go over your evaluation; as a team note the mistakes made; discuss the mistakes and plan improvements on how to solve the next problem.
(Snyder & Snyder, 2008:96; Spence, 2001:4-5)
PBL does not intend to generate single correct answers or solutions. The ideal is that different
appropriate answers might apply. Learners are provided with guidance in solving the problem,
but answers to the problem are not provided. Assessment should focus on how the problem
was solved and not whether answers are correct. Finally, the solution needs to be
communicated.
The role of the teacher is to facilitate learning by supporting, guiding, and monitoring the
learning process, building learners' confidence to take on the problem, and encourage the
learners, while also stretching their understanding. PBL represents a paradigm shift from a
traditional lecture-based teaching and learning philosophy (Schmidt et al., 2011:792-806).
There are four different kinds of problem-based teaching and learning, namely:
Experiments: Experiments are linked to formal curriculum-based problems that require an
investigation into a hypothesis.

Chapter 2: Critical thinking in life sciences: a concept clarification 61
Case studies: Case studies can be based on real-life events that focus on a problem that
needs to be solved.
Role-play and simulations: Role-plays and simulations can immerse learners in teacher-
constructed real-life problem situations from which they should learn certain things, for example
empathising with people.
Project work: Project work extends over a period, where research or investigations are
conducted to collect information, and the information is then presented in a structured and
coherent manner (South African Institute for Distance Education, 2013:314, 321).
Spence (2001:3) states that problem-based learning gives students opportunities to examine
and try out what they already know; to discover what they need to learn; to develop skills for
increased performance in teams; to improve their communication skills (verbally and written); to
state and defend sound arguments and to become open-minded about their own beliefs and
attitudes. Spence (2001:2) also found that problem-based learning environments increase
students’ critical thinking skills and knowledge acquisition. The teacher’s role is to facilitate the
learning process and may provide subject-content knowledge on a “just-in-time” basis (Hmelo-
Silver et al., 2007:100), to enable students who get stuck to proceed with the problem-solving
process.
Problem-based learning is educationally useful to nurture critical thinking because:
Learners learn to apply cognitive and metacognitive skills and strategies such as
interpretation, analysis, evaluation, making inferences, explanation and self-regulation.
Learners have to make selections from different possible solutions to a problem and justify
the selection.
In finding the most suitable solution to a problem, learners learn to demonstrate the
application of a number of dispositions, such as curiosity, truth-seeking, open-mindedness
and systematicity.
Problem-solving activities normally take place in small-group format during which learners
need to acquire interpersonal skills and dispositions, such as cooperation and empathy, and
the willingness to be open-minded to the ideas of others.
In solving problems, learners need to learn how to do so by complying with the universal
intellectual standards of reasoning, such as clarity, accuracy, precision, relevancy,
significance, breadth and depth.
In communicating the solution to a problem and justifying its solution, learners need to learn
how to express themselves clearly, in writing and verbally (Hmelo-Silver et al., 2007:100).

Chapter 2: Critical thinking in life sciences: a concept clarification 62
Inquiry-based learning
According to Arsal (2015:141), the critical thinking skills of pre-service teachers can improve if
they are exposed to student-centered learning experiences, such as inquiry-based teaching.
The teacher’s role in inquiry-based teaching is to facilitate the learning process. Hmelo-Silver et
al. (2007:100) assert that in inquiry-based learning students learn content as well as discipline-
specific reasoning skills and practices by collaboratively engaging in investigations. Laboratory
activities have long had a distinctive and central role in the science curriculum and science
teachers have suggested that many benefits accrue from engaging students in science
laboratory activities. More specifically, according to Qing et al. (2010:4598), when properly
developed, inquiry-centered laboratories have the potential to “enhance students’ constructive
learning, conceptual understanding, and understanding” of the nature of science. Learning by
using the inquiry approach involves students in formulating their own questions about a theme
and having time to explore the answers using the scientific method (Figure 2.5) during their
investigations. The students are both problem posers and problem solvers within inquiry
learning. This is supported by Hofstein et al. (2001:193) who assert that the scientific method
promotes inquiry, formulating questions, designing and conducting scientific investigations,
formulating and revising scientific explanations, recognising and analysing alternative
explanations which are abilities integral to critical thinking.
Figure 2.5 illustrates a possible strategy to facilitate inquiry-based learning by using the
scientific method.

Chapter 2: Critical thinking in life sciences: a concept clarification 63
Ask question
Do background
research
Construct
hypothesis
Test with an
experiment
Analyze results
Draw conclusion
Report results
Think!
Try again
Hypothesis is trueHypothesis is false
or partially true
Figure 2.5: The scientific method (Gebhart et al., 2012:4)
In summary, the scientific method depicted in Figure 2.5 comprises the following steps:
Defining/Identifying the problem.
Stating a possible hypothesis.
Making observations or testing hypothesis and performing experiments
Organising and analysing data.
Establishing if experiments and observations support hypotheses.
If not, performing new experiments and repeating step 4.
Drawing conclusions.
The importance of appropriate questioning in inquiry-based learning is highlighted by Green and
Murris (2014:127), who state that open procedural questioning extends students’ thinking,
enhances specific thinking skills and addresses inquiry. This is supported by McCollister and
Sayler (2010:43), who argue that critical questioning is important to infuse critical thinking in

Chapter 2: Critical thinking in life sciences: a concept clarification 64
teaching and learning, and “raises the intellectual level of thinking” in classrooms. Green and
Murris (2014:127) propose the following non-content-specific questions summarised in Table
2.10, to engage students in further inquiry and critical thinking:
Table 2.10: Different kinds of open procedural questions used during teaching
Clarifying questions
(listening and checking understanding).
Could you explain what you mean?
Can you tell us a little bit more about your thinking?
Reasoning questions
(expanding, probing, seeking justification).
What are your reasons for saying this?
Why do you think that?
If it is true, what will follow?
Inquiry questions
(connecting, generalising, making distinctions).
Are you saying you agree ... disagree? Why?
Is that always the case?
Is that the same as ... ?
Creative questions
(speculating, exploring implications and contexts).
What if ...?
Is it possible that ...?
How is that relevant ... ?
Evaluative questions
(summarising, concluding).
What difference of opinion ... ?
Have we learned anything new?
How should we take this forward?
(Green & Murris, 2014:127)
Independent teaching and learning is an act of constructing knowledge in collaboration with
others, or independently. The learning process involves the students’ metacognitive skills of
planning, monitoring and reflection in order to apply the new knowledge or information. The
independent teaching method is in line with the requirements set out in the CAPS document (cf.
Tables 2.1 and 2.2), which specify the use of the scientific and inquiry methods to enrich and
enhance students’ scientific language. An inquiry-based project allows students to use a
question as a starting point and from there experimenting will be used to accept or reject
hypotheses. Many of these abilities, namely questioning and hypotheses testing, require the
application of critical thinking skills.
2.7.2.4 Interactive/participative teaching methods and related strategies
Interactive (participative) teaching involves two-way communication (cooperation) between the
teacher and the students and between students. The teacher continuously monitors and
responds to students’ thinking. The teacher continues teaching by adjusting the flow and focus

Chapter 2: Critical thinking in life sciences: a concept clarification 65
of a theme in response to how the students are thinking with the aim of allowing them to explore
by asking questions, solving problems, processing, logical reasoning and communicating in the
process of acquiring knowledge (Gawe, 2008:209; Grosser, 2014:241; Sessoms, 2008:88).
One of the methods through which interactive/participative teaching can be introduced into
classrooms is using cooperative learning which promotes participation (Burden & Byrd,
2010:151; Gawe, 2008:209). According to Burden and Byrd (2010:152), Gawe (2008:209),
Gunter et al. (2003:257) and Slavin (2003:270) cooperative learning is a structured and
systematic way of teaching in which learners work together to ensure that all members in their
groups have learnt and understood the same content, thus achieving a common goal.
Many different cooperative learning methods have been described and researched in the
literature, but the most commonly found are described in Table 2.11 (Burden & Byrd, 2010:151;
Gawe, 2008:221; Gunter et al., 2003:259; Slavin, 2003:270).
Table 2.11: Cooperative learning methods
Method Application
1. Student teams achievement division (STAD)
Students are assigned to four-member heterogeneous groups.
Teacher presents a lesson.
Students study worksheets and work within their groups to make sure all team members have mastered the lesson.
Individual tests or quizzes on material are given.
Students’ scores are compared to their own past averages.
Points are summed to form team scores.
Team with highest score is recognised.
2. Teams-games- tournaments (TGT)
Students are assigned to four-member heterogeneous groups.
Teacher presents a lesson.
Students study worksheet and work within their groups to make sure all team members have mastered the lesson.
Students play academic games.
Games are played weekly in a tournament with members of other teams.
Team with highest score is recognised.

Chapter 2: Critical thinking in life sciences: a concept clarification 66
Method Application
3. Cooperative integrated reading and composition (CIRC)
Comprehensive programme for teaching reading and writing.
Students work in four-member groups.
Students engage in activities with one another, including reading, make predictions, summarising stories, writing responses, mastering spelling and vocabulary.
4. Jigsaw
Students are assigned to expert groups and each group is given academic material.
Students read and discuss material in expert groups.
The experts return to their home groups to teach the information to their group mates.
Quizzes / tests are given to each learner.
5. Learning together
Students work in heterogeneous groups on assignments.
Groups hand in a single completed assignment.
Students receive praise and rewards based on group product.
6. Group investigation Students work in small groups using cooperative inquiry, group discussion, cooperative planning and projects.
(Burden & Byrd, 2010:151; Gawe, 2008:221-222; Gunter et al., 2003:259-271; Slavin,
2003:273-276).
Table 2.12 illustrates additional cooperative learning strategies.
Table 2.12 Additional cooperative learning strategies.
Strategies Method
Think-pair-share
Students initially work independently.
Move to pairs to discuss their findings/answers.
Students must report.
Round-robin Place students in groups and they share their answers with others
verbally.
Panel 4 – 6 participants with a chairperson discuss a topic among themselves
and rest of class listens and asks questions.
Symposium Formal presentation of information by each member.
Debate: polar opposites
Ask the class to examine two written-out versions of for example, a theory/law of nature, one is incorrect/the opposite of the other.
In deciding which is correct, students will have to examine a topic from all angles.

Chapter 2: Critical thinking in life sciences: a concept clarification 67
Strategies Method
Role-playing Student-directed activity in which students act a particular situation.
Rest of class observes and analyses the situation.
Simulations
Place students in real-life situations.
Students are required to assume roles, make decisions and face consequences.
Games Involve students in competition.
Teach variety of skills, including problem-solving and decision-making.
Picture prompt
Show students an image with no explanation.
Ask them to identify/explain it.
Students justify their answers.
Think break
Teacher asks a rhetorical question.
Allow 20 seconds for students to think about the problem.
Teacher goes on to explain.
Pass the pointer
Place a complex/intricate/detailed image on screen.
Ask students to identify key features with aid of pointer.
Ask questions about items students do not understand.
Empty outlines Distribute partially completed outline of lecture.
Ask students to complete the outline.
Ask the winner
Students silently solve a problem.
Teacher reveals the answer.
Ask students who got it right to raise their hands.
All students who answered incorrect, need to talk with someone with a raised hand.
Interactive video quizzes
Using annotations and making them hyperlinks to other uploaded videos.
Teachers can construct an on-screen multiple choice test leading to differentiated video reactions, depending on how student answers.
(Burden & Byrd, 2010:152-157; Grosser, 2014:236; Kramer, 2006:104; VanGundy, 2005:169-
340)
Opportunities for acquiring critical thinking skills and traits such as problem-solving,
communication, questioning, processing, humility, empathy, open-mindedness and
understanding are addressed with cooperative learning activities.

Chapter 2: Critical thinking in life sciences: a concept clarification 68
When students are accustomed to being passive learners by merely memorising and recalling
information (teacher-centred), it may be difficult at first to engage them in active learning
(student-centred), that requires the application of critical thinking skills (Snyder & Snyder,
2008:96).
2.8 CHAPTER SUMMARY
This chapter focused on a conceptualisation of critical thinking. Critical thinking involves the
interrelated application of different elements, such as the core critical thinking skills,
metacognitive strategies, critical thinking dispositions/behavioural traits, intellectual traits and
the universal intellectual standards of reasoning (cf. 2.2).
The importance of enhancing the development of critical thinking was linked to the CAPS
curriculum, teaching and learning in 21st century, the acquisition of life skills and the role of
critical thinking in Life Sciences (cf. 2.3). Teachers themselves need to be good critical thinkers
before they can teach learners to think critically.
The critical thinking abilities of pre-service teachers within an international and national context
revealed that school learning apparently does not prepare pre-service teachers to apply critical
thinking skills, and that the development of the critical thinking skills of pre-service teachers are
fragile and in need of development (cf. 2.4).
Different measuring instruments, multiple-choice, open-ended and commercially available tests
to assess the development of critical thinking skills were explored in section 2.5. In the absence
of subject-related tests to establish the application of critical thinking in Life Sciences, the
researcher decided to set his own subject-related test, comprising closed multiple-choice test
items as well open test items to establish the extent to which the students possessed the critical
thinking skills on which the research focused prior to, and after the Thinkig Maps intervention.
Factors that could inhibit the development of students’ critical thinking such as political,
educational, personal, behavioural, cultural and language factors were discussed, and the
importance of, in particular, teaching practices to enhance the development of critical thinking
skills were highlighted (cf. 2.6).
Finally, different learning theories, teaching styles, teaching methods and teaching strategies
and their relation to the development of critical thinking were described with the aim to identify a
suitable teaching-learning framework that would guide the design and implementation of the
Thinking Maps intervention (cf. 2.7). Flowing from the discussions in section 2.7 the researcher
argued that a cognitivist and cognitive constructivist teaching and learning framework and the
facilitation of teaching and learning by means of independent teaching methods and strategies

Chapter 2: Critical thinking in life sciences: a concept clarification 69
would provide the necessary opportunities to enhance the development of critical thinking.
Independent teaching encourages learner activity and independent involvement in selecting,
analysing and evaluating information.
The next chapter, Chapter 3, clarifies the merits of visual learning, with specific reference to the
use of Thinking Maps, for enhancing the development of critical thinking.

Chapter 3: Developing critical thinking through visual learning: The role of thinking maps 70
CHAPTER 3
DEVELOPING CRITICAL THINKING THROUGH VISUAL LEARNING:
THE ROLE OF THINKING MAPS
3.1 INTRODUCTION
In Chapter 2 the researcher identified cognitivism and cognitive constructivism as suitable
theories to underpin teaching and learning that would enhance the development of critical
thinking. In addition, applying independent teaching methods would also possibly contribute to
creating opportunities for enhancing the development of critical thinking in Life Sciences. In
Chapter 3 the role of visual learning by using Thinking Maps as a teaching strategy that would
support independent teaching and learning for enhancing the development of critical thinking in
Life Sciences, is explored. The chapter addresses the following issues:
3.2 Characteristics of effective learning
3.3 Learning styles
Introduction
Visual learning
Auditory learning
Kinaesthetic learning
Learning through reflection
3.4 Types of visual learning strategies
Mind Maps
Concept Maps
Graphic organisers
Charts and diagrams
3.5 Thinking Maps as visual learning strategy to enhance the development of critical thinking
The difference between Thinking Maps and other visual strategies
Thinking Maps: A concept clarification
Types of Thinking Maps and their related functions
The role and place of Thinking Maps in Life Sciences to enhance the development of critical thinking
The importance of Thinking Maps for enhancing effective learning and critical thinking skills
Assessing students’ Thinking Maps
3.6 Chapter summary

Chapter 3: Developing critical thinking through visual learning: The role of thinking maps 71
Although it was important for the researcher to determine whether the use of Thinking Maps
would not only provide opportunities to enhance the development of critical thinking, the use of
Thinking Maps also had to contribute to effective learning of subject content. The following
section therefore explores the characteristics of effective learning and aligns the criteria for
effective learning with the use of Thinking Maps.
3.2 CHARACTERISTICS OF EFFECTIVE LEARNING
Watkins (2002:1) defines effective learning as a reflective activity where students draw upon
prior learning experiences to understand and evaluate present learning experiences with the
aim to gain new knowledge independently and in collaboration with others. Emanating from this
definition of effective learning one can conclude that the effective learner:
is an active and strategic learner;
is skilled to work in groups;
is able to develop goals and plans; and
monitors his/her own learning towards achieving goals.
Grosser (2007:38), Monteith (2002:93) and Pritchard (2014:119-120), add to the characteristics
of effective learning by adding the following elements:
new information is linked to previous knowledge;
information is organised;
cognitive and metacognitive skills and strategies are acquired to aid meaning-making of
information;
effective learning is cumulative and occurs in phases, although a linear connection is not
assumed; and
is influenced by social interaction.
The aforementioned elements align well with the perspective of De Corte (2011:33-47) who
regards effective learning as the contextual and collaborative construction of knowledge as well
as the importance of well-developed self-regulation skills applied during the process of learning.
Considering the above characteristics of effective learning, Watkins (2002:2) emphasises and
concurs with De Corte (2011:35) that learning is not only the acquisition of particular skills and
strategies, but also involves the student in core critical thinking and metacognitive processes of
self-regulation, namely planning, monitoring and evaluation.

Chapter 3: Developing critical thinking through visual learning: The role of thinking maps 72
Many of the aforementioned elements cited for effective learning are contained in the
perspective of Frenton (2015) who identied 20 principles of learning for the 21st century.
Students’ beliefs about their own ability affect their cognitive functioning and learning.
Pre-knowledge affects new learning.
Cognitive development and learning are not limited by general stages of development.
Learning is based on context.
Acquiring long-term knowledge and skills depends on extensive practice.
Clear and timeous feedback to students is important for learning.
Self-regulatory skills are important and can be taught.
Creativity can be fostered and is required for effective problem-solving.
Learning needs to be enjoyable to motivate students intrinsically.
Mastery goals enable students to face challenging tasks better.
Teachers’ expectations affect students’ motivation to learn.
Setting short term goals with moderate challenges enhance motivation.
Learning is situated within various social contexts.
Interpersonal relationships and communication are critical for learning and social
development.
Emotional well-being plays a role in academic performance.
Clear expectations guide and direct learning.
Effective classroom management is based on high expectations, nurturing positive
relationships, providing a high level of student support.
Formative and summative assessments are both important and useful.
Assessment tasks shoud be fair.
Fair interpretation should accompany student assessment.
The use of Thinking Maps supports a number of the characteristics of effective learning,
namely: it involves active learning, information is organised, it involves the acquisition of thinking
processes and learners can monitor their own learning (Hyerle & Yaeger, 2007:8-16).
Thinking Maps furthermore support the use of visual learning. The next section will elucidate the
use of visual learning as a learning style.

Chapter 3: Developing critical thinking through visual learning: The role of thinking maps 73
3.3 LEARNING STYLES
3.3.1 Introduction
Types of learning, or learning styles, can be defined in multiple ways. According to Grosser
(2009:12), Gilakjani (2012:105), and Gilakjani and Ahmadi (2011:469) and Pritchard (2014:69),
learning styles involve orientations to process information in certain ways. Pritchard (2014:46)
defines a learning style as a preferred way of learning and studying. He argues that individuals
have preferences, which refer to specific intellectual approaches to learning, for example using
pictures instead of text; working in collaboration with others instead of working alone In
essence, learning styles refer to the primary and preferred way in which humans acquire
information, which can be visual, auditory, kinaesthetic or reflective (Gilakjani, 2012:105). Each
of the styles will be summarised briefly.
3.3.2 Visual learning
Visual students prefer sight-based learning, writing, drawing, neatness, demonstrations,
pictures, videos, graphics, diagrams, charts and models. Visual students think in pictures and
learn best in visual images; they depend on the teacher’s body language to help with
understanding and take descriptive notes on presented material (Gilakjani, 2012:105; Gilakjani
& Ahmadi, 2011:469).
3.3.3 Auditory learning
Auditory learning is voiced-based learning and auditory students prefer talking, reading aloud,
singing, and listening to lectures, recordings, storytelling and music. According to Gilakjani
(2012:106), and Gilakjani and Ahmadi (2011:470), auditory students discover information
through listening to lectures, recordings, storytelling and music. These students gain knowledge
from reading out loud and may not fully understand written information.
3.3.4 Kinaesthetic learning
Kinaesthetic students prefer movement-based activities (Gilakjani, 2012:106; Gilakjani &
Ahmadi, 2011:470). Gilakjani (2012:106) and Gilakjani and Ahmadi (2011:470) concur that
kinaesthetic individuals learn best with an active “hands-on” approach and favour interaction
with the physical environment.
3.3.5 Learning through reflection
According to Pritchard (2014:48), reflectors collect as much information as possible and make
careful observations before they make decisions. They collect data and analyse the data before

Chapter 3: Developing critical thinking through visual learning: The role of thinking maps 74
any conclusion is made. Reflectors are slow to make up their minds but when they do, it is
based on sound knowledge, opinions, and their own experiences and what they have taken in
when watching and listening to others.
Pritchard (2014:51) argues that students use all the different types of learning to some extent,
but some students rely heavily on one of them and different students may need different types
of learning. From this discussion one may conclude that teachers must cater for a variety of
students to accommodate their learning types.
As this research explored the effect of Thinking Maps as a visual learning strategy for
enhancing critical thinking, the next section will be devoted to identify the role of Thinking Maps
among the other different types of visual learning strategies, and motivate why Thinking Maps
were regarded as the more suitable visual strategy to enhance the development of critical
thinking skills in the context of this research.
3.4 TYPES OF VISUAL LEARNING STRATEGIES
Our ability to learn visually is greater than by any of our other senses (Hyerle & Yeager,
2007:3), and 80% of information that comes into our brain is visual (Jensen in Hyerle & Yeager,
2007:3).
Visual strategies involve, among others, the use of Mind Maps, Concept Maps, Graphic
Organizers and tables, charts and diagrams. Each of the strategies will be briefly discussed
below.
3.4.1 Mind Maps
Mind Maps (cf. Figure 3.1), are visual tools making meaning of or explaining one central
concept or idea (Buzan, 2014:14). According to Hyerle (2009:155), Mind Maps:
promote creative thinking;
enable students to be creative and personalise their learning strategy;
are flexible with different ways of representation;
promote students’ disposition for ingenuity, originality and insightfulness to express their
thinking process;
explore all the creative possibilities of a given subject; and
create new conceptual frameworks within which previous ideas can be reorganised.

Chapter 3: Developing critical thinking through visual learning: The role of thinking maps 75
Figure 3.1: Mind Map
Figure 3.1 illustrates the construction of the Mind Map that focuses on understanding a
particular concept or idea. Students start in the centre of a page and branch out as a concept
or idea expands. Students are able to personalise their thinking process with images, colour,
codes and emphasis (Hyerle, 2009:154).
3.4.2 Concept Maps
Concept Maps (cf. Figure 3.2) are visual tools for organising and representing knowledge as
relationships between ideas with topics and sub-topics (Novak, 2006:1). Novak (2006:1-2)
states that Concept Maps:
can help students to identify general concepts prior to learning and assist in mastering
learning tasks through progressively more explicit knowledge;
are evaluation tools and encourage students to acquire meaningful learning patterns; and
are effective in identifying valid and invalid ideas held by students.

Chapter 3: Developing critical thinking through visual learning: The role of thinking maps 76
Figure 3.2: Concept Map (Novak, 2006:1)
Figure 3.2 illustrates the general structure of a Concept Map. Concept Maps include concepts,
usually enclosed in circles or boxes of some type, and relationships between concepts or
propositions, indicated by a connecting line between two concepts. Words on the line specify
the relationship between the two concepts (Novak, 2006:1).
3.4.3 Graphic Organisers
Graphic Organisers (cf. Figure 3.3) are visual tools that resemble networks of information and
allow students to organise information around one thought or idea (Ausubel, 1978:251).
Teachers often match the Graphic Organisers with content specific strategies (life cycles in Life
Sciences, time lines in History, Venn-diagrams in Mathematics) and Graphic Organisers are
therefore task and subject specific. Graphic Organisers, as illustrated by Ausubel (1978:151-
155), can be used to enhance students’ thinking skills by encouraging brainstorming, generating
new ideas, connecting parts to the whole, drawing sequence and analysing causes and effects.
Graphic Organisers have a number of attributes that enhance students’ thinking skills.
They allow students to make connections among pieces of information and make
information easier to recall.

Chapter 3: Developing critical thinking through visual learning: The role of thinking maps 77
They also allow students to break information into manageable parts, so that they can easily
see the relationships among the separate ideas.
They provide a means to observe and assess the students’ thought processes (Hyerle,
2009:155-156).
Figure 3.3: Graphic Organisers (Figueras, 2013)
Figure 3.3 illustrates possible, flexible structures of Graphic Organisers. Teachers create a
specific visual structure that students follow and complete as lessons progress (Hyerle,
2009:155). Hyerle (2009:155) argues that Graphic Organisers are highly structured and of good
use for students as they systematically organise ideas.
3.4.4 Charts and diagrams
Pie charts, bar charts, histograms, line graphs and diagrams (cf. Figure 3.4) are all different
ways of representing information visually. They usually provide a quick summary that gives a
visual image of the data/information being presented (Gilmartin & Rex, 1999:14).

Chapter 3: Developing critical thinking through visual learning: The role of thinking maps 78
Figure 3.4: Chart and diagrams (Google images)
Figure 3.4 demonstrates some charts and diagrams which are used to illustrate information
discussed in subject-content, case studies or experimental procedures. It is important to be able
to interpret them correctly as they present the facts and figures in such a way so as to confirm
an argument (Gilmartin & Rex, 1999:21).
None of the aforementioned visual strategies (Mind Maps, Concept Maps, Graphic Organisers,
charts and diagrams) scaffold the development of thinking processes (Hyerle, 2009:157).
However, according to Hyerle (2009:157), Thinking Maps provide a strong connection between

Chapter 3: Developing critical thinking through visual learning: The role of thinking maps 79
brain research and exactly mirror and support the development of students’ thinking processes
(cf. 3.5.5).
As the focus of the study was on Thinking Maps to enhance the critical thinking skills of pre-
service Life Science teachers, the next section will elucidate the importance of Thinking Maps
as a visual learning strategy to enhance the development of critical thinking.
3.5 THINKING MAPS AS VISUAL TEACHING AND LEARNING STRATEGY TO
ENHANCE THE DEVELOPMENT OF CRITICAL THINKING
Thinking Maps is a teaching strategy used in successful classrooms to promote cognition and
metacognition amongst students. Costa (2009:16) stated that “Although thinking is innate and
spontaneous, skilful thinking must be cultivated.” This is the crux of all of education – teaching
students how to think and reason critically, and in this regard Thinking Maps appear to be a
valuable strategy.
The following section compares Thinking Maps to the other visual strateiges.
3.5.1 The difference between Thinking Maps and other visual strategies
According to Hyerle (2009:151), similarities between Thinking Maps and other visual learning
strategies include that they are all visual tools that could be used during teaching and
assessment, and all can be highly successful. However, he states that Thinking Maps are
cognitive tools to facilitate specific thinking skills (Hyerle, 2009:151). There are several
differences between Thinking Maps and the other visual strategies, as illustrated in Table 3.1.
Table 3.1: Differences between Thinking Maps and other visual strategies
Thinking Maps Other visual strategies
Fixed visual designs for eight thinking processes. Common set of fixed visual patterns across subject disciplines, grades and schools, reinforced in similar ways.
Not ready-made by the teacher.
Focus on isolated tasks and defined structures. Can be ready-made and given to students by the teachers. Flexible and can take on different ways of representation. Learners can construct individualised maps, that differ across subjects.
Open-ended to complete thoughts and ideas. Restrict the thought process to fill the defined space with concept information.
Easily transferable across subjects, due to fixed designs.
Difficult to transfer from one subject to the next due to flexible structures.
Student-oriented, individual meaning-making. Mostly teacher-oriented and often ready made.

Chapter 3: Developing critical thinking through visual learning: The role of thinking maps 80
Thinking Maps Other visual strategies
Visual strategy for making meaning, organising information and acquiring a thought process.
Visual strategy for organising information and making meaning of a topic.
Focus on eight fundamental integrated thinking processes.
Focus on explaining a central concept in detail.
Cross-discipline strategy to reflect depth and complexity of thinking.
Personalised, content specific strategy.
Main functions are making meaning, organising information and acquiring a thought process.
Main function is to summarise and organise information.
(Hyerle, 2009:151-157; Hyerle, 2014:162-163)
From Table 3.1 it is clear that Thinking Maps could be regarded as effective for enhancing the
development of critical thinking because they address eight fundamental thinking processes that
are involved in critical thinking and describe how these thinking processes work in unison.
Additionally, Thinking Maps are not subject-bound, are student-oriented and clearly define
cognitive skills, drive learning, incorporate metacognitive strategies and eliminate confusion that
can come from other maps and graphic organisers that have flexible structures (Hyerle,
2014:162-163). According to Hyerle and Yeager (2007:8), students who consistently use the
same visual pattern for a specific thought process soon have a visual pattern for thinking and
become independent learners.
The subsequent sections explore the use of Thinking Maps during teaching and learning.
3.5.2 Thinking Maps: A concept clarification
Thinking Maps is a teaching strategy that consists of a set of eight visual tools designed to help
students develop critical thinking processes and habits for problem-soving, as well as reading
(Hyerle & Yeager, 2007:2). Thinking Maps are designed to represent a specific cognitive
process that can be used in a multidisciplinary and integrated fashion across age groups in any
subject field (Hudson, 2013:9).
3.5.3 Types of Thinking Maps and their related functions
Thinking Maps is a set of eight maps based on cognitive skills that support the brain’s natural
tendency to detect patterns. For this reason the maps are used across the curriculum, in any
subject (Hudson, 2013:9). More than one map may be used for a particular topic highlighting the
interrelated application of different cognitive skills visually. Thinking Maps are visual
representations of the following skills namely, defining, describing, comparing, categorising,
seeing cause-and-effect relationships; analysing part-whole relationships and helping students

Chapter 3: Developing critical thinking through visual learning: The role of thinking maps 81
see their own learning pathway or the thought processes and finding analogies utilised to solve
a problem. According to Hyerle (2009:153), students who present their thinking with visual tools
practise metacognition because they describe the thinking processes they use to organise
content and knowledge. The Thinking Maps can be used on their own or in tandem with other
Thinking Maps to create a common visual language for students and teachers at all grade levels
and in all subject areas (Hudson, 2013:3; Hyerle, 2009:164-165). Examples of how the eight
different Thinking Maps could be applied to Life Sciences are explained in the following
sections.
3.5.3.1 Circle Maps
Figure 3.5 highlights the thinking process related to defining in context, which focuses on
defining a concept, thing, or idea in specific contexts (Hyerle & Yeager, 2007:24). Construction
of a Circle Map begins with a small inner circle and a larger outside circle. Words, symbols or
pictures are placed in the innermost circle. This would be the concept, word, or symbol that
needs to be understood and defined. Context information that gives definition to the topic makes
up what is written or drawn in the outer circle. The information in these two circles together
define a topic and shows the thinking process. Circle Maps should be filled with key words,
phrases, descriptors, and/or illustrations (Hyerle & Yeager, 2007:26).

Chapter 3: Developing critical thinking through visual learning: The role of thinking maps 82
Figure 3.5: Circle Map:Describing the scientific method (Adapted from Hyerle &
Yeager, 2007:24)
Circle Maps are used mainly for brainstorming ideas and thoughts about a topic (Hyerle,
2014:165). They can be used on their own or as a starter map. Circle Maps provide a formative
assessment of what the student knows at a specific moment in time. Circle Maps have many
applications, such as vocabulary development, accessing prior knowledge, identifying
misconceptions or reviewing information after lessons (Hyerle & Yeager, 2007:26).
3.5.3.2 Bubble Maps
The thinking process involved in describing properties or providing attributes or characteristics is
captured with a Bubble Map (Figure 3.6). The Bubble Map is used to describe attributes or
characteristics by using adjectives with the aim of identifying sensory and emotional qualities of
Scientific method
Dependent variable
Independent variable
Method of
investigation
Describe
investigations
Draw
conclusions
Test
hypothesis
Perform experiments
Analyse data
Organise data
Do experiments and
observations support
the hypothesis?
Fully describes
investigations

Chapter 3: Developing critical thinking through visual learning: The role of thinking maps 83
a concept (Hyerle & Yeager, 2007:30). The Bubble Map is constructed with a word or symbol
being placed in a larger inside circle. This would be the concept, noun or symbol to be
described. Adjectives describing the noun, concept or symbol in the inner circle are written in
bubbles connecting to the inner circle. Key words used to guide the construction of the Bubble
Map include: describe, use vivid language, identify comparisons, qualities, characteristics and
properties (Hyerle & Yeager, 2007:32).
Figure 3.6: Bubble Map: Characteristics of the prokaryotic cell (Adapted from Hyerle &
Yeager, 2007:30)
Prokaryoticcell
Bilayered
Singlecelled
PleomorphicPrimitive
Small

Chapter 3: Developing critical thinking through visual learning: The role of thinking maps 84
3.5.3.3 Double Bubble Map
Figure 3.7 highlights the thinking process that involves comparing and contrasting any two
things (Hyerle & Yeager, 2007:36) with a Double Bubble Map. To construct a Double Bubble
Map begins with drawing two large circles and writing the items being compared in their centres.
then adding middle bubbles for words, phrases, or symbols that show similarities between the
two items. Outside bubbles can be added connected to the two things being compared, listing
words or phrases that identify differences. Key words used to guide the construction of the
Double Bubble Map include: compare, contrast, similarities, differences, distinguish between,
and differentiate (Hyerle & Yeager, 2007:38).
Figure 3.7: Double Bubble Map: Comparing the eukaryotic cell and the prokarytotic cell
(Adapted from Hyerle & Yeager, 2007:36)

Chapter 3: Developing critical thinking through visual learning: The role of thinking maps 85
Double Bubble Maps can be used to compare anything that students are studying, requiring
students to think about the idea or concept as points with counterpoints. Double Bubble Maps
are also used for prioritising which information is most important within a comparison (Hyerle,
2014:165).
3.5.3.4 Tree Maps
The thinking process involved in classifying and identifying is depicted with a Tree Map (Figure
3.8). The Tree Map classifies or sorts things and ideas into categories or groups by reflecting
main ideas and details (Hyerle & Yeager, 2007:42). The construction of a Tree Map begins with
writing the category name or main idea of the topic on the top line, drawing connection lines
going down to sub-categories or supporting ideas. Below each sub-category or supporting idea
lines list specific members or details of that sub-category or supporting ideas. Key words used
to guide the construction of a Tree Map include among others the following, classify, sort,
categorise, identify the main idea and supporting idea and give sufficient and related details
(Hyerle & Yeager, 2007:44).
Different kinds of microscopes
Light microscope Electron microscope
Scanning electron
microscopes
Transmission electron
microscopes
Magnify objects – 1000
Oil and ultraviolet light can be
used to increase resolution in
compound Light Microscope.
2D ,
Colour
Not much detail
Magnify capability is greater
the LM – 100 000 x
Electron dense metals used
as stains to improve contrast
2D flat images,
Detailed right through object
Magnify capability is greater
the LM –
250 000 x
Electron dense metals used
as stains to improve contrast
3D over the surface images,
Detailed with shadows
Characteristics and useCharacteristics and use
Characteristics and use
Figure 3.8: Tree Map: Classifying microscopes (Adapted from Hyerle & Yeager,
2007:42)

Chapter 3: Developing critical thinking through visual learning: The role of thinking maps 86
Tree Maps can be used to classify information based on their attributes or details. For a slight
variation, Tree Maps can be developed inductively through reverse construction (starting with
the individual members and working backwards to the main topic). It also enables students to
work deductively; they learn to create concepts and ideas as category headings and add
supporting ideas and detail in the branches (Hyerle, 2014:165).
3.5.3.5 Brace Map
The “Whole to Part” thinking process can be visualised with a Brace Map (Figure 3.9). Brace
Maps are used to identify the whole to part relationship while analysing the component parts of
physical objects, and identifying the spatial relationship of parts to the whole or structural
analysis (Hyerle & Yeager, 2007:48). Construction of a Brace Map begins with a name of the
whole object being placed on a line to the extreme left. The lines in the middle of the sets of
braces should be filled with words describing major parts of the whole to the left by using nouns.
The lines to the extreme right are for component parts of the parts of the whole. Key words used
to guide the construction of a Brace Map include: parts of, show the structure, take apart,
identify the structure, physical components, and anatomy (Hyerle & Yeager, 2007:50).
Cell membrane
Chromatids
Eukaryotic cell Cytoplasm
Chromosomes Centromere
Nucleus Nuclear membrane Kinetochores
Organelles Nucleoplasm
Figure 3.9: Brace Map : Analysing the eukaryotic cell (Adapted from Hyerle & Yeager,
2007:48)
Brace Maps can be used to analyse any concrete physical object such as structures in science,
parts of a number in mathematics (Hyerle & Yeager, 2007:51). According to Hyerle (2014:165),

Chapter 3: Developing critical thinking through visual learning: The role of thinking maps 87
Brace Maps support the development of spatial reasoning and understanding physical
boundaries.
3.5.3.6 Flow Map
Sequencing as a thinking process, which is related to ordering of information, is presented in
Figure 3.10. The Flow Map sequences the stages and sub-stages of an event, identifies the
steps in a process, and orders information (Hyerle & Yeager, 2007:54). To construct a Flow
Map the name of the event or sequence is written above the first stage. Then the major stages
of the events are written in the large rectangular boxes flowing from left to right, and finally the
sub-stages of each major stage in the smaller rectangular boxes below. Key words used to
guide the construction of a Flow Map include: sequence, put in order, retell/recount, cycles,
patterns, show the process, and solve multi-step problems. Flow Maps can be written
horizontally, vertically, or in any direction as long as all the stages are connected. Students may
draw their stages cyclically, as rises and falls, or to show comparisons or degrees (Hyerle &
Yeager, 2007:54).
Define/identify the
problemState a hypothesis
Make observations or test hypothesis
and perform experiments
Draw conclusionsDo experiments and observations
support hypothesis?
Organise and analyse
data
Communicate results
Figure 3.10: Flow Map: Steps in the scientific method (Adapted from Hyerle & Yeager,
2007:54)

Chapter 3: Developing critical thinking through visual learning: The role of thinking maps 88
Flow Maps can also show the order of objects arranged from smallest to largest. Common uses
of Flow Maps include life cycles, problem-solving steps, historic events, and time lines (Hyerle &
Yeager, 2007:56).
3.5.3.7 Multi-Flow Map
Figure 3.11 highlights the thinking process related to analysing cause and effect with the use of
a Multi-Flow Map (Hyerle & Yeager, 2007:60). To construct a Multi-Flow Map an important
event that occurred is written in the large centre box. On the right side of the large centre box,
the effects of that event are connected with arrows. On the left of the large centre box, the
causes of that event are connected to the centre with arrows. This illustrates how the causes
lead into the event and how the effects come out of the event. Key words used to guide the
construction of a Multi-Flow Map include: causes and effects, discuss the consequences, “what
would happen if?” “if . . . then,” predict, describe the change, identify the motivation behind,
“identify the results of,” and “what happened because of ?” In Multi-Flow Maps, the number of
causes do not have to match or balance the number of effects. Multi-Flow Maps can be
constructed as one-sided to focus on just causes or just effects of an event (Hyerle & Yeager,
2007:62).

Chapter 3: Developing critical thinking through visual learning: The role of thinking maps 89
Methylene blue Make nuclei more visible
HematoxylinA nuclear stain that, with
fixative, stains nuclei blue-violet
or brown.
Eosin
Iodine solution
Counterstain to haematoxylin, colours
red blood cells, cell membranes,
cytoplasmic material, & extracellular
structures pink / red.
Cells yellow and nuclei dark yellow
Starch indicator -dark blue colour
Animal cells
Plant cells
Figure 3.11: Multi-Flow Map: The effect of stains (Adapted from Hyerle & Yeager,
2007:60)
Applications of Multi-Flow Maps include historic analysis, reading and predicting events, and
behaviour management (Hyerle & Yeager, 2007:63).
3.5.3.8 Bridge Map
Figure 3.12 illustrates the thinking process that involves the identification of analogies by means
of a Bridge Map. The Bridge Map identifies similarities between relationships and creates
analogies (Hyerle & Yeager, 2007:66). Construction of a Bridge Map begins with the relating
factor or the relationship being written on the line of the bridge to the far left, between the top
and bottom phrases, symbols, or words (see Figure 3.12 below). The first pair of terms that
share this relationship is written on the left side of the bridge and a second pair of terms that
share this relationship on the right side of the bridge. Key words used to guide the construction
of a Bridge Map include: identify the relationship, guess the rule, symbolism, metaphor, allegory,
analogy and simile (Hyerle & Yeager, 2007:66).

Chapter 3: Developing critical thinking through visual learning: The role of thinking maps 90
Reagents and Iodine Schultz Millon’s Benedict
food tests Starch Cellulose Proteins Glucose
Figure 3.12: Bridge Map: Reagents and food tests(Adapted from Hyerle & Yeager,
2007:66)
Bridge Maps help students identify similarities between relationships and as long as the
relationship holds true, the bridge can be extended to more than two pairs of words. Possible
applications for Bridge Maps include: scientific concepts, historic events, and mathematical
relationships (Hyerle & Yeager, 2007:66).
3.5.3.9 The Frame of Reference
A Frame of Reference should be added to all the maps. Frames of Reference allow students to
frame their maps within three metacognitive ideas , namely “How do you know what you know?”
“What is influencing the information in your map?” or “Why is this information important?”
(Hyerle & Yeager, 2007:20). A Frame of Reference is a box drawn around any map that gives
students a way to reference their maps within specific contexts and allows students to connect
their prior knowledge to a specific curriculum topic. Each Frame of Reference can be
individually tailored to meet the specific need/curriculum/context of the purpose of the map.
Frames of Reference encourage reflective thinking and the development of metacognition.
(Hyerle, 2014:166; Hyerle & Yeager, 2007:20).
In this research, the researcher concentrated on the following maps during intervention: the
Circle Map, the Tree Map and the Multi-Flow Map, as these maps provide opportunities for
acquiring the skills to analyse, synthesise and evaluate. These are important skills that Life
Relating factor

Chapter 3: Developing critical thinking through visual learning: The role of thinking maps 91
Science students need to apply to make sense out of Life Science phenomena and to make
effective decisions/conclusions about scientific issues.
The contributions of Thinking Maps towards the development of critical thinking skills in Life
Sciences, are explained in the section below.
3.5.4 The role and place of Thinking Maps in Life Sciences to enhance the
development of critical thinking
To the best knowledge of the researcher, no research studies have established the effects of
Thinking Maps for enhancing the development of critical thinking skills in Life Sciences. It is
reasonable to assume that Thinking Maps will enhance the development of critical thinking
because they:
define cognitive skills and enable students to think with depth and apply new knowledge to
complex tasks;
give pathways for thinking about thinking resulting in improved metacognitive skills;
make learning meaningful because they support the brain in turning subject-content into
visual-spatial-verbal format;
require students to move and interact, collaboratively accessing their knowledge to
strengthen connections and support;
allow for the accurate evidence of student performance over time and provide students with
life-long thinking tools (Hyerle, 2014:173-174; Hyerle & Yeager, 2007:8-16).
Considering the skills (cf. Table 2.2) and specific outcomes to be acquired in Life Sciences (cf.
Table 2.1), it is clear that the application of Thinking Maps could probably play a major role in
enhancing critical thinking skills that underpin the achievement of specific outcomes in Life
Sciences.
Hyerle (2014:163) asserts that thoughts through words, orally or through writing, are
“dramatically under-presented” by words and numbers, only because they reflect linear
representations of information. He argues that the networks of ideas in our brain are non-linear
and “highly associative.” Thinking Maps support the brain in creating patterns from content
specific information. This makes learning meaningful for students because Thinking Maps link
the information students are learning to their own emotional frames of reference and give them
ownership of their thinking processes and their learning. Thinking Maps give explicit pathways
for thinking about thinking resulting in improved student performance (Hyerle, 2014:169).
Processing information that is placed on a Thinking Map, moves the information to the long-term

Chapter 3: Developing critical thinking through visual learning: The role of thinking maps 92
memory. Moreover, the use of Thinking Maps supports cognitive (cf. 2.7.1.2) and cognitive
constructivist (cf. 2.7.1.3) teaching and learning theory that could be regarded as suitable to
promote the development of critical thinking, as their approaches to teaching involve students in
active, independent and/or social meaning-making and problem-solving processes that provide
opportunities to acquire and develop critical thinking.
In addition, the use of Thinking Maps comply with the criteria for effective learning (cf. 3.2),
because students not only acquire particular skills and strategies, but are also involved in the
metacognitive processes of planning, monitoring and self-reflection (self-regulation).
In order to assess the development of critical thinking skills through the use of Thinking Maps,
the researcher had to give some consideration to how Thinking Maps should be assessed.
3.5.5 Assessing students’ Thinking Maps
According to Hyerle and Yeager (2007:283), Thinking Maps are designed to be used in the
process of instruction and are not seen as final products to be assessed. In this research, the
students worked independently, and decided which of the three Thinking Maps that this
research focused on could be the most appropriate to use as a learning strategy to analyse,
synthesise and evaluate subject content presented during the intervention effectively.
The researcher provided the students with the following checklists with criteria (Table 3.2, Table
3.3) as a guide that they had to adhere to when constructing the Thinking Maps. The researcher
also used the checklists with criteria for assessing the quality of the students’ Thinking Maps
and to monitor and gauge their progress regarding the development and application of the
critical thinking skills on which the research focused, namely analysis, synthesis and evaluation
to subject content.
Table 3.2 provides a more detailed and specific checklist with criteria that pay attention to a
number of important critical thinking skills, dispositions and universal intellectual standards of
reasoning involved in critical thinking.

Chapter 3: Developing critical thinking through visual learning: The role of thinking maps 93
Table 3.2: Thinking Maps Checklist
Criteria Complete Incomplete
Sufficiency / fluency of ideas
The Thinking Map displays evidence of multiple concepts.
The Thinking Map displays evidence of minimal or no concepts.
Thought process
(Verb or keyword linked to Thinking Map)
The thought processes utilised are correctly linked to the Thinking Map.
The thought processes utilised are incorrectly linked to the Thinking Map.
Collaboration
The Thinking Map displays collaborative evidence (different colours used to add ideas and information).
The Thinking Map idsplays no or minimal evidence of collaboration (no additional ideas or information added).
Flexibility
The concepts / ideas presented in the Thinking Map vary significantly and reflect deeper thought about the concept/idea.
The concepts / ideas presented in the Thinking Map are all very similar and do not differ. No deeper thought about the concept/idea is reflected.
Originality
The Thinking Map displays new and creative facts about the concept/idea (breadth and depth)
The Thinking Map only reflects a basic and simplistic understanding of the concept/idea.
Elaboration The Thinking Map displays fine and rich detail about the concept/idea.
The Thinking Map displays no finer and rich detail about the concept /idea.
Layout The technical structure of the Thinking Map is laid out correctly.
The technical structure of the Thinking Map is laid out incorrectly.
The criteria indicated in Table 3.2 and how they were applied to the research, are briefly
explained below:
Fluency: Fluency refers to generating many different ideas. It is an important skill to practise
because a variety of ideas would enable one to consider appropriate solutions to one’s problem
(Pikulsky & Chard, 2005:512).
Thought process: The student participants had to select the appropropriate Thinking Maps to
align with the thought processes linked to the Life Science subject content. The following
thought processes and Thinking Maps were applicable in the context of this research.

Chapter 3: Developing critical thinking through visual learning: The role of thinking maps 94
Table 3.3: Thought processes and Thinking Maps applicable in the research
Circle Map Tree Map Multi-Flow Map
Define Classify Cause and effect
Brainstorm Categorize Decision and consequence
Generate Organize Reason and influence/result
Name Group Input and output
Identify Cluster
Collaboration: Although the researcher focused on independent learning in the context of the
research, and students did not construct Thinking Maps collaboratively, student participants
were given the opportunity to give feedback on their Thinking Maps during lectures. This
provided the student participants with the opportunity to check the information in their Thinking
Maps and to add or rectify information.
Flexibility: Fluency is about generating as many ideas that are different from each other
(Costa, 2009:21-23). Flexible thinkers think out of the box and in alternative ways and are
creative problem-solvers (Costa, 2009:21-23).
Originality: Originality refers to ideas that are unusual, unconventional and different
(MacFarlane, 2007:18). In the context of the research, student participants had to use the
Thinking Maps to analyse, synthesise and evaluate subject content information in a novel way,
that would differ from the work of others.
Elaboration: Elaboration refers to providing evidence of interesting and elaborate detail to
information that would improve understanding and clarity (Niehuis et al., 2001:120).
Layout: The structures of the Thinking Maps had to correspond with the original structures
designed by Hyerle and Yeager (2007:24-66) for the various thinking processe.
Table 3.4 below, provides a more holistic assessment of the quality of the Thinking Maps in
general that could be used to assess relevancy and elaboration (detail).

Chapter 3: Developing critical thinking through visual learning: The role of thinking maps 95
Table 3.4: Checklist for assessing the Thinking Maps in terms of relevancy and
elaboration (detail)
1 0-29%
Not achieved The Thinking Map displays misconceptions regarding the subject content.
2 30-39%
Elementary achievement
The Thinking Map displays a limited understanding of the subject content.
3 40-49%
Moderate achievement
The Thinking Map displays a simplistic understanding of the subject content.
4 50-59%
Adequate achievement
The Thinking Map displays a basic understanding of the subject content.
5 60-69%
Substantial achievement
The Thinking Map displays a basic understanding as well as new ideas about the subject content.
6 70-79%
Meritorious achievement
The Thinking Map displays basic and new ideas as well as finer detail about the subject content.
7 80-100%
Outstanding achievement
The Thinking Map displays a deeper understanding of the subject content and supplies rich, diverse and creative ideas about the subject content.
3.6 CHAPTER SUMMARY
Chapter 3 focused primarily on clarifying the role of visual learning, what Thinking Maps are and
their importance for developing critical thinking. The use of Thinking Maps supports the criteria
for effective learning (cf. 3.2) as the construction of Thinking Maps involves students in active
meaning-making, often in collaboration with others, and promotes the application of cognitive
skills, metacognitive strategies, dispositions as well as the universal intellectual standards of
reasoning.
Different types of visual learning strategies, namely Mind Maps, Concept Maps, Graphic
Organizers, charts, diagrams and Thinking Maps were explored (cf. 3.4, 3.5). Thinking Maps
could be regarded as more suitable to enhance the development of critical thinking, as they
facilitate more explicitly the cognitive skills (defining, describing characteristics, contrasting,
classifying, whole-part thinking, sequencing, cause-and-effect reasoning and analogical
reasoning) and metacognitive strategies (self-regulation) involved in critical thinking (cf. Figure
2.1). Moreover, Thinking Maps enable students to think with clarity, relevance, depth, breadth
and logic when constructing the maps, thus promoting the development of the universal
intellectual standards of reasoning (cf. 2.2.4). In addition, a number of critical thinking
dispositions/behavioiural traits such as accuracy, open-mindedness, systematicity and
persistence are required to construct good quality Thinking Maps (cf. 2.2.3).

Chapter 3: Developing critical thinking through visual learning: The role of thinking maps 96
The researcher identified the Circle Map (cf. 3.5.3.1), Tree Map (cf. 3.5.3.4) and the Multi-Flow
Map (cf. 3.5.3.7) to be utilised in the context of the research as these maps provide
opportunities for acquiring the critical thinking skills to analyse, synthesise and evaluate.
The following chapter, Chapter 4, provides a detailed discussion of the research methodology
that was employed in the context of the study.

Chapter 4: Empirical research design 97
CHAPTER 4
EMPIRICAL RESEARCH DESIGN
4.1 INTRODUCTION
In this chapter, the researcher explains the research design that was employed in the context of
determining the role of Thinking Maps to enhance the critical thinking skills of pre-service Life
Science teachers. This chapter addresses the following issues:
The first section in this chapter addresses the research paradigm that framed the research.
4.2 RESEARCH PARADIGM
4.2.1 What is a research paradigm?
According to Creswell (2009:6-6) and Nieuwenhuis (2010:47), a paradigm is a set of basic
beliefs that influence one’s worldview and guides a researcher’s actions during research. These
beliefs refer to beliefs about the role of the researcher, the role of the research participant, the
best way to collect data to answer the research question, and the purpose of the research.
4.2 Research paradigm
What is a research paradigm?
Types of research paradigms
4.3 Research aim, objectives, hypotheses and variables
4.4 Research methodology
Research design
Research strategy
Data collection methods
Sampling
Data analysis and interpretation
Quality criteria
Ethical considerations
4.5 Chapter summary

Chapter 4: Empirical research design 98
The following section briefly explains the main paradigms in educational research and
motivates the choice of a particular paradigm for the present research.
4.2.2 Types of research paradigms
4.2.2.1 Positivism
According to Jansen (2010:21), a positivistic research paradigm is concerned with the gathering
of objective data regarding a research phenomenon. He states that facts (knowledge) are
objective, observable and can be explained in terms of scientific laws. Terms like investigate,
experiments, surveys, comparison, quantitative data and correlation are used in a positivistic
paradigm. Cohen et al. (2007:9) agree and furthermore concur that positivistic paradigms are
concerned with measurement, numerical data and statistical analysis.
4.2.2.2 Interpretivism/Socio-constructivism
Jansen (2010:21) indicates that interpretivism/socio-constructivism focuses on an interaction
between the researcher and the participants to gain insight into the participants’ life-worlds by
interacting with them, and appreciating and clarifying meanings they attribute to understanding
research phenomena. According to Creswell (2009:8), socio-constructivism is the development
of subjective meanings of experiences where individuals try to understand the world in which
they live and work.
4.2.2.3 Pragmatism
Pragmatism originates from actions, situations and consequences and is concerned with
applications and solutions to problems (Creswell, 2009:10). Focus is not on the method but on
the research problem and combining quantitative and qualitative approaches to gain a deeper
understanding (knowledge) of a research problem (Creswell, 2009:11).
4.2.2.4 Critical theory
Critical theory is concerned with experiences related to discrimination pertaining to gender,
race, class or other types of oppression (Jansen, 2010:21). Jansen (2010:21) argues that
inequality, racial conflict and class conflict lead to resistance in the following generations, which
could result in responses to injustices. Differences in background (culture, religion, socio-
economic environment, gender) have an effect on people, the society and their understanding
of human relationships.
According to Jensen (1997:1), the purposes of critical theory are:

Chapter 4: Empirical research design 99
to promote a diverse educational system for all individuals, which steer them away from
over-specialisation;
to create a social balance between “personal autonomy of the individual and universal
solidarity of the collective”;
to promote revolution against all forms of discrimination, including those based on gender,
sexual orientation, race and religion;
to promote revolution against all forms of fascism and nationalism; and
to preserve good moral values that promote universal solidarity.
4.2.2.5 Advocacy participatory view
Creswell (2009:9) asserts that the advocacy participatory view involves politics and a political
agenda. Typically, this type of research has an action agenda to reform and change
participants’ lives. Creswell (2009:9) maintains that social issues like empowerment,
suppression, domination, inequality and alienation need to be addressed. The researcher and
participants must work collaboratively to voice their concerns and try to improve their lives
(Creswell, 2009:9).
In the present study, the researcher worked within a positivistic paradigm as he aimed to
gather numerical data objectively from the research participants (Jansen, 2010:21). The
researcher’s beliefs regarding the role of the researcher centred on an external, objective role to
establish the impact of a Thinking Maps intervention on the development of critical thinking
skills. The data collected by means of testing were statistically analysed, supported by a
positivistic paradigm that is concerned with measurement, numerical data and statistical
analysis (McMillan & Schumacher, 2008:254).
In order to answer the research questions, the research formulated a number of objectives and
hypotheses, and identified the variables in the research that would be manipulated, which are
presented below.
4.3 RESEARCH AIM, OBJECTIVES, HYPOTHESES AND VARIABLES
The main aim of the study was to determine to what extent first year pre-service Life Science
teachers are effective at applying the critical thinking skills to analyse, synthesise and evaluate
information, and if not, to establish how a Thinking Maps intervention can enhance the
development of the critical thinking skills analysis, synthesis and evaluation among the first year
pre-service Life Science teachers.

Chapter 4: Empirical research design 100
The main aim was operationalised in the following objectives:
To determine what the development of critical thinking skills entail by means of a literature
review.
To determine which critical thinking skills are important for Life Sciences by means of a
literature review.
To explain what Thinking Maps are by means of a literature review.
To investigate how Thinking Maps can enhance the development of critical thinking skills in
Life Sciences by means of a literature review.
To determine how effective first year pre-service Life Science teachers are in applying the
critical thinking skills of analysing, synthesising and evaluating by means of a pre-test.
To examine to what extent a Thinking Maps intervention can develop the critical thinking
thinking skills of analysing, synthesising and evaluating among first year pre-service Life
Science teachers by means of a post-test and the Thinking Maps constructed by the pre-
service teachers during the intervention.
To examine to what extent there will be a difference in the pre- and post-test results of an
experimental and control group regarding the application of critical thinking skills, after a
Thinking Maps intervention, and in the absence of a Thinking Maps intervention, by
comparing the pre-and post-test results of the different groups.
To establish to what extent a Thinking Maps intervention would contribute to the
development of the universal intellectual standards of reasoning involved in critical thinking
by means of open questions in the pre-tests and post-tests.
The last objective was not a main focus of the study, but the researcher wanted to obtain initial
data for a future study in relation to whether students could apply the intellectual standards of
reasoning to the motivations they provide for test answers.
As the study determined cause and effect relationships, the following tentative hypotheses
guided the execution of the study:
Research hypotheses
The following research hypotheses regarding the impact of Thinking Maps to enhance the
development of critical thinking skills among first year pre-service Life Science teachers were
proposed:

Chapter 4: Empirical research design 101
H01: There will be no statistically significant difference in the application of critical thinking
skills between the pre- and post-test results of participants in Experimental groups 1 and
2 after completion of the Thinking Maps intervention.
Ha1: There will be a statistically significant difference in the application of critical thinking skills
between the pre- and post-test results of participants in Experimental groups 1 and 2
after completion of the Thinking Maps intervention.
H02: There will be no statistically significant difference in the application of critical thinking
skills between the pre- and post-test results of participants in Experimental groups 1 and
2 after normal classroom lecturing (in the absence of teaching with Thinking Maps).
Ha2: There will be a statistically significant difference in the application of critical thinking skills
between the pre- and post-test results of participants in Experimental groups 1 and 2
after normal classroom lecturing (in the absence of teaching with Thinking Maps).
In the context of the study, critical thinking skills (analysis, synthesis, evaluation) were regarded
as the dependent variables (Creswell, 2012:115) and the Thinking Maps intervention as the
treatment or independent variable (Creswell, 2012:116, 117). Moreover, biographic variables
such as gender, home language, culture and type of school attended could be regarded as
control variables (Creswell, 2012:117) that could have influenced the research results. The
various subgroups of the biographical variables however did not contain sufficient participants
for statistical analyses (cf. 6.3.1). It was therefore not possible for the researcher to control for
the influence of these variables (McMillan & Schumacher, 2006:129).
The next section explains and motivates the research methodology that was employed in the
study.
4.4 RESEARCH METHODOLOGY
The research methodoly employed in the context of the research involved the selection of a
research design, research strategy, research participants, data collection methods and
statistical procedures to analyse the data. Details about each of the mentioned aspects are
provided in the subsequent sections.
4.4.1 Research design
Creswell (2009:3) and Leedy and Ormrod (2013:97) state that a research design entails a
carefully planned route or decisions that a researcher takes about how to achieve the aims and
objectives of a research study. In support of a positivist paradigm, the researcher used a

Chapter 4: Empirical research design 102
quantitative, quasi-experimental research design, as the aim was to establish the effect of
an intervention in an experimental and control group situation.
4.4.1.1 Quantitative research design
Creswell (2009:145-169) and Leedy and Ormrod (2013:97) indicate that quantitative research is
structured and planned, the researcher is not subjectively involved in data collection, but takes
on an external role in data collection and objectively gathers numerical data. In this research,
the researcher systematically and objectively collected numerical data from a selected group of
participants, in this case the first year Life Science pre-service teachers (Leedy & Ormrod,
2013:94).
The researcher acknowledges the following advantages and disadvantages of quantitative
research, as identified by Fouché et al. (2011:143-158), Kruger (2003:18-19) and O'Neill (2006).
Advantages
Quantitative research:
allows for a broader study, involving a greater number of subjects, and enhancing the
generalisation of the results;
could allow for greater objectivity and accuracy of results. Generally, quantitative methods
are designed to provide summaries of data that support generalisations about the
phenomenon under study. In order to accomplish this, quantitative research usually involves
few variables and many cases, and employs prescribed procedures to ensure validity and
reliability; and
avoids personal bias by researchers keeping a 'distance' from participating subjects and
employing subjects unknown to them.
Limitations (Disadvantages)
Quantitative research:
collects a much narrower and sometimes superficial dataset;
provides limited results as it provides numerical descriptions rather than detailed narrative
and generally provides less elaborate accounts of human perception;
is often carried out in an unnatural, artificial environment so that a level of control can be
applied to the exercise. This level of control might not normally be in place in the real world,
yielding laboratory results as opposed to real-world results;

Chapter 4: Empirical research design 103
will in addition to pre-set answers not necessarily reflect how people really feel about a
subject and in some cases might just be the closest match; and
can lead to the development of standard questions by researchers based on 'structural' bias
and false representation, where the data actually reflect the view of the researchers instead
of the view of the participant.
As this research involved the manipulation of a dependent variable (critical thinking skills), the
researcher used a quantitative, experimental research design (Creswell, 2012:307). The
research was structured and planned, and numerical data were collected objectively and
statistically analysed (Creswell, 2009:145; Maree & Pietersen, 2010a:145).
4.4.2 Research strategy
According to Creswell (2009:11), a research strategy, or strategy of inquiry, refers to designs or
models that provide direction for the research procedures. Maree and Pietersen (2010a:149)
classify quantitative research strategies as experimental and non-experimental. The researcher
used an experimental research strategy. Three main categories of experimental research
strategies can be distinguished, namely pre-experimental, quasi-experimental and true
experimental (Fouché et al., 2011:144).
The experimental design adheres to the cause-and-effect question and the following
characteristics distinguish the experimental design from others.
Manipulation takes place.
Experimental and control groups are present.
Random selection of participants to experimental and control groups takes place (Fouché et
al., 2011:144; Maree & Pietersen, 2010a:149).
The non-experimental design is used in descriptive studies, mainly surveys, in which the
participants who have been selected to take part in the research are measured on all the
variables applicable without any manipulation (Fouché et al., 2011:144; Maree & Pietersen,
2010a:152).
The following section discusses the quasi-experimental research strategy that was employed in
this research.
4.4.2.1 Quasi-experimental research
Quasi-experimental research strategies aim to evaluate interventions but do not use
randomisation. Quasi-experiments aim to demonstrate causality between an intervention and an

Chapter 4: Empirical research design 104
outcome in non-randomly selected experimental and control groups (Creswell, 2009:160;
Creswell, 2012:307; Leedy & Ormrod, 2013:245).
Using this basic definition, it is evident that although the randomised controlled trial is generally
considered to have the highest level of credibility with regard to assessing causality,
researchers often choose not to randomise the intervention for one or more reasons:
difficulty of randomising subjects;
difficulty to randomise by locations (e.g. fixed classes); or
small available sample size (Leedy & Ormrod, 2013:245; Thyer, 2012:93).
In this research, the researcher used non-randomised intervention because the participants
were in fixed classes, and the research focused on a small group of participants, namely a
group of first year pre-service Life Science teachers at a South African university. The
researcher employed quasi-experimental research with a nonrandomised control group pre-test
and post-test design, or as referred to by Creswell (2009:160), as a non-equivalent control
group pre-test and post-test design, to determine the effects of a Thinking Maps intervention on
enhancing the development of critical thinking skills (Leedy & Ormrod, 2013:245).
The researcher acknowledges the following advantages and limitations of quasi-experimental
research as identified by Fouché et al. (2011:143-158), Kruger (2003:18-19) and McMillan and
Schumacher (2008:273):
Advantages
Quasi-experimental research is used when randomisation is impractical and/or unethical.
Quasi-experimental research is typically easier to set up than true experimental designs.
Quasi-experimental research minimises threats to external validity as natural environments
do not suffer the same problems of artificiality as compared to a well-controlled laboratory
setting.
Quasi-experiments are natural experiments, allowing for some generalisations to be made
about the population.
Quasi-experimental designs are efficient in longitudinal research that involves longer time
periods which can be followed up in different environments.
Limitations (Disadvantages)
Quasi-experimental estimates of impact are subject to contamination by confounding
variables.

Chapter 4: Empirical research design 105
Difficulty to generalise results due to a lack of randomisation.
The lack of random assignment in the quasi-experimental design method may allow studies
to be more feasible.
Non-randomisation makes it harder to rule out confounding variables and introduces new
threats to internal validity.
Because randomisation is absent, some knowledge about the data can be approximated,
but conclusions of causal relationships are difficult to determine due to a variety of
extraneous and confounding variables that exist in a social environment.
Causation cannot be fully established because the experimenter does not have total control
over extraneous variables.
Using unequal groups can also be a threat to internal validity. If groups are not equal, which
is sometimes the case in quasi-experiments; the experimenter might not be able to
conclusively indicate what the causes are for the results (Fouché et al., 2011:143-158;
Kruger, 2003:18-19).
As it was not possible for the researcher to sample research participants randomly, a quasi-
experimental research strategy was regarded as apposite for the study. The researcher used
intact, preselected groups of participants, gave a pre-test, administered the treatment condition
to one group, and gave the post-test, after which a second experiment was conducted in a
similar way with a new experimental and control group (the experimental group in the first
experiment became the control group, and the control group became the experimental group).
4.4.3 Data collection methods
4.4.3.1 Pre- and Post-testing
To generate data, the researcher made use of pre- and post-testing. According to Cohen et al.
(2007:414), in tests researchers have a powerful method of data collection.
As the first year Life Science content links with the content dealt with at Grade 12 level, pre-test
1 measured the extent to which the participants acquired the skills to execute critical thinking
(analysis, synthesis, evaluation) in Life Science content dealt with at school level. Pre-test 1,
was written at the onset of Experiment 1 that took place during weeks 1 – 6 of the first semester
during 2016. Similarly, pre-test 2 was written at the onset of Experiment 2, that took place
during weeks 7-12 of the first semester during 2016, based on the learning content that was
dealt with in weeks 7-12 of semester 1.

Chapter 4: Empirical research design 106
Based on the pre-test results, Thinking Maps interventions (an intervention was developed for
the first six weeks of semester 1 and for the last six weeks of semester 1, respectively) were
developed to address the deficiencies noted in the pre-test results at the onset of the first six
weeks and second six weeks of the first semester during 2016. The intervention was
implemented for a period of twelve weeks with Experimental groups 1 and 2 on a rotational
basis (six weeks per group). On conclusion of the intervention with each group, a post-test,
post-test 1 (written at the end of week 6) and post-test 2 (written at the end of week 12) were
written to establish the effect of the Thinking Maps intervention on enhancing the development
of the critical thinking skills (analysis, synthesis, evaluation) in the context of the subject content
dealt with in each semester, respectively.
In addition, pre-test 1 was administered again as a second post-test, post-test 1B, and pre-test
2 was administered as a second post-test, post-test 2B, to test for the transfer of critical thinking
skills to different subject content.
The tests were norm-referenced, as comparisons were drawn between the achievements of the
control groups relative to the achievements of the experimental groups.
According to the best knowledge of the researcher, there is no test commercially available for
researchers to determine the impact of Thinking Maps to enhance critical thinking skills in Life
Sciences in the South African context. Therefore, the researcher developed tests for pre- and
post-test purposes.
The various pre-tests and post-tests used in the context of the research focused on the
following subject content. Table 4.1 provides a break down of the topics in Life Sciences that
were addressed during the research.

Chapter 4: Empirical research design 107
Pre-test 1: Grade 12 Life Sciences
Post-test 1: Content dealt with during weeks 1 - 6 of the intervention - problem-based learning
and the scientific method.
Post-test 1 B: A repetition of pre-test 1 (Grade 12 Life Sciences)
Pre-test 2: Content dealt with during weeks 1 – 6 of the intervention – content that focused on
problem-based learning and the scientific method.
Post-test 2: Content dealt with during weeks 7 – 12 of the intervention – content that mainly
focused on problem-based learning.
Post-test 2 B: A repetition of pre-test 2 – content that focused on problem-based learning and
the scientific method.
The tests focused on the application of analysis, synthesis and evaluation to different subject-
content as the researcher tested for the transfer of critical thinking skills (Norris & Ennis
1989:101) (cf. 2.5.2, 2.5.5) in a balanced way (cf. Appendix C; Table 6.11).
In the context of assessing critical thinking skills, a pioneer in the field of critical thinking
assessment, Robert Ennis (1993:184), argues for the use of open questions in conjunction with
multiple-choice questions, where students have to justify/defend their answers.
The pre- and post-tests comprised multiple-choice items with one correct answer, and a follow-
up open question for each multiple-choice answer where the student needed to motivate an
answer. Motivating an answer served as a measure to control for guessing answers in the
multiple-choice test, and to reflect the universal intellectual standards of reasoning, such as the
depth, breadth, relevance, significance and logic of the participants' reasoning. As the focus of
these tests was to determine the effectiveness with which the pre-service teachers applied skills
to analyse, synthesise and evaluate information, the multiple-choice questions in equal
proportions addressed the skills to analyse, synthesise and evaluate. Although the questions in
the pre- and post-tests were not exactly the same, the skills tested (analysis, synthesis and
evaluation) remained the same. Both tests reflected the progressive nature of the content that
was covered during the first and second semesters of 2016. Moreover, the content of the pre-
and post-tests also differed, as the researcher wished to establish to what extent transfer of the
skills acquired during the intervention was effective in a different context.
Due to ethical considerations, it was not possible for the researcher to recruit the participants, or
administer the informed consent and tests to his own students. He requested an independent

Chapter 4: Empirical research design 108
person, whom he trained, to assist him with the aforementioned tasks. The independent person
was observed by an independent statistician who is knowledgeable on ethical research conduct.
The data derived from the pre-tests and post-tests were captured, analysed and interpreted with
the assistance of an independent statistician from NWU, Vaal Triangle Campus.
The programme depicted in Table 4.1 was followed during the first semester of 2016, for
Experiment 1 (weeks 1-6) and Experiment 2 (weeks 7-12).

Chapter 4: Empirical research design 109
Table 4.1: Procedural program for the first semester
Data collection Experiment 1
Week 1 Week 2 Week 3 Week 4 Week 5 Week 6
Pre-test 1 Post-test 1 Post-test 1B
Experimental group
Intervention
Thinking Maps
1 Period Scientific method &
Data analysis
1 Period Microscopy
1 Period Mosaic model
Diffusion & Osmosis
1 Period Chemistry concepts
1 Period Organic
Carbohydrates
1 Period Energy & ATP
Metabolism -Cata- &
Anabolism
Control group
No intervention 1 Period Scientific method &
Data analysis
1 Period Microscopy
1 Period Mosaic model
Diffusion & Osmosis
1 Period Chemistry concepts
1 Period Organic
Carbohydrates
1 Period Energy & ATP
Metabolism -Cata- & Anabolism
All groups
Normal teaching and practical
1 Period Indigenous knowledge Study hints
2 Periods -Different cells
-Cell membranes
2 Periods Cell division
1 Period Inorganic
2 Periods Lipids
Proteins Nucleic acids
1 Periods Enzymes

Chapter 4: Empirical research design 110
Data collection Experiment 2
Week 7 Week 8 Week 9 Week 10 Week 11 Week 12 Week 13
Pre-test 2 Post-test 2 Post-test 2B
Experimental group
Intervention Thinking Maps
1 Period Photosynthesis
1 Period Starch tests: Water bath,
boiling water, alcohol, iodine
solution
1 Period Cell respiration
Anaerobic fermentation
1 Period DNA
1 Period RNA
1 Period Cell division
Control group
No intervention 1 Period Photosynthesis
1 Period Starch tests: Water bath,
boiling water, alcohol, iodine
solution
1 Period Cell respiration
Anaerobic fermentation
1 Period DNA
1 Period RNA
1 Period Cell division
All groups
Normal teaching and practical
1 Period Experiments
2 Periods Light,
chlorophyll, carbon dioxide
needed for photosynthesis
2 Periods Experiments: Sugar, yeast, thermometer, rubber stopper
1 Period DNA continued
2 Periods RNA continued
1 Period Conclude semester

Chapter 4: Empirical research design 111
4.4.3.2 Student Thinking Maps
The researcher also used the Thinking Maps generated by the student participants during the
intervention to collect data in relation to the application of the critical thinking skills analysis,
synthesis and evaluation. The Thinking Maps were not regarded as primary data collection
instruments, but were used to provide the researcher with information regarding how well the
students could apply critical thinking processes to the Life Science subject content. The
students worked independently, and decided which of the three Thinking Maps the research
focused on (Circle Map, Tree Map, Multi-Flow Map) would be the most appropriate to use to
analys, synthesise and evaluate the information provided during the Life Science lectures.
Students generated Thinking Maps in class and for homework. The researcher provided the
students with checklist(s) (cf. Table 3.2; Table 3.3) to guide the construction of their Thinking
Maps. The checklists with criteria also allowed the researcher to monitor and gauge the
effectiveness of the students to apply critical thinking skills in the subject content presented to
them.
Marks were allocated to students for their Thinking Maps, which were captured, analysed and
interpreted with the assistance of an independent statistician from NWU, Vaal Triangle Campus.
Examples of the students’ Thinking Maps can be found in Appendix D.
4.4.4 Sampling
Creswell (2012:141), and Maree and Pietersen (2010b:538) maintain that it is important for a
research study to be representative of the population, but usually it is impossible to include the
entire population in a study, as time and costs are the main restrictions. According to Creswell
(2012:142), and McMillan and Schumacher (2008:119), a population is a group of individuals
with the same characteristics. When a researcher selects a sample, the characteristics of the
population always have to be kept in mind. In this study, the population comprised all first year
pre-service teachers at universities in South Africa. It was not possible to do research with the
entire population, due to time, costs and logistical constraints, therefore a study population was
identified. A study population is a heterogeneous, smaller group from the population from which
the sample is selected (Maree & Pietersen, 2010b:538). In the context of this study, the study
population comprised all first year pre-service teachers at a university in Gauteng, South Africa.
The sample was selected from this study population. According to Maree and Pietersen
(2010b:540), a sample is a heterogeneous group of participants from whom data were collected
relevant to the research question.
According to Creswell (2012:142), researchers employ either probability or non-probability
sampling approaches in quantitative studies. Probability sampling involves random sampling,

Chapter 4: Empirical research design 112
which enables a researcher to make generalisations to the population. In the context of this
study, the researcher made use of non-probability sampling, as non-random sampling was
utilised to select the research participants. Non-probability sampling methods use convenient
and purposive sampling strategies. Convenient sampling refers to the selection of participants
who are accessible and available (Creswell, 2012:142). In this study, the researcher conducted
research with a convenient and accessible sample, namely the 2016 first year Life Sciences
pre-service teachers whom he taught (n = 56). Furthermore, the research purposively focused
on Life Sciences pre-service teachers, as the researcher aimed to enhance his own classroom
practice. The sampled participants thus represented the characteristics the researcher sought to
study (McMillan & Schumacher, 2008:125). Non-probability sampling cannot guarantee that the
sample will be representative of the population and therefore no generalisations of the research
findings could be made. It was, however, not the purpose of the study to generalise findings.
The researcher merely aimed at determining the impact of a Thinking Maps intervention as part
of his own classroom practice during teacher-training to enhance the development of critical
thinking skills among first year pre-service Life Sciences teachers. With the small and
geographically bound sample, the researcher envisaged achieving what Mouton (2009)
indicates, namely that a small and geographically bound sample provides the possibility to
obtain more reliable results to support the effectiveness of an intervention.
The sample was heterogeneous with regard to gender, home language, culture and the types of
secondary schools attended (public/township/private). To eliminate the threat of using already
formed groups that might be different, and to avoid researcher bias in the selection of the
experimental and control groups, the researcher requested an independent person who was not
involved in teaching the students and the research to assist with the random allocation of
students to an experimental and a control group. As far as possible, the participants in the
experimental group and control groups were comparable in terms of the following biographic
variables: male/female, White/Black, public/private schools, and Afrikaans/English as language
of instruction. A comparison of the pre-test results also assisted the researcher to establish
whether the experimental and control groups were comparable.
4.4.5 Data analysis and interpretation
4.4.5.1 Multiple-choice test items
Within the context of this research, the researcher analysed nominal data and ratio data (Leedy
& Ormrod, 2013:279). Nominal data use numbers only to identify different categories of people.
In this research, nominal data were collected regarding the demographic composition of the
sampled participants. Leedy and Ormrod (2013:213) conclude that ratio data classify order and
measure data, and have a true zero point. This is apposite to this research, as pre-test and

Chapter 4: Empirical research design 113
post-test scores that have true zero points were compared. In order to analyse the quantitative
data obtained, the researcher made use of descriptive statistics as well as inferential statistics
(Creswell, 2012:182; Pietersen & Maree, 2010a:183; Pietersen & Maree, 2010b:198).
Descriptive statistics were used to organise and summarise the nominal and ratio data in a
meaningful way in order to promote an understanding of the statistics (Pietersen & Maree,
2010a:183). The nominal data were organised and summarised as frequencies and
percentages, whereas the ratio data were organised and summarised as frequencies,
percentages, averages (means) and standard deviations and presented in tabular and graphical
format.
Inferential statistics were used as the researcher wanted to go beyond just summarising and
describing the data collected (Pietersen & Maree, 2010b:198). Inferential statistics enabled the
researcher to compare means of the test data and to make inferences about the effectiveness
of the Thinking Maps intervention (Leedy & Ormrod, 2013:213).
For the purpose of quantitative data analysis by means of inferential statistics, it was important
to determine which type of statistical analysis, parametric or non-parametric, would be suitable
for the type of test data. According to Pietersen and Maree (2010d:225), parametric methods
are used where the sample size is larger than 30 and assumptions can be made that the study
variable is normally distributed (bell-shaped curve) in the wider population. There are, however,
researchers who feel that a minimum of 100 participants is required to check for sampling error
(Strydom, 2011b:225). Although the researcher’s sample only comprised 56 participants
(Experiment 1, 29 participants, Experiment 2, 27 participants), he was able to make
assumptions about the wider population and therefore applied parametric statistical procedures
(Cohen et al., 2007:415). The independent statistician who assisted the researcher with the
data analysis and interpretation confirmed that the skewness and kurtosis of the data
supported the use of parametric statistics (cf. 6.2.1).
To determine the statistical significance of the differences between the test results, t-tests were
used and p-values calculated. All p-values smaller than 0.05 (p ‹ 0.05) were regarded as
significant and p-values larger than 0.05 (p › 0.05) were regarded as non-significant (Pietersen
& Maree, 2010d:225).
The effect size was also calculated for statistical significant differences, which is a standardised,
scale-free measure of the magnitude of the difference or correlation being tested between
variables (Pietersen & Maree, 2010b:211). When looking at mean differences, the effect size is
denoted by d, also known as Cohen’s d. Effect sizes ranging from 0 to 0.2 are interpreted as a

Chapter 4: Empirical research design 114
small effect size, while 0.5 is regarded as a medium effect size and 0.8 is a large effect size
(Pietersen & Maree, 2010b:211).
4.4.5.2 Open questions
The verbatim transcripts of the responses to the open questions were checked to explore the
clarity, accuracy, precision, depth, breadth, relevance, significance and logic of the
reasoning of the participants. Chapter 6 provides examples of the responses to the open
questions (cf. 6.6).
4.4.6 Quality criteria
As part of a quantitative study, a researcher has to ensure the validity and reliability of the
research findings. The following section clarifies how the researcher upheld criteria for validity
and reliability.
4.4.6.1 Validity
The validity of a measurement instrument refers to the extent to which the instrument measures
what it intends to measure (Leedy & Ormrod, 2013:89; Pietersen & Maree, 2010c:216). In the
context of a quantitative study, a researcher has to uphold criteria for validity regarding the
implementation of the research design as well as for the data collection instruments (Leedy &
Ormrod, 2013:92). According to McMillan and Schumacher (2008:125), securing validity of a
quantitative research design comprises four aspects, namely: internal, external, construct and
statistical validity.
Validity of the quantitative research design
Internal validity of a research study focuses on the degree to which its design and the data
allow the researcher to draw precise conclusions between the independent and dependent
variables and relationships within the data (Leedy & Ormrod, 2013:101; McMillan &
Schumacher, 2008:134). According to Maree and Pietersen (2010a:151), internal validity allows
the researcher to have control over the variables. Examples of variables in this research are
gender, home language, culture and secondary schools attended. The researcher did not have
control over the influence of variables as the subgroups of the different biographical variables
comprised too few participants and did not allow the researcher to conduct statistical analyses
to control for the influence of the variables (cf. 6.3).
McMillan and Schumacher (2008:134) conclude that external validity refers to the ability to
generalise the results and conclusions to other individuals who belong to the entire population
(Maree & Pietersen, 2010a:151; Leedy & Ormrod, 2013:103). The experiment was done in a

Chapter 4: Empirical research design 115
real-life setting and this enhanced the external validity. External validity was however
threatened by the fact that this research was conducted at one university with a sample that
was not randomly selected. This limited the generalisation of the research findings to the entire
population, and compromised the external validity of the research.
Construct validity refers to using more than one collection method to validate the research
results (Pietersen & Maree, 2010c:217). In this research, pre-tests and post-tests were used on
a rotational basis with experimental and control groups in two experiments to support construct
validity. Although the responses to the open questions in the test, as well as the assessment of
the students’ Thinking Maps, were not regarded as primary methods of data collection, the
researcher provides an overview of how the data played a supporting role in providing some
insight into the development of the participants’ critical thinking skills after completing a Thinking
Maps intervention.
McMillan and Schumacher (2008:134) concur that statistical conclusion validity is about the
appropriate use of statistical tests to ensure that the correct and valid relationships can be
formed. In the context of the study, statistical conclusion validity was ensured by utilising the
correct statistical procedures as suggested by the Statistical Consultation Services and the
study leader (Creswell, 2012:162).
Validity of the tests
Validity of the test items was guaranteed by addressing various forms of validity, namely face,
content, construct and criterion validity (Delport & Roestenburg, 2011:173; Leedy & Ormrod,
2013:89; Pietersen & Maree, 2010c:217). Leedy and Ormrod (2013:89) and Pietersen and
Maree (2010c:217) agree that face validity is the extent to which the instrument looks as if it is
measuring a particular characteristic and whether it measures what it has to measure. The aim
of this research study was to determine the impact of a Thinking Maps intervention to enhance
critical thinking skills (analysis, synthesis, evaluation) among first year pre-service Life Science
teachers. The pre-tests and post-tests complied with face validity, as the focus of these tests
was to determine the effectiveness with which the pre-service teachers applied skills to analyse,
synthesise and evaluate subject information.
According to Leedy and Ormrod (2013:89), content validity is the extent to which the
measuring instrument represents specific content that has to be measured. Pietersen and
Maree (2010c:217) state that content validity refers to the covering of the complete content of
the construct the test wants to measure in equal proportions. Content validity was ensured by
asking questions that required the pre-service teachers to analyse, synthesise and evaluate
information in equal proportions in the pre-tests and post-tests (cf. Table 6.11).

Chapter 4: Empirical research design 116
Construct validity refers to the data collection method’s ability to measure a characteristic that
cannot be directly observed, but must be inferred from patterns in the data (McMillan &
Schumacher, 2008:134). This form of validity was ensured by conducting a small scale,
informal, dynamic pilot study (Brace, 2008:15) prior to data collection to establish the construct
validity of the test items (cf. 4.4.6.2).
Regarding criterion validity, Delport and Roestenburg (2011:173), Leedy and Ormrod
(2013:90), and Pietersen and Maree (2010c:217) explain that it is the extent to which the results
of the instrument correlate with an external criterion, or data collection instrument known to
measure the same construct. No criterion validity could be guaranteed in this research, as the
researcher made use of researcher-developed tests and was not aware of any other subject-
specific test in Life Sciences for critical thinking against which he could measure the results of
his test instrument.
Validity of the experimental research
Validity of the experimental research was ensured in the following ways:
Internal validity
In this research, the researcher, who is a trained facilitator in Thinking Maps, conducted the
implementation of the intervention. The researcher did not make use of other researchers to
implement the intervention in order to avoid the influence of experimental effects (Lodico et al.,
2010:249).
The implementation time was kept short, as a shorter, more focused and intense
implementation time for an intervention reduces the chance of other factors like history,
maturation and experimental mortality affecting the result (Lodico et al., 2010:244). To avoid
researcher bias in the assigning of participants to the experimental and control groups, the
researcher requested a colleague who was not involved in the research to assist with the
allocation of students to an experimental group and a control group, according to the same
criteria (Cohen et al., 2007:156-159; Lodico et al., 2010:244). The pre-test result was used as a
measure to determine whether the groups were similar and comparable (Lodico et al.,
2010:244).
The use of a control group assisted the researcher to control for the effects of pre-testing on the
results, maturation of the participants, statistical regression and events that could have occurred
outside the study and that could have affected the dependent variable (Lodico et al., 2010:244).

Chapter 4: Empirical research design 117
In order to address the influence of mortality (participants dropping out) the data analysis only
involved the responses of the participants who wrote all the pre-tests and post-tests (Lodico et
al., 2010:244).
External validity
As the intervention was a first pilot study, it was conducted at one university only with a sample
that was not randomly selected. The generalisation of the research findings to the entire
population was therefore limited (Cohen et al., 2007:156-159).
In order to enhance the external validity, the researcher described the independent variables
adequately, to make future replications of the experimental conditions possible (Cohen et al.,
2007:156).
The researcher was aware of the influence of the Hawthorne effect that could contaminate
experimental treatments when participants become aware of the fact that they are participants
in an experiment where a change in behaviour is desired (Cohen et al., 2007:156). Simply being
part of a study can influence one’s feelings, behaviour and attitudes (Lodico et al., 2010:249).
Without deceiving the participants, they were informed that they were going to be exposed to a
new teaching strategy of which the effects would be monitored, specifically indicating the
improvement of critical thinking skills (analysis, synthesis and evaluation) as the focus.
In order to avoid treatment diffusion (Lodico et al., 2010:249), the researcher requested the
participants of the experimental group who received the intervention first, to limit communication
and sharing of information with the participants of the control group. The control group was
informed that they would get their opportunity to take part in the intervention. Participants wrote
all tests at the same time, to minimise the threat of information about the test being provided to
other participants. To avoid the pre-test results influencing the post-test results, the latter
covered different content, but still focused on the application of the same critical thinking skills
as in the pre-test. Cohen et al. (2007:432) state that a pre-test may have questions which differ
in form or wording from the post-test, though the two tests must be pitched at the same difficulty
level. Furthermore, to avoid differential implementation of the intervention to the experimental
and control group respectively, the researcher ensured identical implementation of the
intervention with both groups.
External validity was enhanced by the fact that participants were not exposed to multiple
treatment interactions to enhance their critical thinking skills (Lodico et al., 2010:249). The
researcher focused on establishing the difference that resulted due to the implementation of one
treatment only (Thinking Maps).

Chapter 4: Empirical research design 118
4.4.6.2 Reliability
As the tests used in the research did not comprise Likert-scale items, but multiple-choice items
with one correct answer, the Statistical Consultation Services that assisted the researcher with
the capturing and analysis of data indicated to the researcher that the format of the data
collection items would not be suitable for computing Cronbach Alpha coefficients, and that the
use of an informal pilot study would be suitable to assess the reliability of the test items.
A small scale, informal, dynamic pilot study (Brace, 2008:15) was conducted prior to data
collection to establish the construct validity of the test items. The tests were distributed to
specialists in the field (three Life Science lecturers), to verify whether the tests items measured
analysis, synthesis and evaluation of information in Life Sciences, assess the difficulty level of
the test items, check the wording for clarity and establish the suitablility of the completion time of
the tests. The researcher adapted and reformulated the test items based on the suggestions
and recommendations received from the specialists in the field, before administering the tests to
the students.
In order to avoid threats to the reliability with respect to marking, the researcher ensured that:
marking, adding and transfer of marks were double-checked by a colleague;
he was the only marker, to avoid problems with interpreter reliability; and
objective tests were used to avoid inconsistency in marking (Cohen et al., 2007:159).
4.4.7 Ethical considerations
According to Strydom (2011a:113), “research should be based on mutual trust, acceptance,
promises and well-accepted conventions and expectations between all parties involved in a
research project”. Ethical issues anticipated in this research as indicated by Creswell
(2009:88;2012:23), are discussed below.
4.4.7.1 Research problem
A research problem should have benefits not only for the researcher, but also for the
participants (Creswell, 2009:88). The participants in this research could benefit, as they might
acquire skills through the Thinking Maps intervention, which would enhance the development of
their critical thinking skills so that they could become more successful at learning. In this
research, there was no marginalisation or disempowerment of participants, as the intervention
was implemented on a rotational basis with the experimental and control groups.

Chapter 4: Empirical research design 119
4.4.7.2 Purpose of research
According to Creswell (2009:88) and Strydom (2011a:113), deception involves the misleading of
participants, deliberately misrepresenting facts or withholding information to ensure
participation. The participants in this research were informed and had full disclosure of the
purpose of the study: why and how they were selected to take part, that participation was
voluntary and they could withdraw at any time, and the risks and benefits involved in
participating (see Informed Consent, Appendix B).
4.4.7.3 Data collection
This research was done as a research project for a Master’s degree under the guidance of a
study leader at a university and ethical clearance was obtained from the university’s Ethics
Committee. The students who were willing to participate were provided with an informed
consent form to complete before the research commenced (cf. Appendix B). The researcher
made use of a knowledgeable independent person, Mrs. D Strauss, who dealt with recruitment,
obtaining informed consent and administering of the tests. Confidentiality was guaranteed by
ensuring that the data could not be linked to individual participants and that only the researcher,
the study leader and the independent statistician had access to the data obtained. The data
were at all times locked up in a cupboard in the researcher’s office, where nobody could get
hold of or tamper with the data. Final data were stored on a password protected computer. The
participants completed the pre-tests and post-tests anonymously. The identities and contact
numbers of the researcher and study leader were provided should the participants have had
any questions (McMillan & Schumacher, 2008:143).
The intervention was presented to all participants on a rotation basis. Therefore, all the first year
pre-service Life Science teachers benefited from the intervention. All informed consent forms
and the tests were bilingual (Afrikaans and English) to ensure that language did not pose any
barrier to the understanding and completion of the consent forms and test items.
To avoid unethical practice the following also applied during this research:
The researcher taught to a broader domain, according to the outcomes of Life Sciences
(the LIFE 111 module), and not to the tests, to enhance the validity and reliability of the test
results.
The researcher, as a competent and qualified lecturer, compiled and scored the tests.
Students wrote all tests simultaneously to avoid test content being leaked.
The tests consisted of multiple-choice questions and a follow-up open question for each
multiple-choice answer where the students were required to motivate an answer, thus

Chapter 4: Empirical research design 120
promoting clear and objective marking and grading protocols, to avoid misinterpretation of
responses.
Participants were ensured that the test results would not in any way influence their
passing/failing of the module (Cohen et al., 2007:432-433).
4.4.7.4 Data analysis and interpretation
The data analysis was done by an independent statistician at the NWU, Vaal Triangle Campus,
without identifying any of the participants. The participants were assured that the data would be
kept safe by the researcher in line with the Ethical Policy of the university, for a reasonable
period (5-10 years). The researcher informed the participants that he would make the results of
the study available to the participants once the study had been completed and examined
(Creswell, 2009:91).
According to Strydom (2011a:126), researchers should never manipulate results, falsify or
invent findings, as this is regarded as a serious scientific misconduct. The research report
provided an accurate and a true account of the data obtained, to avoid misappropriation by the
participants, public and colleagues.
The participants in this research could benefit as they might acquire critical thinking skills
through the use of Thinking Maps, to enable them to analyse, synthesise and evaluate
information more effectively, which could improve their academic performance. Furthermore,
the findings could be utilised to make recommendations regarding the improvement of the
teaching practices of Life Science teachers in order to enhance critical thinking skills in
classrooms at school.
4.4.7.5 Writing and disseminating research
Strydom (2011a:126) states that in order for research to have value, research findings should
be presented to the public. The researcher, the participants and the North-West University are
the owners of the data and results will be available to them. The participants’ consent was
obtained to utilise the data for conference presentations and journal articles. Care was taken
that no biased language was used regarding gender, cultural and home language group, or
school attended in the preparation of the final research report.
4.5 CHAPTER SUMMARY
Chapter 4 focused on the research methodology what was employed in the context of the study
(cf. 4.2 – 4.4).

Chapter 4: Empirical research design 121
The study was framed within a positivistic paradigm with a quantitative, quasi-experimental
research design, as manipulation of a dependent variable (critical thinking skills) took place in
an experimental context. The researcher used the non-equivalent groups pre-test-post-test
control and comparison group designs as strategy of inquiry in a double experiment (cf. 4.4.,
4.4.2).
The researcher used norm-referenced tests to collect data, as comparisons were drawn
between the achievements of the control groups relative to the achievements of the
experimental groups. The researcher developed tests with multiple-choice and open test items
that were used to determine the extent to which the participants acquired the skills to execute
critical thinking (analysis, synthesis, evaluation) in Life Sciences. Based on the pre-test results,
the Thinking Maps intervention was developed to address the deficiencies noted in the pre-test
results at the onset of the first six weeks and second six weeks of the first semester of 2016,
before the implementation of the Thinking Maps interventions. The tests were piloted and
refined before being administered to the sampled participants (cf. 4.4.3).
Non-probability sampling was employed to select the first year pre-service Life Science teachers
(n = 56) at a South African university, who took part in the research. Non-probability sampling
could not guarantee that the sample was representative of the population, therefore no
generalisations of the research findings could be made. The researcher aimed to determine the
impact of a Thinking Maps intervention as part of a pilot study in his own classroom practice
during teacher-training to enhance the development of critical thinking skills among first year
pre-service Life Science teachers (cf. 4.4.4).
The data derived from the pre-tests, post-tests and application of Thinking Maps were captured,
analysed and interpreted with the assistance of an independent statistician from the NWU, Vaal
Triangle Campus. The data analysis involved, firstly, the use of descriptive statistical procedures
to summarise the data with frequencies, percentages, averages (means) and standard
deviations. Secondly, inferential statistics were used to accept or reject the hypotheses stated at
the onset of the study after comparing the means of the pre- and post-test data in order to make
inferences about the effectiveness of the Thinking Maps intervention (cf. 4.4.5). The Thinking
Maps that the participants constructed during the Thinking Maps intervention were assessed, to
establish the effectiveness with which the students applied the thinking processes related to
analysis, synthesis and evaluation to the subject content. The responses to the open questions
in the tests provided initial data in relation to the effectiveness of the Thinking Maps intervention
for enhancing the development of the participants’ universal intellectual standards of reasoning
(cf. 4.4.3).

Chapter 4: Empirical research design 122
The researcher adhered to quality criteria by ensuring that the study complied with reliability and
validity criteria (cf. 4.4.6) and that he conducted the research according to ethical principles (cf.
4.4.7).
The following chapter, Chapter 5, provides detail about the twelve-week Thinking Maps
intervention programme that was implemented during the first sememster of 2016.

Chapter 5: The Thinking Maps Intervention Programme 123
CHAPTER 5
THE THINKING MAPS INTERVENTION PROGRAMME
5.1 INTRODUCTION
This chapter aims to provide a comprehensive overview of the Thinking Maps intervention
programme that was implemented in the context of the research, and addresses the following
issues:
As the focus of the study was on establishing the effects of a Thinking Maps intervention to
enhance the development of critical thinking skills among first year pre-service Life Science
teachers, the next section will provide detailed information about the intervention.
5.2 INTERVENTION RESEARCH
5.2.1 Definition
According to De Vos and Strydom (2011:475) and Fraser et al. (2009:157) intervention
research is defined as “studies carried out for the purpose of conceiving, creating and testing
innovative human services approaches”. The following section will briefly explain the purpose of
intervention research.
5.2 Intervention research
Definition
The purpose of intervention research
The stages of intervention research
The stages of intervention research applicable for the study
5.3 The twelve-week intervention programme for Life Sciences
The theoretical framework for the intervention programme
The six-week intervention with the Experimental group 1 (Experiment 1)
The six-week intervention with the Experimental group 2 (Experiment 2)
5.4 Chapter summary
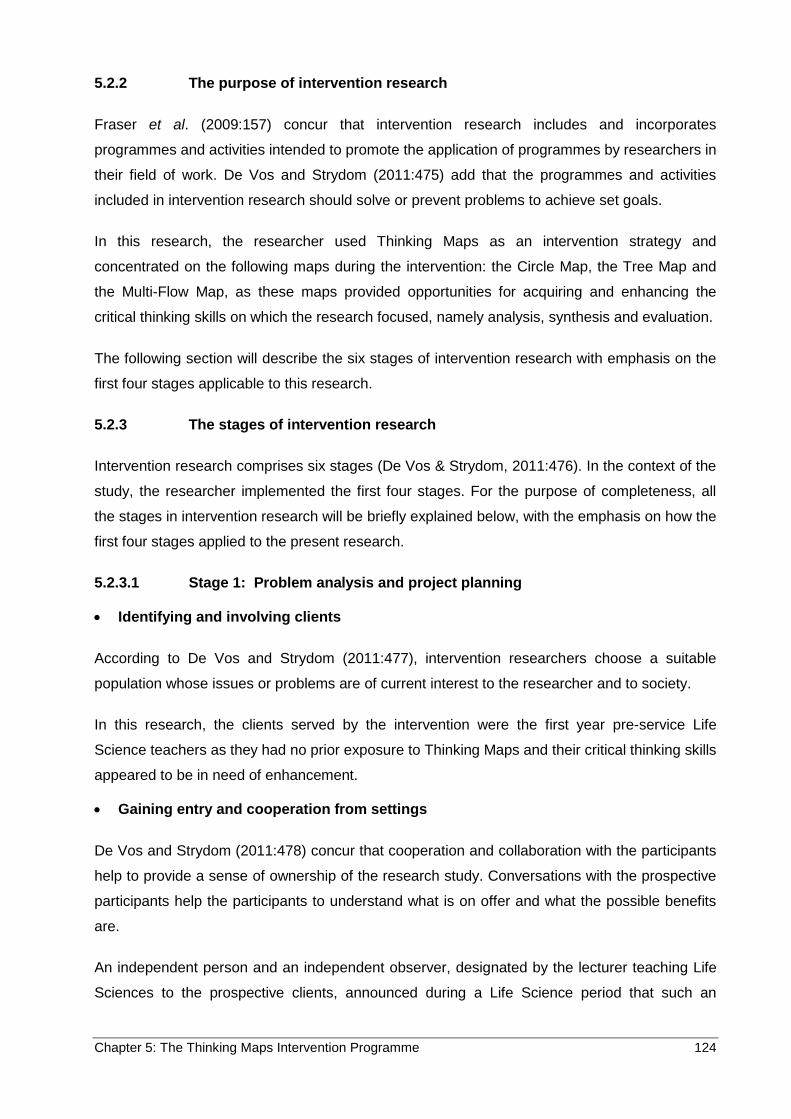
Chapter 5: The Thinking Maps Intervention Programme 124
5.2.2 The purpose of intervention research
Fraser et al. (2009:157) concur that intervention research includes and incorporates
programmes and activities intended to promote the application of programmes by researchers in
their field of work. De Vos and Strydom (2011:475) add that the programmes and activities
included in intervention research should solve or prevent problems to achieve set goals.
In this research, the researcher used Thinking Maps as an intervention strategy and
concentrated on the following maps during the intervention: the Circle Map, the Tree Map and
the Multi-Flow Map, as these maps provided opportunities for acquiring and enhancing the
critical thinking skills on which the research focused, namely analysis, synthesis and evaluation.
The following section will describe the six stages of intervention research with emphasis on the
first four stages applicable to this research.
5.2.3 The stages of intervention research
Intervention research comprises six stages (De Vos & Strydom, 2011:476). In the context of the
study, the researcher implemented the first four stages. For the purpose of completeness, all
the stages in intervention research will be briefly explained below, with the emphasis on how the
first four stages applied to the present research.
5.2.3.1 Stage 1: Problem analysis and project planning
Identifying and involving clients
According to De Vos and Strydom (2011:477), intervention researchers choose a suitable
population whose issues or problems are of current interest to the researcher and to society.
In this research, the clients served by the intervention were the first year pre-service Life
Science teachers as they had no prior exposure to Thinking Maps and their critical thinking skills
appeared to be in need of enhancement.
Gaining entry and cooperation from settings
De Vos and Strydom (2011:478) concur that cooperation and collaboration with the participants
help to provide a sense of ownership of the research study. Conversations with the prospective
participants help the participants to understand what is on offer and what the possible benefits
are.
An independent person and an independent observer, designated by the lecturer teaching Life
Sciences to the prospective clients, announced during a Life Science period that such an

Chapter 5: The Thinking Maps Intervention Programme 125
intervention would be offered to them during the first semester. An explanation of what the
intervention would entail, followed. The reaction from the target group sampled was very
positive as they realised that this intervention strategy could be of great advantage to them in
their current and future studies.
Identifying concerns of the population
De Vos and Strydom (2011:478) state that researchers must avoid projecting external and
personal viewpoints of issues and solutions and should rather concentrate on issues of
importance to the population and subsequently to the community.
The inability of many students to answer questions of analysis, synthesis and evaluation, is a
source of great concern to both teachers at secondary schools and lecturers at university in
South Africa and elsewhere (Lombard & Grosser, 2008:573; Zascavage, 2010:71). As pre-
service Life Science teachers, the researcher and his colleagues also expressed the same
concerns regarding the pre-service Life Science teachers.
Analysing concerns or problems identified
According to De Vos and Strydom (2011:478), key questions such as the following, guide the
process of problem analysis: What is the nature of the problem?; What are the negative and
positive consequences of the problem for the population and community?; Who will benefit? and
How will the participants benefit?
The CAPS was implemented in 2011 and in Life Sciences aims specifically to produce learners
who are able to identify and solve problems and make decisions using critical and creative
thinking. The CAPS implementation has largely shifted teaching from being mainly knowledge-
driven to being more scientific method-orientated learning that requires the application of critical
thinking skills, which many teachers find difficult to teach. The reasons for the inability of
teachers to teach in the scientific method may be linked to the following:
o They might not understand the principles of the scientific method.
o They possibly have not received proper training regarding the implementation of the
scientific method or did not attend such training.
o Little or no direct attention might have been devoted to helping teachers develop the skill
they need to promote the application of critical thinking skills that are important for
working according to the scientific method or with problem-based content in the
classroom.

Chapter 5: The Thinking Maps Intervention Programme 126
The direct benefits for the research participants by taking part in the Thinking Maps
intervention could be the following:
o They could acquire critical thinking skills to analyse, synthesise and evaluate information
more effectively.
o The Thinking Maps strategy could assist participants to learn and study better and
possibly improve their academic performance in any subject.
o Participants would probably come to possess an effective teaching strategy that could
be used when they start teaching.
The indirect benefits will probably be that:
o Researchers could be informed about the possible benefits of Thinking Maps as
teaching strategy to develop critical thinking skills, and conduct further studies to
conclusively confirm the merits of Thinking Maps for enhancing the development of
critical thinking skills.
o Research findings could be used to make recommendations to the Department of Basic
Education regarding the possible improvement of the teaching practices of Life Science
teachers.
o The teaching practice of the greater population of Life Science teachers could benefit if
the Thinking Maps strategy holds merits for developing critical thinking in Life Science.
Setting goals and objectives
The final operation in Stage 1 is to set achievable and measureable goals and objectives. Goals
refer to the outcomes desired by the community. Objectives refer to the specific changes in
programmes or practices to reach the desired goals (De Vos & Strydom, 2011:479).
In this research, the researcher aimed to establish the merits of Thinking Maps for enhancing
the development of critical thinking. The researcher envisaged to:
o conduct a literature review about previous studies on Thinking Maps to estalblish their
impact on enhancing critical thinking skills;
o conceptualise and define critical thinking skills and Thinking Maps;
o reinforce the use of the Circle Map, the Tree Map and the Multi-Flow Map with
Experimental groups 1 and 2 on a rotational basis as a teaching strategy to enhance the
development of the application of the critical thinking skills to analyse, synthesise and
evaluate information more effectively.
o evaluate the impact of Thinking Maps for enhancing critical thinking by administering
researcher-developed pre- and post-tests to Experimental groups 1 and 2 prior to and
after the implementation of a Thinking Maps intervention.

Chapter 5: The Thinking Maps Intervention Programme 127
o draw conclusions and make possible suggestions flowing from this research that could
influence future training of Life Science teachers to become capable of applying teaching
strategies like Thinking Maps to enhance the development of critical thinking.
o equip pre-service teachers with a strategy that could with appropriate usage enhance
their critical thinking skills.
5.2.3.2 Stage 2: Information gathering and synthesis
Using existing information sources
De Vos and Strydom (2011:480) as well as Fraser and Galinsky (2010:462) agree that the
literature review consists of an examination of selected empirical research and reported practice
to identify possible resources, risk, promotive and protective factors related to the particular
problem being studied. De Vos and Strydom (2011:481) indicate that intervention research
should contribute to the development of new knowledge and insight about a topic under
investigation.
The researcher used a variety of literature searches conducted by the Academic Information
Service of the NWU, Vaal Triangle Campus. These literature searches could locate only three
research studies conducted nationally and internationally that determined the effectiveness of
Thinking Maps (cf. 1.1). Qualitative and quantitative research on improving critical thinking skills
by means of intervention programmes have been conducted nationally and internationally
among a variety of participants at all school levels, learners with special needs, undergraduate
students and at management level. The focus areas include Technology, special needs, Natural
sciences, Mathematics, Web Design, Physical Sciences and Computer Science. None of the
aforementioned studies evaluated the impact of Thinking Maps for enhancing the critical
thinking skills of pre-service Life Science teachers (cf. 1.1).
De Vos and Strydom (2011:480) mention that studying natural examples is a useful source of
information and relates to observing how community members faced with a similar problem
have attempted to solve it. Interviews with people who have experienced this problem/issue,
such as service providers and other colleagues, provide insights into which interventions might
be successful and which variables must be considered (De Vos & Strydom, 2011:480).
In this research study, the opinions of colleagues and the Life Science specialists who were
involved in the pilot study and who observed the same lack of critical thinking skills among
learners and students as well as the literature review conducted, served as natural examples
that highlighted the need to address the problem.

Chapter 5: The Thinking Maps Intervention Programme 128
Identifying functional elements of successful models
Once information has been gathered, researchers must analyse previous attempts and
programmes to solve problems or issues. Researchers should examine existing programmes,
models or practice that have been used and have been successful in changing the problem or
issues, and identify potentially useful elements of an intervention (De Vos & Strydom, 2011:482;
Fraser & Galinsky, 2010:462).
The researcher used Thinking Maps as the main component in the intervention programme as
they have been designed to help students develop critical thinking processes and habits. The
researcher could not locate any evidence of other programmes that were successful in
enhancing the critical thinking skills of pre-service Life Science teachers.
5.2.3.3 Stage 3: Design
According to De Vos and Strydom (2011:482), researchers must design a way of observing the
events related to the problem/issues, find a method to determine the extent of the
problem/issues and detect the results after the intervention was applied. The outcomes may be
measured and the type of measurement chosen depends on the number of participants, and the
length of observation and duration within the observational sessions (De Vos & Strydom,
2011:483). By observing the problem and studying innovations of interventions, researchers
should identify procedural elements during the intervention. These procedural elements should
include the use of information, skills and recruitment of participants (De Vos & Strydom,
2011:483).
The researcher made use of an independent person and observer to recruit the participants
during the first period of the 2016 academic year and used two intact, preselected groups of
participants. One group, the control group, received lectures during the normal class period as
allocated by the university, being one period once a week (1 hour 20 minutes). The
experimental group was lectured during another period determined by the participants
themselves and received additional exposure to the use of Thinking Maps. Pre-tests and post-
tests were administered by an independent person to both the experimental and control groups.
Based on the results of the pre-tests, an intervention programme was developed to address the
problems or issues identified in the pre-tests. The following procedural programme was followed
during the first semester of 2016, with 12 teaching weeks divided between Experiment 1 and 2,
as indicated in Table 5.1 below.

Chapter 5: The Thinking Maps Intervention Programme 129
Table 5.1: Procedural programme
Day 1: Recruitment of participants
Weeks 1-6: Semester 1 – Experiment 1
Pre-test 1 Experimental group
Thinking Maps Intervention: 6 weeks
Control group
Normal class teaching: 6 weeks
Post-test 1
Post-test 1B
Groups rotate
Weeks 7-12: Semester 1 – Experiment 2
Pre-test 2 Experimental group (control group of Experiment 1)
Thinking Maps intervention: 6 weeks
Control group (Experimental group of Experiment 1)
Normal class teaching: 6 weeks
Post-test 2
Post-test 2B
5.2.3.4 Stage 4: Early development and pilot testing
According to De Vos and Strydom (2011:483), this phase includes the “development of a
prototype or preliminary intervention concept, conducting a pilot test and applying design criteria
to the intervention concept”.
Developing a prototype or preliminary intervention
During this phase, the researcher developed a prototype of the intervention programme. In the
context of the study, the Thinking Maps intervention programme was developed during the
second semester of 2015.
Conducting a pilot test
De Vos and Strydom (2011:484) and Fraser and Galinsky (2010:464) assert that pilot tests are
designed to determine whether the intervention will be successful and should be administered in
similar settings to that in which the intervention will be used. Pilot tests help to determine the
effectiveness of the intervention programme. Any problems which may arise, or amendments
suggested by participants during pilot testing, should form part of the intervention process (De
Vos & Strydom, 2011:484). As the present study served the purpose of a pilot study, the
observations made during the implementation of the intervention and the results obtained will be
used to refine, amend and adapt the Thinking Maps intervention.

Chapter 5: The Thinking Maps Intervention Programme 130
5.2.3.5 Stage 5: Evaluation and advanced development
This stage comprises the following step:
Selecting an experimental design
According to De Vos and Strydom (2011:485), experimental designs help to show possible
relationships between the intervention programme and the related target (participants). The
choice of design depends on the goals and outcomes sought by the researchers.
The researcher envisages to assess the merits of the Thinking Maps intervention on a larger
scale, using true experimental research in different contexts, after refining and adapting the
intervention.
5.2.3.6 Stage 6: Dissemination
De Vos and Strydom (2011:487) concur that once the intervention has been field-tested, it is
ready to be disseminated to the community and other target groups. The findings should be
published in academic journals, read by practitioners, consumers and policy- makers. It can be
difficult to publish treatment manuals, guides and training manuals due to high costs of
publication versus yielding low profits (Fraser & Galinsky, 2010:465).
The researcher will pay attention to wider dissemination of the research findings in relation to
the merits of the Thinking Maps intervention to enhance the development of critical thinking,
after the implementation of the intervention in true experimental contexts.
As part of the present study, the preliminary findings obtained from the pilot study will be
published in academic, peer-reviewed journals, and communicated at relevant conferences.
5.2.4 The stages of intervention research applicable to the study
Table 5.2 provides a visual summary of the stages of intervention research applicable to this
research.

Chapter 5: The Thinking Maps Intervention Programme 131
Table 5.2: Visual summary of the intervention research
The following section gives an overview of the detailed intervention programme followed for
twelve weeks.
5.3 THE TWELVE-WEEK INTERVENTION PROGRAMME FOR LIFE SCIENCES
The researcher, who received training in the application of Thinking Maps from an accredited
Thinking Maps trainer, implemented the Thinking Maps intervention on a rotational basis with
experimental and control groups as part of two experiments during the first semester of 2016 for
1. Situation analysis and project
planning
2. Information gathering and
synthesis
3. Design
4. Early development and
pilot
Stages Activities
Keeping the learning outcomes and assessment standards of Life Sciences in mind (LIFE 111), activities were designed for the different study units that focused on mastering the learning content and critical thinking skills by means of the following Thinking Maps: 1. Circle Map 2. Tree Map 3. Multi-flow Map
The intervention was designed according to the Thinking Maps learning strategy developed by Dr. David Hyerle, and implemented on a rotation basis with an experimental and control group for 12 weeks (6 weeks per group).
The researcher executed a wide literature search, which confirmed that not much research had been done regarding improving the critical thinking skills of pre-service Life Science teachers by means of Thinking Maps. The intervention programme focused on the use of Thinking Maps as learning strategy to nurture the following critical thinking skills: analysis, evaluation and synthesis.
The importance of critical thinking skills to study and teach Life Sciences is reported widely in the literature. Based on pre-test results an intervention that focused on the use of Thinking Maps to nurture critical thinking skills among first year pre-service teachers was planned.

Chapter 5: The Thinking Maps Intervention Programme 132
a period of twelve weeks, six weeks per group. The teaching of both groups took place at
separate times and in separate venues. The control groups received lectures during a normal
class period (1 hour and 20 minutes) as allocated by the university once a week. The
experimental groups received normal lectures and additional instruction in the use of Thinking
Maps once a week, during another period (1 hour and 20 minutes) determined by the
participants themselves to avoid any inconvenience. At the onset of the Thinking Maps
intervention, the participants received training in the use of Thinking Maps. During each lecture,
the use and application of the Thinking Maps were revised, before students were requested to
use the Thinking Maps. Furthermore, both groups received normal teaching during the practical
component of Life Sciences, which was excluded from the research. Pre-tests and post-tests
were administered to both the experimental and control groups. The researcher (as lecturer)
lectured the module content to achieve the learning outcomes as specified in the LIFE111
module to both the experimental and control groups. Examples of the lessons based on the
Thinking Maps intervention are available of the CD at the back of the dissertation.
5.3.1 The theoretical framework for the intervention programme
Considering the learning theories discussed in Chapter 2, the researcher identified cognitivism
and cognitive constructivism as the most appropriate learning theories to underpin the use of
Thinking Maps as teaching strategy in the intervention programme.
5.3.1.1 The learning theory underpinning the intervention programme
The aforementioned learning theories shifts the locus of control over learning to the student,
equipping them with cognitive skills to be actively involved in constructing meaning of
information by selecting, analysing and evaluating information (Wallace et al., 2007:128) (cf.
2.7.1.2, 2.7.1.3.). The principles of cognitivism and cognitive constructivism enable students to
be involved in meaning making and thinking that could contribute to better understanding and
learning. Students must apply knowledge, they must work to solve problems and discover
information which creates opportunities for the development of higher cognitive and
metacognitive thinking skills, such as analysis, synthesis and evaluation (cf. 2.7.1.5).
5.3.1.2 The teaching method and strategies underpinning the intervention
programme
In support of the cognitive and constructivist learning theory, independent teaching and learning
through the use of Thinking Maps as teaching strategy guided the implementation of the
intervention programme. Independent teaching and learning is an act of independent
construction of knowlege, driven by students themselves. The learning process involves the
students’ metacognitive abilities of planning, monitoring and reflection in order to apply the new

Chapter 5: The Thinking Maps Intervention Programme 133
knowledge or information. The use of the independent teaching method is in line with the
requirements set out in the CAPS document (cf. Tables 2.1 and 2.2), which specifically specify
the use of the scientific and inquiry methods to enrich and enhance students’ scientific
language.
Thinking Maps support the working of the brain in creating patterns from content specific
information. This makes learning meaningful for students because it links the information they
are learning to their own emotional frames of reference and gives them ownership of their
thinking processes and their learning. Thinking Maps give explicit pathways for thinking about
thinking, resulting in improved student performances (Hyerle, 2014:169) (cf. 3.5.3).
5.3.1.3 The Thinking Maps used in the context of the intervention
The interrelated application of the Thinking Maps that was promoted during the intervention, is
explained below.
Circle Map – The Circle Map is used to organise and reorganise knowledge, thus focusing
on applying the skills of analysis and synthesis (cf. Figure 3.5).
Tree Map – The Tree Map focuses on the skills to analyse and synthesise information by
means of classification (cf. Figure 3.8).
Multi-Flow Map – The Multi-Flow Map is used for analysing and evaluating cause and
effect relationships (cf. Figure 3.11).
The Thinking Maps encouraged the students to become involved in a personal process to
discover meaning in information by linking the information to underlying thought processes
(Ertmer & Newby, 2012:55; Powell & Kalina, 2009:241; Wallace et al., 2007:28) (cf. 2.7.1.3,
2.7.1.2).
The next section provides a comprehensive overview of the teaching plan that was followed
during the first semester of 2016.
5.3.2 The six-week intervention with Experimental Group 1 and 2
The following intervention programme with Experimental group 1 (cf. Table 5.3) was followed
during the first six weeks of the first semester of 2016. The control group received normal
classroom lectures. The groups rotated and the intervention was applied for the next six weeks
of the first semester to Experimental group 2 (cf. Table 5.4). The control group of experimental
group 1 now became the experimental group, and the experimental group became the control
group who received normal classroom lectures.

Chapter 5: The Thinking Maps Intervention Programme 134
The Thinking Maps intervention had to fit into a time-limited schedule, and the researcher had to
strive to relate results/findings in the time he had available, namely one semester comprising 12
weeks.
The researcher had to employ a multi-group design – 2 groups following another, as
participants had to enter the intervention at different levels due to logistical and time constraints.
This was done in order to give all the participants the opportunity to be exposed to the Thinking
Maps intervention and to have a control group as part of the research.
The intervention had to correspond with the regular Life Sciences programme, and as it was not
possible on the timetable to provide for simultaneous but separate lecture opportunities for
Experiment 1 and Experiment 2 during weeks 1-6 of the intervention without inconveniencing
the students, the experiment had to be conducted on a rotation basis. This implied that the
intervention with the second experiment had to correspond with the Life Science programme for
weeks 7-12 of the first semester. The researcher therefore had to design two similar
interventions that focused on different topics. The nature of the content was however similar
(problem-based content and content related to working according to the scientific method). The
thinking processes embedded in the content of both semesters were also similar, and
emphasised the application of the critical thinking skills analysis, synthesis and evaluation.
In quasi-experimental research, a researcher can use naturally formed groups where conditions
of treatment might slightly differ (Craighead & Nemeroff, 2002:1397). Although this type of
design has less internal validity, it provides some support for causal inferences to be made
(Rubin & Babbie, 2009:164)

Chapter 5: The Thinking Maps intervention programme 135
Table 5.3: The six-week intervention programme with Experimental group 1
Week 1: Semester 1 – Experiment 1
Study section Outcomes Lecturer activities Student activities
Thinking Maps
Introductory scientific method
Method remarks
Data analysis
Use the Thinking Maps to summarise theory.
Describe the scientific method and critically evaluate1 its use.
Be aware of the existence of other schools of thought in practising science.
Plan and execute2 an experimental investigation.
Write a detailed report3 of an experiment.
Become acquainted with the ways in which data are presented in graph format.
Become acquainted with the different ways of measurements in Life Sciences.
Key for the underlined concepts/phrases: Critical thinking skills involved in this content:
1: Evaluate
2: Analyse
3: Synthesise
PowerPoint presentations on how to construct Thinking Maps and study sections 1.1 – 1.3.
Handouts Thinking Maps – standard.
Specific emphasis on Thinking Maps.
Make sure that you know the steps involved in a scientific investigation as stipulated in MADER, p 11 and Addendum 1. Draw a simple Thinking Map of the scientific method.
Important concepts include hypothesis, manipulated or independent variables, responding or dependent variables, control experiments and theories.
Study the logical consecutive steps that need to be followed when one writes a report on an experiment.
SG* activity p 4 & 5.
Make use of Thinking Maps (try to use at least two types) to summarise theory done in class.
*SG Refers to “Study guide”.

Chapter 5: The Thinking Maps intervention programme 136
Week 2: Semester 1 – Experiment 1
Study section Outcomes Lecturer activities Student activities
Microscopy Correlate the progress that has been made in the field of microscopy with the development of technology.
Distinguish between the different kinds of microscopes and classify the ways in which they are used1.
Identify the different parts that a compound light microscope is made of.
Demonstrate the use, care and handling of a light microscope.
Apply the relevant measuring units and skills2 that are commonly used in cytology with understanding.
Use the different techniques3 that are necessary in preparing temporary and permanent slides for light microscope work.
Choose the correct stains1 that are used in making temporary and permanent slides.
Key for clarifying the underlined concepts/phrases: Critical thinking skills involved:
1: Evaluate
2: Analyse
3: Synthesise
PowerPoint presentations on study sections 2.1.
Specific emphasis on Thinking Maps.
Distinguish between:
Different kinds of microscopes; and different kinds of light microscopes as well as the ways in which each one is used.
Make very sure that you master the table in MADER, p 61.
SG activity p 20 & 21.
Make use of Thinking Maps (try to use at least 2 types) to summarise theory done in class.

Chapter 5: The Thinking Maps intervention programme 137
Week 3: Semester 1 – Experiment 1
Study section Outcomes Lecturer activities Student activities
Membrane
structure and
function;
Diffusion and
osmosis
Explain the fluid mosaic model of the membrane structure.
Explain the structure and function of the cell membrane and illustrate it by means of diagrams1.
Critically evaluate2 the permeability and transmission of membranes.
Key to understand the underlined concepts/phrases: Critical thinking skills involved:
1: Analyse
2: Evaluate
PowerPoint presentations on study sections 2.3.
Experimenting diffusion and osmosis.
Specific emphasis on Thinking Maps and experiments regarding diffusion and osmosis.
Make sure that you are able to explain the fluid mosaic theory of membrane structures.
Identify the following as being present in plasma membranes, as well as biological and chemical characteristics that underline its presence: Lipids; membrane protein; membrane carbohydrates; transportability of the membrane.
List the functions of plasma membranes in your own words.
Describe the functions of plasma protein in your own words with the aid of simple drawings.
Identify the reasons why transmission takes place across membranes.
Also identify the four (4) mechanisms whereby it occurs.
SG activity p 33.
Make use of Thinking Maps (try to use at least two types) to summarise theory done in class.

Chapter 5: The Thinking Maps intervention programme 138
Week 4: Semester 1 – Experiment 1
Study section Outcomes Lecturer activities Student activities
Basic chemistry
Classify1 the chemical and physical nature of matter.
Describe important chemical phenomena and chemical equations2 that are important to Life Sciences.
Critically evaluate3 the characteristics of mixtures.
Key to understand the underlined concepts/phrases: Critical thinking skills involved:
1: Analyse
2: Synthesise
3: Evaluate
PowerPoint presentations on study sections 2.4.
Specific emphasis on Thinking Maps.
Revision SG p 36-37.
Write down the definition of matter.
Name the THREE (3) phases of matter. Briefly tabulate the differences between the three kinds. Also make use of a simple Tree Map that indicates the differences clearly.
Complete a Tree Map that represents the classification of matter. Also write down a definition for every component.
Draw a Circle Map of an atom with all its parts. Summarise all the relevant facts you have to know about on the basis of your drawing.
Follow the same steps as set out on p 41 in SG and indicate how a covalent bond is formed in each of the given compounds. You have to facilitate this content to Grade 10 learners. Plan how you would go about doing it using a Circle Map.
SG activity p 37 – 54.

Chapter 5: The Thinking Maps intervention programme 139
Week 5: Semester 1 – Experiment 1
Study section Outcomes Lecturer activities Student activities
Organic nutrients - Carbohydrates
Describe the structure, composition and the biological importance of the following organic carbohydrates, critically evaluate1 them and where applicable, illustrate the composition by means of diagrams.
Key for understanding the underlined concepts/phrases: Critical thinking skills involved:
1: Evaluate
PowerPoint presentations on study sections 2.5.2.
Specific emphasis on Thinking Maps.
Revision SG p 59.
Draw a labelled sketch of a carbon atom use the Circle Map as your basis and indicate all characteristics.
What is a polysaccharide?
Classify the following polysaccharides with regard to their monomers, structure and function. Draw a Tree Map.
starch; glycogen; cellulose; and chitin.
Food tests: Use the multi-flow map to illustrate cause and effect (scientific method).
SG activity p 63 – 67.
Make use of Thinking Maps (try to use at least 2 types) to summarise theory done in class.

Chapter 5: The Thinking Maps intervention programme 140
Week 6: Semester 1 – Experiment 1
Study section Outcomes Lecturer activities Student activities
Metabolism Distinguish1 between different kinds of energy;
Explain the laws of thermodynamics;
Describe the energy of the cell, ATP, with regard to structure, formation and functions.
Key to understand the underlined concepts/phrases: Critical thinking skills involved:
1: Analyse
PowerPoint presentations on study sections 2.6.1 – 2.6.2.
Specific emphasis on Thinking Maps.
Revision SG p 77.
Summarise the following questions:
What is energy?
Distinguish between different kinds of energy by referring to the flow of energy through a food chain.
Define and describe the following:
The TWO (2) laws of thermodynamics; and cells and entropy
Distinguish between ADP and ATP.
Draw a simple tree map to classify the structures of ATP and ADP.
Make use of a simple chemical equation to demonstrate the formation of ATP,Then explain it briefly with the aid of an appropriate example.
SG activity p 33.
Make use of Thinking Maps (try to use at least two types) to summarise theory done in class.

Chapter 5: The Thinking Maps intervention programme 141
Table 5.4: The six-week intervention programme with Experimental Group 2
Week 7: Semester 1 – Experiment 2
Study section Outcomes Lecturer activities Student activities
Thinking Maps
Photosynthesis Use the Thinking Maps to summarise theory.
Describe the importance of energy1 for organisms.
Define the photosynthesis process;
Critically evaluate2 the importance of the photosynthesis process.
Key to understand the underlined concepts/phrases: Critical thinking skills involved:
1: Analyse
2: Evaluate
PowerPoint presentations on Thinking Maps and study sections 2.7.
Handouts Thinking Maps – standard.
: Specific emphasis on Thinking Maps.
Revision SG p 83 – 84.
Write down the chemical equation of photosynthesis.
Formulate the word definition of photosynthesis by making use of the chemical equation.
Use the chemical equation and explain the biological importance of photosynthesis
Use a single page to summarise this work. Pay attention to the following:
the inner structure of a leaf;
the outer and inner structure of the chloroplast; and
the correlation between structure and function.
Make use of Thinking Maps (try to use at least two types) to summarise theory done in class.

Chapter 5: The Thinking Maps intervention programme 142
Week 8: Semester 1 – Experiment 2
Study section Outcomes Lecturer activities Student activities
Photosynthesis - continued
Describe the cyclic and non-cyclic photophosphorylation processes of the light-dependent phase of the photosynthesis process and illustrate them by means of diagrams1.
Describe the light-independent phase of the photosynthesis process and illustrate them by means of diagrams1.
Critically discuss2 factors that influence the photosynthesis process.
Briefly describe and classify2 the other types of photosynthesis.
Key to understand the underlined concepts/phrases: Critical thinking skills involved:
1: Analyse
2: Synthesise
PowerPoint presentations on study sections 2.7.4-2.7.5.
Specific emphasis on Thinking Maps.
Revision SG p 83 – 84.
Light-dependent phase of photosynthesis.
This phase is divided into the cyclic and non-cyclic photophosphorylation phases of photosynthesis. Use the tip I have given you above and make your own summaries.
Also indicate what the role of the photosystems is.
Factors that influence the photosynthesis process.
Light-independent phase of photosynthesis.
Summarise these sections and make them your own.
Factors that influence the photosynthesis process.
SG activity p 89 -90.
Make use of Thinking Maps (try to use at least 2 types) to summarise theory done in class.

Chapter 5: The Thinking Maps intervention programme 143
Week 9: Semester 1 – Experiment 2
Study section Outcomes Lecturer activities Student activities
Respiration Describe the structure of a mitochondrion and illustrate it by means of diagrams.
Describe the course of the aerobic cellular respiration process (glycolysis, transition phase, Krebs cycle and terminal oxidation) and illustrate it by means of diagrams1.
Describe the anaerobic cellular respiration in plant and animal cells and illustrate it by means of diagrams1.
Describe the role that yeast and lactic fermentation plays in the preparation of food and spirits.
Classify the characteristics2 aerobic and anaerobic cellular respiration.
Classify the characteristics of2 the photosynthesis and aerobic cellular respiration processes and illustrate the correlations by means of flow diagrams.
Describe and critically evaluate3 the correlation between photosynthesis and respiration.
Key to understand the underlined concepts/phrases: Critical thinking skills involved:
1: Analyse
2: Synthesise
3: Evaluate
PowerPoint presentations on study sections 2.8.
Specific emphasis on Thinking Maps.
Revision SG p92-93.
Use a single sheet of paper to summarise this work. Pay attention to the following:
The inner structure of the mitochondrion; and
the correlation between structure and function.
Now compare the anaerobic and aerobic respiration processes in table format.
Now compare photosynthesis and aerobic cellular respiration by creating the schematic representations of the two processes next to each other.
SG activity p 96 – 100.
Make use of Thinking Maps (try to use at least two types) to summarise theory done in class.

Chapter 5: The Thinking Maps intervention programme 144
Week 10: Semester 1 – Experiment 2
Study section Outcomes Lecturer activities Student activities
DNA Bring the applicability of DNA in context with technological developments1.
Describe the formation and structure of a di-nucleotide and a polynucleotide and illustrate them by means of diagrams2.
Describe the formation, structure, characteristics and functions of a DNA molecule and illustrate them by means of a diagram2.
Describe replication of DNA and illustrate it by means of a diagram2.
Describe the composition and functions of rRNA, mRNA and tRNA and illustrate them by means of diagrams2.
Key to understand the underlined concepts/phrases: Critical thinking skills involved.
1: Synthesise
2: Analyse
PowerPoint presentations on study sections 3.1.1 – 3.1.3.
Specific emphasis on Thinking Maps.
Revision SG p104.
Make sure that you know what is meant by di-nucleotide and polynucleotide.
Make use of simple line diagrams and indicate the structure and formation of di-nucleotide and polynucleotide respectively.
Make use of Internet sources and draw the parallels between technological developments and the discovery of DNA.
Study RNA under the following sub-headings:
Structure and function;
Kinds of RNA and the role each one plays in protein synthesis.
Make use of Thinking Maps (try to use at least two types) to summarise theory done in class.

Chapter 5: The Thinking Maps intervention programme 145
Week 11: Semester 1 – Experiment 2
Study section Outcomes Lecturer activities Student activities
RNA - continued
Discuss the important role that this nucleic acid molecule plays in the protein synthesis process;
Describe the course of the protein synthesis and illustrate it by means of appropriate diagrams1.
Define the terms genes and genetic code and describe the characteristics of both.
Critically evaluate2 the role that DNA and RNA play not only in the survival of an organism, but also in the survival of a species.
Link relations between DNA, the medical and forensic industry and possible bio-ethical issues that originate from them3.
Key to understand the underlined concepts/phrases: Critical thinking skills involved:
1: Analyse
2: Evaluate
3: Synthesise
PowerPoint presentations on study sections 3.1.4 – 3.1.6.
Specific emphasis on Thinking Maps.
Revision SG p110 – 111.
Study the genetic code by referring to the definition and characteristics.
Summarise the course of the process and attempt conceiving the process visually.
Make use of Thinking Maps (try to use at least two types) to summarise theory done in class.

Chapter 5: The Thinking Maps intervention programme 146
Week 12: Semester 1 – Experiment 2
Study section Outcomes Lecturer activities Student activities
Cell division Describe chromosome structure and illustrate it by means of suitable diagrams1.
Define the following concepts and where appropriate, illustrate them by means of suitable diagrams1: homologous pairs of chromosomes, a karyogram and the karyotype of a cell, autosomal and gonosome chromosomes, haploid and diploid cells.
Fully describe the following structures that play a role during the cell division processes, namely a centriole, centrosome and a spindle.
Describe the cell cycle and illustrate it by means of a diagram1.
Describe the consecutive phases in the course of the mitosis process and its biological importance and illustrate and substantiate them by means of diagrams.
Classify the ways in which2 cytokinesis takes place in plant and animal cells.
Key to understand the underlined concepts/phrases: Critical thinking skills involved:
1: Analyse
2: Synthesise
PowerPoint presentations on study sections 3.2.
Specific emphasis on Thinking Maps.
Revision SG p114 – 115.
Here you also have to use maps and write down the definitions and functionsthat they fulfil during cell division next to it or on the drawing itself, as far as it is possible.
Study this section by paying attention to the following aspects: Centromere, Centrosome, Centriole, Spindle.
Summarise the events that occur in a cell next to the symbol of each phase.
The sketches of each stage of each phase are now given. Carry out the following instructions in this regard:
Make sketches of all the phases and label them in full.
Summarise the events of each phase in the space left vacant for that purpose.
Make use of Thinking Maps (try to use at least two types) to summarise theory done in class.

Chapter 5: The Thinking Maps intervention programme 147
5.4 CHAPTER SUMMARY
Chapter 5 initially briefly defined and described the six phases of intervention research. In the
context of the study, the researcher implemented four steps, namely problem analysis and
project planning; information gathering and synthesis; design; and early development and pilot
testing.
The twelve-week Thinking Maps intervention programme was underpinned by cognitive and
cognitive constructivist learning theories and implemented by means of independent teaching
as teaching method, with Thinking Maps as teaching strategy. A comprehensive overview of the
twelve weeks Thinking Maps intervention programme was provided (cf. 5.3.2).
The next chapter, Chapter 6, focuses on the data analysis and interpretation.

Chapter 6: Data analysis and interpretation 148
CHAPTER 6
DATA ANALYSIS AND INTERPRETATION
6.1 INTRODUCTION
This chapter presents the statistical analyses and the interpretations of the data obtained from
the research participants in order to determine to what extent a Thinking Maps intervention
programme in Life Sciences enhanced the development of their critical thinking skills (analysis,
synthesis and evaluation).
The data analyses and interpretations will be dealt with in the following sequence:
In the context of the data analysis, the following explanation applies:
6.2 Reliability of the tests
6.3 Biographic information of the participants
6.4 Data analysis and interpretation: Pre- and post-tests
Introduction
Data analysis and interpretation: Experimental group 1
Data analysis and interpretation: Experimental group 2
6.5 Data analysis and interpretation: Comparison between participants from Experimental group 1 and 2
6.6 Data analysis and interpretation: Thinking Maps worksheets – Experiment 1 and 2
6.7 Data analysis and interpretation: Open responses – pre- and post-tests
6.8 Chapter summary

Chapter 6: Data analysis and interpretation 149
Experiment 1 (E1) involved an experimental group and a control group. The experimental group
received six weeks’ exposure to lecturing and a Thinking Maps intervention, and the control
group only received normal lecturing.
Experiment 2 (E2) involved an experimental group (control group of Experiment 1) and a control
group (experimental group of Experiment 1). The experimental group received six weeks’
exposure to lecturing and a Thinking Maps intervention, and the control group only received
normal lecturing.
The next section reports on how the researcher ensured the reliability of the pre-tests and post-
tests in the context of the research.
6.2 RELIABILITY OF THE TEST DATA
6.2.1 Skewness and kurtosis
Data related to skewness and kurtosis indicate the symmetry of the distribution of data, and
guide the researcher in choosing parametric or non-parametric statistical procedures to analyse
the data (Brown, 2008; Leedy & Ormrod, 2013:256).
The skewness of a distribution is a measure that describes how far the distribution of data
deviates from the symmetry. According to Pietersen and Maree (2010a:189), the distribution of
data may be skewed to the right, or positively skewed (longer tail to the right) or the data may
be spread more to the left, or negatively skewed (longer tail to the left). If skewness is smaller
than -1 or larger than 1, the distribution of the data is extremely skew. If skewness lies between
-1 and -0.5 or between 0.5 and 1, the distribution of data is moderately skew. Finally, if the
distribution of data is symmetrical, the skewness will lie between -0.5 and 0.5 (Brown, 2008).
The kurtosis of a distribution describes the amount of “peakedness” (leptokurtic) or “flatness”
(platykurtic) around the mean and is directly related to the standard deviation of the distribution
(Pietersen & Maree, 2010a:190). A normal distribution has kurtosis exactly 3 and is
called mesokurtic. A distribution with kurtosis < 3 is called platykurtic. Compared to a normal
distribution, its tails are shorter and thinner, and often its central peak is lower and broader. A
distribution with kurtosis >3 is called leptokurtic. Compared to a normal distribution, its tails are
longer and fatter, and often its central peak is higher and sharper (Brown, 2008).
Table 6.1 reports on the data obtained for skewness and kurtosis.

Chapter 6: Data analysis and interpretation 150
Table 6.1: Skewness and kurtosis
Application Skewness Kurtosis Skewness Kurtosis
Groups E 1 E 2 E1 E 2 E1 & E2
Sample size 29 27 29 27 56
Pre-test 1 0.514 -0.518 -0.647 -0.365 -0.053 -1.043
Post-test 1 -0.696 0.298 0.991 0.323 -0.056 0.608
Pre-test 2 -0.088 -0.282 -0.564 -0.847 -0.041 -0.399
Post-test 2 1.033 -0.068 1.293 -0.771 0.425 0.000
Post-test 1B (Retention test)*
-0.246 -0.273 -1.134 -0.558 -0.247 -0.878
Post-test 2B (Retention test)**
-0.447 -0.597 -0.087 1.050 -0.515 0.414
* Pre-test 1 was administered twice.
** Pre-test 2 was administered twice.
The skewness for the data obtained for pre-test 1, post-test 1, pre-test 2, post-test 2, post-test
1B and post-test 2B for the entire group of participants (E1 & E2), lies between 0.5 and -0.5.
This indicates that the distribution of data in all the tests is symmetrical (Brown, 2008). The
kurtosis for the data obtained for pre-test 1, post-test 1, pre-test 2, post-test 2 and post-test 1B,
include values smaller than 3 and are mostly negative (except post-tests 1, 2 and 2B), indicating
platykurtic distributions (Pietersen & Maree, 2010a:190). The independent statistician
confirmed that the measures of shape for the data, namely symmetrical and platykurtic
distributions, allowed for the use of parametrical statistical data analysis procedures to analyse
the test data (Pietersen & Maree, 2010d:225) (cf. 4.4.5). Platykurtic distributions do not have
major fluctuations and fewer extreme outliers, and most of the values share the same
frequency.
6.3 BIOGRAPHIC INFORMATION OF THE PARTICIPANTS
Experimental group 1 comprised 29 participants, and Experimental group 2 comprised 27
participants. Initially, 76 students took part in the research. However, many of the students did
not write all the tests, and the statistician advised the researcher to only include the data of the
students who completed all the tests for comparison purposes.

Chapter 6: Data analysis and interpretation 151
6.3.1 Biographic information of students
In Table 6.2 the biographic information of the participants regarding their home language is
indicated.
Table 6.2: Home language
Language Total group Experiment 1 Experiment 2
f % f % f %
Missing* 9 16 4 14 5 18
Afrikaans 5 9 2 7 3 11
English 1 2 1 4 - -
Sesotho 22 39 9 31 13 48
Swati 1 2 1 3 - -
Tswana 1 2 1 3 - -
Xhosa 2 3 1 3 1 4
Zulu 15 27 10 35 5 19
*Number of participants who did not respond to this question.
Figure 6.1 below provides a graphical representation of the various language sub-groupings of
the participants.
Figure 6.1: Home Language
9
4
5
5
2
3
1
1
22
9
13
1
1
1
1
2
1
1
15
10
5
0% 20% 40% 60% 80% 100%
Total group
Experiment 1
Experiment 2
Missing Afrikaans English Sesotho Swati Tswana Xhosa Zulu

Chapter 6: Data analysis and interpretation 152
Table 6.3 presents the biographic information of the participants regarding their gender.
Table 6.3: Gender
Gender Total group Experiment 1 Experiment 2
f % f % f %
Female 33 59 15 52 18 67
Male 23 41 14 48 9 33
Figure 6.2 visually represent the gender of the participants who took part in the study.
Figure 6.2: Gender
Table 6.4 presents the biographic information of the participants regarding their type of school.
Table 6.4 Type of school
Type of school Total group Experiment 1 Experiment 2
f % f % f %
Missing* 9 16 4 14 5 18
Ex-Model C 8 14 3 10 5 19
Township 39 70 22 76 17 63
*Number of participants who did not respond to this question.
33
15
18
23
14
9
0% 20% 40% 60% 80% 100%
Total group
Experiment 1
Experiment 2
Female Male

Chapter 6: Data analysis and interpretation 153
Figure 6.3 visually represent the type of school the participants attended.
Figure 6.3: Type of school
Table 6.5 presents the biographic information of the participants regarding their cultural group.
Table 6.5: Cultural Group
Cultural group Total group Experiment 1 Experiment 2
f % f % f %
Missing 9 16 4 14 5 19
African 41 73 22 76 19 70
White 6 11 3 10 3 11
Figure 6.4 visually represent the cultural groups of the participants.
9
4
5
8
3
5
39
22
17
0% 20% 40% 60% 80% 100%
Total group
Experiment 1
Experiment 2
Missing Ex-Model C Township

Chapter 6: Data analysis and interpretation 154
Figure 6.4: Cultural group
The numbers of participants in the sub-groups for the various biographic variables were too
small to conduct statistical analyses to determine the influence of the biographic variables on
the research findings.
In the following section, the researcher reports on the data obtained from the participants
regarding the various tests for Experimental group 1.
6.4 DATA ANALYSIS AND INTERPRETATION: PRE- AND POST-TESTS
6.4.1 Introduction
By means of descriptive statistics, data were organised and summarised to promote an
understanding of the data characteristics (Pietersen & Maree, 2010a:195).
This section presents the responses obtained from the students for each of the tests. Each test
focused on three skills in relation to critical thinking in the Life Science classroom of first year
B.Ed. Life Science students. Although all the tests focused on the application of the three critical
thinking skills pertaining to this research, namely analysis, synthesis and evaluation, the
contents of the various tests differed to align with the progression in the first semester subject
content for first year Life Sciences. The different content also served the purpose of establishing
if the participants could apply the skills that were possibly acquired during the intervention to
different contexts, and to minimise the possible influence of the pre-test content that might
remain known to the participants after the short six week implementation of the Thinking Maps
9
4
5
41
22
19
6
3
3
0% 20% 40% 60% 80% 100%
Total group
Experiment 1
Experiment 2
Missing African White

Chapter 6: Data analysis and interpretation 155
intervention. Pre-test 1 was repeated as post-test 1B and pre-test 2 was repeated as post-test
2B, to establish the retention of the skills possibly acquired with the Thinking Maps intervention
(Experiment 1) and after normal lecturing (Experiment 2).
The following content was addressed in the various test occasions:
Pre-test 1: Gr. 12 Life Science syllabus: DNA, RNA, meiosis, reproduction of vertebrates,
human reproduction, the nervous system, the endocrine system, homeostasis, Darwinism
and natural selection, human evolution, and human impact on the environment.
Post-test 1: Working according to the scientific method and problem-based content: data
analysis, indigenous knowledge, microscopy, cells, membrane structure and function,
diffusion and osmosis, cell division, basic chemistry, inorganic and organic compounds,
energy and ATP and enzymes.
Post-test 1B (repetition of pre-test1): Gr. 12 Life Science syllabus.
Pre-test 2: Working according to the scientific method and problem-based content that was
the focus of post-test 1.
Post-test 2: Photosynthesis and related experiments, respiration and related experiments,
DNA, RNA and cell division. Focus on problem-based content.
Post-test 2B (repetition of pre-test 2): Scientific method and problem-based content.
The participants’ responses to the various test occasions are reported in a table (Table 6.7), in
order to explore different response patterns between the various test occasions (Pietersen &
Maree, 2010a:185). The data obtained for the responses are summarised with frequencies,
percentages, means and standard deviations. Inferential statistics were applied to determine the
statistical significance of the differences noted between the various test occasions within and
across the experimental and control groups in Experiment 1 and Experiment 2. If statistical
significant differences were noted, Cohen’s d was calculated to determine the effect of the
difference in practice. In line with the advice provided by the Statistical Consultation Services at
the university where the research was conducted, effect sizes are only reported for statistical
significant differences. According to Leech et al. (2005:59), if the difference between means
was not statistically significant, it is best not to make any comment about which mean was
higher because the difference could be due to chance. Likewise, if the difference was not
significant, Leech et al. (2005:59) recommend that effect size not be discussed or interpreted.
Graphical representations are used to visually highlight the prominent features that emanated
from the responses. The data are interpreted according to the average percentage scored on
the tests. The total raw score for each test occasion was 15.

Chapter 6: Data analysis and interpretation 156
Table 6.6 presents the time line for the various test occasions for Experiment 1 and
Experiment 2.
Table 6.6: Time line for various tests
Test application Date applied Groups involved
Pre-test 1 Week 1 Experiment 1
Thinking Maps intervention
Post-test 1 and Post-test 1B* Week 6
Pre-test 2 Week 7 Experiment 2
Thinking Maps intervention
Post-test 2 and Post-test 2B** Week 12
*A repetition of pre-test 1 ** A repetition of pre-test 2
6.4.2 Data analysis and interpretation: Experimental group 1
Table 6.7 reports the data obtained for the various test occasions for Experimental group 1, and
Figure 6.5 indicates the various test score percentages for Experimental group 1.
Figure 6.5: Comparison of test results: Experimental group 1

Chapter 6: Data analysis and interpretation 157
Table 6.7: Test data: Participants Experimental group 1
Test application
n �̅�
(15) %
Mean difference s t df p
Cohen’s d
Effect size
1 Pre-test 1 29 6.828 45.517 0.103
2.331 0.204 28 0.840 - -
Post-test 1 29 6.724 44.827 1.868
2 Pre-test 1 29 6.828 45.517 -2.069
2.331 -5.021 28 0.000* 0.886 Large
Post-test 1B 29 8.897 59.310 2.335
3 Post-test 1 29 6.724 44.827 -2.172
1.868 -4.063 28 0.000* 0.930 Large
Post-test 1B 29 8.897 59.310 2.335
4 Pre-test 2 29 9.276 61.839 2.931
2.750 4.993 28 0.000* 1.066 Large
Post-test 2 29 6.345 42.298 2.192
5 Post-test 2B 29 9.172 61.149 -0.104
1.947 -0.208 28 0.837
-
-
Pre-test 2 29 9.276 61.839 2.750
6 Post-test 2B 29 9.172 61.149 2.827
1.947 5.938 28 0.000* 1.452 Large
Post-test 2 29 6.345 42.298 1.192
* Statistical significance: p < 0.05

Chapter 6: Data analysis and interpretation 158
A comparison between the means for pre-test 1 (�̅� = 6.828) and post-test 1 (�̅� = 6.724)
revealed a statistically non-significant difference, p = 0.840 as the participants obtained more or
less the same average percentage for both tests. A mean difference of 0.103 between pre-test
1 (�̅� = 6.828) and post-test 1 (�̅� = 6.724) was noted. The participants did not appear to be
effective (in the context of the study, “effective” will refer to being successful in producing a
result that indicates powerful improvement) at applying critical thinking in post-test 1 after
completing the Thinking Maps intervention as the average for post-test 1 was lower than the
average achieved for pre-test 1. To explain this finding, the researcher concluded that post-test
1 that focused on the subject content dealt with during weeks 1 – 6 of the Thinking Maps
intervention and focused on problem-based content and working according to the scientific
method, might have been too difficult, in comparison to pre-test 1, that focused on the subject
content of Grade 12 Life Sciences that might have been more familiar to the students. In
addition, the Thinking Maps strategy might not have been effective for dealing with problem-
based content and working according to the scientific method. This finding supports the
viewpoint of Illeris (2015:30) (cf. 2.6.2) who states that mislearning or a lack of understanding
may lead to an inability to apply critical thinking skills.
A comparison between the means of pre-test 1 (�̅� = 6.828) and post-test 1B (�̅� = 8.897), a
repetition of pre-test 1, revealed a statistically significance difference of p < 0.05 = 0.000 with a
large effect in practice, d = 0.886. This result implied that the post-test 1B result was statistically
significantly better than the pre-test 1 result. The researcher concluded that the six weeks of
Thinking Maps intervention possibly enhanced the application of the students’ critical thinking
skills and they became more effective at applying critical thinking to the content of post-test 1B
(Grade 12 Life Sciences). The data supported the effectiveness of the Thinking Maps
intervention to enhance the critical thinking skills in Life Sciences and strengthened the findings
of Hyerle (2009:155) (cf. 3.5.3), who states that Thinking Maps promote the development of
thinking skills. This finding also aligns with the argument of Pritchard (2014:119-120) (cf. 3.2)
that Thinking Maps support active learning and assists in organising information systematically,
which contributes to enhanced performance in the application of thinking skills.
The sample mean for post-test 1 (�̅� = 6.724) and post-test 1B (�̅� = 8.897) highlighted an
average increase of 14% in results. The researcher observed a mean difference of -2.172 and a
statistically significant difference of p < 0.05 = 0.000 with a large effect in practice, d = 0.930.
Post-test 1B was a retention test (a repetition of pre-test 1) and the researcher concluded that
the six weeks of Thinking Maps intervention contributed to improvement noted in the application
of the critical thinking skills that focused on Grade 12 subject content. Post-test 1 was also
written after the Thinking Maps intervention, but the participants did not appear to be effective at
the application of critical thinking skills in the context of this test. This finding revealed to the

Chapter 6: Data analysis and interpretation 159
researcher that the critical thinking skills that were acquired through the Thinking Maps
intervention were apparently not effectively transferred to the Life Science content that focused
on problem-based learning and working according to the scientific method (post-test 1). The
argument of Snyder and Snyder (2008:92) (cf. 2.7.2.4) might also hold true, namely that
students need time to learn the process of thinking, to become effective at the application of
critical thinking, and that the six weeks of the Thinking Maps intervention might have been too
short to effectively acquire and retain critical thinking skills.
The sample mean for pre-test 2 (�̅� = 9.276) and for post-test 2 (�̅� = 6.345) reflected a
decrease in average of 20% in post-test 2. A mean difference of 2.931 with a statistical
significant difference of p < 0.05 = 0.000 with a large effect in practice, d = 1.066, was noted.
Given the increase in the pre-test 2 result, it could be argued that the Thinking Maps
intervention that preceded pre-test 2, benefitted the applicaton of critical thinking in the context
of pre-test 2. Post-test 2 was written six weeks after pre-test 2 after six weeks of normal
lecturing. The researcher concluded that the lack of emphasis during lectures on practising
critical thinking using Thinking Maps possibly resulted in the decline of 19% in average. This
finding supports the view of Paul and Elder (2006:10) (cf. 2.3.3) who confirm that the
enhancement of critical thinking must be infused in the development of students’ critical thinking
through consistent use by the teacher. This statistical analysis strengthened the case that
critical thinking skills involving analysis, synthesis and evaluation were apparently not learned
by the direct teaching method that focused on lecturing, and memorising facts and new
information. It could therefore be argued that new insights must be constructed by students’
own attempts to bring meaning to and make sense of new information and knowledge (Burden
& Byrd, 2010:139; Rüütmann & Kipper, 2011:110) (cf. 2.7.2.2).
Another explanation for the finding could be that the subject content on which pre-test 2
focused, namely problem-based learning and working according to the scientific method
(content dealt with during weeks 1 – 6 of the research), was possibly better understood by the
participants, in comparison to the subject content of post-test 2 that only focused on subject
content linked to problem-based learning dealt with in weeks 1 – 7 of the intervention.
A comparison between the means for post-test 2B (�̅� = 9.172) and pre-test 2 (�̅� = 9.276)
revealed a statistically non-significant difference, p = 0.837 as the participants obtained more or
less the same average percentage for both tests. Both tests were similar as they focused on
problem-based content and working according to the scientific method. No purposeful attention
was paid to the use of Thinking Maps prior to the tests. The participants however did
surprisingly well as the averages for both tests were almost the same. A small decline was
however noticed in the post-test 2 B result, that could possibly be attributed to the absence of

Chapter 6: Data analysis and interpretation 160
explicitly focusing on the use of Thinking Maps for making meaning of subject content. The
researcher argues that it could be reasonable to assume that the critical thinking skills that were
acquired during the first six weeks of the Thinking Maps intervention, to which the good result of
post-test 1B and pre-test 2 testify, were possibly retained in the absence of purposeful focus on
working with Thinking Maps, and transferred effectively to the content of post-test 2B.
Although lecturing was used for six weeks after pre-test 2, the findings could also support the
view of Spence (2001:2) (cf. 2.7.2.3.1) who found that merely working in problem-based
learning environments could contribute to enhancing students’ critical thinking skills and
knowledge acquisition.
The sample mean for post-test 2B (�̅� = 9.172) and post-test 2 (�̅� = 6.345) highlighted an
average increase of 19% in results. The researcher observed a mean difference of 2.827 and a
statistically significant difference of p < 0.05 = 0.000 with a large effect in practice, d = 1.452.
Although post-test 2B and post-test 2 were written at the same time, the researcher finds it
interesting that the participants seemingly were more effective at applying critical thinking skills
to content that focused on problem-based learning and working according to the scientific
method in post-test 2B, than they were at applying critical thinking skills to the problem-based
content in post-test 2. It appears that the critical skills which they acquired through the six
weeks Thinking Maps intervention were retained, which enabled them to be more effective at
applying critical thinking to the information in post-test 2B, than what they were at applying
critical thinking to the information in post-test 2 (Illeris, 2015:30; Pithers & Soden 2000:241) (cf.
2.6.2, 2.6.3). This finding could imply that the participants probably understood the content on
which post-test 2B focused better than the problem-based content of post-test 2, which enabled
them to be more effective at applying critical thinking skills to information in post-test 2B (Illeris,
2015:30; Pithers & Soden 2000:241) (cf. 2.6.2, 2.6.3). This argument of the researcher is
confirmed by the good result received for pre-test 2, which focused on the same content as
post-test 2B.
Improvement is noted for Experimental group 1 between the initial pre-test 1 (�̅� = 6.828) and the
final post-test 2B result (�̅� = 9.172), and the researcher cautiously assumes that the Thinking
Maps intervention contributed to the improvement noted. The result however indicates that the
students are still not master thinkers, but rather still challenged thinkers faced with significant
problems in their thinking who try to improve to become beginning thinkers (Paul & Elder,
2006:19) (cf. 2.3.3).
The standard deviations for all the test occasions varied between s = 2.750 and s = 1.868
respectively, revealed that there was not a lot of variation between results of the various test
occasions, and the results were not widely dispersed around the mean.

Chapter 6: Data analysis and interpretation 161
In summary, the findings in relation to Experimental group 1 strengthened the case that a
Thinking Maps intervention can enhance the development of critical thinking skills (cf. pre-test 1,
pre-test 2 results), which is confirmed by Stedman and Adams (2012:9) (cf. 2.3.4), who state
that the purposive practise of higher order thinking skills contributes to students becoming
capable of improving their critical thinking skills. The findings also supports the argument of
Hyerle (2014:163) (cf. 3.5.3) that Thinking Maps hold potential for the development of critical
thinking skills and confirm the argument of Hyerle and Yeager (2007:10) (cf. 3.5.5) that Thinking
Maps drive the learning process and make information and learning more meaningful. It also
became clear that the skills attained during the use of Thinking Maps were probably not
retained and applied in the absence of the purposeful use of Thinking Maps (cf. post-test 2B
results) (Stedman & Adams, 2012:9) (cf. 2.3.4). The argument of Pritchard (2014:119-120) (cf.
3.2), that Thinking Maps support active learning and assists in organising information
systematically, which contributes to enhanced performance in the application of thinking skills,
also seems to be supported by the test results obtained by Experimental group 1.
It was however clear to the researcher that the difficulty levels of post-test 1 and post-test 2
could have hampered the effective application of critical thinking skills. In addition, some of the
problem-based content, used in post-tests 1 and 2, and the content related to working according
to the scientific method in post-test 1, appeared to be problematic and not understood by the
participants, possibly contributing to the poor results noted in the mentioned tests. This finding
confirms the argument of Illeris (2015:30) (cf. 2.6.2) that a lack of understanding may lead to an
inability to apply critical thinking skills. The participants however appeared to be more effective
at applying critical thinking to the problem-based content and the scientific method of pre-test 2
and post-test 2 B (similar to pre-test 2), as well as the Grade 12 content that was the focus of
pre-test 1 and post-test 1B (similar to pre-test 1).
The researcher cautiously also argues that the findings that emanated from Experiment 1
support the literature where it is argued that direct, passive teaching does not explicitly promote
the development of critical thinking (cf. post-test 2 result) (Burden & Byrd, 2010:120; Kruger,
2002:109) (cf. 2.7.1.1, 2.7.2.1), and that skilful thinking must be cultivated with purposive
practise (Costa, 2009:16) (cf. 3.5). During normal lecturing, there was no explicit emphasis on
the enhancement of critical thinking skills. It can however not be excluded that normal lecturing
could have contributed to the improvement noted in the post-test 2B result.
The following sections discusses the data analysis and interpretation of the research findings in
relation to Experimental group 2.

Chapter 6: Data analysis and interpretation 162
6.4.3 Data analysis and interpretation: Experimental group 2
In the following section the researcher reports on the data obtained from the participants who
took part in Experiment 2 regarding the various critical thinking skills that were addressed in the
various tests, as indicated in Table 6.8.
Figure 6.6 indicates the test score percentages for the various test occasions for Experimental
group 2.
Figure 6.6: Comparison of test results: Experimental group 2

Chapter 6: Data analysis and interpretation 163
Table 6.8: Test data: Participants Experimental group 2
Test application
n �̅�
(15) %
Mean difference s t df p
Cohen’s d
Effect size
1 Pre-test 1 27 8.444 56.296 1.481
1.908 3.382 26 0.002* 0.665 Medium
Post-test 1 27 6.963 46.419 2.227
2 Pre-test 1 27 8.444 56.296 -0.741
1.908 -1.398 26 0.174 - -
Post-test 1B 27 9.185 61.234 2.386
3 Post-test 1 27 6.963 46.419 -2.222
2.227 -5.273 26 0.000* 0.931 Large
Post-test 1B 27 9.185 61.234 2.386
4 Pre-test 2 27 8.815 58.765 2.408
1.961 5.003 26 0.000* 1.007 Large
Post-test 2 27 6.407 42.716 2.390
5 Post-test 2B 27 8.593 57.283 -0.222
2.043 0.700 26 0.490 - -
Pre-test 2 27 8.815 58.765 1.961
6 Post-test 2B 27 8.593 57.283 2.186
2.043 -4.440 26 0.000* 0.915 Large
Post-test 2 27 6.407 42.716 2.390

Chapter 6: Data analysis and interpretation 164
A comparison between the means of pre-test 1 (�̅� = 8.444) and post-test 1(�̅� = 6.963) results
revealed a statistically significance difference of p < 0.05 = 0.002 with a medium effect in
practice, d = 0.665. The researcher is of the opinion that normal lecturing seemingly did not
contribute to enhancing the application of critical thinking skills and the participants were not
effective at applying critical thinking in the context of post-test 1 that focused on the Life Science
subject content dealt with during weeks 1 – 6 of sememster 1 (problem-based content and
working according to the scientific method). This finding confirms the literature that direct
teaching is not effective for developing critical thinking (Burden & Byrd, 2010:39; Rüütman &
Kipper, 2011:110) (cf. 2.7.2.2.).The researcher concluded that the content of post-test 1 that
focused on content dealt with during weeks 1 – 6 might have been misunderstood or
understood in a distorted way and the students were therefore not effective at applying critical
thinking. This conclusion supports the viewpoint of Illeris (2015:30) (cf. 2.6.2) who states that
misunderstanding of information may lead to a lack in the ability to apply critical thinking skills.
A comparison between the means of pre-test 1 (�̅� = 8.444) and post-test 1B (�̅� = 9.185), a
repetition of pre-test 1, did not reveal a statistical significant difference between the two results,
p = 0.174. Bearing in mind that post-test 1B was a repetition of pre-test 1, it appeared that the
lecturing of subject matter and concepts during weeks 1 – 6 to Experimental group 2, assisted
the participants to achieve a slightly better result with the application of the critical thinking skills
the second time. This finding possibly supports the views of McCollister and Sayler (2010:42),
Pithers and Soden (2000:243) and Qing et al. (2010:4598) (cf. 2.3.4), who indicate that it is
possible to develop critical thinking skills in the course of teaching/lecturing subject-matter
content and concepts.
For the comparison between the means of post-test 1 (�̅� = 6.963) and post-test 1B (�̅� =
9.185), a repetition of pre-test 1, the researcher noted a statistical significant difference between
post-test 1 and post-test 1B, p < 0.05 = 0.000, with a large effect in practice, d = 0.931. This
implied that the post-test 1B result was statistically significantly better than the post-test 1 result.
Post-test 1B was a repetition of pre-test 1 (Grade 12 Life Science content), and the researcher
convincingly concluded that the six weeks of normal lecturing contributed to the improvement of
students’ ability to apply critical thinking skills in post-test 1 B. However, it is surprising that the
participants were not effective at applying critical thinking in the context of post-test 1, that was
written simultaneously with post-test 1B. As previously noted, the researcher carefully assumes
that the nature of the content in post-test 1 was probably too difficult for the participants to
grasp, which hampered the effective application of the critical thinking skills, and therefore
contributed to the lower result in post-test 1.

Chapter 6: Data analysis and interpretation 165
A comparison of the sample means for pre-test 2 (�̅� = 8.815) and for post-test 2 (�̅� = 6.407)
revealed an average decrease of 16% in the post-test 2 result with a statistically significant
difference of p < 0.05 = 0.000, and a large effect in practice, d = 1.007. Post-test 2 was written
after the six week Thinking Maps intervention during weeks 7 – 12 of the first semester, and
focused mainly on problem-based content that was dealt with during weeks 7–12 of the
intervention. Similar to the result noted for post-test 1, and compared to the low results obtained
by Experimental group 1 for post-test 1 and post-test 2, it appeared that the understanding of
subject content also might have influenced the poor results of Experimental group 2 for the
mentioned tests. In addition, the poor result obtained for post-test 2 could also point to the
ineffectiveness of the Thinking Maps intervention to enhance the application of critical thinking
skills required for mastering certain problem-based content.
It is interesting to note that the result of pre-test 2, that was also written after the lecturing of
subject content, were lower than the result of post-test 1B that was also written after normal
lecturing. In this regard, the researcher also argues that the subject content (problem-based
content and content related to the scientific method) that was the focus of pre-test 2, was
apparently not well understood, and normal lecturing also did not seem to assist the students in
applying critical thinking skills effectively to the unknown subject content. Similar to
Experiemental group 1, the findings could be linked to the view of Snyder and Snyder (2008:92)
(cf. 2.7.2.4) who state that students need time to learn the process of thinking critically, which
was not the case during normal lecturing. In support of Snyder and Snyer (2008:92), Costa
(2009:16) (cf. 3.5), concludes that skilful thinking must be cultivated with purposive practise,
which was not the case as the participants merely received normal lectures without explicit
emphasis on the enhancement of critical thinking skills. In line with the findings of Snyder and
Snyder (2008:93) (cf. 2.7.2.5), it could be argued that the development of critical thinking
requires more involvement from a student’s personal discovery of information and knowledge.
A comparison between the means for post-test 2B (�̅� = 8.593) and pre-test 2 (�̅� = 8.815)
revealed a statistically non-significant difference, p = 0.490 as the participants obtained more or
less the same average percentage for both tests. A mean difference of -0.222 between post-test
2B (�̅� = 8.593) and pre-test 2 (�̅� = 8.815) was noted, with a small decline in the post-test 2B
result. Both tests focused on problem-based content and working according to the scientific
method, and in the presence of the Thinking Maps intervention prior to post-test 2B (a repetition
of pre-test 2), the participants however obtained good results, as the averages were very similar
for both tests. The researcher assumed that the six weeks of lecturing subject content prior to
the Thinking Maps intervention could have contributed to maintaining good result in post-test
2B, although the result was slighty lower than the pre-test 2 result. This finiding possibly
supports the view of Spence (2001:2) (cf. 2.7.2.3) who found that working in problem-based

Chapter 6: Data analysis and interpretation 166
learning environments could enhance students’ critical thinking skills and knowledge acquisition.
In addition, the Thinking Maps intervention could also have assisted the students to apply
critical thinking more effectively in post-test 2B, supporting the view of Stedman and Adams
(2012:9) (cf. 2.4.5), who indicated that with purposive practising of higher order thinking skills,
students are enabled to improve their critical thinking skills.
The sample mean for post-test 2B (�̅� = 8.593) and post-test 2 (�̅� = 6.407) highlighted an
average increase of 15% in results. The researcher observed a mean difference of 2.186 and a
statistically significant difference of p < 0.05 = 0.000 with a large effect in practice, d = 0.915.
Although post-test 2B and post-test 2 were written at the same time, the researcher observed
that the participants were more effective at applying critical thinking skills to problem-based
content and content related to working according to the scientific method in post-test 2B, than
they were at applying skills to the problem-based content in post-test 2. It appears that the
critical thinking skills which the students acquired during the six weeks Thinking Maps
intervention, and the skills possibly acquired during the six weeks of normal lecturing (the good
pre-test 2 result testifies to this finding), were retained and more effectively applied to the
information in post-test 2B, than in post-test 2 (Illeris, 2015:30; Pithers & Soden 2000:241) (cf.
2.6.2, 2.6.3). In addition, it might have been that the problem-based content on which post-test
2 focused was not familiar to or well understood by the participants, and they probably
experienced difficulties in applying critical thinking to the information, or there was a difference
in the difficulty levels of the post-test 2 and post-test 2B.
The standard deviations for all the test occasions varied between s = 2.390 and s = 1.908
respectively, revealed that there was not a lot of variation in the results of the various test
occasions, and that results were clustered around the means.
In summary, similar to Experimental group 1, the findings obtained for Experimental group 2
also strengthened the case that a Thinking Maps intervention can enhance the development of
critical thinking skills (cf. post-test 2B result), as confirmed by the statements of Stedman and
Adams (2012:9) (cf. 2.3.4), and that with purposive practise of higher order thinking skills,
students apparently become capable of improving their critical thinking skills. The findings also
confirm the argument of Hyerle and Yeager (2007:10) (cf. 3.5.5) that Thinking Maps drive the
learning process and make information and learning more meaningful. It also became clear that
the slight improvement in the application of critical thinking attained during the use of normal
lecturing, as evidenced in the post-test 1B and pre-test 2 results, was probably retained and
reinforced by the Thinking Maps intervention, as the post-test 2B result was only slightly lower
than the post-test 1B and pre-test 2 results. This finding seems to contradict the findings of

Chapter 6: Data analysis and interpretation 167
Burden and Byrd (2010:120) and Kruger (2002:109) (cf. 2.7.2.1), that passive teaching does not
promote the development of critical thinking.
Similar to Experiment 1, the findings also revealed that some of the problem-based learning
content and content that focused on working according to the scientific method seemed to have
influenced the effectiveness with which the participants applied the critical thinking skills (cf.
post-test 1 and post-test 2 results).
As was noted with Experimental group 1, Experimental group 2 was also more effective at
applying critical thinking to the Grade 12 Life Science content in pre-test 1 and post-test 1B, not
forgetting that the content might have been known to the students and therefore they found it
easier to apply critical thinking to the Grade 12 Life Science content.
In the following section, the researcher reports on the data obtained for the comparison
between the Experimental group 1 and 2 for the various test occasions.
6.5 DATA ANALYSIS AND INTERPRETATION: COMPARISON BETWEEN
PARTICIPANTS – EXPERIMENTAL GROUP 1 AND 2
Figure 6.7 and Table 6.9 below compares the data obtained for the various test results obtained
by Experimental group 1 and 2. The two Thinking Maps interventions were not completely
identical in terms of the topics on which the interventions focused, and therefore makes a
comparison difficult. However, the nature of the content (problem-based, scientific method) and
the underlying critical thinking skills that were addressed, were similar (cf. 5.3.2), The
researcher also noted similar trends between Experimental group 1 and 2 in the results
obtained for some of the tests, and therefore cautiously reports on the data related to a
comparison between Experimental group 1 and 2.

Chapter 6: Data analysis and interpretation 168
Figure 6.7: Comparison of test results: Experimental group 1 and 2

Chapter 6: Data analysis and interpretation 169
Table 6.9: Test data: Comparison Experimental group 1 (E1) and Experimental group 2 (E2)
* Statistical significance: p < 0.05
Test Groups n 𝑥 ̅
(15) %
Mean difference
s f t df p Cohen’s
d Effect size
1 Pre-test 1
E1 29 6.828 45.517
-1.616
2.331
1.054 -2.828 54 0.007* 0.693 Medium
E2 27 8.444 56.296 1.908
2 Pre-test 2
E1 29 9.276 61.839
0.461
2.750
2.928 0.717 54 0.476 - -
E2 27 8.815 58.765 1.969
3 Post-test 1
E1 29 6.724 44.827
-0.239
1.868
0.890 -0.436 54 0.665 - -
E2 27 6.963 46.419 2.227
4 Post-test 2
E1 29 6.345 42.298
-0.062
2.192
0.735 -0.102 54 0.919 - -
E2 27 6.407 42.716 2.390
5 Post-test 1B
E1 29 8.897 59.310
-0.288
2.335
0.020 -0.457 54 0.649 - -
E2 27 9.185 61.234 2.386
6 Post-test 2B
E1 29 9.172 61.149
0.579
1.947
0.051 1.087 54 0.282 - -
E2 27 8.593 57.283 2.043

Chapter 6: Data analysis and interpretation 170
The sample mean for pre-test 1, Experimental group 1 (�̅� = 6.828) and Experimental group 2 (�̅�
= 8.444) clearly indicated that the participants in Experimental group 2 obtained a 11% higher
average percentage in results. Furthermore, the researcher observed a mean difference of -
1.616 between the pre-test 1 results of Experimental group 1 and Experimental group 2 with a
statistically significant difference of p < 0.05 = 0.007, and a medium effect, d = 0.693, in
practice. Based on the data, it appeared that Experimental group 2 was more capable of
applying critical thinking skills than Experimental group 1 at the onset of the research. It appears
as if the participants in Experimental group 2 probably acquired some critical thinking skills at
school-level, and were able to retain these skills in the context of the Grade 12 content that was
the focus in pre-test 1. The critical thinking skills appeared to be on a low (Experimental group
1) to average (Experimental group 2) level of development.
A comparison between the pre-test 2 results however indicated that Experimental group 1 (�̅� =
9.276) performed better than Experimental group 2 (�̅� = 8.815). However, mean difference of -
0.461 did not reveal a statistically significant difference, p > 0.05 = 0.476. The improvement in
the result of Experimental group 1 (although not yet statistically significant) could be attributed
to the exposure they received during the Thinking Maps intervention programme, but could also
have been due to chance. Experimental group 2 received normal lecturing during the first six
weeks and seemingly did not benefit greatly from the development of critical thinking skills, as
there was only a slight improvement in their pre-test 2 result, compared to the pre-test 1 result.
A reason for the slight decline in the pre-test 2 result might be linked to the fact that the
researcher placed emphasis on content related to problem-based learning and working
according to the scientific method, which was dealt with during weeks 1 – 6 of the first semester,
which seemingly did not benefit the students to improve the application of critical thinking.
Post-test 1 revealed a statistically non-significant difference between Experimental group 1 (�̅�
= 6.724) and Experimental group 2 (�̅� = 6.963), p > 0.05 = 0.665. Both groups obtained lower
results than in pre-test 1, which indicated that neither the Thinking Maps intervention nor normal
lecturing contributed to enhancing the application of critical thinking in post-test 1. As the
content of post-test 1 focused on problem-based learning and working according to the scientific
method, it could also be argued that the participants might have found the content more difficult
than the Grade 12 content on which pre-test 1 focused. The pre-test 1 and post-test 1 results of
Experimental group 1 remained more or less similar, although the post-test 1 result was slightly
lower than the pre-test 1 result. However, the post-test 1 result for Experimental group 2 was
much lower than their initial pre-test 1 result, which possibly point to the fact that normal
lecturing did not contribute much to enhance the development and application of critical
thinking.

Chapter 6: Data analysis and interpretation 171
The post-test 2 results of both Experimental group 1 (�̅� = 6.345) and Experimental group 2 (�̅�
= 6.407), were lower than the pre-test 1 and post-test 1 results, indicating that the students
could not apply critical thinking skills effectively. The difference between the two results
indicated a statistically non-significant difference of p > 0.05 = 0.919. The result of Experimental
group 1, who received normal lecturing before writing post-test 2, was slightly lower than their
pre-test 1 and post-test 1 results, and the improvement noted in their pre-test 2 result was not
maintained. Experimental group 2, who received the Thinking Maps training before writing post-
test 2, also scored lower in post-test 2 than in pre-test 1 and post-test 1. The researcher argues
that the difficulty level of post-test 2, and the nature of the content that only focused on problem-
based learning, might have influenced the effectiveness with which the students applied critical
thinking in post-test 2
In post-test 1B, both experimental groups achieved better results than in pre-test 1 and post-
test 1. Post-test 1 B was a repetition of pre-test 1, that focused on Grade 12 Life Science
content. A comparison between the two groups however revealed a statistical non-significant
difference, p > 0.05 = 0.649 between the two groups. In comparison to all their other test
results, Experimental group 1 (�̅� = 8.897) achieved the second highest result in post-test 1B.
This finding could imply that the skills acquired during the Thinking Maps intervention, which
possibly also contributed to the increase noted in their pre-test 2 result, were also applied in the
context of post-test 1B, as the post-test 1B result (�̅� = 9.172) indicated an improvement in
comparison to the pre-test 1 result (�̅� = 6.828). However, the lower post-test 2 result of
Experimental group 1, after a six week absence of purposeful focus on Thinking Maps, (�̅� =
6.345), possibly indicated that the critical thinking skills acquired during weeks 1 – 6 of the
semester were not retained. It could also imply that the content of pre-test 1 and post-test 1B
which was similar, allowed for more effective application of critical thinking skills than the
content related to problem-based learning and working according to the scientific method of pre-
test 2 and post-test 1, as well as the exclusive focus on problem-based content in post-test 2. In
addition, the participants could have remembered the test content of pre-test 1, given the short
six week Thinking Maps intervention, and that this could have contributed to the improved post-
test 1B result.
Of all their test results, Experimental group 2 achieved the best results in post-test 1 B after
normal lecturing, which apparently also contributed to the slight increase also noted in pre-test
2. In addition, it appeared that Experimental group 2 did not benefit as much as Experimental
group 1 from the Thinking Maps intervention, as their post-test 2 result after the Thinking Maps
intervention (�̅� = 6.407) was lower than their pre-test 1 result at the onset of the study (�̅� =
8.444).

Chapter 6: Data analysis and interpretation 172
Post-test 2B revealed a statistically non-significant difference between Experimental group 1
(�̅� = 9.172) and Experimental group 2 (�̅� = 8.593), p > 0.05 = 0.282. Experimental group 1
achieved better results in post-test 2B, in comparison to pre-test 1, post-test 1 and post-test 2
This finding points to the possible positive effect that the first six weeks of Thinking Maps
intervention had on the participants’ ability to apply critical thinking skills to new information and
knowledge and retain the skills in the absence of the intervention. Although post-test 2B was
written after six weeks of normal lecturing, the participants appeared to be more able to apply
the critical thinking skills in the context of problem-based learning and working according to the
scientific method that was the focus of post-test 2B, than what they were when writing pre-test 2
that focused on the same subject content.
Experimental group 2 obtained lower results in post-test 2 (�̅� = 6.407) and post-test 2B (�̅� =
8.593) than in post-test 1B (�̅� = 9.185), which indicated that the Thinking Maps intervention
appeared to have had very little influence on enhancing the application of their critical thinking
skills.
As the final post-test 2B result for Experimental group 1, (�̅� = 9.172), was higher than the pre-
test 1 result, (�̅� = 6.828), the researcher concludes that the Thinking Maps intervention possibly
contributed to the improved results noted for Experimental group 1, with a slight chance that
normal lecturing that preceded post-test 2B, might have contributed to the improvement noted
in post-test 2B.
For Experimental group 2, it appeared as if the combination of normal lecturing and the Thinking
Maps intervention collaboratively contributed to the slight enhancement of the participants’
critical thinking skills that were noted in the post-test 2B result, (�̅� = 8.593), in comparison to
the pre-test 1 result (�̅� = 8.444).
In all instances the standard deviations noted were low, and varied between s = 2.390 and s =
1.908, which did not indicate a wide dispersion of scores around the mean.
The results obtained for the various tests indicated that Experimental group 1 apparently
benefitted more from the intervention than Experimental group 2 when comparing the initial pre-
test 1 results (�̅� = 6.828, �̅� = 8.444), and the final post-test 2B results (�̅� = 9.172, �̅� = 8.593).
The Thinking Maps intervention as well as normal lecturing seemed to be effective for both
experimental groups respectively in the context of Grade 12 Life Science content due to the
improvements noted in the post-test 1B results (a repetition of pre-test 1). However, the
Thinking Maps intervention did not appear to hold any benefits for any of the experimental
groups where critical thinking had to be applied to the problem-based content and content

Chapter 6: Data analysis and interpretation 173
related to the scientific method of post-test 1 (Experimental group 1) and the problem-based
content of post-test 2 (Experimental group 2). It also seems reasonable to conclude that
Experimental group 1 possibly retained the critical thinking skills acquired during weeks 1 – 6 of
the Thinking Maps intervention, which enabled them to be effective at the application of critical
thinking in post-test 2B.
In light of the findings noted for both Experimental group 1 and 2, the researcher argues that
the participants could have had other learning style preferences, preconceptions about the
subject, or learning resistance towards the subject, which, according to Illeris (2015:30) and
Snyder and Snyder (2008:93) also inhibit critical thinking ability (cf. 2.6.3).
Given the background of the participants who do not speak English as their home language, it
could also be argued that their lack of academic language proficiency possibly inhibited their
application of critical thinking to certain subject content (Lun et al., 2010:606) (cf. 2.6.5).
Interestingly, the researcher noted that normal lecturing, as well as the use of Thinking Maps,
possibly encouraged opportunities for developing critical thinking. However, in the context of
using Thinking Maps as a teaching strategy, more opportunities should be created for emotional
engagement and reasoning during learning in order to enhance the development of critical
thinking skills in the context of problem-based content and content related to working according
to the scientific method (Browne & Freeman, 2000:304; Howie & Bagnall, 2015:350; McGonigal,
2005:1; Spence, 2001:3; Rüütman & Kipper, 2011:110; VanGundy, 2005:169-340) (cf. 2.7.1.4;
2.7.1.5, 2.7.2.1, 2.7.2.2).
In comparison, the final post-test 2B result (�̅� = 8.593) and the initital pre-test 1 result (�̅� =
8.444) of Experimental group 2 does not reveal a lot of improvement, and the researcher is of
the opinion that Experimental group 2 did not seem to benefit much from the Thinking Maps
intervention. The group of students still appears to be challenged thinkers who need more
exposure to develop critical thinking skills to become master thinkers for which good thinking
habits have become second nature (Paul & Elder, 2006:19) (cf. 2.3.3).
The Thinking Maps intervention as well as normal lecturing seemed to be effective for both
experimental groups respectively in the context of Grade 12 Life Science content due to the
improvements noted in the post-test 1B result (a repetition of pre-test 1). However, the Thinking
Maps interevention did not appear to hold any benefits for any of the experimental groups
where critical thinking had to be applied to the problem-based content and content related to the
scientific method of post-test 1 (Experimental group 1) and the problem-based content of post-
test 2 (Experimental group 2).

Chapter 6: Data analysis and interpretation 174
The findings noted for both Experimental group 1 and 2 supported the argument of Hyerle and
Yeager (2007:8-16) (cf. 3.5.5) who state that Thinking Maps drive students’ learning processes
and progress, improving the developing of critical thinking skills. However, the findings also
indicate that in the absence of the purposeful practising of critical thinking skills, the
improvement noticed may not last (Ijaija et al., 2010:358; Saavedra & Opfer, 2012:7; Stedman &
Adams (2012:9) (cf. 2.3.4, 2.6.2). In contrast to what literature reveals, the researcher cannot
conclude conclusively that traditional lecturing did not have a limited influence on the
development of critical thinking (Saavedra & Opfer, 2012:7; Tsui, 2002:742) (cf. 2.6.2). In this
regard, Spence (2001:2) (cf. 2.7.2.3) argues that merely working in a problem-based learning
environment, as was the case in the context of the research, can promote the development of
critical thinking. In addition, McCollister and Sayler (2010:42), Pithers and Soden (2000:243)
and Qing et al. (2010:4598) (cf. 3.3.4) argue that lecturing subject content can develop critical
thinking skills.
The problem-based content and working according to the scientific method on which many of
the tests focused was probably difficult for the students to comprehend and could have affected
the acquisition and application of critical thinking skills (Illeris, 2015:30; Pithers & Soden,
2000:246; Sternberg, 1987:458) (cf. 2.6.2, 2.6.3). The final post-test 2B results of both
experimental groups indicate that both groups still appear to be in need of more purposeful
efforts to enhance the development of their thinking skills.
The findings could also point to the absence of important critical thinking dispositions, such as
self-confidence in reasoning, thinking reflectively and open-mindedly, working accurately and
systematically and resisting impulsiveness, that could have influenced the effectiveness with
which critical thinking skills were applied (Illeris, 2015:30; Pithers & Soden, 2000:242; Snyder &
Snyder, 2008:93; Sternberg, 1987:458) (cf. 2.6.2, 2.6.3)
More guidance from an teacher might also be required to effectively apply critical thinking when
constructing Thinking Maps in the context of problem-based content and working according to
the scientific method (VanGundy, 2015:169) (cf. 2.7.2.2). Greater involvement of the students
through the presence of the purposeful use of open-procedural questioning during the
independent structuring of Thinking Maps, possibly would have contributed to the critical
thinking skills being enhanced more effectively (Green & Murris, 2014:127; McCollister & Sayler,
2010:43; Pithers & Soden, 2000:242; Tsui, 2002:742) (cf. 2.7.2.3, 2.6.2, 2.6.3).
The following section reports on initial data obtained with the Thinking Maps that participants
constructed during the Thinking Maps intervention.

Chapter 6: Data analysis and interpretation 175
6.6 DATA ANALYSIS AND INTERPRETATION: THINKING MAPS WORKSHEETS
-EXPERIMENT 1 AND 2
Although the Thinking Maps constructed by the students were not regarded as primary sources
of data collection during the research, the researcher includes a short discussion about the
progress of the students noted in working with the Thinking Maps.
The researcher used Thinking Maps as an intervention strategy to enhance the development of
critical thinking skills. During the intervention, the students worked independently, and decided
which of the three Thinking Maps (Circle Map,Tree Map, Multi-Flow Map) would be the most
appropriate to use to synthesise and make meaning of the subject content that was presented
during lessons. Examples of the students’ Thinking Maps are included in Appendix D.
At the onset of the study, the researcher familiarised the participants with the Thinking Maps,
the thinking processes that they represent, and how to structure the layout of the Thinking
Maps. Each follow-up lecture revised and reinforced this information. Lectures during the
Thinking Maps intervention more or less followed the structure presented below in Figure 6.8,
that focus on the input, elaboration and output phases of the learning process. In the absence of
the Thinking Maps intervention only lectures with explanations of information and concepts
characterised the teaching and learning, without explicit focus on the development of thinking
skills. A DVD with all the lesson presentations is included at the back of the dissertation.
Figure 6.8: Lesson structure during the Thinking Maps intervention
Input
•Start lesson with a question to check for pre-knowledge.
•Explaining material/concepts to inform the lecture.
•Focus on the use of verbs/concepts/words related to each Thinking Map during the explanation of content andwhen formulating instructions/questions eg. Explain your understanding of ........; then: Order your thoughts............
Elaboration
•Exploring information related to the new topic.
• In this phase students took control of their own learning, making sense of information by using Thinking Maps.
•Focus on specific skills related to the content (see table with possible verbs/words to guide this step in the learning process) (cf. Table 3.3).
Output
•Presenting/communicating final understanding verbally or orally using the maps as points of departure. The Thinking Map that guides the communication will depend on the specific skill/s the task focused on.

Chapter 6: Data analysis and interpretation 176
As indicated in Figure 6.8, the input phase of the teaching learning process was also
characterised by normal lectures during the Thinking Maps intervention but with greater focus
on the thinking processes that underpin the mastering of the content. However, during the
elaboration and output phases of the learning process, students were independently involved in
making meaning of the lectures through the use of the Thinking Maps that captured their
individual meaning-making processes and understanding of the content.
The specific criteria used to assess the Thinking Maps were: sufficiency/fluency of ideas,
thought process (verb or keyword linked to Thinking Map), collaborative development, flexibility,
originality, elaboration and layout of the Thinking Map (cf. Table 3.2) (cf. 3.5.6). A second table
provides an example of the criteria used to holistically assess the Thinking Maps in terms of
relevancy and elaboration (detail). Marks were linked to the specific criteria: not achieved (1),
elementary achievement (2), moderate achievement (3), adequate achievement (4), substantial
achievement (5), meritorious achievement (6) and outstanding achievement (7) (cf. Table 3.4)
(cf. 3.5.6).
The researcher provided the students with the assessment criteria, (cf. Table 3.2, Table 3.4) (cf.
3.5.6) to guide them in constructing their Thinking Maps. The researcher also used the criteria
to monitor and gauge students’ progress in linking Life Science content and thinking processes
to relevant Thinking Maps.
Table 6.10 reports the data obtained for the comparison between Experimental group 1 and
Experimental group 2 regarding the Thinking Maps worksheets that were constructed each
week. Two maps (A and B) were constructed on a weekly basis, except for week 1 and 7, which
focused on introducing the Thinking Maps to the two experimental groups. Each Thinking Map
was scored out of 7.
Table 6.10: Comparison Participants Experiment 1 and 2: Thinking Maps worksheets
Week n
( 7)
Average /week
Experimental group 1
W1 36 3.194 3.194
W2A 34 3.059 2.824
W2B 34 2.588
W3A 26 3.115 2.904

Chapter 6: Data analysis and interpretation 177
Week n
( 7)
Average /week
W3B 26 2.692
W4A 27 3.556 3.413
W4B 26 3.269
W5A 16 3.688 3.407
W5B 16 3.125
W6A 33 3.606 3.591
W6B 33 3.576
Experimental group 2
W7A 33 3.333 3.167
W7B 33 3.000
W8A 29 4.276 4.242
W8B 29 4.207
W9A 35 4.286 4.315
W9B 35 4.343
W10A 32 4.719 4.657
W10B 32 4.594
W11A 30 4.200 3.850
W11B 30 3.500
W12A 26 4.524 4.435
W12B 26 4.346
*A and B indicate that two maps were constructed during the particular week.
The sample means of week 1 for both Experimental groups 1 and 2 revealed similar results, (�̅�
= 3.194) and (�̅� = 3.167). The Thinking Maps were constructed in class directly after the
presentations on the construction and use of Thinking Maps and the students’ first introduction
to theory in Life Sciences.

Chapter 6: Data analysis and interpretation 178
As from weeks 2 to 6, the sample means for Experimental group 1 clearly indicated that
participants obtained better and improved results from week 2 (�̅� = 2.824) to week 6 (�̅� = 3.591).
The researcher assumed that with time the students mastered the ability to make meaning of
information, organise the information and acquired a thought process through the use of the
Thinking Maps. Costa (2009:16) (cf. 3.5) confirms that Thinking Maps is a teaching strategy that
teaches students how to think and reason more effectively. The improved performance noted in
the construction of the participants’ Thinking Maps and the fact that the Thinking Maps probably
benefited the application of critical thinking skills were also evident in the participants’ improved
results for post-test 1B, pre-test 2 and post-test 2B.
A comparison of the sample means for Experimental group 2 also revealed better and
improved results from week 7 (�̅� = 3.167) to week 12 (�̅� = 4.435), with the best result noted
during week 10 (�̅� = 4.657). The researcher concluded that the students were able to link the
information they acquired to a relevant Thinking Map, which gave them ownership of their
thinking processes. This is in line with Hyerle (2014:169) (cf. 3.5.5), who states that Thinking
Maps give pathways for thinking and students acquire skills and strategies to enhance all
elements of critical thinking. The improved results in the construction of the Thinking Maps for
Experimental group 2 however did not correspond with the findings noted for post-test 2 after
the Thinking Maps intervention, and possibly confirm that the students need more time to learn
the process of thinking (Snyder & Snyder, 2008:92) (cf. 2.7.2.4). The result noted for post-test
2B (�̅� = 8.593) however, indicated an improvement when compared to post-test 2 (�̅� = 6.407),
which provides an indication that the Thinking Maps intervention possibly contributed to the
effective application of critical thinking in the context of post-test 2B.
Bearing in mind that weeks 5 and 11 were also used for semester tests, the researcher
concluded that the lower means of Experimental groups 1 (week 5) and 2 (week 11) were due
to time constraints regarding the generation of Thinking Maps.
The assessment of the Thinking Maps revealed to the researcher that the students became
more skilful at thinking using the Thinking Maps and that the purposive practice of constructing
Thinking Maps aided the cultivation of the application of the thinking skills on which the study
focused (Costa, 2009:16; Stedman & Adams, 2012:9) (cf. 3.5, 2.3.4). The Thinking Maps also
enabled the students to organise information more effectively and systematically (Pritchard,
2014:119-120) (cf. 3.2). Students’ own attempts to construct Thinking Maps enabled them to
increasingly make sense of new information (Burden & Byrd, 2010:139; Rüütmann & Kipper,
2011:110) (cf. 2.7.2.2). The aforementioned argument of the researcher is based on the fact
that the assessment criteria used to assess the Thinking Maps intentionally encouraged and
probed the students to construct maps that inter alia complied with fluency, elaboration,

Chapter 6: Data analysis and interpretation 179
originality and flexibility that are important features of critical thinking to solve problems
effectively (Pikulsky & Chard, 2005:512) for which detailed, flexible, unconventional and original
thinking is required (Costa, 2009:21-23; MacFarlane, 2007:18; Niehuis et al., 2001:120) (cf.
3.5.5).
The following section explores some of the initial trends noted in the open responses to the test
questions. As stated in Chapter 1, the main purpose of including open questions was to obtain
initial data that could be used in follow-up studies regarding the development of students’
universal intellectual standards of reasoning. The main focus of this study was on the critical
thinking skills and not the universal intellectual standards of reasoning.
6.7 DATA ANALYSIS AND INTERPRETATION: OPEN RESPONSES – PRE- AND
POST-TESTS
According to Norris and Ennis (1989:157), open-ended testing can provide information on
critical thinking dispositions but not on specific aspects of critical thinking. The open responses
did not contribute to the final research findings, and the researcher therefore did not aim to
undertake a deep analysis of the open responses, but merely wanted to:
make notes of strengths and weaknesses within individual responses;
gather initial data on the presence or absence of the universal intellectual standards of
reasoning; and
prevent students from guessing.
The responses to the open-ended questions were analysed to explore the clarity, accuracy,
precision, relevance, significance depth, breadth and logic of the participants’ reasoning
prior to and after the Thinking Maps intervention. In relation to the universal intellectual
standards of reasoning, the researcher checked the motivations that the students provided for
their answers to find evidence of the following:
Clarity: Clarifying answers by providing improved elaborations or expressions.
Accuracy: Answers should be really true.
Precision: Answers should provide specific detail.
Relevance: Answers should be connected or applicable to the question.
Significance: Answers should focus on the central idea of the problem.
Depth: Answers should capture the complexities or difficulties of a question.
Breadth: Answers should add another viewpoint or perspective.

Chapter 6: Data analysis and interpretation 180
Logic: Answers should put ideas together that make sense (Paul & Elder, 2006:12).
The participants were expected to formulate motivations for their answers that complied with all
or most of the above-mentioned universal intellectual standards of reasoning for each of the test
items in the various tests.
Due to the large volumes of data that were obtained to the open questions (Tables 6.12 - 6.15),
the researcher provides the ideal answer and examples of three good motivations and three
poor motivations (according to the researchers’ judgement) that the participants presented to
motivate their answers in relation to some randomly selected questions in the tests that focused
on the application of the critical thinking skills analysis, synthesis and evaluation. A breakdown
of the questions in the various tests that focused on analysis, synthesis and evaluation
respectively, is provided in Table 6.11 below. Examples of the open responses to all the test
items are included in Appendix E. The Afrikaans responses were translated into English, as this
research is reported in English. It also has to be kept in mind that English is not the home
language of many participants who replied in English, and the verbatim examples of responses
therefore might contain language and spelling errors.
Table 6.11 below summarises the breakdown of the test questions to address the skills on
which the study focused.
Table 6.11: Breakdown of test questions
Test Analysis questions Synthesis questions
Evaluation questions
Pre-test , Post-test 1B 3, 5, 8, 9, 12,13 2, 4, 7,10,14 1, 6, 11 15
Post-test 2 7, 8, 14, 15 4, 5, 9, 10, 12, 13 1, 2, 3, 6, 11
Pre-test 2, Post-test 2B 2, 6, 7, 9, 10 1, 4, 5, 11, 12 3, 8, 13, 14, 15
Post-test 2 3, 4, 5, 6, 14 2, 8,12, 13 1, 7, 9,10, 11,15
6.7.1 Open responses Experimental group 1 and 2
6.7.1.1 Pre-test 1 and Post-test 1 B
In this section, the researcher reports on the students' application of the universal intellectual
standards of reasoning to motivate their responses to the questions in pre-test 1 and post-test 1
B that focused on the same subject content (Grade 12 Life Sciences). Tables 6.12 – 6.15
summarise some of the verbatim examples of the participants’ response as they appeared on
the tests.

Chapter 6: Data analysis and interpretation 181
Table 6.12: Pre-test 1 and Post-test 1B – Examples of motivations
Question number and ideal answer
Examples of good motivations
Examples of poor motivations
E1
Evaluation
1.Steps are given in diagram.
“When a person is conducting a scientific investigation, he should undergo the same steps as shown”; “for every experiment carried out, there are certain steps to follow”; “it includes steps to follow”.
“Not all the investigations include water”; “… because the lettuce plant grow bigger”; “it has all the components of a good experiment”.
Many students did not provide any motivation for their answer.
E2
Evaluation
“When conducting an experiment, there are steps that needs to be followed”; “… the scientific method are used in every scientific investigation”; “… because the steps must be followed”.
“In scientific investigations, the scientific method is the best”; “… the steps include different stages”; “… it has no aim”.
E1
Synthesis
4.Statement with cause and effect.
“…a scientific prediction which involves both the dependent and independent variables”; “it is a statement”; “… a prediction that should be proved”.
“Because plant will grow bigger”; “because scientists wants to test the theory of water”; “the question of the experiment was about…”
E2
Synthesis
“It has not yet been proven”; “ ..a statement that needs to be proven”; “ … is a statement”.
“... a possible outcome”; “… because water fertilises the roots”; “… because that is what the investigator suspected”.
E1
Anaysis
8. Heat causes sugar to dissolve.
“In order for more sugar to dissolve the water must be heated”; “… sugar depends on cup of heated water”; “ ...for sugar to dissolve depend on heat”.
“Sugar is the one that’s going to be tested”; “… it does not depend on water or sugar”; “… it does not depend on anything”.
E2
Analysis
“The sugar dissolving is dependent on the heat”; “… the water need to be heated for the sugar to dissolve”; “ … sugar depends on hot water to dissolve”.
“The cup of water depends on the heat for the sugar”; “… sugar is dependent on cup of water”; “… the cup of water will depend on the amount of heat”.

Chapter 6: Data analysis and interpretation 182
Question number and ideal answer
Examples of good motivations
Examples of poor motivations
E1
Synthesis
10. Must be the same in cause and effect.
“It is not effected during the experiment”; “… cup of water does not change”; “… cup of water must be constant”.
“Because this experiment is about the water carrying ability”; “… so the result could be more appropriate”; “… the results of the experiment”.
E2
Synthesis
“Accept for sugar and hot water, all other variables must be constant”; “… amount of water must stay the same”; “… same cup and amount of water has to be used”.
“Cup of water should be kept constant”; “… because without water, sugar cannot dissolve”; “… because there are different volumes in sol”.
E1
Evaluation
11. According to the introduction.
“…the experiment was done in order to check the water-carrying capacity”; “… from the introduction…”; “… the scientist is investigating the water-carrying capacity”.
“The soil type were placed in funnels”; “… the soil types differ”; “… dependent and independent variables are there”.
E2
Evaluation
“… scientist is investigating the water-carrying capacity of soil”; “… question based on different soil types”; “… comparing the water-carrying capacity of soil”.
“Water was added in all three types of soil”; “… it is the aim of the investigation”; “… the longer the soil is dipped in water, the greater the filtration”.
E1
Analysis
12. Variable that causes the effect.
“Different types of soil were used”; “… the volume of filtrate depends on the soil type”; “… soil sample is independent”.
“The time determines the volume..”; “… because it changes the whole experiment”; “… time only will tell us the best…”.
E2
Analysis
“it’s the variable that cause the effect”; “… soil type can be changed”; “… soil types are different, making the time of filtration different”.
“it determines how much water is absorbed”; “… time does not depend on the volume”; “… the volume of the filtrate was observed”.
6.7.1.2 Post-test 1
In this section, the researcher reports on the students' application of the universal intellectual
standards of reasoning to the motivation that they had to provide for their response to the
questions in post-test 1, which focused on problem-based content and the scientific method,

Chapter 6: Data analysis and interpretation 183
which were dealt with during weeks 1 – 6 of the first semester 2016. Table 6.13 summarises
some of the verbatim responses of the students.
Table 6.13: Post-test 1 – Examples of motivations
Question number and ideal answer
Examples of good motivation
Examples of poor motivation
E1
Evaluation
2. Contains more proteins.
“Has much protein in food”; “ ... the more proteins, the faster growth”; “… more amount of protein…”.
“Because it has lots of fats”; “… because there are more carbohydrates and fewer proteins”; “ ... it does not contain fats”.
E2
Evaluation
“They have more proteins”; “… proteins are responsible for growth”; “… more proteins found here which …”; “… contains the most proteins”.
“because they contain a lot of oil”; “… because the pie chart line is in the middle”; “… because fats influence growth”.
E1
Evaluation 6. Body temperature / optimum temperature for catalase.
“Enzyme function best at optimal temperature which is 37ºC”; “… enzymes usually most effective at body temperature”; “… that is the suitable temperature for catalase”.
“Because enzyme function best at optimal temperature”; “… the temperature is high”; “… because water is boiling”.
E2
Evaluation
“Enzymes most active at body temperature”; “… enzyme function best at optimum temperature”; “… the temperature seems at optimal…”.
“it changes as more variables are added”; “… catalyst speed up reaction under high temperature”; “… what can be controlled”.
E1
Analysis
8. Variable that cause an effect.
“The temperature of the water bath”; “… the temperature is the cause”; “… because temperature is the one that cause…”.
“The condition of the chicken liver”; “… the amount of hydrogen provided…”; “… it is what must be observed”.
E2
Analysis
“The condition of the chicken liver depends on temperature”; “… we have to use different temperature…”; “… temperature has an effect”.
“The chicken liver is the one that reacts”; “… hydrogen peroxide determines the reaction”; “…the amount of bubbles formed”.
E1
Synthesis
9. Dependent variable.
“The variable that has to stay the same”; “… it varies according to the temperature”; “… it is a dependent variable”.
“Because the amount of liquid oxygen…”; “… the amount of liquid displaced was not a variable”; “… liquid in different beakers”.

Chapter 6: Data analysis and interpretation 184
Question number and ideal answer
Examples of good motivation
Examples of poor motivation
E2
Synthesis
“The condition of the liver”; “… different temperatures”; “… water temperature”; “… during different temperatures”.
“The amount of hydrogen peroxide”; “… because it is not weight”; “… the liquid that was displaced”.
E1
Synthesis
13. No reduction of chromosome number.
“The chromosomes have been halved in meiosis I”; “… crossing over had already occurred in prophase I”; “… chromatid moving from centre”.
“…so that the daughter cell has both maternal and paternal material”; “… sister chromosomes align at equator”; “… chromosomes align in pairs”.
E2
Synthesis
“Chromosomes line up on equator”; “… reduction has halved the number of chromosomes”; “…the chromatids are about to split”.
“The metaphase of meiosis”; “… telophase has not occurred”; “… chromosomes are in homologous pairs”.
E1
Ananlysis 15. Hypertonic low
water potential.
“The water drains from the solute”; “… the water exits the vacuole”; “… hypertonic is the higher solute and less water concentration”.
“Water enters the cell”; “… the vacuole moves towards the cell membrane”; “… because water exits”.
E2
Analysis
“Higher solute concentration”; “… the cell shrinks”; “… cell expands as water enters”.
“Water exits…”; “… will go to the point of high concentration …”; “… the cell will change its shape”.
6.7.1.3 Pre-test 2 and post-test 2B
In this section, the researcher reports on the students' application of the universal intellectual
standards of reasoning to the motivation that they had to provide for their response to the
questions in pre-test 2 that focused on problem-based content and working according to the
scientific method, dealt with in the weeks 1 – 6 of the first semester 2016. Table 6.14
summarises some of the verbatim responses of the students.

Chapter 6: Data analysis and interpretation 185
Table 6.14: Pre-test 2 and post-test 2B – Examples of motivations
Question number and ideal answer
Examples of good motivation
Examples of poor motivation
E1
Analysis
2. Effect of temperature.
“Results are depending on the temperature”; “… the results depend on the temperature”; “… results after washing depends on the temperature in order for the enzymes to function”.
“The size of the blood stain”; “… different temperature cause different results”; “… temperature depend on the time”.
E2
Analysis
“The result after washing and is dependent on enzyme activity”; “… the results depend on the temperatures”; “… it depends on the different temperatures”.
“The stains are not measured”; “…the size of the blood stains are observed”; “… there cannot be results without the experiment”.
E1
Synthesis
4. 33% = 0.33 van 18 = 6.
“33/100 X 18 = 6”; “5.94; 33/100 x 18”. The only correct answer.
“It is six portions of the total consumed”; “… they are the highest that were consumed”; “… because we have to consume 3 meals /day”.
E2
Synthesis
“Because 33% of 18 is 6”; “... 33% of 18 is 5.94”.
“Because it is the biggest portion per day”; “ …if 4 comes from fruit, the rest comes from 18”.
E1
Evaluation
8. Explain sequence of graph.
“According the shape of the graph…”; “… enzyme function low at low temperature and as the temperature increases, they speed up the function”; “… enzyme activity started at low temperature and rise to a point of optimum”.
“This sequence best describe the shape”; “… it started at low temperature and increases”; “… at the beginning of the graph, there is no enzyme activity…”.
E2
Evaluation
“Steps follow line of graph”; “… sequence starts with low temperature and rises as temperature rises”; “… according to the graph”.
“The graph shows that enzymes are inactive at low and again at high temperature”; “… the enzyme temperatures start at low”; “… when temperatures increase, the enzyme reaction increases”.

Chapter 6: Data analysis and interpretation 186
Question number and ideal answer
Examples of good motivation
Examples of poor motivation
E1
Analysis
9. Effect of temperature
“ …different temperatures different number of bubbles...”; “… it depend on the temperature of the water”; “… they are depending on the temperature”.
“Temperature of water depend on the number of gas bubbles”; “… the temperature of the water depend on the rate of photosynthesis”; “… temperature of water is dependent”.
E2
Anaysis
“They are effected by the temperature”; “… the number of gas bubbles is the effect”; “… the gas bubbles will indicate the effect”.
“Temperature will be determined by the amount of heat provided”; “… the effect of water temperature”; “… it is the variable that can be changed”.
E1
Synthesis
11. Optimum – max reaction.
“The graph reaches its peak at 35ºC”; “… the number of bubbles are more at 35ºC”; “… it produces the most gas bubbles”.
“The maximum height; optimal temperatures”; “… as gas bubbles decrease, water content also decreases”; “… this is the highest temperature”.
E2
Synthesis
“Temperature where most bubbles are formed”; “… from graph and use ruler with vertical line drawn from 35ºC”; “… maximum bubbles appear at 35ºC”.
“Because that is the moderate temperature”; “… at 30ºC the amount of gas bubbles are higher”; “… because the graph shows at 40ºC”.
E1
Evaluation
14. 30 – 20 min = 10 min.
“The race ended at 20 minutes, continued to increase until 30 minutes which means 10 minutes”; “… it continued to increase from 20 to 30”. The only correct answer.
“Lasted for 50 minutes”; “… as in line graph”; “… it took 10 minutes to decrease”; “… because it become higher”.
E2
Evaluation
“Lactic acid concentration increased after 10 minutes”; “… 30 – 20 min = 10 minutes”.
Wrong calculations were provided as answers.
6.7.1.4 Post-test 2
In this section, the researcher reports on the students' application of the universal intellectual
standards of reasoning to motivate their responses to the questions in post-test 2. Table 6.15
summarises some examples of the verbatim responses of the students.

Chapter 6: Data analysis and interpretation 187
Table 6.15: Post-test 2 – Examples of motivations
Question number and ideal answer
Examples of good motivation
Examples of poor motivation
E1
Evaluation
1. Tinfoil prevent sunlight from entering and green part contain chlorophyll.
“Leaf covered with tin foil and contain green part”; “… sunlight and plant colour…”; “… variegated leaf test chlorophyll and covered part test sunlight”.
“CO2 and sunlight were tested”; “… to test whether chlorophyll is necessary for photosynthesis”; “… test was performed with a variegated leaf”; “… colour of leaf will change if CO2 is present”.
E2
Evaluation
“Part of leaf was covered with tin foil and other parts contain chlorophyll”; “… plants require sunlight and chlorophyll to photosynthesise”; “… the foil is testing whether sunlight is necessary and green if chlorophyll is essential”.
“Because CO2 and sunlight are essential …”; “… the plant colour was white and green”; “… these factors are essential for photosynthesis”.
E1
Synthesis
2 Contain both correct cause and effect.
“Plant needs both for photosynthesis”; “… they were both tested; the statement mention the two variables tested”.
“Sunlight is the main source that allows photosynthesis”; “… they indicate if photosynthesis has occurred”; “… sunlight and CO2 are…”.
E2
Synthesis
“A statement with both variables”; “… testable statement with cause and effect”; “… both dependent and independent variables in prediction”.
“CO2 is necessary for photosynthesis”; “… that is what the investigation is about”; “… that is what you change in the experiment”.
E1
Analysis
3. Cause of an effect.
“Chlorophyll depends on sunlight”; “… they both cause the effect”; “… they do not change nor depend on any variable”.
“CO2 and sunlight depend on nothing”; “… the leaf depends on sunlight”; “… they are both effected”.
E2
Analysis
“They are factors that cannot be changed”; “… both causes the effect; can be controlled”.
“CO2 and sunlight are needed”; “… the leaf depends on CO2 and sunlight …”; “… CO2 and sunlight are the ones causes the effects”.

Chapter 6: Data analysis and interpretation 188
Question number and ideal answer
Examples of good motivation
Examples of poor motivation
E1
Analysis
6. 50 – 40 = 10 units of light.
“it already has 8 units of glucose and only needs 2 to make 10”. The only correct answer.
“20/4 = 10”; “… it will be able to produce 4 more glucose units”; “… if more light is added the plant will produce more food”.
E2
Analysis
“It already has 8 units of glucose and only needs 2 to make 10”. The only correct answer.
“The more the units of light, the better”; “… 20 units…”; “… more light results in more glucose produced”.
E1
Synthesis 12. Respiration
since oxidation is the loss of electrons and reduction is the gain of electrons.
“Respiration undergoes reduction to produce H2O”; “… because the end products of photosynthesis are needed”; “… the breaking down of carbohydrates”.
“Because during photosynthesis oxidation takes place before reduction”; “… because this is a reduction process that take place”; “… because in A the molecules are large and in B they are smaller”.
E2
Synthesis
“Glucose is oxidized and reduced to CO2 and H2O”; “… glucose was oxidized since it lost electrons”; “O2 was reduced because it gained electrons”.
“Indicates the equation of photosynthesis”; “… O2 is being oxidized”; “… the by-product are the same of that of photosynthesis”.
E1
Evaluation
15. All the factors are limiting photosynthe-sis.
“Because they all contribute to photosynthesis”; “… photosynthesis requires the presence of all mentioned”; “… they are all limiting the process”.
“More CO2 has been taken in and used for photosynthesis”; “… when H2O is available it works hand in hand with CO2”; “… because water availability causes a light reaction”.
E2
Evaluation
“All three important in the process of photosynthesis”; “…all the factors may limit photosynthesis”; “… they are all contributing factors”.
“Some of the factors must be absent”; “… H2O is produced during the process”; “… more glucose is produced since there is enough sunlight”.
In summary, the researcher observed the following initial trends in the majority of the responses.
The responses of the students did not testify to reasoning that reflected clarity, accuracy,
precision, relevance, significance, depth, breadth and logic in all the tests that were
administered. The following general trends were observed in the participants’ responses:

Chapter 6: Data analysis and interpretation 189
The motivations lacked clarity, as elaborations provided by the students were sometimes
part of the questions or items from the questions given to them, and not phrased in their own
words.
Most of the motivations were not true and therefore not accurate.
Some motivations provided insufficient and irrelevant detail.
The motivations lacked relevance, as many responses were not connected or applicable to
the questions.
The motivations lacked significance where responses were repetitions of the actual
questions or items from the questions.
Some questions were probably too difficult (depth) and some participants provided no
motivations for their answers.
Some questions were demonstrated by graphs to give more perspective to the applicable
question, but were misinterpreted by many students.
The motivations lacked logic, as facts/ideas did not follow in order and answers did not
make sense.
The researcher concluded that neither the Thinking Maps intervention nor normal lecturing
appeared to have sensitised the students to apply the universal intellectual standards of
reasoning. The researcher therefore argues that the nurturing of the universal intellectual
standards of reasoning appears to be a dimension of critical thinking that needs exclusive and
purposive attention in order to develop.
An improvement in providing better reasoned motivations were noted regarding questions
where graphs were used to clarify questions (pre-test 2 and post-test 2). This could possibly be
due to the practice of using Thinking Maps as a visual strategy to better understand learning
content.
A disturbing observation was that there were numerous multiple-choice questions not motivated
by some participants at all. This trend not to motivate answers could be due to the problem-
based content and content related to the scientific method, that the participants might not have
understood.
The researcher argues that a major factor that possibly contributed to the apparent inability of
the participants to comply with the universal intellectual standards of reasoning in their answers
was the lack of probing questions used by the lecturer during the Thinking Maps intervention
and normal lecturing. In this regard Paul and Elder (2006:8) argue that probing questions need

Chapter 6: Data analysis and interpretation 190
to become infused in the thinking of students, and have to form part of their inner voice that
would guide them to become more effective at reasoning. The following questions suggested by
Paul and Elder (2006:7, 8), could have guided the thinking of the students during the
construction of the Thinking Maps to intentionally focus on reasoning in accordance with the
universal intellectual standards of reasoning:
Clarity: Could you give an example? Could you explain further? Could you express that in
another way?
Accuracy: Are you sure that your answer is true? How could we know that the answer is true?
Precision: Could you provide more detail to your answer?
Relevance: How is this answer relevant to the question? How does this answer relate to the
issue that we are discussing?
Depth: Are you sure you have identified all the significant facts?
Breadth: Could you answer the question in another way?
Logic: Are you sure your answer makes sense?
Significance: Could you indicate which of the facts that you identified are the most important
and why?
The researcher concludes that most of the participants did not develop a command of the
universal intellectual standards of reasoning during the research, as they were not effective at
motivating their answers with clarity, accuracy, precision, relevance, significance depth, breadth
and logic. In comparison, after reading through the motivations of the students, it appeared to
the researcher that Experimental group 2 provided better motivations for their answers than
Experimental group 1. In addition, Experimental group 2 performed better in comparison to
Experimental group 1 regarding motvating questions that involved basic mathematics.
6.8 CHAPTER SUMMARY
In this chapter the results of the statistical analysis of the pre-tests, post-tests and assessment
of Thinking Maps were reported and discussed.
In summary, the test results for Experimental group 2 revealed quite a different picture when
compared to the results of Experimental group 1. At the onset of the research with pre-test 1,
Experimental group 2 appeared to be more effective than Experimental group 1 with the

Chapter 6: Data analysis and interpretation 191
application of the critical thinking skills. However, at the end of the 12-week intervention with the
writing of post-test 2B, Experimental group 1 managed to achieve better results than
Experimental group 2 (cf. 6.5).
In addition, the researcher noticed the same trends among Experimental groups 1 and 2,
namely that after the Thinking Maps intervention and normal lecturing respectively; an increase
was noticed in the pre-test 2 results, but not in the post-test 1 and post-test 2 results.
Improvement for both groups was then again observed in the post-test 1 B and post-test 2B
results, which could imply that the Thinking Maps intervention (Experimental group 1) and the
normal lecturing (Experimental group 2) over time seemed to have contributed to the improved
results (cf. 6.4.2, 6.4.3). It is noteworthy to mention that although post-test 1 and pre-test 2
focused on problem-based content and working according to the scientific method, none of the
participants appeared to be effective at applying critical thinking in post-test 1, as the average
for post-test 1 was lower than the average achieved for pre-test 2 for both Experimental group 1
and 2. As the post-test 2B results were higher than the pre-test 1 results for both experimental
groups, the researcher concludes that the Thinking Maps intervention and normal lecturing
contributed to enhancing the application of the participants’ critical thinking skills.
The researcher concludes that the results obtained for the various tests, in particular for
Experimental group 1, testify to the latent potential of Thinking Maps to enhance the
development of critical thinking. The improved performance noted in the construction of the
Thinking Maps of the participants of Experimental group 1 probably benefited the application of
critical thinking skills that was observed in the improved results that they obtained for post-test
1B, pre-test 2 and post-test 2B (cf. 6.6).
The improved results in the construction of the Thinking Maps in particular for Experimental
group 2 did not correspond with the findings noted for the various test results, as this group
appeared not to have benefitted as much as Experimental group 1 from the Thinking Maps
intervention, as evidence by their post-test 2 result (cf. 6.6).
Finally, the analysis of the open questions in the various tests indicated that most of the
participants were not able to motivate their answers with clarity, accuracy, precision, relevance,
significance, depth, breadth and logic (cf. 6.7).
The final chapter, Chapter 7, focuses on the summary and findings of the study and
recommendations for enhancing the development of critical thinking through Thinking Maps.

Chapter 7: Summary, findings and recommendations 192
CHAPTER 7
SUMMARY, FINDINGS AND RECOMMENDATIONS
7.1 INTRODUCTION
This study was conducted with the purpose of determining the impact of Thinking Maps on
enhancing the development of critical thinking skills among first year pre-service Life Science
teachers at a university in South Africa. The main aim, objectives and hypotheses formulated at
the onset of the study are revisited in this chapter, in order to determine whether they were
achieved.
It is essential that the literature study and the data gathered by means of tests and the Thinking
Maps should have contributed in answering the primary and secondary questions on which this
study was based, achieving its overall aim and objectives. This chapter addresses the following:
In the subsequent section, a brief overview of the study is provided.
7.2 An overview of the study
7.3 Findings from the literature review
7.4 Findings from the empirical research
Research hypotheses and variables 7.5 Findings in relation to the aim and objectives of the study
Research hypotheses and variables
7.6 Hypotheses: Acceptance or rejection
Research methodology
7.7 Recommendations
7.8 Limitations of the study
7.9 Suggestions for further research
7.10 Contributions of the study
Research hypotheses and variables

Chapter 7: Summary, findings and recommendations 193
7.2 OVERVIEW OF THE STUDY
The overview of the study intends to provide a brief summary of the essence of the preceding
chapters.
7.2.1 Chapter 1
The purpose of the chapter was to familiarise the reader with the rationale, purpose statement,
conceptual framework, research questions, aim and objectives, hypotheses and the empirical
research design as well as data collection and analysis, and the Thinking Maps intervention (cf.
1.1 – 1.14).
The chapter began with a brief discussion to clarify what critical thinking is, and emphasised its
importance to achieve the objectives of the South African CAPS and the subject Life Sciences.
Completed national and international research studies reported that the development of critical
thinking skills among pre-service teachers appears to be fragile and deficient. The use of
Thinking Maps as a teaching strategy to develop the elements of critical thinking, namely
cognitive skills, metacognitive strategies, dispositions/behavioural traits, intellectual traits and
universal intellectual standards of reasoning (cf. 1.1) seems to be a possible solution to
enhance the critical thinking development of pre-service teachers. This research focused on
critical thinking and Thinking Maps as a teaching strategy to enhance critical thinking, therefore
a number of research studies were consulted to establish gaps in the research field. Completed
research in this regard has not yet established the effects of Thinking Maps on enhancing the
development of critical thinking among pre-service Life Science teachers. Therefore, a gap in
terms of specific research linked to Life Sciences as well as Thinking Maps for enhancing critical
thinking was identified (cf. 1.1).
The research question and secondary research questions for the study were formulated and
aligned with the aim and objectives of the study, which entailed determining to what extent pre-
service Life Science teachers are effective at applying the critical thinking skills to analyse,
synthesise and evaluate information, and if not, to investigate to what extent a Thinking Maps
intervention could enhance the development of critical thinking skills among first year pre-
service Life Science teachers (cf. 1.5).
The research was framed within a positivistic paradigm (cf. 1.8.2), and employed quantitative,
quasi-experimental research (cf. 1.8.3) with a non-equivalent pre-test-post-test control group
strategy of inquiry in a double experiment (cf. 1.8.4). The sampling (cf. 1.8.5) involved non-
probability convenient and purposive sampling of first year pre-service Life Science teachers at
a South African university (n = 56). Data were collected by means of researcher-developed pre-
tests and post-tests (cf. 1.9.1), that comprised closed and open test items. With the latter the

Chapter 7: Summary, findings and recommendations 194
researcher envisaged to establish the research participants’ efficiency to comply with the
universal intellectual standards of reasoning. Furthermore, the Thinking Maps generated by the
students during the intervention and for homework were assessed to establish how the Thinking
Maps contributed to the application of critical thinking skills among the growth and development
students (cf. 1.9.2).
Criteria for upholding reliability of the research were adhered to (cf. 1.10.2), and the validity of
this quantitative research design was ensured by complying with the four aspects of internal,
external, construct and statistical validity (cf. 1.10.1.1). The tests were subjected to criteria for
validity, and focused on ensuring face, content, construct and criterion validity (cf. 1.10.2). In
addition, the validity of the experimental research design was ensured by adhering to criteria for
internal and external validity (cf. 1.10.1.3).
The data analysis procedures involved descriptive and inferential statistics (cf. 1.11).
Comparisons were made within and across experimental and control groups to establish the
effect of Thinking Maps to enhance the development of critical thinking skills by comparing the
pre-test and post-test results. The open questions were analysed to establish trends in
participants’ reasoning in relation to the universal intellectual standards of reasoning (cf. 2.2.4).
The Thinking Maps that the students constructed during the intervention were assessed against
criteria such as flexibility, originality, elaboration, fluency, layout and relevancy (cf. 3.5.5), that
provided an indication of the growth and development of their critical thinking skills. Throughout
the research principles for conducting ethical research were upheld (cf. 1.12).
7.2.2 Chapter 2
This chapter focused on a conceptualisation of critical thinking. Critical thinking involves the
interrelated application of different elements, such as the core critical thinking skills and
metacognitive strategies, critical thinking dispositions/behavioural traits, universal intellectual
standards of reasoning and intellectual traits (Ennis, 2001:44; Facione, 2009:5, 6; McPeck,
1981:20; Paul, 1993:58) (cf. 2.2). In the context of the study, the main focus was on the
interrelated core critical thinking skills (analysis, synthesis and evaluation) (cf. 2.2.2).
The importance of enhancing the development of critical thinking was linked to the objectives of
the CAPS curriculum (Department of Basic Education, 2011:4, 5) (cf. 2.3.1), teaching and
learning in the 21st century (Crockett, 2015:2; Saavedra & Opfer, 2012:5; Wagner, 2008:17 (cf.
2.3.2), the acquisition of critical thinking as a life skill (Brookhart, 2010:5; Hager & Kaye,
1992:27; Jacobson, 2014:31) (cf. 2.3.3) and the important role of critical thinking in achieving
the objectives of Life Sciences. Teachers themselves need to be good critical thinkers before

Chapter 7: Summary, findings and recommendations 195
they can teach learners to think critically (Department of Basic Education, 2011:13; Snyder &
Snyder, 2008:92) (cf. 2.3.4).
Research that established the critical thinking abilities of pre-service teachers within an
international and national context revealed that school learning apparently does not prepare
pre-service teachers to apply critical thinking skills (Allamnakhrah, 2013:200; Grosser &
Lombard, 2008:1364; Uksw, 2014:163) (cf. 2.4.1, 2.4.2).
Different measuring instruments such as, multiple-choice, open-ended and commercially
available tests to assess the development of critical thinking skills were explored in section 2.5
(Norris & Ennis,1989:101). In the absence of subject-related tests to establish the application of
critical thinking in Life Sciences, the researcher decided to set his own subject-related tests
comprising closed multiple-choice test items as well as open test items to establish the extent to
which the students possessed the critical thinking skills on which the research focused, as well
as to collect some initial data about the application of the universal intellectual standards of
reasoning prior to, and after the Thinking Maps intervention. Data were also collected by
assessing the Thinking Maps that the students constructed during the intervention to determine
the effectiveness of the students in applying critical thinking skills to Life Science content (cf.
6.6).
Factors that could inhibit the development of students’ critical thinking were discussed, namely
political, educational, personal, behavioural, cultural and language factors. The importance of, in
particular, teaching practices to enhance the development of critical thinking skills was
highlighted (Grosser & Lombard, 2008:1367; Illeris, 2015:30; Lun et al., 2010:606; Pithers &
Soden, 2000:241; Snyder & Snyder, 2008:92) (cf. 2.6.1 - 2.6.5).
Finally, different learning theories, teaching methods and teaching strategies and their relation
to the development of critical thinking were described with the aim to identify a suitable
teaching-learning framework that would guide the design and implementation of the intervention
(cf. 2.7.1-2.7.2). Attention was given to behaviourism (Ertmer & Newby, 2013:48) (cf. 2.7.1.1),
which is characterised by a “drill-and-practice” approach that is still at the order of the day in
many educational institutions. Cognitivism (Pintrich & Schunk, 2002:143; Schunk, 2000:119) (cf.
2.7.1.2) regards students as information processors and Constructivism (Ertmer & Newby,
2013:55) (cf. 2.7.1.3) focuses on active involvement and creating meaning during learning.
Attention was also given to the transformative learning theory (cf. 2.7.1.4), that postulates that
dynamic relationships between teachers and students during learning promote personal
development and growth (McGonigal, 2005:1). Finally, experiential learning theory (cf. 2.7.1.5)
that involves the application of information received from the teacher to a student’s experiences
in real life, was explored (Steffens, 2015:41-45).

Chapter 7: Summary, findings and recommendations 196
The following teaching methods were reviewed to identity a suitable method/methods to apply
when implementing the Thinking Maps intervention programme. Direct, teacher-centered
teaching involves an teacher who takes a central role during teaching and who spends most of
the time talking (Arends, 2004:293; Burden & Byrd, 2010:120; Kramer, 2006:100) (cf. 2.7.2.1).
Indirect teaching is a student-centered approach where the students are active participants and
more in control of their own learning (Borich, 2003:94; Kramer, 2006:101; Kruger, 2002:110) (cf.
2.7.2.2). Independent teaching methods include those where students work by themselves and
rely on their own efforts to accomplish a task or an assignment (Borich, 2007:17; Philpott,
2009:38) (cf. 2.7.2.3). Interactive teaching focuses on cooperation and participation during
teaching, where meaning is constructed through collaboration (Burden & Byrd, 2010:151;
Gawe, 2008:209; Sessoms, 2008:88) (cf. 2.7.2.4).
Flowing from the discussions in section 2.7 the researcher argued that a cognitive and a
cognitive constructivist teaching and learning framework, and the facilitation of teaching and
learning by means of independent teaching methods and strategies would provide the
necessary opportunities for active learning and personal construction of meaning to enhance
the development of critical thinking through the use of Thinking Maps.
7.2.3 Chapter 3
Chapter 3 focused primarily on clarifying the effectiveness of visual learning, what Thinking
Maps are and their importance in developing critical thinking. Effective learning is an activity of
constructing information in collaboration with others and involves the application of
metacognitive and cognitive thinking skills (Grosser, 2007:38; Monteith, 2002:93; Pritchard,
2014:119-120) (cf. 3.2).
Different types of learning were identified, namely visual or sight-based (Gilakjani, 2012:105;
Gilakjani & Ahmadi, 2011:469) (cf. 3.3.2), auditory or voice-based (Gilakjani, 2012:106; Gilakjani
& Ahmadi, 2011:470) (cf. 3.3.3), kinaesthetic or movement-based (Gilakjani, 2012:106; Gilakjani
& Ahmadi, 2011:470) (cf. 3.3.4) as well as learning through reflection (Pritchard, 2014:48) (cf.
3.3.5). Reflectors collect information and make observations before making decisions. This
research explored the influence of Thinking Maps as a visual learning strategy (cf. 3.3.5).
Types of visual learning strategies were identified and explained, namely Mind Maps (Hyerle,
2009:155) (cf. 3.4.1), Concept Maps (Novak, 2006:1-2) (cf. 3.4.2), Graphic organisers (Ausubel,
1978:151-155) (cf. 3.4.3), charts and diagrams (Gilmartin & Rex, 1999:14) (cf. 3.4.4), as well as
Thinking Maps (Hyerle, 2009:151) (cf. 3.5). The latter visual learning strategy was the focus of
this research as Thinking Maps hold the potential to enhance the development of critical
thinking skills (Hyerle & Yeager, 2007:2) (cf. 3.5.2). Thinking Maps could be regarded as more

Chapter 7: Summary, findings and recommendations 197
suitable to enhance the development of critical thinking, as they facilitate more explicitly the
cognitive skills (defining, describing characteristics, contrasting, classifying, whole-part thinking,
sequencing, cause-and-effect reasoning and analogical reasoning) and metacognitive
strategies (reflection) involved in critical thinking (cf. Figure 2.1). Moreover, Thinking Maps
encourage students to think with clarity, relevance, depth, breadth and logic when constructing
the maps, thus promoting the development of the universal intellectual standards of reasoning.
In addition, a number of critical thinking dispositions such as accuracy, open-mindedness,
systematicity and persistence are required to construct good quality Thinking Maps.
The eight Thinking Maps based on the specific cognitive skills mentioned above are Circle
Maps, Bubble Maps, Double Bubble Maps, Tree Maps, Brace maps, Flow Maps, Multi-Flow
Maps and Bridge Maps (Hyerle & Yeager, 2007:26-66) (cf. 3.5.3.1-3.5.3.8). This research
focused on the use of the Circle Map, Tree Map and Multi-Flow Map to enhance the critical
thinking skills to analyse, synthesise and evaluate. The mentioned skills underpin the specific
outcomes in Life Sciences that were the focus of the study.
7.2.4 Chapter 4
Chapter 4 focused on the research methodology that was employed in the context of the study
(cf. 4.2 – 4.4).
The study was framed within a positivistic paradigm (cf. 4.2.2.1) and employed a quantitative,
quasi-experimental research design (cf. 4.4.1.1), as manipulation of a dependent variable
(critical thinking skills) took place in an experimental context. The researcher used the non-
equivalent groups pre-test-post-test control and comparison group designs as strategy of inquiry
in a double experiment (cf. 4.4., 4.4.2).
The researcher used norm-referenced tests to collect data, as comparisons were drawn
between the achievements of the control groups relative to the achievements of the
experimental groups. The researcher developed tests with multiple-choice and open test items
to determine the extent to which the participants acquired the skills to apply critical thinking
(analysis, synthesis, evaluation) in Life Science content. Based on the pre-test results, the
Thinking Maps interventions were developed to address the deficiencies noted in the pre-test
results at the onset of the first six weeks (Experiment 1) and second six weeks (Experiment 2)
of the first semester of 2016. The tests were piloted and refined before being administered to
the sampled participants (cf. 4.4.6).
Non-probability sampling was employed to select the first year pre-service Life Science teachers
(n = 56) at a South African university, who took part in the research (cf. 4.4.4). Non-probability
sampling could not guarantee that the sample was representative of the population, therefore

Chapter 7: Summary, findings and recommendations 198
no generalisations of the research findings could be made. It was, however, not the purpose of
the study to generalise findings. The researcher aimed to determine the impact of a Thinking
Maps intervention as part of a pilot study in his own classroom practice during teacher training
to enhance the development of critical thinking skills among first year pre-service Life Science
teachers (cf. 4.4.4).
The data derived from the closed and open questions in the tests and the Thinking Maps
constructed by the participants during the intervention, were captured, analysed and interpreted
with the assistance of an independent statistician from North-West University, Vaal Triangle
Campus. The data analysis involved, firstly, the use of descriptive statistical procedures to
summarise the data with frequencies, percentages, averages (means) and standard deviations.
Secondly, inferential statistics were used to accept or reject the hypotheses stated at the onset
of the study after comparing the means of the pre- and post-test data and making inferences
about the effectiveness of the Thinking Maps intervention (cf. 4.4.5). The responses to the open
questions in the test were checked to determine whether the students’ thinking complied with
the universal intellectual standards of reasoning (clarity, accuracy, logic, relevancy, depth,
breadth, significance) (cf. 2.2.4). The Thinking Maps constructed by the participants were
assessed against criteria for relevancy, elaboration, flexibility, originality and layout (cf. Tables
3.2, 3.3), to provide information about the extent fo which the students could apply critical
thinking to Life Science content using Thinking Maps.
The researcher adhered to quality criteria by ensuring that the study complied with reliability and
validity criteria (cf. 4.4.6) and ensured that he conducted the research according to ethical
principles (cf. 4.4.7).
7.2.5 Chapter 5
Chapter 5 briefly defined and described the six phases of intervention research. In the context
of the study, the researcher implemented four steps, namely problem analysis and project
planning; information gathering and synthesis; design and early development and pilot testing.
The twelve-weeks Thinking Maps intervention programme was underpinned by cognitive and
cognitive constructivist learning theories and implemented by means of independent teaching
as teaching method with Thinking Maps as teaching strategy. A comprehensive overview of the
twelve weeks Thinking Maps intervention programme was provided (cf. 5.3.2).

Chapter 7: Summary, findings and recommendations 199
7.2.6 Chapter 6
The data obtained from the pre- and post-tests written by students were analysed and
interpreted in this chapter, in which descriptive and inferential statistics were used to analyse
the data. A succinct overview of the main findings reported in Chapter 6 follows:
The findings in relation to Experimental group 1 (cf. Table 6.7) (cf. 6.4.2), highlighted the
potential of Thinking Maps noted in the post-test 1B and pre-test 2 results, to enhance the
development of critical thinking skills, as argued by Stedman and Adams (2012:9) (cf. 2.3.4)
and Hyerle and Yeager (2007:10) (cf. 3.5.5). The findings that emanated from Experimental
group 1 could also concur with the literature that direct, passive teaching does not promote
the development of critical thinking (Burden & Byrd, 2010:120; Kruger, 2002:109) (cf.
2.7.2.1), taking into consideration the low post-test 2 result.
The effectiveness of the Thinking Maps intervention was supported by the findings obtained
for Experimental group 2 and noted in the post-test 2B results. (cf. 6.4.3). In addition, normal
lecturing also appeared to assist the participants to develop critical thinking skills (cf. Table
6.8), evidenced by the improvement in the post-test 1B and pre-test 2 results. The findings
obtained for Experimental group 2 therefore also strengthened the case that a Thinking
Maps intervention can enhance the development of critical thinking skills, as confirmed by
the statements of Stedman and Adams (2012:9) (cf. 2.3.4). This finding seems to contradict
the literature that direct, passive teaching does not promote the development of critical
thinking (Burden & Byrd, 2010:120; Kruger, 2002:109) (cf. 2.7.2.1), when observing the
improvement in the post-test 1B result. The finding however could also support the
literature, based on the low post-test 1 result that the participants obtained after normal
lecturing.
The findings obtained for Experimental group 1 and 2 revealed that the nature and difficulty
level of some problem-based content and content related to working according to the
scientific method seemed to have influenced the effectiveness with which the participants
applied critical thinking skills (cf. 6.4.3) (post-test 1, pre-test 2, post-test 2).
The researcher noticed a similar trend in the comparison between the participants of
Experimental groups 1 and 2 (cf. Table 6.9) (cf. 6.5). After the Thinking Maps intervention
(Experimental group 1) and normal lecturing (Experimental group 2) respectively, an
increase was noticed in the post-test 1B and the pre-test 2 results of both groups, but not in
the post-test 1 results. These results could imply that the Thinking Maps intervention
(Experimental group 1) and the normal lecturing (Experimental group 2) seemed to have
contributed to the improved application of the critical thinking skills. As post-test 1B was a
repetition of pre-test 1, the content (Grade 12 Life Sciences), might have been familiar to the

Chapter 7: Summary, findings and recommendations 200
students, which enabled them to apply critical thinking more effectively than in post-test 1
where questions were phrased around new problem-based content and content related to
the scientific method that were dealt with during weeks 1 – 6 of semester 1.
In comparison to post-test 2 (after normal lecturing (Experimental group 1); after the
Thinking Maps intervention (Experimental group 2)), improvement for both groups was
observed in the post-test 2B results, a repetition of pre-test 2. However, a comparison
between pre-test 2 and post-test 2B revealed a slight decrease in the post-test 2B results.
Both groups also scored higher results in the final test, post-test 2B, compared to pre-test 1
at the onset of the experiment. Therefore, the researcher concluded that the Thinking Maps
intervention and normal lecturing possibly jointly contributed to the retention or transferability
of the participants’ critical thinking skills.
The assessment of the participants’ Thinking Maps constructed during the Thinking Maps
intervention indicated that Experimental group 1 obtained better and improved results from
week 2 to week 4 (cf. Table 6.10). It appeared that with time the participants were able to
use the Thinking Maps to make meaning of information and organise the information. The
results of Experimental group 2 for the construction of the Thinking Maps during their
intervention also revealed better and improved results from week 7 to week 12. The
researcher concluded that the students were able to make meaning of the information and
took ownership of their thinking processes. However, the improved results in the
construction of the Thinking Maps for Experimental group 2 did not correspond with the
findings noted for the various test results, for example the low post-test 2 result after the
Thinking Maps intervention. According to the test results, Experimental group 2 seemingly
did not benefit as much as Experimental group 1 from the Thinking Maps intervention (cf.
6.6), as their post-test 2B result at the end of the intervention were only slightly higher than
their pre-test 1 results at the onset of the research. Experimental group 1 however
maintained higher results in post-test 2B than in pre-test 1 at the onset of the research.
The analysis of the open responses in the questionnaire indicated that the participants in
both experimental groups seemed to have experienced challenges to motivate their test
answers, as their responses reflected an apparent inability to reason with clarity, accuracy,
logic, relevance, significance, breadth and depth (cf. 6.7). It seems reasonable to conclude
that the Thinking Maps intervention did not enhance the development of the universal
intellectual standards of reasoning.
In the next section, the major findings that emanated from the literature review, are presented.

Chapter 7: Summary, findings and recommendations 201
7.3 FINDINGS FROM THE LITERATURE REVIEW
The literature review focused on two concepts, the first being critical thinking and the second
the development of critical thinking through visual learning and specifically the role of Thinking
Maps.
A major finding from the literature revealed that the importance of critical thinking for teacher
training is supported by the new CAPS and within the current school curriculum. Critical thinking
can be linked with specific outcomes and assessment standards in the Life Science classroom
(Department of Basic Education, 2011:4, 5) (cf. 2.3.1). Education systems need to increase their
focus on developing students’ 21st century skills to prepare them for life challenges (Crockett,
2015:2; Saavedra & Opfer, 2012:5; Wagner, 2008:17) (cf. 2.3.2). An important finding that
emanated from the literature review is that critical thinking is a life skill which should be
cultivated (Duron et al., 2006:160; Paul & Elder, 2006:4) (cf. 2.3.3). A major factor influencing
the nurturing of critical thinking in the classroom relates to teachers who purposively and
persistently provide opportunities for students to practise critical thinking (Stedman & Adams,
2012:9) (cf. 2.3.4).
Further findings were revealed regarding the critical thinking abilities of pre-service teachers
with an international and national perspective. Both perspectives revealed that pre-service
teachers lack effective critical thinking skills (Allamnakhrah, 2013:199) and are unable to apply
critical thinking skills (Lombard & Grosser, 2008:573) (cf. 2.4). Furthermore, findings revealed
that the development of critical thinking skills is unlikely unless pre-service teacher education
produces products of critical thinking (Allamnakhrah, 2013:200) (cf. 2.4).
The next major finding related to a concept clarification for critical thinking. Pioneers in the field
of critical thinking argue that critical thinking is the ability to answer questions of analysis,
synthesis and evaluation (Duron et al., 2006:160; Paul, 1985:37; Paul & Elder, 2006:4) (cf.
2.3.3). Good critical thinking comprises interrelated core critical thinking skills and metacognitive
strategies (Facione, 2009:5, 6; Brookhart, 2010:40), critical thinking dispositions/behavioural
traits (Facione et al., 2000:61), intellectual traits (Cheung et al., 2002:505), and universal
intellectual standards of reasoning (Paul & Elder, 2006:10) applied to the elements of thought
(Paul & Elder, 2006:6) (cf. 2.2.2-2.2.5).
The next major finding related to the assessment of students’ critical thinking skills. Literature
revealed that there are no commercially available critical thinking subject-related tests to
estalblish the application of critical thinking in subject content. Therefore, the researcher
developed this own multiple choice Life Science tests with closed and open questions (Norris &
Ennis, 1989:101) (cf. 2.5.1).

Chapter 7: Summary, findings and recommendations 202
The literature study also highlighted various factors that influence the development of critical
thinking skills, which inhibit students’ critical thinking. These factors include political (Ijaiya et al.,
2010:383), educational (Ijaiya et al., 2010:384; Saavedra & Opfer, 2012:7; Snyder & Snyder,
2008:92), personal and behavioural (Pithers & Soden, 2000:241), cultural (Grosser & Lombard,
2008:1369) and language factors (Lun et al., 2010:606; Qing et al., 2010:4598) (cf. 2.6.1-2.6.5).
This research emphasised the importance of educational factors related to the choice of
teaching methods and strategies to enhance critical thinking, as the research was based on the
assumption that Thinking Maps as a teaching strategy could enhance the development of
critical thinking.
An exploration of the literature to identify a suitable teaching-learning framework that would
guide the design and implementation of the Thinking Maps intervention (cf. 2.7), alerted the
researcher to the importance of cognitivism (cf. 2.7.1.2) and cognitive constructivism (cf.
2.7.1.3) that focus on active involvement and creating meaning during learning (Ertmer &
Newby, 2013:55) (cf. 2.7.1.3) to stimulate critical thinking.
A variety of teaching methods and strategies were reviewed to identity a suitable method and
strategy which could be applied when implementing the Thinking Maps intervention programme
(cf. 2.7). Flowing from the literature, the facilitation of teaching and learning by means of
independent teaching methods and strategies seemingly would provide the necessary
opportunities for active learning and personal construction of meaning to enhance the
development of critical thinking through the use of Thinking Maps (cf. 2.7.2.3). A major finding
indicated that the development of good critical thinking skills requires teaching to become less
teacher-centred (direct) and to move towards a more student-centred (indirect/independent)
classroom practice (Kruger, 2002:109) (cf. 2.7.2.2, 2.7.2.3). Furthermore, literature revealed that
problem-based learning and inquiry-based learning involving the application of the scientific
method as independent teaching strategies, promote students’ self-directed learning skills
(Hmelo-Silver et al., 2007:100; Snyder & Snyder, 2008:93) and increase students’ critical
thinking skills and knowledge acquisition (Spence, 2001:2) (cf. 2.7.2.3). Problem-based
learning and the scientific method were part of the subject content taught to the Life Science
research participants.
Essential to the development and nurturing of critical thinking is the classroom climate created
by the teacher. Another issue teachers should be aware of is students’ initial resistance to
critical thinking (Duron et al., 2006:161). Teachers should create a learning environment
conducive to critical thinking (Snyder & Snyder, 2008:96) (cf. 2.7.3), characterised by
psychological safety, creativity and dialogue, with well-trained teachers using good questioning

Chapter 7: Summary, findings and recommendations 203
and technology to support learning (Saavedra & Opfer, 2012:16-21; Snyder & Snyder, 2008:91-
96) (cf. 2.7.3).
As this research employed a visual learning strategy, the literature study highlighted various
types of learning styles, which include visual, auditory, kinaesthetic and learning through
reflection (Gilakjani, 2012:105; Gilakjani & Ahmadi, 2011:469; Grosser, 2009:15; Pritchard,
2014:49) (cf. 3.3). As effective learning and thinking can be promoted through visual learning
(Pritchard, 2014:119-120) (cf. 3.2) the following types of visual learning were also explored:
Mind Maps, Concept Maps, Graphic Organisers, charts and diagrams (cf. 3.4). In comparison to
the aforementioned visual strategies, Thinking Maps are regarded as the only visual strategy
that scaffolds all the critical cognitive and metacognitive thinking skills and strategies to
transform information into knowledge (Hyerle, 2009:151). In addition, literature pointed out that
Thinking Maps provide the tools to combine learning with critical and creative meaning-making
(Costa, 2009:16; Hyerle 2009:157) (cf. 3.5).
Thinking Maps is a teaching and learning strategy which consists of a set of eight visual tools
designed to be used during instruction, to help students to develop critical thinking processes
and habits (Hyerle & Yeager, 2007:2), across the curriculum, in all grades and in any subject
(Hudson, 2013:9) (cf. 3.5.3). The Thinking Maps comprise Circle Maps, Bubble Maps, Double
Bubble Maps, Tree Maps, Brace Maps, Flow Maps, Multi-Flow Maps and Bridge Maps (Hyerle
& Yeager, 2007:24-66) (cf. 3.5.3). Thinking Maps are visual representations of cognitive thinking
skills such as describing, comparing, categorising, seeing cause-and-effect relationships;
analysing part-whole relationships and helping students see their own learning pathway or the
thought processes utilised to solve a problem (cf. 3.5.3). The Circle Map, the Tree Map and the
Multi-Flow Map provide opportunities for acquiring the skills on which the study focused, namely
to analyse, synthesise and evaluate (cf. 3.5.4-3.5.5). Thinking Maps also enable pathways for
thinking, drive and make learning meaningful, allow collaboration and provide students with
lifelong thinking tools (Hyerle, 2014:173-174; Hyerle & Yeager, 2007:8-16) (cf. 3.5.4).
The following section summarises the major findings that emanated from the empirical research.
7.4 FINDINGS FROM THE EMPIRICAL RESEARCH
7.4.1 Experimental group 1
The researcher derived the following findings from the empirical research in relation to
Experimental group 1.
The pre-test 1 results that focused on Grade 12 Life Science content revealed that the
critical thinking skills of the students were fragile and in need of development (�̅� = 6.828).

Chapter 7: Summary, findings and recommendations 204
The Thinking Maps intervention proved to be effective where participants had to apply
critical thinking skills related to Grade 12 Life Science content, as revealed by the
improvement in the post-test 1B result, a repetition of pre-test 1. In comparison to the pre-
test 1 results (�̅� = 6.828) , the post-test 1B results revealed an improvement, (�̅� = 8.897).
The critical thinking skills acquired during weeks 1 – 6 of the Thinking Maps intervention
were also applied effectively to the context of pre-test 2 that focused on problem-based
content and working according to the scientific method that were dealt with during weeks 1 –
6. The results noted for pre-test 2 (�̅� = 9.276) were better than the pre-test 1 and the post-
test 1B results.
The critical thinking skills acquired during weeks 1 – 6 of the Thinking Maps intervention
were probably not retained and enhanced in the absence of the intervention during weeks 7
– 12 as low results were noted for post-test 2 (�̅� = 6.345). In addition, post-test 2 only
focused on problem-based content that were dealt with during weeks 7-12, and appeared to
be difficult for the students to understand, and possibly hampered the application of critical
thinking skills. Normal lecturing that took place during weeks 7 – 12 also appeared not to
assist the students to apply critical thinking skills effectively to problem-based content, of
post-test 2.
Students appeared to be more effective at applying critical thinking in the context of post-
test 2B, a repetition of pre-test 2, that focused on a combination of problem-based content
and working according to the scientific method. The results obtained for post-test 2B (�̅� =
9.172) were better that the results obtained for post-test 1 B ( �̅� = 8.897), and although the
students had six weeks of lecturing only before writing post-test 2B, the critical thinking skills
that they acquired during weeks 1 - 6 of the Thinking Maps intervention, were probably
retained and effectively applied and transferred to the content related to problem-based
learning and the scientific method of post-test 2 B. It is interesting to note, that the students
were not effective at applying critical thinking to the problem-based content of post-test 2.
The researcher argues that the difficulty level of the content in post-test 2 might have
exceeded the difficulty level of pre-test 2/post-test 2B, and influenced the effectiveness with
which the students applied critical thinking in post-test 2.
7.4.2 Experimental group 2
The researcher derived the following findings from the empirical research in relation to
Experimental group 2.
Experimental group 2 performed better that Experimental group 1 at the onset of the study.
A comparison of the pre-test 1 results for the two groups revealed the following:
Experimental group 1 (�̅� = 6.828) and Experimental group 2 (�̅� = 8.444).

Chapter 7: Summary, findings and recommendations 205
After normal lecturing during weeks 1 – 6 of the first semester, the post-test 1 results of
Experimental group 2 (�̅� = 6.963) were lower that their pre-test 1 results. Normal lecturing
appeared to be ineffective for enhancing the critical thinking skills, as the students were
seemingly not effective at applying critical thinking to the content of post-test 1 that focused
on problem-based learning and working according to the scientific method.
With post-test 1 B, a repetition of pre-test 1 (�̅� = 8.444) that focused on Grade 12 Life
Science content, the students improved again, and achieved higher results than in pre-test s
namely (�̅� = 9.185). The researcher assumes that the six weeks of normal lecturing possibly
enabled the participants to be effective at applying critical thinking to the Grade 12 Life
Science content in post-test 1B.
The application of critical thinking again appeared to be more effective in the context of pre-
test 2 (�̅� = 8.815) after normal lecturing. Pre-test 2 focused on problem-based content and
working according to the scientific method that were the the focus of the lecturing during
weeks 1 – 6.
Post-test 2 (�̅� = 6.407) that was written after the six weeks Thinking Maps intervention,
revealed results that were lower than pre-test 1, post-test 1, post-test 1 B, pre-test 2 and
post-test 2B. Post-test 2 only focused on problem-based content that was dealt with during
weeks 7 – 12 when the students received the Thinking Maps intervention. The students
appeared to find the application of critical thinking difficult to this content, and apparently the
Thinking Maps intervention did not benefit the enhancement of the development of the
critical thinking skills
Post-test 2B that was a repetition of pre-test 2 again indicated that the students were
effective at the application of critical thinking in the context of content that combined
problem-based learning and working according to the scientific method. It could also be
argued that the Thinking Maps possibly had some effect on the effective application of
critical thinking in the context of post-test 2B as an increase was noted in the post-test 2B
result in comparison to the post-test 2 results.
In relation to Experimental group 1 and 2 (cf. Table 6.7, Table 6.8) (cf. 6.4.2), the findings
strengthened the case that a Thinking Maps intervention can enhance the development of
critical thinking skills, which is confirmed by Stedman and Adams (2012:9) (cf. 2.3.4), who state
that the purposive practise of higher order thinking skills contributes to students becoming
capable of improving their critical thinking skills. The findings also confirm the argument of
Hyerle and Yeager (2007:10) (cf. 3.5.5) that Thinking Maps drive the learning process and
make information and learning more meaningful. The researcher aimed to promote indirect and
independent learning with the use of the Thinking Maps. However, opportunities for social

Chapter 7: Summary, findings and recommendations 206
learning and emotional engagement during the use of the Thinking Maps were probably
underscored and could have contributed to a more effective development and retainment of
critical thinking skills (Browne & Freeman, 2000:304; Powell & Kalina, 2009:241) (cf. 2.7.1.3;
2.7.1.5). Although the findings that emanated from Experiment 1 seem to support the literature
where it is argued that direct, passive teaching does not promote the development of critical
thinking (Burden & Byrd, 2010:120; Kruger, 2002:109) (cf. 2.7.2.1), given the poor post-test 2
result, the improvement subsequently noted in the post-test 2B result could have been
attributed to the joint influence of Thinking Maps and normal lecturing.
The findings obtained for Experimental group 1 and 2 also confirm the viewpoint of Stedman
and Adams (2012:9) (cf. 2.3.4), that with purposive practise a Thinking Maps intervention can
enhance the development of critical thinking skills. In addition, the findings also support the
argument of Hyerle and Yeager (2007:8-16) (cf. 3.5.5) who state that Thinking Maps drive
students’ learning processes and progress, and improve the development of critical thinking
skills.
The researcher noticed the same trends among Experimental groups 1 and 2, namely that after
the Thinking Maps intervention (Experimental group 1) and normal lecturing (Experimental
group 2) respectively, an increase was noticed in pre-test 2, but not in post-test 1 that was
written one week prior to pre-test 2. Improvement for both groups was then again observed in
the post-test 1B results, which could imply that the Thinking Maps intervention (Experimental
group 1) and the normal lecturing (Experimental group 2) possibly contributed to the increase,
not forgetting that the content (Grade 12 Life Sciences) might have been easier for the students
and enabled them to apply critical thinking more effectively. It is also interesting to note that the
average for post-test 1 was lower than the averages achieved for pre-test 2 in both
experiments. The post-test 2B results were again higher than the pre-test 1 results for both
Experimental group 1 and 2, the researcher concludes that the Thinking Maps intervention and
normal lecturing could have collaboratively contributed to the enhancement of the participants’
critical thinking skills noted in the final post-test 2 B results. Although the researcher argues that
normal lecturing, as well as the use of Thinking Maps, possibly encouraged some openness
towards thinking, more opportunities should be created for emotional engagement with learning
and developing critical thinking skills (Browne & Freeman, 2000:304; Howie & Bagnall, 2015:
350; McGonigal, 2005:1) (cf. 2.7.1.4; 2.7.1.5).
The pre-test superiority of the control group in Experiment 1 diminished and was eliminated
during the fial post-test, post-test 2B. The repetition of pre-test 1 assisted the researcher to
assess the selection maturation of the participants (Lodico et al., 2010:246), namely if they were
maturing at different rates or at the same rates by observing the change from pre-test 1 to the

Chapter 7: Summary, findings and recommendations 207
repetition of pre-test 1 (post-test 1B). Normal maturation could have played a role in the case of
Experimental group 1 whose pre-test 1 result (�̅� = 6.828) improved to (�̅� = 8.897) with the
repetition of pre-test 1 (post-test 1B). On the other hand, Experimental group 2 entered the
research with a pre-test 1 result of (�̅� = 8.444), and only a slight improvement was noted in the
repetition of pre-test 1 (post-test 1B), (�̅� = 9.185). This result could imply that the two groups
were possibly maturing at different rates.
The research participants did not come from extreme low or high performance groups as
evidenced in the pre-test 1 results that could have contributed changes due to statistical
regression towards the mean that threatened the internal validity of the study (Lodico et al.,
2010:246).
Both Experimental group 1 and 2 did not obtain good results for post-test 2 either, that followed
the Thinking Maps intervention for Experimental group 2 and normal lecturing for Experimental
group 1. It therefore seems that the problem-based content in post-test 2 and the combination
of problem-based content and the scientific method addressed in post-test 1 posed problems to
the students, and were probably not well understood, or the difficulty level of post-test 2 and
post-test 1 need adjustment and be aligned to the difficulty level of pre-test 2 where the
students were more effective at applying critical thinking to problem-based content and content
related to the scientific method. In light of the findings for both experimental groups, the
researcher argues that if there might have been misconceptions about the problem-based
learning content, and content related to the scientific method, this could have influenced the
participants’ acquisition and application of critical thinking skills negatively (Illeris, 2015:30;
Pithers & Soden, 2000:246) (cf. 2.6.2).
In light of the findings for both experimental groups, the researcher argues that if there might
have been misconceptions about the problem-based learning content, and content related to
the scientific method, this could have influenced the participants’ acquisition of critical thinking
skills negatively (Illeris, 2015:30; Pithers & Soden, 2000:246) (cf. 2.6.2). In addition, the
participants could have had preconceptions about the subject, which, according to Snyder and
Snyder (2008:93), also inhibit critical thinking ability (cf. 2.6.3). Given the background of the
participants where English is not their home language, it could also be argued that their
academic language proficiency possibly inhibited their application of critical thinking (Lun et al.,
2010:606) (cf. 2.6.5). In addition, it appeared that the use of Thinking Maps to promote indirect
and independent learning that are regarded as effective for developing higher order thinking
(Spence, 2001:3; Rüütman & Kipper, 2011:110; VanGundy, 2005:169-340) (cf. 2.7.2.1; 2.7.2.2),
probably lacked emphasis on exploration and reasoning to more effectively enhance the critical
thinking skills on which the study focused.

Chapter 7: Summary, findings and recommendations 208
In addition, the findings possilby indicate that in the absence of the purposeful practising of
critical thinking skills, improvement noticed may not last (Stedman & Adams, 2012:9) (cf. 2.3.4).
The findings could also point to the absence of important critical thinking dispositions, such as
self-confidence in reasoning and systematic working ways that could have influenced the
effectiveness with which critical thinking was applied (Pithers & Soden, 2000:242) (cf. 2.6.3).
More guidance from an teacher might also be required to effectively apply critical thinking when
constructing Thinking Maps in the context of problem-based content and the scientific method,
where the application of critical thinking appeared to be problematic (VanGundy, 2005:169) (cf.
2.7.2.2). The absence of the purposeful use of open-procedural questioning during the Thinking
Maps intervention and the exclusive focus on the independent structuring of Thinking Maps
could possibly have contributed to the critical thinking skills being enhanced more effectively
(Green & Murris, 2014:127; McCollister & Sayler, 2010:43) (cf. 2.7.2.3).
The researcher concluded that the six weeks Thinking Maps intervention that purposively
focused on improving the practising of higher order thinking skills such as analysis, synthesis
and evaluation through the use of Circle Maps, Tree Maps and Multi-flow Maps, possibly
contributed to the improvement noted in the post-test 1B and pre-test 2 results of Experimental
group 1, and the post-test 2B results of Experimental group 2. This finding is in line with the
viewpoint of Pritchard (2014:119-120) (cf. 3.2) who states that critical thinking skills can be
intentionally taught through Thinking Maps as they promote the effective organisation of
information. However, this seemingly does not hold true in the context of some problem-based
content, and content related to the application of the scientific method, where apparent
misconceptions occurred and learning seemingly did not benefit from the use of Thinking Maps.
In addition, insightfulness to express thinking seemed to be absent (Hyerle, 2009:155) (cf.
3.4.1). The absence of the explicit teaching of thinking by means of Thinking Maps during the
six weeks of normal lecturing and the short implementation of the Thinking Maps intervention
support the arguments of Snyder and Snyder (2008:93) and Hyerle (2009:155) that time and
purposeful, continuous focus on enhancing critical thinking skills are important prerequisites for
sustainable success (cf. 2.6.2, 3.4.1). Costa (2009:16) (cf. 3.5) supports this argument by
indicating that thinking needs to be purposively cultivated and practised. As improved
performance was not noted throughout the implementation of the Thinking Maps intervention in
some of the test results, namely post-test 1 after the Thinking Maps intervention, and for
Experimental group 2 after the Thinking Maps intervention in post-test 2, Hyerle’s claim that
Thinking Maps provide explicit pathways for thinking that result in improved performance,
seems questionable (Hyerle, 2014:169:169) (cf. 3.5.5).
The sample means for the construction of the first Thinking Maps during week 1 and 7 for both
Experimental groups 1 and 2 respectively, revealed similar results. However, the sample

Chapter 7: Summary, findings and recommendations 209
means for Experimental group 1 clearly indicated that participants obtained improved results
for their Thinking Maps from week 2 (�̅� = 2.824) to week 6 (�̅� = 3.591) (cf. 6.6). The researcher
assumed that with time the students mastered the ability to make meaning of information,
organise the information and acquired a thought process through the use of the Thinking Maps.
Costa (2009:16) (cf. 3.5) confirms that Thinking Maps teach students how to think and reason.
The post-test 1B and pre-test 2 results of Experimental group 1 that followed the Thinking Maps
intervention possibly testify to the effectiveness of the Thinking Maps intervention for enhancing
the application of critical thinking skills. In addition, the researcher also cautiously argues, that
the skills acquired during the Thinking Maps intervention were possibly retained during the six
weeks of normal lecturing and enabled the participants to be effective at applying critical
thinking in the context of post-test 2 B.
A comparison of the sample means for the construction of Thinking Maps for Experimental
group 2 also revealed improved results from week 8 (�̅� = 4.242) to week 12 (�̅� = 4.435) (cf.
6.6). The researcher concluded that the students were able to link the information they were
learning to a critical thinking process and this gave them ownership of their learning. This is in
line with Hyerle (2014:169) (cf. 3.5.5) who states that Thinking Maps give pathways for thinking
and students acquire skills and strategies to enhance all elements of critical thinking. However,
the improved results in the construction of the Thinking Maps for Experimental group 2 did not
correspond with the findings noted for their post-test 2 test results that followed the Thinking
Maps intervention. However, their post-test 2B result provided some indication that the Thinking
Maps intervention could have assisted them in being more effective at the application of critical
thinking skills to the content of post-test 2B.
The findings that emanated from the open questions in the tests indicated that the reasoning of
the participants did not comply with the universal intellectual standards of reasoning, and lacked
clarity, logic, relevancy, breadth, depth and significance, and seemingly did not improve during
the exposure to the Thinking Maps intervention (cf. 6.7).
At the onset of the study, the poor (Experimental group 1) to average (Experimental group 2)
pre-test results of both experimental groups, seem to support the research findings of Grosser
and Lombard, (2008), Lombard and Grosser (2004) and Lombard and Grosser (2008), that
critical thinking is apparently not developed at school level. Based on the research findings the
students who took part in the study seemingly did not develop good habits of thought during the
intervention, but are rather still beginning thinkers who will have to improve their thinking with
regular practice (Paul & Elder, 2006:19). Based on the means out of 15 obtained for the various
tests, Experimental group 1 seemingly developed from a poor (�̅� = 6.828) to average (�̅� =

Chapter 7: Summary, findings and recommendations 210
9.172) ability in applying critical thinking, and Experimental group 2 seemingly remained at the
average ability level (�̅� = 8.593) with which they entered the study (�̅� = 8.444).
In the next section, the researcher endeavours to revisit the aim and objectives of the study in
order to ascertain whether they have been achieved.
7.5 FINDINGS IN RELATION TO THE AIM AND OBJECTIVES OF THE STUDY
The main aim of the study was to determine to what extent first year pre-service Life Science
teachers are effective at applying critical thinking skills to analyse, synthesise and evaluate
information, and if not, to establish how Thinking Maps can enhance the development of these
critical thinking skills among first year pre-service Life Science teachers (cf. 1.5).
In order to achieve the main aim, the following objectives were formulated.
Objective 1: To determine what the development of critical thinking skills entails by
means of a literature review.
This objective was achieved through a literature review that highlighted a number of aspects.
According to Crockett (2015:2), and Saavedra and Opfer (2012:5) (cf. 2.3.2), students need to
develop their critical thinking skills for success in the 21st century. This research predominately
made use of the viewpoints of Facione (2009:6), and Paul and Elder (2006:4) on how critical
thinking can develop. They state that “excellence in thought must be systematically cultivated”
to enable someone to explain what he/she thinks and to draw conclusions.
For the purpose of the research, the researcher supported the following conceptualisation of
critical thinking. In essence critical thinking is defined as being multidimensional in nature
(Facione, 2009:5-6), and comprises the following elements: cognitive skills and
metacognitive strategies, dispositions/attitudes/habits of mind/behavioural traits,
intellectual traits, and universal intellectual standards of reasoning that are applied to the
elements of thought (Ennis, 2001:44; Facione, 2009:5, 6; McPeck, 1981:20; Paul, 1993:58; Paul
& Elder, 2006:5) (cf. 2.2.1 - 2.2.6). All the mentioned dimensions can be developed through
purposive efforts to enhance the skills, strategies, dispositions, traits and universal intellectual
standards of reasoning (McCollister & Sayler, 2010:42; Pithers & Soden, 2000:243; Qing et al.,
2010:4598) (cf. 2.2.4).

Chapter 7: Summary, findings and recommendations 211
Objective 2: To determine which critical thinking skills are important for Life Sciences
by means of a literature review.
This objective was achieved through a literature study that indicated that the New CAPS
supports teaching and learning that nurture the cognitive and metacognitive processes and
intellectual dispositions that stand central to effective critical thinking (Department of Basic
Education, 2011:4, 5) (cf. Table 2.1) (cf. 2.3.1).
According to Table 2.2, developing critical thinking in Life Sciences involves the nurturing of
three core critical thinking skills in an integrated manner, namely analysis, synthesis and
evaluation (cf. 2.3.4). Analysis focuses on identifying relationships among information and
comparing information to identify similarities and differences. Synthesis involves breaking
information down into parts and joining different pieces of information together to constitute a
new whole. Evaluation involves judging the value of statements, beliefs, opinions, situations or
experiences; making claims about the worth of something and explaining reasons for or
motivating claims (Brookhart, 2010:40; Facione, 2009:5, 6) (cf. 2.2.2).
Objective 3: To explain what Thinking Maps are by means of a literature review.
This objective was achieved through a literature review that indicated that Thinking Maps are
cognitive tools to facilitate the development of specific thinking skills (Hyerle, 2009:151) (cf.
3.5.1). In addition, according to Hyerle and Yeager (2007:2) (cf. 3.5.2), Thinking Maps is a
teaching strategy that consists of a set of eight visual tools designed to help students develop
critical thinking processes and habits. Each map represents a specific cognitive process (cf.
3.5.3). In this research, the researcher concentrated on the following maps during the
intervention: the Circle Map, the Tree Map and the Multi-Flow Map, as these maps provide
opportunities for acquiring the skills to analyse, synthesise and evaluate in an integrated
manner (cf. 3.5.3). The Circle Map enables one to organise and reorganise knowledge, thus
applying the skills of analysis and synthesis (cf. Figure 1.1). The Tree Map focuses on the skills
to analyse and synthesise information by means of classification. The Multi-Flow Map is used
for analysing and evaluating cause and effect relationships (Hyerle & Yeager, 2007:24-60) (cf.
1.3.3).
Objective 4: To investigate how Thinking Maps can enhance the development of
critical thinking skills in Life Sciences by means of a literature review
This objective was achieved through a literature review. To the researcher’s best knowledge, no
completed research studies have been done which involve pre-service Life Science teachers
and establish the effects of Thinking Maps on enhancing the development of critical thinking
skills (cf. 1.1). According to Hyerle (2014:173-174) and Hyerle and Yeager (2007:8-16) (cf.

Chapter 7: Summary, findings and recommendations 212
3.5.4), Thinking Maps can enhance the development of critical thinking skills, because Thinking
Maps drive learning, give pathways for thinking about thinking, make learning meaningful,
require students to collaboratively access their knowledge and allow for accurate evidence of
student performance over time, and encourage depth and breadth in thought. Students who
consistently use the same visual pattern for a specific thought process soon have a visual
pattern for thinking and become independent learners (Hyerle & Yeager, 2007:8) (cf. 3.5).
Thinking Maps also help with the chunking of information and seeing connecions between
information. Processing information on a Thinking Map moves information into the long-term
memory and benefits the understanding of the information (Hyerle & Yeager, 2007:245) (cf.
3.5).
Objective 5: To determine how effective first year pre-service Life Science teachers are
in applying the critical thinking skills of analysing, synthesising and
evaluating by means of a pre-test.
This particular objective was achieved through an empirical study, in which the researcher
administered pre-test 1 at the onset of the study. Pre-test 1 indicated that all the student
participants appeared to have poor to average developed critical thinking skills that are still
fragile and in need of development. Experimental group 1 appeared to be less effective in the
application of critical thinking skills, (�̅� = 6.828), in comparison to Experimental group 2 who
obtained an average mean out of 15, (�̅� = 8.444) (cf. Table 6.7, Table 6.8). The students
appeared to be challenged thinkers who are faced with significant problems in their thinking
(Paul & Elder, 2006:19) (cf. 2.3.3).
Objective 6: To examine to what extent a Thinking Maps intervention can develop the
critical thinking skills of analysing, synthesising and evaluating among
first year pre-service Life Science teachers by means of a post-test and
the Thinking Maps constructed by the pre-service teachers during the
intervention.
This particular objective was achieved through an empirical study, in which the researcher
administered post-tests to the first year pre-service Life Science teachers, after their exposure
to the Thinking Maps intervention.
Experimental group 1: Experimental group 1 wrote post-test 1 and post-test 1 B (a repetition of
pre-test 1) after the completion of a Thinking Maps intervention. The post-test 1 result (�̅� =
6.724) was lower that their pre-test 1 result (�̅� = 6.828), but the post-test 1B result however
indicated an improvement (�̅� = 8.897) in comparison to the pre-test 1 and post-test 1 results.
The students appeared to be effective at applying critical thinking in post-test 1 B, after the

Chapter 7: Summary, findings and recommendations 213
Thinking Maps intervention. In addition, the pre-test 2 result that followed the Thinking Maps
intervention also indicated improvement, (�̅� = 9.276).
Experimental group 2: Experimental group 2 wrote post-test 2 and post-test 2B (a repetition of
pre-test 2) after the Thinking Maps intervention. The post-test 2 result (�̅� = 6.407) was lower
than the pre-test 2 result (�̅� = 8.815), which indicated that the application of critical thinking
possibly did not benefit from the Thinking Maps intervention. In post-test 2B however,
improvement was noted (�̅� = 8.593) in comparison to the post-test 2 result (�̅� = 6.407), but was
slightly higher than the pre-test 1 result (�̅� = 8.444). It could be argued that the Thinking Maps
intervention possibly enabled the students to apply the critical thinking skills more effectively to
the content of post-test 2B.
This objective as also achieved by assessing the Thinking Maps of the students which they
constructed during the Thinking Maps intervention, and played a secondary role in data
collection.
The Thinking Maps that were constructed by the students during the Thinking Maps intervention
revealed the following regarding the development of the students’ critical thinking skills.
Experimental group 1 obtained better and improved results from week 2 (�̅� = 2.824) to week 6
(�̅� = 3.591), and Experimental group 2 also obtained better and improved results from week 7
(�̅� = 3.167) to week 12 (�̅� = 4.435), with the best result noted during week 10 (�̅� = 4.657). The
improvement noted in the construction of the Thinking Maps was possibly reflected in the the
improved results that Experimental group 1 obtained for post-test 1B, pre-test 2 and post-test
2B. The improved results in the construction of the Thinking Maps for Experimental group 2
however did not align with the findings noted for post-test 2 that followed the Thinking Maps
intervention. Improved results were however noted for post-test 2B.
Objective 7: To examine to what extent there will be a difference in the pre- and post-
test results of an experimental and a control group regarding the
application of critical thinking skills after a Thinking Maps intervention,
and in the absence of a Thinking Maps intervention, by comparing the
pre-and post-test results of the different groups.
This particular objective was achieved through an empirical study, in which the researcher
administered pre- and post-tests to first year pre-service Life Science teachers to establish to
what extent a Thinking Maps intervention could enhance the development of their critical
thinking skills (cf. 6.4, 6.5). Differences between the two groups (cf. Table 6.9) that were
statistically significant, are reported below.

Chapter 7: Summary, findings and recommendations 214
The researcher observed a mean difference of -1.616 between the pre-test 1 results of
Experimental group 1 and Experimental group 2, with a statistically significant difference of p <
0.05 = 0.007, and a medium effect, d = 0.693, in practice. Based on the data, it appeared that
Experimental group 2 was more capable of applying critical thinking skills than Experimental
group 1 at the onset of the research.
It however appeared that the statistical significant differences between the various pre- and
post- test results did not occur between the groups, but rather within each of the experimental
groups. No statistical significant differences were noted between Experimental group 1 and 2 for
any of the comparisons between the different test occasions. It could therefore not be argued
that one of the group seemed to have benefitted more from the Thinking Maps intervention or
normal lecturing.
The statistical significant differences noted within each of the experimental groups are indicated
below.
Experimental group 1 (cf. Table 6.7)
A comparison between the means of pre-test 1 (�̅� = 6.828) and post-test 1B (�̅� = 8.897), a
repetition of pre-test 1, revealed a statistically significance difference of p < 0.05 = 0.000 with a
large effect in practice, d = 0.886. This implied that the post-test 1B results were statistically
significantly better than pre-test 1. The participants appeared to be able to transfer the
application of the critical thinking skills acquired during the Thinking Maps intervention to the
context of post-test 1B effectively.
The sample mean for post-test 1 (�̅� = 6.724) and for post-test 1B (�̅� = 8.897) highlights an
increase in the post-test 1B results. The researcher observed a mean difference of -2.172 and
a statistically significant difference of p < 0.05 = 0.000 with a large effect in practice, d = 0.930.
They students appeared to be more successful in applying the critical thinking skills to the
content of post-test 1 B, which was a repetition of pre-test 1 (Grade 12 Life Sciences), than in
post-test 1. The researcher concludes that the content of post-test 1 might have been more
difficult than the content of post-test 1 B, which possibly influenced the success with which the
participants applied critical thinking.
The sample mean for pre-test 2 (�̅� = 9.276) and post-test 2 (�̅� = 6.345) reflected a decrease in
average for post-test 2. A mean difference of 2.931 with a statistical significant difference of p <
0.05 = 0.000 with a large effect in practice, d = 1.066, was noted. The critical thinking skills
acquired during the Thinking Maps intervention were apparently not retained in the absence of
the Thinking Maps intervention before writing post-test 2, or the difficulty level of the content
hampered the application of the critical thinking skills.

Chapter 7: Summary, findings and recommendations 215
The sample mean for post-test 2B (�̅� = 9.172) and post-test 2 (�̅� = 6.345) highlighted an
increase of 19% in the post-test 2B results. The researcher observed a mean difference of
2.827 and a statistically significant difference of p < 0.05 = 0.000 with a large effect in practice,
d = 1.452. The participants were seemingly more effective at applying critical thinking skills to
problem-based content and content related to the scientific method in post-test 2B, than they
were with applying critical thinking skills to the problem-based content in post-test 2. Although
post-test 2B was written after six weeks of normal lecturing, the skills which the students
apparenty acquired during the six weeks Thinking Maps intervention, were possibly retained
and enabled them to be more effective at applying critical thinking to the information in post-test
2B, than what they were in post-test 2.
Experimental group 2 (cf. Table 6.8).
A comparison between the means of pre-test 1 (�̅� = 8.444) and post-test 1 (�̅� = 6.963) results
revealed a statistically significant difference of p < 0.05 = 0.002 with a medium effect in practice,
d = 0.665. The researcher argues that normal lecturing seemingly did not contribute to
enhancing the application of critical thinking skills in the context of post-test 1.
A comparison between the means of post-test 1 (�̅� = 6.963) and post-test 1B (�̅� = 9.185), a
repetition of pre-test 1 that focused on Grade 12 Life Science content, revealed a statistically
significant difference between post-test 1 and post-test 1B, p < 0.05 = 0.000, with a large effect
in practice, d = 0.931. Bearing in mind that post-test 1B was a repetition of pre-test 1, the
researcher concluded that the six weeks of normal lecturing possibly contributed to the
improvement in the students’ ability to apply critical thinking skills in post-test 1B (Grade 12 Life
Science content).
A comparison of the sample means for pre-test 2 (�̅� = 8.815) and post-test 2 (�̅� = 6.407)
indicated a statistically significant difference of p < 0.05 = 0.000, and a large effect in practice, d
> = 1.007. The Thinking Maps intervention that preceded the writing of post-test 2, seemingly
did not enable the participants to acquire critical thinking skills that they could effectively apply
to the problem-based content of post-test 2.
The sample mean for post-test 2B (�̅� = 8.593) and post-test 2 (�̅� = 6.407) highlighted an
average increase of 15% in results. The researcher observed a mean difference of 2.186 and a
statistically significant difference of p < 0.05 = 0.000 with a large effect in practice, d = 0.915.
The researcher observed that the participants were more effective at applying critical thinking
skills to problem-based content and content related to the scientific method in post-test 2B, than
they were with applying skills to the problem-based information in post-test 2, that maily focused
on problem-based content. It appears that skills which they acquired through the six weeks

Chapter 7: Summary, findings and recommendations 216
Thinking Maps intervention, enabled them to be more effective at applying critical thinking skills
in post-test 2B, than what they were in post-test 2.
Objective 8: To establish to what extent the Thinking Maps intervention contributed
to the development of the universal intellectual standards of reasoning
when applying critical thinking by means of open questions in the pre-
and post-tests.
This particular objective, although it did not directly influence the findings of the research, was
achieved through an empirical study. The researcher checked the open responses which the
participants provided to motivate their answers to the closed questions in the various tests to
gain initial insight into the participants ability to apply the universal intellectual standards of
reasoning, namely clarity, accuracy, precision, relevance, significance, depth and breadth (cf.
2.2.4).
The results clearly indicated that both of the experimental groups were not very successful in
applying the universal intellectual standards of reasoning before and after the Thinking Maps
intervention (cf. 6.7).
After having reflected on and motivated the extent to which the aim and objectives set out at the
onset of the study have been achieved, the researcher is of the opinion that he achieved the
aforementioned aim and objectives of the study.
In the following section, the researcher revisits the tentative hypotheses formulated at the onset
of the study in order to reject or accept them.
7.6 ACCEPTING OR REJECTING HYPOTHESES
H01: In the context of the study, the null hypothesis, which indicates that there will be no
statistically significant difference in the application of critical thinking skills between the pre- and
post-test results after completion of the Thinking Maps intervention, is rejected and accepted
for Experimental group 1 and Experimental group 2 (cf. Table 6.7, Table 6.8).
Statistical significant differences were noted between the means of the results obtained for
Experimental group 1, that supported the potential benefits of the Thinking Maps intervention,
and therefore the null hypothesis is rejected.
Rejection of null hypothesis: Experimental group 1:
A comparison between pre-test 1 (�̅� = 6.828) and post-test 1B (�̅� = 8.897) revealed a
statistical significant difference, p < 0.05 = 0.000. The researcher concludes that the

Chapter 7: Summary, findings and recommendations 217
participants effectively transferred the application of the critical thinking skills acquired
during the Thinking Maps intervention to the context of post-test 1B, and that the
improvement in the post-test 1B results was not due to chance. In addition, the critical
thinking skills acquired during the Thinking Maps intervention were probably retained.
Acceptance of null hypothesis: Experimental group 1
The null hypothesis is accepted in the context of Experimental group 1 as no statistical
significant differences were noted between the pre-test 1 and post-test 1 results after the
implementation of the Thinking Maps intervention.
A comparison between pre-test 1 (�̅� = 6.828) and post-test 1 (�̅� = 6.724) that was written
after the Thinking Maps intervention did not reveal a statistical significant difference, p >
0.05 = 0.840. The results of post-test 1 were lower than the results of pre-test 1.
Acceptance of null hypothesis: Experimental group 2
The null hypothesis is accepted for Experimental group 2, as the statistical significant
differences noted between pre-test 2 (�̅� = 8.815) and post-test 2 (�̅� = 6.407) after the
Thinking Maps intervention, p < 0.05 = 0.000, indiated that the pre-test 2 results before the
Thinking Maps intervention were better that the post-test two results after the Thinking Maps
intervention.
A comparison between pre-test 2 (�̅� = 8.815) and post-test 2B (�̅� = 8.593) that was written
after the Thinking Maps intervention did not indicate a statistical significant difference, p >
0.05 = 0.490. Lower results were noted for post-test 2B that was written after the Thinking
Maps intervention.
Ha1: In the context of the study, the alternative hypothesis, which indicates that there will be a
statistically significant difference in the application of critical thinking skills between the pre- and
post-test results of participants after completion of the Thinking Maps intervention, is accepted
as there were statistical differences noted between the means of the results obtained for
teaching with the Thinking Maps intervention (cf. 6.7) for Experimental group 1.
Acceptance of alternative hypothesis: Experimental group 1
A comparion between pre-test 1 (�̅� = 6.828) and post-test 1B (�̅� = 8.897), revealed a
statistical significant difference, p < 0.05 = 0.000. The researcher concludes that the
participants effectively transferred the application of the critical thinking skills acquired
during the Thinking Maps intervention to the context of post-test 1B, and that the
improvement in the post-test 1B results was not due to chance.

Chapter 7: Summary, findings and recommendations 218
H02: In the context of the study, the null hypothesis, which indicates that there will be no
statistically significant difference in the application of critical thinking skills between the pre- and
post-test results after normal classroom lecturing (in the absence of teaching with Thinking
Maps), is accepted as there were no statistical significant differences between the means of the
results obtained by Experimental group 1 and 2 (cf. Table 6.7, Table 6.8) after normal
classroom lecturing.
Acceptance of null hypothesis: Experimental group 1 (cf. Table 6.7)
The sample mean for pre-test 2 (�̅� = 9.276) and for post-test 2 (�̅� = 6.345) reflected a
decrease in average for post-test 2. A mean difference of 2.931 with a statistical significant
difference of p < 0.05 = 0.000, was noted. Normal lecturing that preceded post-test 2 did not
enhance the application of critical thinking skills, and the statistical significant difference
noted between pre-test 2 and post-test 2 indicated that the pre-test 2 results obtained before
normal lecturing was better that the post-test 2 results that followed normal lecturing.
Similarly, a comparison between the pre-test 2 (�̅� = 9.276) and the post-test 2B (�̅� =
9.172) results did not indicate a statistical significant difference, p > 0.05 = 0.837. The post-
test 2 B results that were obtained after the Thinking Maps intervention were lower than the
pre-test 2 results, and the application of critical thinking in post-test 2B apparently did not
benefit from normal lecturing.
Acceptance of null hypothesis: Experimental group 2
A comparison between pre-test 1 (�̅� = 8.444) and post-test 1 (�̅� = 6.963) revealed a
statistical significant difference, p < 0.05 = 0.002 for pre-test 1 that was written at the onset
of the study. The application of critical thinking skills therefore did not benefit from normal
lecturing that preceded post-test 1 B, and the null hypothesis is therefore accepted.
A comparison between pre-test 1 (�̅� = 8.444) and post-test 1 B (�̅� = 9.185) did not reveal
a statistical significant difference, p > 0.05 = 0.174. The application of critical thinking skills
did not benefit from normal lecturing that preceded post-test 1 B, and the null hypothesis is
therefore accepted.
Ha2: In the context of the study, the alternative hypothesis, which indicates that there will be a
statistically significant difference in the application of critical thinking skills between the pre- and
post-test results after normal classroom lecturing (in the absence of teaching with Thinking
Maps), is accepted as there were statistically significant differences between the means of the
results obtained for normal classroom lecturing with Experimental group 2 (cf. Table 6.8).

Chapter 7: Summary, findings and recommendations 219
Acceptance of alternative hypothesis: Experimental group 2
A comparison between the means of pre-test 1 (�̅� = 8.444) and post-test 1(�̅� = 6.963)
results revealed a statistically significance difference of p < 0.05 = 0.002. However, the pre-
test 1 results at the onset of the study, were better that the post-test 1 result after normal
lecturing. The researcher concluded that normal lecturing did not contribute to enhancing
the application of critical thinking skills in the context of post-test 1 that was written after
normal lecturing.
The following section addresses recommendations that flow from the literature study and the
empirical research.
7.7 RECOMMENDATIONS
In the light of the empirical and literature review findings, the researcher recommends the
following in order to enhance the development of the critical thinking skills analysis, synthesis
and evaluation among first year pre-service Life Science teachers through the use of Thinking
Maps.
7.7.1 Recommendations: Enhancing critical thinking
The specific problems revealed by the data pertaining to the pre-test and post-test results for
Experimental group 1 and 2 include:
A limited (Experimental group 1) to average ability (Experimental group 2) to apply critical
thinking skills to Gr. 12 Life Science subject content (Grosser & Lombard, 2008:1364) (cf.
6.4.2-6.4.3) at the onset of the study.
An inability to provide valid reasons to motivate answers in open-ended test questions that
complied with the universal intellectual standards of reasoning, namely clarity, accuracy,
precision, relevance, significance, depth and breadth (cf. 2.2.4, 6.7).
Both groups of students appeared to be functioning as challenged thinkers who need more
exposure to become practising thinkers (Paul & Elder, 2006:19) (cf. 2.3.3).
Specific recommendations to address these problems include:
Students need to acquire the ability to think critically and analytically, which includes
proficiency in comparing, contrasting, evaluating and synthesising information (Saavedra &
Opfer, 2012:5) (cf. 2.3.2). The researcher suggests that in addition to using Thinking Maps
as a teaching strategy, problem-based learning and working according to the scientific
method should also purposively be emphasised to practise the specific critical thinking skills
of analysis, synthesis and evaluation (Hmelo-Silver et al., 2007:100, Snyder & Snyder,

Chapter 7: Summary, findings and recommendations 220
2008:92) (cf. 2.7.2.3). Problem-based learning and working according to the scientific
method create opportunities for discovery of information, improves argumentation and
nurture open-mindedness that are essential for developing critical thinking skills and
dispositions (cf. 2.7.2.3). Problem-based learning and working according to the scientific
method are useful to nurture and apply cognitive and metacognitive critical thinking skills
and strategies such as interpretation, analysis, evaluation, making inferences, explanation
and self-regulation (Spence, 2001:3) (cf. 2.7.2.3). Although problem-based content and
working according to the scientific method were addressed during Thinking Maps
intervention, no explicit focus was placed on assisting learners to make meaning of the
subject content by using and practising the steps in problem-solving and the scientific
method (cf. Table 2.9, Figure 2.5), but rather to make meaning of the subject content by
using Thinking Maps. Combining the steps in problem-solving and the scientific method to
make meaning of information, in addition to the Thinking Maps to organise and synthesise
information, might have been more effective in developing the critical thinking skills, and
making meaning of subject content. Literature reveals that problem-based learning and
inquiry-based learning involve the application of the scientific method as an independent
teaching strategy, that promotes students’ self-directed learning skills (Hmelo-Silver et al.,
2007:100; Snyder & Snyder, 2008:93) and increases students’ critical thinking skills and
knowledge acquisition (Spence, 2001:2) (cf. 2.7.2.3).
Problem-based learning and working according to the scientific method, that was the focus
of the content that the researcher dealt with during the twelve week intervention, could
possibly have benefitted more if the Flow Map was included as a strategy to master the
understanding of the subject content. The Flow Map specifically addresses learning content
that involves sequencing and stages of events that characterise problem-based learning and
working according to the scientific method ( Hyerle & Yeager, 2007:54) (cf. 3.5.3.6).
If teachers purposively and persistently, in addition to the use of Thinking Maps, practise
higher order thinking skills for example dealing in class with real-world problems,
performing projects, investigations and inquiry-oriented experiments, and encouraging
open-ended class discussions, there is a good chance for the consequent development of
critical thinking skills (Spence, 2001:41-45; Stedman & Adams, 2012:9) (cf. 2.3.4; 2.7.1.5).
Another issue that could have hampered the students’ application of critical thinking is a
possible resistance to engage in critical thinking (Duron et al., 2006:161), due to the
content-driven nature of Life Sciences, and time constraints to complete the Life Science
curriculum. A stronger awareness should therefore be created regarding the merits of
teaching critical thinking skills in the classroom to achieve the Life Science objectives
(Saavedra & Opfer, 2012:7) (cf. 2.6.2). Furthermore, the importance of being trained to

Chapter 7: Summary, findings and recommendations 221
guide learners to apply critical thinking skills, should be emphasised (Lombard & Grosser,
2004:213; Walsh & Paul, 1986:49) (cf. 2.4 - 2.4.2).
Emphasis should also be placed on developing critical thinking dispositions/behavioural
traits and intellectual traits that qualify good thinking, for example developing a command
over the own thought process, confidence in reasoning, empathy, perseverance and
courage to formulate own rational viewpoints (Paul & Elder, 2006:16, 17) (cf. 2.2.3, 2.2.6).
Opportunities should also be created to assist students to master the skill to question
information, make inferences and consider the consequences of their reasoning (Paul &
Elder, 2006, 6, 7) (cf. 2.2.5).
7.7.2 Recommendations: Using Thinking Maps as a teaching strategy
The specific problems revealed by the data pertaining to the assessment of Thinking Maps
include:
The pre-service teachers seemingly need time to master the ability to make meaning of
problem-based subject content as well as content related to working according to the
scientific method with appropriate Thinking Maps, as evidenced in the poor post-test 1 and
post-test 2 results (cf. 6.6). The students appeared to be effective at applying critical thinking
skills in relation to the problem-based content and content that focused on working
according to the scientific method of post-test 2 B, and pre-test 2 as well as in the context of
post-test 1 B (pre-test 1) that focused on Grade 12 Life Science content.
The six week Thinking Maps intervention might have been too short to acquire and practise
the application of critical thinking skills so that they are retained successfully (cf. 6.4).
Specific recommendations include:
The literature supports the notion that memorisation of subject content and an teacher-
centered teaching approach do not promote or support the development of critical thinking
(Duron et al., 2006:96; Snyder & Snyder, 2008:91) (cf. 2.7.3), which was supported by the
findings of the research. Teachers therefore need to be trained to guide learners to apply
critical thinking skills (Lombard & Grosser, 2004:213; Walsh & Paul, 1986:49) (cf. 2.4)
through the choice of teaching strategies (cf. 2.7.2). The use of Thinking Maps as a teaching
strategy to foster independent learning (Arsal, 2015:141; Gebhart et al., 2012:4; Hofstein et
al., 2001:193) (cf. 2.7.2.3) that would benefit the development of critical thinking is
highlighted in the literature (Hudson, 2013:9) (cf. 3.5.2). The researcher however observed
that the application of Thinking Maps as a teaching strategy purely to promote independent
learning did not provide sufficient opportunities to acquire and develop critical thinking skills.

Chapter 7: Summary, findings and recommendations 222
The following suggestions could enhance the use of Thinking Maps for developing critical
thinking.
o Opportunities for emotional engagement during learning (Browne & Freeman,
2000:304) (cf. 2.7.1.5) that involves interaction, collaborative learning and meaning-
making among students (Powell & Kalina, 2009:241, 242; Slavin, 2003:61) (cf. 2.7.1.3)
as well as voicing and sharing opinions, should be created (Burden & Byrd, 2010:151;
Gawe, 2008:209; Howie & Bagnall, 2015; 350) (cf. 2.7.1.4; 2.7.2.4). Including
opportunities for emotional engagement during the construction of Thinking Maps might
be more beneficial to developing critical thinking skills than mainly emphasising students’
independent construction of Thinking Maps. The researcher therefore argues that a
combination of independent learning (cf. 2.7.1.3) and collaborative/interactive
learning (cf. 2.7.1.4) might be more effective to enhance the development of critical
thinking skills. The use of Thinking Maps as an independent strategy to learn, should be
combined with opportunities to engage in collaborative discovery and meaning-making
of information that is an important prerequisite for developing thinking (Vygotsky,
1978:84) (cf. 2.7.1.3).
o The lack of self-reflection opportunities during the Thinking Maps intervention possibly
constrained understanding of subject content. Opportunities to become aware of own
assumptions that could constrain understanding (Mezirow, 1991:167) (cf. 2.7.1.4) and
careful consideration of information before conclusions are made (Pritchard, 2014:48)
(cf. 3.3.5) need to be created in conjunction with the use of Thinking Maps to enhance
the development of critical thinking. For this purpose, the researcher acknowledges that
he should have placed more emphasis on the Frame of Refence around each of the
Thinking Maps (cf. 3.5.3.9) that promote self-reflection and metacognitive thinking
(explaining one’s own thought process).
o More attention should be given to constructive feedback to students about their Thinking
Maps to enhance the quality of student learning and allow teacher and students to
engage in dialogue to discuss criteria and standards to which the Thinking Maps need to
comply (Duron et al., 2006:161-163), as well as learn from one another in order to
extend and adapt their Thinking Maps.
o The findings of the study also made the researcher aware that the construction of
Thinking Maps should be accompanied by open questioning to effectively enhance the
development of critical thinking (Green & Murris, 2014:127; McCollister & Sayler,
2010:43)(cf. 2.7.2.3). In the context of the study, the participants were responsible for
making decisions in relation to the choice of Thinking Maps that would capture their
understanding of the content and the cognitive processes underlying the Life Science
content taught independently, thus placing students in control of their own learning and

Chapter 7: Summary, findings and recommendations 223
thinking (Rüütman & Kipper, 2011:110; VanGundy, 2005:69:169-130) (cf. 2.7.2.2). The
purposeful use of open questioning during the construction of the Thinking Maps could
have extended the participants’ opportunities to apply thinking skills, enhanced specific
thinking skills and addressed inquiry (McCollister & Sayler (2010:43), thus raising the
thinking level during teaching and learning (cf. 2.7.2.3). Clarifying questions could have
checked for the understanding of content and reasoning questions could have alerted
participants to the application of the universal intellectual standards of reasoning (clarity,
logic, significance, relevance, depth, breadth) that appeared not to be well developed.
(Green & Murris (2014:127) (cf. 2.7.2.3). In addition, reasoning questions, inquiry
questions, creative questions and evaluative questions could have benefited the
development of the specific skills on which the study focused, namely analysis,
synthesis and evaluation. The latter questions would have provided additional
opportunities for the participants to probe information, connecting different pieces of
information, exploring implications of decisions and summarising information, that could
have benefited the development of their critical thinking skills and the development of the
universal intellectual standards of reasoning (cf. Table 2.10).
o The researcher argues that the effectiveness of Thinking Maps for enhancing the
application of critical thinking in problem-based content and content related to the
scientific method, could be enhanced by including teamwork, communication and
sharing of ideas, and discussions about subject content during the construction of
Thinking Maps (Snyder & Snyder, 2008:96; Spence, 2001:4-5) (cf. 2.2.3, 2.7.2.3). The
researcher is of the opinion that a lack of dynamic relationships between the lecturer
(researcher) and students during the Thinking Maps intervention to engage in
discussions about the learning content to promote the development of important critical
thinking dispositions such as, open-mindedness, to evaluate different possible options to
solve a problem or answer a question, possibly hampered the effective development of
critical thinking skills (Brown & Brown, 2015:136); McGonigal, 2005:1) (cf. 2.7.1.4).
o The use of Thinking Maps alone as an independent teaching strategy, lacked focus on
inquiry, formulating questions, investigating, looking for alternatives and
exploring possible anwers, which are regarded as important activities for developing
critical thinking (Qing et al., 2010:4598) (cf. 2.7.2.3).
o As students have different learning style preferences, auditory, kinaesthetic and
reflective learning combined with visual learning, might be more effective in enhancing
the development of critical thinking skills (Gilakjani, 2012:1105; Gilakjani & Ahmadi,
2011:469) (cf. 3.3).

Chapter 7: Summary, findings and recommendations 224
o Universities and other Higher Education institutions need to introduce Thinking Maps
into their curricula to expose pre-service teachers to a valuable strategy that could
enhance the development of critical thinking.
Given the aforementioned recommendations that were based on the researcher’s evaluation
of the Thinking Maps intervention, the researcher formulates his view on a classroom
conducive to the development of critical thinking in Life Sciences.
7.7.3 Researcher’s view of classrooms conducive to the development of critical
thinking
After the twelve week Thinking Maps intervention, the researcher envisages to adapt the
intervention by including some of the strategies and activities mentioned in the previous section.
On completion of the intervention and considering the findings that were obtained with the
research, the researcher formulates the following view on teaching Life Sciences to enhance
the development of critical thinking. Figure 7.1 indicates the different stages through which the
teaching and learning in Life Scieces should progress.
Reject / not reject hypothesis
Decision about belief or action
Reject / not reject hypothesis
Decision about belief or action
Reject / not reject hypothesis
Decision about belief or action
Make valid conclusionsJudiciousDeductionInduction
Basic support:Background knowledgeEducator as facilitatorScientific method
Organise or reorganise knowledge Develop flow charts and diagrams Recognise patterns and trends Evaluate and categorise informationUse information in a new way Analyse and synthesise information/ dataRecognise relationships Hypothesise and identify variables Questioning / Problem-solving
Interaction with the world through:Intervention / Formal classes / Problem-based learning (experiments)
To adhere to 3 specific aims: Knowing the subject content Doing science or practical work and investigations Understanding the applications of Life Sciences
AnalyseSynthesise
Evaluate
AnalyseSynthesise
Evaluate
Figure 7.1: A visual representation of the development of critical thinking in Life
Sciences as conceptualised by the researcher

Chapter 7: Summary, findings and recommendations 225
The cognitive and metacognitive processes, as well as intellectual dispositions/traits and
universal intellectual standards of reasoning that are important for critical thinking (cf. 2.2.2 –
2.2.6), are embedded in the learning outcomes. According to the CAPS Life Sciences, Grades
10-12, there are three broad subject-specific aims which relate to the purpose of learning
science, namely knowing the subject content, doing science or practical work and investigations
and understanding the applications of Life Sciences. To achieve the aforementioned aims,
learners must possess well developed dispositons/behavioural traits and intellectual traits to be
able to apply cognitive and metacognitive critical thinking skills and strategies effectively. It is
clear from the aforementioned that the critical thinking skills to analyse, synthesize and
evaluate, as conceptualised by the researcher, are particularly important to achieve the
objectives of the curriculum.
Many students are still exposed to teachers who lecture using the “old school” teaching
strategies; students are passive and teachers use lectures and textbooks only to convey
knowledge and information (Duron et al., 2006:161). However, this teacher-centered
approach does not encourage or provide opportunities to enhance the development of
critical thinking skills (Duron et al., 2006:161).
Based on the preceding discussions in Chapter 2 of the direct, indirect, independent and
interactive teaching methods, the researcher is of the opinion that the following 5-step
model, Figure 2.7, proposed by Duron et al. (2006:161), could be implemented in
conjunction with the Thinking Maps as an approach to enhance the development of critical
thinking.

Chapter 7: Summary, findings and recommendations 226
Step 1: Determine learning objectives
Define behaviours students should exhibit
Target behaviours in higher order thinking
Step 5: Provide feedback and assessment
of learning
Provide feedback to students
Create opportunities for self-assessment
Utilise feedback to improve instruction
Step 2: Teach through questioning
Develop appropriate questions
Employ questioning techniques
Encourage interactive discussion
Step 4: Review, refine and improve
Monitor class activities
Collect feedback from students
Step 3: Practise before you assess
Choose activities that promote active learning
Utilise all components of active learning
Figure 7.2: Five-step model to move students towards critical thinking (Duron et al.,
2006:161)
o Step 1: Determine learning objectives: The learning objectives, activities and
assessments must include the development of thinking at appropriate levels of Bloom’s
taxonomy, namely remember, understand, apply, analyse, evaluate and create
(Anderson & Krathwohl, 2001:13).
o Step 2: Teach through questioning: Questions should be asked to stimulate
interaction between teacher and students; to challenge the students to defend their
ideas and understandings and engage students in collaborative work, whilst
constructing Thinking Maps.
o Step 3: Practise before you assess: Choose activities which involve the students in
thinking about what they are doing (self-reflection). Activities should include experiential
and inquiry-based learning as well as opportunities to reflect. For this purpose, the
Frame of Reference drawn around each Thinking Map could be utilized effectively (cf.
3.5.3.9).
o Step 4: Review, refine and improve: Teachers should use teaching strategies that will
develop critical thinking skills, such as Thinking Maps.
o Step 5: Provide feedback and assessment of learning: Feedback will enhance the
quality of student learning and allow teacher and students to engage in dialogue to
discuss criteria and standards (Duron et al., 2006:161-163).

Chapter 7: Summary, findings and recommendations 227
Linked to the 5-Step Model above, the researcher suggests the following to create classrooms
conducive to the development of critical thinking:
Teachers should be well trained and informed about what good critical thinking skills are and
acquire skills to develop critical thinking skills, strategies, dispositions/traits and universal
intellectual standards of reasoning within students. An teacher is an agent of change.
Teachers therefore need to be guided on how to infuse critical thinking into their daily
lessons; be able to model good critical thinking practices and create activities that promote
the use of critical thinking among their learners (Uksw, 2014:161).
Creating a learning environment where students should feel comfortable and are allowed
time to think through an answer rather than simply having an answer. Teachers should
make use of peer coaching strategies and participative learning (cf. Tables 2.9 & 2.10) to
engage students in active learning and critical thinking opportunities (Browne & Freeman,
2000:302; Snyder & Snyder, 2008:96) (cf. 2.7.2.4).
Using effective teaching methods, strategies (cf. Tables 2.6 - 2.11): The literature supports
the notion that memorisation of subject content does not promote or support critical thinking
(Snyder & Snyder, 2008:91). However, some content, such as definitions, morphological
and physiological information, must be memorised to enable the student to develop a strong
knowledge base which is regarded as a prerequisite for being effective at applying critical
thinking skills. The subject Life Sciences lends itself to inquiry-based teaching which guides
students through the critical thinking process by using the scientific method and problem-
based learning (Arsal, 2015:241) (cf. 2.7.2.3). Combining the use of Thinking Maps with
explicit emphasis on working according to a problem-based approach and according to the
scientific method could advance the application of critical thinking skills through engaging
students in inquiry, explaining and reasoning (Hmelo-Silver et al., 2007:100; Hofstein et al.,
2001:193; Snyder & Snyder, 2008:93) (cf. 2.7.2.3).
Teachers should ask good questions to stimulate students’ critical thinking (Green & Murris,
2014:127) (cf. 2.7.2.3). According to Saavedra and Opfer (2012:19), questioning strategies
should be integrated in class discussions to engage students actively in the learning
process. Duron et al. (2006:162) and Paul and Elder (2006:4) argue that good questions will
accelerate a student’s movement into critical thinking.
o The use of critical questioning (why, what and how), during instruction or in assessment
tasks, requires students to evaluate the clarity and accuracy as well as the depth and
breadth of their thinking (intellectual standards). By questioning their thought processes,
students begin thinking about their thinking (metacognitive) skills (Snyder & Snyder,
2008:91).
o Wait for student responses; critical thinking requires time and patience.

Chapter 7: Summary, findings and recommendations 228
o Use review questions (tests and assignments) to enhance students’ processing skills
and explanations of correct answers by modelling the critical thinking process
(Saavedra & Opfer, 2012:19).
o Assessment should emphasise critical thinking rather than facts (Snyder & Snyder,
2008:95).
Using dialogue in education: Involvement in dialogue requires the application of a number of
critical thinking skills and strategies, dispositions/behavioural traits such as humility,
empathy, integrity, perseverance, open-mindedness, and the universal intellectual standards
of reasononing such as being logical and analytical (cf. 2.2). Green (2014:147) states that
being involved in dialogue is not simply a discussion about issues, but also involves making
sense of different perspectives and producing new insights.
Exploiting technology to support learning: Technology provides students with new ways to
develop their problem-solving, critical thinking and communication skills. In the process they
address misunderstandings, reflect on their thinking and collaborate with their peers
(Saavedra & Opfer, 2012:16).
Fostering students’ creativity: Teachers can enhance students’ creativity, the cognitive
ability to produce new and valuable ideas (Saavedra & Opfer, 2012:17).
Teachers must be reflective practitioners: Being reflective indicates teachers’ abilities to
adjust to change, to overcome barriers of learning and teaching in the classroom and to
reflect on quality of learning and teaching in the classroom (Saavedra & Opfer, 2012:21).
Classrooms that are alive with critical thinking will encourage commitment to think critically and
frequent self-reflection to gain new knowledge and encounter new perspectives (Browne &
Freeman, 2000:307).
7.8 LIMITATIONS OF THE STUDY
A number of limitations were identified while conducting the research, which can be identified as
the following:
The study was not a true experiment, rather a quasi-experiment with a limited number of
participants, and could not link all possible variables to cause and effect.
The researcher focused only on the critical thinking abilities of first year pre-service Life
Science teachers. This limits the study because deeper insights could have been gained
from studying the entire Life Science group.

Chapter 7: Summary, findings and recommendations 229
Participants from only one university, who were conveniently sampled due to time and
logistical constraints were used, and therefore the findings cannot be generalised to pre-
service teachers of other universities.
Focus was placed on only one subject, namely Life Sciences. This limits the generalisability
of the findings with regard to other subjects when it comes to the enhancement of critical
thinking skills.
The researcher primarily focused only on a selection of three core critical thinking skills,
namely analysis, synthesis and evaluation. This limits the study because deeper insights
could have been gained by studying all the elements of critical thinking skills, namely the
cognitive and metacognitive critical thinking skills, dispositions/intellectual traits and the
universal intellectual standards of reasoning in their interrelatedness in depth.
As the researcher aimed to promote indirect and independent learning with the use of the
Thinking Maps, opportunities for social learning and emotional engagement during learning
were probably underscored that could have enhanced the development and retainment of
critical thinking skills (Browne & Freeman, 2000:304; Powell & Kalina, 2009:241) (cf. 2.7.1.3;
2.7.1.5).
Finer trends in the data could have been disovered with cross comparisons between all the
different tests and the various test items that addressed analysis, synthesis and evaluation
respectively, and to establish the effect of the intervention over time, by using an Analysis of
Variance test.
Including a qualitative dimension in the study, for example interviews with the participants
after the Thinking Maps intervention, could have provided richer data to explain the
participants experiences with the Thinking Maps.
The two Thinking Maps interventions were not exactly the same in terms of the subject
topics on which they focused, and the researcher acknowledges that this could have
influenced the research findings.
7.9 SUGGESTIONS FOR FURTHER RESEARCH
The following suggestions are made for further research studies in the field of enhancing critical
thinking skills.
A true experimental study with larger groups that combine quantitative and qualitative
research could be attempted to obtain conclusive evidence about the effect of Thinking
Maps as teaching strategy to enhance critical thinking.

Chapter 7: Summary, findings and recommendations 230
A similar study can be done using the entire Life Science group (year 1 to 4) at the same
university to investigate any differences picked up in the different year-groups in relation to
the development of critical thinking. Such a study could focus on addressing deficient or
fragile critical thinking skills at first year level throughout the four years of study, and the
development of the skills could then be continuously assessed to determine the retention
and transferability of the critical thinking skills.
Conducting experiments that discover finer trends in the data by doing cross comparisons
between all the different tests as well as between the various test items that addressed
analysis, synthesis and evaluation respectively, to establish the effect of the intervention
over time, and to establish which of the critical thinking skills probably benefitted the most
or the least form involvement in a Thinking Maps intervention, by using an Analysis of
Variance test.
The same study can be done using participants from other universities to employ
comparative studies in relation to the development of critical thinking skills with pre-service
teachers in different contexts.
The same study can be carried out in different subjects as well, in order to understand the
status quo and the development of critical thinking skills across a range of subjects.
The same study can be carried out to explore the status quo in relation to all the interrelated
elements of critical thinking and how the multi-dimensional nature of critical thinking can be
enhanced.
Standardised, subject-related tests in Life Sciences can be designed to establish the
development of critical thinking in various school phases and grades.
The effectiveness of Thinking Maps for different types of subject content needs to be
explored in greater depth.
The extent to which normal lecturing and Thinking Maps contribute to the development of
critical thinking also needs to be explored in greater depth.
7.10 CONTRIBUTIONS OF THE STUDY
Many international and national studies have been done regarding the nurturing of critical
thinking skills in several subjects, except Life Sciences. This exploratory pilot study highlights
possible problem areas in relation to enhancing critical thinking skills in first year pre-service Life
Science teachers, and therefore paves the way for further research in this field, with the aim of
developing a programme that could lead to the enhancing of critical thinking skills in Life
Sciences.

Chapter 7: Summary, findings and recommendations 231
The present research contributes to theory regarding the nurturing of critical thinking at pre-
service teacher level, and revealed the latent benefits and pitfalls when using Thinking Maps as
a teaching strategy for enhancing the development of critical thinking. A lack of dynamic
relationships between lecturer (researcher) and students during the Thinking Maps interventions
to engage in discussions about the learning content that promote open-mindedness to evaluate
different possible options to solve a problem or answer a question, possibly hampered the
effective development of critical thinking skills (Brown & Brown, 2015:136); McGonigal, 2005:1)
(cf. 2.7.1.4) by exclusively emphasising the independent nature of the learning process.
The findings of the present study extends the findings of research studies that focused on the
merits of Thinking Maps to pre-service teachers. Previous research mainly emphasises with
young learners, that reported the ineffectiveness of Thinking Maps to enhace achievement
among young learners (Hudson, 2013; Sunseri, 2011; Russell, 2010) (cf. 1.1).
The participants in this research possibly benefitted as they might have acquired critical
thinking skills with Thinking Maps, to enable them to start analysing, synthesising and
evaluating information more effectively, which could improve their academic performance.
Furthermore, the findings could be utilised to make recommendations regarding the
improvement of the teaching practices of Life Science teachers in order to enhance critical
thinking skills in school classrooms.
7.11 CONCLUSIONS
Critical thinking is of the utmost importance in education as it has been identified as an
important objective in the CAPS. In addition, critical thinking is not only an academic skills but a
survival skill needed in the 21st century to make one’s way through life and cope with
challenges.
Life Science teaching needs to emphasise the importance of critical thinking to help learners
acquire cognitive and metacognitive skills and strategies, dispositions/intellectual traits and the
standards of reasoning to cope in a changing 21st century environment. Therefore, the teaching
of Life Sciences should implement teaching strategies, like Thinking Maps, to promote critical
thinking that could benefit academic performance and equip students with life skills.
This research creates an awareness of possible limitations embedded in the teacher-training
programmes that need to be addressed. What the findings revealed is that the most important
challenge facing education at all levels of teaching appears to be an intellectual and practical
one. Firstly, strategies have to be identified to improve the quality of pre-service teachers’
critical thinking. Secondly, pre-service teachers have to be supplied with a repertoire of

Chapter 7: Summary, findings and recommendations 232
strategies to advance the development of the minds of learners whom they will teach. Placing a
stronger focus on enhancing critical thinking at pre-service teacher level could assist pre-service
teachers themselves to become effective critical thinkers who are empowered to promote skilled
reasoning and intellectual self-discipline as well as self-reflective, self-directed, self-monitored
and self-corrective thinking among school learners.

Bibliography 233
BIBLIOGRAPHY4
Akyüz, H.I., & Samsa, S. 2009. Critical thinking skills of pre-service teachers in the blended
learning environment. International journal of human sciences, 6(2):538-550.
Allamnakhrah, A. 2013. Learning critical thinking in Saudi Arabia: Student perceptions of
secondary pre-service teacher education programme. Journal of education and learning,
2(1):97-210.
Anderson, J. 2010. Succeeding with habits of mind: Developing infusing and sustaining the
Habits of Mind for a more thoughtful classroom. Australia: Hawker Brownlow Education.
Anderson, L.W. & Krathwohl, D.R. 2001. A taxonomy for learning, teaching, and assessing: a
revision of Bloom's taxonomy of educational objectives. New York: Longmans.
Arencibia, D.E. 2013. The effects of merging technology and thinking skills in the classroom.
Minneapolis, Minnesota: Walden University. (Dissertation – PhD).
Arends, R.I. 2004. Learning to teach. 8th ed. Boston: McGraw-Hill.
Arsal, Z. 2015. The effects of microteaching on the critical thinking dispositions of pre-service
Teachers. Australian journal of teacher education, 40(3):140-150.
Ausubel, D. 1978. In defence of advanced organizers: A reply to the critics. Review of
educational research, 48:151-257.
Avia, N. 2010. Grade 10 Life Science teachers understanding the development of critical
thinking skills in selected schools in Namibia. Grahamstown: Rhodes University.
(Dissertation – MEd).
Beyer, B.K. 1983. Common sense about teaching thinking skills. Educational leadership,
41(3):44-49.
Beyer, B.K. 1995. Critical thinking. Bloomington, Indiana: Phi Delta Kappa Educational
Foundation.
4 The researcher reflects all the sources utilised during the completion of the study, and not only the quoted sources. For this purpose he compiled a bibliography and not a reference list.

Bibliography 234
Borich, G.D. 2003. Observation skills for effective teaching. 4th ed. New York: Merrill Prentice
Hall.
Borich, G.D. 2007. Effective teaching methods: research-based practices. 6th ed. Upper
Saddle River, N.J.: Pearson/Merrill Prentice Hall.
Botha, J. 2004. A design for the development of critical and creative thinking skills during the
presentation of a web-based course. Johannesburg: University of Johannesburg. (Thesis
– DEd).
Boucher, M.J. 2010. Maps: Developing critical thinking skills for deaf students in a social
studies. San Diego: University of California. (Thesis – master of Arts).
Brace, I. 2008. Questionnaire design: How to plan, structure and write survey material for
effective market research. 2nd ed. London: Kogan Page.
Brookfield, S.D. 2012. Teaching for critical thinking: tools and techniques to help students
question their assumptions. San Francisco: Jossey-Bass.
Brookhart, S.M. 2010. How to assess higher-order thinking skills in your classroom.
Alexandria, Virginia: ASCD
Brown, P.P., & Brown, C.S. 2015. Transformative learning theory in Gerontology:
Nontraditional students. Educational gerontology, 41:136-148.
Brown, S. 2008. Measures of shape. Skewness and kurtosis.
http://www/tcs.edu/instruct/sbrown/stat/shape.htm Date of access: 12 July 2016.
Browne, M.N., & Freeman, K. 2000. Distinguishing features of critical thinking classrooms.
Teaching in higher education, 5(3):301-309.
Burbach, M.E., Matkin, G.S., & Fritz, S.M. 2010. Teaching critical thinking in an introductory
leadership course utilizing active learning strategies: a confirmatory study.
http://findarticles.com/p/articles/mi_m0FCR/is_3_38/ai_n6245168 Date of access: 13
February 2014.
Burden, P.R., & Byrd, D.M. 2010. Methods for effective teaching: Meeting the needs of all
learners. 5th edition. Boston: Pearson Education.
Buzan, T. 2014. The ultimate book of mind maps. https://archive.org/details/pdfy-
MEuyCwZKGT3fqH56 Date of access: 27 July 2015.

Bibliography 235
Cheung, C-K., Rudowicz, E., Kwan, A.S.F., & Yue, X.D. 2002. Assessing university student’s
general and specific critical thinking. College student journal, 36(4):504-522.
Cohen, L., Manion, L., & Morrison, K. 2007. Research methods in education. 6th ed. New
York: Routledge.
Costa, A.L. 2009. Describing the habits of mind. (In Costa, A.L. & Kallick, B., eds. Learning
and leading with habits of mind: 16 essential characteristics for success. Victoria, Australia:
Hawker Brownlow Education. p. 15-41).
Costa, A.L., & Kallick, B. 2014. Habits of mind. (In Green, L., ed Schools as thinking
communities.
Craighead, W.E. & Nemeroff, C.B., eds. 2002. The Corsini’s Encylopedia of psychology and
behaviourism science. 3rd ed. New York: John Wiley and Sons.
Creswell, J.W. 2009. Research design: qualitative, quantitative, and mixed methods
approaches. 3rd ed. Los Angeles, Calif.: Sage.
Creswell, J.W. 2012. Educational research. Planning, conducting and evaluating quantitative
and qualitative research. 4th ed. Boston: Pearson.
Crockett, R. 2015. The critical 21st century skills every student needs and why.
http://globaldigitalcitizen.org/critical21stcenturyskillseverystudentneeds Date of access: 23
June 2015.
Daniel, M. F. 2001. Philosophical dialogue among peers: A study of manifestations of critical
thinking in preservice teachers. Advances in health sciences education, 6:49-67.
De Corte, E. 2011. Constructive, self-regulated, situated and collaborative learning: An
Approach for the acquisition of adaptive competence. Journal of education, 192(2/3):33-47.
Delport, C.S.L., & Roestenburg, W.J.H. 2011. Quantitative data collection methods:
Questionnaires, checklists, structured observations, and structured interview schedules. (In
De Vos, A.S., Strydom, H., Fouché, C.B., & Delport, C.S.L., eds. Research at grass roots.
For the social sciences and human service professions. 4th ed. Pretoria: Van Schaik.
p.171-205).
Department of Basic Education see South Africa. Department of Basic Education.
Bibliography 236
De Vos, A.S., & Strydom, H. 2011. Intervention research. (In De Vos, A.S., Strydom, H.,
Fouché, C.B., & Delport, C.S.L., eds. Research at grass roots. For the social sciences and
human service professions. 4th ed. Pretoria: Van Schaik. p.473-490).
Dewey, J. 1933. How we think. New York: Prometheus Books.
Dewey, J., & Bento, J. 2009. Activating children’s thinking skills (ACTS): The effects of an
infusion approach to teaching thinking in primary schools. British journal of educational
psychology, 79(2):329-351.
Dostál, J. 2015. Theory of Problem Solving. Procedia - Social and Behavioral Science,s 174:
2798–2805. doi:10.1016/j.sbspro.2015.01.970.
Duminy, P.A., Dreyer, H.J., & Steyn, P.D.G. 1990. Education for the student teacher. Cape
Town: Maskew Miller. Longman, (Pty) Ltd, SA.
Du Plessis, E. 2013. Introduction to Caps: Curriculum & Assessment Policy Statement.
Pretoria: Unisa.
Du Preez, L., & Van Wyk, A. 2006. Bios: An integrated approach to Life Sciences teaching and
learning. Pretoria: Mediakor.
Duron, R., Limbach, B., & Waugh, W. 2006. Critical thinking framework for any discipline.
International journal of teaching and learning in higher education, 17(2):160-166.
Elder, L. 2005. Critical thinking as the key to the Learning College: A professional development
model. New directions for community colleges, 130:39-48.
Ennis, R.H. 1993. Critical thinking assessment. Theory and practice, 32(3):179-186.
Ennis, R.H. 1985. A logical basis for measuring critical thinking skills. Educational leadership,
43(2):44-48.
Ennis, R.H. 2001. Goals for a critical thinking curriculum and assessment. (In Costa, A., ed.
Developing minds. 3rd ed. Alexandria, VA: ASCA publications. p. 44-66).
Ennis, R.H. 2002. A logical basis for measuring critical thinking skills. Educational leadership:
43(2):44-48.
Ertmer, P.A., & Newby, T.J. 2013. Behaviorism, Cognitivism, Constructivism: Comparing
critical features from an instructional design perspective. Performance improvement
quarterly, 26(2):43-71.

Bibliography 237
Epstein, R.L., & Kernberger, C. 2006. The pocket guide to critical thinking. 3rd ed. Belmont:
Thomson and Wadsworth.
Facione, P. A. 2000. The disposition toward critical thinking: Its character, measurement, and
relationship to critical thinking skill. Informal logic, 20(1):61-84.
Facione, P. A. 2009. Critical thinking: What it is and why it counts. 2009 Update. 1-24.
Facione, P.A. 2011. Think critically. Boston, MA: Prentice Hall.
Facione, P.A., Facione, N.C., & Giancarlo, C.A. 2000. The disposition toward critical thinking:
Its character, measurement, and relationship to critical thinking skill. Informal logic,
20(1):61-84.
Figueras, A.R. 2013. Graphical/advance organizers. http://www.slideshare.net/arfigueras/
graphic-organizers-26697966?related=2 Date of access: 27 July 2015.
Fouché, C.B., Delport, C.S.L., & De Vos, A.S. 2011. (In De Vos, A.S., Strydom, H., Fouché,
C.B., & Delport, C.S.L., eds. Research at grass roots. For the social sciences and human
service professions. 4th ed. Pretoria: Van Schaik. p. 142-158).
Fradkin, L., Zernov, V., Crisan, C., & Lerman, S. 2010. First year engineering mathematics: The
London South Bank University experience. MSOR Connections, 10(1):35-39.
http://www.mathstore.ac.uk/?q=node/1319 Date of access: 27 July 2015.
Fraser, M.W., Rishman, J.M., Galinsky, M.J., & Day, S.H. 2009. Intervention research. New
York: Oxford University Press.
Fraser, M.W., & Galinsky, M.J. 2010. Steps in intervention research: Designing and developing
social programs. Research on social work practice, 20(5):459-466.
Frenton, N. 2015. Using the ‘Top 20 Principles’. Psychology teacher network.
http://www.apa.org.ed/precollege/ptn/2015/09/top-20-principles.aspx Date of access: 4
February 2017.
Galyam, N. 2004. Teaching thinking skills in science to learners with special needs: an
evaluation study. Stellenbosch: Stellenbosch University. (Dissertation – PhD).
Gardner, H. 2010. Five Minds for the future (In Bellanca, J., & Brandt, R., eds. 21st century
skills: Rethinking how students learn. Bloomington, IN: Solution Tree Press. p. 9-31).

Bibliography 238
Gawe, N. 2008. Cooperative learning. (In Jacobs, M., Vakalisa, N & Gawe, N., eds.
Teaching-learning dynamics. A participative approach for OBE. 3rd ed. Sandton:
Heinemann (Pty) Ltd. p. 208-227).
Gebhart, A., Preethlall, P., Pillay, S., & Farham, B. 2012. Grade 11: Study and master Life
Sciences. Cape Town: Cambridge University Press.
Gilakjani, A.P. 2012. Visual, auditory, kinaesthetic styles and their impacts on English
language teaching. Journal of studies in education, 2(1):104-113.
Gilakjani, A.P., & Ahmadi, S.M. 2011. The effect of visual, auditory, and kinaesthetic learning
styles on language teaching: International conference on social science and humanity,
Singapore: IACSIT Press.
Gilmartin, K., & Rex, K. 1999. Working with charts, graphs and tables. Margate, Kent: Thanet
Press Ltd.
Good, T.L., & Brophy, J.E. 1994. Looking in classrooms. 6th ed. New York: Harper & Row.
Google images for mind maps, concept maps, brain maps. https://www.google.co.za/
search?q=mind+maps,+concept+maps,+brain+maps,+graphical+organizers,+charts+and+d
iagrams&espv=2&biw=1846&bih=1019&tbm=isch&tbo=u&source=univ&sa=X&ved=0CB0Q
sARqFQoTCOCd_e78- Date of access: 27 July 2015.
Google images for charts and diagrams. https://www.google.co.za/search?q=Charts+and+
diagrams&es_sm=93&biw=1846&bih=1019&tbm=isch&tbo=u&source=univ&sa=X&ved=0C
BsQsARqFQoTCLHnm8C6_cYCFWZB2wodUI4DjA Date of access: 28 July 2015.
Goyak, A.M. 2009. The effects of cooperative learning techniques on perceived classroom
environment and critical thinking skills. Liberty University. (Dissertation – PhD).
Green, L. 2014. Enquiry based teaching and learning. Short learning programme in cognitive
education. Vanderbijlpark: North West University, Vaal Triangle Campus.
Green, L., & Murris, K. 2014. Philosophy for children. (In Green, L., ed. Schools as thinking
communities. Pretoria: Van Schaik. p. 121-140).
Greeno, J.G., Collins, A.M., & Resnick, L.B. 1993. Cognition and learning.
https://www.google.co.za/webhp?sourceid=chrome-instant&ion=1&espv=2&ie=UTF-8#q=
cognitive%20learning%20theory%20pdf. Date of access: 26 May 2015.

Bibliography 239
Grosser, M.M. 1999. Die rol van koöperatiewe leer in die ondersteuning van ‘n
denkontwikkelingsbenadering. Vanderbijlpark: Vista Universiteit. (Proefskrif – PhD).
Grosser, M.M. 2007. Effective teaching: Linking teaching to learning functions. South African
journal of education, 27(1):37-52.
Grosser, M.M. 2009. Teaching and learning styles. Vanderbiljpark: NWU, Vaal Triangle
Campus. (Study guide EDCC 312).
Grosser, M.M. 2014. Cooperative learning. (In Green, L., ed. Schools as thinking
communities. Pretoria: Van Schaik. p. 225-244).
Grosser, M.M. 2016a. Development of the critical thinker (In Du Toit, E.R., Louw, L.P. &
Jacobs,L., eds. Help I’m a student teacher. Skills development for teaching practice. 2nd.
edition. Pretoria: Van Schaik. p. 67-90).
Grosser, M.M., ed. 2016b. (in press). Developing critical thinking: A multi-dimensional approach
for the context of South Africa. New York: Nova Science Publishers.
Grosser, M.M., & Lombard, B.J.J. 2008. The relationship between culture and the development
of critical thinking abilities of prospective teachers. Teaching and teacher education,
24:1363-1375.
GSI Teaching & Resource Center. 2015a. http://gsi.berkeley.edu/gsi-guide-contents/learning-
theory-research/social-constructivism/ Date of access: 29 June 2015.
GSI Teaching & Resource Center. 2015b. http://gsi.berkeley.edu/gsi-guide-contents/learning-
theory-research/cognitive-constructivism/ Date of access: 29 June 2015.
Gunter, M.A., Estes, T.H., & Mintz, S.L. 2010. Instruction: a models approach. Boston, Mass.:
Pearson Education.
Gunter, M.A., Estes, T.H., & Schwab, J. 2003. Instruction: A models approach. 4th ed.
Boston: Pearson.
Hager, P., & Kaye, M. 1992. Critical thinking in teacher education: A process-oriented research
agenda. Australian journal of teacher education, 17(2):26-33.
Halpern, D.F. 2007. The nature and nurture of critical thinking (In Sternberg, R., Roediger, H.L.
& Halpern, D.F., eds. Critical thinking psychology. Cambridge University Press. p. 1-12).

Bibliography 240
Hashim, O. R. 2010. Investigation of the teaching of critical and creative thinking in Malaysia.
Jurnal pendidikan Islam, 1:39-56.
Hmelo-Silver, C.E. 2004. Problem-Based Learning: What and How Do Learners
Learn? Educational psychology review, 16(3):235. doi:10.1023/B:EDPR.00000
34022.16470.f3.
Hmelo-Silver, C.E., Duncan, R.G., & Chinn, C.A. 2007. Scaffolding and achievement in
problem-based and inquiry learning: A response to Kiscchner, Sweller and Clark (2006).
Educational psychologist, 42(2):99-107.
Hofstein, A., Nahum, T.L., & Shore, R. 2001. Assessment of the learning environment of
inquiry-type laboratories in high school chemistry. Learning environment research, 4:193-
207.
Howie, P., & Bagnall, R. 2015. A critical comparison of transformation and deep approach
theories of learning. International journal of lifelong education, 34(3):348-365.
Hudson, D. 2013. The effect of thinking maps on fifth grade science achievement.
Minneapolis, Minnesota: Walden University. (Dissertation – PhD).
Hyerle, D. 2009. Thinking maps: Visual tools for activating habits of mind. (In Costa, A.L., &
Kallick, B., eds. Learning and leading with habits of mind: 16 essential characteristics for
success. Victoria, Australia: Hawker Brownlow Education. p. 149-176).
Hyerle, D. 2014. Thinking maps. (In Green, L., ed. Schools as thinking communities.
Pretoria: Van Schaik. p. 161-178).
Hyerle, D. & Yeager, C. 2007. Thinking maps: A language for learning. North Carolina:
Thinking Maps Incorporate.
Ijaiya, N.Y.S., Alabi, A.T., & Fasasi, Y.A. 2010. Teacher education in Africa and critical thinking
skills: Need and strategies. The social sciences, 5(4):380-390.
Illeris, K. 2015. The development of a comprehensive and coherent theory of learning.
European journal of education, 50(1):29-40.
Jacobs, M. 2008. Curriculum design. (In Jacobs, M., Vakalisa, N & Gawe, N., eds. Teaching-
learning dynamics. A participative approach for OBE. 3rd ed. Sandton: Heinemann (Pty)
Ltd. p. 34-87).

Bibliography 241
Jacobson, L. 2014. From Habits of Mind to critical thinking: A study of student learning
behaviors in a university great books general education course. Philadelphia: Temple
University. (Dissertation – PhD).
Jansen, J.D. 2010. The language of research (In Maree, K., ed. First steps in research.
Pretoria: Van Schaik Publishers. p. 15-22).
Jarvis, P. 2015. Learning expertise in practise: Implications for learning theory. Studies in the
education of adults, 47(1):81-94.
Jensen, W. 1997. Defining the critical theory. The application of the critical theory,
http://www127.pair.com/critical/d-ct.htm Date of access: 14 September 2015.
Johanson, J. 2010. Cultivating critical thinking: An interview with Stephan Brookfield. Journal
of developmental education, 33(3):27.
Jordaan, E.J. 1998. Design and development of a computer program for the development of
critical thinking skills in high school pupils. Pretoria: UP. (Dissertation – MEd).
Kolb, D.A. 1983. Experiential learning: Experience as the source of learning and development.
Englewood Cliffs, New York: Prentice-Hall.
Killen, R. 2007. Teaching strategies for outcomes-based education. 2nd ed. Cape Town:
Juta.
Kramer, D. 2006. OBE Teaching Toolbox. OBE strategies, tools and techniques for
implementing Curriculum 2005. Florida Hills: Vivlia Publishers & Booksellers (Pty) Ltd.
Kruger, D.J. 2003. Integrating quantitative and qualitative methods in community
research. The community psychologist, 36:18-19.
Kruger, N. 2002. About the heart of the teacher. (In Kruger, N. & Adams, H. eds., Psychology
for teaching and learning. What teachers need to know. Sandton: Heineman (Pty) Ltd. p.
107-124).
Leech, N.L., Barrett, K.C., & Morgan, G.A. 2005. SPSS for intermediate statistics: use and
interpretation. 2 nd ed. London:Routledge.
Leedy, P.D., & Ormrod, J.E. 2013. Practical research: planning and design. 10th ed. Upper
Saddle River, N.J.: Prentice Hall.

Bibliography 242
Lodico, M.G., Spaulding, D.T., & Voegtle, K.H. 2010. Methods in research. From theory to
practice. 2nd ed. San Francisco: Jossey Bass.
Lombard, B.J.J., & Grosser, M.M. 2004. Critical thinking abilities among prospective teachers:
ideals versus realities. South African journal of education, 24(3):212-216.
Lombard, K., & Grosser, M. 2008. Are the ideals of OBE failing us, or are we failing the ideals
of OBE? South African journal of education, 28:561-579.
Lun, V. M., Fischer, R., & Ward, C. 2010. Exploring cultural differences in critical thinking: is it
about my thinking style of the language I speak? Learning and individual differences,
20:604-616.
MacFarlane, R. 2007. Romantic originality. Original copy: plagiarism and originality in
nineteenth-century literature. Oxford: Oxford University Press.
Mahaye, T., & Jacobs, M. 2008. Teaching methods. (In Jacobs, M., Vakalisa, N & Gawe, N.,
eds. Teaching-learning dynamics. A participative approach for OBE. 3rd edition. Sandton:
Heinemann (Pty) Ltd. p. 174-207).
Maree, K., & Pietersen, J. 2010a. The quantitative research process. (In Maree, K., ed. First
steps in research. Pretoria: Van Schaik Publishers. p. 145-153).
Maree, K., & Pietersen, J. 2010b. Sampling. (2009:6-7) Marlow, L. & Inman, D. 1992. Higher
order thinking skills: Teachers’ perceptions. Education, 112(4):538-541.
McCollister, K., & Sayler, M.F. 2010. Lift the ceiling: Increase rigor with critical thinking skills.
Gifted child today, 33(1):41-47.
McGonigal, K. 2005. Teaching for transformation: From learning theory to teaching strategies.
Newsletter on teaching, 14(2). The center for teaching and learning, Stanford University.
McMillan, J.H., & Schumacher, S. 2006. Research in education: Evidence- based inquiry. 6th
ed. Boston: Pearson.
McMillan, J.H., & Schumacher, S. 2008. Research in education: A conceptual introduction.
Boston, Mass.: Allyn & Bacon.
McNeeley, R.S. 2007. Theories of learning: Learning theories in the early childhood classroom
environment. http://web.utk.edu/-rmcneele/classroom Date of access: 28 May 2015.

Bibliography 243
McPeck, J.E. 1981. Critical thinking and education. Great Britain: Martin Robertson &
Company Ltd.
Mezirow, J. 1991. Transformative dimensions of adult learning. San Francisco: Jossey Bass.
Miri, B., Ben-Chaim, D., & Zoller, U. 2007. Purposely teaching for the promotion of higher-
order thinking skills: A case of critical thinking. Research in science education, 37(4):353-
369.
Monteith, J. 2002. How to become an effective learner. (In Kruger, N. & Adams, H. eds.,
Psychology for teaching and learning. What teachers need to know. Sandton: Heineman
(Pty) Ltd. p. 91-104).
Monyai, R.B. 2006. Teaching strategies. (In Nieman, M.M. & Monyai, R.B. 2006. The teacher
as mediator of learning. Pretoria: Van Schaik. p. 104-135).
Moore, T. 2011. Critical thinking: Seven definitions in search of a concept. Studies in higher
education, 38(4):506-522.
Mouton, J. 2009. Monitoring and evaluating educational interventions. Paper presentation at
the national conference of the International Association for Cognitive Education in Southern
Africa. 11-13 February 2008. Royal Cape Yacht Club, Cape Town, South Africa.
Naidoo, R.R. 2011. The teaching of high order thinking skills at grade 9 level in natural science
in blacktownship schools in the Western Cape. Cape Town: Cape Peninsula University of
Technology. (Dissertation – MEd).
Niehuis, A.E., Manstead, A.S.R., & Spears, R. 2001. Multiple motives and persuasive
communication: creative elaboration as a result of impression motivation and accuracy
motivation. Personality and social psychology bulletin, 27:118-132.
Nieman, M.M., & Pienaar, R.B. 2010. The role of the learning process, learning styles and
learner differences in the mediation of learning (In Nieman, M.M. & Monyai, R.B., eds. The
teacher as mediator of learning. 4th ed. Pretoria: Van Schaik Publishers. p.72-103).
Nieuwenhuis, J. 2010. Introduction qualitative research (In Maree, K., ed. First steps in
research. Pretoria: Van Schaik Publishers. p. 46-68).
Nisbett, R.E., & Norenzayan, A. 2002. Culture and cognition. (In Medin, D.L., ed. 2002.
Steven’s handbook of experimental psychology. 3rd ed. New York: Wiley. p. 3-28).

Bibliography 244
Norris, S.P. 1985. Synthesis of research on critical thinking. Educational leadership, 42(8):40-
45.
Norris, S.P., & Ennis, R.H. 1989. Evaluating critical thinking. Pacific Grove, CA: Critical
Thinking Press Software.
Novak, J.D. 2006. The theory underlying Concept Maps and how to construct them.
http://cmap.ihmc.us/docs/theory-of-concept-maps Date of access: 27 July 2015.
O'Neill, R. 2006. The advantages and disadvantages of qualitative and quantitative research
methods. http://archive.learnhigher.ac.uk/analysethis/main/quantitative1.html Date of
access: 6 August 2015.
Osana, H.P., & Seymour, J.R. 2004. Critical thinking in preservice teachers: a rubric for
evaluating argumentation and statistical reasoning. Educational research and evaluation:
An international journal on theory and practice, 10(4):473-498.
Paul, R.W. 1985. Bloom’s taxonomy and critical thinking intervention. Educational leadership,
42(8):36-39.
Paul, R.W. 1988. Critical thinking in the classroom. Teaching K-8, 18:49-51.
Paul, R. W. 1993. Critical thinking: What every person needs to survive in a rapidly changing
world. Santa Rosa, CA: Foundation for Critical Thinking.
Paul, R.W., & Elder, L. 2006. The miniature guide to critical thinking concepts and tools.
California: The Foundation for Critical Thinking.
Paul, R.W., & Elder, L. 2007. Critical thinking competency standards: Standards, principles,
performance indicators, and outcomes with a critical thinking master rubric. Foundations
for critical thinking.
Perkins, D., Tishman, S., Ritchhart, R., Donis, K., & Andrade, A. 2000. Intelligence in the wild:
A dispositional view if intellectual traits. Educational psychology review, 12(3):269-293.
Philpott, J. 2009. Captivating your class. Effective teaching skills. New York: Continuum
International Publishing group.
Piaget, J. 1969. Psychology of intelligence. Totowa, New York: Littlefield, Adams and
Company.

Bibliography 245
Pietersen, J., & Maree, K. 2010a. Statistical analysis I: Descriptive statistics. (In Maree, K., ed.
2010. First steps in research. Pretoria: Van Schaik Publishers. p. 183-196).
Pietersen, J., & Maree, K. 2010b. Statistical analysis II: Descriptive statistics. (In Maree, K.,
ed. 2010. First steps in research. Pretoria: Van Schaik Publishers. p. 198-213).
Pietersen, J., & Maree, K. 2010c. Standardisation of a questionnaire. (In Maree, K., ed. 2010.
First steps in research. Pretoria: Van Schaik Publishers. p. 215-223).
Pietersen, J., & Maree, K. 2010d. Overview of statistical techniques. (In Maree, K., ed. 2010.
First steps in research. Pretoria: Van Schaik Publishers. p. 225-254).
Pikulsky, J.J., & Chard, D.J. 2005. Fluency: bridge between decoding and reading
comprehension. Reading teacher, 58(6):510-519.
Pink, D.H. 2006. A whole new mind: Why right-brainers will rule the future. New
York:Riverhead Books.
Pintrich, P.R., & Schunk, D.H. 2002. Motivation in education. Theory, research and
applications. 2nd ed. Upper Saddle River, NJ: Merrill Prentice Hall.
Pithers, R. T., & Soden, R. 2000. Critical thinking in education: A review. Educational
research, 42(3):237-249.
Potterton, M. 2008. A curriculum that failed. The teacher: 15.
Powell, K.C., & Kalina, C.J. 2009. Cognitive and social constructivism: Developing tools for an
effective classroom. Education. https://www.questia.com/library/journal/1G1-216181184/
cognitive-and-social-constructivism-developing-tools Date of access: 30 June 2015.
Pritchard, A. 2014. Ways of learning. Learning theories and learning styles in the classroom.
3rd ed. London: David Fulton Publishers.
Profetto-McGrath, J. 2003. The relationship of critical thinking skills and critical thinking
dispositions of baccalaureate nursing students. Journal of advanced nursing, 43(6):569-
577.
Qing, Z., Jing, G., & Yan, W. 2010. Promoting preservice teachers’ critical thinking skills by
inquiry-based chemical experiment. Procedia – social and behavioural sciences,
2(2):4597-4603.

Bibliography 246
Ricketts, J.C., Irani, T., & Jones, L. 2003. The effect of instructional delivery methods on the
critical thinking disposition of distance students and traditional on-campus students. Journal
of Southern agricultural education research, 53(1):59-71.
Rubin, A., & Babbie, E.R. 2009. Essential research methods for social work. Belmont, CA:
Brooks/Cole Cengage Learning.
Russell, L. 2010. The impact of thinking maps on the reading comprehension of elementary
school for students. Texas: A & M University-Commerce. (Dissertation – PhD).
Rüütmann, T., & Kipper, H. 2011. Teaching strategies for direct and indirect instruction in
teaching Engineering. Paper presented at the 14th International Conference on interactive
collaborative learning, Piešt’any, Slovakia, 21-23 September 2001. www.icl-
conference.org/ dl/proceedings/2011/.../contribution122_a.pdf Date of access: 15 July
2015.
Saavedra, A.R., & Opfer, V.D. 2012. Teaching and learning 21st century skills: Lessons from
the Learning Sciences. Asia society, Partnership for global learning: Rand corporation. p.
2-35.
Schmidt, H.G., Rotgans, J.I. & Yew, E.H.J. 2011. The process of problem-based learning:
What works and why. Medical rducation, 45(8):792–806. doi:10.1111/j.1365-
2923.2011.04035.x. PMID 21752076
Scholtz, Z., Braund, M., Hodgen, M., Koopman, R., & Lubben, F. 2008. South African
teachers‘ ability to argue: the emergence of inclusive argumentation. International journal
of inclusive argumentation, 28(1):21-34.
Schunk, D.H. 2000. Coming to terms with motivation constructs: Contemporary educational
psychology, 25:116–119. http://www.idealibrary.com Date of access: 29 June 2015.
Şeker, H., & Kömür, S. 2008. The relationship between critical thinking skills and in-class
questioning behaviours of English language teaching students. European journal of
teacher education, 31(4):389-402.
Sessoms, D. 2008. Interactive instruction: creating interactive learning environments through
tomorrow’s teachers. International journal of technology in teaching and learning, 4(2):86-
96.
Slater, P. 1995. A critical analysis of mathematics learning by identifying learning and thinking
skills implicit in standard 8 algebra. Cape Town: UWC. (Dissertation - M Ed).

Bibliography 247
Slavin, R.E. 2003. Educational psychology. Theory and practise. 7th ed. NY: Pearson
Education. p.254-289.
Snyder, L.G., & Snyder, M.J. 2008. Teaching critical thinking and problem solving skills. The
Delta Pi Epsilon journal, L(2):90-99.
South Africa. Department of Basic Education. 2011. National Curriculum Statement.
Curriculum and Assessment Policy Statement: Further Education and Training Phase, Life
Sciences, Grades 10-12. Pretoria: Department of Basic Education.
South African Institute for Distance Education (SAIDE). 2013. Getting Practical. A guide to
teaching and learning. 3rd edition. Cape Town: Oxford University Press. p. 313-348.
Spence, L.D. 2001. Problem-based learning: Lead to learn, learn to lead.
https://www.studygs.net/pblhandbook.pdf Date of access:15 July 2015.
Stedman, N.L.P., & Adams, B.L. 2012. Identifying faculty’s knowledge of critical thinking
concepts and perceptions of critical thinking instruction in higher education. NACTA jounal,
p.9-14.
Steffens, K. 2015. Competences, learning theories and MOOC’s: Recent developments in
lifelong learning. European journal of education, 50(1):41-59.
Sternberg, R.J. 1987. Teaching critical thinking: Eight ways to fail before you begin. Phi Delta
Kappa International, 68:456-459.
Sterrenberg, L. 2009. Life Sciences Grade 10: The answer series. 1st edition. Cape Town:
The Answer.
Sterrenberg, L. & Fouché, H. 2013. Life Sciences Grade 11: The answer series. Cape Town:
The Answer.
Sterrenberg, L., Fouché, H., & Elliot, G. 2014. Life Sciences Grade 12: The answer series.
Cape Town: The Answer.
Strydom, H. 2011a. Ethical aspects of research in the social sciences and human professions.
(In De Vos, A.S., Strydom, H., Fouché, C.B., & Delport, C.S.L., eds. Research at grass
roots. For the social sciences and human service professions. 4th ed. Pretoria: Van
Schaik. p.113-130).

Bibliography 248
Strydom, H. 2011b. Sampling in the quantitative paradigm. (In De Vos, A.S., Strydom, H.,
Fouché, C.B., & Delport, C.S.L., eds. Research at grass roots. For the social sciences and
human service professions. 4th ed. Pretoria: Van Schaik. p.222-235).
Strydom, H. 2011c. The pilot study in the quantitative paradigm. (In De Vos, A.S., Strydom,
H., Fouché, C.B., & Delport, C.S.L., eds. Research at grass roots. For the social sciences
and human service professions. 4th ed. Pretoria: Van Schaik. p.236-247).
Sunseri, A. 2011. The impact of thinking maps on elementary students expository texts. San
Francisco: San Francisco State University. (Dissertation – PhD).
Thyer, B.A. 2012. Quasi-experimental research designs. New York: Oxford University Press.
Tsui, L. 2002. Fostering critical thinking through effective pedagogy: Evidence from four
institutional case studies. The journal of higher education, 73(6):740-763.
Uksw, S. 2014. Developing critical thinking skills through school teacher training ‘Training and
development personnel’ model and their determinants of success. International journal of
information and education technology, 4(2):161-166.
Umar, I.N., & Ahmad, N.H. 2010. Trainee teachers’ critical thinking in an online discussion
forum: A content analysis. Malaysian journal of learning and instruction, 7: 75-91.
UNESCO. 2004. The office of learning and teaching. http://www.unesco.org/new/en
/education/themes/strengthening-education-systems/quality-framework/technical-notes/
influential-theories-of-learning/ Date of access: 27 May 2015.
VanGundy, A.B. 2005. 101 Activities for teaching creativity and problem solving. San
Francisco: Pfeiffer.
Vieira, R.M, Tenreiro-Vieira, C., & Martins, I.P. 2011. Critical thinking: Conceptual clarification
and its importance in science education. Science education international, 22(1):43-54.
Vygotsky, L. 1978. Mind in society: The development of higher psychological processes.
Cambridge: Harvard University Press.
Vygotsky, L. 1986. Concrete human psychology. Psikhologiya, 14(1):51-64.
Wagner, T. 2008. The global achievement gap: Why even our best schools don’t teach the
new survival skills our children need, and what we can do about it. New York: Basic Books.

Bibliography 249
Wallace, B., Ross, A., Davies, J.B., & Anderson, T., eds. 2007. The mind, the body and the
world: psychology after cognitivism. London: Imprint Academic.
Walsh, D., & Paul, R. 1986. The goal of critical thinking: From educational ideal to educational
reality. Washington, DC: American Federation of Teachers.
Warburton, E. C. 2008. Changes in dance teachers’ beliefs about critical thinking activities.
Journal of education and human development, 2(1):1-13.
Watkins, C. 2002. Effective learning. National school improvement network, 17:1-20.
Yang, Y-TC. 2012. Cultivating critical thinkers: Exploring transfer of learning from pre-service
teacher training to classroom practice. Teaching and teacher education, 28:1116-1130.
Zascavage, V. 2010. Critical thinking skills and the intervention specialist. Journal of border
education research, 8:71-80.
.

Appendix A: Ethical clearance 250
APPENDIX A
ETHICAL CLEARANCE

Appendix A: Ethical clearance 251

Appendix B: Letters of consent 252
APPENDIX B
LETTERS OF CONSENT

Appendix B: Letters of consent 253
Mr. Francois Minnie
Lecturer: Life Science
School of Educational Sciences
North-West University, Vaal Triangle Campus
Vanderbijlpark
1900
REQUEST FOR REGISTER PERIOD DURING 2016
In response to your request to schedule a register period for LIFE 111 students on the time table
during 2016 to assist you with administrative issues related to your research project for your
Masters Degree, I wish to inform you that I grant you permission to make the necessary
arrangements with Mrs Lecretia Redelinghuys who is responsible for the time table
arrangements of the BEd-students.
Yours sincerely
Dr. E. Küng
BEd Programme Manager
LETTER OF CONSENT TO ADMINISTRATIVE PERIOD
PO Box 1174, Vanderbijlpark
South Africa, 1900
Tel: (016) 910-3111
Fax: (016) 910-3116
Web: http://www.nwu.ac.za
Tel: (016) 016 910 3063
Fax (016) 016 901 3078
EMail [email protected]
1 September 2015
PO Box 1174, Vanderbijlpark
South Africa, 1900
Tel: (016) 910-3111
Fax: (016) 910-3116
Web: http://www.nwu.ac.za
Tel: (016) 016 910 3063
Fax (016) 016 901 3078
EMail [email protected]
2 November 2015

Appendix B: Letters of consent 254
LEARNERS (ENGLISH)

Appendix B: Letters of consent 255
1.
HHREC Stamp
PARTICIPANT INFORMATION LEAFLET AND CONSENT FORM FOR FIRST YEAR LIFE SCIENCE
B.ED. STUDENTS
TITLE OF THE RESEARCH PROJECT: The impact of Thinking Maps to enhance the
development of critical thinking skills among first year pre-service Life Science teachers
REFERENCE NUMBERS:
PRINCIPAL INVESTIGATOR/RESEARCHER: Mr Francois Minnie
ADDRESS: SCHOOL OF EDUCATION SCIENCES, NORTH-WEST UNIVERSITY,
HENDRICK VAN ECK BOULEVARD 100, VANDERBIJLPARK
CONTACT NUMBER: 016 910 3074/084 549 2583
You are invited to take part in a research project that forms part of my (the researcher’s) study
for a Master’s degree in Education. Please take some time to read the information presented here,
which will explain the details of this project. Please ask the independent person, Ms. Daphne
Strauss, who will explain the research to you, any questions about any part of this project that
you do not fully understand. It is very important that you are fully satisfied and that you clearly
understand what this research is about and how you could be involved. In addition, your
participation is entirely voluntary and you are free to decline participation. If you say no, this
will not affect you negatively in any way whatsoever. You are also free to withdraw from the
study at any point, even if you do agree to take part. You may also ask me to delete
information/data about you that I collected. If you are younger than 18 , your parents/guardians
will also give consent that you may take part in the study. You need to know that even if your
parents/guardians give consent for you to take part, you still have the choice to decide if you
want to take part in the research or not.
This study has been approved by the Humanities and Health Research Ethics Committee
(HHREC) of the Faculty of Humanities of the North-West University (NWU.............) and
will be conducted according to the ethical guidelines and principles of the international
PO Box 1174, Vanderbijlpark
South Africa, 1900
Web: http://www.nwu.ac.za
DATE: 3 September 2015

Appendix B: Letters of consent 256
Declaration of Helsinki and the ethical guidelines of the National Health Research Ethics
Council. It might be necessary for the research ethics committee or relevant authorities to inspect
the research records to make sure that we (the researchers) are conducting research in an ethical
manner.
What is this research study all about?
I am Mr Francois Minnie, the researcher and your Life Science lecturer, who would like to
involve you in my research project, which I am completing for a Master’s Degree. My research
project will be conducted at the North-West University, Vaal Triangle Campus in
Vanderbijlpark.
This research links well with the present teaching and learning situation in South African
schools, where it is expected of teachers to teach learners the skills to identify and solve
problems by means of critical and creative thinking. My study will specifically focus on critical
thinking. In my study, critical thinking will mean that the research participants must be able to
analyze, synthesize and evaluate information. Analysis means to break up information into
smaller parts. Synthesis means to combine different ideas/information into a new idea.
Evaluation means to judge the truth or value of something and motivate your answer.
The main objectives of the study are:
(i) To find out how well the critical thinking skills (analysis, synthesis, evaluation) of
first year Life Science student teachers were developed during their school years.
(ii) To find out if the use of Thinking Maps as teaching strategy could help to develop
critical thinking skills that might be in need of further development or improvement.
Thinking Maps is a visual learning strategy where a student learns to process and
summarize information in a map. The researcher will apply three Thinking Maps
during the research, namely:
A Circle Map to develop the skill of synthesis
A Tree Map to develop the skill of analysis

Appendix B: Letters of consent 257
A Multi-Flow Map to develop the skill of evaluation
Although many international studies have found the Thinking Maps strategy to be successful for
developing thinking skills, no studies have been conducted to test the effectiveness of Thinking
Maps as teaching strategy to develop critical thinking skills among Life Science student teachers
in the South African context; especially skills like analysis, synthesis and evaluation. These
skills are important for mastering the subject content of Life Science at first year B.Ed.-level.
The researcher would like to include all the 2016 first year B.Ed.-students with Life Science as
major subject in the research. The researcher will recruit the research participants by obtaining
permission from the Director of the School of Education Sciences, Prof. J.E. Fourie, who will act
as a gatekeeper to gain entry to the participants. Based on the numbers of students who enrolled
for Life Science during the past two years, about 60-70 students will take Life Science as major
subject in 2016. This group of students will be a new group of students who have not yet been
exposed to, or overburdened by research at the university.
Why have you been invited to participate?
It will be important to do the research with you, as the researcher is your Life Science lecturer
and want to use a new teaching strategy to firstly improve the quality of my own teaching
practice. Secondly, the researcher was a Life Science teacher for many years, and know that
teachers do not know about teaching strategies that they could use to develop the critical thinking
skills of learners in Life Science. Doing the research with first year Life Science student teachers
will give the researcher the chance to teach a strategy to a group of Life Science teachers which
they could use to possibly nurture critical thinking more effectively at school-level, when they
start teaching. The focus is on first year students, as the researcher wants to teach them how to
use the strategy in their first year of study and encourage them to apply it throughout their four
years of training, so that when they start teaching they might be good at guiding the learners
whom they will teach to use the strategy too. The researcher has been trained by an accredited
Thinking Maps facilitator to apply the Thinking Maps strategy.
In summary, you have been selected to take part in the research because:
(i) You are a first year, male or female B.Ed.-student from any ethnic and language
group at the North-West University, Vaal Triangle Campus in Vanderbijlpark, who
passed Life Science at matric level.
(ii) You are a first year BEd-student with Life Science as one of your major subjects.
Exclusion criteria: Participants will not be involved in the study if they are a second, third or
fourth year B.Ed.Life Science student at the North-West University, Vaal Triangle Campus in
Vanderbijlpark or any other university.

Appendix B: Letters of consent 258
What will your responsibilities be?
The researcher will make use of an independent person, Ms. Daphne Strauss, who will recruit the
participants for the research project. The researcher will train her for this purpose. Ms. Strauss is
a qualified and experienced secondary school teacher. An independent observer, Ms. Aldine
Oosthuyzen, who knows the study well, as she will be the independent statistician who will
capture the data and assist with the analysis of data, will assist her. Moreover, Ms. Oosthuyzen
is a member of the Ethics Committee of the School of Economic Sciences and IT at the NWU,
Vaal Triangle Campus, with a good understanding of ethical research principles, who will be
able to oversee that the work of Ms. Strauss is in line with good ethical practice. Neither Ms.
Strauss nor Ms. Oosthuyzen will have any relationship with the LIFE 111 students.
The recruitment will involve a short one-hour and 20 minutes presentation about the study in the
Life Science lecture venue at the university, to all the B.Ed. 2016 first year Life Science
students, after which the independent person will hand the informed consent forms to the
participants. The independent person will explain the information to the participants and request
them to take the forms home where they have privacy to complete the form at their own time.
The recruitment will take place at the beginning of the year during an hour register period on the
timetable before classes commence. If you are absent during the recruitment session and you are
interested to take part in the research, the independent person will be requested to conduct a
follow-up session with all the participants who missed the first recruitment session, at a time
convenient to the independent person and the participants.
In advance, the researcher will request the B.Ed. Programme Manager, Dr. Elize Küng, to
accommodate a register period on the timetable for first year students during 2016, preferably on
the same day as the LIFE 111 lectures. The researcher could then utilize this period for other
administrative issues related to the research, such as receiving the informed consent, the writing
of pretests and posttests, giving participants the opportunity to share their views about the
research and to receive feedback about the research. The researcher will allow one week to pass
between the recruitment and the obtaining of informed consent, to give participants time to think
about the study and whether they want to take part or not. After one week, the independent
person will meet with the participants during a register period in the Life Science lecture venue
and collect the informed consent forms. The participants who decide to take part in the research
will then be divided into an experimental and control group by the independent person.
Participants will receive a number, which they will use when writing the different tests. If you
decide to withdraw from the research, you do not need to complete the pretests and posttests and
do not have to attend the discussion and feedback sessions. As the research involves the teaching
of the Life Science content, you will however still need to attend class in one of the groups, A or
B.
If you take part in the research, you will be part of an experimental and control group on a
rotation basis during two experiments, experiment 1 and 2, that will run for six weeks each
during the first semester (February to May 2016). These groups will be referred to as Group A
and B, with no specific indication to the students of which group will constitute the
experimental group and which group will constitute the control group. The experimental group
and control group will consist of approximately 30 participants each. The participants of the
experimental and control groups will be determined by the independent person, who will divide
the participants into the groups by keeping a balanced and equal division in terms of gender,
language, ethnic group, type of school attended and matric result for Life Science.

Appendix B: Letters of consent 259
The experimental group will be the group of participants where the researcher will use the new
Thinking Maps strategy for a period of six weeks to see if the strategy will help the participants
to improve in using critical thinking skills. The control group will be the group of participants
who will not receive teaching with the new Thinking Maps strategy. The researcher will do
normal lecturing with them for a period of six weeks. In both groups, the researcher will deal
with the same subject content. If you are part of the experimental group during experiment 1,
you will then be part of the control group during experiment 2, and vice versa. All the
participants will therefore get a chance to receive instruction with the Thinking Maps strategy.
As the first year Life Science content is the same as the content dealt with at Grade 12-level, the
researcher will use pretests to measure how well you have developed the critical thinking skills
to analyse, synthesise and evaluate information in Life Science content at school. A pretest,
pretest 1, will be written at the beginning of experiment 1, based on the learning content that will
be dealt with in the first six weeks of semester 1. In the same way, pretest 2 will be written at the
beginning of experiment 2, based on the learning content that will be dealt with in the last six
weeks of semester 1. The pretests are mainly used to find out how well you developed critical
thinking skills at school, before the researcher teaches you to use the Thinking Maps strategy. In
total, you will write 2 pretests of approximately 30 minutes each.
Based on the pretest results, the researcher will develop the Thinking Maps teaching programme
to address the problems with critical thinking that the researcher noted in the pretest results at the
beginning of the first six weeks and second six weeks of the first semester during 2016. If the
pretests should indicate that the participants do not experience problems with the critical thinking
skills, the researcher will still apply the strategy to determine if it could improve on their present
application of the critical thinking skills.
The Life Science students have 2 periods per week of 1 hour and 20 minutes each on the
university timetable. One of the periods is a practical period, and the researcher will not apply
the Thinking Maps teaching programme during the practical period, but continue with normal
lectures. The remaining period that involves the teaching of theoretical subject content, will be
used for the Thinking Maps teaching programme. The teaching in the experimental and control
groups will take place at separate times on the timetable and in separate venues. The control
group will receive normal lectures during a class period (1 hour and 20 minutes) as allocated by
the university once a week. The experimental group will also receive the Thinking Maps
intervention once a week, during another period (1 hour and 20 minutes).
On conclusion of the Thinking Maps teaching programme with each group, a posttest 1 (after the
first six weeks of semester 1) and posttest 2 (after the last six weeks of semester 2), will be
written to see if the Thinking Maps teaching programme assisted you to develop or improve the
critical thinking skills of analysis, synthesis and evaluation in the context of the subject content
dealt with in each experiment respectively. In total, you will write 2 posttests of 30 minutes
each.
The table below summarizes the implementation of the research experiment.

Appendix B: Letters of consent 260
The pre- and posttests will contain 15 multiple-choice items each with one correct answer, and a
follow-up open question for each multiple-choice answer where you need to motivate an answer.
You need to motivate answers to avoid guessing answers. The motivation will also indicate to
me how well you can reason/argue. The multiple-choice questions will have an equal number of
questions to test the skills to analyze (5 questions), synthesize (5 questions) and evaluate (5
questions). The questions in the pre- and posttests will not be the same, as they will be based on
the subject content of the first and second six weeks of the semester, respectively. However, the
difficulty of the test and the skills tested, namely analysis, synthesis and evaluation, will remain
the same. To make sure that the difficulty level of all the tests will be the same, the researcher
will involve four experienced Life Science university lecturers to verify the difficulty level of all
the tests independently. The researcher will adhere to their comments and adapt tests if
necessary.
An example of how the questions will be asked follows below.
Weeks 1-6: Semester 1- Experiment 1: February – Mid March 2016
Pretest 1 Experimental group
Thinking Maps
Intervention: 6 weeks
Control group
Normal class teaching
(lecturing): 6 weeks
Posttest 1
Groups rotate
Weeks 7-12: Semester 1 – Experiment 2: April – Mid May 2016
Prestest 2 Experimental group
Normal class teaching
(lecturing): 6 weeks
Control group
Thinking Maps
Intervention: 6 weeks
Posttest 2
Choose the correct answer by drawing a circle around the correct answer (1-4). Motivate in writing
why you chose the answer.
Proteins are made from amino acids by the process of:
1. hydrolysis
2. pinocytosis
3. active transport
4. dehydration synthesis
Correct Answer Number: 4
Motivation: Proteins are large chains of amino acids combined by dehydration synthesis, where
by molecules join by removing water. Hydrolysis breaks down proteins into amino acids.
Pinocytosis is a method of ingesting large insoluble molecules, and is a form of active transport.

Appendix B: Letters of consent 261
At the end of the research, the researcher will compare the pretest and posttest results of all the
participants to see which strategy assisted the participants the best to develop their critical
thinking skills, the Thinking Maps strategy or normal lecturing. As suggested by the independent
statistician who will assist the researcher with the data analysis, comparisons of the test results of
individual students will also be done, as it could be that individual participants benefit more from
the new strategy than the group of participants. For this purpose, each participant will receive a
number that they will use throughout the research on their pretests and posttests so that it will be
possible for the researcher to do comparisons with the different numbers. No comparison will,
however, be linked to a participant’s name.
Opportunities for participants to share their opinions about the research, as well as opportunities
for feedback about the research will be scheduled.
In summary, your involvement will entail the following: (Exact dates and times to be provided
when the 2016 time table has been finalized)
1. Invitation and explanation of informed consent (1 hour and 20 minutes during)
2. Completing informed consent (At home, 1 week)
3. Submit informed consent.
4. Selection to an experimental and a control group.
5. Writing pretests (30 minutes) before taking part in Experiment 1 during the LIFE 111
lectures: The implementation of the Thinking Maps strategy for six weeks, 1 hour and 20
minutes per week as part of the experimental group, or as part of the control group who will
receive normal lecturing for six weeks, 1 hour and 20 minutes per week.
6. Writing posttests (30 minutes) after the implementation of the Thinking Maps strategy and
normal lecturing for six weeks as part of Experiment 1 (1 hour and 20 minutes respectively).
7. Taking part in a reversed experiment, Experiment 2, during the LIFE 111 lectures where the
experimental group becomes the control group who will receive normal lecturing for six
weeks (1 hour and 20 minutes per week), and the control group becomes the experimental
group who will receive teaching with the Thinking Maps strategy for six weeks, 1 hour and
20 minutes per week. The writing of pretests (30 minutes) and posttests (minutes) will apply
before and after the six weeks.
8. One discussion session to obtain feedback from students after the implementation of the
Thinking Maps strategy during Experiment 2 (1 hour and 20 minutes during a register
period).
9. Feedback about the research: Feedback 1: 3 weeks after the implementation of Experiment 1
(1 hour and 20 minutes during a register period). Feedback 2: 3 weeks after the
implementation of Experiment 2 (1 hour and 20 minutes during a register period).
10. Final feedback about the research findings (1 hour and 20 minutes during a register period).
11. Will you benefit from taking part in this research?
The direct benefits for you as participant will probably be the following:
(i) You might acquire critical thinking skills with the Thinking Maps teaching strategy to
enable you to analyze, synthesize and evaluate information more effectively.
(ii) The Thinking Maps strategy is also a learning strategy that could assist you to learn
and study better and possibly improve your academic performance in any subject.

Appendix B: Letters of consent 262
(iii) Another benefit would be that you would probably possess an effective strategy that
you could use when you start teaching.
The indirect benefit will probably be that:
(i) Researchers at other universities could be informed about the possible benefits of
Thinking Maps as teaching strategy to develop critical thinking skills and conduct
further studies in other contexts to prove the benefits of the strategy for developing
critical thinking skills on a larger scale.
(ii) The research findings could be used to make recommendations to the Department of
Education, regarding the possible improvement of the teaching practices of Life
Science teachers.
(iii) The teaching practice of the greater population of Life Science teachers could benefit
if the Thinking Maps strategy holds merits for developing critical thinking in Life
Science, and the message be communicated to Schools of Education Sciences at
Universities who could incorporate training in the use of the strategy into the teacher-
training curriculum.
Are there risks involved in your taking part in this research and how will these be
managed?
The possible risks in this study, and how the researcher will manage them, are summarised in the
table below:
Probable/possible risks/discomforts Strategies to minimize risk/discomfort
Conflict of interest and the power
relationship due to the fact that the
researcher will also be the participants’
Life Science lecturer.
The researcher acknowledges that the
group of participants will be a vulnerable
group due to the conflict of interest and
hierarchical lecturer-student relationship
that will exist, because he is the lecturer
of the participants.
However, the use of an independent
person to do the recruitment of the
participants, obtain informed consent,
select the participants to the experimental
and control groups, administer tests for
data collection purposes and verify the
test results of the participants, could
reduce vulnerability. Using an
independent person will avoid
participants feeling coerced to take part
in the research, and avoid their being
influenced by the student-lecturer
relationship.
The independent person will not know or
have any contact with the participants
and will not lecture to any first year
participants. This will ensure that, the
participants will not be forced to do
something against their will, or be

Appendix B: Letters of consent 263
threatened, pressurized or persuaded with
force to take part in the study to please
their lecturer. The study cannot be done
without including this group of
participants, as the aim is to prepare them
from their first year to apply a teaching
strategy adequately that could enhance
critical thinking during teaching.
The researcher cannot guarantee
complete anonymity.
The independent person will make the
participants aware of the fact that
although those who agreed to take part in
the pre- and posttest writing will remain
anonymous to the researcher (their
lecturer), absolute anonymity cannot be
guaranteed during the writing of the
pretests and posttests. Those who agree to
write the tests will not be anonymous to
their peers who will write the tests
together with them. However, no results
will be linked to individual participants,
as numbers will be used to identify
participants. The independent person who
will collect the various test results of the
participants for comparison purposes will
know which name is linked to a specific
number. She will keep the information
confidential and will only report numbers
and results to the researcher and
independent statistician.
Participants will also be made aware of
the fact that although they might not
consent to take part in the research and
write the tests, they will still have to take
part in the intervention, as the
intervention will be linked to the
compulsory subject content of the module
(LIFE 111 - Life Science) which they
have to pass. Exposure to the new
teaching strategy could also be beneficial
to them. The Thinking Maps intervention
will not interfere with normal teaching
time, but will form part of it.
Writing tests might cause anxiety and
stress.
The independent person who will do the
recruitment and obtain informed consent
will explain the following to you:
(i) You do not need to prepare
or study for the tests.
(ii) The tests will be written at
times convenient to the
participants, preferably

Appendix B: Letters of consent 264
during a free period on the
timetable to avoid additional
traveling to write the tests.
For this purpose, the
researcher will arrange for a
fixed register period on the
timetable for the first year
students of 2016.
(iii) The tests will not influence
the participants’ passing or
failing the Life Science
module, LIFE 111.
(iv) The test results will only be
used for research purposes to
find out if the Thinking Maps
strategy is effective for
developing critical thinking
skills or not.
(v) The content on which the
tests will be based will also
be known to the participants
as they would have done the
content in Grade 12. This
might reduce anxiety.
(vi) For the purpose of making
individual comparisons
between test results,
participants will be identified
by means of numbers to the
researcher. The researcher
will not know who took part
in writing the tests (he will
not be involved in
administering the tests). The
independent person will assist
the statistician with selecting
the individual tests for
comparison purposes. The
researcher will only receive
the numbers of the
participants with the various
test results.
(vii) The tests will not focus on
passing or failing but how
good participants can apply
critical thinking skills.
The researcher has planned for appropriate measures to minimize research-related risks, so that
the participants could experience the benefits that the research could hold, as noted above. The
risks appear to be reasonable in relation to the importance of knowledge to be gained that can
possibly improve the teaching and learning of Life Science.

Appendix B: Letters of consent 265
Who will have access to the data?
Your test results will not be linked to your name. You will not write your name on the test, but
will be identified by a number (1, 2 etc.). All results that will be reported will be linked to a
number. You will remain anonymous to the researcher, and your name will not be mentioned in
the findings that will emanate from the research. The researcher assures you that we will protect
the information we have about you. All information regarding the research will be stored on a
password-protected computer and the completed tests will be locked up in a cupboard in the
researcher’s office. The researcher is the only person who has a key to unlock the cupboard.
It is important to inform you that confidentiality will be limited. Apart from the independent
person, only two other people will have access to the data, namely the independent statistician
who will assist me with the capturing of the data, and my supervisor who will check and verify
that my research findings are correct. The independent statistician is Ms. Aldine Oosthuyzen
who is a qualified and experienced statistician. The researcher will store the data for a minimum
of five years. The independent person, study leader and the independent statistician will sign a
written agreement at the beginning of the study that they will keep all information about the
study and the findings of the study confidential, and not talk about it.
What will happen to the data?
The researcher assures you that the information obtained via the research will be used for
research purposes only, and no information about you will be made known in reporting about the
study (for example your name, your address or your parents’/guardians’ name or an address).
The data from this study will be reported in the following ways: (i) The researcher will report the
findings in the form of a dissertation that will be submitted to examiners at other universities for
examination purposes, (ii) The researcher also intends to write about the research in articles and
book chapters, and speak about the research at conferences.
This is a once-off study, so the data will not be re-used in any other studies, which the researcher
may do in future.
Will you be paid/compensated to take part in this study and are there any costs involved?
You will not be paid/compensated to take part in the study, but refreshments will be given to you
after the completion of each test. This will serve as a token of appreciation that you were willing
to become part of the research. The writing of the tests and the intervention programme will take
place during periods on the normal timetable. You do not have to arrange for additional
traveling to participate. No costs will be involved in taking part in the study.
How will you know about the findings?
The general findings of the research will be shared with you via email or post (please include
your address below) by the researcher who will compile a short report about the findings that
will be provided to all the research participants during a register period. All questions about the
report can be directed to the researcher at the contact details below. Alternatively, you are
welcome to schedule an appointment with the researcher to discuss your questions. If you wish
to receive individual feedback, please indicate this in the

Appendix B: Letters of consent 266
Is there anything else that you should know or do?
You can contact Mr Francois Minnie at 084 549 2583 or [email protected] or his study
leader, Prof. Mary Grosser at 083 490 0501 or [email protected], if you have any further
queries or encounter any problems.
You can contact the c
hair of the Humanities and Health Research Ethics Committee (Prof Linda Theron) at 016 910
3076 or [email protected] if you have any concerns or complaints that have not been
adequately addressed by the researcher. You can also contact, the co-chair, Prof Tumi Khumalo
(016 910 3397 or [email protected]). You can leave a message for either Linda or Tumi
with Ms. Daleen Claasens (016 910 30441).
If you have difficulty in following and understanding the explanation of the research, please
contact the researcher or the independent person at the details below, and they will arrange a
time with you to meet with the researcher to explain what is problematic to you.
You will receive a copy of this information and consent form for your own records.
If you are younger than 18, and the researcher discovers any harm done towards you, he must tell
someone who can help you.
Declaration by participants
By signing below, I …………………………………..………, agree that I will take part in a
research study entitled: The impact of Thinking Maps to enhance the development of critical
thinking skills among first year pre-service Life Science teachers
I declare that:
I have read and understood this information and consent form and it is written in a
language with which I am fluent and comfortable.
I have had a chance to ask questions to both the person obtaining consent, as well as
the researcher (if this is a different person), and all my questions have been
adequately answered.
I understand that taking part in this study is voluntary and I have not been
pressurised to give consent that my son/daughter may take part.
I understand that my test results could be reproduced publically and/or quoted, but
without reference to me or my parents’/guardians’ personal identity.
I may choose to leave the study at any time and will not be penalised or prejudiced in
any way.
I may be asked to leave the study before it has finished, if the researcher feels it is in
my best interests, or if I do not follow the study plan, as agreed to.
Signed at (place) ......................…........…………….. on (date) …………....……….. 20....
...................................................................... ...................................................................
Signature of participant Signature of witness

Appendix B: Letters of consent 267
You may contact me again Yes No
I would like a summary of the findings of this research Yes No
I would like to receive individual feedback of the findings of this research
Yes No
The best way to reach me is:
Name & Surname: ________________________________________________
Postal Address: ________________________________________________
Email: ________________________________________________
Phone Number: _____________________
Cell Phone Number: ______________________
In case the above details change, please contact the following person who knows me well and
who does not live with me and who will help you to contact me:
Name & Surname:
___________________________________________________________________________
Phone/ Cell Phone Number /Email:
___________________________________________________________________________
Declaration by person obtaining consent
I (name) ……………………………………………..……… declare that:
I explained the information in this document to …………………………………..
I encouraged him/her to ask questions and took adequate time to answer them.
I am satisfied that he/she adequately understands all aspects of the research, as
discussed above
I did not use an interpreter.
The best way to reach me is:
Name & Surname: ________________________________________________
Postal Address: ________________________________________________
Email: ________________________________________________
Phone Number: _____________________
Cell Phone Number: ______________________
Signed at (place) ......................…........…………….. on (date) …………....……….. 20....
...................................................................... ...................................................................
Signature of person obtaining consent Signature of witness

Appendix B: Letters of consent 268
Declaration by researcher
I (name) ……………………………………………..……… declare that:
I explained the information in this document to …………………………………..
I encouraged him/her to ask questions and took adequate time to answer them.
I am satisfied that he/she adequately understands all aspects of the research, as
discussed above
I did/did not use a interpreter.
Signed at (place) ......................…........…………….. on (date) …………....……….. 20....
...................................................................... ...................................................................
Signature of independent person Signature of witness

Appendix B: Letters of consent 269
LEARNERS (AFRIKAANS)

Appendix B: Letters of consent 270
2.
HHREC Stempel
DEELNEMER SE INLIGTINGSBROSJURE EN INGELIGTE TOESTEMMINGSVORM
VIR B.ED. EERSTEJAAR STUDENTE IN LEWENSWETENSKAP
Titel van navorsingsprojek: Die impak van Denkkaarte om die ontwikkeling van kritiese
denkvaardighede by eerstejaar voordiens Lewenswetenskap-onderwysers te koester
VERWYSINGSNOMMER :
HOOF-NAVORSER: Mnr Francois Minnie
ADRES: SKOOL VIR OPVOEDKUNDIGE WETENSKAPPE, NOORDWES-
UNIVERSITEIT, HENDRICK VAN ECK BOULEVARD 100, VANDERBIJLPARK
KONTAKNOMMER: 016 3074/08 454 92583
U word uitgenooi om deel te neem aan ‘n navorsingsprojek wat deel vorm van my, die navorser,
se studie vir die verwerwing van ‘n Meestersgraad in Opvoedkunde. Gebruik asseblief tyd om
deur die inligting wat hier aangebied word om die navorsingsprojek te verduidelik, te lees. Vra
asseblief vrae aan die navorser oor enige deel van die projek wat u nie ten volle verstaan nie. Dit
is baie belangrik dat u heeltemal tevrede voel en duidelik verstaan waaroor die navorsing gaan
en hoe u betrek kan word. U deelname is heeltemal vrywillig en u mag te enige tyd deelname
aan die navorsing van die hand wys. As u nie toestemming gee dat u aan die navorsing gaan
deelneem nie, sal dit u geensins negatief beïnvloed nie. U mag u ook enige tyd aan die studie
onttrek, al sou u toestem dat u aan die navorsing gaan deelneem. U mag my ook versoek om
enige inligting/data wat ek oor u ingesamel het te vernietig. U moet ook weet dat indien u
jonger as 18 jaar is, u ouers ook toestemming moet gee dat u aan die navorsing mag deelneem. U
het egter nog steeds die keuse om self te besluit of u wil deelneem of nie.
Hierdie studie is goedgekeur deur die Humanities and Health Research Ethics Committee
(HHREC) van die Fakulteit Geesteswetenskappe aan die Noord-Wes Universiteit, Vaal
Driehoekkampus, Vanderbijlpark. Die navorsing sal uitgevoer word in ooreenstemming met
die etiese riglyne en beginsels van die internasionale Deklarasie van Helsinki en die National
Health Research Ethics Council. Dit mag nodig wees dat lede van die etiekkomitee of relevante
Posbus 1174, Vanderbijlpark
Suid Afrika, 1900
Web: http://www.nwu.ac.za
DATUM: 3 September 2015

Appendix B: Letters of consent 271
gesaghebbendes die navorsing ondersoek om seker te maak dat die navorser die navorsing op ‘n
etiese manier uitvoer.
Waaroor gaan die navorsing?
Ek, die navorser is mnr. Francois Minnie, u dosent in Lewenswetenskap, wat graag wil dat u
aan my navorsingsprojek, wat ek vir my Meestersgraad in Opvoedkunde wil voltooi, deelneem.
My navorsingsprojek sal by die Noordwes-Universiteit se Vaal Driehoekkampus in
Vanderbijlpark uitgevoer word.
Die navorsing skakel goed met die huidige onderrig en leersituasie in Suid-Afrikaans skole, waar
dit van onderwysers verwag word om leerders vaardighede te leer om probleme op te los deur
middel van kritiese en kreatiewe denke. My studie gaan spesifiek op kritiese denke fokus. In
my studie gaan kritiese denke soos volg verstaan word. Die deelnemers aan die navorsing moet
in staat wees om inligting te analiseer, sintetiseer en evalueer. Om inligting te analiseer beteken
om inligting in kleiner dele op te breek. Sintese beteken om verskillende idees of inligting te
kombineer om ‘n nuwe idee te vorm. Om te evalueer beteken om die waarheid of waarde van
iets te beoordeel en ‘n antwoord te motiveer.
Die belangrikste doelstellings van my studie is:
(i) Om vas te stel hoe goed die kritiese denkvaardighede (analise, sintese en evaluering)
by eerstejaar Lewenswetenskap-studentonderwysers ontwikkel is gedurende hulle
skoolloopbane.
(ii) Om vas te stel of die gebruik van Denkkaarte as onderrigstrategie die ontwikkeling
van kritiese denkvaardighede wat moontlik verdere ontwikkeling nodig het, of
verbeter kan word, bevorder. Denkkaarte is ‘n visuele leerstrategie waar ‘n student
leer om inligting hulle eie te maak deur dit op te som met behulp van ‘n kaart. Ek
gaan van drie strategieë tydens die navorsing gebruik maak, naamlik:
‘n Sirkelkaart om sintese as vaardigheid te ontwikkel
‘n Boomkaart om analise as vaardigheid te ontwikkel

Appendix B: Letters of consent 272
‘n Multi-vloeikaart om evaluasie as vaardigheid te ontwikkel
Alhoewel baie internasionale studies bevind het dat Denkkaarte suksesvol is vir die ontwikkeling
van denkvaardighede, is nog geen studies gedoen om die effektiwiteit van Denkkaarte as
onderrigstrategie vir die ontwikkeling van kritiese denkvaardighede by Lewenswetenskap-
studentonderwysers in die Suid-Afrikaanse konteks vas te stel nie, veral nie die vaardighede soos
analise, sintese en evaluasie nie. Hierdie vaardighede is belangrik vir die bemeestering van die
Lewenswetenskap-vakinhoud op eerstejaar B.Ed.-vlak.
Die navorser wil graag alle 2016 eerstejaar B.Ed.-studente met Lewenswetenskap as hoofvak by
die navorsing betrek. Ek sal die deelnemers aan die navorsing werf deur toestemming te verkry
by die Direkteur van die Skool vir Opvoedkundige Wetenskappe, Prof. J.E. Fourie, wat as
hekwagter sal optree om vir hom toegang tot die studente te gee.
Gebaseer op die getalle van studente wat die afgelope twee jaar ingeskryf het met
Lewenswetenskap as hoofvak, sal ongeveer 60-70 studente in 2016 Lewenswetenskap as
hoofvak neem. Die navorser wil graag met hierdie nuwe groep studente werk aangesien hulle
nog nie blootgestel was aan of oorlaai is met navorsing wat by die universiteit onderneem word
nie.
Hoekom is u genooi om deel te neem?
Dit sal belangrik wees om navorsing met u te doen, aangesien ek u Lewenswetenskapdosent is
wat self die nuwe onderrigstrategie wil gebruik om die kwaliteit van my eie onderrigpraktyk te
verbeter. Tweedens was die navorser baie jare lank ‘n Lewenswetenskap- onderwyser, en weet
dat onderwysers nie kennis het van onderrigstrategieë wat hulle kan gebruik om kritiese
denkvaardighede in Lewenswetenskap te verbeter nie. Om navorsing met die eerstejaar
Lewenswetenskap-studentonderwysers te doen sal my ‘n kans gee om ‘n strategie vir ‘n groep
Lewenswetenskap-studentonderwysers aan te leer wat hulle sou kon gebruik om kritiese denke
moontlik meer effektief te koester op skoolvlak as hulle begin skoolhou. Die fokus is op
eerstejaar studente omdat ek hulle reeds in hul eerste jaar wil leer hoe om die strategie te
gebruik, en hulle dan aan te moedig om die strategie toe te pas gedurende hulle vier jaar van
opleiding, sodat hulle, wanneer hulle begin skool hou, moontlik goeie leiding aan leerders sal
kan gee om ook die strategie te gebruik. Die navorser is opgelei deur ‘n geakkrediteerde opleier
om Denkkaarte te gebruik.
Opsommenderwys is u gekies om deel te neem aan die studie omdat:
(i) U ‘n manlike of vroulike eerstejaar B.Ed.-student aan die Noordwes-Universiteit se
Vaaldriehoekkampus in Vanderbijlpark is, afkomstig is van enige etniese en
taalgroep, en Lewenswetenskap op matriekvlak geslaag het.

Appendix B: Letters of consent 273
(ii) U ‘n eerstejaar B.Ed.-student is wat Lewenswetenskap as een van sy/haar hoofvakke
neem.
Uitsluitingskriteria: Deelnemers sal nie by die studie betrek word as hulle ‘n tweedejaar,
derdejaar of vierdejaar B.Ed.-student aan die Noordwes-Universiteit se Vaaldriehoekkampus in
Vanderbijlpark of enige ander universiteit is nie.
Wat sal u verantwoordelikhede wees?
Die navorser gaan gebruik maak van ‘n onafhanklike persoon, Mev. Daphne Strauss, ‘n ervare
sekondêre skoolonderwyseres, wat gaan help met die werwing van die deelnemers vir die
navorsingsprojek. Die navorser sal haar oplei vir hierdie doel. Sy sal bygestaan word deur ‘n
onafhanklike waarnemer, Mev. Aldine Oosthuyzen. Mev. Oosthuyzen ken die studie goed omdat
sy as onafhanklike statistikus die vaslegging van data gaan doen en behulpsaam gaan wees met
die analise van die data. Mev. Oosthuyzen is ook ‘n lid van die Etiese Komitee van die Skool vir
Ekonomiese Wetenskappe en IT aan die NWU, Vaal Driehoekkampus, en het ‘n goeie begrip
van etiese beginsels tydens navorsing. Sy sou dus tydens haar waarneming kon verseker dat die
werk van Mev. Strauss voldoen aan goeie etiese praktyk. Mev. Strauss en Mev. Oosthuyzen sal
geen verbintenis met die LIFE 111 studente hê nie.
Die werwing gaan ‘n kort een-uur en 20 minute aanbieding deur Mev. Strauss aan al die 2016
Lewenswetenskap eerstejaar B.Ed.-studente in die Lewenswetenskap lesinglokaal by die
universiteit behels. Daarna sal sy die ingeligte toestemmingsvorms aan die deelnemers uitdeel,
die inligting verduidelik en aan die deelnemers noem dat hulle self ook deur die inligting moet
werk, die vorms huis-toe moet neem en op hulle eie tyd en in privaatheid die vorm moet voltooi
en aandui of hulle wil deelneem aan die navorsing of nie. Die werwing sal aan die begin van die
jaar, voordat die klasse begin plaasvind tydens ‘n registerperiode op die rooster. Indien u afwesig
is tydens die werwingsessie en u stel belang om aan die navorsing deel te neem, sal die
onafhanklike persoon versoek word om ‘n opvolgsessie met al die deelnemers wat afwesig was
te reël op ‘n tyd wat die onafhanklike persoon en die deelnemers sal pas.
Die navorser sal vroegtydig aan die B.Ed. Programbestuurder, Dr Elize Küng, ‘n versoek rig dat
daar voorsiening gemaak moet word vir ‘n registerperiode op die rooster vir die 2016 eerstejaar
B.Ed.-studente, verkieslik op dieselfde dag as die LIFE 111 lesings. Die navorser sou dan
hierdie periode kon gebruik vir administatiewe sake rondom die navorsing, soos vir die ontvang
van die ingeligte toestemmingsvorms, die skryf van voortoetse en posttoeste, geleentheid om die
deelnemers kans te gee om hul sienings oor die navorsing te deel en om terugvoer oor die
navorsing te gee. Die navorser sal sorg dat een week verloop tussen die werwing en die inneem
van ingeligte toestemming, om deelnemers die kans te gee om na te dink oor die studie en of
hulle wil deelneem of nie. Na een week, sal die onafhanklike persoon weer die deelnemers
ontmoet en die ingeligte toestemmingsvorms inneem. Die deelnemers wat besluit om deel te
neem aan die navorsing sal dan deur die onafhanlike persoon in eksperimentele en kontrole
groepe verdeel word. Deelnemers sal ‘n nommer ontvang wat hulle tydens die skryf van die
toetse gaan gebruik. Indien u besluit om aan die navorsing te onttrek, hoef u nie die voortoetse en
natoetse te skryf nie, en ook nie die besprekings en terugvoer sessies by te woon nie. Omdat die
navorsing egter die onderrig van die Lewenswetenskap vakinhoud behels, moet u nog steeds die
klasse in een van die groepe, A of B, bywoon.
Indien u aan die navorsing gaan deelneem, sal u deel wees van ‘n eksperimentele en kontrole
groep wat op rotasiebasis tydens die navorsing aan twee eksperimente, eksperimente 1 en 2, wat
elk ses weke lank gedurende die eerste semester (Februarie tot Mei 2016) sal plaasvind, sal

Appendix B: Letters of consent 274
deelneem. Daar sal na die groepe as Groep A en B verwys word, sonder om aan die studente ‘n
aanduiding te gee watter groep die eksperimentele groep, en watter groep die kontrole groep is.
Die eksperimentele groep en kontrole groep sal elk uit ongeveer 30 deelnemers bestaan. Die
deelnemers vir die eksperimentele en kontrole groepe sal deur die onafhanlike persoon bepaal
word, deur deelnemers min of meer gebalanseerd en gelykop ten opsigte van geslag, taal, etniese
groep, tipe skool bygewoon en matriekpunt vir Lewenswetenskap in die eksperimentele en
kontrole groepe in te deel.
Die eksperimentele groep sal die groep deelnemers wees waar ek die nuwe onderrigstrategie,
Denkkaarte, vir ‘n tydperk van ses weke sal gebruik om vas te stel of die nuwe strategie die
deelnemers sal help om hul kritiese denkvaardighede te verbeter of verder te ontwikkel. Die
kontrole groep sal die groep deelnemers wees wat nie onderrig met die nuwe onderrigstrategie,
Denkkaarte, sal ontvang nie. Die navorser sal slegs gewone lesings vir ‘n tydperk van ses weke
aan hulle aanbied. In beide groepe sal ek dieselfde vakinhoud aanbied. As u deel is van die
eksperimentele groep tydens eksperiment 1, sal u dan deel wees van die kontrole groep tydens
eksperiment 2, en andersom. Al die deelnemers gaan dus ‘n kans kry om onderrig deur middel
van Denkkaarte te ontvang.
Aangesien die vakinhoud van Lewenswetenskap op eerstejaarsvlak dieselfde is as die vakinhoud
wat op Graad 12 vlak hanteer word, gaan die navorser van voortoetse gebruik maak om vas te
stel hoe goed u die kritiese denkvaardighede om te analiseer, sintetiseer en te evalueer in
Lewenswetenskap op skool aangeleer het. ‘n Voortoets, voortoets 1, sal aan die begin van
eksperiment 1 geskryf word en sal gebaseer wees op die vakinhoud wat ons tydens die eerste ses
weke van semester 1 gaan behandel. Op dieselfde manier sal voortoets 2 aan die begin van
eksperiment 2 geskryf word, wat op die vakinhoud wat ons in die laaste 6 weke van semester 1
gaan behandel, gebaseer sal wees. Met die voortoetse wil die navorser hoofsaaklik vasstel hoe
goed u kritiese denkvaardighede op skool ontwikkel is, voordat hy Denkkaarte as
onderrigstrategie gebruik. In totaal, gaan u 2 voortoetse van ongeveer 30 minute elk skryf.
Gebaseer op die voortoets resultate, sal die navorser die onderrigprogram waar hy Denkkaarte
gaan gebruik, ontwikkel, om die probleme met kritiese denke wat hy tydens die voortoetse aan
die begin van die eerste ses weke en die tweede ses weke van die eerste semester gedurende
2016 opgemerk het, aan te spreek. Indien die voortoetse sou uitwys dat die deelnemers nie
probleme met die kritiese denkvaardighede ervaar nie, sal die navorser steeds die strategie toepas
om te kyk of die navorser die toepassing van die kritiese denkvaardighede nog beter kan
ontwikkel.
Die Lewenswetenskap deelnemers het twee Lewenswetenskap periodes per week van 1 uur en
20 minute elk op die universiteitsrooster. Een van die periodes is ‘n praktiese periode en die
navorser sal nie tydens hierdie periode met Denkkaarte onderrig gee nie, maar slegs gewone
lesings aanbied. Die oorblywende periode wat fokus op teoretiese vakinhoud sal gebruik word
om Denkkaarte as onderrigstrategie toe te pas. Die onderrig in die eksperimentele en kontrole
groepe sal op aparte tye en in aparte lokale plaasvind. Die kontrole groep sal normale lesings
tydens hulle klasperiode van 1 uur en 20 minute een keer per week, soos deur die universiteit
toegeken is, ontvang. Die eksperimentele groep sal onderrig met behulp van Denkkaarte een
keer per week tydens hulle periode van 1 uur en 20 minute ontvang.
Wanneer die implementering van die Denkkaart-onderrigprogam voltooi is, sal natoets 1
na afloop van die eerste ses weke van semester 1 geskryf word en natoets 2 na afloop van die
laaste ses weke van semester 2. Die natoetse word geskryf om te sien of Denkkaarte u gehelp
het om die kritiese denkvaardighede van analise, sintese en evaluasie in die konteks van die

Appendix B: Letters of consent 275
vakinhoud wat tydens elke eksperiment hanteer is, te ontwikkel of te verbeter. In totaal sal u
twee natoetse van 30 minute elk skryf.
In die tabel hier onder word die implementering van die navorsingseksperiment opgesom.
Die voortoetse en natoetse sal uit 15 multi-keuse vrae bestaan, waar elke vraag een korrekte
antwoord sal hê. Elke vraag het ook ‘n opvolgvraag waar u ‘n antwoord moet motiveer. U moet
u antwoord motiveer om raaiwerk te ontmoedig en sodat die navorser kan vasstel hoe goed u kan
redeneer/argumenteer. Die multi-keuse vrae sal ‘n gelyke aantal vrae bevat vir die verskillende
vaardighede, naamlik analise (5 vrae), sintese (5 vrae) en evaluasie (5 vrae). Die vrae in die
voortoetse en natoetse sal nie dieselfde wees nie, omdat die toetse elk op verskillende vakinhoud
van die eerste ses en tweede ses weke van semester 1 onderskeidelik, gebaseer sal wees.
Die moeilikheidsgraad van die toetse en die vaardighede wat getoets word, naamlik analise,
sintese en evaluasie, sal dieselfde wees. Om seker te maak dat die moeilikheidsgraad van al die
toetse dieselfde is, sal die navorser vier ervare kollegas wat universiteitsdosente in
Lewenswetenskap is, inskakel om die moeilikheidsgraad van al die toetse onafhanklik te
evalueer. Die navorser sal aandag gee aan hulle kommentaar en indien nodig, die toetse aanpas.
‘n Voorbeeld van hoe die vrae gestel gaan word verskyn hier onder.
Weke1-6: Semester 1- Eksperiment 1: Februarie – middel Maart 2016
Voortoets 1 Eksperimentele groep
Denkkaarte
6 weke
Kontrole groep
Normale klasonderrig
(lesings)
6 weke
Natoets 1
Groepe roteer
Weke 7-12: Semester 1 – Eksperiment 2: April – middel Mei 2016
Voortoets 2 Eksperimentele groep
Normale klasonderrig
(lesings)
6 weke
Kontrole groep
Denkkaarte
6 weke
Natoets 2
Kies die korrekte antwoord deur ‘n sirkel om die korrekte antwoord (1-4) te maak. Motiveer
skirftelik hoekom u die antwoord gekies het.
Proteïne word gemaak van aminosure deur die proses van:
1.hidrolis
2.pinositosis
3.aktiewe vervoer
4.dehidrasie-sintese
Korrekte antwoord: 4
Motivering: Proteïne is groot kettings van aminosure wat gekombineer word deur middel van
dehidrasie-sintese, waar molekules saamgevoeg word deur water te verwyder. Hidrolise breek die
proteïne af in aminosure. Pinositosis is ‘n metode waardeur groot onoplosbare molekules
ingeneem word, en word beskou as ‘n vorm van aktiewe vervoer.

Appendix B: Letters of consent 276
Aan die einde van die navorsing, sal die navorser die voortoets en natoets resultate van al die
deelnemers vergelyk om vas te stel watter strategie die deelnemers se kritiese denkvaardighede
die beste ontwikkel het: Denkkaarte of normale lesings. Op aanbeveling van die onafhanklike
statistiese konsultant wat die navorser gaan help met die analise van die data, gaan vergelykings
ook ten opsigte van individuele deelnemers se toetsresultate gedoen word, aangesien dit
moontlik is dat die nuwe strategie individuele deelnemers beter mag baat as die groep. Die
deelnemers sal elkeen vir hierdie doel ‘n nommer ontvang wat hulle deurgaans op hulle
voortoetse en natoetse gaan aanbring sodat dit vir die navorser moontlik sal wees om
vergelykings ten opsigte van die verskillende toetse gekoppel aan ‘n nommer ook uit te voer.
Geen vergelyking sal egter aan ‘n deelnemer se naam gekopppel word nie.
Geleentheid vir die deelnemers om hulle menings oor die navorsing te gee, asook geleentheid vir
terugvoer deur die navorser oor die navorsingsbevindinge, sal geskeduleer word.
Opsommenderwys gaan u deelname die volgende behels: (Presiese datums en tye sal verskaf
word sodra die klasrooster vir 2016 gefinaliseer is)
1. Uitnodinging en verduideliking van ingeligte toestemming (1 uur en 20 minute).
2.Die voltooiing van ingeligte toestemming (Tuis, 1 week).
3.Inhandiging van ingeligte toestemming.
4.Selektering tot ‘n eksperimentele en kontrole groep.
5.Die skryf van voortoetse (30 minute) voordat u deelneem aan Eksperiment 1: Die
implementering van die Denkkaarte onderrigstrategie tydens die LIFE 111 lesings vir ses weke
(1 uur en 20 minute per week) as deel van die eksperimentele groep, of as deel van die kontrole
groep wat slegs normale lesings vir ses weke (1 uur en 20 minute per week) sal ontvang.
6.Die skryf van natoetse (30 minute) na die implementering van Denkkkaarte en normale lesings
vir ses weke onderskeidelik tydens Eksperiment 1.
7.Deelname aan ‘n omgekeerde eksperiment, Eksperiment 2, tydens die LIFE 111 lesings waar
die eksperimentele groep die kontrole groep word, en die kontrole groep die eksperimentel groep
word. Die eksperimentele groep sal weer vir ses weke onderrig met Denkkaarte ontvang (1 uur
en 20 minute per week) en die kontrole groep vir ses weke onderrig met behulp van normale
lesings sal ontvang (1 uur en 20 minute per week). Die skryf van voortoetse (30 minute) en
natoese (30 minute) voor en na die ses weke sal ook van toepassing wees.
8.Een bespreking waar deelnemers hulle menings oor die navorsing kan gee aan die einde van
Eksperiment 2 (1 uur en 20 minute tydens ‘n register periode) na afloop van die intervensie met
die Denkkaarte.
9.Terugvoer oor die navorsing: Sessie 1: Aan die einde van Eksperiment 1 (1 uur en 20 minute
tydens ‘n registerperiode). Sessie 2: Aan die einde van Eksperiment 2 (1 uur en 20 minute tydens
‘n registerperiode).
10.‘n Finale terugvoersessie oor die navorsingsbevindinge (1 uur en 20 minute tydens ‘n
registerperiode)
Sal u baat vind deur aan die navorsing deel te neem?

Appendix B: Letters of consent 277
Die onmiddellike voordele vir u as deelnemer sal waarskynlik die volgende wees:
(i) U mag moontlik die kritiese denkvaardighede deur middel van Denkkaarte aanleer
wat u in kan staat stel om inligting meer effektief te analiseer, sintetiseer en evalueer.
(ii) Denkkaarte is ook ‘n effektiewe leerstrategie wat jou sou kon help om beter te
studeer en moontlik u akademiese prestasie in enige vak te verbeter.
(iii) ‘n Ander voordeel sou wees dat u moontlik oor ‘n effektiewe strategie sou kon
beskik wanneer u begin skoolhou.
Die indirekte voordele sal waarskynlik wees dat:
(iv) Navorsers by ander universiteite sou moontlik kon kennis neem van die voordele van
Denkkaarte as onderrigstrategie om kritiese denkvaardighede te verbeter, en verdere
studies in ander kontekste sou kon onderneem om die voordele van die strategie vir
die ontwikkeling van kritiese denkvaardighede op groter skaal te bewys.
(v) Die navorsingsbevindinge sou gebruik kon word om aanbevelings aan die
Departement van Onderwys te maak met betrekking tot die moontlike verbetering van
die onderrigpraktyk in Lewenswetenskap op skool, om te verseker dat kritiese denke
wel in klaskamers op skool ontwikkel word.
(vi) Die groter populasie van Lewenswetenskap-onderwysers se onderrigpraktyk sou kon
baat as Denkkaarte as onderrigstrategie meriete inhou vir die ontwikkeling van
kritiese denke in Lewenswetenskap en hierdie bevinding aan Skole vir
Opvoedkundige Wetenskappe aan Universiteite gekommunikeer kan word en
opleiding in die gebruik van die strategie deel gemaak kan word van die kurrikulum
vir onderwysersopleiding.
Is daar enige risiko’s betrokke by u deelname aan die navorsing en hoe gaan die risiko’s
bestuur word?
Die volgende risiko’s is betrokke by die studie, en in die tabel hieronder verduidelik die navorser
hoe hy die risiko’s gaan bestuur.
Moontlike/waarskynlike risko’s
/ongemak
Strategieë om risiko’s en ongemak te
verminder
Botsende belange en die magsverhouding
wat bestaan omdat die navorser ook die
deelnemers se Lewenswetenskapdosent is.
Die navorser erken dat die groep deelnemers
kwesbaar is as gevolg van botsende belange
en die hiërargiese dosent-student verhouding
wat bestaan omdat hy die deelnemers se
dosent is.
Deur gebruik te maak van ‘n onafhanklike
persoon vir die werwing van deelnemers, die
verkryging van ingeligte toestemming, die
selektering van deelnemers tot die
eksperimentele en kontrole groepe en die
afneem van toetse vir data insameling, is die
navorser van mening dat hy kwesbaarheid sal
verminder. Die onafhanklike peroon sal
verhoed dat die deelnemers voel dat hulle

Appendix B: Letters of consent 278
gedwing word om aan die navorsing deel te
neem of voel dat hulle beïnvloed word om
deel te neem as gevolg van die student-dosent
verhouding.
Die onafhanklike persoon sal die deelnemers
nie ken nie en ook nie kontak met hulle hê
nie, omdat sy nie klas gee vir eerstejaar-
studente nie. Dit sal verseker dat die
deelnemers nie verplig voel om iets teen hulle
wil te doen nie, of voel dat hulle bedreig
word, onder druk geplaas word of oorreed
word om deel te neem aan die navorsing
omdat die navorser hulle dosent is nie.
Die studie kan nie gedoen word sonder die
insluiting van die groep deelnemers nie. ‘n
Belangrike doel met die studie is om die
deelnemers reeds van hulle eerstejaar af
behoorlik toe te rus om 'n onderrigstrategie te
gebruik om kritiese denke moontlik tydens
onderrig te ontwikkel.
Die navorser kan nie algehele anonimiteit
waarborg nie.
Die onafhanklike persoon/navorser sal die
deelnemers bewus maak van die feit dat,
hoewel dié wat aan die navorsing gaan
deelneem, anoniem sal bly vir die navorser
(hulle dosent) wanneer hulle die voortoetse en
natoetse skryf, algehele anonimiteit nie
gewaarborg kan word nie. Die deelnemers
wat die toetse skryf sal nie anoniem vir die res
van hulle maats wees wat saam met hulle die
toetse skryf nie. Geen resultate sal egter direk
aan ‘n deelnemer se naam gekoppel word nie,
maar aan die nommer wat gebruik sal word
om die deelnemers te identifiseer. Die
onafhanklike persoon wat die verskillende
toetsuitslae sal versamel om vergelykings te
maak, sal weet watter naam aan watter
nommer gekoppel is. Sy sal die inligting
vertroulik hanteer, en slegs die nommer en die
toetsuitlslae aan die navorser en die
onafhanklike statistikus rapporteer.
Deelnemers sal ook bewus gemaak word van
die feit dat hoewel hulle mag besluit om nie
aan die navorsing deel te neem nie, en nie die
toetse skryf nie, hulle steeds onderrig deur
middel van Denkkaarte gaan ontvang. Die
gebruik van Denkkaarte is gekoppel aan die
vakinhoud van die module, LIFE 111 –
Lewenswetenskap, wat hulle moet slaag.

Appendix B: Letters of consent 279
Blootstelling aan die nuwe onderrigstrategie
kan egter vir hulle ook voordelig wees. Die
gebruik van Denkkaarte as onderrigstrategie
gaan dus nie inmeng met normale klastyd nie,
maar deel daarvan vorm.
Die skryf van toetse mag angs en stres
veroorsaak.
Die onafhanklike persoon wat die werwing
sal hanteer en die ingeligte toestemming van u
sal verky, sal die volgende aan u verduidelik:
(i) U hoef nie vir die toetse voor te
berei of te studeer nie.
(ii) Die toetse sal geskryf word in tye
wat vir die deelnemers gerieflik
sal wees, verkieslik gedurende ‘n
oop periode op die rooster sodat
addisionele ryery om die toetse te
skryf, nie sal plaasvind nie. Die
navorser gaan reël vir ‘n vaste
registerperiode op die rooster vir
eerstejaar studente van 2016 vir
hierdie doel.
(iii) Die toetse sal nie invloed
uitoefen op die deelnemer se slaag
of druip van die Lewenswetenskap
module, LIFE 111 nie.
(iv) Die toetsresultate gaan slegs vir
navorsingsdoeleindes gebruik
word om vas te stel of die gebruik
van Denkkaarte effektief is vir die
ontwikkeling of verbetering van
kritiese denkvaardighede of nie.
(v) Die inoud waarop die toetse
gebaseer gaan wees, gaan vir die
deelnemers bekend wees,
aangesien die inhoud reeds in
Graad 12 behandel is. Dit mag
angs verlig.
(vi) Vir die maak van individuele
vergelykings, sal die deelnemers
met behulp van nommers aan die
navorser uitgeken word. Die
navorser sal nie weet wie ‘n toets
gekryf het of nie (die navorser
gaan nie betrokke wees by die
afneem van die toetse nie). Die
onafhanklike persoon sal die
statistikus help om die individuele
toetspunte te selekteer vir die
vergelykings wat gemaak gaan
word. Die navorser sal slegs die
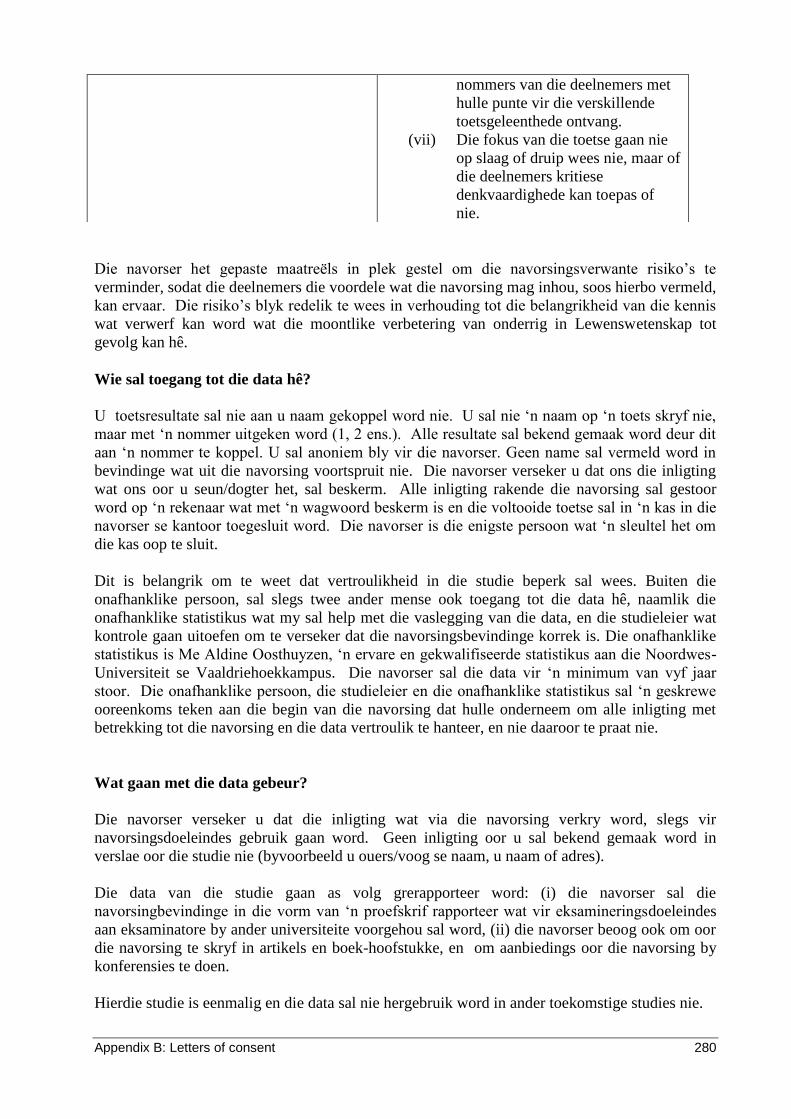
Appendix B: Letters of consent 280
Die navorser het gepaste maatreëls in plek gestel om die navorsingsverwante risiko’s te
verminder, sodat die deelnemers die voordele wat die navorsing mag inhou, soos hierbo vermeld,
kan ervaar. Die risiko’s blyk redelik te wees in verhouding tot die belangrikheid van die kennis
wat verwerf kan word wat die moontlike verbetering van onderrig in Lewenswetenskap tot
gevolg kan hê.
Wie sal toegang tot die data hê?
U toetsresultate sal nie aan u naam gekoppel word nie. U sal nie ‘n naam op ‘n toets skryf nie,
maar met ‘n nommer uitgeken word (1, 2 ens.). Alle resultate sal bekend gemaak word deur dit
aan ‘n nommer te koppel. U sal anoniem bly vir die navorser. Geen name sal vermeld word in
bevindinge wat uit die navorsing voortspruit nie. Die navorser verseker u dat ons die inligting
wat ons oor u seun/dogter het, sal beskerm. Alle inligting rakende die navorsing sal gestoor
word op ‘n rekenaar wat met ‘n wagwoord beskerm is en die voltooide toetse sal in ‘n kas in die
navorser se kantoor toegesluit word. Die navorser is die enigste persoon wat ‘n sleultel het om
die kas oop te sluit.
Dit is belangrik om te weet dat vertroulikheid in die studie beperk sal wees. Buiten die
onafhanklike persoon, sal slegs twee ander mense ook toegang tot die data hê, naamlik die
onafhanklike statistikus wat my sal help met die vaslegging van die data, en die studieleier wat
kontrole gaan uitoefen om te verseker dat die navorsingsbevindinge korrek is. Die onafhanklike
statistikus is Me Aldine Oosthuyzen, ‘n ervare en gekwalifiseerde statistikus aan die Noordwes-
Universiteit se Vaaldriehoekkampus. Die navorser sal die data vir ‘n minimum van vyf jaar
stoor. Die onafhanklike persoon, die studieleier en die onafhanklike statistikus sal ‘n geskrewe
ooreenkoms teken aan die begin van die navorsing dat hulle onderneem om alle inligting met
betrekking tot die navorsing en die data vertroulik te hanteer, en nie daaroor te praat nie.
Wat gaan met die data gebeur?
Die navorser verseker u dat die inligting wat via die navorsing verkry word, slegs vir
navorsingsdoeleindes gebruik gaan word. Geen inligting oor u sal bekend gemaak word in
verslae oor die studie nie (byvoorbeeld u ouers/voog se naam, u naam of adres).
Die data van die studie gaan as volg grerapporteer word: (i) die navorser sal die
navorsingbevindinge in die vorm van ‘n proefskrif rapporteer wat vir eksamineringsdoeleindes
aan eksaminatore by ander universiteite voorgehou sal word, (ii) die navorser beoog ook om oor
die navorsing te skryf in artikels en boek-hoofstukke, en om aanbiedings oor die navorsing by
konferensies te doen.
Hierdie studie is eenmalig en die data sal nie hergebruik word in ander toekomstige studies nie.
nommers van die deelnemers met
hulle punte vir die verskillende
toetsgeleenthede ontvang.
(vii) Die fokus van die toetse gaan nie
op slaag of druip wees nie, maar of
die deelnemers kritiese
denkvaardighede kan toepas of
nie.

Appendix B: Letters of consent 281
Gaan u betaal of vergoed word om aan die studie deel te neem/ is daar enige kostes
betrokke?
U gaan nie betaal of vergoed word om aan die studie deel te neem nie. Verversings sal aan u na
afloop van die toetse verskaf word. Die verversings sal ‘n blyk van waardering wees vir die tyd
wat u opgeoffer het om aan die navorsing deel te neem. Die skryf van die toetse en die onderrig
met behulp van Denkkaarte sal plaasvind gedurende periodes wat op die klasrooster geskeduleer
is. U hoef dus nie vir addisionele vervoer te reël om op ander tye aan die navorsing deel te neem
nie. Geen kostes is dus betrokke by deelname aan die navorsing nie.
Hoe gaan ek weet wat die bevindinge is?
Die algemene bevindinge van die navorsing sal die navorser met u deel via epos of gewone pos
(verskaf asseblief u adres hieronder) deur ‘n kort verslag saam te stel wat aan al die deelnemers
beskikbaar gestel sal word. Alle vrae oor die verslag kan direk aan die navorser gerig word by
die kontakbesonderhede hieronder. U is ook welkom om met die navorser ‘n afspraak te maak
om u vrae te bespreek.
Is daar iets anders wat ek behoort te weet?
U kan mnr. Francois Minnie by 084 549 2583 of [email protected] of sy studieleier, Prof.
Mary Grosser by 083 490 0501 of [email protected], kontak as u enige verdere navrae
het of probleme teekom.
U kan die voorsitter van die Humanities and Health Research Ethics Committee (Prof Linda
Theron) by 016 910 3076 of [email protected] kontak as u enige bekommernis of klagte
het wat nie voldoende deur die navorser aangespreek is nie. U kan ook die mede-voorsitter, Prof.
Tumi Khumalo (016 910 3397 of [email protected]) kontak, of ‘n boodskap vir Linda
of Tumi los by Me Daleen Claasens (016 910 30441).
As u dit moeilik vind om die verduideliking van die navorsing te volg, kontak asseblief die
navorser of die onafhanklike persoon by die kontakbesonderhede hier onder. Hulle sal met u ‘n
tyd reël om die navorser te ontmoet om aan u te verduidelik wat vir u problematies is.
U sal ‘n kopie van die inligting en toestemming ontvang wat u vir u eie rekords kan hou.
Indien u jonger as 18 jaar is, en die navorser kom tydens die navorsing agter dat daar leed aan
jou gedoen word, moet hy iemand daarvan vertel sodat jy hulp kan ontvang.
Verklaring deur student
Deur hier onder te teken, verklaar ek…………………………..dat ek dit goedkeur dat ek aan die
volgende navorsingstudie gaan deelneem: Die impak van Denkkaarte om die ontwikkeling
van kritiese denkvaardighede by eerstejaar voordiens Lewenswetenskap- onderwysers te
koester
Ek verklaar die volgende:

Appendix B: Letters of consent 282
Ek het die inligting gelees en verstaan die inligting in die ingeligte
toestemmingsvorm, en dat dit in ‘n taal geskryf is wat ek gemaklik mee is en vlot
praat.
Ek het ‘n kans gehad om vrae te stel aan die persoon wat die ingeligte toestemming
verkry het sowel as aan die navorser (as hierdie ‘n ander persoon is), en al my vrae is
voldoende beantwoord.
Ek verstaan dat deelname aan die studie vrywillig is, en ek is nie onder druk geplaas
om toestemming te gee dat ek moet deelneem nie.
Ek verstaan dat my toetsresultate in die openbaar bekend gemaak en/of aangehaal
kan word, sonder enige verwysing na my of my ouers se persoonlike identiteit.
Ek mag kies om my enige tyd aan die studie te onttrek, en dit sal vir my geen
penalisering of bevooroordeeldheid inhou nie.
Ek mag gevra word om die studie te verlaat voordat dit voltooi is, as die navorser
voel dat dit in my beste belang is, of as ek nie hou by die navorsingsplan waarop
ooreengekom is nie.
Geteken te (plek) ......................…........…………….. op (datum) …………....……….. 20....
...................................................................... ...................................................................
Handtekening van deelnemer Handtekening van getuie
U mag my weer kontak Ja Nee
Ek wil graag ‘n opsomming van die navorsingsbevindinge Ja Nee
hê
Ek wil graag individuele terugvoer oor die navorsingsbevindinge
hê
Ja Nee
Die beste manier om my te bereik is:
Naam en Van: ________________________________________________
Posadres: ________________________________________________
Epos: ________________________________________________
Telefoonnommer: _____________________
Selfoonnommer: ______________________
Indien die bogenoemde besonderhede verander, kontak asseblief die volgende persoon wat my
goed ken, nie saam met my bly nie en sal help om my te kontak.
Naam en Van:
___________________________________________________________________________
Telefoonommer/ Selfoonnommer /Epos:
___________________________________________________________________________
Verklaring deur persoon wat toestemming verkry
Ek (naam) ……………………………………………..……… verklaar dat:
Ek die inligting in die dokument verduidelik het aan……………………………

Appendix B: Letters of consent 283
Ek hom/haar aangemoedig het om vrae te stel en genoeg tyd toegelaat het om
hom/haar te antwoord.
Ek tevrede is dat hy/sy alle aspekte van die studie soos hierbo bespreek word,
genoegsaam verstaan.
Ek het/het nie ‘n vertaler gebruik het nie.
Die beste manier om my te bereik is:
Naam en Van: ________________________________________________
Posadres: ________________________________________________
Epos: ________________________________________________
Telefoonnommer: _____________________
Selfoonnommer: ______________________
Geteken te (plek) ......................…........…………….. op (datum) …………....……….. 20....
...................................................................... ...................................................................
Handtekening van onafhanklike persoon Handtekening van getuie
Verklaring deur navorser
Ek (naam) ……………………………………………..……… verklaar dat:
Ek die inligting in die dokument verduidelik het aan……………………………
Ek hom/haar aangemoedig het om vrae te stel en genoeg tyd toegelaat het om hom/haar
te antwoord.
Ek tevrede is dat hy/sy alle aspekte van die studie soos hierbo bespreek word,
genoegsaam verstaan.
Ek het/het nie ‘n vertaler gebruik het nie.
Geteken te (plek) ......................…........…………….. op (daum) …………....……….. 20....
...................................................................... ...................................................................
Handtekening van navorser Handtekening van getuie

Appendix B: Letters of consent 284
PARENTS (ENGLISH)

Appendix B: Letters of consent 285
3.
HHREC Stamp
PARTICIPANT INFORMATION LEAFLET
AND CONSENT FORM FOR PARENTS/GUARDIANS OF FIRST
YEAR B.ED. LIFE SCIENCE STUDENTS
TITLE OF THE RESEARCH PROJECT: The impact of Thinking Maps to
enhance the development of critical thinking skills among first year pre-
service Life Science teachers
REFERENCE NUMBERS:
PRINCIPAL INVESTIGATOR/RESEARCHER: Mr Francois Minnie
ADDRESS: SCHOOL OF EDUCATION SCIENCES, NORTH-WEST UNIVERSITY,
HENDRICK VAN ECK BOULEVARD 100, VANDERBIJLPARK
CONTACT NUMBER: 016 910 3074/084 549 2583
You son/daughter is invited to take part in a research project that forms part of my (the
researcher’s) study for a Master’s degree in Education. Please take some time to read the
information presented here, which will explain the details of this project. Please ask the
researcher any questions about any part of this project that you do not fully understand. It is very
important that you are fully satisfied and that you clearly understand what this research is about
and how your son/daughter could be involved. Also, their participation is entirely voluntary and
he/she is free to decline participation. If you say no, this will not affect your son/daughter
negatively in any way whatsoever. You son/daughter is also free to withdraw from the study at
any point, even if you do agree that they take part. You may also ask me to delete
information/data about your son/daughter that I collected. Your son/daughter will also give
consent on his/her own to take part in the study. You need to know that even if you give consent
that your son/daughter may take part, they have the choice to decide if they want to take part in
the research or not.
PO Box 1174, Vanderbijlpark
South Africa, 1900
Web: http://www.nwu.ac.za
DATE: 3 September 2015

Appendix B: Letters of consent 286
This study has been approved by the Humanities and Health Research Ethics Committee
(HHREC) of the Faculty of Humanities of the North-West University (NWU.............) and
will be conducted according to the ethical guidelines and principles of the international
Declaration of Helsinki and the ethical guidelines of the National Health Research Ethics
Council. It might be necessary for the research ethics committee members or relevant authorities
to inspect the research records to make sure that we (the researchers) are conducting research in
an ethical manner.
What is this research study all about?
I am Mr Francois Minnie, the researcher and the Life Science lecturer of your son/daughter, who
would like to involve your son/daughter in my research project, which I am completing for a
Master’s Degree. My research project will be conducted at the North-West University, Vaal
Triangle Campus in Vanderbijlpark.
This research links well with the present teaching and learning situation in South African
schools, where it is expected of teachers to teach learners the skills to identify and solve
problems by means of critical and creative thinking. My study will specifically focus on critical
thinking. In my study, critical thinking will mean that the research participants must be able to
analyze, synthesize and evaluate information. Analysis means to break up information into
smaller parts. Synthesis means to combine different ideas/information into a new idea.
Evaluation means to judge the truth or value of something and motivate your answer.
The main objectives of the study are:
(i) To find out how well the critical thinking skills (analysis, synthesis, evaluation) of
first year Life Science teachers were developed during their school years.
(ii) To find out if the use of Thinking Maps as teaching strategy could enhance the
development of critical thinking skills that might need further development or
improvement. Thinking Maps is a visual learning strategy where a student learns to
process and summarize information in a map. The researcher will apply three
Thinking Maps during the research, namely:
A Circle Map to develop the skill of synthesis
A Tree Map to develop the skill of analysis

Appendix B: Letters of consent 287
A Multi-Flow Map to develop the skill of evaluation
Although many international studies have found the Thinking Maps strategy to be successful for
developing thinking skills, no studies have been conducted to test the effectiveness of Thinking
Maps as teaching strategy to develop critical thinking skills among Life Science student teachers
in the South African context; especially skills like analysis, synthesis and evaluation. These
skills are important for mastering the subject content of Life Science at first year B.Ed.-level.
The researcher would like to include all the 2016 first year B.Ed.-students with Life Science as
major subject in the research. The researcher will recruit the research participants by obtaining
permission from the Director of the School of Education Sciences, Prof. J.E. Fourie, who will act
as a gatekeeper to gain entry to the students. Based on the numbers of students who enrolled for
Life Science during the past two years, about 60-70 students will take Life Science as major
subject in 2016. This group of students will be a new group of students who have not yet been
exposed to, or overburdened by research at the university.
Why has your son/daughter been invited to participate?
It will be important to do the research with your son/daughter, as the researcher is their Life
Science lecturer and firstly want to use a new teaching strategy to improve the quality of my own
teaching practice. Secondly, the researcher was a Life Science teacher for many years, and know
that teachers do not know about teaching strategies that they could use to develop the critical
thinking skills of learners in Life Science. Doing the research with first year Life Science student
teachers will give him the chance to teach a strategy to a group of Life Science teachers which
they could use to possibly nurture critical thinking more effectively at school-level, when they
start teaching. The focus is on first year participants, as the researcher wants to teach them how
to use the strategy in their first year of study and then encourage them to apply it throughout
their four years of training, so that when they start teaching, they might be good at guiding the
learners whom they will teach to use the strategy too. The researcher has been trained by an
accredited Thinking Maps trainer to apply the strategy.
In summary, your son/daughter has been selected to take part in the research because:
(i) He/she is a first year, male or female BEd-student from any ethnic and language
group at the North-West University, Vaal Triangle Campus in Vanderbijlpark, who
passed Life Science at matric level.
(ii) He/she is a first year BEd-student with Life Science as one of his/her major subjects.

Appendix B: Letters of consent 288
Exclusion criteria: Participants will not be involved in the study if they are a second, third or
fourth year B.Ed.-Life Science student at the North-West University, Vaal Triangle Campus in
Vanderbijlpark or any other university.
What will your son’s/daughter’s responsibilities be?
The researcher will make use of an independent person, Ms. Daphne Strauss, an experienced,
secondary school teacher, who will recruit the participants for the research project. The
researcher will train her for this purpose. An independent observer, Ms. Aldine Oosthuyzen, who
knows the study well, as she will be the independent statistician who will capture the data and
assist with the analysis of data, will assist her. Moreover, Ms. Oosthuyzen is a member of the
Ethics Committee of the School of Economic Sciences and IT at the NWU, Vaal Triangle
Campus, with a good understanding of ethical research principles, who will be able to oversee
that the work of Ms. Strauss is in line with good ethical practice. Neither Ms. Strauss nor Ms.
Oosthuyzen will have any relationship with the LIFE 111 students.
The recruitment will involve a short one-hour and 20 minutes presentation about the study in the
Life Science lecture room at the university, to all the 2016 B.Ed. first year Life Science students,
after which the independent person will hand the informed consent forms to the participants and
explain the information to the participants and request them to take home the forms where they
have privacy to complete the form at their own time. The recruitment will take place at the
beginning of the year during an hour register period on the timetable before classes commence.
If your son/daughter is absent during the recruitment session and they are interested to take part
in the research, the independent person will be requested to conduct a follow-up session with all
the participants who missed the first recruitment session, at a time convenient to the independent
person and the participants.
In advance, the researcher will request the B.Ed. Programme Manager, Dr. Elize Küng, to
accommodate a register period on the timetable for first year students during 2016, preferably on
the same day as the LIFE 111 lectures. The researcher could then utilize this period for other
administrative issues related to the research, such as receiving the informed consent, the writing
of pretests and posttests, giving participants opportunity to share their views about the research
and to receive feedback about the research. The researcher will allow one week to pass between
the recruitment and the obtaining of informed consent, to give participants time to think about
the study and whether they want to take part or not. After one week, the independent person will
meet with the research participants and collect the informed consent forms during a register
period in the Life Science lecture venue. The participants who decide to take part in the research
will then be divided into an experimental and control group by the independent person.
Participants will receive a number, which they will use when writing the different tests. If a
participant decides to withdraw from the research, they do not need to complete the pretests and
posttests and do not have to attend the discussion and feedback sessions. As the research
involves the teaching of the Life Science content, a participant will however still need to attend
class in one of the groups, A or B.
If your son/daughter takes part in the research, he/she will be part of an experimental and control
group on a rotation basis during two experiments, experiment 1 and 2, that will run for six weeks
each during the first semester (February to May 2016). These groups will be referred to as Group
A and B, with no specific indication to the participants of which group will constitute the
experimental or control group. The experimental group and control group will consist of
approximately 30 participants each. The participants of the experimental and control groups will
be determined by die independent person, who will divide the participants into the groups by

Appendix B: Letters of consent 289
keeping a balanced and equal division in terms of gender, language, ethnic group, type of school
attended and matric result for Life Science.
The experimental group will be the group of participants where the researcher will use the new
Thinking Maps strategy for a period of six weeks to see if the strategy will help the participants
to improve in using critical thinking skills. The control group will be the group of participants
who will not receive teaching with the new Thinking Maps strategy. The researcher will do
normal lecturing with them for a period of six weeks. In both groups, the researcher will deal
with the same subject content. If your son/daughter is part of the experimental group during
experiment 1, he/she will then be part of the control group during experiment 2, and vice versa.
All the participants will therefore get a chance to receive instruction with the Thinking Maps
strategy.
As the first year Life Science content is the same as the content dealt with at Grade 12-level, the
researcher will use pretests to measure how well your son/daughter has developed the critical
thinking skills to analyse, synthesise and evaluate information in Life Science content at school.
A pretest, pretest 1, will be written at the beginning of experiment 1, based on the learning
content that will be dealt with in the first six weeks of semester 1. In the same way, pretest 2 will
be written at the beginning of experiment 2, based on the learning content that will be dealt with
in the last six weeks of semester 1. The pretests are mainly used to find out how well your
son/daughter developed critical thinking skills at school, before the researcher teaches them to
use the Thinking Maps strategy. In total, your son/daughter will write 2 pretests of
approximately 30 minutes each.
Based on the pretest results, the researcher will develop the Thinking Maps teaching programme
to address the problems with critical thinking that the researcher noted in the pretest results at the
beginning of the first six weeks and second six weeks of the first semester during 2016. If the
pretests should indicate that the participants do not experience problems with the critical thinking
skills, the researcher will still apply the strategy to determine if it could improve on their present
application of the critical thinking skills.
The Life Science participants have 2 periods per week of 1 hour and 20 minutes each on the
university timetable. One of the periods is a practical period, and the researcher will not apply
the Thinking Maps strategy during the practical period, but continue with normal lectures. The
remaining period that focuses on theoretical subject content will be used for applying the
Thinking Maps strategy. The teaching in the experimental and control groups will take place at
separate times on the timetable and in separate venues. The control group will receive normal
lectures during a class period (1 hour and 20 minutes) as allocated by the university once a week.
The experimental group will receive teaching with the Thinking Maps once a week, during
another period (1 hour and 20 minutes).
On conclusion of the Thinking Maps teaching programme with each group, a posttest 1 (after the
first six weeks of semester 1) and posttest 2 (after the last six weeks of semester 2), will be
written to see if the Thinking Maps assisted your son/daughter to develop or improve the critical
thinking skills of analysis, synthesis and evaluation in the context of the subject content dealt
with in each experiment respectively. In total, your son/daughter will write 2 posttests of 30
minutes each.

Appendix B: Letters of consent 290
The table below summarizes the implementation of the research experiment.
The pre- and posttests will contain 15 multiple-choice items each with one correct answer, and a
follow-up open question for each multiple-choice answer where your son/daughter needs to
motivate an answer. Your son/daughter needs to motivate his/her answers to avoid that he/she
guesses answers in the multiple-choice test. The motivation will also indicate to me how well
your son/daughter can reason/argue. The multiple-choice questions will have an equal number of
questions to test the skills to analyze (5 questions), synthesize (5 questions) and evaluate (5
questions). The questions in the pre- and posttests will not be the same, as they will be based on
the subject content of the first and second six weeks of the semester, respectively. However, the
difficulty of the test and the skills tested, namely analysis, synthesis and evaluation, will remain
the same. To make sure that the difficulty level of all the tests will be the same, the researcher
will involve four experienced Life Science university lecturers to verify the difficulty level of all
the tests independently. The researcher will adhere to their comments and adapt tests if
necessary.
An example of how the questions will be asked follows below.
At the end of the research, the researcher will compare the pretest and posttest results of all the
participants to see which strategy assisted the participants the best to develop their critical
thinking skills, the Thinking Maps strategy or normal lecturing. As suggested by the independent
statistician who will assist the researcher with the data analysis, comparisons of the test results of
Weeks 1-6: Semester 1- Experiment 1: February – Mid-March 2016
Pretest 1 Experimental group
Thinking Maps
6 weeks
Control group
Normal class teaching
(lecturing): 6 weeks
Posttest 1
Groups rotate
Weeks 7-12: Semester 1 – Experiment 2: April – Mid May 2016
Prestest 2 Experimental group
Normal class teaching
(lecturing): 6 weeks
Control group
Thinking Maps
6 weeks
Posttest 2
Choose the correct answer by drawing a circle around the correct answer (1-4). Motivate in writing
why you chose the answer.
Proteins are made from amino acids by the process of:
1.hydrolysis
2.pinocytosis
3.active transport
4.dehydration synthesis
Correct Answer Number: 4
Motivation: Proteins are large chains of amino acids combined by dehydration synthesis, where
by molecules join by removing water. Hydrolysis breaks down proteins into amino acids.
Pinocytosis is a method of ingesting large insoluble molecules, and is a form of active transport.

Appendix B: Letters of consent 291
individual students will also be done, as it could be that individual participants benefit more from
the new strategy than the group of participants. For this purpose each participant will receive a
number that they will use throughout the research on their pretests and posttests so that it will be
possible for the researcher to do comparisons of the different tests by using the number of the
participants.
Opportunities for participants to share their opinions about the research, as well as opportunities
for feedback about the research will be scheduled.
In summary, your son’s/daughter’s involvement will entail the following: (Exact dates and times
to be provided when the 2016 time table has been finalized)
1.Invitation and explanation of informed consent (1 hour and 20 minutes during)
2.Completing informed consent (At home, 1 week)
3.Submit informed consent.
4.Selection to an experimental and a control group.
5.Writing pretests (30 minutes) before taking part in Experiment 1 during the LIFE 111 lectures:
The implementation of the Thinking Maps strategy for six weeks, 1 hour and 20 minutes per
week as part of the experimental group, or as part of the control group who will receive normal
lecturing for six weeks, 1 hour and 20 minutes per week.
6.Writing posttests (30 minutes) after the implementation of the Thinking Maps strategy and
normal lecturing for six weeks (1 hour and 20 minutes respectively), as part of Experiment 1.
7.Taking part in a reversed experiment, Experiment 2, during the LIFE 111 lectures where the
experimental group becomes the control group who will receive normal lecturing for six weeks
(1 hour and 20 minutes per week), and the control group becomes the experimental group who
will receive teaching with the Thinking Maps strategy for six weeks, 1 hour and 20 minutes per
week. The writing of pretests (30 minutes) and posttests (minutes) will apply before and after
the six weeks.
8.One discussion session to obtain feedback from students after the implementation of the
Thinking Maps strategy during Experiment 2 (1 hour and 20 minutes during a register period).
9.Feedback about the research: Feedback 1: 3 weeks after the implementation of Experiment 1 (1
hour and 20 minutes during a register period). Feedback 2: 3 weeks after the implementation of
Experiment 2 (1 hour and 20 minutes during a register period).
10. Final feedback about the research findings (1 hour and 20 minutes during a register period).
Will your son/daughter benefit from taking part in this research?
The direct benefits for your son/daughter as participant will probably be the following:
(i) He/she might acquire critical thinking skills with the Thinking Maps teaching strategy
to enable him/her to analyze, synthesize and evaluate information more effectively.
(ii) The Thinking Maps strategy is also a learning strategy that could assist him/her to
learn and study better and possibly improve his/her academic performance in any
subject.
(iii) Another benefit would be that your son/daughter would probably possess an
effective strategy that he/she could use when he/she starts teaching.

Appendix B: Letters of consent 292
The indirect benefit will probably be that:
(i) Researchers at other universities could be informed about the benefits of Thinking
Maps as teaching strategy to develop critical thinking skills and conduct further
studies in other contexts to prove the benefits of the strategy for developing critical
thinking skills on a larger scale.
(ii) The research findings could be used to make recommendations to the Department of
Education, regarding the possible improvement of the teaching practices of Life
Science teachers in order to ensure that critical thinking skills will be developed in
classrooms at school.
(iii) The teaching practice of the greater population of Life Science teachers could benefit
if the Thinking Maps strategy holds merits for developing critical thinking in Life
Science, and the message be communicated to Schools of Education Sciences at
Universities who could incorporate training in the use of the strategy into the teacher-
training curriculum.
Are there risks involved in your son/daughter taking part in this research and how will
these be managed?
The possible risks in this study, and how I will manage them, are summarised in the table below:
Probable/possible risks/discomforts Strategies to minimize risk/discomfort
Conflict of interest and the power
relationship due to the fact that the
researcher will also be the participants’
Life Science lecturer.
The researcher acknowledges that the
group of participants will be a vulnerable
group due to the conflict of interest and
hierarchical lecturer-student relationship
that will exist, because he is the lecturer
of the participants.
However, the use of an independent
person to do the recruitment of the
participants, obtain informed consent, do
the selection of the participants to the
experimental and control groups, and
administer tests for data collection could
reduce vulnerability. Using an
independent person will avoid
participants feeling coerced to take part
in the research, and avoid their being
influenced by the student-lecturer
relationship, so that vulnerability could
be reduced.
The independent person will not know or
have any contact with these participants
and will not lecture to any first year
participants. This will ensure that the
participants will not be forced to do
something against their will, or be
threatened, pressurized or persuaded with

Appendix B: Letters of consent 293
force to take part in the study to please
their lecturer. The study cannot be done
without including this group of
participants, as the aim is to prepare them
from their first year to apply a teaching
strategy adequately that could enhance
critical thinking during teaching.
The researcher cannot guarantee
complete anonymity.
The independent person will make the
participants aware of the fact that
although those who agreed to take part in
the pre- and posttest writing will remain
anonymous to the researcher (their
lecturer), absolute anonymity cannot be
guaranteed during the writing of the
pretests and posttests. Those who agree to
write the tests will not be anonymous to
their peers who will write the tests
together with them. However, no results
will be linked to individual participants,
as numbers will be used to identify
participants. The independent person who
will collect the various test results of the
participants for comparison purposes will
know which name is linked to a specific
number. She will keep the information
confidential and will only report numbers
and results to the researcher and
independent statistician.
Participants will also be made aware of
the fact that although they might not
consent to write the tests, they will still
have to receive teaching with the
Thinking Maps strategy, as the strategy
will be linked to the compulsory subject
content of the module (LIFE 111 - Life
Science) which they have to pass.
Exposure to the new teaching strategy
could also be beneficial to them. The
Thinking Maps strategy will not interfere
with normal teaching time, but will form
part of it.
Writing tests might cause anxiety and
stress.
The independent person who will do the
recruitment and obtain informed consent
will explain the following to your
son/daughter :
They do not need to prepare or study for
the tests.

Appendix B: Letters of consent 294
The tests will be written at times
convenient to the participants, preferably
during a free period on the timetable, to
avoid additional traveling to write the
tests. For this purpose, the researcher will
arrange for a fixed register period on the
timetable for the first year students of
2016.
The tests will not influence the
participants’ passing or failing the Life
Science module, LIFE 111.
The test results will only be used for
research purposes to find out if the
Thinking Maps strategy is effective for
developing critical thinking skills or not.
The content on which the tests will be
based will also be known to the
participants as they would have done the
content in Grade 12. This might reduce
anxiety.
(i) For the purpose of making
individual comparisons
between the test results,
participants will be identified
by means of numbers to the
researcher. The researcher
will not know who took part
in writing the tests (he will not
be involved in the
administering of the tests).
The independent person will
assist the statistician with
selecting the individual tests
for comparison purposes. The
researcher will only receive
the numbers of the
participants with the various
test results.
(ii) The focus will not be on
passing or failing the test, but
how well participants can
apply critical thinking.
The researcher has planned for appropriate measures to minimize research-related risks, so that
the participants could experience the benefits that the research could hold, as noted above. The
risks appear to be reasonable in relation to the importance of knowledge to be gained that can
possibly improve the teaching and learning of Life Science.

Appendix B: Letters of consent 295
Who will have access to the data?
Your son’s/daughter’s test results will not be linked to his/her name. He/she will not write
his/her name on the test, but will be identified by a number (1, 2, etc.). All results that will be
reported will be linked to a number. He/she will remain anonymous, and his/her name will not be
mentioned in the findings that will emanate from the research. The researcher assures you that
we will protect the information we have about your son/daughter. All information regarding the
research will be stored on a password-protected computer and the completed tests will be locked
up in a cupboard in my office. The researcher is the only person who has a key to unlock the
cupboard.
It is important to inform you that confidentiality will be limited in the study. Apart from the
independent person, only two other people will have access to the data, namely the independent
statistician who will assist me with the capturing of the data, and my supervisor who will check
and verify that my research findings are correct. The independent statistician is Ms. Aldine
Oosthuyzen, who is an experienced and qualified statistician at the North-West University, Vaal
Triangle Campus. I will store the data for a minimum of five years. The independent person, the
study leader and independent statistician will sign a written agreement at the beginning of the
study that they will keep all information about the study and the findings of the study
confidential, and not talk about it.
What will happen to the data?
The researcher assures you that the information obtained via the research will be used for
research purposes only, and no information about your son/daughter will be made known in
reporting about the study (for example your name, his/her name or an address). The data from
this study will be reported in the following ways: (i) The researcher will report the findings in the
form of a dissertation that will be submitted to examiners at other universities for examination
purposes, (ii) The researcher also intends to write about the research in articles and book
chapters, and speak about the research at conferences.
This is a once-off study, so the data will not be re-used in any other studies, which I may do in
future.
Will your son/daughter be paid/compensated to take part in this study and are there any
costs involved?
Your son/daughter will not be paid/compensated to take part in the study, but refreshments will
be given to him/her after the completion of each test. This will serve as a token of appreciation
that he/she was willing to become part of the research. The writing of the tests and the
application of the Thinking Maps strategy take place during periods on the normal timetable of
the participants, and during normal lecturing time. Your son/daughter does not have to arrange
for additional traveling to participate. No costs will be involved in taking part in the study.
How will you know about the findings?
The general findings of the research will be shared with you via email or post (please provide
your address below) by the researcher who will compile the final findings in a short report that
will be provided to all the parents/guardians of the research participants. All questions about the

Appendix B: Letters of consent 296
report can be directed to the researcher at the contact details below. Alternatively, you are
welcome to schedule an appointment with the researcher to discuss your questions.
Is there anything else that you should know or do?
You can contact Mr Francois Minnie at 084 549 2583 or [email protected] or his
studyleader, Prof. Mary Grosser at 083 490 0501 or [email protected], if you have any
further queries or encounter any problems.
You can contact the chair of the Humanities and Health Research Ethics Committee (Prof Linda
Theron) at 016 910 3076 or [email protected] if you have any concerns or complaints
that have not been adequately addressed by the researcher. You can also contact, the co-chair,
Prof Tumi Khumalo (016 910 3397 or [email protected]). You can leave a message for
either Linda or Tumi with Ms. Daleen Claasens (016 910 30441).
If you have difficulty in following and understanding the explanation of the research, please
contact the researcher or the independent person at the details below, and they will arrange a
time with you to meet with the researcher to explain what is problematic to you.
You will receive a copy of this information and consent form for your own records.
Declaration by parent
By signing below, I …………………………………..…………., agree that my son/daughter
…………………………. may take part in a research study entitled: The impact of Thinking
Maps to enhance the development of critical thinking skills among first year pre-service
Life Science teachers
I declare that:
I have read and understood this information and consent form and it is written in a
language with which I am fluent and comfortable.
I have had a chance to ask questions to both the person obtaining consent, as well as
the researcher (if this is a different person), and all my questions have been
adequately answered.
I understand that taking part in this study is voluntary and I have not been
pressurised to give consent that my son/daughter may take part.
I understand that my son/daughter’s test results could be reproduced publically
and/or quoted, but without reference to his/her or my personal identity.
My son/daughter may choose to leave the study at any time and will not be penalised
or prejudiced in any way.
My son/daughter may be asked to leave the study before it has finished, if the
researcher feels it is in my son’s/daughter’s best interests, or if my son/daughter does
not follow the study plan, as agreed to.
Signed at (place) ......................…........…………….. on (date) …………....……….. 20....

Appendix B: Letters of consent 297
...................................................................... ...................................................................
Signature of participant Signature of witness
You may contact me again Yes No
I would like a summary of the findings of this research Yes No
The best way to reach me is:
Name & Surname: ________________________________________________
Postal Address: ________________________________________________
Email: ________________________________________________
Phone Number: _____________________
Cell Phone Number: ______________________
In case the above details change, please contact the following person who knows me well and
who does not live with me and who will help you to contact me:
Name & Surname:
___________________________________________________________________________
Phone/ Cell Phone Number /Email:
___________________________________________________________________________
Declaration by person obtaining consent
I (name) ……………………………………………..……… declare that:
I explained the information in this document to …………………………………..
I encouraged him/her to ask questions and took adequate time to answer them.
I am satisfied that he/she adequately understands all aspects of the research, as
discussed above
I did not use an interpreter.
The best way to reach me is:
Name & Surname: ________________________________________________
Postal Address: ________________________________________________
Email: ________________________________________________
Phone Number: _____________________
Cell Phone Number: ______________________
Signed at (place) ......................…........…………….. on (date) …………....……….. 20....
...................................................................... ...................................................................
Signature of independent person Signature of witness

Appendix B: Letters of consent 298
Declaration by researcher
I (name) ……………………………………………..……… declare that:
I explained the information in this document to …………………………………..
I encouraged him/her to ask questions and took adequate time to answer them.
I am satisfied that he/she adequately understands all aspects of the research, as
discussed above
I did/did not use an interpreter.
Signed at (place) ......................…........…………….. on (date) …………....……….. 20....
...................................................................... ...................................................................
Signature of researcher Signature of witness

Appendix B: Letters of consent 299
PARENTS (AFRIKAANS)

Appendix B: Letters of consent 300
4.
HHREC Stempel
DEELENEMER SE INLIGTINGSBROSJURE EN
INGELIGTE TOESTEMMINGSVORM VIR OUERS/VOOGDE
VAN B.ED. EERSTEJAAR STUDENTE IN
LEWENSWETENSKAP
Titel van navorsingsprojek: Die impak van Denkkaarte om die ontwikkeling
van kritiese denkvaardighede by eerstejaar voordiens Lewenswetenskap-
onderwysers te koester
VERWYSINGSNOMMER :
HOOF NAVORSER: Mnr Francois Minnie
ADRES: SKOOL VIR OPVOEDKUNDIGE WETENSKAPPE, NOORDWES-
UNIVERSITEIT, HENDRICK VAN ECK BOULEVARD 100, VANDERBIJLPARK
KONTAKNOMMER: 016 910 3074/084 549 2583
U seun/dogter word uitgenooi om deel te neem aan ‘n navorsingsprojek wat deel vorm van my
studie vir die verwerwing van ‘n Meestersgraad in Opvoedkunde. Gebruik asseblief tyd om deur
die inligting wat hier aangebied word om die navorsingsprojek te verduidelik, te lees. Vra
asseblief vrae aan die navorser oor enige deel van die projek wat u nie ten volle verstaan nie. Dit
is baie belangrik dat u heeltemal tevrede voel en duidelik verstaan waaroor die navorsing gaan
en hoe u seun/dogter betrek kan word. U seun of dogter se deelname is heeltemal vrywillig en
hy/sy mag te enige tyd deelname aan die navorsing van die hand wys. As u nie toestemming gee
dat u seun/dogter aan die navorsing mag deelneem nie, sal dit hom/haar geensins negatief
beïnvloed nie. U seun/dogter mag ook enige tyd hom/haar aan die studie onttrek, al sou u
toestem dat hy/sy aan die navorsing mag deelneem. U mag my ook versoek om enige
inligting/data wat ek oor u seun/dogter ingesamel het te vernietig. U moet ook weet dat al gee u
toestemming dat u seun/dogter aan die navorsing mag deelneem, hy/sy self mag besluit of hulle
toestemming gaan gee om aan die studie deel te neem,
Posbus 1174, Vanderbijlpark
Suid Afrika, 1900
Web: http://www.nwu.ac.za
DATUM: 3 September 2015

Appendix B: Letters of consent 301
Hierdie studie is goedgekeur deur die Humanities and Health Research Ethics Committee
(HHREC) van die Fakulteit Geesteswetenskappe aan die Noord-Wes Universiteit, Vaal
Driehoekkampus, Vanderbijlpark. Die navorsing sal uitgevoer word in ooreenstemming met
die etiese riglyne en beginsels van die internasionale Deklarasie van Helsinki en die National
Health Research Ethics Council. Dit mag nodig wees dat lede van die etiekkomitee of relevante
gesaghebbendes die navorsing ondersoek om seker te maak dat die navorser die navorsing op ‘n
etiese manier uitvoer.
Waaroor gaan die navorsing?
Ek is mnr Francois Minnie, die navorser en u seun/dogter se dosent in Lewenswetenskap, wat
graag wil dat u seun/dogter aan my navorsingsprojek, wat ek vir my Meestersgraad in
Opvoedkunde wil voltooi, deelneem. My navorsingsprojek sal by die Noordwes-Universiteit se
Vaal Driehoekkampus in Vanderbijlpark uitgevoer word.
Die navorsing skakel goed met die huidige onderrig en leersituasie in Suid-Afrikaans skole, waar
dit van onderwysers verwag word om leerders vaardighede te leer om probleme op te los deur
middel van kritiese en kreatiewe denke. My studie gaan spesifiek op kritiese denke fokus. In
my studie gaan kritiese denke soos volg verstaan word: Die deelnemers aan die navorsing moet
in staat wees om inligting te analiseer, sintetiseer en evalueer. Om inligting te analiseer beteken
om inligting in kleiner dele op te breek. Sintese beteken om verskillende idees of inligting te
kombineer om ‘n nuwe idee te vorm. Om te evalueer beteken om die waarheid of waarde van
iets te beoordeel en ‘n antwoord te motiveer.
Die belangrikste doelstellings van die studie is:
(i) Om vas te stel hoe goed die kritiese denkvaardighede (analise, sintese en evaluering)
by eerstejaar Lewenswetenskap-studentonderwysers ontwikkel is gedurende hulle
skoolloopbane.
(ii) Om vas te stel of die gebruik van Denkkaarte as onderrigstrategie die ontwikkeling
van kritiese denkvaardighede wat moontlik verdere ontwikkeling nodig het, of
verbeter kan word, kan bevorder. Denkkaarte is ‘n visuele leerstrategie waar ‘n
student leer om inligting hulle eie te maak deur dit op te som met behulp van ‘n kaart.
Ek gaan van drie strategieë tydens die navorsing gebruik maak, naamlik:
‘n Sirkelkaart om sintese as vaardigheid te ontwikkel
‘n Boomkaart om analise as vaardigheid te ontwikkel

Appendix B: Letters of consent 302
‘n Multi-vloeikaart om evaluasie as vaardigheid te ontwikkel
Alhoewel baie internasionale studies bevind het dat Denkkaarte suksesvol is vir die ontwikkeling
van denkvaardighede, is nog geen studies gedoen om die effektiwiteit van Denkkaarte as
onderrigstrategie vir die ontwikkeling van kritiese denkvaardighede by Lewenswetenskap-
studentonderwysers in die Suid-Afrikaanse konteks vas te stel nie, veral nie die vaardighede
soos analise, sintese en evaluasie nie. Hierdie vaardighede is belangrik vir die bemeestering van
die Lewenswetenskap-vakinhoud op eerstejaar B.Ed.-vlak.
Die navorser wil graag alle 2016 eerstejaar B.Ed.-studente met Lewenswetenskap as hoofvak by
die navorsing betrek. Die navorser sal die deelnemers aan die navorsing werf deur toestemming
te verkry by die Direkteur van die Skool vir Opvoedkundige Wetenskappe, Prof. J.E. Fourie, wat
as hekwagter sal optree om vir hom toegang tot die studente te gee.
Gebaseer op die getalle van studente wat die afgelope twee jaar ingeskryf het met
Lewenswetenskap as hoofvak, sal ongeveer 60-70 studente in 2016 Lewenswetenskap as
hoofvak neem. Ek wil graag met hierdie nuwe groep studente werk aangesien hulle nog nie
blootgestel was aan of oorlaai is met navorsing wat by die universiteit onderneem word nie.
Hoekom is u seun/dogter genooi om deel te neem?
Dit sal belangrik wees om navorsing met u seun/dogter te doen, aangesien ek hulle
Lewenswetenskapdosent is wat self die nuwe onderrigstrategie wil gebruik om die kwaliteit van
my eie onderrigpraktyk te verbeter. Tweedens was ek baie jare lank ‘n Lewenswetenskap-
onderwyser, en weet dat onderwysers nie kennis het van onderrigstrategieë wat hulle kan gebruik
om kritiese denkvaardighede in Lewenswetenskap te verbeter nie. Om navorsing met die
eerstejaar Lewenswetenskap-studentonderwysers te doen sal my ‘n kans gee om ‘n strategie vir
‘n groep eerstejaar Lewenswetenskap-studentonderwysers aan te leer wat hulle sou kon gebruik
om kritiese denke moontlik meer effektief te koester op skoolvlak as hulle begin skoolhou. Die
fokus is op eerstejaar studente omdat ek hulle reeds in hul eerste jaar wil leer hoe om die
strategie te gebruik, en hulle dan aan te moedig om die strategie toe te pas gedurende hulle vier
jaar van opleiding, sodat hulle, wanneer hulle begin skool hou moontlik goeie leiding aan
leerders sal kan gee om ook die strategie te gebruik. Ek is opgelei deur ‘n geakkrediteerde
opleier om Denkkkaarte te gebruik.
Opsommenderwys, is u seun/dogter gekies om deel te neem aan die studie omdat:
(i) Hy/sy ‘n manlike of vroulike eerstejaar B.Ed.-student aan die Noordwes-Universiteit
se Vaaldriehoekkampus in Vanderbijlpark is, en afkomstig is van enige etniese en
taalgroep, en Lewenswetenskap op matriekvlak geslaag het .
(ii) Hy/sy is ‘n eerstejaar B.Ed.-student wat Lewenswetenskap as een van sy/haar
hoofvakke neem.

Appendix B: Letters of consent 303
Deelnemers sal nie by die studie betrek word as hulle ‘n tweedejaar, derdejaar of vierdejaar
B.Ed.-student aan die Noordwes-Universiteit se Vaaldriehoekkampus in Vanderbijlpark of enige
ander universiteit is nie.
Wat sal u seun/dogter se verantwoordelikhede wees?
Ek gaan gebruik maak van ‘n onafhanklike persoon, Me Daphne Strauss, ‘n ervare, sekondêre
skool onderwyseres, wat gaan help met die werwing van die deelnemers vir die
navorsingsprojek. Die navorser sal haar oplei vir hierdie doel. Sy sal bygestaan word deur ‘n
onafhanklike waarnemer, Mev. Aldine Oosthuyzen. Mev. Oosthuyzen ken die studie goed omdat
sy as onafhanklike statistikus die vaslegging van data gaan doen en behulpsaam gaan wees met
die analise van die data. Mev. Oosthuyzen is ook ‘n lid van die Etiese Komitee van die Skool vir
Ekonomiese Wetenskappe en IT aan die NWU, Vaal Driehoekkampus, en het ‘n goeie begrip
van etiese beginsels tydens navorsing. Sy sou dus tydens haar waarneming kon verseker dat die
werk van Mev. Strauss voldoen aan goeie etiese praktyk. Mev. Strauss en Mev. Oosthuyzen sal
geen verbintenis met die LIFE 111 studente hê nie.
Die werwing gaan ‘n kort een-uur aanbieding aan al die 2016 Lewenswetenskap eerstejaar
B.Ed.-studente in die Lewenswetenskap-lesinglokaal by die universiteit behels. Daarna sal die
onafhanklike persoon die ingeligte toestemmingsvorms aan die deelnemers uitdeel, die inligting
verduidelik en aan die deelnemers noem dat hulle self ook deur die inligting moet werk, die
vorms huis-toe moet neem en op hulle eie tyd en in privaatheid die vorm moet voltooi en aandui
of hulle wil deelneem aan die navorsing of nie. Die werwing sal aan die begin van die jaar,
voordat die klasse begin, plaasvind tydens ‘n registerperiode op die rooster. Indien u seun/dogter
afwesig is tydens die werwingsessie en hy/sy stel belang om aan die navorsing deel te neem, sal
die onafhanklike persoon versoek word om ‘n opvolgsessie te skeduleer met al die deelnemers
wat afwesig was op ‘n tyd wat gerieflik is vir die onafhanklike persoon en die deelnemers.
Die navorser sal vroegtydig aan die B.Ed.-programbestuurder, Dr Elize Küng, ‘n versoek rig dat
daar voorsiening gemaak moet word vir ‘n registerperiode op die rooster vir die 2016 eerstejaar
BEd-studente,verkieslik op dieselfde dag as die LIFE 111 lesings. Die navorser sou dan hierdie
periode kon gebruik vir administatiewe sake rondom die navorsing, soos vir die ontvang van die
ingeligte toestemmingsvorms, die skryf van voortoetse en natoeste, geleentheid om die
deelnemers kans te gee om hul sienings oor die navorsing te deel en om terugvoer oor die
navorsing te gee. Die navorser sal sorg dat een week verloop tussen die werwing en die inneem
van ingeligte toestemming, om deelnemers die kans te gee om na te dink oor die studie en of
hulle wil deelneem of nie. Na een week sal die onafhanklike persoon weer die deelnemers
ontmoet, en die ingeligte toestemmingsvorms inneem. Die deelnemers wat besluit om deel te
neem aan die navorsing sal dan deur die onafhanlike persoon in eksperimentele en kontrole
groepe verdeel word. Deelnemers sal ‘n nommer ontvang wat hulle tydens die skryf van die
toetse gaan gebruik. As u seun/dogter besluit om aan die navorsing te onttrek, hoef hy/sy nie die
voortoetse en natoetse te skryf nie, en ook nie die bespreking en terugvoersessies by te woon nie.
Aangesien die navorsing die onderrig van die Lewenswetenskap vakinhoud behels, sal u
seun/dogter steeds die klas moet bywoon in een van die Groepe, A of B.
Indien u seun/dogter aan die navorsing gaan deelneem, sal hy/sy deel wees van ‘n
eksperimentele en kontrole groep wat op rotasiebasis tydens die navorsing aan twee
eksperimente, eksperimente 1 en 2, wat elk vir ses weke lank gedurende die eerste semester
(Februarie tot Mei 2016) sal plaasvind, gaan deelneem. Hierdie groepe sal bekend staan as Groep
A en B, sonder om enige aanduiding aan deelnemers te gee watter groep die eksperimentele
groep en watter groep die kontrole groep is. Die eksperimentele groep en kontrole groep sal elk

Appendix B: Letters of consent 304
uit ongeveer 30 deelnemers bestaan. Die deelnemers vir die eksperimentele en kontrole groepe
sal deur die onafhanlike persoon/navorser bepaal word, deur deelnemers min of meer
gebalanseerd en gelykop ten opsigte van geslag, taal, etniese groep, tipe skool bygewoon en
matriekpunt vir Lewenswetenskap in die eksperimentele en kontrole groepe in te deel.
Die eksperimentele groep sal die groep deelnemers wees waar ek die nuwe onderrigstrategie,
Denkkaarte, vir ‘n tydperk van ses weke sal gebruik om vas te stel of die nuwe strategie die
deelnemers sal help om hul kritiese denkvaardighede te verbeter. Die kontrole groep sal die
groep deelnemers wees wat nie onderrig met die nuwe onderrigstrategie, Denkkaarte, sal
ontvang nie. Ek sal slegs gewone lesings vir ‘n tydperk van ses weke aan hulle aanbied. In
beide groepe sal ek dieselfde vakinhoud aanbied. As u seun/dogter deel is van die
eksperimentele groep tydens eksperiment 1, sal hy/sy dan deel wees van die kontrole groep
tydens eksperiment 2, en andersom. Al die deelnemers gaan dus ‘n kans kry om onderrig deur
middel van Denkkaarte te ontvang.
Aangesien die vakinhoud van Lewenswetenskap op eerstejaarsvlak dieselfde is as die vakinhoud
wat op Graad 12 vlak hanteer is, gaan die navorser van voortoetse gebruik maak om vas te stel
hoe goed u seun/dogter die kritiese denkvaardighede om te analiseer, sintetiseer en te evalueer in
Lewenswetenskap op skool aangeleer het. ‘n Voortoets, voortoets 1, sal aan die begin van
eksperiment 1 geskryf word en sal gebaseer wees op die vakinhoud wat ons tydens die eerste ses
weke van semester 1 gaan behandel. Op dieselfde manier sal voortoets 2 aan die begin van
eksperiment 2 geskryf word, wat op die vakinhoud wat ons in die laaste 6 weke van semester 1
gaan behandel, gebaseer sal wees. Met die voortoetse wil die navorser hoofsaaklik vasstel hoe
goed u seun/dogter se kritiese denkvaardighede op skool ontwikkel is, voordat hy Denkkaarte as
onderrigstrategie gebruik. In totaal, gaan u seun/dogter 2 voortoetse van ongeveer 30 minute elk
skryf.
Gebaseer op die voortoets-resultate, sal die navorser die onderrigprogram waar ek Denkkaarte
gaan gebruik, ontwikkel, om die probleme met kritiese denke wat hy tydens die voortoetse aan
die begin van die eerste ses weke en die tweede ses weke van die eerste semester gedurende
2016 opgemerk het, aan te spreek. Indien die voortoetse sou uitwys dat die deelnemers nie
probleme met die kritiese denkvaardighede ervaar nie, sal die navorser steeds die strategie toepas
om te kyk of ek die toepassing van die kritiese denkvaardighede nog beter kan ontwikkel.
Die Lewenswetenskap-deelnemers het 2 Lewenswetenskap-periodes per week van 1 uur en 20
minute elk op die universiteitsrooster. Een van die periodes is ‘n praktiese periode en die
navorser sal nie tydens hierdie periode met Denkkaarte onderrig gee nie, maar slegs gewone
lesings aanbied. Die oorblywende periode wat fokus op teoretiese vakinhoud sal gebruik word
om Denkkaarte as onderrigstrategie toe te pas. Die onderrig in die eksperimentele en kontrole
groepe sal op aparte tye en in aparte lokale plaasvind. Die kontrole groep sal normale lesings
tydens hulle klasperiode van 1 uur en 20 minute een keer per week, soos deur die universiteit
toegeken is, ontvang. Die eksperimentele groep sal onderrig met behulp van Denkkaarte een
keer per week tydens hulle periode van 1 uur en 20 minute ontvang.
Wanneer die implementering van die Denkkaart-onderrigprogam voltooi is, sal natoets 1
na afloop van die eerste ses weke van semester 1 geskryf word en natoets 2 na afloop van die
laaste ses weke van semester 2. Die natoetse word geskryf om te sien of Denkkaarte u
seun/dogter gehelp het om die kritiese denkvaardighede van analise, sintese en evaluasie in die
konteks van die vakinhoud wat tydens elke eksperiment hanteer is, te ontwikkel of te verbeter.
In totaal sal u seun/dogter twee natoetse van 30 minute elk skryf.

Appendix B: Letters of consent 305
In die tabel hier onder word die implementering van die navorsingseksperiment opgesom.
Die voortoetse en natoetse sal uit 15 multi-keuse vrae bestaan, waar elke vraag een korrekte
antwoord sal hê. Elke vraag het ook ‘n opvolgvraag waar u seun/dogter ‘n antwoord moet
motiveer. U seun/dogter moet sy/haar antwoord motiveer om raaiwerk te ontmoedig en sodat die
navorser kan vasstel hoe goed u seun/dogter kan redeneer/argumenteer. Die multi-keuse vrae sal
‘n gelyke aantal vrae bevat vir die verskillende vaardighede, naamlik analise (5 vrae), sintese (5
vrae) en evaluasie (5 vrae). Die vrae in die voortoetse en natoetse sal nie dieselfde wees nie,
omdat die toetse elk op verskillende vakinhoud van die eerste ses en tweede ses weke van
semester 1 onderskeidelik, gebaseer sal wees.
Die moeilikheidsgraad van die toetse en die vaardighede wat getoets word, naamlik analise,
sintese en evaluasie, sal dieselfde wees. Om seker te maak dat die moeilikheidsgraad van al die
toetse dieselfde is, sal die navorser vier ervare kollegas wat universiteitsdosente in
Lewenswetenskap is inskakel om die moeilikheidsgraad van al die toetse onafhanklik te
evalueer. Die navorser sal aandag gee aan hulle kommentaar en indien nodig, die toetse aanpas.
‘n Voorbeeld van hoe die vrae gestel gaan word, verskyn hier onder.
Weke1-6: Semester 1- Eksperiment 1
Voortoets 1 Eksperimentele groep
Denkkaarte
6 weke
Kontrole groep
Normale klasonderrig
(lesings)
6 weke
Natoets 1
Groepe roteer
Weke 7-12: Semester 1 – Eksperiment 2
Voortoets 2 Eksperimentele groep
Normale klasonderrig
(lesings)
6 weke
Kontrole groep
Denkkaarte
6 weke
Natoets 2
Kies die korrekte antwoord deur ‘n sirkel om die korrekte antwoord (1-4) te maak. Motiveer
skriftelik, hoekom u die antwoord gekies het.
Proteïne word gemaak van aminosure deur die proses van:
1.hidrolise
2.pinositosis
3.aktiewe vervoer
4.dehidrasie-sintese
Korrekte antwoord: 4
Motivering: Proteïne is groot kettings aminosure wat gekombineer word deur middel van
dehidrasie-sintese, waar molekules saamgevoeg word deur water te verwyder. Hidrolise breek die
proteïne af in aminosure. Pinositosis is ‘n metode waardeur groot onoplosbare molekules
ingeneem word, en word beskou as ‘n vorm van aktiewe vervoer.

Appendix B: Letters of consent 306
Aan die einde van die navorsing, sal die navorser die voortoets en natoets resultate van al die
deelnemers vergelyk om vas te stel watter strategie die deelnemers se kritiese denkvaardighede
die beste ontwikkel het: Denkkaarte of normale lesings. Op aanbeveling van die onafhanklike
statistiese konsultant wat die navorser gaan help met die analise van die data, gaan vergelykings
ook ten opsigte van individuele deelnemers se toetsresultate gedoen word, aangesien dit
moontlik is dat die nuwe strategie individuele deelnemers beter mag baat as die groep. Die
deelnemers sal elkeen vir hierdie doel ‘n nommer ontvang wat hulle deurgaans op hulle
voortoetse en natoetse gaan aanbring sodat dit vir die navorser moontlik sal wees om
vergelykings ten opsigte van die verskillende toetse gekoppel aan nommers ook uit te voer. Geen
vergelyking sal egter aan ‘n deelnemer se naam gekopppel word nie.
Geleentheid vir die deelnemers om hulle menings oor die navorsing te gee, asook geleentheid vir
terugvoer deur die navorser oor die navorsingsbevindinge, sal geskeduleer word.
Opsommenderwys gaan u deelname die volgende behels: (Presiese datums en tye sal verskaf
word sodra die klasrooster vir 2016 gefinaliseer is)
1.Uitnodinging en verduideliking van ingeligte toestemming (1 uur en 20 minute).
2.Die voltooiing van ingeligte toestemming (Tuis, 1 week).
3.Inhandiging van ingeligte toestemming.
4.Selektering tot ‘n eksperimentele en kontrole groep.
5.Die skryf van voortoetse (30 minute) voordat u deelneem aan Eksperiment 1: Die
implementering van die Denkkaarte onderrigstrategie tydens die LIFE 111 lesings vir ses weke
(1 uur en 20 minute per week) as deel van die eksperimentele groep, of as deel van die kontrole
groep wat slegs normale lesings vir ses weke (1 uur en 20 minute per week) sal ontvang.
6.Die skryf van natoetse (30 minute) na die implementering van Denkkkaarte en normale lesings
vir ses weke onderskeidelik tydens Eksperiment 1.
7.Deelname aan ‘n omgekeerde eksperiment, Eksperiment 2, tydens die LIFE 111 lesings waar
die eksperimentele groep die kontrole groep word, en die kontrole groep die eksperimentel groep
word. Die eksperimentele groep sal weer vir ses weke onderrig met Denkkaarte ontvang (1 uur
en 20 minute per week) en die kontrole groep vir ses weke onderrig met behulp van normale
lesings sal ontvang (1 uur en 20 minute per week). Die skryf van voortoetse (30 minute) en
natoese (30 minute) voor en na die ses weke sal ook van toepassing wees.
8.Een bespreking waar deelnemers hulle menings oor die navorsing kan gee na afloop van
Eksperiment 2 (1 uur en 20 minute tydens ‘n register periode), na die implementering van die
intervensie met Denkkaarte.
9.Terugvoer oor die navorsing: Sessie 1: Aan die einde van Eksperiment 1 (1 uur en 20 minute
tydens ‘n registerperiode). Sessie 2: Aan die einde van Eksperiment 2 (1 uur en 20 minute tydens
‘n registerperiode).
10.‘n Finale terugvoersessie oor die navorsingsbevindinge (1 uur en 20 minute tydens ‘n
registerperiode)
Sal u seun/dogter baat vind deur aan die navorsing deel te neem?
Die onmiddellike voordele vir u seun/dogter as deelnemer sal waarskynlik die volgende wees:
(i) Hy/sy mag moontlik die kritiese denkvaardighede deur middel van Denkkaarte
aanleer wat hom/haar in staat kan stel om inligting meer effektief te analiseer,
sintetiseer en evalueer.

Appendix B: Letters of consent 307
(ii) Denkkaarte is ook ‘n effektiewe leerstrategie wat hom/haar sou kon help om beter te
studeer en moontlik sy/haar akademiese prestasie in enige vak te verbeter.
(iii) ‘n Ander voordeel sou wees dat u seun/dogter moontlik oor ‘n effektiewe strategie
sou kon beskik wanneer hy/sy begin skoolhou.
Die indirekte voordele sal waarskynlik wees dat:
(i) Navorsers by ander universiteite sou moontlik kon kennis neem van die voordele van
Denkkaarte as onderrigstrategie om kritiese denkvaardighede te verbeter, en verdere
studies in ander kontekste sou kon onderneem om die voordele van die strategie vir
die ontwikkeling van kritiese denkvaardighede op groter skaal te bewys.
(ii) Die navorsingsbevindinge sou gebruik kon word om aanbevelings aan die
Departement van Onderwys te maak met betrekking tot die moontlike verbetering van
die onderrigpraktyk in Lewenswetenskap op skool, om te verseker dat kritiese denke
wel in klaskamers op skool ontwikkel word.
(iii) Die groter populasie van Lewenswetenskap-onderwysers se onderrigpraktyk sou kon
baat as Denkkaarte as onderrigstrategie meriete inhou vir die ontwikkeling van
kritiese denke in Lewenswetenskap en hierdie bevinding aan Skole vir
Opvoedkundige Wetenskappe aan Universiteite gekommunikeer kan word en
opleiding in die gebruik van die strategie deel gemaak kan word van die kurrikulum
vir onderwysersopleiding.
Is daar enige risiko’s betrokke by u seun/dogter se deelname aan die navorsing en hoe gaan
die risiko’s bestuur word?
Die volgende risiko’s is betrokke by die studie, en in die tabel hieronder verduidelik die navorser
hoe hy die risiko’s gaan bestuur.
Moontlike/waarskynlike risko’s
/ongemak
Strategieë om risiko’s en ongemak te
verminder
(i) Botsende belange en die
magsverhouding wat bestaan
omdat die navorser ook die
deelnemers se
Lewenswetenskapdosent is.
Die navorser erken dat die groep deelnemers
kwesbaar is as gevolg van botsende belange en
die hiërargiese dosent-student verhouding wat
bestaan omdat hy die deelnemers se dosent is.
Deur gebruik te maak van ‘n onafhanklike
persoon, vir die werwing van deelnemers, die
verkryging van ingeligte toestemming, die
selektering van deelnemers tot die
eksperimentele en kontrole groepe, en die
afneem van toetse vir data insameling kan die
kwesbaarheid van deelnemers verminder word.
Die onafhanklike persoon sal verhoed dat die
deelnemers voel dat hulle gedwing word om
aan die navorsing deel te neem of voel dat
hulle beïnvloed word om deel te neem as
gevolg van die student-dosent verhouding.
Die onafhanklike persoon sal die deelnemers
nie ken nie en ook nie kontak met hulle hê nie,

Appendix B: Letters of consent 308
omdat sy nie klas gee vir eerstejaar-studente
nie. Dit sal verseker dat die deelnemers nie
verplig voel om iets teen hulle wil te doen nie,
of voel dat hulle bedreig word, onder druk
geplaas word of oorreed word om deel te
neem aan die navorsing omdat die navorser
hulle dosent is nie.
Die studie kan nie gedoen word sonder die
insluiting van die groep deelnemers nie. ‘n
Belangrike doel met die studie is om die
deelnemers reeds van hulle eerstejaar af
behoorlik toe te rus om 'n onderrigstrategie te
gebruik om kritiese denke moontlik tydens
onderrig te ontwikkel.
(ii) Die navorser kan nie algehele
anonimiteit waarborg nie.
Die onafhanklike persoon sal die deelnemers
bewus maak van die feit dat alhoewel dié wat
aan die navorsing gaan deelneem anoniem sal
bly vir die navorser (hulle dosent) wanneer
hulle die voortoetse en natoetse skryf, algehele
anonimiteit nie gewaarborg kan word nie. Die
deelnemers wat die toetse skryf sal nie
anoniem vir die res van hulle maats wees wat
saam met hulle die toetse skryf nie. Geen
resultate sal egter direk aan ‘n deelnemer se
naam gekoppel word nie, maar aan die
nommer, wat gebruik sal word om die
deelnemers te identifiseer. Die onafhanklike
persoon wat die verskillende toetsuitslae sal
versamel om vergelykings te maak, sal weet
watter naam aan watter nommer gekoppel is.
Sy sal die inligting vertroulik hanteer, en slegs
die nommer en die toetsuitlslae aan die
navorser en die onafhanklike statistikus
rapporteer.
Deelnemers sal bewus gemaak word van die
feit dat alhoewel hulle mag besluit om nie aan
die navorsing deel te neem nie, en nie die
toetse skryf nie, hulle steeds onderrig deur
middel van Denkkaarte gaan ontvang. Die
gebruik van Denkkaarte is gekoppel aan die
vakinhoud van die module, LIFE 111 –
Lewenswetenskap, wat hulle moet slaag.
Blootstelling aan die nuwe onderrigstrategie
kan egter vir hulle ook voordelig wees. Die
gebruik van Denkkaarte as onderrigstrategie
gaan dus nie inmeng met normale klastyd nie,
maar deel daarvan vorm.

Appendix B: Letters of consent 309
(iii) Die skryf van toetse mag
angs en stres veroorsaak.
Die onafhanklike persoon wat die werwing sal
hanteer en die ingeligte toestemming van u
seun/dogter sal verky, sal die volgende aan u
seun/dogter verduidelik:
(i) Hulle hoef nie vir die toetse voor te
berei of te studeer nie.
(ii) Die toetse sal geskryf word in tye
wat vir die deelnemers gerieflik sal
wees, verkieslik gedurende ‘n oop
periode op die rooster sodat
addisionele ryery om die toetse te
skryf, nie sal plaasvind nie. Die
navorser gaan reël vir ‘n vaste
registerperiode op die rooster vir
eerstejaar studente van 2016 vir
hierdie doel.
(iii) Die toetse sal nie invloed uitoefen
op die student se slaag of druip van
die Lewenswetenskap module,
LIFE 111 nie.
(iv) Die toetsresultate gaan slegs vir
navorsingsdoeleindes gebruik word
om vas te stel of die gebruik van
Denkkaarte effektief is vir die
ontwikkeling of verbetering van
kritiese denkvaardighede of nie.
(v) Die inoud waarop die toetse
gebaseer gaan wees, gaan vir die
deelnemers bekend wees, aangesien
die inhoud reeds in Graad 12
behandel is. Dit mag angs verlig.
(vi) Vir die maak van individuele
vergelykings sal die deelnemers
met behulp van nommers aan die
navorser uitgeken word. Die
navorser sal nie weet wie ‘n toets
gekryf het of nie (die navorser gaan
nie betrokke wees by die afneem
van die toetse nie). Die
onafhanklike persoon sal die
statistikus help om die individuele
toetspunte te selekteer vir die
vergelykings wat gemaak gaan
word. Die navorser sal slegs die
nommers van die deelnemers met
hulle punte vir die verskillende
toetsgeleenthede ontvang.
(vii) Die fokus van die toetse gaan nie op
slaag of druip wees nie, maar of die
deelnemers kritiese

Appendix B: Letters of consent 310
Die navorser het gepaste maatreëls in plek gestel om die navorsingsverwante risiko’s te
verminder, sodat die deelnemers die voordele wat die navorsing mag inhou, soos hierbo vermeld,
kan ervaar. Die risiko’s blyk redelik te wees in verhouding tot die belangrikheid van die kennis
wat verwerf kan word wat die moontlike verbetering van onderrig in Lewenswetenskap tot
gevolg kan hê.
Wie sal toegang tot die data hê?
U seun/dogter se toetsresultate sal nie aan sy/haar naam gekoppel word nie. Hy/sy sal nie ‘n
naam op ‘n toets skryf nie, maar met ‘n nommer uitgeken word (1, 2 ens.). Alle resultate sal
bekend gemaak word deur dit aan ‘n nommer te koppel. Hy/sy sal anoniem bly vir die navorser.
Geen name sal vermeld word in bevindinge wat uit die navorsing voortspruit nie. Die navorser
verseker u dat ons die inligting wat ons oor u seun/dogter het, sal beskerm. Alle inligting
rakende die navorsing sal gestoor word op ‘n rekenaar wat met ‘n wagwoord beskerm is en die
voltooide toetse sal in ‘n kas in die navorser se kantoor toegesluit word. Die navorser is die
enigste persoon wat ‘n sleultel het om die kas oop te sluit.
Dit is belangrik om te weet dat vertroulikheid in die navorsing beperk gaan wees. Buiten die
onafhanklike persoon, sal slegs twee ander mense ook toegang tot die data hê, naamlik die
onafhanklike statistikus wat my sal help met die vaslegging van die data, en die studieleier wat
kontrole gaan uitoefen om te verseker dat die navorsingsbevindinge korrek is. Die onafhanklike
statistikus is Me Aldine Oosthuyzen, ‘n ervare en gekwalifiseerde statistikus aan die Noordwes-
Universiteit se Vaaldriehoekkampus. Die navorser sal die data vir ‘n minimum van vyf jaar
stoor. Die onafhanklike persoon, die navorser en die onafhanklike statistikus sal ‘n geskrewe
ooreenkoms teken aan die begin van die navorsing dat hulle onderneem om alle inligting met
betrekking tot die navorsing en die data vertroulik te hanteer, en nie daaroor te praat nie.
Wat gaan met die data gebeur?
Ek verseker u dat die inligting wat via die navorsing verkry word, slegs vir navorsingsdoeleindes
gebruik gaan word. Geen inligting oor u seun/dogter sal bekend gemaak word in verslae oor die
studie nie (byvoorbeeld u naam, u seun/dogter se naam of adres).
Die data van my studie gaan as volg grerapporteer word: (i) Die navorser sal die
navorsingbevindinge in die vorm van ‘n proefskrif rapporteer wat vir eksamineringsdoeleindes
aan eksaminatore by ander universiteite voorgehou sal word, (ii) Die navorser beoog ook om oor
die navorsing te skryf in artikels en boek-hoofstukke, en om aanbiedings oor die navorsing by
konferensies te doen.
Hierdie studie is eenmalig en die data sal nie hergebruik word in ander toekomstige studies nie.
Gaan u seun/dogter betaal of vergoed word om aan die studie deel te neem/ is daar enige
kostes betrokke?
U seun/dogter gaan nie betaal of vergoed word om aan die studie deel te neem nie. Verversings
sal aan hom/haar gegee word na afloop van elke toets. Die verversings sal ‘n blyk van
denkvaardighede kan toepas of nie.

Appendix B: Letters of consent 311
waardering wees vir die tyd wat u opgeoffer het om aan die navorsing deel te neem. Die skryf
van daarvan en die onderrig met behulp van Denkkaarte sal plaasvind gedurende periodes wat op
die klasrooster geskeduleer is. U seun/dogter hoef dus nie vir addisionele vervoer te reël om op
ander tye aan die navorsing deel te neem nie. Geen kostes is dus betrokke by deelname aan die
navorsing nie.
Hoe gaan ek weet wat die bevindinge is?
Die algemene bevindinge van die navorsing sal die navorser met u deel via epos of gewone pos
(verskaf asseblief u adres hieronder) deur ‘n kort verslag saam te stel wat aan al die
ouers/voogde van die deelnemers beskikbaar gestel sal word. Alle vrae oor die verslag kan direk
aan die navorser gerig word by die kontakbesonderhede hieronder. U is ook welkom om met die
navorser ‘n afspraak te maak om u vrae te bespreek.
Is daar iets anders wat ek behoort te weet?
U kan mnr Francois Minnie by 084 549 2583 of [email protected] of sy studieleier, Prof.
Mary Grosser by 083 490 0501 of [email protected], kontak as u enige verdere navrae
het of probleme teekom.
U kan die voorsitter van die Humanities and Health Research Ethics Committee (Prof Linda
Theron) by 016 910 3076 of [email protected] kontak as u enige bekommernis of klagte
het wat nie voldoende deur die navorser aangespreek is nie. U kan ook die mede-voorsitter, Prof.
Tumi Khumalo (016 910 3397 of [email protected]) kontak, of ‘n boodskap vir Linda
of Tumi los by Me Daleen Claasens (016 910 30441).
As u dit moeilik vind om die verduideliking van die navorsing te volg, kontak asseblief die
navorser of die onafhanklike persoon by die kontakbesonderhede hier onder. Hulle sal met u ‘n
tyd reël om die navorser te ontmoet om aan u te verduidelik wat problematies vir u is.
U sal ‘n kopie van die inligting en toestemming ontvang wat u vir u eie rekords kan hou.
Verklaring deur ouer
Deur hier onder te teken, verklaar ek…………………………..dat ek dit goedkeur dat my
seun/dogter ………………………………….. …………………………. aan die volgende
navorsingstudie mag deelneem: Die impak van Denkkaarte om die ontwikkeling van kritiese
denkvaardighede by eerstejaar voordiens Lewenswetenskap-onderwysers te koester
Ek verklaar die volgende:
Ek het die inligting gelees en verstaan die inligting in die ingeligte
toestemmingsvorm, wat in ‘n taal geskryf is waarmee ek gemaklik is en vlot praat.
Ek het ‘n kans gehad om vrae te vra aan die persoon wat die ingeligte toestemming
verkry het sowel as aan die navorser (as hierdie ‘n ander persoon is), en al my vrae is
voldoende beantwoord.
Ek verstaan dat deelname aan die studie vrywillig is, en ek is nie onder druk geplaas
om toestemming te gee dat my seun/dogter mag deelneem nie.

Appendix B: Letters of consent 312
Ek verstaan dat my seun/dogter se toetsresultate in die openbaar bekend gemaak
en/of aangehaal kan word, sonder enige verwysing na sy/haar of my persoonlike
identiteit.
My seun/dogter mag kies om om/haar enige tyd aan die studie te onttrek, en dit sal
vir hom /haar geen penalisering of bevooroordeeldheid inhou nie.
My seun/dogter mag gevra word om die studie te verlaat voordat dit voltooi is, as die
navorser voel dat dit in my seun/dogter se beste belang is, of as my seun/doger nie
hou by die navorsingsplan waarop ooreengekom is nie.
Geteken te (plek) ......................…........…………….. op (datum) …………....……….. 20....
...................................................................... ...................................................................
Handtekening van deelnemer Handtekening van getuie
U mag my weer kontak Ja Nee
Ek wil graag ‘n opsomming van die navorsingsbevindinge Ja Nee
hê
Die beste manier om my te bereik is:
Naam en Van: ________________________________________________
Posadres: ________________________________________________
Epos: ________________________________________________
Telefoonnommer: _____________________
Selfoonnommer: ______________________
Indien die bogenoemde besonderhede verander, kontak asseblief die volgende persoon wat my
goed ken, nie saam met my bly nie en sal help om my te kontak.
Naam en van:
___________________________________________________________________________
Telefoonommer/ Selfoonnommer /Epos:
___________________________________________________________________________
Verklaring deur persoon wat toestemming verkry
Ek (naam) ……………………………………………..……… verklaar dat:
Ek die inligting in die dokument verduidelik het aan……………………………
Ek hom/haar aangemoedig het om vrae te stel en genoeg tyd toegelaat het om
hom/haar te antwoord.
Ek tevrede is dat hy/sy alle aspekte van die studie soos hierbo bespreek word,
genoegsaam verstaan.
Ek het/het nie ‘n vertaler gebruik het nie.
Die beste manier om my te bereik is:
Naam en Van: ________________________________________________
Posadres: ________________________________________________

Appendix B: Letters of consent 313
Epos: ________________________________________________
Telefoonnommer: _____________________
Selfoonnommer: ______________________
Geteken te (plek) ......................…........…………….. op (datum) …………....……….. 20....
...................................................................... ...................................................................
Handtekening van persoon wat toestemming verkry Handtekening van getuie
Verklaring deur navorser
Ek (naam) ……………………………………………..……… verklaar dat:
Ek die inligting in die dokument verduidelik het aan……………………………
Ek hom/haar aangemoedig het om vrae te stel en genoeg tyd toegelaat het om hom/haar
te antwoord.
Ek tevrede is dat hy/sy alle aspekte van die studie soos hierbo bespreek word,
genoegsaam verstaan.
Ek het/het nie ‘n vertaler gebruik het nie.
Geteken te (plek) ......................…........…………….. op (daum) …………....……….. 20....
...................................................................... ...................................................................
Handtekening van navorser Handtekening van getuie

Appendix C: Pre- and Post Tests 314
APPENDIX C
PRE- AND POST-TESTS

Appendix C: Pre- and Post Tests 315
PRETEST 1 LIFE 111
Various possible options are provided as answers to the following questions. Choose the correct answer and cross only the letter (A - D) next to the question number on the answer sheet, for example 1. E. Each answer must be motivated.
Verskeie moontlike opsies word as antwoorde vir die volgende vrae verskaf. Kies die korrekte antwoord en deurkruis slegs die letter (A – D) langs die vraagnommer op die antwoordblad, byvoorbeeld 1. E. Elke antwoord moet gemotiveer word.
Study the following representation of the Scientific Method and answer questions 1 to 6
that follow: / Bestudeer die volgende voorstelling van die Wetenskaplike metode en
beantwoord vrae1 tot 6 wat volg:
(Gebhardt et al., 2012:15)
Observation /
Waarneming
Result / Resultaat Method of testing /
Metode van toetsing
Hypothesis / Hipotese
Investigative question/
Ondersoekvraag
Evaluation / Evaluasie
Conclusion /
Gevolgtrekking
More water does make the lettuce
plants grow bigger / Meer water laat die
slaaiplante groter
groei?
I wonder if more water makes the
lettuce plants grow bigger? / Ek wonder
of meer water die slaaiplante groter laat
groei?
I think that I need to repeat the
experiment with more seedlings / Ek
dink ek moet die eksperment met meer saailinge
herhaal
Apparatus / Apparaat

Appendix C: Pre- and Post Tests 316
1. This diagram represents the Scientific
Method as it
1. Hierdie diagram verteenwoordig die
wetenskaplike metode omdat dit
A consists of eight different steps. A uit agt verskillende stappe bestaan.
B shows results. B resultate toon.
C is the specific method used in any
scientific investigation.
C die spesifieke metode is wat in enige
wetenskaplike ondersoek gebruik
word.
D does include steps to design an
experiment.
D stappe insluit vir die ontwerp van ‘n
eksperiment.
2. According to the given investigative
question, what is a possible observation?
2. Na aanleiding van die gegewe
ondersoek vraag, wat is ‘n moontlike
waarneming?
A Difference in height of plants between
the two trays.
A Verskil in planthoogte tussen die
twee bakke.
B One tray receives more sunlight. B Een bak ontvang meer sonlig.
C One tray has a sandy soil type. C Een bak het ‘n sanderige grondtipe.
D One tray receives more water than
the other one.
D Een bak het meer water as die ander
een ontvang.
3. Which ONE of the following is the most
appropriate independent variable for
this experiment?
3. Watter EEN van die volgende is die
mees geskikte onafhanklike
veranderlike vir die eksperiment?
A Sunlight A Sonlig
B More water B Meer water
C Bigger plants C Groter plante
D Sandy soil D Sanderige grond
4. Which ONE of the following is the most 4. Watter EEN van die volgende is die

Appendix C: Pre- and Post Tests 317
appropriate hypothesis for this
experiment?
mees geskikte hipotese vir die
eksperiment?
A Less water makes the lettuce plants
grow bigger.
A Minder water laat die blaarslaai groter
groei.
B Does more water makes the lettuce
plants grow bigger?
B Sal meer water die blaarslaai groter
laat groei?
C Water makes the lettuce plants grow
bigger.
C Water laat die blaarslaai groter groei.
D Does sunlight makes the lettuce
plants grow bigger?
D Sal sonlig die blaarslaai groter laat
groei?
5. Which ONE of the following is the most
appropriate dependent variable for
this experiment?
5. Watter EEN van die volgende is die
mees geskikte afhanklike veranderlike
vir die eksperiment?
A Sunlight A Sonlig
B More water B Meer water
C Bigger plants C Groter plante
D Sandy soil D Sanderige grond
6. Which ONE of the following indicates
the correct order of the steps to design
an experiment?
6. Watter EEN van die volgende dui die
korrekte volgorde van stappe tydens die
ontwerp van ‘n eksperiment?
A Aim → apparatus → determine
variables → method
A Doel → apparaat → bepaal
veranderlikes → metode
B Aim → determine variables →
apparatus → method
B Doel → bepaal veranderlikes →
apparaat → metode
C Determine variables → aim →
apparatus → method
C Bepaal veranderlikes → doel →
apparaat → metode
D Aim → apparatus → method →
determine variables
D Doel → apparaat → metode →
bepaal veranderlikes
Study the following question and answer Bestudeer die volgende vraag en

Appendix C: Pre- and Post Tests 318
questions 7 to 10 that follow:
Does heating a cup of water allow more sugar in a cup to be dissolved?
7. Which ONE of the following is the most
appropriate hypothesis for this
question?
beantwoord vrae 7 tot 10 wat volg:
Sal meer suiker in ‘n koppie oplos wanneer water in die koppie verhit word?
7. Watter EEN van die volgende is die
mees geskikte hipotese vir die vraag?
A Does heating allow more sugar to
dissolve?
B Does heating a cup of water allow it to
dissolve more sugar?
C Water allows more sugar to dissolve.
D Heating a cup of water allows more
sugar to dissolve.
A Sal hitte meer suiker laat oplos?
B Sal die verhitting van ‘n koppie water
meer suiker laat oplos?
C Water laat toe dat meer suiker oplos.
D Die verhitting van ‘n koppie water sal
meer suiker laat oplos.
8. Which ONE of the following is the most
appropriate dependent variable for
this experiment?
A Heat
B Cup of water
C Sugar
D More sugar dissolves
9. Which ONE of the following is the most
appropriate independent variable for
this experiment?
A Heat
B Cup of water
C Sugar
D More sugar dissolves
10. Which ONE of the following is the most
8. Watter EEN van die volgende is die
mees geskikte afhanklike veranderlike
vir die eksperiment?
A Hitte
B Koppie water
C Suiker
D Meer suiker los op
9. Watter EEN van die volgende is die
mees geskikte onafhanklike
veranderlike vir die eksperiment?
A Hitte
B Koppie water
C Suiker
D Meer suiker los op
10. Watter EEN van die volgende is die

Appendix C: Pre- and Post Tests 319
appropriate fixed(constant) variable for
this experiment?
A Heat
B Cup of water
C Less sugar dissolves
D More sugar dissolves
Study the following and answer questions 11 to 15 that follow:
A scientist designed an experiment to investigate the water-carrying capacity of sand, loam and clay soil. A soil sample of each soil type was placed in funnels lined with filter paper. 100 cm3 of water was added to all three soil samples at exactly the same time. The filtrates were collected in measuring cylinders. The results are shown in the following table:
Time
(in minutes)
Volume of filtrate
(in cm3)
Sand Loam Clay
2 10 5 0
4 20 10 0
6 35 20 0
8 50 35 5
10 65 45 10
20 75 55 12
40 75 60 14
60 75 65 16
mees geskikte vaste(konstante)
veranderlike vir die eksperiment?
A Hitte
B Koppie water
C Minder suiker los op/
D Meer suiker los op
Bestudeer die volgende en beantwoord vrae 11 tot 15 wat volg:
‘n Wetenskaplike het ‘n eksperiment ontwerp om die waterhouvermoë van sand, leem en kleigrond te ondersoek. ‘n Grondmonster van elke grondtipe is in tregters met filtreerpapier geplaas en 100 cm3 water is op dieselfde tydstip by elke grondmonster gevoeg. Die filtraat is in maatsilinders opgevang. Die resultate word in onderstaande tabel weergegee:
Tyd
(in minute)
Volume van filtraat
(in cm3)
Sand Leem Klei
2 10 5 0
4 20 10 0
6 35 20 0
8 50 35 5
10 65 45 10
20 75 55 12
40 75 60 14
60 75 65 16

Appendix C: Pre- and Post Tests 320
11. Which ONE of the following is the most
appropriate question for this experiment?
A Does time influence the volume of
filtrate?
B Does more water filter through sand?
C Which soil type has the best water-
carrying capacity?
D Does the filter paper influence the
volume of the filtrate?
12. Which ONE of the following is the most
appropriate independent variable for
this experiment?
A Filter paper
B Time in minutes
C Volume of filtrate in cm3
D Soil sample
13. Which ONE of the following is the most
appropriate dependent variable for
this experiment?
A Filter paper
B Time in minutes
C Volume of filtrate in cm3
D Soil sample
14. Identify three fixed variables for this
experiment.
A Same quantity of each soil type; 100
cm3 of water; add water the same
time.
B Time in minutes; 100 cm3 of water;
add water the same time
C Same quantity of each soil type; 100
11. Watter EEN van die volgende is die
mees geskikte vraag vir die eksperiment?
A Beïnvloed tyd die volume van die
filtraat?
B Filtreer meer water deur sand?
C Watter grondtipe het die beste water-
houvermoë?
D Beïnvloed die filtreerpapier die
volume van die filtraat?
12. Watter EEN van die volgende is die
mees geskikte onafhanklike
veranderlike vir die eksperiment?
A Filtreerpapier
B Tyd in minute
C Volume van filtraat in cm3
D Grondmonster
13. Watter EEN van die volgende is die
mees geskikte afhanklike veranderlike
vir die eksperiment?
A Filtreerpapier
B Tyd in minute
C Volume van filtraat in cm3
D Grondmonster
14. Identifiseer drie vaste veranderlikes vir
die eksperiment.
A Ewe veel van elke tipe grond; 100
cm3 of water; voeg water op dieselfde
tydstip by.
B Tyd in minute; 100 cm3 of water; voeg
water op dieselfde tydstip by.
C Ewe veel van elke tipe grond; 100

Appendix C: Pre- and Post Tests 321
cm3 of water; volume of filtrate in cm3
D Same quantity of each soil type;
volume of filtrate in cm3 ; time in
minutes
15. A possible conclusion for this
experiment?
A Clay has the best water-carrying
capacity.
B Spaces between clay particles are
very small.
C Clay particles are smaller than sand
particles.
D Spaces between sand particles are
large.
cm3 of water; volume van filtraat in
cm3
D Ewe veel van elke tipe grond; volume
van filtraat in cm3; tyd in minute
15. ‘n Moontlike gevolgtrekking vir die
eksperiment:
A Kleigrond het die beste waterhou-
vermoë.
B Spasies tussen kleideeltjies is baie
klein.
C Kleideeltjies is kleiner as
sanddeeltjies.
D Spasies tussen sanddeeltjies is
groot.

Appendix C: Pre- and Post Tests 322
PRETEST 1 – ANSWER SHEET / ANTWOORDBLAD LIFE 111
1 A B C D
Motivation / Motivering: Steps given in diagram
2 A B C D
Motivation / Motivering: Observation – what you see
3 A B C D
Motivation / Motivering: Cause
4 A B C D
Motivation / Motivering: Statement with cause and effect
5 A B C D
Motivation / Motivering: Effect
6 A B C D
Motivation / Motivering: According scientific method
7 A B C D
Motivation / Motivering: Statement with cause and effect
8 A B C D
Motivation / Motivering: Effect
9 A B C D
Motivation / Motivering: Cause
10 A B C D
Motivation / Motivering: Must be the same in cause and effect
11 A B C D
Motivation / Motivering: According to introduction

Appendix C: Pre- and Post Tests 323
12 A B C D
Motivation / Motivering: Cause
13 A B C D
Motivation / Motivering: Effect
14 A B C D
Motivation / Motivering: According to introduction all fixed variables
15 A B C D
Motivation / Motivering: Linked to question

Appendix C: Pre- and Post Tests 324
POSTTEST 1 LIFE 111
Various possible options are provided as answers to the following questions. Choose the correct answer and cross only the letter (A - D) next to the question number on the answer sheet, for example 1. E. Each answer must be motivated.
Verskeie moontlike opsies word as antwoorde vir die volgende vrae verskaf. Kies die antwoord en deurkruis slegs die letter (A – D) langs die vraagnommer op die antwoordblad, byvoorbeeld 1. E. Elke antwoord moet gemotiveer word.
Study the accompanying pie charts which show the carbohydrate, fat and protein content of five different food types marked i) to v). Answer then the questions 1 to 4.
Bestudeer die bygaande sirkeldiagramme wat koolhidraat-, vet- en proteïeninhoud van vyf verskilllende voedselsoorte gemerk i) tot v) aantoon. Beantwoord dan die vrae 1 tot 4.
(Sterrenberg, 2009:3.31)
1. Which of the food types are the least suitable as a source of insulation? A i)
B ii)
C iii)
D v)
1. Watter van die voedselsoorte sal die minste geskik wees as ‘n bron van isolering? A i)
B ii)
C iii)
D v)
2. Which of these food types will be the most suitable for structural growth in size? A ii)
B iii)
C iv)
D v)
2. Watter van hierdie voedselsoorte sal die mees bevorderlike wees vir strukturele groei in grootte? A ii)
B iii)
C iv)
D v)
i) ii) iii)
iv) v)
Key / Sleutel
Carbohydrates /
Koolhidrate
Fats / Vette
Proteins / Proteïene

Appendix C: Pre- and Post Tests 325
3. Which of these food types is the richest source of energy? A i)
B ii)
C iii)
D v)
3. Watter van hierdie voedselsoorte is die rykste bron van energie? A i)
B ii)
C iii)
D v)
4. What percentage of food type ii) is fat? A 25%
B 50%
C 60%
D 75%
4. Watter persentasie van voedselsoort ii) bestaan uit vet? A 25%
B 50%
C 60%
D 75%
Sometimes during cell metabolism, chemical substances are formed that are poisonous to the body. However, the body cells are not destroyed due to the presence of enzymes that decompose these poisonous substances into harmless products. One such poisonous sub-stance that is released as a by-product during normal cellular reactions is hydrogen peroxide. However, the enzyme, catalase, ensures that this poisonous substance is converted into two harmless products as quickly as possible.
Gedurende selmetabolisme ontstaan daar soms chemiese stowwe wat vir die liggaam giftig is. Die liggaamselle word egter nie vernietig nie, omdat daar ensieme teenwoordig is, wat hierdie giftige stowwe afbreek tot onskadelike produkte. Een so ‘n giftige stof wat as neweproduk vrygestel word tydens normale selreaksies, is waterstof-peroksied. Die ensiem, katalase, verseker egter dat hierdie giftige stof so gou as moontlik in twee onskadelike produkte omgeskakel word.
2H2O2 → 2H2O + O2
An experiment is conducted to determine the effect of different temperatures on the action of the enzyme catalase, found in raw chicken livers. Study the accompanying setup apparatus for this experiment and answer questions 5 to 9 that follow:
‘n Eksperiment word uitgevoer om vas te stel wat die effek van verskillende temperature op die werking van die ensiem katalase, wat in rou hoenderlewer aangetref word, is. Bestudeer die bygaande opstelling van die apparaat vir hierdie eksperiment en beantwoord vrae 5 tot 9 wat volg:
Ice-cold water bath / Yswaterbad (2°C)
ii)
Luke warm water bath / Louwarmwaterbad (37°C)
Boiling water bath / Kookwaterbad (90°C)
thermometer termometer
chicken liver / hoenderlewer
chicken liver / hoenderlewer
oxygen / suurstof water hydrogen peroxide / waterstofperoksied
i)
ii) iii)
thermometer termometer
thermometer termometer
i)

Appendix C: Pre- and Post Tests 326
(Sterrenberg & Fouché, 2013:2.58) 5. Suppose you had to conduct this investigation, which one of the following is a possible hypothesis for the experiment? A Catalase functions optimally at 2°C
B Catalase functions optimally at 90°C
C Catalase functions optimally at 37°C
D Different temperatures have an effect on the action of catalase
5. Indien jy die ondersoek moes uitvoer, watter een van die volgende is ‘n moontlike hipotese vir die eksperiment? A Katalase funksioneer optimaal by 2°C
B Katalase funksioneer optimaal by
90°C
C Katalase funksioneer optimaal by
37°C
D Verskillende temperature het ‘n effek
op die werking van katalase
6. In which of the test tube/s would the reaction take place the fastest? A i)
B ii)
C iii)
D i) en iii)
6. In watter proefbuis/e sou die reaksie die vinnigste plaasvind? A i)
B ii)
C iii)
D i) en iii)
7. For this experiment, name the dependent variable. A The temperature of the water bath
B The condition of the chicken liver
C The amount of hydrogen peroxide
D The amount of bubbles formed
7. Noem die afhanklike veranderlike vir die eksperiment. A Die temperatuur van die waterbad
B Die toestand van die hoenderlewer
C Die hoeveelheid waterstofperoksied
D Die hoeveelheid borrels wat gevorm
word
8. For this experiment, name the independent variable. A The temperature of the water bath
B The condition of the chicken liver
C The amount of hydrogen peroxide
D The amount of bubbles formed
8. Noem die onafhanklike veranderlike vir die eksperiment. A Die temperatuur van die waterbad
B Die toestand van die hoenderlewer
C Die hoeveelheid waterstofperoksied
D Die hoeveelheid borrels wat gevorm
word

Appendix C: Pre- and Post Tests 327
9. Which one of the following is not a fixed variable? A The amount of chicken liver
B The condition of the chicken liver
C The amount of hydrogen peroxide
D The amount of liquid that was displaced by the oxygen
9. Watter een van die volgende is nie ‘n vaste veranderlike nie? A Die hoeveelheid hoenderlewer
B Die toestand van die hoenderlewer
C Die hoeveelheid waterstofperoksied
D Die hoeveelheid vloeistof wat deur die
suurstof verplaas word
Study the following representation of a division process and answer the questions 10 to 13 that follow:
Bestudeer die volgende voorstellings van ‘n delingsproses en beantwoord vrae 10 tot 13 wat volg:
(Sterrenberg et al., 2014:3.33)
10. Which one of the following represent the correct sequence of the phases of the cell division process? A iv), i), ii), v), iii)
B iv), i), v), ii), iii)
C i), iv), ii), v), iii)
D i), iv), v), ii), iii)
10. Watter een van die volgende stel die korrekte volgorde van die fases van die seldelingsproses voor? A iv), i), ii), v), iii)
B iv), i), v), ii), iii)
C i), iv), ii), v), iii)
D i), iv), v), ii), iii)
11. If a parent cell has twelve chromosomes, how many chromosomes will each of the daughter cells have following meiosis? A Forty-eight
11. Indien die ouersel twaalf chromosome besit, hoeveel chromosome sal elke dogtersel na meiose hê? A Agt en veertig
i) ii) iii)
iv) v)

Appendix C: Pre- and Post Tests 328
B Twenty-four
C Twelve
D Six
B Vier en twintig
C Twaalf
D Ses
12. At the metaphase plate during metaphase I of meiosis, there are A chromosomes consisting of one chromatid.
B unpaired duplicated chromosomes.
C bivalents.
D no crossing-over.
12. By die metafase-plaat tydens metafase I van meiose, is daar A chromosome wat uit een chromatied bestaan.
B ongepaarde gedupliseerde chromosome.
C bivalente.
D geen oorkruising nie.
13. At the metaphase plate during metaphase II of meiosis, there are A chromosomes consisting of one chromatid.
B unpaired duplicated chromosomes.
C bivalents.
D homologous pairs of chromosomes.
13. By die metafase-plaat tydens metafase II van meiose, is daar A chromosome wat uit een chromatied bestaan.
B ongepaarde gedupliseerde chromosome.
C bivalente.
D homoloë pare chromosome.
14. When a cell is placed in a hypotonic solution, A solute exits the cell to equalize the concentration on both sides of the membrane.
B water exits the cell toward the area of lower solute concentration.
C water enters the cell toward the area of higher solute concentration.
D solute exits and water enters the cell.
14. Wanneer ‘n sel in ‘n hipotone oplossing geplaas word, sal A die oplossing uit die sel beweeg om die konsentrasies aan beide kante van die membraan dieselfde te maak.
B water uit die sel beweeg na gebied met laer konsentrasie oplossing.
C water die sel inbeweeg na gebied met hoër konsentrasie oplossing.
D die oplossing uit die sel en water inbeweeg.
15. When a cell is placed in a hypertonic solution, A solute exits the cell to equalize the concentration on both sides of the membrane.
B water exits the cell toward the area of lower solute concentration.
C water enters the cell toward the area of higher solute concentration.
D solute exits and water enters the cell.
15. Wanneer ‘n sel in ‘n hipertone oplossing geplaas word, sal A die oplossing uit die sel beweeg om die konsentrasies aan beide kante van die membraan dieselfde te maak.
B water uit die sel beweeg na gebied met laer konsentrasie oplossing.
C water die sel inbeweeg na gebied met hoër konsentrasie oplossing.
D die oplossing uit die sel en water inbeweeg.

Appendix C: Pre- and Post Tests 329
POSTTEST 1 – ANSWER SHEET / ANTWOORDBLAD LIFE 111
1 A B C D
Motivation / Motivering: Contains no fats
2 A B C D
Motivation / Motivering: Contains most proteins
3 A B C D
Motivation / Motivering: Contains most fats
4 A B C D
Motivation / Motivering: Half of nutrients are fat
5 A B C D
Motivation / Motivering: Body temperature / optimum temperature for
catalase
6 A B C D
Motivation / Motivering: Body temperature / optimum temperature for
catalase
7 A B C D
Motivation / Motivering: Effect
8 A B C D
Motivation / Motivering: Cause
9 A B C D
Motivation / Motivering: Dependent
10 A B C D
Motivation / Motivering: Meiosis I
11 A B C D
Motivation / Motivering: Reduction of chromosome number
12 A B C D
Motivation / Motivering: Reduction of chromosome number

Appendix C: Pre- and Post Tests 330
13 A B C D
Motivation / Motivering: No reduction of chromosome number
14 A B C D
Motivation / Motivering: Hipotonic high water potential
15 A B C D
Motivation / Motivering: Hypertonic low water potential

Appendix C: Pre- and Post Tests 331
PRETEST 2 LIFE 111
Various possible options are provided as answers to the following questions. Choose the correct answer and cross only the letter (A - D) next to the question number on the answer sheet, for example 1. E. Each answer must be motivated.
Verskeie moontlike opsies word as antwoorde vir die volgende vrae verskaf. Kies die antwoord en deurkruis slegs die letter (A – D) langs die vraagnommer op die antwoordblad, byvoorbeeld 1. E. Elke antwoord moet gemotiveer word.
The diagram below shows details of an experiment in which three similar tablecloths with identical blood stains, were washed in an enzyme-containing powder solution in the same washing machine at three different temperatures, 15°C, 37°C and 65°C. Study the diagram and answer the questions 1 to 3 that follow:
Die onderstaande diagram toon die besonderhede van ‘n eksperiment waarin drie soortgelyke tafeldoeke met identiese bloedvlekke, teen drie verskillende temperature, 15°C, 37°C en 65°C in dieselfde wasmasjien met ‘n waspoeier wat ensieme bevat, gewas is. Bestudeer die diagram en beantwoord vrae 1 tot 3 wat volg:
(Sterrenberg, 2009:3.34)
1. Suppose you had to conduct this investigation, which one of the following is a possible hypothesis for the experiment? A The enzyme functions optimally at 2°C
B The enzyme functions optimally at 90°C
C The enzyme functions optimally at 37°C
D Different temperatures have an effect on the action of the enzyme
1. Indien jy die ondersoek moes uitvoer, watter een van die volgende is ‘n moontlike hipotese vir die eksperiment? A Die ensiem funksioneer optimaal by
2°C
B Die ensiem funksioneer optimaal by
90°C
C Die ensiem funksioneer optimaal by
37°C
D Verskillende temperature het ‘n effek
Before washing / Voordat gewas is
All table cloths are washed for 10 minutes / Alle tafeldoeke is vir 10 minute gewas
Result after washing / Resultaat nadat gewas is gewas is
blood stain / bloedvlek

Appendix C: Pre- and Post Tests 332
op die werking van die ensiem
2. For this experiment, name the dependent variable. A Different temperatures
B The time period of 10 minutes
C Result after washing
D The size of the blood stains
2. Noem die afhanklike veranderlike vir die eksperiment. A Verskillende temperature
B Die tydperiode van 10 minute
C Resultate nadat gewas is
D Die grootte van die bloedvlekke
3. At what possible temperature was each of the tablecloths 2 and 3 washed respectively? A 15°C and 37°C
B 37°C and 65°C
C 15°C and 65°C
D 37°C and 15°C
3. By watter moontlike temperatuur is elk van die tafeldoeke 2 en 3 onderskeidelik, gewas? A 15°C en 37°C
B 37°C en 65°C
C 15°C en 65°C
D 37°C en 15°
Study the accompanying representation of the recommended daily allowance of the different food groups and answer questions 4 and 5 that follow:
Bestudeer meegaande voorstelling van die aanbevole daaglikse inname van die verskillende voedselgroepe en beantwoord vrae 4 en 5 wat volg:
(Sterrenberg & Fouché, 2013:2.57)
If a total of 18 portions is consumed per day, calculate the number of portions that should come from
Indien ‘n totaal van 18 porsies per dag ingeneem word, bereken die aantal porsies wat uit elk van die volgende voedselgroepe ingeneem behoort te word:
Cereal and cereal products / Graan en graanprodukte
33%
Fats and sugars / Vette en suikers 8%
Meat and meat alternatives / Vleis en vleis alternatiewe
12%
Fruits and vegetables / Vrugte en groente
33%
Milk and milk products / Melk en
melkprodukte
15%

Appendix C: Pre- and Post Tests 333
4. fruits and vegetables. A 7
B 6
C 5
D 4
4. vrugte en groente A 7
B 6
C 5
D 4
5. meats and meat alternatives as well as fats and sugars respectively. A 7 and 6
B 6 and 3
C 3 and 2
D 2 and 1
5. vleis en vleis alternatiewe asook vette en suikers onderskeidelik. A 7 en 6
B 6 en 3
C 3 en 2
D 2 en 1
Use the information in the graph below to answer the questions 6 to 8:
Gebruik die inligting in die onderstaande grafiek om vrae 6 tot 8 te beantwoord.
(Sterrenberg, 2009:3.33)
6. At which temperature does the enzyme work optimally? A 5°C
B 35°C
C 45°C
D 55°C
6. By watter temperatuur werk die ensiem optimaal? A 5°C
B 35°C
C 45°C
D 55°C
7. What amount of food is broken down at 25°C?
7. Hoeveel voedsel word by 25°C afgebreek?
Digestion of food by an enzyme at different temperatures /
Vertering van voedsel deur ‘n ensiem by verskillende temperature
Am
ou
nt
of
foo
d
bro
ken
d
ow
n/
Ho
eveelh
eid
vo
ed
sel
afg
eb
reek
(mg
/h)

Appendix C: Pre- and Post Tests 334
A 2.5 mg/h
B 7.5 mg/h
C 15 mg/h
D 20 mg/h
A 2.5 mg/h
B 7.5 mg/h
C 15 mg/h
D 20 mg/h
8. Use the following steps to explain the shape of the graph between 5°C and 35°C: i) optimum temperature ii) enzyme activity is low iii) at low temperatures v) enzyme activity increases vi) temperature rises A vi), ii), iii), i), v)
B iii), v), vi), i), ii)
C iii), ii), vi), i), v)
D iii), ii), vi), v), i)
8. Gebruik die volgende stappe om die vorm van die grafiek van 5°C tot 35°C te verduidelik: i) optimum temperatuur ii) ensiemaktiwiteit laag iii) by lae temperatuur v) ensiemaktiwiteit neem toe vi) temperatuur styg A vi), ii), iii), i), v)
B iii), v), vi), i), ii)
C iii), ii), vi), i), v)
D iii), ii), vi), v), i)
A practical investigation was conducted to determine the effect of water temperature on the rate of photosynthesis of a water plant, using the apparatus shown below. The number of bubbles of gas released per minute was measured at a number of different temperatures. Study the accompanying results and answer questions 9 to 12 that follow:
‘n Praktiese ondersoek word uitgevoer, met behulp van apparate soos in die onderstaande voorstelling, om te bepaal of watertemperatuur ‘n effek het op die tempo waarteen ‘n waterplant fotosinteer. Die aantal gasborrels wat per minuut vrygestel word, word by verskillende water temperature gemeet. Bestudeer die bygaande resultate en beantwoord vrae 9 tot 12 wat volg:
(Sterrenberg & Fouché, 2013:2.55
9. For this experiment, name the dependent variable. A Temperature of water
9. Noem die afhanklike veranderlike vir die eksperiment. A Watertemperatuur
Num
ber
of gas b
ubble
s /
Hoeveelh
eid
lu
gborr
els
Temperature of water / Temperatuur van water (°C)

Appendix C: Pre- and Post Tests 335
B Number of gas bubbles
C Amount of heat applied
D Amount of sunlight present
B Hoeveelheid gasborrels
C Hoeveelheid hitte toegepas
D Hoeveelheid sonlig teenwoordig
10. For this experiment, name the independent variable. A Temperature of water
B Number of gas bubbles
C Amount of heat applied
D Amount of sunlight present
10. Noem die onafhanklike veranderlike vir
die eksperiment.
A Watertemperatuur
B Hoeveelheid gasborrels
C Hoeveelheid hitte toegepas
D Hoeveelheid sonlig
11. At what temperature is the rate of photosynthesis the highest? A 10°C
B 30°C
C 35°C
D 40°C
11. By watter temperatuur is die tempo van fotosintese die hoogste? A 10°C
B 30°C
C 35°C
D 40°C
12. How many gas bubbles are produced at 38°C? A 10
B 15
C 20
D 25
12. Hoeveel gasborrels word by 38°C
geproduseer? A 10
B 15
C 20
D 25
The concentration of lactic acid in the blood of an athlete was measured at intervals before, during and after a long-distance race, which lasted 10 minutes. The results are represented in the accompanying graph. Study the graph and answer questions 13 to 15 that follow:
Die melksuur konsentrasie in die bloed van ‘n atleet is met tussenposes gemeet voor, gedurende en na afloop van ‘n langafstandwedloop wat 10 minute geduur het. Die resultate word deur die bygaande grafiek voorgestel. Bestudeer die grafiek en beantwoord vrae 13 tot 15.

Appendix C: Pre- and Post Tests 336
13. What is the normal lactic acid concentration in the blood? A 18 arbitrary units
B 20 arbitrary units
C 40 arbitrary units
D 90 arbitrary units
13. Wat is die normale melksuur konsentrasie in die bloed? A 18 arbitrêre eenhede
B 20 arbitrêre eenhede
C 40 arbitrêre eenhede
D 90 arbitrêre eenhede
14. For how long did the concentration of lactic acid continue to increase after the end of the race? A 10 minutes
B 30 minutes
C 35 minutes
D 50 minutes
14. Vir hoe lank het die melksuur konsentrasie, na afloop van die wedloop, steeds toegeneem? A 10 minute
B 30 minute
C 35 minute
D 50 minute
15. How long did it take after the race to compensate for the oxygen debt? A 10 minutes
B 30 minutes
C 35 minutes
D 55 minutes
15. Hoe lank, na die afloop van die wedloop, het dit geneem om van die suurstof skuld ontslae te raak? A 10 minute
B 30 minute
C 35 minute
D 55 minute
Co
nc
en
trati
on
of
lacti
c a
cid
in
blo
od
/
Me
lksu
urk
on
sen
trasie
in
blo
ed
(arb
itra
ry u
nit
s / a
rbit
rêre
een
hed
e
Start of race End of race
Begin van wedloop Einde van wedloop Time / Tyd (minutes) Time/tyd
(minutes

Appendix C: Pre- and Post Tests 337
PRETEST 2 – ANSWER SHEET / ANTWOORDBLAD LIFE 111
1 A B C D
Motivation / Motivering: Body temperature / bio-enzyme
2 A B C D
Motivation / Motivering: Effect
3 A B C D
Motivation / Motivering: Body temperature and enzyme denatured at high
temperature
4 A B C D
Motivation / Motivering: 33% = 0.33 van 18 = 6
5 A B C D
Motivation / Motivering: 12% en 8% = 0.12 en 0.08 van 18 = 2 en 1
6 A B C D
Motivation / Motivering: Maximum activity
7 A B C D
Motivation / Motivering: Direk eweredig
8 A B C D
Motivation / Motivering: Explain sequence of graph
9 A B C D
Motivation / Motivering: Effect
10 A B C D
Motivation / Motivering: Cause / bring about the change
11 A B C D
Motivation / Motivering: Optimum – max reaction
12 A B C D
Motivation / Motivering: Direk eweredig

Appendix C: Pre- and Post Tests 338
13 A B C D
Motivation / Motivering: Constant level before exercise
14 A B C D
Motivation / Motivering: 30 – 20 min = 10min
15 A B C D
Motivation / Motivering: 55 – 20 min = 35min

Appendix C: Pre- and Post Tests 339
POSTTEST 2 LIFE 111
Various possible options are provided as answers to the following questions. Choose the correct answer and cross only the letter (A - D) next to the question number on the answer sheet, for example 1. E. Each answer must be motivated.
Verskeie moontlike opsies word as antwoorde vir die volgende vrae verskaf. Kies die antwoord en deurkruis slegs die letter (A – D) langs die vraagnommer op die antwoordblad, byvoorbeeld 1. E. Elke antwoord moet gemotiveer word.
In an investigation to determine whether two factors are essential for photosynthesis to occur successfully, the accompanying variegated leaf was used. It was partially covered with foil. The destarched plant was placed in the sun for few hours and then tested for the presence of starch. Study the accompanying diagram and answer questions 1 to 3 that follow:
In ‘n ondersoek om die noodsaaklikheid van twee faktore vir suksesvolle fotosintese vas te stel, is die bygaande gevlekte blaar gebruik, waarvan ‘n gedeelte met tinfoelie toegeplak is. Die ontstyselde plant is ’n paar uur in die son geplaas en daarna vir stysel getoets. Bestudeer die bygaande diagram en beantwoord vrae 1 tot 3 wat volg:
(Sterrenberg & Fouché, 2013:2.54)
1. Which TWO factors were simultaneously tested for? A Sunlight and plant colours
B Plant colours and carbon dioxide
C Carbon dioxide and sunlight
D Sunlight and chlorophyll
1. Vir watter TWEE faktore word hier gelyktydig getoets? A Sonlig en plantkleure
B Plantkleure en koolstofdioksied
C Koolstofdioksied en sonlig
D Sonlig en chlorofil
green part of leaf /
groen deel van blaar
tin foil /
tinfoelie
white part of leaf /
wit deel van blaar

Appendix C: Pre- and Post Tests 340
2. Which ONE of the following is the most
appropriate hypothesis for this
experiment?
A Sunlight and plant colours are essential for photosynthesis.
B Plant colours and carbon dioxide are essential for photosynthesis..
C Carbon dioxide and sunlight are essential for photosynthesis.
D Sunlight and chlorophyll are essential for photosynthesis.
2. Watter EEN van die volgende is die mees
geskikte hipotese vir die eksperiment?
A Sonlig en plantkleure is noodsaaklik vir fotosintese.
B Plantkleure en koolstofdioksied is noodsaaklik vir fotosintese.
C Koolstofdioksied en sonlig is noodsaaklik vir fotosintese.
D Sonlig en chlorofil is noodsaaklik vir fotosintese.
3. Which ONE of the following indicate the
most appropriate independent variables
for this experiment?
A Sunlight and starch
B Starch and carbon dioxide
C Carbon dioxide and sunlight
D Sunlight and chlorophyll
3. Watter EEN van die volgende dui die
mees geskikte onafhanklike
veranderlikes vir die eksperiment aan?
A Sonlig en stysel
B Stysel en koolstofdioksied
C Koolstofdioksied en sonlig
D Sonlig en chlorofil
Plants require carbon dioxide, water and light to produce sugar during photosynthesis. Assume a plant requires 4 units water, 4 units carbon dioxide and 10 units of light to produce 2 glucose units. Study the following table of data from the five plants and answer questions 4 to 7 that follow:
Plante benodig koolstofdioksied, water en lig om glukose tydens fotosintese te produseer. Veronderstel ‘n plant het 4 eenhede water, 4 eenhede koolstofdioksied en 10 eenhede lig nodig om 2 eenhede glukose te produseer, Bestudeer die volgende tabel met vyf plante se data, en beantwoord vrae 4 tot 7 wat volg:
Plant Units water / Eenhede water Units / Eenhede CO2 Units light / Eenhede lig
i) 16 16 20
ii) 16 12 30
iii) 20 16 20
iv) 20 20 40
v) 16 40 16
4. Which plant produced the most glucose? A ii)
B iii)
C iv)
D v)
4. Watter plant het die meeste glukose geproduseer? A ii)
B iii)
C iv)
D v)

Appendix C: Pre- and Post Tests 341
5. If plant v) received another 14 units of light, how many more units of glucose will it be able to produce? A 1
B 2
C 3
D 4
5. Indien plant v) nog 14 eenhede lig sou ontvang, hoeveel eenhede glukose sou dit kon produseer? A 1
B 2
C 3
D 4
6. How many more units of light does plant iv) require to produce 10 units of glucose? A 10
B 15
C 20
D 25
6. Hoeveel eenhede lig het plant iv) nóg nodig om 10 eenhede glukose te produseer? A 10
B 15
C 20
D 25
7. Which factor/s prevents plant i) from producing more glucose? Unit/s A water, CO2 and light.
B water and CO2.
C CO2 and light.
D light only.
7. Watter faktor/e by plant i) verhoed dat meer glukose geproduseer word? Eenhede A water, CO2 en lig.
B water en CO2.
C CO2 en lig.
D lig alleenlik.
An experiment was set up as shown in the diagram below. All the test tubes were kept in the light. Study the information below and answer questions 8 to 11.
‘n Eksperiment is opgestel soos in die bygaande diagram aangetoon. Al die proefbuise is in lig gehou. Bestudeer die bygaande inligting en beantwoord vrae 8 tot 11.
(Gebhardt et al., 2012:15)
A change in the concentration of carbon dioxide in the test tubes causes an orange indicator to change colour as follows:
normal amounts of CO2 : indicator - orange
‘n Verandering in die konsentrasie van koolstofdioksied in die proefbuise laat die indikator soos volg verkleur:
normale hoeveelheid CO2 : indikator - oranje
worms on fresh leaves / wurms op vars
blare
fresh green leaves / vars groen
blare
light / lig
CO2
indicator / CO2
indikator
air / lug

Appendix C: Pre- and Post Tests 342
low amounts of CO2 : indicator - purple
higher amounts of CO2 : indicator - yellow
klein hoeveelheid CO2 : indikator - pers
groot hoeveelheid CO2 : indikator - geel
8. Which ONE of the following indicates the
most appropriate dependent variable for
this experiment?
A Concentration of carbon dioxide
B Colour of the indicator
C Bright sunlight
D Complete darkness
8. Watter EEN van die volgende dui die
mees geskikte afhanklike veranderlike
vir die eksperiment aan? A Konsentrasie van koolstofdioksied
B Kleur van indikator
C Helder sonlig
D Algehele donkerte
9. Suggest the colour of the indicator at the end of the experiment in test tubes A, B and C respectively. A Yellow; yellow; orange
B Purple; yellow; orange
C Purple; orange; yellow
D Yellow; purple; orange
9. Stel voor wat die kleur van die indikator in proefbuise A, B en C onderskeidelik aan die einde van die eksperiment sal wees. A Geel; geel; oranje
B Pers; geel; oranje
C Pers; oranje; geel
D Geel; pers; oranje
Apply the following to questions 10 and 11: Leaves and worms of equal biomass were then hung together in another test tube, D, containing fresh orange indicator. Suggest what the colour of the indicator in D might be 10. after three hours in bright sunlight. A Purple
B Yellow
C Orange
D None of above
Pas die volgende op vrae 10 en 11 toe: Blare en wurms met gelyke biomassa word dan saam in ‘n ander proefbuis, D, geplaas wat vars oranje indikator bevat. Stel voor wat die kleur van die indikator in D moontlik sal wees 10. ná drie uur in helder sonlig. A Pers
B Geel
C Oranje
D Nie een van bogenoemde nie
11. after six hours in complete darkness. A Purple
B Yellow
C Orange
D None of above
11. ná ses uur in algehele donkerte. A Pers
B Geel
C Oranje
D Nie een van bogenoemde

Appendix C: Pre- and Post Tests 343
Study the following equation and answer questions 12 and 13 that follow:
Bestudeer die volgende vergelyking en beantwoord vrae 12 en 13 wat volg:
A
C6H12O6 + 6O2 6CO2 + 6H2O + energy B 12. What process is represented by this equation? A Photosynthesis: A – oxidation; B – reduction
B Respiration: A – oxidation; B –
reduction
C Photosynthesis: A – reduction; B – oxidation
B Respiration: A – reduction; B – oxidation
12. Watter proses word deur die vergelyking voorgestel? A Fotosintese: A – oksidasie; B – reduksie
B Respirasie: A – oksidasie; B – reduksie
C Fotosintese: A – reduksie; B – oksidasie
B Respirasie: A – reduksie; B – oksidasie
13. The process of reduction entails the A loss of electrons.
B removal of hydrogen atoms.
C gain of electrons.
D reducing of oxygen.
13. Die proses van reduksie behels die A verlies van elektrone.
B verwydering van waterstofatome.
C wins van elektrone.
D vermindering van suurstof.
An investigation was conducted to determine the relationship between light intensity and the release and uptake of carbon dioxide by the leaves of a plant. The results are indicated in the graph below. Study the graph and answer questions 14 and 15.
‘n Praktiese ondersoek is gedoen om die ver-wantskap tussen ligintensiteit en die produksie en absorpsie van koolstofdioksied in die blare van plante te bepaal. Die resultate word in die bygaande grafiek getoon. Bestudeer die grafiek en beantwoord vrae 14 en 15.

Appendix C: Pre- and Post Tests 344
(Sterrenberg & Fouché, 2013:2.55) 14. Within what range of light intensities is carbon dioxide released? A -1 to 0 arbitrary units
B 0 to 2.5 arbitrary units
C 2.5 to 35 arbitrary units
D more than 35 arbitrary units
14. Tussen watter reeks ligintensiteite word koolstofdioksied geproduseer? A -1 tot 0 arbitrêre eenhede
B 0 tot 2.5 arbitrêre eenhede
C 2.5 tot 35 arbitrêre eenhede
D meer as 35 arbitrêre eenhede
15. At a light intensity of above 25 units, the amount of carbon dioxide taken up remains the same. Which of the following limiting factors provide an explanation for this observation? A CO2 availability
B H2O availability
C The rate at which glucose is transported away from the photosynthetic cells
D All of above
15. By ‘n ligintensiteit van meer as 25 eenhede, bly die hoeveelheid koolstofdioksied wat geabsorbeer word, konstant. Watter van die volgende beperkende faktore verskaf ‘n verklaring vir die waarneming? A CO2 beskikbaarheid
B H2O beskikbaarheid
C Die tempo waarteen glukose weg vanaf die fotosintetiserende selle vervoer word.
D Al die bogenoemde
The relationship between light intensity and the release and uptake of CO2 /
Die verwantskap tussen ligintensiteit en vrystelling en opname van CO2
CO
2 p
rod
uc
ed
/
CO
2 t
aken
up
/
ge
pro
du
seer
g
eab
so
rbeer
(mg
/50 c
m3)
(mg
/50 c
m3)
Light intensity (arbitrary units) /
Lgintensiteit (arbitrêre eenhede)

Appendix C: Pre- and Post Tests 345
POSTTEST 2 – ANSWER SHEET / ANTWOORDBLAD LIFE 111
1 A B C D
Motivation / Motivering: Tin foil prevent sunlight from entering and green part
contain chlorophyll
2 A B C D
Motivation / Motivering: Contain both correct cause and effect
3 A B C D
Motivation / Motivering: Cause
4 A B C D
Motivation / Motivering: 8 units of sugar (16 water, 16 CO2, 40 light)
5 A B C D
Motivation / Motivering: 16 units of light + 14 = 30 therefore 3 more
6 A B C D
Motivation / Motivering: 50 – 40 = 10 units of light
7 A B C D
Motivation / Motivering: With 20 more light units it will double the amount of
sugars
8. A B C D
Motivation / Motivering: Effect
9 A B C D
Motivation / Motivering: Plant and worm respire more than plant only – C only
serves as control
10 A B C D
Motivation / Motivering: Worm respirates and plant photosynthesize at max-
11 A B C D
Motivation / Motivering: Both organisms respire and high levels of CO2
12 A B C D

Appendix C: Pre- and Post Tests 346
Motivation / Motivering: Respiration since oxidation is the loss of electrons
and reduction is the gain of electrons
13 A B C D
Motivation / Motivering: Reduction gain electrons and hydrogen atoms
14 A B C D
Motivation / Motivering: According the graph below x-axis
15 A B C D
Motivation / Motivering: All the factors are limiting photosynthesis

Appendix D: Thinking maps of participants 347
APPENDIX D
THINKING MAPS OF PARTICIPANTS

Appendix D: Thinking maps of participants 348

Appendix D: Thinking maps of participants 349

Appendix D: Thinking maps of participants 350

Appendix D: Thinking maps of participants 351

Appendix D: Thinking maps of participants 352

Appendix D: Thinking maps of participants 353

Appendix D: Thinking maps of participants 354

Appendix D: Thinking maps of participants 355

Appendix D: Thinking maps of participants 356

Appendix D: Thinking maps of participants 357

Appendix D: Thinking maps of participants 358

Appendix D: Thinking maps of participants 359

Appendix D: Thinking maps of participants 360

Appendix D: Thinking maps of participants 361

Appendix D: Thinking maps of participants 362

Appendix D: Thinking maps of participants 363

Appendix D: Thinking maps of participants 364

Appendix D: Thinking maps of participants 365

Appendix D: Thinking maps of participants 366

Appendix D: Thinking maps of participants 367

Appendix E: Open responses to questions 368
APPENDIX E
OPEN RESPONSES TO QUESTIONS

Appendix E: Open responses to questions 369
EXPERIMENTAL GROUP 1
Pre-test 1 and Post-test 1B – Examples of motivations
Question number and ideal answer
Examples of good motivations Examples of poor motivations
1. Steps are given in diagram.
“When a person is conducting a scientific investigation, he should undergo the same steps as shown”; “for every experiment carried out, there are certain steps to follow”; “it includes steps to follow”.
“Not all the investigations include water”; “… because the lettuce plant grow bigger”; “it has all the components of a good experiment”.
Many students did not provide any motivation for their answer.
2. Observation – what you see.
“An observation is what you see”; “.. this is because during investigation you can see…”; “is to see whether or not …”.
“The aim of the question was ..”; “one tray received more water”; “…due to the requirements of photosynthesis..”.
3. Cause “The independent variable is responsible for the results”; “it cannot be manipulated”; “the water is the variable that changes the growth”.
“Bigger plants are more likely to stay big”; “sunlight will not effect the growth”; “the plant cannot undergo photosynthesis”.
4. Statement with cause and effect.
“…a scientific prediction which involves both the dependent and independent variables”; “it is a statement”; “… a prediction that should be proved”.
“Because plant will grow bigger”; “because scientists wants to test the theory of water”; “the question of the experiment was about…”
5. Effect “ The dependent variable are controlled by the independent variable”; “… the plant depend on the amount of water”; “… the plant depend on the water”.
“The experiment proves lettuce grow bigger”; “… more water must be added”.
No motivation provided.
6. According the scientific method
“When a scientific investigation is conducted …”; “… when you design an experiment, you must follow the correct steps”; “…first you need to know the reason why the experiment is conducted”.
“It is the correct setup to design an …”; “… one has to know which way they need to go’; “… the aim comes first”.
7. Statement with cause and effect.
“A hypothesis is a scientific prediction”; “… predict from the investigative question…”; “… predict the outcome”.
“Investigation is about a boiling cup of water and sugar”; “ ... sugar dissolves faster”; “… particles of sugar dissolve more in water”.

Appendix E: Open responses to questions 370
Question number and ideal answer
Examples of good motivations Examples of poor motivations
8. Cause “In order for more sugar to dissolve the water must be heated”; “… sugar depends on cup of heated water”; “ ...for sugar to dissolve depend on heat”.
“Sugar is the one that’s going to be tested”; “… it does not depend on water or sugar”; “… it does not depend on anything”.
9. Effect “Heat determines how much sugar dissolves”; “… the person conducting the experiment has control over the amount of heat”; “… heat is influencing the sugar...”
“Heat will be increased”; “… a cup of water that contains sugar”; “… it does not depend on anything”.
10. Must be the same in cause and effect.
“It is not effected during the experiment”; “… cup of water does not change”; “… cup of water must be constant”.
“Because this experiment is about the water carrying ability”; “… so the result could be more appropriate”; “… the results of the experiment”.
11. According to the introduction
“…the experiment was done in order to check the water-carrying capacity”; “… from the introduction…”; “… the scientist is investigating the water-carrying capacity”.
“The soil type were placed in funnels”; “… the soil types differ”; “… dependent and independent variables are there”.
12. Cause “Different types of soil were used”; “… the volume of filtrate depends on the soil type”; “… soil sample is independent”.
“The time determines the volume..”; “… because it changes the whole experiment”; “… time only will tell us the best…”.
13. Effect “The volume depends on the soil type”; “… it depends on the soil sample”; “… volume is affected by the type of soil”.
“The person investigating can control filter papers”; “… it is water-carrying capacity that depends on other factors”; “… it depends on the time”.
14. According to the introduction
“They are not effected during the experiment”; “… they don’t change”; “… they need to remain the same during the experiment”.
“This is made fair for every soil type...”; “… for the results to be more accurate”; “… all these three variables need to be equalised…”.
15. Linked to question
“…the conclusion in response to the question”; “… clay has the best carrying capacity”; “… sand has a low carrying capacity”.
“The spaces between the clay particles are small”; “… volume of filtrate in clay did not increase”; “… it takes longer time for water to infiltrate”.

Appendix E: Open responses to questions 371
Post-test 1 – Examples of motivations
Question number and ideal answer
Examples of good motivation Examples of poor motivation
1. Contains no fats
“Don’t contain fats”; “… it consists of only carbohydrates”; “ …does not have fat”.
“It has a lot of fats”; “… has less fats”; “… it has more fats”.
2. Contains most proteins
“Has much protein in food”; “ ... the more proteins, the faster growth”; “… more amount of protein…”.
“Because it has lots of fats”; “… because there are more carbohydrates and fewer proteins”; “ ... it does not contain fats”.
3. Contains most fats
“Contains a lot of fat”; “… consist mainly of fats”.
“Because it contains all three types of energy sources”; “…contains a lot of carbohydrates”; “… because it has all the food types”.
4. Half of nutrients are fat
“It occupies 50% of chart”; “… it took half of the pie chart”; “… fats is 50%…”.
“… more amounts of carbohydrates”; “… fats is a quarter of the food types”; “ … one that has a medium percentage…”.
5. Body temperature / optimum temperature for catalase
“At 37ºC that’s where enzyme catalase started the reaction”; “… normal function is at 37ºC”; “… body temperature is 37ºC”.
“Because we have different variable temperatures”; “... will vary due to different temperatures”; “… hypothesis is only a prediction”.
6. Body temperature / optimum temperature for catalase
“Enzyme function best at optimal temperature which is 37ºC”; “… enzymes usually most effective at body temperature”; “… that is the suitable temperature for catalase”.
“Because enzyme function best at optimal temperature”; “… the temperature is high”; “… because water is boiling”.
7. Effect “It depends on the temperature of the water bath”; “… because temperature determines the effect”; “… the temperature of the water bath causes the effect”.
“… the bubbles formed and is dependent on water”; “… condition of the liver depends on the water”; “… the catalase will have an effect on the liver”.
8. Cause “The temperature of the water bath”; “… the temperature is the cause”; “… because temperature is the one that cause…”.
“The condition of the chicken liver”; “… the amount of hydrogen provided…”; “… it is what must be observed”.
9. Dependent “The variable that has to stay the same”; “… it varies according to the temperature”; “… it is a dependent variable”.
“Because the amount of liquid oxygen…”; “… the amount of liquid displaced was not a variable”; “… liquid in different beakers”.

Appendix E: Open responses to questions 372
Question number and ideal answer
Examples of good motivation Examples of poor motivation
10. Meiosis I “… correct sequence of meiosis I”; “… phases of meiosis I”; “… meiosis is a reduction division process”.
“The sequence starts with interphase and ends with telophase”; “… because in cell division always in the nucleus…”; “… mitosis stages are …”.
11. Reduction of chromosome number
“Meiosis is a reduction division”; “… after meiosis only half the number in daughter cells”; “… it is a reduction process”.
“Mitosis half’s the number”; “… meiosis is the doubling of chromosomes”; “… 1 parent give rise to 2 daughter cells”.
12. Reduction of chromosome number
“homologous chromosomes align at equator”; “ … the results of crossing over”; “… chromosomes are still in pairs”.
“… there are chromatids not chromosomes”; “… they are not aligned at metaphase I”; “… chromosomes have already crossed…”.
13. No reduction of chromosome number
“The chromosomes have been halved in meiosis I”; “… crossing over had already occurred in prophase I”; “… chromatid moving from centre”.
“…so that the daughter cell has both maternal and paternal material”; “… sister chromosomes align at equator”; “… chromosomes align in pairs”.
14. Hypotonic high water potential
“End osmosis take place”; “… water will move from high to low concentrations”; “… the water enters the cell to lower concentration”.
“Water moves away from the cell…”; “… the solution is hydrophobic”; “… hypo means water is available”.
15. Hypertonic low water potential
“The water drains from the solute”; “… the water exits the vacuole”; “… hypertonic is the higher solute and less water concentration”.
“Water enters the cell”; “… the vacuole moves towards the cell membrane”; “… because water exits”.

Appendix E: Open responses to questions 373
Pre-test 2 and post-test 2B – Examples of motivations
Question number and ideal answer
Examples of good motivation Examples of poor motivation
1. Body temperature / bio-enzyme
“At 37ºC the enzyme functioned…”; “… at 37ºC the enzyme functions at its peak”; “…the stain is gone at 37ºC”.
“The enzymes did not remove the stains at the same temperature”; “… the temperature is too high and enzyme denature”; “… a statement that shows both variables”.
2. Effect “Results are depending on the temperature”; “… the results depend on the temperature”; “… results after washing depends on the temperature in order for the enzymes to function”.
“The size of the blood stain”; “… different temperature cause different results”; “… temperature depend on the time”.
3. Body temperature and enzyme denatured at high temperature
“Enzymes function optimally at 37ºC and denature at 3”; “… tablecloth 2 was washed at 37ºC and tablecloth 3 higher which denature the enzyme”; “… the enzyme functions optimally at 37ºC and lost its function at 65ºC”.
“Tablecloth 2 is very clean”; “… the higher the temperature the better function the enzymes”; “… enzymes need heat to function well”.
4. 33% = 0.33 van 18 = 6
“33/100 X 18 = 6”; “5.94; 33/100 x 18”. The only correct answer.
“It is six portions of the total consumed”; “… they are the highest that were consumed”; “… because we have to consume 3 meals /day”.
5. 12% en 8% = 0.12 en 0.08 van 18 = 2 en 1
“12/100 x 18 = 2.16 and 8/100 x 18 = 1.44”; “ 12% is 2 and 8% is 1”; “12% of 18 is 2 and 8% of 18 is 1”. The only correct answer.
“Percentages will be reduced to decimals”; “… when you subtract 3 from 6, 3 is left for milk”; “… the graph is at its highest point at 25ºC”.
6. Maximum activity
“Temperature at its peak”; “… whereby the most amount of food is broken down”; “… 20 mg/h is broken down at 35ºC”.
“This is because at 5ºC 3-4 mg/h has been broken down”; “… it has reached an equilibrium”.
7. Linear “Where graph corresponds with 15mg/h”; “… amount of 15mg/h is at a conjunction with 25ºC”; “… at 25ºC the amount of food broken down is indicated as 15mg/h”.
“According to the graph”; “… the temperature increases and more food are being broken down”.

Appendix E: Open responses to questions 374
Question number and ideal answer
Examples of good motivation Examples of poor motivation
8. Explain sequence of graph
“According the shape of the graph…”; “… enzyme function low at low temperature and as the temperature increases, they speed up the function”; “… enzyme activity started at low temperature and rise to a point of optimum”.
“This sequence best describe the shape”; “… it started at low temperature and increases”; “… at the beginning of the graph, there is no enzyme activity…”.
9. Effect / Y-axis “ …different temperatures different number of bubbles...”; “… it depend on the temperature of the water”; “… they are depending on the temperature”.
“Temperature of water depend on the number of gas bubbles”; “… the temperature of the water depend on the rate of photosynthesis”; “… temperature of water is dependent”.
10. Cause / bring about the change
“We are testing its effect on photosynthesis”;
“… temperature of water has an effect on the results”; “… it causes the change in gas bubbles”.
“The amount of sunlight”; “… amount of sunlight cannot be controlled’; “… the amount of sunlight cannot be controlled”.
11. Optimum – max reaction
“The graph reaches its peak at 35ºC”; “… the number of bubbles are more at 35ºC”; “… it produces the most gas bubbles”.
“The maximum height; optimal temperatures”; “… as gas bubbles decrease, water content also decreases”; “… this is the highest temperature”.
12. Linear “According the graph…”; “… as indicated in graph”; “… a right angle is formed where 38ºC and 25 bubbles join together”; “… according to the graph”.
“The water temperature is decreasing”; “… the temperature is not really high at that point”; “… because the temperature is high”.
13. Constant level before exercise
“Because the number of arbitrary units are constant”; “… this is where the line is prior to the race”; “… starting point and normal levels”.
“The race has not begun…”; “… 90 arbitrary units are the highest”; “… because the lactic acid last for ten minutes in the blood”.
14. 30 – 20 min = 10 min
“The race ended at 20 minutes, continued to increase until 30 minutes which means 10 minutes”; “… it continued to increase from 20 to 30”. The only correct answer.
“Lasted for 50 minutes”; “… as in line graph”; “… it took 10 minutes to decrease”; “… because it become higher”.

Appendix E: Open responses to questions 375
Question number and ideal answer
Examples of good motivation Examples of poor motivation
15. 55 – 20 min = 35 min
“Temperature drop to normal in 55 minutes which was 35 minutes after the race”. The only correct answer.
“The concentration of lactic acid is now going back”; “… it is the time for lactic acid concentration to go back”; “… the concentration remain constant”.

Appendix E: Open responses to questions 376
Post-test 2 – Examples of motivations
Question number and ideal answer
Examples of good motivation Examples of poor motivation
1. Tinfoil prevent sunlight from entering and green part contain chlorophyll
“Leaf covered with tin foil and contain green part”; “… sunlight and plant colour…”; “… variegated leaf test chlorophyll and covered part test sunlight”.
“CO2 and sunlight were tested”; “… to test whether chlorophyll is necessary for photosynthesis”; “… test was performed with a variegated leaf”; “… colour of leaf will change if CO2 is present”.
2 Contain both correct cause and effect
“Plant needs both for photosynthesis”; “… they were both tested; the statement mention the two variables tested”.
“Sunlight is the main source that allows photosynthesis”; “… they indicate if photosynthesis has occurred”; “… sunlight and CO2 are…”.
3. Cause “Chlorophyll depends on sunlight”; “… they both cause the effect”; “… they do not change nor depend on any variable”.
“CO2 and sunlight depend on nothing”; “… the leaf depends on sunlight”; “… they are both effected”.
4. 8 units of sugar (16 water, 16 CO2, 40 light)
“It produced 8 units of glucose”. The only correct answer.
“They use more units of light compared to the rest”; “… glucose were influenced by light”; “… more CO2 is present, so CO2 will be reduced”.
5. 16 units of light + 14 = 30 therefore 3 more
“14 + 14 = 30 : 3”. The only correct answer
“6 + 14 = 4 glucose”; “… each plant requires 4 units of light”; “… there has been an addition in the light units”; “… more units of light will result in more units of glucose”.
6. 50 – 40 = 10 units of light
“it already has 8 units of glucose and only needs 2 to make 10”. The only correct answer.
“20/4 = 10”; “… it will be able to produce 4 more glucose units”; “… if more light is added the plant will produce more food”.
7. With 20 more light units it will double the amount of sugars
“Double the amount of sugars”. The only correct answer.
“The number of CO2 and H2O units is too low”; “… because it receives less units of CO2 and H2O”; “… the light units are less”.
8. Effect “The colour of the indicator depends on the CO2 concentration”; “… the effect refer to the colour of the indicator”; “… the colour of the indicator is an effect”.
“There is air produced and CO2 indicator”; “… concentration depends on sunlight for energy and green plant to produce CO2”; “… the concentration of CO2 determines the indicator”.

Appendix E: Open responses to questions 377
Question number and ideal answer
Examples of good motivation Examples of poor motivation
9. Plant and worm respire more than plant only – C only serves as control
“Worm will add CO2 during respiration, plant will use CO2 during photosynthesis”. The only correct answer.
“B contains living organisms”; “Test tube A will have higher amounts of CO2”; “… worm will take out CO2”.
10. Worm respires and plant photosynthesize at max-
“The CO2 produced by the worms will be used by the plant to produce oxygen”; “… the worm produce CO2 and the plant use CO2”; “… the worm respirates and the plant photosynthesise”.
“Light intensity does not affect the availability of CO2”; “… the colours were already present in test tubes A, B and C”; “… the worms would have produced more CO2 in the test tube”.
11. Both organisms respire and high levels of CO2
“In complete darkness CO2 will be at its highest”; “CO2 will be produced by both organisms”; “… photosynthesis does not take place, only respiration”.
“It will not be exposed to any type of a light so it might have very low levels”; “… the worm and plant photosynthesise”; “… low amounts of CO2”.
12. Respiration since oxidation is the loss of electrons and reduction is the gain of electrons
“Respiration undergoes reduction to produce H2O”; “… because the end products of photosynthesis are needed”; “… the breaking down of carbohydrates”.
“Because during photosynthesis oxidation takes place before reduction”; “… because this is a reduction process that take place”; “… because in A the molecules are large and in B they are smaller”.
13. Reduction gain electrons and hydrogen atoms
“Reduction gain electrons”; “… electrons that are lost in oxidation in a form of hydrogen are being gained”; “… there is a gain of electrons in the equation”.
“Reduction is the removal of hydrogen atoms”; “… oxygen is removed from hydrogen”; “… the loss of electrons”.
14. According the graph below x-axis
“After 2.5 arbitrary units CO2 is taken up”; “… according graph below x-axis”.
“After 2.5 CO2 is released”; “… from 0 it is taken in”; “… height does not play a role in CO2 being released”.
15. All the factors are limiting photosynthesis
“Because they all contribute to photosynthesis”; “… photosynthesis requires the presence of all mentioned”; “… they are all limiting the process”.
“More CO2 has been taken in and used for photosynthesis”; “… when H2O is available it works hand in hand with CO2”; “… because water availability causes a light reaction”.

Appendix E: Open responses to questions 378
EXPERIMENTAL GROUP 2
Pre-test 1 and post-test 1B – Examples of motivations
Question number and ideal answer
Examples of good motivation Examples of poor motivation
1. Steps are given in diagram.
“When conducting an experiment, there are steps that needs to be followed”; “… the scientific method are used in every scientific investigation”; “… because the steps must be followed”.
“In scientific investigations, the scientific method is the best”; “… the steps include different stages”; “… it has no aim”.
2. Observation – what you see.
“...the plant height in one tray was taller”; “… one tray has bigger plants than the other”; “… one tray has grown lettuce plants”.
“she is doing an experiment and need a result”; “… the height in the two trays are not the same”; “… the other tray receives more water”.
3. Cause “…we can change the amount of water”; “… the growth of the plants depends on water”; “… water is used to determine the result”.
“Because we are investigation its effect on plants”; “ ..lettuce needs water”; “… the more water, the more they grow”.
4. Statement with cause and effect.
“It has not yet been proven”; “ ..a statement that needs to be proven”; “ … is a statement”.
“... a possible outcome”; “… because water fertilises the roots”; “… because that is what the investigator suspected”.
5. Effect “The dependent variable is the effect”; “… the growth of the plants…”; “… the result will depend on this variable”.
“plants are dependent on water”; “… the amount of sunlight cannot be changed”; “… the bigger the plant, the more water it needs”.
6. According the scientific method
“The steps of the scientific method must be followed”; “… it is the scientific manner”; “… scientific investigations should be ordered this way”.
“They must be in that order…”; “… to reject or accept the hypothesis”; “… you need to know your aim”.
7. Statement with cause and effect.
“Hot water allows more sugar to dissolve”; “ … a statement that needs to be proven”; “… sugar dissolves quicker if the water is hot”.
“Sugar as a solid substance can be more solved”; “… particles move faster in boiling water”; “… the question was all about…”.
8. Cause “The sugar dissolving is dependent on the heat”; “… the water need to be heated for the sugar to dissolve”; “ … sugar depends on hot water to dissolve”.
“The cup of water depends on the heat for the sugar”; “… sugar is dependent on cup of water”; “… the cup of water will depend on the amount of heat”.

Appendix E: Open responses to questions 379
Question number and ideal answer
Examples of good motivation Examples of poor motivation
9. Effect “The heat is what we change and has an effect on sugar”; “… because sugar depends on heat to dissolve”; “ ..the effect tested”.
“..the one that give us results”; “… the sugar should be constant”; “… we are not depending on cup of water”.
10. Must be the same in cause and effect.
“Accept for sugar and hot water, all other variables must be constant”; “… amount of water must stay the same”; “… same cup and amount of water has to be used”.
“Cup of water should be kept constant”; “… because without water, sugar cannot dissolve”; “… because there are different volumes in sol”.
11. According to the introduction
“… scientist is investigating the water-carrying capacity of soil”; “… question based on different soil types”; “… comparing the water-carrying capacity of soil”.
“Water was added in all three types of soil”; “… it is the aim of the investigation”; “… the longer the soil is dipped in water, the greater the filtration”.
12. Cause “it’s the variable that cause the effect”; “… soil type can be changed”; “… soil types are different, making the time of filtration different”.
“it determines how much water is absorbed”; “… time does not depend on the volume”; “… the volume of the filtrate was observed”.
13. Effect “We depend on soil types to check water carrying-capacity”; “… volume of filtrate depends on soil types”; “… tested the effect of the cause”.
“It depends on the volume of water”; “… soil depends on water…”; “… the more time, the more filtration”.
14. According to the introduction
“The variables must not be changed”; “… they were kept the same”; “… the variables stay the same”.
“it is important that they are fixed’; “… because they are all available”; “… they are all variables”.
15. Linked to question
“Clay has the best water-carrying capacity”; “… spaces between clay particles are small”; “…; “sand filtrates more water”.
“The spaces between the particles are very small”; “… it absorbs more water than the other types of soil”; “… it filters less water”.

Appendix E: Open responses to questions 380
Post-test 1 – Examples of motivations
Question number and ideal answer
Examples of good motivation Examples of poor motivation
1. Contains no fats
“They contain the least fats”; “… lack of fat”; “… there are no fat…”.
“Because there are no carbohydrates”; “… it has about 70% fats”; “… has more fat than other proteins”.
2. Contains most proteins
“They have more proteins”; “… proteins are responsible for growth”; “… more proteins found here which …”; “… contains the most proteins”.
“because they contain a lot of oil”; “… because the pie chart line is in the middle”; “… because fats influence growth”.
3. Contains most fats
“Contains most fat”; “… fats are the main source of energy”; “… because fats contain more energy”.
“it is a form of glucose”; “… carbohydrates is a source of energy”; “… protein are essential for energy”; “… it is the structural component of the body”.
4. Half of nutrients are fat
“Fats take up half of the pie chart”; “… half consists of fat”; “… it is 50% fats”.
“Its half of carbohydrates and proteins”; “… fats are represented as a quarter of the chart”; “… fat is a total of 75% of total”.
5. Body temperature / optimum temperature for catalase
“The internal environment functions optimally at 37ºC”; “… this is the best temperature at which catalase functions”; “… enzyme functions best at 37ºC”.
“Hypothesis is supposed to be a statement”; “… the temperature is not too high or too low”; “… the hypothesis has both variables”.
6. Body temperature / optimum temperature for catalase
“Enzymes most active at body temperature”; “… enzyme function best at optimum temperature”; “… the temperature seems at optimal…”.
“it changes as more variables are added”; “… catalyst speed up reaction under high temperature”; “… what can be controlled”.
7. Effect “Because it depends on the temperature”; “… temperature is what we change”; “… because the condition of it depends on temperature”.
“The matter that is tested, the cause”; “… because it causes the effect”; “… it is what we are testing for”.
8. Cause “The condition of the chicken liver depends on temperature”; “… we have to use different temperature…”; “… temperature has an effect”.
“The chicken liver is the one that reacts”; “… hydrogen peroxide determines the reaction”; “…the amount of bubbles formed”.
9. Dependent “The condition of the liver”; “… different temperatures”; “… water temperature”; “… during different temperatures”.
“The amount of hydrogen peroxide”; “… because it is not weight”; “… the liquid that was displaced”.

Appendix E: Open responses to questions 381
Question number and ideal answer
Examples of good motivation Examples of poor motivation
10. Meiosis I “This is meiosis…”; “… the process of meiosis…”; “… the correct sequence of meiosis”.
“…the first stage for DNA replication”; “… correct sequence for cell division”; “… correct steps for cell division”.
11. Reduction of chromosome number
“…reduction of chromosome number”; “… it is the reduction process of …”; “… meiosis halves the number of chromosomes”.
“Both parents will transfer equal number of chromosomes”; “… it replicates and …”; “… at the end daughter cells receive the same number of chromosomes”.
.
12. Reduction of chromosome number
“Due to the process of meiosis”; “… chromosomes already reduced”; “… chromatids move to poles”.
“The chromosomes are duplicated”; “… crossing over has already taken place”; “… chromosomes are in homologous pairs”.
13. No reduction of chromosome number
“Chromosomes line up on equator”; “… reduction has halved the number of chromosomes”; “…the chromatids are about to split”.
“The metaphase of meiosis”; “… telophase has not occurred”; “… chromosomes are in homologous pairs”.
14. Hypotonic high water potential
“large amount of water molecules”; “… through osmosis water moves from higher to lower”; “… because the lower concentration of water in solute concentration”.
“The water will separate from the solution”; “… water enters the area of high …”; “… the cell get swollen”.
15. Hypertonic low water potential
“Higher solute concentration”; “… the cell shrinks”; “… cell expands as water enters”.
“Water exits…”; “… will go to the point of high concentration …”; “… the cell will change its shape”.

Appendix E: Open responses to questions 382
Pre-test 2 and post-test 2B – Examples of motivations
Question number and ideal answer
Examples of good motivation Examples of poor motivation
1. Body temperature / bio-enzyme
“Because it has both dependent and independent variables”; “… all variables are mentioned in the statement”; “… the enzyme functions optimally at 37ºC”.
“The hypothesis should include a different temperature”; “… enzymes act at different temperatures”; “… hypothesis only a prediction”.
2. Effect “The result after washing and is dependent on enzyme activity”; “… the results depend on the temperatures”; “… it depends on the different temperatures”.
“The stains are not measured”; “…the size of the blood stains are observed”; “… there cannot be results without the experiment”.
3. Body temperature and enzyme denatured at high temperature
“The enzyme function best at body temperature”; “… 37ºC worked optimally and at 65ºC was denatured”.
“Because the blood stains are not removed at 15ºC and 37ºC”; “… tablecloth 2 was washed under 37ºC and the enzyme worked effectively”.
4. 33% = 0.33 van 18 = 6
“Because 33% of 18 is 6”; “... 33% of 18 is 5.94”.
“Because it is the biggest portion per day”; “ …if 4 comes from fruit, the rest comes from 18”.
5. 12% en 8% = 0.12 en 0.08 van 18 = 2 en 1
“12/100 x 18 = 2.16 and 8/100 x 18 = 1.44”; “12% is 2 and 8% is 1”; “12% of 18 is 2 and 8% of 18 is 1”.
“Because 1 and 2 will balance the portions”; “… their percentages are the lowest”; “… variation from meats and alternatives”.
6. Maximum activity
“Best results as enzyme is optimally active”; “… amount of food broken down at that point is high”; “… most of the food is broken down”.
“More amount of food is digested”; “… the ratio of meat to meat”; “… No motivation supplied.
7. Linear “At 25ºC the amount of food broken down is indicated as 15mg/h”; “… where graph corresponds with 15mg/h”; “… amount of 15mg/h is at a conjunction with 25ºC”.
“The temperature increases and more food are being broken down”; “… according to the graph”.
8. Explain sequence of graph
“Steps follow line of graph”; “… sequence starts with low temperature and rises as temperature rises”; “… according to the graph”.
“The graph shows that enzymes are inactive at low and again at high temperature”; “… the enzyme temperatures start at low”; “… when temperatures increase, the enzyme reaction increases”.

Appendix E: Open responses to questions 383
9. Effect “They are effected by the temperature”; “… the number of gas bubbles is the effect”; “… the gas bubbles will indicate the effect”.
“Temperature will be determined by the amount of heat provided”; “… the effect of water temperature”; “… it is the variable that can be changed”.
10. Cause / bring about the change
“The temperature causes this…”; “… it is use to see the effect on the number of gas bubbles”; “… the temperature of the water bring about the change”.
“The variable that cannot be changed”; “… the heat applied serves as the cause”; “… there will be no measured bubbles”.
11. Optimum – max reaction
“Temperature where most bubbles are formed”; “… from graph and use ruler with vertical line drawn from 35ºC”; “… maximum bubbles appear at 35ºC”.
“Because that is the moderate temperature”; “… at 30ºC the amount of gas bubbles are higher”; “… because the graph shows at 40ºC”.
12. Linear “According the graph..”; “… at 38ºC the corresponding value is 25 gas bubbles”.
“Graph shows 20”; “… the water is warmed for more minutes”; “… the number of bubbles quickly decreases”.
13. Constant level before exercise
“According graph the level before exercise”; “… measured before the race”; “… before the race it is 18”.
“before the race the lactic acid is 20…”; “… lactic concentration is higher when the athlete is stationary”.
14. 30 – 20 min = 10 min
“Lactic acid concentration increased after 10 minutes”; “… 30 – 20 min = 10 minutes”.
Wrong calculations.
15. 55 – 20 min = 35 min
“The lactic acid went back to its normal count at 55 min, this was 35 minutes after the race”; “ 55 – 20 min = 35 min.
Wrong calculations.

Appendix E: Open responses to questions 384
Post-test 2 – Examples of motivations
Question number and ideal answer
Examples of good motivation Examples of poor motivation
1. Tinfoil prevent sunlight from entering and green part contain chlorophyll
“Part of leaf was covered with tin foil and other parts contain chlorophyll”; “… plants require sunlight and chlorophyll to photosynthesise”; “… the foil is testing whether sunlight is necessary and green if chlorophyll is essential”.
“Because CO2 and sunlight are essential …”; “… the plant colour was white and green”; “… these factors are essential for photosynthesis”.
2. Contain both correct cause and effect
“A statement with both variables”; “… testable statement with cause and effect”; “… both dependent and independent variables in prediction”.
“CO2 is necessary for photosynthesis”; “… that is what the investigation is about”; “… that is what you change in the experiment”.
3. Cause “They are factors that cannot be changed”; “… both causes the effect; can be controlled”.
“CO2 and sunlight are needed”; “… the leaf depends on CO2 and sunlight …”; “… CO2 and sunlight are the ones causes the effects”.
4. 8 units of sugar (16 water, 16 CO2, 40 light)
“It produced 8 units of glucose”. The only correct answer.
“Has the most light, CO2 and H2O total”; “… the light unit is high”; “… it accumulates a lot of CO2 which is then converted to glucose”; “… because it has the highest units of CO2, H2O and light”.
5. 16 units of light + 14 = 30 therefore 3 more
“14 + 14 = 30 : 3”. The only correct answer.
“14 will be added to the 6 which makes it 20 units”; “… it receives more amount of light”; “… because each unit of light will reduce 1 CO2 to a glucose”.
6. 50 – 40 = 10 units of light
“It already has 8 units of glucose and only needs 2 to make 10”. The only correct answer.
“The more the units of light, the better”; “… 20 units…”; “… more light results in more glucose produced”.
7. With 20 more light units it will double the amount of sugars
“Double the amount of sugars”. The only correct answer.
“There is less water and CO2. Plants need all three to produce glucose”; “… plant 1 has small units of these factors”; “… more units of light will result in more units of glucose”.
8. Effect “The change in colour depends on CO2 concentration”; “… this relates to the effect”; “… this is what you cannot change”.
“It changes according to the concentration of CO2”; “… it influences the change in colour”; “… the colour depends on the concentration of CO2”.

Appendix E: Open responses to questions 385
Question number and ideal answer
Examples of good motivation Examples of poor motivation
9. Plant and worm respire more than plant only – C only serves as control
“Worm will add CO2 during respiration, plant will use CO2 during photosynthesis”. The only correct answer.
“CO2 is reduced”; “… the indicator cause the colour change…”; “… in test A the leaves absorb CO2 so it will be poor”.
10. Worm respires and plant photosynthesize at max-
“Normal, plant takes in CO2 which was released by worms”; “… worm releases CO2 and plant absorbs CO2 during photosynthesis”.
“A change in concentration of CO2 exposed to light”; “… photosynthesis will occur during 3, 6 hours of sunlight needed”; “… the worm might die and cause CO2 to rise”.
11. Both organisms respire and high levels of CO2
“CO2 concentration would increase since both release CO2 in dark”; “… both respirate and release CO2”; “… high amounts of CO2 as both release CO2”.
“The CO2 might be used up”; “… remain orange as there is no sunlight to charge up the reaction”; “… during dark phase plants uses a lot of CO2”.
12. Respiration since oxidation is the loss of electrons and reduction is the gain of electrons
“Glucose is oxidized and reduced to CO2 and H2O”; “… glucose was oxidized since it lost electrons”; “O2 was reduced because it gained electrons”.
“Indicates the equation of photosynthesis”; “… O2 is being oxidized”; “… the by-product are the same of that of photosynthesis”.
13. Reduction gain electrons and hydrogen atoms
“Reduction is gaining of electrons”; “… you gain electrons”; “… .reduction gain electrons or hydrogen atoms”.
“H2O is oxidized and CO2 is reduced”; “… reduction is represented”; “… No motivation provided.
14. According the graph below x-axis
“CO2 is produced between those units”; “… below the x-axis on graph”.
“CO2 was still increasing between 2.5 to 35 arbitrary units”; “… CO2 increases rapidly”; “… it is shown in the graph”.
15. All the factors are limiting photosynthesis
“All three important in the process of photosynthesis”; “…all the factors may limit photosynthesis”; “… they are all contributing factors”.
“Some of the factors must be absent”; “… H2O is produced during the process”; “… more glucose is produced since there is enough sunlight”.