Empirical Validation of Daylight Simulation Tool for a Test Office with Anidolic Daylighting System
9
J. Basic. Appl. Sci. Res., 3(9)104-112, 2013 © 2013, TextRoad Publication ISSN 2090-4304 Journal of Basic and Applied Scientific Research www.textroad.com * Corresponding Author: Mohsen Roshan, Department of Architecture, Faculty of Built Environment, Universiti Teknologi Malaysia, UTM Skudai, 81310 Johor, Malaysia. E-mail: [email protected] Mobile: 0060-137840090 Empirical Validation of Daylight Simulation Tool for a Test Office with Anidolic Daylighting System Mohsen Roshan * , Mohd Zin Kandar, Mohammad Pir Mohammadi, Yakubu Aminu Dodo Department of Architecture, Faculty of Built Environment, Universiti Teknologi Malaysia, Malaysia ABSTRACT The use of simulation tools to evaluate the daylighting performances of building design attracts enormous interest for architects, engineers and researchers. Integrated Environmental Solution <Virtual Environment> (IES<VE>) is a software tool to daylighting design and analysis. It intends to simulate daylight in buildings and to predict illuminance. The aim of this research is to validate the IES software simulated results and results measured of scale physical model with installed Anidolic Daylighting System (ADS) in a building under real condition in a tropical area. Scaled model was constructed to be tested under real sky measurement. In additional, the same model was designed in the IES<VE> for measuring illuminance. Using this software to study in the ADS, it can be found that absolute work plane illuminance in the intermediate and overcast sky recorded mean difference from the measured results, with 4.6% and 3.8% respectively also DF results illustrated promising results with 4.5% in the overcast sky. However in sunny sky is illustrated high mean difference with relative error 57%, while the trend of these results is approximately similar but the luminance ratio results shown acceptable mean measurement in sunny sky with 2.8%. The simulation results prove that inside illuminance can be modeled with comparable accuracy for ADS under real sky conditions in the intermediate and overcast sky. For future study, validation of other parameters can be carried out such as the size of the ADS, window sizes, environment setting. KEYWORDS: Emprical Validation. Daylight Simulation. Office building. Anidolic Daylighting System IES<VE> Software 1. INTRODUCTION Reducing the energy especially artificial lighting load is a critical step towards sustainable and energy-efficient buildings. In office buildings are consuming more than 40% of the over electricity with artificial lighting and reduction of that is particularly notable in these places [1;2;3]. Preparing available daylight in building not only desirable for energy efficiency reasons, but also improves a healthy and comfortable environment for the occupants [4]. Windows on vertical façades provide the aperture for daylight, but that can only penetrate a limited distance from the windows. For designing higher and longer aperture to provide more daylight at the back of the room lead to an unavailable area in near of the window and increase of cooling load and solar glare. Methods are detected to solve above problems include to employing some form of daylight systems to transfer daylight to deep areas of the building. The ADS has proven to perform well in a tropical area [5;6]. This system forms three principal parts that include the collector on the external side of the façade, the rectangular mirror, and distributor at the end of the duct [7]. Recently, the use and interest in daylight simulation tools are increased [8;9]. Simulation tools are the best opportunities for improving a building’s energy performance before design, and these are feasible for predicting and improve the building daylight design [10]. IES (VE) is a software tool dedicated to analysis and daylighting design. It is proposed to simulate daylight transport in building and contribute professionals to predicting and providing daylight levels and also visualization of a space prior to understanding of the building design [11]. The critical question is whether IES (VE) software produces trustable simulations that users can be confident. To answer this question, the software capability of simulating the light transport, should be assessed in a real model way [12]. The IES (VE) energy analysis software tool tends high accuracy and interoperability with Building Information Modeling (BIM) tools. It is a software for integrated building performance analysis, providing tools for Thermal analysis, Lighting, Cost planning, Lifecycle, Airflow, in one integrated system. IES (VE) contains thermal, solar, lighting, energy costs, and heating/cooling load calculations [13]. A research comparing 20 different building simulation programs concluded that IES (VE) is one of the most complete simulation packages, with its wide range of interlinked modules, and its unrivaled ability to analyze the heating, lighting and ventilation in buildings. The study also reports that IES (VE) has been tested and verified by 104
-
Upload
teknologimalaysia -
Category
Documents
-
view
0 -
download
0
Transcript of Empirical Validation of Daylight Simulation Tool for a Test Office with Anidolic Daylighting System
J. Basic. Appl. Sci. Res., 3(9)104-112, 2013
© 2013, TextRoad Publication
ISSN 2090-4304 Journal of Basic and Applied
Scientific Research www.textroad.com
*Corresponding Author: Mohsen Roshan, Department of Architecture, Faculty of Built Environment, Universiti Teknologi Malaysia, UTM Skudai, 81310 Johor, Malaysia. E-mail: [email protected] Mobile: 0060-137840090
Empirical Validation of Daylight Simulation Tool for a Test Office with Anidolic Daylighting System
Mohsen Roshan*, Mohd Zin Kandar, Mohammad Pir Mohammadi, Yakubu Aminu Dodo
Department of Architecture, Faculty of Built Environment, Universiti Teknologi Malaysia, Malaysia
ABSTRACT
The use of simulation tools to evaluate the daylighting performances of building design attracts enormous interest for architects, engineers and researchers. Integrated Environmental Solution <Virtual Environment> (IES<VE>) is a software tool to daylighting design and analysis. It intends to simulate daylight in buildings and to predict illuminance. The aim of this research is to validate the IES software simulated results and results measured of scale physical model with installed Anidolic Daylighting System (ADS) in a building under real condition in a tropical area. Scaled model was constructed to be tested under real sky measurement. In additional, the same model was designed in the IES<VE> for measuring illuminance. Using this software to study in the ADS, it can be found that absolute work plane illuminance in the intermediate and overcast sky recorded mean difference from the measured results, with 4.6% and 3.8% respectively also DF results illustrated promising results with 4.5% in the overcast sky. However in sunny sky is illustrated high mean difference with relative error 57%, while the trend of these results is approximately similar but the luminance ratio results shown acceptable mean measurement in sunny sky with 2.8%. The simulation results prove that inside illuminance can be modeled with comparable accuracy for ADS under real sky conditions in the intermediate and overcast sky. For future study, validation of other parameters can be carried out such as the size of the ADS, window sizes, environment setting. KEYWORDS: Emprical Validation. Daylight Simulation. Office building. Anidolic Daylighting System IES<VE>
Software
1. INTRODUCTION
Reducing the energy especially artificial lighting load is a critical step towards sustainable and energy-efficient buildings. In office buildings are consuming more than 40% of the over electricity with artificial lighting and reduction of that is particularly notable in these places [1;2;3]. Preparing available daylight in building not only desirable for energy efficiency reasons, but also improves a healthy and comfortable environment for the occupants [4]. Windows on vertical façades provide the aperture for daylight, but that can only penetrate a limited distance from the windows. For designing higher and longer aperture to provide more daylight at the back of the room lead to an unavailable area in near of the window and increase of cooling load and solar glare.
Methods are detected to solve above problems include to employing some form of daylight systems to transfer daylight to deep areas of the building. The ADS has proven to perform well in a tropical area [5;6]. This system forms three principal parts that include the collector on the external side of the façade, the rectangular mirror, and distributor at the end of the duct [7].
Recently, the use and interest in daylight simulation tools are increased [8;9]. Simulation tools are the best opportunities for improving a building’s energy performance before design, and these are feasible for predicting and improve the building daylight design [10].
IES (VE) is a software tool dedicated to analysis and daylighting design. It is proposed to simulate daylight transport in building and contribute professionals to predicting and providing daylight levels and also visualization of a space prior to understanding of the building design [11]. The critical question is whether IES (VE) software produces trustable simulations that users can be confident. To answer this question, the software capability of simulating the light transport, should be assessed in a real model way [12].
The IES (VE) energy analysis software tool tends high accuracy and interoperability with Building Information Modeling (BIM) tools. It is a software for integrated building performance analysis, providing tools for Thermal analysis, Lighting, Cost planning, Lifecycle, Airflow, in one integrated system. IES (VE) contains thermal, solar, lighting, energy costs, and heating/cooling load calculations [13].
A research comparing 20 different building simulation programs concluded that IES (VE) is one of the most complete simulation packages, with its wide range of interlinked modules, and its unrivaled ability to analyze the heating, lighting and ventilation in buildings. The study also reports that IES (VE) has been tested and verified by
104
Roshan et al.,2013
both CIBSE and ASHRAE [14]. It has been shown that the IES (VE) model is able to estimates and predictions to a reasonable level of accuracy in order to examining design changes. It is difficult to expect any model to provide perfect predictions, but through the comparison of model predictions and real measurements, a reliable level of the IES (VE) model estimates has been obtained [14].
The IES (VE) uses international commission on illumination (CIE) sky model for simulation in overcast skies and also intermediate sky and sunny sky. Sky model influences the distribution and amount of entrance illuminance. Thus, the accuracy of using CIE sky to simulate buildings in a tropical area is considerable [15;16].
In this paper, the accuracy of IES is validated. The test methodology is based on the comparison of simulation results to analytical reference model under real tropical area. Moreover, the daylight performance of the simulation tool carries out for various variables.
2. METHODOLOGY
The scale physical model was structured to be tested under real sky condition. The same model was designed in the IES software to performing daylighting simulation experiments. All items were measured under intermediate and overcast tropical sky conditions in Malaysia While orientation of them were in south orientation [17].
2.1 Experiment condition and procedure constructed
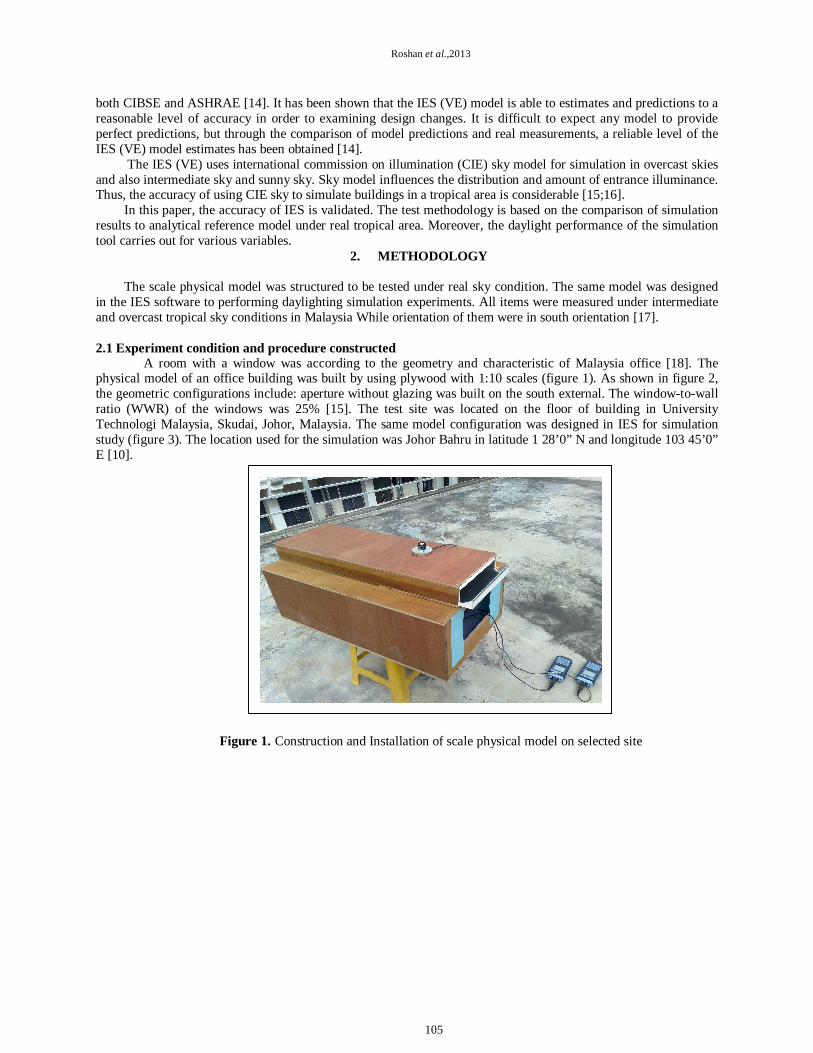
A room with a window was according to the geometry and characteristic of Malaysia office [18]. The physical model of an office building was built by using plywood with 1:10 scales (figure 1). As shown in figure 2, the geometric configurations include: aperture without glazing was built on the south external. The window-to-wall ratio (WWR) of the windows was 25% [15]. The test site was located on the floor of building in University Technologi Malaysia, Skudai, Johor, Malaysia. The same model configuration was designed in IES for simulation study (figure 3). The location used for the simulation was Johor Bahru in latitude 1 28’0” N and longitude 103 45’0” E [10].
Figure 1. Construction and Installation of scale physical model on selected site
105

J. Basic. Appl. Sci. Res., 3(9)104-112, 2013
Figure 2. Geometrical configuration of model and the ADS device
Figure 3. Model for computer simulation of IES software 2.2 Criteria of analysis
To validate the performance of the IES software were employed differences experimental: a- External illuminance (Ee): it was measured and simulated for comparison in order to a clear view of the
tropical sky and CIE sky characteristics.
106

Roshan et al.,2013
b- Absolute Work Plan Illuminance (WIP): they were recorded and simulated at E1, E2, E3 and E4 for comparison as shown in figure 2. According to MS 1525:2007 [19] the recommended minimum absolute WPI for general office is 300 Lux.
c- DF: It is the ratio of interior illuminance on a horizontal surface (Ei) to the exterior illuminance on a horizontal surface (Ee). DF is employed only under an overcast sky. DF=(Ei/Ee)*100
DF performance was accessed for quantitative analysis. Moreover, WPI uniformity and luminance ratio performances were evaluated for qualitative analysis. By using the external illuminance maximum 20000 Lux in tropical overcast, the optimum DF rang for tropical sky used in this model was from 1.5 to 2.5%. This benchmark is employed the MS 1525:2007 and GBI recommendation [19;20].
d- Test case: All tests summarized were shown in table 1. All tests were performed only on south orientation and were recorded every hour to compare the measured and simulation results.
Table 1 : Summary of test cases for field measurement and IES software
Test case Date Time Sky condition Orientation Absolute WPI (Sunny sky) 4 Mar 2013 10:00 - 10:10 Sunny South
Absolute WPI (Intermediate sky) 4 Mar 2013 15:00 – 15:10 Intermediate South Absolute WPI (overcast) 4 Mar 2013 16:00- 16:10 Overcast South
DF 4 Mar 2013 16:00- 16:10 Overcast South Luminance ratio 4 Mar 2013 10:00 - 10:10 Sunny South Luminance ratio 4 Mar 2013 15:00 – 15:10 Intermediate South
2.3 The measurement
The measurements were performed on March 4 under Johor sky conditions for the period of the usual working hours from 09:00 until 17:00 with a time step of two minutes. The illuminance on the horizontal plane of the ambient space is recorded and also indoor illuminance of the model and in particular across the center of the model test on an axis perpendicular to the wall of in a plane representing the working surface with a height of 0.80m [21]. Four sensors were installed in the test case model at point E1, E2, E3 and E4, under the distributors of the light duct were located in 3.70m, 5.20m, 6.70m and 8.20m respectively. Illuminations were recorded in the interior of the test case model at points E1, E2, E3 and E4.Window produces optimum daylight in the building until 3.5 m from window wall [22].
3. RESULT 3.1 Illuminance experiment
The illuminances were achieved both in the indoor of the scale models and the ambient environment. The variation of ambient illuminance during a typical day is shown figure 4. Data in different times were obtained an average of south orientation. It ranges from approximately 10Klux to 105Klux and obtains its maximum values during 11:00 until 14:00.
Figure 4. The average of illuminance variation a horizontal plane on the ambient environment during a typical day of the measurement period
107
J. Basic. Appl. Sci. Res., 3(9)104-112, 2013
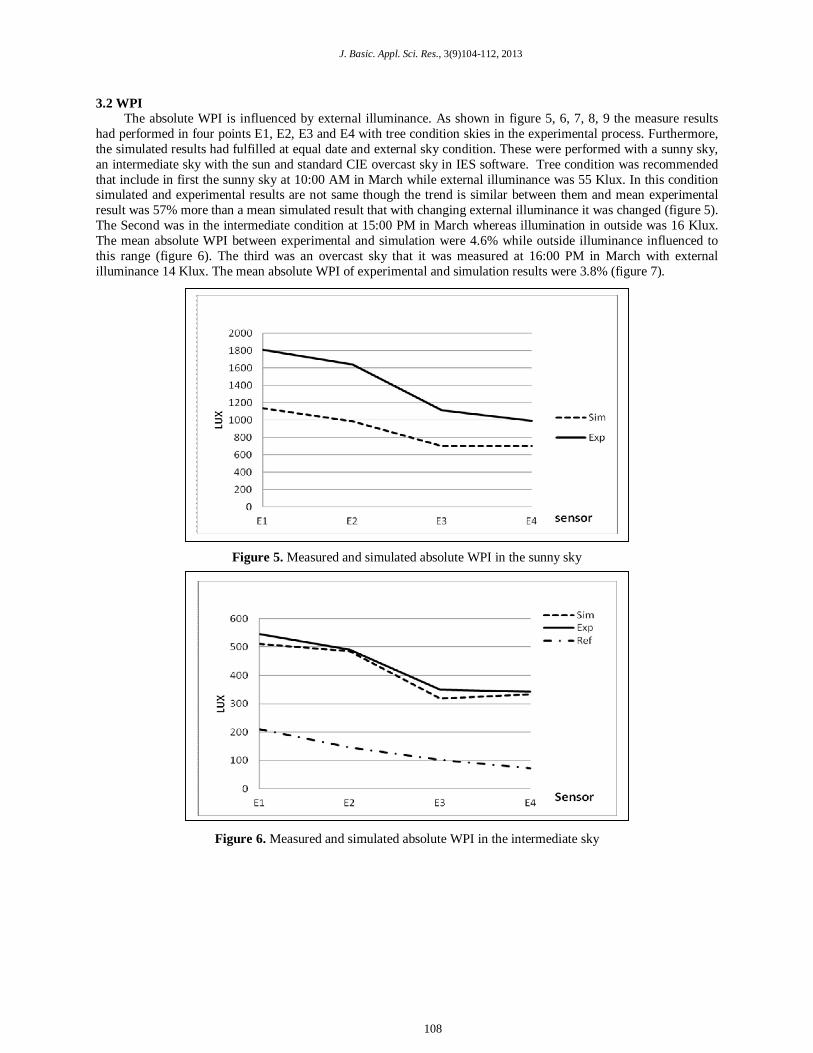
3.2 WPI The absolute WPI is influenced by external illuminance. As shown in figure 5, 6, 7, 8, 9 the measure results
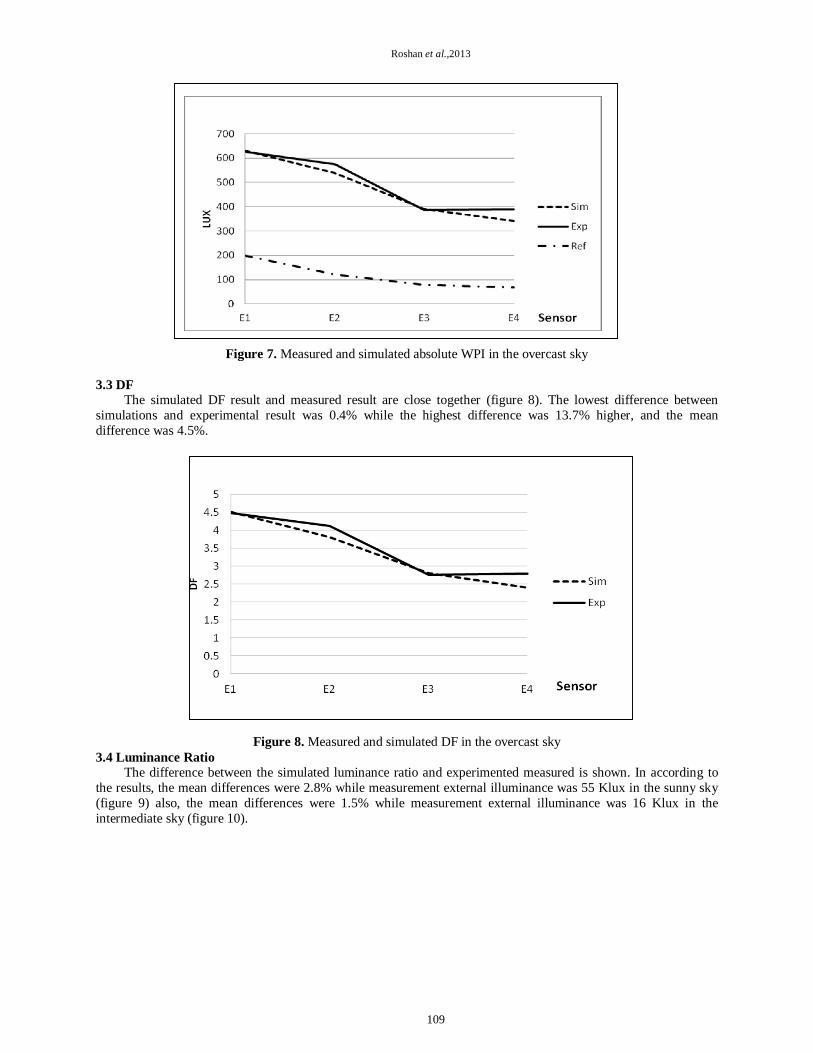
had performed in four points E1, E2, E3 and E4 with tree condition skies in the experimental process. Furthermore, the simulated results had fulfilled at equal date and external sky condition. These were performed with a sunny sky, an intermediate sky with the sun and standard CIE overcast sky in IES software. Tree condition was recommended that include in first the sunny sky at 10:00 AM in March while external illuminance was 55 Klux. In this condition simulated and experimental results are not same though the trend is similar between them and mean experimental result was 57% more than a mean simulated result that with changing external illuminance it was changed (figure 5). The Second was in the intermediate condition at 15:00 PM in March whereas illumination in outside was 16 Klux. The mean absolute WPI between experimental and simulation were 4.6% while outside illuminance influenced to this range (figure 6). The third was an overcast sky that it was measured at 16:00 PM in March with external illuminance 14 Klux. The mean absolute WPI of experimental and simulation results were 3.8% (figure 7).
Figure 5. Measured and simulated absolute WPI in the sunny sky
Figure 6. Measured and simulated absolute WPI in the intermediate sky
108
Roshan et al.,2013
Figure 7. Measured and simulated absolute WPI in the overcast sky 3.3 DF
The simulated DF result and measured result are close together (figure 8). The lowest difference between simulations and experimental result was 0.4% while the highest difference was 13.7% higher, and the mean difference was 4.5%.
Figure 8. Measured and simulated DF in the overcast sky 3.4 Luminance Ratio
The difference between the simulated luminance ratio and experimented measured is shown. In according to the results, the mean differences were 2.8% while measurement external illuminance was 55 Klux in the sunny sky (figure 9) also, the mean differences were 1.5% while measurement external illuminance was 16 Klux in the intermediate sky (figure 10).
109

J. Basic. Appl. Sci. Res., 3(9)104-112, 2013
Figure 9. Measured and simulated Luminance Ratio in the sunny sky
Figure 10. Measured and simulated Luminance Ratio in the intermediate sky
3.5 DISCUSSION
The differences of simulated results and measured results for various variables were summarized (table 2). The high mean differences between simulated and measured results are in absolute WPI in sunny condition with 57%. However absolute WPI in intermediate sky was 4.6%, but external illuminance influenced in this range although external illuminance in this experiment was 16klux. Results showed that the IES was unsuitable to use this simulation tool to predict internal illuminance in sunny and intermediate sky, while luminance ratio results showed more reliable and acceptable results in these sky conditions. Moreover the lowest differences were in absolute WPI and DF for overcast sky with 3.8 and 4.5% respectively.
Table 2 : Summary of the differences of simulated results from measured results
Criteria Min (%) Max (%) Mean (%) External illuminance (Klux)
Absolute WPI (Sunny sky) 41 59 57 55 Absolute WPI (Intermediate sky) 1.2 8.5 4.6 16
Absolute WPI (overcast sky) 0.6 12 3.8 14 DF (Overcast sky) 0.4 13.7 4.5 14
Luminance ratio (Sunny sky) 0 11.4 2.8 55 Luminance ratio (Intermediate sky) 0 5.7 1.5 16
110
Roshan et al.,2013
According to previous research the hourly indices indicate that 85.6% of the time the sky is predominantly intermediate (2.3% intermediate overcast, 66.0% intermediate mean and 16.3% intermediate blue) and 14.0% overcast in Malaysia [15]. Since, clear sky is not applicable for tropical sky, it was not considered in this study as. The overcast sky was the worst condition for daylight availability hence it was base to measure and validate with DF and absolute WPI variables. Intermediate sky was chosen for work plane illuminance (WPI) and luminance ratio.
4. CONCLUSION
In according to the results, the IES software in sunny condition was unable to predict internal illuminance.
However, trends were similar and with increasing external illuminance, distance of simulation and experimental results raised. In additional, this software was promising to predict in the intermediate sky when external illuinance was approximately 14 Klux, whereas the average mean difference between the measured and simulated result was 4.6%. Therefore, by increasing external luminance in this sky condition the difference between them raised. Nevertheless, trend of both results was similar. Moreover, results in the overcast sky shown that the IES software was able to predict internal illuminance in building installed with the ADS due to the average mean difference between both results were 4.5. In additional, DF results illustrate better results via absolute WPI that it was 4.5; therefore, DF is a better choice to compare the performance daylight in the internal space. However absolute WPI is promising measure in tropical area under overcast conditions.
Acknowledgment
The work is financed by International Doctoral Fellowship (IDF) provided by Universiti Teknologi Malaysia and the Ministry of Higher Education of Malaysia.
REFERENCES
1. Jenkins, D., & M. Newborough, (2007). An approach for estimating the carbon emissions associated with office lighting with a daylight contribution. Applied Energy, 84(6), 608-622.
2. Li, D. H., T. N. Lam, & S. Wong, (2006). Lighting and energy performance for an office using high frequency dimming controls. Energy Conversion and Management, 47(9), 1133-1145.
3. To, D. W. T., L. K. Sing, T. Chung, & C. Leung, (2002). Potential energy saving for a side-lit room using daylight-linked fluorescent lamp installations. Lighting Research and Technology, 34(2), 121-132.
4. Veitch, J. A. (2006). Lighting for high-quality workplaces. Creating the Productive Workplace, 2nd edn, London, Taylor & Francis, 206-222.
5. Wittkopf, S. (2007). Daylight performance of anidolic ceiling under different sky conditions. Solar Energy, 81(2), 151-161.
6. Wittkopf, S. K., E. Yuniarti, & L. K. Soon, (2006). Prediction of energy savings with anidolic integrated ceiling across different daylight climates. Energy and buildings, 38(9), 1120-1129.
7. Welford, W. T., & R. Winston, (1989). High collection nonimaging optics. New York: Academic Press, 1989, 1.
8. Ander, G. D. (2003). Daylighting performance and design: Wiley. 9. Loutzenhiser, P., H. Manz, C. Felsmann, P. Strachan, T. Frank, & G. Maxwell, (2007). Empirical
validation of models to compute solar irradiance on inclined surfaces for building energy simulation. Solar Energy, 81(2), 254-267.
10. Lim, Y.-W., M. H. Ahmad, & D. R. Ossen, (2010). Empirical Validation of Daylight Simulation Tool with Physical Model Measurement. American Journal of Applied Sciences, 7(10), 1426-1431.
11. http://www.iesve.com 12. Donn, M., D. Harrison, F. Maamari, & D. Xu, (2007). USING SIMULATION SOFTWARE
CALIBRATION TESTS AS A CONSUMER GUIDE–A FEASIBILITY STUDY USING LIGHTING SIMULATION SOFTWARE. Paper presented at the Proceedings of the 10th IBPSA Building Simulation Conference, Tsinghua University, Beijing.
111

J. Basic. Appl. Sci. Res., 3(9)104-112, 2013
13. Chinnayeluka, S. R., 2011. Performance Assessment Of Innovative Framing Systems Through Building Information Modeling Based Energy Simulation. Master thesis. Osmania University.
14. Booth, A., 2009. Modelling and Simulation of Building Physics. Fourth-Year Undergraduate Project in Group D, Robinson College.
15. Zain-Ahmed, A., K. Sopian, Z. Zainol Abidin, & M.Othman, (2002). The availability of daylight from tropical skies—a case study of Malaysia. Renewable Energy, 25(1), 21-30.
16. Linhart, F., S. K. Wittkopf, & J.-L. Scartezzini, (2010). Performance of Anidolic Daylighting Systems in tropical climates–Parametric studies for identification of main influencing factors. Solar Energy, 84(7), 1085-1094.
17. Roshan, M., M. Z. B. Kandar, M. Nikpur, M. P. Mohammadi, & M. Ghasemi, (2013). Investigating the performance of Anidolic Daylighting System with respect to building orientation in tropical area.
18. Ossen, D. R., M. Hamdan Ahmad, & N. H. Madros, (2005). Optimum overhang geometry for building energy saving in tropical climates. Journal of Asian Architecture and Building Engineering, 4(2), 563-570.
19. Malaysian Standard MS 1525: 2007: Code of Practice on Energy efficiency and Use of Renewable Energy for Non-Residential Buildings. 1st Revision, Department of Standards Malaysia, Malaysia, 2007
20. GBI: Green Building Index: Design Reference Guide. 1st ed. Kuala Lumpur, Malaysia, Green Building Index Sdn. Bhd, 2009.
21. Garcia-Hansen, V. R. (2006). Innovative daylighting systems for deep-plan commercial buildings. 22. Shahriar, A. N. M., & M. A. Mohit, (2007). Estimating depth of daylight zone and PSALI for side lit office
spaces using the CIE Standard General Sky. Building and environment, 42(8), 2850-2859.
112