Emperical research: The achievability of CEO non equity incentive plan targets, REM and its...
37
Research on the Relationship between the Achievability of Non-Equity Incentive Plan Targets and Real Earnings Management and their Determinants Empirical Research in Accounting – Group 19 Master Accounting & Control VU University Milio de Charro 2012340 Liza Dillo 1820915 Hugo Goldberg 2151448 Bo van Houten 1873660 Pim Ploos van Amstel 2142619 Date: 07-10-2013 Abstract A topic that got only little attention in the scientific research on accounting is the achievability of performance targets. The main purpose of this paper is to examine the relationship between the achievability of CEO non-equity incentive plan targets and real
Transcript of Emperical research: The achievability of CEO non equity incentive plan targets, REM and its...

Research on the Relationship between the
Achievability of Non-Equity Incentive Plan
Targets and Real Earnings Management and their
Determinants
Empirical Research in Accounting – Group 19
Master Accounting & Control
VU University
Milio de Charro 2012340Liza Dillo 1820915Hugo Goldberg 2151448
Bo van Houten 1873660Pim Ploos van Amstel
2142619
Date: 07-10-2013
Abstract A topic that got only little attention in the scientific research on accounting is theachievability of performance targets. The main purpose of this paper is to examine therelationship between the achievability of CEO non-equity incentive plan targets and real

earnings management and three possible determinants, market-to-book ratio, return onassets and the achievability of prior years. No significant evidence was found on therelationship between the achievability and the predictors. The relationship between realearnings management and the predictors was found to be significant, but not all therelations were in the predicted direction. Also, no evidence was found on theinterrelationship between the dependent variables, achievability on CEO non-equity incentiveplan targets and real earnings management.
1

TABLE OF CONTENTS
1. Introduction
p.3
2. Related Literature
p.4
2.1 Non-Equity incentive plan
p.4
2.1.1 Achievability of incentive plan targets p.4
2.2 Real earnings management
p.4
2.3 The relationship between achievability of performance targets
and real earnings p.5
management
2.4 Determinants p.5
2.4.1 Market-to-Book ratio p.5
2.4.2 Achievability in prior years p.6
2.4.3 Return on Assets
p.6
3. Hypothesis Development
p.7
4. Research Design
p.10
4.1 Sample selection and data resources
p.10
4.2 Measurements p.10
4.2.1. Causal Model p.10
4.2.2. Variables
p.12
5. Results p.14
2
5.1 Descriptive statistic and data exploring
p.14
5.2 Regression 1: Achievability of non-equity incentive plan targets
p.14
5.2.1 Assumptions underlying linear regression analysis p.16
5.3 Regression 2: Real earnings management
p.17
5.3.1 Assumptions underlying linear regression analysis
p.19
5.4 Interrelationship of dependent variables
p.20
6. Conclusion and Discussion
p.22
References p.25
Appendix p.26
1. INTRODUCTION
A lot of scientific research has been conducted on real earnings
management. Earnings management occurs when managers use judgment in
financial reporting and in structuring transactions to alter
financial reports to either mislead stakeholders about the
underlying economic performance or to influence contractual outcomes
that depend on reported accounting numbers (Healy & Wahlen, 1999, p.
368).
A topic that gets only little attention in the scientific
research is non-equity incentive plan compensation. Non-equity
3

incentive compensation represents a bonus paid in cash. The term
“non-equity incentive plan compensation” was developed by the
Securities and Exchange Commission (SEC) in 2006 to provide more
disclosure of compensations in the financial statement. This new
category was designed to capture executive incentives awarded in
cash which are based on specific pre-established performance-based
targets, because cash incentives like annual bonuses are not
specifically linked to pre-established performance-based incentives
(Palmon, Santoro & Strauss, 2009).
The purpose of this research project is to examine to what extent
the achievability of CEO non-equity incentive plan targets and real
earnings management (in terms of reducing the cost of goods sold by
overproducing inventory) are interrelated. Finally this research
project examine to what extent each of the dependent variables is
related to the achievability of prior year’s CEO non-equity
incentive plan targets, market-to-book ratio and return on assets.
4

2. RELATED LITERATURE
2.1 Non-equity incentive plan
Non-equity incentive compensation represents a bonus paid in cash.
This is different from equity compensations where an equity interest
in the company is given, which gives the receiver a direct economic
interest in the future development of the stock price of the
company. This interest leads automatically to long-term goal
congruence between managers and shareholders.
The term “non-equity incentive plan compensation” was developed
by the Securities and Exchange Commission (SEC) in 2006 to provide
more disclosure of compensations in the financial statement. This
new category was designed to capture executive incentives awarded in
cash which are based upon specific pre-established performance-based
goal, because cash incentives like annual bonuses are not
specifically linked to pre-established performance-based incentives
(Palmon, Santoro & Strauss, 2009).
2.1.1 Achievability of incentive plan targets
A phenomenon that received only little attention from accounting
researchers is the achievability of performance targets. Most
experimental studies show that less achievable targets lead to
higher performance, except when the subjects experienced the goals
as unachievable.
There are two standpoints from which the achievability of
performance targets can be measured. One is the ex ante point of view
which implicates the expected achievability of the target and the
other is the ex post standpoint which reflects the actual achieved
performance (Merchant & Manzoni, 1989).
5

2.2 Real Earnings Management
Earnings management occurs when managers use judgment in financial
reporting and in structuring transactions to alter financial report
to either mislead some stakeholders about the underlying economic
performance or to influence contractual outcomes that depend on
reported accounting numbers (Healy & Wahlen, 1999). In theory of
earnings management, there are two ways to manage the earnings of a
company. The most researched way of earnings management is the
accrual based earnings management. Accrual-based earnings management
is achieved by changing the accounting methods or estimates used
when presenting a given transaction in the financial statement. For
example, this can be changing the depreciation method for fixed
assets (Zang, 2012) or by taking expenses that are not reasonably
expected to generate future cash flows and label them as investment
expenditures (Bergstresser & Philippon, 2006).
The second type, real earnings management or real activities
manipulation, is a purposeful action to alter reported earnings in a
particular direction which is achieved by changing the timing or
structuring of an operation investment, or financing transaction
which has suboptimal business consequences (Zang, 2012). In order to
deliver earnings, R&D, advertising and maintenance expenditures and
cost of goods sold are decreased. Between both types of earnings
management, there is a timing difference: real activity
manipulations must occur during the fiscal year, where accrual based
earnings management is applied after the fiscal year-end. This means
that the latter can be adjusted to the outcomes of the former.
2.3 The relationship between real earnings management and the
achievability of incentive plan targets.
Prior research shows that executives often engage in earnings
management, because they receive an incentive for good performance.
6

CEO bonus plans that have a performance threshold can motivate
executives to smooth their performance. Holthausen et al. (1995)
find that executives manage earnings upward when they are below the
threshold, but do not manage earnings downward when their reported
performance exceeds the maximum.
In addition to the above, management receives less incentives to
manage earnings when the thresholds itself are low, or in other
words, the achievability of the performance targets is high. As
reported in Merchant & Mazoni (1989) an incentive for top managers
to state highly achievable targets is to reduce the engaging in
earnings management practices. Short-term earnings management is a
means available to achieve performance targets and low achievability
or high thresholds would give too much pressure to manage earning on
short-term.
2.4 Determinants
For this research, we have chosen three determinants to examine the
relationship between the achievability of CEO non-equity incentive
plan targets and real earnings management.
2.4.1 Market–to-book Ratio
The market-to-book ratio is normally used as a proxy to observe
firms’ major investment opportunities. Investment opportunities play
an important role in the corporate finance of a firm. The market-to-
book ratio has the highest information constant with respect to
investment opportunities. Adam & Goyal (2008) make a distinction
between the market-to-book asset (MBA) ratio and the market-to-book
equity (MBE) ratio. The MBA ratio represents the market value of the
assets divided by the book value of the assets, which is a proxy for
the assets in place and the investment opportunities. The MBE ratio
is the market value of the equity divided by the book value of the
7

equity. The market value of the equity measures the present value of
the cash flows to equity holders from both assets in place and
future investment opportunities. The book value represents the
accumulated value generated from existing assets only.
Zang (2012) uses the market-to-book ratio to control for
systematic variations in abnormal production costs, discretionary
expenditures and accruals related to a firms’ growth rate in testing
the hypothesis of whether managers decide between the use of real
activities manipulation or accrual-based earnings management.
2.4.2 Achievability in prior years
When earnings targets do not fully adjust for past performance,
Merchant (2010) and co-researchers expected that firms that failed
to meet their 2008 earnings target would have a more difficult 2009
target than firms that met or exceeded their 2008 target. Merchant
(2010) finds evidence that the achievability of earnings targets is
positively associated with prior year’s performance relative to an
earnings target. When firms failed to meet their targets in prior
years, it is expected that it will even be more difficult for those
firms to meet their targets in the next year.
2.4.3 Return on Assets
The return on assets (ROA) shows how profitable a company’s assets
are in generating revenues. This is also called the “productivity
ratio” (Allred, 1997). The ROA is computed as the net income divided
by the average total assets. The ROA provides information about the
management performance in using their business assets to maximize
revenues by satisfying customer needs. Other than ROE (return on
equity), the ROA measurement includes all of the business assets,
arising from liabilities and equity. It combines a measure of
efficiency and external effectiveness. A higher asset turnover due
8

to the artificial decrease of the denominator (through downsizing or
divesting) which may allow management to boost ROA in the short term
is harmful to long term competitiveness since it is caused by
postponing any investments (Courtis, 2003).
9
3. HYPOTHESIS DEVELOPMENT
A purpose of this research is to examine the achievability of CEO
non-equity incentive plan targets and potential determinants of the
degree of achievability. Consistent with several empirical studies
in the accounting literature as shown in the literature review, we
predict that performance targets are positively influenced by
performance targets set in prior years. Hence, we formulate the
following hypothesis:
H1: The achievability of CEO non-equity incentive plan targets in prior years is positively
related with the achievability of current CEO non-equity incentive plan targets in prior
years.
The market reacts positively (resp. negatively) to the
announcement of a challenging (resp. less challenging) target
established in the annual incentive plan (Kim & Yang, 2009). More
specifically, if the market understands that firms tend to set easy
performance targets for their top executives, a challenging
performance target should signal the market the firms’ high
profitability in the future. On the other hand, if a performance
target is not challenging, mediocre or even poor performance will be
rewarded and the incentive mechanism will break down (Anderson,
Dekker & Sedatole, 2008). If the market-to-book ratio is high it
means the market value in excess of the book value. Therefore the
market defines the company at higher value and the market will react
on announcement of challenging targets and therefore has a positive
relation to the achievability of CEO non-equity incentive plans
targets. This reasoning leads to following subsidiary hypothesis:
H2: Other things being equal, market-to-book ratio is positively related with the
achievability in current CEO non-equity incentive plan targets
10

.
The combination of high returns and high operating performance,
according to Cooper et al. (2009), combines the allure of the firms
and can be associated with star effects that high pay may produce
for the firm’s CEO and an inability to distinguish luck from skills
resulting in a negative relation between CEO pay and future returns.
This indicates future returns will decrease by high payments for
CEO’s. Firms with a high ROA set more challenging performance
targets and the achievability of incentive plan is more arduous to
realize. Thus higher return on assets results in less achievability
of CEO non-equity incentive plan targets and the variables therefore
are negatively related to each other. Hence, the following
hypothesis predicts:
H3: Other things being equal, the ROA of a firm is negatively related with the achievability
of current CEO non-equity incentive plan targets.
In this research we focus on one type of real earnings
management, namely through overproducing inventory. To manage
earnings upwards, managers can produce more goods than necessary.
With higher production levels, fixed overhead costs are spread over
a larger number of units, which leads to a lower fixed cost per
unit. This implies that the reported costs of goods sold are lower
and the reported profit margins are higher (Roychowdhury, 2006).
Holthausen et al. (1995) investigated to which extent executives
manipulate earnings to maximize the present value of bonus plan
payments. They did not find evidence for the fact that managers
manipulate earnings downwards when earnings are below the minimum
necessary to receive any bonus. We expect that when the
achievability in prior years is high, the overall level of real
earnings management will be low. There will be less incentive for
managers to apply real earnings management when targets are being
11

met and the performance of a company is good, which leads to the
following hypothesis:
H4: Other things being equal, the achievability of CEO non-equity incentive plan targets in
prior years is negatively related to the level of real earnings management.
Skinner & Sloan (2002) show that the incentive to report a
growth in earnings is increasing with firms’ growth opportunities.
It is likely that growth firms experience pressure to meet other
earnings thresholds. The most used proxy for growth opportunities is
the market-to-book ratio. That is why we state that firms with a
high market-to-book ratio are likely to exhibit high abnormal
productions costs (Roychowdhury, 2006). This expectation can be
expressed in the following hypothesis:
H5: Other things being equal, the market-to-book level of a firm is positively related to the
level of real earnings management.
Return on assets is often used as a measurement of management
performance. A higher ROA relates to a higher profitability of the
assets of a firm. As real earnings management is used to report
higher earnings, it is less likely that it is used when the ROA is
higher, than when there is a lower ROA. This leads to the following
hypothesis:
H6: Other things being equal, the return on assets of a firm is negatively related to the
level of real earnings management.
In contrast, managers of poorly performing firms may be
unwilling to manipulate earnings to achieve maximum payouts under
their bonus plans, because of potential technical violations of the
firm’s lending agreements. The actual award, relative to the award
target, is based on the degree to which financial goals and
12

individual performance objectives established early in the fiscal
year haven been achieved (Holhausen et al., 1995). As mentioned
before, management receives less incentives to manage earnings when
the thresholds itself are low, or in other words, the achievability
of the performance targets is high (Merchant & Mazoni, 1989). The
bonus actually earned depends on the degree to which the performance
target is achieved. As a consequence, if the achievability of CEO
non-equity incentive plan targets are rather low, the degree of
financial goals are harder to achieve and the management receives
more incentives to manipulate earnings. Hence, we predict the
following:
H7: There is a negatively interrelated relationship between the achievability of CEO non-
equity incentive plan targets and real earnings management.
13
4. RESEARCH DESIGN
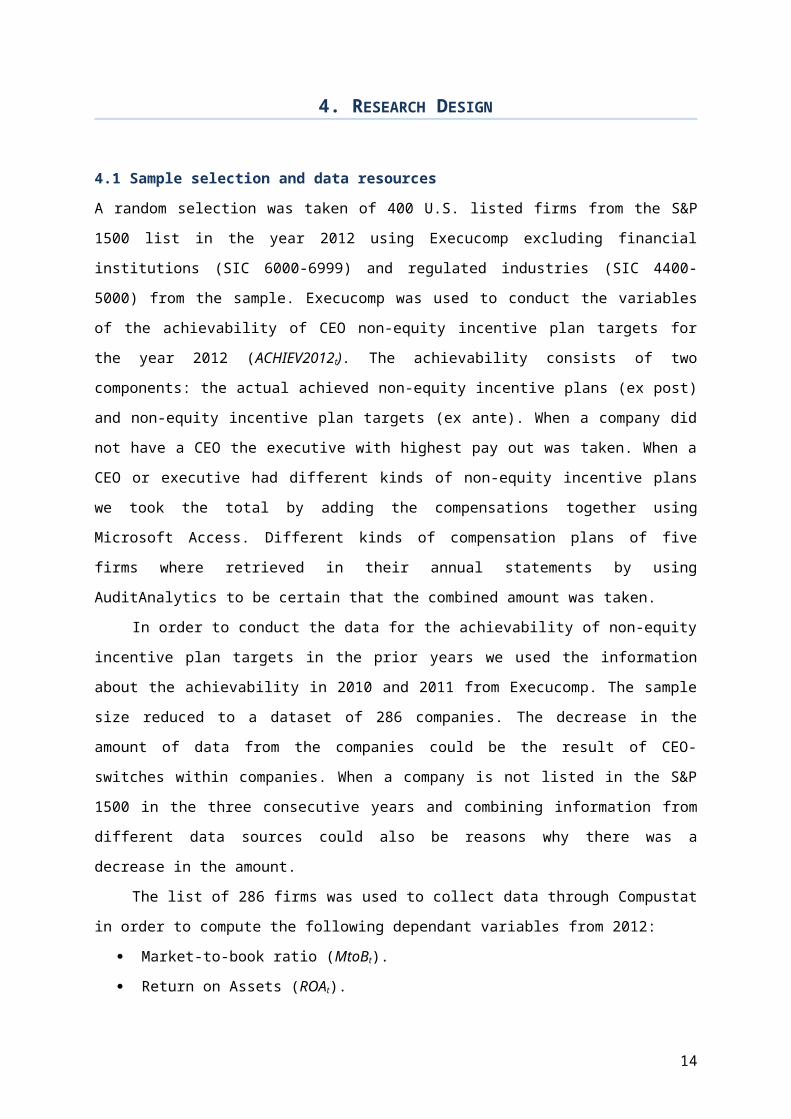
4.1 Sample selection and data resources
A random selection was taken of 400 U.S. listed firms from the S&P
1500 list in the year 2012 using Execucomp excluding financial
institutions (SIC 6000-6999) and regulated industries (SIC 4400-
5000) from the sample. Execucomp was used to conduct the variables
of the achievability of CEO non-equity incentive plan targets for
the year 2012 (ACHIEV2012t). The achievability consists of two
components: the actual achieved non-equity incentive plans (ex post)
and non-equity incentive plan targets (ex ante). When a company did
not have a CEO the executive with highest pay out was taken. When a
CEO or executive had different kinds of non-equity incentive plans
we took the total by adding the compensations together using
Microsoft Access. Different kinds of compensation plans of five
firms where retrieved in their annual statements by using
AuditAnalytics to be certain that the combined amount was taken.
In order to conduct the data for the achievability of non-equity
incentive plan targets in the prior years we used the information
about the achievability in 2010 and 2011 from Execucomp. The sample
size reduced to a dataset of 286 companies. The decrease in the
amount of data from the companies could be the result of CEO-
switches within companies. When a company is not listed in the S&P
1500 in the three consecutive years and combining information from
different data sources could also be reasons why there was a
decrease in the amount.
The list of 286 firms was used to collect data through Compustat
in order to compute the following dependant variables from 2012:
Market-to-book ratio (MtoBt).
Return on Assets (ROAt).
14

X1 Market to book ratio
X2 Achievability in prior years
X3 Return on Assets
Y1: Achievability of CEO non-equity
plan targets
Y2 Real earnings management
Real Earnings Management as the abnormal production level
(REMt).
4.2 Measurements
4.2.1. Causal Model
As described in the literature review and hypotheses development we
are interested in the relationship between two interdependent
variables and it’s determinants. The following model gives a visual
representation of our research (Figure 1):
15

(a)
(b)
Figure 1: Causal model
Relation (a) consists of two regression analyses. To test the first
regression (H1, H2 and H3) we estimate the following regression using
the achievability of non-equity incentive plan targets in 2012
(ACHIEV2012t):
ACHIEV2012t = + 1MtoBt + 2Prioryears + 3ROAt + εt
(Equation 1)
To test to what extent the dependent variable of real earnings
management is related to its determinants (H4, H5 en H6) we estimate
the following regression:
REMt = + 1MtoBt + 2Prioryears + 3ROAt + εt
(Equation 2)
Relation (b) is tested by a Pearson correlation test to measure if
there is an interrelationship between our dependent variables (H7)
4.2.2 Variables
The achievability ratio of non-equity incentive plan targets is
measured by the ratio of the actual “non-equity incentive plan
16

compensation” and the ex ante “estimated future payouts under non-
equity incentive plan – target” of CEO’s. The achievability in prior
years is measured as the mean of the ratio of ex post and ex ante
achievability for the year of 2011 and 2010.
Real earnings management is measured as the level of production
costs (PRODt) divided by total assets (At-1). The estimate of a normal
level of production costs is achieved by the following regression
(Roychowdhury, 2006; Zang, 2012):
PRODt /At-1 = 0 + 1(1 / At-1) + 2(St /At-1) + 3(∆St / At-1) + 4( S∆ t-1 / At-1) +
εt (Equation 3)
Here, PRODt is the sum of the cost of goods sold in year t and the
change in inventory from t-1 to t. At-1 is the total assets in year t-
1. St is the net sales in year t and S∆ t-1 is the change in net sales
from year t-1. The residual from Equation (3) gives an estimation of
the abnormal level of production costs: the higher the residual, the
larger the amount of inventory overproduction and the greater the
increase in reported earnings is through reducing the cost of goods
sold. Table 1 reports the estimates of the Equation 3 and
corresponding level of significant. Three of the mean coefficients
(2 t/m 4) are significant at a level of 5 percent, of which two are
significant at a 1 percent level.
Table
2
Table 1: Coefficient table
17
Coefficientsa
Model
UnstandardizedCoefficients
Standardized
Coefficients
t Sig.BStd.Error Beta
1 Intercept -,253 ,028 -9,047 ,000
1 / At-1 ,000 ,000 ,016 ,960 ,338St /At-1 ,855 ,021 ,910 39,808 ,000∆St / At-
1-,242 ,104 -,047 -2,319 ,021
S∆ t-1 / At-
1,344 ,076 ,108 4,557 ,000
a. Dependent Variable: PRODt /At-1

reports an Adjusted R Square of 92.1 percent of the production cost
model. This indicates that the model has a high substantial
explanatory power. The obtained residual is the indicator for real
earnings management from now on and indicated as REMt
Model Summaryb
Model R
RSquare
Adjusted RSquare
Std. Errorof theEstimate
1 ,960a ,922 ,921 ,2619231a. Predictors: (Intercept), 1/At-1, St /At-1, ∆St / At-1,
S∆ t-1 / At-1
b. Dependent Variable: PRODt /At-1
Table 2: Model summary
The market-to-book ratio is received by dividing the total market
value of the equity fiscal year 2012 by the difference of the total
assets and total liabilities of the companies. The market-to-book
ratio of the fiscal year is computed by the following equation:
MtoB = Market value Equity / (Total Assets – Total Liabilities)
(Equation 4)
The third independent variable is the return on assets. From
Compustat the net income and total assets were collect to calculate
the ROA by the following equation:
ROA = Net Income / Total Assets (Equation
5)
5. RESULTS
5.1 Descriptive statistics and data exploration
Before conducting linear regression analyses the following
descriptive statistics where found that include the mean, minimum,
maximum and standard deviation of the variables that have been
examined, shown in the Table 3.
18
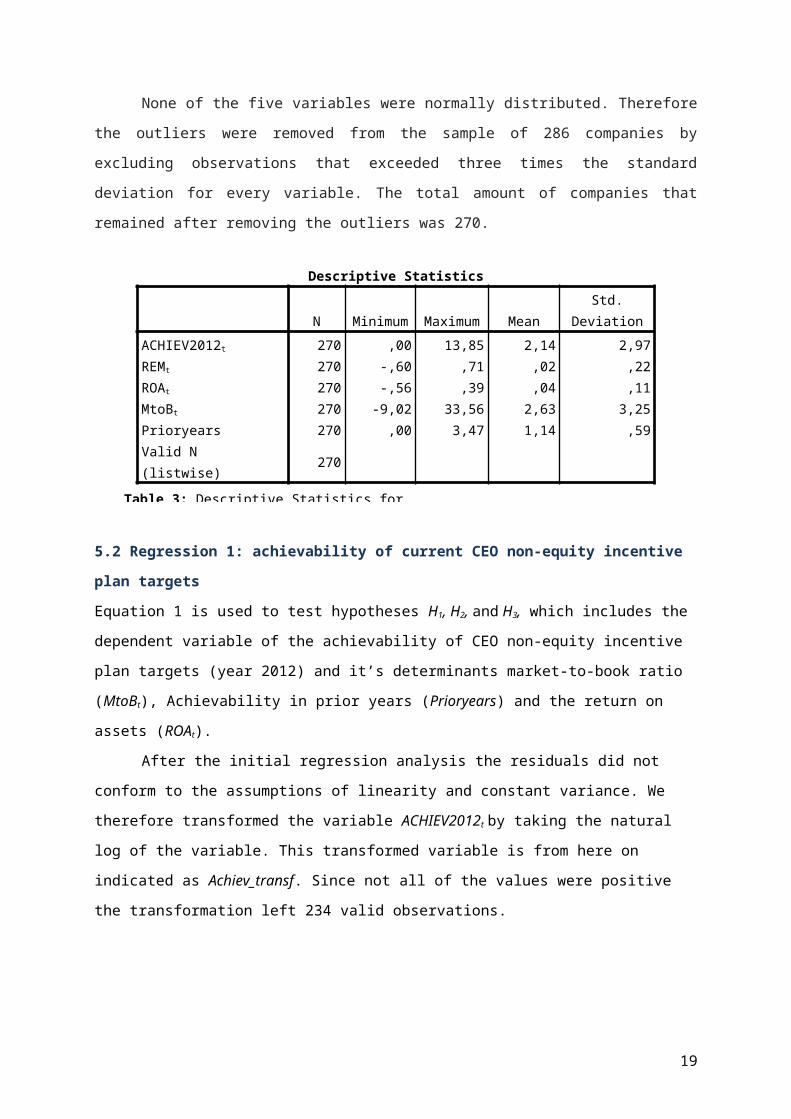
Table 3: Descriptive Statistics for
None of the five variables were normally distributed. Therefore
the outliers were removed from the sample of 286 companies by
excluding observations that exceeded three times the standard
deviation for every variable. The total amount of companies that
remained after removing the outliers was 270.
Descriptive Statistics
N Minimum Maximum MeanStd.
DeviationACHIEV2012t 270 ,00 13,85 2,14 2,97REMt 270 -,60 ,71 ,02 ,22ROAt 270 -,56 ,39 ,04 ,11MtoBt 270 -9,02 33,56 2,63 3,25Prioryears 270 ,00 3,47 1,14 ,59Valid N (listwise) 270
5.2 Regression 1: achievability of current CEO non-equity incentive
plan targets
Equation 1 is used to test hypotheses H1, H2, and H3, which includes the
dependent variable of the achievability of CEO non-equity incentive
plan targets (year 2012) and it’s determinants market-to-book ratio
(MtoBt), Achievability in prior years (Prioryears) and the return on
assets (ROAt).
After the initial regression analysis the residuals did not
conform to the assumptions of linearity and constant variance. We
therefore transformed the variable ACHIEV2012t by taking the natural
log of the variable. This transformed variable is from here on
indicated as Achiev_transf. Since not all of the values were positive
the transformation left 234 valid observations.
19

Table 4: ANOVA fot the As indicated by table 4 the 2012 achievement regression model is not
statistically significant (0.136), so the R square is meaningless
and further interpretation of the components of the model is
useless. After this we tested the relations separately by running
three separate regressions. The regression model of the dependent
variable Achiev_transf and the predictor MtoBt indicates that the
independent variable MtoBt is not statistically significant (0.571)
with a positive effect (0.135) on the 2012 Achievability (Appendix
I). Therefore we reject hypothesis 2. The regression model of the
dependent variable Achiev_transf and the predictor ROAt indicates that
the independent variable is not statistically significant (0.351)
with a positive effect (0.135) on the 2012 Achievability (Appendix
II). Therefore we reject hypothesis 3.
The regression analysis of the effect of “current CEO non-equity
incentive plan targets in prior years (Prioryears)” on “the achievability of CEO non-equity
incentive plan targets (Achiev_transf)” (H1) did give a significant value of 0.30
(see table 5 and 6).
ANOVAa
Model
Sum of
Squares df
Mean
Square F Sig.
20
ANOVAa
Model
Sum of
Squares df
Mean
Square F Sig.
1 Regression 9,516 3 3,172 1,868 ,136b
Residual 390,631 230 1,698
Total 400,147 233
a. Dependent Variable: Achiev_transfb. Predictors: (Constant), Prioryears, MtoBt , ROAt

1 Regressio
n8,030 1 8,030 4,751 ,030b
Residual 392,117 232 1,690
Total 400,147 233
a. Dependent Variable: Achiev_transfb. Predictors: (Constant), Prioryears
Model Summaryb
Model R R Square
Adjusted R
Square
Std. Error of the
Estimate
1 ,142a ,020 ,016 1,300
a. Predictors: (Constant), Prioryearsb. Dependent Variable: Achiev_transf
TTable 6: Model summary Achievability
The total amount explained in the model by the Adjusted R Square is
1.6 percent. Therefore we accept hypothesis 1. Coefficientsa
Model
Unstandardized
Coefficients
Standardize
d
Coefficient
s
t Sig.B Std. Error Beta
1 (Constan
t)-,203 ,196 -1,037 ,301
Prioryea
rs,323 ,148 ,142 2,180 ,030
Table 5: ANOVA regression Prioryears on
21

Table 7: Coefficients of the regression analysis Prioryears on
Figure 2: Scatterplot of the unstanderdized perdicted value and standardised residuals of Achievability
a. Dependent Variable: Achiev_transf
5.2.1 Assumptions underlying linear regression analysis:
The underlying assumptions of a linear regression to value the
outcomes of the model are linearity, independence, constant variance
and normality of the residuals. We tested these assumptions for the
last regression using a scatterplot, histogram, a Q-Q plot and the
Kolmogorov-Smirnov test (Figure 2, 3 and 4).
The Q-Q plot was used to test the assumptions of linearity,
independence and homoscedasticity. Because there are no
heteroscedasticity and non-linear relationships, the assumptions of
linearity and constant variance are met. In the scatter plot there
is no indication that some of the residuals are dependent of one
another since we do not detect any patterns. Although the patterns
are usually hard to recognize the assumption of independence is met.
At last, the normality of the residuals was tested (Figure 3 and Figure 4).
22

Figure 3: Histogram Achievability Figure 4: Q-Q plot Achievability
From the histogram and the Q-Q plot it is concluded that the
assumption of normality is met. The Kolmogorov-Smirnov test also
indicates that the normality assumption is met since the test is not
significant (0.084) (Table 8).
Tests of Normality
Kolmogorov-Smirnova Shapiro-Wilk
Statist
ic df Sig.
Statist
ic df Sig.
Res Prioryears ,055 234 ,084 ,988 234 ,057
a. Lilliefors Significance Correction
Table 8: Test of Normality Achievability
5.3 Regression 2: real earnings management
Equation 2 is used to test hypotheses H4, H5, and H6, which includes
the dependent variable of real earnings management (REMt) and it’s
predictor market-to-book ratio (MtoBt), Achievability in prior years
(Prioryears) and the return on assets (ROAt).
23

ANOVAa
Model
Sum of
Squares df
Mean
Square F Sig.
1 Regressio
n1,178 3 ,393 8,964 ,000b
Residual 11,653 266 ,044
Total 12,831 269
a. Dependent Variable: REMt
b. Predictors: (Constant), Prioryears, MtoBt, ROAt
As indicated by table 9 the real earnings management regression
model is statistically significant (0.000). The Adjusted R Square of
0.082 indicates that the achievability in prior years, the ROA and
the MtoBt value explain 8.2 percent of the real earnings management.
Model Summaryb
Model R R Square
Adjusted R
Square
Std. Error
of the
Estimate
1 ,303a ,092 ,082 ,20930168
a. Predictors: (Constant), Prioryears, MtoBt,
ROAt
b. Dependent Variable: REMt
Table 10: Model Summary real earnings management
Coefficientsa
Model Unstandardized
Coefficients
Standardize
d
Coefficient
s
t Sig.
Table 9: ANOVA real earnings management
24

B Std. Error Beta
1 (Constan
t),068 ,030 2,305 ,022
MtoBt -,011 ,004 -,168 -2,843 ,005
ROAt -,468 ,120 -,231 -3,901 ,000
Prioryea
rs-,004 ,022 -,012 -,200 ,842
a. Dependent Variable: REMt
Table 11: Coefficient table real earnings management
The coefficients table (Tabel 11) of the regression model of
abnormal production level (REMt) indicates that the independent
variable Prioryears is not statistically significant (0.842) and
therefore the negative effect (-0.012) on the REMt is irrelevant. We
therefore reject hypothesis 4.
Table 11 indicates that the independent variable MtoBt is
statistically significant (0.005) with a negative effect (-0.168) on
the REMt. This is contrary to the hypothesis on this relationship.
Hypothesis 5 is rejected. The independent variable ROAt is
statistically significant (0.000) with a negative effect (-0.231) on
the REMt. Hypothesis 6 is therefore accepted.
5.3.1 Assumptions underlying linear regression analysis:
The above results can only be interpreted when the underlying
assumptions of the linear regression are met. We tested these
assumptions for this regression using a scatterplot, histogram, Q-Q
plot and the Kolmogorov-Smirnov test (Figure 5, 6 and 7).
25

Figure 7: Q-Q plot real earnings
Figure 5: Scatterplot real earnings management
Figure 6: Histogram real earnings
26
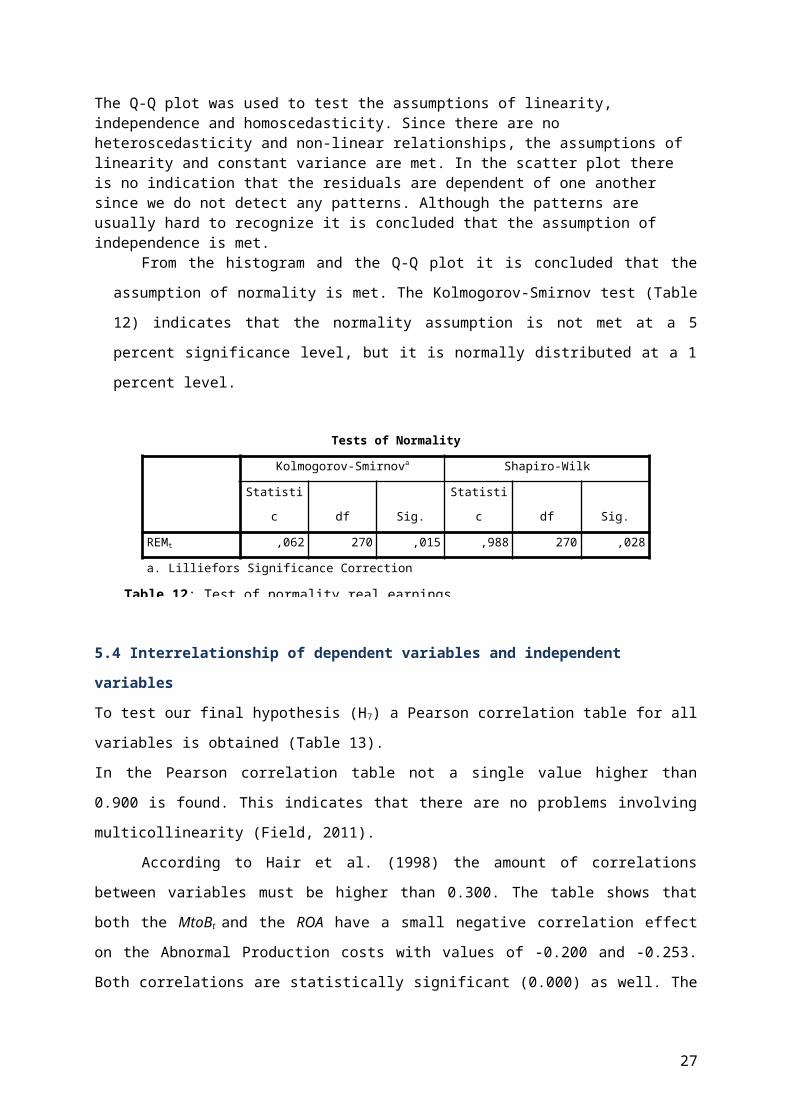
Table 12: Test of normality real earnings
The Q-Q plot was used to test the assumptions of linearity, independence and homoscedasticity. Since there are no heteroscedasticity and non-linear relationships, the assumptions of linearity and constant variance are met. In the scatter plot there is no indication that the residuals are dependent of one another since we do not detect any patterns. Although the patterns are usually hard to recognize it is concluded that the assumption of independence is met.
From the histogram and the Q-Q plot it is concluded that the
assumption of normality is met. The Kolmogorov-Smirnov test (Table
12) indicates that the normality assumption is not met at a 5
percent significance level, but it is normally distributed at a 1
percent level.
Tests of Normality
Kolmogorov-Smirnova Shapiro-Wilk
Statisti
c df Sig.
Statisti
c df Sig.
REMt ,062 270 ,015 ,988 270 ,028
a. Lilliefors Significance Correction
5.4 Interrelationship of dependent variables and independent
variables
To test our final hypothesis (H7) a Pearson correlation table for all
variables is obtained (Table 13).
In the Pearson correlation table not a single value higher than
0.900 is found. This indicates that there are no problems involving
multicollinearity (Field, 2011).
According to Hair et al. (1998) the amount of correlations
between variables must be higher than 0.300. The table shows that
both the MtoBt and the ROA have a small negative correlation effect
on the Abnormal Production costs with values of -0.200 and -0.253.
Both correlations are statistically significant (0.000) as well. The
27
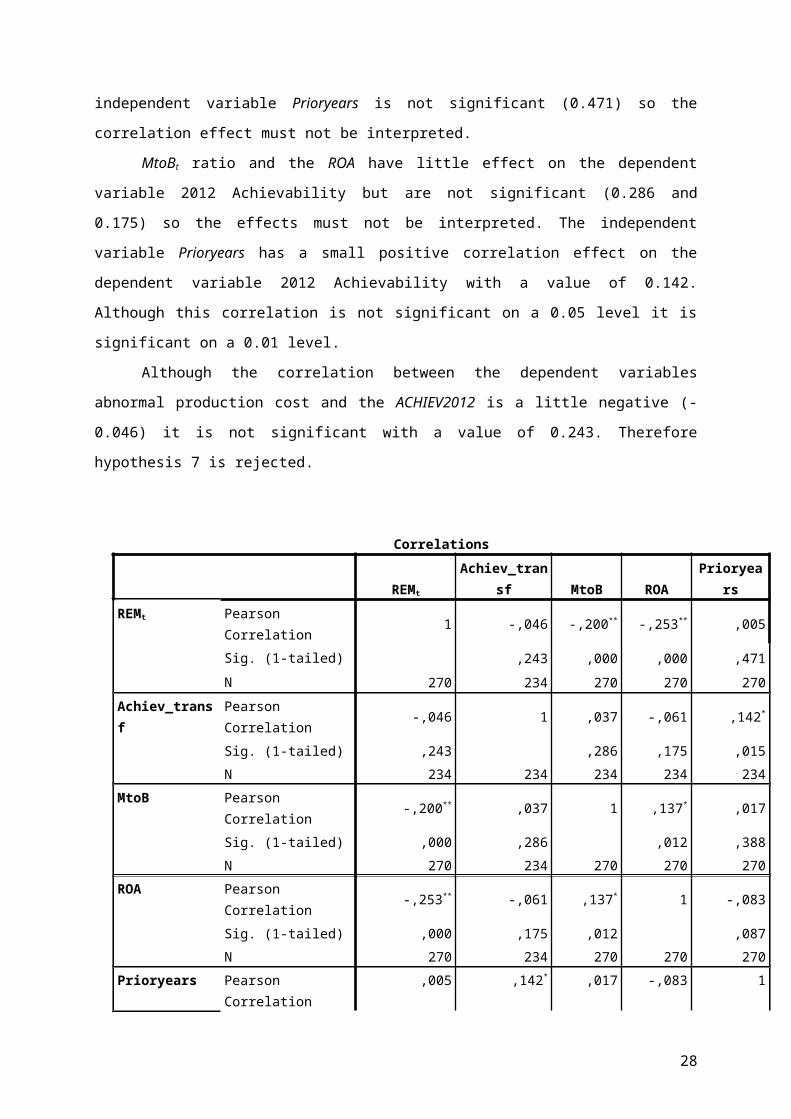
independent variable Prioryears is not significant (0.471) so the
correlation effect must not be interpreted.
MtoBt ratio and the ROA have little effect on the dependent
variable 2012 Achievability but are not significant (0.286 and
0.175) so the effects must not be interpreted. The independent
variable Prioryears has a small positive correlation effect on the
dependent variable 2012 Achievability with a value of 0.142.
Although this correlation is not significant on a 0.05 level it is
significant on a 0.01 level.
Although the correlation between the dependent variables
abnormal production cost and the ACHIEV2012 is a little negative (-
0.046) it is not significant with a value of 0.243. Therefore
hypothesis 7 is rejected.
Correlations
REMt
Achiev_transf MtoB ROA
Prioryears
REMt Pearson Correlation 1 -,046 -,200** -,253** ,005
Sig. (1-tailed) ,243 ,000 ,000 ,471N 270 234 270 270 270
Achiev_transf
Pearson Correlation -,046 1 ,037 -,061 ,142*
Sig. (1-tailed) ,243 ,286 ,175 ,015N 234 234 234 234 234
MtoB Pearson Correlation -,200** ,037 1 ,137* ,017
Sig. (1-tailed) ,000 ,286 ,012 ,388N 270 234 270 270 270
ROA Pearson Correlation -,253** -,061 ,137* 1 -,083
Sig. (1-tailed) ,000 ,175 ,012 ,087N 270 234 270 270 270
Prioryears Pearson Correlation
,005 ,142* ,017 -,083 1
28

Sig. (1-tailed) ,471 ,015 ,388 ,087
N 270 234 270 270 270**. Correlation is significant at the 0.01 level (1-tailed).*. Correlation is significant at the 0.05 level (1-tailed).
Table 13: Correlation table
29

6. CONCLUSION AND DISCUSSION
In this study we have conducted research using a fairly large sample
size, trying to find evidence for the relationship between the
achievability of non-equity incentive plan targets and real earnings
management and their determinants. The determinants used in this
research consist of the market-to-book ratio, the return on assets
ratio and the average achievability of earnings targets in prior
years. We have conducted two regression analyses. With the outcomes
resulting from the regression analyses, we concluded that our
hypotheses stated in the hypothesis development were either verified
or rejected.
In the first regression model we tested hypothesis 1, 2 and 3.
We tested the relationships between the achievability of non-equity
incentive plan targets and our determinants. Since we did not find
significant evidence, we rejected hypothesis 2 and 3. No significant
relationship was found between the market-to-book ratio and the
return on assets ratio to the achievability of incentive plan
targets. The rejection of H2 and H3 was not surprising, since we
found only little empirical research of these relationships and the
effect on achievability. Literature does suggest a greater influence
of the achievability in prior years on the current achievability.
Hypothesis 1 was verified, because of significant results. Therefore
we can conclude that the achievability of incentive plan targets in
prior years has significant influence on the achievability of
current CEO non-equity incentive plan targets. Although, the
explanatory power we found was very low which is in contrast with
literature we have consulted.
In our second regression model we tested hypothesis 4, 5 and 6.
We tested the relationships between the level of real earnings
management and the determinants. No significant relationship was
30
found between the achievability of incentive plan targets in prior
years and the level of real earnings management, therefore we
rejected hypothesis 4. We did found a statistically significant
value for the relationship between the market-to-book ratio and the
level of real earnings management, but the outcome did not
correspond with our stated hypothesis. The effect of the market-to-
book ratio on the level of real earnings management is negative,
which is in contrary to the literature study. There we stated that a
higher market-to-book ratio leads to a higher level of real earnings
management. The independent variable return on assets is
statistically significant with a negative effect on the level of
real earnings management, hypothesis 6 is therefore accepted.
In our final hypothesis, hypothesis 7, we stated our expected
interrelated relationship between the achievability of CEO non-
equity incentive plan targets and real earnings management. We
expected a negative interrelated relationship. To test our final
hypothesis we conducted a Pearson correlation table. We did not
perceive a significant value, therefore hypothesis 7 was rejected.
There are several limitations conducted in this research. Some
obstacles occur with the extraction of the data from the database.
For instance, combining different data from different years by using
different databases in prone to error and gave a smaller sample size
than aimed for. The dependent variable ‘achievability of the
companies’ was calculated dividing the payout of the target by the
actual payout. In result of the calculation the achievability was
concluded if the actual payout exceeded the target payout. We think
more parameters should be included in the research for calculating
the achievability. Not only the amount of bonus payouts for top
executives should be used, but also the target and realized
performance metrics should be included in the research for
31

determining the achievability. In addition, if a CEO’s did not
achieve their goals they got either zero payout or either a
subsequently amount of the target. We could not tell if the
companies with a payout of zero really did not achieve their goals
or that their contract was either you get the bonus or not. This
information is needed to calculate the achievability more
accurately. Also the independent variable ‘achievability prior
years’ was calculated on an average of two years, probably it was
better to use a wider range to give power to the results.
Furthermore, extracting the data from the database a few
problems occur with the data for example market to book values of -
100 and +200. Also comparing the data gave some worries because in
some cases companies with a negative return on assets had a payout
even higher than the target payout and if a company did not achieved
their incentive plan in 2010 a much higher incentive plan payout was
presented in 2011.
32

REFERENCES
Adam, T. & Goyal, V.K. (2008). The investment Opportunity Set and
it’s Proxy Variables. The Journal of Financial Research, 31(1), 41-63.
Allred, James K. Looking at the Return on Assets. Modern Materials
Handling. May 1997.
Anderson, S.W., Dekker, H.C., Sedatole, K.L., (2008). An empirical
examination of negotiated goals and performance-to-goal following
the introduction of an incentive bonus plan.
Bergstresser, D. & Philippon, T. (2006). CEO incentives and earnings
management. Journal of Financial Economics, 80(3), 511-519.
Courtis, P. (2003). Du Pont Ratio: A comprehensive measure of
business performance. European Research Studies, 6(1), 1-31
Cooper, M.J., Gulen H. & Rau P.R (2009). Performance for pay? The
relantionship between CEO incentive compensation and future stock
price performance.
Field, A. (2005). Discovering Statistics Using SPSS. 2nd ed. London:
Sage Publications Ltd. 657p.
Hair, J. F., R. E. Anderson, R. L. Tatham and W. C. Black, (1998),
Multivariate Data Analysis, Upper Saddle River, NJ: Prentice-Hall
International, Inc.
Holthausen, R.W., Larcker, D.F. & Sloan, R.G. (1995) Annual bonus
schemes and the manipulation of earnings. Journal of Accounting and
Economics, 19, 29-74.
Kim, D.S. & Yang, J. (2009). Beating the target: A Closer Look at
Annual Incentive Plans
Merchant, K.A. & Manzoni, J. (1989). The achievability of Budget
Targets in Profit Centers: A Field Study. The Accounting Review, 64(3),
539-558.
Indjejikian, R., Matejka, M., Merchant, K.A. & Van der Stede, W.A.
(2010). Setting Performance Targets in Recessionary Times: Survey
33

Evidence of a Discontinuity in the Distribution of Earnings
Targets.
Palmon, D., Santoro, M.A. & Strauss, R. (2009). Pay Now, Lose Later:
The Role of Bonuses and Non-Equity Incentives in the Financial
Meltdown of 2007-2009. The Open Ethics Journal, 3, 76-80.
Roychowdhury, S. (2006). Earnings management through real activities
manipulation. Journal of Accounting and Economics, 42(3), 355-370.
Skinner, D.J. & Sloan, R.G. (2002). Earnings Surprises, Growth
Expectations, and Stock Returns or Don’t Let an Earnings Torpedo
Sink Your Portfolio. Review of Accounting studies, 7, 289-312
Zang, A.Y. (2012). Evidence on the Trade-Off between Real Activities
Manipulation and Accrual-Based Earnings Management. The Accounting
Review, 87(2), 675-703.
34

APPENDIX
ANOVAa
ModelSum ofSquares df Mean Square F Sig.
1 Regression ,553 1 ,553 ,321 ,571b
Residual 399,593 232 1,722Total 400,147 233
a. Dependent Variable: Achiev_transfb. Predictors: (Constant), MtoBAppendix I: ANOVA Regression between MtoB and transformed achievability
ANOVAa
ModelSum ofSquares df Mean Square F Sig.
1 Regression 1,503 1 1,503 ,875 ,351b
Residual 398,643 232 1,718Total 400,147 233
a. Dependent Variable: Achiev_transfb. Predictors: (Constant), ROAAppendix II: ANOVA regression ROA to transformed achievability
35

36