STATE FISCAL INCENTIVE PROGRAMS IN FEDERALISM
71
THE GEORGE WASHINGTON UNIVERSITY SCHOOL OF BUSINESS THE INSTITUTE OF BRAZILIAN BUSINESS AND PUBLIC MANAGEMENT ISSUES STATE FISCAL INCENTIVE PROGRAMS IN FEDERALISM – THE CASE STUDY OF PARANÁ, BRAZIL Marlon Jorge Liebel The Minerva Program – Fall/2012 Advisor: Prof. Reid W. Click, PhD. Washington, D.C. 2012
-
Upload
khangminh22 -
Category
Documents
-
view
4 -
download
0
Transcript of STATE FISCAL INCENTIVE PROGRAMS IN FEDERALISM

THE GEORGE WASHINGTON UNIVERSITY
SCHOOL OF BUSINESS
THE INSTITUTE OF BRAZILIAN BUSINESS AND
PUBLIC MANAGEMENT ISSUES
STATE FISCAL INCENTIVE PROGRAMS IN
FEDERALISM – THE CASE STUDY OF PARANÁ, BRAZIL
MMaarrlloonn JJoorrggee LLiieebbeell
The Minerva Program – Fall/2012
Advisor: Prof. Reid W. Click, PhD.
Washington, D.C.
2012

ii
INDEX
LIST OF TABLES ............................................................................................. iii LIST OF FIGURES............................................................................................ iv 1. INTRODUCTION......................................................................................... 1
1.1. Objectives ............................................................................................ 1 1.2. Method ................................................................................................. 2 1.3. Structure .............................................................................................. 2 1.4. Limitations............................................................................................ 3
2. FEDERALISM............................................................................................. 4 2.1. Federalism: United States of America.................................................. 5 2.2. Federalism: Brazil ................................................................................ 8 2.3. Differences between the systems and their consequences. .............. 12
3. FISCAL FEDERALISM............................................................................. 13 3.1. Tax administration: the American system .......................................... 20 3.2. Tax administration: the Brazilian system............................................ 23
4. THE ROLE OF FINANCE STATE SECRETARIATS IN THE ECONOMY: A BRAZILIAN PERSPECTIVE............................................................................ 26
4.1. Revenues and expenditures: how to maintain equilibrium without overcharging taxes and offer adequate public goods and services .............. 28 4.2. Externalities that affect forecast numbers .......................................... 31 4.3. Decisions on budget: technical approach x political approach ........... 32
5. FISCAL INCENTIVES: STATE OF PARANÁ CASE STUDY................... 36 5.1. Fiscal incentive programs from 1996 to 2010 in Paraná .................... 36 5.2. Analysis: GDP x Tax Revenue........................................................... 42 5.3. An analysis of expected outcome ...................................................... 47
6. ECONOMIC THEORIES APPLIED TO THE CASE STUDY..................... 51 6.1. Economic theories.............................................................................. 51 6.2. Do economic theories justify the decisions taken by government to increase GDP and VAT revenues?............................................................... 54
7. CONCLUSION.......................................................................................... 58 7.1. Final considerations ........................................................................... 58 7.2. Future papers suggestions................................................................. 61
BIBLIOGRAPHY.............................................................................................. 62

iii
LIST OF TABLES
Table 1 – Top five and bottom five local expenditures relative to state and local expenditures.............................................................................................. 21
Table 2 – Tax revenue representativeness per state – 2011 ........................... 27 Table 3 – Region Participation (%) on Gross Domestic Product 1995 – 2009 . 38 Table 4 – Region Participation (%) on ICMS revenue 1997 - 2011.................. 43 Table 5 – ICMS participation growth and GDP participation growth – 2011/1997
.................................................................................................................. 43

iv
LIST OF FIGURES
Figure 1 – Brazilian tax burden – 1947-2011................................................... 23 Figure 2 – ICMS tax revenue per region – 1997.............................................. 30 Figure 3 – Brazil and Paraná GDP growth – 1995-2009 (basis 1995 = 100)... 39 Figure 4 – Participation in Brazilian GDP, selected states – 1995-2009
(basis 1995 = 100) .................................................................................... 41 Figure 5 – GDP growth, selected states – 1995-2009 (basis 1995 = 100) ...... 41 Figure 6 – Brazil and Paraná ICMS revenue growth – 1997-2011
(basis 1997 = 100) .................................................................................... 44 Figure 7 – Participation in Brazilian ICMS revenue, selected states - 1997-2011
(basis 1995 = 100) .................................................................................... 46 Figure 8 – ICMS revenue growth, selected states – 1997-2011 (basis 1995 =
100) ........................................................................................................... 47 Figure 9 – Monthly unemployment rate in Brazil and Paraná – 2003-2012 ..... 49

1. INTRODUCTION
This paper will present the evolution of GDP – Gross Domestic
Product – in Brazil and its states and the ICMS growth. The ICMS (“imposto
sobre operações relativas à circulação de mercadorias e sobre prestações de
serviços de transporte interestadual e intermunicipal e de comunicação” – tax
on the circulation of merchandise and interstate and intermunicipal
transportation services and communications) is the most important subnational
VAT – Value Added Tax – in Brazil.
1.1. Objectives
The main objective of this paper is to present the economic
context in which Brazilian states are competing for investments, the instruments
they are using to attract companies and the case study of the state of Paraná
regarding postponed ICMS revenues. The intention is to produce an analysis
that may subsidize the authorities with data for future discussions on incentive
programs.
In order to support this study, secondary goals will be pursued.
The following comparisons will be useful to verify the efficiency of the incentive
programs adopted by the state of Paraná: (i) between Paraná and Brazil GDP
growth, (ii) Paraná’s and other selected states’ GDP growth, (iii) Paraná’s and
Brazil’s average ICMS growth, (iv) Paraná’s and selected states’ ICMS growth,
(v) Paraná’s and Brazil’s unemployment rates evolution.
This paper aims at enabling a deeper discussion on the subject
of fiscal benefits in Brazil after the monetary stabilization.

2
1.2. Method
The research method will be a descriptive case study based on
data collection and historical research. The data will provide figures for
numerical comparisons, while the historical research will help explain the
fundamentals of the contemporary economic scenario in Brazil.
1.3. Structure
Chapter 1 presents the contextualization of the subject, the
objectives of the paper, the research method, the paper’s structure and its
limitations.
Chapter 2 describes the history of federalism in the United
States of America and Brazil, drawing a comparison between their
characteristics – constitution, tiers of government, level of autonomy – and the
path that each country trailed to reach democracy.
Chapter 3 brings about a specific topic of federalism that will be
necessary for a better comprehension of the case study, and will provide the
necessary knowledge on fiscal federalism.
Chapter 4 explains the role of the Finance State Secretariats,
state level government institutions responsible for determining the tax policy
and subsidizing the budget with the revenue forecasting.
Chapter 5 presents the particular case of the state of Paraná in
detail as a means to analyze the outcome of each major program the state
implemented with the intention of attracting investments. GDP, ICMS revenue
and unemployment rates will support the conclusions of this chapter.

3
Chapter 6 compares the view of two important economic
schools of thought in relation to the incentive programs that Paraná managed to
put in action.
Chapter 7 will analyze the accomplishment or not of the
proposed objectives, final considerations about the adequate use of economic
data for public decision making and suggestions for future studies.
1.4. Limitations
This paper does not intend to exhaust the subject of actions
Brazilian states have been using to pursue stronger economic growth. The case
study will focus solely on incentive programs based on postponing VAT
revenue. This choice is relevant due to the difficulties in finding reliable data on
different incentives, such as tax reduction and presumptive credit.
The time period is deemed adequate considering the changes
occurred in the VAT legislation resulting from the current Brazilian Constitution,
promulgated on October 5th, 1988. The milestones that defined the analysis
period are the monetary stabilization (1994-1995) for the GDP and the Lei
Kandir (Lei Complementar 87/1996) – Kandir Law for the ICMS.

4
2. FEDERALISM
In order to reach the main subject of this paper, it is necessary
to go through some concepts about federalism. This chapter introduces these
concepts and briefly presents the Federalist systems adopted in the United
States of America and in Brazil, to eventually give a highlight their differences
and comment their consequences.
The first concept to be understood is Federalism. It consists of
a “mode of political organization that unites separate states or other polities
within an overarching political system in such a way as to allow each to
maintain its own fundamental political integrity”, according to the definition of
Encyclopedia Britannica (2012).
Politically, federalism can be defined as a political system in
which power, authority and responsibilities are divided between two (union and
states) or more levels of government (ALLEN, 2009; THRO, 2010; GUNTHER,
2011).
Moreover, federalism is a complex political organization due to
the division of a government into multiple tiers of governments, each one with
different responsibilities and a mission of working cooperatively to reach the
best results for their population.
Considering this is such a complex system, it is intriguing why
25 countries accounting for 40% of the world’s population (FORUM
FEDERATIONS, 2012) would adopt Federalism globally.
Prado (2006) gives the primary reasons why countries adopt
federalism: (i) geography – very large countries tend to resist unification; (ii)
policy – the federate units may be interested in being supported by a Federal

5
government without losing its regional identity; (iii) economy – being part of a
federation may enhance provision of public goods; and (iv) history –
colonization and how the country has been formed.
To support this theory, one can refer to Downs (2011): “The
U.S. and Canadian federal forms are substantially different, as are those in
India, Brazil, Australia, and Germany, because the ideological underpinnings of
federalism in each of those cases are products of varying historical
experiences.”
Although the cited countries have many rich experiences on
federalism, this section is restricted to explore the American and Brazilian
federalist systems and to identify similarities and differences in order to improve
the analysis of future developments.
2.1. Federalism: United States of America
Prior to the Constitution of the United States in 1789 theorists
assumed that sovereignty demanded a unitary government, according to
Samples (2008). The author explains that at first, the national government
decisions should affect only the states, not their citizens.
Notwithstanding major events, remarkably the Civil War,
(southern states wanted to keep slavery legal and were eventually defeated in
1865) the federalist system became even stronger. In 1868 the Fourteenth
Amendment limited state power in order to protect the rights of citizens.
The period of federalism described above came to be known as
“dual federalism”, and lasted until the 1930’s. It was characterized by the
competition between two levels of government (Zackin, 2011).

6
After the Great Depression, a new stage of federalism in the
United States had begun: the cooperative federalism. “A critical advantage of a
cooperative federalism approach is that it sets forth a basic federal framework
while allowing states to experiment within certain contours.”, states Wieser
(2003) while also listing four benefit categories of cooperative federalism: (i)
respecting state autonomy; (ii) facilitating greater accountability for public
policies; (iii) allowing interstate competition; and (iv) relying on the economy of
local agencies.
The crisis represented an opportunity for the Federal
government to employ regulatory power and put an end to its competition with
the states. Zackin (2011) states that “The federal government standardized and
centralized domestic policymaking, transforming states from independent and
competitive sovereigns into cooperative or even coerced administrators.”.
Wieser (2003) also alerts about the risk of transforming cooperation into
coercion depending on the approach used to reach cooperative federalism. For
this reason cooperative federalism is also called by some authors “coercive
federalism”.
The New Deal was a “program to bring more national
involvement and finances into the provision of services in the states.” according
to Janiskee (2011). It has been achieved under Roosevelt’s presidency,
because the conditions were ideal to such a change in this division of labor, and
three Supreme Court cases validated the shift in power (LOWI, 1995): (i)
National Labor Relations Board v. Jones & Laughlin Steel Corporation, (ii)
Helvering v. Davis, and (iii) Steward Machine Company v. Davis.

7
The state-centered federalism lost strength after the Great
Depression, and the national government took the opportunity to grant itself
regulatory power over economic activity. Along with the economic issues, the
Civil Rights Movement helped diminish the importance of states in the
federation even more.
Janiskee (2011) considers the Great Society of Lyndon
Johnson the milestone for the end of cooperative federalism. The author
explains that the Great Society consisted of an increasing participation of the
national government in areas the state had so far been dominant, such as
health, education and welfare policy.
The New Federalism, as this period has been called, evokes
the return to dual federalism or, at least, tries to reach a better equilibrium
between the national and state governments. Richard Nixon followed this path
through revenue sharing – inter-governmental transfers – and Ronald Reagan
offered a clear trade-off to the governors, restoring autonomy to those states
willing to exchange it for less money (JANISKEE, 2011).
After this historical view on American federalism, it comes to
conclusion that this system is very strong in the United States and, although it
has changed since the Constitution was signed, it has been an evolutionary
process that certainly has not yet finished – and probably never will.
It is clear that the population’s demand for services is always
evolving, and the governments have to cope with it in order to allow voters to do
their accountability.

8
2.2. Federalism: Brazil
Nogueira (2005) proposes five distinct periods to the republican
era in Brazil: (i) First Federalism (1889-1930), (ii) Civil Unitarism (1930-1945),
(iii) Second Federalism (1945-1964), (iv) Military Unitarism (1964-1985), and (v)
Third Federalism (1985-today).
Brazil has suffered major changes in its government since the
end of the Empire in 1889. The Republic started with a Constitution (1891) that
was based on the American Constitution – remembering the Dual Federalism
was ongoing in the United States by this time. The First Republic, also called
the “Old Republic”, lasted until the mid-1930s, and was characterized by the
predominance of politicians from the states of Minas Gerais and São Paulo.
This meant that power during First Federalism was changing
hands among groups with the same interests, which came to be known as
“política café com leite” – coffee and milk politics – and it was named after the
states most important products - cattle raising in Minas Gerais and São Paulo's
coffee plantations. Beside these states, there was one more competitor for the
rule of the federal government: Rio Grande do Sul (COSTA, 2003).
And it was from Rio Grande do Sul that came President Getúlio
Vargas, who ruled the country for 15 years – which came to be known as the
Civil Unitarism period. The Constitutions of 1934 and 1937 became effective
under his presidency, but they had very different concepts. The Constitution of
1934 granted welfare – mostly labor benefits –, which affected productive
sectors, and characterized the populist government conducted by Vargas during
his first years of presidency.

9
The Constitution of 1937 established the “Estado Novo” (the
New State), Vargas dictatorship, and was based on the Polish Constitution of
1935 – also a dictatorship. It is necessary to mention that the Vargas
dictatorship had not been comprehended by Brazilian citizens as a dictatorship
in the actual sense of the word. There was an understanding that this
government would be a transitory solution and was ongoing on behalf of
protecting democracy (RANGEL, 2007).
As expected, this constitution came to be authoritarian with a
strong executive branch – with legislative authority – and so centralizing that it
became the only political power, according to Amaral (2004).
Following the authoritarian line, Vargas tried to use this
constitution to extinguish the Old Republic’s federalism, naming interveners to
rule the states, banning state competences and symbols, as well as granting
the national government power to intervene in economic activities and labor
issues on behalf of the nation’s best interest (SCHERER, 2007).
The Second Federalism dealt with some problems similar to the
ones First Federalism faced. It was the post-World War II period, and the
country had just overcome a dictatorship. The Constitution of 1946 restored
federalism by granting autonomy to states and municipalities.
Nogueira (2005) explains that, although the states regained
their place in the federal system – three presidents were former governors –,
the national government was now well established and kept much of the power
obtained by the previous regime, reorganizing federative structure.
During this period, successive crises unmasked an unstable
government, as Camargo (1992) comments: (i) President Vargas – deposed in

10
1945 and democratically elected in 1950 – committed suicide in 1955 due to
political issues, (ii) President Quadros resigned the office due to political
pressure and (iii) President Goulart was on duty in 1964 when the military State
coup occurred.
The Military Unitarism (consolidated by the Constitution of
1967) that followed the above events was quite different from the Civil
Unitarism, for the states did not approve the new national government –
President Vargas was, at first, supported by most governors, as Nogueira
(2005) explains.
The author leads to reflections upon centralization, now
devoted to economics: previously, the national government was present in the
mining (Companhia Vale do Rio Doce) and oil (Petrobrás) sectors; during the
military government its control expanded to the electric sector (Eletrobrás), the
railway business (RFFSA – Rede Ferroviária Federal S/A) and to
telecommunication sector (Telebrás) – the last one being the only branch in
which the states had some participation, through subsidiaries.
On other subjects, in spite of trying to be subtle, the military
government took over politics by determining who would become the governors
in indirect elections – but maintained political parties as a means to legitimate
their actions.
The states started recovering power in the federation in 1982,
after free elections for governor. This event was the milestone of the re-
democratization of the country, when the national executive government
gradually lost power to both the national legislative branch and the states,
eventually leading to the Constitution of 1988 (ARAÚJO, 2009).
11
The period after the military dictatorship has been named “Nova
República” – the New Republic – and started with the Constitution of 1988,
which brought a new actor to the federative pact: the municipalities. For over
almost a hundred years the states and the national government had been the
only two players in Brazilian federalism. From 1988 on, local governments
represented the third layer in the federal system, the closest one to the citizens.
A moment that could have represented the beginning of a
strong new model of federation, which firstly saw states fighting together,
claiming their autonomy and getting rid of some of their obligations, ended up
with each state focusing on its own interests (NOGUEIRA, 2009), therefore
losing political influence – and intergovernmental transfers – to local
governments.
At this very moment there is an intense debate about the way
federalism is being conducted in Brazil. For instance, the judiciary system is
also part of the process. As the states could not reach an agreement on the
division of federal transfers (the FPE – Fundo de Participação dos Estados –
“States Participation Fund” in a free translation) a decision of the Supreme
Court now obligates the states to reach a solution by the end of 2012 –
otherwise the fund will no longer exist.
This debate has been postponed year after year by the
CONFAZ – Conselho Nacional de Política Fazendária – a council that gathers
all 27 State Finance Secretaries every trimester – and had not reached any
conclusion by the time the Supreme Court issued its decision. It is important to
mention that decisions at CONFAZ need to be unanimous, what makes
sensitive issues hard to be confronted and decided.

12
Although the discussion above is restricted to the financial area,
it successfully represents the maturing point in which Brazilian federalism
stands nowadays.
2.3. Differences between the systems and their consequences.
After the historical approach to American and Brazilian
federalism, it is now possible to draw some conclusions.
One of them is that Brazilian federalism has faced many
changes from authoritarian centralizing regimes to liberal decentralizing regimes
(COSTA, 2003) and this is determinant to the development of this country’s
federalism. On the other hand, the United States, despite having to cope with
domestic and international issues, has not suffered significant changes in the
way it is ruled.
So, the comparison here comes to be between a “young
federalism” – Brazil – and an “old federalism”. Apparently, the most significant
difference lies on the behavior of the federated units.
In the United States, units of the same tier may compete among
themselves, but are united in granting their tier the power and revenue to
provide the services to their citizens.
Given the example of Brazilian states – especially the one in
section 2.2 – it is reasonable to assume that states might be losing power to the
national and local governments. The following analysis on fiscal federalism will
be of some help to understand this scenario.

13
3. FISCAL FEDERALISM
After the introduction to federalism concepts and the historical
approach, it is now possible to delve a little deeper into one of the branches of
federalism, the fiscal federalism. The discussion hereby intended does not try to
completely exhaust this field – its main objective is to cast some light on an
interesting and sensitive subject, because it involves collecting taxes and
government expenditures.
The choice of fiscal federalism being used to further study the
relations among the tiers of a federation is due to the interest of the citizens. In
order to have good services, the population is supposed to pay taxes. How to
distribute tax competence and reach the equilibrium between revenue and
expenditures to provide efficient public services is the question that will lead this
chapter’s discussions.
Kokov and Liubimtsev (1997) define fiscal federalism as “a
direction of economic reform that embraces economic, financial, and political
relations”. This broad definition, that presents fiscal federalism as a constantly
changing concept, matches the discussion about federalism seen in Chapter 2,
confirming that the federalist pact is an ongoing evolutionary process.
The relevance of distinguishing fiscal federalism from regulatory
federalism is highlighted by Super (2005) especially for police makers: thus, it is
significant to introduce this concept for the purposes of this study. The term
“fiscal federalism” dates back to 1959 and its first use and development are
attributed to Richard Musgrave, according to Kapucu (2007).
14
Fiscal federalism is the established set of rules that commands
financial relations between central and lower levels of government in a federalist
system (KESNER-SKREB, 2009; KAPUCU, 2007).
For the purpose of reaching a better understanding on fiscal
federalism, Hickey (2009) presents three questions: “i) When will regions
centralize/decentralize authority over fiscal instruments?, ii) How large is the
effect of tax competition over business property?, and iii) Why do self-interested
politicians engage in intergovernmental transfers of resources?”.
Based on these questions it is possible to point out some key
issues of fiscal federalism that will be addressed: (i) autonomy, (ii)
harmonization, (iii) inter-governmental transfers, (iv) expenditures, and, (v)
political decisions.
Governments want autonomy to rule countries, states, and
cities. Although this is an obvious statement – for democratic federations –, it
has a serious financial implication: every tier of government has to cope with a
budget to provide services to its citizens. So, revenue becomes an outstanding
issue to satisfy the population’s needs and expectations.
Fiscal federalism is the instrument to provide public
consumption levels suitable to a heterogeneous population, acting through
decentralization to subnational governments (BRUECKNER, 2006).
Tiebout (1956) studies demonstrate the benefits of fiscal
federalism for citizens linking these benefits with the mobility rights of
consumer-voters. Tiebout’s theory enunciates that if the local government does
not provide expected public goods, population moves out, causing a decline in

15
tax revenue and a subsequently decrease in the quality of public services –
reinitializing the process.
Notwithstanding the fact that the described situation might be
good for the local government which the citizens move into, it is not necessarily
true that this outcome is always desirable. The neighboring of a wealthy
community is also important, thus it might be relevant to find equilibrium
balance, otherwise the negative effect of mobility – a poorer neighbor city, for
instance – may affect the welfare of the community.
Sometimes, as a means to reach the targeted equilibrium, the
intervention of a higher level of government (state or central) is necessary to
assist local governments, usually through funds transfer, equaling the services
provided to citizens living in different cities. The aimed break-even point can
also be obtained by tax harmonization, but this usually impacts the level of
autonomy granted to local governments, which might not be acceptable
because it centralizes power.
Gil-Serrate and López-Laborda (2009) studied revenue
decentralization and observed that there is a level of optimal tax
decentralization for regional growth, and it is determined by taking into
consideration “private and public capital productivities, the tax burden rate in the
absence of decentralisation and the intensity of the flypaper effect”. An
interpretation of the flypaper effect is offered by Bae and Feiock (2004):
“According to economic theory, lump-sum grants
should have the same effect on local government
expenditures as the local government residents’
increase in income. But, empirical work reports
that the response of local government expenditures
to lump-sum grants has often been greater than the
effect of equal increases in the income of
residents. This is called the flypaper effect.“

16
Bailey (1999) provides further explanation about the flypaper
effect.
It is appropriate to emphasize the distinction between fiscal and
administrative decentralization. Tanzi (1995) claims that “fiscal decentralization
exists when subnational governments have the power (…) to raise (some) taxes
and carry out spending activities within clearly established legal criteria”. The
author gives an example of administrative decentralization in which local
governments of Italy raised 8% of total net revenue of the general government
in 1992 but spent about 37% of total net expenditure.
Iimi (2005) demonstrates it is arguable whether decentralization
leads to economic growth, despite the fact that many developed and developing
countries adopt decentralization as a means to accomplish growth. Thornton’s
(2007a) study conduces to a similar outcome, eventually establishing, in
disagreement with most authors, that “high sub-national government and
expenditure shares do not necessarily indicate high local autonomy”.
A logical argument for decentralization – specifically to local
governments – is given by Stansel (2005) who performed a study in all US
metropolitan areas and the outcome of the test supports the theory that
decentralization leads to economic growth. The author also states that “the
relationship between the structure of local government and economic growth
has direct relevance to contemporary policy debates”.
Fiscal competition is a possible outcome when subnational
governments have tax autonomy. The tax payer chooses where to live or where
to begin a business based on the benefits granted by state or local government
– or both.

17
On this matter Brunori (2005) draws a conclusion that fiscal
competition among subnational governments is inevitable, given the increasing
mobility of capital and labor, although the author recognizes that no state will
forgo tax incentives unilaterally.
Consequently, a dilemma is presented: whether to have fiscal
centralization or not. The arguments will be further analyzed from the standpoint
of the tax payer (citizen or firm), of the central government and of the state/local
government.
An important issue economists have been addressing is the
relation between fiscal decentralization and economic growth. Thornton (2007b)
explored the link between revenue decentralization and inflation and concluded
that “when the measure of revenue decentralization is limited to the revenues
over which sub-national governments have full autonomy, its impact on inflation
is not statistically significant”.
Wasylenko (1987) analyzes the relation between fiscal
decentralization and economic development. His conclusions show that per
capita income appears to be determinant in decentralization when the fiscal
decentralization is measured in terms of the extent to which subnational
governments make expenditures or in terms of total state and local government
revenues.
The same subject was also studied by Oates (1999), who
agrees that decentralized finance has an important potential role on economic
development, albeit the author prudentially stresses that “the translation of this
potential into a real contribution to economic growth depends on a number of
crucial conditions regarding the responsiveness of local institutions to local

18
welfare, which, in turn, depends importantly on the proper structure of fiscal
institutions”.
For the purposes of this study, it is necessary to make some
assumptions in order to try to understand the players’ standpoint in the debate
on fiscal centralization. The players considered are tax payers, central
government and subnational governments.
Tax payers might see advantages in centralization in view of
simplification of legislation. Large companies operating in different states may
find cope better with less fiscal legislation when trying to fulfill government
requirements. Companies’ efficiency may increase, because less labor will be
focused on bureaucracy and consequently be available for production, so, less
paperwork is also an advantage. The money “saved” is a simple exchange from
government expenditures (G), that are possible because of tax collection, to
private investment (I) in the Ricardian Equivalence (Y=C+I+G+NX). The
reduced government expenditure – subnational governments will not need to
have fiscal structure and develop their instruments – is likely to become a third
advantage for tax payers. Albeit this paragraph focused only on firms, the
statement is valid for citizens, changing the results that became investment for
firms to consumption (C) for citizens.
On the other hand, tax payers can also see advantages in fiscal
decentralization. Altunbaş and Thornton (2012) exhibit robust data providing
“strong support to the view that fiscal decentralization has a beneficial impact on
improving governance in a country by reducing corruption”. Furthermore, the
authors highlight another conclusion: state/local government autonomy might
reduce the beneficial impact on corruption, implying that fiscal decentralization

19
may be more effective if the resources are directed by the central government.
Another advantage of decentralization is the proximity to the public good
supplier, meaning that the community (citizen and firms) can hold more
influence in public decisions.
For subnational governments, the advantage of fiscal
centralization seems to reside in less expenditure. But this is a simple
compensation for the revenues that will not be directly collected, so the central
government will be able to balance subnational government’s transfer according
to its needs.
Adopting the still more accepted approach, the very first
advantage subnational governments might enjoy in a fiscal decentralized
federation is more autonomy, as a result of managing their own revenues.
Secondly, the state/local political actors are granted more participation into the
democratic process. The third advantage is reaction speed. Thanks to the
closeness to the community, local governments can be particularly more
efficient in undertaking changes in the supply of public goods in the short-run.
In the long-run, however, Seitz and Kempkes (2007) provided
evidence for the relation of aging population with increasing central government
expenditures in Germany.
As for the central government, the only advantage in
decentralization is the fall of expenditures, accompanied by a decrease in taxes
to maintain the equilibrium. On the other hand, centralization might increase the
central government influence in state/local decisions through federal grants tied
to programs outcomes – which is not necessarily good for the citizens.

20
As an example on quality of expenditure, a research performed
by Patrick (2012) brings performance policies into the context of fiscal
federalism, and her finding “supports the claim that fiscal federalism allows
federal policy makers to influence the policy process throughout the states”.
Taking into account the bibliographical review presented, it is
now possible to reach a conclusion: although economists have been trying to
explain the existing relations between fiscal federalism and its variables, most
decisions – if not all – depend on the elected politicians, meaning that vanity
and the thirst for power may also play a relevant role in providing public
services for the population, whatever tier of government we are dealing with.
3.1. Tax administration: the American system
Given the autonomy that state and local governments have in
the United States (as seen in Chapter 2), it is clear that subnational
governments must control their own budgets.
Brunori (2003) asserts that Americans prefer local government
over state or federal governments, as confirmed by many years of public
research. The author mentions Tiebout’s general theory and links it to the
growing number of local government entities (from 24,500 in 1942 to 71,293 in
2002). In the United States, local government units can be: counties,
municipalities, townships, school districts, and special districts.
In order to assess how the state interferes in local governments’
performance Holcombe and Williams (2011), based on 2005 data, compared
per capita incomes with local expenditure participation, as shown in Table 1.

21
Table 1 – Top five and bottom five local expenditures relative to state and local expenditures
Local Per Capita State Local & State Income
Nevada 0.66 38,117 New York 0.63 40,690 Colorado 0.61 38,555 California 0.61 38,767 Nebraska 0.61 34,318 Vermont 0.39 33,441 Rhode Island 0.38 36,214 Maine 0.37 32,008 West Virginia 0.37 26,686 Delaware 0.34 37,001
Source: Holcombe and Williams (2011)
In terms of expenditure, the average per capita income is 15%
higher in the most decentralized states (US$ 38,089) than in the most
centralized ones (US$ 33,070). This leads to the assumption that the less
centralized the expenditures, the wealthier the citizens.
At this point, it might be interesting to know a little more about
expenditures in the United States. Brunori (2012) explained the role of each tier
of government, and, regarding expenditures, the most remarkable one is the
structure of the education, which deserves the following notes.
The federal government runs the military academies and is
responsible for transferring resources to state and local governments. State
governments run universities and colleges, giving incentives (cheaper tuition
fees) for state residents and defining the study plans that will be used at local
governments. The state can also transfer revenue to local governments. The
local government answers for education from kindergarten to the 12th grade. It
is a free public good offered to the population, but there is an uneven level of
education, which leads to problems in the relationship with the state. Poor local
governments receive transfers for the purpose of enhancing their students’

22
achievements, but then the state might interfere, sometimes imposing its own
beliefs to indirectly run the schools.
The information of the previous paragraph – and extending it to
other public good and services – evidences a dispute for revenue to follow
through with the governments’ commitments with tax payers. This issue brings
to light one of the fundamental questions of fiscal federalism: are different levels
of government willing to make a joint effort on behalf of their citizens?
Important contribution on this issue and evidence that
governments change their actions in harmony with the ambience is given by
Koethenbuerger (2011):
“Previous literature predominantly assumes taxes to
be optimized and expenditures to adjust residually.
The paper endogenizes the choices of policy
variables by state governments and, in particular,
explores how federal policy toward state
governments influences the choices. We find that
governments choose to optimize over expenditures
when federal transfers subsidize tax effort.
Conversely, governments choose taxes as the policy
variable when transfers implicitly tax own-source
tax revenues. The paper's results are of relevance
for predicting the efficiency of state policy and
the incidence of federal policy. Specifically, the
efficiency of local policy for a given choice of
policy variable and the efficiency when accounting
for the endogeneity of policy variables may differ.
In the same vein, the level of taxes and
expenditures are sensitive to the choice of policy
variable and so does the incidence of federal
transfer policy that is conditioned on local fiscal
choices.”
Although the United States have many fiscal federalism issues
to embrace in the near future, Inman and Rubinfeld (1992) show the relevance
of having a long standing fiscal federalism, asserting that the then new
European Economic Community should take into consideration the American
experience.

23
3.2. Tax administration: the Brazilian system
The current Brazilian tax administration system was introduced
in the Constitution of 1988. As presented in Chapter 2, the local governments
took part in the federation after 1988, so any revenue comparison among tiers
of government respects that milestone.
It is interesting to quote Diaz-Cayeros (2006) conclusions,
highlighting that, in Brazil, state governments maintained its status and some
autonomy, despite the fact that the country faced two dictatorships. As a means
to get acquainted with Brazilian fiscal reality, Figure 1 represents Brazilian total
tax burden growth from 1947 to 2011.
Figure 1 – Brazilian tax burden – 1947-2011
Source: Afonso (2012).
Although the trajectory suffered important changes during this
period, for the purpose of this paper it is relevant to notice that in the first years
after the Constitution of 1988 the tax burden was more volatile, oscillating
around 25% of the GDP. In recent years, the curve shows a steadier trend,
close to 35% of the GDP.

24
An instrument that brought more stability to public finance was
the “Lei de Responsabilidade Fiscal” (“Lei Complementar 101/2000”) – Fiscal
Responsibility Law, in a free translation – approved by the Congress in 2000. Its
effects can be seen in Figure 1, approximately where the tax burden jumps from
28% to 33%, and later softens the curve to a slower growth in participation of
GDP.
According to Rezende (2003), the centralization of power
existent before the current Constitution allowed the municipalities to claim
decentralization. The outcome is shown by Afonso (2012): municipalities’
participation in total tax revenue increased from 13.3% in 1988 to 18.4% in
2011. This growth was compensated by losses of the central government –
from 60.1% to 57.1% - and of the state governments – from 26.6% to 24.6%.
From here on, there were several challenges for state
governments in the early 1990’s. The competition was established with local
governments, but this combat would only occur in a political arena, and
changes were not likely to happen in favor of the state government over local
government – this situation remains unchanged.
The scenario propitiated the beginning of the “fiscal war” as
fiscal competition among state governments came to be known in Brazil
(VARSANO, 1997). The intention is to attract investments to the state granting
fiscal benefits and infra-structure to companies interested in new investments or
in moving their plants from other states (NASCIMENTO, 2008).
Considering that the consumption of (some) goods produced by
a company that received the incentives will be consumed in the state, Liebel
and Pires (2006), on one hand, understand it can result in an increase of tax

25
revenue. On the other hand, the authors demonstrate their concern with the
quality of the public goods and services offered to the tax payers, because the
continuous fiscal benefits granting, aggravated by the fact that the neighbor
states will adopt the same instrument to attract corporations to their territory,
can lead to a "race to the bottom", where corporations benefit a lot, but the
competing states will often overestimate their capacity to postpone – or even
give up – tax revenues.
A natural consequence of less revenue is the deterioration of
public goods and fewer services to the citizens.
As for the expenditures, one important issue to be discussed is
the definition of clear competences among the three tiers of government. Action
is needed to avoid inefficient expenditures and excuses for not providing a
service. This is not part of the competition previously mentioned, but rather an
outcome. Every level of government tries to do their best within the budget, but
also counts on other levels in order to fulfill different needs of the tax payers.
The main idea is correct, but it has to be clear to all players – particularly to tax
payers – who are the providers of each public service or good, favoring
accountability.

26
4. THE ROLE OF FINANCE STATE SECRETARIATS IN THE ECONOMY: A
BRAZILIAN PERSPECTIVE
Having presented the most relevant concepts of federalism and
fiscal federalism, it is now possible to analyze and understand Finance State
Secretariats responses to economic issues.
Finance State Secretariat is usually called “Secretaria da
Fazenda” in Brazil – 24 out of 27 federative units use this terminology
(CONFAZ, 2012) and its most usual abbreviation is SEFAZ. Their duties can be
summarized saying that the Finance State Secretariat plays the role of
“treasurer” of state finances, primarily performing tax collection and expenditure
control (SEFAZ-SP, 2012).
State tax collection is based in three taxes, according to article
155 of the Brazilian Constitution (1988): (i) tax on property transmission causa
mortis and donations – ITCD or ITCMD – “imposto sobre a transmissão causa
mortis e doação, de quaisquer bens ou direitos”, (ii) tax on the circulation of
merchandise and interstate and intermunicipal transportation services and
communications – ICMS – “imposto sobre operações relativas à circulação de
mercadorias e sobre prestações de serviços de transporte interestadual e
intermunicipal e de comunicação”, and (iii) tax on property of automotive
vehicles – IPVA – “imposto sobre propriedade de veículos automotores”.
As a means to enlighten state options to raise tax collection,
Table 2 brings the representativeness of each of the state taxes for every
Brazilian state in 2011.

27
Table 2 – Tax revenue representativeness per state – 2011
State ICMS IPVA ITCMD Acre 94.2% 5.5% 0.2% Alagoas 94.3% 5.5% 0.2% Amapá 91.9% 8.0% 0.1% Amazonas 96.3% 2.9% 0.7% Bahia 95.0% 4.8% 0.2% Ceará 94.0% 5.4% 0.6% Distrito Federal 88.7% 10.6% 0.7% Espírito Santo 95.9% 3.9% 0.3% Goiás 93.1% 5.9% 1.0% Maranhão 94.1% 5.8% 0.2% Mato Grosso 94.6% 5.0% 0.4% Mato Grosso do Sul 94.7% 4.0% 1.2% Minas Gerais 90.2% 8.5% 1.3% Pará 95.0% 4.6% 0.3% Paraíba 94.9% 4.6% 0.4% Paraná 90.4% 8.8% 0.8% Pernambuco 95.0% 4.6% 0.4% Piauí 94.2% 5.5% 0.2% Rio de Janeiro 92.8% 5.7% 1.5% Rio Grande do Norte 94.5% 5.2% 0.3% Rio Grande do Sul 91.0% 7.8% 1.2% Rondônia 95.4% 4.5% 0.2% Roraima 93.5% 6.3% 0.2% Santa Catarina 92.0% 7.3% 0.7% São Paulo 89.8% 9.3% 0.9% Sergipe 95.0% 4.6% 0.4% Tocantins 92.6% 7.1% 0.4%
BRAZIL 91.7% 7.4% 0.9% Source: Author’s elaboration based on COTEPE (2012) data.
At a glance it becomes easy to understand why the ICMS is the
preferred tax to enhance tax collection, since representativeness is the key. But
there are two other factors that directly affect this option: (i) who pays the tax
and (ii) the political impact of the decision.
Although the citizen is the real tax payer in every taxed
operation, this is not very clear for tax payers in Brazil. The ICMS is known as a
tax paid by companies, simply because the true tax payer does not have to
collect it for the state. So, nevertheless paying ICMS whenever buying goods or
services, tax payers do not “feel” like they are the ones paying the tax included
in the price.

28
The second factor is a derivation of the first one. The IPVA is
due yearly, and it has to be paid by the person/company who has the property
of a vehicle. The same analysis fits the ITCMD, though not in a regular basis. It
means that changes in any of these two taxes, especially increasing their rates,
will largely affect the population – voters – and whoever is in charge might
become very unpopular.
On the other hand, when the government increases its revenue
through ICMS changes, companies might complain and eventually move out of
the state, in pursuit of better circumstances.
Consequently, states have to be creative when searching for a
solution to improve their results in tax collection as a means to offer better
public goods and services to the population, preferably without increasing
current rates. The next section will explore what Brazilian states are doing in
order to increase – and sometimes only preserve – their revenue.
4.1. Revenues and expenditures: how to maintain equilibrium without
overcharging taxes and offer adequate public goods and services
Summarizing the question of this section’s title, how does a
state increase its revenue without changing the rates of its taxes? It is pertinent
to remember that actions to increase state revenue have always been taken
towards ICMS, the reason why we will focus on this particular tax in this study.
For the purpose of increasing revenue, the state’s economy has
to grow. A convenient solution would be the establishment of more companies
in a short period of time. The actions to do so are controversial, because they
lead to fiscal competition.

29
In Brazil, fiscal competition is relatively new, as seen in previous
chapters, and it opened after the current Constitution was promulgated. Some
states, to prevail over others started to offer benefits for companies they were
interested in attracting to their states.
During the 1990’s, due to an agreement settled among
government, industry, car shops and workers union, the states started a race
among themselves to obtain automotive factories. The reason governments
tend to consider an automotive industry such a good investment derives from
the fact that when a company like Ford decides to manufacture its vehicles in a
determined location, all the systemists will follow the assembler and will
consume local goods, enhancing the economics of the region in at least three
manners: (i) the output of the factory, (ii) the indirect increase of output due to
the systemists, and (iii) the increase of income due to the skilled professionals
the industry requires.
The economic growth an automotive industry can bring to a
region is valid to other kinds of industries and some services, and the
development that comes with this growth is what governments are seeking. In
other words, state governments in Brazil understood that in the end they would
have economic growth, and as a side-effect tax revenue would increase.
Here the states analyzed their position in the market. For the
investing company, willing to expand its business, after deciding on country it
still had to settle the specific location of the factory. Although roads, railways,
ports and general infra-structure play a significant role in this strategic decision,
fiscal amenities might be the most debatable point, since states offer different
conditions in order to guarantee the investment.

30
The next question in this scenario should be which states can
compete in this market? Figure 2 presents the ICMS share of Brazilian regions
in 1997.
Figure 2 – ICMS tax revenue per region – 1997
Tax Revenue per Region - 1997
4%13%
61%
15%7%
NORTH NORTHEAST SOUTHEAST SOUTH CENTRAL-WEST
Source: COTEPE/ICMS - Boletim do ICMS e demais impostos estaduais (1997).
Analyzing the diagram, it is possible to infer that regions
Southeast, South and Central-West would be better equipped for a fiscal
competition. Considering they had a higher share of the ICMS, it could be
interpreted they had less budget vulnerability (more money) and more
willingness to forgo revenue at that moment as a means to assure a better
position in the future.
All this arguments have been shown as if the states were a free
market competing for companies’ investments. That is not true. As seen in
section 2.2 of this paper, there are regulations from CONFAZ that limit the
power of states in conceding fiscal benefits. But there are no clear punishments
for those that disobey their rules and the case is now for the Supreme Court to
decide.

31
All in all, it is reasonable to conclude that the states are quite
interested in increasing their revenue, but this is only one side of the story. Why
do governments emphasize revenue so much, if they could also take measures
to reduce their expenditure?
The answer is that reducing expenditure usually implies
reducing the offer of public goods for the population, and this is not an
affordable outcome for politicians, who depend on popular vote and public
opinion.
There have been some budget cuts recently, in areas that can
deal with it without compromising the quality or the quantity of public services,
but it always represents a political friction to decide which Secretariat is going to
give up resources in order to achieve the target budget.
4.2. Externalities that affect forecast numbers
After a budget is approved by the legislators, it is the Finance
Secretariat’s responsibility to make it happen, controlling and centralizing all
revenues and expenditures, as well as executing the payments for the
expenses each organ has approved and verified.
A forecast is always a number used to set the direction of the
expenditure, but major changes due to externalities can turn the whole budget
upside down, and thus, the forecast becomes suitable for a revision.
An example is the change in the electric energy policy that has
been recently announced by President Rousseff, which aims to reduce its
current price in up to 20%. Excellent for consumers, but this means states need

32
to re-estimate their tax revenues. In the state of Paraná, for instance, this sector
represented almost 15% of the ICMS revenue in 2011.
Other changes in the market can also impact tax revenues.
During the financial crisis of 2008 many jobs were lost, and less income means
less consumption, which in turn leads to less output and higher prices. This
way, taxes are affected in a similar proportion to sales, and the government
eventually tries to intervene for the purpose of stopping this cycle.
Whenever any of the reported events happen, independent of
its origin, the governments have to consider their options and weigh the
consequences. Two different approaches will be explored in the next section:
technical and political.
4.3. Decisions on budget: technical approach x political approach
The technical approach to an extraordinary situation, as the
examples on section 4.2, will provide data to subsidize decisions. Government
bureaucrats may also indicate alternative lines of action. The problem is that
technical decisions tend to use the alternative which has the best numerical
outcome, regardless of other possible implications.
As the final decision on fiscal policies comes from the
Governor, assisted by their Finance Secretariat, the information has to cover a
wide range of subjects, such as the effects the new fiscal policy might have, for
tax payers, on employment, output, demand, and supply; and for the
government, on revenue and expenditures. It means several departments will
get involved in the formulation of this kind of public policy. For example, the

33
Finance State Secretariat of Paraná has the following departments to cope with
this task:
– “Coordenação da Receita do Estado” – CRE – State Revenue
Coordination. This is the department responsible for tax administration,
collection and auditing. It prepares tax regulations to send to the Legislative,
controls the revenue, looks after the interaction between tax payers and
authorized banks to collect taxes, monitors the companies based on indicators
of fiscal fraud and eventually audits them. Regarding the budget, the State
Revenue Coordination provides data and forecasts on the state taxes. Its
mission is to “execute tax administration with integrity, enforcing the legislation
in order to have an adequate tax collection” (CRE, 2012).
– “Coordenação da Administração Financeira do Estado” –
CAFE – State Financial Administration. This department’s duties towards the
budget include forecast of all non-tax revenues and the compilation of the
expenditures. It also manages the Executive branch payments and the payroll
of the whole government.
– “Coordenação de Assuntos Econômicos” – CAEC –
Economic Issues Coordination. Regarding budget, the Economic Issues
Coordination is responsible for federal intergovernmental transfers forecast.
This department takes care of the relationship between state and potential
investors, remarkably those interested in fiscal benefits. After a company
formalizes its intention, the Economic Issues Coordination proceeds to an
economic analysis to subsidize the decision on whether granting or not the
benefits. It is also responsible for the “Fundo de Participação dos Municípios” –
FPM – Municipalities Participation Fund. This fund receives 25% of the ICMS

34
revenue to be redistributed to municipalities according to Law 9491/90 (Paraná,
1990). The value added in operations with ICMS is the most representative item
to obtain the ratio of participation.
The Finance Secretariat works along with other Secretariats to
carry out the economic strategy of the state. Continuing with the example of
Paraná, the Budget and Programming Coordination of the Planning Secretariat
– “Coordenação de Orçamento e Programação da Secretaria de Planejamento”
– is the department responsible for planning and executing the budget, putting
together all Secretariats actions and financial information provided by Finance
Secretariat.
With reference to development issues, the “Secretaria de
Indústria e Comércio” – Industry and Commerce Secretariat – seeks companies
interested in expanding operations in Brazil and endeavors to provide
assistance in order to reach an agreement of investment in the state.
There are certainly many other institutions involved in this
process, but the intention is to demonstrate the Finance Secretariat role in the
economy of the state. Nevertheless, it was necessary to mention these two
other secretariats due to the narrow link they have with the Finance Secretariat.
The decision on how to deal with economic issues will evince
the manner a government manages its share of responsibility to stimulate
economic growth. The ICMS gives state governments at least three different
tools to induce this outcome: (i) tax reduction, (ii) presumptive credit, and (iii)
postponed tax revenue.
Tax reduction is quite simple and depends basically on altering
the legislation to benefit a specific set of industries or services. The Legislative

35
branch undoubtedly endorses it, because the proposed legislation is
sympathetic to investors – and sometimes to established companies –, and
aims at developing the state.
Presumptive credit is a more complicated instrument and
depends on various studies to confirm the amount of credit that should be
offered. It became a common tool for the fiscal war, but it might start chain
reactions – neighbor states can adopt a similar legislation to prevent that
companies in its territory are hurt by the advantage given by the first state, and
to avoid the departure of firms to that state. The use of this strategy may lead
the states to a “race to the bottom”, as reviewed in section 3.2, deteriorating tax
revenue.
One problem in adopting either of these two strategies is that
they do not meet CONFAZ requirements, and might even be considered illegal.
Another point to be taken into consideration is that states do not permit the
publishing of details on these benefits, what makes it virtually impossible to
obtain reliable data, even for a theoretical exercise.
The third strategy is postponing ICMS revenue, therefore giving
time for a new company to recoup its investment. This strategy is usually
followed through after a formal approval of CONFAZ, which analyzes the
program and verifies whether its contents do not hurt the federal pact.
The main objective of this article is to explore whether these
incentive programs that postpone ICMS revenue bring the expected outcome to
the state: increase in GDP, ICMS revenue and level of employment. The next
chapter will present the case study of Paraná.

36
5. FISCAL INCENTIVES: STATE OF PARANÁ CASE STUDY
Rodrigues (1998) presented one of the first studies about the
subnational governments’ relevance for Brazilian economic growth towards
decentralization, and indicated seven states as the ones which received most
investment after the monetary stabilization – 1994/1995 – Bahia, Ceará, Minas
Gerais, Paraná, Rio de Janeiro, Rio Grande do Sul, and São Paulo.
5.1. Fiscal incentive programs from 1996 to 2010 in Paraná
The State of Paraná launched its first structured fiscal incentive
program in 1992, named “Bom Emprego” – Good Employment, and it was
based on postponing a significant installment of the due ICMS in order to grant
industries cash flow for their expansion. It is worth remembering that companies
could only postpone incremental ICMS, i.e., if they were already established in
Paraná, only the increase of due tax would be affected by the benefit.
The amount of ICMS companies could postpone, as well as the
percentage of incremental tax, were defined according to a list of municipalities
given by the state government. The intention was to decentralize
industrialization, thus offering better benefits for unindustrialized areas as an
attempt to encourage investments in the poorer areas of the state.
Focusing again on employment, the next program was “Paraná
Mais Emprego” – Paraná More Employment –, in 1995, with similar rules. With
a wider ambition, the Prodepar “Programa de Desenvolvimento Econômico,
Tecnológico e Social do Paraná” – Program of Economics, Technological and
Social Development of Paraná –, in 2001, brought its scope in its name. And in

37
2003, the “Bom Emprego” was restored – with some improvements and minor
changes – and lasted until 2010.
Based on the Decree 630/2011, which implemented the current
fiscal incentive program “Paraná Competitivo” – Competitive Paraná –, it is
possible to offer some details that most of the depicted programs had
employed:
“The program aims to attract investment, generate
employment and income, and promote regional
decentralization and environmental preservation,
induced by industrial development of the state. It
is designed for industrial companies already
settled or intending to settle in Paraná with the
commitment of accomplishing a permanent
investment.” Paraná (2011)
This excerpt of the first article sets the objectives of the program
as well as limits to the kind of companies able to benefit from it. The investment
mentioned refers to the amount of capital invested during the twenty-four
months prior to the beginning of the benefit fruition. The amount invested is also
the limit of incremental ICMS to be postponed.
The incremental ICMS is any ICMS due above the average of
the previous twelve months, so it means the company has to increase the
output after the investment in order to enjoy the benefit.
Nevertheless, if the company accomplishes a new investment
after the beginning of the benefit fruition, the new amount invested can also be
authorized as part of the program, but new limits will be drawn as previously
described.
The fiscal benefit postpones part of the company’s incremental
ICMS – from 10% to 90%, depending on government technical analysis, e.g.,
whether there is a competitor to the good the company will produce – for a

38
period from two to eight years. The first installment is paid on the regular due
date and the second installment is paid after the grace period described. This
authorized “tax collection delay” ensures companies a better cash-flow, right
after completing an investment, avoiding the need to resort to loans in the
market.
This program also brings social requirements for the
companies. The companies cannot reduce labor force during the whole period
of the program and they are obligated to invest part of the benefit granted – up
to 5% – in qualification programs for its employees.
Although all these programs aimed at economic development,
its critics could see them as an attempt of increasing ICMS revenue, which is
considered by programs’ defenders as a long-run side effect of the economic
growth – that had only been achieved due to the programs.
Table 3 brings some valuable information to compare regional
GDP performances.
Table 3 – Region Participation (%) on Gross Domestic Product 1995 – 2009
Region 1995 1996 1997 1998 1999 2000 2001 2002 2003 2004 2005 2006 2007 2008 2009
North 4,2 4,3 4,1 4,2 4,2 4,4 4,5 4,7 4,8 4,9 5,0 5,1 5,0 5,1 5,0
Northeast 12,0 12,5 12,5 12,4 12,4 12,4 12,6 13,0 12,8 12,7 13,1 13,1 13,1 13,1 13,5
Southeast 59,1 58,4 58,5 58,2 58,2 58,3 57,7 56,7 55,8 55,8 56,5 56,8 56,4 56,0 55,3
South 16,2 16,2 16,1 16,2 16,4 16,5 16,7 16,9 17,7 17,4 16,6 16,3 16,6 16,6 16,5
Central-West 8,4 8,6 8,8 9,0 8,8 8,4 8,5 8,8 9,0 9,1 8,9 8,7 8,9 9,2 9,6
Brazil 100,0 100,0 100,0 100,0 100,0 100,0 100,0 100,0 100,0 100,0 100,0 100,0 100,0 100,0 100,0
Source: IBGE (2012a).
Considering the fiscal competition that began in the mid-1990s,
it is possible to detect that the Southeast region, the most developed one in the
country, lost 3.8% of its participation in Brazilian GDP during the 15-year period
analyzed, which represented a decrease of 6% in relative terms from 1995 to
2009.

39
The South region, where Paraná is located, had a minor
variation in participation, with an increase of 0.3% (16.2% to 16.5%), or an
augment of 2% when comparing the 2009 results with the achievements of
1995.
The other regions had a better relative increase in their
participation: the North grew 19% (from 4.2% in 1995 to 5.0% in 2009), the
Central-West grew 14% (from 8.4% in 1995 to 9.6% in 2009) and the Northeast
grew 12% (from 12.0% in 1995 to 13.5% in 2009).
These data does not allow drawing a conclusion about the
efficiency of the programs because they are aggregated by region, but they help
understand the decentralization movement that happened in Brazil after the
monetary stabilization.
As a means to go deeper in the analysis, Figure 3 shows a
comparison between the aggregated GDP growth of Brazil and Paraná.
Figure 3 – Brazil and Paraná GDP growth – 1995-2009 (basis 1995 = 100)
100
110
120
130
140
150
160
GD
P g
row
th i
nd
ex
1995 1996 1997 1998 1999 2000 2001 2002 2003 2004 2005 2006 2007 2008 2009
Year
Brazil Paraná
Source: Author’s elaboration based on IBGE (2012a) data.

40
It is remarkable that the State of Paraná maintained a
consistent higher level of growth than Brazil up to 2004, when the gap started
shortening. A possible explanation to that is the increasing number of states
that adhered to fiscal competition. Another data that is clearly significant is that
the amount of money invested in the period between 2003 and 2010 was barely
equivalent to the amount invested in 2011 alone, when the new program
“Paraná Competitivo” – Competitive Paraná – took place.
A possible effect of the programs can be seen in 2009, when
Brazil suffered its first decrease in GDP in many years. The state suffered a
more intense impact due to the cut in investments derived from the financial
crisis of 2008.
While this comparison gives Paraná’s programs some credit, it
is also necessary to test their performance against similar states. Independent
of on what level these states entered the fiscal competition, they were chosen
based on the similarity of participation in GDP. For this analysis the Federal
District was not considered due to its very specific situation – no industries at all
and the highest income per capita in the country because of the concentration
of high level public employees.
The selected states are, based on GDP participation in 2009:
Rio de Janeiro (10.9%), Minas Gerais (8.9%), Rio Grande do Sul (6.7%), Bahia
(4.2%), Santa Catarina (4.0%) and Goiás (2.6%) – the first three immediately
above Paraná’s participation (5.9%) and the last three immediately below.
Figure 4 shows the evolution of their participation in Brazilian GDP and Figure 5
presents the aggregate growth curve for these states, allowing for a visual
comparison of their performances (basis 1995 = 100).

41
Figure 4 – Participation in Brazilian GDP, selected states – 1995-2009
(basis 1995 = 100)
0%
2%
4%
6%
8%
10%
12%
14%
1995 1996 1997 1998 1999 2000 2001 2002 2003 2004 2005 2006 2007 2008 2009
Year
Par
tici
pat
ion
in
Bra
zili
an G
DP
Rio de Janeiro
Minas Gerais
Rio Grande do Sul
Paraná
Bahia
Santa Catarina
Goiás
Source: Author’s elaboration based on IBGE (2012a) data.
Figure 5 – GDP growth, selected states – 1995-2009 (basis 1995 = 100)
100
110
120
130
140
150
160
170
180
1995 1996 1997 1998 1999 2000 2001 2002 2003 2004 2005 2006 2007 2008 2009
Year
GD
P g
row
th i
nd
ex
Rio de Janeiro
Minas Gerais
Rio Grande do Sul
Paraná
Bahia
Santa Catarina
Goiás
Source: Author’s elaboration based on IBGE (2012a) data.
The analysis of Figures 4 and 5 allows at least two inferences:
(i) it is very difficult to move significantly upwards in GDP participation, despite
the efforts conducted by states (or maybe because their group efforts have
nullified their individual endeavors), and (ii) the bigger the state’s share on the
graph, the harder to consistently maintain an elevated GDP growth ratio.

42
Paraná’s performance, when compared to the selected states,
lies close to average. It might mean that the enhancement of fiscal competition
made it difficult for the state to keep a continuous high performance in GDP
growth. But it is arguable how the state of Goiás managed to grow so much
above its competitors. The difference could be partially explained by the GDP
participation of the state, the smallest one among the selected states.
5.2. Analysis: GDP x Tax Revenue
Having presented the most relevant data about GDP and
comparisons with similar states, it is now necessary to analyze the performance
of the tax used for the competition – the ICMS –, how its behavior has been
affected and the outcome for state budget and strategic planning.
The ICMS data used in this section cover the period from 1997
to 2011. The restraint of the research period is due to the last major
modification in ICMS legislation, the “Lei Kandir” (“Lei Complementar 87/1996”)
– Kandir Law –, named after the Planning Minister at the time. The law
prohibited states from taxing exports of primary products and semi-
manufactured products or services and caused considerable damage to the
ICMS revenue of some them. There was a temporary compensating fund to
help states adjust to the new situation, but the states lobby has managed to
postpone its end repeatedly – and there is no forecast to bring it to closure yet.
Table 4 presents a participation comparison among Brazilian
regions regarding ICMS revenue.

43
Table 4 – Region Participation (%) on ICMS revenue 1997 - 2011
Region 1997 1998 1999 2000 2001 2002 2003 2004 2005 2006 2007 2008 2009 2010 2011
North 4,5 4,3 4,1 4,5 4,7 4,9 5,2 5,3 5,5 5,6 5,6 5,6 5,6 5,7 5,6
Northeast 13,1 13,7 13,5 13,8 13,8 14,4 14,3 14,6 14,6 15,1 14,8 14,4 14,8 15,1 15,1
Southeast 60,5 60,3 59,7 58,7 58,1 56,5 54,8 54,9 54,6 55,0 55,5 55,9 55,2 55,2 54,6
South 14,9 15,1 15,3 15,5 15,9 16,3 17,1 16,4 16,7 15,8 15,5 15,5 15,7 15,6 15,9
Central-West 7,0 6,6 7,3 7,4 7,5 7,9 8,5 8,8 8,6 8,4 8,6 8,6 8,7 8,4 8,7
Brazil 100,0 100,0 100,0 100,0 100,0 100,0 100,0 100,0 100,0 100,0 100,0 100,0 100,0 100,0 100,0
Source: Author’s elaboration based on COTEPE (2012) data.
The behavior of the ICMS participation over the years is exactly
the same as the one shown by the evolution on GDP participation – Table 3 –
with a slightly bigger decrease for the Southeast region (-10%), and
consequently a better performance of other regions which increased their
participation as follows: North (25%), Central-West (25%), Northeast (15%) and,
South (7%). All percentages reflect the relative change on regions participation
in ICMS revenue.
As a means to facilitate the comprehension of the relation
between the variables – GDP participation and ICMS revenue participation –
Table 5 brings the relative growth obtained in both cases.
Table 5 – ICMS participation growth and GDP participation growth – 2011/1997
Regions ICMS growth GDP growth North 25,4% 19,3% Northeast 15,1% 12,2% Southeast -9,7% -6,4% South 6,5% 2,1% Central-West 25,2% 14,1%
Source: Author’s elaboration based on COTEPE (2012) and IBGE (2012a) data.
Following the same line of analysis enacted with GDP, Figure 6
demonstrates a comparison of ICMS revenue growth between Brazil and
Paraná.

44
Figure 6 – Brazil and Paraná ICMS revenue growth – 1997-2011 (basis 1997 = 100)
75
100
125
150
175
200
225
250
ICM
S r
even
ue
gro
wth
in
dex
1997 1998 1999 2000 2001 2002 2003 2004 2005 2006 2007 2008 2009 2010 2011
Year
Brazil Paraná
Source: Author’s elaboration based on COTEPE (2012) data.
The perception that the pattern is the same as the one
previously seen in GDP growth is quite appropriate, with two caveats: (i) the
effect of the financial crisis influenced 2009 ICMS revenue due to the lag
between production decrease and the respective tax payment and (ii) Paraná
has apparently regained its growing pace throughout 2011, increasing the
difference between its revenue growth and the country’s aggregated ICMS
revenue growth.
Notwithstanding the fact that the indexes reflect different time
periods (GDP from 1995 to 2009 and ICMS revenue from 1997 to 2011), it is
fairly easy to notice that ICMS revenue grew at a much faster pace than GDP. It
means the states profited more in tax revenue than the outcome of economic
growth could have produced.

45
It is possible to argue that both indexes should follow the same
tendency. Further investigation shows that the divergence is due to several tax
legislation changes the states implement to manage increasing expenditures. It
might signify the expansion of the government size or a decrease in the
efficiency of the public sector.
The same states compared in section 5.1 will be analyzed
under the focus of ICMS revenue aggregate growth. Before the evaluation of
this index, it is worthwhile to verify what their participation in ICMS revenue in
2011 was: Minas Gerais (9.7%), Rio de Janeiro (8.3%), Rio Grande do Sul
(6.5%), Bahia (4.4%), Santa Catarina (4.1%) and Goiás (3.3%) – the first three
immediately above Paraná participation (5.3%) and the last three below Paraná
performance.
An observation deserves to be made Pernambuco, also with a
participation of 3.3% in aggregate Brazilian ICMS revenue but somewhat higher
than Goiás would be the sixth state to be compared with Paraná if the same
criteria of section 5.1 had been adopted. It was chosen to maintain the same
states of the GDP comparison.
Figure 7 shows the evolution of selected states participation in
Brazilian aggregate ICMS revenue.

46
Figure 7 – Participation in Brazilian ICMS revenue, selected states - 1997-2011 (basis 1995 = 100)
0%
2%
4%
6%
8%
10%
12%
1997 1998 1999 2000 2001 2002 2003 2004 2005 2006 2007 2008 2009 2010 2011
Year
Par
tici
pat
ion
in
Bra
zili
an I
CM
S r
even
ue
Rio de Janeiro
Minas Gerais
Rio Grande do Sul
Paraná
Bahia
Santa Catarina
Goiás
Source: Author’s elaboration based on COTEPE (2012) data.
Two comments are deemed necessary about Figure 7. First,
differently from Figure 4 that showed an almost steady participation in Brazilian
GDP over time, in ICMS revenue states' participation presents a “dispute”
between Rio de Janeiro and Minas Gerais. The result is that Minas Gerais has
a higher participation in ICMS revenue than Rio de Janeiro, in spite of converse
positions in GDP participation.
Besides that, it is noticeable that three states grew in
participation in 2011 compared to 2010: Paraná, Santa Catarina and Goiás.
Considering the fact this diagram only contemplates participation, there is not
enough information to understand its behavior.
Figure 8 will provide a better understanding about the evolution
of each state by presenting the aggregate ICMS revenue growth (basis 1995 =
100).

47
Figure 8 – ICMS revenue growth, selected states – 1997-2011 (basis 1995 = 100)
75
100
125
150
175
200
225
250
275
1995 1996 1997 1998 1999 2000 2001 2002 2003 2004 2005 2006 2007 2008 2009
Year
ICM
S r
even
ue
gro
wth
in
dex
Rio de Janeiro
Minas Gerais
Rio Grande do Sul
Paraná
Bahia
Santa Catarina
Goiás
Source: Author’s elaboration based on COTEPE (2012) data.
Figure 8 helps understand that the four states that lost
participation in 2011 – Rio de Janeiro, Minas Gerais, Rio Grande do Sul and
Bahia – had actually had an increase in ICMS revenues, though a less
meaningful one than Paraná and, especially than Santa Catarina and Goiás.
With regard to Paraná’s increase, it has already been
mentioned that a possible cause of the increase in GDP, and perhaps in ICMS
revenue, might be the current program to attract investments, “Paraná
Competitivo”.
The performance of Santa Catarina and Goiás certainly
warrants them a deeper study, which unfortunately cannot be performed in this
paper due to its focus on Paraná.
5.3. An analysis of expected outcome
As most government interventions in the economy, the
incentive programs described are expected to increase the employment level of
that government – specially these ones, who bring in their names the intention
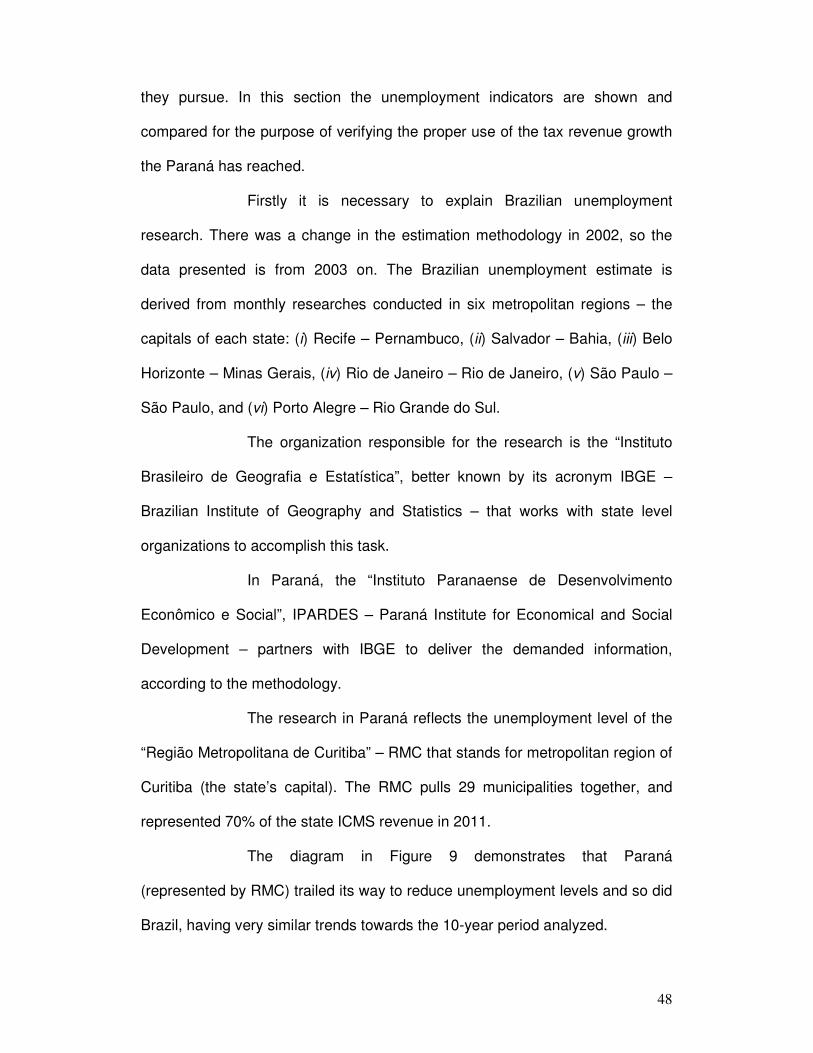
48
they pursue. In this section the unemployment indicators are shown and
compared for the purpose of verifying the proper use of the tax revenue growth
the Paraná has reached.
Firstly it is necessary to explain Brazilian unemployment
research. There was a change in the estimation methodology in 2002, so the
data presented is from 2003 on. The Brazilian unemployment estimate is
derived from monthly researches conducted in six metropolitan regions – the
capitals of each state: (i) Recife – Pernambuco, (ii) Salvador – Bahia, (iii) Belo
Horizonte – Minas Gerais, (iv) Rio de Janeiro – Rio de Janeiro, (v) São Paulo –
São Paulo, and (vi) Porto Alegre – Rio Grande do Sul.
The organization responsible for the research is the “Instituto
Brasileiro de Geografia e Estatística”, better known by its acronym IBGE –
Brazilian Institute of Geography and Statistics – that works with state level
organizations to accomplish this task.
In Paraná, the “Instituto Paranaense de Desenvolvimento
Econômico e Social”, IPARDES – Paraná Institute for Economical and Social
Development – partners with IBGE to deliver the demanded information,
according to the methodology.
The research in Paraná reflects the unemployment level of the
“Região Metropolitana de Curitiba” – RMC that stands for metropolitan region of
Curitiba (the state’s capital). The RMC pulls 29 municipalities together, and
represented 70% of the state ICMS revenue in 2011.
The diagram in Figure 9 demonstrates that Paraná
(represented by RMC) trailed its way to reduce unemployment levels and so did
Brazil, having very similar trends towards the 10-year period analyzed.

49
Figure 9 – Monthly unemployment rate in Brazil and Paraná – 2003-2012
2
4
6
8
10
12
14
jan/0
3
mai/
03
set/0
3
jan/0
4
mai/
04
set/0
4
jan/0
5
mai/
05
set/0
5
jan/0
6
mai/
06
set/0
6
jan/0
7
mai/
07
set/0
7
jan/0
8
mai/
08
set/0
8
jan/0
9
mai/
09
set/0
9
jan/1
0
mai/
10
set/1
0
jan/1
1
mai/
11
set/1
1
jan/1
2
mai/
12
set/1
2
Month
Un
emp
loym
ent
(%)
Brasil Paraná (RMC)
Source: Author’s elaboration based on IBGE (2012b) and IPARDES (2012) data.
The peaks and troughs behavior of Brazil and Paraná curves
are very similar throughout the diagram, but the last three months show a
different trend. It might be an exception, but it is worth to take notice of this
result and follow it up in the next months.
Considering full employment rate as the unemployment rate
consistent with stable inflation (OECD, 2000), it is possible to make a
comparison. McLaughlin (2012) wrote about the Federal Reserve forecasts for
the US GDP growth and unemployment rates (estimated to be 6.4% by the end
of 2015), and mentioned that the calculation assumed a 5.6% full employment
rate.
Using the assumption of 5.6%, Brazil would have been near a
full employment level for the past twelve months reaching a maximum
unemployment rate of 6.2% in March 2012. The state of Paraná, in the same
scenario, would have been above full employment level for the last time in
August 2009.

50
A study driven by the “Instituto de Pesquisa Econômica
Aplicada”, IPEA (2012) – Institute for Applied Economic Research – agrees that
Brazilian economy has important changes in course, and that unemployment
rates have been falling consistently, but alerts that Brazil is still not close to its
full employment level.
It does not seem possible to attribute the evolution of
unemployment rates in Paraná to the fiscal benefit programs, especially
because the decrease was similar to the country’s performance. A caveat must
be made on account of the restricted data (from 2003 to 2012), after all, six
years - out of fifteen - of the GDP data analyzed could not be matched.
As for the opportunity cost the state incurred into, it is widely
debatable. As previously seen, the programs are built on postponing tax
payments. As these credits would not happen if companies decided not to
invest, it is not clear whether the state has given up revenue as a means of
attracting companies – otherwise there would not be revenue to postpone at all.
The detractors of this kind of program insist the government
should have made better use of tax payers’ money, instead of granting
conditions for companies to establish themselves in the state. On the other
hand, the defenders say that Paraná’s GDP and employment would be
shrinking if the programs had not taken place.

51
6. ECONOMIC THEORIES APPLIED TO THE CASE STUDY
After the exposition of federalism concepts and its relation to
fiscal affairs and the information about the procedures subnational governments
are putting in motion in Brazil, it is proper to analyze the tax incentive programs
under the optic of the economic schools of thought.
6.1. Economic theories
Taking into consideration the divergences and the quantity of
schools of thought existing in economics, it is necessary to narrow the scope for
this analysis. Not disregarding the importance of the social economists like Max
Weber, who Peukert exalts (2004) as “undoubtedly one of the most fascinating
and important social scientists of the last century” – although Schumpeter
(1920, apud Peukart, 2004) states that “he was an eminent sociologist and at
best secondarily an economist” – the intention is not to cover the history of
economics, but the main ideological work on which our society has been built
on.
Having said that, the focus of this analysis will lie on Classical
and Keynesian approaches to economic issues. A milestone for this discussion
is Smith (1776) who proposed the division of work as a means to increase
productivity and enrich the country. One of Smith’s main ideas came to be
synthesized years later by Say’s Law: supply creates demand.
Particularly in the matter of international trade, Smith (1776) is
explicit in noticing that a country should benefit from buying commodities
wherever they were cheaper, even if it meant buying from another country.

52
This beginning of the capitalist thought lead countries to pursue
increasing output in order to obtain net exports surplus. There are five reasons
why countries want to trade, according to Suranovic (2010): (i) differences in
technology, (ii) differences in resource endowments, (iii) differences in demand,
(iv) the existence of economies of scale in production and, (v) the existence of
government policies. To the case study under analysis, all those reasons can
be applied, especially when a company is pondering where to invest in a new
facility.
The evolution of classical economic thought continued until an
opponent to the mainstream brought his discourse to place. John Maynard
Keynes, although agreeing on many points with the classical economists,
introduced the idea of wage and price rigidity (ABEL et al., 2011).
The classical view of economics believes that, in the long run,
markets will clear by rapidly adjusting wages and prices. So, in the case of a
supply shock that reduces output, prices increase and, therefore, demand
decreases. Whatever the cause might have been, an expected solution would
come – a technological breakthrough – and the shock on the supply side would
lead to the opposite direction of the first one. The repetition of this pattern
explains the classical business cycle.
Most importantly, according to the classical economists, all
these peaks and troughs in the economy of a country would occur naturally,
what means the market should oscillate freely and eventually accept the
business cycles outcome as a routine.

53
One of Keynes most famous remarks is “in the long run we are
all dead” (Wapshott, 2011), in an attempt to defend his idea of the government
intervening in the economy because of the immediate results it could generate.
This idea could be based on the concept of Adam Smith’s
“invisible hand”. One possible interpretation to this concept is that there are
regulations to be followed. Here, the separation between Keynes and the
classical theory becomes clear: while the classical school believed the invisible
hand was the power the markets had to self-regulate, Keynes saw the
government as the invisible hand.
It is indispensable to notice that Keynes was not an
interventionist by definition, but he considered almost mandatory that the
government intervenes to stand up for the economic growth of the country,
mainly by stimulating consumption – regardless of the debt that these measures
could lead to. It is consistent with no concern at all to the long run.
Click (2012) explains that an optimal approach would merge
these two schools of economic thought and produce a more appropriate
approach to contemporary economic issues.
An option could be the implementation of the Keynesian
thought in the short run, imposing a shock in the economy and after its effects
start being noticed, gradually withdrawing, thus impeding the malefic side
effects of intervention from reaching a prohibitive cost to the country.
The complete withdrawal of intervention should allow free
markets to take over the economic growth in the long run. It would avoid the
risks of government failure in driving the economy and becoming defaulting with
its obligations.

54
6.2. Do economic theories justify the decisions taken by government to
increase GDP and VAT revenues?
Remembering that the motivation for states to enter fiscal
competition is generating jobs and guaranteeing economic growth, the
economic schools of thought analyzed in the previous section are deemed
adequate for supporting this study.
The case study of Paraná presented in Chapter 5 represents a
clear interference of the state government in the market. The questions to be
answered are: (i) why is the government granting the benefits, (ii) how does it
affect the market, and (iii) how long do the benefits last.
Why is the government granting benefits? The reason is the
interest of the community, because it allegedly guarantees a higher employment
rate and sustained economic growth.
The results obtained in Chapter 5 do not support this
hypothesis, but the data also demonstrates that the state of Paraná kept its
growth at least at the same velocity of the country average, after having a jump
start – the state was amongst the first ones to offer structured programs to
attract companies.
According to the classical school the programs should never
have been launched, since they deviate the natural course of choice for
investments. It means the company is losing because it has given up the
optimal location for a new facility in favor of fiscal benefits. The government is
losing because it is providing money for an activity that apparently is not one in
which the state has a comparative advantage – otherwise no benefits would be

55
necessary. The tax payers are losing because their money might have been
misused if the government is not making the best decisions on how to spend it.
From a classical stand point, the arguments against benefit
programs are: (i) the commitment of the company is not with the state, but with
the fiscal benefit, i.e., it lasts as long as the program, (ii) the company is likely to
become recurrent in its pledges for more benefits – even threatening to remove
its facilities from the state, and (iii) the cost to sustain such benefits shares the
same revenue existent to provide public goods and services, so either the
government diminishes its expenditures – resulting in worse conditions for the
community – or it increases the debt in the long run, which can turn into an even
worse problem than facing the natural ups and downs of the economy.
Keynesians in their turn would defend the programs based on
the follow arguments: (i) if no action had been taken, the indicators obtained by
the state would have been worse off – the indicators are actually above national
average, and (ii) there is no real cost for the state, because it is simply
postponing a revenue it would not have if the program had not taken place.
Furthermore, Keynesians would likely recommend the increase
of benefit programs to stimulate economic activity that could maintain a full
employment rate and further increase economic growth.
How do benefits affect the market? Considering the market
simply as the place where buyers and sellers meet to make business, whenever
a third party takes actions to drive it – an externality – there will be winners and
losers.
If this is a positive externality (i.e., social benefits are greater
than social costs) the community will be better off. As seen in the analysis so

56
far, the beneficiaries of the programs are the companies which enter the
programs, leaving for society the cost of its maintenance. So it is definitely a
negative externality.
This distortion would be condemned by the classical
economists because it interrupts free market trade favoring a particular
economic group. They believe companies that cannot compete in the market
should be shut down, and the resources – labor, capital and land – must be
reallocated to an industry in which the state has a comparative advantage.
Keynesians could understand this negative externality as a
trade-off – if the economy had not had the incentive with the programs, workers
would lose their jobs and would not have either public goods or income to
spend, slowing down growth and eventually falling into a recession. So, a better
scenario is presented with the incentive programs.
How long do the benefits last? Depending on the program, the
usual period of fruition is from four to eight years. Some exceptions might go
over this period, mainly due to the pressure companies exert to have more and
more time to enjoy the benefits. The programs do not always prevent
companies that are already in an old program from entering a new one – they
may even assure that a company can transfer from the prior program to the new
one, granting them a new deadline for the benefits.
Once again, the classical economists would be concerned
about the results in the long run, and Keynesians on the other hand would
applaud this government initiative. The discussion that follows is based on the
same arguments already presented.

57
It is pertinent to remember the concept introduced in this
chapter of pursuing a different approach to this subject that would merge the
Classical School concerns with the long run with the Keynesian interventions
applied only in the short run. This approach could become both budget efficient
and beneficial for the community.
The analysis provided arguments that lead to the conclusion
that classical economists would not approve the incentive programs Paraná has
been putting in action for the past 20 years. Keynesians would praise it as the
reason why Paraná held its position and its share in GDP participation.

58
7. CONCLUSION
This paper has reached its main goal by bringing to a wide
open discussion the merits of fiscal incentives of postponing tax revenue as a
means to attract companies to the state of Paraná, in a context where fiscal
competition among Brazilian states gets stronger every day. The arguments
have been presented in Chapters 4, 5 and 6. The secondary goals – data
comparison on GDP, ICMS revenue and unemployment rates – were discussed
in Chapter 5.
Classical economists’ analysis presented in Chapter 6 about
fiscal incentive programs assumes that they would stand against the fiscal
incentive program because it represents an intervention in the market.
Nevertheless, some modern Classicals can see the fiscal competition among
the states as a good thing, as long as it does not bring previously unnoticed
distortions to the market. In the Brazilian case it is difficult to determine the
current distortions origin due to the scenario of complex legislation regarding
fiscal issues.
7.1. Final considerations
The study showed that it is possible to analyze fiscal incentives
in different ways such as the economical, budgetary, and social standpoints.
Although the information brought here covers only a specific
kind of incentive, it paves the way to further analysis of the fiscal benefits given
by states in order to enhance their economies, basically aiming at GDP growth
and a full employment rate.

59
Paraná, given the numbers presented in Chapter 5, is doing a
little above the average. It grew faster than Brazil in the late 1990’s, faced a
decrease in the economic acceleration in the middle of the 2000’s and has been
keeping a similar pace ever since. As previously mentioned, the absence of the
incentive programs could have decreased its participation in Brazilian GDP and
its employment rate.
In comparison to other states, Paraná had an average result in
GDP growth, because some states with similar or larger economy size
managed to achieve better results.
As for the ICMS growth, Paraná had a good outcome, behind
Santa Catarina and Goiás, the smaller states present in this study. Part of this
result demonstrates the increasing efficiency of the State Revenue Coordination
in preventing tax evasion, as the GDP growth had not presented results to
support the ICMS revenue growth.
The unemployment rate comparison faced a restriction due to
the period of data gathering – from 2003 on with the current methodology. It
prevents a comparison based on the period the incentive programs began to be
granted. Nevertheless, the period evaluated showed that Paraná and Brazil are
sharing the same trend – decreasing unemployment rates. The state of Paraná
managed to maintain an average unemployment rate 2.7% smaller than Brazil
along the years.
The results presented here allow the assumption that fiscal
incentives might be good for states that do not put the fulfillment of their
budgets at stake by taking part on the fiscal competition. In the case of some
Brazilian states, the decision of conceding the fiscal benefits discussed might

60
lead them to the race to the bottom described in Chapter 3, and therefore the
fiscal incentives programs can be considered bad politics. However, the state of
Paraná has been particularly successful in reaching the incentive programs
objectives, i.e., economic growth and low unemployment rate.
The current incentive program, “Paraná Competitivo”, has yet to
be evaluated and it is worth keeping in mind the amount of money companies
invested in the first year – more than they did in the previous eight years. This
might be a milestone in Paraná’s economy if the desired outcomes come to
fruition in the near future.
The structure of Paraná’s Finance State Secretariat seen in
Chapter 4 is settled to provide dynamic and optimized information for the head
of the Secretariat, but considering the federalism and fiscal federalism concepts
brought to discussion, it is necessary to highlight the importance of the political
actors in state level actions.
The decisions about tax policy come from the Governor
assisted by the Finance State Minister, therefore robust and reliable information
must be provided for public decision making.
A warning that seems suitable to people who sit in a public
decision making position, especially those whose decisions affect the economy,
is given by Keynes (1936):
“The ideas of economists and political
philosophers, both when they are right and when
they are wrong, are more powerful than is commonly
understood. Indeed the world is ruled by little
else. Practical men, who believe themselves to be
quite exempt from any intellectual influences, are
usually the slaves of some defunct economist.”

61
Considering that the economic thought has been evolving
continuously ever since Adam Smith, the advice quoted above is deemed
particularly appropriate to government officials that must be open minded for
new ideas and should also continue studying throughout their career to improve
public service.
7.2. Future papers suggestions
The subject certainly deserves further investigation as a means
to achieve a deeper understanding on the effects state tax policy have on GDP
and tax revenue. A line of work could analyze tax reduction and/or presumptive
credit in the state of Paraná. The main issue the researcher will face is the
difficulty of gathering precise information from other states to make the
comparisons, but the result would be worth reading.
A second line of work could be to improve this paper in relation
to the social indicator. Census can become a good source to support this
analysis, because it guarantees the same methodology and indicators to all
states. Census 2010 education results will be delivered in December 2012, so
comparisons can be drawn against the census 2000 results.
A third line of work could present similar comparisons to the
ones produced in this paper focusing on other state of the Brazilian Federation.

62
BIBLIOGRAPHY
ABEL, A.; BERNANKE, B.; CROUSHORE, D., 2011. Macroeconomics – Seventh Edition. The Pearson series in economics. Addison Wesley. AFONSO, J., 2012. A reforma possível na perspectiva das entidades federadas. A reforma tributária possível – a busca do consenso. Lecture promoted by Academia Internacional de Direito e Economia, São Paulo, May 5, 2012. ALLEN, M., 2009. Federalism. In D. Haider-Markel, M. Card, R. Gaddie, G. Moncrief, & K. Palmer (Eds.), Political encyclopedia of U.S. states and regions. (pp. 767-771). Washington: CQ Press. doi: 10.4135/9781452240084.n115 ALTUNBAŞ, Y.; THORNTON, J. Fiscal Decentralization and Governance. Public Finance Review, January 2012, vol. 40, no. 1, pp. 66-85. AMARAL, R., 2004. O constitucionalismo da Era Vargas. In Lamarão S.; Cachapuz, P.; Silva, R. (Org.). Getúlio Vargas e seu tempo. Rio de Janeiro, BNDES, pp. 291-301. ARAÚJO, A., 2009. Dinâmica do federalismo brasileiro e guerra fiscal. Master Dissertation presented to the Programa de Pós-graduação da Faculdade de Filosofia, Letras e Ciências Humanas da Universidade de São Paulo. São Paulo. BAE, S.; FEIOCK, R., 2004. The Flypaper Effect revisited: intergovernmental grants and local governance. International Journal of Public Administration, Vol. 27, Nos. 8 & 9, pp. 577–596. BAILEY, S., 1999. Local government economics. Principles and Practice, MacMillan, London. BRASIL. Lei Complementar nº 101, de 5 de julho de 2000. Fiscal Responsibility Law. BRUECKNER, J., 2006. Fiscal federalism and economic growth. Journal of Public Economics 90 pp. 2107–2120. BRUNORI, D., 2003. Local tax policy: a federalist perspective. The Urban Institute Press, Washington, D.C.. _____, 2005. State tax policy: a political perspective. The Urban Institute Press, Washington, D.C., 2nd ed. _____, 2012. Lecture given as part of the Minerva Program “The Role of the Government – Session 03” promoted by the Institute of Brazilian Issues, School of Business of The George Washington University, Washington, D.C., on August 31st, 2012.

63
CAMARGO, A., 1992. A federação acorrentada: nacionalismo desenvolvimentista e instabilidade democrática. XV encontro anual da ANPOCS Associação Nacional de Pós-Graduação e Pesquisa em Ciências Sociais. Caxambu. CLICK, R., 2012. Lecture given as part of the Minerva Program “Macroeconomics – Session 07” promoted by the Institute of Brazilian Issues, School of Business of The George Washington University, Washington, D.C., on October 10th, 2012. CONFAZ, 2012. Conselho Nacional de Política Fazendária, http://www.fazenda.gov.br/confaz/, retrieved 18 October 2012. COSTA, V., 2003. Relações intergovernamentais no Brasil. Fórum das Federações. p. 77-88. http://www.forumfed.org/libdocs/IGRBook1/IGR-br-Costa-p.pdf, retrieved 23 September 2012. COTEPE, 2012. Comissão Técnica Permante do ICMS - Boletim do ICMS e demais impostos estaduais – 1997 a 2012, http://www.fazenda.gov.br/confaz/boletim/, retrieved 22-23 October 2012 and 02 November 2012. CRE, 2012. Coordenação da Receita do Estado - Missão, http://www.fazenda.pr.gov.br/modules/conteudo/conteudo.php?conteudo=10, retrieved 25 October 2012. DIAZ-CAYEROS, A., 2006. Federalism, fiscal authority, and centralization in Latin America. Cambridge University Press, New York. DOWNS, W., 2011. Comparative federalism, confederalism, unitary systems. In J. Ishiyama, & M. Breuning (Eds.), 21st century political science: A reference handbook. (pp. 168-177). Thousand Oaks: SAGE Publications, Inc. doi: 10.4135/9781412979351.n20 ENCYCLOPEDIA BRITANNICA, http://www.britannica.com/search?query=federalism, retrieved 16 September 2012. FORUM FEDERATIONS, http://www.forumfed.org/en/federalism/introduction.php, retrieved 16 September 2012. GIL-SERRATE, R.,; LÓPEZ-LABORDA, J., 2009. Tax decentralisation, the flypaper effect, and growth. Urban Public Economics Review, Vol. 10, pp. 53-72. GUNTER, M., 2011. Federalism. In D. Mulvaney, & P. Robbins (Eds.), Green politics: An A-to-Z guide. (pp. 175-178). Thousand Oaks: SAGE Publications, Inc. doi: 10.4135/9781412971867.n56

64
HICKEY, R., 2009. Three essays on fiscal federalism. Doctoral thesis presented to the Department of Economics of Simon Fraser University. Burnaby, BC, Canada. HOLCOMBE, R.; WILLIAMS, D., 2011. The cartelization of local governments. Public Choice, vol. 149, pp. 65–74 doi: 10.1007/s11127-011-9825-8 IBGE, 2012a. Instituto Brasileiro de Geografia e Estatística – Contas Regionais do Brasil – Série 1995-2009 – Tabela 02 e Tabela 03, http://www.ibge.gov.br/home/estatistica/economia/contasregionais/2009/defaultrepond_zip.shtm, retrieved 29-30 October 2012. _____, 2012b. Instituto Brasileiro de Geografia e Estatística – IBGE. Pesquisa Mensal de Emprego – Pessoas Desocupadas - PD, http://www.ibge.gov.br/home/estatistica/indicadores/trabalhoerendimento/pme_nova/defaulttab_hist.shtm, retrieved 04 November 2012. IIMI, A., 2005. Decentralization and economic growth revisited: an empirical note. Journal of Urban Economics, vol. 57, pp. 449–461. INMAN, R.; RUBINFELD, D., 1992. Fiscal federalism in Europe: Lessons from the United States experience. European Economic Review vol. 36, pp. 654-660. IPEA, 2012. Instituto de Pesquisa Econômica Aplicada. Considerações sobre o Pleno Emprego no Brasil. Comunicados do IPEA n.º 135, Feb 16, 2012. JANISKEE, B., 2011. American federalism. In J. Ishiyama, & M. Breuning (Eds.), 21st century political science: A reference handbook. (pp. 760-769). Thousand Oaks: SAGE Publications, Inc. doi: 10.4135/9781412979351.n88 KAPUCU, N., 2007. Fiscal federalism. In M. Bevir (Ed.), Encyclopedia of governance. (pp. 314-315). Thousand Oaks, CA: SAGE Publications, Inc. doi: 10.4135/9781412952613.n190. KESNER-SKREB, M., 2009. Fiscal federalism. Financial Theory and Practice, vol. 33, no. 2, pp. 235-237. KEYNES, J., 1936. The general theory of employment, interest and money. Great Minds Series. Prometheus Books, 403 pp., New York, 1997. KOETHENBUERGER, M., 2011. How do local governments decide on public policy in fiscal federalism? Tax vs. expenditure optimization. Journal of Public Economics, vol. 95, pp. 1516–1522. KOKOV V.; LIUBIMTSEV I., 1997. Fiscal Federalism. Problems Of Economic Transition. (pp. 22-41). March 1997; vol.39 n.11. Available from: Business Source Complete, Ipswich, MA. LIEBEL, M.; PIRES, G., 2006. Aspectos positivos e negativos da competição fiscal. In Fórum Fiscal dos Estados Brasileiros, Cadernos Fórum Fiscal n. 2 – Competição Fiscal, Brasília.

65
LOWI, T., 1995. The end of the republican era. The Julian J. Rothbaum distinguished lecture series; v. 5. University of Oklahoma Press. MCLAUGHLIN, D., 2012. Fed forecasts imply risk of policy error. The Financial Times Limited – FT.com, Sep 17, 2012, London, United Kingdom. NASCIMENTO, S., 2008. Guerra fiscal: uma avaliação com base no PIB, nas receitas de ICMS e na geração de empregos, comparando estados participantes e não participantes. Doctoral Thesis presented to the Departamento de Economia, Administração e Sociologia da Escola Superior de Agricultura ‘Luiz de Queiroz’ da Universidade de São Paulo. Piracicaba. NOGUEIRA, A., 2005. As relações federativas no Brasil. Master Dissertation presented to the Programa de Pós-graduação em Ciência Política, do Instituto de Filosofia e Ciências Humanas da Universidade Federal do Rio Grande do Sul. Porto Alegre. _____., 2009. A barganha federativa e o processo decisório na Nova República. Doctoral Thesis presented to the Programa de Pós-graduação em Ciência Política, do Departamento de Ciência Política da Faculdade de Filosofia, Letras e Ciências Humanas da Universidade de São Paulo. São Paulo. OATES, W., 1993. Fiscal decentralization and economic development. National Tax Journal, Jun 1993; vol. 46, n. 2; pp. 237-243. _____, 1999. An essay on fiscal federalism. Journal of Economic Literature, vol. 37 n.3, pp. 1120-1149. OECD, 2000. Revised OECD measures of structural unemployment. Organisation for Economic Cooperation and Development/OECD – Social and welfare issues – Labour markets, human capital and inequality, http://www.oecd.org/social/labourmarketshumancapitalandinequality/2086120.pdf, retrieved 04 November 2012. PARANÁ. Lei nº 9491, de 21 de dezembro de 1990. _____. Decreto 630 de 24 de fevereiro de 2011. PATRICK B., 2012. Fiscal Federalism, Performance Policies, and Education Reforms: Are States Using Performance Policies to Improve Workforce Quality? Politics & Policy, August 2012, Volume 40, Issue 4, pp. 593–628. PEUKERT, H., 2004. Max Weber. American Journal of Economics and Sociology, ISSN 0002-9246, 11/2004, Volume 63, Issue 5, pp. 987 - 1020. PRADO, S., 2006. Lecture given as part of the cycle of debate “Competição Fiscal e Desequilíbrios Regionais” promoted by Forum Fiscal dos Estados Brasileiros on 1st February 2006.

66
RANGEL, C., 2007. Participação política nos discursos oposicionistas a Getúlio Vargas (Brasil) e Gabriel Terra (Uruguai) – 1930/1942. Doctoral Thesis presented to the Programa de Pós-graduação em História da Universidade Federal do Rio Grande do Sul. Porto Alegre. REZENDE, F., 2003. Modernização tributária e federalismo fiscal. In: REZENDE, F.; OLIVEIRA, F. Descentralização e federalismo fiscal no Brasil: desafios da reforma tributária, Konrad Adenauer Stiftung, Rio de Janeiro. RODRIGUES, D, 1998. O Papel dos Governos Estaduais na Indução do Investimento: A Experiência dos Estados do Ceará, da Bahia e de Minas Gerais, Revista BNDES, Dez/1998. RUGER, T., 2004. New Federalism: Introduction. Washington University journal of law and policy., 16 p. 89. (ISSN: 1533-4686) SAMPLES, J., 2008. Federalism. In R. Hamowy (Ed.), The encyclopedia of libertarianism. (pp. 169-172). Thousand Oaks: Sage Publications, Inc. doi: 10.4135/9781412965811.n104 SCHERER, C., 2007. Caracterização do ambiente institucional e sua mudança no Brasil entre 1889 e 1945. Doctoral Thesis presented to the Programa de Pós-graduação em Economia da Universidade Federal do Rio Grande do Sul. Porto Alegre. SCHUMPETER, J., 1920. Max Webers Werk. Der österreichische Volkswirt 12, pp 831-834. SEFAZ-SP, 2012. Secretaria de Estado da Fazenda de São Paulo: Sobre a Secretaria da Fazenda, http://www.fazenda.sp.gov.br/institucional/oque.shtm, retrieved 18 October 2012. SEITZ H.; KEMPKES G., 2007. Fiscal federalism and demography. Public Finance Review, vol. 35, no. 3 (May 2007), pp. 385-413. STANSEL, D. 2005. Local decentralization and local economic growth: A cross-sectional examination of US metropolitan areas. Journal of Urban Economics vol. 57, pp. 55–72. SMITH, A., 1776. Wealth of Nations: An inquiry into the nature and causes of the wealth of nations. Methuen & Co., Ltd., London, 5th ed., 1904. Available at http://www.econlib.org/library/Smith/smWN.html, retrieved 11 November, 2012. SUPER, D., 2005. Rethinking Fiscal Federalism. Harvard Law Review, Vol. 118, No. 8 (Jun 2005), pp. 2544-2652. SURANOVIC, S., 2010. International Trade – theory and policy. Flatworld Knowledge, New York, USA.

67
TANZI, V., 1995. Fiscal federalism and decentralization: A review of some efficiency and macroeconomic aspects, in: BRUNO M., PLESKOVIC B. (Eds.), Annual World Bank Conference on Development Economics, World Bank, Washington, DC, pp. 295-316. THORNTON, J., 2007a. Fiscal decentralization and economic growth reconsidered. Journal of Urban Economics, vol. 61, pp. 64–70. _____, 2007b. Further evidence on revenue decentralization and inflation. Economics Letters, vol. 95, pp. 140-145. THRO, W., 2010. Federalism. In C. Russo (Ed.), Encyclopedia of law and higher education. (pp. 182-184). Thousand Oaks: SAGE Publications, Inc. doi: 10.4135/9781412969024.n58 TIEBOUT, C., 1956. A pure theory of local expenditures. Journal of Political Economy 64, pp. 416–424. VARSANO, R., 1997. A guerra fiscal do ICMS: quem ganha e quem perde. Texto para discussão n. 500, Instituto de Pesquisa Econômica Aplicada, Rio de Janeiro. WAPSHOTT, N., 2011. Keynes Hayek: The clash that defined modern economics. WW Norton and Company, London. WASYLENKO, M., 1987. Fiscal Decentralization and Economic Development. Public Budgeting & Finance, ISSN 0275-1100, Volume 7, Issue 4, pp. 57-71. doi:10.1111/1540-5850.00764 WIESER, P., 2003. Cooperative Federalism and its Challenges. Law Review of Michigan State University Detroit College of Law (pp. 727-740). 2003 L. Rev. M.S.U.-D.C.L. ZACKIN, E., 2011. What's Happened to American Federalism?. Polity, vol. 43, no. 3, pp. 388-403 ProQuest Research Library; ProQuest Social Science Journals. ISSN 00323497. DOI 10.1057/pol.2011.4.