The effect of state on sensory gating: comparison of waking, REM and non-REM sleep
12
The effect of state on sensory gating: comparison of waking, REM and non-REM sleep M.A. Kisley * , A. Olincy, R. Freedman Department of Psychiatry, University of Colorado Health Sciences Center, 4200 E. 9th Avenue, Box C268-71, Denver, CO 80262, USA Accepted 6 April 2001 Abstract Objectives: Auditory sensory gating is an electrophysiological assay that has been employed in clinical and basic research to clarify the neurobiological basis of perceptual and attentional impairments associated with schizophrenia and other diseases. In addition to genetically- linked characteristics, this measure also exhibits potentially confounding sensitivity to behavioral state, most notably acute stress. The goal of the present study is to determine if auditory sensory gating of evoked potential component P50 (‘P1’) could be measured during rapid eye movement (REM) sleep, as an alternative to the waking state. Methods: The suppression of vertex-recorded auditory evoked potential components, P30, P50 and N100, was measured as a function of stimulus redundancy using the paired-click paradigm during all-night sleep in 10 control subjects. Average evoked responses were computed separately for 30 min periods of waking, REM sleep, and non-REM (stage 2) sleep. Results: Evoked response component P50 exhibited suppression to the paired-click stimulus during REM sleep, not significantly different than waking. Suppression of wave N100 was significantly poorer during both sleep stages than waking. Component P30 was not suppressed in response to repetitive stimuli under any state of vigilance. Conclusions: In addition to waking, response suppression of evoked potential component P50 can be measured during REM sleep, thus allowing the separation of trait- and state-dependent effects in future investigations of auditory sensory gating. Published by Elsevier Science Ireland Ltd. Keywords: Auditory evoked potentials; Sensory gating; P50; P1; Sleep; Rapid eye movement 1. Introduction Auditory sensory gating is a rudimentary physiological assay of the brain’s ability to filter out or ‘gate’ extraneous acoustic information. This phenomenon is generally measured by observing the reduction in magnitude of parti- cular auditory evoked potentials as a function of stimulus repetition (i.e. stimulus redundancy). Evoked potential attenuation of this type has been alternatively interpreted as a reflection of the brain’s finite ‘recovery function’ (e.g. Davis et al., 1966). Regardless of terminology, the electrophysiological response-reduction paradigm has proven extremely useful in clinical and basic research directed towards understanding the neurobiological basis of perceptual filtering impairments commonly associated with schizophrenia (neurobiology reviewed by Adler et al., 1998; perceptual impairments reviewed by Light and Braff, 2000). Adler et al. (1982) first demonstrated that component P50 (i.e. ‘P1’ or ‘P b ’) of the vertex auditory evoked potential is generally not suppressed in response to redundant stimuli for patients with schizophre- nia, whereas it is attenuated in healthy subjects. Intact and impaired sensory gating of wave P50, in control and schizo- phrenia patient populations, respectively, has since been replicated by several independent research groups (e.g. Boutros et al., 1991; Erwin et al., 1991; Judd et al., 1992; Jerger et al., 1992). More recently, an animal model of sensory gating (Adler et al., 1986; Luntz-Leybman et al., 1992; Stevens et al., 1996) and a human genetic linkage study (Freedman et al., 1997) have both implicated abnorm- alities of a very specific neuronal element – the a7 nicotinic receptor – in auditory gating deficits associated with schizo- phrenia. In addition to trait-dependence, auditory sensory gating is sensitive to a subject’s behavioral state. In particular, acute stress has been shown to impair sensory gating in control individuals (Johnson and Adler, 1993; White and Yee, 1997), most likely through a noradrenergic mechanism (humans: Adler et al., 1994; animal model: Adler et al., Clinical Neurophysiology 112 (2001) 1154–1165 1388-2457/01/$ - see front matter. Published by Elsevier Science Ireland Ltd. PII: S1388-2457(01)00578-8 www.elsevier.com/locate/clinph CLINPH 2000184 * Corresponding author. Tel.: 11-303-315-1044; fax: 11-303-315-5347. E-mail address: [email protected] (M.A. Kisley).
-
Upload
independent -
Category
Documents
-
view
0 -
download
0
Transcript of The effect of state on sensory gating: comparison of waking, REM and non-REM sleep
The effect of state on sensory gating:comparison of waking, REM and non-REM sleep
M.A. Kisley*, A. Olincy, R. Freedman
Department of Psychiatry, University of Colorado Health Sciences Center, 4200 E. 9th Avenue, Box C268-71, Denver, CO 80262, USA
Accepted 6 April 2001
Abstract
Objectives: Auditory sensory gating is an electrophysiological assay that has been employed in clinical and basic research to clarify the
neurobiological basis of perceptual and attentional impairments associated with schizophrenia and other diseases. In addition to genetically-
linked characteristics, this measure also exhibits potentially confounding sensitivity to behavioral state, most notably acute stress. The goal of
the present study is to determine if auditory sensory gating of evoked potential component P50 (`P1') could be measured during rapid eye
movement (REM) sleep, as an alternative to the waking state.
Methods: The suppression of vertex-recorded auditory evoked potential components, P30, P50 and N100, was measured as a function of
stimulus redundancy using the paired-click paradigm during all-night sleep in 10 control subjects. Average evoked responses were computed
separately for 30 min periods of waking, REM sleep, and non-REM (stage 2) sleep.
Results: Evoked response component P50 exhibited suppression to the paired-click stimulus during REM sleep, not signi®cantly different
than waking. Suppression of wave N100 was signi®cantly poorer during both sleep stages than waking. Component P30 was not suppressed
in response to repetitive stimuli under any state of vigilance.
Conclusions: In addition to waking, response suppression of evoked potential component P50 can be measured during REM sleep, thus
allowing the separation of trait- and state-dependent effects in future investigations of auditory sensory gating. Published by Elsevier Science
Ireland Ltd.
Keywords: Auditory evoked potentials; Sensory gating; P50; P1; Sleep; Rapid eye movement
1. Introduction
Auditory sensory gating is a rudimentary physiological
assay of the brain's ability to ®lter out or `gate' extraneous
acoustic information. This phenomenon is generally
measured by observing the reduction in magnitude of parti-
cular auditory evoked potentials as a function of stimulus
repetition (i.e. stimulus redundancy). Evoked potential
attenuation of this type has been alternatively interpreted
as a re¯ection of the brain's ®nite `recovery function'
(e.g. Davis et al., 1966).
Regardless of terminology, the electrophysiological
response-reduction paradigm has proven extremely useful
in clinical and basic research directed towards understanding
the neurobiological basis of perceptual ®ltering impairments
commonly associated with schizophrenia (neurobiology
reviewed by Adler et al., 1998; perceptual impairments
reviewed by Light and Braff, 2000). Adler et al. (1982) ®rst
demonstrated that component P50 (i.e. `P1' or `Pb') of the
vertex auditory evoked potential is generally not suppressed
in response to redundant stimuli for patients with schizophre-
nia, whereas it is attenuated in healthy subjects. Intact and
impaired sensory gating of wave P50, in control and schizo-
phrenia patient populations, respectively, has since been
replicated by several independent research groups (e.g.
Boutros et al., 1991; Erwin et al., 1991; Judd et al., 1992;
Jerger et al., 1992). More recently, an animal model of
sensory gating (Adler et al., 1986; Luntz-Leybman et al.,
1992; Stevens et al., 1996) and a human genetic linkage
study (Freedman et al., 1997) have both implicated abnorm-
alities of a very speci®c neuronal element ± the a7 nicotinic
receptor ± in auditory gating de®cits associated with schizo-
phrenia.
In addition to trait-dependence, auditory sensory gating is
sensitive to a subject's behavioral state. In particular, acute
stress has been shown to impair sensory gating in control
individuals (Johnson and Adler, 1993; White and Yee,
1997), most likely through a noradrenergic mechanism
(humans: Adler et al., 1994; animal model: Adler et al.,
Clinical Neurophysiology 112 (2001) 1154±1165
1388-2457/01/$ - see front matter. Published by Elsevier Science Ireland Ltd.
PII: S1388-2457(01)00578-8
www.elsevier.com/locate/clinph
CLINPH 2000184
* Corresponding author. Tel.: 11-303-315-1044; fax: 11-303-315-5347.
E-mail address: [email protected] (M.A. Kisley).

1988; Stevens et al., 1993). Whether attention modulates
sensory gating is still under debate (compare Guterman et
al., 1992 with Jerger et al., 1992; White and Yee, 1997).
Sensitivity to these and other experimental parameters
might explain one group's failure to ®nd intact sensory
gating of wave P50 in a sample of healthy individuals (Kath-
mann and Engel, 1990).
To maximize the utility of sensory gating assays in clin-
ical research, it is desirable to distinguish long-lasting
neurobiological modi®cations due to genetic inheritance
and damage caused by environmental insult from relatively
transient, state-dependent effects. Enhanced reliability
becomes especially important as more psychiatric and
neurological patient populations are tested for sensory
gating abnormalities (e.g. posttraumatic stress disorder:
Neylan et al., 1999; Skinner et al., 1999; Parkinson's
disease: Teo et al., 1997; attention-de®cit/hyperactivity
disorder: Olincy et al., 2000; drug abuse: Boutros et al.,
2000; Patrick and Struve, 2000; traumatic brain injury:
Arciniegas et al., 2000; Alzheimer's disease: Tanila et al.,
2000). Whereas past attempts to increase reliability have
focused on methodological (Nagamoto et al., 1991; Clem-
entz et al., 1997; McCallin et al., 1997) and analytical
(Cardenas et al., 1993; Smith et al., 1994; Patterson et al.,
2000) aspects of gating measures, the present study is moti-
vated by the search for a stable, easily-de®ned brain/beha-
vioral state during which to measure auditory sensory
gating.
Rapid eye movement (REM) sleep is a particularly appro-
priate candidate `state' for the measurement of component
P50 sensory gating. During REM sleep, the activity of nora-
drenergic neurons in the locus coeruleus are greatly reduced
(Hobson et al., 1975), potentially removing the confounding
effect of norepinephrine. Furthermore, the possible in¯u-
ence of selective attention on sensory gating becomes irre-
levant if subjects are asleep. Waveform measurements
necessary to assess gating can be achieved because all
components of the auditory evoked potential, including
P50, are present during REM sleep (Williams et al., 1962;
Weitzman and Kremen, 1965). Further, differential proces-
sing of sequential acoustic stimuli occurs during REM sleep
as re¯ected in later evoked potential components, such as
the mismatch negativity (Loewy et al., 1996, 2000; Nashida
et al., 2000) and P300 (Sallinen et al., 1996; Cote and Camp-
bell, 1999a,b). Nevertheless, only one previous study has
examined auditory evoked potential attenuation as a func-
tion of stimulus repetition during REM sleep: Ornitz et al.
(1972, 1974) found that component N2 ± a negative wave
occurring about 250 ms after stimulus onset ± exhibits better
recovery (i.e. poorer gating) during REM sleep than during
waking in healthy children. Our understanding of sleep's
effect on gating of wave P50 is limited to the observation
that preceding episodes of non-REM sleep, but not episodes
of REM sleep, can actually improve sensory gating
measured in waking schizophrenia patients (Grif®th and
Freedman, 1995).
The primary goal of the present study is to show that
auditory sensory gating of wave P50 can be measured
during REM sleep in control subjects, thus demonstrating
the validity of this experimental procedure for clinical
research. A secondary goal is to compare quantitative esti-
mates of sensory gating obtained across different states of
vigilance ± speci®cally to test whether gating of P50 is
improved in REM sleep compared with waking for this
population. Additionally, amplitude suppression of evoked
potential components P30 (i.e. `Pa') and N100 (i.e. `N1') are
also described for waking and REM sleep, and gating of all
3 waves is examined during non-REM sleep.
2. Methods
Ten adult subjects (aged 21±44 years; mean, 31.2 years; 5
male) participated in this study. None had a positive perso-
nal or family history of schizophrenia. All subjects gave
informed consent. Experimental procedures were approved
by the Colorado Multiple Institutional Review Board.
2.1. General procedures
Electroencephalographic signals were recorded (Neuros-
can Acquisition System; Sterling, VA) from each subject
during two separate sessions: one during waking, and one
during sleep. Half of the subjects underwent the waking
recording ®rst. For both sessions, the continuous electroen-
cephalogram (EEG) was recorded from a vertex electrode
(Cz) referenced to the right ear, and the electrooculogram
(EOG) from a bipolar con®guration between electrodes
directly above and lateral to the left eye. During sleep
recordings, the electromyogram (EMG) was also recorded
with a bipolar submental con®guration. A ground electrode
was attached to the left ear. All electrode impedances were
maintained below 10 kV.
Average auditory evoked potentials were computed from
the EEG activity immediately following acoustic clicks
(0.04 ms pulse, ®ltered between 20 and 12 000 Hz),
which were delivered through insert earphones. The click
intensity was adjusted to 40 dB above each subject's hearing
threshold (determined by method of limits; thresholds for all
subjects were within a 10 dB range), separately for each ear.
Clicks occurred in pairs (0.5 s inter-click interval), and pairs
occurred every 10 s.
For the awake recording, supine subjects were instructed
to keep their eyes open and still during auditory stimuli
(which occurred every 10 s), and to apprise the experimenter
of any dif®culty in staying awake or keeping their eyes
open. After a 5 min acclimatization, recording began and
lasted until 30 min of data had been acquired. Each subject
decided during the experiment whether acquisition contin-
ued unabated for 30 min (N � 4), or whether this time was
broken up into two 15 min blocks (N � 4), or 3 blocks of 10
min each (N � 2). Drowsiness (i.e. dif®culty staying awake)
was generally the determining variable. None of the subjects
M.A. Kisley et al. / Clinical Neurophysiology 112 (2001) 1154±1165 1155

fell asleep during data acquisition (veri®ed by observation
of the EEG and subject report).
Sleep recordings occurred in the same laboratory, and in
one of two general paradigms. For 8 subjects, evoked poten-
tials were measured continuously during all-night sleep. The
other two subjects came to the laboratory at 03:00 h, after a
partial night's sleep.
2.2. Signal processing
For acquisition, EEG signals were ampli®ed 5000 times
and ®ltered between 0.1 and 200 Hz, EOG ampli®ed 1000
times and ®ltered between 0.1 and 100 Hz, EMG ampli®ed
12 500 times and ®ltered between 5.0 and 200 Hz. Occa-
sionally, a 60 Hz bandstop ®lter was used to attenuate
power line artifact. All channels were sampled at 1000
Hz. Continuously recorded data were converted from
Neuroscan's Scan 4.1 software format to ASCII format,
then imported into the Matlab software package (Math-
works; Natick, MA) for further analysis with custom
programs.
Single trial evoked potentials were isolated from the
continuous EEG by aligning the signal with stimulus
markers to the nearest millisecond. These trials were ®ltered
with a bandpass (5±100 Hz) that includes those frequencies
which contribute the most power to auditory middle latency
components (Suzuki et al., 1983), and a bandstop ®ltered at
60 Hz. All ®lters were applied both forward and reverse to
eliminate phase distortion (Matlab's `®lt®lt' function).
2.3. Isolation of sleep stages for evoked potential
measurement
Continuous recordings were divided into 20 s epochs for
scoring of sleep stages, and initially screened for REM sleep
periods by simple power analysis: the average power in the
EEG channel between 12 and 14 Hz (`spindle' band), the
total power in the EOG channel, and the total power in the
EMG channel were plotted as a function of time for the
entire recording session (e.g. Fig. 1). Putative REM sleep
episodes were then easily detected as periods of greatly
reduced spindle power, increased EOG power (due to
REMs), and reduced submental EMG power (due to reduced
muscle tone). Final determination of sleep stage was
achieved by visual inspection of the EEG, EOG, and
EMG signals in 20 s epochs, and the application of tradi-
tional criteria as described in Rechtschaffen and Kales
(1968).
Average auditory evoked potentials were computed from
EEG signals recorded during the initial 30 min of the ®rst
REM episode of the night that lasted 30 min or longer. A
`REM episode' was considered to begin when two conse-
cutive 20 s epochs were scored as REM sleep, and end when
3 or more consecutive epochs were scored as non-REM
sleep or waking. A REM episode de®ned in this manner
could include epochs with movement artifact and arousals
as long as the subject returned to REM sleep within two
epochs. For all subjects, the average percentage of 20 s
epochs within a `REM episode' that were actually scored
as `REM epochs' by the criteria of Rechtschaffen and Kales
(1968) was 95.4% (SD � 3:1%). The majority of other
epochs contained within REM episodes were either `move-
ment time' or occasionally stage II sleep because of multiple
K-complexes. One subject never exhibited a REM episode
lasting 30 min. For this subject, the average evoked poten-
tial was computed from the EEG recorded during the initial
15 min of the two longest REM periods of the night.
For comparison, average evoked potentials were also
computed from signals recorded during non-REM sleep.
Efforts were made to compute these evoked potentials
from 30 min periods characterized by relatively stable
stage II sleep. In particular, the EEG signal recorded during
the 30 min directly preceding the last REM episode of the
night was utilized. This approach was motivated by the fact
that most slow-wave sleep (i.e. stage III and IV sleep)
occurs during the ®rst few hours of the night (Feinberg,
1974; BorbeÂly, 1982). If the subject awakened during this
period, the 30 min directly preceding the awakening were
used to compute the non-REM average auditory evoked
potential (N � 1). For the 30 min non-REM periods of all
10 subjects, the average number of 20 s epochs scored as
stage II sleep by the criteria of Rechtschaffen and Kales
(1968) was 86.5% (SD � 13:3%), which roughly agrees
with the percentage of non-slow-wave sleep occurring
during the later non-REM periods of the night for adults
(Bes et al., 1991). The majority of the other 13.5% of epochs
were scored either as `movement time' or stage III sleep.
2.4. Auditory sensory gating paradigm: T/C ratio
Pairs of clicks (0.5 s inter-click interval) were presented
every 10 s throughout the recording session, and average
evoked potentials computed separately for each click of the
pair. For each of the individual evoked potential compo-
nents, the magnitude of evoked response to the second
(`test') click of a pair was then compared with the magni-
tude of evoked response to the ®rst (`conditioning') click.
Speci®cally, a ratio of the magnitudes, the test/conditioning
or `T/C' ratio, was computed to quantify sensory gating. A
T/C ratio close to 0 indicates robust suppression (very small
test response compared with conditioning response) and a T/
C ratio of 1 indicates essentially no sensory gating (test and
conditioning responses were comparable in magnitude). In
the general population, T/C ratios for component P50 range
between 0 and well over 1, but are generally below 0.4 for
subjects without a personal or family history of psychosis
(Siegel et al., 1984; Waldo et al., 1994). Individuals af̄ icted
with schizophrenia usually have T/C ratios above 0.4 (e.g.
Adler et al., 1982). Thus, for the present study, T/C ratios for
component P50 below 0.4 are considered to represent
`intact' sensory gating. No equivalent de®nition has been
established for the other evoked potential components.
M.A. Kisley et al. / Clinical Neurophysiology 112 (2001) 1154±11651156

M.A. Kisley et al. / Clinical Neurophysiology 112 (2001) 1154±1165 1157
Fig. 1. Example of sleep staging techniques. (Top) Mean relative signal power for EEG (spindle frequency band only), EOG, and EMG channels; 3 consecutive
h, beginning in the middle of the night, divided into 20 s epochs. Note two separate periods with reduced spindle power and increased EOG power. The latter
episode, accompanied by suppressed EMG power, was REM sleep (broken lines indicate start and stop times for this period, determined by classical sleep
staging techniques applied to each 20 s epoch). The former was a period of waking. (Bottom) Twenty second epochs exemplifying waking, REM, and non-
REM periods. Note large, fast eye movements during REM sleep. Large, widespread K-complexes were detectable even on the EOG channel during the
illustrated non-REM epoch ± in this case stage II sleep. Positivity is plotted upwards.

2.5. Computation of average evoked potentials and
component de®nition
For all states of vigilance, average evoked potentials were
computed from single trial responses evoked during care-
fully de®ned 30 min intervals. During waking, the average
was computed from the ®rst 30 contiguous min of recording
time following the initial 5 minute acclimatization. The 30
min periods utilized for REM and non-REM sleep are
detailed above in the discussion of sleep stage scoring. Arti-
fact rejection was achieved by treating the value of each
signal channel (EEG, EOG, EMG) at each millisecond as
a normal random variable, and eliminating those single
trials that occurred when any of these channels contained
an extreme value. More speci®cally, for each channel, the
standard deviation (SD) of all signal values recorded during
the entire session was computed. If, during a single trial
evoked potential (from post-stimulus time 0 to 200 ms),
any of the signal channels exceeded 4 of its standard devia-
tions, that trial was excluded from further analysis. For each
30 min period, regardless of vigilance state, an average of
177 single trial conditioning and 177 single trial test evoked
responses were recorded. This represents a large number of
trials compared with other studies of auditory sensory gating
(typically 32 trials for each click of the pair). After artifact
rejection, the mean number of single trial conditioning/test
evoked responses available to compute average evoked
potentials was 164.9/163.2 (waking), 162.6/164 (REM)
and 161/158.8 (non-REM). As expected, the majority of
single trials rejected during REM sleep were due to extreme
values on the EOG channel (due to large eye movements),
and the majority rejected during non-REM sleep were due to
extreme values on the EEG channel (because of large,
synchronous events such as K-complexes). Single trials
evoked during arousals and movements were robustly
rejected by this method because of increased signal size
on the EMG channel and movement artifact on all 3 chan-
nels. The majority of trials rejected during the waking
condition were due to eye-blinks, clearly evident on the
EOG channel.
Auditory evoked potential components were de®ned as
follows: P30, positive wave, peaking between 25 and 45 ms;
P50, positive, peak 45±65 ms; and N100, negative, ®rst
trough .75 ms. Examples are shown in Fig. 2. To maintain
consistency with previous sensory gating literature, magni-
tudes of these components were measured from preceding
trough to peak (P30 and P50: Nagamoto et al., 1989) and
from preceding peak to trough (N100). When an expected
peak or trough was absent, the value at the nearest
`shoulder' (i.e. point of minimal slope) was used (P50 of
REM sleep conditioning response in Fig. 2B). Measurement
of the N100 amplitude was often confounded by the
presence of another positive wave after P50 but before
N100. Based on this wave's latency and polarity, it might
correspond to `TP78' of Wood and Wolpaw (1982), a
component usually more prominent over temporal regions.
The N100 magnitude was measured from this unde®ned
positive component when present (Fig. 2A,B), but otherwise
from the peak of wave P50 (conditioning response of Fig.
2C). Further complications arise because N100 is a multi-
component waveform (Fig. 2C; reviewed by Woods, 1995).
In this study, N100 was de®ned as the ®rst negative trough
(not shoulder) after 75 ms.
2.6. Statistics
All statistical hypothesis tests were planned in advance.
Two-sided, paired Student's t tests were used to compare the
mean evoked potential amplitude, latency, and T/C ratios
between waking and REM sleep, and between waking and
non-REM sleep. A repeated-measures analysis of variance
was utilized to determine if any of these variables, for any of
the individual evoked potential components, exhibited
signi®cant variation over the course of a 30 min REM
period. For all tests, the criterion for signi®cance was
a � 0:05. Statistical analysis was carried out with version
8 of SAS Analysis Software (SAS Institute, Inc.; Cary, NC).
3. Results
Average auditory evoked potentials in response to paired-
click stimuli were recorded from 10 control subjects during
two separate sessions: waking and sleeping. The upper
portion of Fig. 2A exempli®es conditioning and test evoked
responses for an individual while awake. Note that compo-
nent P30 was robustly present in response to both clicks of
the pair, indicating that this wave was not `gated'. This was
true of the sample in general, as the mean T/C ratio for P30
was 0.77 (SD � 0:44), not signi®cantly different from 1
(two-tailed, one-sample t test, d:f: � 9, P � 0:14). Compo-
nent N100, on the other hand, was strongly attenuated in
response to the test click for this particular individual and
for the sample (d:f: � 9, P , 0:001). Although the subject
in Fig. 2A did not exhibit sensory gating of component P50,
the sample as a whole did (d:f: � 9, P , 0:001). Average T/
C ratios and corresponding standard deviations are summar-
ized in Table 1.
3.1. Auditory sensory gating during REM sleep
Average evoked potentials and sensory gating were
measurable during REM sleep as well. The lower portion
of Fig. 2A shows the average conditioning and test evoked
responses for the same subject, now during REM sleep.
Compared with waking, component P50 was strongly
gated. For this subject and two others, the P50 T/C ratio
was elevated (.0.4) during waking and intact (,0.4) during
REM sleep. No subjects exhibited the opposite pattern.
However, one subject had elevated T/C ratios under both
conditions. Fig. 2B demonstrates perfect sensory gating (i.e.
T=C � 0) in another subject during REM sleep. Generally,
the mean T/C ratio for component P50 was lower in REM
M.A. Kisley et al. / Clinical Neurophysiology 112 (2001) 1154±11651158
M.A. Kisley et al. / Clinical Neurophysiology 112 (2001) 1154±1165 1159
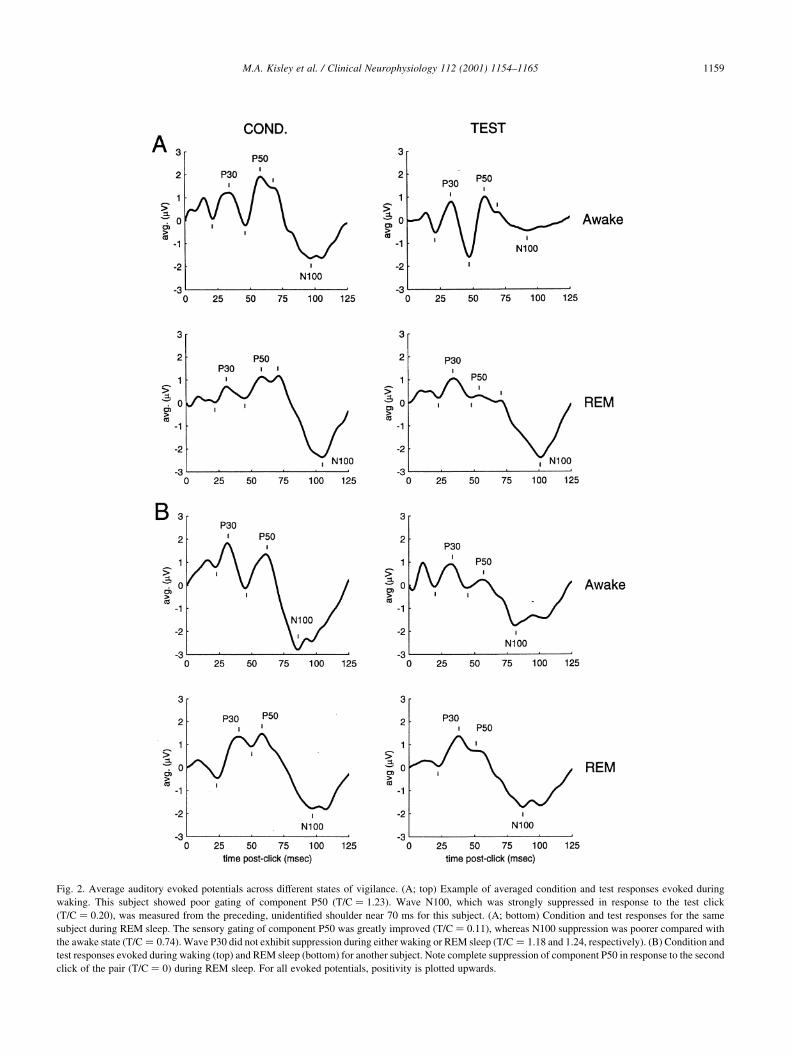
Fig. 2. Average auditory evoked potentials across different states of vigilance. (A; top) Example of averaged condition and test responses evoked during
waking. This subject showed poor gating of component P50 (T=C � 1:23). Wave N100, which was strongly suppressed in response to the test click
(T=C � 0:20), was measured from the preceding, unidenti®ed shoulder near 70 ms for this subject. (A; bottom) Condition and test responses for the same
subject during REM sleep. The sensory gating of component P50 was greatly improved (T=C � 0:11), whereas N100 suppression was poorer compared with
the awake state (T=C � 0:74). Wave P30 did not exhibit suppression during either waking or REM sleep (T=C � 1:18 and 1.24, respectively). (B) Condition and
test responses evoked during waking (top) and REM sleep (bottom) for another subject. Note complete suppression of component P50 in response to the second
click of the pair (T=C � 0) during REM sleep. For all evoked potentials, positivity is plotted upwards.

sleep than during waking for the sample (mean reduction,
0.19), but not signi®cantly so (d:f: � 9, P � 0:21). This
reduction in T/C ratio was anticipated, but the power to
declare this difference signi®cant based on this particular
sample is only 23%. A power of 80% would require a
sample of approximately 45 subjects.
A summary of change in T/C ratios for all subjects and all
evoked potential components is shown in Fig. 3. Sensory
gating of component P30 did not change between waking
and REM, but gating of wave N100 did. In particular,
response suppression due to redundant acoustic stimulation
for N100 was signi®cantly poorer during REM sleep
compared with waking (Table 1).
In response to the conditioning click, the latency and
amplitude of the 3 evoked potential components were differ-
entially affected by REM sleep. In particular, the peak of
P30 and the trough of N100 were both signi®cantly delayed
in time during REM sleep compared with waking (Table 2).
Regarding the evoked potential magnitude, P30 remained
unchanged, P50 exhibited a trend towards reduction
(d:f: � 9, P � 0:0575), and N100 was signi®cantly reduced
(Table 3).
In order to determine if any evoked potential variables
changed over the course of a 30 min REM period, separate
repeated-measures ANOVAs were applied to the T/C ratio,
the conditioning response latency, and the conditioning
response amplitude for each of the 3 evoked potential
components. Speci®cally, average evoked potentials were
computed individually from 3 adjacent 10 min periods, and
appropriate measures were taken (N � 9, because one
subject never exhibited a REM episode lasting 30 min).
Assessed in this manner, none of the variables exhibited
signi®cant time-effects (d:f: � 2,16; a � 0:05). This
implies that any ¯uctuation of auditory sensory gating
measures exhibited over the course of a given REM sleep
period was random across subjects.
3.2. Auditory sensory gating during non-REM sleep
Auditory sensory gating was also assessed during non-
REM sleep in 8 subjects. The remaining two individuals
were without observable P30 and P50 components during
this sleep stage. Like REM sleep, the N100 component
exhibited signi®cantly poorer gating during non-REM
sleep compared with waking (Table 1). Average T/C ratios
for both P30 and P50 were not signi®cantly different from
the awake condition. For 3 of 8 subjects, component P50
exhibited elevated T/C ratios during non-REM sleep,
including one subject that had a T/C ratio of 0 during
waking. The only signi®cant change in latency from waking
to non-REM sleep was a delay of more than 5 ms for wave
P30's peak (Table 2). P50 and N100 amplitudes in response
to the conditioning click were both attenuated compared
with waking, but neither were signi®cantly so (Table 3;
trend for N100: d:f: � 7, P � 0:08). As during REM
sleep, no systematic variation in evoked potential and
sensory gating measures was detected over the course of a
M.A. Kisley et al. / Clinical Neurophysiology 112 (2001) 1154±11651160
Fig. 3. Change in sensory gating from waking to REM sleep for each
subject, for each evoked potential component. The plus sign indicates the
corresponding average T/C ratio for all 10 subjects. P50 T/C ratios above
dotted line (at 0.4) are considered to be above the normal range by tradi-
tional criteria. For wave P50, gating appears to have generally improved
(i.e. T/C ratios tended to decrease) in REM sleep. In contrast, suppression
was clearly stronger during waking for wave N100. No systematic pattern
of change is obvious for P30.
Table 2
Mean latencya for each wave as a function of state
P30 P50 N100
Awake 32.6 (3.0) 57.5 (2.7) 92.8 (6.9)
REM 37.9 (4.1)b 59.2 (2.4) 101.6 (9.4)b
Non-REMc 37.9 (2.3)d 57.1 (6.4) 95.3 (14.2)
a Mean latency (ms); SD in parentheses.b Signi®cantly different than awake, two-sided paired t test, P , 0:05.c N � 8 for computation of means and for t tests.d P , 0:01.
Table 1
Mean T/C ratioa for each wave as a function of brain state
P30 P50 N100
Awake 0.77 (0.44) 0.34 (0.42) 0.24 (0.16)
REM 0.94 (0.43) 0.15 (0.27) 0.69 (0.15)b
Non-REMc 1.17 (0.58) 0.33 (0.43) 0.75 (0.36)d
a SD in parentheses.b P , 0:0001.c N � 8 for computation of means and for t tests.d Signi®cantly different than awake, two-sided paired t test, P , 0:05.

given 30 min non-REM sleep episode when that period was
divided into 3 periods of 10 min each (repeated-measure
ANOVA, d:f: � 2,14; a � 0:05).
4. Discussion
This study demonstrates that sensory gating of auditory
evoked potential component P50 can be measured during
REM sleep. Theoretically, gating measures involving this
particular wave should be more reliable during REM sleep
because of reduced noradrenergic activity (Hobson et al.,
1975) and inattentiveness to the external sensory environ-
ment. Accordingly, we expected P50 T/C ratios to be lower
during REM sleep than during waking. Our results are
consistent with this notion, but not statistically signi®cant
due to sample size. To maximize the signal-to-noise ratio of
the average evoked potential, analysis was restricted to
REM sleep lasting for 30 continuous min. Nevertheless,
we believe that auditory sensory gating could be measured
during shorter REM episodes because all such periods
during the night, except the ®rst, exhibit similar acoustic
transfer properties as measured by evoked potentials
(RoÈschke et al., 1995).
Although paired-click evoked potential measures were
generally obtainable during non-REM sleep, several
features of this brain state make it less desirable for clinical
research involving auditory gating, especially for compo-
nent P50. First, the correlation between intact and elevated
T/C ratios between states was poor: for some subjects,
gating improved from waking to non-REM, while for
others, it worsened. Also, two of 10 subjects could not be
studied during non-REM sleep because P30 and P50
components could not be detected in the average evoked
potential.
The sensory gating of waves P30 and N100 was also
assessed in this study. Component P30 did not exhibit
response suppression during any state: waking, REM
sleep, or non-REM sleep. Surprisingly, gating of N100
was signi®cantly poorer (i.e. better `recovery') during
REM sleep than during waking. This effect cannot be
explained by differences in attention between waking and
sleeping, because previous studies have shown that reduced
attention to the paired-click stimulus leads to better auditory
sensory gating of wave N100 (Jerger et al., 1992; White and
Yee, 1997). Further, this ®nding is not likely to be explained
by changes in the activity of a single neurotransmitter
system ± e.g. noradrenergic or cholinergic ± because gating
of component N100 was also disrupted during non-REM
sleep. An intriguing hypothesis is that different sub-compo-
nents of vertex wave N100 have different gating ± or recov-
ery ± functions (LuÈ et al., 1992), and further that these sub-
components are differentially detectable during waking and
sleeping states (i.e. one is larger during waking, the other
during sleep). Consistent with this idea, we found N100
latency to be longer during sleep than during waking, parti-
cularly for REM sleep. Since sub-components of wave
N100 exhibit differential scalp distributions (reviewed by
Woods, 1995), the validity of this explanation for the
observed state-dependent modulation of N100 sensory
gating could be pursued with multiple electrodes distributed
over the head.
4.1. Comparison with previous studies
Although several investigators have examined the effect
of sleep on evoked potential components P30, P50 and
N100, there are no reports describing sensory gating of
these waves during sleep. Our ®ndings for the waking
condition are consistent with previous studies demonstrat-
ing essentially no response suppression as a function of
stimulus repetition for wave P30 (Goldstein et al., 1972;
Erwin and Buchwald, 1986a) compared with strong sensory
gating for components P50 (Adler et al., 1982) and N100
(Nelson and Lassman, 1968) in control subjects. Investiga-
tions of P50 gating during waking have estimated that one in
10 healthy individuals actually exhibit T/C ratios in the
elevated range (.0.4, Siegel et al., 1984; Waldo et al.,
1994). We found a similar proportion in our sample for
the REM sleep condition. This suggests that 10% of indivi-
duals without a positive personal or family history of schi-
zophrenia might still have a state-independent impairment
in auditory sensory gating. Although genetic linkage has
implicated a speci®c locus on chromosome 15 in the proper
and improper expression of P50 sensory gating in families
of individuals with schizophrenia (Freedman et al., 1997),
no evidence yet exists that elevated T/C ratios in control
subjects can be attributed to modi®cations at the same
region of the genome. Further, environmental ± rather
than genetic ± factors could be responsible for `abnormal'
sensory gating in these healthy individuals.
It is unclear why 4 of 10 control subjects exhibited T/C
ratios above 0.4 during waking in the present study,
compared with one of 10 in previous studies. Screening
procedures might account for the differences, as subjects
in the present study were not formally assessed for drug
use, a behavior that can impair sensory gating (Boutros et
al., 2000; Patrick and Struve, 2000; Adler et al., 2001).
Variations in brain state, particularly wakeful alertness
(Grif®th et al., 1993; but see Cardenas et al., 1997) and
M.A. Kisley et al. / Clinical Neurophysiology 112 (2001) 1154±1165 1161
Table 3
Mean amplitudea for each wave, evoked by the conditioning click, as a
function of state
P30 P50 N100
Awake 1.65 (1.11) 1.93 (1.57) 6.38 (2.69)
REM 1.67 (0.62) 0.96 (0.57) 4.10 (1.43)b
Non-REMc 1.99 (1.01) 1.06 (0.84) 3.65 (1.41)
a Mean amplitude (mV); SD in parentheses.b Signi®cantly different than awake, two-sided paired t test, P , 0:05.c N � 8 for computation of means and for t tests.

acute stress (Adler et al., 1994), could also have caused
elevated T/C ratios in some of these control subjects.
Regarding modulation of amplitude and latency for indi-
vidual evoked potential components by REM and non-REM
sleep, the present results generally support previous inves-
tigations with one notable exception: the amplitude of wave
P50 during non-REM sleep. In contrast to Erwin and Buch-
wald (1986b) who reported a virtual absence of component
P50 during stage II sleep for all 14 of their subjects, we
found clear evoked potential components corresponding to
P50 in 8 of our 10 subjects during non-REM (mostly stage
II) sleep. Further, we found the mean amplitude of P50
during non-REM sleep to be approximately equal to that
for REM sleep. Methodological elements which differed
between our studies might be responsible for the discre-
pancy. Erwin and Buchwald (1986b) ®ltered auditory
evoked potentials between 10 and 300 Hz, whereas we
®ltered between 5 and 100 Hz. Since evoked potentials
were recorded with a wide bandpass (0.1±200 Hz) for the
present study, and subsequently ®ltered digitally, we are
able to compare the effect of different cut-off frequencies
on the magnitude of wave P50. The example shown in Fig.
4A demonstrates that a ®lter very similar to that used by
Erwin and Buchwald (10±200 Hz) does not reduce the
amplitude of P50 evoked during non-REM sleep. Thus,
the difference in ®lter parameters probably cannot explain
the discrepancy in results between the present study and that
of Erwin and Buchwald (1986b).
We feel the difference between acoustic stimulation para-
digms utilized in the two studies is more likely to be respon-
sible for the disparate ®ndings regarding the magnitude of
wave P50 during non-REM sleep. The critical variable is
probably the inter-click interval. Erwin and Buchwald
(1986b) presented auditory clicks in trains at 1 Hz, whereas
we employed the paired-click paradigm. Average evoked
potentials were computed from all evoked responses in a
click-train for the former (inter-click interval, 1 s), and only
from the conditioning evoked responses for the latter (inter-
click interval, 10 s). Like Erwin and Buchwald, Jones and
Baxter (1988) reported the disappearance of component P50
M.A. Kisley et al. / Clinical Neurophysiology 112 (2001) 1154±11651162
Fig. 4. Example of ®ltering effects on average evoked responses recorded during non-REM sleep. (A) Response to conditioning click. (Top) Evoked potential
comprised of single trials ®ltered between 5 and 100 Hz. (Bottom) Evoked potential computed from the same single trials, now ®ltered between 10 and 200 Hz
(similar to Erwin and Buchwald, 1986b). Note the overall similarity between evoked responses, most notably the clear detectability of component P50. (B)
Example test response recorded during non-REM sleep (does not correspond to conditioning response in (A)). (Top) Note that component P50 is virtually
absent (i.e. it is gated) when single trials are ®ltered between 5 and 100 Hz. (Bottom) Filtering the single trials between 0.3 and 15 Hz distorts the average
evoked waveform, making it appear to contain a clear `P50' wave (latency� 58 ms).

during non-REM sleep when clicks were presented in rapid
trains (5 Hz), even though very wide-band ®lters (0.3±3000
Hz) were applied to the evoked potential signal. In compar-
ison, studies using click-trains at slower rates of presenta-
tion (#0.5 Hz) have consistently reported the robust
presence of component P50 across all sleep stages, includ-
ing II, III, and IV in adults (Williams et al., 1962; Weitzman
and Kremen, 1965; Kevanishvili and von Specht, 1979) and
children (Barnet et al., 1975).
To summarize, vertex component P50 appears to be
measurable under non-REM sleep for most subjects in
response to the conditioning click for the paired-click para-
digm, and also in response to clicks during the click-train
paradigm for rates of 0.5 Hz or less, but not for rates of 1 Hz
or more. Two studies in the literature at ®rst seem to contra-
dict this conclusion. de Lugt et al. (1996) described a clear
P50 component during all sleep stages in response to clicks
presented at 1.67 Hz. However, their signal was low-pass
®ltered at 15 Hz. Utilizing such an extreme cut-off
frequency could have distorted the evoked potential wave-
forms suf®ciently to lead these investigators to mistake
component P30 for P50 (e.g. see Fig. 4B). Paavilainen et
al. (1987) also reported the presence of P50 during stage II
sleep when click-trains of 1.96 Hz were used. However,
their de®nition of component P50 was unusual: the largest
positivity between 0 and 100 ms post-stimulus. This overly
general de®nition could have allowed other waveform
components ± such as P30, TP78 (Wood and Wolpaw,
1982), or evoked slow-wave activity that would not have
been attenuated by their high-pass ®lter at 1 Hz ± to be
mistakenly identi®ed as P50.
5. Conclusion
Motivation for this study came from the growing realiza-
tion that functional assessment of the nervous system orga-
nization depends crucially on the brain and behavioral state
under which measurements are taken (e.g. Kisley and
Gerstein, 1999; WoÈrgoÈtter and Eysel, 2000). The present
results demonstrate two relevant, and related points: (1),
measurement of component P50 auditory gating can be
achieved during REM sleep; and (2), intact sensory gating
of this wave does not depend on a particular brain state, and
is thus likely to be determined by trait. It remains to be
demonstrated that the genetically-determined difference in
sensory gating, previously observed between waking
control and schizophrenia populations, also exists during
REM sleep. This demonstration would con®rm the appro-
priateness of REM sleep for future auditory gating studies
involving clinical populations.
Acknowledgements
For helpful discussion and suggestions, the authors grate-
fully acknowledge Drs Lawrence Adler, Randal Ross, and
Merilyne Waldo. Technical assistance was provided by
Kara McRae and Ellen Cawthra. This work was supported
by the Veteran's Administration Medical Research Service
and the US National Institute of Mental Health (MH4212,
MH38321).
References
Adler LE, Pachtman E, Franks RD, Pecevich M, Waldo MC, Freedman R.
Neurophysiological evidence for a defect in neuronal mechanisms
involved in sensory gating in schizophrenia. Biol Psychiatry
1982;17:639±654.
Adler LE, Rose G, Freedman R. Neurophysiological studies of sensory
gating in rats: effects of amphetamine, phencyclidine, and haloperidol.
Biol Psychiatry 1986;21:787±798.
Adler LE, Pang K, Gerhardt G, Rose GM. Modulation of the gating of
auditory evoked potentials by norepinephrine: pharmacological
evidence obtained using a selective neurotoxin. Biol Psychiatry
1988;24:179±190.
Adler LE, Hoffer L, Nagamoto HT, Waldo MC, Kisley MA, Grif®th JM.
Yohimbine impairs P50 auditory sensory gating in normal subjects.
Neuropsychopharmacology 1994;10:249±257.
Adler LE, Olincy A, Waldo M, Harris JG, Grif®th J, Stevens K, Flach K,
Nagamoto H, Bickford P, Leonard S, et al. Schizophrenia, sensory
gating, and nicotinic receptors. Schizophr Bull 1998;24:189±202.
Adler LE, Olincy A, Cawthra E, Hoffer M, Nagamoto HT, Amass L, Freed-
man R. Reversal of diminished inhibitory sensory gating in cocaine
addicts by a nicotinic cholinergic mechanism. Neuropsychopharmacol-
ogy 2001;24:671±679.
Arciniegas D, Olincy A, Topkoff J, McRae K, Cawthra E, Filley CM, Reite
M, Adler LE. Impaired auditory gating and P50 non-suppression
following traumatic brain injury. J Neuropsychiatry Clin Neurosci
2000;12:77±85.
Barnet AB, Ohlrich ES, Weiss IP, Shanks B. Auditory evoked potentials
during sleep in normal children from ten days to three years of age.
Electroenceph clin Neurophysiol 1975;39:29±41.
Bes F, Schulz H, Navelet Y, Salzarulo P. The distribution of slow-wave
sleep across the night: a comparison for infants, children, and adults.
Sleep 1991;14:5±12.
BorbeÂly AA. A two process model of sleep regulation. Hum Neurobiol
1982;1:195±204.
Boutros NN, Zouridakis G, Overall J. Replication and extension of P50
®ndings in schizophrenia. Clin Electroencephalogr 1991;22:40±45.
Boutros N, Campbell D, Petrakis I, Krystal J, Caporale M, Kosten T.
Cocaine use and the mid-latency auditory evoked responses. Psychiatry
Res 2000;96:117±126.
Cardenas VA, Gerson J, Fein G. The reliability of P50 suppression as
measured by the conditioning/testing ratio is vastly improved by dipole
modeling. Biol Psychiatry 1993;33:335±344.
Cardenas VA, Gill P, Fein G. Human P50 suppression is not affected by
variations in wakeful alertness. Biol Psychiatry 1997;41:891±901.
Clementz BA, Geyer MA, Braff DL. P50 suppression among schizophrenia
and normal comparison subjects: a methodological analysis. Biol
Psychiatry 1997;41:1035±1044.
Cote KA, Campbell KB. P300 to high intensity stimuli during REM sleep.
Clin Neurophysiol 1999a;110:1345±1350.
Cote KA, Campbell KB. The effects of varying stimulus intensity on P300
during REM sleep. NeuroReport 1999b;10:2313±2318.
Davis H, Mast T, Yoshie N, Zerlin S. The slow response of the human
cortex to auditory stimuli: recovery process. Electroenceph clin Neuro-
physiol 1966;21:105±113.
de Lugt DR, Loewy DH, Campbell KB. The effect of sleep onset on event
related potentials with rapid rates of stimulus presentation. Electroen-
ceph clin Neurophysiol 1996;98:484±492.
Erwin RJ, Buchwald JS. Midlatency auditory evoked responses: differential
M.A. Kisley et al. / Clinical Neurophysiology 112 (2001) 1154±1165 1163

recovery cycle characteristics. Electroenceph clin Neurophysiol
1986a;64:417±423.
Erwin R, Buchwald JS. Midlatency auditory evoked responses: differential
effects of sleep in the human. Electroenceph clin Neurophysiol
1986b;65:383±392.
Erwin RJ, Mawhinney-Hee M, Gur RC, Gur RE. Midlatency auditory
evoked responses in schizophrenia. Biol Psychiatry 1991;30:430±442.
Feinberg I. Changes in sleep cycle patterns with age. J Psychiatr Res
1974;10:283±306.
Freedman R, Coon H, Myles-Worsley M, Orr-Urtreger A, Olincy A, Davis
A, Polymeropoulos M, Holik J, Hopkins J, Hoff M, et al. Linkage of a
neurophysiological de®cit in schizophrenia to a chromosome 15 locus.
Proc Natl Acad Sci USA 1997;94:587±592.
Goldstein R, Rodman LB, Karlovich RS. Effect of stimulus rate and number
on the early components of the averaged electroencephalic response. J
Speech Hear Res 1972;15:559±566.
Grif®th JM, Freedman R. Normalization of the auditory P50 gating de®cit
of schizophrenic patients after non-REM but not REM sleep. Psychiatry
Res 1995;56:271±278.
Grif®th JM, Waldo M, Adler LE, Freedman R. Normalization of auditory
sensory gating in schizophrenic patients after a brief period of sleep.
Psychiatry Res 1993;49:29±39.
Guterman Y, Josiassen RC, Bashore Jr TR. Attentional in¯uence on the P50
component of the auditory event-related brain potential. Int J Psycho-
physiol 1992;12:197±209.
Hobson JA, McCarley RW, Wyzinski PW. Sleep cycle oscillation: recipro-
cal discharge by two brainstem neuronal groups. Science 1975;189:55±
58.
Jerger K, Biggins C, Fein G. P50 suppression is not affected by attentional
manipulations. Biol Psychiatry 1992;31:365±377.
Johnson MR, Adler LE. Transient impairment in P50 auditory sensory
gating induced by a cold-pressor test. Biol Psychiatry 1993;33:380±
387.
Jones LA, Baxter RJ. Changes in the auditory middle latency responses
during all-night sleep recording. Br J Audiol 1988;22:279±285.
Judd LL, McAdams L, Budnick B, Braff DL. Sensory gating de®cits in
schizophrenia: new results. Am J Psychiatry 1992;149:488±493.
Kathmann N, Engel RR. Sensory gating in normals and schizophrenics: a
failure to ®nd strong P50 suppression in normals. Biol Psychiatry
1990;27:1216±1226.
Kevanishvili ZS, von Specht H. Human slow auditory evoked potentials
during natural and drug-induced sleep. Electroenceph clin Neurophy-
siol 1979;47:280±288.
Kisley MA, Gerstein GL. Trial-to-trial variability and state-dependent
modulation of auditory-evoked responses in cortex. J Neurosci
1999;19:10451±10460.
Light GA, Braff DL. Do self-reports of perceptual anomalies re¯ect gating
de®cits in schizophrenia patients? Biol Psychiatry 2000;47:463±467.
Loewy DH, Campbell KB, Bastien C. The mismatch negativity to
frequency deviant stimuli during natural sleep. Electroenceph clin
Neurophysiol 1996;98:493±501.
Loewy DH, Campbell KB, de Lugt DR, Elton M, Kok A. The mismatch
negativity during natural sleep: intensity deviants. Clin Neurophysiol
2000;111:863±872.
LuÈ Z-L, Williamson SJ, Kaufman L. Human auditory primary and associa-
tion cortex have differing lifetimes for activation traces. Brain Res
1992;572:236±241.
Luntz-Leybman V, Bickford PC, Freedman R. Cholinergic gating of
response to auditory stimuli in rat hippocampus. Brain Res
1992;587:130±136.
McCallin K, Cardenas VA, Fein G. P50 event-related brain potential ampli-
tude and suppression measurements recorded with subjects seated
versus supine. Biol Psychiatry 1997;41:902±905.
Nagamoto HT, Adler LE, Waldo MC, Freedman R. Sensory gating in
schizophrenics and normal controls: effects of changing stimulation
interval. Biol Psychiatry 1989;25:549±561.
Nagamoto HT, Adler LE, Waldo MC, Grif®th J, Freedman R. Gating of
auditory response in schizophrenics and normal controls: effects of
recording site and stimulation interval on the P50 wave. Schizophr
Res 1991;4:31±40.
Nashida T, Yabe H, Sato Y, Hiruma T, Sutoh T, Shinozaki N, Kaneko S.
Automatic auditory information processing in sleep. Sleep
2000;23:821±828.
Nelson DA, Lassman FM. Effects of intersignal interval on the human
auditory evoked response. J Acoust Soc Am 1968;44:1529±1532.
Neylan TC, Fletcher DJ, Lenoci M, McCallin K, Weiss DS, Schoenfeld FB,
Marmar CR, Fein G. Sensory gating in chronic posttraumatic stress
disorder: reduced auditory P50 suppression in combat veterans. Biol
Psychiatry 1999;46:1656±1664.
Olincy A, Ross RG, Harris JG, Young DA, McAndrews M, Cawthra E,
McRae KA, Sullivan B, Adler LE, Freedman R. The P50 auditory
event-evoked potential in adult attention-de®cit disorder: comparison
with schizophrenia. Biol Psychiatry 2000;47:969±977.
Ornitz EM, Lee JCM, Tanguay PE, Sivertsen B, Wilson C. The effect of
stimulus interval on the auditory evoked response during sleep in
normal children. Electroenceph clin Neurophysiol 1972;33:159±166.
Ornitz EM, Tanguay PE, Forsythe AB, de la PeÂna A, Ghahremani J. The
recovery cycle of the averaged auditory evoked response during sleep in
normal children. Electroenceph clin Neurophysiol 1974;37:113±122.
Paavilainen P, Cammann R, Alho K, Reinikainen K, Sams M, NaÈaÈtaÈnen R.
Event-related potentials to pitch change in an auditory stimulus
sequence during sleep. In: Johnson Jr R, Rohrbaugh JW, Parasuraman
R, editors. Current trends in event-related potential research, Amster-
dam: Elsevier, 1987. pp. 246±255.
Patterson JV, Jin Y, Gierczak M, Hetrick WP, Potkin S, Bunney WE,
Sandman CA. Effects of temporal variability on P50 and the gating
ratio in schizophrenia. Arch Gen Psychiatry 2000;57:57±64.
Patrick G, Struve FA. Reduction of auditory P50 gating response in mari-
huana users: further supporting data. Clin Electroencephalogr
2000;31:88±93.
Rechtschaffen A, Kales A. A manual of standardized terminology, techni-
ques and scoring system for sleep stages of human subjects, . Washing-
ton, DC: Public Health Service, US Government Printing Of®ce, 1968.
RoÈschke J, Mann K, Riemann D, Frank C, Fell J. Sequential analysis of the
brain's transfer properties during consecutive REM episodes. Electro-
enceph clin Neurophysiol 1995;96:390±397.
Sallinen M, Kaartinen J, Lyytinen H. Processing of auditory stimuli during
tonic and phasic periods of REM sleep as revealed by event-related
brain potentials. J Sleep Res 1996;5:220±228.
Siegel C, Waldo M, Mizner G, Adler LE, Freedman R. De®cits in sensory
gating in schizophrenic patients and their relatives: evidence obtained
with auditory evoked responses. Arch Gen Psychiatry 1984;41:607±
612.
Skinner RD, Rasco LM, Fitzgerald J, Karson CN, Matthew M, Williams
DK, Garcia-Rill E. Reduced sensory gating of the P1 potential in rape
victims and combat veterans with posttraumatic stress disorder. Depress
Anxiety 1999;9:122±130.
Smith DA, Boutros NN, Schwarzkopf SB. Reliability of P50 auditory
event-related potential indices of sensory gating. Psychophysiology
1994;31:495±502.
Stevens KE, Meltzer J, Rose GM. Disruption of sensory gating by the a2
selective noradrenergic antagonist yohimbine. Biol Psychiatry
1993;33:130±132.
Stevens KE, Freedman R, Collins AC, Hall M, Leonard S, Marks MJ, Rose
GM. Genetic correlation of inhibitory gating of hippocampal auditory
evoked response and a-bungarotoxin-binding nicotinic cholinergic
receptors in inbred mouse strains. Neuropsychopharmacology
1996;15:152±162.
Suzuki T, Kobayashi K, Hirabayashi M. Frequency composition of auditory
middle responses. Br J Audiol 1983;17:1±4.
Tanila H, Wang J, Gurevicius K, Ikonen S, PaÈaÈkkoÈnen A, Tarkka I. Altered
auditory gating in familial Alzheimer's disease and in transgenic mice
with APP and PS1 mutations. Soc Neurosci Abstr 2000;26:1545.
Teo C, Rasco L, Al-Mefty K, Skinner RD, Boop FA, Garcia-Rill E.
M.A. Kisley et al. / Clinical Neurophysiology 112 (2001) 1154±11651164

Decreased habituation of midlatency auditory evoked responses in
Parkinson's disease. Mov Disord 1997;12:655±664.
Waldo MC, Cawthra E, Adler LE, Dubester S, Staunton M, Nagamoto H,
Baker N, Madison A, Simon J, Scherzinger A, et al. Auditory sensory
gating, hippocampal volume, and catecholamine metabolism in schizo-
phrenics and their siblings. Schizophr Res 1994;12:93±106.
Weitzman ED, Kremen H. Auditory evoked responses during different
stages of sleep in man. Electroenceph clin Neurophysiol 1965;18:65±70.
White PM, Yee CM. Effects of attentional and stressor manipulations on the
P50 gating response. Psychophysiology 1997;34:703±711.
Williams HL, Tepas DI, Morlock Jr HC. Evoked responses to clicks and
electroencephalographic stages of sleep in man. Science 1962;138:685±
686.
Wood CC, Wolpaw JR. Scalp distribution of human auditory evoked poten-
tials. II. evidence for overlapping sources and involvement of auditory
cortex. Electroenceph clin Neurophysiol 1982;54:25±38.
Woods DL. The component structure of the N100 wave of the human
auditory evoked potential. In: Karmos G, MolnaÂr M, CseÂpe V, Czigler
I, Desmedt JE, editors. Perspectives of event-related potentials research,
Amsterdam: Elsevier, 1995. pp. 102±109.
WoÈrgoÈtter F, Eysel UT. Context, state and the receptive ®elds of striatal
cortex cells. Trends Neurosci 2000;23:497±503.
M.A. Kisley et al. / Clinical Neurophysiology 112 (2001) 1154±1165 1165