Industrial development and industrial finance in Brazil and ...
Upload
khangminh22Category
view
1download
0
•VIS
ION
S•SCIENCE•TEC
HN
OL
OG
Y•RESEARCHHIGHLI
GH
TS
Dissertation
19
VT
T S
CIE
NC
E 1
9
Ele
ctro
co
ag
ula
tion
in th
e tre
atm
en
t of in
du
strial w
ate
rs an
d w
aste
wa
tersISBN 978-951-38-7940-2 (soft back ed.)
ISBN 978-951-38-7941-9 (URL: http://www.vtt.fi/publications/index.jsp)ISSN 2242-119X (soft back ed.) ISSN 2242-1203 (URL: http://www.vtt.fi/publications/index.jsp)
Electrocoagulation in the treatment of industrial waters and wastewaters
Chemical coagulation is commonly used in raw water and wastewater treatment plants for the destabilisation of pollutants so that they can be removed in the subsequent separation processes. The most commonly used coagulation chemicals are aluminium and iron metal salts. Electrocoagulation technology has also been proposed for the treatment of raw waters and wastewaters. With this technology, metal cations are produced on the electrodes via electrolysis and these cations form various hydroxides in the water depending on the water pH. In addition to this main reaction, several side reactions, such as hydrogen bubble formation and the reduction of metals on cathodes, also take place in the cell. In this research, the applications of electrocoagulation were investigated in raw water treatment and wastewater applications.
Electrocoagulation in the treatment of industrial waters and wastewatersMikko Vepsäläinen

VTT SCIENCE 19
Electrocoagulation in the treatment of industrial waters and wastewaters
Mikko Vepsäläinen
Thesis for the degree of Doctor of Science (Technology) to be presented with due permission for public examination and criticism in chamber music audito-rium at the Concert and Congress House Mikaeli, Mikkeli, Finland on the 2nd of November, 2012 at noon.
ISBN 978-951-38-7940-2 (soft back ed.) ISSN 2242-119X (soft back ed.)
ISBN 978-951-38-7941-9 (URL: http://www.vtt.fi/publications/index.jsp) ISSN 2242-1203 (URL: http://www.vtt.fi/publications/index.jsp)
Copyright © VTT 2012
JULKAISIJA – UTGIVARE – PUBLISHER
VTT PL 1000 (Tekniikantie 4 A, Espoo) 02044 VTT Puh. 020 722 111, faksi 020 722 7001
VTT PB 1000 (Teknikvägen 4 A, Esbo) FI-2044 VTT Tfn. +358 20 722 111, telefax +358 20 722 7001
VTT Technical Research Centre of Finland P.O. Box 1000 (Tekniikantie 4 A, Espoo) FI-02044 VTT, Finland Tel. +358 20 722 111, fax +358 20 722 7001
Kopijyvä Oy, Kuopio 2012
3
Electrocoagulation in the treatment of industrial waters and wastewaters Mikko Vepsäläinen. Espoo 2012. VTT Science 19. 96 p. + app. 50 p.
Abstract Chemical coagulation is commonly used in raw water and wastewater treatment plants for the destabilisation of pollutants so that they can be removed in the sub-sequent separation processes. The most commonly used coagulation chemicals are aluminium and iron metal salts. Electrocoagulation technology has also been proposed for the treatment of raw waters and wastewaters. With this technology, metal cations are produced on the electrodes via electrolysis and these cations form various hydroxides in the water depending on the water pH. In addition to this main reaction, several side reactions, such as hydrogen bubble formation and the reduction of metals on cathodes, also take place in the cell. In this research, the applications of electrocoagulation were investigated in raw water treatment and wastewater applications.
The surface water used in this research contained high concentrations of natu-ral organic matter (NOM). The effect of the main parameters – current density, initial pH, electric charge per volume, temperature and electrolysis cell construc-tion – on NOM removal were investigated. In the wastewater treatment studies, the removal of malodorous sulphides and toxic compounds from the wastewaters and debarking effluents were studied. Also, the main parameters of the treatment, such as initial pH and current density, were investigated. Aluminium electrodes were selected for the raw water treatment, whereas wastewaters and debarking effluent were treated with iron electrodes.
According to results of this study, aluminium is more suitable electrode material for electrocoagulation applications because it produces Al(III) species. Metal ions and hydroxides produced by iron electrodes are less effective in the destabilisation of pollutants because iron electrodes produce more soluble and less charged Fe(II) species. However, Fe(II) can be effective in some special applications, such as sulphide removal. The resulting metal concentration is the main parameter affecting destabilisation of pollutants. Current density, treatment time, temperature and electrolysis cell construction affect the dissolution of electrodes and hence also the removal of pollutants. However, it seems that these parameters have minimal significance in the destabilization of the pollutants besides this effect (in the studied range of parameters). Initial pH and final pH have an effect on the dissolution of electrodes, but they also define what aluminium or iron species are formed in the solution and have an effect on the -potential of all charged species in the solution. According to the results of this study, destabilisation mechanisms of pollutants by electrocoagulation and chemical coagulation are similar.
4
Optimum DOC removal and low residual aluminium can be obtained simultane-ously with electrocoagulation, which may be a significant benefit of electrocoagula-tion in surface water treatment compared to chemical coagulation. Surface water treatment with electrocoagulation can produce high quality water, which could be used as potable water or fresh water for industrial applications. In wastewater treatment applications, electrocoagulation can be used to precipitate malodorous sulphides to prevent their release into air. Technology seems to be able to remove some toxic pollutants from wastewater and could be used as pretreatment prior to treatment at a biological wastewater treatment plant. However, a thorough eco-nomic and ecological comparison of chemical coagulation and electrocoagulation is recommended, because these methods seem to be similar in pollutant destabilisa-tion mechanisms, metal consumption and removal efficiency in most applications.
Keywords Electrocoagulation, water treatment, wastewater treatment
5
Preface This study was carried out between 2006 and 2011 at the Laboratory of Green Chemistry, Mikkeli, Finland with financial support from the European Union, the City of Mikkeli, Savcor Forest Oy and UPM-Kymmene Oyj.
I am highly grateful to my supervisor Professor Mika Sillanpää for giving me the opportunity to conduct these studies at the Laboratory of Green Chemistry and for his guidance and support. I am also very grateful to Martti Pulliainen for his guid-ance, encouragement and support throughout the whole process. I would like to thank my amazing colleagues at the Laboratory of Green Chemistry, my former employer Savcor Forest Oy and my current employer VTT Materials and Building for their help, support and great company. I am naturally very thankful to my co-authors for their contribution and support.
I am grateful for my friends and family for their support, encouragement and love. Somehow they always thought I would finish this work, even when I was ready to give up. Last but not least, I would like to express my deepest gratitude to my partner, for the love, support, humour, sensibility, care and all other great things you brought into my life.

6
Academic dissertation Supervisor Professor Mika Sillanpää
Lappeenranta University of Technology Department of Energy and Environmental Technology Laboratory of Green Chemistry Patteristonkatu 1 FI-50190 Mikkeli, Finland
Reviewers Professor Raimo Alén University of Jyväskylä Department of Chemistry P.O. Box 35 FI-40014 University of Jyväskylä, Finland Professor Guohua Chen The Hong Kong University of Science and Technology Department of Chemical and Biomolecular Engineering Clear Water Bay Kowloon, Hong Kong
Opponent Professor Raimo Alén University of Jyväskylä Department of Chemistry P.O. Box 35 FI-40014 University of Jyväskylä, Finland
7
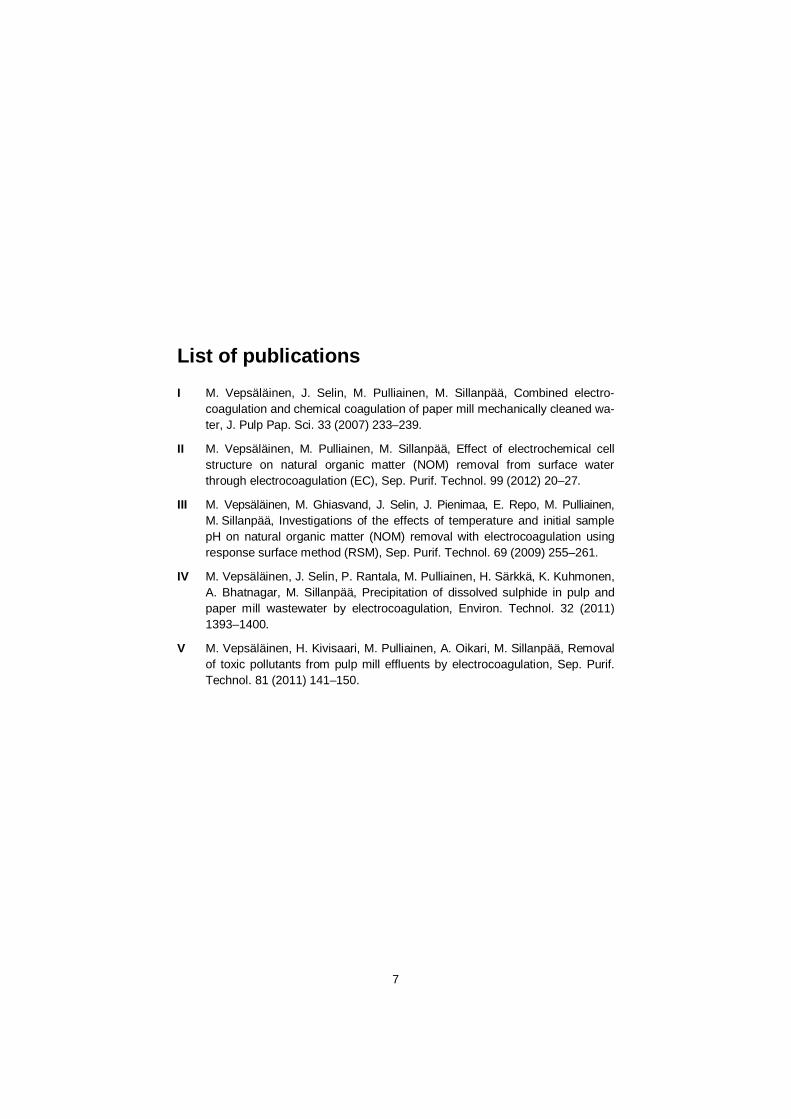
List of publications I M. Vepsäläinen, J. Selin, M. Pulliainen, M. Sillanpää, Combined electro-
coagulation and chemical coagulation of paper mill mechanically cleaned wa-ter, J. Pulp Pap. Sci. 33 (2007) 233–239.
II M. Vepsäläinen, M. Pulliainen, M. Sillanpää, Effect of electrochemical cell structure on natural organic matter (NOM) removal from surface water through electrocoagulation (EC), Sep. Purif. Technol. 99 (2012) 20–27.
III M. Vepsäläinen, M. Ghiasvand, J. Selin, J. Pienimaa, E. Repo, M. Pulliainen, M. Sillanpää, Investigations of the effects of temperature and initial sample pH on natural organic matter (NOM) removal with electrocoagulation using response surface method (RSM), Sep. Purif. Technol. 69 (2009) 255–261.
IV M. Vepsäläinen, J. Selin, P. Rantala, M. Pulliainen, H. Särkkä, K. Kuhmonen, A. Bhatnagar, M. Sillanpää, Precipitation of dissolved sulphide in pulp and paper mill wastewater by electrocoagulation, Environ. Technol. 32 (2011) 1393–1400.
V M. Vepsäläinen, H. Kivisaari, M. Pulliainen, A. Oikari, M. Sillanpää, Removal of toxic pollutants from pulp mill effluents by electrocoagulation, Sep. Purif. Technol. 81 (2011) 141–150.
8
Author’s contributions to the publications I–III The author carried out all experiments, analysed the data, and prepared
the first draft of the manuscript.
IV–V The author planned and supervised the experiments and conducted part of the experiments. The author analysed the most of the data and pre-pared the first draft of the manuscript.
9
Contents Abstract ........................................................................................................... 3
Preface ............................................................................................................. 5
Academic dissertation ..................................................................................... 6
List of publications .......................................................................................... 7
Author’s contributions to the publications ..................................................... 8
Abbreviations ................................................................................................ 11
1. Introduction ............................................................................................. 13 1.1 Basic concepts and theory of coagulation and flocculation with
hydrolysing metal salts ...................................................................... 14 1.1.1 Interface of colloidal particles ................................................. 14 1.1.2 Stability of colloids in aqueous solutions ................................. 16 1.1.3 Destabilisation mechanisms of colloids ................................... 17 1.1.4 Commonly used metal salt coagulants .................................... 19 1.1.5 Applications of metal salt coagulants in industrial raw water and
wastewater treatment ............................................................. 24 1.2 Theory of electrocoagulation ............................................................. 26
1.2.1 Main reactions ....................................................................... 27 1.2.2 Side reactions ........................................................................ 30 1.2.3 Properties of the sludge ......................................................... 32 1.2.4 Treatment parameters............................................................ 33 1.2.5 Comparison of electrocoagulation and chemical coagulation ... 38
1.3 Practical considerations of electrocoagulation .................................... 39 1.3.1 Constructions of electrocoagulation systems........................... 39 1.3.2 Applications of electrocoagulation .......................................... 41 1.3.3 Combinations of electrocoagulation and other water treatment
technologies .......................................................................... 46 1.3.4 Economical and ecological considerations .............................. 46
2. Objectives and structure of the work...................................................... 48 2.1 Surface water treatment by electrocoagulation................................... 48
10
2.2 Wastewater treatment by electrocoagulation...................................... 48
3. Materials and methods ............................................................................ 49 3.1 Water samples and chemicals ........................................................... 49 3.2 Water treatment procedure ............................................................... 51 3.3 Analytical methods ........................................................................... 52
3.3.1 Chemical analysis .................................................................. 52 3.3.2 Toxicity analysis .................................................................... 53
3.4 Statistical methods ........................................................................... 53
4. Results and discussion........................................................................... 56 4.1 Quality of the statistical models ......................................................... 56 4.2 Dissolving of electrodes .................................................................... 56
4.2.1 Aluminium electrodes ............................................................. 57 4.2.2 Iron electrodes ....................................................................... 60
4.3 Change of pH and conductivity .......................................................... 61 4.4 Surface water treatment .................................................................... 62
4.4.1 Organic matter removal .......................................................... 62 4.4.2 Residual metals and turbidity.................................................. 68
4.5 Wastewater treatment ....................................................................... 69 4.5.1 Organic matter removal .......................................................... 69 4.5.2 Sulphide precipitation ............................................................. 72 4.5.3 Resin acids, copper and toxicity removal ................................ 73
5. Conclusions and recommendations ....................................................... 77
References ..................................................................................................... 79 Appendices
Publications I–V
11
Abbreviations
AC Alternating current
ANOVA Analysis of variance
BOD Biological oxygen demand
CCF Central composite face
COD Chemical oxygen demand
DAF Dissolved air flotation
DC Direct current
DHAA Dehydroabietic acid
DLVO Derjaguin-Landau-Verwey-Overbeek (theory)
DOC Dissolved organic carbon
DOE Design of experiments
EC Electrocoagulation
EC50 Half maximal effective concentration
EDL Electrical double layer
EF Electroflotation
FTIR Fourier transform infrared spectroscopy
GC-MS Gas chromatograph - mass spectrometry
HMM High molecular mass
HPAC Highly efficient composite polyaluminium chloride
ICP-OES Inductively coupled plasma optical atomic emission spectrometry
IPA Isopimaric acid
MLR Multiple linear regression
NOM Natural organic matter
NTU Nephelometric turbidity unit
12
OHP Outer Helmholtz plane
ORP Oxidation-reduction potential
PACl Polymeric aluminium chloride
PAF-SiC Polyaluminium ferric silicate chloride
PASiC Polyaluminium silicate chloride
PDADMAC Polydiallyl dimethyl ammonium chloride
PFC Polyferric chloride
PFS Polyferric sulphate
PFSiS Polyferric silicate sulphate
PICl Polymeric iron chloride
PLS Partial least squares
PSF Polysilicate ferric
PtCo Platinum-cobalt scale
PXRD Powder X-ray diffraction
RSM Response surface model
SCE Saturated calomel electrode
SEM-EDS Scanning electron microscope with energy dispersive spectroscopy
SRB Sulphate reducing bacteria
SUVA Specific ultraviolet absorbance
SVI Sludge volume index
TOC Total organic carbon
TSS Total suspended solids
USD United Stated dollar
UV/VIS Ultraviolet-visible spectroscopy
XPS X-ray photoelectron spectroscopy
1. Introduction
13
1. Introduction
There is a growth in demand for new water treatment technologies as the world’s population increases and fresh water sources are polluted. Waterborne diseases are still common in developing countries due to the lack of funding or appropriate know-how for water purification. Industry also uses these limited water sources and has to acquiesce to lower quality raw water as a higher proportion of fresh water is required for human consumption. Wastewater treatment technologies used in both municipal and industrial applications have to be further developed in order to reduce the pollution of receiving water bodies.
Chemical coagulation and flocculation are commonly used as a part of the wa-ter purification systems for the removal of pollutants from raw waters and wastewaters. Their main function is to enhance particle separation in the subse-quent processes, such as filtration, sedimentation or flotation. In order to under-stand destabilisation of particles by coagulants and flocculants, it is crucial to understand the mechanisms which stabilise particles in aqueous solutions. Chem-ical coagulation and flocculation are used in both industrial and municipal raw water and wastewater treatment systems. They can enhance the removal of sev-eral types of pollutants from the water streams. Typical examples of pollutants to be removed are nutrients, toxic heavy metals and natural organic matter (NOM). The most commonly used coagulants are aluminium or iron salts, such as sul-phates and chlorides. These metal salts form various hydrolysis products in the water depending on water chemistry, such as pH and the concentration of anions. Metal cations and hydroxides destabilise colloid pollutants in water by reducing repulsion forces between the colloids and by entrapping particles in the sludge.
Electrocoagulation (EC) has been suggested as an advanced alternative to chemical coagulation in pollutant removal from raw waters and wastewaters. In this technology, metal cations are released into water through dissolving metal electrodes. Simultaneously, beneficial side reactions can remove flocculated ma-terial from the water. However, there are also adverse side reactions, such as deposition of salts on the electrode surface, which may cause deterioration of removal efficiency after long operation. As in the case of chemical coagulation with metal salts, aluminium or iron cations and hydroxides are the active compounds in EC. Chemical coagulation and EC have fundamentally similar destabilisation
1. Introduction
14
mechanisms and it is therefore important to go through the theory of colloid desta-bilisation with metal salt coagulants, because chemical coagulation has been studied more extensively than EC.
1.1 Basic concepts and theory of coagulation and flocculation with hydrolysing metal salts
Pollutants in raw waters and wastewaters are typically colloidal particles, which are not easily removed with typical filtration sedimentation or flotation due to their stability in water. These particles have special properties due to their small size and large total surface area. The properties of the interface of colloidal particles and the stabilisation of colloidal particles by hydrolysing metal salts are discussed in the first section of this work.
1.1.1 Interface of colloidal particles
Colloid is a microscopic particle, typically having at least one dimension in the range of 1 nm to 10 µm, which is dispersed throughout the other substance [1]. This medium where particles are dispersed can be gas, liquid or solid. The com-bined surface area of colloids in dispersions is large due to their small size and therefore surface properties play an important role in their characteristics. Natural waters and typical wastewaters are heterodispersions, having a wide variety of particles with different particles sizes [2].
Stability and destabilisation of colloids in solutions is the result of their surface charge. Surface immersed into a solution can attain a charge by ionisation of surface groups, by ion adsorption, by dissolution of ionic solids or by isomorphous substitution [1]. Many surfaces contain ionisable functional groups, such as –OH, –COOH or –NH2. Surface charge therefore depends on the ionisation of these functional groups and consequently on the pH of the solution [3]. Isomorphous substitution occurs when lattice imperfection occurs at the crystal due to the re-placement of some atom in the crystal by another ion that has a different amount of electrons, which results in a charged surface. This occurs for example in clay particles. Adsorption of ions has an impact on surface charge of the particles. Dissolution of ionic solids can cause a charge on the surface if the dissolution of anions and cations from the solid is unequal.
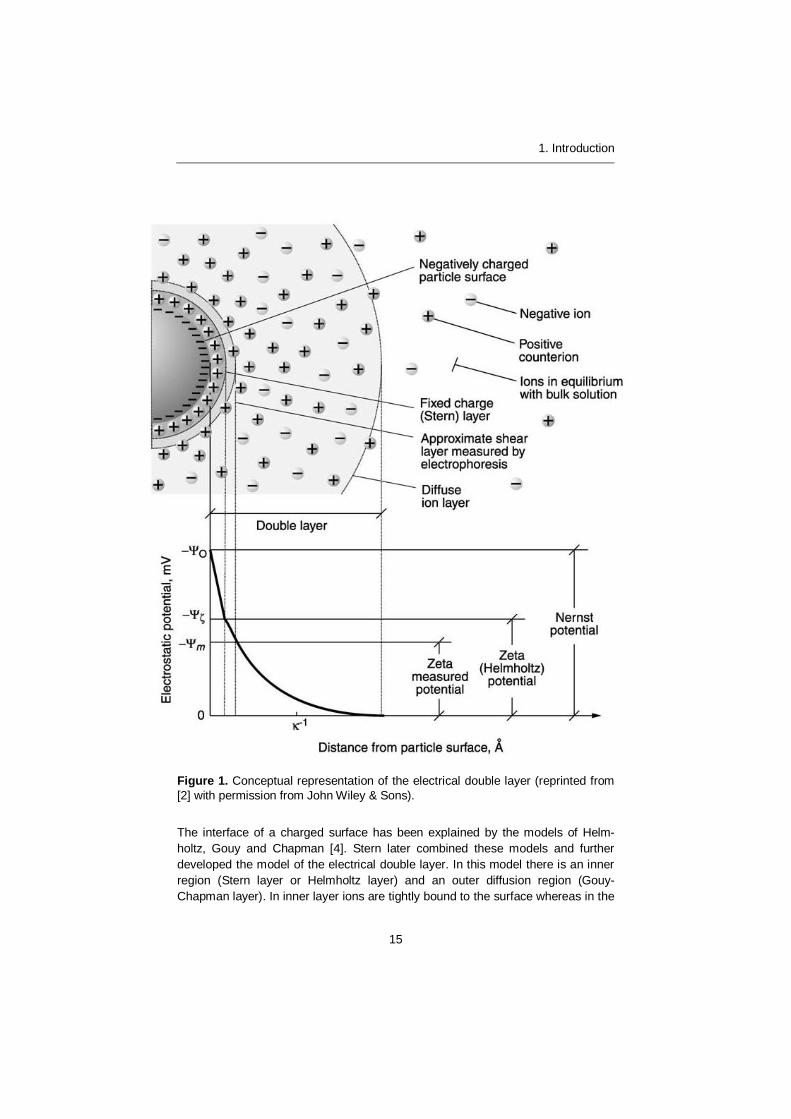
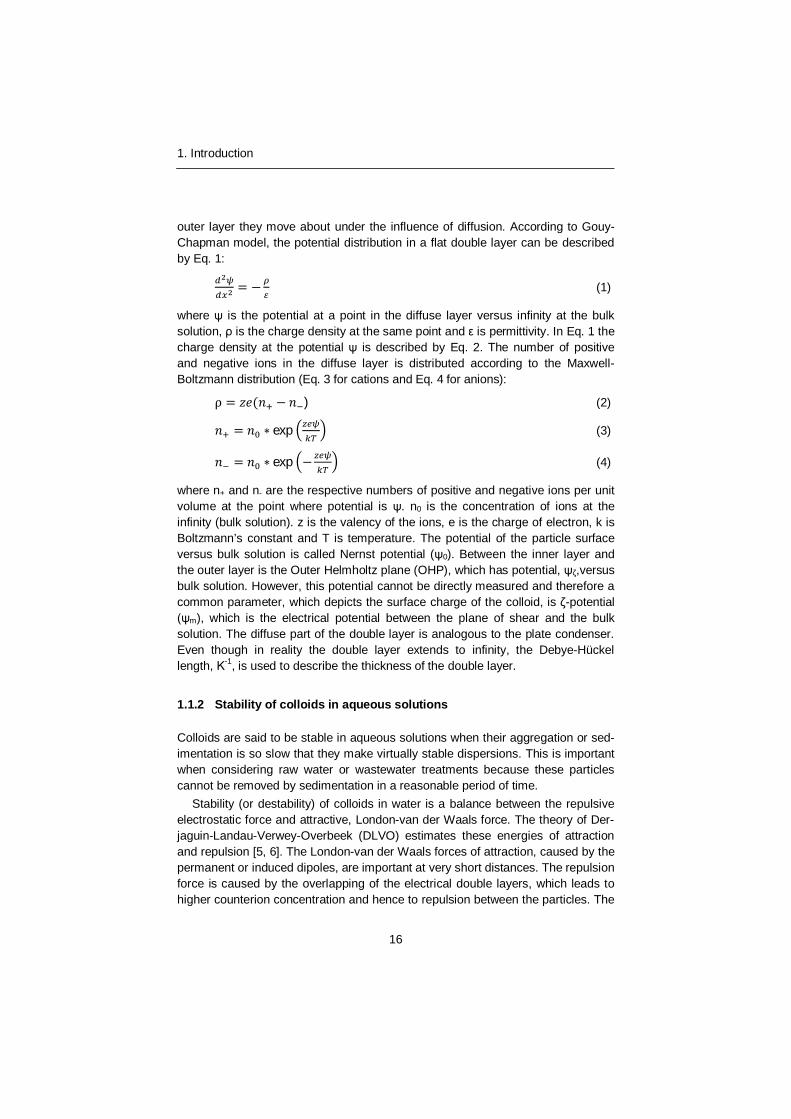
When a charge forms on the surface it also affects the ions in the surrounding solution. The ions of opposite charge are attracted towards the surface, whereas the ions of the same charge are repelled from the surface. This separation of charges on the particle surface results in the formation of electrical double layer (EDL) presented in Fig. 1 [1–4].
1. Introduction
15
Figure 1. Conceptual representation of the electrical double layer (reprinted from [2] with permission from John Wiley & Sons).
The interface of a charged surface has been explained by the models of Helm-holtz, Gouy and Chapman [4]. Stern later combined these models and further developed the model of the electrical double layer. In this model there is an inner region (Stern layer or Helmholtz layer) and an outer diffusion region (Gouy-Chapman layer). In inner layer ions are tightly bound to the surface whereas in the
1. Introduction
16
outer layer they move about under the influence of diffusion. According to Gouy-Chapman model, the potential distribution in a flat double layer can be described by Eq. 1:
(1)
where is the potential at a point in the diffuse layer versus infinity at the bulk solution, is the charge density at the same point and is permittivity. In Eq. 1 the charge density at the potential is described by Eq. 2. The number of positive and negative ions in the diffuse layer is distributed according to the Maxwell-Boltzmann distribution (Eq. 3 for cations and Eq. 4 for anions):
) (2)
exp (3)
exp (4)
where n+ and n- are the respective numbers of positive and negative ions per unit volume at the point where potential is . n0 is the concentration of ions at the infinity (bulk solution). z is the valency of the ions, e is the charge of electron, k is Boltzmann’s constant and T is temperature. The potential of the particle surface versus bulk solution is called Nernst potential ( 0). Between the inner layer and the outer layer is the Outer Helmholtz plane (OHP), which has potential, ,versus bulk solution. However, this potential cannot be directly measured and therefore a common parameter, which depicts the surface charge of the colloid, is -potential
m), which is the electrical potential between the plane of shear and the bulk solution. The diffuse part of the double layer is analogous to the plate condenser. Even though in reality the double layer extends to infinity, the Debye-Hückel length, -1, is used to describe the thickness of the double layer.
1.1.2 Stability of colloids in aqueous solutions
Colloids are said to be stable in aqueous solutions when their aggregation or sed-imentation is so slow that they make virtually stable dispersions. This is important when considering raw water or wastewater treatments because these particles cannot be removed by sedimentation in a reasonable period of time.
Stability (or destability) of colloids in water is a balance between the repulsive electrostatic force and attractive, London-van der Waals force. The theory of Der-jaguin-Landau-Verwey-Overbeek (DLVO) estimates these energies of attraction and repulsion [5, 6]. The London-van der Waals forces of attraction, caused by the permanent or induced dipoles, are important at very short distances. The repulsion force is caused by the overlapping of the electrical double layers, which leads to higher counterion concentration and hence to repulsion between the particles. The
1. Introduction
17
repulsion force is an exponential function of the distance between the particles with a range of the order of the thickness of the electrical double layer, whereas the attraction force decreases as an inverse power of the distance between the particles.
There are two minimums in the summation of attraction and repulsion forces between the particles having similar charges. The primary minimum, at a close distance between the particles, is where particles reside after coagulation. There is also a secondary minimum at longer distance and this is the energy minimum of flocculation. Potential energy at the primary minimum is significantly smaller than at the secondary minimum and hence the particles at the primary minimum are more tightly attached. Between the primary and secondary potential energy mini-mums, an energy barrier exists which the particles have to overcome with their kinetic energy before coagulation can take place. Detailed calculations of attrac-tion and repulsion forces have been discussed in the articles of Overbeek [7] and Verwey and Overbeek [6].
Ionic strength affects the thickness of double layer. The double layer com-presses when ionic strength increases according to Eq. 5. In addition to ionic strength, the valence of the ions also affects the thickness of the EDL. Multivalent counterions are concentrated in the double layer more than monovalent ions ac-cording to Eq. 3 and 4. According to the Schulze-Hardy rule, the optimum concen-tration for coagulation for tri-, di- and monovalent cations is 800:12:1. However, the required ion concentration of multivalent ions is often less than the Schultze-Hardy rule predicts [2].
= 10 (5)
where 1/ is Debye length, NA is Avogadro’s number, I is ionic strength and 0 is permittivity in vacuum.
1.1.3 Destabilisation mechanisms of colloids
As discussed in Section 1.1.2, colloids can be stable in water due to electrostatic repulsions between the particles. In coagulation and flocculation technologies, particles are destabilised with the addition of inorganic or organic chemicals which have an effect on the properties of EDL. Coagulants are chemicals which reduce the repulsive energy between the particles (energy barrier). Therefore particles can more easily agglomerate at the primary minimum of potential energy. Floccu-lation occurs when these agglomerated particles attach to each other with a weak bond (the secondary minimum of potential energy). Flocculation aids improve floc properties, such as settleability and filterability.
Mechanisms which can destabilise colloidal particles in water are [2, 3]:
Compression of electrical double layer. The increase of the concentra-tion of ions in bulk solution compresses EDL and particles come together
1. Introduction
18
more easily as the length of EDL decreases. Optimum destabilisation is achieved when -potential is close to 0 mV. Excess salt concentration does not lead to restabilisation of the particles. This mechanism is not employed in water treatment because very high salt concentrations are required for destabilisation.
Adsorption destabilisation. This occurs when oppositely charged ions or polymers are adsorbed on the surfaces of particles. They reduce surface charge and thus repulsive force between the particles. Destabilisation oc-curs typically at -potential values close to 0 mV. Too high a coagulant dose can lead to the restabilisation of the particles because the charge is reversed.
Inter-particle bridging. Polymerised metal coagulants or organic chemi-cals can form bridges between the particles. Polymer can adsorb on the particle surface by several mechanisms, such as charge-charge interac-tions, dipole interactions, hydrogen bonding or van der Waals interaction. When one polymer chain adsorbs on multiple particles, bridging occurs and molecular weight increases. Bridging is a typical mechanism with long-chained, high molecular weight organic polymers. The -potential of the particles which are destabilised by bridging mechanism is not typically close to zero. Restabilisation can occur when the surface is completely covered by the polymer.
Precipitation and enmeshment mechanism. This destabilisation mecha-nism is typical with the high concentrations of metal salts in near neutral pH. In this pH, metal salts, such as alum or ferric sulphate, form insoluble hy-drolysis products and polymerise. Colloidal particles can then be en-meshed into these sweep flocs. The required dosage of coagulant is virtu-ally independent of the type and concentration of colloids in the solution.
Adsorption destabilisation and inter-particle bridging mechanisms are susceptible to restabilisation when excess coagulant is added. In the bridging mechanism, restabilisation occurs when the adsorption sites of the particles are occupied and no further bridging can occur. In the overcharging phenomenon the inner part of the EDL carries more countercharge than exists on the surface of the particle [8, 9]. In this case, potentials and m are reversed from negative values to positive ones in typical colloids existing in raw water and wastewaters. However, double layer compression and precipitation mechanisms can again destabilise particles when even higher coagulant concentrations are used.
In typical coagulation processes of raw water and wastewater treatment plants there are several mixing stages. At the point of coagulation, fast mixing is required to properly disperse chemicals into the water stream and promote particle colli-sions. After this short fast mixing stage, water goes into slow mixing stage (floccu-lation) where induced velocity gradients provide particles opportunities for contact
1. Introduction
19
and further particle size growth. However, if the water velocity in the flocculation is too high it may cause floc breakdown. There are several types of mixers for fast and slow mixing stages and required conditions depend, e.g., pollutants to be removed and primary mechanism of destabilisation. Detailed description can found in [2, 3].
1.1.4 Commonly used metal salt coagulants
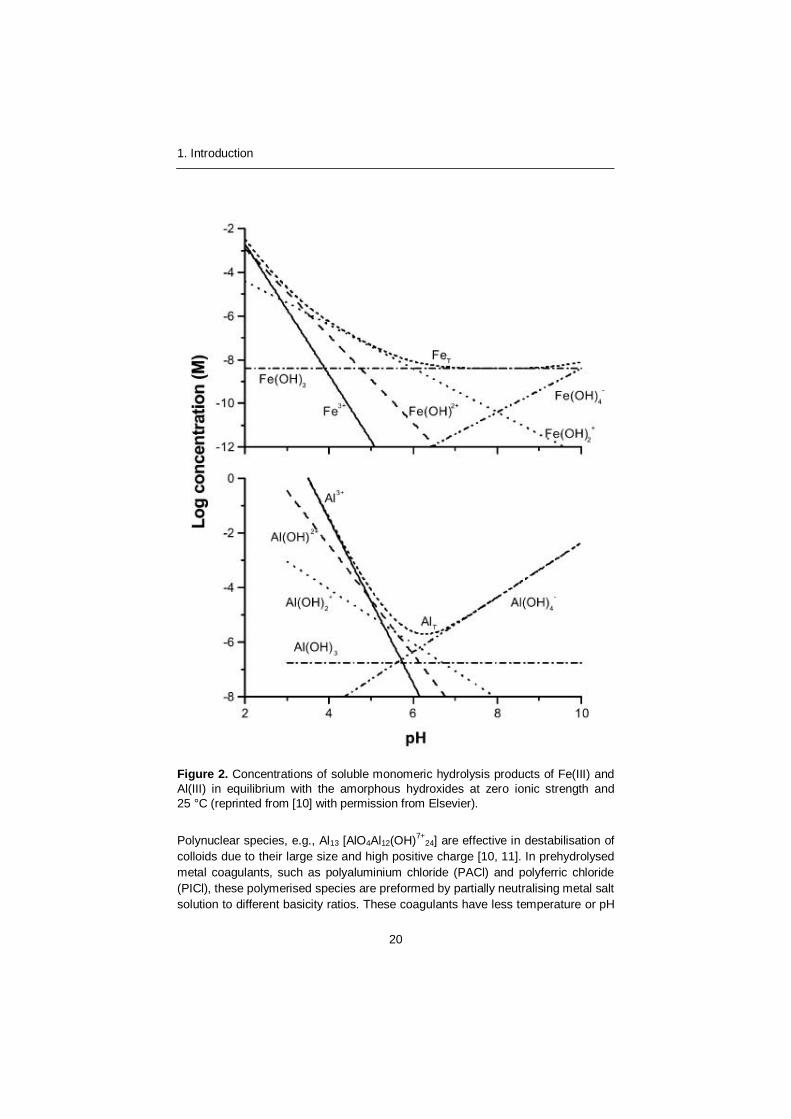
Aluminium and iron metal salts are used in raw water and wastewater treatment. Both metals can form multivalent ions, Al3+, Fe2+ and Fe3+, and various hydrolysis products [10]. Fe(II) is poor coagulant itself and is typically oxidised to Fe(III) form during the coagulation process to obtain higher efficiency. The most commonly used metals salts are simple aluminium and iron sulphates and chlorides. Metal cations go through a series of hydrolytic reactions depending on the pH of the solution and mononuclear (Fig. 2 and Eq. 6) and polynuclear hydroxides form in the solution. Neutral amorphous metal hydroxides, Al(OH)3 and Fe(OH)3, are poorly soluble species. Distribution of mononuclear species of metals can be pre-sented as solubility diagrams.
Me ( ) H Me(OH) H ) (6)
1. Introduction
20
Figure 2. Concentrations of soluble monomeric hydrolysis products of Fe(III) and Al(III) in equilibrium with the amorphous hydroxides at zero ionic strength and 25 °C (reprinted from [10] with permission from Elsevier).
Polynuclear species, e.g., Al13 [AlO4Al12(OH)7+24] are effective in destabilisation of
colloids due to their large size and high positive charge [10, 11]. In prehydrolysed metal coagulants, such as polyaluminium chloride (PACl) and polyferric chloride (PICl), these polymerised species are preformed by partially neutralising metal salt solution to different basicity ratios. These coagulants have less temperature or pH

1. Introduction
21
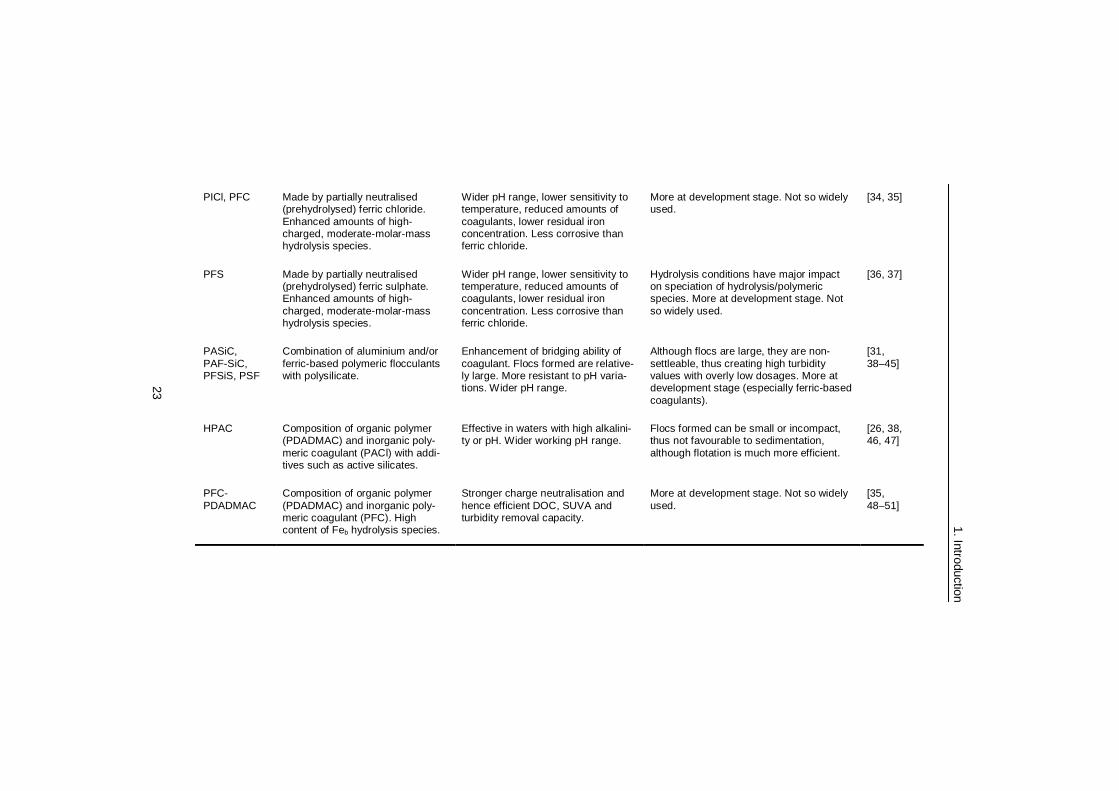
dependence and their alkalinity consumption is lower. Recently new types of co-agulants have been developed where prehydrolysed aluminium or iron coagulants are supplemented with silicates or organic polymers [12]. Commonly used and recently studied metal and composite coagulants are presented in Table 1. A more detailed description of these coagulants can be found in our review article [12].
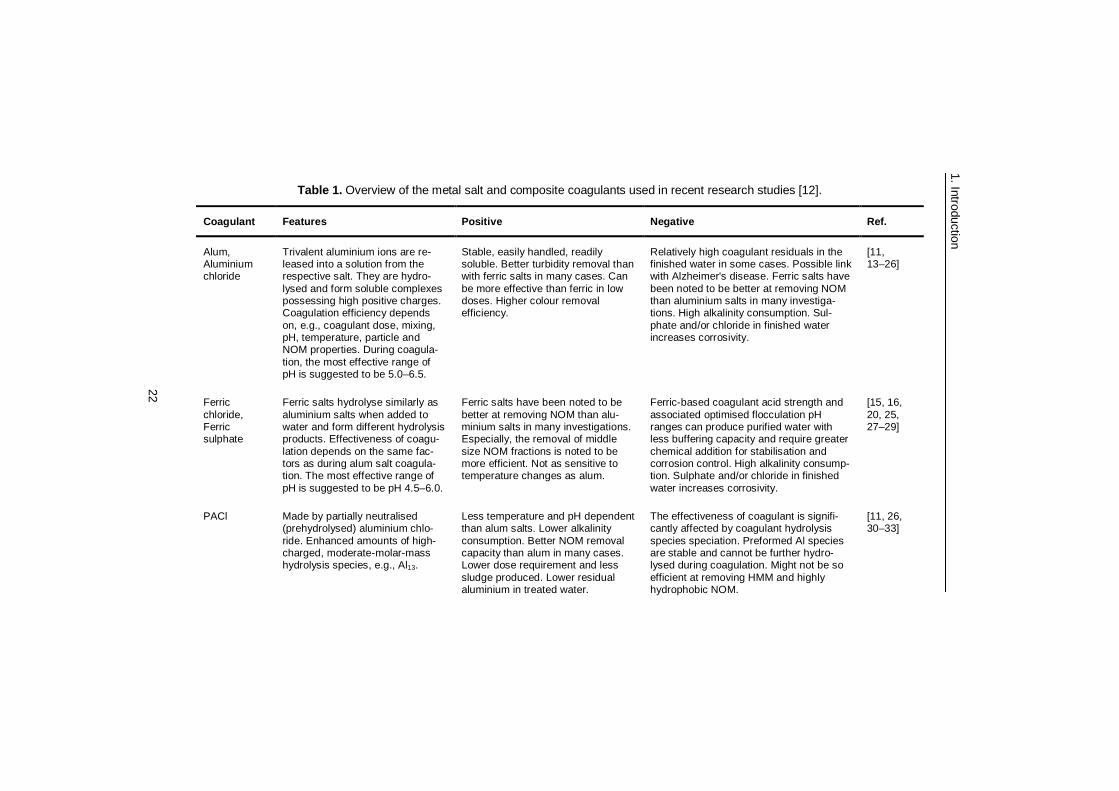
Table 1. Overview of the metal salt and composite coagulants used in recent research studies [12].
Coagulant Features Positive Negative Ref.
Alum, Aluminium chloride
Trivalent aluminium ions are re-leased into a solution from the respective salt. They are hydro-lysed and form soluble complexes possessing high positive charges. Coagulation efficiency depends on, e.g., coagulant dose, mixing, pH, temperature, particle and NOM properties. During coagula-tion, the most effective range of pH is suggested to be 5.0–6.5.
Stable, easily handled, readily soluble. Better turbidity removal than with ferric salts in many cases. Can be more effective than ferric in low doses. Higher colour removal efficiency.
Relatively high coagulant residuals in the finished water in some cases. Possible link with Alzheimer's disease. Ferric salts have been noted to be better at removing NOM than aluminium salts in many investiga-tions. High alkalinity consumption. Sul-phate and/or chloride in finished water increases corrosivity.
[11, 13–26]
Ferric chloride, Ferric sulphate
Ferric salts hydrolyse similarly as aluminium salts when added to water and form different hydrolysis products. Effectiveness of coagu-lation depends on the same fac-tors as during alum salt coagula-tion. The most effective range of pH is suggested to be pH 4.5–6.0.
Ferric salts have been noted to be better at removing NOM than alu-minium salts in many investigations. Especially, the removal of middle size NOM fractions is noted to be more efficient. Not as sensitive to temperature changes as alum.
Ferric-based coagulant acid strength and associated optimised flocculation pH ranges can produce purified water with less buffering capacity and require greater chemical addition for stabilisation and corrosion control. High alkalinity consump-tion. Sulphate and/or chloride in finished water increases corrosivity.
[15, 16, 20, 25, 27–29]
PACl Made by partially neutralised (prehydrolysed) aluminium chlo-ride. Enhanced amounts of high-charged, moderate-molar-mass hydrolysis species, e.g., Al13.
Less temperature and pH dependent than alum salts. Lower alkalinity consumption. Better NOM removal capacity than alum in many cases. Lower dose requirement and less sludge produced. Lower residual aluminium in treated water.
The effectiveness of coagulant is signifi-cantly affected by coagulant hydrolysis species speciation. Preformed Al species are stable and cannot be further hydro-lysed during coagulation. Might not be so efficient at removing HMM and highly hydrophobic NOM.
[11, 26, 30–33]
22
1. Introduction
PICl, PFC Made by partially neutralised (prehydrolysed) ferric chloride. Enhanced amounts of high-charged, moderate-molar-mass hydrolysis species.
Wider pH range, lower sensitivity to temperature, reduced amounts of coagulants, lower residual iron concentration. Less corrosive than ferric chloride.
More at development stage. Not so widely used.
[34, 35]
PFS Made by partially neutralised (prehydrolysed) ferric sulphate. Enhanced amounts of high-charged, moderate-molar-mass hydrolysis species.
Wider pH range, lower sensitivity to temperature, reduced amounts of coagulants, lower residual iron concentration. Less corrosive than ferric chloride.
Hydrolysis conditions have major impact on speciation of hydrolysis/polymeric species. More at development stage. Not so widely used.
[36, 37]
PASiC, PAF-SiC, PFSiS, PSF
Combination of aluminium and/or ferric-based polymeric flocculants with polysilicate.
Enhancement of bridging ability of coagulant. Flocs formed are relative-ly large. More resistant to pH varia-tions. Wider pH range.
Although flocs are large, they are non-settleable, thus creating high turbidity values with overly low dosages. More at development stage (especially ferric-based coagulants).
[31, 38–45]
HPAC Composition of organic polymer (PDADMAC) and inorganic poly-meric coagulant (PACl) with addi-tives such as active silicates.
Effective in waters with high alkalini-ty or pH. Wider working pH range.
Flocs formed can be small or incompact, thus not favourable to sedimentation, although flotation is much more efficient.
[26, 38, 46, 47]
PFC-PDADMAC
Composition of organic polymer (PDADMAC) and inorganic poly-meric coagulant (PFC). High content of Feb hydrolysis species.
Stronger charge neutralisation and hence efficient DOC, SUVA and turbidity removal capacity.
More at development stage. Not so widely used.
[35, 48–51]
23
1. Introduction
1. Introduction
24
In addition to pH, competing anions also have an influence on the composition of metal hydroxides. The effect of anion depends on its electronegativity and tenden-cy to react with metal ion or the positively charged sites of metal hydroxide precipi-tates [3]. Sulphate ions are weakly basic and strongly coordinated with metal ions. They broaden the pH zone of destabilisation to acidic side. Phosphates shift the optimum pH of destabilisation to the acidic side. Chlorides and nitrates have only a slight effect in high concentrations.
1.1.5 Applications of metal salt coagulants in industrial raw water and wastewater treatment
Metal salt coagulants are used in industrial raw water treatment processes and wastewater treatment plants to remove various pollutants. Typical contaminants in surface waters that can be removed by coagulation are for example NOM, mineral substances and microorganisms. The variety of pollutants found in industrial wastewaters is enormous and only some examples of applications could be given in this study.
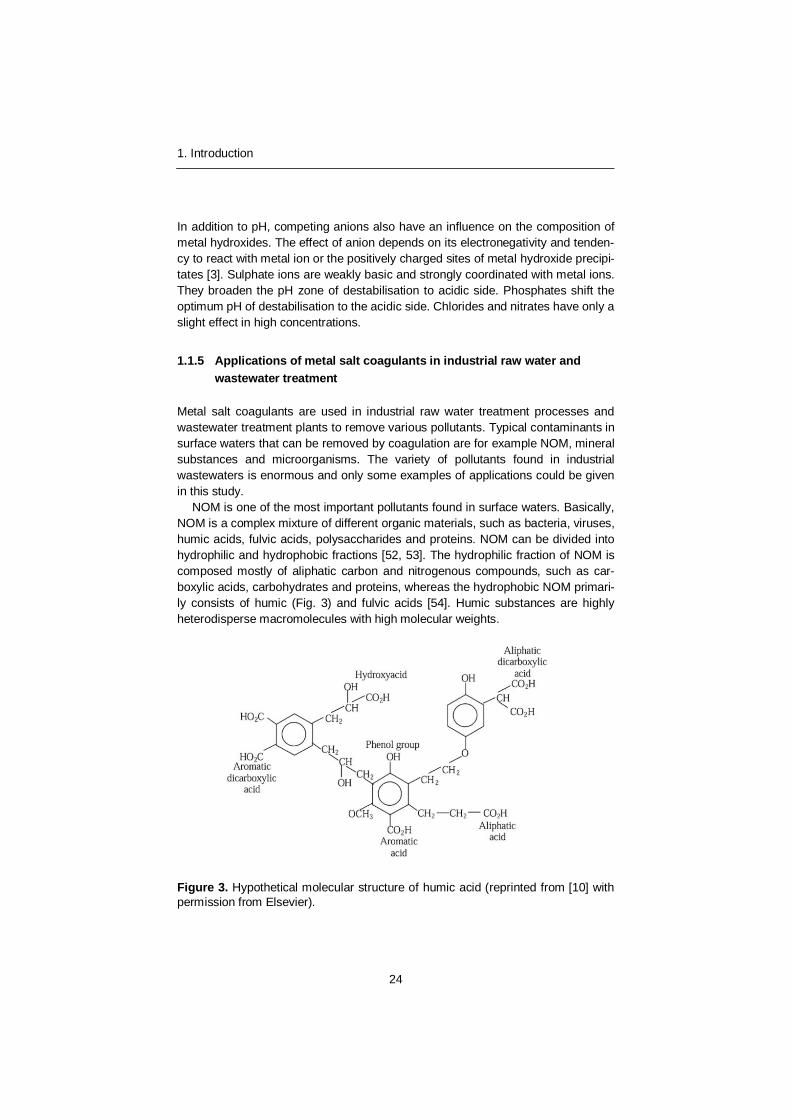
NOM is one of the most important pollutants found in surface waters. Basically, NOM is a complex mixture of different organic materials, such as bacteria, viruses, humic acids, fulvic acids, polysaccharides and proteins. NOM can be divided into hydrophilic and hydrophobic fractions [52, 53]. The hydrophilic fraction of NOM is composed mostly of aliphatic carbon and nitrogenous compounds, such as car-boxylic acids, carbohydrates and proteins, whereas the hydrophobic NOM primari-ly consists of humic (Fig. 3) and fulvic acids [54]. Humic substances are highly heterodisperse macromolecules with high molecular weights.
Figure 3. Hypothetical molecular structure of humic acid (reprinted from [10] with permission from Elsevier).
1. Introduction
25
High molecular weight hydrophobic NOM fractions are more easily destabilised than low molecular weight hydrophilic fractions [3, 52, 53, 55]. Hydrophilic frac-tions can be partially removed when sufficiently high coagulant concentrations are used at low pH. In these conditions, metal ions form complexes with ionogenic groups of the hydrophilic colloid and electroneutral precipitate forms. Hydrophobic NOM contains more aromatic compounds than hydrophilic fractions and has a higher level of charge due to ionisable groups, such as carboxylic and phenolic groups. Humic substances can also be classified as humus coal, fulvic acids, hymatomelanic acids and humic acids. Humus coal is an insoluble fraction, whereas others are soluble in neutral water. Molecular weights of the soluble fractions of humic substances in order of decreasing molecular weight are humic acid > hymatomelanic acid > fulvic acids. Humic acid fraction is more hydrophobic than fulvic acid fraction and is therefore more easily destabilised by coagulation.
Industrial wastewaters often contain colloidal suspensions which can be desta-bilised by the addition of chemical coagulants [56]. Coagulant technologies can be used before biological wastewater treatment to remove toxic substances from the wastewater stream that could affect the survival of microbes at biological wastewater treatment plants [57]. Coagulant chemicals can be added into primary clarifiers to reduce the load on biological processes. With coagulation technology it is common to achieve high removals of pollutants; 95% total suspended solids (TSS), 65% chemical oxygen demand (COD) and 50% biological oxygen demand (BOD). Chemical coagulation can also be used after the biological wastewater treatment plant to remove residual phosphorus from the water stream. Phospho-rus causes eutrophication in the receiving wastewaters and therefore, discharges of wastewater treatment plants have to be minimised. Chemical precipitation can be used to remove orthophosphates and particulate phosphorus species [3]. The stoichiometric of Aladded:Premoved has been reported to vary from 1.4 to 4.3. The stoichiometric relationship is valid at high phosphorus concentrations and higher doses are required when concentration decreases. Typically optimum phosphorus removal occurs within the pH range of 5.5 to 6.0.
Iron (II) and iron (III) salts are also used in wastewater treatment plants or long pipeline systems to precipitate dissolved sulphides present in the wastewater. Hydrogen sulphide (H2S) has a low odour threshold and besides common odour problems, hydrogen sulphide also has adverse effects on human health and caus-es corrosion of the sewers and other equipment [58–62]. Precipitation of dissolved sulphides is normally performed using iron salts, such as ferric chloride or ferrous sulphate [63–65]. Iron salts can be added prior to sulphide formation or into wastewater already containing sulphides. A higher concentration of iron salt is required if dosing is conducted before sulphide formation, because iron hydroxides and carbonates are formed, and iron cations only partially react with dissolved sulphide ions. Sulphides form black ferrous sulphide (FeS) according to Eq. 7 in the presence of Fe(II). Fe(III) can remove sulphides by chemically oxidising them to elemental sulphur (Eq. 8), while the Fe(II) formed during the reaction can sub-sequently produce FeS (Eq. 7). According to Firer et al. [64], the stoichiometry of
1. Introduction
26
the reaction with Fe(II) is approximately 1.3 mole of Fe2+ per 1 mole of S2- re-moved, and with Fe(III) 0.9 mole is required per 1 mole of S2- removed.
Fe ( ) + HS ( ) FeS( ) + H (7)
2Fe ( ) + HS (aq 2Fe (aq)+S (s)+H (8)
Common issues that arise when iron chemicals are used include the corrosion of equipment and a localised decrease in pH at the feeding point, which can release hydrogen sulphide into the sewer atmosphere. Due to the corrosive nature of the chemicals, special materials, such as titanium, are used in the tanks and piping, increasing capital costs of the equipment [66].
1.2 Theory of electrocoagulation
EC has a long history: the first plant was built in London in 1889 for the treatment of sewage [67, 68]. Despite some promising results, the success of this technolo-gy has been limited. However, there has been renewed scientific, economic and environmental interest in this technology in recent years due to demand of alterna-tive water treatment technologies. EC understandably has several similarities with the chemical coagulation but also significant differences, such as side reactions, which are discussed in this section.
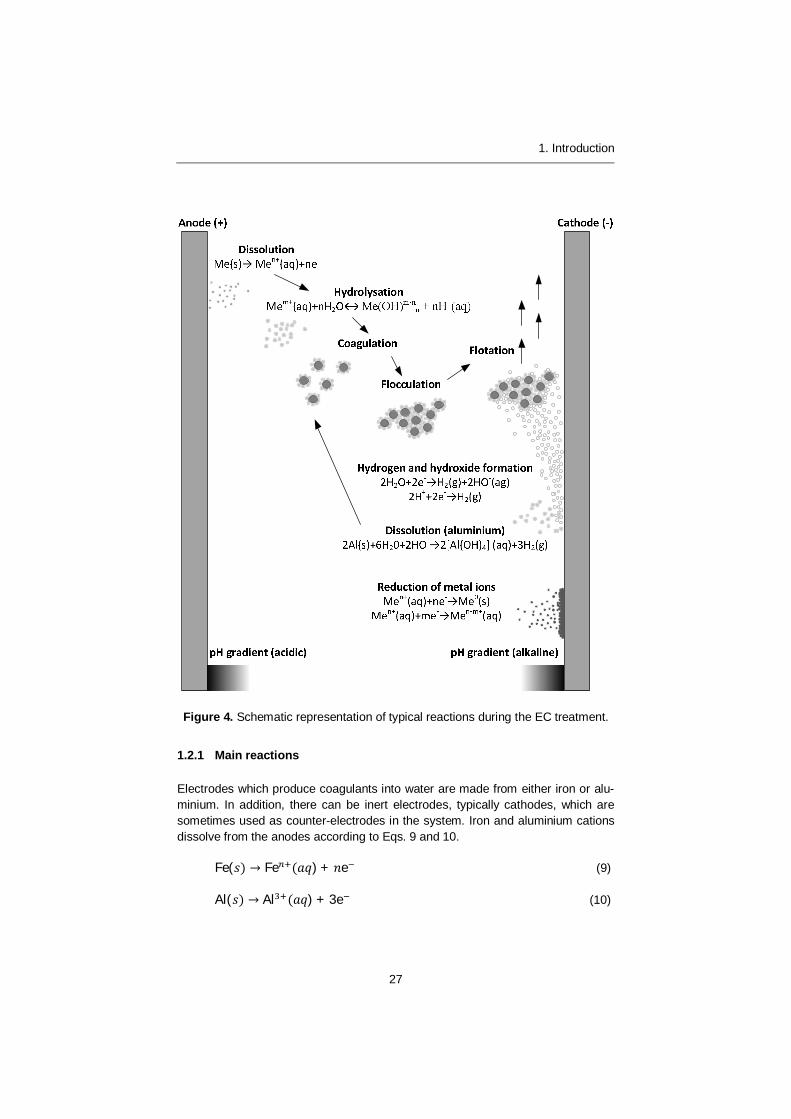
In the EC system there are multiple electrochemical reactions occurring simul-taneously at the anodes and cathodes. These mechanisms can be divided into the main mechanisms that cause destabilisation of pollutants, and side reactions, such as hydrogen formation. The most important reactions are summarised in Fig. 4.
1. Introduction
27
Figure 4. Schematic representation of typical reactions during the EC treatment.
1.2.1 Main reactions
Electrodes which produce coagulants into water are made from either iron or alu-minium. In addition, there can be inert electrodes, typically cathodes, which are sometimes used as counter-electrodes in the system. Iron and aluminium cations dissolve from the anodes according to Eqs. 9 and 10.
Fe( Fe ) + e (9)
Al( Al ) + 3e (10)
1. Introduction
28
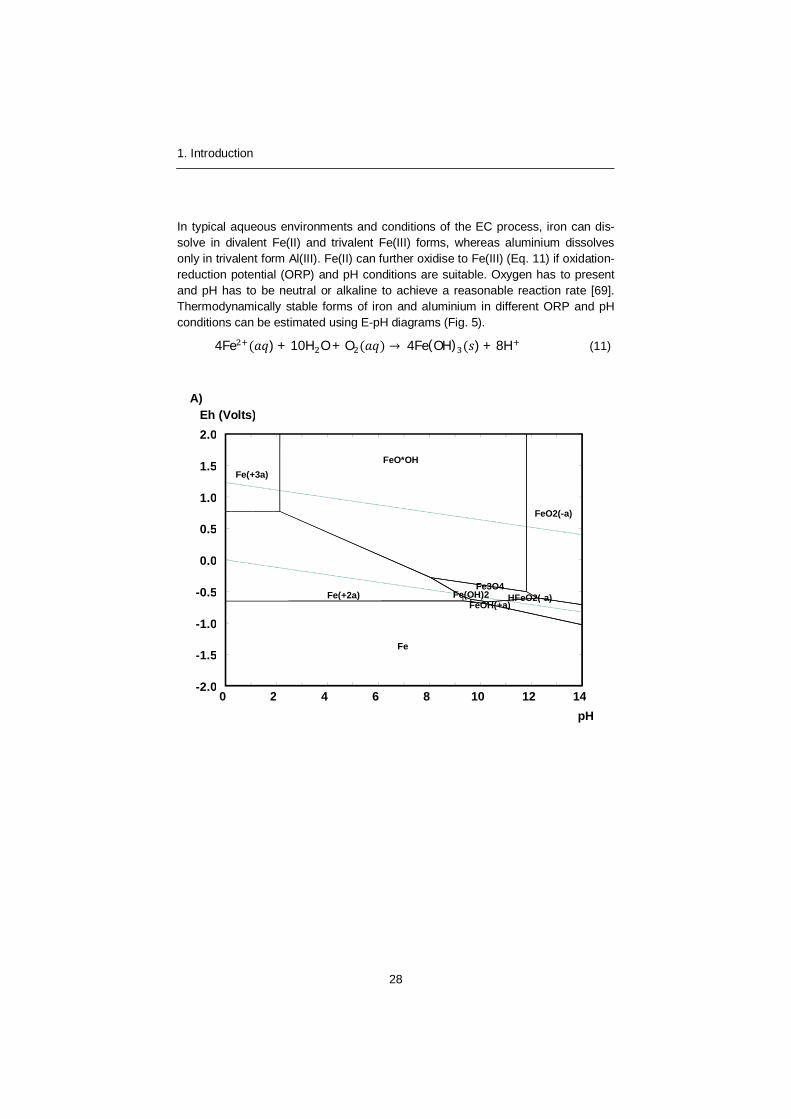
In typical aqueous environments and conditions of the EC process, iron can dis-solve in divalent Fe(II) and trivalent Fe(III) forms, whereas aluminium dissolves only in trivalent form Al(III). Fe(II) can further oxidise to Fe(III) (Eq. 11) if oxidation-reduction potential (ORP) and pH conditions are suitable. Oxygen has to present and pH has to be neutral or alkaline to achieve a reasonable reaction rate [69]. Thermodynamically stable forms of iron and aluminium in different ORP and pH conditions can be estimated using E-pH diagrams (Fig. 5).
4Fe ) + 10H O + O 4Fe(OH) ) + 8H (11)
14121086420
2.0
1.5
1.0
0.5
0.0
-0.5
-1.0
-1.5
-2.0
pH
Eh (Volts)
Fe
Fe3O4Fe(OH)2
FeO*OHFe(+3a)
Fe(+2a)
FeO2(-a)
FeOH(+a) HFeO2(-a)
A)

1. Introduction
29
Figure 5. E-pH diagrams of a) iron and b) aluminium at 25 °C, 1 bar and 10–6 M.
Moreno et al. [67] studied the electrochemical reactions of iron electrodes in EC system. According to their results and the thermodynamical data they presented, the potential of the iron anode in an EC system is in the region where Fe(III) iron is produced. However, some authors suggest that the potential of the cathode is in the region where Fe(III) is reduced to Fe(II) form and therefore, both forms exists in the EC system [70, 71]. Iron is produced on the anodes mainly in Fe(II) form [72]. In low pH the chemical dissolution of iron can be significant and total iron concentration can be higher than would be theoretically expected. Sasson et al. also studied oxidation of produced Fe(II). According to their results, no significant oxidation occurred at pH 5, oxidation rate was moderate at pH 6 and very rapid oxidation occurred at pH 7–9.
The amount of metal cations dissolved during the reactions at the anode can be calculated according to Faraday’s law (Eq. 12).
m = (12)
where I is the current, t is the operation time (s), Mw is molecular weight of the substance (g/mol), F is Faraday’s constant (96485 C/mol), z is the number of electrons involved in the reaction (2 for Fe2+ and 3 for Fe3+ and Al3+) and m is the quantity of metal dissolved (g). Several studies have reported current yields higher
14121086420
2.0
1.5
1.0
0.5
0.0
-0.5
-1.0
-1.5
-2.0
pH
Eh (Volts)
AlH3
AlO(OH)Al(OH)4(-
Al3(OH)4(+5a)
B)
1. Introduction
30
than 100% for the dissolving of aluminium electrodes [73]. It seems that aluminium also dissolves from the cathodes. This occurs when pH on the surface of the cath-ode decreases due to the formation of HO- (Eq. 13) or by the consumption of hydronium ions/protons (Eq. 14).
2H O + 2e H ( ) + 2HO ) (13)
2H ) + 2e H ( ) (14)
At high pH, aluminium dissolves as aluminate (Eq. 15).
2Al( ) + 6H O + 2HO 2[Al(OH) ] ( ) + 3H ) (15)
Picard et al. [73] studied cathodic dissolution during the EC process. They com-pared hydrogen evolution from the stainless steel cathodes and aluminium cath-odes. Hydrogen produced at the stainless steel cathodes followed Faraday’s law. In tests with the aluminium cathodes, hydrogen production was higher due to the chemical dissolution of aluminium according to Eq. 15. Hydrogen formation and aluminium dissolved from the cathodes increased exponentially with the current intensities.
When aluminium ion, aluminate or iron ions are produced on the electrodes they experience hydrolysis or dehydrolysis reactions in the solution. Green rust is formed when iron electrodes are used [67]. Green rust contains both Fe(II) and Fe(III) hydroxides and anions, such as Cl-, CO3
2- and SO42-. Other metal cations,
such as Cu(II) and Ni(II), can also substitute Fe(II) in green rust if they exist in the solution [74, 75]. In an EC system, green rust and hydrogen are formed according to Eq. 16.
6Fe( ) + (12 + )H ½(12 )H ( ) Fe(OH) ( )Fe(OH) ) (16)
Mononuclear hydrolysis products of Fe(III) and Al(III) were presented in Fig. 2 as a function of pH. It is probable that similar polynuclear species are formed in EC and chemical coagulation. However, this has not been verified by experimental stud-ies.
1.2.2 Side reactions
In addition to dissolving of aluminium and iron production, other electrochemical reactions can also take place in the EC system. They are:
• hydrogen formation at the cathodes due to Eqs. 13–15
• increase of pH due to the formation of hydroxyl ions or the consumption of hydronium ions/protons (Eqs. 13 and 14)
• reduction of metal ions on the cathodes.
1. Introduction
31
Some articles have also speculated that oxygen is also produced on the anodes [76, 77]. However, it seems that this does not take place in typical conditions (electrochemical potential) of EC systems as dissolution of anodes follows Fara-day’s law [72, 78]. However, at alkaline pH, dissolution of iron anodes is lower than calculated according to Faraday’s law, which indicates that other electro-chemical reactions are taking place in these conditions.
There is technology called electroflotation (EF), which can be used to produce bubbles that can effectively separate particles from the solution [79–81]. In electro-flotation technology, oxygen bubbles are produced on the anodes and hydrogen bubbles on the cathodes, whereas in EC technology only hydrogen bubbles are produced on the cathodes. The efficiency of the flotation in EC and EF technolo-gies depends on the size of the bubbles. Smaller bubbles can provide a larger surface area for particle attachment. EF produces smaller diameter bubbles than commonly used dissolved air flotation (DAF) technology. The mean diameter of the hydrogen and oxygen bubbles generated in EF range from 17 to 50 µm, whereas in DAF the typical mean diameter of the bubbles range from 48 to 60 µm [80]. Usually, the diameters of the electrolytically generated bubbles obey log-normal distribution.
Electrode material, current density and pH affect bubble size. The smallest hy-drogen bubbles are produced at neutral or acidic pH [80]. Stainless steel plates have been found to produce the smallest bubbles. There has been some contro-versy in the reported effects of current density on the bubble size. Sarkar et al. [82] studied the effect of current density and electrode on bubble size produced on the cathodes. They discovered that a significant proportion of hydrogen produced on the cathodes can be dissolved in the solution. According to their results, bubble size diameter is a function of hydrogen production rate, bubble nucleation rate and dissolved gas concentration field.
In contrast to chemical coagulation, EC treatment increases the pH of the solu-tion when it is in an acidic, neutral or slightly alkaline region and decreases when it is highly alkaline. This change of pH during the EC treatment affects the speciation of aluminium and iron hydroxides. At highly acidic pH (pH 2) the alkalinity pro-duced during the EC is not sufficient to increase the pH of the solution, whereas at pH 3 and higher initial pH values pH rises during the treatment [78]. This is easily understandable, as concentration of hydronium ions increases by factor 10 when pH decreases from pH 3 to pH 2. When initial pH is significantly alkaline (pH > 9), pH probably decreases due to the formation of aluminate [Al(OH)4
-], which is an alkalinity consumer [83, 84]. It seems that the pH change rate and final steady-state pH depends on the concentration of anions in the solution. According to Trompette and Vergnes [85], pH increases more in sulphate solution than in chlo-ride solution. As mentioned in Section 1.1.4 sulphates can replace hydroxyl ions in the hydroxide precipitates and therefore less hydroxyl ions are bound to hydrox-ides.
Because electrochemical reactions occur at the surface of the electrodes, the concentration of reaction products is highest at the electrode surface and the
1. Introduction
32
concentration gradient exists from the surface towards the bulk solution. There-fore, pH decreases at the vicinity of the anodes and vice versa at the cathode surface. This can lead to precipitation of inorganic salts on the electrode surface if their solubility changes as a function of pH, e.g., precipitation of calcium carbonate on the cathodes [86].
If electrochemical potential at the cathodes is in the right region, the direct elec-trochemical reduction of metal cations may occur at the cathode surface (Eq. 17).
Me ) + e Me ( ) (17)
There are several studies where the removal of metals from wastewaters has been studied, as discussed later in Section 1.3.2. Results indicate that metals are mostly removed by coagulation and co-precipitation. However, the reduction of metal ions may have some effect on removal efficiency even if they are not re-duced to the metallic state. Heidmann and Calmano [87] studied the removal of Zn(II), Cu(II), Ni(II), Ag(I) and Cr(VI) from aqueous solution by EC. They proposed that Zn(II), Cu(II), Ni(II) and Ag(I) were removed from the solution by hydrolysation and co-precipitation, whereas Cr(VI) was reduced first to Cr(III), after which it was precipitated as hydroxide. It is probable that dissolving of aluminium at the cath-odes prevents plating of the cathode with other metals. With iron or inert cathodes, some plating could be expected at least with some metal ions, e.g., Ni(II) and Cu(II). It is possible that plating is a slow reaction in typical concentrations and re-moval occurs mainly by coagulation co-precipitation due to these kinetic reasons.
1.2.3 Properties of the sludge
The properties of produced sludge are important because sludge treatment and disposal are one of the major cost factors in water and wastewater treatment, especially when sludge has been produced by chemicals. The dried EC sludge produced by different combination electrodes during arsenic removal has been characterized by FTIR, PXRD, XPS, SEM-EDS and Mössbauer spectroscopy [71]. Dried sludge formed by Al-Al electrodes contained amorphous aluminium hydrox-ide and/or aluminium oxyhydroxide. Fe-Fe electrodes produced crystalline phases, such as magnetite, and poorly crystalline phases, such as iron oxyhydroxides and lepidocrocite. Sludge produced by combined Fe-Al electrodes contained the aforementioned products as well as mansfeldite, diaspore and iron oxide. Crystal-linity of iron species decreased, possibly due to the substitution of iron by alumini-um. Emamjomeh and Sivakumar studied the sludge produced during the fluoride removal by EC using XRD [88]. Identified products were aluminium fluoride hy-droxide complexes and aluminium hydroxide. Shafael et al. [89] identified amor-phous manganese and aluminium species in sludge produced by EC during Mn(II) removal.
The settleability of sludge produced by EC during paper mill [90] and textile wastewater treatment has been studied [91]. When paper mill wastewater was
1. Introduction
33
treated, the sludge volume index (SVI) was 0.207–0.310 L/g and 0.081–0.091 L/g for aluminium and iron electrodes, respectively. The sludge formed by iron elec-trodes was heavier and produced a more compact layer. The authors observed similar results with textile wastewaters. Hydrogen produced during the EC induces flotation of particles and decreases settling velocity. As discussed in Section 1.2.2, the operating parameters of EC affect the properties of hydrogen bubbles. Lai and Lin [92] treated chemical mechanic polishing wastewater by Al-Fe electrodes and studied settling properties of produced sludge. They concluded that complex mod-els of third or fourth order described the sludge settling data.
The heat value of the sludge produced by EC has been measured using a bomb calorimeter [93]. Heat value was 5.3 MJ/kg and authors concluded that it could be used as a fuel in the furnaces and the produced ash could be blended with the cementitious mixtures. It is probable that sludge produced during the treatment of other wastewaters containing high organic matter also has a high heat value. The combination of EC and electrodewatering has been studied for the reduction of water content in sewage sludge [94]. The combination of EC and electrodewatering reduced water content of the sludge to 55%, whereas water content in sludge treated with only pressure filtration was 78%.
1.2.4 Treatment parameters
There are various parameters which have an effect on the efficiency of the EC in removing the pollutants from water. Parameters which are known to have an effect are:
• Material of the electrodes can be iron, aluminium and/or inert material (typically cathodes). Iron and aluminium ions and hydroxides have different chemistries and applications.
• pH of the solution has an effect on the speciation of metal hydroxides in the solution and also on the -potential of the colloidal particles. It also af-fects the dissolution of aluminium cathodes.
• Current density is proportional to the amount of electrochemical reactions taking place on the electrode surface.
• Treatment time or electric charge added per volume is proportional to the amount of coagulants produced in the EC system and other reactions tak-ing place in the system.
• Electrode potential defines which reactions occur on the electrode surface.
• Concentration of the pollutants affects the removal efficiency because coagulation does not follow zeroth-order reaction kinetics but rather pseudo second or first-order kinetics.
1. Introduction
34
• Concentration of anions, such as sulphate or fluoride, affects the composition of hydroxides because they can replace hydroxide ions in the precipitates.
• Temperature affects floc formation, reaction rates and conductivity. De-pending on the pollutant, increasing temperature can have a negative or a positive effect on removal efficiency.
• Other parameters, such as hydrodynamical conditions and inter-electrode distance, may have effect on efficiency of the treatment and electricity con-sumption. However, these parameters have not been widely studied or they have a negligible effect on the removal efficiency.
Electrode materials
Electrode material defines which electrochemical reactions take place in the EC system. Aluminium and iron electrodes have both been used successfully in EC systems. Aluminium dissolves in all cases as Al(III) whereas there is some contro-versy as to whether iron dissolves as Fe(II) or Fe(III) [67, 72]. Most results indicate that iron dissolves as Fe(II), such as [72, 95, 96], and is oxidised in bulk solution to Fe(III) if there are oxidants, such as oxygen, present in sufficient concentration and pH is alkaline (Fig. 5a, see p. 28). Fe(II) is a poor coagulant compared to Fe(III) due to higher solubility of hydroxides and lower positive charge, which ex-plains some poor results obtained with iron electrodes, such as in the study of Bagga et al. [96]. Optimal material selection depends on the pollutants to be re-moved and the chemical properties of the electrolyte. In general, aluminium seems to be superior compared to iron in most cases when only the efficiency of the treatment is considered. However, it should be noted that aluminium is more ex-pensive than iron.
Inert electrodes, such as metal oxide coated titanium, are used as cathodes in some constructions. When water has significant amounts of calcium or magnesi-um ions, the inert cathode material is recommended [76]. There are also some studies where combinations of aluminium and iron electrodes have been used. Linares-Hernández et al. [95] obtained high removal of colour with aluminium electrodes, while iron was more effective than aluminium in reducing COD from industrial wastewater. A combination of iron and aluminium removes both colour (71%) and COD (69%) with high efficiency. Similar results were obtained when paper mill wastewaters were treated with various aluminium and iron electrode combinations [97]. Aluminium electrodes were most effective in removing colour of the wastewater, whereas iron electrodes removed COD and phenol from the wastewater more effectively than aluminium electrodes. A combination of alumini-um and iron electrodes removed colour, COD and phenol with high efficiency. Combination electrodes have been studied for arsenic removal from groundwater [71]. Iron electrodes and a combination of iron and aluminium electrodes gave the highest arsenic removal efficiencies. Similar results were obtained for copper,
1. Introduction
35
chromium and nickel removal from metal plating wastewater [98]. Fe-Al pair has been most effective in removing indium from water [99].
pH of the solution
One key parameters of EC treatment is the pH of the solution to be treated. It has an effect on the conductivity of the solution, dissolution of the electrodes, specia-tion of hydroxides and -potential of colloidal particles. As discussed in Sections 1.1.3 and 1.1.4, aluminium and iron cations and hydroxides cause destabilisation of colloids. Effective coagulant species are formed in acidic, neutral and slightly alkaline pH. In highly alkaline pH Al(OH)4
- and Fe(OH)4- ions are formed and these
ions have poor coagulation performance. As can be seen in Fig. 2 (see p. 20), Fe(III) is effective in a wider pH area than Al(III) and works also in slightly alkaline pH. It is also known that competing anions have an effect on the optimum pH of the coagulation. The effect of water pH on the efficiency of pollutant removal can mostly be explained by the aforementioned mechanisms. However, as discussed in Section 1.2.3, pH increases during the EC treatment, making it a constantly changing parameter; therefore mechanistic studies of EC systems are difficult to conduct.
In pHs lower than 3, the release rate of aluminium during electrolysis with a constant charge per volume was lower than in pHs above 3 [78]. Chemical disso-lution of aluminium cathodes occurs because pH increases to a level where alu-minate is formed. It is probable that acidic bulk solution inhibits this reaction be-cause produced hydroxyl ions are consumed by the acid in the solution. In acidic pH the dissolution of iron electrodes was significant even without electricity, whereas oxidation of Fe(II) to Fe(III) occurs only at pHs above 5 [72]. The dissolu-tion rate decreases at high pH, which is understandable as the corrosion rate of iron decreases in alkaline pH in the presence of oxygen because a passive layer forms on the surface. It has been suggested that initial pH is key parameter when either chemical coagulation or EC is selected for the water treatment [100]. EC is more suitable when higher pH is desired (acidic solutions), whereas chemical coagulation is preferred when pH should decrease before discharge.
There are also some pollutants which have specific optimum pHs of treatment, such as phosphorus and metal cations. The effect of initial pH on phosphate re-moval from wastewater by EC with iron electrodes has been studied [101]. The highest removal efficiency was observed at the lowest tested initial pH (pH 3). Wastewater pH increased to a highly alkaline level (pH 10–12) during the long treatment, probably due to partial replacement of HO- by PO4
3-. In high pH the removal rate was poor due to the formation of Fe(OH)4
- and higher solubility of FePO4. In higher pH there are more HO- ions to compete with PO4
3- and therefore less FePO4 is formed. Other researchers have had similar results with iron elec-trodes when they studied the removal of phosphorus from secondary effluent [102]. According to Janpoor et al., phosphorus removal from laundry wastewater
1. Introduction
36
with aluminium electrodes was poor when initial pH was lower than 6 or higher than 8 [103].
As with aluminium and iron, other metal cations can also form hydroxides in water. Most non-ionic hydroxides have low solubility in water and can be removed by precipitation and co-precipitation with EC systems. Hanay and Hasar [104] studied removal of Cu(II), Mn(II) and Zn(II) by aluminium electrodes. Removal efficiency increased when initial pH of the wastewater increased. Similar results have been obtained for the removal of Co(II) [105], As(V) [106], Cu, Cr and Ni [98], Cu(II), Pb(II) and Cd(II) [107], Cu(II), Ni(II), Zn(II) and Mn(II) [108], In(III) [99], Mn(II) [89] and Cr(III) [109]. Hg(II) removal was not significantly affected by initial pH in the range of 3–7 [110].
Current density and treatment time
Current density is directly proportional to the rate of electrochemical reactions taking place on the electrode surface and it also has an influence on the electrode potential, which defines the reactions taking place on the electrode surface. It seems that on iron and aluminium anodes, dissolution reaction is the primary reaction, and the proportion of other reactions is insignificant at the typical current densities and electrode potentials when pH is neutral or acidic [72, 78]. At alkaline pH the dissolution rate of iron anodes can be lower than the value calculated by Faraday’s law, which indicates that there can be other reactions at the anode in these conditions [72].
Coagulant produced by electrolysis can usually be calculated according to Far-aday’s law when current and treatment times are known (Eq. 12). Coagulant con-centration produced by electrolysis on anodes is typically directly proportional to the electric charge added per volume (coulombs per litre). However, the total amount of coagulant dissolved also includes chemical dissolution of the electrodes in low pH and the dissolution of aluminium cathodes. Current density probably has some influence on the chemical dissolution of aluminium cathodes, as it affects the rate of hydroxyl ion production at the cathodes. Mouedhen et al. [78] studied aluminium dissolution from the cathodes with an electrochemical cell constructed of platinised titanium anode and aluminium cathode. They used constant charge per volume (540 C/L) and various current densities. According to their results, as the current density decreases the amount of aluminium generated increases. These results indicate that even low current density (< 1 A/dm2) initiates the dis-solving reaction on the cathodes if solution pH is not highly acidic and therefore the produced amount of aluminium on the cathodes depends more on the treat-ment time than the electric charge added per volume.
1. Introduction
37
Concentration of anions
Concentration of anions in the solution affects the stability of passive layer of the aluminium electrodes. Sulphate anions are passivating agents and therefore re-duce the production of metal cations [111]. Chloride, on the other hand, induces the breakdown of the passive layer and pitting corrosion. The effect of supporting electrolytes on the efficiency of an EC system has been studied by treating un-skimmed milk samples and a cutting oil emulsion by aluminium electrodes in the presence of NaCl, Na2SO4, NH4Cl and (NH4)2SO4 [85]. According to results, sul-phate anions increase electrical consumption and have a negative effect on EC efficiency. Ratio of [Cl-]/[SO4
2-] should be 0.1 or higher to ensure breakdown of the passive film. Mouedhen et al. [78] reported that optimum concentration of Cl- ions was 61 mg/l. In addition to the effect on the passive layer, some salts can precipi-tate on the cathodes if the concentration of salts in water is sufficiently high [86]. This insulating layer increases power consumption significantly [76].
As discussed in Section 1.1.4, competing anions can replace hydroxyl anions in the precipitate, which has an effect on the properties of hydroxide and therefore, also on efficiency and optimum conditions of coagulation processes. Competing anions can also have a direct influence if the pollutant is anion e.g. fluoride or phosphate. Hu et al. [112] studied fluoride removal in the presence of chloride, nitrate and sulphate anions. They obtained the best results in the absence of these anions. Sulphate ion concentration had a significant effect on the removal efficiency of the fluoride, probably because it can compete with fluoride ions from Al(III). According to Vasudevan et al. [113] fluoride and arsenate compete with phosphate ion and reduce its removal by EC.
Temperature
The effect of temperature on the removal of pollutants through EC has been stud-ied in a few articles. The effect of solution temperature on boron removal by EC has been studied in the range of 293–333 K [114]. When temperature increased from 293 K to 333 K, the boron removal efficiency increased from 84% to 96%. The opposite effect has been reported when paper mill wastewater was treated at temperatures between 293 and 333 K [97]. Removal of colour, COD and phenol decreased by 10–20% when temperature increased from 293 K to 333 K. The effect of temperature on phosphate removal from wastewater by EC has been studied in the range of 293–333 K [113]. Removal efficiency was 29% lower at 293 K than in higher temperatures. Authors concluded that at low temperatures the dissolution of anode occurs at a lower rate. However, they did not present any results, such as concentrations of aluminium dissolved from electrodes, which would support this conclusion.
It has been suggested that when temperature is too high, there is a shrinkage of large pores of the Al(OH)3 gel, which causes the formation of dense flocs that
1. Introduction
38
are more likely to deposit on the electrode surface [76]. Increasing temperature also enhances the solubility of aluminium. However, it seems that increasing tem-perature can have positive and negative effects on the removal efficiency. It is possible that the effect of temperature on removal efficiency depends on the re-moval mechanism of pollutants.
1.2.5 Comparison of electrocoagulation and chemical coagulation
There are only a few published studies in which chemical coagulation and EC have been compared. However, these technologies can be considered competing technologies and therefore, the comparisons of treatment efficiencies are im-portant. As previously mentioned, reliable comparisons are difficult to conduct due to the dynamic nature of the EC process.
Change of pH during the EC and its effect on aluminium species formed has been studied [100]. The formation of monomeric and polymeric aluminium hydrox-ides were compared when aluminium was added as AlCl3 or by EC. According to results, there are no significant differences in the speciation of aluminium obtained by these two methods. Authors concluded that both processes are similar in terms of removing the pollutants from the wastewater under the same dynamic condi-tions, doses of aluminium and steady-state pHs.
EC and chemical coagulation have been compared in the treatment of ultrafine quartz suspensions [115], the removal of Cr(VI) [116] and as a pretreatment be-fore microfiltration membranes [96, 117]. Kili et al. [115] compared chemical coagulation and EC and the effect of initial pH and aluminium dosage on the re-moval efficiency of a model pollutant (ultrafine quartz particles). They used alumin-ium anodes and stainless steel cathodes. The optimum pH for the removal of particles was 9 for EC and 6–9 for chemical coagulation. Wider optimum coagula-tion pH with chemical coagulant was probably a result of higher sulphate concen-tration because aluminium sulphate was used as a chemical coagulant. The effect of aluminium dosage on the destabilisation of pollutants and optimum aluminium dosages were similar with both technologies. Both technologies removed turbidity equally well. Researchers suggested, based on the -potential measurements, that destabilisation mechanisms are similar with both technologies.
EC was more effective (42%) than chemical coagulation (approximately 11.5%) at removing Cr(VI) from aqueous solution [116]. Some Cr(VI) was removed by deposition on the cathode. Alum and aluminium sulphate showed poor Cr(VI) removal, which was probably due to competitive adsorption of sulphate ions on the sludge matrix. Zhu et al. [117] compared EC and chemical coagulation pretreat-ment for enhanced virus removal using microfiltration membranes. Both technolo-gies improved virus removal but EC outperformed chemical coagulation in removal efficiency. The researchers suggested that the enhanced removal by EC was due to electrophoretic movement of viruses on electrodes. However, the effect of elec-trophoresis on removal efficiency in EC has not been reliably verified by experi-
1. Introduction
39
mental studies. Somewhat opposite results were obtained when chemical coagu-lation and EC were compared at pretreatment for surface water microfiltration [96]. Chemical coagulation with ferric chloride was superior compared to EC with iron anode and stainless steel cathode. Iron dissolved in Fe(II) form which had higher solubility and poor coagulation performance compared to Fe(III) in ferric chloride. NOM can prevent oxidation of Fe(II) to more effective Fe(III) form [118]. Zhu et al. [117] used synthetic freshwaters which did not include NOM in their studies, which may explain better performance of EC in their research.
According to studies in which EC and chemical coagulation have been com-pared, it seems that these technologies have similar destabilisation mechanisms. However, a chemical coagulant is added together with anion, such as sulphate or chloride, which may have some influence on the efficiency of the process. In some cases, side reactions, such as reduction on the cathode surface, may play an important role in the destabilisation of pollutants. Iron is dissolved from the iron electrodes in Fe(II) form and hence oxidation to more effective Fe(III) form is im-portant in order to obtain high removal efficiency. Therefore, it would be more descriptive to compare Fe(II) coagulants, such as ferrous sulphate, and EC with iron electrodes.
1.3 Practical considerations of electrocoagulation
1.3.1 Constructions of electrocoagulation systems
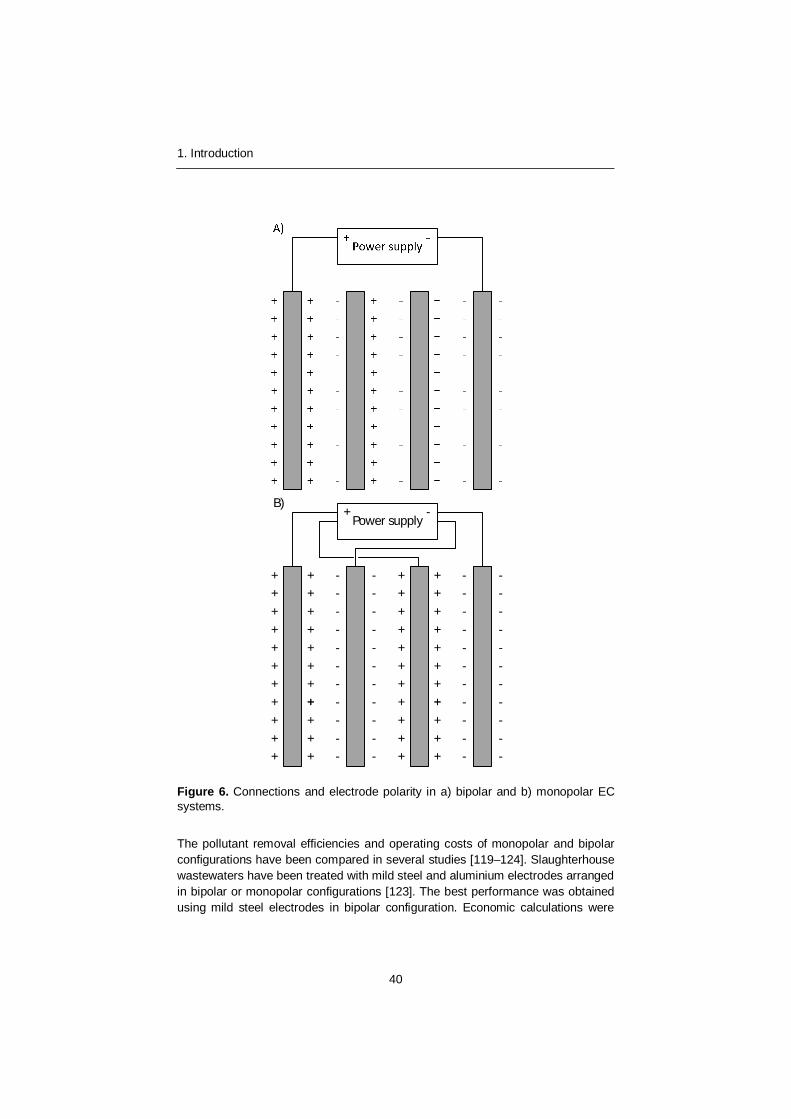
EC systems are typically constructed of plate electrodes and water flows through the space between the electrodes [76]. There are several methods how electrodes can be arranged in the EC system. Flow between the electrodes can follow a vertical or horizontal direction. Electrodes can be monopolar or bipolar. In the monopolar systems (Fig. 6a) all anodes are connected to each other and similarly all cathodes are also connected to each other. In the bipolar systems (Fig. 6b) the outermost electrodes are connected to a power source and current passes through the other electrodes, thus polarising them. In the bipolar systems the side of the electrode facing the anode is negatively polarised and vice versa on the other side facing the cathode.
1. Introduction
40
Power supply+ -
+++++++++++ +
+++
+++
+++
++ -
---------- -
--
--
---
--
-
----------- -
--
--
---
--
-
+++++++++++ +
+++
+++
+++
++
B)
Figure 6. Connections and electrode polarity in a) bipolar and b) monopolar EC systems.
The pollutant removal efficiencies and operating costs of monopolar and bipolar configurations have been compared in several studies [119–124]. Slaughterhouse wastewaters have been treated with mild steel and aluminium electrodes arranged in bipolar or monopolar configurations [123]. The best performance was obtained using mild steel electrodes in bipolar configuration. Economic calculations were
1. Introduction
41
made based on the results but electrode consumption was calculated according to Faraday’s law which gives false results, especially when aluminium electrodes are used. Golder et al. [119] studied Cr3+ removal with EC by mild steel electrodes. Current efficiency for the dissolving of the mild steel electrodes was lower when electrodes were in bipolar configuration (64.5%) than when they were in monopo-lar configuration (91.7%). This is probably due to the higher electrode potential of the electrodes in bipolar arrangement and competing reactions taking place on the electrodes. A complete removal of Cr3+ was obtained when electrodes were in the bipolar arrangement. However, treatment cost was lower with a monopolar ar-rangement when the treatment was continued to the discharge limit. Similar re-sults were reported when EC was used for the removal of fluoride from drinking water [120]. The bipolar connection removed fluoride more effectively but operat-ing costs of the treatment were higher with this configuration. Monopolar configu-ration has been reported to be better in the treatment of laundry wastewater [121], oily bilge water [122] and textile wastewater [124]. Results of the aforementioned studies could be summarised so that monopolar configuration has lower operating cost but in some cases higher removal of pollutants can be achieved with bipolar configuration, possibly due to additional side reactions.
Typically, direct current (DC) has been used in EC systems. However, there are a few studies in which alternating current (AC) has been tested. Vasudevan et al. [125] studied the removal of fluoride from water with DC and AC EC systems. They observed similar removal efficiencies with both technologies. However, en-ergy consumption was slightly lower with AC technology. Eyvaz et al. [126] used alternating pulsed current in their study. Alternating pulsed current enhanced re-moval efficiency compared to DC current. Pollutant removal decreases over the course of time with DC systems, possibly due to passivation of electrodes, where-as in an alternating pulse current system this was not observed. Polarity reversal has also been suggested by other authors to reduce passivation of electrodes [127].
In addition to actual coagulation procedure, some sludge removal process has to follow EC. As with chemical coagulation, these can be flotation, sedimentation or filtration. Due to hydrogen bubble production, flotation is often the preferred choice. These separation technologies are discussed in detail in books such as [1, 3, 127].
1.3.2 Applications of electrocoagulation
Most of the articles published on EC concentrate on the removal of some specific pollutant or pollutants from synthetic or real solutions. The majority of these appli-cation studies can be divided into the following categories:
Removal of metal ions and/or hydroxides from synthetic solutions, groundwaters or wastewaters (Table 2). Typically high or complete removal
1. Introduction
42
could be obtained when treatment parameters are optimised. Aluminium, iron and combination electrodes can be used in EC system.
Removal of organic material from wastewaters or synthetic solutions (Table 3). High removal (> 70%) is typically obtained with optimum parame-ters. Aluminium, iron and combination electrodes can be used. In general, iron electrodes give higher organic matter removal, whereas higher colour removal is obtained with aluminium electrodes.
Purification of surface waters from natural organic matter, inorganic pol-lutants or microbes (Table 4). Typically high removal of pollutants (> 90%). Aluminium electrodes are more commonly used than iron electrodes in these applications.
Tables 2–4 review relevant and recent publications in these categories. There is also a review article where most of the applications have been discussed [128]. Practically all articles report a higher removal percentage when higher current density and/or treatment times are used. Therefore, this finding was not included in Tables 2–4. This result is easily understandable as produced coagulant concentra-tion in solution increases as a function of electric charge added as discussed in Section 1.2.4.
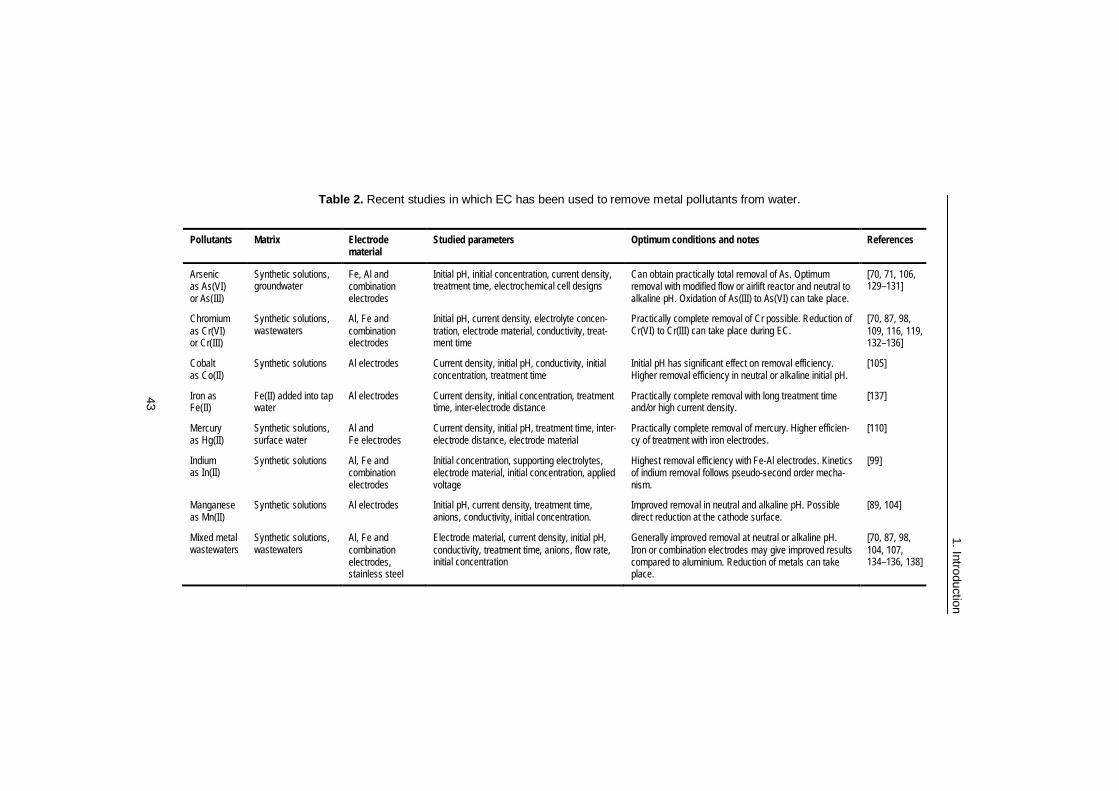
Table 2. Recent studies in which EC has been used to remove metal pollutants from water.
Pollutants Matrix Electrode material
Studied parameters Optimum conditions and notes References
Arsenic as As(VI) or As(III)
Synthetic solutions, groundwater
Fe, Al and combination electrodes
Initial pH, initial concentration, current density, treatment time, electrochemical cell designs
Can obtain practically total removal of As. Optimum removal with modified flow or airlift reactor and neutral to alkaline pH. Oxidation of As(III) to As(VI) can take place.
[70, 71, 106, 129–131]
Chromium as Cr(VI) or Cr(III)
Synthetic solutions, wastewaters
Al, Fe and combination electrodes
Initial pH, current density, electrolyte concen-tration, electrode material, conductivity, treat-ment time
Practically complete removal of Cr possible. Reduction of Cr(VI) to Cr(III) can take place during EC.
[70, 87, 98, 109, 116, 119, 132–136]
Cobalt as Co(II)
Synthetic solutions Al electrodes Current density, initial pH, conductivity, initial concentration, treatment time
Initial pH has significant effect on removal efficiency. Higher removal efficiency in neutral or alkaline initial pH.
[105]
Iron as Fe(II)
Fe(II) added into tap water
Al electrodes Current density, initial concentration, treatment time, inter-electrode distance
Practically complete removal with long treatment time and/or high current density.
[137]
Mercury as Hg(II)
Synthetic solutions, surface water
Al and Fe electrodes
Current density, initial pH, treatment time, inter-electrode distance, electrode material
Practically complete removal of mercury. Higher efficien-cy of treatment with iron electrodes.
[110]
Indium as In(II)
Synthetic solutions Al, Fe and combination electrodes
Initial concentration, supporting electrolytes, electrode material, initial concentration, applied voltage
Highest removal efficiency with Fe-Al electrodes. Kinetics of indium removal follows pseudo-second order mecha-nism.
[99]
Manganese as Mn(II)
Synthetic solutions Al electrodes Initial pH, current density, treatment time, anions, conductivity, initial concentration.
Improved removal in neutral and alkaline pH. Possible direct reduction at the cathode surface.
[89, 104]
Mixed metal wastewaters
Synthetic solutions, wastewaters
Al, Fe and combination electrodes, stainless steel
Electrode material, current density, initial pH, conductivity, treatment time, anions, flow rate, initial concentration
Generally improved removal at neutral or alkaline pH. Iron or combination electrodes may give improved results compared to aluminium. Reduction of metals can take place.
[70, 87, 98, 104, 107, 134–136, 138]
43
1. Introduction
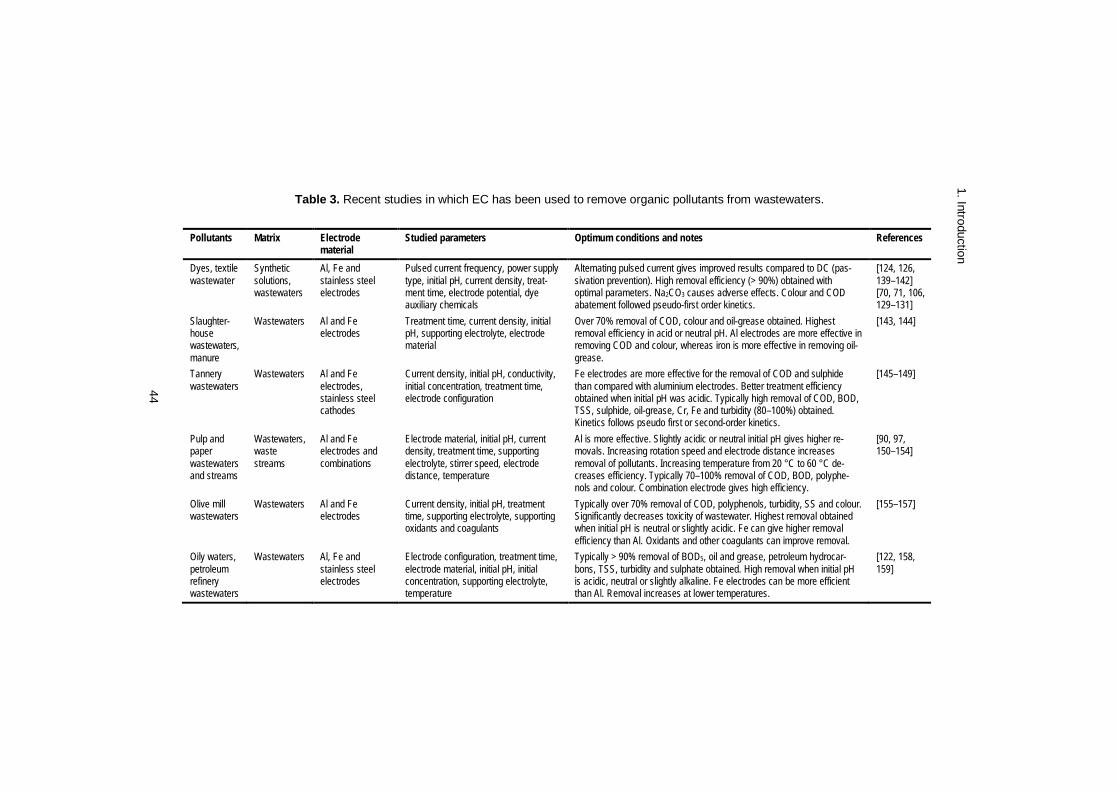
Table 3. Recent studies in which EC has been used to remove organic pollutants from wastewaters.
Pollutants Matrix Electrode material
Studied parameters Optimum conditions and notes References
Dyes, textile wastewater
Synthetic solutions, wastewaters
Al, Fe and stainless steel electrodes
Pulsed current frequency, power supply type, initial pH, current density, treat-ment time, electrode potential, dye auxiliary chemicals
Alternating pulsed current gives improved results compared to DC (pas-sivation prevention). High removal efficiency (> 90%) obtained with optimal parameters. Na2CO3 causes adverse effects. Colour and COD abatement followed pseudo-first order kinetics.
[124, 126, 139–142] [70, 71, 106, 129–131]
Slaughter-house wastewaters, manure
Wastewaters Al and Fe electrodes
Treatment time, current density, initial pH, supporting electrolyte, electrode material
Over 70% removal of COD, colour and oil-grease obtained. Highest removal efficiency in acid or neutral pH. Al electrodes are more effective in removing COD and colour, whereas iron is more effective in removing oil-grease.
[143, 144]
Tannery wastewaters
Wastewaters Al and Fe electrodes, stainless steel cathodes
Current density, initial pH, conductivity, initial concentration, treatment time, electrode configuration
Fe electrodes are more effective for the removal of COD and sulphide than compared with aluminium electrodes. Better treatment efficiency obtained when initial pH was acidic. Typically high removal of COD, BOD, TSS, sulphide, oil-grease, Cr, Fe and turbidity (80–100%) obtained. Kinetics follows pseudo first or second-order kinetics.
[145–149]
Pulp and paper wastewaters and streams
Wastewaters, waste streams
Al and Fe electrodes and combinations
Electrode material, initial pH, current density, treatment time, supporting electrolyte, stirrer speed, electrode distance, temperature
Al is more effective. Slightly acidic or neutral initial pH gives higher re-movals. Increasing rotation speed and electrode distance increases removal of pollutants. Increasing temperature from 20 °C to 60 °C de-creases efficiency. Typically 70–100% removal of COD, BOD, polyphe-nols and colour. Combination electrode gives high efficiency.
[90, 97, 150–154]
Olive mill wastewaters
Wastewaters Al and Fe electrodes
Current density, initial pH, treatment time, supporting electrolyte, supporting oxidants and coagulants
Typically over 70% removal of COD, polyphenols, turbidity, SS and colour. Significantly decreases toxicity of wastewater. Highest removal obtained when initial pH is neutral or slightly acidic. Fe can give higher removal efficiency than Al. Oxidants and other coagulants can improve removal.
[155–157]
Oily waters, petroleum refinery wastewaters
Wastewaters Al, Fe and stainless steel electrodes
Electrode configuration, treatment time, electrode material, initial pH, initial concentration, supporting electrolyte, temperature
Typically > 90% removal of BOD5, oil and grease, petroleum hydrocar-bons, TSS, turbidity and sulphate obtained. High removal when initial pH is acidic, neutral or slightly alkaline. Fe electrodes can be more efficient than Al. Removal increases at lower temperatures.
[122, 158, 159]
44
1. Introduction
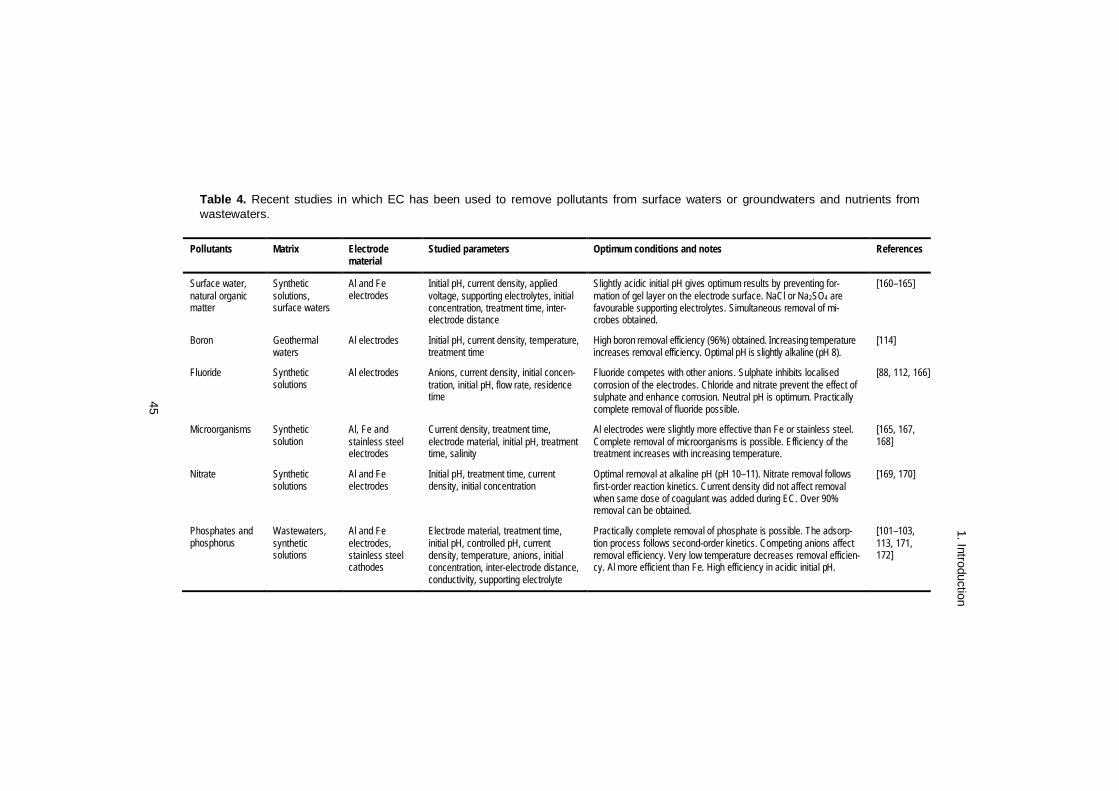
Table 4. Recent studies in which EC has been used to remove pollutants from surface waters or groundwaters and nutrients from wastewaters.
Pollutants Matrix Electrode material
Studied parameters Optimum conditions and notes References
Surface water, natural organic matter
Synthetic solutions, surface waters
Al and Fe electrodes
Initial pH, current density, applied voltage, supporting electrolytes, initial concentration, treatment time, inter-electrode distance
Slightly acidic initial pH gives optimum results by preventing for-mation of gel layer on the electrode surface. NaCl or Na2SO4 are favourable supporting electrolytes. Simultaneous removal of mi-crobes obtained.
[160–165]
Boron Geothermal waters
Al electrodes Initial pH, current density, temperature, treatment time
High boron removal efficiency (96%) obtained. Increasing temperature increases removal efficiency. Optimal pH is slightly alkaline (pH 8).
[114]
Fluoride Synthetic solutions
Al electrodes Anions, current density, initial concen-tration, initial pH, flow rate, residence time
Fluoride competes with other anions. Sulphate inhibits localised corrosion of the electrodes. Chloride and nitrate prevent the effect of sulphate and enhance corrosion. Neutral pH is optimum. Practically complete removal of fluoride possible.
[88, 112, 166]
Microorganisms Synthetic solution
Al, Fe and stainless steel electrodes
Current density, treatment time, electrode material, initial pH, treatment time, salinity
Al electrodes were slightly more effective than Fe or stainless steel. Complete removal of microorganisms is possible. Efficiency of the treatment increases with increasing temperature.
[165, 167, 168]
Nitrate Synthetic solutions
Al and Fe electrodes
Initial pH, treatment time, current density, initial concentration
Optimal removal at alkaline pH (pH 10–11). Nitrate removal follows first-order reaction kinetics. Current density did not affect removal when same dose of coagulant was added during EC. Over 90% removal can be obtained.
[169, 170]
Phosphates and phosphorus
Wastewaters, synthetic solutions
Al and Fe electrodes, stainless steel cathodes
Electrode material, treatment time, initial pH, controlled pH, current density, temperature, anions, initial concentration, inter-electrode distance, conductivity, supporting electrolyte
Practically complete removal of phosphate is possible. The adsorp-tion process follows second-order kinetics. Competing anions affect removal efficiency. Very low temperature decreases removal efficien-cy. Al more efficient than Fe. High efficiency in acidic initial pH.
[101–103, 113, 171, 172]
45
1. Introduction
1. Introduction
46
1.3.3 Combinations of electrocoagulation and other water treatment technologies
Besides the sludge separation technologies, filtration, flotation and sedimentation, other water treatment technologies have also been combined with EC. EC has been combined with chemical coagulants [173], Fenton-oxidation [174], hydrogen peroxide [175, 176], ozone [177], photocatalysis [178–180] and biofiltration [102].
The addition of oxidants such as hydrogen peroxide or ozone increases the removal of organic material from wastewaters. Kabda li et al. [174] studied the removal of organic matter and heavy metals from metal plating effluents using a combined EC-Fenton process. Stainless steel electrodes were used as anodes and cathodes. The combined process increased the removal of organic matter compared to EC only. The optimal dose of hydrogen peroxide was 15–30 mM. Roa-Morales et al. [176] treated wastewater from pasta and biscuit processing with aluminium EC combined with peroxide additions. Hydrogen peroxide addi-tions slightly increased COD removal compared to pure EC. Ozonation of effluent after EC can further decrease the concentration of organic matter in the effluent [177]. Higher removal efficiencies could be obtained when iron electrodes are used instead of aluminium because the presence of Fe(II) catalyses the decompo-sition of oxidants to hydroxyl radicals, which can mineralise organic pollutants. Residual organic matter after EC can be also removed with photocatalysis accord-ing to our study [180] and Boroski et al. [178, 179].
Can et al. [173] combined EC with chemical coagulants PACl and alum. The addition of chemical coagulants decreases pH, whereas EC increases it and with a combination system, the final pH can be stabilised to neutral region. EC com-bined with PACl gave higher COD removals than combination with alum. PACl has more prepolymerised species, which can be more efficient in pollutant removal and it also contains chlorides which increase localised corrosion of electrodes and reduce energy consumption. Yu et al. [102] combined EC with biofiltration. Combining EC to biofiltration increased the removal of COD and phosphorus from 69.1% and 9.6% to 76.6–83.7% and 70.7–93.0%, respectively.
1.3.4 Economical and ecological considerations
Operating cost calculations have been made in a few articles. Calculations typical-ly include the cost of chemicals, electrodes and energy. It should be noted that the price of materials and energy changes over the course of time and therefore, operating costs are only rough estimates. Cost calculations do not typically include investment costs, which may be significant including, for example power supplies, electrochemical cell vessels and sludge separation systems.
The treatment cost of dye polluted wastewaters has been estimated by Eyvaz et al. [126]. The estimated operating cost was USD 1.3–3.4 per kg TOC removed depending on parameters, such as treatment time. Sridhar et al. [151] carried out
1. Introduction
47
an economic analysis of the operating cost of EC treatment of pulp and paper industry bleaching effluents. Operating costs varied from USD 1.52 per m3 to 1.72 per m3. Ölmez [133] estimated the cost of Cr(VI) removal from wastewaters. The total cost of the EC process was about two-fold compared to the conventional process because of higher electricity consumption. Meunier et al. [135] compared the cost of electrochemical and chemical precipitation with calcium hydroxide or sodium hydroxide. EC was up to five times cheaper than chemical precipitation. Emamjomeh et al. [88] estimated operating costs of fluoride removal from water. Operating cost was AUD 0.36–0.61 per m3 when initial fluoride concentration was 5 mg/l. Kobya et al. [181] have published their operating cost calculations on the treatment of waste metal cutting fluids using EC. The operating cost was USD 0.025–0.90 per m3 and USD 0.01–0.79 per m3 with iron and aluminium electrodes, respectively. Espinoza-Quiñones et al. [149] made operational cost calculations for tannery wastewater treatment with EC. They estimated that a 60 min treatment (high removal of pollutants) costs USD 1.64 per m3, which was less than with conventional coagulants. According to Bayramoglu et al. [124], the operating cost of chemical treatment of textile wastewater by chemical coagulation was 3.2 times as high as that of EC.
It can be noticed that there are few articles where the costs of chemical coagu-lation and EC have been compared. It might be difficult to obtain reasonable in-formation on the price of common coagulants. Some chemical coagulants, such as aluminium sulphate and ferric chloride, are bulk chemicals and have a low price, whereas prehydrolysed metal coagulants are more expensive. The price of chemi-cals naturally depends on the amount that is required in the process and therefore, major consumers, such as pulp and paper mills or municipal water treatment plants, pay less for their chemicals than small users. However, iron and aluminium are typically more expensive in their metallic state than as metal salts because production of metals is energy consuming. Coagulation chemicals are produced from the minerals and are not transformed into the metallic state during this pro-cess. For example, aluminium sulphate is manufactured through the reaction of aluminium trihydrate and sulphuric acid. Aluminium trihydrate is made from baux-ite mineral by purification. Also the ecological effects of EC are somewhat un-known. As mentioned earlier, production of metallic aluminium and iron consume high amounts of energy [182]. It has been estimated that aluminium production consumes 5% of the electricity generated in the USA. Typically, aluminium is recycled and this process requires significantly less energy than the production of pristine metal. The ecological effect of water purification with EC and chemical coagulants should be compared, taking energy and material consumption into account during the manufacture of metals or chemicals.
2. Objectives and structure of the work
48
2. Objectives and structure of the work
2.1 Surface water treatment by electrocoagulation
The objective in Publications I–III was to study the parameters affecting NOM removal by EC. The effect of current density, treatment time, electric charge add-ed per volume, temperature, initial pH and electrochemical cell structure on the removal efficiency of NOM were investigated. Relevant water quality parameters were measured before and after treatment to evaluate the performance of the treatment. In Publication I, one objective of the study was to investigate whether chemical coagulation and EC could be used in combination. Statistical design of experiments (DOE) and models were used in Publication II–III to interpret the effect of treatment parameters and their combinations on NOM removal and to optimise parameters of EC.
2.2 Wastewater treatment by electrocoagulation
The objective in Publications IV and V was to investigate two specific applications of EC in wastewater treatment; the removal of sulphides in Publication IV and the removal of toxic pollutants in Publication V. In both papers, the main parameters affecting removal efficiency were studied. Wastewaters and effluents used in the studies were collected from pulp and paper mills. Synthetic pollutants were also used in Publication V in order to study the removal of single pollutants using EC treatment. Statistical methods were used in Publication V to interpret the results and to optimise the treatment parameters.
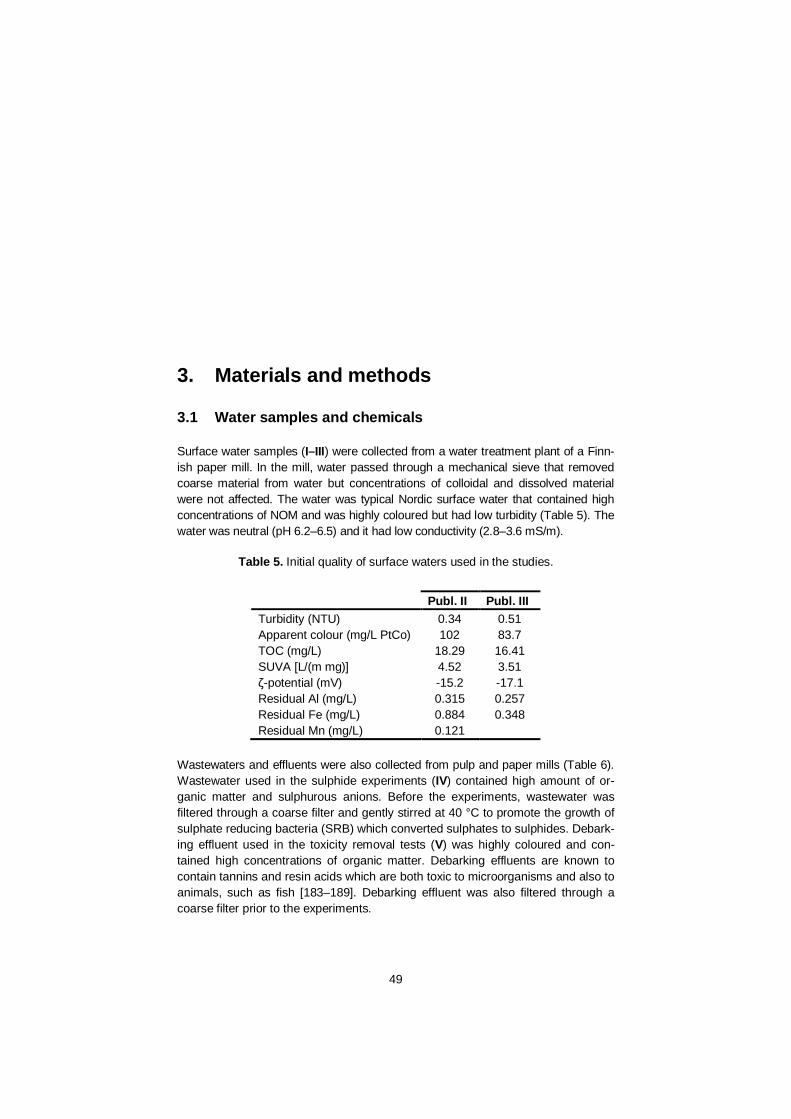
3. Materials and methods
49
3. Materials and methods
3.1 Water samples and chemicals
Surface water samples (I–III) were collected from a water treatment plant of a Finn-ish paper mill. In the mill, water passed through a mechanical sieve that removed coarse material from water but concentrations of colloidal and dissolved material were not affected. The water was typical Nordic surface water that contained high concentrations of NOM and was highly coloured but had low turbidity (Table 5). The water was neutral (pH 6.2–6.5) and it had low conductivity (2.8–3.6 mS/m).
Table 5. Initial quality of surface waters used in the studies.
Publ. II Publ. III Turbidity (NTU) 0.34 0.51 Apparent colour (mg/L PtCo) 102 83.7 TOC (mg/L) 18.29 16.41 SUVA [L/(m mg)] 4.52 3.51 -potential (mV) -15.2 -17.1
Residual Al (mg/L) 0.315 0.257 Residual Fe (mg/L) 0.884 0.348 Residual Mn (mg/L) 0.121
Wastewaters and effluents were also collected from pulp and paper mills (Table 6). Wastewater used in the sulphide experiments (IV) contained high amount of or-ganic matter and sulphurous anions. Before the experiments, wastewater was filtered through a coarse filter and gently stirred at 40 °C to promote the growth of sulphate reducing bacteria (SRB) which converted sulphates to sulphides. Debark-ing effluent used in the toxicity removal tests (V) was highly coloured and con-tained high concentrations of organic matter. Debarking effluents are known to contain tannins and resin acids which are both toxic to microorganisms and also to animals, such as fish [183–189]. Debarking effluent was also filtered through a coarse filter prior to the experiments.
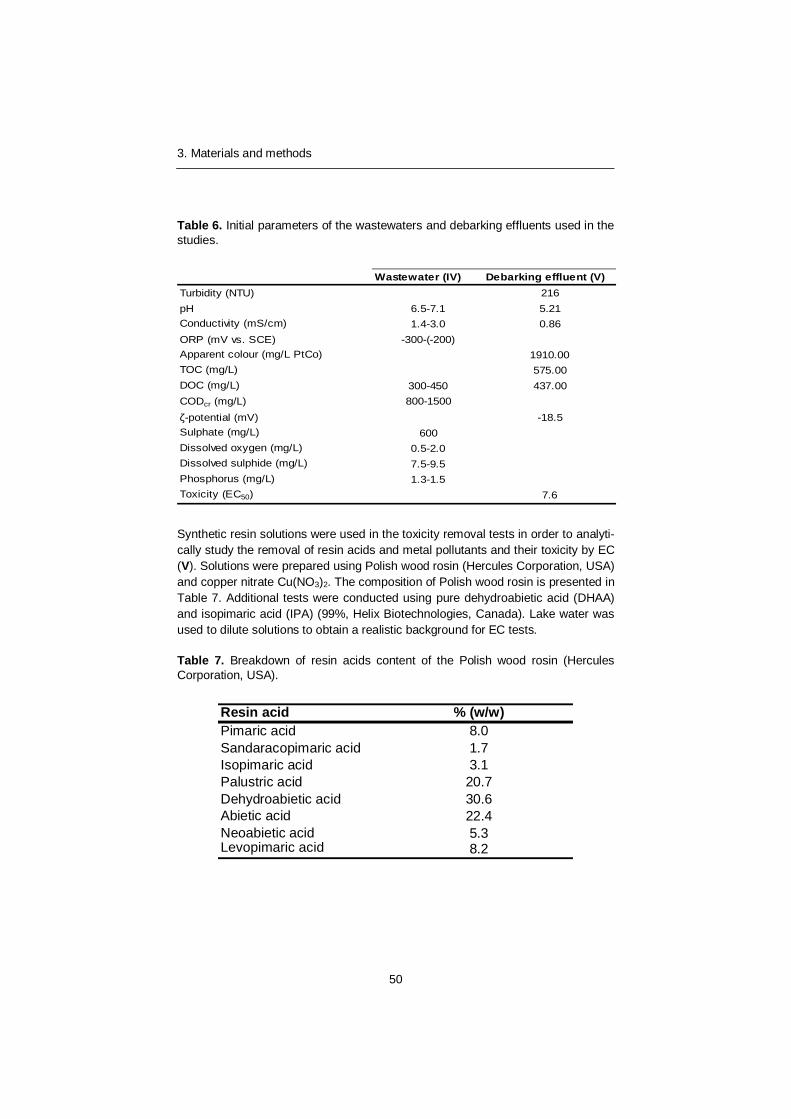
3. Materials and methods
50
Table 6. Initial parameters of the wastewaters and debarking effluents used in the studies.
Wastewater (IV) Debarking effluent (V)Turbidity (NTU) 216pH 6.5-7.1 5.21Conductivity (mS/cm) 1.4-3.0 0.86ORP (mV vs. SCE) -300-(-200)Apparent colour (mg/L PtCo) 1910.00TOC (mg/L) 575.00DOC (mg/L) 300-450 437.00CODcr (mg/L) 800-1500-potential (mV) -18.5
Sulphate (mg/L) 600Dissolved oxygen (mg/L) 0.5-2.0Dissolved sulphide (mg/L) 7.5-9.5Phosphorus (mg/L) 1.3-1.5Toxicity (EC50) 7.6
Synthetic resin solutions were used in the toxicity removal tests in order to analyti-cally study the removal of resin acids and metal pollutants and their toxicity by EC (V). Solutions were prepared using Polish wood rosin (Hercules Corporation, USA) and copper nitrate Cu(NO3)2. The composition of Polish wood rosin is presented in Table 7. Additional tests were conducted using pure dehydroabietic acid (DHAA) and isopimaric acid (IPA) (99%, Helix Biotechnologies, Canada). Lake water was used to dilute solutions to obtain a realistic background for EC tests.
Table 7. Breakdown of resin acids content of the Polish wood rosin (Hercules Corporation, USA).
Resin acid % (w/w)Pimaric acid 8.0Sandaracopimaric acid 1.7Isopimaric acid 3.1Palustric acid 20.7Dehydroabietic acid 30.6Abietic acid 22.4Neoabietic acid 5.3Levopimaric acid 8.2
3. Materials and methods
51
Water pH was adjusted (I–III, V) to the desired level using sulphuric acid and sodium hydroxide solutions. Auxiliary electrolytes, sodium chloride (NaCl) (I) and sodium sulphate (Na2SO4) (V), were used in some studies to acquire reasonable conduc-tivity. A chemical coagulant, PACl, was used in tests of combined EC and chemical coagulation (I). All inorganic salts and pH adjustment chemicals used in this study were of analytical grade except PACl, which was typical commercial grade used in the water treatment plant of a paper mill.
3.2 Water treatment procedure
Possible auxiliary chemicals were added into the water prior to electrochemical treatment. Electrochemical treatments were conducted in regular glass beakers. During the treatment, water was stirred with a standard magnetic stirrer. The elec-trochemical cell was constructed of either aluminium (I–III), iron (IV, V) or combi-nations of aluminium and inert electrodes (II). Combinations of aluminium and inert electrodes were constructed so that either anode (Cell A) or cathode (Cell C) or both electrodes (Cell T) were made of aluminium. In the Cell A and Cell C other electrodes were made of inert material which does not dissolve in these condi-tions. In all tests, electrodes were in a monopolar configuration. Electrode assem-bly was constructed of 70 mm * 120 mm (I) or 50 mm * 70 mm (II–V) plate elec-trodes. In total, four (I, IV, V) or 6 (II, III) electrode plates were used (half anodes and other half cathodes). The distance between the electrode plates was 5 mm (IV) or 10 mm (I–III, V). Electrochemical cells was constructed using plastic nuts and bolts to prevent short-circuiting of electrode plates. Standard laboratory power supplies were used in the experiments. Electrolysis parameters are presented in Table 8.
Table 8. Electrolysis parameters of this study.
Cur. density (mA/cm2) Electric charge (C/L) Voltage (V)Surface water (I-III) 0.36-1.79 0-150 3-32Wastewater (IV) 3.6-17.9 0-4500 2-11Debarking effluent (V) 7.1-21.4 0-2700 8-25
In some of the studies, samples were transferred into a programmable stirrer (I) or an overhead stirrer (II, III) to promote flocculation. Sedimentation was used (I– III, V) to enhance removal of coagulated material from the electrochemically treated water. Filtration through filter paper (I, III, IV) (Whatman or VWR) or GF/C glass fibre filter (Whatman) (II, V) was used in most of the studies for the separation of coagulated material from the treated water. In few tests, samples were conveyed by pipette from the glass beakers from the centre of the beaker after sedimenta-tion or flotation (I). Flocculation, sedimentation and filtration steps were used to simulate particle separation in full-scale water treatment plants by filtration, sedi-
3. Materials and methods
52
mentation or flotation. In addition, a few flotation tests were conducted using the bench-scale DAF system (I).
Temperature adjustment (III) during the tests was undertaken at 295 K using heating plate, at 285 K using water flow and at 275 K with an ice bath. According to measurements, temperature was maintained within a ±1 K range of the set temperature throughout all stages. Oxidation of sulphide was prevented during the sulphide precipitation tests (IV) by adding nitrogen into the sample bottle. Samples were pumped into the beakers to further ensure that mixing with air was mini-mised. After electrochemical treatment, the electrodes were washed with 4–10% HCl solution and distilled water.
3.3 Analytical methods
3.3.1 Chemical analysis
Water samples were stored, after filtration, in the cold, except sulphide samples which were measured right after the experiment because sulphides oxidise to sulphates when they come into contact with air. Water pH, conductivity, ORP and dissolved oxygen were measured using standard laboratory devices and sensors. The turbidity of samples was measured with Spectroquant NOVA60 (Merck) (I) or Model 2100P ISO turbidimeter (Hach) (II, III, V). Apparent colour was measured using a photometer 2100AN (I) or DR 2800 (Hach Lange) (II, III, V) according to standard EN ISO 7887:1994. Absorbance of the samples at 254 nm wavelength was measured with a Lambda 45 UV/Vis spectrophotometer (II–III).
The organic matter content of surface water and wastewater samples was in-vestigated by analysing permanganate index (I), COD (IV), TOC (II, III, V) or DOC (IV, V). The permanganate index was measured as stated in standard EN ISO 8467:1995 using a 2100AN (Hach) photometer. COD was measured according to standard SFS 5504:1998. TOC was measured using a TOC analyser (Shimadzu) and DOC was measured with the same analyser after the samples were filtered through a 0.45 µm pore size membrane.
Absorbance at 254 nm wavelength was measured to study the composition of residual NOM. Specific UV absorbance (SUVA) is absorbance at 254 nm divided by DOC concentration. When long-chained humic acids are present in water, SUVA values is high [3]. When SUVA value is 4–5 L/(m mg) the water is com-posed of hydrophobic material which is high in aromatic structures. When SUVA is less than 3 L/(m mg) the water is composed mainly of hydrophilic material. SUVA values were measured during the temperature and cell construction tests (II, III).
The concentration of metals was measured from acidified samples (0.2 ml 37% HNO3 to 10 ml sample) using iCAP 6000 series ICP-OES (Thermo Electron) (II–V) or photometric method (I). Residual metal concentrations were measured after filtration, whereas metals dissolved from the electrodes were measured from the
3. Materials and methods
53
samples which were taken during or directly after the treatment. The -potential of the samples was measured using a Zetasizer Nano ZS analyser (Malvern). Resin acids were measured according to the method described by Soimasuo et al. [190] using the HP 6890 GC-MS system (Hewlett-Packard) with HP-5 capillary column. Sulphate, sulphide and phosphorus concentrations of the samples were measured using photometric methods (Lange). Dissolved sulphide and phosphorus concen-trations were measured after passing the samples through a 0.45 µm pore size membranes.
3.3.2 Toxicity analysis
Bacterial toxicity was measured using a Microtox-Flash assay based on the biolu-minescence of the marine bacterium Vibrio fischeri. Toxic substances affect the metabolism of the cells and break their structure, thus reducing bioluminence. Bacterial toxicity tests were conducted according to the BioToxTM method (Aboatox, BO1243-500), standard draft ISO CD 2006b and the method developed by Lappalainen et al. [191] using a Sirius luminometer. 2% NaCl solution was used as negative control, whereas K2Cr2O7 was used as a positive reference chemical. In addition to bacterial toxicity, toxicity of samples to algae was also measured. Analysis was carried out according to standard ISO 8692:2004. The sample size was reduced to fit 48-well microplates (Greiner bio-one GmbH). The average algal cell concentration prior to exposure to wastewaters was measured using a micro-scope (Olympus BX40) and cytometer (Assistant). Fluorescence after 0 hrs, 24 hrs, 48 hrs and 72 hrs exposure was measured using Fluoroscan Ascent fluorom-eter (Labsystems). Negative control solutions contained nutrients, whereas K2Cr2O7 was used as the positive reference substance.
3.4 Statistical methods
Statistical design of experiments (DOE) and statistical models were used to study the effect of treatment parameters (factors) and their interaction terms on pollutant removal. Either full factorial design containing all possible variations (II, III) or central composite face (CCF) (V) design was used. The factors range and levels are presented in Tables 9–11. Full factorial design (Table 9) was conducted sepa-rately for all three electrolysis design cells when the effect of cell construction on NOM removal was studied (II).
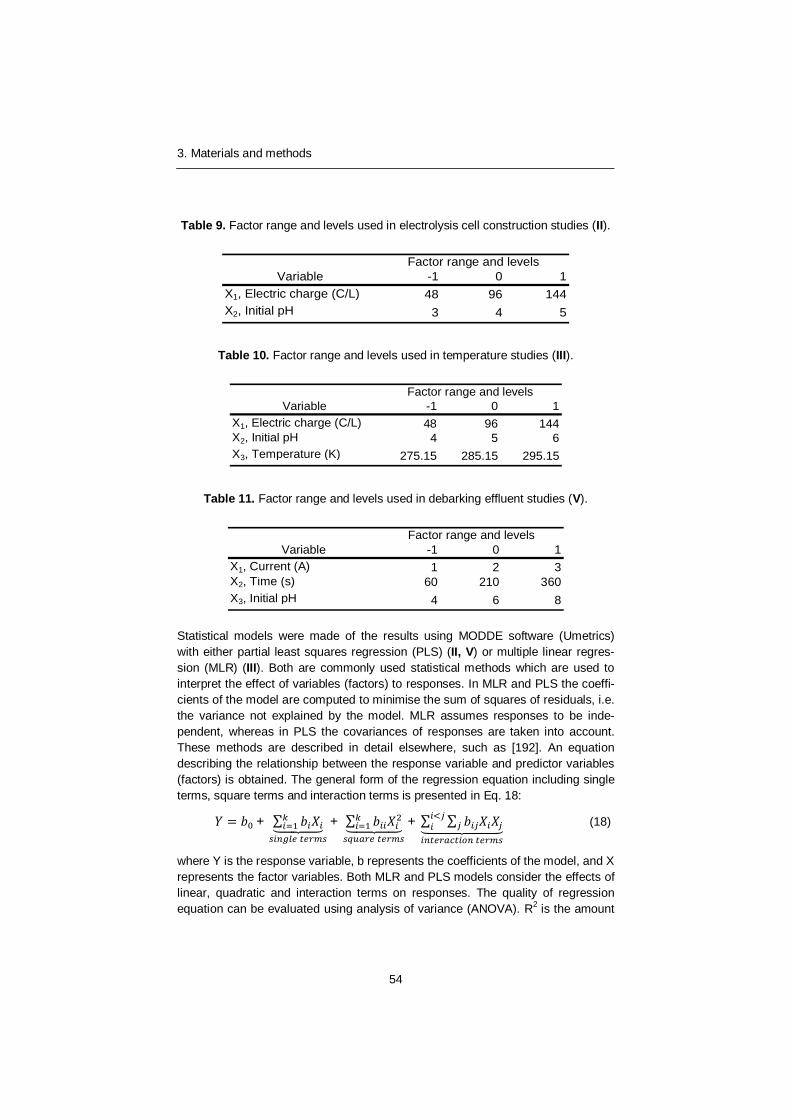
3. Materials and methods
54
Table 9. Factor range and levels used in electrolysis cell construction studies (II).
Variable -1 0 1X1, Electric charge (C/L) 48 96 144X2, Initial pH 3 4 5
Factor range and levels
Table 10. Factor range and levels used in temperature studies (III).
Variable -1 0 1X1, Electric charge (C/L) 48 96 144X2, Initial pH 4 5 6X3, Temperature (K) 275.15 285.15 295.15
Factor range and levels
Table 11. Factor range and levels used in debarking effluent studies (V).
Variable -1 0 1X1, Current (A) 1 2 3X2, Time (s) 60 210 360X3, Initial pH 4 6 8
Factor range and levels
Statistical models were made of the results using MODDE software (Umetrics) with either partial least squares regression (PLS) (II, V) or multiple linear regres-sion (MLR) (III). Both are commonly used statistical methods which are used to interpret the effect of variables (factors) to responses. In MLR and PLS the coeffi-cients of the model are computed to minimise the sum of squares of residuals, i.e. the variance not explained by the model. MLR assumes responses to be inde-pendent, whereas in PLS the covariances of responses are taken into account. These methods are described in detail elsewhere, such as [192]. An equation describing the relationship between the response variable and predictor variables (factors) is obtained. The general form of the regression equation including single terms, square terms and interaction terms is presented in Eq. 18:
+ + + (18)
where Y is the response variable, b represents the coefficients of the model, and X represents the factor variables. Both MLR and PLS models consider the effects of linear, quadratic and interaction terms on responses. The quality of regression equation can be evaluated using analysis of variance (ANOVA). R2 is the amount

3. Materials and methods
55
of variance explained by the model, whereas Q2 is an estimate of the predictive ability of the model. Q2 is calculated using the results of cross-validation. Detailed descriptions of model quality terms are given elsewhere [192].
4. Results and discussion
56
4. Results and discussion
4.1 Quality of the statistical models
Variation of TOC, DOC, final pH, aluminium added, UV254nm absorbance, water colour (PtCo), toxicity and residual aluminium and iron concentrations were ex-plained with high accuracy (R2 0.8) by the model terms (II, III, V). R2 was moder-ate (III) or good (II, V) for the -potential of the samples. Moderate -potential was due to pure error of the measurements according to reproducibility values. Iron concentration and toxicity of the debarking effluents had low Q2 values, thus indi-cating poor results in cross-validation and therefore low predictability of these responses by the model. According to ANOVA, this was mainly related to model error. Turbidity of the samples had moderate R2 for the model of Cell C (II). Cell C had low predictability (Q2 < 0.5) for turbidity, apparent colour, TOC, aluminium added and residual concentrations of iron and manganese. This was due to both model error and replicate error. In general, model qualities for different cell con-structions were in order of Cell C < Cell T < Cell A, which could be explained by the different dissolution mechanisms. Dissolution of aluminium in Cell A depended linearly on electric charge added per volume, whereas in Cell C and Cell T the dissolution rate of cathode changed over the course of time. As most of the water quality parameters depended on aluminium added to the solution, the linear be-haviour of Cell A was more easily explained by the model. Therefore, it is also recommended that aluminium added is used as factor in possible future studies.
4.2 Dissolving of electrodes
Dissolving of aluminium and iron electrodes was studied in various conditions. Dissolving of both electrode materials followed or were higher than estimated according to Faraday’s law. The effect of current density on electrode dissolution was not studied because highest removal of NOM per electric charge was ob-tained with lowest current densities (I) and therefore low current densities were selected for the further studies. The effect of current density on dissolution of aluminium has been studied by [78].
4. Results and discussion
57
Aluminium electrodes were selected for NOM removal studies because alumin-ium does not significantly increase the colour of water, even when there is some residual concentration, and were therefore more suitable for surface water treat-ment when water should be used as industrial fresh water. Iron electrodes were selected for the wastewater treatment studies because iron is known to react with sulphides more effectively than aluminium [148] and aluminium may have some toxicity towards microorganisms [193].
4.2.1 Aluminium electrodes
Water temperature had a significant effect on the dissolving speed of the alumini-um electrodes (III). First, the effect of temperature on the dissolving rate of alumin-ium electrodes was studied in preliminary tests, in which the treatment time was short (low electric charge per volume). Longer tests were made according to DOE (Fig. 7). The dissolving rate of aluminium was 0.13–0.30 mgAl/C in long tests, whereas the theoretical dissolution rate calculated according to Faraday’s law is 0.093 mgAl/C. According to both tests, the dissolving rate obtained at 275.15 K was significantly lower than at 295.15 K, especially when electric charge per vol-ume increased. The dissolving rate was close to theoretical values at the begin-ning of the treatment and increased over the course of time. The dissolution of anodes followed Faraday’s law [78] and it is not expected that temperature has a significant effect on this electrochemical dissolution mechanism because current passing through the cell was directly proportional to the dissolution rate, and the current did not fluctuate during the test (galvanostatic test). According to the re-sults, the chemical dissolution of aluminium cathodes was affected by tempera-ture. At low temperatures, chemical dissolution initiated more slowly than at higher temperatures. However, the test duration was short and therefore it is not known when and where the dissolution rate stabilised and if there was any difference in the dissolution rates at different temperatures when the reaction rate had stabi-lised.
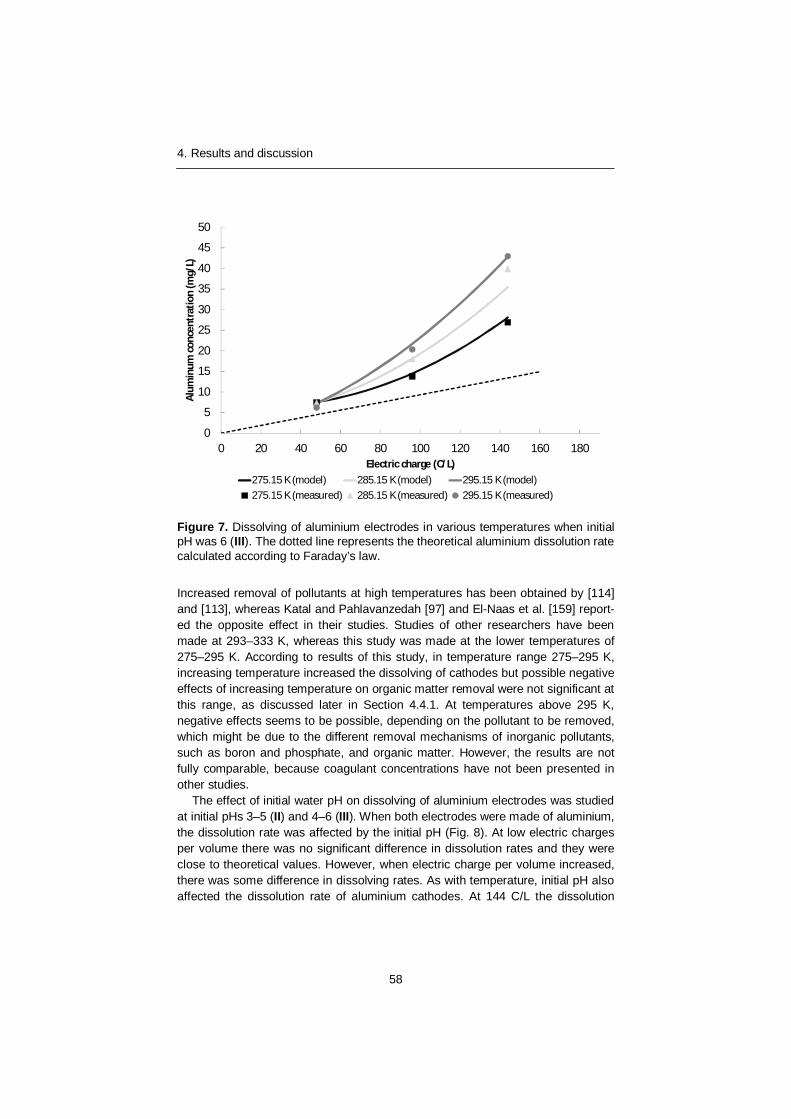
4. Results and discussion
58
Figure 7. Dissolving of aluminium electrodes in various temperatures when initial pH was 6 (III). The dotted line represents the theoretical aluminium dissolution rate calculated according to Faraday’s law.
Increased removal of pollutants at high temperatures has been obtained by [114] and [113], whereas Katal and Pahlavanzedah [97] and El-Naas et al. [159] report-ed the opposite effect in their studies. Studies of other researchers have been made at 293–333 K, whereas this study was made at the lower temperatures of 275–295 K. According to results of this study, in temperature range 275–295 K, increasing temperature increased the dissolving of cathodes but possible negative effects of increasing temperature on organic matter removal were not significant at this range, as discussed later in Section 4.4.1. At temperatures above 295 K, negative effects seems to be possible, depending on the pollutant to be removed, which might be due to the different removal mechanisms of inorganic pollutants, such as boron and phosphate, and organic matter. However, the results are not fully comparable, because coagulant concentrations have not been presented in other studies.
The effect of initial water pH on dissolving of aluminium electrodes was studied at initial pHs 3–5 (II) and 4–6 (III). When both electrodes were made of aluminium, the dissolution rate was affected by the initial pH (Fig. 8). At low electric charges per volume there was no significant difference in dissolution rates and they were close to theoretical values. However, when electric charge per volume increased, there was some difference in dissolving rates. As with temperature, initial pH also affected the dissolution rate of aluminium cathodes. At 144 C/L the dissolution
0
5
10
15
20
25
30
35
40
45
50
0 20 40 60 80 100 120 140 160 180
Alum
inum
conc
entr
atio
n (m
g/L)
Electric charge (C/L)275.15 K (model) 285.15 K (model) 295.15 K (model)275.15 K (measured) 285.15 K (measured) 295.15 K (measured)
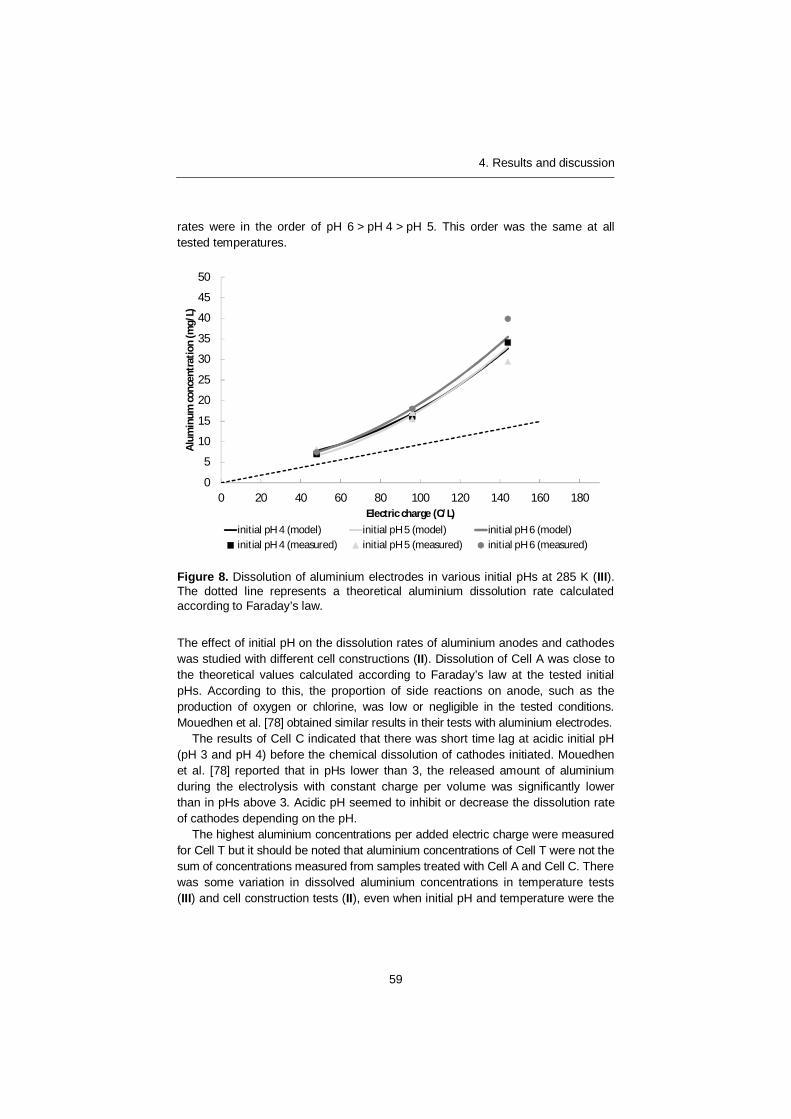
4. Results and discussion
59
rates were in the order of pH 6 > pH 4 > pH 5. This order was the same at all tested temperatures.
Figure 8. Dissolution of aluminium electrodes in various initial pHs at 285 K (III). The dotted line represents a theoretical aluminium dissolution rate calculated according to Faraday’s law.
The effect of initial pH on the dissolution rates of aluminium anodes and cathodes was studied with different cell constructions (II). Dissolution of Cell A was close to the theoretical values calculated according to Faraday’s law at the tested initial pHs. According to this, the proportion of side reactions on anode, such as the production of oxygen or chlorine, was low or negligible in the tested conditions. Mouedhen et al. [78] obtained similar results in their tests with aluminium electrodes.
The results of Cell C indicated that there was short time lag at acidic initial pH (pH 3 and pH 4) before the chemical dissolution of cathodes initiated. Mouedhen et al. [78] reported that in pHs lower than 3, the released amount of aluminium during the electrolysis with constant charge per volume was significantly lower than in pHs above 3. Acidic pH seemed to inhibit or decrease the dissolution rate of cathodes depending on the pH.
The highest aluminium concentrations per added electric charge were measured for Cell T but it should be noted that aluminium concentrations of Cell T were not the sum of concentrations measured from samples treated with Cell A and Cell C. There was some variation in dissolved aluminium concentrations in temperature tests (III) and cell construction tests (II), even when initial pH and temperature were the
0
5
10
15
20
25
30
35
40
45
50
0 20 40 60 80 100 120 140 160 180
Alum
inum
conc
entr
atio
n (m
g/L)
Electric charge (C/L)initial pH 4 (model) initial pH 5 (model) initial pH 6 (model)initial pH 4 (measured) initial pH 5 (measured) initial pH 6 (measured)
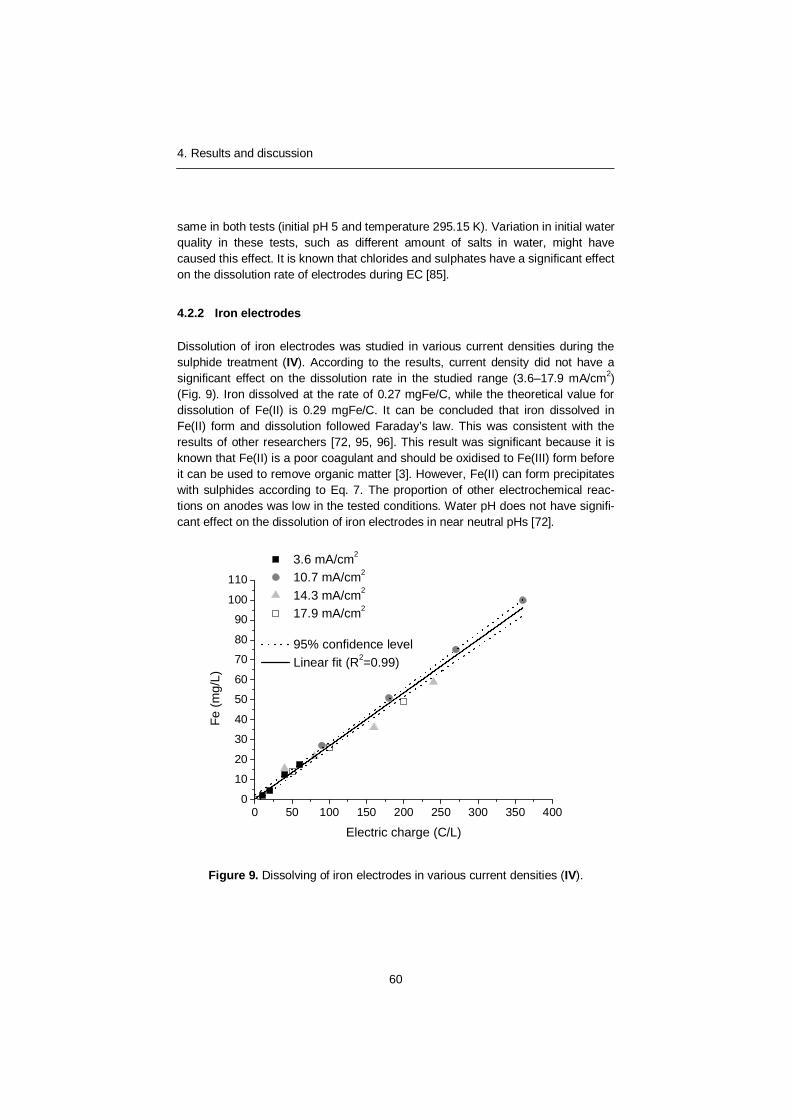
4. Results and discussion
60
same in both tests (initial pH 5 and temperature 295.15 K). Variation in initial water quality in these tests, such as different amount of salts in water, might have caused this effect. It is known that chlorides and sulphates have a significant effect on the dissolution rate of electrodes during EC [85].
4.2.2 Iron electrodes
Dissolution of iron electrodes was studied in various current densities during the sulphide treatment (IV). According to the results, current density did not have a significant effect on the dissolution rate in the studied range (3.6–17.9 mA/cm2) (Fig. 9). Iron dissolved at the rate of 0.27 mgFe/C, while the theoretical value for dissolution of Fe(II) is 0.29 mgFe/C. It can be concluded that iron dissolved in Fe(II) form and dissolution followed Faraday’s law. This was consistent with the results of other researchers [72, 95, 96]. This result was significant because it is known that Fe(II) is a poor coagulant and should be oxidised to Fe(III) form before it can be used to remove organic matter [3]. However, Fe(II) can form precipitates with sulphides according to Eq. 7. The proportion of other electrochemical reac-tions on anodes was low in the tested conditions. Water pH does not have signifi-cant effect on the dissolution of iron electrodes in near neutral pHs [72].
Figure 9. Dissolving of iron electrodes in various current densities (IV).
0 50 100 150 200 250 300 350 4000
10
20
30
40
50
60
70
80
90
100
110
Fe (m
g/L)
Electric charge (C/L)
3.6 mA/cm2
10.7 mA/cm2
14.3 mA/cm2
17.9 mA/cm2
95% confidence level Linear fit (R2=0.99)
4. Results and discussion
61
4.3 Change of pH and conductivity
Change of pH during the EC treatment is a well-known side effect of EC [76, 127, 194]. The effects of initial pH, temperature, electric charge and electrolysis cell construction on pH change were studied (II, III). When initial pH was highly acidic (pH 3), the alkalinity produced by electrochemical reaction was not sufficient to neutralise pH and final pH was 3.3–4.4 when the electric charge was 48–144 C/L. When initial pH was 4–6, the final pH was neutralised to pH 5.6–7.8. According to the results, the pH increment was higher when initial pH was acidic (except in very acidic initial pH 3) and therefore, it could be concluded that less HO- ions were bound to the sludge produced in water having low initial pH. This may have an effect on sludge properties.
Tests with different cell constructions indicate that final pH also depended on the cell construction (II). This effect was due to different Al/HO- ratios produced by different cell constructions. In initial pH 5 and electric charge 144 C/L the final pHs of waters treated with Cell T, Cell C and Cell A were 6.83, 7.47 and 7.76, respec-tively. Respective aluminium concentrations were 18.42 mg/L, 16.26 mg/L and 12.04 mg/L. The amount of HO- ions produced by electrolysis followed Faraday’s law. Aluminium, on the other hand, dissolved from both electrodes but chemical dissolution of cathodes did not follow Faraday’s law. A higher concentration of free HO- ions led to higher final pH. The effect was similar in other tested initial pHs. Decreasing temperature slightly increased the final pH due to this same effect; aluminium cathodes dissolved at a lower rate at lower temperatures and therefore, there were more free HO- ions in the solution.
Water pH also increased when iron electrodes were used (IV, V), except at ini-tial pH 8 when short treatment times were used. When DOC and COD removals were studied with high electric charges (4500 C/L) the final pH of the wastewater increased as high as 10.4. It was expected that pH increases faster and higher with iron electrodes than with aluminium electrodes because less coagulant was produced per produced HO- ions, because iron did not dissolve on cathodes. Produced Fe(II) bound less HO- ions compared to Al(III) and therefore pH in-creased to a higher level because sludge contained less HO- ions. Al(III) form Al(OH)4
- species at high pH, which stabilises pH change. The transformation of Fe(II) to Fe(III) at high pH and oxidising conditions decreased pH because Fe(III) bound more HO- ions.
Conductivities of samples depended on the concentration of residual metal co-agulant and final pH. When initial pH was acidic, conductivity was naturally higher than in neutral initial pH because more ions were added into the solution. In tem-perature tests, water conductivity without EC treatments was 2.8 mS/m and after small pH correction (initial pH 6) and treatment with 144 C/L at 295.15 K the final conductivity was 3.0 mS/m. Water conductivity was 3.5 mS/m and 3.3 mS/m when waters having initial pH 4 and 5 were treated with the same parameters, respectively. It could be concluded that optimised EC treatment had a negligible
4. Results and discussion
62
effect on water conductivity. This differs from metal salt coagulants, which signifi-cantly increase the concentration of salts, such as chlorides or sulphates, in water.
4.4 Surface water treatment
4.4.1 Organic matter removal
The effects of current density, electric charge, initial pH, temperature and electrol-ysis cell construction on NOM removal from surface water samples were studied (I–III). In addition, the removal of NOM by combined chemical coagulation and EC was investigated (I).
When current density increased, the same amount of organic matter was re-moved in a shorter treatment time as when the production rate of coagulant in-creased (I). However, when organic matter removal was observed as a function of electric charge, low current density was more effective. According to Mouedhen et al. [78], the dissolution rate of cathodes does not increase as a function of current density in contrast to the dissolution of anodes. Even low current density initiated chemical dissolution of cathodes and therefore, more aluminium was produced per electric charge in low current density, which in turn meant that low current density was more energy efficient.
DOC or TOC removal increased when added electric charge per volume in-creased. Initial pH had a significant effect on the removal of organic matter. At initial pH 3, there was no significant effect whether aluminium originated from anodes or cathodes (II). The TOC removal rate was 0.83 mgTOC per mgAl added into the solution. TOC concentration depended linearly on the aluminium concen-tration added into the solution. The statistical model showed somewhat false re-sults at this initial pH, especially for Cell C (Fig. 10). At low pH, the mechanism of NOM removal was mainly charge neutralisation and compression of double layer, because hydroxides were not stable in this environment [3, 10]. It is noteworthy that the TOC removal rate as a function of aluminium concentration did not de-crease, even at low TOC concentrations at this initial pH. Therefore, it is possible that even higher TOC removal could be obtained if even higher aluminium concen-trations would be used.
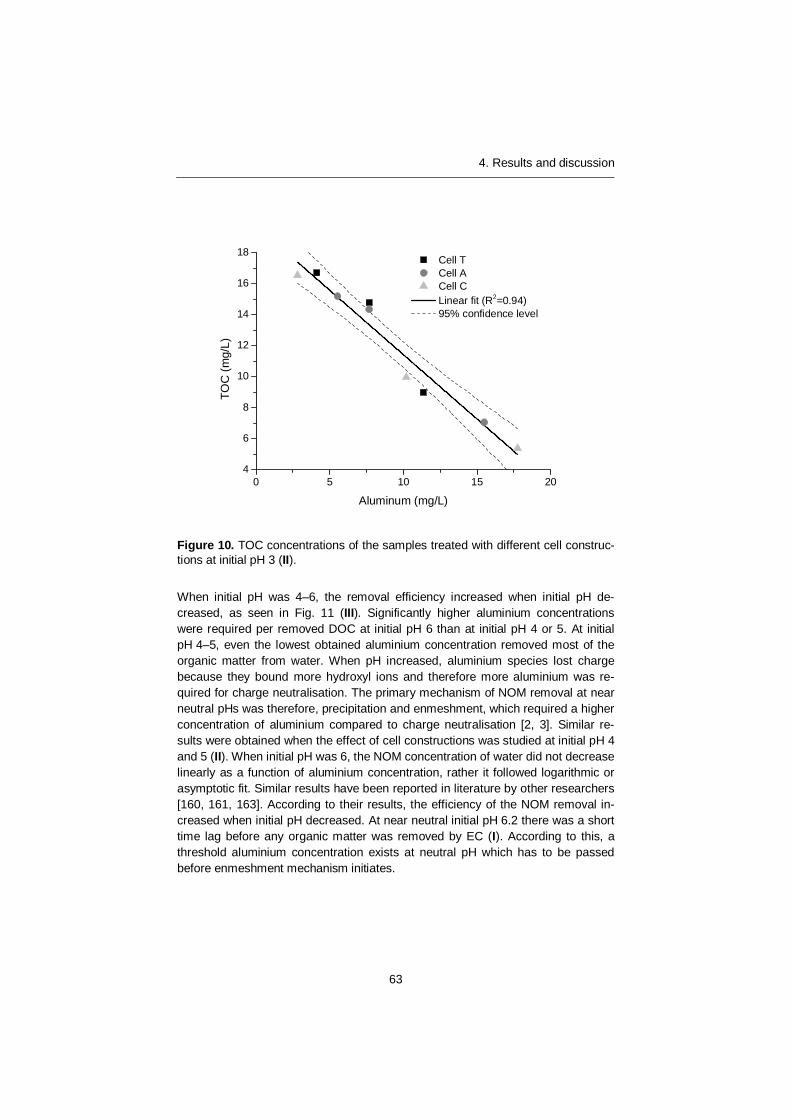
4. Results and discussion
63
Figure 10. TOC concentrations of the samples treated with different cell construc-tions at initial pH 3 (II).
When initial pH was 4–6, the removal efficiency increased when initial pH de-creased, as seen in Fig. 11 (III). Significantly higher aluminium concentrations were required per removed DOC at initial pH 6 than at initial pH 4 or 5. At initial pH 4–5, even the lowest obtained aluminium concentration removed most of the organic matter from water. When pH increased, aluminium species lost charge because they bound more hydroxyl ions and therefore more aluminium was re-quired for charge neutralisation. The primary mechanism of NOM removal at near neutral pHs was therefore, precipitation and enmeshment, which required a higher concentration of aluminium compared to charge neutralisation [2, 3]. Similar re-sults were obtained when the effect of cell constructions was studied at initial pH 4 and 5 (II). When initial pH was 6, the NOM concentration of water did not decrease linearly as a function of aluminium concentration, rather it followed logarithmic or asymptotic fit. Similar results have been reported in literature by other researchers [160, 161, 163]. According to their results, the efficiency of the NOM removal in-creased when initial pH decreased. At near neutral initial pH 6.2 there was a short time lag before any organic matter was removed by EC (I). According to this, a threshold aluminium concentration exists at neutral pH which has to be passed before enmeshment mechanism initiates.
0 5 10 15 204
6
8
10
12
14
16
18 Cell T Cell A Cell C Linear fit (R2=0.94) 95% confidence level
TOC
(mg/
L)
Aluminum (mg/L)
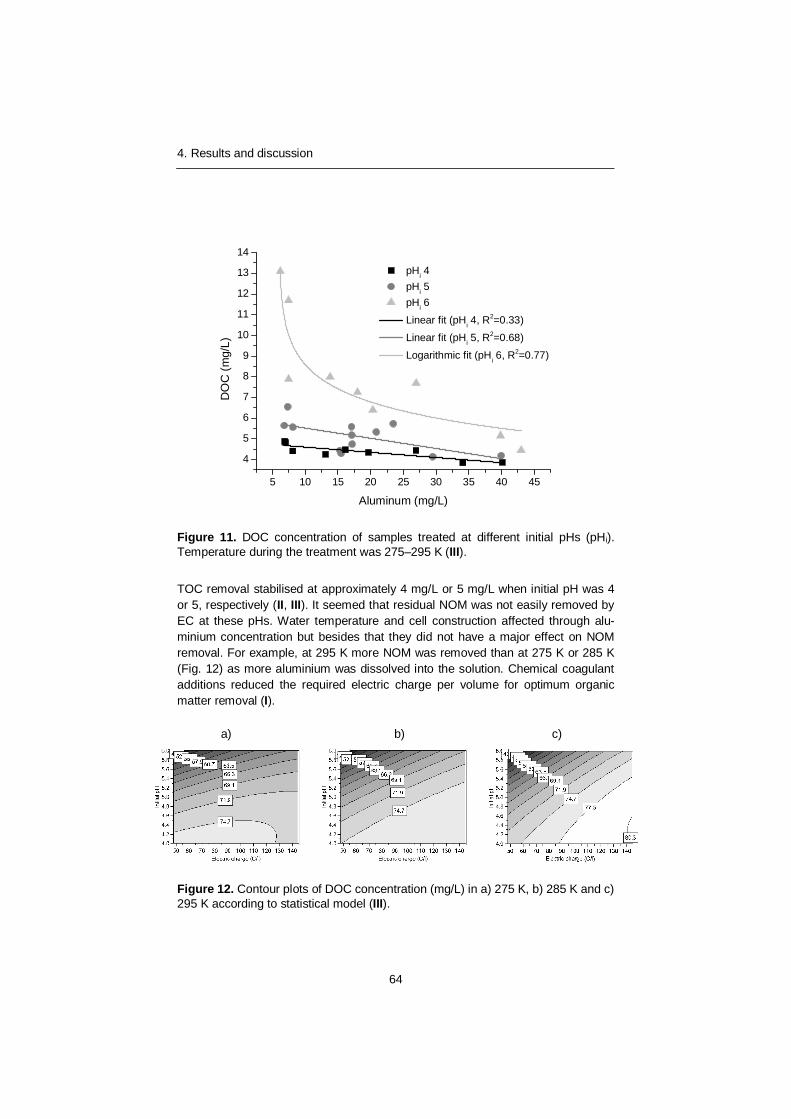
4. Results and discussion
64
Figure 11. DOC concentration of samples treated at different initial pHs (pHi). Temperature during the treatment was 275–295 K (III).
TOC removal stabilised at approximately 4 mg/L or 5 mg/L when initial pH was 4 or 5, respectively (II, III). It seemed that residual NOM was not easily removed by EC at these pHs. Water temperature and cell construction affected through alu-minium concentration but besides that they did not have a major effect on NOM removal. For example, at 295 K more NOM was removed than at 275 K or 285 K (Fig. 12) as more aluminium was dissolved into the solution. Chemical coagulant additions reduced the required electric charge per volume for optimum organic matter removal (I).
Figure 12. Contour plots of DOC concentration (mg/L) in a) 275 K, b) 285 K and c) 295 K according to statistical model (III).
5 10 15 20 25 30 35 40 45
4
5
6
7
8
9
10
11
12
13
14
pHi 4 pHi 5 pHi 6 Linear fit (pHi 4, R2=0.33)
Linear fit (pHi 5, R2=0.68) Logarithmic fit (pHi 6, R2=0.77)
DO
C (m
g/L)
Aluminum (mg/L)
a) b) c)
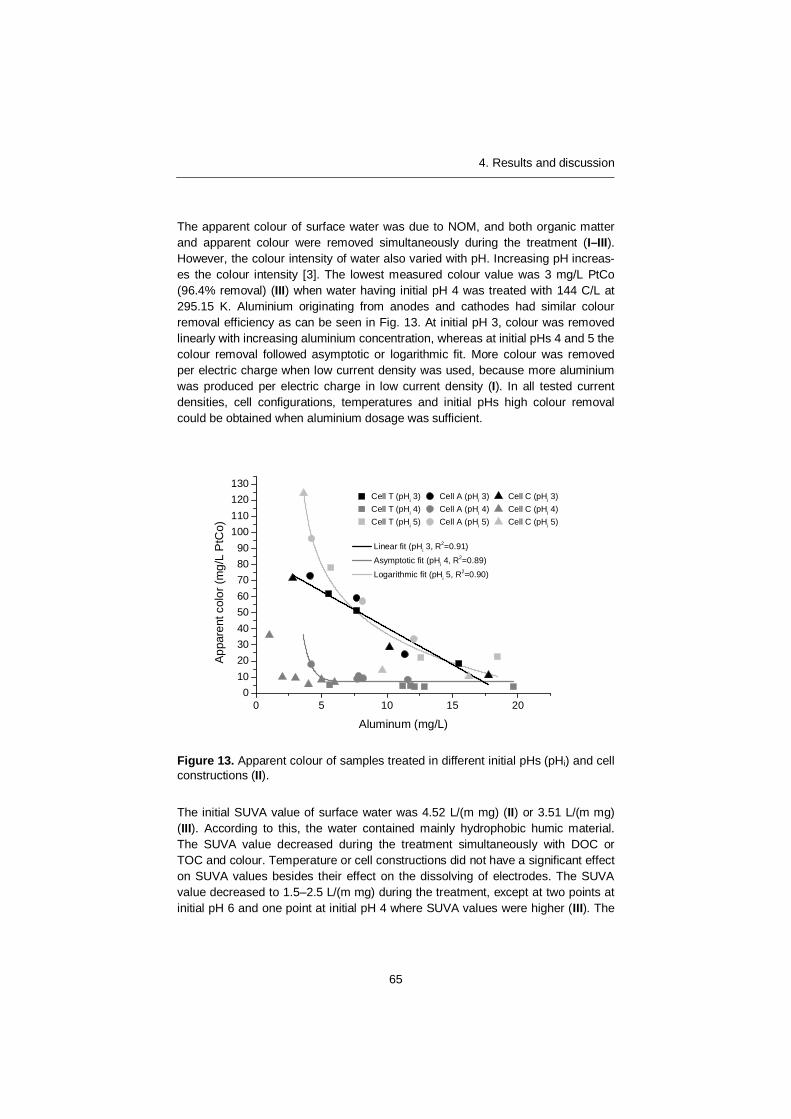
4. Results and discussion
65
The apparent colour of surface water was due to NOM, and both organic matter and apparent colour were removed simultaneously during the treatment (I–III). However, the colour intensity of water also varied with pH. Increasing pH increas-es the colour intensity [3]. The lowest measured colour value was 3 mg/L PtCo (96.4% removal) (III) when water having initial pH 4 was treated with 144 C/L at 295.15 K. Aluminium originating from anodes and cathodes had similar colour removal efficiency as can be seen in Fig. 13. At initial pH 3, colour was removed linearly with increasing aluminium concentration, whereas at initial pHs 4 and 5 the colour removal followed asymptotic or logarithmic fit. More colour was removed per electric charge when low current density was used, because more aluminium was produced per electric charge in low current density (I). In all tested current densities, cell configurations, temperatures and initial pHs high colour removal could be obtained when aluminium dosage was sufficient.
Figure 13. Apparent colour of samples treated in different initial pHs (pHi) and cell constructions (II).
The initial SUVA value of surface water was 4.52 L/(m mg) (II) or 3.51 L/(m mg) (III). According to this, the water contained mainly hydrophobic humic material. The SUVA value decreased during the treatment simultaneously with DOC or TOC and colour. Temperature or cell constructions did not have a significant effect on SUVA values besides their effect on the dissolving of electrodes. The SUVA value decreased to 1.5–2.5 L/(m mg) during the treatment, except at two points at initial pH 6 and one point at initial pH 4 where SUVA values were higher (III). The
0 5 10 15 200
102030405060708090
100110120130
Cell T (pHi 3) Cell A (pHi 3) Cell C (pHi 3)Cell T (pHi 4) Cell A (pHi 4) Cell C (pHi 4)Cell T (pHi 5) Cell A (pHi 5) Cell C (pHi 5)
Linear fit (pHi 3, R2=0.91) Asymptotic fit (pHi 4, R2=0.89) Logarithmic fit (pHi 5, R2=0.90)
Appa
rent
col
or (m
g/L
PtC
o)
Aluminum (mg/L)
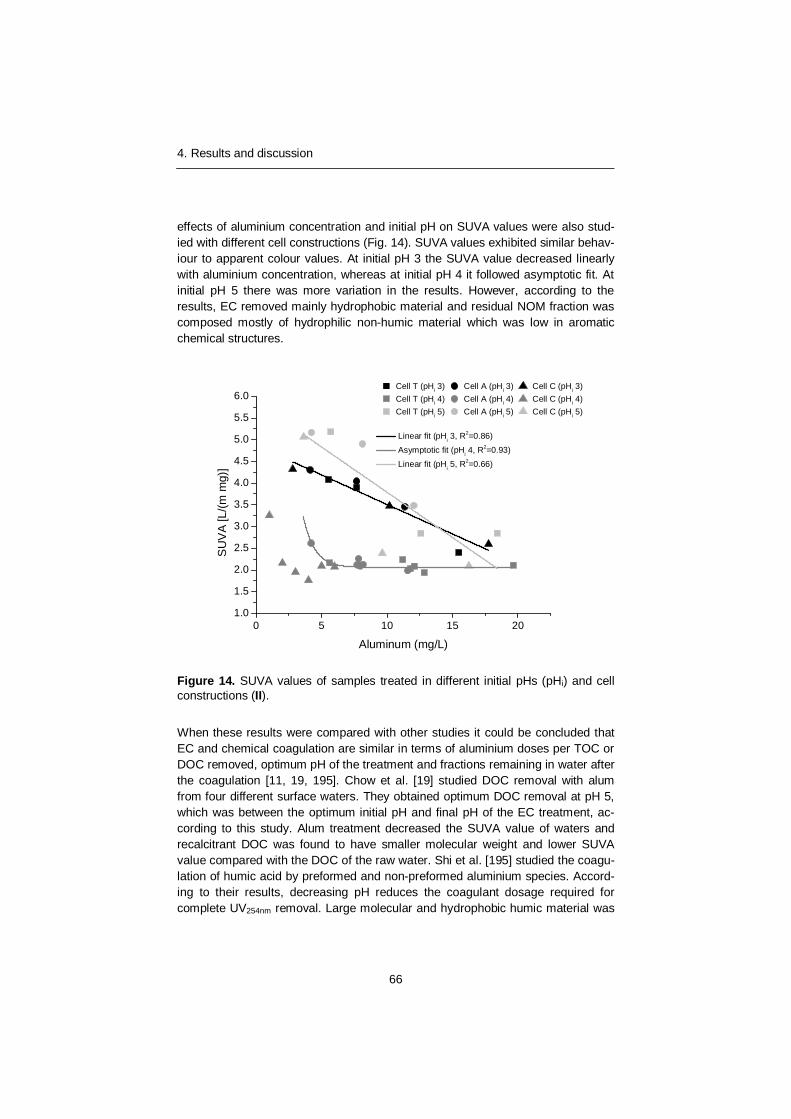
4. Results and discussion
66
effects of aluminium concentration and initial pH on SUVA values were also stud-ied with different cell constructions (Fig. 14). SUVA values exhibited similar behav-iour to apparent colour values. At initial pH 3 the SUVA value decreased linearly with aluminium concentration, whereas at initial pH 4 it followed asymptotic fit. At initial pH 5 there was more variation in the results. However, according to the results, EC removed mainly hydrophobic material and residual NOM fraction was composed mostly of hydrophilic non-humic material which was low in aromatic chemical structures.
Figure 14. SUVA values of samples treated in different initial pHs (pHi) and cell constructions (II).
When these results were compared with other studies it could be concluded that EC and chemical coagulation are similar in terms of aluminium doses per TOC or DOC removed, optimum pH of the treatment and fractions remaining in water after the coagulation [11, 19, 195]. Chow et al. [19] studied DOC removal with alum from four different surface waters. They obtained optimum DOC removal at pH 5, which was between the optimum initial pH and final pH of the EC treatment, ac-cording to this study. Alum treatment decreased the SUVA value of waters and recalcitrant DOC was found to have smaller molecular weight and lower SUVA value compared with the DOC of the raw water. Shi et al. [195] studied the coagu-lation of humic acid by preformed and non-preformed aluminium species. Accord-ing to their results, decreasing pH reduces the coagulant dosage required for complete UV254nm removal. Large molecular and hydrophobic humic material was
0 5 10 15 201.0
1.5
2.0
2.5
3.0
3.5
4.0
4.5
5.0
5.5
6.0Cell T (pHi 3) Cell A (pHi 3) Cell C (pHi 3)Cell T (pHi 4) Cell A (pHi 4) Cell C (pHi 4)Cell T (pHi 5) Cell A (pHi 5) Cell C (pHi 5)
Linear fit (pHi 3, R2=0.86) Asymptotic fit (pHi 4, R2=0.93) Linear fit (pHi 5, R2=0.66)
SU
VA
[L/(m
mg)
]
Aluminum (mg/L)
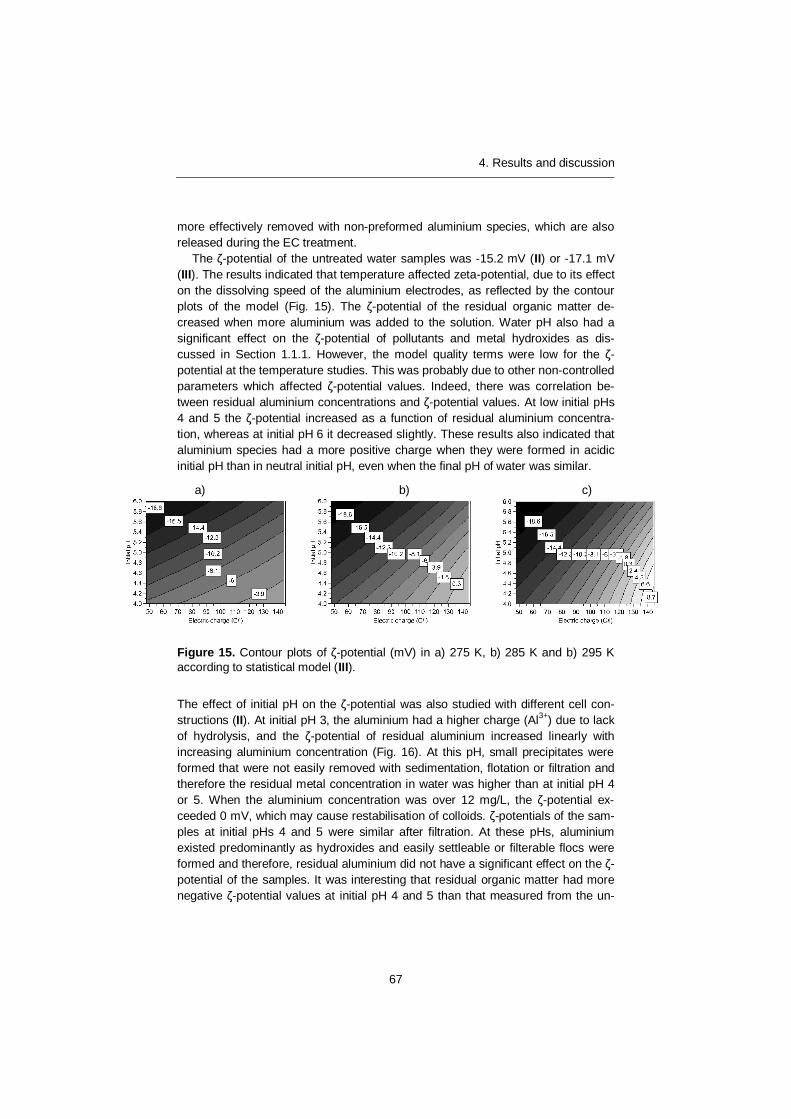
4. Results and discussion
67
more effectively removed with non-preformed aluminium species, which are also released during the EC treatment.
The -potential of the untreated water samples was -15.2 mV (II) or -17.1 mV (III). The results indicated that temperature affected zeta-potential, due to its effect on the dissolving speed of the aluminium electrodes, as reflected by the contour plots of the model (Fig. 15). The -potential of the residual organic matter de-creased when more aluminium was added to the solution. Water pH also had a significant effect on the -potential of pollutants and metal hydroxides as dis-cussed in Section 1.1.1. However, the model quality terms were low for the -potential at the temperature studies. This was probably due to other non-controlled parameters which affected -potential values. Indeed, there was correlation be-tween residual aluminium concentrations and -potential values. At low initial pHs 4 and 5 the -potential increased as a function of residual aluminium concentra-tion, whereas at initial pH 6 it decreased slightly. These results also indicated that aluminium species had a more positive charge when they were formed in acidic initial pH than in neutral initial pH, even when the final pH of water was similar.
Figure 15. Contour plots of -potential (mV) in a) 275 K, b) 285 K and b) 295 K according to statistical model (III).
The effect of initial pH on the -potential was also studied with different cell con-structions (II). At initial pH 3, the aluminium had a higher charge (Al3+) due to lack of hydrolysis, and the -potential of residual aluminium increased linearly with increasing aluminium concentration (Fig. 16). At this pH, small precipitates were formed that were not easily removed with sedimentation, flotation or filtration and therefore the residual metal concentration in water was higher than at initial pH 4 or 5. When the aluminium concentration was over 12 mg/L, the -potential ex-ceeded 0 mV, which may cause restabilisation of colloids. -potentials of the sam-ples at initial pHs 4 and 5 were similar after filtration. At these pHs, aluminium existed predominantly as hydroxides and easily settleable or filterable flocs were formed and therefore, residual aluminium did not have a significant effect on the -potential of the samples. It was interesting that residual organic matter had more negative -potential values at initial pH 4 and 5 than that measured from the un-
b) c) a)
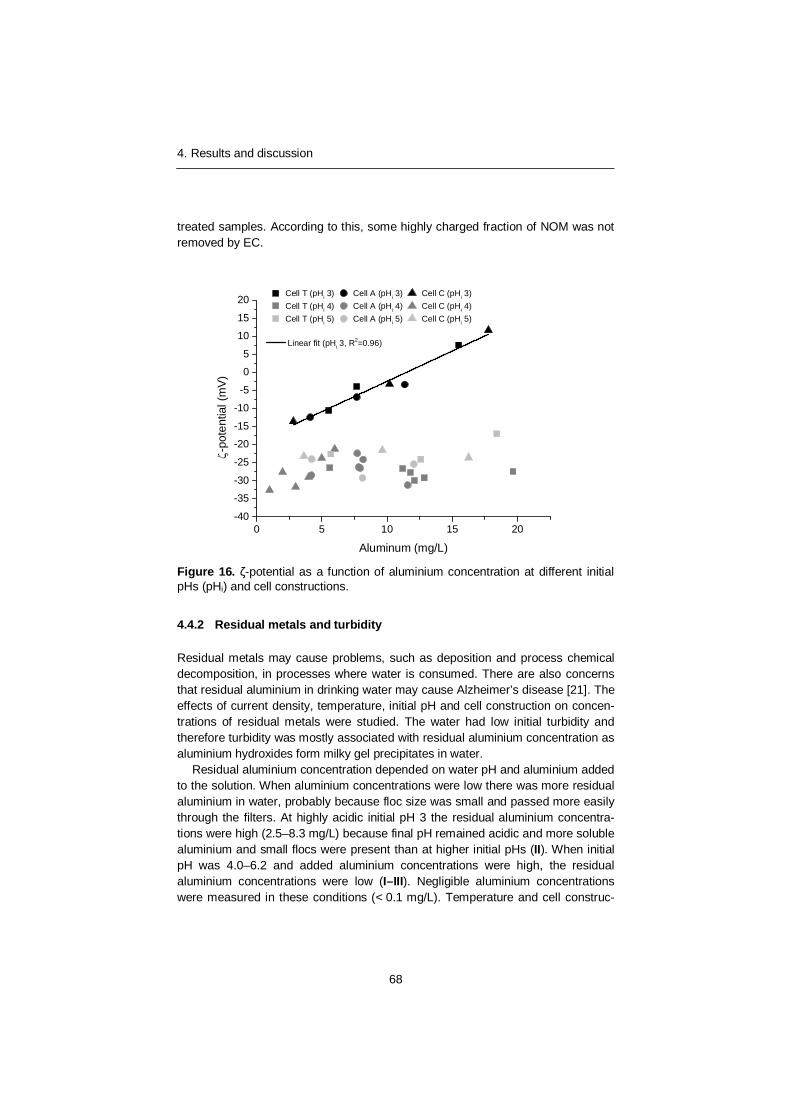
4. Results and discussion
68
treated samples. According to this, some highly charged fraction of NOM was not removed by EC.
Figure 16. -potential as a function of aluminium concentration at different initial pHs (pHi) and cell constructions.
4.4.2 Residual metals and turbidity
Residual metals may cause problems, such as deposition and process chemical decomposition, in processes where water is consumed. There are also concerns that residual aluminium in drinking water may cause Alzheimer’s disease [21]. The effects of current density, temperature, initial pH and cell construction on concen-trations of residual metals were studied. The water had low initial turbidity and therefore turbidity was mostly associated with residual aluminium concentration as aluminium hydroxides form milky gel precipitates in water.
Residual aluminium concentration depended on water pH and aluminium added to the solution. When aluminium concentrations were low there was more residual aluminium in water, probably because floc size was small and passed more easily through the filters. At highly acidic initial pH 3 the residual aluminium concentra-tions were high (2.5–8.3 mg/L) because final pH remained acidic and more soluble aluminium and small flocs were present than at higher initial pHs (II). When initial pH was 4.0–6.2 and added aluminium concentrations were high, the residual aluminium concentrations were low (I–III). Negligible aluminium concentrations were measured in these conditions (< 0.1 mg/L). Temperature and cell construc-
0 5 10 15 20-40
-35
-30
-25
-20
-15
-10
-5
0
5
10
15
20Cell T (pHi 3) Cell A (pHi 3) Cell C (pHi 3)Cell T (pHi 4) Cell A (pHi 4) Cell C (pHi 4)Cell T (pHi 5) Cell A (pHi 5) Cell C (pHi 5)
Linear fit (pHi 3, R2=0.96)
-pot
entia
l (m
V)
Aluminum (mg/L)
4. Results and discussion
69
tions did not have a significant effect on residual aluminium concentration besides their effect on the dissolving rate of aluminium electrodes. According to Chow et al. [19], minimum residual aluminium concentrations following alum treatment were obtained between pH 6 and 7. They concluded that optimum DOC removal and minimum residual aluminium concentration cannot be obtained at the same pH. However, according to results of this study optimum DOC removal and low residual aluminium could be obtained simultaneously with EC when initial pH was 4–5. This could be a significant benefit of EC in surface water treatment compared to chemical coagulation.
Untreated surface water also contained a relatively high concentration of iron (0.35–0.88 mg/L) and also low concentrations of manganese (0.12 mg/L). Both of these metals can cause coloured deposits. Iron was removed simultaneously with residual aluminium. Negligible iron concentrations (< 0.1 mg/L) were measured from electrocoagulated waters when the final pH of water was close to neutral and a sufficient concentration of aluminium was produced by electrolysis. Similar re-sults were obtained by Ghosh et al. [137] when they studied Fe(II) removal from tap water by EC. In contrast to iron removal, manganese removal seemed to de-pend on cell construction as the lowest manganese concentrations were meas-ured from samples which were treated with Cell T. However, manganese concen-tration in all samples, including the untreated samples, was low. High removal efficiencies of manganese have been reported by other researchers [89, 104]. It has been suggested that a direct reduction of Mn2+ would occur at the cathode surface.
4.5 Wastewater treatment
Two possible applications of EC in wastewater treatment, sulphide precipitation and toxicity removal, were studied. The effects of treatment parameters, such as initial pH, current density and added electric charge per volume were investigated. The simultaneous removal of organic matter, colour and phosphorus were also studied. Iron was selected for the material of electrodes.
4.5.1 Organic matter removal
Organic matter removal by EC was investigated during the sulphide precipitation tests and toxicity tests. The removal of organic matter by iron EC required high electric charge per volume and iron concentration. This confirms that iron dis-solved from anodes in Fe(II) form and was not effectively oxidised to Fe(III) in the studied conditions. Other researchers have also concluded that iron electrodes dissolve in Fe(II) form [72, 95, 96]
It was possible that simultaneous hydrogen formation during the treatment kept ORP of the water in the reducing range and therefore, oxidation of Fe(II) was slow.
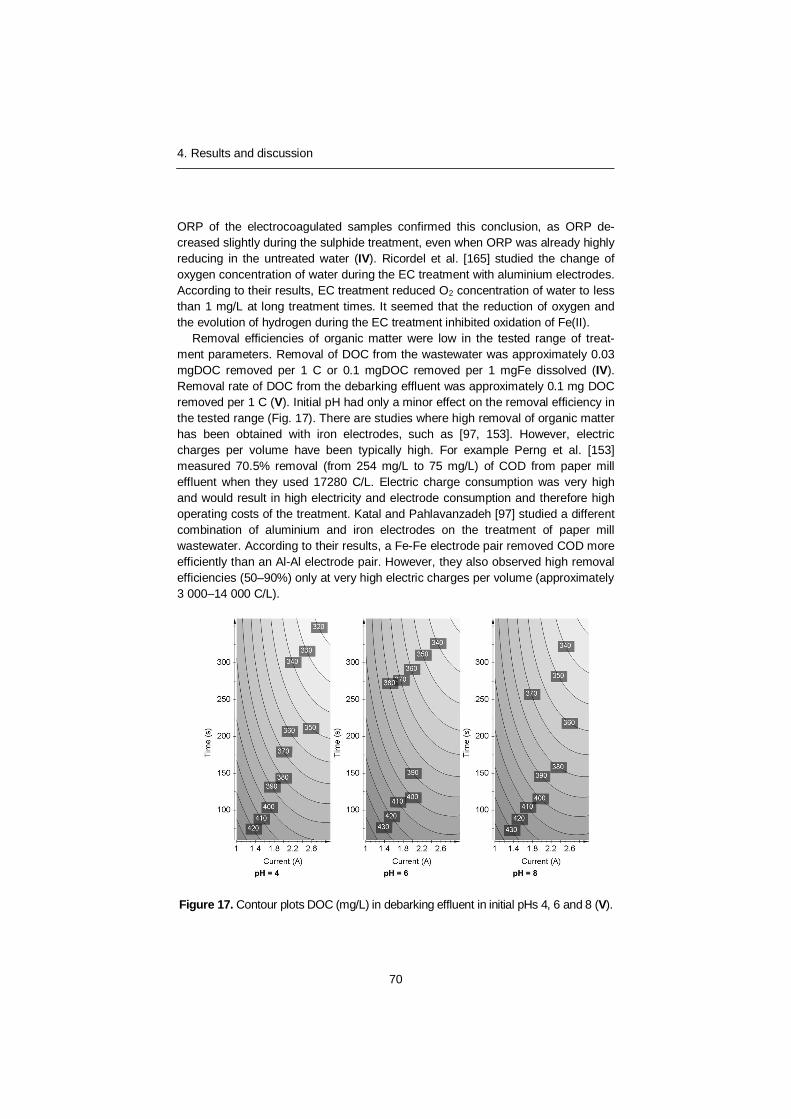
4. Results and discussion
70
ORP of the electrocoagulated samples confirmed this conclusion, as ORP de-creased slightly during the sulphide treatment, even when ORP was already highly reducing in the untreated water (IV). Ricordel et al. [165] studied the change of oxygen concentration of water during the EC treatment with aluminium electrodes. According to their results, EC treatment reduced O2 concentration of water to less than 1 mg/L at long treatment times. It seemed that the reduction of oxygen and the evolution of hydrogen during the EC treatment inhibited oxidation of Fe(II).
Removal efficiencies of organic matter were low in the tested range of treat-ment parameters. Removal of DOC from the wastewater was approximately 0.03 mgDOC removed per 1 C or 0.1 mgDOC removed per 1 mgFe dissolved (IV). Removal rate of DOC from the debarking effluent was approximately 0.1 mg DOC removed per 1 C (V). Initial pH had only a minor effect on the removal efficiency in the tested range (Fig. 17). There are studies where high removal of organic matter has been obtained with iron electrodes, such as [97, 153]. However, electric charges per volume have been typically high. For example Perng et al. [153] measured 70.5% removal (from 254 mg/L to 75 mg/L) of COD from paper mill effluent when they used 17280 C/L. Electric charge consumption was very high and would result in high electricity and electrode consumption and therefore high operating costs of the treatment. Katal and Pahlavanzadeh [97] studied a different combination of aluminium and iron electrodes on the treatment of paper mill wastewater. According to their results, a Fe-Fe electrode pair removed COD more efficiently than an Al-Al electrode pair. However, they also observed high removal efficiencies (50–90%) only at very high electric charges per volume (approximately 3 000–14 000 C/L).
Figure 17. Contour plots DOC (mg/L) in debarking effluent in initial pHs 4, 6 and 8 (V).
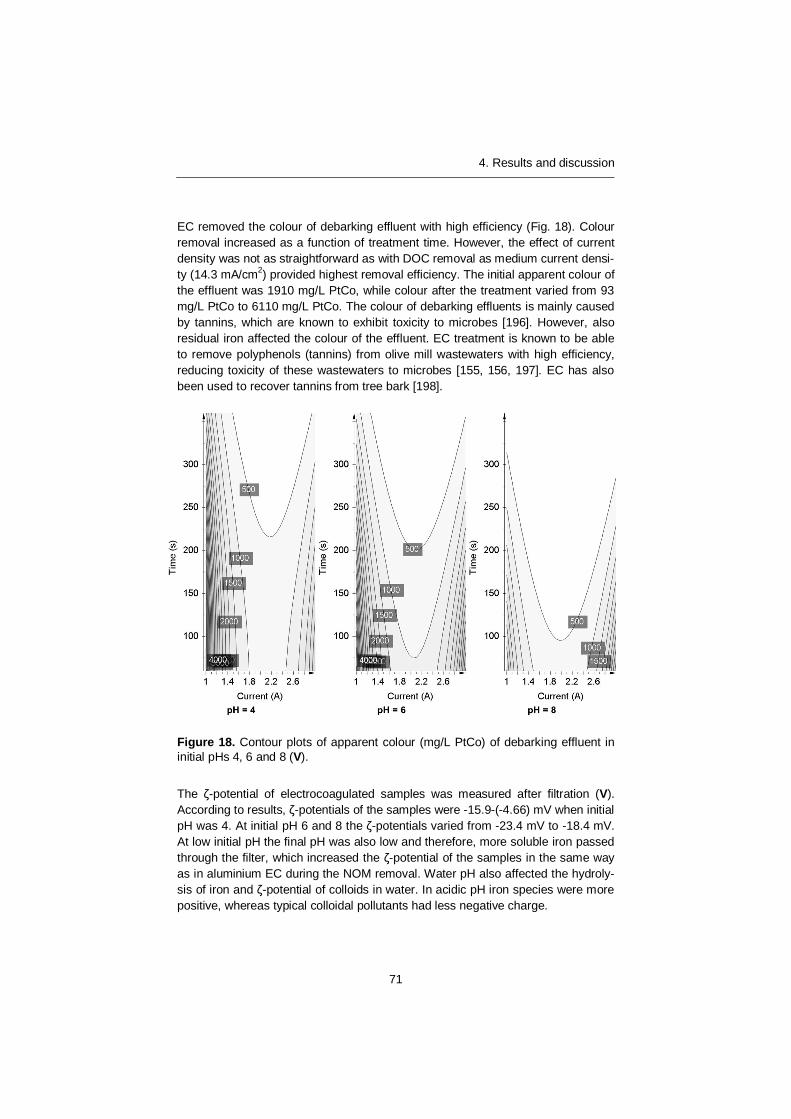
4. Results and discussion
71
EC removed the colour of debarking effluent with high efficiency (Fig. 18). Colour removal increased as a function of treatment time. However, the effect of current density was not as straightforward as with DOC removal as medium current densi-ty (14.3 mA/cm2) provided highest removal efficiency. The initial apparent colour of the effluent was 1910 mg/L PtCo, while colour after the treatment varied from 93 mg/L PtCo to 6110 mg/L PtCo. The colour of debarking effluents is mainly caused by tannins, which are known to exhibit toxicity to microbes [196]. However, also residual iron affected the colour of the effluent. EC treatment is known to be able to remove polyphenols (tannins) from olive mill wastewaters with high efficiency, reducing toxicity of these wastewaters to microbes [155, 156, 197]. EC has also been used to recover tannins from tree bark [198].
Figure 18. Contour plots of apparent colour (mg/L PtCo) of debarking effluent in initial pHs 4, 6 and 8 (V).
The -potential of electrocoagulated samples was measured after filtration (V). According to results, -potentials of the samples were -15.9-(-4.66) mV when initial pH was 4. At initial pH 6 and 8 the -potentials varied from -23.4 mV to -18.4 mV. At low initial pH the final pH was also low and therefore, more soluble iron passed through the filter, which increased the -potential of the samples in the same way as in aluminium EC during the NOM removal. Water pH also affected the hydroly-sis of iron and -potential of colloids in water. In acidic pH iron species were more positive, whereas typical colloidal pollutants had less negative charge.
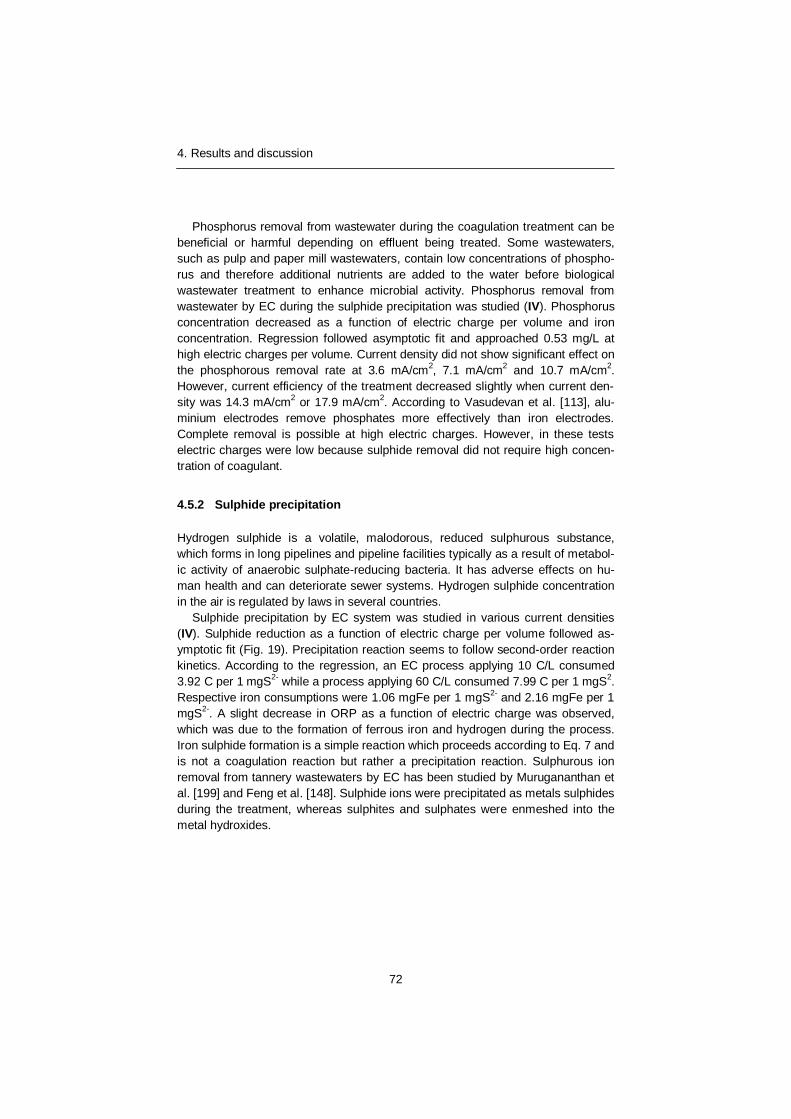
4. Results and discussion
72
Phosphorus removal from wastewater during the coagulation treatment can be beneficial or harmful depending on effluent being treated. Some wastewaters, such as pulp and paper mill wastewaters, contain low concentrations of phospho-rus and therefore additional nutrients are added to the water before biological wastewater treatment to enhance microbial activity. Phosphorus removal from wastewater by EC during the sulphide precipitation was studied (IV). Phosphorus concentration decreased as a function of electric charge per volume and iron concentration. Regression followed asymptotic fit and approached 0.53 mg/L at high electric charges per volume. Current density did not show significant effect on the phosphorous removal rate at 3.6 mA/cm2, 7.1 mA/cm2 and 10.7 mA/cm2. However, current efficiency of the treatment decreased slightly when current den-sity was 14.3 mA/cm2 or 17.9 mA/cm2. According to Vasudevan et al. [113], alu-minium electrodes remove phosphates more effectively than iron electrodes. Complete removal is possible at high electric charges. However, in these tests electric charges were low because sulphide removal did not require high concen-tration of coagulant.
4.5.2 Sulphide precipitation
Hydrogen sulphide is a volatile, malodorous, reduced sulphurous substance, which forms in long pipelines and pipeline facilities typically as a result of metabol-ic activity of anaerobic sulphate-reducing bacteria. It has adverse effects on hu-man health and can deteriorate sewer systems. Hydrogen sulphide concentration in the air is regulated by laws in several countries.
Sulphide precipitation by EC system was studied in various current densities (IV). Sulphide reduction as a function of electric charge per volume followed as-ymptotic fit (Fig. 19). Precipitation reaction seems to follow second-order reaction kinetics. According to the regression, an EC process applying 10 C/L consumed 3.92 C per 1 mgS2- while a process applying 60 C/L consumed 7.99 C per 1 mgS2. Respective iron consumptions were 1.06 mgFe per 1 mgS2- and 2.16 mgFe per 1 mgS2-. A slight decrease in ORP as a function of electric charge was observed, which was due to the formation of ferrous iron and hydrogen during the process. Iron sulphide formation is a simple reaction which proceeds according to Eq. 7 and is not a coagulation reaction but rather a precipitation reaction. Sulphurous ion removal from tannery wastewaters by EC has been studied by Murugananthan et al. [199] and Feng et al. [148]. Sulphide ions were precipitated as metals sulphides during the treatment, whereas sulphites and sulphates were enmeshed into the metal hydroxides.
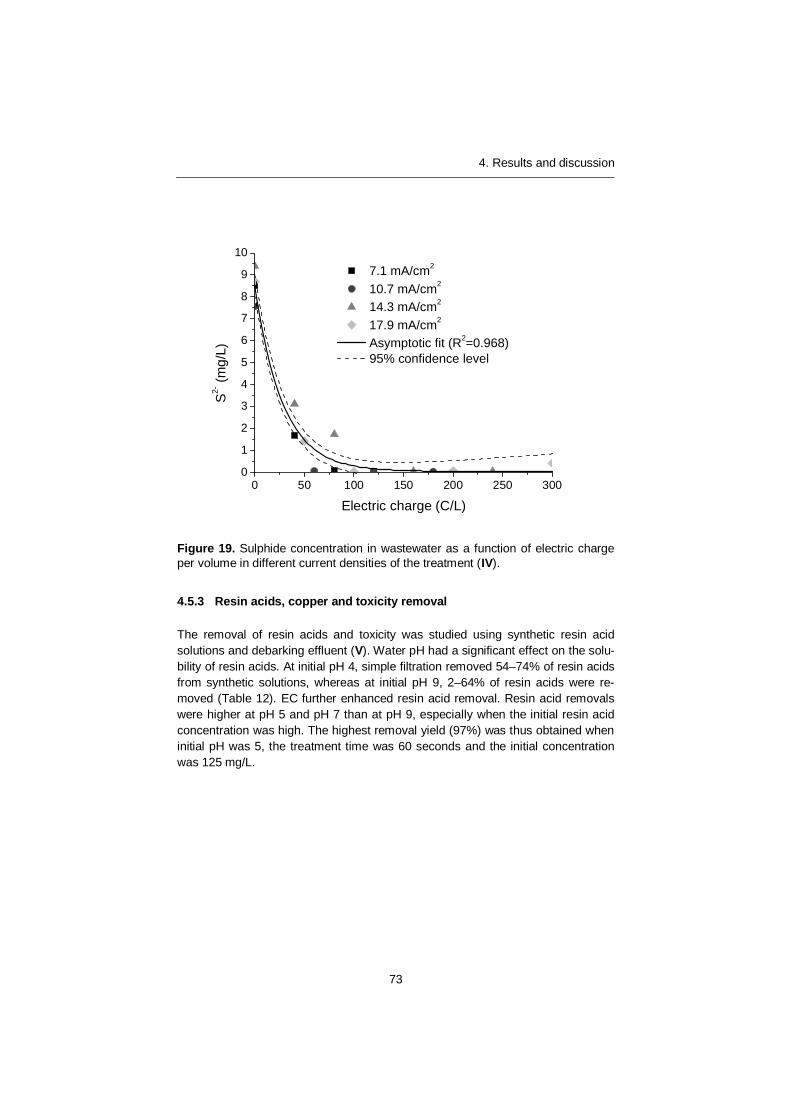
4. Results and discussion
73
0 50 100 150 200 250 3000
1
2
3
4
5
6
7
8
9
10
S2- (m
g/L)
Electric charge (C/L)
7.1 mA/cm2
10.7 mA/cm2
14.3 mA/cm2
17.9 mA/cm2
Asymptotic fit (R2=0.968) 95% confidence level
Figure 19. Sulphide concentration in wastewater as a function of electric charge per volume in different current densities of the treatment (IV).
4.5.3 Resin acids, copper and toxicity removal
The removal of resin acids and toxicity was studied using synthetic resin acid solutions and debarking effluent (V). Water pH had a significant effect on the solu-bility of resin acids. At initial pH 4, simple filtration removed 54–74% of resin acids from synthetic solutions, whereas at initial pH 9, 2–64% of resin acids were re-moved (Table 12). EC further enhanced resin acid removal. Resin acid removals were higher at pH 5 and pH 7 than at pH 9, especially when the initial resin acid concentration was high. The highest removal yield (97%) was thus obtained when initial pH was 5, the treatment time was 60 seconds and the initial concentration was 125 mg/L.
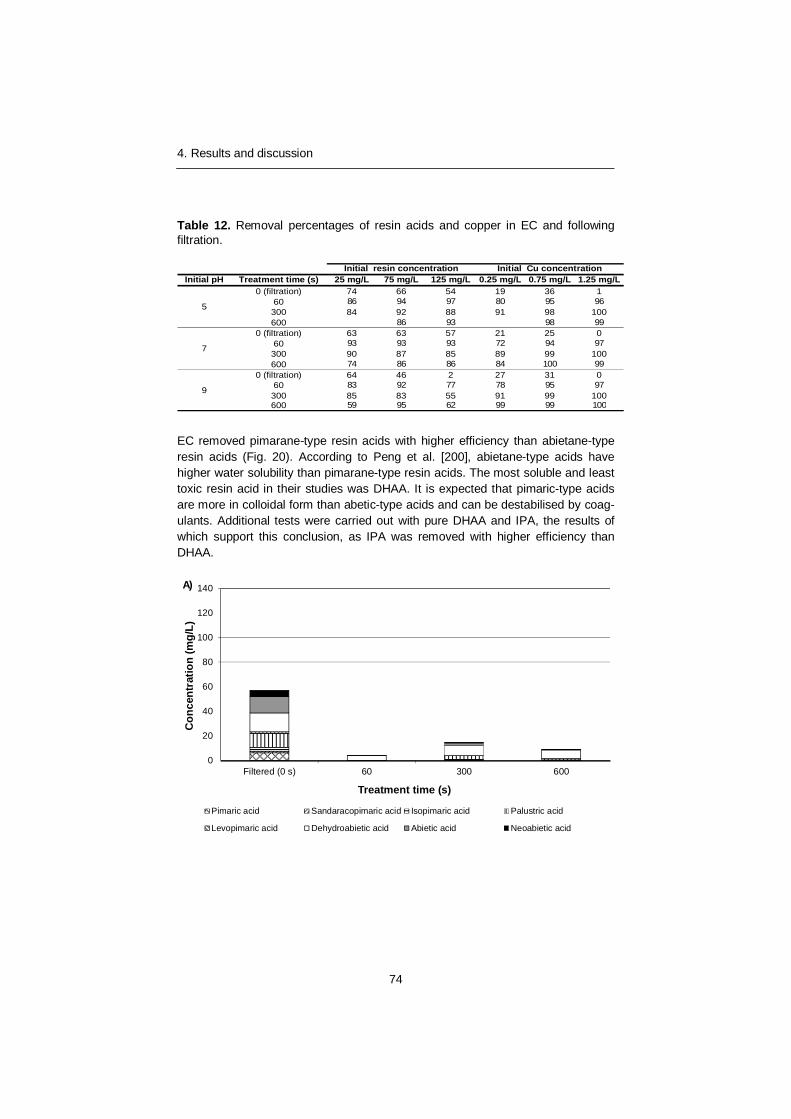
4. Results and discussion
74
Table 12. Removal percentages of resin acids and copper in EC and following filtration.
Initial pH Treatment time (s) 25 mg/L 75 mg/L 125 mg/L 0.25 mg/L 0.75 mg/L 1.25 mg/L0 (filtration) 74 66 54 19 36 1
60 86 94 97 80 95 96300 84 92 88 91 98 100600 86 93 98 99
0 (filtration) 63 63 57 21 25 060 93 93 93 72 94 97
300 90 87 85 89 99 100600 74 86 86 84 100 99
0 (filtration) 64 46 2 27 31 060 83 92 77 78 95 97300 85 83 55 91 99 100600 59 95 62 99 99 100
Initial resin concentration Initial Cu concentration
5
7
9
EC removed pimarane-type resin acids with higher efficiency than abietane-type resin acids (Fig. 20). According to Peng et al. [200], abietane-type acids have higher water solubility than pimarane-type resin acids. The most soluble and least toxic resin acid in their studies was DHAA. It is expected that pimaric-type acids are more in colloidal form than abetic-type acids and can be destabilised by coag-ulants. Additional tests were carried out with pure DHAA and IPA, the results of which support this conclusion, as IPA was removed with higher efficiency than DHAA.
0
20
40
60
80
100
120
140
Filtered (0 s) 60 300 600
Con
cent
ratio
n (m
g/L)
Treatment time (s)
Pimaric acid Sandaracopimaric acid Isopimaric acid Palustric acid
Levopimaric acid Dehydroabietic acid Abietic acid Neoabietic acid
A)
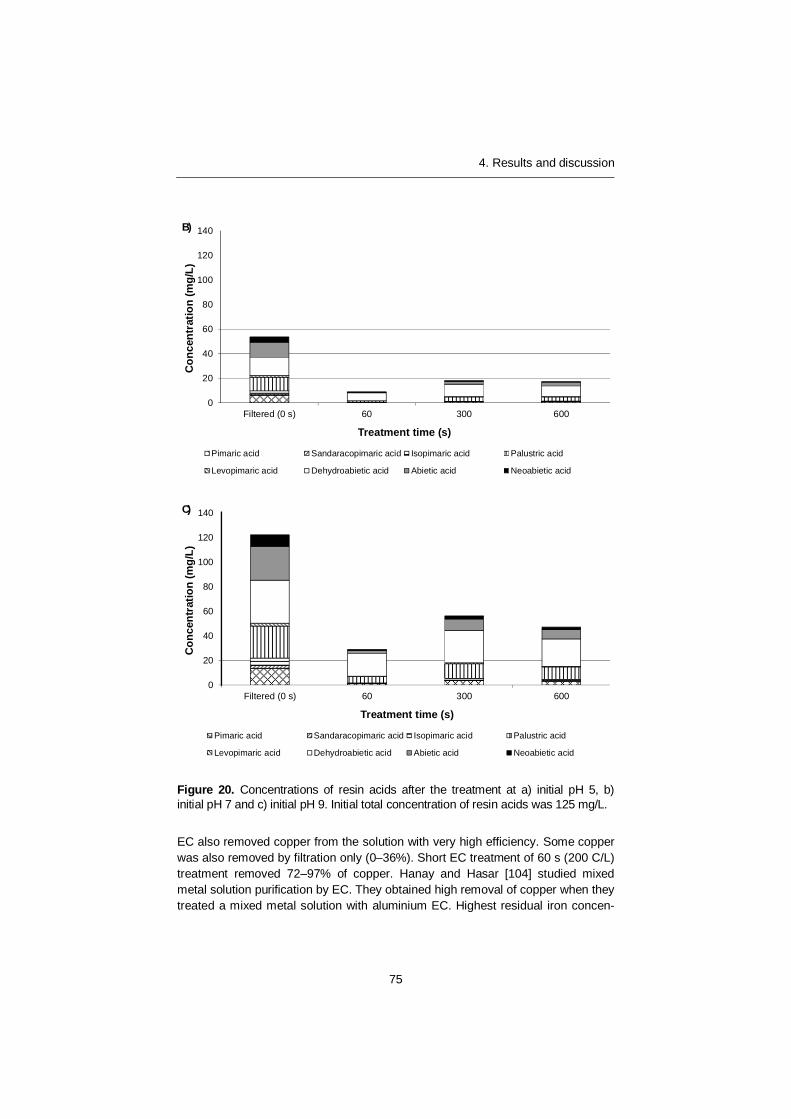
4. Results and discussion
75
Figure 20. Concentrations of resin acids after the treatment at a) initial pH 5, b) initial pH 7 and c) initial pH 9. Initial total concentration of resin acids was 125 mg/L.
EC also removed copper from the solution with very high efficiency. Some copper was also removed by filtration only (0–36%). Short EC treatment of 60 s (200 C/L) treatment removed 72–97% of copper. Hanay and Hasar [104] studied mixed metal solution purification by EC. They obtained high removal of copper when they treated a mixed metal solution with aluminium EC. Highest residual iron concen-
0
20
40
60
80
100
120
140
Filtered (0 s) 60 300 600
Con
cent
ratio
n (m
g/L)
Treatment time (s)
Pimaric acid Sandaracopimaric acid Isopimaric acid Palustric acid
Levopimaric acid Dehydroabietic acid Abietic acid Neoabietic acid
B)
0
20
40
60
80
100
120
140
Filtered (0 s) 60 300 600
Con
cent
ratio
n (m
g/L)
Treatment time (s)
Pimaric acid Sandaracopimaric acid Isopimaric acid Palustric acid
Levopimaric acid Dehydroabietic acid Abietic acid Neoabietic acid
C)
4. Results and discussion
76
trations were measured at low initial pH 5 and short treatment time. As previously mentioned, at low initial pH there were more soluble iron species and also oxida-tion of Fe(II) to Fe(III) was slow when pH was acidic or neutral.
EC had a minor effect on the toxicity of synthetic resin acid solutions. At initial pH 5, the solution strength causing 50% reduction in bioluminescence (EC50) increased by 7–14%, which indicated a small reduction in toxicity. At initial pH of 9, toxicity slightly decreased with the shortest treatment time (60 seconds) but in-creased with longer treatment times. The effect of initial pH on toxicity was not due to protons alone, because the pH was adjusted to 7 prior to assay measurement. However, pH adjustment may have affected the solubility or speciation of resin acids and metals in the solution, and could partially explain the lack of correlation. However, toxicity to algae decreased as the function of copper concentration. Filtered samples which were not treated with EC were highly toxic to algae (EC50 with 3.7% solution). EC removed toxicity completely (EC50 with 95–110% solution) and, according to cell count measurements, electrocoagulated samples stimulated algal growth when compared to control algae tests. Wood rosin had only low tox-icity to algae (EC50 142 mg/L).
The removal of bacterial toxicity from debarking effluents was more effective than removal from synthetic solutions. The initial EC50 value of the filtered debark-ing effluent sample was 7.6%. Toxicities of the filtered reference samples at pH 4, 6 and 8 were also measured, and the EC50 values were 7.7%, 8.4% and 13.8%, respectively. It seems that simple pH adjustment prior to filtration significantly decreased the toxicity of the samples, even when pH was adjusted again to 7 prior to toxicity measurement. Toxicity change was also related to colour removal of the samples. The colour of debarking effluents is mainly caused by tannins, which are known to exhibit toxicity to microbes [196]. The highest colour removal was ob-served at high initial pH, whereas high toxicity removal was observed both at low and high initial pH. This was probably due to the effect of iron on colour values at low initial pH. The model predicts minimum toxicity, EC50, at 43% solution in the tested factors ranges at 1.4 A, 360 seconds and initial pH 8. It is possible that this value is unrealistically high due to the model error, as the lowest measured toxicity (EC50) was 21.9%. However, according to the results, EC enhanced toxicity re-moval. Longer treatment times could increase toxicity removal, but they would raise the operating cost of treatment. It should be noted that prior to the EC treat-ment, resin acids were minor toxic species in the debarking effluents compared to tannins. According to the results of synthetic wastewaters, the toxicity of the efflu-ents after EC treatment could be caused by residual resin acids or toxic com-pounds formed during EC treatment. Khoufi et al. [156] studied olive mill wastewater treatment by iron EC. According to their results, long settling (3–6 days) enhanced toxicity removal. It is possible that this could also further enhance toxicity removal from debarking effluents.
5. Conclusions and recommendations
77
5. Conclusions and recommendations
EC is suitable for the removal of various pollutants from surface water and wastewaters. It can produce high quality fresh water from highly coloured surface water having high concentrations of organic matter. Produced fresh water could be used as potable water or industrial fresh water. Optimum DOC removal and low residual aluminium can be obtained simultaneously with EC, which could be of significant benefit to EC in surface water treatment compared to chemical coagula-tion. In wastewater treatment applications, EC can be used to precipitate malodor-ous sulphides to prevent their release into air. Technology seems to be able to remove some toxic pollutants from wastewater and could be used as pretreatment prior to treatment at a biological wastewater treatment plant. However, organic matter removal from wastewaters with iron electrodes was poor in these studies.
Aluminium seems to be a more suitable electrode material for EC applications because it produces Al(III) species. Metal ions and hydroxides produced by iron electrodes are less effective in the destabilisation of pollutants because iron elec-trodes produce more soluble and less charged Fe(II) species. Iron electrodes could be suitable for some special applications, such as sulphide precipitation where Fe(II) is effective. Possible addition of oxidants could enhance pollutant removal due to oxidation of Fe(II) to Fe(III) form and this should be studied further. It is also possible that Fe(III) production could be enhanced by optimum water chemistry and electrochemical treatment parameters, for example, by increasing water pH and current density.
There are several published articles in the field where the coagulant concentra-tion dissolved from the electrodes has not been measured. According to our stud-ies, produced metal concentration is the main parameter affecting destabilisation of pollutants. Dissolution of aluminium electrodes cannot be calculated according to Faraday’s law as aluminium cathodes dissolve chemically in local high pH envi-ronments at the electrode surface. Current density, treatment time, temperature and electrolysis cell construction affect the dissolution of electrodes and hence also the removal of pollutants. However, it seems that these parameters have low significance besides this effect (in the studied range of parameters). Initial pH and final pH have an effect through the dissolution of electrodes but they also define what aluminium or iron species are formed in the solution and affect the -potential
5. Conclusions and recommendations
78
of all charged species in the solution. According to the results of this study, the destabilisation mechanisms of pollutants by EC and chemical coagulation are similar. Aluminium consumption in EC seems to be in the same order as used in chemical coagulation when our results are compared with values obtained from the literature.
Thorough economical and ecological comparison of chemical coagulation and EC is suggested as these methods seem to be similar to pollutant destabilisation mechanisms, metal consumption and removal efficiency in most applications. This investigation should contain operating and investment costs including coagulation, mixing and separation phases of the treatment. Side reactions of EC, such as flotation due to hydrogen bubble production, should also be considered. These calculations would show what the economically viable applications of EC are. If EC is more expensive than chemical coagulation, it may still have applications in small water treatment systems, for example, emergency water treatment systems or small communities as it could be simpler to operate than chemical coagulation, especially if electroflotation is used for particle separation. In addition to economic and ecological studies, new technological innovations and studies are also re-quired to prevent passivation and fouling of electrodes and to further optimise treatment parameters. It is probable that possible full-scale systems operate in continuous-flow mode and therefore it is suggested that future studies are made in bench-scale continuous-flow systems.
79
References
[1] T. Cosgrove, Colloid science – Principles, methods and applications (Knovel ebook), Blackwell Publishing, UK, 2005.
[2] J.C. Crittenden, R.R. Trussell, D.W. Hand, K.J. Howe, G. Tchobanoglous, Water treatment – Principles and design (2nd ed.) (Knovel ebook), John Wiley & Sons, USA, 2005.
[3] J. Bratby, Coagulation and flocculation in water and wastewater treatment, 2nd ed., IWA Publishing, UK, 2006.
[4] F. Scholtz (Ed.), Electroanalytical Methods, 2nd ed., Springer-Verlag, Germany, 2010, pp. 3–9.
[5] B.V. Derjaguin, L. Landau, Theory of the stability of strongly charged lyophobic sols and of the adhesion of strongly charged particles in solutions of electrolytes, Acta Phys.Chim.URSS. 14 (1941) 633–662.
[6] E.J.W. Verwey, Theory of the stability of lyophobic colloids, J. Phys. Chem. 51 (1947) 631–636.
[7] O. J.Th.G. Overbeek, Recent developments in the understanding of colloid stability, J. Colloid Interface Sci. 58 (1977) 408–422.
[8] J. Lyklema, Quest for ion–ion correlations in electric double layers and over-charging phenomena, Adv. Colloid Interface Sci. 147–148 (2009) 205–213.
[9] J. Lyklema, Overcharging, charge reversal: Chemistry or physics?, Colloids Surf. Physicochem. Eng. Aspects. 291 (2006) 3–12.
[10] J. Duan, J. Gregory, Coagulation by hydrolysing metal salts, Adv. Colloid Interface Sci. 100–102 (2003) 475–502.
[11] M. Yan, D. Wang, J. Ni, J. Qu, C.W.K. Chow, H. Liu, Mechanism of natural organic matter removal by polyaluminum chloride: Effect of coagulant particle size and hydrolysis kinetics, Water Res. 42 (2008) 3361–3370.
[12] A. Matilainen, M. Vepsäläinen, M. Sillanpää, Natural organic matter removal by coagulation during drinking water treatment: A review, Adv. Colloid In-terface Sci. 159 (2010) 189–197.
80
[13] E. Smith, Y. Kamal, Optimizing treatment for reduction of disinfection by-product (DBP) formation, Water Sci. Technol. Water Supply 9 (2009) 191–198.
[14] C.W.K. Chow, R. Fabris, J. Van Leeuwen, D. Wang, M. Drikas, Assessing natural organic matter treatability using high performance size exclusion chromatography, Environ. Sci. Technol. 42 (2008) 6683–6689.
[15] J. Yu, D. Wang, M. Yan, C. Ye, M. Yang, X. Ge, Optimized coagulation of high alkalinity, low temperature and particle water: pH adjustment and polyelectrolytes as coagulant aids, Environ. Monit. Assess. 131 (2007) 377–386.
[16] C.S. Uyguner, M. Bekbolet, H. Selcuk, A comparative approach to the appli-cation of a physico-chemical and advanced oxidation combined system to natural water samples, Sep. Sci. Technol. 42 (2007) 1405–1419.
[17] J.J. Qin, M.H. Oo, K.A. Kekre, F. Knops, P. Miller, Impact of coagulation pH on enhanced removal of natural organic matter in treatment of reservoir water, Sep. Purif. Technol. 49 (2006) 295–298.
[18] Y.C. Soh, F. Roddick, J. van Leeuwen, The impact of alum coagulation on the character, biodegradability and disinfection by-product formation poten-tial of reservoir natural organic matter (NOM) fractions, Water Sci. Tech-nol. 58 (2008) 1173–1179.
[19] C.W.K. Chow, J.A. van Leeuwen, R. Fabris, M. Drikas, Optimised coagulation using aluminium sulfate for the removal of dissolved organic carbon, De-salination 245 (2009) 120–134.
[20] V. Uyak, I. Toroz, Disinfection by-product precursors reduction by various coagulation techniques in Istanbul water supplies, J. Hazard. Mater. 141 (2007) 320–328.
[21] T.P. Flaten, Aluminium as a risk factor in Alzheimer's disease, with emphasis on drinking water, Brain Res. Bull. 55 (2001) 187–196.
[22] S. Matsukawa, S. Itoho, S. Habuthu, T. Aizawa, An approach to residual alu-minium control at Nisiya purification plant, Water Sci. Technol. Water Supply 6 (2006) 67–74.
81
[23] D. Bérubé, C.C. Dorea, Optimizing alum coagulation for turbidity, organics, and residual Al reductions, Water Sci. Technol. Water Supply. 8 (2008) 505–511.
[24] J.Y. Shin, R.F. Spinette, C.R. O'Melia, Stoichiometry of coagulation revisited, Environ. Sci. Technol. 42 (2008) 2582–2589.
[25] L. Rizzo, A. Di Gennaro, M. Gallo, V. Belgiorno, Coagulation/chlorination of surface water: A comparison between chitosan and metal salts, Sep. Pu-rif. Technol. 62 (2008) 79–85.
[26] M. Yan, D. Wang, S. You, J. Qu, H. Tang, Enhanced coagulation in a typical North-China water treatment plant, Water Res. 40 (2006) 3621–3627.
[27] E.L. Sharp, S.A. Parsons, B. Jefferson, The impact of seasonal variations in DOC arising from a moorland peat catchment on coagulation with iron and aluminium salts, Environ. Pollut. 140 (2006) 436–443.
[28] G.C. Budd, A.F. Hess, H. Shorney-Darby, J.J. Neemann, C.M. Spencer, J.D. Bellamy, P.H. Hargette, Coagulation applications for new treatment goals, J. Am. Water Works Assoc. 96 (2004) 102–113.
[29] W. Bellamy, K. Carlson, D. Pier, J. Ducoste, M. Carlson, Determining disinfec-tion needs, J. Am. Water Works Assoc. 92 (2000) 44–52.
[30] M. Yan, H. Liu, D. Wang, J. Ni, J. Qu, Natural organic matter removal by co-agulation: Effect of kinetics and hydraulic power, Water Sci. Technol. Water Supply. 9 (2009) 21–30.
[31] W.P. Cheng, F.H. Chi, C.C. Li, R.F. Yu, A study on the removal of organic substances from low-turbidity and low-alkalinity water with metal-polysilicate coagulants, Colloids Surf. Physicochem. Eng. Aspects. 312 (2008) 238–244.
[32] M. Yan, D. Wang, J. Yu, J. Ni, M. Edwards, J. Qu, Enhanced coagulation with polyaluminum chlorides: Role of pH/Alkalinity and speciation, Chemo-sphere. 71 (2008) 1665–1673.
[33] W. Dongsheng, L. Hong, L. Chunhua, T. Hongxiao, Removal of humic acid by coagulation with nano-Al13, Water Sci. Technol. Water Supply. 6 (2006) 59–67.
82
[34] T.K. Liu, C.J.M. Chin, Improved coagulation performance using preformed polymeric iron chloride (PICl), Colloids Surf. Physicochem. Eng. Aspects. 339 (2009) 192–198.
[35] J.C. Wei, B.Y. Gao, Q.Y. Yue, Y. Wang, L. Lu, Performance and mechanism of polyferric-quaternary ammonium salt composite flocculants in treating high organic matter and high alkalinity surface water, J. Hazard. Mater. 165 (2009) 789–795.
[36] G. Lei, J. Ma, X. Guan, A. Song, Y. Cui, Effect of basicity on coagulation per-formance of polyferric chloride applied in eutrophicated raw water, Desal-ination 247 (2009) 518–529.
[37] A.I. Zouboulis, P.A. Moussas, F. Vasilakou, Polyferric sulphate: Preparation, characterisation and application in coagulation experiments, J. Hazard. Mater. 155 (2008) 459–468.
[38] M. Yan, D. Wang, J. Qu, J. Ni, C.W.K. Chow, Enhanced coagulation for high alkalinity and micro-polluted water: The third way through coagulant op-timization, Water Res. 42 (2008) 2278–2286.
[39] A.I. Zouboulis, P.A. Moussas, Polyferric silicate sulphate (PFSiS): Prepara-tion, characterisation and coagulation behaviour, Desalination 224 (2008) 307–316.
[40] F. Li, A. Yuasa, Y. Ando, Characterization of micro-flocs of NOM coagulated by PACI, alum and polysilicate-iron in terms of molecular weight and floc size, Water Sci. Technol. 57 (2008) 83–90.
[41] A.I. Zouboulis, N.D. Tzoupanos, Polyaluminium silicate chloride-A systematic study for the preparation and application of an efficient coagulant for wa-ter or wastewater treatment, J. Hazard. Mater. 162 (2009) 1379–1389.
[42] Y. Fu, S.L. Yu, Characterization and coagulation performance of solid poly-silicic-ferric (PSF) coagulant, J. Non Cryst. Solids. 353 (2007) 2206–2213.
[43] Y. Fu, S. Yu, C. Han, Morphology and coagulation performance during prepara-tion of poly-silicic-ferric (PSF) coagulant, Chem. Eng. J. 149 (2009) 1–10.
[44] P.A. Moussas, A.I. Zouboulis, A study on the properties and coagulation be-haviour of modified inorganic polymeric coagulant-Polyferric silicate sul-phate (PFSiS), Sep. Purif. Technol. 63 (2008) 475–483.
83
[45] X. Xu, S. Yu, W. Shi, Z. Jiang, C. Wu, Effect of acid medium on the coagula-tion efficiency of polysilicate-ferric (PSF) – A new kind of inorganic poly-mer coagulant, Sep. Purif. Technol. 66 (2009) 486–491.
[46] M. Yan, D. Wang, J. Ni, J. Qu, W. Ni, J. van Leeuwen, Natural organic matter (NOM) removal in a typical North-China water plant by enhanced coagu-lation: Targets and techniques, Sep. Purif. Technol. 68 (2009) 320–327.
[47] M. Yan, D. Wang, B. Shi, M. Wang, Y. Yan, Effect of Pre-ozonation on opti-mized coagulation of a typical North-China source water, Chemosphere. 69 (2007) 1695–1702.
[48] B.Y. Gao, Y. Wang, Q.Y. Yue, J.C. Wei, Q. Li, The size and coagulation be-havior of a novel composite inorganic-organic coagulant, Sep. Purif. Technol. 62 (2008) 544–550.
[49] Y. Wang, B. Gao, Q. Yue, J. Wei, Q. Li, The characterization and flocculation efficiency of composite flocculant iron salts-polydimethyldiallylammonium chloride, Chem. Eng. J. 142 (2008) 175–181.
[50] J. Wei, B. Gao, Q. Yue, Y. Wang, W. Li, X. Zhu, Comparison of coagulation behavior and floc structure characteristic of different polyferric-cationic polymer dual-coagulants in humic acid solution, Water Res. 43 (2009) 724–732.
[51] J.C. Wei, B.Y. Gao, Q.Y. Yue, Y. Wang, Strength and regrowth properties of polyferric-polymer dual-coagulant flocs in surface water treatment, J. Hazard. Mater. 175 (2010) 949–954.
[52] E.L. Sharp, S.A. Parsons, B. Jefferson, Seasonal variations in natural organic matter and its impact on coagulation in water treatment, Sci. Total Environ. 363 (2006) 183–194.
[53] E.L. Sharp, P. Jarvis, S.A. Parsons, B. Jefferson, Impact of fractional character on the coagulation of NOM, Colloids Surf. Physicochem. Eng. Aspects. 286 (2006) 104–111.
[54] J. wietlik, A. Dabrowska, U. Raczyk-Stanis awiak, J. Nawrocki, Reactivity of natural organic matter fractions with chlorine dioxide and ozone, Water Res. 38 (2004) 547–558.
84
[55] R. Fabris, C.W.K. Chow, M. Drikas, B. Eikebrokk, Comparison of NOM char-acter in selected Australian and Norwegian drinking waters, Water Res. 42 (2008) 4188–4196.
[56] Woodard & Curran Inc., Industrial Waste Treatment Handbook (2nd ed.) (Knovel ebook), Elsevier, USA, 2006.
[57] R.J. Stephenson, S.J.B. Duff, Coagulation and precipitation of a mechanical pulping effluent—II. Toxicity removal and metal salt recovery, Water Res. 30 (1996) 793–798.
[58] R. Reiffenstein, W. Hulbert, S. Roth, Toxicology of hydrogen sulfide, Annu. Rev. Pharmacol. Toxicol. 32 (1992) 109–134.
[59] T. Yamanaka, I. Aso, S. Togashi, M. Tanigawa, K. Shoji, T. Watanabe, N. Watanabe, K. Maki, H. Suzuki, Corrosion by bacteria of concrete in sew-erage systems and inhibitory effects of formates on their growth, Water Res. 36 (2002) 2636–2642.
[60] J.L. Davis, D. Nica, K. Shields, D.J. Roberts, Analysis of concrete from cor-roded sewer pipe, Int. Biodeterior. Biodegrad. 42 (1998) 75–84.
[61] A.H. Nielsen, J. Vollertsen, H.S. Jensen, T. Wium-Andersen, T. Hvitved-Jacobsen, Influence of pipe material and surfaces on sulfide related odor and corrosion in sewers, Water Res. 42 (2008) 4206–4214.
[62] W. Sand, E. Bock, Concrete corrosion in the Hamburg Sewer system, Envi-ronmental Technology Letters. 5 (1984) 517–528.
[63] A.H. Nielsen, T. Hvitved-Jacobsen, J. Vollertsen, Effects of pH and Iron Con-centrations on Sulfide Precipitation in Wastewater Collection Systems, Water Environ. Res. 80 (2008) 380–380.
[64] D. Firer, E. Friedler, O. Lahav, Control of sulfide in sewer systems by dosage of iron salts: Comparison between theoretical and experimental results, and practical implications, Sci. Total Environ. 392 (2008) 145–156.
[65] A.H. Nielsen, P. Lens, J. Vollertsen, T. Hvitved-Jacobsen, Sulfide-iron interac-tions in domestic wastewater from a gravity sewer, Water Res. 39 (2005) 2747–2755.
[66] R. Stuetz, F.B. Frechen (Eds.), Odours in Wastewater Treatment: Measure-ment, Modelling and Control, IWA Publishing, UK, 2001.
85
[67] H. Moreno, D. Cocke, J. Gomes, P. Morkovsky, J. Parga, E. Peterson, C. Garcia, Electrochemical reactions for electrocoagulation using iron elec-trodes, Ind. Eng. Chem. Res. 48 (2009) 2275–2282.
[68] E.A. Vik, D.A. Carlson, A.S. Eikum, E.T. Gjessing, Electrocoagulation of potable water, Water Res. 18 (1984) 1355–1360.
[69] B. Morgan, O. Lahav, The effect of pH on the kinetics of spontaneous Fe(II) oxidation by O2 in aqueous solution – basic principles and a simple heu-ristic description, Chemosphere 68 (2007) 2080–2084.
[70] J. Parga, D. Cocke, V. Valverde, J. Gomes, M. Kesmez, H. Moreno, M. Weir, D. Mencer, Characterization of electrocoagulation for removal of chromi-um and arsenic, Chem. Eng. Technol. 28 (2005) 605–612.
[71] J.A.G. Gomes, P. Daida, M. Kesmez, M. Weir, H. Moreno, J.R. Parga, G. Irwin, H. McWhinney, T. Grady, E. Peterson, D.L. Cocke, Arsenic removal by electrocoagulation using combined Al–Fe electrode system and char-acterization of products, J. Hazard. Mater. 139 (2007) 220–231.
[72] M.B. Sasson, W. Calmano, A. Adin, Iron-oxidation processes in an electro-flocculation (electrocoagulation) cell, J. Hazard. Mater. 171 (2009) 704–709.
[73] T. Picard, G. Cathalifaud-Feuillade, M. Mazet, C. Vandensteendam, Cathodic dissolution in the electrocoagulation process using aluminium electrodes, J. Environ. Monit. 2 (2000) 77–80.
[74] P. Refait, J.M.R. Genin, Mechanisms of oxidation of Ni(II)-Fe(II) hydroxides in chloride-containing aqueous media: Role of the pyroaurite-type Ni-Fe hydroxychlorides, Clay Miner. 32 (1997) 597–613.
[75] P. Refait, H. Drissi, Y. Marie, J.M.R. Génin, The substitution of Fe2+ ions by Ni2+ ions in green rust one compounds, Hyperfine Interact. 90 (1994) 389–394.
[76] G. Chen, Electrochemical technologies in wastewater treatment, Sep. Purif. Technol. 38 (2004) 11–41.
[77] M.Y.A. Mollah, P. Morkovsky, J.A.G. Gomes, M. Kesmez, J. Parga, D.L. Cocke, Fundamentals, present and future perspectives of electrocoagu-lation, J. Hazard. Mater. 114 (2004) 199–210.
[78] G. Mouedhen, M. Feki, M.D.P. Wery, H.F. Ayedi, Behavior of aluminum elec-trodes in electrocoagulation process, J. Hazard. Mater. 150 (2008) 124–135.
86
[79] K.A. Matis, E.N. Peleka, Alternative flotation techniques for wastewater treatment: Focus on electroflotation, Sep. Sci. Technol. 45 (2010) 2465–2474.
[80] C. Comninellis, Electrochemistry for the Environment, Springer, USA, 2010.
[81] L. Mansour, S. Chalbi, I. Kesentini, Experimental study of hydrodynamic and bubble size distributions in electroflotation process, Indian J. Chem. Technol. 14 (2007) 253–257.
[82] M.S.K.A. Sarkar, G.M. Evans, S.W. Donne, Bubble size measurement in electroflotation, Minerals Eng. 23 (2010) 1058–1065.
[83] X. Chen, G. Chen, P.L. Yue, Separation of pollutants from restaurant wastewater by electrocoagulation, Sep. Purif. Technol. 19 (2000) 65–76.
[84] M. Kobya, H. Hiz, E. Senturk, C. Aydiner, E. Demirbas, Treatment of potato chips manufacturing wastewater by electrocoagulation, Desalination. 190 (2006) 201–211.
[85] J.L. Trompette, H. Vergnes, On the crucial influence of some supporting elec-trolytes during electrocoagulation in the presence of aluminum elec-trodes, J. Hazard. Mater. 163 (2009) 1282–1288.
[86] D. Hasson, V. Lumelsky, G. Greenberg, Y. Pinhas, R. Semiat, Development of the electrochemical scale removal technique for desalination applica-tions, Desalination 230 (2008) 329–342.
[87] I. Heidmann, W. Calmano, Removal of Zn(II), Cu(II), Ni(II), Ag(I) and Cr(VI) present in aqueous solutions by aluminium electrocoagulation, J. Hazard. Mater. 152 (2008) 934–941.
[88] M.M. Emamjomeh, M. Sivakumar, Fluoride removal by a continuous flow electrocoagulation reactor, J. Environ. Manage. 90 (2009) 1204–1212.
[89] A. Shafaei, M. Rezayee, M. Arami, M. Nikazar, Removal of Mn2+ ions from synthetic wastewater by electrocoagulation process, Desalination 260 (2010) 23–28.
[90] S. Zodi, J. Louvet, C. Michon, O. Potier, M. Pons, F. Lapicque, J. Leclerc, Electrocoagulation as a tertiary treatment for paper mill wastewater: Re-moval of non-biodegradable organic pollution and arsenic, Sep. Purif. Technol. 81 (2011) 62–68.
87
[91] S. Zodi, O. Potier, F. Lapicque, J. Leclerc, Treatment of the textile wastewaters by electrocoagulation: Effect of operating parameters on the sludge settling characteristics, Sep. Purif. Technol. 69 (2009) 29–36.
[92] C.L. Lai, S.H. Lin, Treatment of chemical mechanical polishing wastewater by electrocoagulation: system performances and sludge settling characteris-tics, Chemosphere 54 (2004) 235–242.
[93] M. Kumar, F.I.A. Ponselvan, J.R. Malviya, V.C. Srivastava, I.D. Mall, Treat-ment of bio-digester effluent by electrocoagulation using iron electrodes, J. Hazard. Mater. 165 (2009) 345–352.
[94] H. Shin, J. Lee, Performance evaluation of electrocoagulation and electrode-watering system for reduction of water content in sewage sludge, Korean J. Chem. Eng. 23 (2006) 188–193.
[95] I. Linares-Hernández, C. Barrera-Díaz, G. Roa-Morales, B. Bilyeu, F. Ureña-Núñez, Influence of the anodic material on electrocoagulation perfor-mance, Chem. Eng. J. 148 (2009) 97–105.
[96] A. Bagga, S. Chellam, D.A. Clifford, Evaluation of iron chemical coagulation and electrocoagulation pretreatment for surface water microfiltration, J. Membr. Sci. 309 (2008) 82–93.
[97] R. Katal, H. Pahlavanzadeh, Influence of different combinations of aluminum and iron electrode on electrocoagulation efficiency: Application to the treatment of paper mill wastewater, Desalination 265 (2011) 199–205.
[98] F. Akbal, S. Camc , Copper, chromium and nickel removal from metal plating wastewater by electrocoagulation, Desalination 269 (2011) 214–222.
[99] W. Chou, C. Wang, K. Huang, Effect of operating parameters on indium (III) ion removal by iron electrocoagulation and evaluation of specific energy consumption, J. Hazard. Mater. 167 (2009) 467–474.
[100] P. Cañizares, C. Jiménez, F. Martínez, M.A. Rodrigo, C. Sáez, The pH as a key parameter in the choice between coagulation and electrocoagulation for the treatment of wastewaters, J. Hazard. Mater. 163 (2009) 158–164.
[101] S. Irdemez, N. Demircio lu, Y.S. Yildiz, The effects of pH on phosphate removal from wastewater by electrocoagulation with iron plate elec-trodes, J. Hazard. Mater. 137 (2006) 1231–1235.
88
[102] M.J. Yu, J.S. Koo, G.N. Myung, Y.K. Cho, Y.M. Cho, Evaluation of bipolar electrocoagulation applied to biofiltration for phosphorus removal, Water Sci. Technol. 51 (2005) 231–239.
[103] F. Janpoor, A. Torabian, V. Khatibikamal, Treatment of laundry wastewater by electrocoagulation, J. Chem. Technol. Biotechnol. 86 (2011) 1113–1120.
[104] Ö. Hanay, H. Hasar, Effect of anions on removing Cu2+, Mn2+ and Zn2+ in electrocoagulation process using aluminum electrodes, J. Hazard. Mater. 189 (2011) 572–576.
[105] A. Shafaei, E. Pajootan, M. Nikazar, M. Arami, Removal of Co(II) from aque-ous solution by electrocoagulation process using aluminum electrodes, Desalination 279 (2011) 121–126.
[106] N. Balasubramanian, T. Kojima, C.A. Basha, C. Srinivasakannan, Removal of arsenic from aqueous solution using electrocoagulation, J. Hazard. Mater. 167 (2009) 966–969.
[107] C. Escobar, C. Soto-Salazar, M.I. Toral, Optimization of the electrocoagulation process for the removal of copper, lead and cadmium in natural waters and simulated wastewater, J. Environ. Manage. 81 (2006) 384–391.
[108] B. Al Aji, Y. Yavuz, A.S. Koparal, Electrocoagulation of heavy metals con-taining model wastewater using monopolar iron electrodes, Sep. Purif. Technol. 86 (2012) 248–254.
[109] A.K. Golder, A.N. Samanta, S. Ray, Removal of trivalent chromium by elec-trocoagulation, Sep. Purif. Technol. 53 (2006) 33–41.
[110] C.P. Nanseu-Njiki, S.R. Tchamango, P.C. Ngom, A. Darchen, E. Ngameni, Mercury(II) removal from water by electrocoagulation using aluminium and iron electrodes, J. Hazard. Mater. 168 (2009) 1430–1436.
[111] A. Kolics, J.C. Polkinghorne, A. Wieckowski, Adsorption of sulfate and chlo-ride ions on aluminum, Electrochim. Acta. 43 (1998) 2605–2618.
[112] C.Y. Hu, S.L. Lo, W.H. Kuan, Effects of co-existing anions on fluoride re-moval in electrocoagulation (EC) process using aluminum electrodes, Water Res. 37 (2003) 4513–4523.
[113] S. Vasudevan, J. Lakshmi, J. Jayaraj, G. Sozhan, Remediation of phosphate-contaminated water by electrocoagulation with aluminium, aluminium alloy and mild steel anodes, J. Hazard. Mater. 164 (2009) 1480–1486.
89
[114] A.E. Yilmaz, R. Boncukcuo lu, M.M. Kocakerim, M.T. Yilmaz, C. Paluluo lu, Boron removal from geothermal waters by electrocoagulation, J. Hazard. Mater. 153 (2008) 146–151.
[115] M.G. Kiliç, Ç. Hosten, S. Demirci, A parametric comparative study of electro-coagulation and coagulation using ultrafine quartz suspensions, J. Haz-ard. Mater. 171 (2009) 247–252.
[116] A. Golder, A. Chanda, A. Samanta, S. Ray, Removal of Cr(VI) from aqueous solution: Electrocoagulation vs chemical coagulation, Sep. Sci. Technol. 42 (2007) 2177–2193.
[117] B. Zhu, D.A. Clifford, S. Chellam, Comparison of electrocoagulation and chemical coagulation pretreatment for enhanced virus removal using mi-crofiltration membranes, Water Res. 39 (2005) 3098–3108.
[118] T.L. Theis, P.C. Singer, Complexation of iron(II) by organic matter and its effect on iron(II) oxygenation, Environ. Sci. Technol. 8 (1974) 569–573.
[119] A.K. Golder, A.N. Samanta, S. Ray, Removal of Cr3+ by electrocoagulation with multiple electrodes: Bipolar and monopolar configurations, J. Haz-ard. Mater. 141 (2007) 653–661.
[120] D. Ghosh, C.R. Medhi, M.K. Purkait, Treatment of fluoride containing drink-ing water by electrocoagulation using monopolar and bipolar electrode connections, Chemosphere 73 (2008) 1393–1400.
[121] C. Wang, W. Chou, Y. Kuo, Removal of COD from laundry wastewater by electrocoagulation/electroflotation, J. Hazard. Mater. 164 (2009) 81–86.
[122] M. Asselin, P. Drogui, S.K. Brar, H. Benmoussa, J. Blais, Organics removal in oily bilgewater by electrocoagulation process, J. Hazard. Mater. 151 (2008) 446–455.
[123] M. Asselin, P. Drogui, H. Benmoussa, J. Blais, Effectiveness of electrocoag-ulation process in removing organic compounds from slaughterhouse wastewater using monopolar and bipolar electrolytic cells, Chemosphere 72 (2008) 1727–1733.
[124] M. Bayramoglu, M. Eyvaz, M. Kobya, Treatment of the textile wastewater by electrocoagulation, Chem. Eng. J. 128 (2007) 155–161.
90
[125] S. Vasudevan, B.S. Kannan, J. Lakshmi, S. Mohanraj, G. Sozhan, Effects of alternating and direct current in electrocoagulation process on the removal of fluoride from water, J. Chem. Technol. Biotechnol. 86 (2011) 428–436.
[126] M. Eyvaz, M. Kirlaroglu, T.S. Aktas, E. Yuksel, The effects of alternating current electrocoagulation on dye removal from aqueous solutions, Chem. Eng. J. 153 (2009) 16–22.
[127] L.K. Wang, Y. Hung, N.K. Shammas (Eds.), Advanced Physicochemical Treatment Technologies, Humana Press, USA, 2007, pp. 57–106.
[128] M.M. Emamjomeh, M. Sivakumar, Review of pollutants removed by electro-coagulation and electrocoagulation/flotation processes, J. Environ. Man-age. 90 (2009) 1663–1679.
[129] J.R. Parga, D.L. Cocke, J.L. Valenzuela, J.A. Gomes, M. Kesmez, G. Irwin, H. Moreno, M. Weir, Arsenic removal via electrocoagulation from heavy metal contaminated groundwater in La Comarca Lagunera México, J. Hazard. Mater. 124 (2005) 247–254.
[130] N. Balasubramanian, T. Kojima, C. Srinivasakannan, Arsenic removal through electrocoagulation: Kinetic and statistical modeling, Chem. Eng. J. 155 (2009) 76–82.
[131] H.K. Hansen, P. Nuñez, D. Raboy, I. Schippacasse, R. Grandon, Electro-coagulation in wastewater containing arsenic: Comparing different pro-cess designs, Electrochim. Acta 52 (2007) 3464–3470.
[132] M.S. Bhatti, A.S. Reddy, A.K. Thukral, Electrocoagulation removal of Cr(VI) from simulated wastewater using response surface methodology, J. Hazard. Mater. 172 (2009) 839–846.
[133] T. Ölmez, The optimization of Cr(VI) reduction and removal by electrocoagu-lation using response surface methodology, J. Hazard. Mater. 162 (2009) 1371–1378.
[134] N. Meunier, P. Drogui, C. Montané, R. Hausler, G. Mercier, J. Blais, Com-parison between electrocoagulation and chemical precipitation for metals removal from acidic soil leachate, J. Hazard. Mater. 137 (2006) 581–590.
[135] N. Meunier, P. Drogui, G. Mercier, J. Blais, Treatment of metal-loaded soil leachates by electrocoagulation, Sep. Purif. Technol. 67 (2009) 110–116.
91
[136] I. Heidmann, W. Calmano, Removal of Ni, Cu and Cr from a galvanic wastewater in an electrocoagulation system with Fe- and Al-electrodes, Sep. Purif. Technol. 71 (2010) 308–314.
[137] D. Ghosh, H. Solanki, M.K. Purkait, Removal of Fe(II) from tap water by electrocoagulation technique, J. Hazard. Mater. 155 (2008) 135–143.
[138] I. Kabda li, T. Arslan, T. Olmez-Hanci, I. Arslan-Alaton, O. Tünay, Complex-ing agent and heavy metal removals from metal plating effluent by elec-trocoagulation with stainless steel electrodes, J. Hazard. Mater. 165 (2009) 838–845.
[139] Z. Zaroual, M. Azzi, N. Saib, E. Chainet, Contribution to the study of electro-coagulation mechanism in basic textile effluent, J. Hazard. Mater. 131 (2006) 73–78.
[140] A. Aleboyeh, N. Daneshvar, M.B. Kasiri, Optimization of C.I. Acid Red 14 azo dye removal by electrocoagulation batch process with response sur-face methodology, Chem. Eng. Process. 47 (2008) 827–832.
[141] I. Kabda li, B. Vardar, I. Arslan-Alaton, O. Tünay, Effect of dye auxiliaries on color and COD removal from simulated reactive dyebath effluent by elec-trocoagulation, Chem. Eng. J. 148 (2009) 89–96.
[142] C. Phalakornkule, P. Sukkasem, C. Mutchimsattha, Hydrogen recovery from the electrocoagulation treatment of dye-containing wastewater, Int. J. Hydrogen Energy 35 (2010) 10934–10943.
[143] K. Yetilmezsoy, F. Ilhan, Z. Sapci-Zengin, S. Sakar, M.T. Gonullu, Decolori-zation and COD reduction of UASB pretreated poultry manure wastewater by electrocoagulation process: A post-treatment study, J. Hazard. Mater. 162 (2009) 120–132.
[144] M. Kobya, E. Senturk, M. Bayramoglu, Treatment of poultry slaughterhouse wastewaters by electrocoagulation, J. Hazard. Mater. 133 (2006) 172–176.
[145] I.A. Dengil, S. Kulaç, M. Özacar, Treatment of tannery liming drum wastewater by electrocoagulation, J. Hazard. Mater. 167 (2009) 940–946.
[146] A. Benhadji, M. Ahmed, R. Maachi, Electrocoagulation and effect of cathode materials on the removal of pollutants from tannery wastewater of Roui-ba, Desalination 277 (2011) 128–134.
92
[147] S. Kongjao, S. Damronglerd, M. Hunsom, Simultaneous removal of organic and inorganic pollutants in tannery wastewater using electrocoagulation technique, Korean J. Chem. Eng. 25 (2008) 703–709.
[148] J. Feng, Y. Sun, Z. Zheng, J. Zhang, S. Li, Y. Tian, Treatment of tannery wastewater by electrocoagulation, J. Environ. Sci. 19 (2007) 1409–1415.
[149] F.R. Espinoza-Quiñones, M.M.T. Fornari, A.N. Módenes, S.M. Palácio, F.G. da Silva, N. Szymanski, A.D. Kroumov, D.E.G. Trigueros, Pollutant re-moval from tannery effluent by electrocoagulation, Chem. Eng. J. 151 (2009) 59–65.
[150] M. Zaied, N. Bellakhal, Electrocoagulation treatment of black liquor from paper industry, J. Hazard. Mater. 163 (2009) 995–1000.
[151] R. Sridhar, V. Sivakumar, V. Prince Immanuel, J. Prakash Maran, Treatment of pulp and paper industry bleaching effluent by electrocoagulant process, J. Hazard. Mater. 186 (2011) 1495–1502.
[152] M. U urlu, A. Gürses, C. Do ar, M. Yalçin, The removal of lignin and phenol from paper mill effluents by electrocoagulation, J. Environ. Manage. 87 (2008) 420–428.
[153] Y. Perng, E. Wang, S. Yu, A. Chang, Application of a pilot-scale pulsed electrocoagulation system to OCC-based paper mill effluent, Tappi J. 8 (2009) 14–20.
[154] S. Mahesh, B. Prasad, I. Mall, I. Mishra, Electrochemical degradation of pulp and paper mill wastewater. Part 1. COD and color removal, Ind. Eng. Chem. Res. 45 (2006) 2830–2839.
[155] F. Hanafi, O. Assobhei, M. Mountadar, Detoxification and discoloration of Moroccan olive mill wastewater by electrocoagulation, J. Hazard. Mater. 174 (2010) 807–812.
[156] S. Khoufi, F. Feki, S. Sayadi, Detoxification of olive mill wastewater by elec-trocoagulation and sedimentation processes, J. Hazard. Mater. 142 (2007) 58–67.
[157] Ü. Tezcan Ün, S. U ur, A.S. Koparal, Ü. Bak r Ö ütveren, Electrocoagula-tion of olive mill wastewaters, Sep. Purif. Technol. 52 (2006) 136–141.
93
[158] M. Tir, N. Moulai-Mostefa, Optimization of oil removal from oily wastewater by electrocoagulation using response surface method, J. Hazard. Mater. 158 (2008) 107–115.
[159] M.H. El-Naas, S. Al-Zuhair, A. Al-Lobaney, S. Makhlouf, Assessment of electrocoagulation for the treatment of petroleum refinery wastewater, J. Environ. Manage. 91 (2009) 180–185.
[160] A.S. Koparal, Y. . Yildiz, B. Keskinler, N. Demircio lu, Effect of initial pH on the removal of humic substances from wastewater by electrocoagulation, Sep. Purif. Technol. 59 (2008) 175–182.
[161] Y. . Y ld z, A.S. Koparal, B. Keskinler, Effect of initial pH and supporting electrolyte on the treatment of water containing high concentration of humic substances by electrocoagulation, Chem. Eng. J. 138 (2008) 63–72.
[162] Y. . Yildiz, A.S. Koparal, . rdemez, B. Keskinler, Electrocoagulation of synthetically prepared waters containing high concentration of NOM us-ing iron cast electrodes, J. Hazard. Mater. 139 (2007) 373–380.
[163] Q. Feng, X. Li, Y. Cheng, L. Meng, Q. Meng, Removal of humic acid from groundwater by electrocoagulation, J. China Univ. Mining Technol. 17 (2007) 513,520–515,520.
[164] M.H. El-Masry, O.M. Sadek, W.K. Mekhemer, Purification of raw surface water using electro-coagulation method, Water Air Soil Pollut. 158 (2004) 373–385.
[165] C. Ricordel, A. Darchen, D. Hadjiev, Electrocoagulation–electroflotation as a surface water treatment for industrial uses, Sep. Purif. Technol. 74 (2010) 342–347.
[166] J. Zhu, H. Zhao, J. Ni, Fluoride distribution in electrocoagulation defluorida-tion process, Sep. Purif. Technol. 56 (2007) 184–191.
[167] D. Ghernaout, A. Badis, A. Kellil, B. Ghernaout, Application of electrocoagu-lation in Escherichia coli culture and two surface waters, Desalination 219 (2008) 118–125.
[168] N. Uduman, V. Bourniquel, M.K. Danquah, A.F.A. Hoadley, A parametric study of electrocoagulation as a recovery process of marine microalgae for biodiesel production, Chem. Eng. J. 174 (2011) 249–257.
94
[169] E. Lacasa, P. Cañizares, C. Sáez, F.J. Fernández, M.A. Rodrigo, Removal of nitrates from groundwater by electrocoagulation, Chem. Eng. J. 171 (2011) 1012–1017.
[170] M.M. Emamjomeh, M. Sivakumar, Denitrification using a monopolar electro-coagulation/flotation (ECF) process, J. Environ. Manage. 91 (2009) 516–522.
[171] . rdemez, N. Demircio lu, Y. . Y ld z, Z. Bingül, The effects of current density and phosphate concentration on phosphate removal from wastewater by electrocoagulation using aluminum and iron plate elec-trodes, Sep. Purif. Technol. 52 (2006) 218–223.
[172] . rdemez, Y. . Yildiz, V. Tosuno lu, Optimization of phosphate removal from wastewater by electrocoagulation with aluminum plate electrodes, Sep. Purif. Technol. 52 (2006) 394–401.
[173] O.T. Can, M. Kobya, E. Demirbas, M. Bayramoglu, Treatment of the textile wastewater by combined electrocoagulation, Chemosphere 62 (2006) 181–187.
[174] I. Kabda li, T. Arslan, I. Arslan-Alaton, T. Olmez-Hanci, O. Tünay, Organic matter and heavy metal removals from complexed metal plating effluent by the combined electrocoagulation/Fenton process, Water Sci. Technol. 61 (2010) 2617–2624.
[175] C. Barrera-Diaz, B. Bilyeu, G. Roa-Morales, P. Balderas-Hernandez, A com-parison of iron and aluminium electrodes in hydrogen peroxide-assisted electrocoagulation of organic pollutants, Environ. Eng. Sci. 25 (2008) 529–537.
[176] G. Roa-Morales, E. Campos-Medina, J. Aguilera-Cotero, B. Bilyeu, C. Barre-ra-Díaz, Aluminum electrocoagulation with peroxide applied to wastewater from pasta and cookie processing, Sep. Purif. Technol. 54 (2007) 124–129.
[177] M. Hernández-Ortega, T. Ponziak, C. Barrera-Díaz, M.A. Rodrigo, G. Roa-Morales, B. Bilyeu, Use of a combined electrocoagulation–ozone process as a pre-treatment for industrial wastewater, Desalination. 250 (2010) 144–149.
[178] M. Boroski, A.C. Rodrigues, J.C. Garcia, A.P. Gerola, J. Nozaki, N. Hioka, The effect of operational parameters on electrocoagulation-flotation process fol-
95
lowed by photocatalysis applied to the decontamination of water effluents from cellulose and paper factories, J. Hazard. Mater. 160 (2008) 135–141.
[179] M. Boroski, A.C. Rodrigues, J.C. Garcia, L.C. Sampaio, J. Nozaki, N. Hioka, Combined electrocoagulation and TiO2 photoassisted treatment applied to wastewater effluents from pharmaceutical and cosmetic industries, J. Hazard. Mater. 162 (2009) 448–454.
[180] S. Vilhunen, M. Vilve, M. Vepsäläinen, M. Sillanpää, Removal of organic matter from a variety of water matrices by UV photolysis and UV/H2O2 method, J. Hazard. Mater. 179 (2010) 776–782.
[181] M. Kobya, C. Ciftci, M. Bayramoglu, M.T. Sensoy, Study on the treatment of waste metal cutting fluids using electrocoagulation, Sep. Purif. Technol. 60 (2007) 285–291.
[182] J. Emsley, Nature's building blocks: an A–Z guide to the elements, Oxford University Press, UK, 2003.
[183] J.A. Field, S. Kortekaas, G. Lettinga, The tannin theory of methanogenic toxicity, Biological Wastes. 29 (1989) 241–262.
[184] J.A. Field, M.J.H. Leyendekers, R. Sierra Alvarez, G. Lettinga, L.H.A. Habets, Methanogenic toxicity of bark tannins and the anaerobic biodeg-radability of water soluble bark matter, Water Sci. Technol. 20 (1988) 219–240.
[185] M.K. Korczak, S. Koziarski, B. Komorowska, Anaerobic treatment of pulp mill effluents, Water Sci. Technol. 24 (1991) 203–206.
[186] J.H.M. Temmink, J.A. Field, J.C. Van Haastrecht, R.C.M. Merkelbach, Acute and sub-acute toxicity of bark tannins in carp (Cyprinus carpio L.), Water Res. 23 (1989) 341–344.
[187] L.T.K. Chung, H.P. Meier, J.M. Leach, Can pulp mill effluent toxicity be esti-mated from chemical analyses?, Tappi 62 (1979) 71–75.
[188] J.M. Leach, A.N. Thakore, Toxic constituents in mechanical pulping efflu-ents, Tappi 59 (1976) 129–132.
[189] A. Oikari, B.E. Lonn, M. Castren, Toxicological effects of dehydroabietic acid (DHAA) on the trout, Salmo gairdneri Richardson, in fresh water, Water Res. 17 (1983) 81–89.
96
[190] M.R. Soimasuo, A.E. Karels, H. Leppänen, R. Santti, A.O.J. Oikari, Bi-omarker responses in whitefish (Coregonus lavaretus L. s.l.) experimen-tally exposed in a large lake receiving effluents from pulp and paper in-dustry, Arch. Environ. Contam. Toxicol. 34 (1998) 69–80.
[191] J. Lappalainen, R. Juvonen, K. Vaajasaari, M. Karp, A new flash method for measuring the toxicity of solid and colored samples, Chemosphere 38 (1999) 1069–1083.
[192] R.G. Brereton, Applied Chemometrics for Scientists, John Wiley & Sons Ltd, UK, 2007.
[193] R. Pina, C. Cervantes, Microbial interactions with aluminium, Biometals 9 (1996) 311–316.
[194] M.Y.A. Mollah, R. Schennach, J.R. Parga, D.L. Cocke, Electrocoagulation (EC) – science and applications, J. Hazard. Mater. 84 (2001) 29–41.
[195] B. Shi, Q. Wei, D. Wang, Z. Zhu, H. Tang, Coagulation of humic acid: The performance of preformed and non-preformed Al species, Colloids Surf. Physicochem. Eng. Aspects 296 (2007) 141–148.
[196] M. Ali, T.R. Sreekrishnan, Aquatic toxicity from pulp and paper mill effluents: A review, Adv. Environ. Res. 5 (2001) 175–196.
[197] S. Khoufi, F. Aloui, S. Sayadi, Extraction of antioxidants from olive mill wastewater and electro-coagulation of exhausted fraction to reduce its toxicity on anaerobic digestion, J. Hazard. Mater. 151 (2008) 531–539.
[198] S. Chowwanapoonpohn, S. Chewchanwuttiwong, M.J. Garson, D. Buddhas-ukh, Electrocoagulation and recovery of tannins from tree barks, J. Appl. Electrochem. 33 (2003) 647–650.
[199] M. Murugananthan, G. Bhaskar Raju, S. Prabhakar, Removal of sulfide, sulfate and sulfite ions by electro coagulation, J. Hazard. Mater. 109 (2004) 37–44.
[200] G. Peng, J.C. Roberts, Solubility and toxicity of resin acids, Water Res. 34 (2000) 2779–2785.
PUBLICATION I
Combined electrocoagulation and chemical coagulation
of paper mill mechanically cleaned water
In: J. Pulp Pap. Sci. 2007, 33, pp. 233–239.Copyright 2007 PAPTAC and JPPS.
Reprinted with permission from the publisher.

I/1
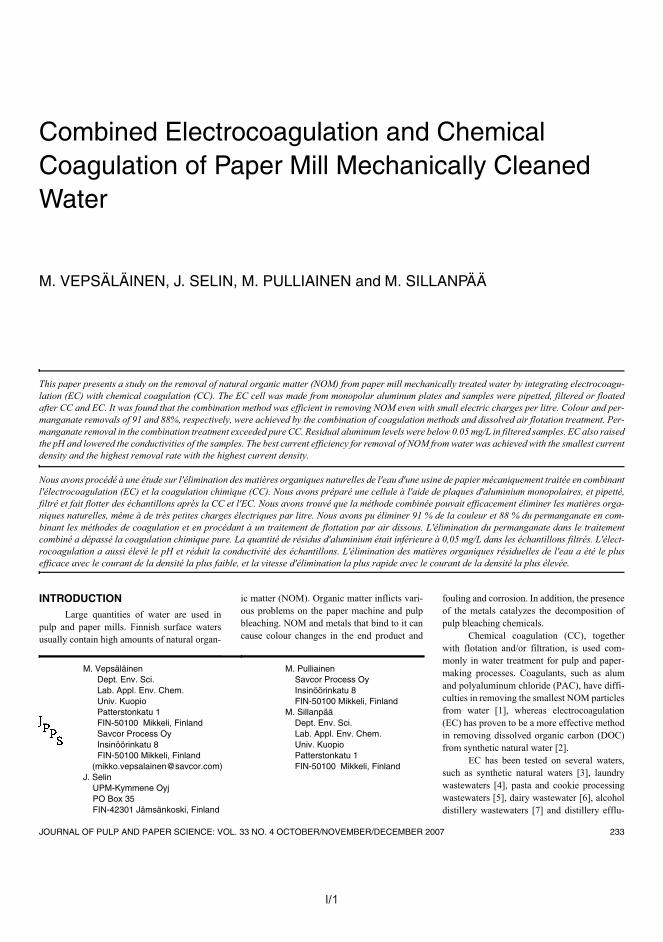
I/1
JOURNAL OF PULP AND PAPER SCIENCE: VOL. 33 NO. 4 OCTOBER/NOVEMBER/DECEMBER 2007 233
Combined Electrocoagulation and Chemical Coagulation of Paper Mill Mechanically Cleaned Water
M. VEPSÄLÄINEN, J. SELIN, M. PULLIAINEN and M. SILLANPÄÄ
This paper presents a study on the removal of natural organic matter (NOM) from paper mill mechanically treated water by integrating electrocoagu-lation (EC) with chemical coagulation (CC). The EC cell was made from monopolar aluminum plates and samples were pipetted, filtered or floatedafter CC and EC. It was found that the combination method was efficient in removing NOM even with small electric charges per litre. Colour and per-manganate removals of 91 and 88%, respectively, were achieved by the combination of coagulation methods and dissolved air flotation treatment. Per-manganate removal in the combination treatment exceeded pure CC. Residual aluminum levels were below 0.05 mg/L in filtered samples. EC also raisedthe pH and lowered the conductivities of the samples. The best current efficiency for removal of NOM from water was achieved with the smallest currentdensity and the highest removal rate with the highest current density.
Nous avons procédé à une étude sur l'élimination des matières organiques naturelles de l'eau d'une usine de papier mécaniquement traitée en combinantl'électrocoagulation (EC) et la coagulation chimique (CC). Nous avons préparé une cellule à l'aide de plaques d'aluminium monopolaires, et pipetté,filtré et fait flotter des échantillons après la CC et l'EC. Nous avons trouvé que la méthode combinée pouvait efficacement éliminer les matières orga-niques naturelles, même à de très petites charges électriques par litre. Nous avons pu éliminer 91 % de la couleur et 88 % du permanganate en com-binant les méthodes de coagulation et en procédant à un traitement de flottation par air dissous. L'élimination du permanganate dans le traitementcombiné a dépassé la coagulation chimique pure. La quantité de résidus d'aluminium était inférieure à 0,05 mg/L dans les échantillons filtrés. L'élect-rocoagulation a aussi élevé le pH et réduit la conductivité des échantillons. L'élimination des matières organiques résiduelles de l'eau a été le plusefficace avec le courant de la densité la plus faible, et la vitesse d'élimination la plus rapide avec le courant de la densité la plus élevée.
INTRODUCTIONLarge quantities of water are used in
pulp and paper mills. Finnish surface watersusually contain high amounts of natural organ-
ic matter (NOM). Organic matter inflicts vari-ous problems on the paper machine and pulpbleaching. NOM and metals that bind to it cancause colour changes in the end product and
fouling and corrosion. In addition, the presenceof the metals catalyzes the decomposition ofpulp bleaching chemicals.
Chemical coagulation (CC), togetherwith flotation and/or filtration, is used com-monly in water treatment for pulp and paper-making processes. Coagulants, such as alumand polyaluminum chloride (PAC), have diffi-culties in removing the smallest NOM particlesfrom water [1], whereas electrocoagulation(EC) has proven to be a more effective methodin removing dissolved organic carbon (DOC)from synthetic natural water [2].
EC has been tested on several waters,such as synthetic natural waters [3], laundrywastewaters [4], pasta and cookie processingwastewaters [5], dairy wastewater [6], alcoholdistillery wastewaters [7] and distillery efflu-
M. Vepsäläinen Dept. Env. Sci. Lab. Appl. Env. Chem. Univ. Kuopio Patterstonkatu 1 FIN-50100 Mikkeli, Finland Savcor Process Oy Insinöörinkatu 8
FIN-50100 Mikkeli, Finland ([email protected])
J. Selin UPM-Kymmene Oyj PO Box 35 FIN-42301 Jämsänkoski, Finland
M. Pulliainen Savcor Process Oy Insinöörinkatu 8 FIN-50100 Mikkeli, FinlandM. Sillanpää Dept. Env. Sci. Lab. Appl. Env. Chem. Univ. Kuopio Patterstonkatu 1 FIN-50100 Mikkeli, Finland
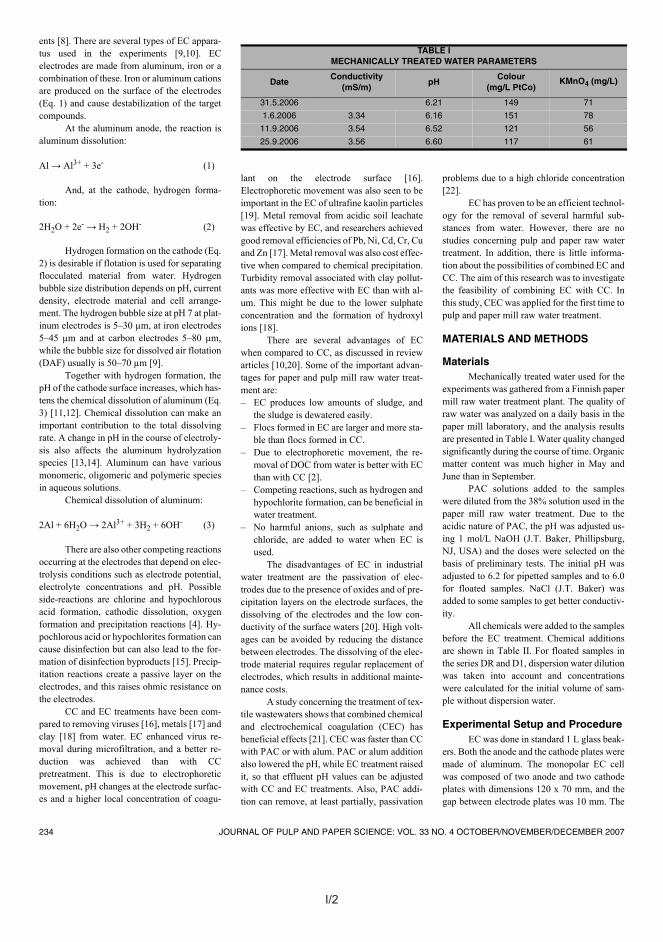
I/2 I/3
234 JOURNAL OF PULP AND PAPER SCIENCE: VOL. 33 NO. 4 OCTOBER/NOVEMBER/DECEMBER 2007
ents [8]. There are several types of EC appara-tus used in the experiments [9,10]. ECelectrodes are made from aluminum, iron or acombination of these. Iron or aluminum cationsare produced on the surface of the electrodes(Eq. 1) and cause destabilization of the targetcompounds.
At the aluminum anode, the reaction isaluminum dissolution:
Al → Al3+ + 3e- (1)
And, at the cathode, hydrogen forma-tion:
2H2O + 2e- → H2 + 2OH- (2)
Hydrogen formation on the cathode (Eq.2) is desirable if flotation is used for separatingflocculated material from water. Hydrogenbubble size distribution depends on pH, currentdensity, electrode material and cell arrange-ment. The hydrogen bubble size at pH 7 at plat-inum electrodes is 5–30 µm, at iron electrodes5–45 µm and at carbon electrodes 5–80 µm,while the bubble size for dissolved air flotation(DAF) usually is 50–70 µm [9].
Together with hydrogen formation, thepH of the cathode surface increases, which has-tens the chemical dissolution of aluminum (Eq.3) [11,12]. Chemical dissolution can make animportant contribution to the total dissolvingrate. A change in pH in the course of electroly-sis also affects the aluminum hydrolyzationspecies [13,14]. Aluminum can have variousmonomeric, oligomeric and polymeric speciesin aqueous solutions.
Chemical dissolution of aluminum:
2Al + 6H2O → 2Al3+ + 3H2 + 6OH- (3)
There are also other competing reactionsoccurring at the electrodes that depend on elec-trolysis conditions such as electrode potential,electrolyte concentrations and pH. Possibleside-reactions are chlorine and hypochlorousacid formation, cathodic dissolution, oxygenformation and precipitation reactions [4]. Hy-pochlorous acid or hypochlorites formation cancause disinfection but can also lead to the for-mation of disinfection byproducts [15]. Precip-itation reactions create a passive layer on theelectrodes, and this raises ohmic resistance onthe electrodes.
CC and EC treatments have been com-pared to removing viruses [16], metals [17] andclay [18] from water. EC enhanced virus re-moval during microfiltration, and a better re-duction was achieved than with CCpretreatment. This is due to electrophoreticmovement, pH changes at the electrode surfac-es and a higher local concentration of coagu-
lant on the electrode surface [16].Electrophoretic movement was also seen to beimportant in the EC of ultrafine kaolin particles[19]. Metal removal from acidic soil leachatewas effective by EC, and researchers achievedgood removal efficiencies of Pb, Ni, Cd, Cr, Cuand Zn [17]. Metal removal was also cost effec-tive when compared to chemical precipitation.Turbidity removal associated with clay pollut-ants was more effective with EC than with al-um. This might be due to the lower sulphateconcentration and the formation of hydroxylions [18].
There are several advantages of ECwhen compared to CC, as discussed in reviewarticles [10,20]. Some of the important advan-tages for paper and pulp mill raw water treat-ment are:– EC produces low amounts of sludge, and
the sludge is dewatered easily.– Flocs formed in EC are larger and more sta-
ble than flocs formed in CC.– Due to electrophoretic movement, the re-
moval of DOC from water is better with ECthan with CC [2].
– Competing reactions, such as hydrogen andhypochlorite formation, can be beneficial inwater treatment.
– No harmful anions, such as sulphate andchloride, are added to water when EC isused.
The disadvantages of EC in industrialwater treatment are the passivation of elec-trodes due to the presence of oxides and of pre-cipitation layers on the electrode surfaces, thedissolving of the electrodes and the low con-ductivity of the surface waters [20]. High volt-ages can be avoided by reducing the distancebetween electrodes. The dissolving of the elec-trode material requires regular replacement ofelectrodes, which results in additional mainte-nance costs.
A study concerning the treatment of tex-tile wastewaters shows that combined chemicaland electrochemical coagulation (CEC) hasbeneficial effects [21]. CEC was faster than CCwith PAC or with alum. PAC or alum additionalso lowered the pH, while EC treatment raisedit, so that effluent pH values can be adjustedwith CC and EC treatments. Also, PAC addi-tion can remove, at least partially, passivation
problems due to a high chloride concentration[22].
EC has proven to be an efficient technol-ogy for the removal of several harmful sub-stances from water. However, there are nostudies concerning pulp and paper raw watertreatment. In addition, there is little informa-tion about the possibilities of combined EC andCC. The aim of this research was to investigatethe feasibility of combining EC with CC. Inthis study, CEC was applied for the first time topulp and paper mill raw water treatment.
MATERIALS AND METHODS
MaterialsMechanically treated water used for the
experiments was gathered from a Finnish papermill raw water treatment plant. The quality ofraw water was analyzed on a daily basis in thepaper mill laboratory, and the analysis resultsare presented in Table I. Water quality changedsignificantly during the course of time. Organicmatter content was much higher in May andJune than in September.
PAC solutions added to the sampleswere diluted from the 38% solution used in thepaper mill raw water treatment. Due to theacidic nature of PAC, the pH was adjusted us-ing 1 mol/L NaOH (J.T. Baker, Phillipsburg,NJ, USA) and the doses were selected on thebasis of preliminary tests. The initial pH wasadjusted to 6.2 for pipetted samples and to 6.0for floated samples. NaCl (J.T. Baker) wasadded to some samples to get better conductiv-ity.
All chemicals were added to the samplesbefore the EC treatment. Chemical additionsare shown in Table II. For floated samples inthe series DR and D1, dispersion water dilutionwas taken into account and concentrationswere calculated for the initial volume of sam-ple without dispersion water.
Experimental Setup and ProcedureEC was done in standard 1 L glass beak-
ers. Both the anode and the cathode plates weremade of aluminum. The monopolar EC cellwas composed of two anode and two cathodeplates with dimensions 120 x 70 mm, and thegap between electrode plates was 10 mm. The
TABLE I MECHANICALLY TREATED WATER PARAMETERS
DateConductivity
(mS/m)pH
Colour (mg/L PtCo)
KMnO4 (mg/L)
31.5.2006 6.21 149 71
1.6.2006 3.34 6.16 151 78
11.9.2006 3.54 6.52 121 56
25.9.2006 3.56 6.60 117 61
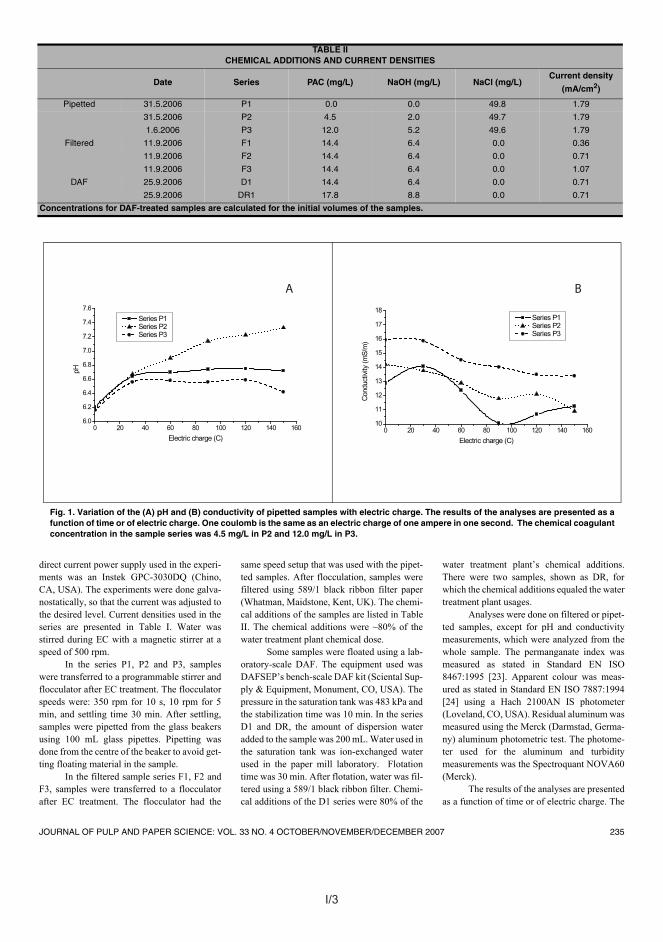
I/3
JOURNAL OF PULP AND PAPER SCIENCE: VOL. 33 NO. 4 OCTOBER/NOVEMBER/DECEMBER 2007 235
direct current power supply used in the experi-ments was an Instek GPC-3030DQ (Chino,CA, USA). The experiments were done galva-nostatically, so that the current was adjusted tothe desired level. Current densities used in theseries are presented in Table I. Water wasstirred during EC with a magnetic stirrer at aspeed of 500 rpm.
In the series P1, P2 and P3, sampleswere transferred to a programmable stirrer andflocculator after EC treatment. The flocculatorspeeds were: 350 rpm for 10 s, 10 rpm for 5min, and settling time 30 min. After settling,samples were pipetted from the glass beakersusing 100 mL glass pipettes. Pipetting wasdone from the centre of the beaker to avoid get-ting floating material in the sample.
In the filtered sample series F1, F2 andF3, samples were transferred to a flocculatorafter EC treatment. The flocculator had the
same speed setup that was used with the pipet-ted samples. After flocculation, samples werefiltered using 589/1 black ribbon filter paper(Whatman, Maidstone, Kent, UK). The chemi-cal additions of the samples are listed in TableII. The chemical additions were ~80% of thewater treatment plant chemical dose.
Some samples were floated using a lab-oratory-scale DAF. The equipment used wasDAFSEP’s bench-scale DAF kit (Sciental Sup-ply & Equipment, Monument, CO, USA). Thepressure in the saturation tank was 483 kPa andthe stabilization time was 10 min. In the seriesD1 and DR, the amount of dispersion wateradded to the sample was 200 mL. Water used inthe saturation tank was ion-exchanged waterused in the paper mill laboratory. Flotationtime was 30 min. After flotation, water was fil-tered using a 589/1 black ribbon filter. Chemi-cal additions of the D1 series were 80% of the
water treatment plant’s chemical additions.There were two samples, shown as DR, forwhich the chemical additions equaled the watertreatment plant usages.
Analyses were done on filtered or pipet-ted samples, except for pH and conductivitymeasurements, which were analyzed from thewhole sample. The permanganate index wasmeasured as stated in Standard EN ISO8467:1995 [23]. Apparent colour was meas-ured as stated in Standard EN ISO 7887:1994[24] using a Hach 2100AN IS photometer(Loveland, CO, USA). Residual aluminum wasmeasured using the Merck (Darmstad, Germa-ny) aluminum photometric test. The photome-ter used for the aluminum and turbiditymeasurements was the Spectroquant NOVA60(Merck).
The results of the analyses are presentedas a function of time or of electric charge. The
TABLE II CHEMICAL ADDITIONS AND CURRENT DENSITIES
Date Series PAC (mg/L) NaOH (mg/L) NaCl (mg/L)Current density
(mA/cm2)
Pipetted 31.5.2006 P1 0.0 0.0 49.8 1.79
31.5.2006 P2 4.5 2.0 49.7 1.79
1.6.2006 P3 12.0 5.2 49.6 1.79
Filtered 11.9.2006 F1 14.4 6.4 0.0 0.36
11.9.2006 F2 14.4 6.4 0.0 0.71
11.9.2006 F3 14.4 6.4 0.0 1.07
DAF 25.9.2006 D1 14.4 6.4 0.0 0.71
25.9.2006 DR1 17.8 8.8 0.0 0.71
Concentrations for DAF-treated samples are calculated for the initial volumes of the samples.
Fig. 1. Variation of the (A) pH and (B) conductivity of pipetted samples with electric charge. The results of the analyses are presented as afunction of time or of electric charge. One coulomb is the same as an electric charge of one ampere in one second. The chemical coagulantconcentration in the sample series was 4.5 mg/L in P2 and 12.0 mg/L in P3.
0 20 40 60 80 100 120 140 1606.0
6.2
6.4
6.6
6.8
7.0
7.2
7.4
7.6 Series P1 Series P2 Series P3
pH
Electric charge (C)
A
0 20 40 60 80 100 120 140 16010
11
12
13
14
15
16
17
18 Series P1 Series P2 Series P3
Cond
uctiv
ity (m
S/m
)
Electric charge (C)
B
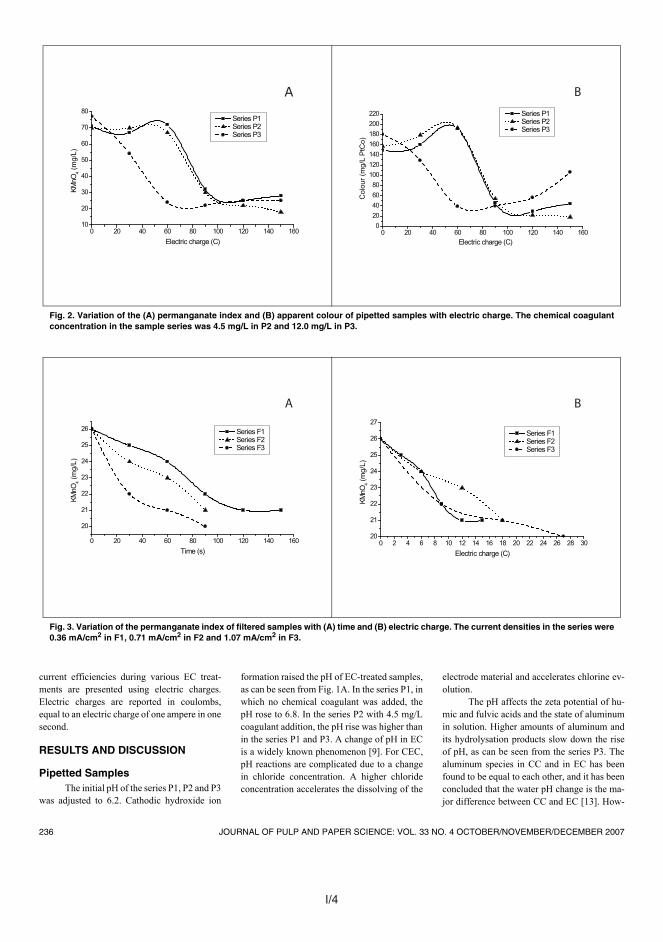
I/4 I/5
236 JOURNAL OF PULP AND PAPER SCIENCE: VOL. 33 NO. 4 OCTOBER/NOVEMBER/DECEMBER 2007
current efficiencies during various EC treat-ments are presented using electric charges.Electric charges are reported in coulombs,equal to an electric charge of one ampere in onesecond.
RESULTS AND DISCUSSION
Pipetted SamplesThe initial pH of the series P1, P2 and P3
was adjusted to 6.2. Cathodic hydroxide ion
formation raised the pH of EC-treated samples,as can be seen from Fig. 1A. In the series P1, inwhich no chemical coagulant was added, thepH rose to 6.8. In the series P2 with 4.5 mg/Lcoagulant addition, the pH rise was higher thanin the series P1 and P3. A change of pH in ECis a widely known phenomenon [9]. For CEC,pH reactions are complicated due to a changein chloride concentration. A higher chlorideconcentration accelerates the dissolving of the
electrode material and accelerates chlorine ev-olution.
The pH affects the zeta potential of hu-mic and fulvic acids and the state of aluminumin solution. Higher amounts of aluminum andits hydrolysation products slow down the riseof pH, as can be seen from the series P3. Thealuminum species in CC and in EC has beenfound to be equal to each other, and it has beenconcluded that the water pH change is the ma-jor difference between CC and EC [13]. How-
Fig. 2. Variation of the (A) permanganate index and (B) apparent colour of pipetted samples with electric charge. The chemical coagulantconcentration in the sample series was 4.5 mg/L in P2 and 12.0 mg/L in P3.
0 20 40 60 80 100 120 140 16010
20
30
40
50
60
70
80 Series P1 Series P2 Series P3
KMnO
4 (m
g/L)
Electric charge (C)
A
0 20 40 60 80 100 120 140 1600
20406080
100120140160180200220 Series P1
Series P2 Series P3
Col
our (
mg/
L P
tCo)
Electric charge (C)
B
Fig. 3. Variation of the permanganate index of filtered samples with (A) time and (B) electric charge. The current densities in the series were0.36 mA/cm2 in F1, 0.71 mA/cm2 in F2 and 1.07 mA/cm2 in F3.
0 20 40 60 80 100 120 140 160
20
21
22
23
24
25
26 Series F1 Series F2 Series F3
KMnO
4 (m
g/L)
Time (s)
A
0 2 4 6 8 10 12 14 16 18 20 22 24 26 28 3020
21
22
23
24
25
26
27
Series F1 Series F2 Series F3
KMnO
4 (m
g/L)
Electric charge (C)
B
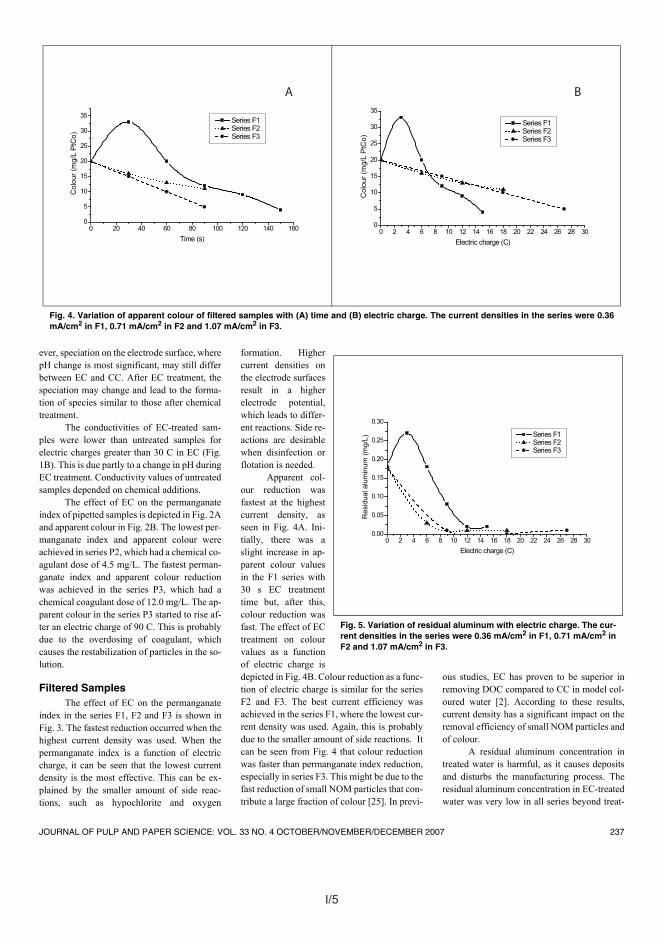
I/5
JOURNAL OF PULP AND PAPER SCIENCE: VOL. 33 NO. 4 OCTOBER/NOVEMBER/DECEMBER 2007 237
ever, speciation on the electrode surface, wherepH change is most significant, may still differbetween EC and CC. After EC treatment, thespeciation may change and lead to the forma-tion of species similar to those after chemicaltreatment.
The conductivities of EC-treated sam-ples were lower than untreated samples forelectric charges greater than 30 C in EC (Fig.1B). This is due partly to a change in pH duringEC treatment. Conductivity values of untreatedsamples depended on chemical additions.
The effect of EC on the permanganateindex of pipetted samples is depicted in Fig. 2Aand apparent colour in Fig. 2B. The lowest per-manganate index and apparent colour wereachieved in series P2, which had a chemical co-agulant dose of 4.5 mg/L. The fastest perman-ganate index and apparent colour reductionwas achieved in the series P3, which had achemical coagulant dose of 12.0 mg/L. The ap-parent colour in the series P3 started to rise af-ter an electric charge of 90 C. This is probablydue to the overdosing of coagulant, whichcauses the restabilization of particles in the so-lution.
Filtered SamplesThe effect of EC on the permanganate
index in the series F1, F2 and F3 is shown inFig. 3. The fastest reduction occurred when thehighest current density was used. When thepermanganate index is a function of electriccharge, it can be seen that the lowest currentdensity is the most effective. This can be ex-plained by the smaller amount of side reac-tions, such as hypochlorite and oxygen
formation. Highercurrent densities onthe electrode surfacesresult in a higherelectrode potential,which leads to differ-ent reactions. Side re-actions are desirablewhen disinfection orflotation is needed.
Apparent col-our reduction wasfastest at the highestcurrent density, asseen in Fig. 4A. Ini-tially, there was aslight increase in ap-parent colour valuesin the F1 series with30 s EC treatmenttime but, after this,colour reduction wasfast. The effect of ECtreatment on colourvalues as a functionof electric charge isdepicted in Fig. 4B. Colour reduction as a func-tion of electric charge is similar for the seriesF2 and F3. The best current efficiency wasachieved in the series F1, where the lowest cur-rent density was used. Again, this is probablydue to the smaller amount of side reactions. Itcan be seen from Fig. 4 that colour reductionwas faster than permanganate index reduction,especially in series F3. This might be due to thefast reduction of small NOM particles that con-tribute a large fraction of colour [25]. In previ-
ous studies, EC has proven to be superior inremoving DOC compared to CC in model col-oured water [2]. According to these results,current density has a significant impact on theremoval efficiency of small NOM particles andof colour.
A residual aluminum concentration intreated water is harmful, as it causes depositsand disturbs the manufacturing process. Theresidual aluminum concentration in EC-treatedwater was very low in all series beyond treat-
Fig. 4. Variation of apparent colour of filtered samples with (A) time and (B) electric charge. The current densities in the series were 0.36mA/cm2 in F1, 0.71 mA/cm2 in F2 and 1.07 mA/cm2 in F3.
0 20 40 60 80 100 120 140 1600
5
10
15
20
25
30
35 Series F1 Series F2 Series F3
Col
our (
mg/
L P
tCo)
Time (s)
A
0 2 4 6 8 10 12 14 16 18 20 22 24 26 28 300
5
10
15
20
25
30
35
Series F1 Series F2 Series F3
Col
our (
mg/
L P
tCo)
Electric charge (C)
B
Fig. 5. Variation of residual aluminum with electric charge. The cur-rent densities in the series were 0.36 mA/cm2 in F1, 0.71 mA/cm2 inF2 and 1.07 mA/cm2 in F3.
0 2 4 6 8 10 12 14 16 18 20 22 24 26 28 300.00
0.05
0.10
0.15
0.20
0.25
0.30
Series F1 Series F2 Series F3
Res
idua
l alu
min
um (m
g/L)
Electric charge (C)
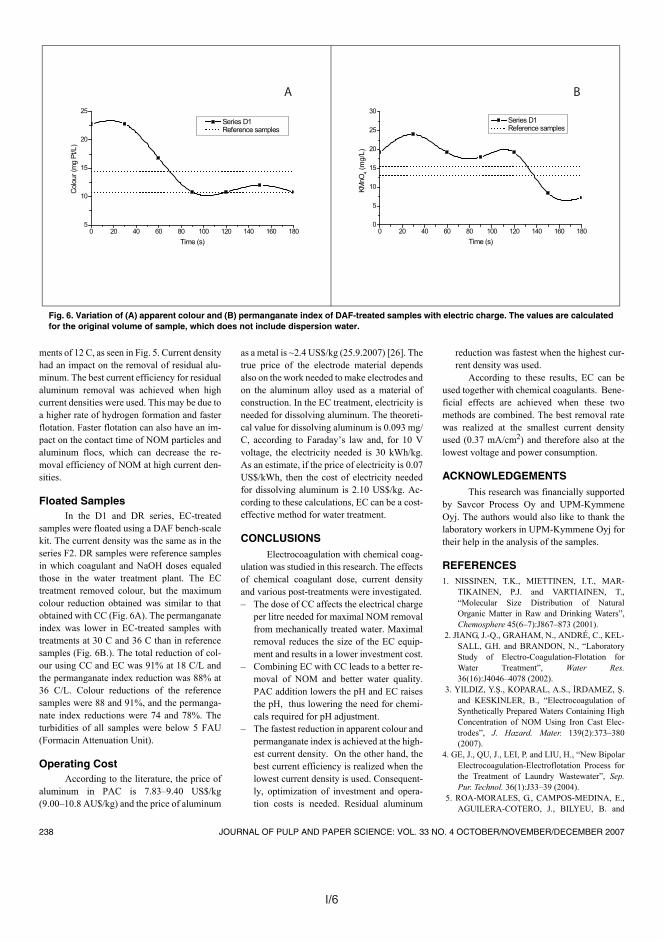
I/6 I/7
238 JOURNAL OF PULP AND PAPER SCIENCE: VOL. 33 NO. 4 OCTOBER/NOVEMBER/DECEMBER 2007
ments of 12 C, as seen in Fig. 5. Current densityhad an impact on the removal of residual alu-minum. The best current efficiency for residualaluminum removal was achieved when highcurrent densities were used. This may be due toa higher rate of hydrogen formation and fasterflotation. Faster flotation can also have an im-pact on the contact time of NOM particles andaluminum flocs, which can decrease the re-moval efficiency of NOM at high current den-sities.
Floated SamplesIn the D1 and DR series, EC-treated
samples were floated using a DAF bench-scalekit. The current density was the same as in theseries F2. DR samples were reference samplesin which coagulant and NaOH doses equaledthose in the water treatment plant. The ECtreatment removed colour, but the maximumcolour reduction obtained was similar to thatobtained with CC (Fig. 6A). The permanganateindex was lower in EC-treated samples withtreatments at 30 C and 36 C than in referencesamples (Fig. 6B.). The total reduction of col-our using CC and EC was 91% at 18 C/L andthe permanganate index reduction was 88% at36 C/L. Colour reductions of the referencesamples were 88 and 91%, and the permanga-nate index reductions were 74 and 78%. Theturbidities of all samples were below 5 FAU(Formacin Attenuation Unit).
Operating CostAccording to the literature, the price of
aluminum in PAC is 7.83–9.40 US$/kg(9.00–10.8 AU$/kg) and the price of aluminum
as a metal is ~2.4 US$/kg (25.9.2007) [26]. Thetrue price of the electrode material dependsalso on the work needed to make electrodes andon the aluminum alloy used as a material ofconstruction. In the EC treatment, electricity isneeded for dissolving aluminum. The theoreti-cal value for dissolving aluminum is 0.093 mg/C, according to Faraday’s law and, for 10 Vvoltage, the electricity needed is 30 kWh/kg.As an estimate, if the price of electricity is 0.07US$/kWh, then the cost of electricity neededfor dissolving aluminum is 2.10 US$/kg. Ac-cording to these calculations, EC can be a cost-effective method for water treatment.
CONCLUSIONSElectrocoagulation with chemical coag-
ulation was studied in this research. The effectsof chemical coagulant dose, current densityand various post-treatments were investigated.– The dose of CC affects the electrical charge
per litre needed for maximal NOM removalfrom mechanically treated water. Maximalremoval reduces the size of the EC equip-ment and results in a lower investment cost.
– Combining EC with CC leads to a better re-moval of NOM and better water quality.PAC addition lowers the pH and EC raisesthe pH, thus lowering the need for chemi-cals required for pH adjustment.
– The fastest reduction in apparent colour andpermanganate index is achieved at the high-est current density. On the other hand, thebest current efficiency is realized when thelowest current density is used. Consequent-ly, optimization of investment and opera-tion costs is needed. Residual aluminum
reduction was fastest when the highest cur-rent density was used.
According to these results, EC can beused together with chemical coagulants. Bene-ficial effects are achieved when these twomethods are combined. The best removal ratewas realized at the smallest current densityused (0.37 mA/cm2) and therefore also at thelowest voltage and power consumption.
ACKNOWLEDGEMENTSThis research was financially supported
by Savcor Process Oy and UPM-KymmeneOyj. The authors would also like to thank thelaboratory workers in UPM-Kymmene Oyj fortheir help in the analysis of the samples.
REFERENCES1. NISSINEN, T.K., MIETTINEN, I.T., MAR-
TIKAINEN, P.J. and VARTIAINEN, T.,“Molecular Size Distribution of NaturalOrganic Matter in Raw and Drinking Waters”,Chemosphere 45(6–7):J867–873 (2001).
2. JIANG, J.-Q., GRAHAM, N., ANDRÉ, C., KEL-SALL, G.H. and BRANDON, N., “LaboratoryStudy of Electro-Coagulation-Flotation forWater Treatment”, Water Res.36(16):J4046–4078 (2002).
3. YILDIZ, Y.Ş., KOPARAL, A.S., İRDAMEZ, Ş.and KESKINLER, B., “Electrocoagulation ofSynthetically Prepared Waters Containing HighConcentration of NOM Using Iron Cast Elec-trodes”, J. Hazard. Mater. 139(2):373–380(2007).
4. GE, J., QU, J., LEI, P. and LIU, H., “New BipolarElectrocoagulation-Electroflotation Process forthe Treatment of Laundry Wastewater”, Sep.Pur. Technol. 36(1):J33–39 (2004).
5. ROA-MORALES, G., CAMPOS-MEDINA, E.,AGUILERA-COTERO, J., BILYEU, B. and
Fig. 6. Variation of (A) apparent colour and (B) permanganate index of DAF-treated samples with electric charge. The values are calculatedfor the original volume of sample, which does not include dispersion water.
0 20 40 60 80 100 120 140 160 1805
10
15
20
25 Series D1 Reference samples
Colo
ur (m
g Pt
/L)
Time (s)
A
0 20 40 60 80 100 120 140 160 1800
5
10
15
20
25
30 Series D1 Reference samples
KMnO
4 (m
g/L)
Time (s)
B
I/7
JOURNAL OF PULP AND PAPER SCIENCE: VOL. 33 NO. 4 OCTOBER/NOVEMBER/DECEMBER 2007 239
BARRERA-DÍAZ, C., “Aluminium Electroco-agulation with Peroxide Applied to Wastewaterfrom Pasta and Cookie Processing”, Sep. Pur.Technol. 54(1):J124–129 (2007).
6. ŞENGIL, İ.A. and ÖZACAR, M., “Treatment ofDairy Wastewater by Electrocoagulation UsingMild Steel Electrodes”, J. Hazard. Mater.137(2):J1197–1205 (2006).
7. YAVUZ, Y., “EC and EF Processes for the Treat-ment of Alcohol Distillery Wastewater”, Sep.Pur. Technol. 53(1):J135–140 (2007).
8. KANNAN, N., KARTHIKEYAN, G. and TAMIL-SELVAN, N., “Comparison of Treatment Poten-tial of Electrocoagulation of Distillery Effluentwith and without Activated Areca catechu NutCarbon”, J. Hazard. Mater. 137(3):J1803–1809(2006).
9. CHEN, G., “Electrochemical Technologies inWastewater Treatment”, Sep. Pur. Technol.38(1):J11–41 (2004).
10. MOLLAH, M.Y.A., MORKOVSKY, P.,GOMES, J.A.G., KESMEZ, M., PARGA, J. andCOCKE, D.L., “Fundamentals, Present andFuture Perspectives of Electrocoagulation”, J.Hazard. Mater. 114(1–3):199–210 (2004).
11. CAÑIZARES, P., CARMONA, M., LOBATO,J., MARTÍNEZ, F. and RODRIGO, M.A.,“Electrodissolution of Aluminum Electrodes inElectrocoagulation Process”, Ind. Engin. Chem.Res. 44(12):J4178–4185 (2005).
12. CAÑIZARES, P., MARTINEZ, F., CARMONA,M., LOBATO, J. and RODRIGO, M.A., “Con-tinuous Electrocoagulation of Synthetic Col-loid-Polluted Wastes”, Ind. Engin. Chem. Res.44(22):J8171–8177 (2005).
13. CAÑIZARES, P., MARTINEZ, F., JIMÉNEZ,C., LOBATO, J. and RODRIGO, M., “Compar-ison of the Aluminum Speciation in Chemicaland Electrochemical Dosing Processes”, Ind.Engin. Chem. Res. 45(26):J8749–8756 (2006).
14. DUAN, J. and GREGORY, J., “Coagulation byHydrolysing Metal Salts”, Adv. Coll. InterfaceSci. (100–102):J475–502 (2003).
15. NISSINEN, T.K., MIETTINEN, I.T., MAR-TIKAINEN, P.J. and VARTIANEN, T., “Disin-fection By-Products in Finnish DrinkingWaters”, Chemosphere 48(1):9–20 (2002).
16. ZHU, B., CLIFFORD, D.A. and CHELLAM, S.,“Comparison of Electrocoagulation and Chemi-cal Coagulation Pretreatment for EnhancedVirus Removal Using Microfiltration Mem-branes”, Water Res. 39(13):J3098–3108 (2005).
17. MEUNIER, N., DROGUI, P., MONTANÉ, C.,HAUSLER, R., MERCIER, G. and BLAIS, J.-F., “Comparison between Electrocoagulationand Chemical Precipitation for Metals Removalfrom Acidic Soil Leachate.”, J. Hazard. Mater.137(1):J581–590 (2006).
18. HOLT, P.K., BARTON, G.W., WARK, M. andMITCHELL, C.A., “A Quantitative Compari-son between Chemical Dosing and Electrocoag-ulation”, Coll. Surf. A 211(2–3):233–248(2002).
19. MATTESON, M.J., DOBSON, R.L., GLENNJr., R.W., KUKUNOOR, N.S., WAITS III, W.H.and CLAYFIELD, E.J., “Electrocoagulationand Separation of Aqueous Suspensions ofUltrafine Particles”, Coll. Surf. A 104(1):101–109 (1995).
20. MOLLAH, M.Y.A., SCHENNACH, R.,PARGA, J.R. and COCKE, D.L., “Electrocoag-ulation (EC) – Science and Applications”, J.Hazard. Mater. 84(1):29–41 (2001).
21. CAN, O.T., KOBYA, M., DEMIRBAS, E. andBAYRAMOGLU, M., “Treatment of the TextileWastewater by Combined Electrocoagulation”,Chemosphere 62(2):J181–187 (2006).
22. HU, C.Y., LO, S.L. and KUAN, W.H., “Effectsof Co-Existing Anions on Fluoride Removal inElectrocoagulation (EC) Process Using Alumi-num Electrodes”, Water Res. 37(18):J4513–4523 (2003).
23. “Water Quality – Determination of Permanga-nate Index”, ISO 8467:1993, Intl. Org. Stand-ardiz., Geneva, Switzerland (1993).
24. Water Quality – Examination and Determinationof Colour”, ISO 7887:1994, Intl. Org. Stand-ardiz., Geneva, Switzerland (1994).
25. RATNAWEERA, H., HILLER, N. and BUNSE,U., “Comparison of the Coagulation Behaviorof Different Norwegian Aquatic NOMSources”, Env. Int. 25(2–3):J347–355 (1999).
26. GEBBIE, P., “Using Polyaluminium Coagulantsin Water Treatment”, Proc. 64th Ann. WaterIndustry Engineers Operators’ Conf., AustralianWater Wastewater Operators Assoc., 39–47(2001).
REFERENCE: VEPSÄLÄINEN, M., SELIN, J., PULLIAINEN, M. and SILLANPÄÄ, M., Com-bined Electrocoagulation and Chemical Coagulation of Paper Mill Mechanically Cleaned Water,Journal of Pulp and Paper Science, 33(4):233–239 October/November/December 2007. Paper of-fered as a contribution to the Journal of Pulp and Paper Science. Not to be reproduced without per-mission from the Pulp and Paper Technical Association of Canada. Manuscript received February19, 2007; revised manuscript approved for publication by the Review Panel October 16, 2007.KEYWORDS: WATER RECLAMATION, WATER TREATMENT, COAGULATION, ELECTRICI-TY.
Congratulations to James Olson, Richard Kerekes and David Goosen, University of British Co-lumbia, Vancouver, BC for winning the 2007 JPPS Best Paper Award. Their winning paper is "TheRole of Heterogeneity in Compression Refining", published in the April/May/June 2007 issue of JPPS.
The award is conferred in recognition of the best paper published in the Journal of Pulp and Pa-per Science. The awards were presented during the PAPTAC Awards Ceremony at the 94th AnnualMeeting, February 7, 2008 in Montreal. The Scientific Editor and the Associate Scientific Editorsjudged the papers.
2007 JPPS Best Paper Award

PUBLICATION II
Effect of electrochemical cell structure on natural
organic matter (NOM) removal from surface water through
electrocoagulation (EC)
In: Sep. Purif. Technol. 2012, 99, pp. 20–27.Copyright 2012 Elsevier.
Reprinted with permission from the publisher.

II/1
Author's personal copy
Effect of electrochemical cell structure on natural organic matter (NOM)removal from surface water through electrocoagulation (EC)
Mikko Vepsäläinen a,b,⇑, Martti Pulliainen c, Mika Sillanpää b
aVTT Technical Research Centre of Finland, P.O. Box 1000, FI-02044 VTT, Finlandb Laboratory of Green Chemistry, LUT Faculty of Engineering, Lappeenranta University of Technology, Patteristonkatu 1, FI-50190 Mikkeli, Finlandc Savcor Forest Oy, Insinöörinkatu 8, FI-50100 Mikkeli, Finland
a r t i c l e i n f o
Article history:Received 4 March 2012Received in revised form 4 July 2012Accepted 7 August 2012Available online 16 August 2012
Keywords:Response surface methodElectrocoagulationWater treatmentNatural organic matter
a b s t r a c t
This study analyzed the effect of electrocoagulation cell construction on NOM removal from Finnish sur-face water. Three types of cells were used in this research: one that only had aluminum electrodes, onethat had aluminum anodes and inert cathodes, and one that had inert anodes and aluminum cathodes.Main water quality parameters such as TOC, apparent color, and concentrations of residual metals weremeasured from the samples. A statistical model was made from the results using partial least squares(PLSs) regression. According to the results, electrocoagulation was able to produce high quality waterwith low NOM concentration. Lowest measured TOC concentration was 4.02 mg/l (78% removal). Thepotential applications of water after the treatment could be potable water or industrial fresh water. Alu-minum originating from the anodes or cathodes had similar NOM removal efficiency. According to TOCand f-Potential results, the mechanism of NOM removal was similar to chemical coagulation in differentpHs. It seems that in low pH, double layer compression was the main destabilization mechanism whereasin higher pH, adsorption and bridging dominated.
� 2012 Published by Elsevier B.V.
1. Introduction
Electrocoagulation has been suggested to be a promising alter-native to chemical coagulation for removing various pollutantsfrom freshwaters and wastewaters [1–3]. Sacrificial metal anodesor cathodes produce metal ions or metal hydroxides into solution.Metal cations and hydroxides interact with pollutants by severalmechanisms, including charge neutralization, precipitation, andenmeshment. Pollutants can be removed from water by electroflo-tation, which can occur simultaneously with electrocoagulation, orby sedimentation, or filtration. Electroflotation is caused bymicrometer-sized bubbles (15–23 lm diameter), which are pro-duced on the cathode surface [4]. Other mechanisms that may af-fect pollution removal are electromigration of ions towardselectrodes and reduction of metals on the cathode surface. Thesereactions, as well as well-known advantages and disadvantagesand applications of electrocoagulation, are presented in reviewarticles [1–3,5,6].
It is well known that aluminum in the electrocoagulation pro-cess can be dissolved from aluminum anodes and cathode elec-trodes. Aluminum dissolves from anodes according to simpleelectrochemical reaction Eq. (1) and forms hydroxides in water
Eq. (2). Meanwhile, aluminum cathodes dissolve due to high pHon the cathode surface Eq. (4), which is caused by OH� that is pro-duced by an electrochemical reaction Eq. (3). Aluminate also formsvarious hydroxides in water Eq. (2) depending on the water pH.
AlðsÞ ! Al3þðaqÞ þ 3e� ð1Þ
Al3þðaqÞ þ nH2O $ AlðOHÞ3�nþn þ nHþðaqÞ ð2Þ
2H2Oþ 2e� ! H2ðgÞ þ 2OH�ðaqÞ ð3Þ
2AlðsÞ þ 6H2Oþ 2OH�ðaqÞ ! 2AlðOHÞ�4 ðaqÞ þ 3H2ðgÞ ð4Þ
Electrocoagulation treatment of surface waters and removal ofNOM from waters has been studied in several articles [7–16]. Jianget al. applied a laboratory flow-through system, which they testedwith model-colored water and lowland surface water [8]. Electro-coagulation performed better for DOC removal than chemical coag-ulation for the model-colored water, but for the lowland surfacewater both processes had similar performance. Yildiz et al. studiedthe effect of initial pH, supporting electrolyte, applied potentialand initial humic substance concentration on NOM removal fromsynthetically prepared waters containing a high concentration ofNOM [14,15]. According to their results, the optimum initial pHis 5 for electrocoagulation using aluminum plate electrodes. Theyconcluded that Na2SO4 was the most favorable supporting
1383-5866/$ - see front matter � 2012 Published by Elsevier B.V.http://dx.doi.org/10.1016/j.seppur.2012.08.011
⇑ Corresponding author at: VTT Technical Research Centre of Finland, P.O. Box1000, FI-02044 VTT, Finland. Tel.: +358 40 706 4995; fax: +358 20 722 7002.
E-mail address: [email protected] (M. Vepsäläinen).
Separation and Purification Technology 99 (2012) 20–27
Contents lists available at SciVerse ScienceDirect
Separation and Purification Technology
journal homepage: www.elsevier .com/locate /seppur
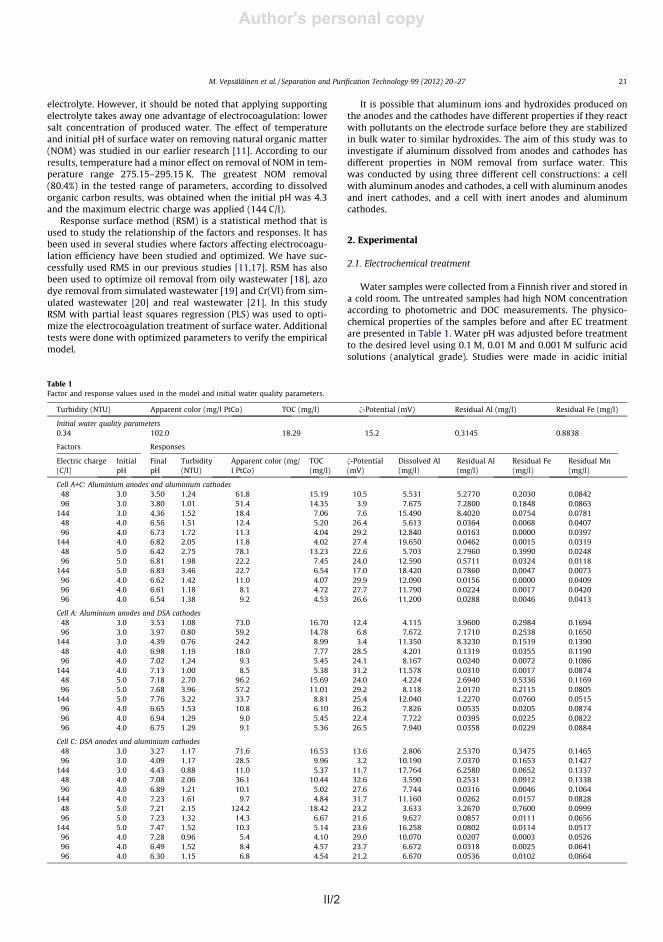
II/2 II/3
Author's personal copy
pH because our previous study shows that low initial pH enhancesNOM removal [11]. Surface waters in Scandinavia are typically softand therefore a low amount of acid is required for the pHadjustment.
In this study, three EC cells were constructed. Cells A + C wasmade of 6 aluminum plates; 3 anodes and 3 cathodes. Cell A wasmade of aluminum anodes (3 plates) and inert cathodes (3 plates).Cell C was similar to Cell A, but inert plates were used as anodesand aluminum plates as cathodes. Inert electrode material usedin this study was commercially available dimensionally stable an-ode (DSA) electrodes. These electrodes were made of titanium thatwas coated with a mixed metal oxide layer (iridium and rutheniumoxides). Aluminum alloy 1050 (99.5% Al) was used in the experi-ments. All electrode plates were 7 cm long and 5 cmwide. Distancebetween electrode plates was 1 cm. EC treatment was done inbatch cells where electrodes were arranged into monopolar config-uration. Water volume during the treatment was 500 ml.
GW Instek PSM-6003 was used as a power source throughoutthe experiments. The current used in this study was 0.100 A. Low
current density 0.48 mA/cm2 was selected on the basis of our pre-vious studies [12]. Treatment time varied from 4 (48 C/l) to 12 min(144 C/l). Electrode plates were washed thoroughly with 4% HCl,tap water, and MilliQ-water after treatments.
Samples were magnetically stirred during the EC treatment atthe speed of 300 rpm. After the treatment, samples were stirredwith an overhead stirrer at the speed of 40 rpm for 10 min to facil-itate flocculation. Settling time after flocculation was 30 min.Water samples were filtered through a glass fiber filter (GF/CWhatman, nominal pore size 1.2 lm) and stored in a cold room be-fore further analysis.
2.2. Chemical analysis
Metal concentrations were determined using iCAP 6000 seriesICP-OES (Thermo Electron) from samples in which 0.2 ml of 37%HNO3 (analytical grade) was added to 10 ml of sample. Dissolvedaluminum samples were taken right after electrochemical treat-ment before slow stirring stage. Residual metals were analyzed
Table 2The fraction of the variation of the response explained by the model (R2) and the fraction of the variation of the response predicted by the model according to cross validation (Q2).
Term Final pH Turbidity Apparent color TOC f-Potential Dissolved Al Residual Al Residual Fe Residual Mn
Cell A+CR2 0.98 0.93 0.86 0.93 0.94 0.97 0.98 0.80 0.98Q2 0.85 0.53 0.52 0.62 0.70 0.70 0.82 0.57 0.80Cell AR2 0.99 0.97 0.98 0.96 0.94 1.00 0.98 0.93 0.94Q2 0.92 0.75 0.87 0.77 0.71 0.92 0.88 0.77 0.71Cell CR2 0.96 0.70 0.91 0.93 0.93 0.92 0.96 0.81 0.79Q2 0.84 0.12 0.40 0.46 0.58 0.41 0.74 0.43 0.32
Table 3Coefficients of the model terms (X1 is electric charge and X2 is initial pH).
Response Unit Constant X1 X2 X21 X2
2X1
�X2
Cell A+CFinal pH �2.07E+01 �1.55E�02 1.26E+01 5.19E�05 �1.43E+00 2.66E�03Turbiditya NTU 4.86E�01 �1.05E�02 �1.14E�01 5.70E�05 3.30E�02 1.61E�04App. Colora PtCo mg/l 1.01E+01 �1.10E�02 �4.15E+00 3.27E�05 5.11E�01 2.50E�04TOCa mg/l 6.91E+00 �3.80E�03 �2.91E+00 1.03E�06 3.53E�01 2.47E�04f-Potentialb mV �1.09E+00 �3.71E�04 �4.71E�01 5.71E�06 5.53E�02 �1.01E�04Dissolved Al mg/l �2.42E+01 3.62E�02 1.27E+01 3.29E�04 �1.50E+00 7.10E�03Residual Ala mg/l 3.18E+01 �2.92E�02 �1.56E+01 1.43E�04 1.89E+00 1.66E�04Residual Fec mg/l 2.74E+01 �4.79E�02 �1.36E+01 2.22E�04 1.67E+00 �1.34E�03Residual Mna mg/l �1.63E+00 6.25E�03 4.29E�01 �3.54E�06 �8.09E�02 �1.98E�03
Cell AFinal pH �2.00E+01 6.94E�03 1.14E+01 2.28E�05 �1.18E+00 �1.45E�03Turbiditya NTU 1.64E+00 �1.30E�04 �1.03E+00 �2.69E�05 1.51E�01 1.19E�03App. Colora PtCo mg/l 1.25E+01 �6.42E�03 �5.51E+00 7.98E�06 6.92E�01 1.25E�04TOCa mg/l 6.23E+00 �4.29E�03 �2.55E+00 8.09E�06 3.14E�01 9.38E�05f-Potentialb mV �1.47E+00 1.42E�03 �3.16E�01 �2.50E�06 3.77E�02 �2.15E�04Dissolved Al mg/l 9.77E�01 6.52E�02 �1.79E�01 2.82E�06 1.20E�02 3.03E�03Residual Ala mg/l 2.86E+01 4.49E�03 �1.48E+01 3.69E�05 1.86E+00 �3.46E�03Residual Fec mg/l 1.77E+01 1.84E�02 �9.96E+00 �8.00E�05 1.28E+00 �2.88E�03Residual Mna mg/l 3.27E�01 2.58E�03 �5.41E�01 5.45E�06 6.57E�02 �1.41E�03
Cell CFinal pH �2.26E+01 9.60E�03 1.27E+01 7.57E�05 �1.32E+00 �4.67E�03Turbiditya NTU �6.42E�01 �9.96E�03 5.50E�01 4.79E�05 �5.56E�02 �1.40E�04App. Colora PtCo mg/l 7.74E+00 �2.78E�02 �2.53E+00 1.29E�04 3.31E�01 �1.39E�03TOCa mg/l 4.70E+00 �1.44E�02 �1.52E+00 5.73E�05 1.92E�01 �3.43E�04f-Potentialb mV �1.24E+00 3.51E�03 �4.82E�01 �4.27E�06 6.19E�02 �5.77E�04Dissolved Al mg/l 3.06E+01 1.79E�01 �1.85E+01 �4.50E�05 2.43E+00 �1.22E�02Residual Ala mg/l 2.00E+01 6.41E�03 �1.01E+01 1.44E�04 1.31E+00 �1.04E�02Residual Fec mg/l 1.43E+01 �5.51E�02 �6.53E+00 3.46E�04 8.52E�01 �5.70E�03Residual Mna mg/l 5.18E�01 �4.79E�03 �5.11E�01 4.20E�05 6.02E�02 �1.28E�03
a Logarithmic transformation Log10(Y).b Negative logarithmic transformation –Log10(100 � Y).c Logarithmic transformation Log10(Y+0.001).
22 M. Vepsäläinen et al. / Separation and Purification Technology 99 (2012) 20–27
Author's personal copy
electrolyte. However, it should be noted that applying supportingelectrolyte takes away one advantage of electrocoagulation: lowersalt concentration of produced water. The effect of temperatureand initial pH of surface water on removing natural organic matter(NOM) was studied in our earlier research [11]. According to ourresults, temperature had a minor effect on removal of NOM in tem-perature range 275.15–295.15 K. The greatest NOM removal(80.4%) in the tested range of parameters, according to dissolvedorganic carbon results, was obtained when the initial pH was 4.3and the maximum electric charge was applied (144 C/l).
Response surface method (RSM) is a statistical method that isused to study the relationship of the factors and responses. It hasbeen used in several studies where factors affecting electrocoagu-lation efficiency have been studied and optimized. We have suc-cessfully used RMS in our previous studies [11,17]. RSM has alsobeen used to optimize oil removal from oily wastewater [18], azodye removal from simulated wastewater [19] and Cr(VI) from sim-ulated wastewater [20] and real wastewater [21]. In this studyRSM with partial least squares regression (PLS) was used to opti-mize the electrocoagulation treatment of surface water. Additionaltests were done with optimized parameters to verify the empiricalmodel.
It is possible that aluminum ions and hydroxides produced onthe anodes and the cathodes have different properties if they reactwith pollutants on the electrode surface before they are stabilizedin bulk water to similar hydroxides. The aim of this study was toinvestigate if aluminum dissolved from anodes and cathodes hasdifferent properties in NOM removal from surface water. Thiswas conducted by using three different cell constructions: a cellwith aluminum anodes and cathodes, a cell with aluminum anodesand inert cathodes, and a cell with inert anodes and aluminumcathodes.
2. Experimental
2.1. Electrochemical treatment
Water samples were collected from a Finnish river and stored ina cold room. The untreated samples had high NOM concentrationaccording to photometric and DOC measurements. The physico-chemical properties of the samples before and after EC treatmentare presented in Table 1. Water pH was adjusted before treatmentto the desired level using 0.1 M, 0.01 M and 0.001 M sulfuric acidsolutions (analytical grade). Studies were made in acidic initial
Table 1Factor and response values used in the model and initial water quality parameters.
Turbidity (NTU) Apparent color (mg/l PtCo) TOC (mg/l) f-Potential (mV) Residual Al (mg/l) Residual Fe (mg/l)
Initial water quality parameters0.34 102.0 18.29 �15.2 0.3145 0.8838
Factors Responses
Electric charge(C/I)
InitialpH
FinalpH
Turbidity(NTU)
Apparent color (mg/l PtCo)
TOC(mg/l)
f-Potential(mV)
Dissolved Al(mg/l)
Residual Al(mg/l)
Residual Fe(mg/l)
Residual Mn(mg/l)
Cell A+C: Aluminium anodes and aluminium cathodes48 3.0 3.50 1.24 61.8 15.19 �10.5 5.531 5.2770 0.2030 0.084296 3.0 3.80 1.01 51.4 14.35 �3.9 7.675 7.2800 0.1848 0.0863
144 3.0 4.36 1.52 18.4 7.06 7.6 15.490 8.4020 0.0754 0.078148 4.0 6.56 1.51 12.4 5.20 �26.4 5.613 0.0364 0.0068 0.040796 4.0 6.73 1.72 11.3 4.04 �29.2 12.840 0.0163 0.0000 0.0397
144 4.0 6.82 2.05 11.8 4.02 �27.4 19.650 0.0462 0.0015 0.031948 5.0 6.42 2.75 78.1 13.23 �22.6 5.703 2.7960 0.3990 0.024896 5.0 6.81 1.98 22.2 7.45 �24.0 12.590 0.5711 0.0324 0.0118
144 5.0 6.83 3.46 22.7 6.54 �17.0 18.420 0.7860 0.0047 0.007396 4.0 6.62 1.42 11.0 4.07 �29.9 12.090 0.0156 0.0000 0.040996 4.0 6.61 1.18 8.1 4.72 �27.7 11.790 0.0224 0.0017 0.042096 4.0 6.54 1.38 9.2 4.53 �26.6 11.200 0.0288 0.0046 0.0413
Cell A: Aluminium anodes and DSA cathodes48 3.0 3.53 1.08 73.0 16.70 �12.4 4.115 3.9600 0.2984 0.169496 3.0 3.97 0.80 59.2 14.78 �6.8 7.672 7.1710 0.2538 0.1650
144 3.0 4.39 0.76 24.2 8.99 �3.4 11.350 8.3230 0.1519 0.139048 4.0 6.98 1.19 18.0 7.77 �28.5 4.201 0.1319 0.0355 0.119096 4.0 7.02 1.24 9.3 5.45 �24.1 8.167 0.0240 0.0072 0.1086
144 4.0 7.13 1.00 8.5 5.38 �31.2 11.578 0.0310 0.0017 0.087448 5.0 7.18 2.70 96.2 15.69 �24.0 4.224 2.6940 0.5336 0.116996 5.0 7.68 3.96 57.2 11.01 �29.2 8.118 2.0170 0.2115 0.0805
144 5.0 7.76 3.22 33.7 8.81 �25.4 12.040 1.2270 0.0760 0.051596 4.0 6.65 1.53 10.8 6.10 �26.2 7.826 0.0535 0.0205 0.087496 4.0 6.94 1.29 9.0 5.45 �22.4 7.722 0.0395 0.0225 0.082296 4.0 6.75 1.29 9.1 5.36 �26.5 7.940 0.0358 0.0229 0.0884
Cell C: DSA anodes and aluminium cathodes48 3.0 3.27 1.17 71.6 16.53 �13.6 2.806 2.5370 0.3475 0.146596 3.0 4.09 1.17 28.5 9.96 �3.2 10.190 7.0370 0.1653 0.1427
144 3.0 4.43 0.88 11.0 5.37 11.7 17.764 6.2580 0.0652 0.133748 4.0 7.08 2.06 36.1 10.44 �32.6 3.590 0.2531 0.0912 0.133896 4.0 6.89 1.21 10.1 5.02 �27.6 7.744 0.0316 0.0046 0.1064
144 4.0 7.23 1.61 9.7 4.84 �31.7 11.160 0.0262 0.0157 0.082848 5.0 7.21 2.15 124.2 18.42 �23.2 3.633 3.2670 0.7600 0.099996 5.0 7.23 1.32 14.3 6.67 �21.6 9.627 0.0857 0.0111 0.0656
144 5.0 7.47 1.52 10.3 5.14 �23.6 16.258 0.0802 0.0114 0.051796 4.0 7.28 0.96 5.4 4.10 �29.0 10.070 0.0207 0.0003 0.052696 4.0 6.49 1.52 8.4 4.57 �23.7 6.672 0.0318 0.0025 0.064196 4.0 6.30 1.15 6.8 4.54 �21.2 6.670 0.0536 0.0102 0.0664
M. Vepsäläinen et al. / Separation and Purification Technology 99 (2012) 20–27 21
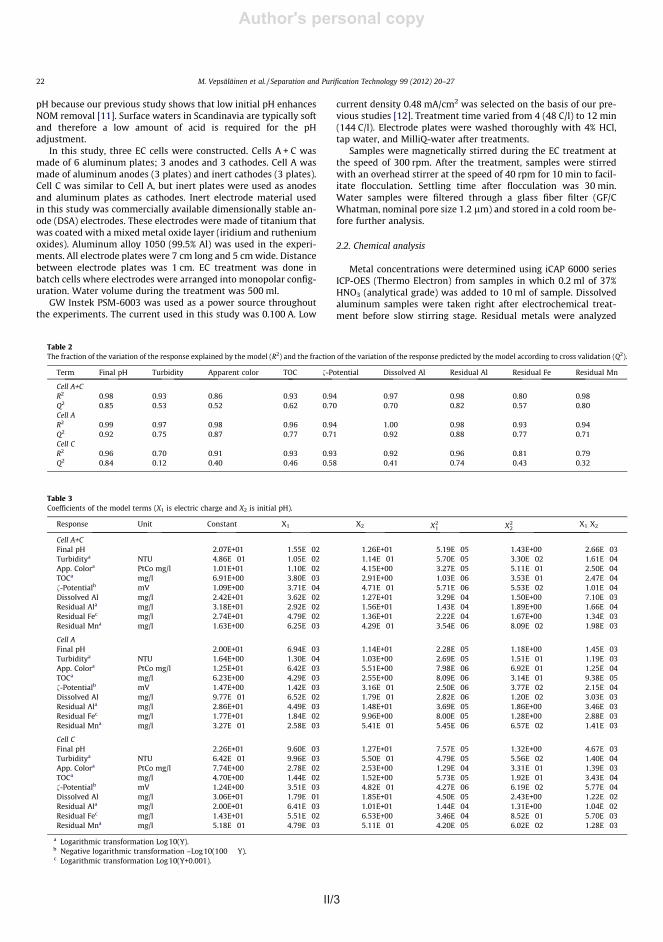
II/3
Author's personal copy
pH because our previous study shows that low initial pH enhancesNOM removal [11]. Surface waters in Scandinavia are typically softand therefore a low amount of acid is required for the pHadjustment.
In this study, three EC cells were constructed. Cells A + C wasmade of 6 aluminum plates; 3 anodes and 3 cathodes. Cell A wasmade of aluminum anodes (3 plates) and inert cathodes (3 plates).Cell C was similar to Cell A, but inert plates were used as anodesand aluminum plates as cathodes. Inert electrode material usedin this study was commercially available dimensionally stable an-ode (DSA) electrodes. These electrodes were made of titanium thatwas coated with a mixed metal oxide layer (iridium and rutheniumoxides). Aluminum alloy 1050 (99.5% Al) was used in the experi-ments. All electrode plates were 7 cm long and 5 cmwide. Distancebetween electrode plates was 1 cm. EC treatment was done inbatch cells where electrodes were arranged into monopolar config-uration. Water volume during the treatment was 500 ml.
GW Instek PSM-6003 was used as a power source throughoutthe experiments. The current used in this study was 0.100 A. Low
current density 0.48 mA/cm2 was selected on the basis of our pre-vious studies [12]. Treatment time varied from 4 (48 C/l) to 12 min(144 C/l). Electrode plates were washed thoroughly with 4% HCl,tap water, and MilliQ-water after treatments.
Samples were magnetically stirred during the EC treatment atthe speed of 300 rpm. After the treatment, samples were stirredwith an overhead stirrer at the speed of 40 rpm for 10 min to facil-itate flocculation. Settling time after flocculation was 30 min.Water samples were filtered through a glass fiber filter (GF/CWhatman, nominal pore size 1.2 lm) and stored in a cold room be-fore further analysis.
2.2. Chemical analysis
Metal concentrations were determined using iCAP 6000 seriesICP-OES (Thermo Electron) from samples in which 0.2 ml of 37%HNO3 (analytical grade) was added to 10 ml of sample. Dissolvedaluminum samples were taken right after electrochemical treat-ment before slow stirring stage. Residual metals were analyzed
Table 2The fraction of the variation of the response explained by the model (R2) and the fraction of the variation of the response predicted by the model according to cross validation (Q2).
Term Final pH Turbidity Apparent color TOC f-Potential Dissolved Al Residual Al Residual Fe Residual Mn
Cell A+CR2 0.98 0.93 0.86 0.93 0.94 0.97 0.98 0.80 0.98Q2 0.85 0.53 0.52 0.62 0.70 0.70 0.82 0.57 0.80Cell AR2 0.99 0.97 0.98 0.96 0.94 1.00 0.98 0.93 0.94Q2 0.92 0.75 0.87 0.77 0.71 0.92 0.88 0.77 0.71Cell CR2 0.96 0.70 0.91 0.93 0.93 0.92 0.96 0.81 0.79Q2 0.84 0.12 0.40 0.46 0.58 0.41 0.74 0.43 0.32
Table 3Coefficients of the model terms (X1 is electric charge and X2 is initial pH).
Response Unit Constant X1 X2 X21 X2
2X1
�X2
Cell A+CFinal pH �2.07E+01 �1.55E�02 1.26E+01 5.19E�05 �1.43E+00 2.66E�03Turbiditya NTU 4.86E�01 �1.05E�02 �1.14E�01 5.70E�05 3.30E�02 1.61E�04App. Colora PtCo mg/l 1.01E+01 �1.10E�02 �4.15E+00 3.27E�05 5.11E�01 2.50E�04TOCa mg/l 6.91E+00 �3.80E�03 �2.91E+00 1.03E�06 3.53E�01 2.47E�04f-Potentialb mV �1.09E+00 �3.71E�04 �4.71E�01 5.71E�06 5.53E�02 �1.01E�04Dissolved Al mg/l �2.42E+01 3.62E�02 1.27E+01 3.29E�04 �1.50E+00 7.10E�03Residual Ala mg/l 3.18E+01 �2.92E�02 �1.56E+01 1.43E�04 1.89E+00 1.66E�04Residual Fec mg/l 2.74E+01 �4.79E�02 �1.36E+01 2.22E�04 1.67E+00 �1.34E�03Residual Mna mg/l �1.63E+00 6.25E�03 4.29E�01 �3.54E�06 �8.09E�02 �1.98E�03
Cell AFinal pH �2.00E+01 6.94E�03 1.14E+01 2.28E�05 �1.18E+00 �1.45E�03Turbiditya NTU 1.64E+00 �1.30E�04 �1.03E+00 �2.69E�05 1.51E�01 1.19E�03App. Colora PtCo mg/l 1.25E+01 �6.42E�03 �5.51E+00 7.98E�06 6.92E�01 1.25E�04TOCa mg/l 6.23E+00 �4.29E�03 �2.55E+00 8.09E�06 3.14E�01 9.38E�05f-Potentialb mV �1.47E+00 1.42E�03 �3.16E�01 �2.50E�06 3.77E�02 �2.15E�04Dissolved Al mg/l 9.77E�01 6.52E�02 �1.79E�01 2.82E�06 1.20E�02 3.03E�03Residual Ala mg/l 2.86E+01 4.49E�03 �1.48E+01 3.69E�05 1.86E+00 �3.46E�03Residual Fec mg/l 1.77E+01 1.84E�02 �9.96E+00 �8.00E�05 1.28E+00 �2.88E�03Residual Mna mg/l 3.27E�01 2.58E�03 �5.41E�01 5.45E�06 6.57E�02 �1.41E�03
Cell CFinal pH �2.26E+01 9.60E�03 1.27E+01 7.57E�05 �1.32E+00 �4.67E�03Turbiditya NTU �6.42E�01 �9.96E�03 5.50E�01 4.79E�05 �5.56E�02 �1.40E�04App. Colora PtCo mg/l 7.74E+00 �2.78E�02 �2.53E+00 1.29E�04 3.31E�01 �1.39E�03TOCa mg/l 4.70E+00 �1.44E�02 �1.52E+00 5.73E�05 1.92E�01 �3.43E�04f-Potentialb mV �1.24E+00 3.51E�03 �4.82E�01 �4.27E�06 6.19E�02 �5.77E�04Dissolved Al mg/l 3.06E+01 1.79E�01 �1.85E+01 �4.50E�05 2.43E+00 �1.22E�02Residual Ala mg/l 2.00E+01 6.41E�03 �1.01E+01 1.44E�04 1.31E+00 �1.04E�02Residual Fec mg/l 1.43E+01 �5.51E�02 �6.53E+00 3.46E�04 8.52E�01 �5.70E�03Residual Mna mg/l 5.18E�01 �4.79E�03 �5.11E�01 4.20E�05 6.02E�02 �1.28E�03
a Logarithmic transformation Log10(Y).b Negative logarithmic transformation –Log10(100 � Y).c Logarithmic transformation Log10(Y+0.001).
22 M. Vepsäläinen et al. / Separation and Purification Technology 99 (2012) 20–27
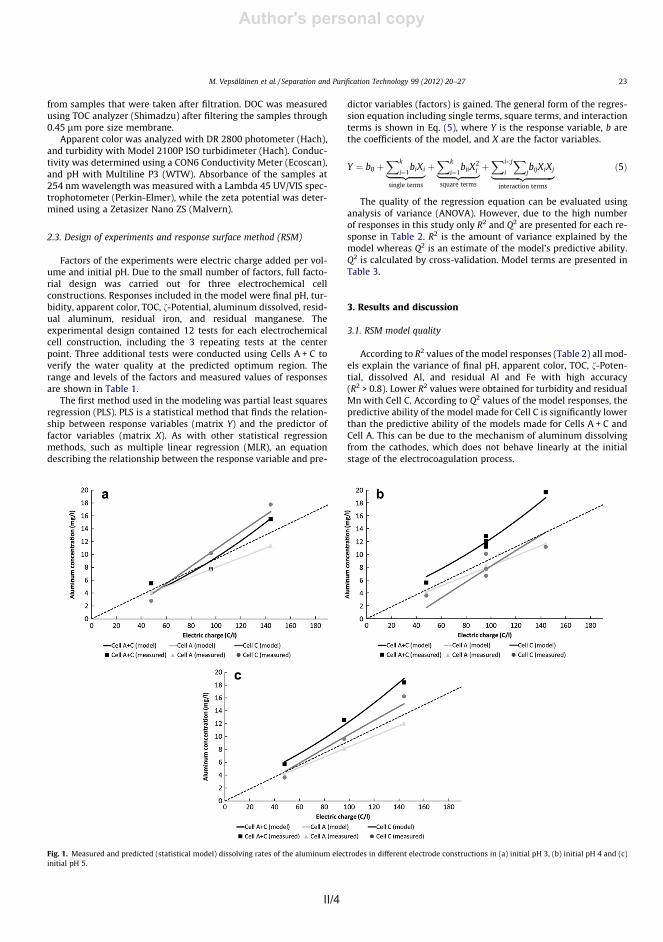
II/4 II/5
Author's personal copy
3.2. Aluminum dissolved from the electrodes and metal residuals aftertreatment
Measured and predicted aluminum concentrations of the sam-ples after EC treatment are shown in Fig. 1. The highest aluminumconcentrations per electric charge were measured for Cells A + Cwhen initial pH was 4 and 5. However, in initial pH 3 the highestdissolved aluminum concentrations with 96 C/l and 144 C/l weremeasured for Cell C. It is possible that at very low pH the chemicaldissolution of aluminum from all electrode plates (Eq. (6)) occurssimultaneously with Eq. (1).
2AlðsÞ þ 6Hþ ! 2Al3þðaqÞ þ 3H2 ð6Þ
There were small variations in the initial delay before the elec-tric current was switched on, but the fact that the electrodes wereimmersed in the solution or on the metal surface state could ex-plain the difference measured between the aluminum concentra-tions obtained with Cells A + C and Cell C in pH 3. According toSasson et al. iron electrodes are significantly corroded withoutelectricity at pH < 8 [22]. In this study, aluminum electrodes wereused and dissolution rate of electrodes in the solution withoutelectricity was not measured. However, it is well known that alu-minum corrodes when pH is either acidic or alkaline [23]. Alumi-num is naturally passive because continuous protecting alumina(Al2O3) layer is formed on the surface. This layer protects alumi-num efficiently at the pH range 4–8. In higher and lower pH envi-ronment, alumina layer dissolves at considerable rate. Thecorrosion behavior of aluminum depends also on the other param-eters of solution, such as the concentration of anions. Sulphate an-ions are passivating agents and therefore reduce the production ofmetal cations [24]. Chlorides, on the other hand, induce the break-down of the passive layer and therefore cause pitting corrosion[23,25]. It is known that passivation and formation of deposits onelectrodes increases the voltage of electrocoagulation systemwhencurrent density is kept constant and hence reduces the power effi-ciency [1]. However, this was not observed in these short batchstudies.
The dissolving of Cell A follows theoretical values calculatedaccording to Faraday’s law of electrolysis (Eq. (7)).
m ¼ ltMw
zFð7Þ
where I is the current density, t is the operation time (s), Mw ismolecular weight of the substance, F is Faraday’s constant(96485 C/mol), z is the number of electrons involved in the reaction(3 for Al3+) and m is the mass of the aluminum dissolved.
When the initial pH was 3, aluminum concentrations dissolvedfrom Cells A + C and Cell C were close to theoretical values (Fig. 1a).
With the higher initial pH, theoretical values were different tomeasured values for Cells A + C and Cell C (Fig. 1b and c). Faraday’slaw only considers direct electrolysis reactions occurring at theelectrodes, e.g. dissolving of aluminum from anodes. The dissolu-tion reaction rate is nearly constant in all cases in the range of vari-ables studied, except in pH 3 with Cells A + C. With initial pH 3 and4, linear fits of Cell C and Cells A + C results cross the X-axis at 0–10 C/l range, whereas linear fits of Cell A cross the X-axis almostat the 0 C/l (origin). This indicates that there is a short lag periodbefore aluminum dissolving at the cathodes initiates in low pH.Aluminum cathodes dissolve chemically due to local high pH envi-ronment at the electrode surface that is formed when hydroxyl-ions form according to Eq. (3). Hence in low pH environment atthe initial stage, hydroxyl ions are consumed by acidic water closethe electrode surface which may cause this lag period in acidicsolution. It is interesting that the aluminum concentration ob-tained with Cells A + C is not the sum of concentrations of Cell Aand Cell C. It is unclear what mechanism inhibits the dissolvingreactions of Cells A + C.
Our results support the conclusion made by Mouedhen et al.[26]. According to their results, no secondary reactions such asoxygen evolution took place at the aluminum anodes. Our resultsverify that the proportion of side-reaction on the aluminum anodesis low or negligible. Moudhen et al. concluded that chemical disso-lution of cathodes contributed significantly to the total amount ofaluminum dissolved into solution. Solution pH increased duringthe treatment. However, in very low pH environment (initial pH2) the alkalinity produced during by cathodic reaction was not suf-ficient to increase the pH of the solution. Solution pH 9 was stableduring treatment. When the initial pH was very low (pH < 3), lessaluminum was produced on the cathode surface. Current densityalso had a significant influence on the aluminum produced onthe cathode surface. The highest current efficiencies were mea-sured with the lowest current densities. Aluminum dissolved fromthe anode was practically equal to theoretical values and insensi-tive to current density (in the range tested).
Residual metals can cause problems, such as deposition andprocess chemical decomposition, in processes where water is con-sumed. Concentration of residual metals (Al, Fe and Mn) was highin EC treated samples when the final pH of water was low. Thesemetals are highly soluble in acidic and alkaline pH. Neutral amor-phous metal hydroxides, such as Al(OH)3 and Fe(OH)3 are poorlysoluble species [27]. Minimum solubility for Al(OH)3 and Fe(OH)3is in neutral to slightly alkaline pH region. In addition to mono-meric hydrolysis products, also polynuclear species, e.g. Al13[AlO4Al12ðOHÞ7þ24 ] are formed in water. The formation of the hydro-lysis products of Al(III) and Fe(III) are gone through in detail in[27]. Insoluble hydroxides can be removed by sedimentation orfiltration. The residual manganese concentration was low in
Fig. 2. Measured concentration of residual metals (a) iron and (b) aluminum in the samples after electrocoagulation.
24 M. Vepsäläinen et al. / Separation and Purification Technology 99 (2012) 20–27
Author's personal copy
from samples that were taken after filtration. DOC was measuredusing TOC analyzer (Shimadzu) after filtering the samples through0.45 lm pore size membrane.
Apparent color was analyzed with DR 2800 photometer (Hach),and turbidity with Model 2100P ISO turbidimeter (Hach). Conduc-tivity was determined using a CON6 Conductivity Meter (Ecoscan),and pH with Multiline P3 (WTW). Absorbance of the samples at254 nm wavelength was measured with a Lambda 45 UV/VIS spec-trophotometer (Perkin-Elmer), while the zeta potential was deter-mined using a Zetasizer Nano ZS (Malvern).
2.3. Design of experiments and response surface method (RSM)
Factors of the experiments were electric charge added per vol-ume and initial pH. Due to the small number of factors, full facto-rial design was carried out for three electrochemical cellconstructions. Responses included in the model were final pH, tur-bidity, apparent color, TOC, f-Potential, aluminum dissolved, resid-ual aluminum, residual iron, and residual manganese. Theexperimental design contained 12 tests for each electrochemicalcell construction, including the 3 repeating tests at the centerpoint. Three additional tests were conducted using Cells A + C toverify the water quality at the predicted optimum region. Therange and levels of the factors and measured values of responsesare shown in Table 1.
The first method used in the modeling was partial least squaresregression (PLS). PLS is a statistical method that finds the relation-ship between response variables (matrix Y) and the predictor offactor variables (matrix X). As with other statistical regressionmethods, such as multiple linear regression (MLR), an equationdescribing the relationship between the response variable and pre-
dictor variables (factors) is gained. The general form of the regres-sion equation including single terms, square terms, and interactionterms is shown in Eq. (5), where Y is the response variable, b arethe coefficients of the model, and X are the factor variables.
Y ¼ b0 þXk
i¼1biXi|fflfflfflfflfflffl{zfflfflfflfflfflffl}
single terms
þXk
i¼1biiX
2i|fflfflfflfflfflfflffl{zfflfflfflfflfflfflffl}
square terms
þXi<j
i
XjbijXiXj|fflfflfflfflfflfflfflfflfflfflfflfflffl{zfflfflfflfflfflfflfflfflfflfflfflfflffl}
interaction terms
ð5Þ
The quality of the regression equation can be evaluated usinganalysis of variance (ANOVA). However, due to the high numberof responses in this study only R2 and Q2 are presented for each re-sponse in Table 2. R2 is the amount of variance explained by themodel whereas Q2 is an estimate of the model’s predictive ability.Q2 is calculated by cross-validation. Model terms are presented inTable 3.
3. Results and discussion
3.1. RSM model quality
According to R2 values of the model responses (Table 2) all mod-els explain the variance of final pH, apparent color, TOC, f-Poten-tial, dissolved Al, and residual Al and Fe with high accuracy(R2 > 0.8). Lower R2 values were obtained for turbidity and residualMn with Cell C. According to Q2 values of the model responses, thepredictive ability of the model made for Cell C is significantly lowerthan the predictive ability of the models made for Cells A + C andCell A. This can be due to the mechanism of aluminum dissolvingfrom the cathodes, which does not behave linearly at the initialstage of the electrocoagulation process.
Fig. 1. Measured and predicted (statistical model) dissolving rates of the aluminum electrodes in different electrode constructions in (a) initial pH 3, (b) initial pH 4 and (c)initial pH 5.
M. Vepsäläinen et al. / Separation and Purification Technology 99 (2012) 20–27 23
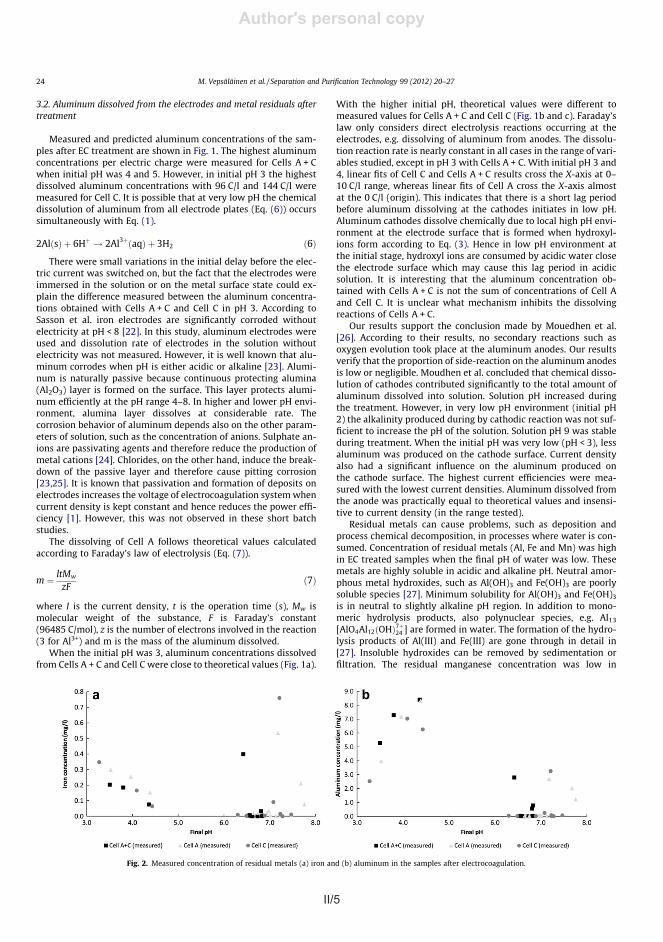
II/5
Author's personal copy
3.2. Aluminum dissolved from the electrodes and metal residuals aftertreatment
Measured and predicted aluminum concentrations of the sam-ples after EC treatment are shown in Fig. 1. The highest aluminumconcentrations per electric charge were measured for Cells A + Cwhen initial pH was 4 and 5. However, in initial pH 3 the highestdissolved aluminum concentrations with 96 C/l and 144 C/l weremeasured for Cell C. It is possible that at very low pH the chemicaldissolution of aluminum from all electrode plates (Eq. (6)) occurssimultaneously with Eq. (1).
2AlðsÞ þ 6Hþ ! 2Al3þðaqÞ þ 3H2 ð6Þ
There were small variations in the initial delay before the elec-tric current was switched on, but the fact that the electrodes wereimmersed in the solution or on the metal surface state could ex-plain the difference measured between the aluminum concentra-tions obtained with Cells A + C and Cell C in pH 3. According toSasson et al. iron electrodes are significantly corroded withoutelectricity at pH < 8 [22]. In this study, aluminum electrodes wereused and dissolution rate of electrodes in the solution withoutelectricity was not measured. However, it is well known that alu-minum corrodes when pH is either acidic or alkaline [23]. Alumi-num is naturally passive because continuous protecting alumina(Al2O3) layer is formed on the surface. This layer protects alumi-num efficiently at the pH range 4–8. In higher and lower pH envi-ronment, alumina layer dissolves at considerable rate. Thecorrosion behavior of aluminum depends also on the other param-eters of solution, such as the concentration of anions. Sulphate an-ions are passivating agents and therefore reduce the production ofmetal cations [24]. Chlorides, on the other hand, induce the break-down of the passive layer and therefore cause pitting corrosion[23,25]. It is known that passivation and formation of deposits onelectrodes increases the voltage of electrocoagulation systemwhencurrent density is kept constant and hence reduces the power effi-ciency [1]. However, this was not observed in these short batchstudies.
The dissolving of Cell A follows theoretical values calculatedaccording to Faraday’s law of electrolysis (Eq. (7)).
m ¼ ltMw
zFð7Þ
where I is the current density, t is the operation time (s), Mw ismolecular weight of the substance, F is Faraday’s constant(96485 C/mol), z is the number of electrons involved in the reaction(3 for Al3+) and m is the mass of the aluminum dissolved.
When the initial pH was 3, aluminum concentrations dissolvedfrom Cells A + C and Cell C were close to theoretical values (Fig. 1a).
With the higher initial pH, theoretical values were different tomeasured values for Cells A + C and Cell C (Fig. 1b and c). Faraday’slaw only considers direct electrolysis reactions occurring at theelectrodes, e.g. dissolving of aluminum from anodes. The dissolu-tion reaction rate is nearly constant in all cases in the range of vari-ables studied, except in pH 3 with Cells A + C. With initial pH 3 and4, linear fits of Cell C and Cells A + C results cross the X-axis at 0–10 C/l range, whereas linear fits of Cell A cross the X-axis almostat the 0 C/l (origin). This indicates that there is a short lag periodbefore aluminum dissolving at the cathodes initiates in low pH.Aluminum cathodes dissolve chemically due to local high pH envi-ronment at the electrode surface that is formed when hydroxyl-ions form according to Eq. (3). Hence in low pH environment atthe initial stage, hydroxyl ions are consumed by acidic water closethe electrode surface which may cause this lag period in acidicsolution. It is interesting that the aluminum concentration ob-tained with Cells A + C is not the sum of concentrations of Cell Aand Cell C. It is unclear what mechanism inhibits the dissolvingreactions of Cells A + C.
Our results support the conclusion made by Mouedhen et al.[26]. According to their results, no secondary reactions such asoxygen evolution took place at the aluminum anodes. Our resultsverify that the proportion of side-reaction on the aluminum anodesis low or negligible. Moudhen et al. concluded that chemical disso-lution of cathodes contributed significantly to the total amount ofaluminum dissolved into solution. Solution pH increased duringthe treatment. However, in very low pH environment (initial pH2) the alkalinity produced during by cathodic reaction was not suf-ficient to increase the pH of the solution. Solution pH 9 was stableduring treatment. When the initial pH was very low (pH < 3), lessaluminum was produced on the cathode surface. Current densityalso had a significant influence on the aluminum produced onthe cathode surface. The highest current efficiencies were mea-sured with the lowest current densities. Aluminum dissolved fromthe anode was practically equal to theoretical values and insensi-tive to current density (in the range tested).
Residual metals can cause problems, such as deposition andprocess chemical decomposition, in processes where water is con-sumed. Concentration of residual metals (Al, Fe and Mn) was highin EC treated samples when the final pH of water was low. Thesemetals are highly soluble in acidic and alkaline pH. Neutral amor-phous metal hydroxides, such as Al(OH)3 and Fe(OH)3 are poorlysoluble species [27]. Minimum solubility for Al(OH)3 and Fe(OH)3is in neutral to slightly alkaline pH region. In addition to mono-meric hydrolysis products, also polynuclear species, e.g. Al13[AlO4Al12ðOHÞ7þ24 ] are formed in water. The formation of the hydro-lysis products of Al(III) and Fe(III) are gone through in detail in[27]. Insoluble hydroxides can be removed by sedimentation orfiltration. The residual manganese concentration was low in
Fig. 2. Measured concentration of residual metals (a) iron and (b) aluminum in the samples after electrocoagulation.
24 M. Vepsäläinen et al. / Separation and Purification Technology 99 (2012) 20–27
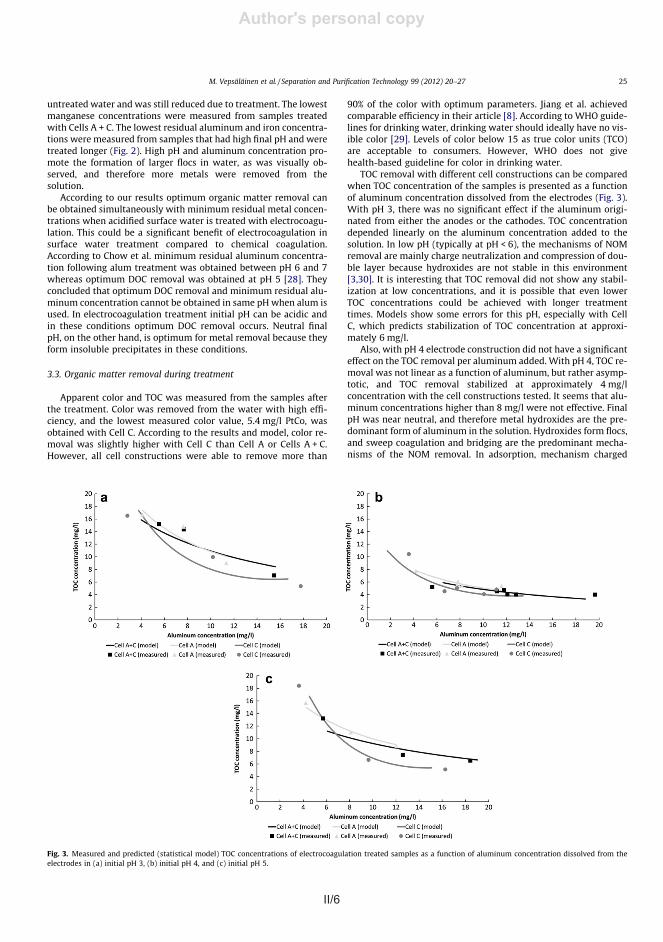
II/6 II/7
Author's personal copy
coagulant species are adsorbed onto the particle surface and theeffective surface charge is reduced. Bridging mechanism occurswhen polynuclear metal hydroxides form bridges between parti-cles, and thus promote the destabilization of NOM. It is likely thatresidual TOC (4 mg/l) is composed mainly of hydrophilic sub-stances, such as fulvic acids, which are not easily removed in neu-tral pH [30].
With pH 5, there was more variation in the results of the differ-ent cells. Slightly better TOC removal per aluminum added wasmeasured from the samples that were treated with Cell C. How-ever, the efficiency of EC treatment was lower with this pH in allcell constructions when compared to pH 4, and more aluminumwas required for the same TOC removal. It also seems that theTOC level stabilizes to a slightly higher TOC level (5 mg/l) thanwith pH 4 (4 mg/l). It possible that the mechanism of NOM removalchanged even further from charge neutralization and double layercompression to adsorption and bridging mechanisms, which wereunable to remove hydrophilic colloids from the water.
f-Potential of the filtered samples was measured (Fig. 4). Theseresults support the previously mentioned findings. With pH 3, thealuminum has a higher charge (Al3+) due to lack of hydrolysis. Thisaffects NOM destabilization through double layer repression. f-Po-tential in initial pH 3 increased linearly with increasing aluminumconcentration. With this pH, small precipitates are formed that arenot easily removed with sedimentation, flotation, or filtration.According to f-Potential results, it seems that with this pH no spe-cific NOM fraction was enriched to filtered samples. When alumi-num concentration was over 12 mg/l f-Potential was over 0 mV,which may cause restabilization of colloids. f-Potentials of thesamples with initial pH 4 and 5 were similar after filtration. Inthese pH’s aluminum exists predominantly as hydroxides and eas-ily settleable or filterable flocs are formed. It seems that highlycharged, and probably hydrophilic, NOM fraction was enrichedinto the samples during the treatment. According to f-Potential re-sults, the same NOM fractions were removed whether aluminumwas dissolved from the anodes or the cathodes. However, thisshould be verified with research where composition of the remain-ing NOM fraction is studied.
Three additional tests were done with optimum parameters ofCell C (Table 4). The initial pH in these tests was 4.1 and the electriccharge per volume was 115 C/l. Results were similar to results atthe center point of the mode, which was expected because the fac-tor values were close to each other. The model predicts a TOC valueof 4.04 mg/l, which is slightly lower than the measured value. Thepredicted final pH was 7.1, which is slightly higher than the mea-sured value. The predicted aluminum concentration dissolved fromthe electrodes was 9.97 mg/l, whereas the measured aluminumconcentration was 7.90–9.52 mg/l. Turbidity, color, and residualmetal concentrations were close to predicted values. Accordingto the results of these verification tests, the model predicts waterquality parameters with high accuracy.
4. Conclusions
This study analyzed the effect of electrocoagulation cell con-struction on NOM removal. Three types of cells were studied:one that only had aluminum electrodes, one that had aluminumanodes and inert cathodes, and one that had inert anodes and alu-minum cathodes. Besides the TOC concentration of the water, theother main parameters measured were final pH, turbidity, color,and concentration of residual metals of the water produced. Amodel was made from the results of each cell construction usingPLS regression. The model quality was high for the most of the re-sponses. The following conclusions can be made from the results:
� Aluminum dissolved from the Cells A + Chat was constructedfrom aluminum anodes and inert cathodes followed theoreticalvalues calculated according to Faraday’s law.
� Aluminum dissolved from the cathodes did not follow electriccharge per volume linearly. Low initial pH (pH 3) decreasedthe dissolving reaction rate, probably because the hydroxyl ionsproduced were consumed by the acidic water.
� Low residual metals concentrations (Al, Fe, Mn) were measuredfrom the samples when the final pH was high and treatmenttime was long and hence aluminum concentration was high.
� The efficiency of aluminum in TOC removal was similar in allcell constructions in the pH range tested. According to theseresults, the efficiency of electrocoagulation cannot be enhancedsignificantly by using either aluminum anodes or cathodes orboth. High TOC removal was measured with all constructionstested.
� When the initial pH was 3, the TOC concentration of the treatedsamples depended linearly on aluminum added to the solution.In pH 4 and 5, the TOC removal per added aluminum followedasymptotic regression. This is probably due to the transitionof the destabilization mechanism of colloids from double layercompression to adsorption and bridging. This conclusion wassupported by the f-Potential results.
The results of this research indicate that reactions betweenNOM and aluminum occur in the bulk water and not on the elec-trode surface. It seems that destabilization mechanisms of NOMare similar compared to chemical coagulation. According to our re-sults, optimum organic matter can be obtained simultaneously
Fig. 4. Measured f-Potentials of the samples after electrocoagulation and filtration.
Table 4Measured water quality parameters of the samples from the additional repeating tests. Initial pH was 4.1 and electric charge per volume was 115 C/l.
Responses
Final pH Turbidity (NTU) Apparent color (mg/l PtCo) TOC (mg/l) Dissolved Al (mg/l) Residual Al (mg/l) Residual Fe (mg/l) Residual Mn (mg/l)
5.95 0.92 6.1 4.61 7.904 0.0518 0.0018 0.01876.39 1.22 7.3 4.48 9.520 0.0235 0.0024 0.02106.29 1.09 6.6 4.29 8.357 0.0184 0.0015 0.0228
26 M. Vepsäläinen et al. / Separation and Purification Technology 99 (2012) 20–27
Author's personal copy
untreated water and was still reduced due to treatment. The lowestmanganese concentrations were measured from samples treatedwith Cells A + C. The lowest residual aluminum and iron concentra-tions were measured from samples that had high final pH and weretreated longer (Fig. 2). High pH and aluminum concentration pro-mote the formation of larger flocs in water, as was visually ob-served, and therefore more metals were removed from thesolution.
According to our results optimum organic matter removal canbe obtained simultaneously with minimum residual metal concen-trations when acidified surface water is treated with electrocoagu-lation. This could be a significant benefit of electrocoagulation insurface water treatment compared to chemical coagulation.According to Chow et al. minimum residual aluminum concentra-tion following alum treatment was obtained between pH 6 and 7whereas optimum DOC removal was obtained at pH 5 [28]. Theyconcluded that optimum DOC removal and minimum residual alu-minum concentration cannot be obtained in same pHwhen alum isused. In electrocoagulation treatment initial pH can be acidic andin these conditions optimum DOC removal occurs. Neutral finalpH, on the other hand, is optimum for metal removal because theyform insoluble precipitates in these conditions.
3.3. Organic matter removal during treatment
Apparent color and TOC was measured from the samples afterthe treatment. Color was removed from the water with high effi-ciency, and the lowest measured color value, 5.4 mg/l PtCo, wasobtained with Cell C. According to the results and model, color re-moval was slightly higher with Cell C than Cell A or Cells A + C.However, all cell constructions were able to remove more than
90% of the color with optimum parameters. Jiang et al. achievedcomparable efficiency in their article [8]. According to WHO guide-lines for drinking water, drinking water should ideally have no vis-ible color [29]. Levels of color below 15 as true color units (TCO)are acceptable to consumers. However, WHO does not givehealth-based guideline for color in drinking water.
TOC removal with different cell constructions can be comparedwhen TOC concentration of the samples is presented as a functionof aluminum concentration dissolved from the electrodes (Fig. 3).With pH 3, there was no significant effect if the aluminum origi-nated from either the anodes or the cathodes. TOC concentrationdepended linearly on the aluminum concentration added to thesolution. In low pH (typically at pH < 6), the mechanisms of NOMremoval are mainly charge neutralization and compression of dou-ble layer because hydroxides are not stable in this environment[3,30]. It is interesting that TOC removal did not show any stabil-ization at low concentrations, and it is possible that even lowerTOC concentrations could be achieved with longer treatmenttimes. Models show some errors for this pH, especially with CellC, which predicts stabilization of TOC concentration at approxi-mately 6 mg/l.
Also, with pH 4 electrode construction did not have a significanteffect on the TOC removal per aluminum added. With pH 4, TOC re-moval was not linear as a function of aluminum, but rather asymp-totic, and TOC removal stabilized at approximately 4 mg/lconcentration with the cell constructions tested. It seems that alu-minum concentrations higher than 8 mg/l were not effective. FinalpH was near neutral, and therefore metal hydroxides are the pre-dominant form of aluminum in the solution. Hydroxides form flocs,and sweep coagulation and bridging are the predominant mecha-nisms of the NOM removal. In adsorption, mechanism charged
Fig. 3. Measured and predicted (statistical model) TOC concentrations of electrocoagulation treated samples as a function of aluminum concentration dissolved from theelectrodes in (a) initial pH 3, (b) initial pH 4, and (c) initial pH 5.
M. Vepsäläinen et al. / Separation and Purification Technology 99 (2012) 20–27 25
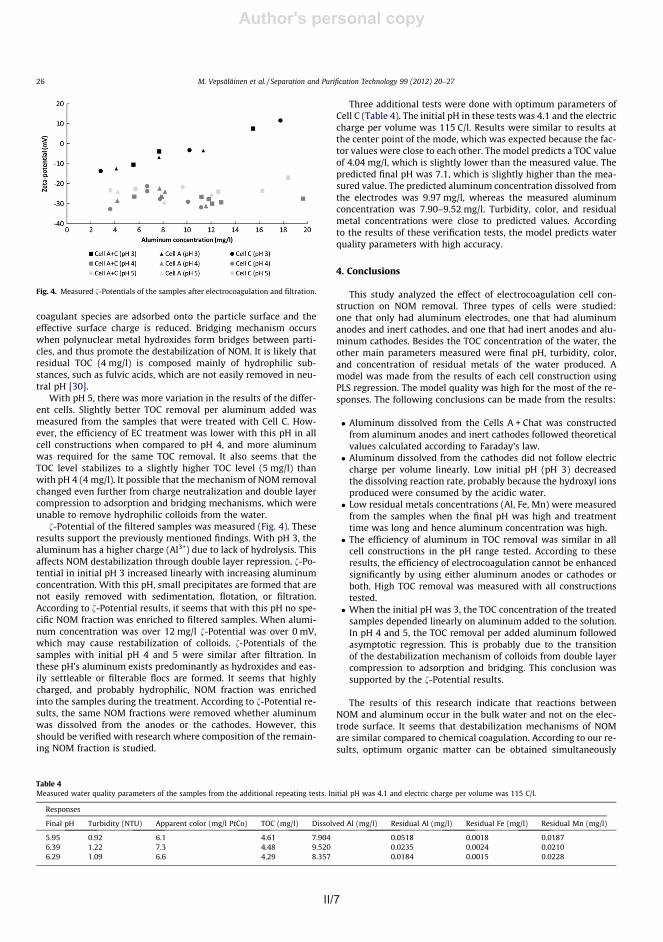
II/7
Author's personal copy
coagulant species are adsorbed onto the particle surface and theeffective surface charge is reduced. Bridging mechanism occurswhen polynuclear metal hydroxides form bridges between parti-cles, and thus promote the destabilization of NOM. It is likely thatresidual TOC (4 mg/l) is composed mainly of hydrophilic sub-stances, such as fulvic acids, which are not easily removed in neu-tral pH [30].
With pH 5, there was more variation in the results of the differ-ent cells. Slightly better TOC removal per aluminum added wasmeasured from the samples that were treated with Cell C. How-ever, the efficiency of EC treatment was lower with this pH in allcell constructions when compared to pH 4, and more aluminumwas required for the same TOC removal. It also seems that theTOC level stabilizes to a slightly higher TOC level (5 mg/l) thanwith pH 4 (4 mg/l). It possible that the mechanism of NOM removalchanged even further from charge neutralization and double layercompression to adsorption and bridging mechanisms, which wereunable to remove hydrophilic colloids from the water.
f-Potential of the filtered samples was measured (Fig. 4). Theseresults support the previously mentioned findings. With pH 3, thealuminum has a higher charge (Al3+) due to lack of hydrolysis. Thisaffects NOM destabilization through double layer repression. f-Po-tential in initial pH 3 increased linearly with increasing aluminumconcentration. With this pH, small precipitates are formed that arenot easily removed with sedimentation, flotation, or filtration.According to f-Potential results, it seems that with this pH no spe-cific NOM fraction was enriched to filtered samples. When alumi-num concentration was over 12 mg/l f-Potential was over 0 mV,which may cause restabilization of colloids. f-Potentials of thesamples with initial pH 4 and 5 were similar after filtration. Inthese pH’s aluminum exists predominantly as hydroxides and eas-ily settleable or filterable flocs are formed. It seems that highlycharged, and probably hydrophilic, NOM fraction was enrichedinto the samples during the treatment. According to f-Potential re-sults, the same NOM fractions were removed whether aluminumwas dissolved from the anodes or the cathodes. However, thisshould be verified with research where composition of the remain-ing NOM fraction is studied.
Three additional tests were done with optimum parameters ofCell C (Table 4). The initial pH in these tests was 4.1 and the electriccharge per volume was 115 C/l. Results were similar to results atthe center point of the mode, which was expected because the fac-tor values were close to each other. The model predicts a TOC valueof 4.04 mg/l, which is slightly lower than the measured value. Thepredicted final pH was 7.1, which is slightly higher than the mea-sured value. The predicted aluminum concentration dissolved fromthe electrodes was 9.97 mg/l, whereas the measured aluminumconcentration was 7.90–9.52 mg/l. Turbidity, color, and residualmetal concentrations were close to predicted values. Accordingto the results of these verification tests, the model predicts waterquality parameters with high accuracy.
4. Conclusions
This study analyzed the effect of electrocoagulation cell con-struction on NOM removal. Three types of cells were studied:one that only had aluminum electrodes, one that had aluminumanodes and inert cathodes, and one that had inert anodes and alu-minum cathodes. Besides the TOC concentration of the water, theother main parameters measured were final pH, turbidity, color,and concentration of residual metals of the water produced. Amodel was made from the results of each cell construction usingPLS regression. The model quality was high for the most of the re-sponses. The following conclusions can be made from the results:
� Aluminum dissolved from the Cells A + Chat was constructedfrom aluminum anodes and inert cathodes followed theoreticalvalues calculated according to Faraday’s law.
� Aluminum dissolved from the cathodes did not follow electriccharge per volume linearly. Low initial pH (pH 3) decreasedthe dissolving reaction rate, probably because the hydroxyl ionsproduced were consumed by the acidic water.
� Low residual metals concentrations (Al, Fe, Mn) were measuredfrom the samples when the final pH was high and treatmenttime was long and hence aluminum concentration was high.
� The efficiency of aluminum in TOC removal was similar in allcell constructions in the pH range tested. According to theseresults, the efficiency of electrocoagulation cannot be enhancedsignificantly by using either aluminum anodes or cathodes orboth. High TOC removal was measured with all constructionstested.
� When the initial pH was 3, the TOC concentration of the treatedsamples depended linearly on aluminum added to the solution.In pH 4 and 5, the TOC removal per added aluminum followedasymptotic regression. This is probably due to the transitionof the destabilization mechanism of colloids from double layercompression to adsorption and bridging. This conclusion wassupported by the f-Potential results.
The results of this research indicate that reactions betweenNOM and aluminum occur in the bulk water and not on the elec-trode surface. It seems that destabilization mechanisms of NOMare similar compared to chemical coagulation. According to our re-sults, optimum organic matter can be obtained simultaneously
Fig. 4. Measured f-Potentials of the samples after electrocoagulation and filtration.
Table 4Measured water quality parameters of the samples from the additional repeating tests. Initial pH was 4.1 and electric charge per volume was 115 C/l.
Responses
Final pH Turbidity (NTU) Apparent color (mg/l PtCo) TOC (mg/l) Dissolved Al (mg/l) Residual Al (mg/l) Residual Fe (mg/l) Residual Mn (mg/l)
5.95 0.92 6.1 4.61 7.904 0.0518 0.0018 0.01876.39 1.22 7.3 4.48 9.520 0.0235 0.0024 0.02106.29 1.09 6.6 4.29 8.357 0.0184 0.0015 0.0228
26 M. Vepsäläinen et al. / Separation and Purification Technology 99 (2012) 20–27
II/8 III/1
Author's personal copy
with minimum residual metal concentrations when surface wateris treated with electrocoagulation. The potential applications ofwater after the treatment could be potable water or industrialfresh water.
Acknowledgements
We would like to thank Savcor Forest Oy, the city of Mikkeli,and the European Union for financial support for this research.The authors would like to thank Eveliina Repo for conducting themetal analyses.
References
[1] G. Chen, Electrochemical technologies in wastewater treatment, Sep. Purif.Technol. 38 (2004) 11–41.
[2] M.M. Emamjomeh, M. Sivakumar, Review of pollutants removed byelectrocoagulation and electrocoagulation/flotation processes, J. Environ.Manage. 90 (2009) 1663–1679.
[3] H. Liu, X. Zhao, J. Qu, Electrocoagulation in Water Treatment, in: C.Comninellis, G. Chen (Eds.), Electrochemistry for the Environment, Springer,New York, 2010, pp. 245–262.
[4] M.S.K.A. Sarkar, G.M. Evans, S.W. Donne, Bubble size measurement inelectroflotation, Miner. Eng. 23 (2010) 1058–1065.
[5] M.Y.A. Mollah, R. Schennach, J.R. Parga, D.L. Cocke, Electrocoagulation (EC) –science and applications, J. Hazard. Mater. 84 (2001) 29–41.
[6] G. Chen, Y. Hung, Electrochemical Wastewater Treatment Processes, in: L.K.Wang, Y. Hung, N.K. Shammas (Eds.), Advanced Physicochemical TreatmentTechnologies, Humana Press, 2007, pp. 57–106.
[7] M.H. El-Masry, O.M. Sadek, W.K. Mekhemer, Purification of raw surface waterusing electro-coagulation method, Water, Air, Soil, Pollut. 158 (2004) 373–385.
[8] J. Jiang, N. Graham, C. André, G.H. Kelsall, N. Brandon, Laboratory study ofelectro-coagulation–flotation for water treatment, Water Res. 36 (2002) 4064–4078.
[9] A.S. Koparal, Y.S�. Yildiz, B. Keskinler, N. Demircioglu, Effect of initial pH on theremoval of humic substances from wastewater by electrocoagulation, Sep.Purif. Technol. 59 (2008) 175–182.
[10] C. Ricordel, A. Darchen, D. Hadjiev, Electrocoagulation–electroflotation as asurface water treatment for industrial uses, Sep. Purif. Technol. 74 (2010) 342–347.
[11] M. Vepsäläinen, M. Ghiasvand, J. Selin, J. Pienimaa, E. Repo, M. Pulliainen, M.Sillanpää, Investigations of the effects of temperature and initial sample pH onnatural organic matter (NOM) removal with electrocoagulation using responsesurface method (RSM), Sep. Purif. Technol. 69 (2009) 255–261.
[12] M. Vepsäläinen, J. Selin, M. Pulliainen, M. Sillanpää, Combinedelectrocoagulation and chemical coagulation of paper mill mechanicallycleaned water, J. Pulp Pap. Sci. 33 (2007) 233–239.
[13] E.A. Vik, D.A. Carlson, A.S. Eikum, E.T. Gjessing, Electrocoagulation of potablewater, Water Res. 18 (1984) 1355–1360.
[14] Y.S. Yildiz, A.S. Koparal, B. Keskinler, Effect of initial pH and supportingelectrolyte on the treatment of water containing high concentration of humicsubstances by electrocoagulation, Chem. Eng. J. 138 (2008) 63–72.
[15] Y.S. Yildiz, A.S. Koparal, S. Irdemez, B. Keskinler, Electrocoagulation ofsynthetically prepared waters containing high concentration of NOM usingiron cast electrodes, J. Hazard. Mater. 139 (2007) 373–380.
[16] A. Matilainen, M. Vepsäläinen, M. Sillanpää, Natural organic matter removal bycoagulation during drinking water treatment: a review, Adv. Colloid InterfaceSci. 159 (2010) 189–197.
[17] M. Vepsäläinen, H. Kivisaari, M. Pulliainen, A. Oikari, M. Sillanpää, Removal oftoxic pollutants from pulp mill effluents by electrocoagulation, Sep. Purif.Technol. 81 (2011) 141–150.
[18] M. Tir, N. Moulai-Mostefa, Optimization of oil removal from oily wastewaterby electrocoagulation using response surface method, J. Hazard. Mater. 158(2008) 107–115.
[19] A. Aleboyeh, N. Daneshvar, M.B. Kasiri, Optimization of C.I. Acid Red 14 azo dyeremoval by electrocoagulation batch process with response surfacemethodology, Chem. Eng. Process. 47 (2007) 827–832.
[20] M.S. Bhatti, A.S. Reddy, A.K. Thukral, Electrocoagulation removal of Cr(VI) fromsimulated wastewater using response surface methodology, J. Hazard. Mater.172 (2009) 839–846.
[21] T. Ölmez, The optimization of Cr(VI) reduction and removal byelectrocoagulation using response surface methodology, J. Hazard. Mater.162 (2008) 1371–1378.
[22] M.B. Sasson, W. Calmano, A. Adin, Iron-oxidation processes in anelectroflocculation (electrocoagulation) cell, J. Hazard. Mater. 171 (2009)704–709.
[23] C. Vargel, Corrosion of Aluminium, Elsevier Ltd., The Netherlands, 2004.[24] A. Kolics, J.C. Polkinghorne, A. Wieckowski, Adsorption of sulfate and chloride
ions on aluminum, Electrochim. Acta 43 (1998) 2605–2618.[25] J.L. Trompette, H. Vergnes, On the crucial influence of some supporting
electrolytes during electrocoagulation in the presence of aluminum electrodes,J. Hazard. Mater. 163 (2009) 1282–1288.
[26] G. Mouedhen, M. Feki, M.D.P. Wery, H.F. Ayedi, Behavior of aluminumelectrodes in electrocoagulation process, J. Hazard. Mater. 150 (2008) 124–135.
[27] J. Duan, J. Gregory, Coagulation by hydrolysing metal salts, Adv. ColloidInterface Sci. 100–102 (2003) 475–502.
[28] C.W.K. Chow, J.A. van Leeuwen, R. Fabris, M. Drikas, Optimised coagulationusing aluminium sulfate for the removal of dissolved organic carbon,Desalination 245 (2009) 120–134.
[29] Guidelines for Drinking-Water Quality, fourth ed., World Health Organization,Malta, 2011.
[30] J. Bratby, Coagulation and Flocculation in Water and Wastewater Treatment,second ed., IWA Publishing, London, 2006.
M. Vepsäläinen et al. / Separation and Purification Technology 99 (2012) 20–27 27
III/1
PUBLICATION III
Investigations of the effects of temperature and initial
sample pH on natural organic matter (NOM) removal with
electrocoagulation using response surface method
(RSM)
In: Sep. Purif. Technol. 2009, 69, pp. 255–261.Copyright 2009 Elsevier.
Reprinted with permission from the publisher.

III/1
III/1
Separation and Purification Technology 69 (2009) 255–261
Contents lists available at ScienceDirect
Separation and Purification Technology
journa l homepage: www.e lsev ier .com/ locate /seppur
Investigations of the effects of temperature and initial sample pH on naturalorganic matter (NOM) removal with electrocoagulation using response surfacemethod (RSM)
Mikko Vepsäläinena,b,∗, Mohammad Ghiasvandb, Jukka Selinc, Jorma Pienimaac,Eveliina Repoa, Martti Pulliainend, Mika Sillanpääa
a Laboratory of Applied Environmental Chemistry, Department of Environmental Sciences, University of Kuopio, Patteristonkatu 1, FIN-50100 Mikkeli, Finlandb Savcor Forest Oy, Insinöörinkatu 8, FIN-50100 Mikkeli, Finlandc UPM-Kymmene Oyj, P.O. Box 35, FIN-42301 Jämsänkoski, Finlandd Savcor Group Oy, Insinöörinkatu 8, FIN-50100 Mikkeli, Finland
a r t i c l e i n f o
Article history:Received 11 May 2009Received in revised form 3 August 2009Accepted 4 August 2009
Keywords:ElectrocoagulationResponse surface methodWater treatment
a b s t r a c t
The removal of natural organic matter (NOM) from surface water by electrocoagulation (EC) was stud-ied using response surface method (RSM). Factors used in the empirical model were electric charge perliter, initial pH and temperature. Relevant square and interaction terms of factors were studied. Based onanalysis of variance (ANOVA), the model fitted well with dissolved organic carbon (DOC) reduction, alu-minum dissolving and pH changes. UV 254 nm absorbance removal was moderately predicted. Accordingto results, temperature affected significantly the dissolving rate of aluminum electrodes. Initial DOC con-centration of the surface water was 18.35 mg/l. Maximum DOC removal of 80.4% was obtained when highelectric charge per liter (144 C/l), low pH (4.3) and high temperature (295.15 K) were used. However, highDOC removal of 76.2% was predicted also when water temperature was only 275.15 K. Effect of tempera-ture on NOM removal was minor as compared to the effects of electric charge per volume and the initialpH. EC neutralized pH during the EC treatment and had little impact on the conductivity of the water.According to the results, EC can be used for NOM removal during cold water period in Nordic countries.
© 2009 Elsevier B.V. All rights reserved.
1. Introduction
Surface water in Nordic region typically contains a high con-centration of natural organic matter (NOM), which gives water itsbrown color. Efficient removal of NOM is required for drinking andindustrial water applications. In the drinking water, high NOM con-centration causes formation of disinfection by-products (DBP) thatare carcinogenic. In the industrial applications, such as paper mak-ing process, NOM can cause fouling of the surfaces, resulting in thedefects in the end-product quality [1].
Basically, NOM is a complex mixture of different organicmaterials such as bacteria, viruses, humic acids, fulvic acids,polysaccharides and proteins. Dissolved organic matter (DOM) isdefined to be a part of the NOM that passes through 0.45 �mpore size membrane. Normal coagulation process in combinationwith flotation or sedimentation can easily remove the high molec-
∗ Corresponding author at: Laboratory of Applied Environmental Chemistry,Department of Environmental Sciences, University of Kuopio, Patteristonkatu 1,FIN-50100 Mikkeli, Finland. Tel.: +358 40 706 4995; fax: +358 15 355 6513.
E-mail address: [email protected] (M. Vepsäläinen).
ular weight fraction but it has limited effect on small molecularweight fraction [2,3]. Hydrophopic NOM has a higher charge den-sity than hydrophilic NOM and is therefore more easily removedduring coagulation treatment [4]. Humic acid fraction (HAF) ofNOM has a higher amount of aromatic structures and therefore, ismore hydrophobic than fulvic acid fraction (FAF) [5,6]. Typicallywater containing high DOM concentration is commonly treatedwith enhanced coagulation where a high dose of coagulant is usedtogether with acidic pH [7].
In electrocoagulation (EC), coagulant is added from electrodesand concurrently beneficial side-reactions, such as pH change andhydrogen bubble formation, take place. Near electrode surface pHdiffers from the solution pH. Aluminum ions formed during thecorrosion of the aluminum at the anode [Eq. (1)] go through hydrol-ysis reactions [Eq. (2)] and pH at the vicinity of the anode surfacedecreases.
Al(s) → Al3+(aq) + 3e− (1)
Al3+(aq) + nH2O ↔ Al(OH)n3−n + nH+(aq) (2)
At the cathode, surface pH increases due to hydrogen evolution[Eq. (3)]. The increment of the pH at the cathode surface leads to the
1383-5866/$ – see front matter © 2009 Elsevier B.V. All rights reserved.doi:10.1016/j.seppur.2009.08.001
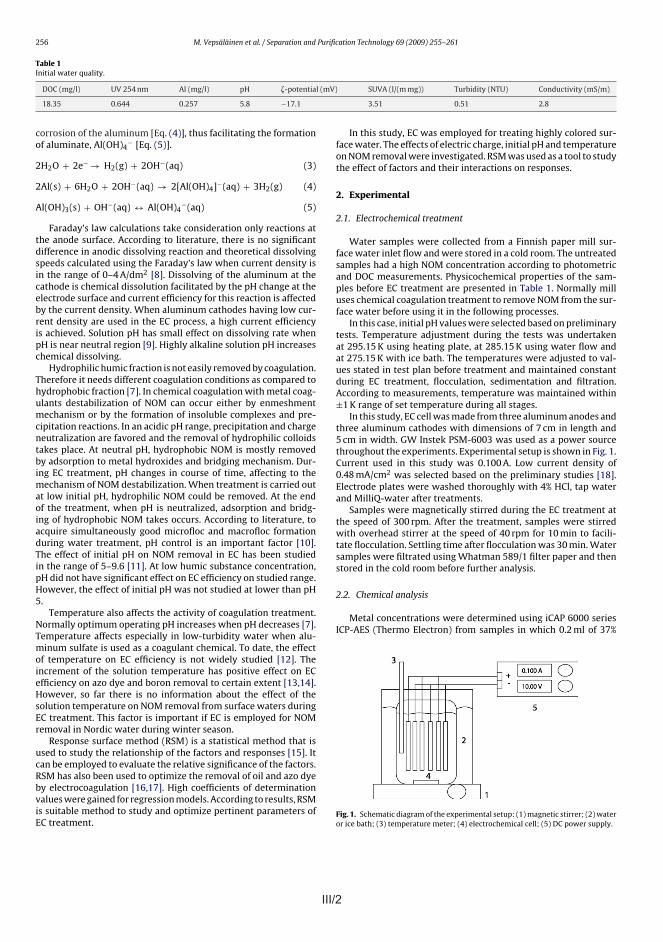
III/2 III/3
M. Vepsäläinen et al. / Separation and Purification Technology 69 (2009) 255–261 257
HNO3 (analytical grade) was added to 10 ml of sample. DOC wasmeasured using TOC analyzer (Shimadzu) after filtering the sam-ples through 0.45 �m pore size membrane.
Apparent color was analyzed with DR 2800 photometer (Hach)and turbidity with Model 2100P ISO turbidimeter (Hach). Conduc-tivity was determined using CON6 conductivity-meter (Ecoscan)and pH with Multiline P3 (WTW). Absorbance of the samplesat 254 nm wavelength was measured with Lambda 45 UV/VIS-spectrophotometer (PerkinElmer), while the zeta-potential wasdetermined using Zetasizer Nano ZS (Malvern).
2.3. Design of experiments and response surface method (RSM)
Multiple linear regression (MLR) was selected as regressionmethod (Umetrics MODDE 8.0) in this study. Design of the exper-iments was done using full factorial design. Factors of the RSMmodel were electric charge added per volume, temperature andinitial pH. Electric charge per volume controls the amount of elec-trochemical reactions taking place on the electrode surface. InitialpH was selected because pH has significant effect on coagulationefficiency and optimum coagulation pH may vary with tempera-ture as stated in Section 1. Effect of temperature is important factorbecause water temperature changes significantly especially in theNordic countries. Flocculation parameters were not included in thefactors to keep the amount of samples in reasonable level. Rangeand levels of factors are presented in Table 2.
Responses included in the model were removal efficiency (R%) ofDOC and UV 254 nm absorbance, total aluminum added, pH changeduring the EC treatment and zeta-potential of the filtered samplesafter treatment. Removal efficiencies were calculated according toEq. (6).
Removal efficiency (R%) =(
C0 − CEC
C0
)× 100 (6)
Table 2Factor levels of full factorial design.
Variable Factor range and levels
−1 0 1
X1, Electric charge (C/l) 48 96 144X2, Initial pH 4 5 6X3, Temperature (K) 275.15 285.15 295.15
C0 and CEC are the initial and the final concentration before andafter the EC treatment.
Current efficiency for aluminum dissolving was calculatedaccording to Eq. (7).
Current efficiency(CE%) = CEC
CFL× 100 (7)
CEC is the concentration of aluminum predicted by the RSMmodel, while CFL is the concentration of aluminum added accordingto the Faraday’s law. Accuracy of the RSM prediction of aluminumdissolving is presented in Section 3.
Q2 was calculated using a predicted sum of the squares (PRESS)from the cross-validation and the total sum of the squares of Ycorrected for the mean (SS) [Eq. (8)].
Q 2 = 1 − PRESSSS
(8)
R2 was the amount of variance explained by the model and ‘R2
adjusted’ was adjusted for the degrees of freedom. Model validitycompared model error to pure error. If model validity was largerthan 0.25, there was no significant lack of fit in the model. Repro-ducibility was calculated from the replications at the center pointsaccording to Eq. (9).
Reproducibility = 1 − MSPure error
MSTotal corrected(9)
Table 3Factors and response values of full factorial design.
Factors Responses Not included in the model
Electriccharge
InitialpH
Temperature DOC(R%)
UV 254 nm(R%)
Al (mg/l) pH change �-potential(mV)
SUVA(l/(m mg))
Turbidity(NTU)
ResidualAl (mg/l)
Conductivity(mS/m)
−1 −1 1 76.0 89.2 8.1 1.64 −11.6 1.59 0.09 0.054 3.60 −1 1 76.3 89.0 19.7 2.40 −9.9 1.63 0.36 0.273 3.31 −1 1 79.0 91.3 40.1 2.52 6.1 1.45 0.19 0.455 3.5
−1 0 1 64.3 78.5 7.3 1.49 −16.4 2.12 0.27 0.239 3.60 0 1 71.0 84.9 20.9 1.88 −10.1 1.83 0.36 0.401 3.91 0 1 77.2 89.6 39.9 1.99 3.9 1.60 0.49 0.858 3.3
−1 1 1 28.7 6.0 6.2 −0.12 −20.9 4.63 3.96 5.184 5.20 1 1 65.2 81.9 20.3 0.02 −11.8 1.82 0.49 0.580 3.41 1 1 75.8 88.1 43.0 0.75 1.4 1.73 0.93 1.784 3.0
−1 −1 0 73.8 88.8 7.0 2.48 −12.1 1.50 0.34 0.053 3.40 −1 0 75.7 88.2 16.1 2.94 −12.6 1.71 0.94 0.398 3.11 −1 0 79.1 79.3 34.1 2.65 16.1 3.47 8.88 5.168 3.2
−1 0 0 69.7 87.0 8.1 1.36 −12.2 1.51 0.13 0.027 3.40 0 0 71.8 87.6 17.1 1.38 −14.0 1.55 0.15 0.062 3.01 0 0 77.5 90.2 29.5 2.26 −0.1 1.53 0.42 0.311 3.0
−1 1 0 57.0 69.0 7.5 0.22 −19.4 2.53 1.7 1.107 4.00 1 0 60.5 80.6 18.0 0.73 −18.1 1.73 0.39 0.266 3.01 1 0 71.9 86.4 39.9 0.04 −5.3 1.70 0.96 0.909 3.00 0 0 76.6 85.7 15.5 0.72 2.17 2.15 2.32 1.457 4.40 0 0 74.1 88.6 17.2 0.68 −17.7 1.55 0.56 0.230 3.30 0 0 69.6 85.8 17.1 0.66 −14.4 1.64 0.2 0.070 3.2
−1 −1 −1 73.4 88.1 6.9 1.82 −10.7 1.58 0.45 0.169 3.80 −1 −1 76.8 86.7 13.1 2.08 12.9 2.02 2.41 2.013 3.41 −1 −1 75.8 88.3 26.9 1.85 1.2 1.70 1.71 1.005 3.1
−1 0 −1 69.3 86.2 6.8 0.78 −12.9 1.58 0.14 0.060 3.20 0 −1 75.9 87.1 15.3 1.70 10.9 1.88 2.33 1.804 3.31 0 −1 68.8 85.4 23.5 0.94 −14.8 1.64 0.32 0.141 2.9
−1 1 −1 36.3 31.7 7.5 0.37 −21.2 3.77 2.56 4.023 3.60 1 −1 56.5 69.2 13.8 0.42 −14.3 2.48 1.73 1.962 3.01 1 −1 58.1 84.8 26.9 0.30 −14.2 1.28 0.15 0.132 3.3
256 M. Vepsäläinen et al. / Separation and Purification Technology 69 (2009) 255–261
Table 1Initial water quality.
DOC (mg/l) UV 254 nm Al (mg/l) pH �-potential (mV) SUVA (l/(m mg)) Turbidity (NTU) Conductivity (mS/m)
18.35 0.644 0.257 5.8 −17.1 3.51 0.51 2.8
corrosion of the aluminum [Eq. (4)], thus facilitating the formationof aluminate, Al(OH)4
− [Eq. (5)].
2H2O + 2e− → H2(g) + 2OH−(aq) (3)
2Al(s) + 6H2O + 2OH−(aq) → 2[Al(OH)4]−(aq) + 3H2(g) (4)
Al(OH)3(s) + OH−(aq) ↔ Al(OH)4−(aq) (5)
Faraday’s law calculations take consideration only reactions atthe anode surface. According to literature, there is no significantdifference in anodic dissolving reaction and theoretical dissolvingspeeds calculated using the Faraday’s law when current density isin the range of 0–4 A/dm2 [8]. Dissolving of the aluminum at thecathode is chemical dissolution facilitated by the pH change at theelectrode surface and current efficiency for this reaction is affectedby the current density. When aluminum cathodes having low cur-rent density are used in the EC process, a high current efficiencyis achieved. Solution pH has small effect on dissolving rate whenpH is near neutral region [9]. Highly alkaline solution pH increaseschemical dissolving.
Hydrophilic humic fraction is not easily removed by coagulation.Therefore it needs different coagulation conditions as compared tohydrophobic fraction [7]. In chemical coagulation with metal coag-ulants destabilization of NOM can occur either by enmeshmentmechanism or by the formation of insoluble complexes and pre-cipitation reactions. In an acidic pH range, precipitation and chargeneutralization are favored and the removal of hydrophilic colloidstakes place. At neutral pH, hydrophobic NOM is mostly removedby adsorption to metal hydroxides and bridging mechanism. Dur-ing EC treatment, pH changes in course of time, affecting to themechanism of NOM destabilization. When treatment is carried outat low initial pH, hydrophilic NOM could be removed. At the endof the treatment, when pH is neutralized, adsorption and bridg-ing of hydrophobic NOM takes occurs. According to literature, toacquire simultaneously good microfloc and macrofloc formationduring water treatment, pH control is an important factor [10].The effect of initial pH on NOM removal in EC has been studiedin the range of 5–9.6 [11]. At low humic substance concentration,pH did not have significant effect on EC efficiency on studied range.However, the effect of initial pH was not studied at lower than pH5.
Temperature also affects the activity of coagulation treatment.Normally optimum operating pH increases when pH decreases [7].Temperature affects especially in low-turbidity water when alu-minum sulfate is used as a coagulant chemical. To date, the effectof temperature on EC efficiency is not widely studied [12]. Theincrement of the solution temperature has positive effect on ECefficiency on azo dye and boron removal to certain extent [13,14].However, so far there is no information about the effect of thesolution temperature on NOM removal from surface waters duringEC treatment. This factor is important if EC is employed for NOMremoval in Nordic water during winter season.
Response surface method (RSM) is a statistical method that isused to study the relationship of the factors and responses [15]. Itcan be employed to evaluate the relative significance of the factors.RSM has also been used to optimize the removal of oil and azo dyeby electrocoagulation [16,17]. High coefficients of determinationvalues were gained for regression models. According to results, RSMis suitable method to study and optimize pertinent parameters ofEC treatment.
In this study, EC was employed for treating highly colored sur-face water. The effects of electric charge, initial pH and temperatureon NOM removal were investigated. RSM was used as a tool to studythe effect of factors and their interactions on responses.
2. Experimental
2.1. Electrochemical treatment
Water samples were collected from a Finnish paper mill sur-face water inlet flow and were stored in a cold room. The untreatedsamples had a high NOM concentration according to photometricand DOC measurements. Physicochemical properties of the sam-ples before EC treatment are presented in Table 1. Normally milluses chemical coagulation treatment to remove NOM from the sur-face water before using it in the following processes.
In this case, initial pH values were selected based on preliminarytests. Temperature adjustment during the tests was undertakenat 295.15 K using heating plate, at 285.15 K using water flow andat 275.15 K with ice bath. The temperatures were adjusted to val-ues stated in test plan before treatment and maintained constantduring EC treatment, flocculation, sedimentation and filtration.According to measurements, temperature was maintained within±1 K range of set temperature during all stages.
In this study, EC cell was made from three aluminum anodes andthree aluminum cathodes with dimensions of 7 cm in length and5 cm in width. GW Instek PSM-6003 was used as a power sourcethroughout the experiments. Experimental setup is shown in Fig. 1.Current used in this study was 0.100 A. Low current density of0.48 mA/cm2 was selected based on the preliminary studies [18].Electrode plates were washed thoroughly with 4% HCl, tap waterand MilliQ-water after treatments.
Samples were magnetically stirred during the EC treatment atthe speed of 300 rpm. After the treatment, samples were stirredwith overhead stirrer at the speed of 40 rpm for 10 min to facili-tate flocculation. Settling time after flocculation was 30 min. Watersamples were filtrated using Whatman 589/1 filter paper and thenstored in the cold room before further analysis.
2.2. Chemical analysis
Metal concentrations were determined using iCAP 6000 seriesICP-AES (Thermo Electron) from samples in which 0.2 ml of 37%
Fig. 1. Schematic diagram of the experimental setup: (1) magnetic stirrer; (2) wateror ice bath; (3) temperature meter; (4) electrochemical cell; (5) DC power supply.
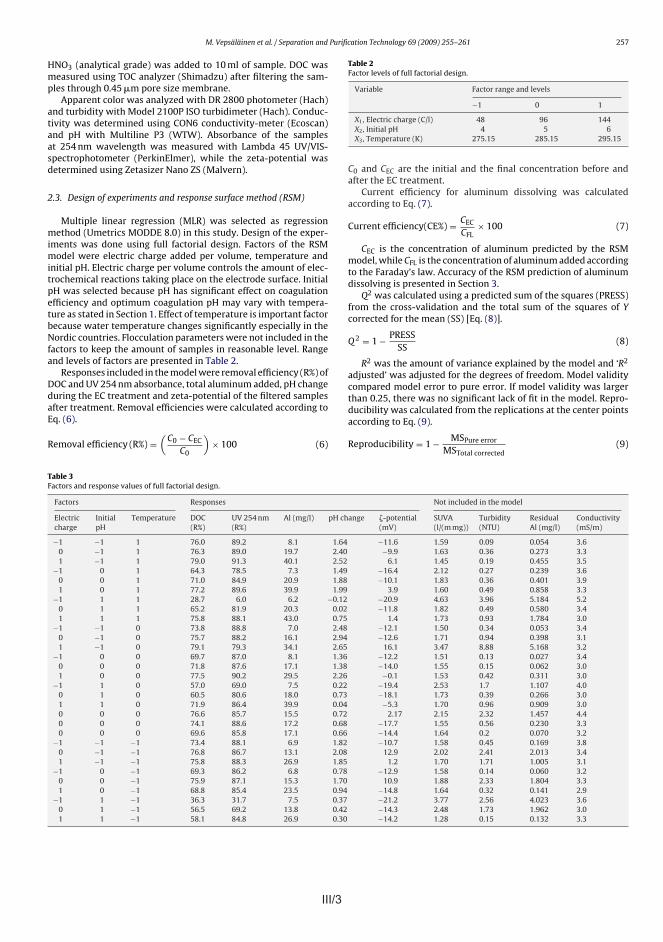
III/3
M. Vepsäläinen et al. / Separation and Purification Technology 69 (2009) 255–261 257
HNO3 (analytical grade) was added to 10 ml of sample. DOC wasmeasured using TOC analyzer (Shimadzu) after filtering the sam-ples through 0.45 �m pore size membrane.
Apparent color was analyzed with DR 2800 photometer (Hach)and turbidity with Model 2100P ISO turbidimeter (Hach). Conduc-tivity was determined using CON6 conductivity-meter (Ecoscan)and pH with Multiline P3 (WTW). Absorbance of the samplesat 254 nm wavelength was measured with Lambda 45 UV/VIS-spectrophotometer (PerkinElmer), while the zeta-potential wasdetermined using Zetasizer Nano ZS (Malvern).
2.3. Design of experiments and response surface method (RSM)
Multiple linear regression (MLR) was selected as regressionmethod (Umetrics MODDE 8.0) in this study. Design of the exper-iments was done using full factorial design. Factors of the RSMmodel were electric charge added per volume, temperature andinitial pH. Electric charge per volume controls the amount of elec-trochemical reactions taking place on the electrode surface. InitialpH was selected because pH has significant effect on coagulationefficiency and optimum coagulation pH may vary with tempera-ture as stated in Section 1. Effect of temperature is important factorbecause water temperature changes significantly especially in theNordic countries. Flocculation parameters were not included in thefactors to keep the amount of samples in reasonable level. Rangeand levels of factors are presented in Table 2.
Responses included in the model were removal efficiency (R%) ofDOC and UV 254 nm absorbance, total aluminum added, pH changeduring the EC treatment and zeta-potential of the filtered samplesafter treatment. Removal efficiencies were calculated according toEq. (6).
Removal efficiency (R%) =(
C0 − CEC
C0
)× 100 (6)
Table 2Factor levels of full factorial design.
Variable Factor range and levels
−1 0 1
X1, Electric charge (C/l) 48 96 144X2, Initial pH 4 5 6X3, Temperature (K) 275.15 285.15 295.15
C0 and CEC are the initial and the final concentration before andafter the EC treatment.
Current efficiency for aluminum dissolving was calculatedaccording to Eq. (7).
Current efficiency(CE%) = CEC
CFL× 100 (7)
CEC is the concentration of aluminum predicted by the RSMmodel, while CFL is the concentration of aluminum added accordingto the Faraday’s law. Accuracy of the RSM prediction of aluminumdissolving is presented in Section 3.
Q2 was calculated using a predicted sum of the squares (PRESS)from the cross-validation and the total sum of the squares of Ycorrected for the mean (SS) [Eq. (8)].
Q 2 = 1 − PRESSSS
(8)
R2 was the amount of variance explained by the model and ‘R2
adjusted’ was adjusted for the degrees of freedom. Model validitycompared model error to pure error. If model validity was largerthan 0.25, there was no significant lack of fit in the model. Repro-ducibility was calculated from the replications at the center pointsaccording to Eq. (9).
Reproducibility = 1 − MSPure error
MSTotal corrected(9)
Table 3Factors and response values of full factorial design.
Factors Responses Not included in the model
Electriccharge
InitialpH
Temperature DOC(R%)
UV 254 nm(R%)
Al (mg/l) pH change �-potential(mV)
SUVA(l/(m mg))
Turbidity(NTU)
ResidualAl (mg/l)
Conductivity(mS/m)
−1 −1 1 76.0 89.2 8.1 1.64 −11.6 1.59 0.09 0.054 3.60 −1 1 76.3 89.0 19.7 2.40 −9.9 1.63 0.36 0.273 3.31 −1 1 79.0 91.3 40.1 2.52 6.1 1.45 0.19 0.455 3.5
−1 0 1 64.3 78.5 7.3 1.49 −16.4 2.12 0.27 0.239 3.60 0 1 71.0 84.9 20.9 1.88 −10.1 1.83 0.36 0.401 3.91 0 1 77.2 89.6 39.9 1.99 3.9 1.60 0.49 0.858 3.3
−1 1 1 28.7 6.0 6.2 −0.12 −20.9 4.63 3.96 5.184 5.20 1 1 65.2 81.9 20.3 0.02 −11.8 1.82 0.49 0.580 3.41 1 1 75.8 88.1 43.0 0.75 1.4 1.73 0.93 1.784 3.0
−1 −1 0 73.8 88.8 7.0 2.48 −12.1 1.50 0.34 0.053 3.40 −1 0 75.7 88.2 16.1 2.94 −12.6 1.71 0.94 0.398 3.11 −1 0 79.1 79.3 34.1 2.65 16.1 3.47 8.88 5.168 3.2
−1 0 0 69.7 87.0 8.1 1.36 −12.2 1.51 0.13 0.027 3.40 0 0 71.8 87.6 17.1 1.38 −14.0 1.55 0.15 0.062 3.01 0 0 77.5 90.2 29.5 2.26 −0.1 1.53 0.42 0.311 3.0
−1 1 0 57.0 69.0 7.5 0.22 −19.4 2.53 1.7 1.107 4.00 1 0 60.5 80.6 18.0 0.73 −18.1 1.73 0.39 0.266 3.01 1 0 71.9 86.4 39.9 0.04 −5.3 1.70 0.96 0.909 3.00 0 0 76.6 85.7 15.5 0.72 2.17 2.15 2.32 1.457 4.40 0 0 74.1 88.6 17.2 0.68 −17.7 1.55 0.56 0.230 3.30 0 0 69.6 85.8 17.1 0.66 −14.4 1.64 0.2 0.070 3.2
−1 −1 −1 73.4 88.1 6.9 1.82 −10.7 1.58 0.45 0.169 3.80 −1 −1 76.8 86.7 13.1 2.08 12.9 2.02 2.41 2.013 3.41 −1 −1 75.8 88.3 26.9 1.85 1.2 1.70 1.71 1.005 3.1
−1 0 −1 69.3 86.2 6.8 0.78 −12.9 1.58 0.14 0.060 3.20 0 −1 75.9 87.1 15.3 1.70 10.9 1.88 2.33 1.804 3.31 0 −1 68.8 85.4 23.5 0.94 −14.8 1.64 0.32 0.141 2.9
−1 1 −1 36.3 31.7 7.5 0.37 −21.2 3.77 2.56 4.023 3.60 1 −1 56.5 69.2 13.8 0.42 −14.3 2.48 1.73 1.962 3.01 1 −1 58.1 84.8 26.9 0.30 −14.2 1.28 0.15 0.132 3.3
256 M. Vepsäläinen et al. / Separation and Purification Technology 69 (2009) 255–261
Table 1Initial water quality.
DOC (mg/l) UV 254 nm Al (mg/l) pH �-potential (mV) SUVA (l/(m mg)) Turbidity (NTU) Conductivity (mS/m)
18.35 0.644 0.257 5.8 −17.1 3.51 0.51 2.8
corrosion of the aluminum [Eq. (4)], thus facilitating the formationof aluminate, Al(OH)4
− [Eq. (5)].
2H2O + 2e− → H2(g) + 2OH−(aq) (3)
2Al(s) + 6H2O + 2OH−(aq) → 2[Al(OH)4]−(aq) + 3H2(g) (4)
Al(OH)3(s) + OH−(aq) ↔ Al(OH)4−(aq) (5)
Faraday’s law calculations take consideration only reactions atthe anode surface. According to literature, there is no significantdifference in anodic dissolving reaction and theoretical dissolvingspeeds calculated using the Faraday’s law when current density isin the range of 0–4 A/dm2 [8]. Dissolving of the aluminum at thecathode is chemical dissolution facilitated by the pH change at theelectrode surface and current efficiency for this reaction is affectedby the current density. When aluminum cathodes having low cur-rent density are used in the EC process, a high current efficiencyis achieved. Solution pH has small effect on dissolving rate whenpH is near neutral region [9]. Highly alkaline solution pH increaseschemical dissolving.
Hydrophilic humic fraction is not easily removed by coagulation.Therefore it needs different coagulation conditions as compared tohydrophobic fraction [7]. In chemical coagulation with metal coag-ulants destabilization of NOM can occur either by enmeshmentmechanism or by the formation of insoluble complexes and pre-cipitation reactions. In an acidic pH range, precipitation and chargeneutralization are favored and the removal of hydrophilic colloidstakes place. At neutral pH, hydrophobic NOM is mostly removedby adsorption to metal hydroxides and bridging mechanism. Dur-ing EC treatment, pH changes in course of time, affecting to themechanism of NOM destabilization. When treatment is carried outat low initial pH, hydrophilic NOM could be removed. At the endof the treatment, when pH is neutralized, adsorption and bridg-ing of hydrophobic NOM takes occurs. According to literature, toacquire simultaneously good microfloc and macrofloc formationduring water treatment, pH control is an important factor [10].The effect of initial pH on NOM removal in EC has been studiedin the range of 5–9.6 [11]. At low humic substance concentration,pH did not have significant effect on EC efficiency on studied range.However, the effect of initial pH was not studied at lower than pH5.
Temperature also affects the activity of coagulation treatment.Normally optimum operating pH increases when pH decreases [7].Temperature affects especially in low-turbidity water when alu-minum sulfate is used as a coagulant chemical. To date, the effectof temperature on EC efficiency is not widely studied [12]. Theincrement of the solution temperature has positive effect on ECefficiency on azo dye and boron removal to certain extent [13,14].However, so far there is no information about the effect of thesolution temperature on NOM removal from surface waters duringEC treatment. This factor is important if EC is employed for NOMremoval in Nordic water during winter season.
Response surface method (RSM) is a statistical method that isused to study the relationship of the factors and responses [15]. Itcan be employed to evaluate the relative significance of the factors.RSM has also been used to optimize the removal of oil and azo dyeby electrocoagulation [16,17]. High coefficients of determinationvalues were gained for regression models. According to results, RSMis suitable method to study and optimize pertinent parameters ofEC treatment.
In this study, EC was employed for treating highly colored sur-face water. The effects of electric charge, initial pH and temperatureon NOM removal were investigated. RSM was used as a tool to studythe effect of factors and their interactions on responses.
2. Experimental
2.1. Electrochemical treatment
Water samples were collected from a Finnish paper mill sur-face water inlet flow and were stored in a cold room. The untreatedsamples had a high NOM concentration according to photometricand DOC measurements. Physicochemical properties of the sam-ples before EC treatment are presented in Table 1. Normally milluses chemical coagulation treatment to remove NOM from the sur-face water before using it in the following processes.
In this case, initial pH values were selected based on preliminarytests. Temperature adjustment during the tests was undertakenat 295.15 K using heating plate, at 285.15 K using water flow andat 275.15 K with ice bath. The temperatures were adjusted to val-ues stated in test plan before treatment and maintained constantduring EC treatment, flocculation, sedimentation and filtration.According to measurements, temperature was maintained within±1 K range of set temperature during all stages.
In this study, EC cell was made from three aluminum anodes andthree aluminum cathodes with dimensions of 7 cm in length and5 cm in width. GW Instek PSM-6003 was used as a power sourcethroughout the experiments. Experimental setup is shown in Fig. 1.Current used in this study was 0.100 A. Low current density of0.48 mA/cm2 was selected based on the preliminary studies [18].Electrode plates were washed thoroughly with 4% HCl, tap waterand MilliQ-water after treatments.
Samples were magnetically stirred during the EC treatment atthe speed of 300 rpm. After the treatment, samples were stirredwith overhead stirrer at the speed of 40 rpm for 10 min to facili-tate flocculation. Settling time after flocculation was 30 min. Watersamples were filtrated using Whatman 589/1 filter paper and thenstored in the cold room before further analysis.
2.2. Chemical analysis
Metal concentrations were determined using iCAP 6000 seriesICP-AES (Thermo Electron) from samples in which 0.2 ml of 37%
Fig. 1. Schematic diagram of the experimental setup: (1) magnetic stirrer; (2) wateror ice bath; (3) temperature meter; (4) electrochemical cell; (5) DC power supply.
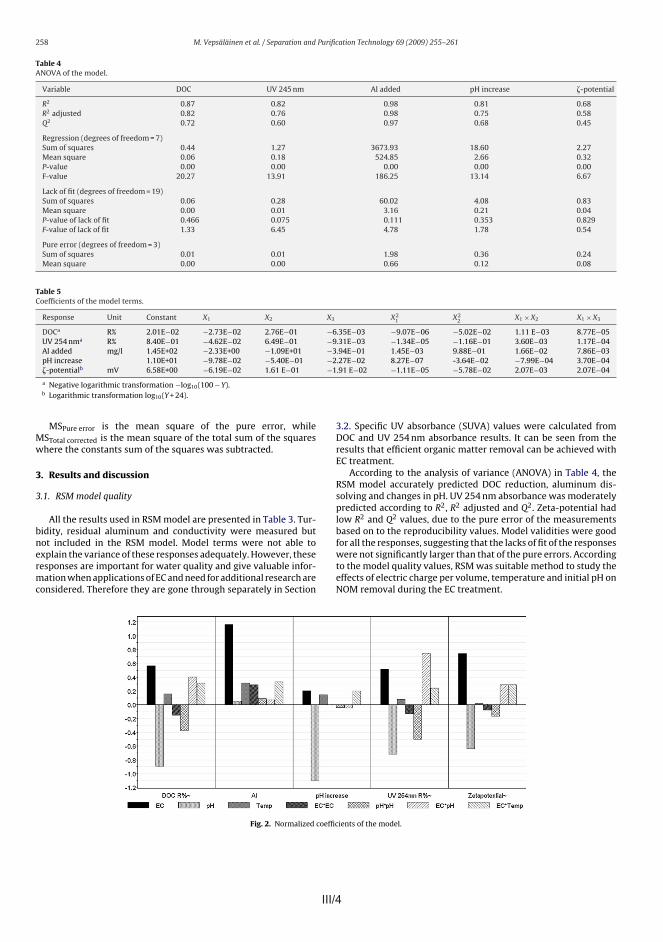
III/4 III/5
M. Vepsäläinen et al. / Separation and Purification Technology 69 (2009) 255–261 259
Fig. 3. Dissolving rate of the electrodes in different water temperatures. Theoreticalvalues are calculated according to Faraday’s law for anodic dissolving reaction.
Coefficients of the model terms are listed in Table 5 and nor-malized coefficients are presented in Fig. 2. The effects of theterms to responses could be easily seen from the normalized coef-ficients. Square terms of electric charge per liter and initial pH andinteraction terms of electric charge per liter with initial pH andtemperature were included in the model. Square terms or interac-tion terms that were not significant at 95% confidence level to anyof the responses were not included in the model.
3.2. Reactions during the EC treatment
Dissolving speed at different temperatures was tested prior tothe preparation of the model. Temperature had significant effecton the dissolving speed of the aluminum. In Fig. 3, theoretical ratesof aluminum dissolving, calculated according to Faraday’s law, andmeasured aluminum dissolving rates are plotted. Rate of the dis-solving increased during the tests especially at 295.15 K.
Accuracy of the aluminum dissolving was high according toRSM model R2 and Q2 values (0.98 and 0.97 respectively). Rate ofthe aluminum dissolving exceeded theoretical values in the factorsrange as can be seen from Fig. 4. Over-Faradic current efficiency isattributed to the dissolving of the aluminum at the cathode surfacedue to hydroxyl ion generation [8,9,19].
According to RSM model, temperature, electric charge per liter,square term of electric charge per liter and interaction term of tem-perature and electric charge per liter were terms that affect onspeed of the dissolving of the aluminum at 95% confidence level.It was reflected from the contours plot in Fig. 4 that at higher elec-
tric charge per liter treatments, temperature had significant effecton amount of aluminum that was dissolved to the samples. It isapparent that chemical dissolving reaction at the cathode surfacewas affected by water temperature. According to current efficien-cies, dissolving reaction rate did not attained equilibrium duringthe batch experiments even at the highest temperature. Initial pH ofthe samples did not have significant effect on the dissolving speedof the electrodes at the studied range.
It is evident that initial pH affects on the change of pH duringthe EC treatment. All other RSM model terms are insignificant at95% confidence level. Lower initial pH leads to higher pH incre-ment during the EC treatment. Final pH of all of the samples afterfiltration ranged between 5.6 and 7.3. At this pH range, flocculationwas efficient and flocs were easily removed by settling or flotation.This suggests that after EC treatment of the surface water no pHadjustment is required to facilitate flocculation.
When aluminum was produced at a low initial pH at the begin-ning of the EC treatment, NOM probably reacted through theformation of insoluble aluminum humate complexes and chargeneutralization. Less hydroxyl ions were bound to aluminum whenlow initial pH was used according to results of pH change. When pHincreased during the treatment and aluminum hydrolysed, removalmechanism of NOM changed from complex formation to adsorp-tion and enmeshment. When high initial pH is used, aluminumhydrolysis increased as compared to low initial pH and the adsorp-tion and enmeshment of NOM is prevalent mechanism during thewhole treatment time.
Zeta-potential was measured from the filtered samples fromwhich flocculated materials were removed during settling and fil-tration stages. According to RSM model, electric charge per volumeand initial pH were primary terms that affected on zeta-potentialof the NOM in the filtered samples. Results indicate that temper-ature affected on zeta-potential through the dissolving speed ofthe aluminum electrodes, as reflected by the coefficients of thezeta-potential and the contour plots in Fig. 5. The zeta-potentialof the NOM in the filtered samples was higher when the initial pHof the water was acidic. Increased charge neutralization at sam-ples indicates that the formation of aluminum humates and chargeneutralization occurred, when EC treatment was initiated at acidicpH range. It seems that the final pH of the samples after the ECtreatment did not have significant effect on the zeta-potential ofthe NOM in the samples. This might be related to small differencein final pH between the samples.
Water conductivity was not included in the model. Conductiv-ities of the EC treated samples varied from 2.9 mS/m to 5.2 mS/m.Conductivity was affected by the residual aluminum and final pH.According to results, EC has little impact on water conductivity. Thisdiffers from inorganic coagulation chemicals, such as aluminumsulfate and iron(III) sulfate, that increase salt concentration of the
Fig. 4. Contour plots of (a) dissolved aluminum (mg/l) and (b) current efficiency (%) of aluminum dissolving at pH 5.
258 M. Vepsäläinen et al. / Separation and Purification Technology 69 (2009) 255–261
Table 4ANOVA of the model.
Variable DOC UV 245 nm Al added pH increase �-potential
R2 0.87 0.82 0.98 0.81 0.68R2 adjusted 0.82 0.76 0.98 0.75 0.58Q2 0.72 0.60 0.97 0.68 0.45
Regression (degrees of freedom = 7)Sum of squares 0.44 1.27 3673.93 18.60 2.27Mean square 0.06 0.18 524.85 2.66 0.32P-value 0.00 0.00 0.00 0.00 0.00F-value 20.27 13.91 186.25 13.14 6.67
Lack of fit (degrees of freedom = 19)Sum of squares 0.06 0.28 60.02 4.08 0.83Mean square 0.00 0.01 3.16 0.21 0.04P-value of lack of fit 0.466 0.075 0.111 0.353 0.829F-value of lack of fit 1.33 6.45 4.78 1.78 0.54
Pure error (degrees of freedom = 3)Sum of squares 0.01 0.01 1.98 0.36 0.24Mean square 0.00 0.00 0.66 0.12 0.08
Table 5Coefficients of the model terms.
Response Unit Constant X1 X2 X3 X21 X2
2 X1 × X2 X1 × X3
DOCa R% 2.01E−02 −2.73E−02 2.76E−01 −6.35E−03 −9.07E−06 −5.02E−02 1.11 E−03 8.77E−05UV 254 nma R% 8.40E−01 −4.62E−02 6.49E−01 −9.31E−03 −1.34E−05 −1.16E−01 3.60E−03 1.17E−04Al added mg/l 1.45E+02 −2.33E+00 −1.09E+01 −3.94E−01 1.45E−03 9.88E−01 1.66E−02 7.86E−03pH increase 1.10E+01 −9.78E−02 −5.40E−01 −2.27E−02 8.27E−07 -3.64E−02 −7.99E−04 3.70E−04�-potentialb mV 6.58E+00 −6.19E−02 1.61 E−01 −1.91 E−02 −1.11E−05 −5.78E−02 2.07E−03 2.07E−04
a Negative logarithmic transformation −log10(100 − Y).b Logarithmic transformation log10(Y + 24).
MSPure error is the mean square of the pure error, whileMSTotal corrected is the mean square of the total sum of the squareswhere the constants sum of the squares was subtracted.
3. Results and discussion
3.1. RSM model quality
All the results used in RSM model are presented in Table 3. Tur-bidity, residual aluminum and conductivity were measured butnot included in the RSM model. Model terms were not able toexplain the variance of these responses adequately. However, theseresponses are important for water quality and give valuable infor-mation when applications of EC and need for additional research areconsidered. Therefore they are gone through separately in Section
3.2. Specific UV absorbance (SUVA) values were calculated fromDOC and UV 254 nm absorbance results. It can be seen from theresults that efficient organic matter removal can be achieved withEC treatment.
According to the analysis of variance (ANOVA) in Table 4, theRSM model accurately predicted DOC reduction, aluminum dis-solving and changes in pH. UV 254 nm absorbance was moderatelypredicted according to R2, R2 adjusted and Q2. Zeta-potential hadlow R2 and Q2 values, due to the pure error of the measurementsbased on to the reproducibility values. Model validities were goodfor all the responses, suggesting that the lacks of fit of the responseswere not significantly larger than that of the pure errors. Accordingto the model quality values, RSM was suitable method to study theeffects of electric charge per volume, temperature and initial pH onNOM removal during the EC treatment.
Fig. 2. Normalized coefficients of the model.
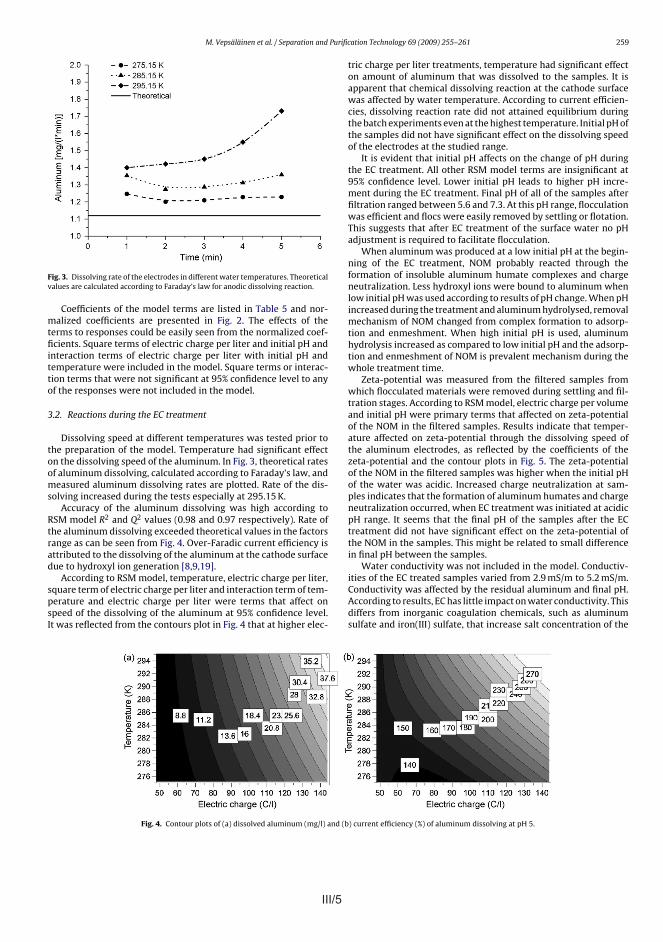
III/5
M. Vepsäläinen et al. / Separation and Purification Technology 69 (2009) 255–261 259
Fig. 3. Dissolving rate of the electrodes in different water temperatures. Theoreticalvalues are calculated according to Faraday’s law for anodic dissolving reaction.
Coefficients of the model terms are listed in Table 5 and nor-malized coefficients are presented in Fig. 2. The effects of theterms to responses could be easily seen from the normalized coef-ficients. Square terms of electric charge per liter and initial pH andinteraction terms of electric charge per liter with initial pH andtemperature were included in the model. Square terms or interac-tion terms that were not significant at 95% confidence level to anyof the responses were not included in the model.
3.2. Reactions during the EC treatment
Dissolving speed at different temperatures was tested prior tothe preparation of the model. Temperature had significant effecton the dissolving speed of the aluminum. In Fig. 3, theoretical ratesof aluminum dissolving, calculated according to Faraday’s law, andmeasured aluminum dissolving rates are plotted. Rate of the dis-solving increased during the tests especially at 295.15 K.
Accuracy of the aluminum dissolving was high according toRSM model R2 and Q2 values (0.98 and 0.97 respectively). Rate ofthe aluminum dissolving exceeded theoretical values in the factorsrange as can be seen from Fig. 4. Over-Faradic current efficiency isattributed to the dissolving of the aluminum at the cathode surfacedue to hydroxyl ion generation [8,9,19].
According to RSM model, temperature, electric charge per liter,square term of electric charge per liter and interaction term of tem-perature and electric charge per liter were terms that affect onspeed of the dissolving of the aluminum at 95% confidence level.It was reflected from the contours plot in Fig. 4 that at higher elec-
tric charge per liter treatments, temperature had significant effecton amount of aluminum that was dissolved to the samples. It isapparent that chemical dissolving reaction at the cathode surfacewas affected by water temperature. According to current efficien-cies, dissolving reaction rate did not attained equilibrium duringthe batch experiments even at the highest temperature. Initial pH ofthe samples did not have significant effect on the dissolving speedof the electrodes at the studied range.
It is evident that initial pH affects on the change of pH duringthe EC treatment. All other RSM model terms are insignificant at95% confidence level. Lower initial pH leads to higher pH incre-ment during the EC treatment. Final pH of all of the samples afterfiltration ranged between 5.6 and 7.3. At this pH range, flocculationwas efficient and flocs were easily removed by settling or flotation.This suggests that after EC treatment of the surface water no pHadjustment is required to facilitate flocculation.
When aluminum was produced at a low initial pH at the begin-ning of the EC treatment, NOM probably reacted through theformation of insoluble aluminum humate complexes and chargeneutralization. Less hydroxyl ions were bound to aluminum whenlow initial pH was used according to results of pH change. When pHincreased during the treatment and aluminum hydrolysed, removalmechanism of NOM changed from complex formation to adsorp-tion and enmeshment. When high initial pH is used, aluminumhydrolysis increased as compared to low initial pH and the adsorp-tion and enmeshment of NOM is prevalent mechanism during thewhole treatment time.
Zeta-potential was measured from the filtered samples fromwhich flocculated materials were removed during settling and fil-tration stages. According to RSM model, electric charge per volumeand initial pH were primary terms that affected on zeta-potentialof the NOM in the filtered samples. Results indicate that temper-ature affected on zeta-potential through the dissolving speed ofthe aluminum electrodes, as reflected by the coefficients of thezeta-potential and the contour plots in Fig. 5. The zeta-potentialof the NOM in the filtered samples was higher when the initial pHof the water was acidic. Increased charge neutralization at sam-ples indicates that the formation of aluminum humates and chargeneutralization occurred, when EC treatment was initiated at acidicpH range. It seems that the final pH of the samples after the ECtreatment did not have significant effect on the zeta-potential ofthe NOM in the samples. This might be related to small differencein final pH between the samples.
Water conductivity was not included in the model. Conductiv-ities of the EC treated samples varied from 2.9 mS/m to 5.2 mS/m.Conductivity was affected by the residual aluminum and final pH.According to results, EC has little impact on water conductivity. Thisdiffers from inorganic coagulation chemicals, such as aluminumsulfate and iron(III) sulfate, that increase salt concentration of the
Fig. 4. Contour plots of (a) dissolved aluminum (mg/l) and (b) current efficiency (%) of aluminum dissolving at pH 5.
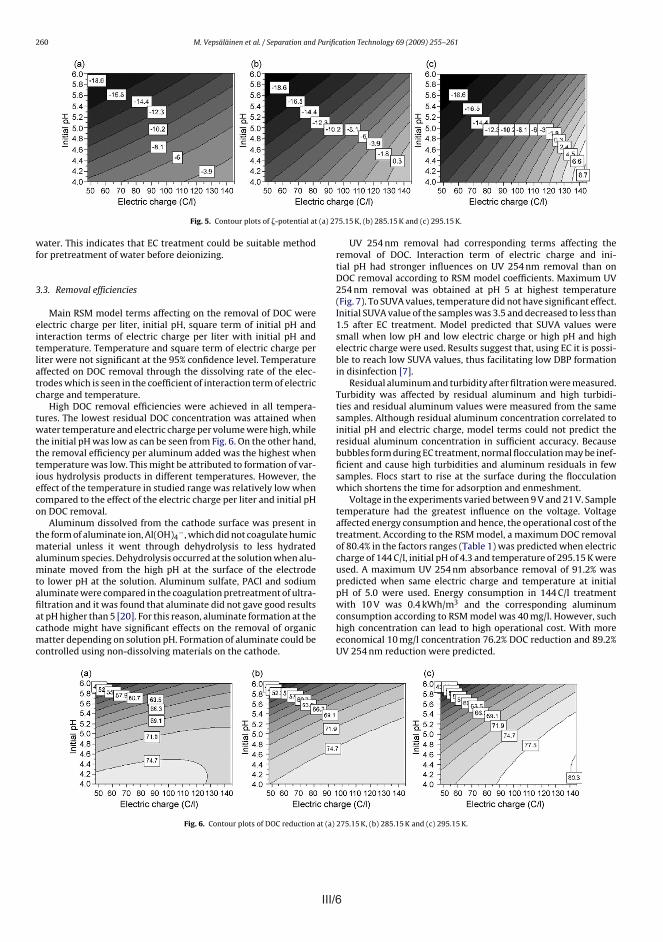
III/6 III/7
M. Vepsäläinen et al. / Separation and Purification Technology 69 (2009) 255–261 261
Fig. 7. Contour plots of UV 254 nm reduction at (a) 275.15 K, (b) 285.15 K and (c) 295.15 K.
4. Conclusions
In this study, the effects of temperature and initial sample pHon the NOM removal from surface water by EC process have beeninvestigated using RSM. Aluminum added, DOC and UV 254 nmabsorbance removal and pH change during electrochemical treat-ment well correlated with the predicted values of the RSM model.
• Dissolving speed of the aluminum electrodes increased whentemperature of the samples increased. Reaction rate of the dis-solving was not balanced during the batch experiments. Withflow-through cell aluminum concentration could be controlledmore easily and used as factor when making design of experi-ments.
• Change of the pH during EC treatment was mainly affected by theinitial pH. Final pHs of the samples were in the range of 5.6–7.3.
• Electrocoagulation had little impact on the conductivity of thewater. Conductivities of the samples varied from 2.9 mS/m to5.2 mS/m.
• High NOM removal was obtained in EC treatment. MaximumNOM removal, according to DOC and UV 254 nm measurements,was achieved when low pH of 4.3, high temperature of 295.15 Kand high electric charge of 144 C/l were applied. Energy consump-tion in maximum DOC and UV 254 nm absorbance removal in thefactors range was 0.4 kWh/m3 and aluminum consumption was40 mg/l.
• Temperature had minor effect on the removal of NOM in stud-ied range when compared to effect of electric charge per literand initial pH. Temperature affected mainly through the differentdissolving rate of the electrodes.
According to results, EC treatment can be used for efficientremoval of NOM from surface waters also during the cold waterperiod. According to results, EC could be suitable method for pre-treatment of surface water before deionizing process. Lower saltconcentration may also reduce corrosion in the water systems andhave positive effects to following industrial processes.
In future studies, more information about the effects of dif-ferent aluminum species formed during the EC treatment on theanode and the cathode surface is needed to optimize NOM removal.Simultaneous bubble formation during EC treatment may need fur-ther development of flocculation to have good floc formation andseparation simultaneously.
Acknowledgements
This research was financially supported by Savcor Forest Oy,UPM-Kymmene Oyj, the city of Mikkeli and the European Union.
Authors would like to thank Tonni Kurniawan and Shashi Dubeyfor language consulting.
References
[1] P. Hynninen, Papermaking Science and Technology: Environmental Control,Fapet Oy, Helsinki, 1998, pp. 43–55.
[2] A. Matilainen, N. Lindqvist, S. Korhonen, T. Tuhkanen, Removal of NOM inthe different stages of the water treatment process, Environ. Int. 28 (2002)457–465.
[3] T.K. Nissinen, I.T. Miettinen, P.J. Martikainen, T. Vartiainen, Molecular size dis-tribution of natural organic matter in raw and drinking waters, Chemosphere45 (2001) 865–873.
[4] E.M. Sharp, S.A. Parsons, B. Jefferson, Seasonal variations in natural organicmatter and its impact on coagulation in water treatment, Sci. Total Environ.363 (2006) 183–194.
[5] M.J. Scott, M.N. Jones, C. Woof, B. Simon, E. Tipping, The molecular proper-ties of humic substances isolated from a UK upland peat system: a temporalinvestigation, Environ. Int. 27 (2001) 449–462.
[6] E.L. Sharp, P. Jarvis, S.A. Parsons, B. Jefferson, Impact of fractional character onthe coagulation of NOM, Colloids Surf. A 286 (2006) 104–111.
[7] J. Bratby, Coagulation and Flocculation in Water and Wastewater Treatment,second ed., IWA Publishing, London, 2006.
[8] G. Mouedhen, M. Feki, M. De Petris Wery, H.F. Ayedi, Behavior of alu-minium electrodes in electrocoagulation process, J. Hazard. Mater. 150 (2008)124–135.
[9] P. Ganizares, M. Garmona, J. Lobato, F. Martínez, M.A. Rodrigo, Electrodissolu-tion of aluminium electrodes in electrocoagulation processes, Ind. Eng. Chem.Res. 44 (2005) 4178–4185.
[10] J.E. Gregor, C.J. Nokes, E. Fenton, Optimising natural organic matter removalfrom low turbidity waters by controlled pH adjustment of aluminium coagu-lation, Water Res. 31 (12) (1997) 2949–2958.
[11] A.S. Koparal, Y. S Yildiz, B. Keskinler, N. Demircioglu, Effect of initial pH onthe removal of humic substances from wastewater by electrocoagulation, Sep.Purif. Technol. 59 (2008) 175–182.
[12] G. Chen, Electrochemical technologies in wastewater treatment, Sep. Purif.Technol. 38 (2004) 11–41.
[13] N. Daneshvar, H. Ashassi Sorkhabi, M.B. Kasiri, Decolorization of dye solutioncontaining Acid Red 14 by electrocoagulation with a comparative investigationof different electrode connections, J. Hazard. Mater. B112 (2004) 55–62.
[14] A.E. Yilmaz, R. Boncukcuoglu, M.M. Kocakerim, M.T. Yilmaz, C. Paluluoglu,Boron removal from geothermal waters by electrocoagulation, J. Hazard. Mater.153 (2008) 146–151.
[15] R. Myers, D. Montgomery, Response Surface Methodology: Process and ProductOptimization Using Designed Experiments, second ed., John Wiley & Sons Inc.,NY, 2002.
[16] A. Aleboyeh, N. Daneshvar, M.B. Kasiri, Optimization of C.I. Acid Red 14 azo dyeremoval by electrocoagulation batch process with response surface methodol-ogy, Chem. Eng. Process 47 (2008) 827–832.
[17] M. Tir, N. Moulai-Mostefa, Optimization of oil removal from oily wastewater byelectrocoagulation using response surface method, J. Hazard. Mater. 158 (2008)107–115.
[18] M. Vepsäläinen, J. Selin, M. Pulliainen, M. Sillanpää, Combined electrocoagu-lation and chemical coagulation of paper mill mechanically cleaned water, J.Pulp Pap. Sci. 33 (2007) 233–239.
[19] T. Picard, G. Cathalifaud-Feuillade, M. Mazet, C. Vandensteendam, Cathodicdissolution in the electrocoagulation process using aluminium electrodes, J.Environ. Monit. 2 (2000) 77–80.
[20] M. Kabsch-Korbutowicz, Effect of Al coagulant type on natural organic mat-ter removal efficiency in coagulation/ultrafiltration process, Desalination 185(2005) 327–333.
260 M. Vepsäläinen et al. / Separation and Purification Technology 69 (2009) 255–261
Fig. 5. Contour plots of �-potential at (a) 275.15 K, (b) 285.15 K and (c) 295.15 K.
water. This indicates that EC treatment could be suitable methodfor pretreatment of water before deionizing.
3.3. Removal efficiencies
Main RSM model terms affecting on the removal of DOC wereelectric charge per liter, initial pH, square term of initial pH andinteraction terms of electric charge per liter with initial pH andtemperature. Temperature and square term of electric charge perliter were not significant at the 95% confidence level. Temperatureaffected on DOC removal through the dissolving rate of the elec-trodes which is seen in the coefficient of interaction term of electriccharge and temperature.
High DOC removal efficiencies were achieved in all tempera-tures. The lowest residual DOC concentration was attained whenwater temperature and electric charge per volume were high, whilethe initial pH was low as can be seen from Fig. 6. On the other hand,the removal efficiency per aluminum added was the highest whentemperature was low. This might be attributed to formation of var-ious hydrolysis products in different temperatures. However, theeffect of the temperature in studied range was relatively low whencompared to the effect of the electric charge per liter and initial pHon DOC removal.
Aluminum dissolved from the cathode surface was present inthe form of aluminate ion, Al(OH)4
−, which did not coagulate humicmaterial unless it went through dehydrolysis to less hydratedaluminum species. Dehydrolysis occurred at the solution when alu-minate moved from the high pH at the surface of the electrodeto lower pH at the solution. Aluminum sulfate, PACl and sodiumaluminate were compared in the coagulation pretreatment of ultra-filtration and it was found that aluminate did not gave good resultsat pH higher than 5 [20]. For this reason, aluminate formation at thecathode might have significant effects on the removal of organicmatter depending on solution pH. Formation of aluminate could becontrolled using non-dissolving materials on the cathode.
UV 254 nm removal had corresponding terms affecting theremoval of DOC. Interaction term of electric charge and ini-tial pH had stronger influences on UV 254 nm removal than onDOC removal according to RSM model coefficients. Maximum UV254 nm removal was obtained at pH 5 at highest temperature(Fig. 7). To SUVA values, temperature did not have significant effect.Initial SUVA value of the samples was 3.5 and decreased to less than1.5 after EC treatment. Model predicted that SUVA values weresmall when low pH and low electric charge or high pH and highelectric charge were used. Results suggest that, using EC it is possi-ble to reach low SUVA values, thus facilitating low DBP formationin disinfection [7].
Residual aluminum and turbidity after filtration were measured.Turbidity was affected by residual aluminum and high turbidi-ties and residual aluminum values were measured from the samesamples. Although residual aluminum concentration correlated toinitial pH and electric charge, model terms could not predict theresidual aluminum concentration in sufficient accuracy. Becausebubbles form during EC treatment, normal flocculation may be inef-ficient and cause high turbidities and aluminum residuals in fewsamples. Flocs start to rise at the surface during the flocculationwhich shortens the time for adsorption and enmeshment.
Voltage in the experiments varied between 9 V and 21 V. Sampletemperature had the greatest influence on the voltage. Voltageaffected energy consumption and hence, the operational cost of thetreatment. According to the RSM model, a maximum DOC removalof 80.4% in the factors ranges (Table 1) was predicted when electriccharge of 144 C/l, initial pH of 4.3 and temperature of 295.15 K wereused. A maximum UV 254 nm absorbance removal of 91.2% waspredicted when same electric charge and temperature at initialpH of 5.0 were used. Energy consumption in 144 C/l treatmentwith 10 V was 0.4 kWh/m3 and the corresponding aluminumconsumption according to RSM model was 40 mg/l. However, suchhigh concentration can lead to high operational cost. With moreeconomical 10 mg/l concentration 76.2% DOC reduction and 89.2%UV 254 nm reduction were predicted.
Fig. 6. Contour plots of DOC reduction at (a) 275.15 K, (b) 285.15 K and (c) 295.15 K.
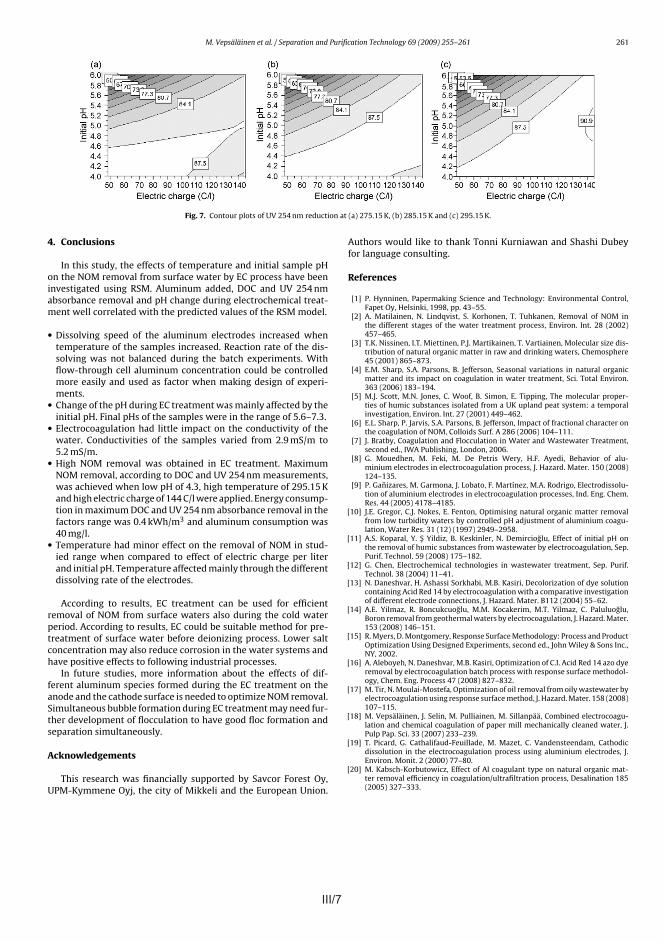
III/7
M. Vepsäläinen et al. / Separation and Purification Technology 69 (2009) 255–261 261
Fig. 7. Contour plots of UV 254 nm reduction at (a) 275.15 K, (b) 285.15 K and (c) 295.15 K.
4. Conclusions
In this study, the effects of temperature and initial sample pHon the NOM removal from surface water by EC process have beeninvestigated using RSM. Aluminum added, DOC and UV 254 nmabsorbance removal and pH change during electrochemical treat-ment well correlated with the predicted values of the RSM model.
• Dissolving speed of the aluminum electrodes increased whentemperature of the samples increased. Reaction rate of the dis-solving was not balanced during the batch experiments. Withflow-through cell aluminum concentration could be controlledmore easily and used as factor when making design of experi-ments.
• Change of the pH during EC treatment was mainly affected by theinitial pH. Final pHs of the samples were in the range of 5.6–7.3.
• Electrocoagulation had little impact on the conductivity of thewater. Conductivities of the samples varied from 2.9 mS/m to5.2 mS/m.
• High NOM removal was obtained in EC treatment. MaximumNOM removal, according to DOC and UV 254 nm measurements,was achieved when low pH of 4.3, high temperature of 295.15 Kand high electric charge of 144 C/l were applied. Energy consump-tion in maximum DOC and UV 254 nm absorbance removal in thefactors range was 0.4 kWh/m3 and aluminum consumption was40 mg/l.
• Temperature had minor effect on the removal of NOM in stud-ied range when compared to effect of electric charge per literand initial pH. Temperature affected mainly through the differentdissolving rate of the electrodes.
According to results, EC treatment can be used for efficientremoval of NOM from surface waters also during the cold waterperiod. According to results, EC could be suitable method for pre-treatment of surface water before deionizing process. Lower saltconcentration may also reduce corrosion in the water systems andhave positive effects to following industrial processes.
In future studies, more information about the effects of dif-ferent aluminum species formed during the EC treatment on theanode and the cathode surface is needed to optimize NOM removal.Simultaneous bubble formation during EC treatment may need fur-ther development of flocculation to have good floc formation andseparation simultaneously.
Acknowledgements
This research was financially supported by Savcor Forest Oy,UPM-Kymmene Oyj, the city of Mikkeli and the European Union.
Authors would like to thank Tonni Kurniawan and Shashi Dubeyfor language consulting.
References
[1] P. Hynninen, Papermaking Science and Technology: Environmental Control,Fapet Oy, Helsinki, 1998, pp. 43–55.
[2] A. Matilainen, N. Lindqvist, S. Korhonen, T. Tuhkanen, Removal of NOM inthe different stages of the water treatment process, Environ. Int. 28 (2002)457–465.
[3] T.K. Nissinen, I.T. Miettinen, P.J. Martikainen, T. Vartiainen, Molecular size dis-tribution of natural organic matter in raw and drinking waters, Chemosphere45 (2001) 865–873.
[4] E.M. Sharp, S.A. Parsons, B. Jefferson, Seasonal variations in natural organicmatter and its impact on coagulation in water treatment, Sci. Total Environ.363 (2006) 183–194.
[5] M.J. Scott, M.N. Jones, C. Woof, B. Simon, E. Tipping, The molecular proper-ties of humic substances isolated from a UK upland peat system: a temporalinvestigation, Environ. Int. 27 (2001) 449–462.
[6] E.L. Sharp, P. Jarvis, S.A. Parsons, B. Jefferson, Impact of fractional character onthe coagulation of NOM, Colloids Surf. A 286 (2006) 104–111.
[7] J. Bratby, Coagulation and Flocculation in Water and Wastewater Treatment,second ed., IWA Publishing, London, 2006.
[8] G. Mouedhen, M. Feki, M. De Petris Wery, H.F. Ayedi, Behavior of alu-minium electrodes in electrocoagulation process, J. Hazard. Mater. 150 (2008)124–135.
[9] P. Ganizares, M. Garmona, J. Lobato, F. Martínez, M.A. Rodrigo, Electrodissolu-tion of aluminium electrodes in electrocoagulation processes, Ind. Eng. Chem.Res. 44 (2005) 4178–4185.
[10] J.E. Gregor, C.J. Nokes, E. Fenton, Optimising natural organic matter removalfrom low turbidity waters by controlled pH adjustment of aluminium coagu-lation, Water Res. 31 (12) (1997) 2949–2958.
[11] A.S. Koparal, Y. S Yildiz, B. Keskinler, N. Demircioglu, Effect of initial pH onthe removal of humic substances from wastewater by electrocoagulation, Sep.Purif. Technol. 59 (2008) 175–182.
[12] G. Chen, Electrochemical technologies in wastewater treatment, Sep. Purif.Technol. 38 (2004) 11–41.
[13] N. Daneshvar, H. Ashassi Sorkhabi, M.B. Kasiri, Decolorization of dye solutioncontaining Acid Red 14 by electrocoagulation with a comparative investigationof different electrode connections, J. Hazard. Mater. B112 (2004) 55–62.
[14] A.E. Yilmaz, R. Boncukcuoglu, M.M. Kocakerim, M.T. Yilmaz, C. Paluluoglu,Boron removal from geothermal waters by electrocoagulation, J. Hazard. Mater.153 (2008) 146–151.
[15] R. Myers, D. Montgomery, Response Surface Methodology: Process and ProductOptimization Using Designed Experiments, second ed., John Wiley & Sons Inc.,NY, 2002.
[16] A. Aleboyeh, N. Daneshvar, M.B. Kasiri, Optimization of C.I. Acid Red 14 azo dyeremoval by electrocoagulation batch process with response surface methodol-ogy, Chem. Eng. Process 47 (2008) 827–832.
[17] M. Tir, N. Moulai-Mostefa, Optimization of oil removal from oily wastewater byelectrocoagulation using response surface method, J. Hazard. Mater. 158 (2008)107–115.
[18] M. Vepsäläinen, J. Selin, M. Pulliainen, M. Sillanpää, Combined electrocoagu-lation and chemical coagulation of paper mill mechanically cleaned water, J.Pulp Pap. Sci. 33 (2007) 233–239.
[19] T. Picard, G. Cathalifaud-Feuillade, M. Mazet, C. Vandensteendam, Cathodicdissolution in the electrocoagulation process using aluminium electrodes, J.Environ. Monit. 2 (2000) 77–80.
[20] M. Kabsch-Korbutowicz, Effect of Al coagulant type on natural organic mat-ter removal efficiency in coagulation/ultrafiltration process, Desalination 185(2005) 327–333.

PUBLICATION IV
Precipitation of dissolved sulphide in pulp and
paper mill wastewater by electrocoagulation
In: Environ. Technol. 2011, 32, pp. 1393–1400.Copyright 2011 Taylor & Francis.
Reprinted with permission from the publisher.

IV/2 IV/1
IV/2 IV/1
Environmental Technology
Vol. 32, No. 12, September 2011, 1393–1400
ISSN 0959-3330 print/ISSN 1479-487X online© 2011 Taylor & FrancisDOI: 10.1080/09593330.2010.536790http://www.informaworld.com
Precipitation of dissolved sulphide in pulp and paper mill wastewater by electrocoagulation
Mikko Vepsäläinen
a
*, Jukka Selin
b
, Pekka Rantala
c
, Martti Pulliainen
d
, Heikki Särkkä
a
, Kaisa Kuhmonen
a
, Amit Bhatnagar
e
and Mika Sillanpää
a,f
a
Department of Environmental Science, Laboratory of Applied Environmental Chemistry, University of Eastern Finland, Patteristonkatu 1, FIN-50100 Mikkeli, Finland;
b
UPM-Kymmene Oyj, P.O. Box 35, FIN-42301 Jämsänkoski, Finland;
c
UPM-Kymmene Oyj, P.O. Tehtaankatu 1, FIN-42220 Kaipola, Finland;
d
Savcor Forest Oy, Insinöörinkatu 8, FIN-50100 Mikkeli, Finland;
e
LSRE – Laboratory of Separation and Reaction Engineering, Departamento de Engenharia Química, Faculdade de Engenharia da Universidade do Porto (FEUP), Rua Dr. Roberto Frias, 4200–465 Porto, Portugal;
f
LUT Faculty of Engineering, Lappeenranta University of Technology, Patteristonkatu 1, FI-50190 Mikkeli, Finland
Taylor and Francis
(
Received 4 August 2010; Accepted 26 October 2010
)
10.1080/09593330.2010.536790
The precipitation of dissolved sulphide ions by electrocoagulation was studied at laboratory scale using pulp andpaper mill wastewaters. Concentrations of dissolved organic carbon and phosphorus were analysed before and afterthe electrocoagulation process to examine the suitability of the process for treatment of sulphide odour from pulp andpaper mill wastewater. The electrochemical cell used in this study was constructed from monopolar dissolving ironelectrodes. The dissolved iron concentration was directly proportional to the applied electric charge (C/L) at thetested current densities. Electrochemically produced ferrous iron (Fe
2+
) precipitated dissolved sulphide ionsefficiently. Electricity consumption of the treatment was 4–8 C/mg S
2
−
while iron consumption was 1.1–2.2 mg/mgS
2
−
during the initial phase of the sulphide precipitation when the applied electric charge was 10–60 C/L. When 60C/L was applied, 88% of dissolved sulphides and 40% of phosphorus was precipitated. The reduction in DOC waslow during the sulphide precipitation. According to these results, electrocoagulation can precipitate dissolvedsulphides effectively and thereby reduce sulphide odours of pulp and paper mill wastewaters.
Keywords:
electrocoagulation; sulphide precipitation; odour treatment; pulp and paper mill wastewater; irondissolution
1. Introduction
Disturbing odours originating from pulp and papermills have received increasing public attention duringrecent years. Pulp and paper mill effluents usuallycontain high concentrations of sulphurous compoundsthat can change into malodorous reduced sulphur mole-cules in a low oxygen environment. The mostcommonly found malodorous sulphurous substance ishydrogen sulphide, which forms in the long pipelinesand pipeline facilities. It can be formed within biofilms,where sulphates (present in the wastewater) can beconverted to sulphides as a result of the metabolicactivity of anaerobic sulphate-reducing bacteria (SRB)[1]. Odours, and especially hydrogen sulphide, areregulated by laws in many countries, such as the US,the UK, Germany and Japan [2].
Hydrogen sulphide (H
2
S) has an odour threshold of0.5
µ
g/L. Air above wastewater treatment lagoons cancontain 100 or even 1000 times this threshold concen-tration, resulting in odour problems in the vicinity ofwastewater treatment facilities [3]. Besides common
odour problems, H
2
S also has adverse effects on humanhealth. It penetrates biological membranes, and severalcases of poisoning of industrial workers have beenreported [4]. Hydrogen sulphide concentrations in therange of 250–500 mg/L can cause pulmonary oedema,and concentrations over 500 mg/L cause unconscious-ness, respiratory paralysis and even death. Hydrogensulphide also accelerates corrosion of concrete and iron[5,8]. In the moist sewer atmosphere, a thin water layercontaining a high concentration of hydrogen sulphideforms on the surfaces of the gas space. Sulphur-oxidizingbacteria can oxidize sulphides to sulphuric acid in theanaerobic regions of the biofilms covering submergedand wet sewer walls [9]. The surface pH of the concretecan decrease to below 2.0 after one month of exposureto high hydrogen sulphide concentrations.
Several chemical and biological technologies havebeen proposed for hydrogen sulphide emission control,such as catalytic oxidation, adsorption and biologicaloxidation diffusion into activated sludge [10–12].Commonly used chemical oxidants, such as hydrogen
*Corresponding author. Email: [email protected]
Dow
nloa
ded
by [V
TT],
[Mik
ko V
epsä
läin
en] a
t 22:
53 2
9 Ju
ne 2
011
IV/2 IV/3
1394
M. Vepsäläinen
et al.
peroxide, chlorine, hypochlorite and potassiumpermanganate, oxidize sulphides, thereby decreasingthe amount of malodorous sulphides present in waste-water [10,11]. Biological oxidation of sulphidesthrough the addition of nitrate and nitrite is also a tech-nique that can be used to control sulphide odours. Theformation of H
2
S is also controlled by increasing thepH, which leads to a smaller proportion of volatilesulphides (Equation (1)).
Electrochemical processes can oxidize sulphides toother sulphurous compounds, such as elemental sulphuror sulphates. However, electrochemical oxidation ofsulphides may require a high electric charge pervolume, which can make this process uneconomical forlarge-scale use [13]. Dutta
et al.
recovered sulphidesfrom the effluent from anaerobic paper mill treatment,using an electrochemical process [14]. The sulphideremoved was recovered as pure, concentrated alkalinesulphide/polysulphide solution, from which elementalsulphur can be obtained.
Precipitation of dissolved sulphides is normallyperformed using iron salts, such as ferric chloride orferrous sulphate. Iron salts can be added prior tosulphide formation or to wastewater already containingsulphides. A higher concentration of iron salt is requiredif dosing is conducted before sulphide formation,because iron hydroxides and carbonates are formed, andiron cations only partially react with dissolved sulphideions [15]. Sulphides form black ferrous sulphide (FeS)according to Equation (3) in the presence of Fe
2+
. Fe
3+
can remove sulphides by chemically oxidizing them toelemental sulphur (Equation (4)), while the Fe
2+
formedduring the reaction can subsequently produce FeS(Equation (3)). According to Firer
et al
., the stoichiom-etry of the reaction with Fe
2+
is approximately 1.3 moleof Fe
2+
per 1 mole of S
2
−
removed, and with Fe
3+
, 0.9mole is required per 1 mole of S
2
−
removed [16].According to the results of Zhang
et al.
[17] the additionof Fe
3+
also inhibits SRB activity of anaerobic sewerbiofilms, which is beneficial if ferric salt is dosedupstream of sewers.
Common issues that arise when iron chemicals are usedinclude the corrosion of equipment and a localized
decrease in the pH at the feeding point, which canrelease hydrogen sulphide into the sewer atmosphere.Because of the corrosive nature of the chemicals,special materials, such as titanium, are used in the tanksand piping, increasing capital costs of equipment[10,18].
Electrocoagulation (EC) is an evolving technologythat has been effectively applied in the treatment ofindustrial wastewater containing various pollutants,such as textile wastewaters, chemical mechanicalpolishing wastewaters and olive mill wastewaters [19–21]. Anodes can be made of iron or aluminium, whereascathodes can also be made of other materials, such astitanium or graphite, depending upon the wastewater tobe treated and the contaminants to be removed [22,23].Coagulants dissolved from the anodes during the elec-trochemical process cause destabilization of the pollut-ants. Iron anodes can produce ferrous or ferric ionsaccording to Equation (5). Ferrous and ferric hydrox-ides are produced according to Equation (6), where
m
depends on the pH, and the value of
m
ranges from 0–2for ferrous and 0–3 for ferric ions in the pulp and papermill wastewater pH range [24]. Hydrogen formation onthe cathode (Equation (7)) is usually the main reductionreaction occurring on the iron electrodes during ECtreatment [23]. Fe
2+
is oxidized to Fe
3+
, according toEquation (8), in the presence of dissolved oxygen andneutral or high pH (above 7.0).
Hydrogen evolution can induce flotation of particles[23]. This electroflotation technology can be used forefficient separation of precipitated, coagulated or floc-culated material. Utilization of electroflotation technol-ogy for the treatment of chemically coagulated papermill wastewater has been studied by Mansour
et al.
[25].Murugananthan
et al.
[26,27] and Feng
et al.
[28]have studied sulphurous ion removal from tannery waste-water by electrocoagulation. According to results ofMurugananthan
et al
., sulphide ions were precipitated asmetal sulphides during the treatment, whereas sulphitesand sulphates were enmeshed in the metal hydroxides[26,27]. Sulphides such as pyrite, marcasite, makhinaw-ite, greigite as well as elemental sulphur were detectedin the samples. According to Feng et al. [28], sulphide
H S H HS pKg aq a2 7 04( ) ( ) ( . )↔ + =+ − (1)
HS H S pKaq aq a( ) ( ) ( . )− + −↔ + =2 11 96 (2)
Fe HS FeS Haq aq s( ) ( ) ( )
2+ − ++ → + (3)
2 23 2 0Fe HS Fe S Haq aq aq s( ) ( ) ( )
+ − + ++ → + + (4)
Fe Fe nes aqn
( ) ( )→ ++ − (5)
Fe mOH Fe OHaq
nmn m
( )( )( )+ − − ++ ↔ (6)
2 2 22 2H O e H OHg+ → +− −
( ) (7)
4 10 4 822 2 3Fe H O O Fe OH Haq aq s( ) ( ) ( )( )+ ++ + → + (8)
Dow
nloa
ded
by [V
TT],
[Mik
ko V
epsä
läin
en] a
t 22:
53 2
9 Ju
ne 2
011
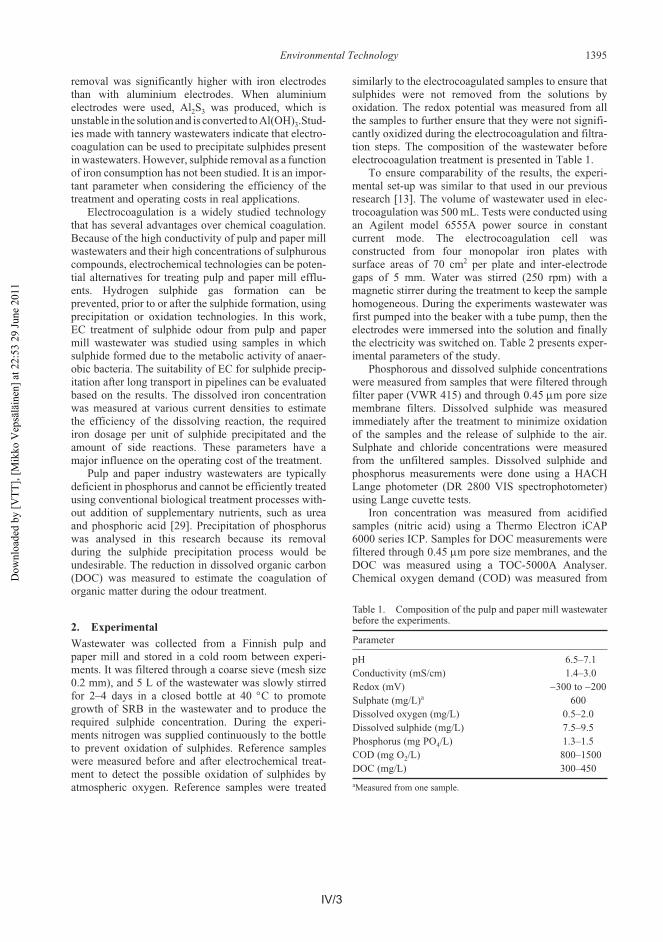
Environmental Technology
1395
removal was significantly higher with iron electrodesthan with aluminium electrodes. When aluminiumelectrodes were used, Al
2
S
3
was produced, which isunstable in the solution and is converted to Al(OH)
3
.Stud-ies made with tannery wastewaters indicate that electro-coagulation can be used to precipitate sulphides presentin wastewaters. However, sulphide removal as a functionof iron consumption has not been studied. It is an impor-tant parameter when considering the efficiency of thetreatment and operating costs in real applications.
Electrocoagulation is a widely studied technologythat has several advantages over chemical coagulation.Because of the high conductivity of pulp and paper millwastewaters and their high concentrations of sulphurouscompounds, electrochemical technologies can be poten-tial alternatives for treating pulp and paper mill efflu-ents. Hydrogen sulphide gas formation can beprevented, prior to or after the sulphide formation, usingprecipitation or oxidation technologies. In this work,EC treatment of sulphide odour from pulp and papermill wastewater was studied using samples in whichsulphide formed due to the metabolic activity of anaer-obic bacteria. The suitability of EC for sulphide precip-itation after long transport in pipelines can be evaluatedbased on the results. The dissolved iron concentrationwas measured at various current densities to estimatethe efficiency of the dissolving reaction, the requirediron dosage per unit of sulphide precipitated and theamount of side reactions. These parameters have amajor influence on the operating cost of the treatment.
Pulp and paper industry wastewaters are typicallydeficient in phosphorus and cannot be efficiently treatedusing conventional biological treatment processes with-out addition of supplementary nutrients, such as ureaand phosphoric acid [29]. Precipitation of phosphoruswas analysed in this research because its removalduring the sulphide precipitation process would beundesirable. The reduction in dissolved organic carbon(DOC) was measured to estimate the coagulation oforganic matter during the odour treatment.
2. Experimental
Wastewater was collected from a Finnish pulp andpaper mill and stored in a cold room between experi-ments. It was filtered through a coarse sieve (mesh size0.2 mm), and 5 L of the wastewater was slowly stirredfor 2–4 days in a closed bottle at 40
°
C to promotegrowth of SRB in the wastewater and to produce therequired sulphide concentration. During the experi-ments nitrogen was supplied continuously to the bottleto prevent oxidation of sulphides. Reference sampleswere measured before and after electrochemical treat-ment to detect the possible oxidation of sulphides byatmospheric oxygen. Reference samples were treated
similarly to the electrocoagulated samples to ensure thatsulphides were not removed from the solutions byoxidation. The redox potential was measured from allthe samples to further ensure that they were not signifi-cantly oxidized during the electrocoagulation and filtra-tion steps. The composition of the wastewater beforeelectrocoagulation treatment is presented in Table 1.
To ensure comparability of the results, the experi-mental set-up was similar to that used in our previousresearch [13]. The volume of wastewater used in elec-trocoagulation was 500 mL. Tests were conducted usingan Agilent model 6555A power source in constantcurrent mode. The electrocoagulation cell wasconstructed from four monopolar iron plates withsurface areas of 70 cm
2
per plate and inter-electrodegaps of 5 mm. Water was stirred (250 rpm) with amagnetic stirrer during the treatment to keep the samplehomogeneous. During the experiments wastewater wasfirst pumped into the beaker with a tube pump, then theelectrodes were immersed into the solution and finallythe electricity was switched on. Table 2 presents exper-imental parameters of the study.
Phosphorous and dissolved sulphide concentrationswere measured from samples that were filtered throughfilter paper (VWR 415) and through 0.45
µ
m pore sizemembrane filters. Dissolved sulphide was measuredimmediately after the treatment to minimize oxidationof the samples and the release of sulphide to the air.Sulphate and chloride concentrations were measuredfrom the unfiltered samples. Dissolved sulphide andphosphorus measurements were done using a HACHLange photometer (DR 2800 VIS spectrophotometer)using Lange cuvette tests.
Iron concentration was measured from acidifiedsamples (nitric acid) using a Thermo Electron iCAP6000 series ICP. Samples for DOC measurements werefiltered through 0.45
µ
m pore size membranes, and theDOC was measured using a TOC-5000A Analyser.Chemical oxygen demand (COD) was measured from
Table 1. Composition of the pulp and paper mill wastewaterbefore the experiments.
Parameter
pH 6.5–7.1Conductivity (mS/cm) 1.4–3.0Redox (mV)
−
300 to
−
200Sulphate (mg/L)
a
600Dissolved oxygen (mg/L) 0.5–2.0Dissolved sulphide (mg/L) 7.5–9.5Phosphorus (mg PO
4
/L) 1.3–1.5COD (mg O
2
/L) 800–1500DOC (mg/L) 300–450
a
Measured from one sample.
Dow
nloa
ded
by [V
TT],
[Mik
ko V
epsä
läin
en] a
t 22:
53 2
9 Ju
ne 2
011
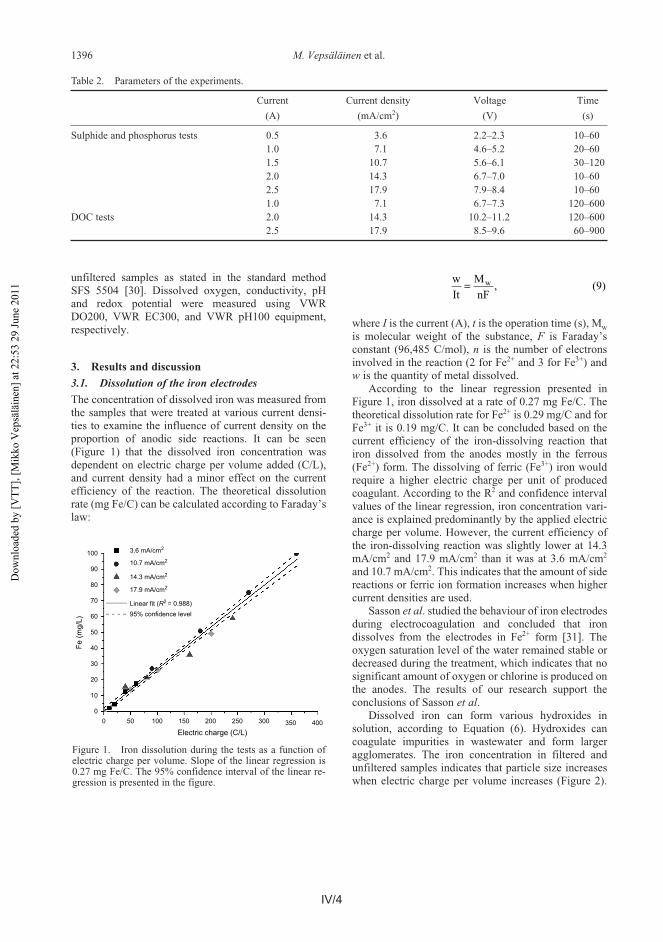
IV/4 IV/5
1396
M. Vepsäläinen
et al.
unfiltered samples as stated in the standard methodSFS 5504 [30]. Dissolved oxygen, conductivity, pHand redox potential were measured using VWRDO200, VWR EC300, and VWR pH100 equipment,respectively.
3. Results and discussion
3.1. Dissolution of the iron electrodes
The concentration of dissolved iron was measured fromthe samples that were treated at various current densi-ties to examine the influence of current density on theproportion of anodic side reactions. It can be seen(Figure 1) that the dissolved iron concentration wasdependent on electric charge per volume added (C/L),and current density had a minor effect on the currentefficiency of the reaction. The theoretical dissolutionrate (mg Fe/C) can be calculated according to Faraday’slaw:
where
I
is the current (A),
t
is the operation time (s), M
w
is molecular weight of the substance,
F
is Faraday’sconstant (96,485 C/mol),
n
is the number of electronsinvolved in the reaction (2 for Fe
2+
and 3 for Fe
3+
) and
w
is the quantity of metal dissolved.
Figure 1. Iron dissolution during the tests as a function of electric charge per volume. Slope of the linear regression is 0.27 mg Fe/C. The 95% confidence interval of the linear regression is presented in the figure.
According to the linear regression presented inFigure 1, iron dissolved at a rate of 0.27 mg Fe/C. Thetheoretical dissolution rate for Fe
2+
is 0.29 mg/C and forFe
3+
it is 0.19 mg/C. It can be concluded based on thecurrent efficiency of the iron-dissolving reaction thatiron dissolved from the anodes mostly in the ferrous(Fe
2+
) form. The dissolving of ferric (Fe
3+
) iron wouldrequire a higher electric charge per unit of producedcoagulant. According to the R
2
and confidence intervalvalues of the linear regression, iron concentration vari-ance is explained predominantly by the applied electriccharge per volume. However, the current efficiency ofthe iron-dissolving reaction was slightly lower at 14.3mA/cm
2
and 17.9 mA/cm
2
than it was at 3.6 mA/cm
2
and 10.7 mA/cm
2
. This indicates that the amount of sidereactions or ferric ion formation increases when highercurrent densities are used.
Sasson
et al
. studied the behaviour of iron electrodesduring electrocoagulation and concluded that irondissolves from the electrodes in Fe
2+
form [31]. Theoxygen saturation level of the water remained stable ordecreased during the treatment, which indicates that nosignificant amount of oxygen or chlorine is produced onthe anodes. The results of our research support theconclusions of Sasson
et al
.Dissolved iron can form various hydroxides in
solution, according to Equation (6). Hydroxides cancoagulate impurities in wastewater and form largeragglomerates. The iron concentration in filtered andunfiltered samples indicates that particle size increaseswhen electric charge per volume increases (Figure 2).
w
It
M
nFw= , (9)
Table 2. Parameters of the experiments.
Current Current density Voltage Time
(A) (mA/cm
2
) (V) (s)
Sulphide and phosphorus tests 0.5 3.6 2.2–2.3 10–601.0 7.1 4.6–5.2 20–601.5 10.7 5.6–6.1 30–1202.0 14.3 6.7–7.0 10–602.5 17.9 7.9–8.4 10–601.0 7.1 6.7–7.3 120–600
DOC tests 2.0 14.3 10.2–11.2 120–6002.5 17.9 8.5–9.6 60–900
Figure 1. Iron dissolution during the tests as a function ofelectric charge per volume. Slope of the linear regression is0.27 mg Fe/C. The 95% confidence interval of the linear re-gression is presented in the figure.
Dow
nloa
ded
by [V
TT],
[Mik
ko V
epsä
läin
en] a
t 22:
53 2
9 Ju
ne 2
011
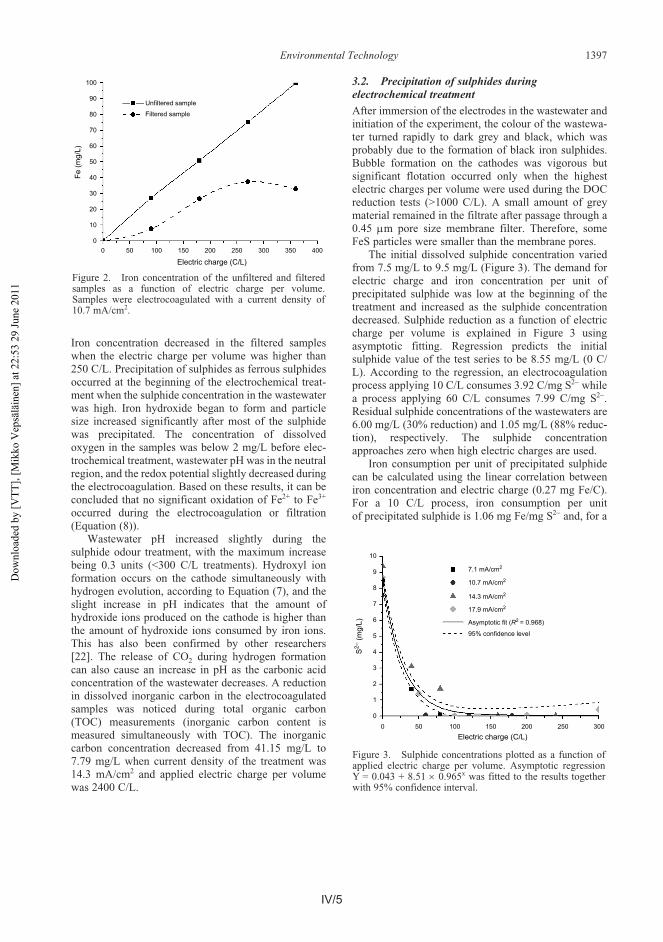
IV/4 IV/5
Environmental Technology
1397
Iron concentration decreased in the filtered sampleswhen the electric charge per volume was higher than250 C/L. Precipitation of sulphides as ferrous sulphidesoccurred at the beginning of the electrochemical treat-ment when the sulphide concentration in the wastewaterwas high. Iron hydroxide began to form and particlesize increased significantly after most of the sulphidewas precipitated. The concentration of dissolvedoxygen in the samples was below 2 mg/L before elec-trochemical treatment, wastewater pH was in the neutralregion, and the redox potential slightly decreased duringthe electrocoagulation. Based on these results, it can beconcluded that no significant oxidation of Fe
2+
to Fe
3+
occurred during the electrocoagulation or filtration(Equation (8)).
Figure 2. Iron concentration of the unfiltered and filtered samples as a function of electric charge per volume. Samples were electrocoagulated with a current density of 10.7 mA/cm
2
.
Wastewater pH increased slightly during thesulphide odour treatment, with the maximum increasebeing 0.3 units (<300 C/L treatments). Hydroxyl ionformation occurs on the cathode simultaneously withhydrogen evolution, according to Equation (7), and theslight increase in pH indicates that the amount ofhydroxide ions produced on the cathode is higher thanthe amount of hydroxide ions consumed by iron ions.This has also been confirmed by other researchers[22]. The release of CO
2
during hydrogen formationcan also cause an increase in pH as the carbonic acidconcentration of the wastewater decreases. A reductionin dissolved inorganic carbon in the electrocoagulatedsamples was noticed during total organic carbon(TOC) measurements (inorganic carbon content ismeasured simultaneously with TOC). The inorganiccarbon concentration decreased from 41.15 mg/L to7.79 mg/L when current density of the treatment was14.3 mA/cm
2
and applied electric charge per volumewas 2400 C/L.
3.2. Precipitation of sulphides during electrochemical treatment
After immersion of the electrodes in the wastewater andinitiation of the experiment, the colour of the wastewa-ter turned rapidly to dark grey and black, which wasprobably due to the formation of black iron sulphides.Bubble formation on the cathodes was vigorous butsignificant flotation occurred only when the highestelectric charges per volume were used during the DOCreduction tests (>1000 C/L). A small amount of greymaterial remained in the filtrate after passage through a0.45
µ
m pore size membrane filter. Therefore, someFeS particles were smaller than the membrane pores.
The initial dissolved sulphide concentration variedfrom 7.5 mg/L to 9.5 mg/L (Figure 3). The demand forelectric charge and iron concentration per unit ofprecipitated sulphide was low at the beginning of thetreatment and increased as the sulphide concentrationdecreased. Sulphide reduction as a function of electriccharge per volume is explained in Figure 3 usingasymptotic fitting. Regression predicts the initialsulphide value of the test series to be 8.55 mg/L (0 C/L). According to the regression, an electrocoagulationprocess applying 10 C/L consumes 3.92 C/mg S
2
−
whilea process applying 60 C/L consumes 7.99 C/mg S
2
−
.Residual sulphide concentrations of the wastewaters are6.00 mg/L (30% reduction) and 1.05 mg/L (88% reduc-tion), respectively. The sulphide concentrationapproaches zero when high electric charges are used.
Figure 3. Sulphide concentrations plotted as a function of applied electric charge per volume. Asymptotic regression Y = 0.043 + 8.51
×
0.965
x
was fitted to the results together with 95% confidence interval.
Iron consumption per unit of precipitated sulphidecan be calculated using the linear correlation betweeniron concentration and electric charge (0.27 mg Fe/C).For a 10 C/L process, iron consumption per unitof precipitated sulphide is 1.06 mg Fe/mg S
2
−
and, for a
Figure 2. Iron concentration of the unfiltered and filteredsamples as a function of electric charge per volume.Samples were electrocoagulated with a current density of10.7 mA/cm2.
Figure 3. Sulphide concentrations plotted as a function ofapplied electric charge per volume. Asymptotic regressionY = 0.043 + 8.51 × 0.965x was fitted to the results togetherwith 95% confidence interval.
Dow
nloa
ded
by [V
TT],
[Mik
ko V
epsä
läin
en] a
t 22:
53 2
9 Ju
ne 2
011
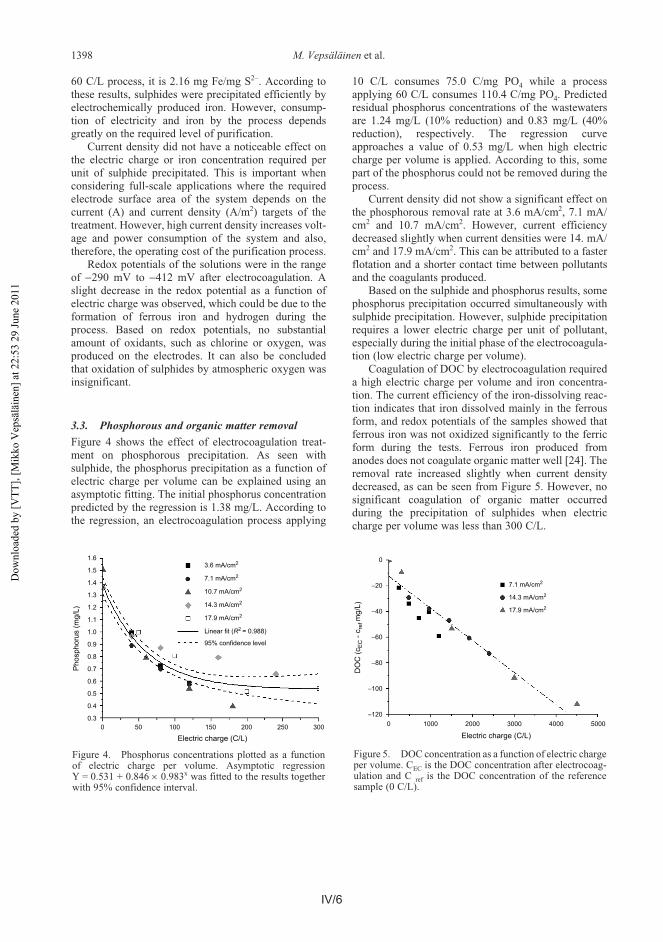
IV/6 IV/7
1398
M. Vepsäläinen
et al.
60 C/L process, it is 2.16 mg Fe/mg S
2
−
. According tothese results, sulphides were precipitated efficiently byelectrochemically produced iron. However, consump-tion of electricity and iron by the process dependsgreatly on the required level of purification.
Current density did not have a noticeable effect onthe electric charge or iron concentration required perunit of sulphide precipitated. This is important whenconsidering full-scale applications where the requiredelectrode surface area of the system depends on thecurrent (A) and current density (A/m
2
) targets of thetreatment. However, high current density increases volt-age and power consumption of the system and also,therefore, the operating cost of the purification process.
Redox potentials of the solutions were in the rangeof
−
290 mV to
−
412 mV after electrocoagulation. Aslight decrease in the redox potential as a function ofelectric charge was observed, which could be due to theformation of ferrous iron and hydrogen during theprocess. Based on redox potentials, no substantialamount of oxidants, such as chlorine or oxygen, wasproduced on the electrodes. It can also be concludedthat oxidation of sulphides by atmospheric oxygen wasinsignificant.
3.3. Phosphorous and organic matter removal
Figure 4 shows the effect of electrocoagulation treat-ment on phosphorous precipitation. As seen withsulphide, the phosphorus precipitation as a function ofelectric charge per volume can be explained using anasymptotic fitting. The initial phosphorus concentrationpredicted by the regression is 1.38 mg/L. According tothe regression, an electrocoagulation process applying
10 C/L consumes 75.0 C/mg PO
4
while a processapplying 60 C/L consumes 110.4 C/mg PO
4
. Predictedresidual phosphorus concentrations of the wastewatersare 1.24 mg/L (10% reduction) and 0.83 mg/L (40%reduction), respectively. The regression curveapproaches a value of 0.53 mg/L when high electriccharge per volume is applied. According to this, somepart of the phosphorus could not be removed during theprocess.
Figure 4. Phosphorus concentrations plotted as a function of electric charge per volume. Asymptotic regression Y = 0.531 + 0.846
×
0.983
x
was fitted to the results together with 95% confidence interval.
Current density did not show a significant effect onthe phosphorous removal rate at 3.6 mA/cm
2
, 7.1 mA/cm
2
and 10.7 mA/cm
2
. However, current efficiencydecreased slightly when current densities were 14. mA/cm
2
and 17.9 mA/cm
2
. This can be attributed to a fasterflotation and a shorter contact time between pollutantsand the coagulants produced.
Based on the sulphide and phosphorus results, somephosphorus precipitation occurred simultaneously withsulphide precipitation. However, sulphide precipitationrequires a lower electric charge per unit of pollutant,especially during the initial phase of the electrocoagula-tion (low electric charge per volume).
Coagulation of DOC by electrocoagulation requireda high electric charge per volume and iron concentra-tion. The current efficiency of the iron-dissolving reac-tion indicates that iron dissolved mainly in the ferrousform, and redox potentials of the samples showed thatferrous iron was not oxidized significantly to the ferricform during the tests. Ferrous iron produced fromanodes does not coagulate organic matter well [24]. Theremoval rate increased slightly when current densitydecreased, as can be seen from Figure 5. However, nosignificant coagulation of organic matter occurredduring the precipitation of sulphides when electriccharge per volume was less than 300 C/L.
Figure 5. DOC concentration as a function of electric charge per volume.
Figure 4. Phosphorus concentrations plotted as a functionof electric charge per volume. Asymptotic regressionY = 0.531 + 0.846 × 0.983x was fitted to the results togetherwith 95% confidence interval.
Figure 5. DOC concentration as a function of electric chargeper volume. CEC is the DOC concentration after electrocoag-ulation and C ref is the DOC concentration of the referencesample (0 C/L).
Dow
nloa
ded
by [V
TT],
[Mik
ko V
epsä
läin
en] a
t 22:
53 2
9 Ju
ne 2
011
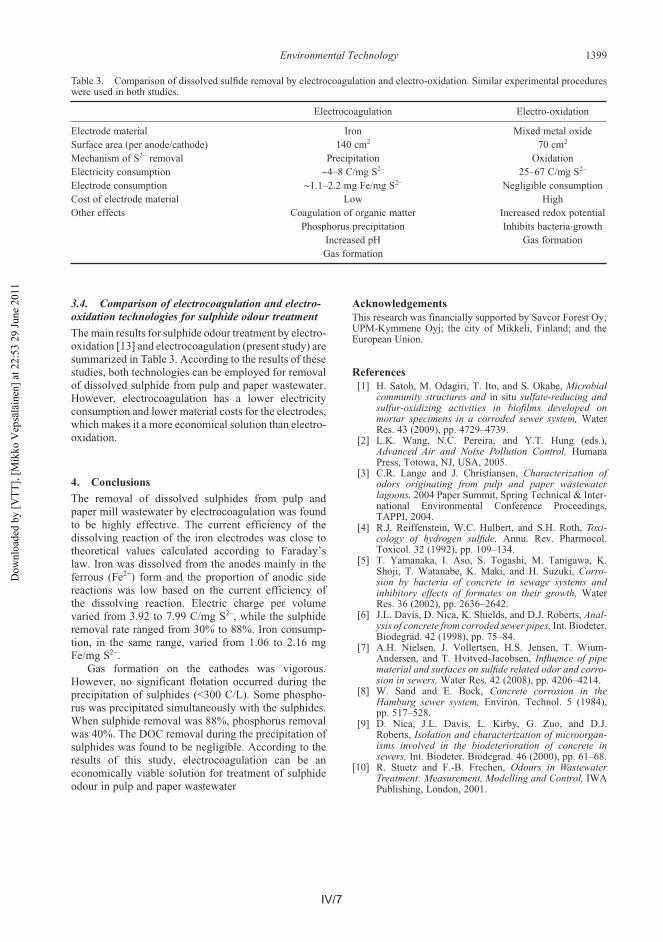
IV/6 IV/7
Environmental Technology 1399
3.4. Comparison of electrocoagulation and electro-oxidation technologies for sulphide odour treatment
The main results for sulphide odour treatment by electro-oxidation [13] and electrocoagulation (present study) aresummarized in Table 3. According to the results of thesestudies, both technologies can be employed for removalof dissolved sulphide from pulp and paper wastewater.However, electrocoagulation has a lower electricityconsumption and lower material costs for the electrodes,which makes it a more economical solution than electro-oxidation.
4. Conclusions
The removal of dissolved sulphides from pulp andpaper mill wastewater by electrocoagulation was foundto be highly effective. The current efficiency of thedissolving reaction of the iron electrodes was close totheoretical values calculated according to Faraday’slaw. Iron was dissolved from the anodes mainly in theferrous (Fe2+) form and the proportion of anodic sidereactions was low based on the current efficiency ofthe dissolving reaction. Electric charge per volumevaried from 3.92 to 7.99 C/mg S2−, while the sulphideremoval rate ranged from 30% to 88%. Iron consump-tion, in the same range, varied from 1.06 to 2.16 mgFe/mg S2−.
Gas formation on the cathodes was vigorous.However, no significant flotation occurred during theprecipitation of sulphides (<300 C/L). Some phospho-rus was precipitated simultaneously with the sulphides.When sulphide removal was 88%, phosphorus removalwas 40%. The DOC removal during the precipitation ofsulphides was found to be negligible. According to theresults of this study, electrocoagulation can be aneconomically viable solution for treatment of sulphideodour in pulp and paper wastewater
AcknowledgementsThis research was financially supported by Savcor Forest Oy;UPM-Kymmene Oyj; the city of Mikkeli, Finland; and theEuropean Union.
References[1] [1] H. Satoh, M. Odagiri, T. Ito, and S. Okabe, Microbial
community structures and in situ sulfate-reducing andsulfur-oxidizing activities in biofilms developed onmortar specimens in a corroded sewer system, WaterRes. 43 (2009), pp. 4729–4739.
[2] [2] L.K. Wang, N.C. Pereira, and Y.T. Hung (eds.),Advanced Air and Noise Pollution Control, HumanaPress, Totowa, NJ, USA, 2005.
[3] [3] C.R. Lange and J. Christiansen, Characterization ofodors originating from pulp and paper wastewaterlagoons, 2004 Paper Summit, Spring Technical & Inter-national Environmental Conference Proceedings,TAPPI, 2004.
[4] [4] R.J. Reiffenstein, W.C. Hulbert, and S.H. Roth, Toxi-cology of hydrogen sulfide, Annu. Rev. Pharmocol.Toxicol. 32 (1992), pp. 109–134.
[5] [5] T. Yamanaka, I. Aso, S. Togashi, M. Tanigawa, K.Shoji, T. Watanabe, K. Maki, and H. Suzuki, Corro-sion by bacteria of concrete in sewage systems andinhibitory effects of formates on their growth, WaterRes. 36 (2002), pp. 2636–2642.
[6] [6] J.L. Davis, D. Nica, K. Shields, and D.J. Roberts, Anal-ysis of concrete from corroded sewer pipes, Int. Biodeter.Biodegrad. 42 (1998), pp. 75–84.
[7] [7] A.H. Nielsen, J. Vollertsen, H.S. Jensen, T. Wium-Andersen, and T. Hvitved-Jacobsen, Influence of pipematerial and surfaces on sulfide related odor and corro-sion in sewers, Water Res. 42 (2008), pp. 4206–4214.
[8] [8] W. Sand and E. Bock, Concrete corrosion in theHamburg sewer system, Environ. Technol. 5 (1984),pp. 517–528.
[9] [9] D. Nica, J.L. Davis, L. Kirby, G. Zuo, and D.J.Roberts, Isolation and characterization of microorgan-isms involved in the biodeterioration of concrete insewers, Int. Biodeter. Biodegrad. 46 (2000), pp. 61–68.
[10][10] R. Stuetz and F.-B. Frechen, Odours in WastewaterTreatment: Measurement, Modelling and Control, IWAPublishing, London, 2001.
Table 3. Comparison of dissolved sulfide removal by electrocoagulation and electro-oxidation. Similar experimental procedureswere used in both studies.
Electrocoagulation Electro-oxidation
Electrode material Iron Mixed metal oxideSurface area (per anode/cathode) 140 cm2 70 cm2
Mechanism of S2− removal Precipitation OxidationElectricity consumption ∼4–8 C/mg S2− 25–67 C/mg S2−
Electrode consumption ∼1.1–2.2 mg Fe/mg S2− Negligible consumptionCost of electrode material Low HighOther effects Coagulation of organic matter Increased redox potential
Phosphorus precipitation Inhibits bacteria growthIncreased pH Gas formationGas formation
Dow
nloa
ded
by [V
TT],
[Mik
ko V
epsä
läin
en] a
t 22:
53 2
9 Ju
ne 2
011
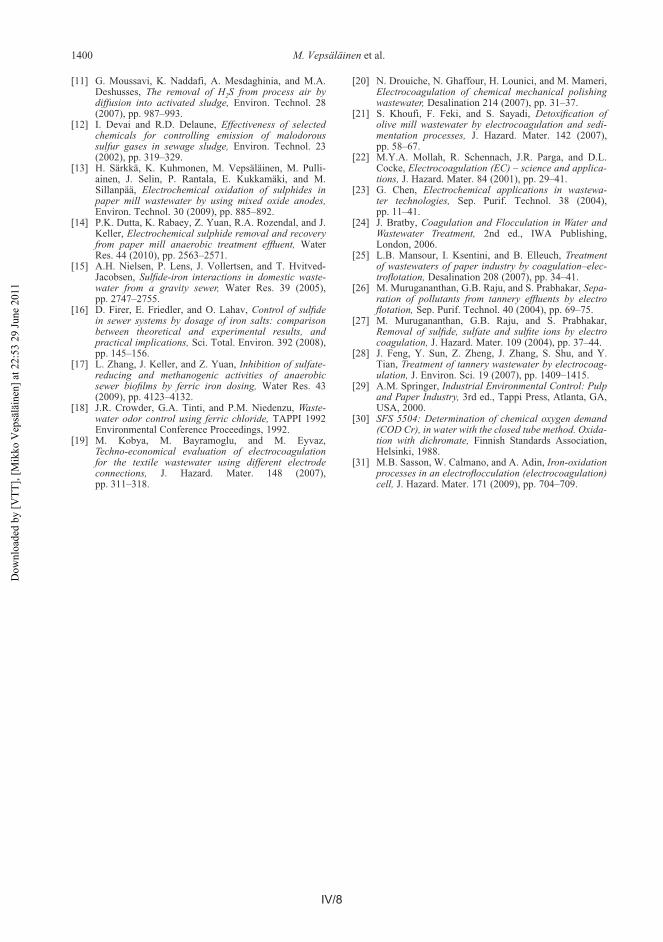
IV/8 IV/9
1400 M. Vepsäläinen et al.
[11][11] G. Moussavi, K. Naddafi, A. Mesdaghinia, and M.A.Deshusses, The removal of H2S from process air bydiffusion into activated sludge, Environ. Technol. 28(2007), pp. 987–993.
[12][12] I. Devai and R.D. Delaune, Effectiveness of selectedchemicals for controlling emission of malodoroussulfur gases in sewage sludge, Environ. Technol. 23(2002), pp. 319–329.
[13][13] H. Särkkä, K. Kuhmonen, M. Vepsäläinen, M. Pulli-ainen, J. Selin, P. Rantala, E. Kukkamäki, and M.Sillanpää, Electrochemical oxidation of sulphides inpaper mill wastewater by using mixed oxide anodes,Environ. Technol. 30 (2009), pp. 885–892.
[14][14] P.K. Dutta, K. Rabaey, Z. Yuan, R.A. Rozendal, and J.Keller, Electrochemical sulphide removal and recoveryfrom paper mill anaerobic treatment effluent, WaterRes. 44 (2010), pp. 2563–2571.
[15][15] A.H. Nielsen, P. Lens, J. Vollertsen, and T. Hvitved-Jacobsen, Sulfide-iron interactions in domestic waste-water from a gravity sewer, Water Res. 39 (2005),pp. 2747–2755.
[16][16] D. Firer, E. Friedler, and O. Lahav, Control of sulfidein sewer systems by dosage of iron salts: comparisonbetween theoretical and experimental results, andpractical implications, Sci. Total. Environ. 392 (2008),pp. 145–156.
[16][17] L. Zhang, J. Keller, and Z. Yuan, Inhibition of sulfate-reducing and methanogenic activities of anaerobicsewer biofilms by ferric iron dosing, Water Res. 43(2009), pp. 4123–4132.
[17][18] J.R. Crowder, G.A. Tinti, and P.M. Niedenzu, Waste-water odor control using ferric chloride, TAPPI 1992Environmental Conference Proceedings, 1992.
[18][19] M. Kobya, M. Bayramoglu, and M. Eyvaz,Techno-economical evaluation of electrocoagulationfor the textile wastewater using different electrodeconnections, J. Hazard. Mater. 148 (2007),pp. 311–318.
[19]
[20] N. Drouiche, N. Ghaffour, H. Lounici, and M. Mameri,Electrocoagulation of chemical mechanical polishingwastewater, Desalination 214 (2007), pp. 31–37.
[20][21] S. Khoufi, F. Feki, and S. Sayadi, Detoxification ofolive mill wastewater by electrocoagulation and sedi-mentation processes, J. Hazard. Mater. 142 (2007),pp. 58–67.
[21][22] M.Y.A. Mollah, R. Schennach, J.R. Parga, and D.L.Cocke, Electrocoagulation (EC) – science and applica-tions, J. Hazard. Mater. 84 (2001), pp. 29–41.
[22][23] G. Chen, Electrochemical applications in wastewa-ter technologies, Sep. Purif. Technol. 38 (2004),pp. 11–41.
[23][24] J. Bratby, Coagulation and Flocculation in Water andWastewater Treatment, 2nd ed., IWA Publishing,London, 2006.
[24][25] L.B. Mansour, I. Ksentini, and B. Elleuch, Treatmentof wastewaters of paper industry by coagulation–elec-troflotation, Desalination 208 (2007), pp. 34–41.
[25][26] M. Murugananthan, G.B. Raju, and S. Prabhakar, Sepa-ration of pollutants from tannery effluents by electroflotation, Sep. Purif. Technol. 40 (2004), pp. 69–75.
[26][27] M. Murugananthan, G.B. Raju, and S. Prabhakar,Removal of sulfide, sulfate and sulfite ions by electrocoagulation, J. Hazard. Mater. 109 (2004), pp. 37–44.
[27][28] J. Feng, Y. Sun, Z. Zheng, J. Zhang, S. Shu, and Y.Tian, Treatment of tannery wastewater by electrocoag-ulation, J. Environ. Sci. 19 (2007), pp. 1409–1415.
[28][29] A.M. Springer, Industrial Environmental Control: Pulpand Paper Industry, 3rd ed., Tappi Press, Atlanta, GA,USA, 2000.
[29][30] SFS 5504: Determination of chemical oxygen demand(COD Cr), in water with the closed tube method. Oxida-tion with dichromate, Finnish Standards Association,Helsinki, 1988.
[30][31] M.B. Sasson, W. Calmano, and A. Adin, Iron-oxidationprocesses in an electroflocculation (electrocoagulation)cell, J. Hazard. Mater. 171 (2009), pp. 704–709.
Dow
nloa
ded
by [V
TT],
[Mik
ko V
epsä
läin
en] a
t 22:
53 2
9 Ju
ne 2
011
IV/8 IV/9
PUBLICATION V
Removal of toxic pollutants from pulp mill effluents by
electrocoagulation
In: Sep. Purif. Technol. 2011, 81, pp. 141–150.Copyright 2011 Elsevier.
Reprinted with permission from the publisher.

V/1
Author's personal copy
Removal of toxic pollutants from pulp mill effluents by electrocoagulation
Mikko Vepsäläinen a,b,⇑, Heli Kivisaari c, Martti Pulliainen d, Aimo Oikari c, Mika Sillanpää b
aVTT Technical Research Centre of Finland, P.O. Box 1000, FI-02044 VTT, Finlandb LUT Faculty of Engineering, Lappeenranta University of Technology, Patteristonkatu 1, FI-50190 Mikkeli, FinlandcEnvironmental Science and Technology, Ambiotica, FI-40014 University of Jyväskylä, Finlandd Savcor Forest Oy, Insinöörinkatu 8, FI-50100 Mikkeli, Finland
a r t i c l e i n f o
Article history:Received 22 April 2011Received in revised form 6 July 2011Accepted 13 July 2011Available online 23 July 2011
Keywords:Pulp and paper mill wastewaterToxicity removalElectrocoagulationResin acidsCopper
a b s t r a c t
This study investigated the effect of electrocoagulation treatment on toxic pollutant removal from pulpmill effluents. Synthetic wastewaters containing wood rosin and copper or pure resin acids were used toinvestigate the removal of resin acids and copper by electrocoagulation. Removal of pollutants by elec-trocoagulation was also tested with real debarking effluent. In this study, statistical experimental designand partial least squares modeling were used to investigate the effect of initial pH, current (current den-sity) and treatment time. Electrocoagulation and subsequent filtration removed resin acids and copperfrom the synthetic wastewaters with high efficiency. Toxicity to algae (Pseudokirchneriella subcapita)was completely eliminated by the treatment, however reduction of bacterial toxicity (Vibrio fischeri)was more limited. While the initial EC50 value for bacteria in debarking effluent was around 8–14 vol%,toxicity was approximately halved by electrocoagulation. Toxicity removal from the debarking effluentswas associated with color removal.
� 2011 Elsevier B.V. All rights reserved.
1. Introduction
Pulp and paper mills generate large amounts of wastewater intheir manufacturing processes. Pollutants are produced duringthe wood debarking, digesting, pulp washing, pulp bleaching andpapermaking processes. Effluents often contain high amounts oftoxic chemicals which originate from raw materials, such as resinacids and tannins, or are produced during the manufacturing pro-cesses, such as chlorinated organic compounds. These pollutantscan cause long-term toxic effects on animal life, such as respiratorystress, toxicity, mutagenicity and genotoxicity [1].
Soil, dirt and bark are removed from the wood raw materialduring the wood preparation stages [2]. Debarking can be carriedout by means of wet processes [3]. Wet processes usually circulatewater in order to reduce water consumption and produce lowereffluent levels. Wet debarking processes remove large amountsof organic matter from the wood and transfer them into the circu-lating water. The effluents are highly colored due to their tannincontent, which contributes to up to 50% of the COD of debarkingwastewater [4]. The effluents are known to exhibit toxicity to bac-teria and fish due to their interaction with enzymes [4–7].
Debarking waters also contain a high concentration of resinacids, which are weak hydrophobic acids. Commonly found resin
acids in pulping wastewaters include isopimaric, sandacopimaric,levopimaric, abietic, dehydroabietic, neoabietic and palustric acids[1,8–10,14]. According to Peng et al., resin acid toxicity is stronglyaffected by wastewater pH which has an effect on the solubility ofthe resin acids [8]. Their toxicity correlates inversely with their sol-ubility, the least soluble being the most toxic. According to the re-sults of Peng et al. and Wilson et al. [8,11], in pulp and paper millwastewaters isopimaric acid is the most toxic resin acid, althoughit is not the most prevalent. In studies with rainbow trout, acutelethal concentrations (LC50) of individual resin acids have beenfound to be in the range of 0.4–1.1 mg/l [12–14]. Oikari et al. re-ported the minimum effective concentration of dehydroabieticacid to be as low as 20 lg/l [15].
Aerobic and anaerobic biological processes are able to removeresin acids from the effluent streams [1,9,10,17,18]. However, dis-charged residue can still be toxic to aquatic organisms [9,10].Debarking effluents also cause problems in wastewater treatmentdue to their toxicity to microbes in the treatment process. Tanninshave been found to be effective inhibitors of methanogens, whichmay in turn inhibit anaerobic biological treatment processes[4,19]. Oligomeric tannins have highest toxicity as they can formstrong hydrogen bonds with proteins [6,20].
Chemical coagulation has been proposed as a treatment fortoxic mechanical pulping effluents and bleaching filtrates [21,22].Resin acids are poorly water soluble, in particular under acidic con-ditions, and are present as colloids, which could be destabilized bychemical coagulants. Stephenson et al. studied toxicity removal
1383-5866/$ - see front matter � 2011 Elsevier B.V. All rights reserved.doi:10.1016/j.seppur.2011.07.017
⇑ Corresponding author at: VTT Technical Research Centre of Finland, P.O.Box 1000, FI-02044 VTT, Finland. Tel.: +358 40 706 4995; fax: +358 15 760 4211.
E-mail address: [email protected] (M. Vepsäläinen).
Separation and Purification Technology 81 (2011) 141–150
Contents lists available at ScienceDirect
Separation and Purification Technology
journal homepage: www.elsevier .com/ locate /seppur
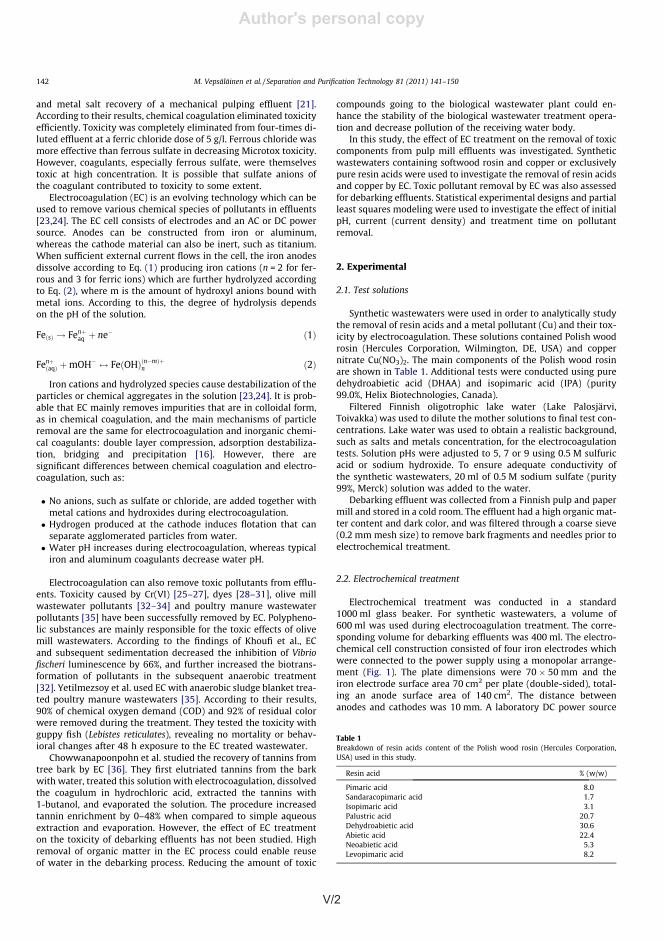
V/2 V/3
Author's personal copy
(Instek PSP-405, Taiwan) was used in constant current mode inall tests. The voltage varied in the tests between 19 and 28 V.
Synthetic wastewaters were treated at room temperature witha constant current of 2 A (current density 14.3 mA/cm2). The ap-plied current was a test variable in the tests with debarking efflu-ent and varied from 1 A (7.1 mA/cm2) to 3 A (21.4 mA/cm2).Wastewater samples were stirred during the electrochemicaltreatments at a speed of 350 rpm using a standard magnetic stirrer.Electrodes were washed with 10% HCl acid solution between treat-ments and rinsed with tap water and distilled water. The treatmentparameters for synthetic wastewaters are shown in Table 2.
After electrocoagulation treatment the samples were allowed tosettle for 10 min and then filtered through a glass fiber filter (GF/CWhatman, nominal pore size 1.2 lm) to simulate particle separa-tion by filtration, sedimentation or flotation.
2.3. Toxicity analysis
Bacterial toxicity was measured using a Microtox-Flash assaybased on the bioluminescence of the marine bacterium V. fischeri.Physical and chemical interference (toxicity) affects the metabo-lism of the bacterial cells and can break down the cell structures,reducing their bioluminescence. The analysis was carried out usingthe BioTox™ method (Aboatox, BO1243-500, Turku, Finland) usinga Sirius luminometer (Berrthold Detection Systems, Germany).Measurements were conducted according to the Aboatox manual,standard draft ISO/CD 2006b, and the method developed by Lapp-alainen et al. [37]. Luminescence was measured after 15 s, 5, 15and 30 min exposure times at five different sample concentrations.The sample concentration required to reduce bioluminescence by50% (EC50) was calculated based on the results. The negative con-trol solution was 2% NaCl, whereas K2Cr2O7 was used as the posi-tive reference chemical.
Toxicity to algae (Pseudokirchneriella subcapita) was analyzedaccording to standard ISO:8692 (1989). In contrast to the standardprocedure, the sample size was reduced to fit 48-well microplates(Greiner bio-one GmbH, Germany). The average algal cell concen-tration prior to exposure to wastewaters was measured using amicroscope (Olympus BX40, Japan) and cytometer (Assistant, Ger-many). Fluorescence emitted by the algae was measured prior toexposure and 24, 48 and 72 h after exposure to wastewaters usinga fluorometer (Fluoroscan Ascent, Labsystems, Finland). A negativecontrol was conducted with nutrient solutions. K2Cr2O7 was usedas the positive reference substance.
2.4. Chemical analysis
The metal concentrations of the acidified samples were mea-sured using an ICP system (Thermo Electron Corporation, USA).DOC samples were filtered through 0.45 lm pore size PTFE mem-branes and analyzed using a TOC system (Shimadzu, Japan). Color(PtCo) was measured using a photometer (Hach Lange DR2800,Germany) and turbidity using a turbidimeter (Model 2100P ISOturbidimeter, Hach, Germany). Resin acids were measured accord-ing to the method described by Soimasuo et al. [38] using a GC–MSsystem (HP 6890, Hewlett-Packard, Germany) with an HP-5 capil-lary column. Z-potentials were measured using a Zetasizer Nano ZS(Malvern, USA).
2.5. Design of experiments and modeling
The design of experiments (DOE) and modeling of the resultswere performed using Umetrics MODDE 8.0. The DOE was carriedout using a Central Composite Face (CCF) design. The model factors
Fig. 1. Schematic diagram of the EC reactor with monopolar electrodes.
Table 2Removal percentages of resin acids and copper in electrocoagulation and filtration.
Initial pH Treatment time (s) Initial resin concentration Initial Cu concentration
25 mg/l 75 mg/l 125 mg/l 0.25 mg/l 0.75 mg/l 1.25 mg/l
5 0 (filtration) 74 66 54 19 36 160 86 94 97 80 95 96300 84 92 88 91 98 100600 86 93 98 99
7 0 (filtration) 63 63 57 21 25 060 93 93 93 72 94 97300 90 87 85 89 99 100600 74 86 86 84 100 99
9 0 (filtration) 64 46 2 27 31 060 83 92 77 78 95 97300 85 83 55 91 99 100600 59 95 62 99 99 100
M. Vepsäläinen et al. / Separation and Purification Technology 81 (2011) 141–150 143
Author's personal copy
and metal salt recovery of a mechanical pulping effluent [21].According to their results, chemical coagulation eliminated toxicityefficiently. Toxicity was completely eliminated from four-times di-luted effluent at a ferric chloride dose of 5 g/l. Ferrous chloride wasmore effective than ferrous sulfate in decreasing Microtox toxicity.However, coagulants, especially ferrous sulfate, were themselvestoxic at high concentration. It is possible that sulfate anions ofthe coagulant contributed to toxicity to some extent.
Electrocoagulation (EC) is an evolving technology which can beused to remove various chemical species of pollutants in effluents[23,24]. The EC cell consists of electrodes and an AC or DC powersource. Anodes can be constructed from iron or aluminum,whereas the cathode material can also be inert, such as titanium.When sufficient external current flows in the cell, the iron anodesdissolve according to Eq. (1) producing iron cations (n = 2 for fer-rous and 3 for ferric ions) which are further hydrolyzed accordingto Eq. (2), where m is the amount of hydroxyl anions bound withmetal ions. According to this, the degree of hydrolysis dependson the pH of the solution.
FeðsÞ ! Fenþaq þ ne� ð1Þ
FenþðaqÞ þmOH� $ FeðOHÞðn�mÞþn ð2Þ
Iron cations and hydrolyzed species cause destabilization of theparticles or chemical aggregates in the solution [23,24]. It is prob-able that EC mainly removes impurities that are in colloidal form,as in chemical coagulation, and the main mechanisms of particleremoval are the same for electrocoagulation and inorganic chemi-cal coagulants: double layer compression, adsorption destabiliza-tion, bridging and precipitation [16]. However, there aresignificant differences between chemical coagulation and electro-coagulation, such as:
� No anions, such as sulfate or chloride, are added together withmetal cations and hydroxides during electrocoagulation.
� Hydrogen produced at the cathode induces flotation that canseparate agglomerated particles from water.
� Water pH increases during electrocoagulation, whereas typicaliron and aluminum coagulants decrease water pH.
Electrocoagulation can also remove toxic pollutants from efflu-ents. Toxicity caused by Cr(VI) [25–27], dyes [28–31], olive millwastewater pollutants [32–34] and poultry manure wastewaterpollutants [35] have been successfully removed by EC. Polypheno-lic substances are mainly responsible for the toxic effects of olivemill wastewaters. According to the findings of Khoufi et al., ECand subsequent sedimentation decreased the inhibition of Vibriofischeri luminescence by 66%, and further increased the biotrans-formation of pollutants in the subsequent anaerobic treatment[32]. Yetilmezsoy et al. used EC with anaerobic sludge blanket trea-ted poultry manure wastewaters [35]. According to their results,90% of chemical oxygen demand (COD) and 92% of residual colorwere removed during the treatment. They tested the toxicity withguppy fish (Lebistes reticulates), revealing no mortality or behav-ioral changes after 48 h exposure to the EC treated wastewater.
Chowwanapoonpohn et al. studied the recovery of tannins fromtree bark by EC [36]. They first elutriated tannins from the barkwith water, treated this solution with electrocoagulation, dissolvedthe coagulum in hydrochloric acid, extracted the tannins with1-butanol, and evaporated the solution. The procedure increasedtannin enrichment by 0–48% when compared to simple aqueousextraction and evaporation. However, the effect of EC treatmenton the toxicity of debarking effluents has not been studied. Highremoval of organic matter in the EC process could enable reuseof water in the debarking process. Reducing the amount of toxic
compounds going to the biological wastewater plant could en-hance the stability of the biological wastewater treatment opera-tion and decrease pollution of the receiving water body.
In this study, the effect of EC treatment on the removal of toxiccomponents from pulp mill effluents was investigated. Syntheticwastewaters containing softwood rosin and copper or exclusivelypure resin acids were used to investigate the removal of resin acidsand copper by EC. Toxic pollutant removal by EC was also assessedfor debarking effluents. Statistical experimental designs and partialleast squares modeling were used to investigate the effect of initialpH, current (current density) and treatment time on pollutantremoval.
2. Experimental
2.1. Test solutions
Synthetic wastewaters were used in order to analytically studythe removal of resin acids and a metal pollutant (Cu) and their tox-icity by electrocoagulation. These solutions contained Polish woodrosin (Hercules Corporation, Wilmington, DE, USA) and coppernitrate Cu(NO3)2. The main components of the Polish wood rosinare shown in Table 1. Additional tests were conducted using puredehydroabietic acid (DHAA) and isopimaric acid (IPA) (purity99.0%, Helix Biotechnologies, Canada).
Filtered Finnish oligotrophic lake water (Lake Palosjärvi,Toivakka) was used to dilute the mother solutions to final test con-centrations. Lake water was used to obtain a realistic background,such as salts and metals concentration, for the electrocoagulationtests. Solution pHs were adjusted to 5, 7 or 9 using 0.5 M sulfuricacid or sodium hydroxide. To ensure adequate conductivity ofthe synthetic wastewaters, 20 ml of 0.5 M sodium sulfate (purity99%, Merck) solution was added to the water.
Debarking effluent was collected from a Finnish pulp and papermill and stored in a cold room. The effluent had a high organic mat-ter content and dark color, and was filtered through a coarse sieve(0.2 mm mesh size) to remove bark fragments and needles prior toelectrochemical treatment.
2.2. Electrochemical treatment
Electrochemical treatment was conducted in a standard1000 ml glass beaker. For synthetic wastewaters, a volume of600 ml was used during electrocoagulation treatment. The corre-sponding volume for debarking effluents was 400 ml. The electro-chemical cell construction consisted of four iron electrodes whichwere connected to the power supply using a monopolar arrange-ment (Fig. 1). The plate dimensions were 70 � 50 mm and theiron electrode surface area 70 cm2 per plate (double-sided), total-ing an anode surface area of 140 cm2. The distance betweenanodes and cathodes was 10 mm. A laboratory DC power source
Table 1Breakdown of resin acids content of the Polish wood rosin (Hercules Corporation,USA) used in this study.
Resin acid % (w/w)
Pimaric acid 8.0Sandaracopimaric acid 1.7Isopimaric acid 3.1Palustric acid 20.7Dehydroabietic acid 30.6Abietic acid 22.4Neoabietic acid 5.3Levopimaric acid 8.2
142 M. Vepsäläinen et al. / Separation and Purification Technology 81 (2011) 141–150

V/3
Author's personal copy
(Instek PSP-405, Taiwan) was used in constant current mode inall tests. The voltage varied in the tests between 19 and 28 V.
Synthetic wastewaters were treated at room temperature witha constant current of 2 A (current density 14.3 mA/cm2). The ap-plied current was a test variable in the tests with debarking efflu-ent and varied from 1 A (7.1 mA/cm2) to 3 A (21.4 mA/cm2).Wastewater samples were stirred during the electrochemicaltreatments at a speed of 350 rpm using a standard magnetic stirrer.Electrodes were washed with 10% HCl acid solution between treat-ments and rinsed with tap water and distilled water. The treatmentparameters for synthetic wastewaters are shown in Table 2.
After electrocoagulation treatment the samples were allowed tosettle for 10 min and then filtered through a glass fiber filter (GF/CWhatman, nominal pore size 1.2 lm) to simulate particle separa-tion by filtration, sedimentation or flotation.
2.3. Toxicity analysis
Bacterial toxicity was measured using a Microtox-Flash assaybased on the bioluminescence of the marine bacterium V. fischeri.Physical and chemical interference (toxicity) affects the metabo-lism of the bacterial cells and can break down the cell structures,reducing their bioluminescence. The analysis was carried out usingthe BioTox™ method (Aboatox, BO1243-500, Turku, Finland) usinga Sirius luminometer (Berrthold Detection Systems, Germany).Measurements were conducted according to the Aboatox manual,standard draft ISO/CD 2006b, and the method developed by Lapp-alainen et al. [37]. Luminescence was measured after 15 s, 5, 15and 30 min exposure times at five different sample concentrations.The sample concentration required to reduce bioluminescence by50% (EC50) was calculated based on the results. The negative con-trol solution was 2% NaCl, whereas K2Cr2O7 was used as the posi-tive reference chemical.
Toxicity to algae (Pseudokirchneriella subcapita) was analyzedaccording to standard ISO:8692 (1989). In contrast to the standardprocedure, the sample size was reduced to fit 48-well microplates(Greiner bio-one GmbH, Germany). The average algal cell concen-tration prior to exposure to wastewaters was measured using amicroscope (Olympus BX40, Japan) and cytometer (Assistant, Ger-many). Fluorescence emitted by the algae was measured prior toexposure and 24, 48 and 72 h after exposure to wastewaters usinga fluorometer (Fluoroscan Ascent, Labsystems, Finland). A negativecontrol was conducted with nutrient solutions. K2Cr2O7 was usedas the positive reference substance.
2.4. Chemical analysis
The metal concentrations of the acidified samples were mea-sured using an ICP system (Thermo Electron Corporation, USA).DOC samples were filtered through 0.45 lm pore size PTFE mem-branes and analyzed using a TOC system (Shimadzu, Japan). Color(PtCo) was measured using a photometer (Hach Lange DR2800,Germany) and turbidity using a turbidimeter (Model 2100P ISOturbidimeter, Hach, Germany). Resin acids were measured accord-ing to the method described by Soimasuo et al. [38] using a GC–MSsystem (HP 6890, Hewlett-Packard, Germany) with an HP-5 capil-lary column. Z-potentials were measured using a Zetasizer Nano ZS(Malvern, USA).
2.5. Design of experiments and modeling
The design of experiments (DOE) and modeling of the resultswere performed using Umetrics MODDE 8.0. The DOE was carriedout using a Central Composite Face (CCF) design. The model factors
Fig. 1. Schematic diagram of the EC reactor with monopolar electrodes.
Table 2Removal percentages of resin acids and copper in electrocoagulation and filtration.
Initial pH Treatment time (s) Initial resin concentration Initial Cu concentration
25 mg/l 75 mg/l 125 mg/l 0.25 mg/l 0.75 mg/l 1.25 mg/l
5 0 (filtration) 74 66 54 19 36 160 86 94 97 80 95 96300 84 92 88 91 98 100600 86 93 98 99
7 0 (filtration) 63 63 57 21 25 060 93 93 93 72 94 97300 90 87 85 89 99 100600 74 86 86 84 100 99
9 0 (filtration) 64 46 2 27 31 060 83 92 77 78 95 97300 85 83 55 91 99 100600 59 95 62 99 99 100
M. Vepsäläinen et al. / Separation and Purification Technology 81 (2011) 141–150 143
Author's personal copy
and metal salt recovery of a mechanical pulping effluent [21].According to their results, chemical coagulation eliminated toxicityefficiently. Toxicity was completely eliminated from four-times di-luted effluent at a ferric chloride dose of 5 g/l. Ferrous chloride wasmore effective than ferrous sulfate in decreasing Microtox toxicity.However, coagulants, especially ferrous sulfate, were themselvestoxic at high concentration. It is possible that sulfate anions ofthe coagulant contributed to toxicity to some extent.
Electrocoagulation (EC) is an evolving technology which can beused to remove various chemical species of pollutants in effluents[23,24]. The EC cell consists of electrodes and an AC or DC powersource. Anodes can be constructed from iron or aluminum,whereas the cathode material can also be inert, such as titanium.When sufficient external current flows in the cell, the iron anodesdissolve according to Eq. (1) producing iron cations (n = 2 for fer-rous and 3 for ferric ions) which are further hydrolyzed accordingto Eq. (2), where m is the amount of hydroxyl anions bound withmetal ions. According to this, the degree of hydrolysis dependson the pH of the solution.
FeðsÞ ! Fenþaq þ ne� ð1Þ
FenþðaqÞ þmOH� $ FeðOHÞðn�mÞþn ð2Þ
Iron cations and hydrolyzed species cause destabilization of theparticles or chemical aggregates in the solution [23,24]. It is prob-able that EC mainly removes impurities that are in colloidal form,as in chemical coagulation, and the main mechanisms of particleremoval are the same for electrocoagulation and inorganic chemi-cal coagulants: double layer compression, adsorption destabiliza-tion, bridging and precipitation [16]. However, there aresignificant differences between chemical coagulation and electro-coagulation, such as:
� No anions, such as sulfate or chloride, are added together withmetal cations and hydroxides during electrocoagulation.
� Hydrogen produced at the cathode induces flotation that canseparate agglomerated particles from water.
� Water pH increases during electrocoagulation, whereas typicaliron and aluminum coagulants decrease water pH.
Electrocoagulation can also remove toxic pollutants from efflu-ents. Toxicity caused by Cr(VI) [25–27], dyes [28–31], olive millwastewater pollutants [32–34] and poultry manure wastewaterpollutants [35] have been successfully removed by EC. Polypheno-lic substances are mainly responsible for the toxic effects of olivemill wastewaters. According to the findings of Khoufi et al., ECand subsequent sedimentation decreased the inhibition of Vibriofischeri luminescence by 66%, and further increased the biotrans-formation of pollutants in the subsequent anaerobic treatment[32]. Yetilmezsoy et al. used EC with anaerobic sludge blanket trea-ted poultry manure wastewaters [35]. According to their results,90% of chemical oxygen demand (COD) and 92% of residual colorwere removed during the treatment. They tested the toxicity withguppy fish (Lebistes reticulates), revealing no mortality or behav-ioral changes after 48 h exposure to the EC treated wastewater.
Chowwanapoonpohn et al. studied the recovery of tannins fromtree bark by EC [36]. They first elutriated tannins from the barkwith water, treated this solution with electrocoagulation, dissolvedthe coagulum in hydrochloric acid, extracted the tannins with1-butanol, and evaporated the solution. The procedure increasedtannin enrichment by 0–48% when compared to simple aqueousextraction and evaporation. However, the effect of EC treatmenton the toxicity of debarking effluents has not been studied. Highremoval of organic matter in the EC process could enable reuseof water in the debarking process. Reducing the amount of toxic
compounds going to the biological wastewater plant could en-hance the stability of the biological wastewater treatment opera-tion and decrease pollution of the receiving water body.
In this study, the effect of EC treatment on the removal of toxiccomponents from pulp mill effluents was investigated. Syntheticwastewaters containing softwood rosin and copper or exclusivelypure resin acids were used to investigate the removal of resin acidsand copper by EC. Toxic pollutant removal by EC was also assessedfor debarking effluents. Statistical experimental designs and partialleast squares modeling were used to investigate the effect of initialpH, current (current density) and treatment time on pollutantremoval.
2. Experimental
2.1. Test solutions
Synthetic wastewaters were used in order to analytically studythe removal of resin acids and a metal pollutant (Cu) and their tox-icity by electrocoagulation. These solutions contained Polish woodrosin (Hercules Corporation, Wilmington, DE, USA) and coppernitrate Cu(NO3)2. The main components of the Polish wood rosinare shown in Table 1. Additional tests were conducted using puredehydroabietic acid (DHAA) and isopimaric acid (IPA) (purity99.0%, Helix Biotechnologies, Canada).
Filtered Finnish oligotrophic lake water (Lake Palosjärvi,Toivakka) was used to dilute the mother solutions to final test con-centrations. Lake water was used to obtain a realistic background,such as salts and metals concentration, for the electrocoagulationtests. Solution pHs were adjusted to 5, 7 or 9 using 0.5 M sulfuricacid or sodium hydroxide. To ensure adequate conductivity ofthe synthetic wastewaters, 20 ml of 0.5 M sodium sulfate (purity99%, Merck) solution was added to the water.
Debarking effluent was collected from a Finnish pulp and papermill and stored in a cold room. The effluent had a high organic mat-ter content and dark color, and was filtered through a coarse sieve(0.2 mm mesh size) to remove bark fragments and needles prior toelectrochemical treatment.
2.2. Electrochemical treatment
Electrochemical treatment was conducted in a standard1000 ml glass beaker. For synthetic wastewaters, a volume of600 ml was used during electrocoagulation treatment. The corre-sponding volume for debarking effluents was 400 ml. The electro-chemical cell construction consisted of four iron electrodes whichwere connected to the power supply using a monopolar arrange-ment (Fig. 1). The plate dimensions were 70 � 50 mm and theiron electrode surface area 70 cm2 per plate (double-sided), total-ing an anode surface area of 140 cm2. The distance betweenanodes and cathodes was 10 mm. A laboratory DC power source
Table 1Breakdown of resin acids content of the Polish wood rosin (Hercules Corporation,USA) used in this study.
Resin acid % (w/w)
Pimaric acid 8.0Sandaracopimaric acid 1.7Isopimaric acid 3.1Palustric acid 20.7Dehydroabietic acid 30.6Abietic acid 22.4Neoabietic acid 5.3Levopimaric acid 8.2
142 M. Vepsäläinen et al. / Separation and Purification Technology 81 (2011) 141–150
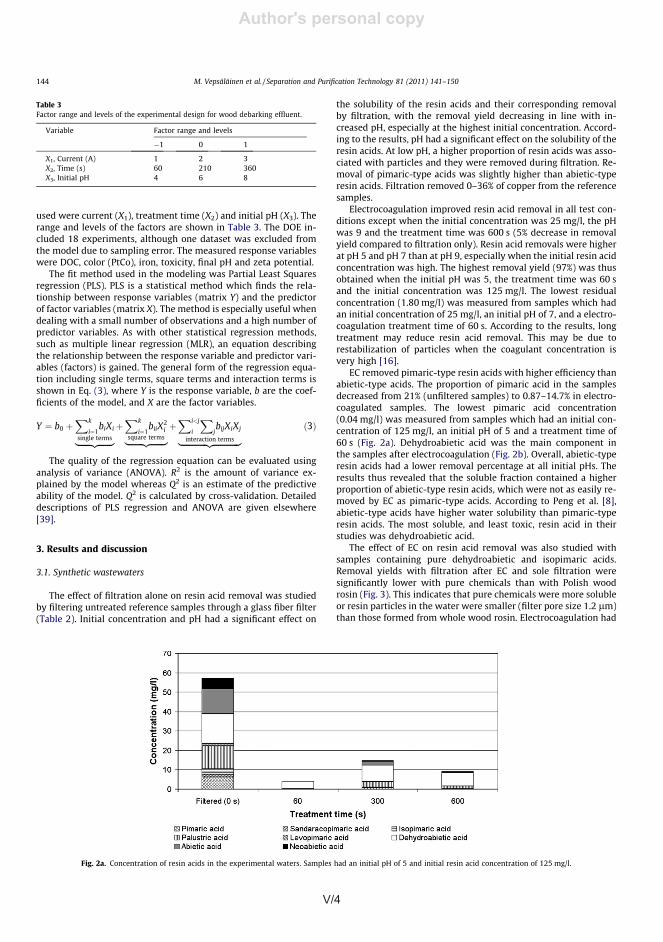
V/4 V/5
Author's personal copy
a stronger effect on isopimaric acid removal than dehydroabieticacid removal, which is consistent with the results gained with Pol-ish wood rosin.
Electrocoagulation and filtration removed copper from thesolutions with very high efficiency. Treatment for 60 s followedby filtration removed 72–97% of copper from the solutions.
Proportionally, the lowest reduction was measured fromsamples with the lowest initial concentration (0.25 mg/l). How-ever, the residual concentration of the samples was similar forall samples after electrocoagulation (0.01–0.07 mg/l). As ex-pected, iron concentrations in the electrocoagulated sampleswere higher than in the references. Iron concentrations were
Fig. 2b. Concentration of resin acids in the water samples. Samples had an initial resin acid concentration of 125 mg/l and were treated with electrocoagulation for 60 s.
Fig. 3. Concentration of dehydroabietic acid and isopimaric acid in the samples after electrocoagulation and filtration.
Fig. 4. Bacterial toxicity of the samples after electrocoagulation and filtration. EC50 values are based on the solution strength (%) causing a 50% reduction in bioluminescence.
M. Vepsäläinen et al. / Separation and Purification Technology 81 (2011) 141–150 145
Author's personal copy
used were current (X1), treatment time (X2) and initial pH (X3). Therange and levels of the factors are shown in Table 3. The DOE in-cluded 18 experiments, although one dataset was excluded fromthe model due to sampling error. The measured response variableswere DOC, color (PtCo), iron, toxicity, final pH and zeta potential.
The fit method used in the modeling was Partial Least Squaresregression (PLS). PLS is a statistical method which finds the rela-tionship between response variables (matrix Y) and the predictorof factor variables (matrix X). The method is especially useful whendealing with a small number of observations and a high number ofpredictor variables. As with other statistical regression methods,such as multiple linear regression (MLR), an equation describingthe relationship between the response variable and predictor vari-ables (factors) is gained. The general form of the regression equa-tion including single terms, square terms and interaction terms isshown in Eq. (3), where Y is the response variable, b are the coef-ficients of the model, and X are the factor variables.
Y ¼ b0 þXk
i¼1biXi
single terms|fflfflfflfflfflffl{zfflfflfflfflfflffl}þXk
i¼1biiX
2i
square terms|fflfflfflfflfflfflffl{zfflfflfflfflfflfflffl}þXi<j
i
XjbijXiXj
interaction terms|fflfflfflfflfflfflfflfflfflfflfflfflffl{zfflfflfflfflfflfflfflfflfflfflfflfflffl}ð3Þ
The quality of the regression equation can be evaluated usinganalysis of variance (ANOVA). R2 is the amount of variance ex-plained by the model whereas Q2 is an estimate of the predictiveability of the model. Q2 is calculated by cross-validation. Detaileddescriptions of PLS regression and ANOVA are given elsewhere[39].
3. Results and discussion
3.1. Synthetic wastewaters
The effect of filtration alone on resin acid removal was studiedby filtering untreated reference samples through a glass fiber filter(Table 2). Initial concentration and pH had a significant effect on
the solubility of the resin acids and their corresponding removalby filtration, with the removal yield decreasing in line with in-creased pH, especially at the highest initial concentration. Accord-ing to the results, pH had a significant effect on the solubility of theresin acids. At low pH, a higher proportion of resin acids was asso-ciated with particles and they were removed during filtration. Re-moval of pimaric-type acids was slightly higher than abietic-typeresin acids. Filtration removed 0–36% of copper from the referencesamples.
Electrocoagulation improved resin acid removal in all test con-ditions except when the initial concentration was 25 mg/l, the pHwas 9 and the treatment time was 600 s (5% decrease in removalyield compared to filtration only). Resin acid removals were higherat pH 5 and pH 7 than at pH 9, especially when the initial resin acidconcentration was high. The highest removal yield (97%) was thusobtained when the initial pH was 5, the treatment time was 60 sand the initial concentration was 125 mg/l. The lowest residualconcentration (1.80 mg/l) was measured from samples which hadan initial concentration of 25 mg/l, an initial pH of 7, and a electro-coagulation treatment time of 60 s. According to the results, longtreatment may reduce resin acid removal. This may be due torestabilization of particles when the coagulant concentration isvery high [16].
EC removed pimaric-type resin acids with higher efficiency thanabietic-type acids. The proportion of pimaric acid in the samplesdecreased from 21% (unfiltered samples) to 0.87–14.7% in electro-coagulated samples. The lowest pimaric acid concentration(0.04 mg/l) was measured from samples which had an initial con-centration of 125 mg/l, an initial pH of 5 and a treatment time of60 s (Fig. 2a). Dehydroabietic acid was the main component inthe samples after electrocoagulation (Fig. 2b). Overall, abietic-typeresin acids had a lower removal percentage at all initial pHs. Theresults thus revealed that the soluble fraction contained a higherproportion of abietic-type resin acids, which were not as easily re-moved by EC as pimaric-type acids. According to Peng et al. [8],abietic-type acids have higher water solubility than pimaric-typeresin acids. The most soluble, and least toxic, resin acid in theirstudies was dehydroabietic acid.
The effect of EC on resin acid removal was also studied withsamples containing pure dehydroabietic and isopimaric acids.Removal yields with filtration after EC and sole filtration weresignificantly lower with pure chemicals than with Polish woodrosin (Fig. 3). This indicates that pure chemicals were more solubleor resin particles in the water were smaller (filter pore size 1.2 lm)than those formed from whole wood rosin. Electrocoagulation had
Table 3Factor range and levels of the experimental design for wood debarking effluent.
Variable Factor range and levels
�1 0 1
X1, Current (A) 1 2 3X2, Time (s) 60 210 360X3, Initial pH 4 6 8
Fig. 2a. Concentration of resin acids in the experimental waters. Samples had an initial pH of 5 and initial resin acid concentration of 125 mg/l.
144 M. Vepsäläinen et al. / Separation and Purification Technology 81 (2011) 141–150
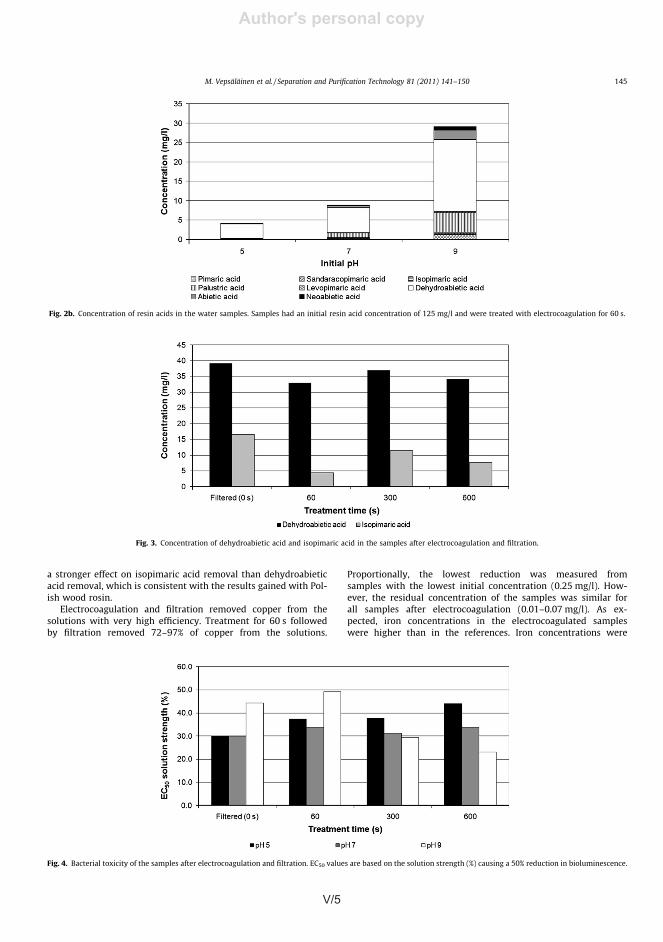
V/5
Author's personal copy
a stronger effect on isopimaric acid removal than dehydroabieticacid removal, which is consistent with the results gained with Pol-ish wood rosin.
Electrocoagulation and filtration removed copper from thesolutions with very high efficiency. Treatment for 60 s followedby filtration removed 72–97% of copper from the solutions.
Proportionally, the lowest reduction was measured fromsamples with the lowest initial concentration (0.25 mg/l). How-ever, the residual concentration of the samples was similar forall samples after electrocoagulation (0.01–0.07 mg/l). As ex-pected, iron concentrations in the electrocoagulated sampleswere higher than in the references. Iron concentrations were
Fig. 2b. Concentration of resin acids in the water samples. Samples had an initial resin acid concentration of 125 mg/l and were treated with electrocoagulation for 60 s.
Fig. 3. Concentration of dehydroabietic acid and isopimaric acid in the samples after electrocoagulation and filtration.
Fig. 4. Bacterial toxicity of the samples after electrocoagulation and filtration. EC50 values are based on the solution strength (%) causing a 50% reduction in bioluminescence.
M. Vepsäläinen et al. / Separation and Purification Technology 81 (2011) 141–150 145
Author's personal copy
used were current (X1), treatment time (X2) and initial pH (X3). Therange and levels of the factors are shown in Table 3. The DOE in-cluded 18 experiments, although one dataset was excluded fromthe model due to sampling error. The measured response variableswere DOC, color (PtCo), iron, toxicity, final pH and zeta potential.
The fit method used in the modeling was Partial Least Squaresregression (PLS). PLS is a statistical method which finds the rela-tionship between response variables (matrix Y) and the predictorof factor variables (matrix X). The method is especially useful whendealing with a small number of observations and a high number ofpredictor variables. As with other statistical regression methods,such as multiple linear regression (MLR), an equation describingthe relationship between the response variable and predictor vari-ables (factors) is gained. The general form of the regression equa-tion including single terms, square terms and interaction terms isshown in Eq. (3), where Y is the response variable, b are the coef-ficients of the model, and X are the factor variables.
Y ¼ b0 þXk
i¼1biXi
single terms|fflfflfflfflfflffl{zfflfflfflfflfflffl}þXk
i¼1biiX
2i
square terms|fflfflfflfflfflfflffl{zfflfflfflfflfflfflffl}þXi<j
i
XjbijXiXj
interaction terms|fflfflfflfflfflfflfflfflfflfflfflfflffl{zfflfflfflfflfflfflfflfflfflfflfflfflffl}ð3Þ
The quality of the regression equation can be evaluated usinganalysis of variance (ANOVA). R2 is the amount of variance ex-plained by the model whereas Q2 is an estimate of the predictiveability of the model. Q2 is calculated by cross-validation. Detaileddescriptions of PLS regression and ANOVA are given elsewhere[39].
3. Results and discussion
3.1. Synthetic wastewaters
The effect of filtration alone on resin acid removal was studiedby filtering untreated reference samples through a glass fiber filter(Table 2). Initial concentration and pH had a significant effect on
the solubility of the resin acids and their corresponding removalby filtration, with the removal yield decreasing in line with in-creased pH, especially at the highest initial concentration. Accord-ing to the results, pH had a significant effect on the solubility of theresin acids. At low pH, a higher proportion of resin acids was asso-ciated with particles and they were removed during filtration. Re-moval of pimaric-type acids was slightly higher than abietic-typeresin acids. Filtration removed 0–36% of copper from the referencesamples.
Electrocoagulation improved resin acid removal in all test con-ditions except when the initial concentration was 25 mg/l, the pHwas 9 and the treatment time was 600 s (5% decrease in removalyield compared to filtration only). Resin acid removals were higherat pH 5 and pH 7 than at pH 9, especially when the initial resin acidconcentration was high. The highest removal yield (97%) was thusobtained when the initial pH was 5, the treatment time was 60 sand the initial concentration was 125 mg/l. The lowest residualconcentration (1.80 mg/l) was measured from samples which hadan initial concentration of 25 mg/l, an initial pH of 7, and a electro-coagulation treatment time of 60 s. According to the results, longtreatment may reduce resin acid removal. This may be due torestabilization of particles when the coagulant concentration isvery high [16].
EC removed pimaric-type resin acids with higher efficiency thanabietic-type acids. The proportion of pimaric acid in the samplesdecreased from 21% (unfiltered samples) to 0.87–14.7% in electro-coagulated samples. The lowest pimaric acid concentration(0.04 mg/l) was measured from samples which had an initial con-centration of 125 mg/l, an initial pH of 5 and a treatment time of60 s (Fig. 2a). Dehydroabietic acid was the main component inthe samples after electrocoagulation (Fig. 2b). Overall, abietic-typeresin acids had a lower removal percentage at all initial pHs. Theresults thus revealed that the soluble fraction contained a higherproportion of abietic-type resin acids, which were not as easily re-moved by EC as pimaric-type acids. According to Peng et al. [8],abietic-type acids have higher water solubility than pimaric-typeresin acids. The most soluble, and least toxic, resin acid in theirstudies was dehydroabietic acid.
The effect of EC on resin acid removal was also studied withsamples containing pure dehydroabietic and isopimaric acids.Removal yields with filtration after EC and sole filtration weresignificantly lower with pure chemicals than with Polish woodrosin (Fig. 3). This indicates that pure chemicals were more solubleor resin particles in the water were smaller (filter pore size 1.2 lm)than those formed from whole wood rosin. Electrocoagulation had
Table 3Factor range and levels of the experimental design for wood debarking effluent.
Variable Factor range and levels
�1 0 1
X1, Current (A) 1 2 3X2, Time (s) 60 210 360X3, Initial pH 4 6 8
Fig. 2a. Concentration of resin acids in the experimental waters. Samples had an initial pH of 5 and initial resin acid concentration of 125 mg/l.
144 M. Vepsäläinen et al. / Separation and Purification Technology 81 (2011) 141–150
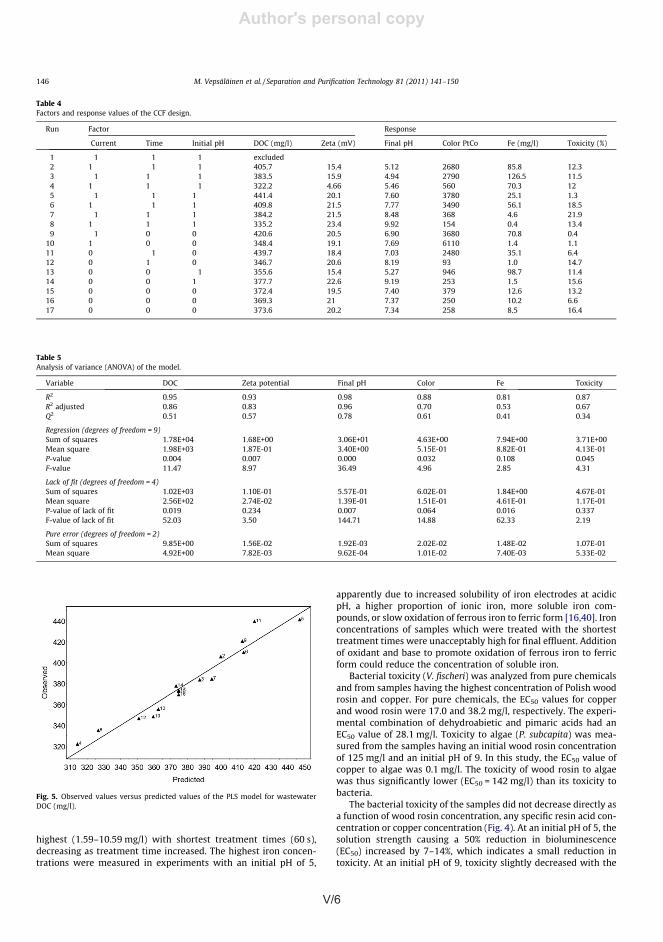
V/6 V/7
Author's personal copy
shortest treatment time (60 s) but increased with longer treatmenttimes. The effect of initial pH on toxicity was not due to protonsalone, because the pH was adjusted to 7 prior to assay measure-ment. However, pH adjustment may have affected the solubilityor speciation of resin acids and metals in the solution, and couldpartially explain the lack of correlation.
Toxicity to algae decreased as a function of copper concentra-tion. Filtered samples which were not treated with electrocoagula-tion were highly toxic to algae (EC50 with 3.7% solution). ECremoved toxicity completely (EC50 with 95–110% solution) and,according to cell count measurements, electrocoagulated samplesstimulated algal growth when compared to control algae tests.Due to the low toxicity of wood rosin to algae (EC50 142 mg/l), re-moval of resin acids by EC did not have any further contribution interms of algal toxicity.
3.2. Debarking effluents
The measured response values of the CCF design are shown inTable 4. According to the R2 of the responses (Table 5), the modelexplained the response variance with good accuracy. However,iron concentration and toxicity had markedly low Q2 values(<0.5), thus indicating poor cross-validation results and thereforelow predictability of these responses. According to ANOVA, this ismainly related to model error. Examples of observed values versuspredicted values of wastewater DOC are presented in Fig. 5.
The coefficients of the model terms are shown in Table 6 andthe normalized coefficients in Fig. 6. The direction and magnitude
of the normalized coefficients in the figure visualize the effect ofsingle, square and interaction terms on the responses. Normalizedcoefficients (mean zero value and dataset variance of 1.0) enablesimultaneous comparison of the effect of the terms on the re-sponses. For example, it can be seen from Fig. 6 that current (cur-rent density) and time are the most important terms affecting DOCvalues, and both in the same direction. It should be noted that thestatistical model is valid only within the limits of the experimentaldata obtained.
DOC removal was low in the tested factor ranges. As mentionedabove, the main terms affecting DOC removal were electric current(current density) and treatment time. DOC concentration de-creased as current density and treatment time increased. The min-imum DOC value predicted by the model was 314 mg/l, while theminimum measured DOC value was 322 mg/l (26.3% removal).According to the model, color removal was not directly linked toDOC removal. Electrocoagulation removed color with high effi-ciency (Fig. 7). Color decreased as a function of treatment timewhile the other main term affecting color removal was the squareterm of electric current. The model predicts total color removal atintermediate current density, high treatment time, and high initialpH. At low pH, a high residual iron concentration may have in-creased color values. According to previous studies, EC treatmenteffectively removes color and toxicity caused mainly by polyphe-nols (tannins) from olive mill wastewaters [32–34].
Initial pH was the main parameter affecting the final pH andzeta potential of the samples. Current density and treatment timeslightly increased the final pH. Electrocoagulation increases pH due
Table 6Coefficients of the model.
Response Constant X1 X2 X3 X21 X2
2 X23
X1⁄X2 X1⁄X3 X2⁄X3
DOC 4.49E+02 �6.42E+01 �3.10E-01 2.18E+01 1.15E+01 4.81E-04 �1.68E+00 �5.75E-02 6.41E-01 �1.10E-03Zeta potentiala �4.53E-02 6.09E-01 4.99E-03 1.52E-03 �1.39E-02 �7.28E-07 1.32E-02 �2.49E-04 �8.32E-02 �7.37E-04Final pH 1.06E+00 5.58E-01 �1.30E-02 1.41E+00 �3.54E-01 5.73E-06 �9.22E-02 2.26E-03 1.09E-01 1.41E-03Colorb 5.81E+00 �3.83E+00 3.62E-03 3.83E-01 8.47E-01 �5.90E-06 �4.21E-02 �4.92E-04 6.32E-02 �5.61E-04Feb 4.21E+00 �9.44E-01 4.22E-03 �4.25E-01 3.33E-01 3.12E-06 3.34E-02 �1.54E-03 �5.62E-02 �9.01E-04Toxicityc �2.23E+00 4.43E+00 �1.60E-03 �1.27E+00 �8.52E-01 1.79E-05 1.15E-01 �2.26E-03 �3.94E-02 6.73E-05
a Logarithmic transformation Log10(Y) + 24.b Logarithmic transformation Log10(Y).c Logit transformation Log10[Y/(100 � Y)].
Fig. 6. Normalized coefficients of the PLS model. EC is electric current, Tim is treatment time and pH is the initial pH of the wastewater.
M. Vepsäläinen et al. / Separation and Purification Technology 81 (2011) 141–150 147
Author's personal copy
highest (1.59–10.59 mg/l) with shortest treatment times (60 s),decreasing as treatment time increased. The highest iron concen-trations were measured in experiments with an initial pH of 5,
apparently due to increased solubility of iron electrodes at acidicpH, a higher proportion of ionic iron, more soluble iron com-pounds, or slow oxidation of ferrous iron to ferric form [16,40]. Ironconcentrations of samples which were treated with the shortesttreatment times were unacceptably high for final effluent. Additionof oxidant and base to promote oxidation of ferrous iron to ferricform could reduce the concentration of soluble iron.
Bacterial toxicity (V. fischeri) was analyzed from pure chemicalsand from samples having the highest concentration of Polish woodrosin and copper. For pure chemicals, the EC50 values for copperand wood rosin were 17.0 and 38.2 mg/l, respectively. The experi-mental combination of dehydroabietic and pimaric acids had anEC50 value of 28.1 mg/l. Toxicity to algae (P. subcapita) was mea-sured from the samples having an initial wood rosin concentrationof 125 mg/l and an initial pH of 9. In this study, the EC50 value ofcopper to algae was 0.1 mg/l. The toxicity of wood rosin to algaewas thus significantly lower (EC50 = 142 mg/l) than its toxicity tobacteria.
The bacterial toxicity of the samples did not decrease directly asa function of wood rosin concentration, any specific resin acid con-centration or copper concentration (Fig. 4). At an initial pH of 5, thesolution strength causing a 50% reduction in bioluminescence(EC50) increased by 7–14%, which indicates a small reduction intoxicity. At an initial pH of 9, toxicity slightly decreased with the
Table 4Factors and response values of the CCF design.
Run Factor Response
Current Time Initial pH DOC (mg/l) Zeta (mV) Final pH Color PtCo Fe (mg/l) Toxicity (%)
1 �1 �1 �1 excluded2 1 �1 �1 405.7 �15.4 5.12 2680 85.8 12.33 �1 1 �1 383.5 �15.9 4.94 2790 126.5 11.54 1 1 �1 322.2 �4.66 5.46 560 70.3 125 �1 �1 1 441.4 �20.1 7.60 3780 25.1 1.36 1 �1 1 409.8 �21.5 7.77 3490 56.1 18.57 �1 1 1 384.2 �21.5 8.48 368 4.6 21.98 1 1 1 335.2 �23.4 9.92 154 0.4 13.49 �1 0 0 420.6 �20.5 6.90 3680 70.8 0.4
10 1 0 0 348.4 �19.1 7.69 6110 1.4 1.111 0 �1 0 439.7 �18.4 7.03 2480 35.1 6.412 0 1 0 346.7 �20.6 8.19 93 1.0 14.713 0 0 �1 355.6 �15.4 5.27 946 98.7 11.414 0 0 1 377.7 �22.6 9.19 253 1.5 15.615 0 0 0 372.4 �19.5 7.40 379 12.6 13.216 0 0 0 369.3 �21 7.37 250 10.2 6.617 0 0 0 373.6 �20.2 7.34 258 8.5 16.4
Table 5Analysis of variance (ANOVA) of the model.
Variable DOC Zeta potential Final pH Color Fe Toxicity
R2 0.95 0.93 0.98 0.88 0.81 0.87R2 adjusted 0.86 0.83 0.96 0.70 0.53 0.67Q2 0.51 0.57 0.78 0.61 0.41 0.34
Regression (degrees of freedom = 9)Sum of squares 1.78E+04 1.68E+00 3.06E+01 4.63E+00 7.94E+00 3.71E+00Mean square 1.98E+03 1.87E-01 3.40E+00 5.15E-01 8.82E-01 4.13E-01P-value 0.004 0.007 0.000 0.032 0.108 0.045F-value 11.47 8.97 36.49 4.96 2.85 4.31
Lack of fit (degrees of freedom = 4)Sum of squares 1.02E+03 1.10E-01 5.57E-01 6.02E-01 1.84E+00 4.67E-01Mean square 2.56E+02 2.74E-02 1.39E-01 1.51E-01 4.61E-01 1.17E-01P-value of lack of fit 0.019 0.234 0.007 0.064 0.016 0.337F-value of lack of fit 52.03 3.50 144.71 14.88 62.33 2.19
Pure error (degrees of freedom = 2)Sum of squares 9.85E+00 1.56E-02 1.92E-03 2.02E-02 1.48E-02 1.07E-01Mean square 4.92E+00 7.82E-03 9.62E-04 1.01E-02 7.40E-03 5.33E-02
Fig. 5. Observed values versus predicted values of the PLS model for wastewaterDOC (mg/l).
146 M. Vepsäläinen et al. / Separation and Purification Technology 81 (2011) 141–150
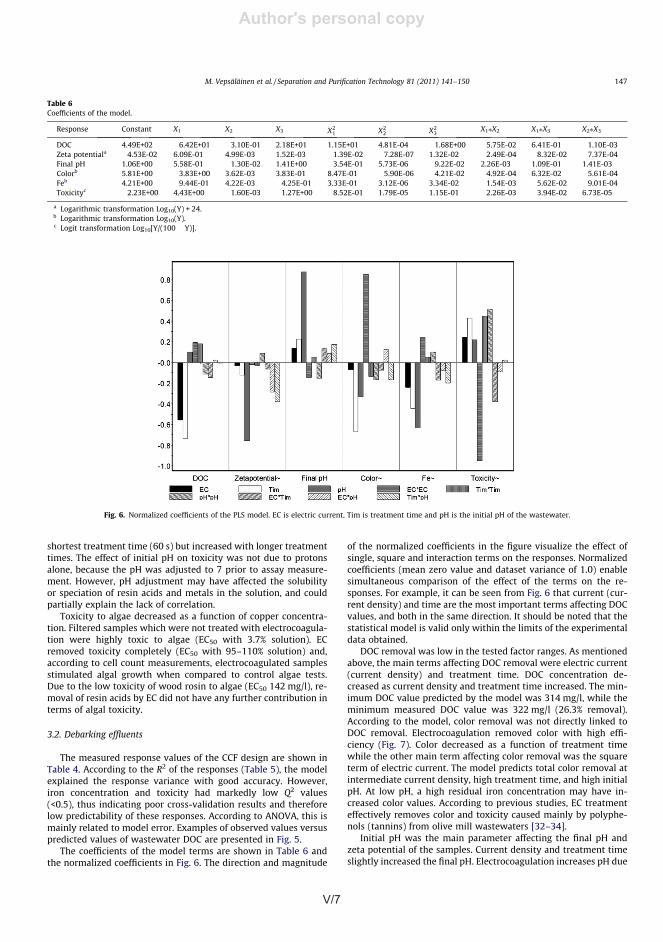
V/7
Author's personal copy
shortest treatment time (60 s) but increased with longer treatmenttimes. The effect of initial pH on toxicity was not due to protonsalone, because the pH was adjusted to 7 prior to assay measure-ment. However, pH adjustment may have affected the solubilityor speciation of resin acids and metals in the solution, and couldpartially explain the lack of correlation.
Toxicity to algae decreased as a function of copper concentra-tion. Filtered samples which were not treated with electrocoagula-tion were highly toxic to algae (EC50 with 3.7% solution). ECremoved toxicity completely (EC50 with 95–110% solution) and,according to cell count measurements, electrocoagulated samplesstimulated algal growth when compared to control algae tests.Due to the low toxicity of wood rosin to algae (EC50 142 mg/l), re-moval of resin acids by EC did not have any further contribution interms of algal toxicity.
3.2. Debarking effluents
The measured response values of the CCF design are shown inTable 4. According to the R2 of the responses (Table 5), the modelexplained the response variance with good accuracy. However,iron concentration and toxicity had markedly low Q2 values(<0.5), thus indicating poor cross-validation results and thereforelow predictability of these responses. According to ANOVA, this ismainly related to model error. Examples of observed values versuspredicted values of wastewater DOC are presented in Fig. 5.
The coefficients of the model terms are shown in Table 6 andthe normalized coefficients in Fig. 6. The direction and magnitude
of the normalized coefficients in the figure visualize the effect ofsingle, square and interaction terms on the responses. Normalizedcoefficients (mean zero value and dataset variance of 1.0) enablesimultaneous comparison of the effect of the terms on the re-sponses. For example, it can be seen from Fig. 6 that current (cur-rent density) and time are the most important terms affecting DOCvalues, and both in the same direction. It should be noted that thestatistical model is valid only within the limits of the experimentaldata obtained.
DOC removal was low in the tested factor ranges. As mentionedabove, the main terms affecting DOC removal were electric current(current density) and treatment time. DOC concentration de-creased as current density and treatment time increased. The min-imum DOC value predicted by the model was 314 mg/l, while theminimum measured DOC value was 322 mg/l (26.3% removal).According to the model, color removal was not directly linked toDOC removal. Electrocoagulation removed color with high effi-ciency (Fig. 7). Color decreased as a function of treatment timewhile the other main term affecting color removal was the squareterm of electric current. The model predicts total color removal atintermediate current density, high treatment time, and high initialpH. At low pH, a high residual iron concentration may have in-creased color values. According to previous studies, EC treatmenteffectively removes color and toxicity caused mainly by polyphe-nols (tannins) from olive mill wastewaters [32–34].
Initial pH was the main parameter affecting the final pH andzeta potential of the samples. Current density and treatment timeslightly increased the final pH. Electrocoagulation increases pH due
Table 6Coefficients of the model.
Response Constant X1 X2 X3 X21 X2
2 X23
X1⁄X2 X1⁄X3 X2⁄X3
DOC 4.49E+02 �6.42E+01 �3.10E-01 2.18E+01 1.15E+01 4.81E-04 �1.68E+00 �5.75E-02 6.41E-01 �1.10E-03Zeta potentiala �4.53E-02 6.09E-01 4.99E-03 1.52E-03 �1.39E-02 �7.28E-07 1.32E-02 �2.49E-04 �8.32E-02 �7.37E-04Final pH 1.06E+00 5.58E-01 �1.30E-02 1.41E+00 �3.54E-01 5.73E-06 �9.22E-02 2.26E-03 1.09E-01 1.41E-03Colorb 5.81E+00 �3.83E+00 3.62E-03 3.83E-01 8.47E-01 �5.90E-06 �4.21E-02 �4.92E-04 6.32E-02 �5.61E-04Feb 4.21E+00 �9.44E-01 4.22E-03 �4.25E-01 3.33E-01 3.12E-06 3.34E-02 �1.54E-03 �5.62E-02 �9.01E-04Toxicityc �2.23E+00 4.43E+00 �1.60E-03 �1.27E+00 �8.52E-01 1.79E-05 1.15E-01 �2.26E-03 �3.94E-02 6.73E-05
a Logarithmic transformation Log10(Y) + 24.b Logarithmic transformation Log10(Y).c Logit transformation Log10[Y/(100 � Y)].
Fig. 6. Normalized coefficients of the PLS model. EC is electric current, Tim is treatment time and pH is the initial pH of the wastewater.
M. Vepsäläinen et al. / Separation and Purification Technology 81 (2011) 141–150 147
Author's personal copy
highest (1.59–10.59 mg/l) with shortest treatment times (60 s),decreasing as treatment time increased. The highest iron concen-trations were measured in experiments with an initial pH of 5,
apparently due to increased solubility of iron electrodes at acidicpH, a higher proportion of ionic iron, more soluble iron com-pounds, or slow oxidation of ferrous iron to ferric form [16,40]. Ironconcentrations of samples which were treated with the shortesttreatment times were unacceptably high for final effluent. Additionof oxidant and base to promote oxidation of ferrous iron to ferricform could reduce the concentration of soluble iron.
Bacterial toxicity (V. fischeri) was analyzed from pure chemicalsand from samples having the highest concentration of Polish woodrosin and copper. For pure chemicals, the EC50 values for copperand wood rosin were 17.0 and 38.2 mg/l, respectively. The experi-mental combination of dehydroabietic and pimaric acids had anEC50 value of 28.1 mg/l. Toxicity to algae (P. subcapita) was mea-sured from the samples having an initial wood rosin concentrationof 125 mg/l and an initial pH of 9. In this study, the EC50 value ofcopper to algae was 0.1 mg/l. The toxicity of wood rosin to algaewas thus significantly lower (EC50 = 142 mg/l) than its toxicity tobacteria.
The bacterial toxicity of the samples did not decrease directly asa function of wood rosin concentration, any specific resin acid con-centration or copper concentration (Fig. 4). At an initial pH of 5, thesolution strength causing a 50% reduction in bioluminescence(EC50) increased by 7–14%, which indicates a small reduction intoxicity. At an initial pH of 9, toxicity slightly decreased with the
Table 4Factors and response values of the CCF design.
Run Factor Response
Current Time Initial pH DOC (mg/l) Zeta (mV) Final pH Color PtCo Fe (mg/l) Toxicity (%)
1 �1 �1 �1 excluded2 1 �1 �1 405.7 �15.4 5.12 2680 85.8 12.33 �1 1 �1 383.5 �15.9 4.94 2790 126.5 11.54 1 1 �1 322.2 �4.66 5.46 560 70.3 125 �1 �1 1 441.4 �20.1 7.60 3780 25.1 1.36 1 �1 1 409.8 �21.5 7.77 3490 56.1 18.57 �1 1 1 384.2 �21.5 8.48 368 4.6 21.98 1 1 1 335.2 �23.4 9.92 154 0.4 13.49 �1 0 0 420.6 �20.5 6.90 3680 70.8 0.4
10 1 0 0 348.4 �19.1 7.69 6110 1.4 1.111 0 �1 0 439.7 �18.4 7.03 2480 35.1 6.412 0 1 0 346.7 �20.6 8.19 93 1.0 14.713 0 0 �1 355.6 �15.4 5.27 946 98.7 11.414 0 0 1 377.7 �22.6 9.19 253 1.5 15.615 0 0 0 372.4 �19.5 7.40 379 12.6 13.216 0 0 0 369.3 �21 7.37 250 10.2 6.617 0 0 0 373.6 �20.2 7.34 258 8.5 16.4
Table 5Analysis of variance (ANOVA) of the model.
Variable DOC Zeta potential Final pH Color Fe Toxicity
R2 0.95 0.93 0.98 0.88 0.81 0.87R2 adjusted 0.86 0.83 0.96 0.70 0.53 0.67Q2 0.51 0.57 0.78 0.61 0.41 0.34
Regression (degrees of freedom = 9)Sum of squares 1.78E+04 1.68E+00 3.06E+01 4.63E+00 7.94E+00 3.71E+00Mean square 1.98E+03 1.87E-01 3.40E+00 5.15E-01 8.82E-01 4.13E-01P-value 0.004 0.007 0.000 0.032 0.108 0.045F-value 11.47 8.97 36.49 4.96 2.85 4.31
Lack of fit (degrees of freedom = 4)Sum of squares 1.02E+03 1.10E-01 5.57E-01 6.02E-01 1.84E+00 4.67E-01Mean square 2.56E+02 2.74E-02 1.39E-01 1.51E-01 4.61E-01 1.17E-01P-value of lack of fit 0.019 0.234 0.007 0.064 0.016 0.337F-value of lack of fit 52.03 3.50 144.71 14.88 62.33 2.19
Pure error (degrees of freedom = 2)Sum of squares 9.85E+00 1.56E-02 1.92E-03 2.02E-02 1.48E-02 1.07E-01Mean square 4.92E+00 7.82E-03 9.62E-04 1.01E-02 7.40E-03 5.33E-02
Fig. 5. Observed values versus predicted values of the PLS model for wastewaterDOC (mg/l).
146 M. Vepsäläinen et al. / Separation and Purification Technology 81 (2011) 141–150
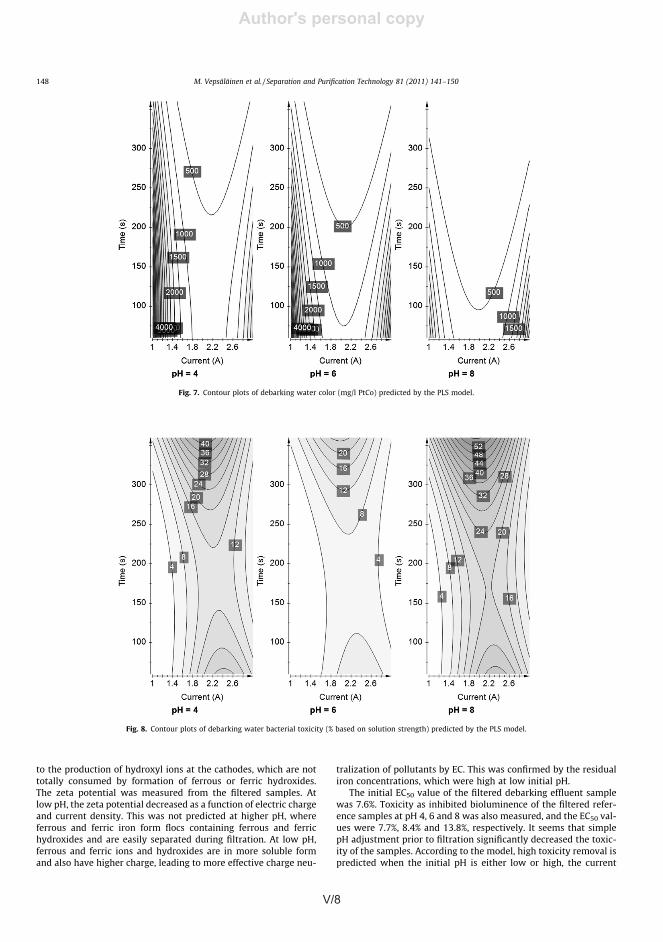
V/8 V/9
Author's personal copy
density is intermediate and the treatment time is long (Fig. 8). Tox-icity change was also related to color removal of the samples. Thecolor of debarking effluents is mainly caused by tannins, which areknown to exhibit toxicity to microbes [1]. Highest color removalwas observed at high initial pH, whereas high toxicity removalwas observed both at low and high initial pH. This is probablydue to the effect of iron on color values at low initial pH. The modelpredicts minimum toxicity, EC50 at 43% solution in the tested factorranges at 1.4 A, 360 s and initial pH 8. It is possible that these val-ues are unrealistically high due to model error, as the lowest mea-sured toxicity (EC50) was 21.9%. However, according to the results,electrocoagulation enhanced toxicity removal. Longer treatmenttimes could increase toxicity removal, but would raise the operat-ing cost of treatment. It can be noted that prior the EC treatment,resin acids were minor toxic species in the debarking effluentscompared to tannins. According to the results for synthetic waste-waters, the toxicity of the effluents after EC treatment could becaused by residual resin acids or toxic compounds formed duringEC treatment.
4. Conclusions
This study investigated the effect of electrocoagulation treat-ment on toxic pollutant removal from pulp mill effluents. Syntheticwastewaters containing wood rosin and copper or pure resin acidswere used to investigate the removal of resin acids by electrocoag-ulation. According to the results, the following conclusions can bedrawn:
� Electrocoagulation enhanced resin acid removal in the subse-quent filtration stage. Maximum removal (97%) was obtainedwith an initial pH of 5, a treatment time of 60 s, and an initialconcentration of 125 mg/l. Pimaric-type acids were removedwith higher efficiency than abietic-type resin acids.
� Copper was efficiently removed with a short treatment time. A60 s treatment with 2 A current removed 72–97% of the copperfrom the experimental solution.
� EC50 values for copper and wood rosin to bacteria (V. fischeri)were 17.0 and 38.2 mg/l, respectively. Electrocoagulation hadno significant effect on bacterial toxicity despite a high removalefficiency of resin acids and copper.
� Electrocoagulation and filtration completely eliminated the tox-icity of synthetic wastewaters to algae (P. subcapita) even withthe shortest treatment time (60 s).
Toxic pollutant removal by electrocoagulation was also studiedwith debarking effluents. Statistical experimental design and par-tial least squares modeling were used to investigate the effect ofinitial pH, current (current density) and treatment time on pollu-tant removal. According to the results:
� Electrocoagulation enhanced color removal. The model predictsoptimum removal with intermediate current, long treatmenttime, and high initial pH. The lowest measured color valuewas 93 PtCo. Some DOC was removed with high current densityand long treatment time.
� According to the model, toxicity was associated with samplecolor. Optimum toxicity removal is predicted with same param-eters as optimum color removal. The lowest EC50 value based onthe solution strength was 22%.
In summary, electrocoagulation combined with separationtechnologies such as filtration, sedimentation or flotation offers apotential method for the removal of toxic pollutants from pulp millwastewaters. However, further studies are required to optimize the
treatment. Addition of oxidants to mill wastewater could furtherincrease the efficiency of coagulation due to enhanced oxidationof ferrous iron to ferric form, which is known to have better coag-ulation performance.
Acknowledgements
This research was financially supported by Savcor Forest Oy, theCity of Mikkeli and the European Union. The authors would like tothank Eveliina Repo for conducting the metal analyses.
References
[1] M. Ali, T.R. Sreekrishnan, Aquatic toxicity from pulp and paper mill effluents: areview, Adv. Environ. Res. 5 (2001) 175–196.
[2] D. Pokhrel, T. Viraraghavan, Treatment of pulp and paper mill wastewater – areview, Sci. Total Environ. 333 (2004) 37–58.
[3] P. Bajpai, Environmentally Friendly Production of Pulp and Paper, John Wiley &Sons, Hoboken, 2010.
[4] J.A. Field, M.J.H. Leyendeckers, R. Sierra-Alvarez, G. Lettinga, L.H.A. Habets, Themethanogenic toxicity of bark tannins and the anaerobic biodegradability ofwater-soluble bark matter, Water Sci. Technol. 20 (1988) 219–240.
[5] M.K. Korczak, S. Koziarski, B. Komorowska, Anaerobic treatment of pulp andpaper mill effluents, Water Sci. Technol. 24 (1991) 203–206.
[6] J.A. Field, S. Kortekaas, G. Lettinga, The tannin theory of methanogenic toxicity,Biol. Waste 29 (1989) 241–262.
[7] J.H.M. Temmink, J.A. Field, J.C. Haastrecht, R.C.M. van Merkelbach, Acute andsub-acute toxicity of bark tannins in carp (Cyprinus carpio, L.), Water Res. 23(1989) 341–344.
[8] G. Peng, J.C. Roberts, Solubility and toxicity of resin acids, Water Res. 34 (2000)2779–2785.
[9] A. Kostamo, B. Holmbom, J.V.K. Kukkonen, Fate of wood extractives inwastewater treatment plants at kraft pulp mills and mechanical pulp mills,Water Res. 38 (2004) 972–982.
[10] A. Kostamo, J.V.K. Kukkonen, Removal of resin acids and sterols from pulp milleffluents by activated sludge treatment, Water Res. 37 (2003) 2813–2820.
[11] A.E.J. Wilson, E.R.B. Moore, W.W. Mohn, Isolation and characterization ofIsopimaric acid degrading bacteria from sequencing batch reactor, Appl.Environ. Mirobiol. 62 (1996) 3146–3151.
[12] L.T.K. Chung, H.P. Meier, J.M. Leach, Can pulp mill effluent toxicity beestimated from chemical analysis, Tappi 62 (1979) 71–74.
[13] J.M. Leach, A.N. Thakore, Toxic constituents in mechanical pulping effluents,Tappi 59 (1976) 129–132.
[14] J.M. Leach, L.T.K. Chung, Development of a chemical toxicity assay for pulp milleffluents, US EPA publication No EPA-600/2-80-206, Ohio, USA.
[15] A. Oikari, B. Lönn, M. Caastren, T. Nakari, B. Snickars-Nikinmaa, H. Bister, E.Virtanen, Toxicological effects of dehydroabietic acid (DHAA) on the TroutSalmo Gairdneri Richardsonin fresh water, Water Res. 17 (1983) 81–98.
[16] J. Bratby, Coagulation and Flocculation in Water and Wastewater Treatment,second ed., IWA publishing, London, 2006.
[17] M. Belmonte, C. Xavier, J. Decap, M. Martinez, R. Sierra-Alvarez, G. Vidal,Improved aerobic biodegradation of abietic acid in ECF bleached kraft milleffluent due to biomass adaptation, J. Hazard. Mater. B135 (2006) 256–263.
[18] T. Leiviskä, J. Rämö, H. Nurmesniemi, R. Pöykiö, T. Kuokkanen, Sizefractionation of wood extractives lignin and trace elements in pulp andpaper mill wastewater before and after biological treatment, Water Res. 43(2009) 3199–3206.
[19] J.A. Field, G. Lettinga, The methanogenic toxicity and anaerobic degradabilityof a hydrolysable tannin, Water Res. 21 (1987) 367–374.
[20] T. White, Tannins – their occurrence and significance, J. Food. Sci. Agric. 8(1957) 377–384.
[21] R.J. Stephenson, S.J.B. Duff, Coagulation precipitation of a mechanical pulpingeffluent – II. Toxicity removal metal salt recovery, Water Res. 30 (1996) 793–798.
[22] T. Leiviskä, J. Rämö, Coagulation of wood extractives in chemical pulpbleaching filtrate by cationic polyelectrolytes, J. Hazard. Mater. 153 (2008)525–531.
[23] M.Y. Mollah, R. Schennach, J. Parga, D.L. Cocke, Electrocoagulation (EC) –science and applications, J. Hazard. Mater. B84 (2001) 29–41.
[24] M.Y.A. Mollah, P. Morkovksy, J.A.G. Gomes, M. Kesmez, J. Parga, D.L. Cocke,Fundamentals present and future perspectives of electrocoagulation, J. Hazard.Mater. B114 (2001) 199–210.
[25] I. Zongo, J.P. Leclerc, H.A. Maïga, J. Wéthe, F. Lepicque, Removal of hexavalentchromium from industrial wastewater by electrocoagulation: acomprehensive comparison of aluminium and iron electrodes, Sep. Purif.Technol. 66 (2009) 159–166.
[26] S. Aber, A.R. Amani-Ghadim, V. Mirzajani, Removal of Cr(VI) from pollutedsolutions by electrocoagulation: Modeling of experimental results usingartificial neural network, J. Hazard. Mater. 171 (2009) 484–490.
[27] I. Heidmann, W. Calmano, Removal of Zn(II), Cu(II), Ni(II), Ag(I) and Cr(VI)present in aqueous solutions by aluminium electrocoagulation, J. Hazard.Mater. 152 (2008) 934–941.
M. Vepsäläinen et al. / Separation and Purification Technology 81 (2011) 141–150 149
Author's personal copy
to the production of hydroxyl ions at the cathodes, which are nottotally consumed by formation of ferrous or ferric hydroxides.The zeta potential was measured from the filtered samples. Atlow pH, the zeta potential decreased as a function of electric chargeand current density. This was not predicted at higher pH, whereferrous and ferric iron form flocs containing ferrous and ferrichydroxides and are easily separated during filtration. At low pH,ferrous and ferric ions and hydroxides are in more soluble formand also have higher charge, leading to more effective charge neu-
tralization of pollutants by EC. This was confirmed by the residualiron concentrations, which were high at low initial pH.
The initial EC50 value of the filtered debarking effluent samplewas 7.6%. Toxicity as inhibited bioluminence of the filtered refer-ence samples at pH 4, 6 and 8 was also measured, and the EC50 val-ues were 7.7%, 8.4% and 13.8%, respectively. It seems that simplepH adjustment prior to filtration significantly decreased the toxic-ity of the samples. According to the model, high toxicity removal ispredicted when the initial pH is either low or high, the current
Fig. 7. Contour plots of debarking water color (mg/l PtCo) predicted by the PLS model.
Fig. 8. Contour plots of debarking water bacterial toxicity (% based on solution strength) predicted by the PLS model.
148 M. Vepsäläinen et al. / Separation and Purification Technology 81 (2011) 141–150
V/9
Author's personal copy
density is intermediate and the treatment time is long (Fig. 8). Tox-icity change was also related to color removal of the samples. Thecolor of debarking effluents is mainly caused by tannins, which areknown to exhibit toxicity to microbes [1]. Highest color removalwas observed at high initial pH, whereas high toxicity removalwas observed both at low and high initial pH. This is probablydue to the effect of iron on color values at low initial pH. The modelpredicts minimum toxicity, EC50 at 43% solution in the tested factorranges at 1.4 A, 360 s and initial pH 8. It is possible that these val-ues are unrealistically high due to model error, as the lowest mea-sured toxicity (EC50) was 21.9%. However, according to the results,electrocoagulation enhanced toxicity removal. Longer treatmenttimes could increase toxicity removal, but would raise the operat-ing cost of treatment. It can be noted that prior the EC treatment,resin acids were minor toxic species in the debarking effluentscompared to tannins. According to the results for synthetic waste-waters, the toxicity of the effluents after EC treatment could becaused by residual resin acids or toxic compounds formed duringEC treatment.
4. Conclusions
This study investigated the effect of electrocoagulation treat-ment on toxic pollutant removal from pulp mill effluents. Syntheticwastewaters containing wood rosin and copper or pure resin acidswere used to investigate the removal of resin acids by electrocoag-ulation. According to the results, the following conclusions can bedrawn:
� Electrocoagulation enhanced resin acid removal in the subse-quent filtration stage. Maximum removal (97%) was obtainedwith an initial pH of 5, a treatment time of 60 s, and an initialconcentration of 125 mg/l. Pimaric-type acids were removedwith higher efficiency than abietic-type resin acids.
� Copper was efficiently removed with a short treatment time. A60 s treatment with 2 A current removed 72–97% of the copperfrom the experimental solution.
� EC50 values for copper and wood rosin to bacteria (V. fischeri)were 17.0 and 38.2 mg/l, respectively. Electrocoagulation hadno significant effect on bacterial toxicity despite a high removalefficiency of resin acids and copper.
� Electrocoagulation and filtration completely eliminated the tox-icity of synthetic wastewaters to algae (P. subcapita) even withthe shortest treatment time (60 s).
Toxic pollutant removal by electrocoagulation was also studiedwith debarking effluents. Statistical experimental design and par-tial least squares modeling were used to investigate the effect ofinitial pH, current (current density) and treatment time on pollu-tant removal. According to the results:
� Electrocoagulation enhanced color removal. The model predictsoptimum removal with intermediate current, long treatmenttime, and high initial pH. The lowest measured color valuewas 93 PtCo. Some DOC was removed with high current densityand long treatment time.
� According to the model, toxicity was associated with samplecolor. Optimum toxicity removal is predicted with same param-eters as optimum color removal. The lowest EC50 value based onthe solution strength was 22%.
In summary, electrocoagulation combined with separationtechnologies such as filtration, sedimentation or flotation offers apotential method for the removal of toxic pollutants from pulp millwastewaters. However, further studies are required to optimize the
treatment. Addition of oxidants to mill wastewater could furtherincrease the efficiency of coagulation due to enhanced oxidationof ferrous iron to ferric form, which is known to have better coag-ulation performance.
Acknowledgements
This research was financially supported by Savcor Forest Oy, theCity of Mikkeli and the European Union. The authors would like tothank Eveliina Repo for conducting the metal analyses.
References
[1] M. Ali, T.R. Sreekrishnan, Aquatic toxicity from pulp and paper mill effluents: areview, Adv. Environ. Res. 5 (2001) 175–196.
[2] D. Pokhrel, T. Viraraghavan, Treatment of pulp and paper mill wastewater – areview, Sci. Total Environ. 333 (2004) 37–58.
[3] P. Bajpai, Environmentally Friendly Production of Pulp and Paper, John Wiley &Sons, Hoboken, 2010.
[4] J.A. Field, M.J.H. Leyendeckers, R. Sierra-Alvarez, G. Lettinga, L.H.A. Habets, Themethanogenic toxicity of bark tannins and the anaerobic biodegradability ofwater-soluble bark matter, Water Sci. Technol. 20 (1988) 219–240.
[5] M.K. Korczak, S. Koziarski, B. Komorowska, Anaerobic treatment of pulp andpaper mill effluents, Water Sci. Technol. 24 (1991) 203–206.
[6] J.A. Field, S. Kortekaas, G. Lettinga, The tannin theory of methanogenic toxicity,Biol. Waste 29 (1989) 241–262.
[7] J.H.M. Temmink, J.A. Field, J.C. Haastrecht, R.C.M. van Merkelbach, Acute andsub-acute toxicity of bark tannins in carp (Cyprinus carpio, L.), Water Res. 23(1989) 341–344.
[8] G. Peng, J.C. Roberts, Solubility and toxicity of resin acids, Water Res. 34 (2000)2779–2785.
[9] A. Kostamo, B. Holmbom, J.V.K. Kukkonen, Fate of wood extractives inwastewater treatment plants at kraft pulp mills and mechanical pulp mills,Water Res. 38 (2004) 972–982.
[10] A. Kostamo, J.V.K. Kukkonen, Removal of resin acids and sterols from pulp milleffluents by activated sludge treatment, Water Res. 37 (2003) 2813–2820.
[11] A.E.J. Wilson, E.R.B. Moore, W.W. Mohn, Isolation and characterization ofIsopimaric acid degrading bacteria from sequencing batch reactor, Appl.Environ. Mirobiol. 62 (1996) 3146–3151.
[12] L.T.K. Chung, H.P. Meier, J.M. Leach, Can pulp mill effluent toxicity beestimated from chemical analysis, Tappi 62 (1979) 71–74.
[13] J.M. Leach, A.N. Thakore, Toxic constituents in mechanical pulping effluents,Tappi 59 (1976) 129–132.
[14] J.M. Leach, L.T.K. Chung, Development of a chemical toxicity assay for pulp milleffluents, US EPA publication No EPA-600/2-80-206, Ohio, USA.
[15] A. Oikari, B. Lönn, M. Caastren, T. Nakari, B. Snickars-Nikinmaa, H. Bister, E.Virtanen, Toxicological effects of dehydroabietic acid (DHAA) on the TroutSalmo Gairdneri Richardsonin fresh water, Water Res. 17 (1983) 81–98.
[16] J. Bratby, Coagulation and Flocculation in Water and Wastewater Treatment,second ed., IWA publishing, London, 2006.
[17] M. Belmonte, C. Xavier, J. Decap, M. Martinez, R. Sierra-Alvarez, G. Vidal,Improved aerobic biodegradation of abietic acid in ECF bleached kraft milleffluent due to biomass adaptation, J. Hazard. Mater. B135 (2006) 256–263.
[18] T. Leiviskä, J. Rämö, H. Nurmesniemi, R. Pöykiö, T. Kuokkanen, Sizefractionation of wood extractives lignin and trace elements in pulp andpaper mill wastewater before and after biological treatment, Water Res. 43(2009) 3199–3206.
[19] J.A. Field, G. Lettinga, The methanogenic toxicity and anaerobic degradabilityof a hydrolysable tannin, Water Res. 21 (1987) 367–374.
[20] T. White, Tannins – their occurrence and significance, J. Food. Sci. Agric. 8(1957) 377–384.
[21] R.J. Stephenson, S.J.B. Duff, Coagulation precipitation of a mechanical pulpingeffluent – II. Toxicity removal metal salt recovery, Water Res. 30 (1996) 793–798.
[22] T. Leiviskä, J. Rämö, Coagulation of wood extractives in chemical pulpbleaching filtrate by cationic polyelectrolytes, J. Hazard. Mater. 153 (2008)525–531.
[23] M.Y. Mollah, R. Schennach, J. Parga, D.L. Cocke, Electrocoagulation (EC) –science and applications, J. Hazard. Mater. B84 (2001) 29–41.
[24] M.Y.A. Mollah, P. Morkovksy, J.A.G. Gomes, M. Kesmez, J. Parga, D.L. Cocke,Fundamentals present and future perspectives of electrocoagulation, J. Hazard.Mater. B114 (2001) 199–210.
[25] I. Zongo, J.P. Leclerc, H.A. Maïga, J. Wéthe, F. Lepicque, Removal of hexavalentchromium from industrial wastewater by electrocoagulation: acomprehensive comparison of aluminium and iron electrodes, Sep. Purif.Technol. 66 (2009) 159–166.
[26] S. Aber, A.R. Amani-Ghadim, V. Mirzajani, Removal of Cr(VI) from pollutedsolutions by electrocoagulation: Modeling of experimental results usingartificial neural network, J. Hazard. Mater. 171 (2009) 484–490.
[27] I. Heidmann, W. Calmano, Removal of Zn(II), Cu(II), Ni(II), Ag(I) and Cr(VI)present in aqueous solutions by aluminium electrocoagulation, J. Hazard.Mater. 152 (2008) 934–941.
M. Vepsäläinen et al. / Separation and Purification Technology 81 (2011) 141–150 149
Author's personal copy
to the production of hydroxyl ions at the cathodes, which are nottotally consumed by formation of ferrous or ferric hydroxides.The zeta potential was measured from the filtered samples. Atlow pH, the zeta potential decreased as a function of electric chargeand current density. This was not predicted at higher pH, whereferrous and ferric iron form flocs containing ferrous and ferrichydroxides and are easily separated during filtration. At low pH,ferrous and ferric ions and hydroxides are in more soluble formand also have higher charge, leading to more effective charge neu-
tralization of pollutants by EC. This was confirmed by the residualiron concentrations, which were high at low initial pH.
The initial EC50 value of the filtered debarking effluent samplewas 7.6%. Toxicity as inhibited bioluminence of the filtered refer-ence samples at pH 4, 6 and 8 was also measured, and the EC50 val-ues were 7.7%, 8.4% and 13.8%, respectively. It seems that simplepH adjustment prior to filtration significantly decreased the toxic-ity of the samples. According to the model, high toxicity removal ispredicted when the initial pH is either low or high, the current
Fig. 7. Contour plots of debarking water color (mg/l PtCo) predicted by the PLS model.
Fig. 8. Contour plots of debarking water bacterial toxicity (% based on solution strength) predicted by the PLS model.
148 M. Vepsäläinen et al. / Separation and Purification Technology 81 (2011) 141–150
V/10 V/11
Author's personal copy
[28] N. Daneshvar, A. Oladegaragoze, N. Djafarzadeh, Decolorisation of basic dyesolution by electrocoagulation: an investigation of the effect of operationalparameters, J. Hazard. Mater. B 129 (2006) 116–122.
[29] A. Alinsafi, M. Khemis, M.N. Pons, J.P. Leclerc, A. Yaccoubi, A. Benhammou, A.Nejmeddine, Electro-coagulation of reactive textile dyes and textilewastewater, Chem. Eng. Process. 44 (2005) 461–470.
[30] A. Aleboyeh, N. Daneshvar, M.B. Kasiri, Optimization of C.I. Acid Red 14 azo dyeremoval by electrocoagulation batch process with response surfacemethodology, Chem. Eng. Process. 47 (2008) 827–832.
[31] S.M. Palácio, F.R. Espinoza-Guiñones, A.N. Módenes, C.C. Oliveira, F.H. Borba,F.G. Silva Jr., Toxicity assessment from electro-coagulation treated-textile dyewastewaters by bioassays, J. Hazard. Mater. 172 (2009) 330–337.
[32] S. Khoufi, F. Feki, S. Sayadi, Detoxification of olive mill wastewater byelectrocoagulation and sedimentation processes, J. Hazard. Mater. 142 (2007)58–67.
[33] S. Khoufi, F. Aloui, S. Sayadi, Extraction of antioxidants from olive millwastewater and electro-coagulation of exhausted fraction to reduce itstoxicity on anaerobic digestion, J. Hazard. Mater. 151 (2008) 531–539.
[34] F. Hanafi, O. Assobhei, M. Mountadar, Detoxification and discoloration ofMoroccan olive mill wastewater by electrocoagulation, J. Hazard. Mater. 174(2010) 807–812.
[35] K. Yetilmezsoy, F. Ilhan, Z. Sapci-Zengin, S. Sakar, S.T. Gonullu, Decolorizationand COD reduction of UASB pretreated poultry manure wastewater byelectrocoagulation process: a post-treatment study, J. Hazard. Mater. 162(2009) 120–132.
[36] S. Chowwanapoonpohn, S. Chewchanwuttiwong, M.J. Garson, D. Buddhasukh,Electrocoagulation and recovery of tannins from tree barks, J. Appl.Electrochem. 33 (2003) 647–650.
[37] J. Lappalainen, R. Juvonen, K. Vaajasaari, M. Karp, A new flash method formeasuring the toxicity of solid and colored samples, Chemosphere 38 (1999)1069–1083.
[38] M.R. Soimasuo, A.E. Karels, H. Leppänen, R. Santti, A.O.J. Oikari, Biomarkerresponses in whitefish (Coregonus lavaretus L. s.l) experimentally exposed in alarge lake receiving effluents from pulp paper industry, Arch. Environ. Contam.Toxicol. 34 (1998) 69–80.
[39] R.G. Brereton, Applied Chemometrics for Scientists, John Wiley & Sons Ltd.,England, 2007.
[40] M.B. Sasson, W. Calmano, A. Adin, Iron-oxidation processes in anelectroflocculation (electrocoagulation) cell, J. Hazard. Mater. 171 (2009)704–709.
150 M. Vepsäläinen et al. / Separation and Purification Technology 81 (2011) 141–150
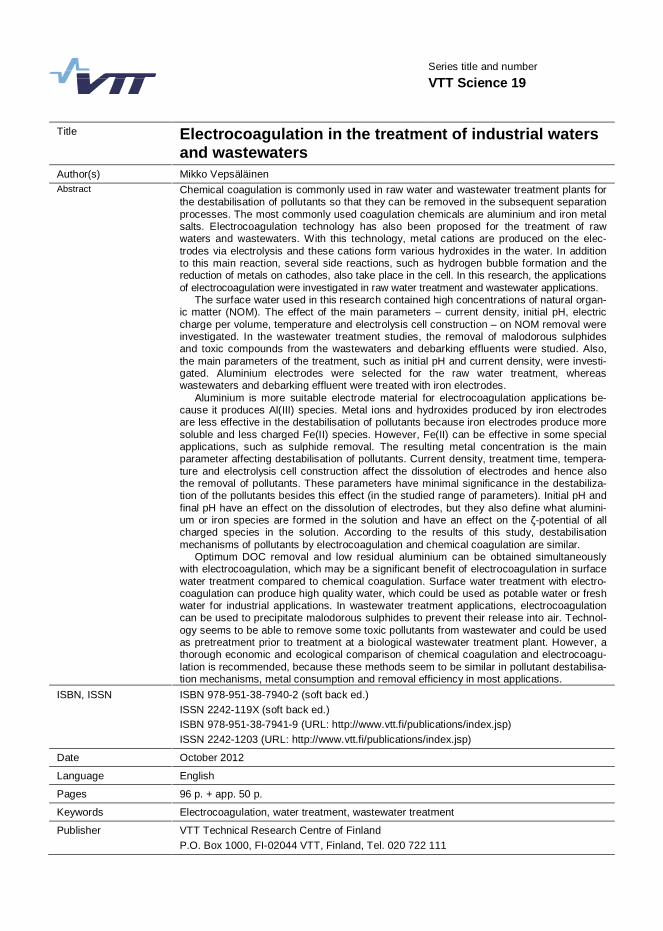
97
Series title and number VTT Science 19
Title Electrocoagulation in the treatment of industrial waters and wastewaters
Author(s) Mikko Vepsäläinen Abstract Chemical coagulation is commonly used in raw water and wastewater treatment plants for
the destabilisation of pollutants so that they can be removed in the subsequent separation processes. The most commonly used coagulation chemicals are aluminium and iron metal salts. Electrocoagulation technology has also been proposed for the treatment of raw waters and wastewaters. With this technology, metal cations are produced on the elec-trodes via electrolysis and these cations form various hydroxides in the water. In addition to this main reaction, several side reactions, such as hydrogen bubble formation and the reduction of metals on cathodes, also take place in the cell. In this research, the applications of electrocoagulation were investigated in raw water treatment and wastewater applications.
The surface water used in this research contained high concentrations of natural organ-ic matter (NOM). The effect of the main parameters – current density, initial pH, electric charge per volume, temperature and electrolysis cell construction – on NOM removal were investigated. In the wastewater treatment studies, the removal of malodorous sulphides and toxic compounds from the wastewaters and debarking effluents were studied. Also, the main parameters of the treatment, such as initial pH and current density, were investi-gated. Aluminium electrodes were selected for the raw water treatment, whereas wastewaters and debarking effluent were treated with iron electrodes.
Aluminium is more suitable electrode material for electrocoagulation applications be-cause it produces Al(III) species. Metal ions and hydroxides produced by iron electrodes are less effective in the destabilisation of pollutants because iron electrodes produce more soluble and less charged Fe(II) species. However, Fe(II) can be effective in some special applications, such as sulphide removal. The resulting metal concentration is the main parameter affecting destabilisation of pollutants. Current density, treatment time, tempera-ture and electrolysis cell construction affect the dissolution of electrodes and hence also the removal of pollutants. These parameters have minimal significance in the destabiliza-tion of the pollutants besides this effect (in the studied range of parameters). Initial pH and final pH have an effect on the dissolution of electrodes, but they also define what alumini-um or iron species are formed in the solution and have an effect on the -potential of all charged species in the solution. According to the results of this study, destabilisation mechanisms of pollutants by electrocoagulation and chemical coagulation are similar.
Optimum DOC removal and low residual aluminium can be obtained simultaneously with electrocoagulation, which may be a significant benefit of electrocoagulation in surface water treatment compared to chemical coagulation. Surface water treatment with electro-coagulation can produce high quality water, which could be used as potable water or fresh water for industrial applications. In wastewater treatment applications, electrocoagulation can be used to precipitate malodorous sulphides to prevent their release into air. Technol-ogy seems to be able to remove some toxic pollutants from wastewater and could be used as pretreatment prior to treatment at a biological wastewater treatment plant. However, a thorough economic and ecological comparison of chemical coagulation and electrocoagu-lation is recommended, because these methods seem to be similar in pollutant destabilisa-tion mechanisms, metal consumption and removal efficiency in most applications.
ISBN, ISSN ISBN 978-951-38-7940-2 (soft back ed.) ISSN 2242-119X (soft back ed.) ISBN 978-951-38-7941-9 (URL: http://www.vtt.fi/publications/index.jsp) ISSN 2242-1203 (URL: http://www.vtt.fi/publications/index.jsp)
Date October 2012
Language English
Pages 96 p. + app. 50 p.
Keywords Electrocoagulation, water treatment, wastewater treatment
Publisher VTT Technical Research Centre of Finland P.O. Box 1000, FI-02044 VTT, Finland, Tel. 020 722 111


VTT Technical Research Centre of Finland is a globally networked multitechnological contract research organization. VTT provides high-end technology solutions, research and innovation services. We enhance our customers’ competitiveness, thereby creating prerequisites for society’s sustainable development, employment, and wellbeing.
Turnover: EUR 300 million Personnel: 3,200
VTT publications
VTT employees publish their research results in Finnish and foreign scientific journals, trade periodicals and publication series, in books, in conference papers, in patents and in VTT’s own publication series. The VTT publication series are VTT Visions, VTT Science, VTT Technology and VTT Research Highlights. About 100 high-quality scientific and profes-sional publications are released in these series each year. All the publications are released in electronic format and most of them also in print.
VTT VisionsThis series contains future visions and foresights on technological, societal and business topics that VTT considers important. It is aimed primarily at decision-makers and experts in companies and in public administration.
VTT ScienceThis series showcases VTT’s scientific expertise and features doctoral dissertations and other peer-reviewed publications. It is aimed primarily at researchers and the scientific community.
VTT TechnologyThis series features the outcomes of public research projects, technology and market reviews, literature reviews, manuals and papers from conferences organised by VTT. It is aimed at professionals, developers and practical users.
VTT Research HighlightsThis series presents summaries of recent research results, solutions and impacts in selected VTT research areas. Its target group consists of customers, decision-makers and collaborators.
•VIS
ION
S•SCIENCE•TEC
HN
OL
OG
Y•RESEARCHHIGHLI
GH
TS
Dissertation
19
VT
T S
CIE
NC
E 1
9
Ele
ctro
co
ag
ula
tion
in th
e tre
atm
en
t of in
du
strial w
ate
rs an
d w
aste
wa
tersISBN 978-951-38-7940-2 (soft back ed.)
ISBN 978-951-38-7941-9 (URL: http://www.vtt.fi/publications/index.jsp)ISSN 2242-119X (soft back ed.) ISSN 2242-1203 (URL: http://www.vtt.fi/publications/index.jsp)
Electrocoagulation in the treatment of industrial waters and wastewaters
Chemical coagulation is commonly used in raw water and wastewater treatment plants for the destabilisation of pollutants so that they can be removed in the subsequent separation processes. The most commonly used coagulation chemicals are aluminium and iron metal salts. Electrocoagulation technology has also been proposed for the treatment of raw waters and wastewaters. With this technology, metal cations are produced on the electrodes via electrolysis and these cations form various hydroxides in the water depending on the water pH. In addition to this main reaction, several side reactions, such as hydrogen bubble formation and the reduction of metals on cathodes, also take place in the cell. In this research, the applications of electrocoagulation were investigated in raw water treatment and wastewater applications.
Electrocoagulation in the treatment of industrial waters and wastewatersMikko Vepsäläinen
Copyright © 2022 FDOKUMEN