
Urban waters: Resource or Risk? - Leesu
177
Urban waters: Resource or Risk? WWW-YES-2012 21 – 25 May 2012 Arcueil – France PROCEEDINGS DRAFT VERSION UNIVERSITÉ POPULAIRE DE L’EAU ET DU DEVELOPPEMENT DURABLE Conseil Général du Val-de-Marne Communauté d’Agglomération du Val de Bièvre Université Paris-Est
-
Upload
khangminh22 -
Category
Documents
-
view
4 -
download
0
Transcript of Urban waters: Resource or Risk? - Leesu

Urban waters: Resource or Risk? WWW-YES-2012
21 – 25 May 2012 Arcueil – France
PROCEEDINGS DRAFT VERSION
UNIVERSITÉ POPULAIRE DE L’EAU ET DU DEVELOPPEMENT DURABLE
Conseil Général du Val-de-Marne Communauté d’Agglomération du Val de Bièvre
Université Paris-Est

12th World Wide Workshop for Young Environmental Scientists WWW-YES-2012 Urban waters: resource or risks? Arcueil, France (21 – 25 May 2012)
1 / 175
Framework Growing population worldwide, economic development and increasing degradation of freshwater resources make the actual management of urban waters unsustainable for the world of tomorrow. Competition between water users, inadequate technologies or inappropriate managerial approaches makes better and adequate capacity building necessary. Furthermore, due to academic financial restrictions, PhD students are often limited in their ability to present and discuss their ongoing
research projects at an international level.
The LEESU research group and the H2o Association organise in the framework of the "University for water and sustainable development" of the Val-de-Marne County (South-East of Paris) an annual doctoral workshop dedicated to young environmental scientists and their capacity building.
Since the creation of the workshop in 2001, the thematic outline is "Urban waters, resource or risk", emphasizing the necessity of the integration of human activity in the natural environment to enable sustainable development of urban space. The workshop is multidisciplinary joining natural (urban hydrology, chemistry, ecology, health sciences...) and social sciences (architecture, management, decision making...), to improve trans-disciplinary discussions and social commitment of the scientific research in the field of integrated water management.
This workshop is characterized by a non formal work environment stimulating scientific creativity, exchange and discussion between participants, which number is limited to 25. For each participant, both papers and oral presentations especially focus on:
o The scientific context,
o The research questions together with their environmental justification,
o The field and/or laboratory and/or model methodologies that are currently or will be used, together with their justification for addressing the questions presented before,
o The planned research activity,
o The significance and limitations of these methodologies for developing countries.
Indeed this workshop is not mostly dedicated to present original results (the purpose of all conventional scientific conferences), but to present, discuss and justify methodologies selected by each PhD student. Furthermore, taking into account the large field of "urban water", papers and presentations are illustrated for being well understood. Finally, taking into account the large participation of students issued from developing countries, each paper and oral presentation should also include some discussion of the benefits and limitations of such methodologies within developing countries, where most up-to-date technology is often not available and financial resources always limited.
The five days of the workshop are dedicated:
o To the presentation, discussion and assessment of the individual research projects of each participant,
o To the building-up of international environmental research projects,

WWW-YES-2012 proceedings (draft version)
2 / 175
o To a half-day technical visit of urban water management equipments in the Val de Marne County,
o To an evening public presentation and discussion of an international survey, conducted by all workshop participants, on drinking water resource, production and distribution conditions in selected towns.
In conclusion the capacity building objectives of the WWW-YES workshop are focussed on 8 major tasks of an environmental scientist who wishes to reach an international expertise level:
1. Ability to present, discuss and build collaborations using English as a communication language,
2. Prepare a well formatted and structured scientific paper according to International Water Association guidelines,
3. Prepare a review report on a paper submitted for publication in an international journal and make general comments as well as specific questions to the author(s),
4. Chair a scientific presentation and discussion on a topic not closely related to your own one, i.e. moderate the discussion, find justified questions if necessary, control the discussion time,
5. Build an international work group including both nature and human scientists, working efficiently on a common goal,
6. Build a collaborative research project according to an international call and to limited time and strict format constrains and justify it for an international expert panel,
7. Conduct a scientific survey on a given city and collect both technical, economical and social data, the 3 major pillars of a sustainable development approach,
8. Present and discuss environmental or sustainable development issues to/with an non specialised public made of elected representatives and local citizens.
Program Oral presentation (21 – 24 May 2012)
Each participant has prepared and uploaded prior to 4 April 2012 a 6-10 page manuscript following the suggested format.
Each participant has prepared a 10 min scientific presentation, in English, on his / her research project and is ready for 30 min detailed scientific discussion during the workshop, also exclusively in English, chaired by the workshop participant in charge of reviewing his / her manuscript.
The oral presentation (ca. 10 slides) should especially focus on:
o The scientific context of the research subject,
o The research questions that are expected to be answered during the PhD preparation, together with their environmental justification,
o The field and/or laboratory and/or model methodologies that are currently or will be used, together with their justification for addressing the questions presented before,
o One or two major results obtained so far,
o The planned research activity till the end of the PhD (or after its termination, in the case of a PhD which is already finished),
o The significance and limitations of these methodologies for developing countries.
12th World Wide Workshop for Young Environmental Scientists WWW-YES-2012 Urban waters: resource or risks? Arcueil, France (21 – 25 May 2012)
3 / 175
Workshop participants are reminded of the large diversity of background knowledge within their colleagues, i.e. from natural to human sciences: thus these oral presentations should be extremely clear and well illustrated, allowing non-specialists of the research field to understand the raised environmental questions and the applied methods.
Each participant has received a manuscript to review, using a referee report form issued from International Water Association: this review was expected to be filled and sent back prior to 26 April 2012 to Daniel Thevenot, who has then send these reports to the author of the refereed manuscript. Thus WWW-YES-2012 participants should be ready, after their oral presentation, to answer to comments and questions raised by his / her referee.
A printed version of the proceedings draft version will be given to each participant upon arrival. In the meanwhile a light version of this document will be available on the web: due to file size limitations on this server, all photographs and numerous illustrations may have to be deleted. Since 2008, all participants are offered to publish their paper in an Open Source specific collection (http://hal.archives-ouvertes.fr/WWW-YES/fr/ ).
Field visit (22 May afternoon)
A half-day technical visit on urban water issues will be organised at several sites of Bièvre valley, close to Arcueil. The SIAVB will explain the Bièvre River management upstream the highly urbanised part of the river where it becomes a domestic underground sewer. A visit of one of the hydraulic regulation lakes will follow. Finally, participants will discover parts of the Bièvre River where it has been re-opened, in the middle of a newly designed park (Parc des Prés) or where it shall be reopenned (Cachan). This visit will be accompanied by senior scientist to ensure the transfer of knowledge and the discussion with the representatives of the local water authority.
Public discussion on drinking water management (22 May evening)
In the evening of Tuesday 22 May, all WWW-YES participants are invited to take part to a public discussion session with institutions, associations and citizens of the Bièvre valley on the topic of "Drinking water management: results of an international survey conducted by young environmental scientists". This public discussion will take place at Jean Vilar picture theatre (few hundred meters from CAVB buildings at Arcueil) after a short fiction film "Histoire d’eau" produced in 1958 by Jean-Luc Godard and Francois Truffaut, champions of the French "Nouvelle vague". Translation to/from English will be offered to the workshop participants, so that they understand the questions raised by the French public and are able to reply in English and be understood by the public.
Thus each selected participant has received an html link to an on-line survey questionnaire which should have been filled prior to 4 April 2012 on a city of his/her choice (except for cities which have been surveyed by participants of past WWW-YES editions). For the same deadline, each participant have sent to Daniel Thévenot 3 JPG pictures files illustrating the drinking water equipment and/or problems on the selected city as well as a country map indicating the city location.
Four voluntary workshop participants have prepared an English summary presentation of the surveyed towns since the WWW-YES-2009 editions and present it orally to the public attending this meeting. During the discussion, workshop participants may be questionned on the city which they will have selected for this survey. In order to prepare this public presentation and discussion, a rehearsal will be performed, in the presence of only WWW-YES-participants, on Monday 21 May afternoon.
Collaborative research project building-up (21 – 24 May - half-day sessions)
At the start of the workshop, participants will be invited to build multidisciplinary groups of 4-5 persons. Each group will prepare a proposal for international scientific research, under the guidance of senior experts. The topics of these proposals are defined with the help of

WWW-YES-2012 proceedings (draft version)
4 / 175
actors of decentralized cooperation in the field of water supply and sanitation, or with academic searchers.
For better understanding of such role game, this collective proposal preparation will be introduced by a short course on scientific proposal writing and accompanied by senior scientists who have all experienced European research projects.
Each collaborative research proposal will result both into a one-page ‘expression of interest’ (EoI) distributed to participants and into an oral presentation and discussion with a panel of senior scientists and practitioners on the morning of Friday 25 May. The aims of this exercise are to learn how to justify all aspects of an international research project and to help participants to possibly obtain a support for future environmental research projects during or after their PhD preparation.
Organising committee • Daniel THEVENOT – University Paris-Est, Université Paris-Est Créteil – LEESU, France
• Martin SEIDL - UFMG EHR Brazil / Université Paris-Est, Ecole des Ponts ParisTech - LEESU, France
Scientific committee
• Daniel THEVENOT - Université Paris-Est, Université Paris-Est Créteil – LEESU, France
• Martin SEIDL - UFMG EHR Brazil / Université Paris-Est, Ecole des Ponts-ParisTech LEESU, France
• Sani LAOUALI - University Abbou Moumouni, Niamey, Niger
• Tahar IDDER - University Kasdi Merbah, Ouargla, Algeria
• Gilles VARRAULT - Université Paris-Est Créteil – LEESU, France
• Bruno TASSIN - Université Paris-Est Ecole des Ponts-ParisTech – LEESU, France
• Bruno LEMAIRE – AgroParisTech – LEESU, France
• Jean Claude DEUTSCH – Université Paris-Est Ecole des Ponts-ParisTech – LEESU, France
• Nilo NASCIMENTO - UFMG EHR, Brazil
Workshop sites Accomodation
Thanks to Arcueil municipality, all WWW-YES participants (including those living in Paris conurbation) will be accommodated within the “Maison des Sportifs” ground level which access is situated at 12 rue Victor Bash, 94 114 Arcueil (see map below). This site is conveniently situated ca. 250 m from RER B (fast metro line directly connected to CDG airport) Laplace station. Room keys will be provided by WWW-YES organisers during Sunday 20 May at this site or on Monday 21 May at the workshop site.
This accommodation site is conveniently situated ca. 250 m from Arcueil city hall (Monday 21 May work place) and ca. 400 m from Communauté Urbaine du Val de Bièvre (CAVB) (Tuesday 22 till Friday 25 May workplace).
This accommodation site contains:
o 9 double rooms and 1 single room, all containing a washing basin,
o Sheets, blankets, pillow… are placed in plastic gaskets below each bed, but neither towels nor soap are provided,

12th World Wide Workshop for Young Environmental Scientists WWW-YES-2012 Urban waters: resource or risks? Arcueil, France (21 – 25 May 2012)
5 / 175
o A sanitary block containing several showers, toilets and basins (including equipment and products for cleaning after use),
o A small eating area including a fridge, a microwave, a coffee maker, tables, chairs and utensils: thus, just as for the sanitary block, participants need to get organised and successively share these facilities; WWW-YES organisers will provide basic drinks and food for breakfast prior to 21 May morning,
o Each room key allows the opening of both the outside door and the room door, but only room number 1 key (the only single room) contains a key for opening the garden grid: thus it is suggested not to close this grid during the workshop.
Participants will be accommodated at this site from Sunday 20 May till Sunday 27 May 2012. Keys to the rooms will be given to WWW-YES participants (one key per double room) by Martin Seidl on Sunday 20 May (from 2 pm to 7 pm).
An information meeting will be held at accommodation site on Sunday 20 May at 7 pm (19:00) by Martin Seidl.
Workshop sites
Thanks for the Arcueil municipality, a large and well equipped function hall named “Salle du Conseil” will be available for the first day of the workshop (Monday 21 May). It is conveniently situated at ca. 400 m from the accommodation site at 10 avenue Paul Doumer, 94 114 Arcueil (see map below).
This hall contains:
o A workshop zone with table, chairs, video projector, laptop PC and paper boards,
o A lunch area where a buffet lunch will be delivered.
Thanks to the “Communauté Urbaine du Val de Bièvre” (CAVB), a large and well equipped function hall named “Salle du Conseil” will be available during the rest of the workshop Tuesday 22 May till Friday 25 May). It is conveniently situated at ca. 400 m from the accommodation site at 7-9 avenue François Vincent Raspail, 94 114 Arcueil (see map below).
This hall contains:
o A workshop zone with table, chairs, video projector, laptop PC and paper boards,
o A coffee break area with coffee machine, boiler and soft drinks,
o A lunch area where a buffet lunch will be delivered each day,
o Computer Internet access facilities (using RJ45 cables), either in the main hall or in an adjacent small room, 3 PCs and a black and white printer.
Public meeting site
Thanks for the festival de l’Oh! and the Val-de-Marne county, the Jean Vilar picture theatre will be opened to the public and to the WWW-YES participants for the evening of Tuesday 22 May. This hall is conveniently situated at ca. 800 m from the workshop site at 1 Rue Paul Signac, 94110 Arcueil (see map below). After a short fiction film "Histoire d’eau" produced in 1958 by Jean-Luc Godard and Francois Truffaut, champions of the French "Nouvelle vague", WWW-YES participants will present and discuss with an non-specialised public the results of the drinking water surveys conducted from 2009 to 2012 (5 workshop editions).

WWW-YES-2012 proceedings (draft version)
6 / 175
Urban transportation in Paris by RATP
From the Airport (< 10€) RER : line B from the CDG Airport to Laplace station, then walk (10 min) till 12 rue Victor Bash, 94 114 Arcueil (see map below)
Figure 1: Map of WWW-YES accomodation and work sites
Université Paris-Est LEESU © 2012 Laboratoire Eau, Environnement et Systèmes Urbains / Water, Environment and Urban systems Laboratory (UMR - MA 102) http://leesu.univ-paris-est.fr/ Université Paris-Est Ecole des Ponts-ParisTech 6-8 Avenue Blaise Pascal Cité Descartes, Champs sur Marne 77455 Marne la Vallée Cedex 2, France Phone: +33-1 64 15 36 25 Fax: +33-1 64 15 37 64 [email protected]
Université Paris-Est University Paris-Est Créteil Faculty of Science and Technology 61 Avenue du General de Gaulle, 94010 Creteil Cedex, France Phone: +33-1 45 17 16 23 Fax: +33-1 45 17 16 27 [email protected]
Association H2o Paris © 2012 www.h2o.net 23 Bd de Belleville 75011 Paris [email protected]
http://leesu.univ-paris-est.fr/yes/
RER B (fast metro with direct connexion from CDG airport): Laplace station
Accommodation site 12 rue Victor Bash (ca. 250 m from RER Laplace station)
Work site (22-25 May): CAVB 7-9 ave François Vincent Raspail (ca. 400 m from
d ti it )
Work site (21 May): Arcueil city hall 10 Avenue Paul Doumer, 94110 Arcueil (ca. 400 m from accommodation site)
Jean Vilar hall (22 May) 1 Rue Paul Signac, 94110 Arcueil (ca. 800 m from accommodation site)

12th World Wide Workshop for Young Environmental Scientists WWW-YES-2012 Urban waters: resource or risks? Arcueil, France (21 – 25 May 2012)
7 / 175
WWW-YES-2012 Preliminary detailed programme
Monday 21 May
Conf
. nu
mbe
r
Conf
. Ti
me
FAMILY NAME
First Name Nationality University Title of presentation and
paper
Paper chairperson and reviewer
8:30 THEVENOT Daniel Universite Paris-Est
WWW-YES-2012 participants welcome
9:00 ROSSIGNOL Joseph Val-de-Marne county
Official opening of the 12th WWW-YES workshop
9:15 METAIRIE Christian Val-de-Bievre
Official opening of the 12th WWW-YES workshop
9:30 Short presentation of each WWW-YES-2012 participants
10:30 Break
Session 1. Waste water management
1 11:00 BENAMI Maya Israel / USA
Ben Gurion University of the Negev
Assessment of waterborne pathogenic bacteria in greywater and irrigated soils
ROGUET
2 11:40 CHANDEL Mukta Singh India
Maulana Azad National Institute of Technology
Microbial analysis and treatment of grey water BENAMI
3 12:20 RAFIEE Mojtaba Iran Shahid Chamran University
Application of Iranian Standard for Site-Selection of WWTP using GIS
MOULIN
13:00 Buffet lunch and group set-up
14:00 SEIDL Martin Université Paris-Est
Presentation of research cooperation project topics
14:30 Selection of research cooperation project topic by each group
15:00 THEVENOT Daniel Université Paris-Est
Research cooperation project building-up methodology: an introduction
15:30 Summary group members
Rehearsal of presentation and discussion of drinking water survey summary
18:00 End of session

WWW-YES-2012 proceedings (draft version)
8 / 175
Tuesday 22 May
Conf
. nu
mbe
r
Conf
. Ti
me
FAMILY NAME
First Name
Nationality University Title of presentation
and paper
Paper chairperson and reviewer
Session 1. Waste water management (follow.)
4 8:30 YIOUGO Lydie Burkina Faso
International Institute of water and environment engineering
Multi-Criteria Decision Analysis and choice of sanitation technology: challenge in urban water quality of Pouytenga, Burkina Faso
RAFIEE
5 9:10 BERNAL SUAREZ
Diana Paola Colombia Universidad
del Valle
Key issues for decentralization in municipal wastewater treatment
YIOUGO
6 9:50 WILINSKI Piotr Poland
Warsaw University of Technology
Dissolved Ozone Flotation as a innovative and prospect method for treatment of micropollutants and wastewater treatment costs reduction
NORMATOV
10:30 Break
Session 2. Water management
7 11:00 SELLAMI Emna Tunisia Universite Paris-Est
Modelling the Zn emissions from rooffing materials at Creteil city scale
AL-RUBAEI
8 11:40 AL-RUBAEI Ahmed Iraq
Lulea University of Technology
Long term performance of stormwater infiltration facilities
SELLAMI
12:20 Buffet lunch
13:20 Bus transportation
Technical visit of the Bievre river/sewer equipments: SIAVB (upstream Bievre management) and Cachan future Bievre river re-opening
17:30 Break and walk to the Jean Vilar picture theater (Arcueil): presentation equipment set-up
19:00 Light snack
19:30 Public presentation of a short fiction film "Histoire d’eau" produced in 1958 by Jean-Luc Godard and Francois Truffaut, champions of the French "Nouvelle vague"
20:00
Public presentation of the WWW-YES international survey on drinking water management: presentation and discussion with Val de Bievre citizen (translation to/from English available)
21:30 End of session

12th World Wide Workshop for Young Environmental Scientists WWW-YES-2012 Urban waters: resource or risks? Arcueil, France (21 – 25 May 2012)
9 / 175
Wednesday 23 May
Conf
. nu
mbe
r
Conf
. Ti
me
FAMILY NAME
First Name
Nationality University Title of presentation and
paper
Paper chairperson and reviewer
Session 2. Water management (follow.)
9 8:30 ROGUET
Adelaide France
University Paris-Est Creteil (UPEC)
Impact of multiple disturbances on the sanitary and ecological quality of urban lakes
CHANDEL
10 9:10 SINGH Ritu India FRI University
Urban Lakes and Wetlands: Opportunities and Challenges in Indian Cities - Case Study of Delhi
BERNAL SUAREZ
11 9:50 ASADI LOUR Mehdi Iran
Islamic Azad university science and research branch of Tehran, Iran
Developing decision support tools for optimum domestic management by Bayesian belief networks in Tehran, Iran
TLILI
10:30 Break 11:00 Research cooperation project: preparation 12:30 Buffet lunch 13:30 Research cooperation project: preparation
18:00 End of session

WWW-YES-2012 proceedings (draft version)
10 / 175
Thursday 24 May
Conf
. nu
mbe
r
Conf
. Ti
me
FAMILY NAME
First Name
Nationality
University
Title of presentation and paper
Paper chairperson and reviewer
Session 2. Water management (follow.)
12 8:30 NORMATOV Parviz Tajikistan
Tajik Technical University
Investigation of the underground sources of potable water chemical properties and influence of drainage waters on degree of their mineralization
WILINSKI
13 9:10 TRAN KHAC Viet Vietnam
Ecole des Ponts ParisTech
Urban lakes: interaction between phytoplankton dynamics and trace metal speciation
OYEDOTUN
14 9:50 TLILI Youssef Tunisia ENGEES
A multicriteria decision scheme for water pipe replacement prioritization
ASADI LOUR
15 10:30 MOULIN Elodie France Universite Paris-Est
Live with floods in the Greater Paris. Flood risk integration in the landuse projects
SINGH
11:10 Break
Session 3. Water resource
16 11:40 OYEDOTUN
Temitope D. Timothy
Nigeria University College London
Urban water usages in Egbeda area of Oyo State, Nigeria
BIABANAKI
17 12:20 BIABANAKI Monireh Iran
Isfahan University of Technology
Low Flow Regionalization Models by Regression and Hybrid Methods
TRAN KHAC
12:30 Buffet lunch
13:30 Research cooperation project: summary preparation (EoF)
15:30
Research cooperation project: presentation preparation (PPT)
18:00 End of session
12th World Wide Workshop for Young Environmental Scientists WWW-YES-2012 Urban waters: resource or risks? Arcueil, France (21 – 25 May 2012)
11 / 175
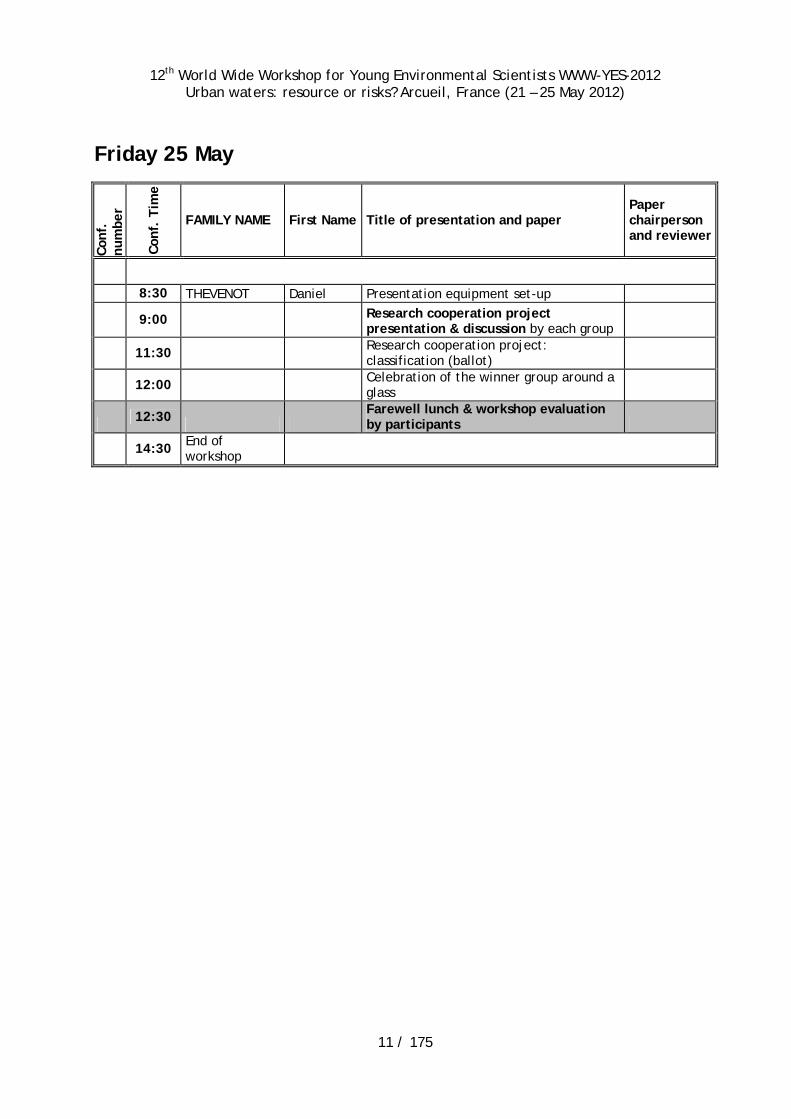
Friday 25 May
Conf
. nu
mbe
r
Conf
. Ti
me
FAMILY NAME First Name Title of presentation and paper Paper chairperson and reviewer
8:30 THEVENOT Daniel Presentation equipment set-up
9:00
Research cooperation project presentation & discussion by each group
11:30 Research cooperation project: classification (ballot)
12:00 Celebration of the winner group around a glass
12:30 Farewell lunch & workshop evaluation by participants
14:30 End of workshop

WWW-YES-2012 proceedings (draft version)
12 / 175
WWW-YES-2012 proceedings (draft version) 1. Assessment of waterborne pathogenic bacteria in greywater and irrigated soils13
Maya BENAMI, Moshe HERZBERG, Ezra ORLOFSKY, Amit GROSS and Osnat GILLOR 13 2. Microbial Analysis and Treatment of Grey water ................................................... 28
Mukta Singh CHANDEL*, Mukul KULSHRESTHA* and Pawan LABHASETWAR** 28 3. Application of Iranian Standard for Site-Selection of WWTP using GIS .............. 35
Mojtaba RAFIEE*, Fereydoun RADMANESH* and Abdolkarim BEHNIA* 35 4. Multi-Criteria Decision Analysis and choice of sanitation technology: challenge in
urban water quality of Pouytenga, Burkina Faso .................................................. 42 Lydie S. A YIOUGO*, Halidou KOANDA**, Joseph WETHE***, Samuel YONKEU**** and Evariste DA***** 42
5. Key issues for decentralization in municipal wastewater treatment.................... 52 Diana Paola BERNAL* and Inés RESTREPO** 52
6. Dissolved Ozone Flotation as a innovative and prospect method for treatment of micropollutants and wastewater treatment costs reduction................................. 64 Piotr Robert WILIŃSKI*, Jeremi NAUMCZYK 64
7. Modelling the Zn emissions from roofing materials at Créteil city scale - Defining a methodology .............................................................................................................. 71 Emna SELLAMI-KAANICHE 1,2, Bernard de GOUVELLO 1,2, Arnaud Le BRIS 3, Marie-Christine GROMAIRE 2 and Ghassan CHEBBO 2 71
8. Long-Term performance of stormwater infiltration facilities ................................ 81 Ahmed Mohammed AL-RUBAEI 81
9. Impact of multiple disturbances on microbiological quality of urban and peri-urban lakes................................................................................................................. 90 Adélaïde ROGUET and Françoise S. LUCAS 90
10. Urban Lakes and Wetlands: Opportunities and Challenges in Indian Cities - Case Study of Delhi .......................................................................................................... 100 Ritu SINGH and Manu BHATNAGAR 100
11. Developing decision support tools for optimum domestic management by Bayesian belief networks in Tehran, Iran.............................................................. 112 Mehdi ASADI LOUR *, F. KAVEH*, M. MANSHURI* and A. KHOSROJERDI* 112
12. Investigation of the underground sources of potable water chemical properties and influence of drainage waters on degree of their mineralization .................. 124 Parviz NORMATOV*, Asliya RAJABOVA** 124
13. Urban lakes: interaction between phytoplankton dynamics and trace metal speciation................................................................................................................. 131 Viet TRAN KHAC*, Brigitte VINÇON-LEITE*, Gilles VARRAULT*, Bruno Jacques LEMAIRE*, Bruno TASSIN* and Nilo NASCIMENTO** 131
14. A spatial and temporal analysis for long term renewal of water pipes .............. 140 Youssef TLILI *,** and Amir NAFI ** 140
15. Live with floods in the Greater Paris. Flood risk integration in the landuse projects................................................................................................................................... 148 Élodie MOULIN * 148
16. Urban water usages in Egbeda area of Oyo State, Nigeria ................................. 155 Temitope Dare Timothy OYEDOTUN* 155
17. Low flow regionalization by regression and hybrid methods............................. 166 Monireh BIABANAKI*, Seyed Saeid ESLAMIAN** and Alireza TABATABAEI*** 166

12th World Wide Workshop for Young Environmental Scientists WWW-YES-2012 Urban waters: resource or risks? Arcueil, France (21 – 25 May 2012)
13 / 175
WWW-YES-2012 session 1: Water management
1. Assessment of waterborne pathogenic bacteria in greywater and irrigated soils
Maya BENAMI, Moshe HERZBERG, Ezra ORLOFSKY, Amit GROSS and Osnat GILLOR
Department of Environmental Hydrology & Microbiology, Zuckerberg Institute for Water Research, J. Blaustein Institutes for Desert Research, Ben-Gurion University of the Negev, Sede Boqer 84990, Israel (E-mail: [email protected]; [email protected]; [email protected]; [email protected]; [email protected])
Abstract Reusing greywater (GW) for irrigation is recognized as a sustainable solution to water conservation in arid lands. One of the major impediments for reuse of GW is the presence of pathogenic microorganisms. The presence and abundance of nine pathogens and indicators was investigated in three GW treatment systems and their respective irrigated soils. The GW and soils were monitored bi-monthly over the course of a year using culture dependent and independent methods. The presence of the pathogens and indicators was analyzed and compared in GW versus freshwater (FW) irrigated soils. The results showed that comparable types of pathogens and fecal indicator bacteria including Escherichia coli, Klebsiella pneumoniae, Staphylococcus aureus, Salmonella enterica, Pseudomonas aeruginosa, Enterococcus faecalis, Shigella spp., and Vibrio cholerae were found in the treated GW and their corresponding irrigated soils, while Campylobacter jejuni was found in none of the analyzed samples. Although the FW and GW irrigated soils contained a similar array of bacterial pathogens and indicators, we cannot establish their source. Spatial and temporal scales were found to have no impact on the diversity or abundance of pathogens and indicators in the treated GW or irrigated soils. With our experimental set-up our results suggest that GW irrigation has minor effect on the pathogen and indicator diversity and abundance in irrigated soils.
Keywords Greywater; pathogens; qPCR; irrigation; soil
INTRODUCTION Water scarcity calls for large-scale conservation and reuse (JURY AND VAUX, 2007). Combined with increasing population, the demand for water has prompted a growing search for additional sources of water. In many countries, wastewater (WW) reuse is now a growing practice and in Israel it is a major part of the overall water management plan (MEKOROT, 2007). One type of possible WW to be utilized is Greywater (GW). GW is the non-toilet portion of domestic WW stream coming from bathing, laundry, and kitchen use (FRIEDLER et al., 2005). Due to their dubious origin GW composition and volume are highly variable, depending on sanitary standards and lifestyle, such as: age of residents, family size, eating habits, and detergents used (WHO 2006). GW represents the largest potential source of water savings in domestic residences, accounting for as much as 50–80% of the total water usage in a household (CHRISTOVA-BOAL, 1996).

WWW-YES-2012 proceedings (draft version)
14 / 175
Currently, the guidelines for pathogen detection in WW require testing for enteric indicators including fecal coliforms and Enterococcus faecalis (US EPA 2004/WHO 2006). However, owing to their source, untreated and treated GW may contain a variety of harmful microorganisms with types and numbers that vary depending on the background levels of infection in the house of origin (WHO 2006). Therefore, the sole use of fecal coliforms currently required might not be as useful for GW because (i) their concentration is expected to be lower, compared to full domestic WW; and (b) the bacteria in GW are not necessarily of fecal source. The presence of a wide array of bacteria in treated GW has gone untested, though raw GW has been examined for fecal contamination and exhibited a high variability of pathogen loads (CASANOVA et al., 2001a and 2001b; GROSS et al., 2005; GROSS et al., 2007; TRAVIS et al., 2010). One of the major impediments for legislation imposing the widespread use of GW is the possible presence of a variety of pathogenic microorganisms (WINWARD et al., 2008). An additional risk associated with the use of contaminated water is its intended application for soil (yard) irrigation. However, the presence, viability, and persistence of human pathogens with soil irrigated with GW have not been evaluated (WARRINER et al., 2009). Safe reuse of GW requires the identification and characterization of a range of pathogens in GW treated effluent. The principal aim of this study was to monitor an array of bacterial pathogens and indicators in GW and the irrigated soils. To our knowledge, only suggested quality parameters exist for GW (WHO 2006), but there are no universal standards or quality parameters for either GW reuse and the soils irrigated by GW. We assessed how much and which pathogenic bacteria originating from the treated GW are introduced, establish and persist in the GW irrigated soil matrix. We hypothesized that comparable types of pathogens and indicators would be found in each sampling of the treated GW and corresponding numbers will dominate the irrigated soils; such that GW and FW irrigated soils would support a dissimilar array of bacterial pathogens and indicators. We also investigated if spatial and temporal scales would impact the diversity or abundance of pathogens found in the treated GW.
MATERIAL & METHODS
Field site and sampling approach Over the course of six months in 2010, bi-monthly GW (excluding water derived from the kitchen) and corresponding irrigated soil samples were taken from recycled vertical flow constructed wetland (RVFCW) systems (GROSS et al., 2007, GROSS et al., 2008) located in three private domestic residences. Two of the residences were located in the central Negev desert, Israel. The third system was located in the Sharon region, Israel. All residences housed adults and school aged children.
Water samples
Water samples were collected in 25 L plastic containers. One hundred L were collected from each site and delivered to the lab. The samples were stored at 4 ºC to minimize analyte loss, contamination, or biological degradation. Maximum holding times for samples prior to processing and testing was 48 hours.
Soil samples
All of the soils selected for use in the study are naturally occurring: hamra loam (Typic Rhodoxeralfs) was obtained from a private household in the Sharon region (Merkaz); loess (sandy loam Aridisol), a natural desert soil, was obtained from the three sample locations Sde Boqer Barak (SBB), Sde Boqer Gross (SBG) and a few control sites in Sede Boqer, Israel. All

12th World Wide Workshop for Young Environmental Scientists WWW-YES-2012 Urban waters: resource or risks? Arcueil, France (21 – 25 May 2012)
15 / 175
sample sites were irrigated with GW for at least 2 years except for the control site, which was irrigated with FW for at least 10 years. Soil samples were collected from each yard irrigated with the treated GW and from a few yards irrigated with FW (control) by randomly selecting five sampling points. Each soil sample was collected by removing, approximately, 100 g of soil from the upper 5 cm of the profile, using a sterile scoop. The samples were placed in individual sterile plastic bags (Whirl-Pak, USA), transported to the lab, stored at 4 °C and processed within 24 hr. In the lab, the samples were composited and homogenized while removing plant litter and debris and separated into sub-samples for chemical and microbial analyses (the latter stored at -80 °C).
Ultrafiltration GW samples were concentrated using a modified UF process based on the designs described in Leskinen and Lim (2008). The GW sample was concentrated directly from about 100 L to approximately 100 mL using a disposable F200NR filter (Fresenius Medical; Germany). The filtration system is illustrated further in Figures 1-3.
Internal recovery control estimates
To account for recovery efficiency in the samples we spiked a known amount of the bacteria Agrobacterium tumefaciens into the water samples, prior to the concentration step. A. tumefaciens is a common soil bacteria which causes crown gall disease, a neoplastic disease of dicotyledonous plants (TOMLINSON AND FUQUA, 2009). To confirm that A. tumefaciens is not naturally found in GW, a water sample was divided into two subsamples (each of 50 L portions): half spiked with A. tumefaciens and the other naïve. Each subsample was filtered separately. Using qPCR, we did not detect A. tumefaciens in the naïve subsample confirming the use of this bacterium as a reference. To validate the use of A. tumefaciens as a recovery surrogate, a known concentration of A. tumefaciens, 10 mL of 0.6 OD600 (approximately 107 cells), was initially added to 100 L of tap water in a manner identical to the prospective GW samples. We then used qPCR to detect the amount of cells as gene copies per reaction following water concentration. The numbers of organisms found by qPCR in seeded retentates were determined from standard curves and then normalized to gene copies 100 mL-1. Following the preliminary tests, 10 mL of 0.6 OD600 (approximately 107 cells) of A. tumefaciens was added and processed in each GW sample. All resulting data were adjusted by the percentage of recovered A. tumefaciens cells (TABLE A.1 in APPENDIX A).
FIGURE 1 : Schematic representation of the ultrafiltration unit

WWW-YES-2012 proceedings (draft version)
16 / 175
FIGURE 2: The Fresenius filtration system A) schematic and B) picture.
Microbial analysis and techniques Standard microbial tests for detection and enumeration of fecal indicators from the GW treated effluent and soils were performed, i.e., a spread-plate method using selective media (APHA 1998).
DNA extraction from GW and soil samples
DNA was extracted from all the concentrated pellets of the GW and soil samples according to the manufacturer instructions using PowerSoil DNA extraction kit (MoBio, USA). Extractions were analyzed for purity and quantity using a Nanodrop 2000 spectrophotometer (Thermo, USA). All DNA extracts from the GW and soil samples were stored at -80°C.
Reference bacteria DNA extraction
Cultivation of the reference bacteria listed in Table B.1 in Appendix B was done in Luria-Bertani broth (LB) for A. tumefaciens, E. coli, K. pneumoniae, S. aureus, S. enterica, Shigella flexneri., and Vibrio cholerae; Brain Heart Infusion (BHI) for P. aeruginosa; or BHI plus 20% glycerol
Recycle Line
Peristaltic Pump
Permeate
Retentate
Feed
Water Tank
B
A

12th World Wide Workshop for Young Environmental Scientists WWW-YES-2012 Urban waters: resource or risks? Arcueil, France (21 – 25 May 2012)
17 / 175
(Sigma) for Enterococcus faecalis. The reference bacteria Campylobacter jejuni could not be grown in our lab for technical reasons, therefore, E. coli transformed with a plasmid containing the probe’s targeted DNA fragment (TABLE B.1 in APPENDIX B) was used as a reference. All the bacteria were grown in a shaking incubator (New Brunswick Scientific, NJ) at 37°C and 250 rpm overnight (12-15 hr). A. tumefaciens cells were grown in LB media at 25°C for 48 hr. Genomic DNA from pure cultures was extracted using the Accuprep Genomic DNA Extraction Kit (Bioneer, S. Korea) according to the manufacturer protocol.
Plasmid extraction
The primers used for plasmid cloning are listed in TABLE B.1 in APPENDIX B. All plasmids were cloned according to the manufacturer protocol using the InstaClone PCR Cloning Kit (Fermentas, Canada) and extracted using Accuprep plasmid mini extraction kit (Bioneer).
Real time qPCR
Real time quantitative PCR (qPCR) for the suite of pathogens was performed targeting the bacteria listed in TABLE B.1 in APPENDIX B. Plasmid DNA and genomic DNA of pure cultures were used as a reference for calibrating the bacterial concentrations. The extracted DNA was analyzed with the primers and probes listed in TABLE B.1 in APPENDIX B. To determine the detection sensitivity of the qPCR assay, a preliminary amplification and cycle threshold (CT) test was performed with a series of five 10-fold dilutions of the reference bacterial genomic DNA (starting at 1 ng reaction–1 to 100 fg reaction–1). A standard curve was generated and used to estimate the amount of species specific DNA detected in each sample. All qPCR assays utilized fluorescent probes (Metabion, Germany) and were conducted in at least three replicate assays each done in triplicates. The overall PCR product size was smaller than 120 bases. As different probe dyes could be detected on distinct wavelengths, multiplex qPCR was performed. The following reaction mix was used for each reaction: 5μL template genomic DNA (of 4 ng μL-
1), 2.1 μL water, 0.625 μL 4µM of each set of primers and probe, 10 μL Absolute Blue qPCR mix (Thermo Scientific, USA) and DDW to a final volume of 20 μL. All qPCR reactions were executed in a real time PCR machine (Corbett Research Rotor Gene 6000, Thermo, USA) following enzyme activation at 95°C for 15 min, denaturation at 95°C for 10 min, and 40 cycles of annealing at 55°C for 15 s extension at 60°C for 45 s. The qPCR results were adjusted by the recovery efficiencies (TABLE A in APPENDIX A) and normalized to gene copies 100 mL-1.
Physicochemical characterization of GW and soils The physical and chemical quality parameters of the treated GW and the irrigated soils were analyzed using APHA 1998 standard tests (APHA 1998; GROSS et al., 2008) and included the following tests: for the GW treated effluent we measured turbidity, electrical conductivity, optical density (OD600), pH, total suspended solids (TSS), biological oxygen demand (BOD), total organic carbon (TOC), Total N, and Total P was taken. Soil analyses included water content, saturation, pH, electrical conductivity, sodium, calcium, magnesium, sodium adsorption ratio, percentage organic matter, nitrate, ammonium, phosphorus, and potassium. All results are listed in TABLES C.1 and C.2 in APPENDIX C.

WWW-YES-2012 proceedings (draft version)
18 / 175
Statistical analysis and Data Plotting Microsoft Excel and STATISTICA software were used for all graphical and statistical analysis. Analyses included linear regression, mean, median, and statistical significance below 0.05.
RESULTS AND DISCUSSION
Bacteria
Klebsiella pneumoniae
Pseudomonas aeruginosa
Shigella spp.
Enterococcus faecalis
Salmonella enterica
Vibrio cholerae
Staphylococcus aureus
Campylobacter jejuni
Escherichia coli
Esherichia coli culture
Log 10
Gen
e C
opie
s pe
r 100
mL
0
1
2
3
4
5
6
7
8
9
10 Mean
Median
FIGURE 3: Detection of pathogenic bacterial gene copies in treated GW. All GW pathogen data were adjusted by each sample’s recovery efficiency (TABLE 1) and normalized to gene copies 100 mL-1.
Escherichia coli culture was quantified in log10 CFU per 100 mL.
Bacteria
Klebsiella pneumoniae
Pseudomonas aeruginosa
Shigella spp.
Enterococcus Faecalis
Salmonella enterica
Vibrio cholerae
Staphylococcus aureus
Campylobacter jejuni
Escherichia coli
Escherichia coli culture
Log 10
Gen
e C
opie
s pe
r 1 g
r
0
1
2
3
4
5
6
7
8
9
10MeanMedian
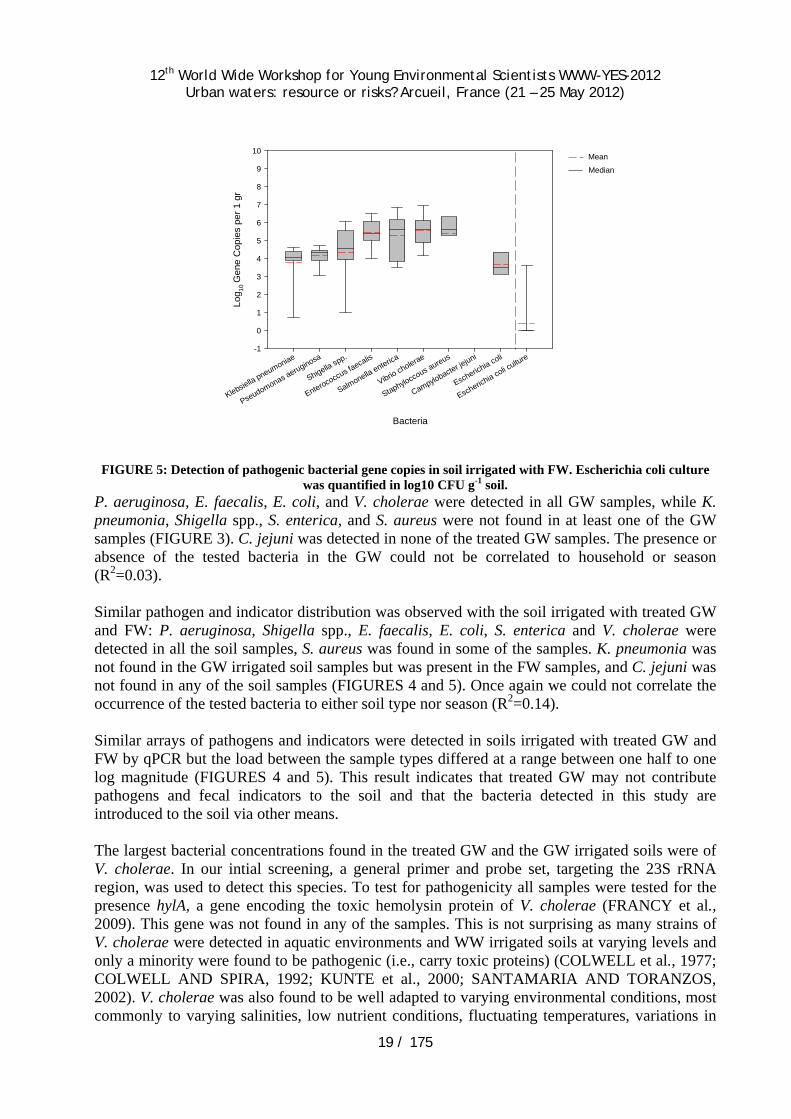
FIGURE 4: Detection of pathogenic bacterial gene copies in soil irrigated with GW. Escherichia coli culture was quantified in log10 CFU g-1.
12th World Wide Workshop for Young Environmental Scientists WWW-YES-2012 Urban waters: resource or risks? Arcueil, France (21 – 25 May 2012)
19 / 175
Bacteria
Klebsiella pneumoniae
Pseudomonas aeruginosa
Shigella spp.
Enterococcus faecalis
Salmonella enterica
Vibrio cholerae
Staphyloccous aureus
Campylobacter jejuni
Escherichia coli
Escherichia coli culture
Log 10
Gen
e C
opie
s pe
r 1 g
r
-1
0
1
2
3
4
5
6
7
8
9
10Mean
Median
FIGURE 5: Detection of pathogenic bacterial gene copies in soil irrigated with FW. Escherichia coli culture was quantified in log10 CFU g-1 soil.
P. aeruginosa, E. faecalis, E. coli, and V. cholerae were detected in all GW samples, while K. pneumonia, Shigella spp., S. enterica, and S. aureus were not found in at least one of the GW samples (FIGURE 3). C. jejuni was detected in none of the treated GW samples. The presence or absence of the tested bacteria in the GW could not be correlated to household or season (R2=0.03). Similar pathogen and indicator distribution was observed with the soil irrigated with treated GW and FW: P. aeruginosa, Shigella spp., E. faecalis, E. coli, S. enterica and V. cholerae were detected in all the soil samples, S. aureus was found in some of the samples. K. pneumonia was not found in the GW irrigated soil samples but was present in the FW samples, and C. jejuni was not found in any of the soil samples (FIGURES 4 and 5). Once again we could not correlate the occurrence of the tested bacteria to either soil type nor season (R2=0.14). Similar arrays of pathogens and indicators were detected in soils irrigated with treated GW and FW by qPCR but the load between the sample types differed at a range between one half to one log magnitude (FIGURES 4 and 5). This result indicates that treated GW may not contribute pathogens and fecal indicators to the soil and that the bacteria detected in this study are introduced to the soil via other means. The largest bacterial concentrations found in the treated GW and the GW irrigated soils were of V. cholerae. In our intial screening, a general primer and probe set, targeting the 23S rRNA region, was used to detect this species. To test for pathogenicity all samples were tested for the presence hylA, a gene encoding the toxic hemolysin protein of V. cholerae (FRANCY et al., 2009). This gene was not found in any of the samples. This is not surprising as many strains of V. cholerae were detected in aquatic environments and WW irrigated soils at varying levels and only a minority were found to be pathogenic (i.e., carry toxic proteins) (COLWELL et al., 1977; COLWELL AND SPIRA, 1992; KUNTE et al., 2000; SANTAMARIA AND TORANZOS, 2002). V. cholerae was also found to be well adapted to varying environmental conditions, most commonly to varying salinities, low nutrient conditions, fluctuating temperatures, variations in

WWW-YES-2012 proceedings (draft version)
20 / 175
oxygen tension, and exposure to UV sunlight (COLWELL AND SPIRA, 1992). With such a hardy character, V. cholerae seems well suited to a diversity of habitats, hence it is not surprising to find V. cholerae species within the GW system and yard soils. The irrigated soils generally contained large amounts of E. faecalis (FIGURES 4 and 5). E. faecalis is a facultative anaerobe gram-positive cocci that can survive harsh conditions, including a broad range of environments (it was found in soil, water, and plants) and conditions (various pH values and temperatures) (GILMORE et al., 2002). Specifically, E. faecalis strains were frequently isolated from environmental waters (HE AND JIANG, 2009), hence, this bacterium serves as a common indicator for fecal contamination (SANTO-DOMINGO et al., 2003). When testing GW and the irrigated soils, this species might present a better indicator, as it was prevalent in all the tested samples, unlike E. coli that was absent from some of the samples. Salmonella enterica and Shigella sp. were found in most GW and GW and FW irrigated samples. Both pathogens have been reported to be found in GW samples (KOTUT et al., 2011; ROSE 1991; OTTOSSON 2003). Like in GW, quantities in wastewater have been found to vary depending on the environmental conditions, time of sampling, and the type of contaminants entering the system (HU and GIBBS, 1995; ROSE 1995; TOZE, 1999; SHANNON et al., 2007). Staphylococcus aureus, a common food pathogen, was found in a few GW and GW irrigated soil samples, but largely detected in the FW irrigated soils. A number of studies have stated that S. aureus is rarely detectable in wastewater, and this may be due to its high susceptibility to heat and other disinfection methods (SHANNON et al., 2007). Unless an outbreak of S. aureus-related gastroenteritis has occurred, the chance of detection is limited (VOLKMANN et al., 2004). We cannot account for why it was frequently detected in the FW irrigated soils. Klebsiella pneumonia was not found at all in the soil irrigated with GW, and very little was found in the GW itself and FW irrigated soils. GW studies have suspected that when coliform bacteria are present that Klebsiella pneumonia, a thermotolerant coliform bacteria, is also present. It is not surprising that C. jejuni was not found in the samples as it usually dwells in warmer (42ºC), microaerophilic environments (OBIRI-DANSO and JONES, 1999). Such characteristics are lacking in the RVFCW (type of GW treatment system - Recirculating Vertical Flow Constructed Wetland) GW effluent and the irrigated upper soil environments. Although a similar pattern of bacteria were found in the soil irrigated with GW as in the GW itself, we cannot confirm that the GW added pathogens to the soil matrix. GW may not be the only, if at all, contributor to pathogens and indicators in the soil as the soil irrigated with FW contained similar types and amounts of the pathogens. As a result, we can suggest that although there are comparable types of pathogens and indicators in the GW and the irrigated soil, we cannot establish that the source of the pathogens in the soils is indeed GW. As all households sampled during this study often hosted mammals in their yards, enteric pathogens may have been introduced into the soil in this manner. Once the enteric microbes are introduced, previous studies suggest that if key resources are available, pathogens and indicators could proliferate in soils (FREEMAN AND CAWTHORN, D.L. 1999; JIANG et al., 2001; WANG et al., 1996; PELL, 1997; VAN ELSAS et al., 2011). However, competition with soil microorganisms and adverse environmental conditions can influence their survival (JIANG et al., 2001). We have shown that soils irrigated with treated GW and FW basically contain the same array of pathogens and indicators; however, the survival, viability and origin of each individual pathogen species is questionable and will be subjected to further research.

12th World Wide Workshop for Young Environmental Scientists WWW-YES-2012 Urban waters: resource or risks? Arcueil, France (21 – 25 May 2012)
21 / 175
CONCLUSIONS Here we show that treated GW and the irrigated soils with either GW or FW hold comparable types of pathogens. P. aeruginosa, E. faecalis, E. coli, and V. cholerae were found in all matrices (GW effluent as well as GW and FW irrigated soils). K. pneumoniae, Shigella spp., S. enterica, and S. aureus were detected in some samples and C. jejuni in none. However, FW irrigated soils harbor the same array of pathogens and indicators as was found in the GW irrigated soils indicating that GW is not the sole contributor to the bacteria detected in yard soils. Further research into the viability of these pathogens is called for, but we suggest that GW and FW irrigated soils contain the same array of pathogens and indicator bacteria, questioning the role of GW irrigation in their introduction to yards.
REFERENCES • AL-HAMAIEDEH H. and Bino M. (2010). Effect of treated grey water reuse in irrigation on soil
and plants. Desalination, 256(1-3):115-119. • APHA (1998). APHA, Standard Methods for the Examination of Water and Wastewater, 20 edn.
American Public Health Association, Washington, DC. • CASANOVA L. M., Gerba C. P., and Karpiscak, M. (2001a). Chemical and microbial
characterization of household graywater. Journal of Environmental Science and Health Part a, 36:395-401.
• CASANOVA, L.M., Little V., Frye R.J., and Gerba C.P. (2001b). A survey of the microbial quality of recycled household graywater, J. Am. Water Resour. Assoc., 37(5): 1313–1319.
• CHRISTOVA-BOAL D., Eden R. E., and McFarlane S. (1996). An investigation into greywater reuse for urban residential properties. Desalination, 106: 391-397.
• COLWELL R.R., Kaper J., and Joseph S.W. (1977). Vibrio cholerae, Vibrio parahaemolyticus and other Vibrios: occurrence and distribution in Chesapeake Bay. Science, 198: 394–396.
• COLWELL R.R. and Spira W.M. (1992). The ecology of Vibrio cholerae. In: Cholera. D. Barua (ed.) and W.B. Greenough III (ed.), Plenum, New York, pp. 107–127.
• DEAKIN W.J., Sanderson J.L., Goswami T., and Shaw C.H. (1997). The Agrobacterium tumefaciens motor gene moiA, is in a linked cluster with the flagellar switch protein genes, fliG, fliM, and fliN. Gene, 189: 139-141.
• FRANCY D.S., Bushon R.N., Brady A.M.G., Bertke E.E., Kephart C.M., Likirdopulos C.A., Mailot B.E., Schaefer F.W., and Lindquist A. (2009). Comparison of traditional and molecular analytical methods for detecting biological agents in raw and drinking water following ultrafiltration. Journal of Applied Microbiology, 107(5): 1479-1491.
• FREEMAN T. M. and Cawthon D.L. (1999). Use of composted dairy cattle solid biomass, poultry litter and municipal biosolids as greenhouse growth media. Compost Science Utilization, 3:66-71.
• FRIEDLER E., Galil N. I., and Kovalio, R. (2005). On-site greywater treatment and reuse in multi-storey buildings. Wat. Sci. Tech., 51(10): 187-194.
• GILMORE M. (2002). The Enterococci: Pathogenesis, Molecular Biology, and Antibiotic Resistance. American Society for Microbiology Press, Washington, DC
• GROSS A., Azulai N., Oron G., Rone, Z., Arnold M. and Nejidat, A. (2005). Environmental impact and health risks associated with greywater irrigation: a case study. Water Science and Technology, 52(8):161-169.
• GROSS A., Shmueli, O., Ronen Z., and Raveh, E. (2007). Recycled vertical flow constructed wetland (RVFCW)—a novel method of recycling greywater for landscape irrigation in small communities and households. Chemosphere, 66(5): 916-923.
• GROSS A., Wiel-Shafran A., Bondarenko N., and Ronen Z. (2008). Reliability of small scale greywater treatment systems and the impact of its effluent on soil properties. International Journal of Environmental Studies, 65(1): 41-50.

WWW-YES-2012 proceedings (draft version)
22 / 175
• HE J.W. and Jiang S. (2009). Quantification of enterococci and human adenoviruses in environmental samples by real-time PCR. Applied Environmental Microbiology, 75(2): 557.
• JIANG X., Morgan J., and Doyle M.P. (2001). Fate of Escherichia coli O157:H7 in Manure-Amended Soil. Applied and Environmental Microbiology, 68(5): 2605-2609
• JURY WA, Vaux Jr. H.J., and Donald L.S. (2007). The Emerging Global Water Crisis: Managing Scarcity and Conflict Between Water Users. Adv Agron. 20: 1-76.
• KOTUT K., Nganga V. G., and Kariuki, F.W. (2011). Physico-chemical and microbial quality of greywater from various households in homa bay town. Open Environmental Engineering Journal, 4: 162-169.
• KUNTE D.P, Yeole T.Y., and Ranade D.R. (2000). Inactivation of Vibrio cholerae during anaerobic digestion of human night soil. Bioresource Technology, 75(2): 149-151.
• MCILWAINE S. (2010). Greywater Use in the Middle East: Technical, Social, Economic and Policy Issues. International Development Research Centre and the Center for the Study of the Built Environment, Replika Press, India.
• Mekorot. Wastewater Treatment and Reclamation. Watec 2007, Tel Aviv, Israel, 2007. • OBIRI-DANSO K, and Jones K. (1999). Distribution and seasonality of microbial indicators and
thermophilic campylobacters in two freshwater bathing sites on the River Lune in northwest England. Journal of Applied Microbiology, 87: 822-832.
• OTTOSON J. (2003). Hygiene Aspects of Greywater and Greywater Reuse. Licentiate thesis of Royal Institute of Technology (KTH) Department of Land and Water Resources Engineering and Swedish Institute for Infectious Disease Control (SMI) Department of Water and Environmental Microbiology.
• PELL A.N. (1997). Manure and microbes: public and animal health problem? Journal of Dairy Science, 80: 2673-2681.
• ROSE J.B. (1991). Microbial quality and persistence of enteric pathogens in graywater from various household sources. Water Research, 25(1):37–42.
• SANTAMARIA J., and Toranzos G.A. (2003). Enteric pathogens and soil: a short review. International Microbiology, 6: 5-9.
• SANTO DOMINGO J.W., Siefring S.C., and Haugland, R.A. (2003). Real-time PCR method to detect Enterococcus faecalis in water. Biotechnology Letters, 25(3):1627-1634
• SHANNON K. E., Lee D.Y., Trevors J. T., and Beaudette L. A. (2007). Application of real-time quantitative PCR for the detection of selected bacterial pathogens during municipal wastewater treatment. Science of the Total Environment, 382: 121-129.
• SINGH D.V., Matte M.H., Sanyal C.S., Shukla B.N., Sabeena S., Jiang R., Colwell R.R., Huq C.S., and Matte V.D. (2001). Molecular Analysis of Vibrio cholerae O1, O139, non-O1, and non-O139 Strains: Clonal Relationships between Clinical and Environmental Isolates. Environmental Microbiology, 67(2): 910-921.
• SKLARZ M.Y., Gross A., Yakirevich A., and Soares M.I.M. (2009). A recirculating vertical flow constructed wetland for the treatment of domestic wastewater. Desalination, 246(1-3): 617-624.
• THIEM V. D., Sethabutr O., von Seidlein L., Van Tung T., Canh D. G., Chien B. T., Tho H., Lee H., Houng H. S., Hale T. L., Clemens J. D., Mason C., and Trach D. (2004). Detection of Shigella by a PCR assay targeting the ipaH gene suggests increased prevalence of shigellosis in Nha Trang, Vietnam.Journal of Clinical Microbiology, 42: 2031-2035.
• TOMLINSON A.D., and Fuqua, A. (2009). Mechanisms and regulation of polar surface attachment in Agrobacterium tumefaciens. Current Opinion in Microbiology, 12(6):708-714.
• TOZE S. PCR and the detection of microbial pathogens in water and wastewater. (1999). Water Research, 33(17): 3545-3556.
• TRAVIS M.J., Weisbrod N., Gross A. (2008). Accumulation of oil and grease in soils irrigated with greywater and their potential role in soil water repellency. Science of the Total Environment, 394(1): 68-74.
• TRAVIS M.J., Wiel-Shafran A., Weisbrod N., Adar E., and Gross A. (2010). Greywater reuse for irrigation: Effect on soil properties. Science of the Total Environment, 408(12): 2501-2508.

12th World Wide Workshop for Young Environmental Scientists WWW-YES-2012 Urban waters: resource or risks? Arcueil, France (21 – 25 May 2012)
23 / 175
• VAN ELSAS J.D., Semenov A.V., Costa R., and Trevors J.T. (2011). Survival of Escherichia coli in the environment: fundamental and public health aspects. International Society for Microbial Ecology Journal, 5:173-183.
• VOLKMANN H., Schwartz T, Bischoff P., Kirchen S., and Obst U. (2004). Detection of clinically relevant antibiotic-resistance genes in municipal wastewater using real-time PCR (TaqMan). Journal of Microbiological Methods, 56(2): 277-286.
• WANG G., Zhao T., and Doyle M.P. (1996). Fate of enterohemorrhagic Escherichia coli O157:H7 in bovine feces. Applied Environmental Microbiology, 62:2567-2570.
• WARDAK S., and Szych J. (2006). Prevalence of pathogenic genes of Campylobacter jejuni isolated from humans in Poland between 2003-2005. Medycyna Doswiad czalna i Mikrobiologia, 58(3): 217-22.
• WARRINER K., Hubard A., Namvar A., Fan W., and Dunfield K. (2009). Chapter 4 Recent Advances in the Microbial Safety of Fresh Fruits and Vegetables. Advances in Food and Nutrition Research, 57: 155-208.
• WELLER S.A., Simpkins S.A., Stead D.A., Kurdziel A., Hird H., and Weekes R.J. (2002). Identification of Agrobacterium spp. present within Brassica napus seed-by TaqMan PCR – implications for GM screening procedures. Arch Microbiology, 178: 338–34.
• WINWARD G. P., Avery L. M., Frazer-Williams R., Pidou M., Jeffrey P., Stephenson T., and Jefferson B. (2008). A study of the microbial quality of greywater and an evaluation of treatment technologies for reuse. Ecological Engineering, 32: 187-197.
APPENDIX A
TABLE A.1 Recovery measures from spiking experiments using the UF Units. Recoveries are presented as percentage recovery by household per GW sampling
Sampling Number and Site % Retained from Start Sampling 1
SBG 1.82% Merkaz 8.18%
SBB 34.65% Sampling 2
SBG 4.31% Merkaz 5.82%
SBB 12.80% Sampling 3
SBG 20.46% Merkaz 19.48%
SBB 146.94%

WWW-YES-2012 proceedings (draft version)
24 / 175
APPENDIX B
TABLE B.1 Reference bacteria for qPCR detection
Reference strain (ATCC) GenBank No. Gen
e Function Primer/probesb Sequence Source Color of
probe/channel used for detection
*
Agrobacter tumefaciens (33970D-5)
NC003062 fliG Flagellar motor switch protein G fliG-F
CCG GCA AGC TGC TGA AAT
WELLER et al., 2002
fliG-R
CGT CTG AGC CGA GGA AAT
GA
DEAKIN et al., 1997
fliG-Pr
TTT CAC GCA GCA CGA ATT
GCA GAT G
Cy5/Red
Enterococcus faecalis (10100) AF335185 gro
ES Heat-shock
protein Efaecal-F GAGAAATTCCAAACGA
ACTTG
SHANNON et al., 2007
Efaecal-R CAGTGCTCTACCTCCA
TCATT
Efaecal-PR
TGGTTCTCTCCGAAATAGCTTTAG
GGCTA
Yakima Yellow/Yellow
Escherichia coli (25922) S69414 uid
A Glucoronidase Eco-F GTCCAAAGCGGCGATT
TG
SHANNON et al., 2007
Eco-R CAGGCCAGAAGTTCTT
TTTCCA
Eco-PR ACGGCAGAGAAGGTA FAM/Green
Klebsiella pneumoniae
(10031) AF064793 pho
E
Outer membrane
phosphate porin Kpneu-F
CCTGGATCTGACCCTG
CAGTA
SHANNON et al., 2007
Kpneu-R CCGTCGCCGTTCTGTT
TC
Kpneu-Pr CAGGGTAAAAACGAAG
GC Texas Red/Orange
or FAM/Green
Pseudomonas aeruginosa (47085D-5)
X12366 regA
Toxin A synthesis
regulating gene Paer-F
TGCTGGTGGCACAGGA
CAT
SHANNON et al., 2007
Paer-R TTGTTGGTGCAGTTCC
TCATTG
Paer-Pr CAGATGCTTTGCCTCA
A FAM/Green
Salmonella enterica (49416)
U43272 invA Invasion protein Sal-F CGTTTCCTGCGGTACT
GTTAATT
Shannon et al., 2007
Sal-R AGACGGCTGGTACTGATCGATAA
Sal-Pr CCACGCTCTTTCGTCT Yakima
Yellow/Yellow
Shigella spp. (29029) M32063 ipa
H Invasion plasmid
H Shig-F ACC ATG CTC GCA GAG AAA
THIEM et al., 2004

12th World Wide Workshop for Young Environmental Scientists WWW-YES-2012 Urban waters: resource or risks? Arcueil, France (21 – 25 May 2012)
25 / 175
CT
Shig-R
TAC GCT TCA GTA CAG CAT
GC
Shig-Pr
TGG CGT GTC GGG AGT GAC
AGC
FAM/Green
Staphylococcus aureus ( 21195
) X05815 nuc Thermonulease
nuc Saur-F
CGC TAC TAG TTG CTT AGT GTT AAC
TTT AGT TG
SHANNON et al., 2007
Saur-R
TGC ACT ATA TAC TGT TGG ATC TTC
AGA A
Saur-Pr
TGC ATC ACA AAC AGA TAA CGG CGT AAA TAG
AAG
Yakima Yellow/Yellow
Vibrio cholerae (39315)
VC03951008
hlyA hemolysin Vchol-F
TGC GTT AAA CAC GAA GCG
AT
SINGH et al., 2001
Vchol-R
AAG TCT TAC ATT GTG CTT GGG TCA
Vchol-PR
TCA ACC GAT GCG ATT GCC CAA GA
Yakima Yellow/Yellow
Vibrio cholerae
AE003852
23S rRNA
23S rRNA gene
Vchol-F
TCACGATGTCCAACCG
TGAT FRANCY et al.,
2009
Vchol-R
GCGGTCTCCTCCCAAA
GAGT
Vchol-PR
AGCCCACCTTCGTGCT
CCTCCG
Cy5/Red
Campylobacter spp.
(11168) CJ1478c
cadF
outer membrane fibronectin-
binding protein Camp-F
CTG AAT TTG ATA CCT TAA
GTG CAG C
Wardak and Szych, 2006
Camp-R
AGG CAC GCC TAA ACC TAT
AGC T
Camp-PR
TCT CCT TGC TCA TCT TTA GGA TAA ATT CTT
TCA
Texas Red/Orange
a The probe color was subject to change in order to maximize the number of assays that can be run simultaneously. All probe sequences begin with a fluorescent dye (listed in the last column) and end with a quencher, BHQ-1/2-. b Pr=Probe; F=Forward; R=Reverse.

WWW-YES-2012 proceedings (draft version)
26 / 175
APPENDIX C
TABLE C.1: GW water quality data Parametera SBB SBG Merkaz
Turbidity (NTU) 3.5 ±0.81b 3.4 ±1.7 2.4 ±1.12
TSS 7.03 ±8.23b 4.03 ±2.2b 2.7 ±0.36b
BOD5 1.4 ±0.7 1 ±0.7 1.6±0.3
COD (mgO2/L) 24.3 ±13.07 23.5 ±17.1 17.3 ±9.2
Total P 1 ±0.4 2 ±2.3 1 ±1.5
Total N 6.6 ±3.3 19.1 ±13.3 11.5 ±10.8
Total B 0.5 ±0.02 0.5 ±0.04 0.2 ±0.06
UV (OD254) 0.1 ±0.03 0.2 ±0.04 0.1 ±0.02
EC (ms/cm) 1.0 ±0.1 1.0 ±0.2 1.9 ±0.3
pH 8.2 ±0.5 8.1 ±0.3 8.2 ±0.4
a Results are calculated for mg L-1 unless stated otherwise. b An outlier value was omitted because it skewed the Turbidity and TSS results likely due to clogging of a filter during one sampling.
C.1 GW physico-chemical results Despite the well described spatial and temporal variability of raw GW, the treated GW from the RVFCW were fairly uniform with average low TSS and BOD of less than 10, COD around 20 mgO2 L-1, TP between 1-2 mg L-1, TN median of 11 mg L-1, TB no larger than 0.5 mg L-1, UV (OD254) around 0.1-0.2, EC no larger than 2 ms cm-1, and a slightly basic pH of 8.2. Natural variability exists between sampling sites in treated GW quality parameters due to changes in household family composition, or changes in the chemical use. As GW quality is highly affected by chemical loads, the variability of water quality parameters could be due to a recent laundry washing immediately before a sampling, or a change or extra use of certain soaps in the bathroom or laundry. Because of this variability in measurements during samplings, no conclusions could be drawn at this time regarding the GW chemical and physical quality (TABLE C.1). Similar results were found previously in treated GW studies of water from this system, demonstrating its robustness (AL-JAYYOUSI, 2003; TRAVIS et al., 2008; TRAVIS et al., 2010; GROSS et al., 2007; SKLARZ et al., 2009).

12th World Wide Workshop for Young Environmental Scientists WWW-YES-2012 Urban waters: resource or risks? Arcueil, France (21 – 25 May 2012)
27 / 175
TABLE C.2: Soil quality data Parameter SBB SBG Merkaz Controld Saturation Point (%) 39 ±4.2 39 ±8.5 34.5 ±2.12 N/A
pH 7.5 ±0.2 7.3 ±0.1 7.2 ±0.2 7.6 ±0.2
EC (dS/m) 3.2 ±1.7 4.1 ±6.2 2.8 ±1.6 1.5 ±0.9
Na (meq/l) 28.6 ±7.3 46.8 ±57 16.4 ±0.3 N/A
Ca/Mg (meq/l) 38.9 ±4.6 57.9 ±57.4 37.8 ±8.1 N/A
SAR Ratio 6.4 ±1.3 7.3 ±7.2 3.8 ±5.5 N/A
Nitrate (mg/kg) 8 ±2.2 44.1 ±48 52.6 ±54.2 34.7 ±54.6 Ammonium (mg/kg) 14.2 ±6 30.8 ±12.7 14.7 ±10.4c 77.6 ±39.4
Phosphorus (mg/kg) 147.7 ±53* 494.7 ±176.5* 98.2 ±35.1 66.1 ±32
Soluble K 30.1 ±12.2 30 ±12.3c 44.9 ±28.4 41.2 ±26.6
c Indicates that an outlier value was omitted, possibly due to the recent application of fertilizer to the sampling location during one sampling.
d Several samples of FW irrigated loess (sandy loam Aridisol) soil was used as a control. * Indicates a significant difference between household average measurement and control measurement.
C.2 Soil physico-chemical results Average measurements were fairly uniform except for elevated average phosphorus levels in the SBG site (TABLE C.2). The control soil was not always measured for certain soil quality parameters. A saturation point of less than 40 %, Na of around 30 meq L-1, and Ca/Mg of 45 meq L-1 was found in all GW sampled sites (Merkaz, SBG, SBB). All sampled locations had a fairly neutral pH of 7.4 and EC of around 3 dS m-1 in all sites. Steady average values for nitrate (40 mg kg-1), ammonium (30 mg kg-1), soluble K (36.5 mg kg-1), and an SAR ratio of less than 10 were found in all irrigated soil sites. Phosphorus was measured to be around 109 mg kg-1 for all sites except for the SBG site with an average phosphorus level of 500 mg kg-1. These measurements indicate that irrigation with treated GW affect only the phosphorous levels in the soil and no other parameter. These findings correlate with two other studies, which analyzed soils irrigated with treated GW (TRAVIS et al., 2010; AL-HAMAIEDEH and BINO, 2010), and further suggests that such an irrigation regime may have little effect on the soil, at least not during the first few years of irrigation.

WWW-YES-2012 proceedings (draft version)
28 / 175
2. Microbial Analysis and Treatment of Grey water
Mukta Singh CHANDEL*, Mukul KULSHRESTHA* and Pawan LABHASETWAR**
* Department of Civil Engineering, Maulana Azad National Institute of Technology (MANIT), Bhopal-462051, India (E-mail: [email protected] ; [email protected]) ** Water Technology and Management Division, National Environmental Engineering Reasearch Institute (NEERI), Nehru Marg, Nagpur 440020, India (E-mail: [email protected] )
Abstract This research work focuses on investigating the common pathogens present in grey water their characterization and evolving appropriate treatment technologies for safe recycling. The experiments on characterization of greywater have been performed at the National Environmental Engineering Research Institute, NEERI-Nagpur, India. Forty Samples were picked from the NEERI Swimming pool bathrooms, washing machine outlets, kitchen wastewater, and WCL Laundry, Nagpur. These samples were analyzed for the potential presence of the following microbes: Total coliforms, fecal coliforms, fecal streptococcus, Salmonella spp, Shigella spp, Pseudomonas aeruginosa. The tests were conducted by a standard Membrane Filtration Technique, with an objective to evolve reuse methodologies for possible applications for uses such as horticulture use, flushing of toilets, street washing, flushing of roadside drains etc. Appropriate treatment technologies are identified depending upon the possible reuse.
Keywords grey water; pathogens; indicator organisms; chlorination; water reuse
INTRODUCTION Water is an integral part of our daily lives and not just for drinking: when we when wake up, we might take a shower, or sip coffee or tea; during the day we quench our thirst with all types of beverages; some of us water our gardens; we wash the laundry and the dishes; and by the end of the day, the average person in a western society has consumed some 150-200 liters of freshwater (European Environmental Agency, 2001). In India, the per capita water availability in India in the years 1991 and 2001 were 2300 m3 (6.3 m3/day) and 1980 m3 (5.7 m3/day), respectively and these are projected to reduce 1401 m3 and 1191 m3 by the years 2025 and 2050, respectively (Kumar et al., 2005). The USA alone uses more than 500 billion liters of freshwater everyday to cool electric power plants and roughly the same amount is needed to irrigate crop fields (Hightower & Pierce, 2008). In striking contrast, more than one billion people in developing nations do not have access to safe drinking water and two billion do not have adequate sanitation (World Health Organization/United Nations Children’s Fund, 2005). These figures are expected to increase in near future. Although food and water are equally essential for human life, we treat these two resources differently. Food is usually regarded as a limited economic commodity, as shown by the sharp rises in food prices in 2008. Water, by contrast is generally seen as a free resource and one that governments should ensure citizens have unlimited access to.

12th World Wide Workshop for Young Environmental Scientists WWW-YES-2012 Urban waters: resource or risks? Arcueil, France (21 – 25 May 2012)
29 / 175
One way to some spare freshwater could be wastewater recycling. Such reclaimed water could be used for irrigation, recreational applications or toilet flushing (water uses ranges around 20% to 30% of the total domestic consumption: Diaper et al. 2001; Salmon and Bedel 2001; Smitch et al. 2001) in order to keep drinking water for cooking and body care. Among wastewaters, Greywater are less polluted. Greywater can broadly be defined as all wastewater generated in household, excluding toilet wastewater. Greywater can be include wastewater from bathroom sinks, baths and showers (‘light grey’ ) and may also include more contaminated waste from laundry facilities, dishwashers and in some instances, kitchen sinks (‘dark grey water‘). Grey water contains easily biodegradable organic content and relatively low pathogens content, making it easier to treat and safer to recycles for water uses that do not need potable water quality, such as toilet flushing, urban landscaping or road washing. As water is becoming rare resource because of increasing global population and increasing growing urbanization, the onsite reuse and recycling of grey water is practiced in many countries as a sustainable solution to reduce the overall urban water demand. In developing countries, the reuse of grey water for irrigation is becoming increasingly common and is often used without any significant pre-treatment, a practice mistakenly considered safe, though this form of application can damage soil health. Although greywater is not likely to contain disease organisms of the same magnitude as those in black water, microbial and chemical contamination of grey water also poses a potential risk to human health. It is therefore important to recognize that grey water does have the potential to transmit disease and therefore requires treatment and disinfection to inactivate the pathogenic microorganisms.
MATERIAL & METHODS
Study area: Nagpur Nagpur, popularly known as orange city is having history of 300 years. It is a winter capital of Maharashtra and geographical centre of India. It is situated at a height of 312.42 meters above sea level. The geographical location of city is at 79º 7´E longitude and 21º7´N latitude, on the Deccan Plateau. It is also the geographical centre of two national highways NH 6 & 7. Average temperature of the city varies between 8ºC and 48ºC, while annual rainfall is 1200mm. According to the Census 2011, the population of Nagpur city is 2.3 million spread over 217.56 km2 and is rapidly growing into a Metro city with an expected population of 5 million in the near 30 years.
Study Methodology
Sample Collection
Grey water samples were collected from main drain of showers from bathroom of swimming pool located in NEERI colony, Nagpur. Additionally grey water collected from NEERI colony, WCL Laundry along with Ajani Railway colony in Nagpur. Samples were collected in sterile autoclaved polypropylene containers and either used immediately or stored at 5±1ºC and analyzed within 8 hrs. The preservation and analysis of the samples was carried out as per the methods prescribed in the Standards Methods for the Examination of water and wastewater, APHA, AWWA, and WEF, 21st edition, 2005.
Physico - Chemical Properties

WWW-YES-2012 proceedings (draft version)
30 / 175
Determination of pH, conductivity, salinity and TDS was carried out by using appropriate probes of Multi-parameter test meter. Dissolved oxygen (DO) was measured using Winkler’s method. These involved transferring a suitable amount to an appropriate container into which the multiline probes for the measurement of each of the above attributes was lowered into the samples and reading taken after allowing stabilization for a few minutes. Chemical Oxygen demand (COD) was analyzed using the Reflux method. Biological oxygen demand (BOD) was established through the titrimetric determination of dissolved oxygen before and after incubation of appropriately diluted samples for five days.
Bacterial Load
Samples of raw and treated grey water were analyzed for microbial parameters according to Membrane Filtration Technique. All the media used were weighed out and prepared according to the manufacture’s specification with respect to given instructions and directions. An appropriate amount of sample from each source was filtered through 0.45 µm pore size sterilized filter membrane and membranes were placed on the plates containing different media. After incubation, colonies formed were counted using a colony counter to calculate the total bacteria per 100 ml of each sample. The pure cultures of the bacterial isolates were subjected to various morphological and biochemical characterization tests to determine the identity of the bacteria isolates with reference to Bergey’s Manual of Determinative Bacteriology (Buchanan and Gibbon, 1974).
DISINFECTION EXPERIMENTS Grey water is biologically polluted effluent and its reuse implies a sanitary risk associated with a potential spread of microorganisms. Therefore disinfection is a key step in any treatment for safe reuse. Chlorinated disinfection agents show high efficacy for disinfection and subsequently, recommendations for more efficient treatments (as coagulation-chlorination and additional removal of organic residuals) have been published. Other disinfection strategies such as UV irradiation also provide satisfactory results.
Chlorination Chlorine is a widely used utilized disinfectant, and as such, is a leading candidate for disinfection of grey water intended for reuse. The exact mechanism of micro-organism inactivation by chlorine has not been fully understood. According to studies bacterial cell membrane undergoes changes in permeability in the presence of chlorine and that the membrane is an important factor in determining bacterial resistance to chlorine disinfection. Chlorination was performed by adding hypochlorite solution (4%) to the sample in various concentrations. In the first experiment hypochlorite doses were set to satisfy a chlorine dose of 0 to 30 mg L-1 at the interval of 10 mg L-1. Free chlorine was neutralized by adding sodium thiosulphate. In each of the above samples residual chlorine and microbial count were determined at the interval of 1 h, 2 h and 3 h contact time. Optimum dose of chlorine was found to be of 20 mg L-1 in 3 h.

12th World Wide Workshop for Young Environmental Scientists WWW-YES-2012 Urban waters: resource or risks? Arcueil, France (21 – 25 May 2012)
31 / 175
Table 1: Physico-chemical Characteristics of Grey water Parameters Swimming Pool
(NEERI Colony) Kitchenwaste
water(NEERI Colony) WCL Laundry Mixed Greywater
pH 7.31 8 7.34 8.2
Conductivity 360 453 424 480
Salinity 148 220 161 187
TDS 295 510 300 450
BOD 75 96 78.5 150
COD 263 311 292.8 350
Table 2: Bacteriological characteristics of Grey water Parameters Swimming Pool (NEERI
Colony) Kitchen waste water
(NEERI Colony) WCL Laundry Mixed Grey water (Ajni Railway Colony)
Untreated Treated Untreated Treated Untreated Treated Untreated Treated Total coliforms 9.1×10³ 4.5×10³ 6.2×10⁴ 3.9×10⁴ 5.42×10⁴ 2.9×10⁴ 1.58×10⁵ 7.4×10⁴ Fecal coliforms 5.3×10³ 2.1×10³ 4.4×10⁴ 2.5×10⁴ 3.15×10⁴ 1.9×10⁴ 9.83×10⁴ 5.3×10⁴
Fecal streptococci
2.1×10³ 7.5×10² 2.8×10⁴ 1.2×10⁴ 1.13×10⁴ 5.6×10³ 4.39×10⁴ 2.2×10⁴
Salmonella 3.5×10³ 1.5×10³ 1.2×10⁴ 5.4×10³ 6.14×10³ 3×10⁴ 4.45×10⁴ 2.1×10⁴ Shigella 2.2×10³ 1.3×10³ 9.9×10³ 4.7×10³ 7.5 ×10³ 3.9 ×10³ 4×10⁴ 2.3×10⁴

WWW-YES-2012 proceedings (draft version)
32 / 175
Fig. 1: Bacteriological characteristics of Raw and treated grey water.
RESULTS AND DISCUSSION The Physico-chemical characteristics of grey water are presented in Table 1. The low pH was recorded from Swimming pool and comparatively high pH value is recorded in laundry grey water due to the alkalinity of the detergents and soap used. The range of salinity is recorded in the range of in the range of 147-220 ppt. Mixed grey water is showing higher Conductivity in comparison with other sources. BOD and COD measurements were reported 75-150 mgL-1 and 260-350 mgL-1. Chlorination caused a little increase at pH values. There was reduction on COD concentrations after chlorination and showing 20-30% removal efficiency. There was reduction on BOD concentrations at chlorination process also and showing removal efficiency is 10-15%. The study shows the presence of Total coliforms, fecal coliforms, fecal streptococcus, Salmonella and Shigella in grey water collected from different locations in Nagpur. Presence of fecal coliforms is usually considered to be a specific indicator as well as the possible presence of pathogenic bacteria. The Bacteriological characteristics of untreated and treated grey water are given in Table 2. Grey water originating from showers of swimming pool typically has the lowest concentrations of bacteria whereas mixed grey water collecting from Ajni Railway colony is typically having higher concentrations of bacteria.
CONCLUSION Disinfection of grey water sample was investigated by chlorination. Special attention was given to the ability of chlorine to inactivate the indicator bacteria along with specific pathogens. The microbial quality of the treated grey water did not meet reuse guidelines and in order to ensure safe reuse, it had to be further disinfected.
REFERENCES • Al-Jayyousi OR. (2003). Greywater reuse: towards sustainable water management. Desalination,
vol 156, Issue 1, pp. 181-192. • APHA, “Standard Methods for the examination of water and wastewater”, Americal public health
association, Washington DC, USA, 1998. • Birks, R., Colbourne, J., Hills, S., & Hobson, R. (2004). Microbiological water quality in a large
in-building recycling facility. Water Science and Technology, vol 50, Issue 2, pp. 165–172. • Birks R. and Hills S. (2007). Characterisation of indicator organisms and pathogens in domestic
greywater for recycling. Environmental Monitoring and Assessment, vol 129, pp. 61-69.

12th World Wide Workshop for Young Environmental Scientists WWW-YES-2012 Urban waters: resource or risks? Arcueil, France (21 – 25 May 2012)
33 / 175
• Casanova LM, Gerba CP, Karpiscak M. (2001) Chemical and microbial characterization of household graywater. J Environ Sci Health A Tox Hazardous Subst Environ Eng, vol 36, Issue 4, pp. 395–401.
• Chaillou katell, Gerente Claire and Andres Yves et al., (2011). Bathroon grey water characterization and potential treatments for reuse. Water Air soil Pollut, vol 215, pp. 31-42,
• Cominelli Eleonora and Galbiati Massimo et al., (2009). Water: the invisible problem. European Molecular Biology Organization, vol 10, Issue 7, pp. 671-676.
• Friedler Eran, Katz Ilan and Dosorretz G. (2008). Chlorination and coagulation as pretreatments for greywater desalination. Desalination, 222, pp. 38-49.
• Frielder Eran, Gilboa Yael, (2010). Performance of UV disinfection and the microbial quality of grey water effluent along a reuse system for toilet flushing.Science of the Total Environment, vol 408, Issue 9, pp. 2109-2117.
• Friedler E, Kovalio R, Ben-Zvi A. (2006). Comparative study of microbial of greywater treated by three on-site treatment systems. Environ Technol, vol 27, Issue 6, pp 653–63.
• Gideon P. Winward et al. (2008). Chlorine disinfection of grey water for reuse: Effect of organics and particles. Water Research, vol 42, Issue (1-2), pp. 483-491.
• Gross A., Kaplan D. and Baker K. (2006). Removal of Microorganisms from domestic grey water using a recycling vertical flow constructed wetland (RVFCW). Water Environment Foundation, pp. 6133-6141.
• Guidance Manual for water Quality monitoring and Assessment (First edition), (2007). Published by National Environmental Engineering Research Institute (NEERI), Nehru Marg, Nagpur.
• Hightower M., Pierce SA (2008). The Energy Challenges. Nature, 452 (7185), pp. 285-286. • Kariuki W. Francis, Koktut Kiplagat and Nganga G. Victor. (2011). The Potential of low cost
technology for the grey water treatment. The Open Environmental Engineering Journal, vol 4, pp. 32-39.
• Kumar R. Singh RD, Sharma KD. (2005). Water resource of India. Current Science, vol. 89, issue 5, pp. 749-811.
• Kotut Kiplagat, Nganga G. Victor, and Kariuki W. Francis, (2011). Physico-Chemical and Microbial Quality of Grey water from Various Households in Homa Bay Town. The Open Environmental Engineering Journal, vol 4, pp. 162-169.
• Leal Hernandez L., Temmink H. and Zeeman G.et al., (2011). Characterization and anaerobic biodegradability of grey water. Desalination, vol 270, pp. 111-115.
• Li Fangyue, Wichmann Knut and Otterpohl Ralf, (2009). Review of the technological approaches for grey water and reuses.Science of the Total Environment, vol 407, Issue 11, pp. 3439-3449.
• Mandal Deepika, Labhasetwar Pawan and Dhone Shankar et al., (2011). Water conservation due to grey water treatment and reuse in urban setting with specific context to developing countries. Resources, Condervation and Recycling, vol 55, pp. 356-361.
• March G.J. and Gual M. (2009). Studies on Chlorination of grey water. Desalination, vol 249, pp. 317-322.
• Mourad A. Khaldoon, Berndtsson C. Justya and Berndtsson Ronny. (2011). Potential fresh water saving using greywater in toilet flushing in Syria. Journal of Environmental Management, vol 92, pp. 2447-2453.
• Nolde E. (1999). Grey water reuse system for toilet flushing in multi-storey buildings- over ten years experience in Berlin. Urban water, vol 1, pp. 275-284
• Nolde E. (1999). Grey water recycling system in Germany- results, experiences and guidelines. Water Science and Technology, vol 51, Issue 10, pp. 203-210.
• Omezuruike Iheannyi Okonko, Damilola Oluseyi Adejoye and Adeola Tolulope Ogunussi et al., (2008). Microbiological and physicochemical analysis of different water samples used for domestic purposes in Abeokuta and Ojota, Lagos State, Nigeria. African Journal of Biotechnology, vol 7, Issue 5, pp. 617-621.
• Ottoson Jacob, Stenstrom, Axel Thor, (2003). Fecal contamination of Grey water and associated microbial risks.Water Research, vol 37, pp. 645-655.

WWW-YES-2012 proceedings (draft version)
34 / 175
• Rose J.B., Sun G., Gerba C.P. and Sinclair N.A. (1991). Microbial quality and persistent of enteric pathogens pathogens in grey water from various household sources. Water Research, vol 25, Issue 1, pp. 37-42.
• Santos C., Taveira-Pinto F. and Cheng Y.C., et al., (2012). Development of an experimental system for grey water reuse. Desalination, vol 285, pp. 301-305.
• Standard methods for examination of water and wastewater (21st edition) (2005).published by • American Public Health Association (APHA), American Water Works Association (AWAA) and
Water Environment Federation (WEF). • Winward G.P., Avery Lisa M., Stephenson T. & Jefferson B. (2008). Chlorine disinfection of
grey water for reuse: effect of organics and particles. Water Research, vol. 42, pp. 483-491. • WHO (2006): WHO Guidelines for the safe use of wastewater, excreta and greywater, vol 4
Excreta and Grey water use in agriculture. Geneva, Switzerland, WHO press.

12th World Wide Workshop for Young Environmental Scientists WWW-YES-2012 Urban waters: resource or risks? Arcueil, France (21 – 25 May 2012)
35 / 175
3. Application of Iranian Standard for Site-Selection of WWTP using GIS
Mojtaba RAFIEE*, Fereydoun RADMANESH* and Abdolkarim BEHNIA*
* Department of Water Science and Engineering, Shahid Chamran University, Golestan Boulevard, Ahvaz, Iran. (E-mail: [email protected] ; [email protected] ; [email protected] )
Abstract In arid zones, the scarcity of freshwater resources is a critical problem and the reuse of marginal quality water is increasing regularly. In central Iran, Mohammadabad and Nikababd- two agricultural-based towns- the scarcity of water -especially irrigation water- led people to emigrate. Therefore the Iranian Water and Wastewater Company (IWWC) decided to build a WWTP to solve the water scarcity problem by using WWTP’s effluent, instead of using the existing absorbing wells. In this research the qualitative Iranian criteria (standard 3-129) for siting WWTP was quantified-mostly with economical aspect- for the towns. Each criterion such as slope of the site, soil type, and appropriate access to roads, farms, urban regions, etc, was represented with a raster layer using ArcGIS software. Then each raster layer weighted with respect to cost or importance of each criterion. Finally, the overlay of weighted layers resulted in finding the best place for siting the WWTP.
Keywords re-use; treatment; Iranian Standard; siting; GIS;
INTRODUCTION Ever-increasing urbanization and rapid industrialization in recent decades have considerably increased the rate of water pollution. Municipal wastewater is commonly produced by human activities in different sectors. In many cases wastewater conveys to wastewater treatment plant to be acceptable for discharging into the environment. In central Iran, Mohammadabad and Nikababd- two agricultural-based towns- the scarcity of water -especially irrigation water- led people to emigrate. Therefore the Iranian Water and Wastewater Company (IWWC) decided to build a Wastewater treatment plant (WWTP) to solve the water scarcity problem by using WWTP’s effluent, instead of using the existing absorbing wells. Therefore IWWC planed to siting the WWTP for Mohammadabad and Nikabad. The aerated lagoon process is preffered for the WWTP.“Dezab Consultant Engineers (2002)”. Siting is a complex process involving social, environmental and technical parameters as well as government regulations. As such, it evidently requires the processing of a massive amount of spatial data. Before advances in computer science have led to the creation of GIS, engineers’ data collection had been confined to site visit. Today, GIS initially based on map layering concept, combines spatial data (maps, aerial photographs, and satellite images) with quantitative, qualitative, and descriptive information databases, which can support a wide range of spatial queries. All of these factors have made GIS an indispensable tool for location studies “R. Church (2002)”. In recent years, the geographic information systems (GIS) technology has been used in environmental sciences and engineering for siting landfill facilities “Siddiqui et al., (1996); Kontos et al. (2003)”, for evaluating groundwater pollution vulnerability “Lake et al. (2003)” or for watershed

WWW-YES-2012 proceedings (draft version)
36 / 175
studies “Tsihrintzis et al. (1996, 1997); Aspinall and Diane (2000); Tong and Chen (2002); Mitchell (2005)”, and for siting the WWTP “Gemitzi et al. (2007)”, among other applications. Weights indicate the relative importance of each criterion. In this study most of criteria weighted based on the cost of each one.
MATERIAL & METHODS
General The GIS-based methodology resulted in various layers, which satisfy criteria: A map layer created based on cost of each suitability criterion, and a final composite map was then produced by overlaying all individual layers. Then the not-allowed zones specified as rejected zone and eliminated from the final raster. The result is a composite map, which highlights the areas that satisfy all suitability criteria and presents a site with the minimum cost.
Area of Study Mohammadabad & Nikabad, two towns located in Isfahan province in central Iran, 55 and 65 km southern Isfahan city, respectively. They located 52 6’ E & 32 19’ N and 52 12’ E; 32 18’ N, respectively.
Figure 1: Study area and its topography (DEM)
Siting Criteria In this research, Iranian criteria for siting WWTP (standard 3-129) were applied. Since the criteria presented in a descriptive format, in this study those quantified-mostly with economical aspect- for the study area. The criteria are categorized to three types, the first type was criteria which indicated not-allowed locations ; the second type was criteria which their cost could be calculated; and the last type was criteria which couldn’t be presented by their cost. It should be mentioned that some criteria are categorized in both type I and type II. For example distance to roads indicates not-allowed regions and simultaneous can be calculated Type I criteria are: Building WWTP in the distance of 200 m to roads, 1000 m to urban regions, and 50 m to streams is not allowed. Because the lagoons are considered for the WWTP, building lagoons in site with slope greater than 10% is not possible. Type II criteria are bellows, based on Iranian standard (3-129):

12th World Wide Workshop for Young Environmental Scientists WWW-YES-2012 Urban waters: resource or risks? Arcueil, France (21 – 25 May 2012)
37 / 175
(1) distance to urban zone (2) dominant wind direction (3) Distance to roads (4) Distance to farms (5) Land use of the site (6) Distance to recipient water (7) Distance to energy sources (8) Possession feasibility (9) Site properties such as soil type, surface water and groundwater, slope of region- to
minimize pumping costs. Type III criteria are: There are two criteria which could not be calculated as a function of cost. The selected site should not be in the direction of prevailing winds. Furthermore an adequate area -a rectangular 7-hectare site- should be available; the strips or disordered-shape sites are not acceptable. In table 1 the mentioned descriptive criteria are pricing “Iranian Former Management and Planning Organization (2008)”. Table 2 indicates inappropriate zones which are described in criteria type I.
Table 1: Iranian Standard Criteria and their weight Criterion Cost (ten thousands Rials)
Wastewater conveyance length (Distance to outlet of WWTP)
70, for each length meter
Access road to WWTP (Distance to road) 220, for each length meter Effluent conveyance channel (Distance to recipient water) 40, for each length meter Electricity line (Distance to nearest electricity sources) 40, for each length meter Field possession 7000, for each hectare of irrigated
lands. 3000, for each hectare of arid lands
Pumping Station Costs (both investment and operation cost)
3000, for pressured conveyance line. 0 for gravity conveyance line.
Table 2: Not-allowed zones Parameter Limitation
Distance to roads >200 meter Distance to urban zone >1000 meter Distance to watercourses >50 meter Slope of land <10%
An overlay of the different layers was used to eliminate those areas that are unsuitable and to identify candidate areas.
Software The software ArcGIS was applied in this study.

WWW-YES-2012 proceedings (draft version)
38 / 175
RESULTS AND DISCUSSION
Raster layer preparation At first, a raster layer was derived for each criterion mentioned in table 2. Each raster was
calculated based on its cost which calculated based on data in table 1. The layers are showed in figure 2 to 9. Then the layers overlaid and their summation considered as the final cost of the site. The summation of costs which is a function of location of the plant is obtained in Figure 10.
Figure 2: Raster map of distance to recipient waters
Figure 3: Raster map of agricultural and unused area
Figure 4: Raster map of distance to Energy conveyance lines.
Figure 5: Raster map of distance to asphalted roads

12th World Wide Workshop for Young Environmental Scientists WWW-YES-2012 Urban waters: resource or risks? Arcueil, France (21 – 25 May 2012)
39 / 175
Figure 6: Raster map of distance to outlet of WW collection system of Nikabad
Figure 7: Raster map of distance to outlet of WW collection system of Mohamadabad
Figure 8: Raster map of requirement of pumping station from Mohamadabad
Figure 9: Raster map of requirement of pumping station from Nikabad
Figure 10: summation of costs which are a function
of location of the plant Figure 11: not-allowed regions for siting the
WWTP

WWW-YES-2012 proceedings (draft version)
40 / 175
Figure12: Raster map of final cost
Figure13: Raster map of final cost (less than 13
million Rials)
In the next step the not-allowed locations mentioned in table 2 indicated and then eliminated. Figure 11 shows the not-allowed locations consists of steep slopes, urbanized regions, roads, energy conveyance lines and their marginal not-allowed zone.
Other Criteria The criteria which couldn’t be presented with economical value (type III criteria) were two criterion. The first one indicates that the WWTP site not to be selected in the path of prevailing winds and the second one indicates that the selected site should satisfy the required area (in this study a rectangular 7-hectare area should be available). In figure 14 a site which is not in the prevailing winds path (North-West) is selected for building a WWTP.
Figure14: The selected site for WWTP
CONCLUSIONS This study presents siting a wastewater treatment system plant using the GIS technology based on Iranian Standard Criteria. The methodology was applied to Nikabad and Mohamadabad, two adjacent towns in Central Iran.
The Selected Site

12th World Wide Workshop for Young Environmental Scientists WWW-YES-2012 Urban waters: resource or risks? Arcueil, France (21 – 25 May 2012)
41 / 175
The GIS technology was used in order to create and analyze several layers of different criterion and then highlight the areas of interest, i.e., those that satisfy all the relevant criteria and have the minimum cost. In conclusion, it is believed that the present study offers a quite simple and fast way to examine large areas and to highlight possible locations for siting WWTP based on Iranian Standard (3-129) criteria.
REFERENCES • Aspinall R., Diane, P. (2000). Integrated geographical assessment of environmental condition in
water catchments: linking landscape ecology, environmental modelling and GIS. Journal of Environmental Management 59, 299–319.
• Church R., Geographical information systems and location science (2002). Computers & Operations Research 29 (6) 541–562.
• Dezab Consultant Engineers, (2008) Mohammadabad & Nikabad Wastewater Treatment Plant survey-phase 1.
• Iranian Former Management & Planning Organization (1993). Standard 3-129. • Iranian Former Management & Planning Organization (2008). The Water & Wastewater Prices
List. • Kontos Th. D., Komilis, D.P., Halvadakis C.P., Siting M.S. (2003). Wlandfills in Lesvos Island
with a GIS-basedmethodology,Waste Management and Research 21 (3) 262–327. • Lake I.R., Lovett A.A., Hiscock K.M., Betson M., Foley A., Sunnenberg G., Evers S., Fletcher
S., (2003). Evaluating factors influencing groundwater vulnerability to nitrate pollution: developing the potential of GIS. Journal of Environmental Management 68, 315–328.
• Mitchell G., (2005). Mapping hazard from urban non-point pollution: a screening model to support sustainable urban drainage planning. Journal of Environmental Management 74, 1–9.
• Siddiqui M.Z. (1996). Landfill siting using Geographic Information Systmes: a demonstration, Journal of Environmental Engineering 122 (6) 515–523.
• Tong S.T.Y., Chen, W. (2002). Modelling the relationship between land use and surface water quality. Journal of Environmental Management 66, 377–393.
• Tsihrintzis V.A., Hamid R., Fuentes H.R. (1996). Use of Geographic Information Systems (GIS) in water resources: a review. Water Resources Management, EWRA 10 (4), 251–277.
• Tsihrintzis V.A., Fuentes H.R., Gadipudi R. (1997). GIS-aided modelling of nonpoint source pollution impacts on surface and ground waters. Water Resources Management, EWRA 11 (3), 207–218.
• Gemitzi A., Tsihrintzis V.A., Christou O., Petalas C., (2007). Use of GIS in siting stabilization pond facilities for domestic wastewater treatment, Journal of Environmental Management 82. 155–166.

WWW-YES-2012 proceedings (draft version)
42 / 175
4. Multi-Criteria Decision Analysis and choice of sanitation technology: challenge in urban water quality of Pouytenga, Burkina Faso
Lydie S. A YIOUGO*, Halidou KOANDA**, Joseph WETHE***, Samuel YONKEU**** and Evariste DA*****
* International Institute for Water and Environment Engineering, 01 BP 594 Ouagadougou, Burkina Faso (E-mail: [email protected]) ** Water Aid Burkina Faso, 11 BP 1211 CMS Ouagadougou, Burkina Faso (E-mail: [email protected]) *** Water and Sanitation for Africa, 03 BP 7112 Ouagadougou, Burkina Faso (E-mail: [email protected]) **** SIG International, 06 BP 9283 Ouagadougou, Burkina Faso (E-mail : [email protected]) ***** Université de Ouagadougou 03 BP 7021 Ouagadougou, Burkina Faso (E-mail : [email protected])
Abstract
In developing countries, several means exist for excreta management like construction of septic tank, pit latrines, soak-away, and water closest system. Door to door collection and individual household disposal methods are, however, used for solid waste management. Pouytenga is a mid-size urban city in Burkina Faso which has no strategic sanitation plan. Previous study has showed that Pouytenga currently discharges about 286.6 tons of nitrogen to groundwater through indiscriminate disposal of liquid and solid wastes. Multi-Criteria Decision Analysis (MCDA) was applied to identify the household choice of sanitation technology in the city based on 4 criteria: cost, service quality, environmental sustainability, and socio-cultural acceptability. Based on the living standards, 3 categories of households were involved in the survey/focus group interview. Results show environmental sustainability & socio-cultural acceptability as NOT having strong influence on sanitation decision making, rather cost and service quality.
Keywords: Sanitation; water quality; developing country; Burkina Faso; Multi-criteria Decision Analysis
INTRODUCTION
Pouytenga is a mid-size city located in Burkina Faso in West Africa. The population is about 72,000 inhabitants. Pouytenga have one of big livestock market in the sub region. About sanitation, previous study (Yiougo et al., 2011) has shown that 66% of households discharge

12th World Wide Workshop for Young Environmental Scientists WWW-YES-2012 Urban waters: resource or risks? Arcueil, France (21 – 25 May 2012)
43 / 175
their grey water on the street and 14% do not have on-site sanitation facilities and practice open defecation. In that way, Pouytenga currently discharges about 61,824 tons of material, including 36 tons of nitrogen per year in surface water and 373,098 tons of material, including 282.6 tons of nitrogen on groundwater per year. The rainwater is drained by natural channels and discharges into a dam located in the city upstream. The population growth and human activities in Pouytenga lead current pollution and gradual closing of the dam. Therefore this dam is used for supplying the city with drinking water. The city does not have any strategic sanitation plan (SSP). So, in the context of rainfall scarcity, this dam benefit from being well managed by controlling pollution upstream by developing and implementing a SSP. In order to draw a SSP for solid and liquid waste, several technologies exist in Africa. A participatory decision-making process is a key of SSP implementation success. Indeed this process brings together people with diverse set of interests in an open, authentic discussion of possible solutions in order to arrive at a mutual beneficial solution (Lüthi et al., 2009; McConville, 2010). The purpose of this paper is to apply a decision-making model for the choice of sanitation options technology in Pouytenga, a mid-size city in Africa. The method of Multi-Criteria Decision Analysis (MCDA) has been used and households who are the ends-users of sanitation technology as principle stakeholders.
MATERIAL & METHODS
Definition of multi-criteria decision analysis
Multi-criteria analysis is a decision-making tool that supports solution of complex multi-criteria problems which include qualitative and/ or quantitative parameters in decision-making (Garfi et al., 2009; Mendoza et Macoun, 2000). MCDA allow choosing the most optimal choice among several options or alternatives, where option A scores better than option B with regard to some objectives, but worse on others (Buuren, 2010). The approach of MCDA enables policy-makers in making speedy progress by solving a decision problem where multiple views, often contradictory, must be taken into account (Samoura, 2010). Also called multi-stakeholder analysis, the MCDA implies that several actors are included in the process of decision making in order to legitimize the decision and to ensure collective ownership of its implementation. These features (multi-criteria and multi-stakeholders) can take into account the heterogeneity of users and diversity of size in the catchment, as mentioned by Raj (1995). This is a tool for decision support based on finding a solution acceptable to all (consensus), which opposes the search for an optimum single objective as possible. The different steps of the MCDA are six and are summarized in figure 1 (Buuren, 2010; Samoura, 2010).
Figure 1: Steps of multi-criteria analysis method implementation

WWW-YES-2012 proceedings (draft version)
44 / 175
MCDA implementation in Pouytenga
Problem description, stakeholders identification and objectives formulation
This step consists in specifying what is expected in the decision-making. The issue framework is based on preliminary studies. Previous studies indeed allow defining problems and identifying stakeholders involved in the decision-making. Stakeholders are individuals or groups who have particular interest(s) in the issue. They can directly or indirectly affect the decision. It is also those who have the power to act in a specific area. Previous study of the current status of sanitation in the city of Pouytenga has highlighted problems in all aspects of sanitation. These include problems of wastewater, excreta, faecal sludge, solid waste and storm water management. Indeed, the city does not have any sanitation strategy plan. The purpose of decision making is to improve the environmental sanitation in Pouytenga by implementing a strategy with technology corresponding to the priority of categories of households in order to preserve water resources. Key stakeholders in the process of decision making are households (table 1). The choice of different categories of stakeholders takes into accounts how the living standards and gender may influence the decision. Indeed, according to the standard of living and sex, individuals do not place the same importance to the various sanitation problems. On this basis, 05 categories of stakeholders were consulted.
Table 1: stakeholders group who have been consulted
Standard of living Gender Household of high standard of living Males
Household of middle standard of living Females Household of low standard of living
Identification of possible alternatives or options
This is the set of possible solutions for achieving the goals or solves the identified problem. It is made by the analyst and is based on literature review and experience. Issues were identified from the study of the current state of sanitation in the city. There are six of such issues. Each issue has 1 to 4 alternatives or actions. The choice of alternatives or actions is based on existing technologies used in Sub Saharan Africa for improving access to environmental sanitation (table 2).
Table 2: Issues and alternatives
Issues Actions or alternatives Drinking water supplying - Standpipe
- Network connection
solid waste management - dustbin - Door to door collection - Recovery and recycling
Wastewater management - soak away
Excreta management - Septic tank - Pour -flush toilet - Ventilated improved Pit (VIP) - Urine Diverted Toilet (UDT)
Faecal sludge management - Mechanical emptying - Manual emptying - Sludge treatment and reuse
Rainwater management - Channel construction - Channel cleaning out
Stake and criteria definition

12th World Wide Workshop for Young Environmental Scientists WWW-YES-2012 Urban waters: resource or risks? Arcueil, France (21 – 25 May 2012)
45 / 175
A criterion is the expression of quantitative and qualitative point of view, goals, abilities, or constraints in a given context which assesses the different options. The criteria must be relevant to the issue and measurable or quantifiable. From the view of water and sanitation context, there are five mains groups of criteria identified in literatures:: (i) technology functionality; (ii) health ; (iii) environment ; (iv) social issue and (v) economic aspect (McConville, 2010; Zurbrügg et Tilley, 2007). However the health criterion is often excluded. According to Loetscher (2002) all sanitations options aims indeed to protect human health. This criterion is not discriminating between different sanitation options. On this basis, four criteria were selected for this study. These are:
• The strategy cost: the cost is important in decision-making. The cost of the technology takes into account the cost of the technology construction and, costs related to the use and operation. For example, pour- flush toilet means extra costs due to the use of water for flushing. This criterion is measured by the willingness and ability to pay;
• The service quality: The quality of service is its availability and the possibility of resource recycling or recovery. For example, solid waste collection from door to door has a higher quality of service than that of voluntary provision to a trash bin;
• The environmental sustainability: this criterion takes into account (i) protection of natural resources, i.e. groundwater and surface water; and, (ii) the recovery and reuse of resources such as organic matter and nutrients.
• The socio - cultural acceptability: This is to measure the acceptability and the appropriation of a technology by households. For example, UDT involving the reuse of excreta in agriculture must be judged against this criterion.
Determination of relative weight of criteria It is to convey the preferences of stakeholders by taking into account their value systems. Indeed, stakeholders often do not have the same interests nor the same objectives and are sometimes contradictory. Thus, their preference for each criterion is not the same. This weighting is performed by stakeholders. The criteria may be quantitative or qualitative. For the weighting of criteria, two investigative techniques were used to collect data from households. These are:
• Household survey among 60 households (20 households of low standard of living, 20 medium and 20 from high) using a questionnaire
• Focus groups with 02 groups: a group of men and a women's group. Each focus group is composed by ten people.
The questionnaire is composed by four main parts:
• Socio-economic identification of the household : household head occupation and household size ;
• Weighting of issues: This involves distribution of 100 points on 07 issues of sanitation according to the priority the household gives to each issue;
• Weighting of the criteria: This also involves the distribution of 100 points on four criteria according to the importance each categories of stakeholder give to each criterion. It means that stakeholder should give more points to the criteria which have more importance to him/her ;
• The willingness to pay for the options or alternatives. The collected data were captured and analyzed using Excel. The calculations were used to find the average weights assigned to the different issues and criteria for each category of stakeholders.

WWW-YES-2012 proceedings (draft version)
46 / 175
Actions or alternatives assessment
This is to judge every action or alternative according to each criterion. This step consists of assessing the potential impacts of each action according to scientifically recognized methods. The evaluation is presented in table form called performance table which presents the actions and criteria. Alternatives assessments have been performed by a comparison between them on the basis of the bibliography. The evaluation is presented in the performance table (table 3).
Table 3 : Criteria performance according to alternatives or actions
Alternatives or Actions Strategy cost Service quality Environment sustainability Socio cultural acceptability Standpipe High Medium Medium High Network Low High High High Trash bin Very high Low Very Low High Door to door collection Medium High High High Recovery and recycling Low Very high Very high High Septic tank Very Low High Medium High VIP latrine Medium Medium High Medium Pour flush toilet (UDT) Medium Medium Medium High Urine diverted toilet high Medium Very high Low Mechanical emptying Low High Medium High Manual emptying Medium Medium Medium High Sludge reuse Very Low Very high Very high Low Drainage channel construction Very Low High Medium High Channel cleaning out High Medium Medium High
The issue of "Wastewater" with only one alternative that is "soak away" has not been evaluated.
Judgment aggregation and decision-making
Aggregation provides information on the overall performance of the actions on individual criteria (Maystre et al., 1993). This aggregation may be a choice, sorting, storage or description of the actions. Samoura (2010) identified three approaches to multi-criteria aggregation: (i) the approach of synthetic single criterion; (ii) the approach of on-ranking synthesis and (iii) The approach of interactive local judgment. The approach of on-ranking synthesis involves PROMETHEE methods (Preference Ranking Organization METHod for Enrichment Evaluation) and ELECTRE (Elimination and Choice Translating reality). Pair wise comparisons are used to calculate three flows that rank preference actions:
• the positive flow or outflow (strength) : φ+(a) = 1n −1
π (a,b)b∈A∑ (1)
It measures how an action is preferred to the other: an action with an important outflow should be taken first.
• the negative flow or inflow (weakness) : φ−(a) = 1
n −1π (b,a)
b∈A∑
(2) It measures how many others’ actions are preferred in this action. Indeed, an action with a small negative flow should be taken first. Normally these two flows result in different classifications, so there is not a ranking which
totally agree with all the pair wise comparisons. • The net flow : φ(a) = φ+ (a) − φ−(a) (3)

12th World Wide Workshop for Young Environmental Scientists WWW-YES-2012 Urban waters: resource or risks? Arcueil, France (21 – 25 May 2012)
47 / 175
The net flow is the balance between positive and negative flows. This flow is used for the actions classification of the more positive to the more negative. The descriptive part of PROMETHEE is GAIA, it gives a visual and descriptive analysis to better understand the conflicting criteria, actions profiles and possible compromise solutions. GAIA uses a Principal Component Analysis (PCA) in the multidimensional space corresponding to the normalized net flow. In this way stakeholders' preferences are considered in the normalization. In GAIA plan, actions are represented by points and criteria by their projection of their unity on the axis. The aggregation method that has been chosen is judgments based on the ranking. Indeed, the approach of classification is most suitable for solving environmental management problems which include many non-quantitative aspects and not-commensurable (Mena, 2000; Samoura, 2010). ELECTRE and PROMETHEE methods are part of this approach. PROMETHEE differs from ELECTRE that it builds on a relationship valued ranking reflecting intensity of preference. In addition, PROMETHEE methods are an efficient means of aggregating performance and integration concerns and values of stakeholders in the assessment of options impacts. For analysis, options ranking are made according to PROMETHEE and complemented by GAIA method which is descriptive and which then allows a visual representation. DSight software has been using to implements PROMETHEE and GAIA. These methods have been used by Samoura (2010) for a comparative analysis of options for operating the hydroelectric potential of coastal basins.
Validation workshop
The results of the multi criteria analysis have been validated during stakeholders workshop. They were represented by households, NGOs, technical services in charge of water and sanitation. The workshop aimed to enable stakeholders to amend the results of the study on the priorities of sanitation problems and actions by households and define final technology options. The tools used during the workshop are the results of the MCA and the Compendium of sanitation systems (Tilley et al., 2008) which presents the various excreta management technologies with the advantages, disadvantages and implementation conditions
RESULTS AND DISCUSSION
Ranking of sanitation technology options according to household standard of living The analysis takes into account the preference of different social groups by the system of weighted criteria. The ranking are different depending on the households belonging to low, medium, and high standard of living. The blue colour represents the options of the drinking water options and the green solid waste management options, the black excreta management options; the purple faecal sludge management options and the red one the storm-water management options.
Low standard of living
The ranking of options by household from low standard of living is motivated primarily by the strategy cost criterion (figure 2). Therefore the criterion of service quality is not involved in decision making. Indeed, the chosen options are those with a lower cost. For the issue of drinking water, the option of increasing the number of standpipes was preferred to individual connections, the cost is much higher. For solid management the option of setting up dustbin is

WWW-YES-2012 proceedings (draft version)
48 / 175
the preferred option, followed by door to door collection. UDT has been choice for excreta management. This group of household is not against pour-flush toilet but against the septic tank because of its cost. Manual emptying is the system of sludge extraction and drainage channel cleaning is the system of storm water management.
Figure 2: Options ranking by household from household of low standard of living
Medium standard of living
Decision-making by households of medium standard of living is shared between the criteria strategy cost and service quality (figure 3). Therefore, decision-making is mixed. Thus, the issue of drinking water, the choice is to increase standpipes number but household are not totally against the individual connections because of the quality of service. For solid waste management, the choice is about the system of dustbin and door to door collection. UDT is the option for excreta management, but stakeholders are not against VIP latrine and pour flush toilet. The choice for the system of sludge extraction is the manual one. The drainage channel cleaning is the chosen option for improving storm-water management.
Figure 3: Options ranking by household from household of medium standard of living
High standard of living
The decision axis of household of high standing is mainly directed towards the criterion of service quality. Thus, depending on the issues, priorities are brought to the increasing of number of individual connections to drinking water network, door to door collection and waste recovery, septic tanks for excreta management, mechanical emptying and faecal sludge treatment for recycling or faecal sludge management and channel construction for storm-water management (figure 4).

12th World Wide Workshop for Young Environmental Scientists WWW-YES-2012 Urban waters: resource or risks? Arcueil, France (21 – 25 May 2012)
49 / 175
Figure 1 : Options ranking by household from household of high standard of living
Ranking of sanitation technology options according to gender Sanitation technology options ranking which were derived during the focus groups did not show a significant difference between the ranking of men and women. The ranking is similar to that obtained in the household’s survey of low and medium standard of living households. The results obtained are shown in the table below. The criterion of strategy cost was the key element of decision-making.
Table 1 : sanitation technology option raking according to gender Male Female Drinking water - Standpipe - Standpipe Solid waste - Dustbin
- Door to door collection - Dustbin - Door to door collection - Recycling/ Recovery
Excreta - Urine Diverted Toilet - Pour-flush Toilet - Ventilated Improved Pit
- Urine Diverted Toilet - Ventilated Improved Pit - Pour flush Toilet
Faecal sludge - Manual emptying - Manual emptying Storm water - Channel cleaning - Channel cleaning
Stakeholders coalition analysis On the basis that the 03 categories of stakeholders have the same power of decision, a ranking of stakeholder’s coalition has been done. This analysis gives the consensus options that can satisfy all the stakeholders (figure 5). This coalition shows that the development of a strategic sanitation plan for the city of Pouytenga should take into account both the increase of standpipe’s number of individual connections to the drinking water network. For solid waste management, the plan should include, in addition to the waste collection system, a system for recycling and waste recovery. UDT, VIP and pour-flush toilet will be part of technological options to provide to households. Manual emptying is the practice for sludge extraction from pits. The regular cleaning of existing drainage channel will be drain storm-water.

WWW-YES-2012 proceedings (draft version)
50 / 175
Figure 5: consensual ranking of all stakeholders according to PROMETHEE II
For stakeholder’s coalition analysis, the categories of stakeholders become criteria. The GAIA plane (figure 6) shows that the interests of households from low standing and those of the medium one converge in the same direction and together they control the decision axis. This explains the fact that options of the coalition are strongly influenced by these two stakeholders.
Figure 6: illustration of stakeholder’s coalitions in the GAIA plan
CONCLUSIONS In this study of multi-criteria and multi-stakeholders analysis applied in Pouytenga, the criteria of environmental sustainability and socio-cultural acceptability are not involved much in the process of decision-making. Therefore the criteria that guided the decisions are those relating to strategy costs and service quality. These results confirm the conclusions obtained in the application of MDCA for the evaluation and choice of the best waste management alternatives by Garfi et al. (2009). Indeed, the study concluded that the criteria of health, living conditions, income and employment have played a fundamental role in the comparison of alternatives in comparison with environmental, resource consumption and technical criteria (Garfi et al., 2009).
Decision axis

12th World Wide Workshop for Young Environmental Scientists WWW-YES-2012 Urban waters: resource or risks? Arcueil, France (21 – 25 May 2012)
51 / 175
One of the key success factors of a multi-criteria analysis is the effective participation of those concerned and careful choice of the criteria guiding the choice of technologies. The MCA is based on the weighting of criteria, so the choice is made without the stakeholders being aware of options which they have chosen, hence the need to achieve restitution and validation workshop. In this study, some selected options were abandoned in favour of other in view of their disadvantages. The different technologies should be clearly explained with the advantages and disadvantages. For example, for excreta management, the results of multi-criteria analysis shows that the first choice is UDT because of its low cost. However, at the workshop, the choice was rather towards VIP latrine. The main reason for the abandonment of UDT is the difficulty of management and maintenance of UDT that requires the addition of ash after each use and regular removal of urine. One parameter to take into account is also representative of each stakeholder. Indeed, in the city of Pouytenga, households in high standing represent only 10% and the matter is whether to give this category of stakeholders having the same power of decision-making as those of the medium and low standing that represent 28% and 62% of households in the city despite having a higher investment power.
REFERENCES • Buuren, J.C.L.V., 2010, Sanitation choice involving stakeholders: a participatory multicriteria
method for drainage and sanitation system selection cities- applied in HO-CHI- MINH city - Vietnam, Wageningen university.
• Garfi, M., Tondelli, S., and Bonoli, A., 2009, Multi-criteria decision analysis for waste management in Saharawi refugee camps: Waste Management, p. 11.
• Loetscher, T., and Keller, J., 2002, A decision support system for selecting sanitation systems in developing countries: Socio-Economic Planning Science 36 (2002) 267-290.
• Lüthi, C., Morel, A., P, K., and Tilley, E., 2009, People's Choice First. A 4-Country Comparative Validation of the HCES Planning Approach for Environnemental Sanitation, NCCR North-South Dialogue 22: Bern, p. 129.
• Maystre, L.Y., Pictet, J., and Simos, J., 1993, Méthodes multicritères ELECTRE, Collection gérer l'environnement: Lausanne, Presses polytechniques et universitaires romandes, p. 319.
• McConville, J., 2010, Unpacking Sanitation Planning Comparing Theory and Practice: Gothenburg, Sweden, Chalmers.
• Mena, S.B., 2000, Introduction aux méthodes multicritères d’aide à la décision: Biotechnol. Agron. Soc. Environ.2000 4(2), 83-93.
• Mendoza, G.A., and Macoun, P., 2000, Application de l'analyse multicritère à l'évaluation des critères et indicateurs, Cirad, 84 p.
• Samoura, K., 2010, Contributions méthodologiques à l'évaluation environnementale stratégique de l'exploitation du potentiel hydroélectrique des bassins côtiers en milieu tropical: Cas du Koukouré, en Guinée, Université du Québec, Montréal.
• Tilley, E., Lüthi, C., Morel, A., Zurbrügg, C., and Schertenleib, R., 2008, Compendium of Sanitation Systems and Technologies: Dübendorf, Zwitzerland, Swiss Federal Institute of Aquatic Science and Technology (Eawag), 158 p.
• Yiougo, L., Koanda, H., Luethi, C., Wéthé, J., Bernard Yapo, and Dapola, E., 2011, The material flow analysis method: a tool for selecting sustainable sanitation technology options: the case of Pouytenga (Burkina Faso), Water Resources Management IV, Volume 145: Riverside, Californie, USA, WIT Transactions on Ecology and the Environment, p. 671 - 680.
• Zurbrügg, C., and Tilley, E., 2007, Evaluation of existing Low-cost Conventional as well as Innovative Sanitation Systems and Technologies, Workpackage 3 - Assessement of Sanitation System and Technologies/ NETSSAF, Deliverable 22 & 23. Project no. 037099, EAWAG, p. 43.

WWW-YES-2012 proceedings (draft version)
52 / 175
5. Key issues for decentralization in municipal wastewater treatment
Diana Paola BERNAL* and Inés RESTREPO**
*CinaraInstitute, Universidad del Valle. Calle 13 No. 100-00 Bldg 341, Cali, Colombia (E-mail: [email protected] ; [email protected]) **CinaraInstitute, Universidad del Valle. Calle 13 No. 100-00 Bldg 341, Cali, Colombia (E-mail: [email protected]; [email protected])
Abstract The pressure on water resources caused by accelerated urbanization, the inadequate management and disposal of wastewater and the implementation of sophisticated treatment systems which sometimes with low efficiency and coverage are some of the problems to be solved with alternative and innovative strategies that be in harmony with the recent trends on water management. One of these strategies is the decentralisation in wastewater treatment. In this article, it is proposed an overview of the state of the art and a review of successful cases worldwide, to identify technological, social, economic and environmental issues to be considered for implementation of decentralisation in treatment of municipal wastewater in Colombia. These aspects are a first step in building the conceptual model for the selection of decentralised - centralised treatment schemes.
Keywords Decentralisation; wastewater management; municipal wastewater; developing countries; urban areas.
INTRODUCTION The pressure on water resources as a result of city development has a negative effect on water systems. The expected population growth between 2000 and 2025 will concentrate in urban areas, where by 2025 about 80% of the population will be living in developing countries in Africa, Asia, or Latin America (United Nations, 2007). Thus, the growth dynamics of urban population should be considered one of the major issues of urban water pollution (Marsalek et al., 2001) and is related to the lack of public access to sanitation (2.6 billion people do not have access to improved sanitation facilities). In the period 1990–2008, approximately 1.3 billion people gained access to improved sanitation, and 64% of them live in urban areas. However urban areas, though better served than rural counterparts, are struggling to keep up with the growth of the urban population (WHO and UNICEF, 2010). At the present time, environmental protection and sustainable management of natural resources are in the foreground of economic and technological activities worldwide (Verstraete, 2009). The tendency in development must be aimed at achieving a self-sustainable urban water cycle, which is not only a closed-loop cycle in terms of water flows, but also minimises energy requirements and waste volumes discharged to the environment. Likewise, the plans, programs and projects must be subject to an environmental impact evaluation for the purpose of identifying potential alternatives for prevention, mitigation, and compensation, as well as of reforming the economic structure to direct towards a decision-making process in which environmental consequences are considered (Wang, 2009).

12th World Wide Workshop for Young Environmental Scientists WWW-YES-2012 Urban waters: resource or risks? Arcueil, France (21 – 25 May 2012)
53 / 175
The traditional water planning approach includes a relentless increase of future demands that exceed the sources of supply, considering that the projections of population, the per capita water demand, the agricultural production, and the levels of economic productivity are calculated upward (Gleick, 2000, Marsalek et al., 2006). The conventional approach allows the use of drinking water for irrigation, toilet flushing, and draining, even when these uses do not require high quality standards. Wastewater treatment is a commonly spread practice in developing countries where a high percentage of the population (90%) is connected to centralised treatment systems (Metcalf and Eddy Inc., 2003). Decentralised systems, however, are becoming of special interest because of the possibility of reducing treatment costs in the long term and reusing wastewater (Daigger, 2009). In urban water management there is a need for a change to improve the sustainability of the systems. This new approach should include the integration of social, economic, and environmental aspects with practices such as rainwater management, water conservation, wastewater reuse, rational energy management (incorporating the use of alternative sources), nutrient recovery, and sorting at source. This approach can be applied to centralised and decentralised schemes or even a combination of both (Daigger, 2009).
Decentralised wastewater management as an option for urban areas Decentralised treatment is defined by the fact that raw wastewater is treated next to the source (Wilderer and Schreff, 2000 cited by Libralato et al., 2011), this approach is becoming an viable alternative for wastewater management, minimizing the environmental impacts and facilitating the resources recovery (Nhapi, 2004). Decentralised systems can offer a profitable long-term option to guarantee the accomplishment of public health and water quality objectives (EPA, 1997). These systems, however, involve changes in the way in which planning and decisions are made with regard to the management of water resources, as well as infrastructure, operational, and maintenance changes. Additionally, considering climate change, environmental degradation, and increasing concerns about security further exacerbates the pressures on urban water systems (Jackson et al., 2001cited by Milman and Short, 2008). A decentralised infrastructure offers benefits because it spreads the risks of drought and extreme events and so it is often more climate resilient (Howard and Bartram, 2010). To complement the above, the concept of decentralisation provides greater flexibility in choosing and locating the types of facilities for treating urban water. A distributed system is also inherently more reliable and less susceptible to failure and outside intervention than a centralised system (Andoh, 2002, Daigger and Crawford, 2007, Panebianco and Pahl-Wostl, 2006, Gikas and Tchobanoglous, 2009, Nelson, 2008). Decentralisation also emphasises a more holistic approach that considers the benefits of reducing the amount of waste at source and the option of recycling or reuse at the site. Besides, decentralised systems keep the collection component of a wastewater management system as minimal as possible and focus primarily on the necessary treatment and disposal of wastewater. The fee collection costs can be reduced down to more than 60% of the total budget for wastewater management in a centralised system, particularly in small communities with low population densities (Massoud et al., 2009). Considering the variety of sustainable factors, such as social, cultural, environmental, and technical factors, which must be taken into account in order to implement a wastewater treatment

WWW-YES-2012 proceedings (draft version)
54 / 175
system, the financial aspect is often the most decisive factor in developing countries. This is the reason for which decentralised systems are being considered increasingly as a viable alternative because they are less intensive in terms of resource requirements and more ecologically sustainable (Tchobanoglous et al., 2003). However, in the majority of countries, there is a lack of suitable institutional arrangements for managing decentralised systems and a lack of a suitable policy framework that encourages a decentralised approach. Without technical assistance and other capacity-building measures, problems of institutional capacity that existed under a centralised operation are simply passed on to the new structures (Parkinson and Tayler, 2003). Similarly, there is limited information on how sustainability applies to the general field of wastewater infrastructure, including both centralised and decentralised treatment approaches (Danyluk, 2008). Table 1 shows the drivers and constraints of decentralisation of wastewater treatment
Table 1 Drivers and constraints for decentralisation Drivers Constraints
Water crises and other new societal demands on the infrastructure − Droughts and water supply shortages − Water quality and habitat degradation − Climate change and resilience − Aging infrastructure costs - repairs and expansion − Alternatives to sprawl development (promoted by
sewers and large-lot septic systems) − Quality of life in urban and rural communities—
pervasive grey infrastructure Population growth Water scarcity Resource constraints Available technology Increased demand New ideas and design concepts— natural, social,
economic systems Niche innovations by advocates and entrepreneurs
Government policies and regulations founded on centralised infrastructure
Market failures, with fragmentation and little information
Distorted rates of water Fragmentation of the water and sanitation agencies Civil society based on the conventional Minimum investment in research Lack of local models that combine technology,
management, financing and customer acceptance Segregation of actors (entrepreneurs, professionals,
and academics) in three different areas: supply, storm water and wastewater
Lack of acceptance public Lack of economic evaluations procedures Stove-pipe professional thinking Institutional constrains Existing practices
Source: (Daigger, 2009, Nelson, 2008)
The drivers listed in Table 1 show that many of the environmental problems associated with municipal wastewater could be mitigated and controlled through the implementation of decentralised schemes. However, the main constraint is the lack of knowledge by professionals and institutions in the water sector where training is given to provide conventional solutions with an “end-of-the-pipe” approach. There are constraints on the part of the government agencies that establish the guidelines for plans, policies, and regulations in relation with urban planning and urban water management. Additionally, current centralised schemes do not enable communities to access and acquire technical solutions. The decentralised wastewater management is aimed at the development of systems more financially affordable, more socially responsible, and more environmentally benign than conventional centralised systems, bridging the gap between onsite systems and conventional centralised systems (Nhapi, 2004, Burkhard et al., 2000). Environmental problems in urban areas are a consequence of the number of people producing waste in high concentrations. In this sense, a centralised approach to managing wastewater is the best option from the standpoint of per-capita costs of treatment. However, when there are high population densities in peri-urban areas located at great distances from centralised systems, this

12th World Wide Workshop for Young Environmental Scientists WWW-YES-2012 Urban waters: resource or risks? Arcueil, France (21 – 25 May 2012)
55 / 175
economy of scale disappears, leading centralised systems to require large investments (Chung et al., 2008, Fane et al., 2002). The implementation of a decentralised system calls for a different kind of planning where the feasibility, design, and implementation activities should be carried out by independent sectors within the urban area, taking into account specific contexts and providing solutions that meet their individual needs. This is done also considering the existing heterogeneity in a urban centre, where the social, environmental, geographic, economic, and technological conditions may vary widely (Liang and van Dijk, 2008). Decentralisation has the advantages not only of being easily adaptable to local conditions in urban areas, but also of extending its capacity in line with population growth. Besides, this approach facilitates reusing water and recovering by-products in the form of nutrients, sludge, and energy. Table 2 shows a comparison between centralised and decentralised approaches.
Table 2 Comparison between centralised and decentralised schemes Parameter Centralised Decentralised
Collecting system Large diameters, long distances Small diameters, short distances Requirements space Large area in one place Small areas in many places Operation and maintenance Full time technical staff requirements Less demanding, can be monitored remotely Uniformity of water Many types of water More uniform water
Dilution grade Less control over the stormwater, more dilution
More control over the stormwater, more concentrate
Risk Risk on a larger scale Risk distributed Water transfer Increase the needs for water transfer Water is used and reused in the same area Social control Social control is lost More social control
Ease of expansion High costs, more complexity to implementation
Low cost, less complexity to implementation
Potential to reuse All water is concentrated in one point Water can be reused locally Source: Adapted by CODESAB (2011)
Experiences of decentralisation The decentralisation for wastewater management present different levels from individual solutions, clusters and individual buildings to semi-centralised or satellite treatment systems that could be also integrated within the existing centralised system even if only for solid sludge processing (Libralato et al., 2011). Additionally, Orth(2007) classify the decentralisation in 3 categories: i) simple sanitation systems, whose purpose to assure minimum hygienic standards for the population, with water pollution control being of minor significance. ii) Small-scale mechanical-biological treatment plant that are designed to limit water pollution, beside to assuring a high standard of hygiene; iii) Recycling systems which priority is the environmental protection while simultaneously maintaining a high standard of hygiene, a common principle is separation of the different sewage or material streams (urine, faeces, grey water, and stormwater). The extreme level of decentralisation corresponds to individual solutions, being this option one of the most commonly reported in literature, mainly at locations with low population density and scattered. Furthermore this kind of alternative is also used in peri-urban areas. In the United States around 60 million people use some form of onsite wastewater treatment, and about 20 million of them use the conventional septic tank system (Bradley et al., 2002). Another example of an individual solution is the use of dry toilets with the recovery of nutrients which are used in approximately 700,000 households in China (Larsen et al, 2009 cited by Libralato et al., 2011). In Turkey, almost 28% of the municipalities are served by septic tanks (Engin and Demir, 2006 cited by Massoud et al., 2009). In New Haven, Adelaide, South Australia, there are onsite

WWW-YES-2012 proceedings (draft version)
56 / 175
treatment facilities for wastewater generated by 65 households on a two-hectare site (Mitchell, 2004). Successful cases of decentralisation are documented in Japan, where about 2,500 decentralised systems are associated with large blocks of buildings that treat and reuse their own wastewater. In general, there are clusters of residential buildings, hospitals, schools or institutional centres (Yamagata et al., 2002). Likewise, both the Solaire residential complex in New York and the Metropolitan Government facilities in Tokyo have a collection and treatment system in place for reusing wastewater for a toilet-flushing and cooling system (Gikas and Tchobanoglous, 2009). The combination of onsite treatment and semi-centralised alternatives is the case of Surabaya, Indonesia where wastewater management has been divided into smaller sub-districts (RukunTetangga – RT, the lowest level of an organised community) with the two following options for treatment: a communal toilet for a part of population in the RT who does not have their own/private WC (water closet) with source separation (yellow, brown, and grey water) and decentralised domestic wastewater treatment for the rest of the population in the RT who have their own WC with treatment and storage of faeces and urine in every household and grey water carried to the decentralised treatment unit (Prihandrijanti et al., 2008). Another approach is the connection into decentralised systems with a centralised collection system. The largest satellite plant is the Tillman WWTP in Los Angeles which has a capacity of approximately 80 Mgal/day. The excess of flow and solids from the Tillman WWTP are discharged to the collection system feeding the Hyperion WWTP. In another example, the Los Angeles County Sanitation District maintains seven satellite plants to facilitate water reuse projects throughout the county. Similarly, the Serrano development in CA was made possible with a satellite water reuse system for irrigation water (Leverenz and Tchobanoglous, 2009). Other experiences of decentralisation of wastewater treatment are summarised in Table 3 below.
Table 3 Experiences of decentralisation for wastewater treatment Location Description
Serrano, El Dorado County, CA, UnitedStates
Yard and community landscape irrigation with reclaimed wastewater from decentralised system. During the summer period the reclaimed water supply must be augmented (Gikas and Tchobanoglous, 2009)
Rouse Hill, Nueva Gales del Sur, Australia
Reclaimed water from decentralised system used for a variety of non-potable uses (Mitchell, 2004)
St. Petersburg, Florida, Estados Unidos
Landscape irrigation from four decentralised water reclamation plants (Gikas and Tchobanoglous, 2009)
Upland Hills Country Club Golf Course, Upland, CA. United States
One of the earliest satellite systems involving sewer mining and treatment for golf course irrigation. System has been in operation for 25 years (Ripley, 2006 cited byGikas and Tchobanoglous, 2009)
LowerJordanRift Valley, Jordan
Development of a strategic plan to include decentralised and semi-centralised systems for rural and urban areas in the water master plan of Jordan 2009 – 2022 (van Afferden et al., 2010).
Venice, Italy 4,493 decentralised systems distribute in 119 islands (MAV, 2007 citado por Libralato et al., 2011)
Muscat, Oman 12 wastewater treatment systems serve to 30% of population; the remaining 70% is served by individual septic tanks. The wastes generated are sent to municipal treatment plant. There are 137 private treatment plans (Bakir, 2001)
Gweru, Redcliff, Mupandawana, Nemanwa, Zimbabue
Analysis and development of an alternative strategy of decentralised wastewater management in Zimbabwe. The conceptual plan was developed taking into account capital and operational cost, wastewater generation patterns and quality, and urban agriculture (Nhapi, 2004)
Beijing, China
Around 1,000 decentralised wastewater recycling systems have been constructed and are operational in Beijing. According with the regulations, all institutes, schools and hotels of which a construction area larger than 30,000 m2 have their own water recycling system (Liang and van Dijk, 2008)

12th World Wide Workshop for Young Environmental Scientists WWW-YES-2012 Urban waters: resource or risks? Arcueil, France (21 – 25 May 2012)
57 / 175
New York, United States Decentralised wastewater collection and treatment incorporating 14 wastewater treatment plants (Daigger and Crawford, 2007)
IDENTIFYING THE KEY ISSUES FOR DECENTRALISATION Based on a review of the state of the art and documented experiences, the key issues to the implementation of decentralised systems in urban areas were identified and classified, particularly in the context of developing countries. A review of 14 different studies provided the basis for establishing commonalities between them with regard to various issues, which were classified into the six following categories: planning, demographic, technological, economic, environmental, and social issues. These issues and their respective authors are summarised in Table 4. The key aspects to the implementation of a decentralised system were identified in each category based on the largest number of commonalities between the authors. Nevertheless, there were some issues in each category that were more relevant than others (where more than 50% of authors agreed) which can make a difference in implementing decentralised schemes in the context of urban areas in developing countries. These issues are shown in Figure 1.
Table 4: Overview of the key issues for decentralisation Issue Authors
Planning Urban area planning 2,4,5,7,8,10 Geographical distribution and land uses 1,3,4,5,7 Strengthening of master plans and urban development plans 1,2,6,7,8,10,12,14 Strengthening of legislation 1,2,6,8,10,12,14 Strengthening of institutions 6,10,12,14 Administrative and political reforms 6,8,14 Demographic Size 1,2,3,4,8,9,10 Distribution of population 1,2,3,4,5,7, 9,13 Density 1,2,4,9,13 Growth rate 1,2,3,4,10 Technological Sewer system existence 1,2,3,5,6,13 Sewer system coverage 3,5,10,13 Wastewater treatment existence 1,2,3,13,14 Wastewater treatment coverage 3,5,10 Non-conventional technologies 1,2,9,10,13,14 Technologies combination 1,2,3,13,14 Water demand 2,3,4,8,14 Wastewater production 2,3,8 Wastewater composition 2,4,5,6 Efficiency 2,3,4,5,6,7,13,14 Reliability 2,3,4,5,6,7,13 Reclamation and reuse of wastewater 1,2,3,6,7,8,9,10,11,12,13,14 Combination of centralised and decentralised schemes 1,2,3,6,7,9,10,13,14 Compliance with quality standards 2,4,5,6,7,13,14 Economic Collecting and conveyance cost 1,2,3,4,5,6,7,8,9,13,14 Treatment cost 1,2,3,4,5,6,7,8,9,11,14

WWW-YES-2012 proceedings (draft version)
58 / 175
Construction cost 3,5,8,11 Maintenance and operation cost 2,3,5,7,8,11 Materials cost 1,5,8 Environmental cost 8,11,12,14 Environmental Environmental protection 3,4,6,8,9,11,13 Resources consumption 7,8 Environmental benefits 4,8,11,12,14 Social Acceptance 4,7,8,11,12 Social awareness on the environment 6,8,11,12,14 Environmental education 6,11,12 Health Impact 6,7,8,9,13 Water culture 11,12,14
Source: 1. Prihandrijantiet al., (2008) 2. van Afferden et al., (2010) 3. Libralato et al., (2011) 4. Gikas and Tchobanoglous(2009) 5. Chung et al., (2008) 6. Massoud et al., (2009) 7. Daigger and Crawford (2007) 8. Liang and van Dijk(2008) 9. Naphi(2004) 10. Daigger(2009) 11. Mankad and Tapsuwan(2010) 12. Parkinson and Tyler (2003) 13. Bakir(2001) 14. Panebianco and Pahl-Wostl(2006)
DECENTRALISATIONDemographicSize
Distributionof population
Planning
Strengthening of developments plans Strengthening of legislation
Technological
EficiencyReliabilityReclamation and reuse of wastewaterCombination of centralised and decentralised schemesCompliance with quality standards
Economic
Collecting and conveyance costTreatment cost
Environmental Environmentalprotection
Social
AcceptanceSocial awareness on the environment
Figure 1: The most relevant key issues of decentralisation
RESULTS AND DISCUSSION
Planning category Six key issues were identified in this category, namely, urban area planning; geographical distribution and land uses; strengthening of master plans and urban development plans; strengthening of regulations; strengthening of institutions; and administrative and political reforms. All these key issues are related to the form of planning for water management in a city, where a centralised approach prevails with conventional “end-of-the-pipe” solutions with results that have not yet shown the expected efficiency regarding pollution control. In this sense, in order to implement decentralised treatment schemes mainly in cities in developing countries, it is necessary to integrate urban planning with water resource planning

12th World Wide Workshop for Young Environmental Scientists WWW-YES-2012 Urban waters: resource or risks? Arcueil, France (21 – 25 May 2012)
59 / 175
based on geographical and spatial distribution and land uses, so it can be defined the level of decentralisation and evaluate the potential of reuse in each sector. However, to achieve this, it is essential to make some reforms to the legal, political, and administrative framework of urban planning and water resource management, promoting decentralisation as an innovative solution to the pollution problems, improving wastewater treatment coverage, and meeting quality standards that ensure public health and environmental protection. The importance of reforming the political, legal, and administrative framework as well as of strengthening the capacity of institutions involved in the water and sanitation sectors in relation to the issue of decentralisation can become a critical instrument to ensure sustainability of these alternatives and their articulation with already operating centralised schemes.
Demographic category Aspects such as size, distribution, density, and growth rate of population are critical to the development of any project for urban water management; but for decentralisation, distribution and population size are especially important considering that these issues are the basis of good planning respect to the number of decentralised systems and the level of decentralisation to provide.
Technological category Most authors agree that efficiency, reliability, and compliance with quality standards are key issues under a decentralised scheme because of the need for a strict control of the technology to meet removal efficiencies required by the regulations, especially when they are small decentralised schemes operating in isolation from the central treatment system. On the other hand, the common characteristic of all the described decentralised options is the “zero-discharge” and the “closing-the-loop” approach aimed at recycling treated effluent for agricultural or municipal reuse (Zhang and Tan, 2010); In this sense, the selected technology must be capable of providing water quality according to the subsequent use of the effluent, and the infrastructure installed in a decentralised scheme should facilitate reuse. Lastly, another important technological issue is related with the possibility of combining centralised and decentralised schemes, taking into account that this would facilitate the implementation of decentralised treatment systems within existing centralised systems. As the case of satellite treatment plants that could be also integrated within the existing centralised system even if only for solid sludge processing (Libralato et al., 2011). Apart of the obvious utility for water reuse, the satellite treatment systems may also be used to reduce wastewater flows to the centralised facilities, or as means to eliminate or reduce discharges to impacted receiving water bodies (Gikas and Tchobanoglous, 2009).
Economic category In centralised systems, it is well recognized that most of the financial costs are related to the construction and maintenance of the sewage collection system. Conversely, most of the decentralisation costs are related to the treatment unit (Hong et al., 2005 cited by Libralato et al., 2011). An economic analysis should be performed of each particular project to assess the costs associated with environmental and social benefits (externalities) associated with the technological scheme. Some of the externalities related to decentralised water systems include avoiding the effects of water restrictions on lifestyle, private green space and property value; reducing nutrient flow into

WWW-YES-2012 proceedings (draft version)
60 / 175
the environment from reduced treated wastewater discharge; and reducing potable water demand which can help delay the need for additional potable water sources in the future (Mankad and Tapsuwan, 2010) Likewise, while decentralisation is economically feasible, it is necessary to have a plan for funding the system to ensure its sustainability over time. The implementation of decentralised systems may reduce the cost of investment required for wastewater management, save water resources and capital investments, but they have the risk of not continue operating in the long term because the financial problems, taking into account that the majority of local government agencies and departments lack the resources to invest in new infrastructure and rely on grants from higher levels of government to finance improvements in service provision (Angelakis et al., 2003, Parkinson and Tayler, 2003).
Environmental category Environmental protection is the ultimate goal of a treatment system. For the context of decentralisation there is a special connotation, considering that significant pollution problems by the discharges of wastewater without treatment or deficient treatment associated to centralised systems. In contrast, in decentralised scheme the flows at any point would remain small, implying less environmental damage from any mishap. System construction would also result in less environmental disturbances as the smaller collection pipes would be installed at shallow depths and could be more flexibly routed (Nhapi, 2004) Social category Social repercussions of small wastewater treatment systems and of decentralisation processes in general, are frequently underestimated compared to the economic and environmental ones. Actually, the general feeling is that centralisation has no reason to be substituted by decentralisation where it is already in force (Ho and Anda, 2004 cited by Libralato et al., 2011). Centralised systems are already accepted by the general public, while the success of a decentralised system depends on many aspects of the acceptance of the population served and the surrounding population where the system is located. This acceptance is accompanied by environmental awareness which is also linked with information access, environmental education, and water culture. The public acceptance for the use of decentralised water or non-potable uses is compelling. Acceptance is strongly driven by environmental concerns and social responsibility to reduce household demand; however, beliefs about appropriate applications for alternative water seem to also be influenced by cognitive perceptions related to water quality. Social research has provided clear evidence that the public’s acceptance of alternative water is based on measurable concerns that are heavily influenced by perceptions of risk and health-related concerns (Mankad and Tapsuwan, 2010).
CONCLUSIONS Environmental pollution, water scarcity, population growth, innovation, and technological developments are drivers that encourage rethinking the current approach to urban water management. In this sense, decentralisation encourages us to think of urban water management in a holistic way, integrating all sectors, drinking water, wastewater, and stormwater to get the most benefit out of them, thereby reducing costs, improving environmental management, expanding service coverage, and considering social and environmental benefits that are not visible with the current perspective.

12th World Wide Workshop for Young Environmental Scientists WWW-YES-2012 Urban waters: resource or risks? Arcueil, France (21 – 25 May 2012)
61 / 175
The above mentioned should be accompanied by a reform of policies and guidelines that govern urban development plans and water management plans in cities in developing countries. The incorporation of decentralisation as a viable option for wastewater management in urban areas and the regulation of reusing practices such as defining quality criteria are necessary actions to articulate the conceptual framework with the actions that occur in reality. Based on a review of the state of the art and experiences with decentralisation, it can be concluded that the social, financial, and environmental benefits of decentralisation become critical factors when considering this kind of scheme in urban water management plans, mainly in peri-urban areas where wastewater collection and/or treatment is not available. In addition to the benefits, the key issues of each one of the identified economic, social, and environmental categories should be discussed. These include, among others, the cost of collecting and treating wastewater, acceptance and social awareness, and environmental protection, all of which must be considered in implementing decentralisation in urban areas in developing countries. According to the context of each case, the level of decentralisation may be a critical issue to achieving sustainability of a wastewater management system. In many cases, a semi-centralised scheme can be a feasible option to introduce decentralisation in an urban area in a developing country, considering that the planning policies and the regulatory framework do not have many components that facilitate a different kind of management other than the traditional "end-of-the-pipe" solutions and with use of conventional technologies in centralised systems.
REFERENCES ANDOH, Y. G. Year. Urban drainage and wastewater treatment for the 21st century. In: 9th International
Conference on Urban Drainage, 2002 Portland, Oregon. ANGELAKIS, A. N., BONTOUX, L. & LAZAROVA, V. 2003. Challenges and prospective for water
recycling and reuse in eu countries. . Water Science and Technology, IWA Publishing, 3, 59-68. BAKIR, H. A. 2001. Sustainable wastewater management for small communities in the Middle East and
North Africa. Journal of Environmental Management (2001) 61, 319–328, 319-328. BRADLEY, R. B., DAIGGER, G. T., RUBIN, R. & TCHOBANOGLOUS, G. 2002. Evaluation of onsite
wastewater treatment technologies using sustainable development criteria. Clean Technologies and Environmental Policy, 4, 87-99.
BURKHARD, R., DELETIC, A. & CRAIG, A. 2000. Techniques for water and wastewater management: a review of techniques and their integration in planning. Urban Water, 2, 197-221.
CODESAB 2011. Los Retos: Tratamiento Descentralizado de Aguas Residuales. Foro Metropolitano de Cochabamba del Agua y Saneamiento. Universidad Mayor de San Simón - Bolivia.
CHUNG, G., LANSEY, K., BLOWERS, P., BROOKS, P., ELA, W., STEWART, S. & WILSON, P. 2008. A general water supply planning model: Evaluation of decentralized treatment. Environmental Modelling & Software, 23, 893-905.
DAIGGER, G. 2009. Evolving Urban Water and Residuals Management Paradigms: Water Reclamation and Reuse, Decentralization, and Resource Recovery. Water Environment Research, 81, 809-823.
DAIGGER, G. & CRAWFORD, G. 2007. Enhancing water system security and sustainability by incorporating centralized and decentralized water reclamation and reuse into urban water management systems. J. Environ. Eng. Manage, 17, 1-10.
DANYLUK. 2008. Wastewater treatment systems: an assessment of sustainability. University of Cincinnati.
EPA, U. 1997. Response to congress on use of decentralized wastewater treatment systems. In: EPA-832-R-97- 001B, U. E. O. W., APRIL. (ed.). EPA - Office of Water
FANE, S. A., ASHBOLT, N. J. & WHITE, S. B. 2002. Decentralised urban water reuse: The implications of system scale for cost & pathogen risk. Water Science and Technology, IWA Publishing, 46, 281 - 288.

WWW-YES-2012 proceedings (draft version)
62 / 175
GIKAS, P. & TCHOBANOGLOUS, G. 2009. The role of satellite and decentralized strategies in water resources management. Journal of Environmental Management, 1-9.
GLEICK, P. H. 2000. El Cambio de Paradigma del Agua. Una Mirada al Desarrollo de los Recursos Hidráulicos en el Siglo Veintiuno. Water International Journal, 25, 127-138.
HOWARD, G. & BARTRAM, J. 2010. Vision 2030. The resilience of water supply and sanitation in the face of climate change. Technical report. Public Health and Environment Water, Sanitation, Hygiene and Health. Geneva, Switzerland: World Health Organization.
LEVERENZ, H. & TCHOBANOGLOUS, G. 2009. Satellite Systems for Enhanced Wastewater Management in Urban Areas. Water Environment Federation, 5592 - 5608.
LIANG, X. & VAN DIJK, M. P. 2008. economic and financial analisys of decentralized water recycling systems in Beijing. 3rd SWITCH Scientific Meeting Belo Horizonte.
LIBRALATO, G., VOLPI GHIRARDINI, A. & AVEZZÙ, F. 2011. To centralise or to decentralise: An overview of the most recent trends in wastewater treatment management. Journal of Environmental Management.
MANKAD, A. & TAPSUWAN, S. 2010. Review of socio-economic drivers of community acceptance and adoption of decentralised water systems. Journal of Environmental Management, 1-12.
MARSALEK, J., JIMÉNEZ-CISNEROS, B. E., MALMQUIST, P. A., KARAMOUZ, M., GOLDENFUM, J. & CHOCAT, B. 2006. Urban Water Cycle Processes and Interactions, Paris, France, UNESCO/IHP.
MARSALEK, J., ROCHFORT, Q. & SAVIC, D. 2001. Urban water as a part of integrated catchment management. In: MAKSIMOVIC, C. & TEJADA-GUIBERT, J. A. (eds.) Frontiers in urban water management, Deadlock or Hope. London, UK: IWA, IHE.
MASSOUD, M. A., TARHINI, A. & NASR, J. A. 2009. Decentralized approaches to wastewater treatment and management: Applicability in developing countries. Journal of environmental management, 90, 652-659.
METCALF & EDDY INC. 2003. Wastewater Engineering. Treatment and Reuse, New York, USA, Mc Graw Hill.
MILMAN, A. & SHORT, A. 2008. Incorporating resilience into sustainability indicators: An example for the urban water sector
Global Environmental Change, 18, 758-767. MITCHELL, V. G. 2004. Integrated urban water management: A review of current Australian practice.
Australian: AWA - CSIRO. NELSON, V. 2008. New approaches in decentralized water infraestructure In: TREATMENT, C. F. A.
W. (ed.). Gloucester. MA. USA: Coalition for alternative wastewater treatment. NHAPI, I. 2004. A framework for the decentralised management of wastewater in Zimbabwe. Physics
and Chemistry of the Earth, 29, 1265–1273. ORTH, H. 2007. Centralised versus decentralised wastewater systems? . Water Sci. Technol. , 56,
259e266. PANEBIANCO, S. & PAHL-WOSTL, C. 2006. Modelling socio-technical transformations in wastewater
treatment—A methodological proposal. Technovation, 26, 1090–1100. PARKINSON, J. & TAYLER, K. 2003. Decentralized wastewater management in peri-urban areas in
low-income countries. Environmental and Urbanization, 15, 75-90. PRIHANDRIJANTI, M., MALISIE, A. & OTTERPOHL, R. 2008. Cost–Benefit Analysis for Centralized
and Decentralized Wastewater Treatment System (Case Study in Surabaya-Indonesia). In: AL BAZ I, O. R., WENDLAND C, EDITORS (ed.) Efficient Management of Wastewater: Its Treatment and Reuse in Water-Scarce Countries. Berlin-Heidelberg: Springer.
TCHOBANOGLOUS, BURTON & STENSEL 2003. Wastewater Engineering. Treatment and reuse, United States.
UNITED NATIONS 2007. Population Division of the Department of Economic and Social Affairs of the United Nations Secretariat, World Population Prospects: The 2006 Revision and World Urbanization Prospects: The 2005 Revision. .
VAN AFFERDEN, M., CARDONA, J., RAHMAN, K., DAOUD, R., HEADLEY, T., KILANI, Z., SUBAH, A. & MUELLER, A. 2010. A step towards decentralized wastewater management in the Lower Jordan Rift Valley. Water, Science and Technology, 61, 3117-3128.

12th World Wide Workshop for Young Environmental Scientists WWW-YES-2012 Urban waters: resource or risks? Arcueil, France (21 – 25 May 2012)
63 / 175
VERSTRAETE, W. V. D. C., P; DIAMANTES, V. 2009. Maximum use of resources present in domestic “used water”. Bioresource Technology. 100, 5537-5545.
WANG, S. L., J; REN, L; ZHANG, K; WANG, R. 2009. The development and practices of Strategic Environmental Assessment in Shandong Province, China. Environmental Impact Assessment Review. 29, 408 - 420.
WHO & UNICEF 2010. Progress on sanitation and drinking - water: 2010 Update. Joint monitoring programme for water supply and sanitation. Switzerland.
YAMAGATA, H., OGOSHI, M., SUZUKI, Y., OZAKI, M. & ASANO, T. 2002. On-site insight into reuse in Japan. Water Sci. Technol., 21, 26e28.
ZHANG, D. Q. & TAN, S. K. 2010. Decentralized Wastewater Management and Its Application in an Urban Area of Beijing, China. 4th International Conference on Bioinformatics and Biomedical Engineering (iCBBE). Chengdu, China.
WWW-YES-2012 proceedings (draft version)
64 / 175
6. Dissolved Ozone Flotation as a innovative and prospect method for treatment of micropollutants and wastewater treatment costs reduction
Piotr Robert WILIŃSKI*, Jeremi NAUMCZYK
Faculty of Environmental Engineering, Warsaw University of Technology, Nowowiejska 21, 00-653 Warszawa, Poland (* Corresponding author, e-mail: [email protected])
Abstract The lack of fresh water is one of the major threats for people. The extremely sufficient and cost saving methods for water and wastewater treatment must be applied. The paper shows possibility of using traditional Dissolved Air Flotation method (DAF) with alternation of feeding gas by ozone (Dissolved Ozone Flotation – DOF) instead of air to obtain better treatment results and possibilities of decreasing the costs of water and wastewater treatment. Moreover the DOF method may come in effective in case of more and more restrictive recommendations regarding water quality and micro-pollutants removal. As the method is on early stage of the research many technical aspects and mechanisms must be taken into consideration and to be investigated. Presumably the DOF method could be applied in technical scale for pre-treatment of industrial wastewaters, fracturing fluids, water with algae or for final separation of effluent and excess sludge in municipal wastewater treatment plants.
Keywords dissolved air flotation (DAF); ozonation; water and wastewater treatment, industrial wastewater
INTRODUCTION Nowadays, the lack of freshwater impels governments to create new, more restrictive law and private companies to create new, sufficient and cost- and energy-effective technologies and methods for purification of water and treatment of wastewater. The shortage of freshwater can be seen especially in Asia (fast growing population) and Africa (lack of freshwater reservoirs). Poland has problem with limited amount of freshwater. In many cases it is bad quality water. All in all, this issue has high importance, as water (clean freshwater) is at the bottom of human’s life. Flotation method is mainly used in two sectors: mining industry (for separation of metal ores) and in wastewater treatment process (both for municipal and industrial wastewaters) for separation of suspended solids, emulsions, chemical sludge or excess sludge. Conventional flotation relies on floating of solids (mainly suspended solids) on the top of the liquid by air bubbles (in conventional process they have and average diameter of 100 – 300 µm). Better separation effect is obtained when air bubbles are very small (micro and nano). Special dispersing pumps are able to create air-water mixture of nanobubbles and process is named as micro- and nanoflotation. Coagulants and flocculants are used in the process for better agglomeration of small particles and colloids. Ferrous or aluminum sulfates are the most common coagulants and they are mixed with water or wastewater before entering flotation unit.

12th World Wide Workshop for Young Environmental Scientists WWW-YES-2012 Urban waters: resource or risks? Arcueil, France (21 – 25 May 2012)
65 / 175
Nowadays, micro and nanoflotion with ozone (Dissolved Ozone Flotation, DOF) is in laboratory research scale. The research is conducted mainly in Asia: South Korea (Ulsan University), Japan (Kyoto) and China (Xian). However it is very early stage of the research. In this method ozone is used instead of atmospheric air. This substitution causes ability to obtain two processes in one unit: separation of solids and emulsions by gas bubbles (as in conventional flotation) and oxidation of soluble organic compounds using strong oxidizing agent – ozone. Synergy of those two processes (separation and oxidation) can lead to better treatment effects. It can cause positive results as: decreasing dosing coagulants and flocculants, pathogen removal, improvement of wastewater biodegradability, micro-pollutants removal (antibiotics, hormones, personal care products), decreasing the amount of excess biological sludge (in case that DOF unit is used for separation of effluent from excess activated sludge). Previous research were focused on process efficiency, but only relationship between dose of ozone and treatment efficiency was measured. It must be mentioned that in the past research, the conventional flotation (coarse bubbles) was implemented (not micro – nanoflotation with bubbles size of 1-20 µm). Thus, in the research essential fact was omitted. The size of bubble has enormous influence on kinetics and efficiency of oxidation process. The main parameter which can limit the process kinetics is mass transfer of ozone into the solution (wastewater). The efficiency of the process depends on total area of ozone bubbles in the solution. The bigger area (the amount of bubbles generated) causes higher mass transfer kinetics of ozone and velocity of organic compounds oxidation is increasing. In conclusion, this problem can be solved using appropriate air dispersing pumps (micro- and nano-bubbles pumps). Until now, the research on conventional flotation with ozone as feeding gas was made on municipal, livestock wastewater and as the method of tertiary treatment. During testing of municipal wastewaters, LEE et. al (2008) observed the higher efficiency of the process for DOF method comparing with conventional DAF in case of reducing: suspended solids, color, Biological Oxygen Demand (BOD), turbidity, total phosphorus. Additionally, the great effect of disinfection and removing coliform bacteria was noticed. LEE et.al (2006) made the research on livestock wastewater. The effects were as well good considering the reduction of suspended solids and Chemical Oxygen Demand (COD). JEAONG et. al (2011) claimed, For pigment wastewater, efficiency of DOF method combined with sequencing batch reactor (SBR). Separate SBR and DOF-PO2 method did not fulfilled the discharge limits. After combining both methods required limits were obtained. The DOF method was tested by YA-LING et. al (2010) for checking the ability of algae removal from freshwater. Small amount of ozone in feeding gas gave positive effect of algae cells agglomeration and better flotation on the top of the solution afterwards. As DOF method is new and innovative technology, many questions appear and must be answered. The aims of the research (first year of ongoing PhD study) are following: • to examine the effectiveness of a combination of two processes: micro- and nanoflotation with ozonation, • to examine technical and operational factors affecting the process (bubbles size, pH conditions, coagulant and flocculant addition), • to examine treatment efficiency of the DOF process compare to DAF process in case of treatment fracturing fluids, industrial wastewater and water containing algae, • to choose trace micro-pollutant (i.e. biocide in used fracturing fluid) and check its removal efficiency by DOF with comparison with DAF method, • to examine the potential reduction of operating costs and treatment efficiency,

WWW-YES-2012 proceedings (draft version)
66 / 175
• to research the influence of ozone on potential increase of wastewater biodegradability.
MATERIAL & METHODS Testing method Dissolved air flotation unit with the volume of 150 L (active volume) was used as testing unit. Air dispersing system was supported by micro-nano bubble pump Karyu Turbo Mixer15NPD (KTM Nikuni Pump). The pump has mixing tank for preparation of air-water feed. Ozone was generated by BNP Ozone-Generator S0Z-Y0B-10G (power 400W, ozone output 10g/h) and connected to KTM pump to generate air-ozone-water mixture. Flocculants and coagulants (Iron (III) sulfate) used in DAF process were dosed directly to the reactor.
Figure 1: Dissolved Air (DAF) and Dissolved Ozone Flotation unit scheme: 1 – Nikuni Pump, 2 – air-water
mixture injection, 3 – main flotation unit tank, 4- sludge tank, 5 – clean water tank Collection of samples After pilot tests of DAF and DOF methods, influent and effluent samples (1,0 dm3) were collected for chemical analysis. At the moment only one test was made at the fruit processing factory. The test was conducted to check-up and compare pre-treatment efficiency of DAF and DOF method and to calculate possible reductions of the cost on the biological step of wastewater treatment. Further tests (i.e. on fracturing fluids for checking micro-pollutants removal efficiency) will be made during ongoing PhD research. Chemical analysis and process parameters analysis Laboratory analysis was conducted to obtain the values of: COD, BOD5, Total Suspended Solids (TSS), pH. In further analysis other parameters will be measured: Total Organic Carbon (TOC), biodegrability, toxicity, selected micro-pollutants concentration decrease (by HPLC). Also process parameters will be measured: bubbles size (ozone mass transfer), optimum ozone concentration, process kinetics, coagulant and polymer dosage. Design of dimensions of biological treatment step ATV-DVWK method was used for dimensioning of biological step after DAF and DOF pre-treatment and show how each method influence next treatment step. The calculation was made based on organic matter removal (without nitrification and denitrification processes).
RESULTS AND DISCUSSION Fruit processing wastewater The test was made at the fruits processing factory (apples). The factory produces apple’s concentrate. The average daily wastewater flow is Qd= 1 400m3/d (wastewater from production). The plant has own mechanical-biological WWTP. However the owner wants to enhance the treatment efficiency, especially before biological step (by reduction of loadings on biology). Wastewater for analysis was taken from sewer with wastewater from production.

12th World Wide Workshop for Young Environmental Scientists WWW-YES-2012 Urban waters: resource or risks? Arcueil, France (21 – 25 May 2012)
67 / 175
The experiment procedure and results Flotation unit was fulfilled with 150L of wastewater and then flotation process was conducted for 20 minutes in each case (DAF and DOF). For DAF method iron (III) sulfate was used as a coagulant (0.3mL of iron (III) sulfate)/1L wastewater) and anionic polymer as a flocculant (2mL of polymer/1L wastewater). The kind of coagulant and flocculant and their quantity were chosen based on author’s previous experiences in this kind of industry wastewater and jar tests. In DOF method coagulant was not dosed. Instead of air-water mixture for flotation (in traditional DAF method) air-ozone-water mixture was used. Ozone was used in quantity app. 3,5g/run of DOF test. The amount of anionic polymer added was 1.5mL/L of wastewater. In table 1 are collected results from DAF and DOF tests and raw wastewater. Wastewater pre-treatment efficiency was measured for each method (DAF and DOF) twice. The results in table 1 are average from two measurements. Higher treatment efficacy was observed for DOF process compare to DAF. The COD, CODsoluble, BOD5 concentrations are lower in the case of DOF unit effluent, 33.8%, 29.3% and 34.8% respectively compare to 20.1%, 6.6% and 20.3% in case of DAF unit. Those results were used for calculation of possible exploitation costs reduction in the next paragraph.
Table 1: Parameters comparison for influent wastewater and effluent after DAF and DOF process for fruits processing industry (average from two measurements)
Parameter Unit Influent After DAF [% removal]
After DOF [% removal]
CODtotal mgO2/dm3 4 080 3 260 [20.1] 2 700 [33.8]
CODsoluble mgO2/dm3 3 310 3 090 [6.6] 2 340 [29.3]
BOD5 mgO2/dm3 2 270 1 810 [20.3] 1 480 [34.8]
TSS mg/dm3 930 310 [66.6] 510 [45.2]
pH - 9,0 8,0 8,8
The figure 2 shows colour difference between raw wastewater and wastewater after DAF treatment. The next figure (no 3) shows DAF and DOF pilot-test unit during the test in factory.
Figure 2: DAF effluent and raw wastewater during tests

WWW-YES-2012 proceedings (draft version)
68 / 175
Figure 3: Dissolved Air Flotation (DAF) and Dissolved Ozone Flotation (DOF) unit during tests Biological treatment step dimensioning and hypothetical exploitation costs reduction The design procedure was conducted to compare influence of using ozone in flotation process on biological treatment step. It led to show merits of DOF process comparing with DAF as a pre-treatment method before biological treatment. Biological step dimensions for DAF and DOF as pre-treatment step were calculated based on ATV-DVWK method. The design was made for 15°C and calculated basing on COD loading. For the air distribution system, air grid with diffusers (fine bubbles) was designed. The reactor high was assumed as H=6.0m. The results are shown in table 2.
Table 2: Biological step dimensions for DAF and DOF as pre-treatment method (calculations for wastewater temperature T=15°C)
Parameter Unit After DAF After DOF % reduction for DOF compared to DAF
Reactor size m3 3 807 3 587 5.8
Oxygen demand kgO2/h 105.2 129.0 18.5
Air demand Nm3/h 3 150 3 870 18.6
Energy demand for aeration (air blower motor power) kWh 110 130 15.4
Excess sludge production kg/d 1 816 1 648 9.3
The results obtained from ATV procedure shown significant reduction of exploitation area, oxygen (air) demand, sludge production and energy demand by using DOF instead of DAF. For the results from table 2 yearly exploitation savings were calculated. Working year was assumed as 250 days (24h/d operation) and for 1 400m3 of wastewater flow. The following savings were calculated: 21 500 €/ year – by reducing usage of iron (III) sulfate, 3 500 €/ year – by lower sludge production, 10 800 €/ year – by lower energy consumption by air blower, Obviously cost of the ozone generation must be subtracted from total savings. However the cost of ozone generation amount to only 17% of iron sulfate dosage. In total savings are calculated as

12th World Wide Workshop for Young Environmental Scientists WWW-YES-2012 Urban waters: resource or risks? Arcueil, France (21 – 25 May 2012)
69 / 175
ca. 32 000 €/ year. This value is approximated, however it gives positive and prospective sight of DOF technology and reasons for further research.
CONCLUSIONS As previous results obtained by Lee (2006), Jin (2006), Cheng (2010) and others and first experiment made by author at fruit processing plant showed promising effects, consecutive experiments must be carried on. Further laboratory research will be focused on DOF process efficiency for treatment of: fracturing fluids from shell-gas exploitation process (concentration reduction of selected micro-pollutant i.e. biocide), selected industrial wastewater (i.e. cosmetics wastewater) and water containing algae. The most important questions regard process kinetics and mechanism, factors affecting process and merits and demerits of DOF method. It cannot be omitted that there are threats which may discontinue research on DOF method. One of the major thread is organic micro-pollutants and chemical compounds transformation by ozonolysis process. There is no information about the research on this process regarding wastewater. On the beginning of nineties the similar problem appeared regarding ozonation of potable water in case of bromines. As those ions are considered to be cancerogenic many researchers focused on the formation of bromines and reaction mechanisms. Biń et al. (1999) underlined the problem and showed the further difficulties which could appear i.e. in case of modelling of bromines formation and proper technology application and design. The similar objections should be considered during DOF research in this PhD thesis. In consecutive research toxicity tests would be applied to check how the DOF process can affect wastewater’s influence on life forms. As DOF process may be used as a pre-treatment step before biological treatment, some concerns may rely the influence of residual ozone on microorganisms of activated sludge (bacteria). However the research made by LEEUWEN et al. (2009) showed curious and a bit surprising results. LEEUWEN examined ozone impact on bacteria presented in activated sludge. The research focused on ozonation as a pre-treatment method combined with biological stage and its influence on further biological treatment. From LEEUWEN research it can be seen than ozone had positive effect on microorganisms and treatment efficiency. The concentration of 16.7 mgO3/L caused proper biological treatment and increased biodegrability of onerous chemical compounds (methylene blue). Moreover the bacteria were not harmed by strong oxidant. Ozone caused selection of microorganims, but it had positive effect on the activated sludge population. Another threat or strong conviction is the price of ozone generation. It can be seen that over the years new ozone generators are manufactured. The new generators can produce up to 20% of ozone by weight (Primozone), whereas few years ago it was around 12 %. Other important factor is mentioned before micro- and nanobubble system which enables better ozone transfer into the surrounding medium (wastewater). General efficacy of DOF process was checked. Consecutive research will be done in new laboratory flotation unit designed in purpose of this PhD thesis. Synthetic fracturing fluid will be produced and then treated in DAF/DOF unit. Further laboratory test would be focused on checking process efficiency in case of removal selected micropollutants i.e. biocide, wastewater toxicity and process parameters.
REFERENCES • GOTTSHALK, C.; Libra, J.A.; Saupe, A. (2009): Ozonation of water and waste water. Willey-
WCH

WWW-YES-2012 proceedings (draft version)
70 / 175
• BELTRAN, F.J. (2004) Ozone Reaction Kinetics for Water and Wastewater systems. Lewis Publishers
• LEE, B.H.; Song, W.C.; Manna, B.; Ha, J.K (2008): Dissolved ozone flotation (DOF) - a promising technology in municipal wastewater treatment. Desalination vol 225. pp 260-273
• LEE, B. H.; Song, W.C. (2006): High concentration of ozone application by the DAF (Dissolved Ozone Flotation) system to treat livestock wastewater. Water Pollution VIII: Modelling, Monitoring and Management
• JIN, P.K.; Wang, X.C.; Hu, G. (2006): A dispersed-ozone flotation (DOF) separator for tertiary wastewater treatment. Water science and Technology, vol 53 no 9. pp. 151-157
• MATSUMO, M.; Tanaka, K. (2008): Nano-bubble size dependence of surface tension and inside pressure. Fluid Dynamics Research vol 40. pp. 546-533
• TSAI, J.C.; Kumar, M.; Chen, S.Y.; Lin, J.G. (2007): Nano-bubble flotation technology with coagulation process for the cost-effective treatment of chemical mechanical polishing wastewater. Separation and Purification Technology vol 58. pp. 61-67
• WANG, L.K.; Shammas, N.K.; Selke, W.A.; Aulenbach, D.B. (2010): Flotation Technology, Handbook of Environmental Engineering Volume 12. Humana Press, Springer Science, New York 2010
• RUBIO, J.; Souza, M.L. ; Smith, R.W. (2002): Overview of flotation as a wastewater treatment technique. Minerals Engineering 15. pp. 139–155
• EDZWALD, J.K. (2010): Dissolved Air Flotation and me. Water Research 44. pp. 2077 – 2106 • CHENG Y.L.; Yu-Chuan Juang ; Guan-Yu Liao; Shih-Hsin Ho; Kuei-Ling Yeh; Chun-Yen
Chen; Jo-Shu Chang; Jhy-Chern Liu; Duu-Jong Lee (2010): Dispersed ozone flotation of Chlorella vulgaris. Bioresource Technology 101. pp. 9092–9096
• VELASQUEZ, M.T. Orta de; Altamirano Coro, J.M. (1998): Improvement of Wastewater Coagulation Using Ozone. Ozone Science & Engineering 20. pp. 151–162
• LEEUWEN, J.H. Sridhar, A.; Harrata, A.K.; Esplugas, M.; Onuki, S.; Cai, L.; Koziel, J.A. (2009): Improving the Biodegradation of Organic Pollutants with Ozonation during Biological Wastewater Treatment. Ozone: Science & Engineering: The Journal of the International Ozone Association, 31:2, pp. 63–70
• BIŃ, A.K.; Możdżaryn (1999): Problem bromianów – współczesny stan badań oraz modyfikacje technologii oczyszczania wody. Ochrona Środowiska 3. pp. 49–56

12th World Wide Workshop for Young Environmental Scientists WWW-YES-2012 Urban waters: resource or risks? Arcueil, France (21 – 25 May 2012)
71 / 175
WWW-YES-2012 session 2: Water management
7. Modelling the Zn emissions from roofing materials at Créteil city scale - Defining a methodology
Emna SELLAMI-KAANICHE 1,2, Bernard de GOUVELLO 1,2, Arnaud Le BRIS 3, Marie-Christine GROMAIRE 2 and Ghassan CHEBBO 2
1 Centre Scientifique et Technique du Bâtiment (CSTB), 11 rue Henri Picherit, BP 82341, 44323 Nantes Cedex, France 2 Laboratoire Eau Environnement et Systèmes Urbains (LEESU), Ecole des ponts ParisTech, 6-8 Avenue Blaise Pascal, 77455 Champs-sur-Marne, France. 3 Institut Géographique National (IGN), MATIS Laboratory, 2-4 Avenue Pasteur, 94165 Saint Mandé Cedex, France (E-mail: [email protected]; [email protected]; [email protected]; [email protected]; [email protected])
Abstract Today, urban runoff is considered as an important source of environment pollution. Roofing materials, in particular the metallic ones are considered as a major source of urban runoff contamination. An accurate evaluation of contaminant flows from roofs is thus required at the city scale. This paper aims to describe the definition of an appropriate methodology for evaluating the zinc emission at the city scale. This methodology is based on combining two different methods. The first one is an automatic classification and the second one is a theoretical urban study site. In order to obtain representative data, the choice of the study site was based on the diversity of land use and the urban and social context. Finally some results and future works will be presented.
Key words Urban water; contaminant; methodology; roofing materials; runoff
INTRODUCTION Roofing materials, in particularly the metallic ones are considered as a major source of urban runoff. This observation was revealed by several research programs conducted since the 1990s (Förster, 1996; Gromaire-Mertz et al., 1999; Odnevall Wallinder, 1998). The OPUR (Observatoire des Polluants URbains en Ile-de-France) program then focused on identifying and quantifying the emission of different contaminant (Zn, Pb…) at the test-bed, roof and small urban catchment scales (Robert-Sainte, 2009). This works have been conducted in the context of TOITEAU project, in which annual metallic runoff rates at different scales (test-bed and roof) have been evaluated, for the different roofing materials commonly used in Paris and suburbs. Then, in other works (Gromaire et al., 2011; Le Bris et al., 2009), the previous results have been extended to larger special scales by using roof surface areas data obtained from aerial photographs and image classification software. The classification method based on aerial images was applied to an urban catchment with 2.25 km² of surface. The obtained results showed about 75 to 80% of well classified roofing surfaces.

WWW-YES-2012 proceedings (draft version)
72 / 175
Nevertheless, classification method presents some limitations especially in terms of confusion between different classes (eg: zinc and slates at light). The goal of this paper is to describe the methodology defined to evaluate the zinc emitting surfaces at the city scale. On the one hand, this methodology is based on applying the automatic classification method. In the other hand, we propose to overcome the limitations of the classification method by adding further information. These informations are developed by another work which seeks to understand the key factors leading to the choice of roofing materials on construction projects and defining the related performance indicators. To validate and apply this methodology in other cities, a complex representative site had to be chosen. In this paper, we firstly describe the classification method and its limitations. Then, the different criteria of the chosen city will be presented. Finally, we present the proposed solutions and discuss the awaited performances.
METHODS Our work aims at evaluating the zinc roofing emitting surfaces at the city scale. However, this task seems difficult because of the diversity and the very large number of buildings. So a specific methodology has to be developed to identify and evaluate the different roofing material at the city scale. Previous studies (Gromaire et al., 2011; Le Bris et al., 2009) have evaluated the surface of zinc at the scale of a small urban catchment by using a classification method based on aerial images. They have shown about 25% of misclassification which is due to some limitations. In fact, some classes have similar radiometry, so it becomes difficult to distinguish between them (eg: zinc and slates at light). Then, roofing materials in shadow are misclassified; this is the case of red tiles in the shadow which are classified as brown tiles. In addition, radiometry greatly varies in the same class. If we want to apply this method at the city scale, classification errors may be increased because of the larger scale and the different limitations. As illustrated in Figure 1, we propose to combine the automatic classification method with a theoretical approach based on a study of the site (history, urban land use, social characteristics…). This approach aims to define criteria to interpret the results of the classification method. Therefore we can improve the results by adding further informations, for example in individual habitat we know that zinc as roof material is rarely used. So if the classification result in this area gives zinc, there is an important probability that it is actually slate roof. To validate and to generalize the methodology we need to apply it to a significant complex urban area which will be chosen according to different criteria which will be described later.

12th World Wide Workshop for Young Environmental Scientists WWW-YES-2012 Urban waters: resource or risks? Arcueil, France (21 – 25 May 2012)
73 / 175
Figure 2 : Methodology to identify and evaluate the different roofing material at the city scale
Classification method As mentioned earlier, the chosen method is the classification of roofing materials from aerial images using the AVET (Automatic Vegetation Extraction Technique) tool (Trias-Sanz, 2006). This tool was developed to extract information on vegetation areas from aerial images. Then it was adapted by (Le Bris, 2009) for urban roof classification. In fact, six classes corresponding to the following kinds of roofs were defined: zinc sheetings, slates, red tiles, brown tiles and flat roofs. Before classification, some treatments are undergone on the images: segmentation and computing building mask.
Data: the ortho-images
The identification of roofing materials will be based on the analysis of aerial photography. These latter, will inform us about the materials used on roofs with their radiometry and their projected surfaces. Aerial images have undergone some treatment to be transformed into orthorectified images. Indeed, in these photos the deformation due to relief and the inclination of the axis of the shooting have been corrected (Lafont et al., 2003). The images come from IGN’s (Institut Géographique National) ortho-image database named BD-ortho, which contains digital colour ortho-photos with three or four (red–green–blue–near infrared) bands and with a 50 cm ground resolution.
Method steps
The classification method consists in the following steps: - Segmentation: First of all, the ortho image is segmented into homogeneous radiometric regions. This is achieved thanks to the multi-scale segmentation method by PYRAM and SXS tools (Guigues et al., 2006; Guigues, 2003). - Derived channels: The classification process is combined with the computing of derived channels. In fact, derived channels have been calculated from the original (red–green–blue–near

WWW-YES-2012 proceedings (draft version)
74 / 175
infrared) bands of the ortho-image. These channels can be radiometric channels computed as combinations of the original bands (such as channels of another color space or indices as the well known ndvi computed from red and near infrared bands to discriminate vegetation) or texture channels. Therefore, the choice of good associations of channels is important to obtain good classification results. Different tests should be made to get the best association of channels.
- Building mask: In this classification method, we focalise only on buildings, so hiding non buildings objects in the ortho-images is needed. In our case, a mask named BD-topo (database for Topographic Information comes from IGN) is used to focalise in buildings. This operation has limitations. In fact, the limits of buildings in BD-topo don’t overlap exactly the limits of buildings in BD-ortho (see figure 2). In some cases, the mask didn’t include the entire roof, or it includes a small part of roads. This problem is more important for the highest buildings for which the shift between the roof on the ortho-image and the corresponding database building object is sometimes important.
Figure 3 : The building mask don’t overlap exactly the limits of buildings in BD-ortho
- Classification: The segmented regions are then classified by the AVET classification tool (Trias-Sanz et al., 2005 and Trias-Sanz, 2006). This tool works in tow steps. First model estimation from training data captured by an operator will be computed: for each class of material (zinc, tile…), an n-dimensional histogram of the radiometry of the class is calculated. Then AVET estimate the best statistical distributions (such as gaussian, laplacian laws but also histograms (raw or obtained by kernel density estimation) to fit to the radiometric histogram. Finally, the best model is selected thanks to a Bayes information criterion (Schwarz, 1978) enabling to choose an alternative between fit to data and model complexity. Secondly classification will be applied: the image can then be classified according to the statistical model of the radiometry of the different classes. Several per pixel and per region classification algorithms are proposed (Trias-Sanz, 2006). In the present work, a ‘maximum a posteriori’ (MAP) classification algorithm is used because it makes possible to take into account external knowledge as prior probabilities (this method will be described in the proposed solution section). The label co(R) given to a region R is its most probable class according to the model previously estimated (and to prior probabilities). Hence, with the MAP algorithm, c0(R) is the class c that maximizes the following function:
Equation 1 : )(/1
_mod__ ))()(().)(( RCard
Rspixelelcradiometriknowledgeprior cscsIPcRcP == ∏
∈
with I(s) standing for the radiometry vector of pixel s, c(z) meaning region or pixel “z’s class” and P(c(z) = c) standing for the probability for pixel or region z to belong to class c. Card (R) the number of pixels in the region. -Surfaces computing: for each class its surface is calculated by computing the number of pixels and multiplying them by the resolution of the image.

12th World Wide Workshop for Young Environmental Scientists WWW-YES-2012 Urban waters: resource or risks? Arcueil, France (21 – 25 May 2012)
75 / 175
All of these steps have been applied for the city selected and figures were illustrated in results paragraph.
Problems and limits The classification method of roofing materials from aerial image is perturbed by several phenomena causing misclassification (about 20% to 25% of errors at the scale of a small catchment). Indeed, the information provided by the aerial images is not sufficient to classify and separate the different classes of roofing materials at the city scale.
Shadows/Illumination effect
The superstructures of roofs or higher buildings overshadow the lower ones. In this case, red tiles in the shadow are classified as brown tiles and zinc plates in shadow are classified as slate.
Classes with similar radiometry
Some classes have similar radiometry. Therefore it becomes difficult to distinguish between them even by a human operator. These are the case of brown tiles and slates, some red tiles and flats roofs and also zinc sheets and sunny slates.
Radiometric variations within a class
This variation in radiometry is due to several factors: - Industrial: the material could undergo surface treatments which changes the shade of its
color. - Age: the material is exposed to the atmosphere (eg: the corrosion for metals) which
changes its surface characteristics. - Shadow: shadow could influence the color of the material and then the radiometry in the
image.
Resolution of the ortho-images
The resolution of the images is 50 cm. Therefore, it’s difficult to use texture channels. Indeed, every roofing material is characterized by a specific texture, for example zinc is used as plates. However tiles are small pieces posed one against the other. These textures cannot be detected in the 50 cm available aerial image.
Age of buildings
The previous studies have shown that the age of the material have an important influence in the emission of contaminants. So it becomes necessary to introduce this information in our work. However, the aerial image cannot or weakly inform us about the age of roofs.
Proposed solution
Shadow/No shadow class
To obtain a correct classification of the image, roofs in shadow must be taken into account. So, we can correct the radiometry in shadows areas after having detected them. However, this correction is limited by several uncertainties:
- The ortho-images have undergone a process of radiometric treatments as described in the previous section. Therefore there is a loss of information in shadow areas.
- The resolution of the image is taken at 50 cm.

WWW-YES-2012 proceedings (draft version)
76 / 175
- The accuracy of 3D urban model at the selected city is not available.
In this case, a method was proposed and successfully used in a previous study (Le Men et al., 2002). This method has shown that radiometry of a class will be completely different in the shadow and light. Simpler solution have been proposed (Le Bris et al., 2008) which consist in dividing each class “c” into two classes “c in shadow” and “c in light”. So, two distinct radiometric models are obtained for each class of roofing material from the first part of training data in AVET tool.
Introduction of external knowledge in the classification process
The study made by (Le Bris et al., 2008) has shown that it is possible to improve the classification results by taking into account knowledge from external sources. First, external informations should be identified by studying the urban characteristics of the city which influence the use of roofing materials. In this study many sources are used: urban documents, land use database, planning method, history documents, conducting interviews with actors (master work, architect...)... Secondly, these informations will be used as prior probabilities in the ‘maximum a posteriori’ (MAP) classification algorithm. With this classification method, the label co(R) given to a region R is the most probable class according to the radiometric model previously estimated and to prior probabilities. Hence, co(R) is the class c that maximises the following function: Equation 2 : With I(s) standing for the radiometry vector of pixel s (I(s) is an n-dimension vector with n standing for the number of channels used for the classification), c(z) meaning class of the region [or pixel] ‘‘z’’ and P(c(z)= c) standing for the probability for region [or pixel] z to belong to class c. The ai terms stand for weight parameters balancing the different prior probability sources.
Study site To validate our methodology we need to choose a complex site in which we try to have the different aspects of the city. In fact, the city should present a sufficient urban diversity so as to make it possible to apply the methodology to other cities. Therefore our choice will be based on the following criteria:
- Diversity: the site should represent urban, functional and social diversity. We should have different type of habitats (houses, collective habitats, and social habitats), different activity areas (economic, industrial, and commercial) and an old downtown.
- “Sufficient but reasonable” size: the site should have between 50,000 and 100,000 inhabitants. This makes it easier to identify and study the various aspects of the city during the three year of my thesis.
- Availability and accessibility of data: in our work we need different type of data: urban, social, annual contaminant runoff unit rates… Therefore it is important to ensure their availability and also their accessibility in the study site. In addition, the site should be easily accessible from our laboratory in order to investigate on it (eg: to make survey).
PRIMARY RESULTS In this part the different tests that will be applied in our methodology and the selected city are described.
)))()((.())((( )(/1
_mod_
_inf__
RCard
Rspixelelcradiometri
ai
sourceormationexternali
cscsIPcRcP i === ∏∏∈

12th World Wide Workshop for Young Environmental Scientists WWW-YES-2012 Urban waters: resource or risks? Arcueil, France (21 – 25 May 2012)
77 / 175
Selected appropriated city The selected city is Créteil (Department 94) located about 10 km from Paris (France). Créteil has 89 304 inhabitants (www.insee.fr) distributed over 11.5 km² which represents a reasonable size. This city is presented in figure 2. Créteil is divided into four major historical urban areas: Old center, Mont Mesly, New Creteil I, New Créteil II as illustrated in figure 2.a. Each area presents a specific urban organization which depends especially of the period of construction. The recent zone is number four. Figure 2.b shows the interesting urban and functional diversity of Créteil.
Table 2 : Créteil characteristics
Figure 4: (a): The four urban areas of Créteil (source PLU); (b): The different land uses (source: IAU-IDF)
In fact, we can see different land use represented by different color: industrial activities located nearby (violet color), health equipment (light blue) different types of habitat (collective: red color, individual: yellow color). The land use is not homogeneous in the different urban area of the city. For example the Old center mainly consists of individual habitat. However Mont Mesly is composed of collective habitat. This distribution is mainly due to historical factors. In addition, Créteil is easily accessible from the laboratory. Finally contaminant runoff unit rates are available at this site (Robert Sainte, 2009).
Area Population (in 2008) Location Créteil
11, 5 km² 89 304 inh 10 km from Paris (France)

WWW-YES-2012 proceedings (draft version)
78 / 175
Tests In the classification method, different association of channels will be tested. Then we will apply the classification process to each historical urban area of Créteil (in particularly for each area we get its training data). This operation has double aim. First, we will obtain roofing material classified with their ages with taking into account possible renovation area. Secondly, we can improve results by decreasing the radiometric variations within a class knowing its age. In fact, the age of the material influences its color and then the radiometry in the image. Finally, external informations will be introduced to the classification process by testing different fusion data methods and then their performances will be tested. The following figures represent the first results of applying only classification method using Créteil city images. In figure 4 we can see the segmentation of roofs in different regions corresponding to the different classes of materials. After segmentation, a building mask was computed as we can see in figure 5: the BD-ortho associated to its BD-topo. Finally, classification was applied and we get the results in figure 6. In this latter, every color represent the material assigned by AVET classification. These first results present misclassification. For example, as we can see in figure 6, a same slate roof was classified into three materials: slate, flat and shadow area. This is due to the shadow problem.
Figure 5 : Example of segmentation
Figure 6: Left: BD-ortho; Right: BD-topo
Figure 6: Example of results obtained in Créteil

12th World Wide Workshop for Young Environmental Scientists WWW-YES-2012 Urban waters: resource or risks? Arcueil, France (21 – 25 May 2012)
79 / 175
Introduction of external knowledge in the classification process In this part, the possible external knowledge to take into account in the classification process is described. A recent work (which is still under study) aims at understanding the procedure of selecting roofing materials in a given building by studying the history, planning method, land use… at Créteil city. Interviews were conducted with various actors and stakeholders (eg: master of work, contracting authority, architect). This work seeks to identify the decision maker and to understand the key factors leading to the choice of roofing materials on construction projects. The primary results of this study have shown that the choice of roofing materials depends especially on the architect. Nevertheless, this actor is subjected to many constraints: laws constraints, aesthetics, type of building (equipment, house, tower...), the context and the period of the construction, the cost... In this context, it is proposed to take into account the ages of buildings and the land use in our classification. On the one hand, zinc emission depends on the age of roof. On the other hand, the use of roofing material depends on the land use. In fact, zinc is mostly used in collectives habitats and rarely in individual ones.
Informations related to the land use
For each land use, probability of presence of each class of roofing materials will be calculated: zinc plates, slates, red tiles, brown tiles and flat roofs. These probabilities will be integrated in the MAP algorithm. In our classification method a land use database is employed and it comes from IAU_IDF (Institut d’Aménagement et d’Urbanisme de l’Ile-de-France). These informations will be integrated in AVET tool in addition to the building mask. Indeed, we use a mask of land use.
Informations related to the ages of buildings
Créteil city is divided into four major historical urban areas. The idea is to subdivide the image of Créteil into different areas with their age. Then, we obtain the surfaces of different classes versus their ages. Once validated, this approach allows us to compute the zinc plates surfaces versus their ages and the land use, and then the zinc runoff rates will be use to obtain the emission of zinc contaminant from zinc plates at Créteil city scale.
CONCLUSION In conclusion, to quantify zinc emitting surfaces at the city scale, we have defined a methodology based on combining two different methods. The first one is an automatic classification method based on using AVET tool. At a small urban catchment, this automatic classification has shown some limitations. Therefore, to apply this method at the city scale, we have proposed to integrate a second theoretical method based on an urban study of the selected city. Thus, results will be improved. The selection procedure was based on different criteria to validate and generalize the methodology developed in other cities.
REFERENCES • Förster J., (1996). Patterns of roof runoff contamination and their potential implications on
practice and regulation of treatment and local infiltration. Water, Science and Technology", 33 (6):39 - 48.

WWW-YES-2012 proceedings (draft version)
80 / 175
• Gromaire M.C., Robert-Sainte P., Bressy A., Saad M., de Gouvello B. and Chebbo G., (2011). Zn and Pb emissions from roofing materials-Modelling and mass balance attempt at the scale of a small urban catchment. Water Science and Technology, 63 (11):2590-2597.
• Gromaire-Mertz, M., Garnaud, S., Gonzalez, A. and Chebbo, G., (1999). Characterisation of urban runoff pollution in Paris. Water, Science and Technology, 39 (2):1-8.
• Gromaire-Mertz M. C., (1998). La pollution des eaux pluviales urbaines en réseau d'assainissement unitaire : caractéristiques et origines. Thèse de Doctorat -Sciences et techniques de l'Environnement: Ecole Nationale des Ponts et Chaussées, 506 p (+ annexes).
• Guigues, L., Cocquerez, J.-P. and Le Men, H., (2006). Scale-sets image analysis. International Journal of Computer Vision, 68 (3):289-317.
• Guigues L., (2003). Modèles multi-échelles pour la segmentation d’images. École Doctorale Sciences et Ingénierie de l’Université de Cergy-Pontoise, 302.
• IAU-IDF: Institue d’aménagement et d’urbanisme de l’Ile-de-France http://www.iau-idf.fr/ • Lafont C. and Troispoux G., (2003). Orthophotographies, définition et mise en oeuvre appliquée
à la BD ORTHO de l'IGN. Edition du Certu (n°149), 122p. • Le Bris A. and Robert-Sainte P., (2009). 'Classification of roof materials for rainwater pollution
modelization'. • Le Bris A. and Boldo D., (2008). Extraction of land cover themes from aerial ortho-images in
mountainous areas using external information. The Photogrammetric Record, 23 (124):387-404. • Le Men H., Trévisan J. and Boldo D., (2002). Automatic extraction of landcover themes on
digital orthophotos in mountainous area for mapping at 1/25k. International Archives of Photogrammetry, Remote Sensing and Spatial Information Sciences, 34 (2):331-337.
• Odnevall Wallinder I., Verbiest P., He W., Leygraf C., (1998) The influence of patina age and pollutant levels on the runoff rate of zinc from roofing materials. Corrosion Science 40:1977-1982.
• OPUR : Observatoire des Polluants URbains en Ile-de-France, http://leesu.univ-paris-est.fr/opur/. • PLU : plan local de l’urbanisme : http://www.ville-creteil.fr • Robert-Sainte P., (2009). Contribution des matériaux de couverture à la contamination métallique
des eaux de ruissellement. École doctorale Ville et environnement. Paris: Université Paris-Est, 335 pp.
• Schwarz G., (1978). Estimating the dimension of a model. Annals of Statistics, 6 (2):461-464. • Trias-Sanz, R., (2006). Semi-automatic high-resolution rural land cover classification. Paris:
Université René Descartes-Paris 5, 344. • Trias-Sanz R. and Boldo D., (2005). A high-reliability, high-resolution method for land cover
classification into forest and non-forest. Proceedings of the 14th Scandinavian Conference on Image Analysis. Lecture Notes in Computer Science. Springer, Heidelberg: (Eds. H. Kalviainen, J. Parkkinen & A. Kaarna), 831-840.
• www.insee.fr.

12th World Wide Workshop for Young Environmental Scientists WWW-YES-2012 Urban waters: resource or risks? Arcueil, France (21 – 25 May 2012)
81 / 175
8. Long-Term performance of stormwater infiltration facilities
Ahmed Mohammed AL-RUBAEI
Urban Water, Department of Civil, Environmental and Natural Resources Engineering, Luleå University of Technology, 971 87 Luleå, Sweden Mail: [email protected] , Phone: +46 (0)920 492353
Abstract Porous pavements are an effective stormwater management technology. However, this technology suffers from clogging over time, thereby a decline in infiltration capacity. This study investigated the infiltration capacity of clogged porous asphalt pavements in a housing area in Luleå and Haparanda, northern Sweden and also investigated the effect ofvacuum cleaning toretrieve the infiltration capacity of these pavements. The infiltration capacity of the two pavements was measured using replicate double ring infiltrometer tests before and after cleaning of the clogged asphalt with an industrial vacuum cleaner/sweeping truck. The results of this study showed that the porous asphalts had a substantial decrease in the infiltration capacity. Additionally, the results of the tests in Luleå showed that vacuum cleaning had the ability to recover the infiltration capacity of the porous asphalt while in Haparanda no effect was shown. Furthermore, it was shown that the long-term behavior of the infiltration capacity depends largely on the street maintenance, thus regular maintenance is crucial to counteract clogging.
Keywords Clogging; drainage; infiltration capacity; porous asphalt; stormwater harvesting; vacuum cleaning
INTRODUCTION Urbanization causes increased stormwater discharges due to increase in impervious surfaces, thereby less water infiltrates and more runs off (Walsh et al., 2005).As a consequence, stormwater is conveyed via sewers (combined or separated sewer systems) (Butler and Davies, 2004); these systems are designed to move stormwater as rapidly as possible towards a discharge point, either a watercourse or soakaway (Marsaleket al., 1993). Urban stormwater is a major issue due to high peak flows and large volumes as well as contamination with e.g. sediments, nutrients, heavy metals and hydrocarbons (Ellis and Marsalek, 1996); this involves a higher risk of flooding and high flows in the receiving waters and furthermore, discharge of pollutants (Walsh, 2000). Urban stormwater harvesting by using water sensitive urban design (WSUD)concepts is an effective solution to reduce peak flows and large volumes, and also an alternative water supply (Fletcher et al., 2008).Stormwater infiltration systemssuch as porous pavements, are one of water sensitive urban design (WSUD)concepts, can be applied as an alternative for stormwater managementto minimize the negative impacts of conventional urban drainage systems on the urban environment (Chocat et al., 2007; Lindsey et al., 1992). They have the ability to efficiently control runoff volumes and flows, reduce or avoid downstream flooding, recharge natural groundwater, and remove pollutants (Brabec et al., 2002; Brattebo and Booth, 2003; Shackel, 2010).They are usually more cost effective than conventional drainage pipe systems (Brown, 2003; Burton and Pitt, 2002).

WWW-YES-2012 proceedings (draft version)
82 / 175
Studies have found that permeable pavements provide as much as 70% to 80% of annual rainfall to recharge groundwater (Yong et al., 2011).However, as with many other infiltration systems, the main threat for the long-term performance of porous pavements is their tendency to become clogged if they are not maintained regularly, clogging is a process accumulation and deposition of sediments on the system surface over time (Dietz, 2007), and lack of regular maintenance actions has been shown (Lindsey et al., 1992). Thus, the objectives of this study were to investigate the long term hydraulic performance and the potential of vacuum cleaning to recover the infiltration capacity of two clogged permeable asphalts in northern Sweden, which have been in service for 17 and 24 years. Furthermore, reasons for the clogging are identified and the efficiency of vacuum cleaning is quantified.
BACKGROUND Water sensitive urban design (WSUD) techniques are an alternative approach to conventional urban drainage systems (Dietz, 2007). There are various WSUD techniques which can be used as the long term solution to reduce stormwater runoff and peak flows, improve water quality, and integrate stormwater treatment into landscape (Dietz, 2007; Lindsey et al., 1992; Waterways, 2006).Furthermore, they can be used for stormwater harvesting and reuse (Beecham, 2011; Philp et al., 2008).Common techniques are green roofs, swales, buffer strips, sediment basins, permeable pavements, infiltration measures, and bioretention systems (Dietz, 2007;Fletcher et al., 2008;Lindsey et al., 1992; Waterways, 2006). Porous asphalt is one type of permeable pavements (Dietz, 2007).Porous asphalt (also known as open-graded asphalt) is standard hot-mix asphalt without sand or fines in it (Dietz, 2007), thus containing open pores which allow water to percolate through it (Roseen et al. 2012). Typical porous asphalt structures consist of a surface course (porous asphalt) over a top filter course (crushed stone), a reservoir course (a stone recharge bed), and a nonwoven geotextile layer, all constructed on a permeable subgrade base (Jackson, 2003). The thickness of porous asphalt is typically 5 to 10 cm, having a minimum of 16% air void. The filter course is 2.5 to 5 cm thick. It provides filtration and also stability for the reservoir course layer during application of the asphalt mix. The reservoir layer thickness depends on water storage requirements and/or frost depth whichever requires the greater thickness. Typically it has a minimum depth of approximately 25 cm. It serves to temporarily store stormwater while it slowly drains into the underlying soil. A geotextile layer separates the structure from the underlying soil and prevents the migration of fines into the bed (FHWA, 2004; NAPA, 2008). In general, porous asphalt pavements are commonly used on parking lots (Roseen et al. 2012), driveways, sidewalks, bike paths, playgrounds, tennis courts and also in residential and commercial areas and other similar uses (Scholz and Grabowiecki, 2007; UNHSC, 2007). Despite permeable pavements have many environmental benefits; the most concern issue is clogging (Dietz, 2007; Lindsey et al. 1992; Siriwardene et al. 2007). Studies have shown that most of the failures due to construction, a lack of maintenance (Brown, 2003; Lindsey et al. 1992) and poor design (Yong et al., 2011).In Maryland, USA in 1986, Lindsey et al. 1992 conducted a field survey of stormwater infiltration facilities, observed that 71% of 14 of the porous pavement facilities were not functioning due to clogging and lack of maintenance. The survey was repeated in 1990 and found that the porous pavement facilities declined the most which indicates a lack of maintenance. A laboratory and field investigation (Pezzaniti et al. 2009) showed influence of clogging on the effective life of three types of permeable pavements; found that the effective life relies on the number of years in operation. A laboratory study of three permeable pavement systems (porous asphalt is one of them) by (Yong et al., 2011)investigated rate of clogging and treatment efficiency of key stormwater pollutants,showed that regular maintenance is very important to avoid clogging. (Balades et al. 1995) showed that clogging occurs in the upper layer of the system surface (2 cm) which impede access water

12th World Wide Workshop for Young Environmental Scientists WWW-YES-2012 Urban waters: resource or risks? Arcueil, France (21 – 25 May 2012)
83 / 175
through.A field study by (Borgwardt, 2006) to investigate the infiltration performance of permeable concrete block pavement. The author found that the infiltration capacity is prone to a decline over time due to clogging of the system.
MATERIALS AND METHODS Site description In this study, two residential streets located in northern Sweden were investigated, one in Luleå and the other one in Haparanda. Both streets are covered with porous asphalt (Figure 1) underlain by a coarse macadam layer. Field measurements for this study were conducted in May 2011 after snowmelt. The temperature at the sampling rounds was approximately between 10 and 15°C. Two measurement/sampling rounds were conducted before and after vacuum cleaning of the road.
Figure 1. Asphalt cores sampled at Kockvägen, Luleå (left) and Åkergatan, Haparanda (right). Luleå site The first road (Kockvägen) is located in a housing area in the outskirts of Luleå. It was constructed in 1993/94. This site has previously been described by Stenmark (1995) and Bäckström (1999). The porous pavement structure of the layers is illustrated in Figure 2. The initial porosity (at time of construction) of the porous asphalt was 15-20%. A drainage pipe was placed in the sub-base to allow drainage of the infiltrated water. The coarse material used in the sub-base consists of macadam and blast furnace slag; this layer had a porosity of 35-40%. A geotextile was put between the fine soil layer and the macadam layer. The porous asphalt had porosity 18% during construction. During each winter, fine gravel (2-4mm) is applied two to four times (depending on the weather conditions) to the road surface as an anti-slipping agent. The gravel is removed with a mechanical sweeper each spring after snowmelt (approximately in May). No de-icing salt is used. To maintain the infiltration capacity, initially the porous asphalt had been cleaned regularly by vacuum cleaning. However, during at least the last five to six years no vacuum cleaning was carried out which means that maintenance to sustain the infiltration capacity of the porous pavement was not conducted. The infiltration capacity of the asphalt was evaluated shortly after construction of the road by Stenmark (1995) and after about two years of operation by Bäckström and Bergström (2000). Stenmark (1995) measured the initial infiltration capacity using asphalt test pieces (0.4 x 0.4 m) which were cut out from the field study site. The mean infiltration capacity was 290 mm/min at room temperature and 130 mm/min at a temperature between -1.1 and -1.9°C. Bäckström and Bergström (2000) used the same method to investigate the infiltration capacity during a

WWW-YES-2012 proceedings (draft version)
84 / 175
simulated snowmelt period after about two years of operation. The infiltration capacity at +20°C was 19 mm/min which was reduced close to the freezing point to 7.4 mm/min (Table 1).
Figure 2. Construction of the porous pavement (Bäckström, 1999).
Haparanda site The second road is located in Haparanda (Åkergatan). In autumn 1987, the road was repaved with porous asphalt;a 70 to 100-cm thick sub-base layer was included below the porous asphalt layer (30-cm). The groundwater level was varying 1.75 to 2.70 m beneath the natural soil (silty loam). The porous asphalt had a porosity of 18 %, the macadam-layer from 20 to 40 %. A layer of geotextile was placed over the subgrade allows the water to drain into the natural soil and blocks soil particles from moving into the sub-base layer (Figure 2). Each winter, a sand mixture (0-6 mm, mixed with 2 % road salt) is applied on the road surface as an anti-slipping agent (5-10 times each winter depending on the weather conditions). After snowmelt in spring, similar to Luleå, mechanical sweeping is used to remove the sand from the asphalt. Besides that mechanical sweeping in spring, no maintenance measures were conducted to sustain the infiltration capacity; the asphalt was never cleaned by vacuum cleaning. Gyllefjord and Kangas (1989) measured the infiltration capacity in laboratory by using test pieces (0.4 x 0.4 m) comparing new asphalt from Åkergatan with asphalt which had been exposed to artificial sand applications. The infiltration capacity was 470 mm/min for new asphalt (Table 1). The porosity of the porous asphalt was around 17.9%.
Table 1.Measured infiltration capacities of (0.4 x 0.4 m) porous asphalt of Luleå and Haparanda. Infiltration Capacity (mm/min) Site Age (year) +20°C 0°C -1.5°C Reference
0 290 130 Stenmark (1995) Luleå 2 19 7.4 Bäckström, Bergström
(2000) 0 470 Haparanda 1.5 7 - 12
Gyllefjord, Kangas (1989)
Infiltration measurements In 2011, replicate (n = 3) infiltration capacity measurements were conducted at three locations in Luleå (L1, L2 and L3) and two sites in Haparanda (H1 and H2). The three locations in Luleå (L1, L2 and L3) were chosen since they represent different traffic conditions. Location L1 lies at the intersection of two roads; this area is exposed to relatively high traffic and receives additional stormwater runoff from the entering road with conventional pavement. Location L2 is located in

12th World Wide Workshop for Young Environmental Scientists WWW-YES-2012 Urban waters: resource or risks? Arcueil, France (21 – 25 May 2012)
85 / 175
a dead end street; this zone has limited traffic and is rarely used as parking. The third location L3 was chosen to be in the middle of the road representing conditions for ordinary traffic load like transit and parking. The two locations in Haparanda, H1 and H2, were chosen randomly representing typical conditions along the street. Double ring infiltrometers were used to measure the infiltration capacity at the five locations before and after vacuum cleaning. Each test included measurements with three replicate infiltrometer sets that were placed on the asphalt within a distance of approximately 1 m. The three infiltrometer sets were sealed to the asphalt with plumber’s putty. The outer ring was filled with water to control the sealing. Then water was added to the inner and outer ring to a height of approximately 5 to 10 cm. The initial water level in the inner ring was recorded at time zero and then the water level was logged every 2-10 minutes depending on the infiltration rate. The tests were completed when the infiltration rate stayed constant or almost reached zero.
Vacuum cleaning In between the two infiltration measurement rounds, the roads were vacuum cleaned using an industrial vacuum cleaner/sweeping truck from BDX Företagen AB. This technology is recommended as a maintenance option for porous asphalt (Dietz, 2007). Vacuum cleaning was conducted once in the sampling areas. The roads were not cleaned with a mechanical sweeper between snowmelt and vacuum cleaning since there was not much fine gravel or sand on the roads given the beneficial weather conditions during the winter 2010/11.
Data Analysis An analysis of variance (ANOVA) was used to compare the performance of porous asphalt in both Kockvägen and Åkergatan with respect to infiltration capacity. The infiltration capacity data after vacuum cleaning were log transformed to have normal residuals with constant variance. A paired t-test was used to determine whether there was a statistically significant influence of the vacuum cleaning on infiltration capacity. The infiltration capacity data in Åkergatan after vacuum cleaning did not consist of normal residuals with constant variance, and a suitable transformation for the data did not exist. As a result, a nonparametric Wilcoxon signed rank test was used to evaluate differences among the locations. Furthermore, individual value plots were created for infiltration capacity measurements to compare between them before and after vacuum cleaning. All statistical calculations and plots were computed with the software MINITAB® 15. For all statistical analysis, significance was accepted at an α-level of 0.05.
RESULTS Infiltration Capacity The infiltration capacity at all sites was comparably low with mean infiltration capacities all being below 1.0 mm/min (Table 2). Thus, the long term performance of the porous asphalts on both streets was insufficient since severe clogging had occurred. The results obtained were compared to previous studies obtained by Stenmark (1995) and Bäckström and Bergström (2000) a rapid decrease in infiltration capacity can be noticed in both sites. In Kockvägen, Stenmark (1995) estimated the initial infiltration of 290 mm/min while Bäckström & Bergström (2000) observed a far lower infiltration capacity of 19 mm/min after approximately 2 years of operation. In Åkergatan, Gyllefjord and Kangas (1989) measured the infiltration capacity of 470 mm/min for new unused asphalt. A comparison of the five sites shows that the asphalt at L2 has the highest mean infiltration capacity (0.73±0.25 mm/min), while the locations H1 and H2 have the lowest infiltration capacity (0.13and 0.3 mm/min), (Table 2 and Figure 2). This difference was statistically

WWW-YES-2012 proceedings (draft version)
86 / 175
significant (One-way ANOVA; p=0.016). However, given the measurement accuracy and the generally very low infiltration capacity, this statistical difference should not be overestimated and is practically negligible.
Table 2. Mean infiltration capacities for all sampling sites before and after vacuum cleaning (VC) and p-value of the paired t-test.
Infiltration Capacity (mm/min) Site
Before VC After VC
P-Value Paired t-test
L1 0.43 ± 0.21 2.37 ± 1.65
L2 0.73 ± 0.25 7.00 ± 2.00
L3 0.33 ± 0.15 1.07 ± 0.31
AV. 0.50 ± 0.26 3.48 ± 3.00 0.014
H1 0.13 ± 0.06 0.13 ± 0.06
H2 0.30 ± 0.10 0.10 ± 0.00
AV. 0.22 ± 0.12 0.12 ± 0.04 0.178
Effect of Vacuum Cleaning Vacuum cleaning had a beneficial effect on the infiltration capacity in Luleå which increased substantially; mean infiltration capacities varied between 1.1 and 7.1 mm/min after cleaning (Table 2) and were statistical significant higher than the initial ones (paired t-test; p=0.014) and the highest mean infiltration capacity was observed for site L2 (dead end street with very little traffic). In contrast to Luleå, in Haparanda the infiltration capacity remained at around 0.12 mm/min also after vacuum cleaning (Table 2 and Figure 2). This difference was statistically significant (One-way ANOVA; p=0.000). Although the improvement of the infiltration capacity after vacuum cleaning in Luleå, it was still far lower than the initial infiltration capacity after construction (290 mm/min; Stenmark 1995) and after approximately two years of operation (19 mm/min; Bäckström and Bergström 2000).
H2H1L3L2L1AfterBeforeAfterBeforeAfterBeforeAfterBeforeAfterBefore
9
8
7
6
5
4
3
2
1
0
Infil
trat
ion
Cap
acit
y (m
m/m
in)
Figure 2. Individual value plot of infiltration capacity before and after vacuum cleaning
DISCUSSION Location L1 had nearly a similar infiltration capacity to location L3 because both locations were located in main traffic areas, whilst location L2 showed a substantial increase in the infiltration capacity among the locations after vacuum cleaning since the location was located in a low

12th World Wide Workshop for Young Environmental Scientists WWW-YES-2012 Urban waters: resource or risks? Arcueil, France (21 – 25 May 2012)
87 / 175
traffic area (dead-end street). Bean et al., (2007) and Chopra et al., (2010) have observed increased infiltration capacities after maintenance. However, the streets investigated in this study are considerably older than those evaluated in the cited studies. The infiltration capacity of the locations H1 and H2 was nearly similar because they have identical conditions with respect to street's age and maintenance. The different results in Luleå and Haparanda might be due to a range of factors. The different age of the two roads might have been influenced the results.Research findings by (Borgwardt, 2006) showed that the infiltration capacity of permeable pavements decreases with the increasing age. At the University of Guelph, a field study by (Gerrits and James, 2002) observed that the infiltration capacity of the permeable pavers was installed in 1994 decreases with age and increasing average daily traffic. Additionally, the de-icing material and its application rate each winter differ between Luleå and Haparanda. The finer material and more often applications in Haparanda might have supported clogging since a higher amount of fine particles was available to intrude and thus clog the fine pores. A study conducted by Bean et al., (2007) found that intrusion of fines can significantly support a decrease of infiltration capacity. Further, an important factor is the lack of maintenance in Haparanda, while in Luleå the road was swept after each winter and at least vacuum cleaned occasionally (even though not during the last years), in Haparanda only mechanical sweeping was conducted.Surely these facts have contributed to the lower infiltration capacity and the non-effectiveness of vacuum-cleaning in Haparanda. Regular maintenance and adjusted winter maintenance may support the infiltration ability of porous asphalts (Dietz, 2007; Lindsey et al., 1992). By comparison, in coastal New Hampshire, a field study on a parking lot which was constructed in October 2004 with a 10-cm layer of porous asphalt having a porosity of 18% over 10-cm choker course of 19 mm of crushed stone, a 61-cm layer of filter course, and a 10-cm reservoir course of crushed stone, the pavement was monitored for hydraulic and water-quality performance from 2004 to 2008 (Roseen et al. 2012). The authors reported that the mean infiltration capacity ranging from 248 mm/min to 448 mm/min over the year. A rapid growth of population and the rapid urbanization in conjunction with scarcity and accelerating demand of water is a major issue. Thus, stormwater harvesting using WSUD techniques such as permeable pavements is an ideal solution to increase the groundwater and reuse (Beecham et al., 2010; Fletcher et al., 2008).In Orange city, Australia has been using urban stormwater harvesting for drinking water supplies (Devitt, 2010).In Singapore, urban stormwater harvesting is regarded a valuable water resource, it has been used for decades due to lack of water resources (Lim et al., 2011). In developing countries such as Kuwait, semi-arid country, water demand is increasing day by daydue to increase in population.The country relies on two water resource supplies are stormwaterfor recharge groundwater and desalination of sea water (Zaghloul and Al-Mutairi, 2010). Iraq, arid to semi-arid country, depends substantially on the Tigris and Euphrates Rivers and their tributaries. Although there are two rivers but the country suffers from scarcity of water due to the fact that headwaters of these rivers outside Iraq, where extensive dam projects constructed in Syria, Iran and Turkey have a significant impact in reduction of annual flows of these rivers. Thus, the most scientific and cost effective way in developing countries is stormwater harvesting as an additional valuable water resource by using sustainable means such as WSUD techniques.
CONCLUSION This study was carried out to evaluate the long-term performance of two clogged porous asphalts in northern Sweden with respect to infiltration capacity and also if vacuum cleaning could recover infiltration capacity of these pavements. After having been in service for 17 and 24 years (in Luleå and Haparanda, respectively), the two pavements were found to be significantly

WWW-YES-2012 proceedings (draft version)
88 / 175
clogged. Based on the results of this study, a significantly reduced infiltration capacity compared to studies conducted earlier after 1 or 2 years of operation. Our results show that vacuum cleaning had the ability to recover the infiltration capacity (even though the infiltration capacity could be enhanced in Luleå, no changes were detected in Haparanda). This was possibly due to the extent of existing clogging. The anti-skid agents and their subsequent breakage into finer solids by vehicular traffic have a substantial impact on the long-term performance of porous asphalts. Vacuum cleaning can be recommended to recover infiltration capacity of porous asphalt depending on the grade of clogging. Furthermore, with regular maintenance, clogging of these pavements can be remedied. In addition, exposure of the road surface to fine sediment should be avoided if possible.
REFERENCES • Balades, J. D., Legret, M., and Madiec, H. (1995). Permeable pavements: Pollution Management
Tools. Water Science and Technology, 32(1), pp. 49–56. • Bäckström, M. and Forsberg C. (1998). An Alternative Road Construction for Stormwater
Infiltration in A cold Climate. VATTEN 54 (2), pp. 115-121. • Bäckström, M., and Bergström, A. (2000). Draining function of porous asphalt during snowmelt
and temporary freezing. Canadian Journal of Civil Engineering, 27(3), 594-598. • Bean, E. Z., Hunt, W. F., and Bidelspach, D. A. (2007). Field survey of permeable pavement
surface infiltration rates. Journal of Irrigation and Drainage Engineering 133 (3): 249-255. • Beecham, S. (2011). Using Water Sensitive Urban Design to Achieve Multi-functional Urban
Landuse. 2011 SIA Queensland State Conference. • Beecham, S., Lucke, T. and Myers, B. (2010). Designing porous and permeable pavements for
stormwater harvesting and reuse, in Proceedings of First European IAHR Congress, International Association for Hydro-Environment Engineering and Research, Edinburgh, UK.
• Borgwardt, S. (2006). Long-Term In-Situ Infiltration Performance of Permeable Concrete Block Pavement. Proc. 8th Int. Conf. on Concrete Block Paving, San Francisco, California USA.
• Brabec, E., S. Schulte, and P. L. Richards. (2002). Impervious surfaces and water quality: a review of current literature and its implications for watershed planning. Journal of Planning Literature 16: 499-514.
• Brattebo, B. O., and Booth, D. B. (2003). “Long-term stormwater quantity and quality performance of permeable pavement systems.” Water Research, 37(18), 4369–4376.
• Brown, D.C.(2003). Managing stormwater with porous asphalt, Public Works 134, 14-16. • Burton, G.A., Pitt, R.(2002). Stormwater Effects Handbook: A Toolbox for Watershed Managers,
Scientists, Engineers. CRC. • Butler, D., Davies, J.W.(2004). Urban Drainage. 2nd edition. Spon Press, London, UK. • Chocat, B., Ashley, R., Marsalek, J., Matos, M.R., Rauch, W., Schilling, W., Urbonas, B.(2007).
Toward the sustainable management of urban storm-water, Indoor and Built Environment 16, 273-285.
• Chopra, M., Kakuturu, S., Ballock, C., Spence, J., Wanielista, M.(2010). Effect of rejuvenation methods on the infiltration rates of pervious concrete pavements. Journal of Hydrologic Engineering, 15, 426-433.
• Devitt, C.(2010). Urban stormwater supplies drinking water at orange, NSW, Water 37, 75-79. • Dietz, M. E. (2007). Low Impact Development Practices: A Review of Current Research and
Recommendations for Future Directions. Water Air and Soil Pollution, 186, 351-363. • Ellis, J.B., Marsalek, J.(1996). Overview of urban drainage: Environmental impacts and concerns,
means of mitigation and implementation policies, Journal of Hydraulic Research 34, 723-731. • Fletcher, T.D., Deletic, A., Mitchell, V.G., Hatt, B.E. ( 2008). Reuse of urban runoff in Australia:
A review of recent advances and remaining challenges, J. Environ. Qual. 37, S116-S127. • Gerrits, C., James, W. (2002). Restoration of infiltration capacity of permeable pavers. Global
Solutions for Urban Drainage. Proc. 9th Intl. Conf. on Urban Drainage / ASCE 1-14.

12th World Wide Workshop for Young Environmental Scientists WWW-YES-2012 Urban waters: resource or risks? Arcueil, France (21 – 25 May 2012)
89 / 175
• Gyllefjord, A., Kangas, J. (1989). Infiltrationsmätning på permeabel asfalt i labmiljö: Infiltration measurements on permeable asphalt i laboratory. Luleå.
• Jackson, N. (2003). Design, Construction and Maintenance Guide for Porous Asphalt Pavements: Information Series 131. National Asphalt Pavement Association.
• Lim, M.H., Leong, Y.H., Tiew, K.N., Seah, H. (2011). Urban stormwater harvesting: A valuable water resource of Singapore, Water Practice and Technology 6.
• Lindsey, G., Roberts, L., and Page, W. (1992). "Inspection and maintenance of infiltration facilities." J. Soil and Water Conservation, 47(6), 481-486.
• Marsalek, J., Barnwell, T.O., Geiger, W., Grottker, M., Huber, W.C., Saul, A.J., Schilling, W., Torno, H.C.(1993). Urban drainage systems: Design and operation, Water Science and Technology 27, 31-70.
• National Asphalt Pavement Association (NAPA), Porous Asphalt Pavements for Stormwater Management: Design, Construction, and Maintenance Guide (IS-131). Lanham, MD, 2008.
• Pezzaniti, D., Beecham, S. and Kandasamy, J. (2009). A Laboratory and Field Investigation into the Effective Life of Permeable Pavements. Journal of Water Management, Institution of Civil Engineers, UK, 162(2), pp76-87.
• Philp, M., McMahon, J., Heyenga, S., Marinoni, O., Jenkins, G., Maheepala, S., Greenway, M. (2008). Urban Water Security Research Alliance, Water for a Healthy Country Flagship. Review of Stormwater Harvesting Practices. Urban Water Security Research Alliance.
• Roseen, R. M., Ballestero, T.P., Houle, J.J., Briggs, J.F., and Houle, J.P. (2012). Water Quality and Hydrologic Performance of a Porous Asphalt Pavement as a Storm water Treatment Strategy in a Cold Climate. Journal of Environmental Engineering, 138(1), pp. 81-89.
• Scholz, M. and Grabowiecki, P. (2007). Review of permeable pavement systems. Building and Environment, 42(11), pp. 3830-3836.
• Shackel B. (2010). The Design, Construction and Evaluation of Permeable pavements in Australia. 24th ARRB Conference – Building on 50 years of road and transport research, Melbourne, Australia 2010.
• Siriwardene, N.R., Deletic, A., Fletcher, T.D. (2007). Clogging of stormwater gravel infiltration systems and filters: Insights from a laboratory study. Water Res. 41, 1433-1440.
• Stenmark, C. (1990), Local infiltration of urban storm water in cold climate, Proc. of the Fifth International Conference on Urban Storm Drainage, Osaka, Japan, pp. 809-814.
• Stenmark, C. (1995), "An Alternative Road Construction for Stormwater Management in Cold Climates", Water Science and Technology, vol. 32, no. 1, pp. 79-84.
• University of New Hampshire Stormwater Center (UNHSC). Design Specifications for Porous Asphalt Pavement and Infiltration Beds. July 2007. Durham, NH.
• U.S Department of Transportation, Federal Highway Administration, “A Guide for Selection of Context Sensitive Roadway Surfacing, Task A, Summary of Roadway Surfacing Options”, Report No. FHWA-CFL- 03-004, 2004.
• Walsh, C. J.(2000). Urban impacts on the ecology of receiving waters: a framework for assessment, conservation and restoration. Hydrobiologia, 431, 107-114.
• Walsh, C.J., Roy, A.H., Feminella, J.W., Cottingham, P.D., Groffman, P.M., Morgan II, R.P.(2005). The urban stream syndrome: Current knowledge and the search for a cure, J. N. Am. Benthol. Soc. 24, 706-723.
• Waterways, M.B.(2006). Water Sensitive Urban Design: Technical Design Guidelines for South East Queensland.
• Yong, C.F., Deletic, A., Fletcher, T.D. and Grace, M.D. (2011). Hydraulic and treatment performance of pervious pavements under variable drying and wetting regimes. Water science and technology 64(8), 1692-1699.
• Zaghloul, N.A., Al-Mutairi, B.L. (2010). Water harvesting of urban runoff in Kuwait. Sci. Iranica 17, 236-243.

WWW-YES-2012 proceedings (draft version)
90 / 175
9. Impact of multiple disturbances on microbiological quality of urban and peri-urban lakes
Adélaïde ROGUET and Françoise S. LUCAS
Université Paris-Est Créteil, Laboratoire Eau Environnement Systèmes Urbains (Leesu) UMR MA 102-AgroParisTech, 61 avenue du Général de Gaulle, 94000 Créteil, France (E-mails: [email protected] ; [email protected])
Abstract This project will focus on global changes impact on the microbiological quality of urban and peri-urban lakes in Ile-de-France (France). The goal is to better understand the impact of anthropogenic pressures and changes of land use on bacterial populations in urban lakes, to identify indicators of quality and ecological status and to better evaluate the ecology of emerging waterborne pathogens such as nontuberculous mycobacteria. The study will include an annual survey of forty eight lakes and a monthly monitoring of the Créteil Lake to assess the temporal and spatial variations of bacterial communities, faecal contamination indicators and nontuberculous mycobacteria. A supplementary study will be undertaken to identify the favorable habitats of mycobacteria in urban lakes.
Keywords Microbial diversity; faecal bacterial indicators; nontuberculous mycobacteria; global changes; urban lakes
INTRODUCTION Lakes are very common ecosystems in the urban and peri-urban landscape. More than 900 are listed in the Ile-de-France area (Catherine et al., 2008)). These ecosystems have been studied for a long time because they provide many ecosystem services, such as important economical, recreational and educational services (Bolund and Hunhammar, 1999). Since, these ecosystems are coupled with watersheds, they appear to be good indicators of the general state of the landscape because they are particularly vulnerable to environmental change and they represent a complex set of environments (Williamson et al., 2008). Moreover, these ecosystems are sensitive to a wide variety of environmental changes, which act at the same time at the local level (agricultural, industrial or urban pollution, eutrophication, etc.) and at global scale (increasing intensity of the rains and the heatwaves, etc.) (Poff et al., 2002; Peters et al., 2008). Anthropogenic disturbances mainly lead to the degradation of aquatic biological systems, which can impact the ecosystem functioning or the sanitary quality aspects (MEA, 2005). For these reasons, it is important to understand these ecosystems. Microorganisms have a major importance for the functioning of aquatic ecosystems (Linderman, 1942). Indeed, these microorganisms play a critical role in biogeochemical cycles, by degrading and mineralizing the organic compounds to their inorganic forms (Cole et al., 1988; Cotner et al., 2002). In addition, these organisms constitute preys for eukaryotic predators, which by fueling the food web, has a profound impact on elemental fluxes and water quality in these ecosystems (Pernthaler and Amann, 2005). However, it is well documented (Williamson et al., 2008) that deterioration of water quality because of land use or anthropogenic contaminants can significantly impact the functioning of aquatic ecosystems, by creating new ecological niches

12th World Wide Workshop for Young Environmental Scientists WWW-YES-2012 Urban waters: resource or risks? Arcueil, France (21 – 25 May 2012)
91 / 175
that could encourage the survival of certain bacteria species or pathogens (Johnson et al., 2010). In spite of their ecological importance, the composition of microbial communities in freshwater ecosystems still remained a black box and little is know about their response to the variations in their environment. So, molecular biology techniques since a decade provide us with unprecedented access to the identification and composition of microorganisms of freshwater lake bacterial communities and have for the first time enabled microbial ecology to identify the numerically dominant organisms in these ecosystems and to learn much about their distributions in time and space. Yet, the impact of physico-chemical properties of lakes related to land occupation on the diversity of bacteria is still unclear and need to be investigated. Among services provided by urban lakes, recreational activities by practicing recreational activities such as bathing, fishing or practice of nautical sports, humans are often directly in contact with freshwaters. Yet, lakes waters can be contaminated by waterborne pathogens, which are originated from animals, humans or environment. Therefore, to assess and characterize the sanitary quality of bathing water, various indicators of faecal contamination are usually used. The abundance of these indicators is supposed to be correlated to the density of pathogenic microorganisms from faecal origin and thus to be an indication of the sanitary risk associated with the various water use (bathing, shellfish harvesting, etc.). For years, the group of faecal coliforms (FC) has been the most widely used as faecal indicator. In recent years, some organizations (USEPA, 1999; WHO, 2004) have proposed to use Escherichia coli and intestinal enterococci as indicators of faecal pollution: E. coli is used to detect recent contamination, whereas intestinal enterococci detect faecal is employed to assess a old pollution (PIREN-Seine, 2009). However, these bacteria can survive in natural environment (Rivera et al., 1988; Hardina and Fujioka, 1991; Muller et al., 2001; Whitman et al., 2002), consequently the amount of these indicators do not always reflect an ancient or recent contamination. For instance, according to Whitman et al., (2003), in Lake Michigan, E. coli can persist several months in the algae Clodophora. Nevertheless, these two indicators are the most studied in the world to characterize the quality of bathing waters. In addition to not be often correlated with enteric cases, faecal indicators do not correlate at all with environmental pathogens such as nontuberculous mycobacteria (NTM). These organisms have been recognized as emergent opportunistic pathogens since 2004 by the World Health Organization and it is generally accepted that environmental water is the main source of most human infections caused by NTM, such as severe human skin, pulmonary, digestive or urinary infections (Falkinham III, 2002; Primm et al., 2004; Griffith et al., 2007). On NTM, despite numerous studies, to date their diversity, their environmental sources and reservoir and their persistence in freshwater are still poorly understood. Consequently, because NTM are emerging pathogens for humans and domestic animals, it is important to identify these aspects. Thus, even if many studies focus on pathogens in lakes and that few multilake studies have shown that differences in bacterial community composition between lakes can be quite large and in relation with lakes properties (Lindström, 2000; Yannarell et al., 2004; Yannarell et al., 2005; Jones et al., 2009; Newton et al., 2011), no study has described and analyzed jointly the sanitary and the environmental statutes of lakes, especially in small urban lakes which are often less studied than the great lakes in microbial ecology. Thus, our study aims to combine these two approaches in urban and peri-urban lakes in Ile-de-France over three years by focusing on the bacterial assemblages. Firstly, in order to identify factors controlling the pathogens and faecal indicators densities and the bacterial diversity to characterize the relative impact of global change and other anthropogenic pressures. Secondly, we aim to identify sensitive areas and

WWW-YES-2012 proceedings (draft version)
92 / 175
factors aggravating the ecological and sanitary status of these ecosystems in order to optimize the management practices of urban lakes. This study is part of the research project PULSE (Peri-Urban Lakes, Society and Environment) supported by ANR (National Research Allowance) funds and which involve seven laboratories. To fulfill our objectives two complementary approaches will be undertaken: at a larger scale for a global vision and at a smaller temporal and spatial scale for a finer analysis of the processes and factors involved. The first is an inter-annual comparison of the sanitary and ecological status of 48 lakes, representative of the land occupation in the Ile-de-France region (Catherine et al., 2008) for three consecutive years. The Ile-de-France region constitutes a good model for studying the impact of multiples pressures on waterbodies, because it lies within a single, first-order hydro-ecoregion as defined by Wasson et al. (2002) and thus, its geology is considered to be homogeneous at all the sampling sites. Moreover, this region displays a diversity of anthropogenic pressures and global changes in terms of their nature and intensity, and it includes a wide range of urban and peri-urban lakes. This first approach will be coupled with a more detailed analysis by monthly monitoring the lake of Créteil (Val de Marne, France). Two transects will be sampled, one vertical and the one horizontal in order to assess the temporal and spatial variations of bacterial communities, indicators of faecal contamination and NTM.
In addition, a study will be conducted in the spring and summer on two contrasted lakes, one oligotrophic and the other one eutrophic, in order to study the spatial distribution of NTM. We aim to identify which habitats are favourable to MNT within urban lakes by investigating the densities of NTM in the sediment, water column, neuston, and in biofilm covering plants (epiphytic) and submerged rocks (epilithic).
MATERIAL & METHODS
Study of multiple disturbances on the microbial assemblages in urban lakes
Impact of land use
Sampling area The 48 lakes surveyed are localized in the Ile-de-France region (Figure 1), an area covering 12,011 km2 in north-central France, in the center of Paris basin which concentrated 18.3% of the French population in 2011 (INSEE1). This fertile sedimentary basin contains many large industrial cities, residential suburbs and agricultural areas which represent half of the total area of the region (INSEE). Forested areas cover over 24% of the region (INSEE). The characteristics of lakes are presented in Table 1 (Catherine et al., 2008). Sampling design For three years (2011-2013), between July and August, the 48 lakes will be monitored. For each lake, the water column is sampled at three depths on three different locations. Water samples are then pooled together in order to obtain one average sample per lake. Various biotic and abiotic parameters are measured by four different laboratories (Table 2). Faecal indicator densities will be estimated by the most probable number (MPN) method using microplates according to the standards NF EN ISO 9308-3 and 7899-1 for E. coli and intestinal enterococci respectively. We use these two indicators, in particular in the goal to be able to compare our data with other studies, such as those of the Conseil Général du 94. Total bacterial densities will be measured by flow cytometry. To characterize the genetic structure of the 1 INSEE (Institut National de la Statistique et des Études Économiques) : http://www.insee.fr/

12th World Wide Workshop for Young Environmental Scientists WWW-YES-2012 Urban waters: resource or risks? Arcueil, France (21 – 25 May 2012)
93 / 175
bacterial community from lakes, bacterial DNA will be extracted to analyze the diversity of genes coding for the 16S rRNA (gene essential for the survival of species) by dHPLC profiling (Denaturing High-Performance Liquid Chromatography) (Danger et al., 2008). A high throughput sequencing method will be performed for one of the three campaigns, to define the composition of the bacterial assemblages in order to link diversity indices and main taxonomic groups with the characteristics of the lakes. Finally, the density and the community structure of NTM will be analyzed by real time PCR (Radomski et al., 2010) and dHPLC respectively. Statistical analysis will be conducted with R software (R development Core Team 2012) by combining biological results with land occupation data of watershed. These will be obtained using the ArcGis (vs 9.3 ESRI), an geographic information system software that uses layers of vector geo-referenced and describing land occupation of an area (crops, forests, cottage homes, buildings, industries, etc.), to isolate only the information related to the lake watersheds.
FIGURE 1: Localization of the studied 48 lakes in the Ile-de-France region.
Temporal and spatial variability
Sampling area Créteil Lake located in Ile-de-France region (48°46’N 02°27’E) originates from an excavation of alluvial sediments near the confluence of the Rivers Seine and Marne. Its surface is 40.8 ha and has an average depth of 4.5 meters. The lake is mainly supplied with anoxic phreatic waters circulating through alluvial deposits and diverse filling materials. It is also supplied by a rainwater sewer. Well exposed to wind, the lake stratified only weakly and intermittently from May to October.

WWW-YES-2012 proceedings (draft version)
94 / 175
TABLE 1: Location, morphological characteristics of the 48 lakes and total chlorophyll a observed in August 2006 (Catherine et al., 2008)
Hydrographical zones are based on land use index (urban impervious, non-impervious, cropland surfaces), on morphological index (altitude and surface) and on drainage index of the watershed. Within each cluster the number of lakes is proportional the representativeness of lakes in the
region.
Clusters Surface
Name Localisation (defined by hydrographical
zones)
Linked to rivers and streams
area (ha)
Mean depth (m)
Total Chl a (μg.L-1)
Isles-les Villenoy Pond 48°54’ N 02°50’ E 1 - 41.6 2.6 10.1
Fontenay/Vic Pond 48°33’ N 02°23’ E 1 + 9.8 1.2 357.3
Vert-le-Petit Pond 48°33’ N 02°22’ E 1 - 5.0 2.0 123.1
Fleuri Pond 48°32’ N 02°22’ E 1 + 8.4 1.3 67.6
Courcouronnes Pond 48°37’ N 02°25’ E 1 + 6.5 1.4 123.5
Delomez Pond 48°24’ N 03°07’ E 1 - 6.7 4.2 9.6
Leclerc Pond 48°24’ N 03°05’ E 1 - 5.4 2.8 6.1
Maurepas Reservoir 48°46’ N 01°55’ E 2 + 7.6 3.4 138.7
Noés Reservoir 48°45’ N 01°58’ E 2 + 24.0 0.7 73.0
Vaux-de-Cernay Pond 48°41’ N 01°56’ E 2 + 6.5 1.4 101.6
Grande Paroisse Pond 48°22’ N 02°54’ E 2 + 52.7 3.7 191.5
Grand Marais Pond 48°22’ N 02°57’ E 2 - 16.5 2.4 27.1
Villefermoy Reservoir 48°32’ N 02°56’ E 2 + 21.7 2.1 54.8
Freneuse Cove 49°04’ N 01°35’ E 3 + 14.0 2.4 202.3
Grand Lavacourt Pond 49°03’ N 01°41’ E 3 - 111.5 4.3 25.3
Ilon Cove 49°01’ N 01°37’ E 3 + 7.4 3.8 84.5
ASM Club Cove 49°00’ N 01°40’ E 3 + 9.2 2.5 181.4
Bout du Monde Pond 48°58’ N 01°50’ E 3 - 27.6 1.2 3.1
Port-Sud Pond 48°34’ N 02°11’ E 3 + 6.5 1.7 118.8
Clarette Pond 48°19’ N 02°42’ E 3 - 13.9 1.4 129.7
Souppes/Loing Pond 48°10’ N 02°45’ E 3 + 21.1 2.9 39.7
Saint-Blaise Pond 48°31’ N 02°22’ E 4 + 5.2 1.4 68.6
Gazeran Pond 48°38’ N 01°46’ E 5 + 8.2 0.7 45.7
Samoreau Pond 48°25’ N 02°45’ E 5 - 10.2 2.4 2.4
Grosse Pierre Pond 49°00’ N 01°58’ E 6 - 46.2 4.3 34.2
Gaule Achéroise Pond 48°58’ N 02°03’ E 6 - 5.3 6.2 7.8
Triel Pond 48°57’ N 02°00’ E 6 - 34.1 3.9 61.4
Jabline-Anet Lake 48°54’ N 02°43’ E 6 - 77.1 7.0 6.5
Saclay Reservoir 48°44’ N 02°10’ E 6 + 30.2 1.5 77.0
La Veyssière Pond 48°41’ N 02°24’ E 6 + 27.1 1.6 143.5
Noues de Seine Pond 48°40’ N 02°23’ E 6 + 29.1 3.4 49.9
Seine Port Pond 48°33’ N 02°32’ E 6 - 5.9 2.9 176.5
Saint-Quentin Reservoir 48°47’ N 02°01’ E 6 + 120.1 1.6 103.7
Bois-le-Roi pond 48°29’ N 02°43’ E 6 + 8.3 2.6 23.3
Les Galets Pond 49°01’ N 02°03’ E 7 - 10.6 2.2 15.0
Epinoche Pond 48°37’ N 02°17’ E 7 + 5.7 2.4 110.4
Loy Pond 48°51’ N 02°41’ E 8 + 6.9 1.3 225.3
Créteil Lake 48°46’ N 02°27’ E 9 + 40.8 4.5 20.7
Choisy Pond 48°46’ N 02°25’ E 9 - 21.6 2.6 39.6
Plage Bleue Pond 48°45’ N 02°28’ E 9 - 9.3 3.1 27.4
Lake Inférieur 48°51’ N 02°16’ E 10 + 9.5 1.2 255.3
Les Pâtis Pond 48°52’ N 02°36’ E 10 - 10.3 2.6 35.8
UCPA Centre Pond 48°52’ N 02°37’ E 10 - 92.0 5.3 1.6
Saint-Cucufa Pond 48°51’ N 02°10’ E 10 + 5.4 1.8 85.0
UTE Louveciennes 48°51’ N 02°06’ E 10 - 7.5 2.5 < d.l.
Lake Minimes 48°50’ N 02°27’ E 10 + 5.8 1.2 194.4
Swiss Pond 48°48’ N 02°07’ E 10 - 14.4 1.9 32.5
Enghien Lake 48°58’ N 02°18’ E n.d. n.d. n.d. 1.0 n.d.
Chl a: clorophyll a; n.d.: not defined

12th World Wide Workshop for Young Environmental Scientists WWW-YES-2012 Urban waters: resource or risks? Arcueil, France (21 – 25 May 2012)
95 / 175
TABLE 2: Biotic and abiotic parameters analysed in the 48 lakes by each laboratory. LEESU
UMR MA 102 University of Paris-Est MCAM
UMR 7245 CNRS/MNHN ESE
UMR CNRS 8079 University of Paris-Sud BIOEMCO
UMR CNRS 7618 ENS
pH* % Transmitted signal* Eukaryotic Phytoplankton Seston
Light* Depth max* Cyanobacteria Zooplankton Temperature* NH4
+* Heterotrophic bacteria Thermal stratification* Ntotal* Heterotrophic protists Extinction coefficient* PO4
3-* Viruses Conductivity* Ptotal* Haptophytes
O2 concentration* Total Chlorophyll a * O2 saturation (%)* Green algae
NO3- * Cyanobacteria NO2-* Diatoms
TSS (Total Suspended Solid)* Crypto algae TOC* Yellow substance DOC* Total phytoplankton POC* Microcystis : toxic blue-green algae
Metals** PAH (Polycyclic Aromatic
Hydrocarbon)**
E. coli Intestinal enterococci
NTM Bacterial diversity
* Correspond to the abiotic parameters analyzed for the monthly campaigns of Créteil Lake and the NTM study. ** Correspond to parameters analyzed only for Créteil lake monthly campaigns. Sampling design A monthly monitoring is carried out on this lake since December 2011 on a horizontal transect consisting of three points between the storm sewer outlet and the outlet: the « S » point is close to the storm sewer outlet, the « R » point is located next to a rich organic reedbed area and the central point « C », is located between S and R (Figure 2a). The water is collected at three depths for each of the points at about 0.5, 1.5 and 3.5 meters deep (Figure 2b). For each campaign an average sample, named « M » is achieved by pooling the water from the three depths at the three points. This monitoring will be supplemented by punctual campaigns during particular events (storms, phytoplankton blooms, etc.). Furthermore, only three of the four laboratories presented in Table 2 participated in the field campaigns of Créteil Lake: LEESU, BIOEMCO and ESE. The parameters analyzed by these laboratories are the same as for the 48 lakes campaign. The details of the parameters investigated are shown in Figure 2b and Table 2. Microbial assemblages (Figure 2b) are surveyed on the horizontal surface transect (S1, C1 and R1) in order to compare these data with the survey of the Conseil Général du Val de Marne four times per year. Moreover, on the central point, microbial parameters are also measured on the vertical transect (C1, C2, C3) and in the average sample (M).

WWW-YES-2012 proceedings (draft version)
96 / 175
a.
b.
FIGURE 2: a. Distribution of the three sampling points on the lake of Créteil. b. Biotic and abiotic parameters analyzed according to the sampling points and depths.
Study of the distribution of NTM in urban lakes Sampling area This study is conducted on two urban lakes: Daumesnil and Créteil. Daumesnil Lake is located in Bois de Vincennes, in the suburbs of Paris. The water supply of this lake comes from a network of non-potable water of Charonne reservoir, itself fed by the Ourcq canal (fed by the Marne River). It varies in depth from 1 to 1.40 meters for most of its surface area (12 ha). This lake is considered as eutrophic with the following characteristics: 0.1 mg.L-1 of total phosphorous, 0.1 mg.L-1 of total phosphate, <1.0 mg.L-1 of nitrogen (Moulin, 2011). Créteil Lake has an oligotrophic lake status. Sampling design On each site, five points will be followed once in the spring and once in the summer (Figure 3). On these points, NTM present in the sediment, water column, neuston, epiphytic and epilithic biofilms will be characterized by quantitative PCR, dHPLC profiles and by sequencing. Abiotic parameters surveyed during Créteil Lake monthly campaigns, except metals, will be determined for each points. Humic acids will be analyzed too in sediments.

12th World Wide Workshop for Young Environmental Scientists WWW-YES-2012 Urban waters: resource or risks? Arcueil, France (21 – 25 May 2012)
97 / 175
FIGURE 3: Distribution of five sampling spots on Daumesnil Lake (left) and Créteil Lake (right)
PRELIMINARY RESULTS The first sampling campaign on the 48 lakes was conducted during the summer 2011. For now data cannot be analyzed since all laboratories, including ours, have not yet measured all their parameters. However, at first glance the concentration of faecal indicators has show that lakes with a storm sewer outlet or being connected directly to the Seine tend to display a water more contaminated water than the other lakes. Moreover, during the monthly monitoring of Créteil Lake, the weather factor appears determining in the distribution of the indicators of faecal pollution. Indeed, the concentration of these bacteria is very abundant after rain events, especially in the surroundings of the storm sewer outlet. While their concentration is almost zero during dry weather in all the samples, including nearby the sewer outlet (data not shown).
REFERENCES • BOLUND P. and Hunhammar S. (1999). Ecosystem services in urban areas. Ecological
Economics, 29:293-301. • CATHERINE A., Troussellier M. and Bernard C. (2008). Design and application of a stratified
sampling strategy to study the regional distribution of cyanobacteria (Ile-de-France, France). Water Research, 42:4989-5001.
• COLE J.J., Findlay S. and Pace M.L. (1988). Bacterial production in fresh and saltwater ecosystems - a cross-system overview. Marine Ecology - Progress Series, 43:1-10.
• COTNER J.B. and Biddanda B.A. (2002). Small players, large role: microbial influence on biogeochemical processes in pelagic aquatic ecosystems. Ecosystems, 5:105–121.
• DANGER M., Daufresne T., Lucas F.S., Pissard S. and Lacroix G. (2008). Does Liebig’s law of the minimum scale up from species to communities? Oikos, 117:1741-1751.
• FALKINHAM III J. O. (2002). Nontuberculous mycobacteria in the environment. Clinics in chest medicine, 23(3):529-551.
• GRIFFITH D.E., Aksamit T., Brown-Elliott B.A., Catanzaro A., Daley C. et al. (2007). An official ATS/IDSA statement: diagnosis, treatment, and prevention of nontuberculous

WWW-YES-2012 proceedings (draft version)
98 / 175
mycobacterial diseases. American Journal of Respiratory and Critical Care Medicine, 175(4):367-416.
• JOHNSON P.T.J., Townsend A.R., Cleveland C.C., Glibert P.M., Howarth R.W. et al. (2010). Linking environmental nutrient enrichment and disease emergence in humans and wildlife. Ecological Applications, 20(1):16-29.
• JONES S. E., Newton R.J. and McMahon K.D. (2009). Evidence for structuring of bacterial community composition by organic carbon source in temperate lakes. Environmental microbiology, 11(9):2463-2472.
• HARDINA C.M. and Fujioka R.S. (1991). Soil: the environmental source of Escherischia coli and enterococci in Hawaii’s stream. Environmental Toxicology Water Quality, 6:185-195.
• LINDERMAN R.L. (1942). The trophic-dynamic aspect of ecology. Ecology, 23: 399-418. • LINDSTRÖM E.S. (2000). Bacterioplankton community composition in five lakes differing in
trophic status and humic content. Microbial Ecology, 40:104-113. • MEA – Millenium Ecosystem Assessment (2005). Ecosystems and human well-being: wetlands
and water. Synthesis. World Resources Institute, Washington, DC. • MOULIN L. (2011). Contrôle de la qualité de l’eau des lacs des bois de Boulogne et de
Vincennes. Prepared for the City of Paris, Eau de Paris. • MULLER T.A., Ulrich A., Ott E.M. and Muller M. (2001). Identification of plant-associated
enterococci. Journal of Applied Microbiology, 91:268-278. • NEWTON R.J., Jones S.E., Eiler A., McMahon K.D. and Bertilsson S. (2011). A guide to the
natural history of freshwater lake bacteria. Microbiology and Molecular Biology Reviews, 75(1):14-49.
• PERNTHALER J. and Amann R. (2005). Fate of heterotrophic microbes in pelagic habitats: focus on populations. Microbiology and Molecular Biology Reviews, 69:440-461.
• PETERS D.P.C., Groffman P.M., Nadelhoffer K.J., Grimm N.B., Collins S.L. et al. (2008). Living in an increasingly connected world: a framework for continental-scale environmental science. Frontiers in Ecololy Environment, 6:229-237.
• PIREN-SEINE (2009). La contamination microbienne dans le bassin de la Seine. In : Servais P., Billen G., Garcia-Armisen T., Georges I., Goncalves A., Thibert S. Editors. Eau Seine Normandie. Nanterre, France.
• POFF N.L., Brinson M.M. and Day J.W. (2002). Aquatic ecosystems and global climate change: potential impacts on inland freshwater and coastal wetland ecosystems in the United States. www.pewtrusts.org/our_work_ektid30677.aspx. Viewed on January 2012.
• PRIMM T.P., Lucero C.A. and Falkinham III J.O. (2004). Health Impacts of Environmental Mycobacteria. Clinical Microbiology Reviews, 17(1):98-106.
• RADOMSKI N., Lucas F.S., Moilleron R., Cambau E., Haenn S. and Moulin L. (2010). Development of a real-time qPCR method for detection and enumeration of Mycobacterium spp. in surface water. Applied and Environmental Microbiology, 76:7348-7351
• RIVERA S.C., Hazen T.C. and Toranzos G.A. (1988). Isolation of fecal coliforms from pristine sites in a tropical rainforest. Journal of Applied Microbiology, 54:513-517.
• USEPA – United States Environmental Protection Agency (1999). Action plan for beaches and recreational waters. EPA 600-R-98/079. Washington DC.
• WASSON J.G., Chandesris A., Pella H. and Blanc L. (2002). Typology and reference conditions for surface water bodies in France: the hydro-ecoregion approach. In: Ruoppa, M., Karttunen, K. (Eds.), Typology and Classification of Lakes and Rivers, Symposium on Typology and Classification of Lakes and Rivers. Helsinki, Finland, October 24-26, 2002. Tema Nord 566, pp. 37–41.
• WHO – World Health Organization (2001). Water quality: guidelines, standards and health. Assessment of risk management for water-related infectious disease. In: Fewtrell L., Bartram J., editors. WHO Water series. London, UK: IWA Publishing.
• WILLIAMSON C.E., Dodds W., Kratz T.K. and Palmer M.A. (2008). Lakes and streams as sentinels of environmental change in terrestrial and atmospheric processes. Frontiers in Ecology and the Environment, 6(5):247-254.

12th World Wide Workshop for Young Environmental Scientists WWW-YES-2012 Urban waters: resource or risks? Arcueil, France (21 – 25 May 2012)
99 / 175
• WHITMAN R.L., Fowler M., Shively D.A. and Byappanahalli M.N. (2002). Distribution and characterization of E. coli within the Dunes Creek watershed, Indiana Dunes State Park. Report to the Indiana Department of Natural Resources. U.S. Geological Survey, Porter, Ind.
• YANNARELL A.C. and Triplett E.W. (2004). Within- and between-lake variability in the composition of bacterioplankton communities: investigations using multiple spatial scales. Applied Environmental Microbiology, 70:214-223.
• YANNARELL A.C. and Triplett E.W. (2005). Geographic and environmental sources of variation in lake bacterial community composition. Applied Environmental Microbiology, 71:227-239.

WWW-YES-2012 proceedings (draft version)
100 / 175
10. Urban Lakes and Wetlands: Opportunities and Challenges in Indian Cities - Case Study of Delhi
Ritu SINGH and Manu BHATNAGAR
Natural Heritage Division, Indian National Trust for Art and Cultural Heritage, 71, Lodhi Estate, New Delhi, India (Email: [email protected] )
Abstract In India, urban waterbodies commonly become cesspools due to lack of sanitation facilities. Delhi is continually urbanizing at a rapid pace that has affected the condition of waterbodies. To identify water resource available within Delhi, an extensive field survey and remote sensing based mapping was carried out in Delhi to map all the water bodies including groundwater recharge sites – 44 lakes and 355 village ponds. Haus-Khas, a historical tank and important recharge site, was restored by sourcing secondary treated wastewater and further improving water quality through ecological methods including bio-remediation that are cost effective. Water quality, water recharge and avian diversity data was collected to record improvement. The water table rose by more than 20 feet, biological oxygen demand decreased from 50 mg/l to 15 mg/l in 21 days, the number of resident and migratory birds increased with two resident water bird species breeding in the lake.
Keywords urban lakes, Delhi, restoration, water quality, ecosystem services
INTRODUCTION Lakes are perceived as vast expanse of water in a pristine landscape where one goes for recreation. It is a place of experiencing nature by way of boating, camping, fishing, swimming, bird watching, etc. however, when one mentions ‘urban lakes’ the picture is soon demystified. While urban lakes are different from the common perception of lakes in general they too have value and functions, both ecosystem functions and social values.
There is no specific definition for Lakes in India. The word “Lake” is used loosely to describe many types of water bodies – natural, manmade and ephemeral including wetlands. Many of them are euphemistically called Lakes more by convention and a desire to be grandiose rather than by application of an accepted definition. Vice versa, many lakes are categorized as wetlands while reporting under Ramsar Convention.
India abounds in water bodies, a preponderance of them manmade, typical of the tropics. The manmade (artificial) water bodies are generally called Reservoirs, Ponds and Tanks though it is not unusual for some of them to be referred to as lakes. Ponds and tanks are small in size compared to lakes and reservoirs.
In a recent initiative the Ministry of Environment and Forest (MoEF) has mapped wetland on a 1:50,000 scale, however, the mapping for Delhi was carried out at 1:25,000 scale under the National Wetland Inventory and Assessment project. The inventory identifies and maps 15260572 Ha area under natural and manmade lakes but small wetlands (< 2.25 ha) are mapped as point features (3.64 %). While it is difficult to date the natural lakes, most of the manmade water bodies like ponds and tanks are historical. The large reservoirs are all of recent origin. All

12th World Wide Workshop for Young Environmental Scientists WWW-YES-2012 Urban waters: resource or risks? Arcueil, France (21 – 25 May 2012)
101 / 175
of them, without exception, have suffered environmental degradation. Only the degree of degradation differs. The degradation itself is a result of lack of public awareness and governmental indifference. The situation is changing but slowly. Environmental activism and legal interventions have put sustainability of lakes in the vanguard of environmental issues.
Case of Urban Lakes Humanity is increasingly urban, but continues to depend on Nature for its survival. Cities are dependent on the ecosystems beyond the city limits, but also benefit from internal urban ecosystems. The numerous effects of urbanization on hydrology, geomorphology, and ecology make wetlands in urban regions function differently from wetlands in non-urban lands. Furthermore, wetlands in urban regions may take on human-related values that they lack in non-urban areas, as they provide some contact with nature, and some opportunities for recreations that are otherwise rare in the urban landscape. Natural water bodies tend to get absorbed in urban expansion and their catchment is disturbed as a result of development. In Delhi in the Yamuna floodplain, the once river fed water bodies are disconnected from the river because of embankments.
Impact of Urbanization The biodiversity of lake and pond ecosystems is currently threatened by a number of human disturbances, of which the most important include increased nutrient load, contamination, acidification, and invasion of exotic species (Bronmark & Hansson, 2002).
Hydrologic change is the most visible impact of urbanization. Hydrology concerns the quality, duration, rates, frequency and other properties of water flow. Urbanization typically increases runoff peak flows and total flow volumes and damages water quality and aesthetics. Pollutants reach wetlands mainly through runoff. Urbanized watersheds generate large amounts of pollutants, including eroded soil from construction sites, toxic metals and petroleum from roadways, industrial and commercial areas, and nutrients and bacteria from residential areas. By volume, sediment is the most important non-point pollutant. At the same time that urbanization produces large quantities of pollutants, it reduces water infiltration capacity, yielding more surface runoff. Pollutants from urban land uses are, therefore, more vulnerable to transport by surface runoff than pollutants from other land uses.
Likely effects of urbanization on wetland hydrology and geomorphology
Hydrology
• Decreased surface storage of stormwater results in increased surface runoff • Increased stormwater discharge relative to baseflow discharge results in increased erosive
force within stream channels, which results in increased sediment input to recipient waters
• Changes occur in water quality (increased turbidity, increased nutrients, metals, organic pollutants, decreased O2 etc.)
• Decreased groundwater recharge results in decreased groundwater flow, which reduces baseflow and may eliminate dry season flow
• Increased floodwater frequency and magnitude result in ,or scour of wetland surface, physical disturbance of vegetation
• Increase in range of flow rates (low flows are diminished high flows are augmented) may deprive wetlands of water during dry weather

WWW-YES-2012 proceedings (draft version)
102 / 175
Geomorphology
• Decreased sinuosity of wetland/ upland edge reduces amount of ecotones habitat • Decreased sinuosity of stream and river channels results in increased velocity of stream
water discharge to receiving wetlands • Alterations in shape of slopes(e.g., convexity) affects water gathering or water
disseminating properties
Likely effects of urbanization on wetland ecology
Vegetation
• Large number of exotic species present; large and continuous sources of re-invasion • Restricted pool of pollinators and fruit dispersers • Chemical changes and physical impediments to growth associated with the presence of
trash • Small remnant patches of habitat not connected to other natural vegetation • Human enhanced dispersal of some species • Trampling along wetland edges and periodically unfloodded areas
Fauna
• Species with small home ranges, high reproductive rates, high dispersal rates favoured • ‘edge’ species favoured over forest-interior species • Absence of upland habitat adjacent to wetlands • Absence of wetland/upland ecotones • Human presence disruptive of normal behavior
(source: Ehrenfeld, 2000)
Bolund & Hunhammar (1999) in a study of Stockholm, Sweden, analyzed the ecosystem services generated by ecosystems within the urban area. ‘Ecosystem services’ refers to the benefits human populations derive from ecosystems. Seven different urban ecosystems have been identified: street trees; lawns/parks; urban forests; cultivated land; wetlands; lakes/ sea; and streams. These systems generate a range of ecosystem services. In this paper, six local and direct services relevant for Stockholm are addressed: air filtration, micro climate regulation, noise reduction, rainwater drainage, sewage treatment, and recreational and cultural values. It is concluded that the locally generated ecosystem services have a substantial impact on the quality-of-life in urban areas and should be addressed in land-use planning. Findings of this study indicater that wetlands perform all six ecosystem services while other habitats lagged on one or more of these services.
Urban lakes and wetlands provide habitat for biodiversity conservation. Many species both flora and fauna that are dependent on wetlands are not facing threat. Birds are known to be useful biological indicators of health of an ecosystem as they respond to secondary changes resulting from primary causes. Because of their high mobility birds react very rapidly to any change in their habitat. Urban development is one such change which often affects the population and diversity of terrestrial as well as water birds. In a comparative study of sub-urban wetland and irrigation reservoir it was demonstrated that the natural sub-urban lake supported resident species of birds while the reservoir supported migratory species (Rathod and Padate, 2008). Similarly Mohan & Gaur (2008) observed sixty two species of birds in Jajiwal pond, a natural wetland on the outskirts of Jodhpur city in Rajasthan, India. At Udaipur, Rajasthan, India, 32 bird species belonging to 18 families were observed during two year study period, 2004-2006. Of these 20

12th World Wide Workshop for Young Environmental Scientists WWW-YES-2012 Urban waters: resource or risks? Arcueil, France (21 – 25 May 2012)
103 / 175
were resident, two summer migrants and 10 winter migrants. It was suggested that better habitat management would increase species diversity of the area.
Loss of wetland habitat results in threat to species dependent on it, in a study conducted during 2002- 2005, Gopakumar and Kimal (2008) showed that population of white breasted water hen Amaurornis phoenicurus phoenicurus was declining due to clearing of wild vegetation, filling of water bodies, change in landuse pattern and construction activities. The study proved that wetlands are inevitable for breeding of this species. Loss of wetlands was responsible for its decline and if it continues at current level, it was feared that this bird may become a threatened species in the immediate future. Effective management of existing wetland habitats is crucial for conservation of this species.
The condition of urban lakes and waterbodies in India is so dismal that the people have now filed a number of public interest litigation (PIL) to put pressure on government agencies to take action for their conservation. Citizens having realised that this important natural resource is key to sustenance of habitations and source of potable water need immediate conservation. Many cases have been documented, Dal Lake in Kashmir, Delhi’s Waterbodies, Kurpa Tal, Naini Tal, Bhimtal, Naukuchia Tal and Sattal in Uttaranchal, Charkop, Thanne lake, Powai and Eksar Lakes in Mumbai, Hussain Sagar, Saroo Nagar lake, Kolleru wetlands in Andhra Pradesh, Vembanad wetlands in Kerala, Bangalore lakes, Bellandur lake in Karnataka etc. There are many more instances where citizens have come forward to conserve the wetlands and lake in light of government apathy.
The city of Hyderabad, in the last 50 years of its growth have witnessed large scale destruction of this physical heritage of Hyderabad. It is estimated that there were 932 tanks in 1973 in and around Hyderabad which came down to 834 in 1996. Consequently the area under water bodies got reduced from 118 to110 sq.km. About 18 water bodies of over 10 hectare size and 80 tanks of below 10-hectare size were lost during that period in the Hyderabad Urban Development Authority area.
MATERIALS AND METHOD
The study area Delhi, the capital city, spread over an area of 1483 km2, has grown at a phenomenal rate, having a population of over 10 million. Data was accessed from the National Wetland Inventory and Assessment (http://moef.nic.in/modules/others/?f=wetlands-atlases), survey of India topographical sheets (scale 1:50,000) were referred. The Blueprint for Water Augmentation in Delhi, which is the only comprehensive source so far for information on waterbodies in Delhi was used as primary reference.
In Delhi, the national inventory of MoEF identifies total wetland area estimated is 2556 ha that is around 0.86 per cent of the geographic area (Table 2). The major wetland types are river/stream (1116 ha), tanks/ponds (518 ha), waterlogged (natural/man-made) accounting for 23.2 percent of the wetlands (577 ha) and reservoirs (230 ha). It identifies 11 natural lakes and 352 manmade ponds/tanks in a total of 573 lakes/wetlands in Delhi.

WWW-YES-2012 proceedings (draft version)
104 / 175
Table 1: Area estimates of wetlands in the Delhi area in hectares Sr. No.
Wetland Category Number of Wetlands
Total Wetland Area
% of wetland area
Open Water
Post-monsoon
Area
Pre-Monsoon
Area Inland Wetlands - Natural
1 Lakes/Ponds 11 106 4.15 100 60 2 Ox-bow lakes/ Cut-off
meanders - - - - -
3 High altitude wetlands - - - - - 4 Riverine wetlands 5 15 0.59 13 14 5 Waterlogged 10 86 3.36 54 65 6 River/Stream 26 1116 43.66 826 845 Inland Wetlands -Man-made
7 Reservoirs/Barrages 8 230 9.00 124 153 8 Tanks/Ponds 352 466 18.23 441 418 9 Waterlogged 29 471 18.43 85 145
10 Salt pans - - - - -
INTACH’s blueprint for water augmentation mapped all water resources as well as possible groundwater recharge sites such as paleo-channels and lineaments. It identified 44 lakes and 355 village ponds as major sites for water storage and recharge locations. A few of these are water bodies constructed by Delhi rulers in the past that have become defunct with time. When revived they can be used for storage of rainwater and groundwater that will aid in recharging the groundwater in the associated aquifers, in addition to providing habitat for biodiversity.
Survey of Lakes in Delhi During 2010-11 the status of these 44 lakes of Delhi was re-ascertained. With the use of Google Earth application change in last 10 years was also recorded. It was recorded that 21 of 44 lakes/ depressions have either been encroached or were permanently dry. The waterbodies that were part of parks or protected areas had survived; however, the water quality was generally poor.
The wetlands surviving in heavily developed areas are highly degraded by the complex of stressors associated with urban development. However, some wetland functions can persist despite urban challenges. Wetland functions result from interactions among plants soils, and water. Urban residents use wetlands for passive recreation. While ecologists value wetlands for their biodiversity support function, which help maintain overall species richness in the landscape, people living near wetlands may value the provision of bird habitat or pleasing scenery, or have a general sense of ethical “good” associated with natural habitat (Erhenfeld, 2005).
Restoration of Haus Khas Lake, Delhi, India Restoration of wetland hydrology is the single most important need for urban wetlands, but also the most challenging. Most of the wetlands are now located in places where adjacent land use cannot be changed. This then calls for innovative restoration techniques. Secondly, adjoining land use is an important factor in protecting biotic integrity of urban wetlands, densely vegetated forest edges helps protect these sites from exotic invasion.
Less than a decade ago, Hauz Khas Lake suffered from a fallen water table; its bed was dry and partly concretized. Surface water was not available for restoration. Stormwater from 125 ha. catchment area and treated effluent from Vasant Kunj Sewage Treatment Plant was directed to Hauz Khas through a series of five check dams in Sanjay Van as per the INTACH proposal.

12th World Wide Workshop for Young Environmental Scientists WWW-YES-2012 Urban waters: resource or risks? Arcueil, France (21 – 25 May 2012)
105 / 175
From the large check dam, a 3 km pipeline was laid in SW nala to Hauz Khas ensuring gravity flow. The restored Lake is now a popular destination for tourists and Delhi citizens.
Objectives of restoration were: • Enrich the local ground water regime • Offer a bio-diversity habitat for aquatic life and avian visitors • Enable sustained tube well operations in the area • Substantially add to the visual attraction of the area • Cool the micro-climate • Offer recreational possibilities • Increase soil moisture to support enhanced vegetation growth in the localized area
Database The lake is situated in a district park of urban south Delhi and has a water spread of 6 hectares. The catchment of this lake has undergone rapid urbanization The Hauz has an area of 58515 sq.m.s, an average depth of 2.20m [the bed is in slope with a difference of 1.5 m between the highest and lowest levels] and a storage capacity of 128,000 cu.m. It has a perimeter of 1 km. The bed of the Hauz was concretized with a 50 mm thick layer of lean concrete in 1968 with a view to stop the tremendous percolation losses. Over a period of time the layer has crumbled and is completely ineffective. Several trees had taken root in shallow mud pockets in the bed and several more have been planted along the 1 km. long edge. From the lake management point of view this vegetation is a nightmare as it multiplies the insitu organic load through decay and leaf fall. The littoral zone is also steep with stone-pitched banks and little vegetation. There is an island of 0.40 hectare with steep banks but thick vegetation. The strata is extremely porous and makes it difficult to retain surface water. The water table was encountered at 19 mbgl (metres below ground level) in 2002. The depth to bedrock in the area is 60 -112 mbgl and the shallow aquifer occurs from 26 – 35 mbgl The catchment area was estimated at 10 sq.km. draining through 3 stormwater channels [now carriers of sewage] and these are now diverted away from the Hauz (MAP 1). The groundwater contained high levels of nitrates (>20mg/l), chlorides (90mg/l), and total dissolved solids(TDS) was 400-500 mg/l.
Resources in the Catchment: A sewage treatment plant exists in the catchment discharging 2.5 million gallons of treated effluent. The effluent quality of this STP that was available for sourcing water to Hauz Khas lake is given in table below.
Table 2: Vasant Kunj STP Effluent Quality pH Total Alkanity Cl TS SS DS BOD COD Oil Grease
January 7.8 403 171 895 16 879 12 96 1 February 7.7 415 126 889 12 877 14 March 7.7 448 182 936 19 917 13 46 2 April 7.7 472 184 904 77 882 14 47 1 27.9 May 7.7 470 167 892 19 873 14 39 1 28.2 June 7.8 329 176 881 13 868 26 1 31.1 July 8.1 399 171 886 15 871 11 27 August 8.1 348 166 773 14 739 10 29 1 September 8 432 155 783 16 267 11 31 2.5 4.2 October 8.1 486 178 820 26 794 13 54 1 November 7.9 439 151 754 21 733 12 40 2
December
Source : DJB , Note : One day from every month of 2002 values of all parameters in mg/l except for pH

WWW-YES-2012 proceedings (draft version)
106 / 175
The parameters of effluent were fairly consistent and the effluent quality meets the Ministry of Environment & Forests [MoEF] standards for discharge into surface streams [<20mg/l BOD, <30 mg/l SS, >100mg/l COD].
Catchment Area: Three storm water channels lie on the upstream side of the Hauz. None of them were directly flowing into the Hauz in the natural course. These channels emerge south of the Hauz from the southern ridge area and serve a catchment of approximately 10 sq.km. These channels are carrying wastewaters/sewage from unsewered areas of heavily urbanized catchment, the annual storm water runoff generated was about 700,000 - 900,000 cu.m. annually in a year of average rainfall.
Stormwater Drainage Channels: The drainage channels of the southern ridge which are relevant to the Hauz emerge, one from Jawaharlal Nehru University (JNU) and two from north of JNU passing through Sanjay Van and thereafter through Indian Institute of Technology(IIT), Delhi. As mentioned earlier the storm waters were contaminated by the sewage load carried by these channels. The south-easternmost of these channels also carried the treated effluent of the Vasant Kunj STP. The channel has a series of 5 check dams in the Sanjay Van area which have served to recharge the aquifer and bring up the water table in that area. The treated effluent discharge of STP available at the checkdam no. 3 are given below.
Table 4: Treated Effluent Discharge at Checkdam No.3 in Sanjay Van Time (hours) Discharge (cumecs)
0800 0.055 0900 0.06 1000 0.085 1200 0.04
1400 0.066 1600 0.073 1800 0.072 1900 0.065
Source: Field Observations (February, 2003)

12th World Wide Workshop for Young Environmental Scientists WWW-YES-2012 Urban waters: resource or risks? Arcueil, France (21 – 25 May 2012)
107 / 175
Map 1: Revival of Hauz Khas lake in Delhi
Rainfall: The average annual rainfall in Delhi is 61cm, direct precipitation over the Hauz reservoir area annually amounted to 35110 cubic meters.
Evaporation: Evaporation losses from lake were considered and water management system devised accordingly.

WWW-YES-2012 proceedings (draft version)
108 / 175
Operational Concept On analysing the data base assembled above it emerges that:
• given the current state of the storm water channels [which have become carriers of polluted urban flows]
• the erratic nature of the rainfall [80% of annual precipitation occurs during July to September]
• the deep water table combined with the porous sub-stratum which no longer supports the surface spread
It would not have been possible to fill up the Hauz with clean storm water and sustain the lakes water spread to beyond even October. Nor, in an above average rainfall year, would it be possible to store sufficient water so as to maintain the waterbody beyond October. To revive the Hauz presently there was no option but to utilize the treated effluent water from Vasant Kunj which is the only reliable regular source of water. The following scheme was followed :
a) One MGD (Million Gallon per Day) treated effluent from Vasant Kunj STP was utilized for filling the lake after further treatment with duckweeds (Spirodella, Lemna, Wolffia) in the water retained in existing checkdams in the catchment. The objective was to bring the BOD from 12 mg/l [at STP outlet] to < 5mg/l with 2 days retention time.
b) The treated water is conveyed from checkdam through a system of pipes (600 mm ø) and chambers. The pipes are laid on the bed of the storm water channel on brick masonary piers (foundations laid to below scour levels). This ensures that non-point pollution does not affect the water quality en route.
c) The entire flow is accomplished with gravity.
d) Based on the flow regime the average flow is estimated at 2000 cu.m.d after accounting for diversions upstream of Sanjay Van, seepage losses in Sanjay Van, trans-evaporation by the plant community in the aquatic plants lagoon in Sanjay Van and removals in IIT campus.
e) After filling the Hauz to full capacity the losses on account of evaporation and percolation have to be made up. The percolation losses are assumed as a stable constant whereas the evaporation losses would vary with the seasons. The losses are estimated between a high of 940 cu.m.d. in May to a low of 600 cu.m.d. in December – January.
f) After filling the Hauz appropriate fish species have been introduced in the reservoir. [Populations : Indian Carps – 120,000, Grass Carps - 50,000, Gambussia – 10,000 no.s]. The plankton, which feed upon the organic load in the water, were to be consumed by the fish. Bottom feeder fish feed upon the detritus of dead matter floating down towards the bed of the reservoir. The fish would attract fish eating birds and thus the organic matter would be removed from the water through a natural food chain.
g) Bioremediation: Facultative anaerobic bacterial consortium was introduced in surface waters to reduce biological oxygen demand, reduce nitrates and to improve the levels of dissolved oxygen. This formed basis for restoration of water quality and aquatic ecosystem to the lake.
Map 2 shows operational scheme.
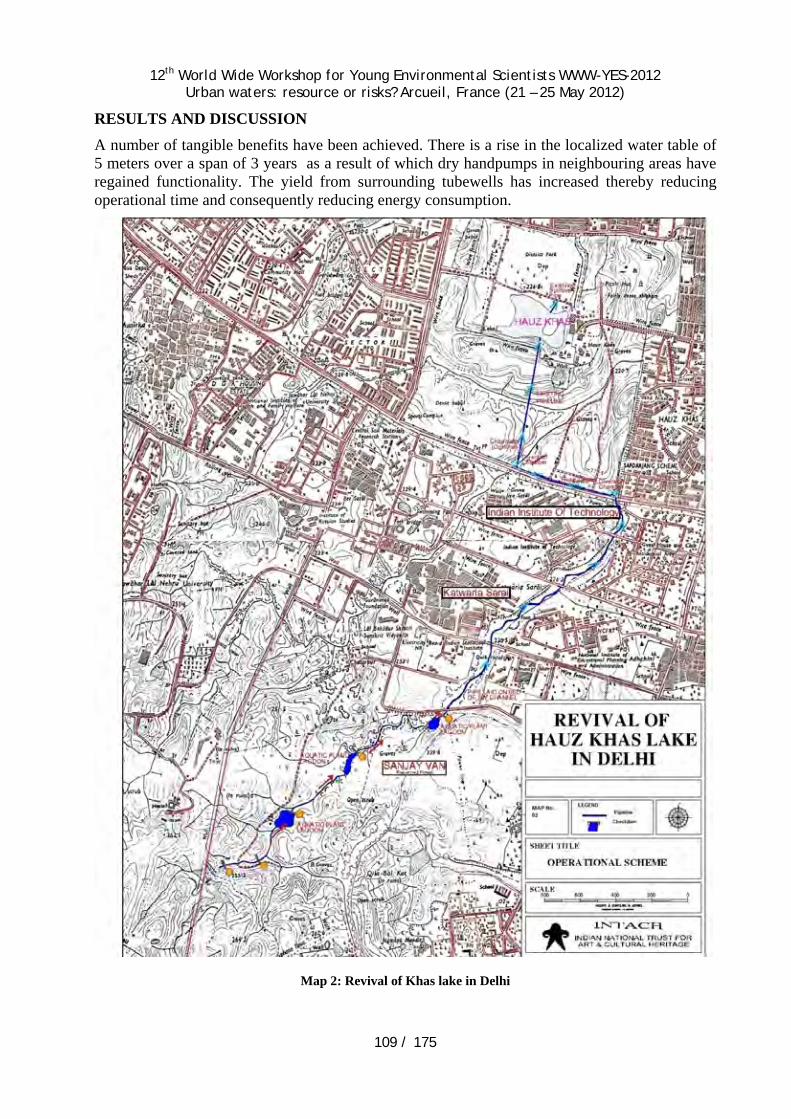
12th World Wide Workshop for Young Environmental Scientists WWW-YES-2012 Urban waters: resource or risks? Arcueil, France (21 – 25 May 2012)
109 / 175
RESULTS AND DISCUSSION A number of tangible benefits have been achieved. There is a rise in the localized water table of 5 meters over a span of 3 years as a result of which dry handpumps in neighbouring areas have regained functionality. The yield from surrounding tubewells has increased thereby reducing operational time and consequently reducing energy consumption.
Map 2: Revival of Khas lake in Delhi

WWW-YES-2012 proceedings (draft version)
110 / 175
Rain water, to the tune of 500 million litres, has been harvested to date. Due to the high percolation rate this has all been recharged to the aquifer. Overall the groundwater quality has improved as shown by post-project groundwater tests.
The treated effluent which further downstream was getting re-polluted in the open drains, is now being further cleaned and recharged to the aquifer. It has been recycled and after soil filtration through lake bed has contributed to the rise in the water table. Analysis of the groundwater samples [2004 and 2007] have shown improvement in a number of parameters. pH reduced to 7.1, biological oxygen demand reduced from 3mg/L to 1 mg/L, nitrates fell from 20mg/L to 1.14 mg/L. The estimated volume of this recharge is 3500 million litres. Thus, the total recharge effected through this project is 4000 million litres to date.
Bioremediation of lake water ensured that the BOD in lake water fell from 50 mg/L to 15 mg/L. visual water quality drastically improved within a month and turbidity level improved as well. This process was instrumental in controlling algal blooms. The table below details water quality improvement in lake waters
Table 11: Water Quality analysis of lake water during bioremediation process pH Turbidity
(FNU) Conductivity (µmhos/cm)
BOD (mg/L)
Week
Spot 1 Spot 2 Spot 1 Spot 2 Spot 1 Spot 2 Spot 1 Spot 2
First Week (13 – 19 July 2007)
9.57 9.25 102 174 800 797 50 70
Second Week (20 – 26 July 2007)
9.07 9.13 52 158 787 787 17 34
Third Week (27 July-02 August 2007)
8.82 9.02 50 131 761 748 15 28
The lake has steadily acquired the characteristics of a natural eco-system. While fish have been introduced into it, some tortoises have also made their way into it. The fish have now become quite large and fish weighing even 3 kilograms have been landed. Several wild ducks have been attracted here and have also been breeding as is evident by the large number of ducklings. Thus 12 species of birds have been observed here, amongst them, Northern Shovellers from Central Asia. The observed species include spotbill ducks, black-winged stilts, pond herons, garganey duck, gadwall duck, pied kingfisher, white-breasted kingfisher, plovers, coots, waterhens. In the winter of 2006-2007 the bird count reached 500. Spot-billed duck, Indian moorhen and White-breasted waterhen are resident water birds that regularly breed in the lake.
The recreation of an environmental asset and its transformation into a natural habitat with pleasing visual characteristics is beginning to attract citizens to the area as well as to the nearby markets. The historical monuments on the southern corner now have an original water foreground to reflect them.
Given Delhi’s large number of waterbodies, it has potential to house natural restored wetlands. While a large number of water bodies- 21 out of 44 surveyed have gone dry, it is due to rapid urbanization and falling groundwater tables. These were smaller depression that were not protected, however, those waterbodies that were either larger in size or were part of city greens/ institutional areas have survived. The survey shows immediate need to preserve remaining water bodies and restoring the ones that have gone dry.
It is demonstrated by restoration of Hauz Khas lake, the waterbodies in urban areas can not only be restored but develop into functional ecosystems. Restoration of ecosystem services garners

12th World Wide Workshop for Young Environmental Scientists WWW-YES-2012 Urban waters: resource or risks? Arcueil, France (21 – 25 May 2012)
111 / 175
public support. Such restoration efforts could be extended to other lakes in Delhi as also to urban waterbodies across the country.
Even in the face of encroaching development, urban wetlands can retain an impressive amount of integrity. Despite their need for restoration and management, urban wetlands remain functional and diverse ecosystems. It is important that urban wetlands as well as forests be accessible to people, though it may be argued by ecologists (purist) as source of disturbance, therefore, a threat to ecosystem.
Some challenges pertain to the established paradigm of engineered solution. In a country like India we can ill afford the cost intensive and energy intensive engineered solution. The low confidence in ecosystem approach to restoration of lakes and control of pollution needs a change. It also stems from a root cause that ecologists and environmentalists are not part of decision making and planning process. Time has come to look at the issues of urban environment in landscape context rather than isolated project.
CONCLUSION An effort towards restoration of urban lakes through innovative measures has been demonstrated by INTACH through its project on Haus Khas. Other similar innovative endeavours are required. Further, instead of a project based approach conservation of urban lakes needs to be part of master plans. Lest proactive measures are taken the remaining waterbodies of Delhi will disappear as many have.
Lastly, urban environment research in the India is limited to pollution abatement in the conventional way. The need now is to identify and accept that there are ‘natural’ areas within urban areas. That there are several ecosystems including wetlands/ lakes and forest that are functional ecosystems; that these are in need of conservation and that the urban wetland and lakes add to the quality-of-life. Research in urban forestry, urban wetlands and urban lakes is required to establish their role in provision of ecosystem services, as wildlife habitats, as carbon sinks, as climate ameliorators, as controllers of pollution, and for their position in hydrology.
REFERENCES • Bolun, P., and Hunnammar, S., 1999, Ecosystem Services in Urban Areas, Ecological Economics
29: 293-301 • Bronmark,C., & Hansson,L., 2002, Environmental Issues in Lakes and Ponds: Current State and
Perspectives- Environmental Conservation 29:290-306 • Ehrenfeld, J.G., 2000, Evaluating Wetlands Within an Urban Context, Urban Ecosystem 4: 69-85 • Ehrenfeld, J.G., 2005, Backyard Bogs: Understanding Urban Wetland Functions and
Management, National Wetlands Newsletter, USA (March-April 2005) • Gopakumar, P.S. and Kaimal, P.P., Loss of wetland breeding habitats and population decline of
white breasted water hen Amaurornis phoenicurus phoenicurus(Pennant)- A Case Study; in Proceeding of Taal 2007: 12th World Lake Conference pp. 529-36
• Mohan, D. and Gaur, A., Avian Diversity Around Jajiwal Pond -A Natural Wetland; in Proceeding of Taal 2007: 12th World Lake Conference pp. 542-546
• Rathod, J. and Padate, G.S., A comparative study of avifauna of a sub-urban wetland and an irrigation reservoir of Savli Taluka, District Vadodra, in Proceeding of Taal 2007: 12th World Lake Conference pp. 537-541
WWW-YES-2012 proceedings (draft version)
112 / 175
11. Developing decision support tools for optimum domestic management by Bayesian belief networks in Tehran, Iran
Mehdi ASADI LOUR *, F. KAVEH*, M. MANSHURI* and A. KHOSROJERDI*
* Department of Water Engineering, Islamic Azad University Science and Research Branch of Tehran, Iran (E-mail: [email protected] )
Abstract Water demand is increasing on a general basis all over the world, a fact, which is being aggravated by decreased water quality and quantity. Faced with this situation, a Bayesian Network was developed by means of stakeholder’s participation which is intended to be useful in the decision-making process related to water resource management in the Hydrogeological Unit ‘‘Tehran city’’. The main problem in the region is the risk of exploitation of the local aquifer, and quality of drinking water. This paper firstly show a BN model which was developed to assess the impact of a range of management interventions identified during the study and secondly present the results obtained through the application.A Bayesian model network, which utilizes the stakeholders’ knowledge and real data in design of management tools, was established to allocate water requirement in real time operation. In our case, this applies to the construction and setting up of a Bayesian Network, which may prove to be of assistance in the decision-making process leading to proper water management policy in Tehran. To assess the impacts of potential water management actions, a number of scenarios were simulated and compared to the ‘‘current condition’’ scenario (CuCo) as described by data available in the hydrological year 2009–2010.
Keywords Decision Support System (DSS), Bayesian network (BN), Integrated Water Resources Managements (IWRM), stakeholders, Tehran
INTRODUCTION Water resource systems have benefited both people and their economies for many centuries. The services provided by such systems are multiple. Yet in many regions water resource systems are not able to meet the demands, and sometimes even the basic needs, for clean fresh water. Inadequate water resource systems reflect failures in planning, management, and decision making and at levels broader than water. Over the centuries surface and ground waters have been a source of water supply for agricultural, municipal, and industrial consumers. They have provided people water-based recreational opportunities and have been a source of water for wildlife and their habitat. They have also served as a means of transporting and transforming waste products that are discharged into them. The use of groundwater to supply large surfaces of irrigated land has been the key to agricultural development in a large number of countries over the past few years. In arid and semiarid zones, irrigation using groundwater has transformed good quality dry land with low productivity into high productive areas. Consequently, the income level for the farmers has increased and the rural population base has been maintained. (Bernabe´u and Serna, 2002). Groundwater extraction should be kept sustainable by balancing abstractions with the recharge of the aquifer. Overexploitation of the systems has often been a risk in the past, leading to

12th World Wide Workshop for Young Environmental Scientists WWW-YES-2012 Urban waters: resource or risks? Arcueil, France (21 – 25 May 2012)
113 / 175
serious environmental damage and contributing to the desertification process. Moreover, the exploitation of this land will eventually prove to be uneconomical in the future (Martı´n de Santa Olalla and de Juan Valero, 2001). In addition, it is necessary to have participation by the stakeholders in the water situation to management of water resources. So that they can have the opportunity to identify the issues that are most important them; even though this may give rise to conflicts and opposing opinions, the process is enriched by it and consensus solutions may be found. The concept of integration means that the impact produced by a given type of management or by a specific decision is not limited to water availability, but may also span related aspects of the resource and its medium. In this sense, it has been remarked that ‘‘Many watershed management problems require holistic, integrated solutions’’ (Prato and Fulcher, 1998). This paper discusses a model based on a Bayesian Network (BN) has been applied as an integrating tool for Tehran city water system supplied. The aim of this paper is firstly to show a BN model which was developed to assess the impact of a range of management interventions identified during the study and secondly to present the results obtained through the application.
Integrated water resources management of Tehran domestic system Participation and integration are increasingly accepted by international organizations and national authorities as central principles for decision making in the environmental field (Castelletti2007). in the study area to prepare Water Basin Management Plans in accordance with the principles of Integrated Water Resource Management (IWRM), and with the express requirement of active stakeholder participation in the planning process. The water management challenge in this area is to develop strategies that are able to strike a balance between water resource sustainability and agricultural sector profit. At least two conditions are necessary for the development of effective strategies. The first is the active participation of stakeholders in the management and decision-making process; the second is the application of tools that enable the problem to be tackled in an integrated way using multi- disciplinary skills. Only by ensuring these conditions suitable, sustainable strategies and policies can be formulated and more importantly implemented.( Martı´n et al.,2007) Tools used to support the implementation of IWRM can be divided into two main groups, models and Decision Support Systems (DSSs) (Barthel et al., 2008). Models are descriptions of a real-world system that simplify calculation and prediction. However, although these models are highly useful for studying water resources and impacts on the environment, in most cases they are not designed to address and integrate widely-varying aspects such as the socio-economic, legal and cultural issues related to water management (Henriksen et al., 2006). DSSs are considered the best tool for approaching an integrated analysis of water management. Such systems apply reason similar to that of a human being, who is the expert in the subject (Stevens, 1984). In addition, there are also several commercial software packages, specifically designed for each type of DSS, (Cain, 2001). DSSs can be either stochastic or deterministic, depending on whether or not; they deal with processes containing a degree of uncertainty. Stochastic DSSs are further sub-divided depending on how uncertainty is dealt with, and include methods such as certainty factors (Buchanan and Shortlife, 1984), evidence theory (Sapher, 1976) and probabilistic methods. In this study, the selected technique is a probabilistic method: Bayesian Networks (BNs). In this paper we consider the Participatory and Integrated Planning (PIP) procedure described in Soncini-Sessa et al. (in press-a-b) and in Castelletti and Soncini-Sessa (2006) with some

WWW-YES-2012 proceedings (draft version)
114 / 175
adjustment, which was developed specifically for Tehran water systems. As shown in Fig.1, the proposed methodology includes some main components namely water balance simulations, PIP procedure, and finally developing real time operating rules for groundwater management by training a BN. The model inputs are the Tehran dams operating data, inflow to dams, population, water consumption per capita and Tehran aquifer information. The water balance model (WEAP soft) used to simulate existing condition. Afterwards structural of Tehran Bayesian Network was made. By the outputs of water balance model, the CPTs populated, i.e. filled in with probability values. These may be derived from operational dam data, elicited from experts. The outputs of the proposed methodology are the Probability Distribution Function (PDF) of optimal fractional allocation of each dams and the PDF of optimal policies for groundwater exploitation. Therefore, a decision maker can decide optimally being aware of the variations of the total groundwater exploitation.
MATERIAL & METHODS
Bayesian network Bayes’ theorem, developed by the Rev. Thomas Bayes, an 18th century mathematician and theologian, was first published in 1763. Mathematically it is expressed as:
Where we can update our belief in hypothesis H given the additional evidence E and the background context c. The left-hand term, P(H|E, c), is known as the “posterior probability”, or the probability of H after considering the effect of E on c. The term P(H|c) is called the “prior probability” of H given c alone. The term P(E|H, c) is called the “likelihood” and gives the probability of the evidence assuming that the hypothesis H and the background information c is true. Finally, the last term P(E|c) is independent of H and can be regarded as a normalizing or scaling factor (Martı´n de Santa Olalla and De Juan, 2001). Bayes’ theorem provides a mathematical framework for processing new data, as they become available over time, so that the current posterior distribution can then be used as the prior distribution when the next set of data becomes available. Determining the prior distribution is usually based on generic data, and the new or additional data usually involve system-specific test or operating data. The resulting posterior distribution would then be the system-specific distribution of the parameter. The above Bayesian probability theory allows one to model uncertainty about the events and outcomes of interest by combining common-sense knowledge and observational evidence. This is done using Bayesian networks. The network is commonly represented as a graph, which is a set of nodes and arrows. The nodes represent the probabilistic state variables and the arrows represent the causal relationships between these variables. A Bayesian Network (BN) is a type of Decision Support System (DSS) based on a probability theory which implements Bayes’ rule (Pearl, 1988; Jensen, 1996; Jensen, 2001; Bayes, 1991). BNs have gained a reputation of being powerful techniques for modeling complex problems involving uncertain knowledge and impacts of causes. The part of the net defined by variables and links is relatively easily communicated to stakeholders (Henriksen et al., 2007b). The multilateral properties of belief networks appear to allow their use in multiple ways in resource and environmental modelling (Varis and Kuikka, 1999). According to Cain (2001), a BN can also be defined as follows: ‘‘Some nodes that represent random variables that interact with others. These interactions are expressed like connections between variables’’. The use of BNs presents a series of advantages over that of other Environmental DSSs, as mentioned in

12th World Wide Workshop for Young Environmental Scientists WWW-YES-2012 Urban waters: resource or risks? Arcueil, France (21 – 25 May 2012)
115 / 175
previous studies (Bromley, 2003, 2005; Castelletti and Soncini-Sessa, 2007). For instance, according to Borsuk et al. (2004), the graphical structure explicitly represents a cause–effect relationship between system variables that may be obscured under other approaches. Netica is a complete software package to work with Bayesian Belief network, decision net and influence diagrams. it is used to model the problem and perform the computations, use these to answer queries and find optimal decisions, and create probabilistic expert systems. It is suitable for applications in the areas of diagnosis, prediction, decision analysis, probabilistic modeling, risk management, expert system building, sensor fusion, reliability analysis, and certain kinds of statistical analysis and data mining.(help netica) This paper seeks to attach greater importance of Bayesian network, which utilize the stakeholders’ knowledge and real data in the design of management tools to allocate water requirement in real time operation. In our case, this applies to the construction and setting up of a Bayesian Network, which may prove to be of assistance in the decision-making process leading to proper water management policy.
Study area This study is set mainly in Tehran the capital of Iran with a total population of about 8,000,000 covers approximately area of 790 km2 and lies within the Tehran basin on the semiarid plains on the south side of the Caspian Sea as shown in Fig.1. The population growth in the next decade will place immense demands on the city’s water resources.
Figure 1. Study area and position of Dams and drinking wells around Tehran city
Current water supply and demands Five dams included of Karaj, Taleghan, Lar, Latyan and Mamlu are regulated to supply Tehran domestic demands, but they are only supply approximately 72% of demands in current condition. Groundwater has an important role in supplement of the remaining domestic demands when surface water resources are inadequate. Therefore exploitation of ground water has been increased as a safe water resource. The annual exploitation of subterranean water for supply is increasing and currently is approximately 250 MCM, which is drawn In Table 1. In 2006 the surface water resources supply Tehran domestic with 705 MCM/year while a further 250

WWW-YES-2012 proceedings (draft version)
116 / 175
MCM/year are pumped from 200 deep wells with an average depth of 130 m to water supply network. With regards to increasing population and water demand in next decays, Taleghan and Mamlu dams will be added to Tehran water supply cycle and supply approximately 185 MCM of Tehran domestic demands (Table 1). On the other hand Tehran lacks an adequate wastewater collection and treatment system. In 2006, the total municipal water consumption was around 955 MCM that approximately 85% of this is returning water and 165 MCM of domestic return flow are reclaimed by waste water treatment plant. In 2035 all of the Tehran wastewater network will complete and return flow will being refined. Now most of the city’s wastewater is disposed under the ground, without any treatment, through the use of injection wells. This type of disposal is unique and has caused some water supplies to be polluted, raised the water table in some aria, and degraded surface water channels. With regard to this dangerous levels of nitrates have been found in Tehran’s drinking water in recent years due to contaminated sources tapped to address population overgrowth. Therefore it should be restricted the use of groundwater as a source of Tehran domestic supply and imperative strategies should be adopted to regulate the minimum volume of water abstraction in order to sustain the quality of drinking water in Tehran.
Table1. Tehran domestic demand and regulated water to supply (Tehran Regional Water Company)
Karadj Dam
Taleghan Dam
Latyan Dam
Lar Dam
Mamlu Dam
Ground water
2006 7,500,000 330 903.4 51.6 315 ‐ 280 110 ‐ 250
2035 10,000,000 298 1087.7 70.3 340 115 320 165 70 148
year
Tehran water supply resources(MCM)Tehran Other demands (MCM)
Tehran domestic demand (MCM)
Consumption per capita (lit/day)
Population
Representation in WEAP There is one main demand that is represented in the model: urban demand in Tehran. It is calculated by the Tehran Water and Sewage Company. For modeling Tehran water and resources, a hydrological study performed through a mass balance model using WEAP (Water Evaluation And Planning System). For this monthly water accounting was constructed for whole system. WEAP is distinguished by its integrated approach to simulating water systems and by its policy orientation. The outputs of these WEAP model regarding to operational dam data and water balances was the input information introduced in the DSS. Demands and supplies are represented on a monthly basis for the years 1972-2010 for purposes of calibration. We included as much detail as was needed to properly characterize both demand and supply sources, subject to the availability of field data. The representations consist of the following main elements: Distribution System: In the WEAP model, distribution system is either municipal supply (for Tehran city). From west to east, the active dams are Karaj (Amirkabir), Taleghan, latyan, Mamlu, and Lar. Account is taken of inflows, outflows, releases, evaporative losses, and groundwater interactions. Problems that are facing water resources management in Tehran can be summarized as increase in demand and waste production due to population growth and socioeconomic development; decrease in availability of water per capita; high losses of urban water; and local depletion and pollution of surface and groundwater. Urban water management in this city will fail without a holistic and integrated view. Water allocation within WEAP is carried out by using user-specified priorities for demands and sources. The WEAP algorithm is implemented as a series of linear programming (LP) problems, iterated over demand and supply priorities. After observing the patterns of dam releases and volumes over time, the WEAP outputs were specified to train CPTs of Bayesian network.

12th World Wide Workshop for Young Environmental Scientists WWW-YES-2012 Urban waters: resource or risks? Arcueil, France (21 – 25 May 2012)
117 / 175
Structure of the Bayesian network In this paper only three uses of Bns are considered: (1) for modeling, when they are used to describe the system being studied; (2) for aiding decision making, when they include decision and utility nodes, and are employed as a decision support system (DSS). (3) A third use does exist, however: Bns can be used as a visualization tool to summarize simply the outcomes of more complex models. This tool may be part of a more complex DSS. Fig.2 shows the BN of Tehran water system in Netica.
Figure 2. Single BN of Tehran water supply network under current condition
Variable description The BN used to describe each dam is divided into two main sections; one deals with the water mass balance, the other with operation data conditions. Of course, the dams are not identical, which means that the configuration of each one is slightly different to reflect the specific circumstances of each dam. Fig. 3 and Table 2-8 reveal all variables and their states that appear in the dam networks, though not all appear in each and every dam; the variables of the networks are also shown. The water balance variables were defined using the water balance models developed for this research. The CPTs for BN(Bayesian Network) variables were entered automatically via the Learning Wizard module, using data obtained from the output of WEAP model constructed for each dam. Automatically entered variables included ‘‘Rainfall’’, ‘‘Soil conservation’’, ‘‘Inflow to dam’’ and ‘‘Dam storage’’. The relationship among these variables was established within the mass water balance model. The BN variables were trained from two ways: 1) Firstly from a mass water balance simulation model (WEAP) in which the main variables were defined and after doing simulation process the outputs used to train BN network variable and CPT. 2) Secondly, from the operational dam data in which all data included ‘‘Inflow to dam’’, ‘‘domestic, agriculture and other outflows’’ and ‘‘dam storage’’, are measured daily. To summarize, states of the variables (Tables 2 and 3) were defined according to the outputs of the previous models made in the sectorial studies (mass balance model), as well as according to the results from the operational dam data, As in many previous studies (Borsuk et al., 2004; Bromley et al., 2005; Ticehurst et al., 2005), variables have been parameterised using either knowledge or data.
Lar dam System
Latyan dam System
Mamlu dam System
Karaj dam System
Taleghan dam System
Tehran city System

WWW-YES-2012 proceedings (draft version)
118 / 175
Table2. Extended list of variables and their states for Karaj Dam system
statePercipitation
(mm)Inflow to Dam(MCM)
soil conservation
(CN)
Dam storage (MCM)
Domestic Release to Tehran (MCM)
A 0‐25 0‐25 90 0‐50 0‐5B 25‐50 25‐50 70 50‐100 5‐10C 50‐75 50‐100 ‐ 100‐150 10‐15D 75‐100 100‐150 ‐ 150‐205 15‐20E 100‐125 >150 ‐ ‐ 20‐25F 125‐150 ‐ ‐ ‐ 25‐30G >150 ‐ ‐ ‐ 30‐35H ‐ ‐ ‐ ‐ ‐
Table3. Extended list of variables and their states for Mamlu & Taleghan Dams system
stateInflow to
Dam (Latyan Spill)
Dam storageDomestic Release to Tehran
Inflow to Dam Dam storageDomestic Release to Tehran
A 0‐25 0‐40 0‐2 0‐25 50‐100 3‐6B 25‐50 40‐80 2‐4 25‐50 100‐150 6‐9C 50‐100 80‐120 4‐6 50‐75 150‐200 9‐12D 100‐150 120‐160 6‐6.45 75‐100 200‐250 12‐15E >150 160‐200 ‐ 100‐125 250‐300 >15F ‐ 200‐240 ‐ 125‐150 300‐350 ‐G ‐ 240‐250.6 ‐ 150‐200 350‐400 ‐
H ‐ ‐ ‐ >200 400‐420 ‐
MCMMCM
Mamlu Dam Taleghan Dam
Table4. Extended list of variables and their states for Lar Dam system
statePercipitation
(mm)Inflow to Dam(MCM)
soil conservation
(CN)
Dam storage(MCM)
Domestic Release to Tehran(MCM)
A 0‐40 0‐25 90 0‐50 0‐5B 40‐80 25‐50 70 50‐100 5‐10C 80‐120 50‐100 ‐ 100‐150 10‐15D 120‐160 100‐150 ‐ 150‐200 15‐20E 160‐200 >150 ‐ 200‐250 20‐25F 200‐240 ‐ ‐ 250‐300 25‐30G >240 ‐ ‐ 300‐350 30‐35H ‐ ‐ ‐ ‐ 35‐46
Table5. Extended list of variables and their states for Latyan Dam system
statePercipitation
(mm)Inflow to Dam(MCM)
soil conservation
(CN)
Dam storage (MCM)
Domestic Release (MCM)
Latyan Spill(MCM)
A 0‐40 0‐25 90 0‐50 0‐5 0B 40‐80 25‐50 70 50‐100 5‐10 0‐20C 80‐120 50‐100 ‐ 100‐150 10‐15 20‐40D 120‐160 100‐150 ‐ 150‐200 15‐20 40‐60E 160‐200 >150 ‐ 200‐250 20‐25 60‐80F 200‐240 ‐ ‐ 250‐300 25‐30 80‐105G >240 ‐ ‐ 300‐350 30‐35 ‐H ‐ ‐ ‐ ‐ 35‐46 ‐

12th World Wide Workshop for Young Environmental Scientists WWW-YES-2012 Urban waters: resource or risks? Arcueil, France (21 – 25 May 2012)
119 / 175
Validation of the DSS Evaluation and validation of the DSS was conducted in collaboration with stakeholders (government managers) and by using information from parallel studies being undertaken by the Tehran water company. Results obtained from the numerical part of the DSS based on BNs are in line with results of previous hydro-economic partial studies. The whole process cannot be carried out by the analyst alone, but should be done together with the stakeholders and government managers. These water actors indicated whether the results offered by the DSS, both partial and global, are acceptable or, on the contrary, the relationships between variables, their states or their probabilities should be changed in order to make them acceptable. In order to achieve this aim, one meetings were held. Thus, the stakeholders’ participation is justified. So, a ‘‘user validation’’ has been performed. Once the model has been validated, we can be certain that the stakeholders included Tehran regional water company and Tehran water & wastewater company managers will trust the BN further down the decision-making process.
RESULTS FROM SIMULATION OF WATER MANAGEMENT SCENARIOS The existing surface potential to supply Tehran demand is totally almost 730 MCM from 3 dams. The surface water resources have been regulated to the highest capacity during the critical period. Also there are no anymore surface resources to transfer Tehran. Continue with the status quo and increasing population, water demand will increase and because of limitation in surface water, more ground water will extract. On the other hands excessive withdrawal of groundwater resources has other consequences like Nitrate increscent in drinking water and Tehran aquifer instability. For optimum management other policies in order to reduction of water consumption should be taken. To assess the impacts of potential water management actions, a number of scenarios were simulated and compared with ‘‘current condition’’ scenario (CuCo) as described, by data available in the hydrological year 2009–2010. For example the result of BN for Karaj dam in current condition is shown at Fig.3. Proposed scenarios in next Section have been based on actions carried out in Tehran water system as well as information obtained from water managers and operational data. All states and probability distributions for every intervention were, as far as possible, based on information obtained from managers (stakeholders).
Figure 3. Bayesian network structure for Karaj dam (current condition)
Results from simulation of current condition (CuCo) The results of simulations representing current conditions for each dam and for the overall system can be summarized as follows (Table 7-9).

WWW-YES-2012 proceedings (draft version)
120 / 175
Tehran has population about 8,100,000 in 2011. This population requires about 980 MCM water per year. Dams around Tehran regulate approximately 730 MCM per year and rest of demand is supplied through ground water extraction. Net demand per capita in current condition is about 260 (lit/day) and the most probability of monthly water demand of city has a 53.4% to be between 75-83.3 MCM (Table 8). There is 38.4% chance that the ground water extraction rate will be 0 (not extraction). If the probability of ground water extraction (Table 9.) be less, indicate decreases in uses of ground water and good for stakeholders (people and managers). The probability of domestic demand of Tehran in current condition is shown in Fig4.
Figure. 4. Bayesian network structure for Tehran city (current condition)
People Cooperation to Reduce water Consumption (PCRC) In our case, the main use is for urban, which accounts for more than 90% of the total water consumed. Tehran people are therefore the first element to be taken into account in the management of water resources. Urban green space and industrial use accounts less than 10% of the total resources involved. It is managed on a joint basis, as industrial consumers are connected to the urban network. The bodies who are responsible for supplying of drinking water to municipal districts are Tehran regional water company and Water and Sewage. With regard to last studies and manager opinions, people cooperation has a important role in reduction of water consumption. so that with good cooperation of people the net demand per capita will decrease and following that probability of ground water extraction at 0 (not extract state) increases to 46.1% in this scenario.
Urban Water price increases (UPWI) After announcing the fuel rationing policy in 2008, government decided to eliminate subsidies in order to manage consumption of natural resources. Thus, a cashing subsidy policy has been applied since end of 2010. The results of subsidies elimination in last 12 month show reduction of 20% in water consumption. Therefore the role of increase in water price is unavoidably. Price increases in water prices to double in existing rate causes that net demand per capita reduce and probability of ground water extraction at 0 (not extract state) increases to 55.4% in this scenario rather that current condition.
Reduce population growth rates and prevent migration to Tehran(RPGR) Tehran has faced critical situation regarding to population and mitigation rate in last year. On the other hand available water resources are limited. We consider effect of population growth on ground water extraction in RPGR rather than CuCo. In the near future with increase of population from A state to B state, probability of ground water extraction at 0 (not extract state) decreases to 19.8% in this scenario.

12th World Wide Workshop for Young Environmental Scientists WWW-YES-2012 Urban waters: resource or risks? Arcueil, France (21 – 25 May 2012)
121 / 175
Improvement of Urban Water Network (IUWN) Since the 1980s access to urban water supply has increased from 75.5% to 98%. However, a number of challenges remain. According to the World Bank, Tehran is suffered by “low water distribution efficiency in urban network”. According to water meters information’s published by Tehran water and wastewater company (WWC), water distribution efficiency is approximately 85%. With improvement of this, gross demand per capita will decrees, subsequently probability of ground water extraction at 0 (not extract state) increases to 51.1% in this scenario(table 9).
Best Condition in Water Management (BCWM) In this scenario all the policy that helps the managers to decrease water consumption are considered. The policies are shown in table 7. with regard to all effective policies, net demand per capita will be reduced to its lowest rate and probability of ground water extraction at 0 (not extract state) increases to 70% in this scenario(table 8).
Table6. Extended list of variables and their states for Tehran city system
stateWater Price
(Rial/m3)population
Net demand per capita (lit/day)
Pepole cooperation
Urban Network
improvement
Yearly Domestic demand of
A 250 7,510,000 ‐8,490,000 182 ± 13% Aphatetic YES 500‐600B 300 8,500,000 ‐9,490,000 208 ± 13% Good NO 600‐700C 350 9,510,000 ‐10,490,00 234 ± 13% ‐ ‐ 700‐800D 400 10,510,000 ‐11,490,000 260 ± 13% ‐ ‐ 800‐900E ‐ ‐ ‐ ‐ ‐ 900‐1000F ‐ ‐ ‐ ‐ ‐ 1000‐1100G ‐ ‐ ‐ ‐ ‐ 1100‐1200H ‐ ‐ ‐ ‐ ‐ 1200‐1400I ‐ ‐ ‐ ‐ ‐ 1300‐1400J ‐ ‐ ‐ ‐ ‐ 1400‐1500
Table7. Comparison of the impacts on net demand per capita caused by the water management implementation
populationPepole
cooperationUrban Network improvement
Water Price
182 ± 13% 208 ± 13% 234 ± 13% 260 ± 13%
CuCo A Apathetic No A 0 0 0 100
PCRC A Good No A 4 12 9 75
UWPI A Apathetic No D 25 10 5 60
RPGR B Apathetic No A 0 0 0 100
IUWN A Apathetic yes A 0 0 0 100
BCWM A Good yes D 25 17 13 45
objective LikelihoodNet demand per capita
variables in scenarios
scenarios
Table8. Comparison of the impacts on Monthly Domestic Demand of Tehran by the water management implementation
populationPepole
cooperationUrban Network improvement
Water Price
41.7‐50 50‐58.3 58.3‐66.7 66.7‐75 75‐83.3 83.3‐91.7 91.7‐100 100‐108.3 108.3‐116.7 116.7‐125
CuCo A Apathetic No A 0 0 0 24.4 53.4 22.2 0 0 0 0
PCRC A Good No A 0.44 4.44 9.92 26.5 42 16.7 0 0 0 0
UWPI A Apathetic No D 2.8 17.7 13.1 20 33.1 13.3 0 0 0 0
RPGR B Apathetic No A 0 0 0 0 20 48.9 28.9 2.2 0 0
IUWN A Apathetic yes A 0 0 13.3 53.3 31.1 2.3 0 0 0 0
BCWM A Good yes D 11.5 22.9 21.3 29 14.3 1 0 0 0 0
Monthly Domestic demand of Tehran (MCM)objective Likelihood
variables in scenarios
scenarios
Table9. Comparison of the impacts on Ground Water Extraction by the water management implementation

WWW-YES-2012 proceedings (draft version)
122 / 175
populationPepole
cooperationUrban Network improvement
Water Price
Not extract (0)
0‐5 5‐10 10‐15 15‐20 20‐25 25‐30Other states
CuCo A Apathetic No A 38.4 12 12.2 11.2 9.3 6.9 4.6 5.4
PCRC A Good No A 46.1 11.4 11.1 9.8 7.9 5.7 3.8 4.2
UWPI A Apathetic No D 55.4 9.94 9.31 8 6.35 4.6 3 3.4
RPGR B Apathetic No A 19.8 8.42 10.2 11.3 11.6 10.8 9.22 18.66
IUWN A Apathetic yes A 51.1 12.2 11.3 9.25 6.76 4.41 2.57 2.41
BCWM A Good yes D 70 8.7 7.2 5.5 3.9 2.4 1.4 0.9
variables in scenarios
scenariosGround water extraction(drinking)
objective Likelihood
CONCLUSIONS This paper shows the way in which a city water system can be modeled and integration of hydrological and social factors simulated using a Bayesian Network (BN) approach. There is a high degree of uncertainty concerning the decision-making process. For this reason and because of the large number of variables and complex nature of the system, the use of the BN technique is justified. To evaluate the possible impacts caused by future water management actions on the water system, some interventions have been selected and simulated by the model. Results reveal that under current conditions, it is not possible to recover all demands of Tehran by surface water resources. Furthermore, results also reveal that any intervention should be taken to reduce drawdown of ground water. This paper provides a practical demonstration of how a BN model may be used to support water resource management decision-making exemplified in Tehran. It has also been demonstrated that BN can be used to balance Tehran versus the hydrological sides of the equation. The results of the model application show the direction and the order to which the efforts should be directed. Stakeholder participation (manager and people) is the key to achieve the validation of this type of model, as well as strengthening collaboration and increasing confidence among stakeholders, managers and researchers.
ACKNOWLEDGEMENTS The author gratefully acknowledges the contributions of the following people and organizations: Dr. Reza Karachian, from the Tehran University for his suggestion in use of BN; Dr. K. Shiati and M. shafeefar from Yekom consulting engineering company, for their cooperation. Package Netica that was the software used for this study.
REFERENCES • Barthel, R., Janisch, S., Schwarz, N., Trifkovic, A., Nickel, D., Schulz, C., Mauser, W. (2008).
An integrated modelling framework for simulating regional-scale actor responses to global change in the water domain. Environmental Modelling & Software 23, 1095–1121.
• Bayes, T., (1991). 1763. ‘‘An essay towards solving a problem in the doctrine of chances’’ Bayesian Statistics: Principles, Models, and Applications: 189 215.
• Bernabe´u, R., Serna, J. (2002). Ponencia ‘‘Los grandes cultivos herba´ceos de regadı´o en Castilla-La Mancha’’. Libro Blanco de la Agricultura y el Desarrollo Rural. Jornada Autono´mica de la Comunidad de Castilla-La Mancha. Toledo, Spain.
• Bromley, J. (2005). Guidelines for the Use of Bayesian Networks as a Participatory Tool for Water Resource Management. Based on The Results of The MERIT Project. Centre for Ecology and Hydrology, Wallingford.
• Bromley, J., Jackson, N., Clymer, O., Giacomello, A., Jensen, F. (2005). The use of Hugin to develop Bayesian Network as an aid to integrated water resource planning. Environmental Modelling & Software 20, 231–242.

12th World Wide Workshop for Young Environmental Scientists WWW-YES-2012 Urban waters: resource or risks? Arcueil, France (21 – 25 May 2012)
123 / 175
• Buchanan, B.G., Shortlife, E.H. (1984). Rule-based Expert Systems: The MYCIN Experiments of the Stanford Heuristic Programming Project. Addison-Wesley, Reading.
• Borsuk, M.E., Stow, C.A., Reckhow, K.H. (2004). A Bayesian network of eutrophication models for synthesis, prediction, and uncertainty analysis. Ecological Modelling 173, 219–239.
• Cain, J., 2001. Planning Improvements in Natural Resources Management. Centre for Ecology and Hydrology, Wallingford, UK.
• Castelletti, A., Soncini-Sessa, R. (2007). Bayesian Networks and participatory modeling in water resource management. Environmental Modelling & Software 22, 1075-1088.
• Henriksen, H.J., Rasmussen, P., Brandt, G., von Bu low, G., Jensen, F.V. (2006). Public participation modelling using Bayesian networks in management of groundwater contamination. Environmental Modelling & Software 22 (8), 1101–1113.
• Hisschemo¨ ller, M., Tol, R.S.J., Vellinga, P. (2001). The relevance of participatory approaches in integrated environmental assessment. Integrated Assessment 2, 57–72.
• Jensen, F.V. (1996). An Introduction to Bayesian Networks. UCL Press, London Jensen, F.V., 2001. Bayesian Network and Decision Graphs. Department of Computer Science, Aalborg University, Aalborg, Denmark.
• Martı´n de Santa Olalla, F., de Juan Valero, A. (2001). In: Martı´n de Santa Olalla, F. (Ed.),El uso del agua en una agricultura sostenible. Agricultura y Desertificacio´n. Ediciones Mundi-Prensa, Madrid, pp. 273–303.
• Martı´n de Santa Olalla, F., Dominguez, A., Ortega, F., Artigao, A., Fabeiro, C. (2007). Bayesian networks in planning a large aquifer in Eastern Mancha, Spain. Environmental Modeling & Software (220), 1089-1100
• Martı´n de Santa Olalla, F.J., Domı´nguez, A., Artigao, A., Fabeiro, C., Ortega, J.F. Integrated hydric resource management of the Hydrogeological Unit ‘‘Eastern Mancha’’ using Bayesian Belief Networks. Agricultural Water Management, in press.
• Molina,J.L., Bromley,J., Garcı´a-Aro´stegui, J.L., Sullivan C., Benavente, J. (2010). Integrated water resources management of overexploited hydrogeological systems using Object-Oriented Bayesian Networks. Environmental Modelling & Software 25 (2010) 383–397.
• Pearl, J. (1988). Probabilistic Reasoning in Intelligent Systems. Morgan Kaufmann, San Mateo, CA.
• Prato, T., Fulcher, C. (1998). Protecting soil and water resources through multi objective decision making. In: El-Swaify, S.A., Yakowitz, D.S. (Eds.), Proceedings of the First International Conference on Multiple Objective Decision Support Systems (MODSS) for Land, Water and Environmental Management. Lewis, New York, pp. 385–394.
• Sapher, G. (1976). A Mathematical Theory of Evidence. Princeton University Press, Princeton. • Stevens, L., 1984. Artificial Intelligence. The Search for The Perfect Machine. Hayden Book
Company, New York • Tajrishy, M., Abrishamchi, A. (1998). Integrated Approach to Water and Wastewater
Management for Tehran, Iran, Water and Sewage, Volume 28, 1998. Pp. 2-11. • Ticehurst, J.L., Rissik, D., Letcher, R.A., Newham, L.H.T., Jakeman, A.J. (2005). Development
of decision support tools to assess the sustainability of Coastal Lakes. In: Zerger, A., Argent, R.M. (Eds.), MODSIM 2005 International Congress on Modelling and Simulation. Modelling and Simulation Society of Australia and New Zealand, Melbourne, Australia, pp. 2414–2420.
• Varis, O., Kuikka, S. (1999). Learning Bayesian decision analysis by doing: lessons from environmental and natural resources management. Ecological Modelling 119, 177–195.

WWW-YES-2012 proceedings (draft version)
124 / 175
12. Investigation of the underground sources of potable water chemical properties and influence of drainage waters on degree of their mineralization
Parviz NORMATOV*, Asliya RAJABOVA**
* Tajik Technical University named after acad. M.S. Osimi, 10 acad. Radzabovikh Ave., Dushanbe, 734022, Tajikistan (E-mail: [email protected] ; [email protected]) ** Institute of Water problems, Hydropower and Ecology of the Academy of Sciences Republic of Tajikistan, 12 Parvin Str., Dushanbe, 734002, Tajikistan (E-mail:[email protected])
Abstract It is well known that superficial and groundwaters constantly in dynamic interaction and thus take it a place penetration and diffusion of the pollution in source of groundwaters. In paper will be are presented results of researches on seasonal change of a chemical compound of the groundwaters of Tajikistan in dependences of the period of year and quantity of precipitation. The present work is devoted to research of research of the opportunity of clearing of waters with application of a method of electro sedimentation. Results of physical and chemical and bacteriological analyses are presented.
Keywords Chloride; nitrate; vegetation; agriculture; electrosedimentation
INTRODUCTION Water one of dynamical components of an ecosystem possesses ability promptly to transfer various pollutions and infectious diseases on the big territories. Though it concerns basically to the surface water but not an exception is also underground waters. It, first of all, is caused by that superficial and underground waters constantly are in dynamic interaction and take thus a place penetration and diffusion of the pollution in source of underground waters. The underground water sources of take the appreciable place in supply of the population of Tajikistan with potable water. Earlier considerable seasonal change of concentration of nitrates as a part of underground waters was revealed: during the droughty periods concentration of nitrates did not exceed unit and in rains reached 18 mg/dm3.The Republic of Tajikistan is the agrarian country and the cotton is basic agricultural production. For good harvest reception many farmers breaking the established norms, apply enough considerable quantities of mineral fertilizers and pesticides. It is necessary to notice that the most of water supply sources of rural population are near to the irrigated lands and is observed getting of pollutions to underground waters at storm rains and irrigation. In the Republic of Tajikistan more than 90 % of agricultural crops are produced on the irrigated lands. Now in Tajikistan it is irrigated 730 Th. ha and for maintenance of level of ground waters on depth 3.0-3.5 m the area more 325 Th. ha is supplied by the collector-drainage network. Other irrigated lands are located basically in the foothill areas concerning high and average parts of cones-carrying out where the territory is provided by a natural drainage with the deep level of the underground waters. The meliorative-adverse lands in Tajikistan are developed mainly in Sogd and Khatlon (region Kurgantube region) areas.
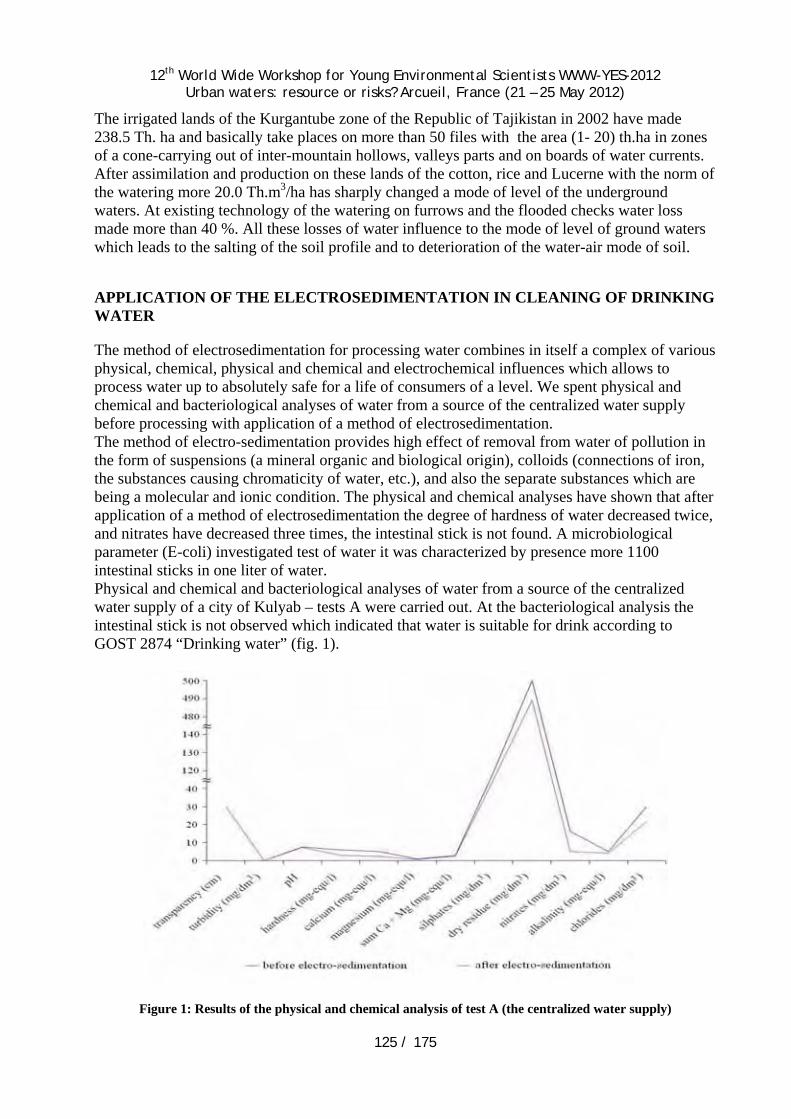
12th World Wide Workshop for Young Environmental Scientists WWW-YES-2012 Urban waters: resource or risks? Arcueil, France (21 – 25 May 2012)
125 / 175
The irrigated lands of the Kurgantube zone of the Republic of Tajikistan in 2002 have made 238.5 Th. ha and basically take places on more than 50 files with the area (1- 20) th.ha in zones of a cone-carrying out of inter-mountain hollows, valleys parts and on boards of water currents. After assimilation and production on these lands of the cotton, rice and Lucerne with the norm of the watering more 20.0 Th.m3/ha has sharply changed a mode of level of the underground waters. At existing technology of the watering on furrows and the flooded checks water loss made more than 40 %. All these losses of water influence to the mode of level of ground waters which leads to the salting of the soil profile and to deterioration of the water-air mode of soil.
APPLICATION OF THE ELECTROSEDIMENTATION IN CLEANING OF DRINKING WATER
The method of electrosedimentation for processing water combines in itself a complex of various physical, chemical, physical and chemical and electrochemical influences which allows to process water up to absolutely safe for a life of consumers of a level. We spent physical and chemical and bacteriological analyses of water from a source of the centralized water supply before processing with application of a method of electrosedimentation. The method of electro-sedimentation provides high effect of removal from water of pollution in the form of suspensions (a mineral organic and biological origin), colloids (connections of iron, the substances causing chromaticity of water, etc.), and also the separate substances which are being a molecular and ionic condition. The physical and chemical analyses have shown that after application of a method of electrosedimentation the degree of hardness of water decreased twice, and nitrates have decreased three times, the intestinal stick is not found. A microbiological parameter (Е-coli) investigated test of water it was characterized by presence more 1100 intestinal sticks in one liter of water. Physical and chemical and bacteriological analyses of water from a source of the centralized water supply of a city of Kulyab – tests A were carried out. At the bacteriological analysis the intestinal stick is not observed which indicated that water is suitable for drink according to GOST 2874 “Drinking water” (fig. 1).
Figure 1: Results of the physical and chemical analysis of test A (the centralized water supply)

WWW-YES-2012 proceedings (draft version)
126 / 175
Superficial waters of Vose district were following object of research. Test - B (the centralized water supply) is taken from a kishlak “Pushyon” which is in 20 km from the area centre. Test - C is taken from the open channel of the same kishlak. It is necessary to notice, that for the kishlak population the given sources are used as potable water. The physical and chemical and bacteriological analyses have shown that the given sources very polluted. A microbiological indicator coli-index tests - B contains more 1100 intestinal sticks in one liter of water, at norm 3 intestinal sticks in one liter that can lead to infectious diseases. In the test B after electrosedimentation the degree of coagulation consist 93 % and coli- index and the intestinal stick is not found which specifies in suitability of water to the use (fig.2).
Figure 2: Results of physical and chemical analyses of test B (the centralized water supply)
In fig. 3 present results of physical and chemical and bacteriological analyses of test C. The fig. 3 shows that after electrosedimentation the degree of coagulation more than 90 % and intestinal sticks not observed (fig. 4).
Figure 3: Results of physical and chemical analyses of test C (the open channel)

12th World Wide Workshop for Young Environmental Scientists WWW-YES-2012 Urban waters: resource or risks? Arcueil, France (21 – 25 May 2012)
127 / 175
1110
0 20 0
1115
0 25 0
0
200
400
600
800
1000
1200
coli-index (colibacillus) coli-titer (ml) coli-index (colibacillus) coli-titer (ml)
before electro-sedimentation after electro-sedimentation
Test B Test C
Figure 4: Results of the bacteriological analysis of waters of test B (the centralized water supply)
and tests C (the open channel) Thus, according result of the spent researches of sources of potable water of Vose district it was revealed that the maintenance of a microbiological indicator Coli- index in tests B and C makes more than 1100 intestinal sticks on one liter. It testifies that these waters are sources of distribution disease of infectious character and application of a method of electrosedimentation it is possible to reach prevention of distribution of such diseases.
INFLUENCE OF THE IRRIGATION ON THE GROUND WATER MINERALIZATION
In the Table 1 present result of monitoring of the loss of water at filtration for the period of 1995-2002 in irrigated lands of the Kurgantube zone.
Table 1: Loss of irrigation waters at filtration
Name Unit 1995 1996 1997 1998 1999 2000 2001 2002
Total draw-off mln.m3 5215 5612 5795 5356 5484 4999 5008 4413
Total water loss mln.m3 1870 2258 2260 2098 2098 2084 1907 1860
The main sources of the irrigation of the lands of the Kurgantube zone is the Pyanj, Vakhsh and Kafernigan rivers where their mineralization fluctuates from 0.23 to 0.5-1.0 g/l. On the chemical compound the waters of the Pyanj and Kafernigan rivers is mainly hydrocarbonate-calcium, and waters of the river Vakhsh on the cations composition is calcium-atrium and on anion composition sulfate-hydrocarbonate- chlorides. The mineralization of underground waters on all territory of the Kurgantube zone makes from 0.5 to 3.0 g/l and more (Table 2).

WWW-YES-2012 proceedings (draft version)
128 / 175
Table 2: Distribution of irrigated lands on the degree of the groundwater mineralization
Mineralization, g/l Unit 1995 1996 1997 1998 1999 2000 2001 2002
less 1.0 ha 75200 66600 68832 71304 73893 72023 72030 72570
1,0 -3.0 ha 146806 157300 157361 152450 149638 150100 151440 151740
For definition of degree of influence of the surface water on change of a chemical compound of underground waters the important place occupies drawing up of water balance of the irrigated lands. The inflow part of water balance at a filtration reflects degree of replenishment of underground waters in vegetation. The water balance of the irrigated lands of the Kurgantube zone for the 1995-2002 years is presented in the Table 3.
Table 3: Water balance of the meliorative area years
Name Unit 1995 1996 1997 1998 1999 2000 2001 2002
A mln.m3 381,3 385,7 388,8 381,2 402,9 349,8 372,2 282,5
A- Accumulation of the ground water in vegetation periods In tables 4-6 results of monitoring of distribution of the irrigated lands on level and degree of a mineralization of ground waters are presented.
Table 4: Distribution of irrigated lands on level of ground water
Level of ground water,
m 1995 1996 1997 1998 1999 2000 2001 2002
less 1.0 5450 6970 6592 7214 7836 7433 9280 8120
1.0-1.5 12180 12600 13735 14070 16005 15433 14660 15230
1.5-2.0 22750 22120 23617 23744 24056 25709 24890 25120
2.0-3.0 53260 55930 55856 52784 49712 56696 47590 47480
more 3.0 142060 141130 141216 141215 143521 132664 142482 142572
Total 235700 238750 241016 238027 238027 237935 238902 238522
Table 5: Distribution of the irrigated land on the mineralization degree of the ground waters
content Unit 1995 1996 1997 1998 1999 2000 2001 2002
less 1.0 g/l ha 75200 66600 68832 71304 73893 72023 72030 72570
1.0 – 3.0 ha 146806 157300 157361 152450 149638 150100 151440 151740
more 3.0 g/l ha 13694 14850 14823 14273 14496 15812 15432 14232
Total ha 235700 238750 241016 238027 238027 237935 238902 238522

12th World Wide Workshop for Young Environmental Scientists WWW-YES-2012 Urban waters: resource or risks? Arcueil, France (21 – 25 May 2012)
129 / 175
2000 1
1,4
1,8
2,2
2,6
3
Seasons of Year
C1 /С
2
III-V VI-VIII IX-IX XII-II
1
2
2.6
2.2
1.8
1.4
2002 1,2
1,4
1,6
1,8
2
2,2
2,4
Seasons of Year
C1 /С
2
III-V VI-VIII IX-IX XII-II
2
12.2
2.0
1.8
1.6
1.4
Table 6: Distribution of the irrigated lands on level of depth and a mineralization of ground waters for 2002 years
depth th.ha
Mineralization (g/l in th. ha) Name Irrigated area
th.ha <1 1-3 >3 <1 1-3 >3
Republic of Tajikistan 699.1 11.3 207.5 480.3 389.1 272.1 37.9
Khatlon 316.9 8.8 136.2 171.9 111.0 179.5 26.4
Sogd 262.1 2.4 64.0 195.6 158.3 92.3 11.5
The lower are presented results of researches on change of a chemical compound of the underground waters of Tajikistan in dependences of the period of year and quantity of precipitation. For this purpose two sources of underground waters have been chosen: 1-Kafarnigansk and 2- East unit. Results of researches are presented on Fig.5. The presented figures are demonstrated that in the summer at insignificant quantities of atmospheric precipitation the difference of the maintenance of chlorides in sources 1 and 2 strongly differs. In the autumn at increase in quantity of deposits the maintenance of chlorides in these sources are almost equated. Such picture is found out under the maintenance of nitrates, sulfates and other chemical components.
Figure 5: Relative change of the chloride (a) and nitrate (b) concentration in underground water sources Kofarnigansk (C1) and East unit (C2) in depending on seasons of year
CONCLUSIONS As a result of the spent researches we establish essential influence of surface water on quality and property of waters of underground horizons. In the conditions of market economy development when many farmlands are distributed to farmers and private land users a problem of monitoring of quality of potable water from underground sources gets a special urgency. It, first of all, is connected by that many private land users for increase in productivity of agricultural crops bring unrationed quantity of mineral and chemical fertilizers which are washed off by irrigation water and get to underground tanks of potable water.

WWW-YES-2012 proceedings (draft version)
130 / 175
The high efficiency of an electrosedimentation method for chemical and bacteriological clearing of potable water is observed
REFERENCES • NORMATOV P. I. Influences of inorganic catalyst on the kinetics of water disinfection
by gaseous oxidant/ Abstract of 5th IWA Specialist Conference Oxidation Technologies for Water and Wastewater Treatment, March 30 – April 1, 2009, Berlin, Germany. CUTEC-Serial Publication No_72.ISBN 978-3-89720-990-9. P.66.
• NORMATOV I.SH. Application of the Bentonits for purification of groundwater’s Republic of Tajikistan. J. Chem. And Technology of Water. 2003.№4.P.271-275.
• NORMATOV I.SH., Mirsaidov U. Synthesis and properties of catalysts for the cleaning air and waste waters. Dushanbe. 2003. 82 p.
• NORMATOV I. SH., Botirov. S. Kh. Sanitary – Hygienic aspects of Water supply in the Republic of Tajikistan. Proc. Inter. Conf. SEHCA – 2005 Children’s Environmental health in Central Asia, Almaty, Kazakhstan, 14-18 May, 2005. p. 149-154.
• P.I.NORMATOV, O.S.Bokiev, K.F.Emomov, I.Sh. Normatov. Role of the information technology in water quality management and social-economical estimation of the flood impacts in mountain regions of the Central Asia. Proc. the 2nd International Conference Integrated Water Resources Management and Challenges of the Sustainable Development, Agadir, 24-26 March 2010, Marocco.-5p.
• NORMATOV I. SH., Zarina U. Eshonkulova, Nabi Nosirov. Monitoring influences of the groundwater level and quantity on soils fertility of the irrigating lands of the Tajikistan. Abs. XXXVIII International Association Hydrogeologists Congress “Groundwater quality sustainability”, 12-17 September 2010, Krakow, Poland.
• NORMATOV I. SH., N. Karomatulloeva, I. M. Rakhimov. Current situation of water supply and improvement of sanitary conditions in Republic of Tajikistan. International Archives of the Photogrammetry, Remote Sensing and Spatial Information Science, Volume XXXVIII, Part 8, Kyoto Japan 2010,pp.335-338.
• NORMATOV I. SH., Nuriddin Fayz, Nabi Nasirov, Makhmadrezbon Idiev, Obid Bokiev. Appearance of the risk contamination of drinking water supply sources at rainfall and vegetation periods. Proc. 12th International Symposium on Water Management and Hydraulic Engineering, 5-8 September 2011, Gdansk, Poland, P.145-149.

12th World Wide Workshop for Young Environmental Scientists WWW-YES-2012 Urban waters: resource or risks? Arcueil, France (21 – 25 May 2012)
131 / 175
13. Urban lakes: interaction between phytoplankton dynamics and trace metal speciation
Viet TRAN KHAC*, Brigitte VINÇON-LEITE*, Gilles VARRAULT*, Bruno Jacques LEMAIRE*, Bruno TASSIN* and Nilo NASCIMENTO**
* Laboratoire Eau Environnement Systèmes Urbains (LEESU), Ecoles des ponts ParisTech, 6-8 Av. Blaise Pascal, 77455 Champs-sur-Marne, France. (E-mail: [email protected])
** Federal University of Minas Gerais, Hydraulic and water resource engineering department, av. Antônio Carlos, 6627, 31270-901, Belo Horizonte, MG, Brazil.
Abstract Urban lakes have a particular influence on the water cycle in urban catchments. Thermal stratification and a longer residence time of the water within the lake can boost the phytoplankton production. On the other hand, trace metals are naturally found in environment in trace amounts due to erosion and physic-chemical or biological alteration processes. Trace metals are essential to growth and reproduction of organisms. However, they are also well known for their toxic effects on animals and humans. Their ecotoxicity depends on metal properties and chemical speciation (particulate, dissolved: labile or bioavailable and inert fractions). The interaction between phytoplankton production and trace metal speciation is not well understood until present time. The aim of this research is twofold: (1) to analyze the driving processes of the phytoplankton production in an urban lake through physical-chemical and biological field data collection and (2) simultaneously to survey the chemical speciation of trace metals in this lake. To address these issues, a field survey and laboratory analysis, including physical-chemical, biological variables, organic matter and trace metal concentrations, have been designed and implemented in an urban study site: Lake Créteil in France
Keywords Urban lakes; trace metal; phytoplankton; transparent exopolymer particles; speciation
INTRODUCTION Urban lakes are different from rural and natural lakes: they are specific elements of storm water drainage networks, highly artificial, small and shallow water bodies. These water bodies, such as ponds and grave-pits lakes, are common in urban and peri-urban landscape. Urban lakes play a key role in recreation and storing rainwater (Stephen Birch, 1999). According to Downing et al. (2006), 99,2% of water bodies in the world is 10ha or less. These aquatic ecosystems are highly impacted by watershed urbanization and by urban activities such as industry, traffic waste and drainage systems (Friese et al., 2010). Moreover, they are also very sensitive to a large variety of planetary environmental changes (PECs) such as increased CO2, increased air temperature and atmospheric pollution (Poff et al., 2002). Despite the abundance and the usefulness of these water bodies for societies, we notice a lack of research on these urban lakes in comparison with large and deep lakes (Jeppesen 1998, Moss 2010, Davies et al. 2008). Because urban lakes are often small and shallow, they should respond rapidly and strongly to climatic fluctuations (Whitehead et al. 2007). Climate change could increase wet periods during winter and spring and increase drought during summer time. Consequently, water residence time would be modified (Bates et al. 2008). During extreme climatic events, rain runoff effluents lead

WWW-YES-2012 proceedings (draft version)
132 / 175
to a decline of bacteriological and chemical water quality and thus impacting the sanitary state and the functioning of aquatic ecosystems (Characklis et al. 2005, Patz et al. 2005, Allan & Castilla 2007). Heat wave events can enhance phytoplankton production rates (Nõges 2009, Moijj et al. 2005). Urban lakes are generally polymictic lakes and they may be particularly vulnerable to changes in the water temperature and the mixing patterns caused by climatic extremes (Wagner & Adrian 2009). All these environmental and anthropic disturbances can modify both hydrodynamic and physical-chemical conditions of urban lakes, which can favor phytoplankton development or even reinforce eutrophication due to higher nutriment internal cycling and better light climate (Nõges 2009, Bertolo et al. 1999 ).
Scientific context of the research Two sources of trace metals exist in aquatic environment: natural source and anthropic source. Trace metals are naturally present in environment due to erosion and physical-chemical or biological alteration processes. Human activities represent an anthropic source in aquatic ecosystem. Trace metals enter urban water bodies via several pathways such as atmospheric deposition, industrial and domestic wastewater discharge, agricultural activities or storm water runoff (Thévenot et al, 2009). Trace metals are vital components for growth, development and reproduction of living organisms (Buffle, 1988; Tessier et Turner, 1995). A lack of metals can be a limited factor for development of organism, for example a lack of iron can cause a diminution of phytoplankton development (Martin et Fitzwater, 1988; Martin et al., 1991). However, a high concentration of metals can be extremely toxic. Indeed, trace metal toxicity for aquatic organisms have been known for a long time and are considered as a serious threat for human and animal health (Bryan and Langston, 1992). Ecotoxicity and bioavailability of trace metal are not directly related to total metal concentration but depends on the form and the nature of chemical species (Florence, 1986, Scoullos and Pavlidou, 1997, Lores and Pennock, 1998). In aquatic systems, trace metals can exist in many different chemical forms, which determine bioavailability and toxicity to aquatic organisms (Hirose, 2006, Morel et al., 2003). Trace metals can be particulate or dissolved (free or complexed to organic and inorganic ligands). Under different meteorological and physical-chemical conditions (pH, salinity, hardness of water, organic carbon content…), trace metal form can change (Forstner and Wittmann 1979). In dissolved metal fraction, metal can be labile (free or weakly linked to organic or inorganic ligand) or inert (no interaction with surrounding environment). Labile metal is defined as free metal or weakly linked to mineral ions (hydroxyl, carbonate) or to organic molecules (Thevenot, Meybeck et al. 2002). Labile metal is also defined as “easily modifiable, exchangeable by easy and rapid interaction with surrounding solution” (Tusseau-Vuillemin 2005). In other word, labile metal is constituted of cationic free form or weakly associated to mineral ions (Thevenot, Meybeck et al. 2002). Because of their mobility in aquatic environment, this fraction is directly related to bioavailability of metal. These labile metals, which can be easily linked to aquatic organisms, are a good indicator of toxicity. Therefore, it is important to study the speciation of trace metal in aquatic systems. So far, we know that dissolved organic matter (DOM) plays a key role on trace metal speciation in aquatic systems. DOM can be divided into 2 categories: the humic substances and the non-humic substances. According to Thurman (1985), humic substances are majority, up to 70% of DOM in comparison with non humic substances, estimated at 25%. Humic and fulvic acids are the most studied because they play a key role on complexing free metal ion in most of the

12th World Wide Workshop for Young Environmental Scientists WWW-YES-2012 Urban waters: resource or risks? Arcueil, France (21 – 25 May 2012)
133 / 175
aquatic systems. However, in urban areas, the non-humic, mainly hydrophilic DOM, can constitute a significant fraction as a result of treated or untreated wastewater discharge (Pernet-Coudrier et al., 2011). The binding ability of wastewater organic matter has been highlighted during an acute toxicity test of copper with Daphnia Magna (Pernet-Coudrier et al., 2008). In aquatic ecosystems, non-humic DOM can also be produced by microbiological activity, mainly phytoplankton and bacteria. The complexing ability of trace-metal of this natural aquagenic DOM, called extracellular polymeric substances (EPS) is still unclear. Our research will focus on one type of EPS, called Transparent Exopolymer Particles (TEP). TEP are defined as particles formed from acid polysaccharides. During phytoplankton blooms in freshwater and marine systems, phytoplankton and bacteria abundantly exude TEPs. Diatoms are especially known for producing TEPs during their growth (Passow, U. 2002). TEPs can play a role on trace metal speciation because of the large affinity of trace metal to surface-active exopolymers (Tye, Jespen, & Lick, 1996). Between 40-90% of trace elements can be adsorbed by the TEPs in marine system (Passow, U. 2002). However, until now, the TEPs have been more widely studied in marine systems than in freshwaters. Moreover, very few results exist about the TEP characteristics in urban lakes. In this context, the main question of our research is: How are the TEPs generated by phytoplankton and bacteria during blooms events influencing the trace-metal speciation in an urban lake? To achieve this issue, monthly field campaigns aimed at measuring physical-chemical and biological variables and trace metal concentrations have been implemented in Lake Créteil (France). Physical parameters (temperature, pH, conductivity, oxygen, photosynthesis active radiations (PAR)) are monitored in situ with probes. Laboratory analysis (total phosphorus, phosphates, major cations and anions, TEP…) are performed on water samples. In this paper, the organization of the field campaigns and the laboratory analysis will be presented. The first results will be exposed and discussed. A second study site (not be presented in this paper) with different climate and socio-economic context has been selected, Lake Pampulha (Brazil). Lake Créteil survey takes part of the research project PULSE (Peri-Urban Lakes, Society and Environment) supported by ANR (National Research Agency). Lake Pampulha survey takes part of the research project MAPLU (Storm water management project, funded by the Brazilian Agency for Funding Study and Projects – FINEP
MATERIAL & METHODS In order to investigate the interactions between phytoplankton and trace metals, we have designed a field survey aimed at monitoring the main environmental parameters driving the phytoplankton dynamics, the transparent exopolymer particles production which could consequently influence the metal speciation. The field survey includes high-frequency measurements of water temperature aimed at providing continuous time series at 3 depths, giving access to the stratification and mixing patterns of the water column. Water temperature is an essential parameter, which directly, through algal growth rate, plays a key role in phytoplankton production. Moreover, mixing or stratification of the water column will control in a different way the growth of the algal species and will lead to

WWW-YES-2012 proceedings (draft version)
134 / 175
different algal succession. These high-frequency measurements will allow us to understand at small time scale the physical control of phytoplankton dynamics. The field campaigns also include, at a regular frequency, (1) vertical profiles of physical parameters aimed at describing the phytoplankton growth conditions: temperature, pH, conductivity, photosynthesis active radiations (PAR); (2) vertical profiles of parameters associated to the phytoplankton biomass: Chlorophyll a produced by 4 main phytoplankton groups and oxygen concentrations; (3) water sampling for further analysis of nutrients and TEPs concentrations and (4) specific water sampling and field filtration for trace metal speciation analysis . More details on the field and the analysis protocols are given in a following paragraph.
Description of study site
Lake Créteil is located in Ile-de-France region (48°46’N 02°27’E), in an urbanized zone at 15km from Paris. The lake originates from an excavation of alluvial sediments near the confluence of the Rivers Seine and Marne. Its surface is 40.8 ha, the volume is 1.5 106 m3, the maximum depth 6m and the mean depth 4.5 m. The lake is mainly supplied by groundwater but also supplied by a stormwater outlet of the urbanized Mont-Mesly area. This lake is used for recreational activities (sailing, windsurfing, fishing...) and plays an important role in providing quality of life for the inhabitants of this highly urbanized area.
Lake Créteil is polymictic with a density stratification lasting from days to weeks during the summer, which impacts the primary production.
Figure 7 Lake Créteil location (Créteil, France) (Google Maps)
Continuous temperature monitoring At the central point C (see Figure 8), three temperature sensors installed at three fixed depths (0.55m, 0.94 m and 3.62m) will measure continuously the water temperature. The measurement time step is 30mn. This sensor chain has been working since August 2011.
The monthly field campaigns The monitoring campaigns, conducted on Lake Créteil, include three sampling points located on an horizontal transect, from the stormwater outlet to the lake outlet : the « S » point is close to the stormwater outlet, the « R » point is located next to a rich organic reedbed area and the central point « C », is located between S and R (Figure 2). For each sampling point, three depths

12th World Wide Workshop for Young Environmental Scientists WWW-YES-2012 Urban waters: resource or risks? Arcueil, France (21 – 25 May 2012)
135 / 175
are defined: surface (0.5 meters), middle (1.5 meters) and bottom (3.5 meters). For each campaign, a “lake average sample”, named “M” is mixed from 9 samples collected at three depths at the three points (S1, S2, S3, C1, C2, C3, R1, R2, R3). Water samples are collected using a NISKIN bottle. For each campaign, 6 samples are collected for trace metal and TEP analysis: S2 (middle of the water column at point S), C1, C2, C3 (3 depths at central point), R2 (middle of the water column at point R) and M (lake average point).
Figure 8 Location of the three sampling points on the lake Créteil (Left) and sampling depth (black rectangle) for laboratory analysis
Probe measurements
Vertical profiles of physical (salinity, temperature, oxygen, conductivity, photosynthetically active radiation (PAR), water transparency) and biological (chlorophyll a) parameters are also monitored in situ using probes: CTD Seabird43, LI-COR193 (underwater PAR sensor), Fluoroprobe BBE.
Water sampling
Trace-metals Trace metal analysis suffers of very high contamination risks. In order to avoid these risks, all materials used are in high-density polyethylene and have been prepared in a clean room. These materials have been washed according to a specific procedure: first washing cycle in detergent solution EXTRA at 5% prepared with reverse osmosis water during 24h and second washing cycle in nitric acid solution at 5% prepared with ultrapure water. For each field campaign, 3 metal fractions are analyzed: (1) total metals, (2) total dissolved metals and (3) inert metals. Total metal, analyzed in the raw water sample (50mL), corresponds to particulate and dissolved metal fractions. Total dissolved metal is operationally defined as the filtrate of 0.45-micron filtration. The sample volume is 20mL. Inert metals are determined using chelating disks where a chelating resin retains labile metal. The chelating disk (EMPORETM) contains a chelating resin “Chelex 100”, constituted of styrene-divinylbenzene co-polymer containing imino-diacetic

WWW-YES-2012 proceedings (draft version)
136 / 175
acid groups. Imino-diacetic acid groups have a strong affinity toward transition metal that allows fixing them by a coordinate bond. Inert metals go through the chelating disk. The sample volume for inert metals is 20mL. The labile metal fraction is quantified by difference between total dissolved metal and inert metal. The concentrations of the 3 metal fractions mentioned above are determined using inductively coupled plasma mass spectrometry (ICP-MS). Trace metals determined are: Al, Cr, Mn, Fe, Ni, Cu, Zn, Cd, Pb, Ti, V, Co, Ag. Transparent exopolymer particles (TEP) Transparent exopolymer particles (TEP) are operationally defined as particles retained on polycarbonate filters (0.45µm), which stains with the cationic dye alcian blue. The dying blue alcian solution 8GX, which can stain both sulfated and carboxylated polysaccharides, is prepared at concentration 0.02% m/v with 0.06% acetic acid to maintain pH at 2.5 (Passow & Alldredge, 1995b). TEP concentration is measured using Passow and Alldredge’s method (1995). 100 mL of raw water are filtered through 0.45µm pore size polycarbonate filters and stained with alcian blue. Stained filters are rinsed with ultrapure water to remove excess blue alcian and keep in frozen until analysis. TEP stained by blue alcian are re-dissolved in 6mL of 80% sulphuric acid for 3h. Absorption at 787nm was measured spectrophotometrically. Measures are conducted in triplicate. Average concentration will be expressed as a standardized Xanthan equivalent in µg.l-1 (µgXeq.l-1).
Laboratory analysis
Water samples are analyzed in laboratory to determine nutrient (total phosphorus, phosphate, nitrate) and major anion and cation concentration. Total Phosphorus and phosphate analysis are measured according to AFNOR norm. Total Phosphorus is mineralized with persulfate and phosphate is colored by ascorbic acid. Absorption at 880nm is measured with a spectrophotometer. Nitrate concentration is determined by ionic chromatography.
PRELIMINARY RESULTS Our preliminary results allow us to present the seasonal physical-chemical and biological patterns of Lake Creteil recorded from August 2011 to March 2012. First results of metal concentration by ICP-MS were obtained very recently (30th March 2012) and the data treatment is under progress. We are still working on the validation of these results. TEP analysis planned for monthly field campaigns will start in May 2012. Presently, we are conducting laboratory tests in order to validate our final protocol. Conductivity is very high in Lake Creteil; it was nearly constant at about 1600 µS/cm between October 2011 and March 2012. This value corresponds to historical data of the lake. Lake Créteil is rich on chloride and sulfate, which contribute to a high conductivity. Ref? pH is about 7.8 between October 2011 and March 2012. Between August 2011 and March 2012, the surface temperature at the central point C was maximal at 23°C in 05-August 2011. Temperature profile was homogenous in the water column from December 2011 to March 2012. The temperature was minimal (1.6°C) in February 2012,

12th World Wide Workshop for Young Environmental Scientists WWW-YES-2012 Urban waters: resource or risks? Arcueil, France (21 – 25 May 2012)
137 / 175
when the lake was frozen. The temperature gradients recorded in the lake during the summer 2011 are low, around 0.4°/m.
Sulfate and chloride Ionic chromatography analysis confirmed that sulfate and chloride are the major anions in the lake. The concentration of these anions in the lake is largely higher in comparison to the others. Sulfate and chloride concentrations are respectively about 450 mg/L and 150 mg/L.
Phosphorus total and phosphate Table 3 Total Phosphorus and phosphate concentrations for February and March 2012 February March
Points Phosphate (µg/L) Total Phosphorus (µg/L) Phosphate (µg/L) Total Phosphorus (µg/L)
M 9.1 36.5 2.5 137.4
S2 21.2 52.6 2.8 32.3
R2 8.2 305.8 2.5 56.7
C1 29.9 65.6 5.5 34.1
C2 9.0 35.2 1.7 33.3
C3 8.2 36.6 5.6 35.2
We have to notice that in February, air temperature was negative during 2 weeks. The lake was frozen during the field campaign. It was not possible to reach the regular sampling points and we had to conduct measurements close to point position. It can explain why there was an extremely high phosphorus total concentration at the reedbed point R2. Phosphate concentration seems to be more homogenous for March than February.
Chlorophyll a Between October 2011 and March 2012 chlorophyll a concentration measured by Fluoroprobe BBE varies from 5 – 20 µg/L.
CONCLUSION AND PERSPECTIVES In order to investigate interactions between trace metal and phytoplankton, we suppose that organic matter at the lake central point C is essentially produced by phytoplankton. On the contrary, organic matter from storm water effluent will be mostly of urban origin and the organic matter in the reedbed area will have a more humic structure. Comparing and analyzing the data set of these 3 points will allow us to disentangle the influence of phytoplankton on trace metal speciation. Monitoring of physical parameters and laboratory analysis will be useful to understand hydrodynamical and environmental conditions of the lake. In a second step, we intend to synthesize the knowledge of the lake functioning in an hydrodynamical and biological model, which can simulate and explain phytoplankton development in the lake. Understanding of phytoplankton dynamic helps us to understand better TEP production, which can explain trace metal speciation and bioavailability.

WWW-YES-2012 proceedings (draft version)
138 / 175
REFERENCES • Allan D.J., and Castillo M.M., 2007. Stream ecology: structure and function of running waters.
Springer, Dordrecht, the Netherlands, pp. 436. • Bates, B.C., Z.W. Kundzewicz, S. Wu & J.P. Palutikof (Eds.). 2008: Climate Change and Water.
Technical Paper of the Intergovernmental Panel on Climate Change, IPCC Secretariat, Geneva, 210 pp.
• Bryan G W, Langston W J, 1992. Bioavailability, accumulation and effects of heavy metals in sediments with special reference to United Kingdom estuaries: A review. Environmental Pollution, 76(2): 89–131.
• Buffle, J. (1988). "Complexation reactions in aquatic systems, an analytical approach " Ellis Horwood series in analytical chemistry: 304-380.
• Characklis G.W., Dilts M.J, Simmons O.D., Likirdopulos, C.A., Krometis, L.A. and Sobsey M.D., 2005. Microbial Partitioning to Settleable Particles in Stormwater. Water Research, 39 : 1773-1782.
• Florence, T.M. (1986), Electrochemical approaches to trace element speciation in waters, Analyst, 111, 489-505.
• Forstner, U. and G. T. W. Wittmann (1979). "Metal Pollution in the Aquatic Environment. Springer- Verlag." New York: 289 p.
• Hirose, K. Chemical speciation of trace metals in seawater: a review. Anal. Sci. 2006, 22, 1055–1063.
• Lores, E. and Pennock, J. (1998), The effect of salinity on binding of Cd, Cr, Cu and Zn to dissolved organic matter, Chemosphere, 37, 861-874.
• Lores, E. and Pennock, J. (1998), The effect of salinity on binding of Cd, Cr, Cu and Zn to dissolved organic matter, Chemosphere, 37, 861-874
• Louis, Y., G. Varrault, et al. (2009). "Détermination des concentrations en métaux labiles et dissous dans la Marne et ses affluents durant un épisode de temps de pluie." Programme PIREN-Seine.
• Martin J. H. and Fitzwater S. E. (1988). "Iron deficiency limits phytoplankton growth in the north-east Pacific subarctic". Nature 331 (6154), 341-343.
• Martin J. H., Gordon R. M. and Fitzwater S. E. (1991). "The case for iron". Limnology and Oceanography 36 (8), 1793-1802.
• Mooij, W.M., S. Hülsmann, L.N. De Senerpont Domis, B.A. Nolet, P.L.E. Bodelier, P.C.M. Boers, L.M. Dionisio Pires, H.J. Gons, B.W. Ibelings, R. Noordhuis, R. Portielje, K. Wolfstein & E.H.R.R. Lammens. 2005. The impact of climate change on lakes in the Netherlands: a review. Aquatic Ecology, 39: 381-400.
• Morel, F. M. M.; Price, N. M. The biogeochemical cycles of trace metals in the oceans. Science 2003, 300, 944–947
• Nõges, T. 2009. Relationships between morphometry, geographic location and water quality parameters of European lakes. Hydrobiologia, 633: 33-43.
• Patz J.A., Campbell-Lendrum D., Holloway T. and Foley J.A., 2005. Impact of regional climate change on human health. Nature, 438: 310-317.
• Tessier, A., D. R. Turner, et al. (1995). "Metal speciation and bioavailability in aquatic systems." John Wiley & sons, Chichester: 679p.
• Thévenot D.R., Lestel L., Tusseau-Vuillemin M.H., Gonzalez J.L, Meyback M. 2009. « Les métaux dans le bassin de la Seine » – Programme Interdisciplinaire de Recherche sur l’Environnement de la Seine (PIREN-SEINE)
• Thevenot, D., M. Meybeck, et al. (2002). "Métaux lourds: des bilans en mutation, Piren-Seine, Rapport de synthèse 1998-2001."
• Thurman. 1985. Organic geochemistry of natural waters. Dordrecht: Kluwer Academic Publishers Group.
• Tushara Chaminda, G. G., F. Nakajima, et al. (2009). "Zn and Cu complexation with DOM in wastewater treatment plant effluent." 19ème congrès international de la SETAC.
• Tye, R., Jepsen, R., & Lick, W. (1996). Effects of colloids, flocculation, particle size, and organic matter on the adsorption of hexachlorobenzene to sediments. Environmental Toxicology and

12th World Wide Workshop for Young Environmental Scientists WWW-YES-2012 Urban waters: resource or risks? Arcueil, France (21 – 25 May 2012)
139 / 175
Chemistry, 15, 643–651. • Wagner, C. & R. Adrian. 2009. Cyanobacteria dominance: Quantifying the effects of climate
change. Limnology and Oceanography, 54: 2460-2468. • Whitehead, P.G., R.L. Wilby, R.W. Battarbee, M. Kernan & A.J.Wade. 2009. A review of the
potential impacts of climate change on surface water quality. Hydrological Sciences, 54: 101-123.

WWW-YES-2012 proceedings (draft version)
140 / 175
14. A spatial and temporal analysis for long term renewal of water pipes
Youssef TLILI *,** and Amir NAFI **
*Technical University of Bari, Italy- Joint Research Unit in Water and Environmental Territory Management, Cemagref-Engees, Strasbourg, France **Joint Research Unit in Water and Environmental Territory Management, Cemagref-Engees, Strasbourg, France (E-mail: [email protected]; [email protected] )
Abstract Drinking Water distribution systems as well as other technical networks represent an important accounting. Managing these networks aims to sustain people's access to drinking water quality and quantity according to a satisfactory level of service. Water networks are an assembly of technical devices, most of them are buried. This makes their diagnosis more difficult and requires the implementation of a policy, known by «asset management". This requires planned actions in the short, medium and long term. It aims to describe the state of the asset by developing specific tools in a first time and plan the actions needed to maintain its state in a second phase. This current research deals with the problematic of establishing priorities for pipes that should be selected for rehabilitation. The developed approach is based on the discrimination of vulnerable pipes by a spatial and temporal analysis starting from a simple idea: the diagnosis is often unaware dimensions: topology and evolution of failures pattern. Thus, detailed approach provides a holistic vision of the network by identifying areas with high failures, called "hotspots" and their evolution over time. Therefore, this research allows a visual representation using the network topology; such representation provides a resolution of the network and can be used to evaluate, a priori, the effectiveness of the rehabilitation policies according to their incidence on hotspots’ reducing .
Keywords Breakage, cluster density, indicator, prioritization, pipe replacement.
INTRODUCTION Asset management (AM) of drinking water systems is an approach that tracks the status of the buried heritage and anticipates works to be done for his continued service during its service lifetime. It is a managerial approach which aims to sustain the user’s water service in a required quality and quantity, in the best technical and financial conditions. First of all, AM tends to improve the network knowledge by implementing inventories of equipments and checkups of components. It requires the establishment of the criteria and indicators for assessing the level of asset condition. By considering that it’s almost impossible to rehabilitate the network at once, it is required to establish priorities in order to discriminate the more deteriorated parts and thus to carry out the appropriate actions to ensure the service continuity. Deterioration implies a decrease of the condition level that may be physical or functional. It depends on many parameters that can be environmental, technical, managerial and economic. The asset status is established in present time i.e. today, so current network state depends on the policies implemented earlier by the network manager.
The recurring questions that the manager arises concerning the renewal of the network are the following: What pipes do I renew? What are the criteria for renewal? When do I have to

12th World Wide Workshop for Young Environmental Scientists WWW-YES-2012 Urban waters: resource or risks? Arcueil, France (21 – 25 May 2012)
141 / 175
renew? How much is it going to cost? In general we have two ways to be mistaken: to replace a pipe that should not be or to unselect one that has to be. In practice, the renewal of water pipes is conditioned by the available financial resources. In most cases, the budget for renewal is fixed in advance and works to be performed must meet the financial constraint. In response to these challenges, several decision support systems for prioritizing water pipes have been developed (Utilnets, Caree-W (Le Gauffre and Haidar, 2008)), Kanew, Riva, Sirocco, Prams (Nafi and Werey, 2009)). Most researches (Dridi et al, 2006) , (Halfawy et al, 2008) and (Giustolisi and Berardi, 2009) proposed a non-exhaustive list of various criteria and encouraged water utilities to better know their asset by collecting new data and by ensuring their update. Even if the proposed criteria are relevant, the spatial dimension and “network scale” are not enough taken into account. Indeed, the prioritization criteria identified in literature are assessed at the pipe scale and allow discriminating pipes between them. Some criteria are difficult to quantify or require too much input data, often unavailable. In reality, the most used criteria for pipes rehabilitation are the age of pipes; roadwork’s or planned works on adjacent networks as gas, electricity and sewers. However the pipe condition depends on both physical and functional deterioration. The importance of a pipe depends not only on its location in the network, but also on its connection with other pipes and other endogenous and exogenous factors. The analysis scale should therefore be both the pipe and the whole network. In addition, analysis across the network refers to a spatial analysis which was not considered in general. Often, the pipe is a recording in a database, identified by a key; we do not even know its location in the network during its selection. This induces a loss of important informations and can penalize the prioritization of pipes to be chosen for renewal. The spatial analysis of the network shows clusters of breaks, which are more crowded in some areas of the water network. Empirically, it seems that the first break is an independent event but the following breaks events are dependent on the latter’s and locate nearby (Goulter and Kazemi A. 1988) . Therefore, we explore the construction of pipes prioritization criteria based on the gathering of pipe breaks in "clusters" in order to discriminate areas of high density of breaks called “hotspots” surrounding areas characterized by low density of breaks or “noise breaks” that does not reflect a potential concentration of failures. These criteria will be used to identify hotspot zones and rank the pipes candidate for renewal within the same cluster. The following paper is arranged on 4 main sections; first the analysis of the context by literature review of existing criteria for pipes prioritization. The second section introduces the spatiotemporal approach by explaining the principal, objectives and used algorithm, the third section shows the implementation of the approach on a real case study and the significant results. A first evaluation of the approach, results and also a further work is presented in the last section.
PRIORITIZITION CRITERIA: CONSIDERATION OF THE SPATIAL AND TEMPORAL DIMENSIONS Since the network status is uncertain and the opportunities to inspect it are rare (repair, work on other network), the establishment of a renewal program requires the implementation of a proactive approach for failure prediction and the definition of relevant criteria for the selection and prioritization of pipes to be renewed. Prioritization criteria can be classified into families as follows:
Hydraulic criteria: Surplus or pressure deficit, demand satisfaction, hydraulic capacity, reliability, resilience.
Economic criteria: replacement cost, opportunities and economy of scale, direct and indirect costs, social costs, cost of water loss, repair cost,

WWW-YES-2012 proceedings (draft version)
142 / 175
Social criteria: customer dissatisfaction, number of complaints, Structural criteria: number of breaks or leakage, breakage rate, linear index of loss.
Beyond these criteria, we propose to build additional indices to characterize hotspots and their evolution over time. This implies a spatial analysis of failures through clustering assumption according to historical failures data. The knowledge of failure trend, occurrences and their spatial distribution within the network remains essential before any prioritization task. It will be inadequate to plan renewal works without knowing a priori the trends, the tendency and the breaks location. A discernment of failures concentrations grants to focus on the most vulnerable pipes and thus avoids an early renewal of pipes having just suffered from noise breaks. This helps to better target the renewal works and perform significant savings.
Distance analysis In this section, we analyse how clustered or dispersed the breaks are. Based on the nearest neighbor approach, the analysis put us on track for identifying and understanding hotspots. We used distance analysis techniques to answer questions about the dispersion of breaks and hotspot analysis to identify areas where breaks concentrate.
Nearest Neighbour Analysis (NNA)
The Nearest Neighbor Analysis (NNA) measures the distance of each point to its nearest neighbor, determines the mean distance between neighbors, and compares the mean distance to what would have been expected in a random nearest neighbor distribution. We can also control whether to compare each point to its single nearest neighbor or to run the routine against the second-nearest, third-nearest, and so on. NNA allows calculating the Nearest Neighbor Index (NNI). In the NNI, a score of 1 would indicate absolutely no discrepancy between the expected distances in a random distribution and the measured distances in the actual distribution. Scores lower than 1 indicate that incidents are more clustered than would be expected in a random distribution, and scores higher than 1 indicate the incidents are more dispersed than would be expected in a random distribution. The NNI calculation process is given by:
AnDensity
DensityDNN R ==
21
(1)
n
NNDDNN
DNNDNNR
n
i
R
∑=== 1
(2) Where: n = Number of failure points in the distribution A= Size of the study area R = Ratio of the observed distance to the expected distance NND = Distance between each point and its nearest neighbor
= The observed mean distance between nearest neighbors = Expected value of the nearest neighbor distance in a random pattern.
Spatial clustering: Finding patterns Clustering is the process of creating a collection of similar data within the same group and dissimilar when they belong to different groups. Clustering is the unsupervised classification, which means without previously predefined classes. These methods are widely used in risk and crime spread analysis. A good clustering method ensures a high similarity «within-group» and allows dissimilarity "inter-group." It is through this characteristics that will be based
DNNRDNN

12th World Wide Workshop for Young Environmental Scientists WWW-YES-2012 Urban waters: resource or risks? Arcueil, France (21 – 25 May 2012)
143 / 175
the analysis of the spatial distribution of pipe breaks. There are four major clustering approaches. Partitional Clustering Algorithms constructs usually predefined clusters. Hierarchical Clustering Algorithms creates a hierarchical decomposition which can be represented as dendograms. Density-based partitioning Algorithms search for regions which are denser according to a predefined threshold. Grid-based Algorithms are based on a multiple-level granularity by quantizing the search space into a finite number of cells (Abdulvahit and Düzgün 2006) . We use in this study the Neighbour Hierarchical Spatial Clustering (NNH) for failures clustering points in the network based on two parameters i)the maximum neighbourhood radius that separates a basic break point for other points of breakage “Eps” and ii) the minimum neighborhood number of breaks “MinPts”.
MATERIAL & METHODS: CASE STUDY In this section, we follow the spatial and temporal trend of pipes breaks to understand in which manner evolves the size of clusters during the time, which add time dimensionality to the study. The developed methodology includes 4 steps: • Step1: partition the break history (1962-2003) in four equivalent intervals of time: [1962,
1973], [1974, 1984], [1985, 1995] and [1996, 2003].
• Step 2: plot on the network breaks corresponding to each interval of time.
• Step 3: for each horizon, a first way to detect the spatial distribution of breaks is to calculate the nearest neighbor index (NNI).
• Step 4: divide the network into clusters using NNH to identify areas of high failure from surrounding areas of low density of breakage (noise breaks), hence understand and discern the breaks pattern in time. To provide stable results regarding the number of clusters, quality of clustering output and to derive clusters that are meaningful to condition assessment and replacement optimization needs, many simulations where performed to fix the clustering parameters values.
(Ben-David and Simon, 2002) and (De Oliveira et al, 2010) demonstrated that the loss of clustering quality is precipitated by the increase of the “eps”- distance and with decrease of “MinPts” parameters. In another hand, while nearby pair of breaks might result from poor repair of previous breaks, spatial clusters with few breaks, e.g., clusters with pairs of breaks will not generate useful replacement candidates because they tend to have a very small extension [9], the “MinPts” parameter was chosen equal to values of three breaks and above in order to avoid the generation of numerous small spatial clusters and to reach significant clusters in the same time. An upper bound for the “eps”- distance is defined by looking into the pipes length and considering that replacement will not be performed in arbitrarily large extensions of pipes but rather in a small length. For instance, taking in account the longest pipe (410 m) and the shortest one (37 m), we used an “eps” distance or search radius equal to the average value of pipe length equal to 223m, this distance is not generated randomly and it is meaningful for decision makers. One of the interest of the analysis comparing to large clusters, was first to have small clusters since smaller ones at finer hierarchy tend to present more uniform distribution of breaks along pipes and also more homogenous in term of environmental factors (e.g., soil characteristics), pipe conditions (e.g., material , traffic..) and especially density of breaks along pipes. Additionally, this allows getting a large number of clusters which offer in principle, more choices of pipes candidate for renewal (De Oliveira et al, 2010) and (De Oliveira et al, 2011). • Step 5: Define criteria for giving a first level of ranking and identifying which clusters
exactly constitute hotspot zones. A possible criterion is the breakage rate of a cluster. Once

WWW-YES-2012 proceedings (draft version)
144 / 175
we managed to set a classification of clusters, the pipes included will be automatically prioritized. The breakage rate of clusters will be compared to rates of groups of pipes based on non spatial criteria (i.e., pipe diameter and material).
• Step 6: Define prioritization ranking for each pipe or street into the clusters. Within each cluster, prioritization could not be only on the pipes’ level but rather on the level of streets or roads level.
Clustering analysis The methodology was applied to a part of a network consisting of 147 cast iron pipes with a diameter between 150 and 250 mm. For each interval time, we performed separately the cluster analysis (Nearest Neighbor hierarchical clustering algorithm with a fixed radius of 223 m). Additionally, one way to analyze and observe the temporal trend of breaks was by adding the clusters of the period n+1 to those of the previous period n in an incremental way of time. This analysis is illustrated in the figure 1. The figure below shows the obtained clusters for 4 periods of time considered separately. The Nearest Neighbour Index corresponding to periods is respectively 0.55, 0.53, 0.48 and 0.6(<1) that denote the clustering behaviour of breaks. We note also that between these time periods, clusters have trend to occur in the same location as in the previous period, they can be superposed, with same deviation or also between two adjacent previous clusters. This may accentuate breaks and are more and more clustered in a precise location. We observe that there are three main annotations : i) appearance of new clusters, ii) evolution of clusters from one or more other clusters and iii) above all, overlapping of clusters of new clusters over old ones, particularly these clusters seems to be the most critical zones characterized by a higher density of breaks.
Figure 9. Clustering analysis since year 1962 to 2003.
Differently said, we observe that many scored clusters are close or have exactly the same location as those in the previous period, the thing that let us understand that more breaks were concentrated exactly in the same location of previous cycle and they are therefore encompassed. To perform the reasoning concerning hotspots, the analysis was performed also using the kernel density estimation function, the figure 2 shows that there is practically the same hotspots and cold spots describing the breakage density in each raster. This make us understand that the zones A,B and C are the most critical zones in the study area, these zones are characterized by a high density of breakage and will be the sections where we will enhance our prioritization scheme .

12th World Wide Workshop for Young Environmental Scientists WWW-YES-2012 Urban waters: resource or risks? Arcueil, France (21 – 25 May 2012)
145 / 175
Figure 2. Hotspot analysis: Kernel density estimation
A second issue to be discussed here is that this kind of hierarchy, to move from smaller clusters to larger (dissolved) clusters was done in purpose, since a smaller clusters can provide an indicator of breakage that is higher that breakage density in vicinity at the level of small sections but not allow to work in a larger scale if we would like to concentrate our prioritization at the level of streets or roads. Thereby, merging small clusters into larger ones, will permit to obtain a second level of clusters through which it will more easy to catch streets to replace (figure 3).
Figure 3. Merged clusters: Breakage rate
PRIORITIZATION SCHEME Spatial clusters results are now analyzed in order to provide insight on what issues spatial clustering can address to the infrastructure management decision. In this section we aim to compare the information provided by the definition of (non spatial) groups of pipe with similar age to the information provided by spatial clusters of pipes. The figure 3 shows that basing on breakage number per cluster, zones A and B are the most critical despite they contain newer pipes (installation year respectively 1956-1958 and 1959-1960). Basing on the breakage rate (breaks/km/year/cluster), we observe that the most critical zones are not those installed before
Zone AZone
Zone

WWW-YES-2012 proceedings (draft version)
146 / 175
1955 but rather where most breaks are concentrated. Furthermore, a same age of pipe may enclose different levels of breakage density which is one of the advantages of clustering (Fig.3). Right now, the prioritization scheme within each cluster will be based only on breakage rate of pipes as pipes included in clusters are automatically classified. Besides, to compare the current methodology with the classic one based only on breakage rate of pipes, we sort pipes network according to the breakage rate (high to low) and we plot the curve describing the avoided number of breaks versus the cumulative percentage of pipes length renewed in the network (Fig.4). To get validation period, we share the time horizon since 1962 to 2003 into two periods: analysis [1962, 1995] and validation [1996, 2003].
Figure 4. Avoided breaks versus renewed length
The figure shows that from 25% of the renewed length, the clustering approach is still advantageous over the classic one. This may justify the importance of the clustering concept as a long- term prioritizing method. It seems that the clustering method is very suitable for a long term rehabilitation planning where failures can form significant clusters during a meaningful period of time. Fig.4 shows that a long-term rehabilitation program considering 25% of the network for renewal allows us to avoid 50% of breaks while replacing 50% of the network grant us to avoid 100% of failures and 90% with rehabilitation techniques not based on spatial and temporal clustering. A second issue to underline here is that the replacement based on spatial analysis of clusters allows us to have fewer replacements, less linear to replace (10.9 km against 11.3km for classic method) that’s equivalent to 1.5% of the whole network but sparing the same number of future breaks (avoided breaks). Obviously, avoiding unnecessary replacements for 1.5% of the network will allow us to save about 99,650 € for the last seven years which corresponds to an average amount of 14,230 € per year.
CONCLUSION This research includes two main analyses using data on water pipe failures to complete the study started by (Nafi and Kleiner 2010). Geostatistical analyses through the use of scanning algorithm were addressed to discover not only the distribution of water pipes failures in space but also indicate various spatial and temporal trends. Through the spatial, temporal and scanning process based on the nearest neighbor hierarchical clustering, the breakage rate is calculated for each cluster as a first level of prioritization. This study indicates that a significant number of failures appear in geographic clusters. Notably, it shows point distribution with a strong concentration in some areas and low in another where it will be interesting to know the causes and types of these failures. In conclusion, analyses

12th World Wide Workshop for Young Environmental Scientists WWW-YES-2012 Urban waters: resource or risks? Arcueil, France (21 – 25 May 2012)
147 / 175
conducted via the point mapping cluster identification and spatial analyses techniques constitute powerful tools that can help for understanding the water pipe failure pattern problem and the prioritization process of pipes that should be renewed. The current methodology offers economic savings by avoiding unnecessary renewal.
REFERENCES • Le Gauffre P and Haidar H. (2008). Assessing the benefits of rehabilitation programmes defined
with the CARE-W decision support system. Water Asset Management International 4.1: 15-18. • Nafi A and Werey C (2009). Modèles d’aide à la décision et modèles de prévision de
défaillances : Etat de l’art et enseignements méthodologiques. Research report. Strasbourg. France. 56 p.
• Dridi L, Mailhot A, Parizeau M and Villeneuve J-P (2006). Planification optimale du renouvellement des conduites dans un réseau de distribution d’eau. Conference INFRA: 12th Annual Urban Infrastructure Week, Quebec Under Construction: Optimizing Infrastructure Resources, Québec City, Nov.22, 2006, pp.1-14.
• Halfawy M.R, Dridi, L and Baker S. (2008). Integrated decision support system for optimal renewal planning of sewer networks. Journal of Computing in Civil Engineering, v. 22, no. 6, pp 360-372.
• Giustolisi O and Berardi L (2009). Prioritizing pipe replacement: From multiobjective genetic algorithms to operational decision support. Journal of water resources planning and management. ASCE. 135(6): 484- 492.
• Goulter I.C and Kazemi A. (1988). Spatial and temporal groupings of water main pipe breakage in Winnipeg. Journal of Civil Engineering, 15(1): 91–97.
• Abdulvahit Torun A and Düzgün S (2006). Using spatial data mining techniques to reveal vulnerability of people and places due to oil transportation and accidents: A case study of Istanbul Strait. ISPRS Technical Commission II Symposium, Vienna, 12 – 14 July 2006.
• S. Ben-David, N. Eiron, and H.U. Simon. The computational complexity of densest region detection. Journal of Computer and System Sciences, 64(1): 22- 47, 2002.
• De Oliveira D.P, Garrett .J.H and Soibelman L (2010). A density-based spatial clustering approach for defining local indicators of drinking water distribution pipe breakage. Journal of Advanced Engineering Informatics.
• De Oliveira D.P, Neill D.B Garrett .J.H and Soibelman L (2011). Detection of Patterns in Water Distribution Pipe Breakage Using Spatial Scan Statistics for Point Events in a Physical Network. Journal of Computing in Civil Engineering, Vol. 25, No. 1
• Nafi A and Kleiner Y. (2010). Scheduling renewal of water pipes while considering adjacency of infrastructure works and economics of scale. ASCE Journal of Water Resources Planning and Management, 136, (5), pp. 519-603, October 01, 2010.

WWW-YES-2012 proceedings (draft version)
148 / 175
15. Live with floods in the Greater Paris. Flood risk integration in the landuse projects
Élodie MOULIN *
* LEESU, Laboratory Environment Water Urban Systems, 6-8 avenue Blaise Pascal, Cité Descartes, Champs sur Marne 77 455 Marne-La-Vallée Cedex 2, France (Email: [email protected] )
Abstract My thesis is the result of a European research conducted since 2009 about the implementation of flood resilience. This research is multidisciplinary; it involves hard sciences and human sciences researchers. This experience was a first step to develop my PhD subject. Indeed, the interaction between hard and human sciences is a key to a better understanding of how the issue of floods could be appropriate by non technical specialists. This research has to take into account the special context of the landuse in flooding areas in the Greater Paris, between a strong regulation and the real estate pressure. Behind the technical aspects of flood risk, the risk integration by the stakeholders is a relevant aspect of the landuse. We will search if the flood risk is considered as a main issue in the execution of an urban project and in this way observe the integration of the risk throughout the project.
Keywords Floods; landuse; urban project; management
INTRODUCTION Despite the strong regulation concerning the building in flooding areas, 80% of these areas are built and 828 100 inhabitants are exposed to floods in the Ile-de-France region (IAU, 2011). The land use in flooding area is presented as a solution to solve the real estate pressure. For instance some of the industrial wastelands are along the river and are currently in redevelopment and residential buildings are planned. Moreover, in the Ile-de-France master plan2 it is provided to build 60 000 accommodations pro year, in order to obtain 1.5 millions additional accommodations on the horizon 2030, we can deduce that the phenomenon of landuse in flooding areas will increase. This research fit into the special greater Paris framework (very dense and a strong lack of accommodation) and we have to take into account the metropolitan context as a matter of fact. In fact, we may ask ourselves if there is a place for flood integration in the metropolitan context. The regulatory context is mostly based on risk prevention plan, whereas there are more flood management tools, like the action plans for floods (PAPI). However with the implementation of the Flood directive since 2010, the objective is to homogenize the flood management policy and to make clearer the flood risk prevention and protection policy. How human sciences (urbanism, geography, social sciences) could deal with flood risk. And how answer to the question: how the integration of the flood risk enables the implementation of an urban project. This paper will first present the context of the development of the PhD project.
2 in the draft version of 2008

12th World Wide Workshop for Young Environmental Scientists WWW-YES-2012 Urban waters: resource or risks? Arcueil, France (21 – 25 May 2012)
149 / 175
It will then introduce the methods used to answer to the core question. At last, we will show how first results can be turned into research hypothesis and lead to a new research question.
THE FLOOD RISK THROUGH THE HUMAN SCIENCES
A European project: Smart Resilience Technology Systems and Tools (SMARTeST) This European project is the first step of our research. This project began in 2009 and will end in December 2012. It involves seven countries Germany, United Kingdom, France, Greece, Cyprus, Netherlands and Spain. The purpose of the project is to find the “road to market” for flood resilient3 tools, as barriers, non-return valves, demountables gates. In order to meet this objective, the project integrates hard sciences and human sciences to develop a flood resilient system. It’s structured in five work packages, the first one is the management of the project, the second concerns the test of the flood resilient tools, the third is designing a flood resilient system, the forth is developing technology implementation tools and the fifth includes all the work packages to find the improvement of the flood resilient tools integration. I’m especially involved in the fifth, the one which including mostly human sciences researchers, with the description of stakeholders interactions and the development of workshops integrating stakeholders in order to find the best scenarios of flood resilient systems. Each country chose a city to develop its research. In France, we chose the Greater Paris and especially the Bièvre River, the urban project Seine Rive Gauche in Paris and the “Orly-Rungis Seine Amont” area (in the west of the Val de Marne County). As human sciences researcher in the framework of the project, we have to describe the flood risk management in France, to conduct interviews with local authorities, associations, cities services and to organize workshops about flood resilience integration. Along the project hard sciences and human sciences researchers have to be in contact to describe as well what is a flood resilient system including hydraulic data and stakeholders interactions. For instance, the workshops are conducted in three parts and focused on the Bièvre River basin; the territorial diagnosis, including flood protection and prevention measures and tools; strategies elaboration, that is to say the elaboration of combination of structural and individual solutions of flood protection and/or vulnerability reduction depending on the foreseen projects of urban development; and the assessment and rating of the scenarios. These workshops are an example of the combination of hard sciences methodology with the territorial diagnosis and the use of models to develop the scenarios and at the same time human sciences methodology to organize into a hierarchy the scenarios and to integrate all stakeholders including inhabitants in the process. Through this project I find how I can investigate the landuse in flooding areas and what question has not been explored by researchers. The resulting topic The landuse in urban area has to be linked with the regulatory policy. Indeed, the risk prevention plans are the tools used by the central state services to control the urbanism in these vulnerable areas. These documents establish the constructible areas (with some instructions to take into account) and the non-constructible areas. The risk prevention plan is included in the city master plan, so the mayor has to take it into account when he issues planning permissions. The management of flood risk is constituted by others documents concerning prevention, 3 Here we use the most common definition of the resilience: the ability of a system/community/society/defence to react to and recover from the damaging effect of realised hazards. www.floodsite.net

WWW-YES-2012 proceedings (draft version)
150 / 175
management of the crisis, etc. The first question is: why, despite regulation, there is still building in floodplains. To us, it's maybe in the application of the regulation by stakeholders, that we will find some of the flaw of the flood risk management. We want to study the amount of risk taken by those involved in planning. At the beginning of my PhD project, we developed some questions, which appeared to us as key points in our reflection. We wanted to identify which step of the development of a building project is the key moment to integrate the flood risk issue, that is to say at which time the flood risk appeared in the debate around the development of the project. What is the good governance around the project, which enables the risk integration? Who are the stakeholders’ driving this process? How is built the speech about the improvement of the resilience and the reduction of the vulnerability. Are these concepts openly mentioned or are they underlying? To answer to these questions we planned to take into account different scales of landuse project: the building, the plot, the district. This approach enables us to observe if the integration of the risk rises crescendo along the project or if it progressively disappears of the stakeholders’ speeches and actions. The progress of the SMARTeST project allows us to enrich this PhD project and to develop a method applied to human sciences and especially to urbanism and landuse.
MATERIAL & METHODS: THE URBAN PROJECT, HOW TO APPROACH THE INTEGRATION OF THE RISK Here we have to define what we hear with the concept of urban project, the central point of this PhD research.
The urban project: a way to understand the stakeholders’ interactions The urban project is born with the delegation of responsibilities from the global (central state) to the local (city) (Pinson, 2009). The central services used to proceed with a long term planning, whereas the elected representatives and town planners tend to act with uncertainties and pragmatic planning. The state urbanism was focus on central services (technical and administrative), whereas in the conduct of urban project the stakeholders networks involve public and private stakeholders, political and technical, expert and layman (Pinson, 2009). Most often an urban project involves working with a larger scale, e.g. the neighborhood. Currently, in France and especially in the discussions about the Greater Paris development, a new concept appears: the project urbanism (l’urbanisme de projet). This concept means that the development of a city has to be think through the urban project, which has to be free from the city and the regional (landuse) planning. This includes a special dispensation that is to say that the urban project doesn’t have to take into account the city and the regional master plan. In the case of flood risk awareness, this concept of project urbanism could be a good or a bad thing. Around the Greater Paris there are a lot of discussions and one of them it’s : “We have to build in flooding areas because there are still free from buildings”. So with the project urbanism, city planners could use the special dispensation included, to build in flooding areas without taking into account the risk in the development of a project. But on the contrary the concept could be a way to take the risk into account differently at a larger scale. Indeed, risk prevention plan deals with flood risk at the building scale, project urbanism could deals with flood risk at the district/neighbourhood scale.

12th World Wide Workshop for Young Environmental Scientists WWW-YES-2012 Urban waters: resource or risks? Arcueil, France (21 – 25 May 2012)
151 / 175
To answer questions raised above, we have chosen the urban project approach and so we have chosen several urban projects and through its descriptions we will develop how the risk is taken into account. We will interview all stakeholders taking part in the building of an urban project: contracting owner (elected representatives,…) project manager (architects, town planners,…), property developer, social landlords, central state services etc.
Urban projects selected We have chosen the Greater Paris as our area of study, in order to continue the work begun with the SMARTeST project. Here we are going to describe the urban projects we selected. This list will perhaps change during our project, functions of information which information we can access. Indeed, some city planners or cities do not always agree with the diffusion of some information about the development of the projects. So the access of information (e.g. archives, plan, meeting report,…) will shape the list of the selected projects. The main project we are studying is a project called the Ardoines (“les Ardoines”) located along the Seine River in Vitry-sur-Seine in the Val de Marne County. The Ardoines are integrated in an operation of national interest (Opération d’Intérêt National, OIN), which included 12 cities. It used to be an industrial wasteland, and now this area is in redevelopment and a public development authority (Etablissement Public d’Aménagement, EPA) is in charge of this redevelopment. This area is interesting because the public development authority brought together several experts to elaborate some guidelines to know how build in this flooding area and how take into account vulnerability, resilience and the management of the crisis. An architect drew up a master plan taking into account the risk and the vulnerability. It’s a planning with three steps: the first one could be flooded by a 20 years flood, so it is occupied by a park; the second floor could be flooded by a 50 years flood, here there are some accommodation and activities, but the ground floor of buildings has to be unoccupied; and then the third floor could be flooded by a 100 years flood, it’s occupied by the most vulnerable activity e.g. transport infrastructures. This master plan has to be tested by hydraulic models.

WWW-YES-2012 proceedings (draft version)
152 / 175
Source : SEURA, 2009.
Fig. 1: The Ardoines master plan The second selected project is an eco-neighbourhood in the city of Ile saint Denis, in the Seine-Saint-Denis County. It’s a farmer warehouse area and now the local authority has a redevelopment project in the city. The territory has got a lot of constraints because it’s an island, but they decided to give more space to water in the neighbourhood. Here the question of the crisis management is relevant, but at this time this question it’s not evocated in the project discussions. The third selected project is Paris Seine Rive Gauche, a neighbourhood located between the Austerlitz station and the National library. It’s a flooded area. During the construction of the building they did not take into account the risk. But yet they weatherproof some basements, for instance to protect the National Library books and archives. We have selected others projects, we considered them as secondary in our study and as element of comparison. We have chosen an eco-neighbourhood in Mantes-la Jolie, a project of a lake dwelling in Neuilly-sur-Marne and an urban project called Ivry-Confluence. There are all urban projects in flooding areas and are in the study phase. Our investigations concerning these projects are not very advanced in terms of interviews and analyses. After around twenty interviews, our approach evolved but the urban projects stayed the middle of our reflection.

12th World Wide Workshop for Young Environmental Scientists WWW-YES-2012 Urban waters: resource or risks? Arcueil, France (21 – 25 May 2012)
153 / 175
RESULTS AND DISCUSSION The flood risk isn’t a major issue in an urban project Thanks to the interviews, the first result is that the risk is not taken into account by the stakeholders as a major issue in the discussions around the urban project. They apply the risk prevention plans but the flood risk is integrated as a constraint of the urban project. The elected representatives are afraid to communicate about the flood risk to the inhabitants. For instance, in the consultation about the development of the Ardoines project, there is little information about the risk concerning the area. Indeed, the elected representatives don’t agree with the master plan, because a part of the area could be flooded by a 20 years flood and they don’t accept that the city appears as a flooding city. On the contrary, the river as the natural element is actually a rise in value element. The discussions around the Greater Paris promote the return of the city towards the river. A member of the Paris city hall says that high rise buildings have to be built along the Seine River, because more people could have a river view. There is a gap between the landuse policy and the flood risk management policy. This gap could be reduced if the urban project is integrated in a territory and so is thought at a larger scale. Currently, the management of flood risk is limited to the application of the risk prevention plan. Civil engineering: a way to integrate the flood risk We observe that the non-integration of the flood risk issue is not because a technical problem; a lack of knowledge about the hazard or a lack of knowledge in the way to build taking into account the vulnerability and the resilience, but more because a non-integration by stakeholders. The risk prevention plan is not very efficient in dense area because this document concerns only new buildings. But despite twenty years of risk prevention policy in the urban project only the risk prevention plan is applied and comes down to civil engineering; e.g. stilts, ground reshaping, build out of the high water mark, etc. It’s a failure in the policy of flood risk management regarding all the documents concerning prevention and management of the crisis. The stakeholders taking part in urban project take the risk into account only through constructive measures and don’t care about the management of the crisis.
CONCLUSIONS Because of the real estate pressure, the concept of densification through the sustainable development and the fact that the river appears as an element of an urban project promotion, the risk is not considered as a major aspect of an urban project. Currently, we observe that the management of the flood risk is dissected in accordance with the sustainable development and the concept of densification. Indeed, the flood risk management is summarized as constructive measures, without thinking in terms of prevention and crisis management. But in case of flood, who will be responsible for the damages? Nowadays the human sciences try to “do science” to the side of hard sciences. They appropriate technical subject related to environmental sciences as the flood risk. But they chose others entry points as the urban project and others subject as the interactions of the stakeholders. To the scientific community the human scientists’ methodology isn’t real sciences and could be compared with the work of the journalists. Through projects bringing together human and hard scientists, the understanding and the exchange of way of “do sciences” may be rewarding for each.

WWW-YES-2012 proceedings (draft version)
154 / 175
REFERENCES • BRUN Alexandre, ADISSON Félix, « Réduction de la vulnérabilité face au risque d’inondation
dans le grand Paris : le projet Seine Ardoines », La Houille Blanche, vol. 1, 2011, p. 75-81. • Grands Lacs de Seine, « L’aménagement des zones inondables en Ile-de-France. Regards croisés
de praticiens », 2010, 45 pp. • IAU Île de France, Note rapide Urbanisation et zones inondables: les risques encourus 557 -
juillet 2011, 6 pp. • PINSON G., Gouverner la ville par projet, Urbanisme et gouvernance des villes européennes,
Sciences Po. Les presses (ed), 2009, 420 pp. • Schéma Directeur de la Région Ile de France, draft version September 2008. • VANIER Martin Territoire territorialité, territorialisation, Presses Universitaires de Rennes,
Espaces et Territoires, 2009, 232 pp.

12th World Wide Workshop for Young Environmental Scientists WWW-YES-2012 Urban waters: resource or risks? Arcueil, France (21 – 25 May 2012)
155 / 175
WWW-YES-2012 session 3: Water resource
16. Urban water usages in Egbeda area of Oyo State, Nigeria
Temitope Dare Timothy OYEDOTUN*
* Department of Geography and Planning Sciences, Adekunle Ajasin University, P. M. B. 001, Akungba-Akoko, Ondo State, Nigeria. (E-mail: [email protected] )
Abstract The increasing urbanisation of Egbeda town has put pressure on the scarce freshwater resources for the multifarious household usages. 149 households were sampled to evaluate their water usages and needs through the use of prepared questionnaires. It is discovered that the town is entering the category of “water stressed” towns which is a typical phenomenon in the 21st Century developing urban cities. As the population increases, the per capita water share diminishes. Unfortunately, the limited freshwater available are below the WHO Drinking Water Standard as observed from the analysed samples from the four main sources. Major limitations observed is peculiar in a developing country like Nigeria which include lack of accurate data and the unwillingness of many households to participate in questionnaire interview. However, the method adopted remains a vital medium by which urban water usage can be evaluated in developing countries where there’s no standard water metering supplying system.
Keywords: Developing countries; water quality; water usages; contaminants; urban;
INTRODUCTION Urbanisation, as an age-old phenomenon, has been described as the process by which human agglomerate in multi-functional settlements of relatively large size (Mabogunje, 1981; Central Bank of Nigeria (CBN), 1999). However, if this phenomenon is properly controlled and managed, it connotes civilisation and socio-economic progress (CBN, 1999;)- this is being true of the Western world. If it is not controlled, on the other hand, it would be characterised with several ranges of social vices and economic problems including but not limited to environmental pollution, inadequate and poor housing provisions, disproportionate high rate of unemployment, crimes and violence, uncontrollable high poverty rate, water resources problems and a host of other developmental challenges- the emblems of many developing countries, especially those domiciled in sub-Saharan Africa. One of the important components of any area (whether urban or rural) is the development of water resources for various uses and purposes to which they can be put. Water issues have, therefore, always been on the fore-front of political and academic headlines, discussions, forums and conferences at various spheres. This is because of the water’s undisputable importance to man’s daily life and earthly existence. Water has always been serving communities and sustaining life through-out the history of man-kind. There is an abundant of fresh water resources in Nigeria, particularly in the south-western region of the country (Obatoyinbo and Oyedotun, 2011) where Egbeda Local Government Area (LGA)

WWW-YES-2012 proceedings (draft version)
156 / 175
is situated. Rijswljk (1981) estimated the groundwater resources in Nigeria at 0 – 50m depth to be 6 X 10⁶ km3 (6 x 10⁶ m3) while Hanidu (1990) estimated the total surface water resources to be 224 trillion litre per year (l/yr). However, Akujieze, et al. (2003) estimated the total groundwater yield from the eight mega regional aquifers in Nigeria to be 7.2 times Rijswljk (1981)’s figures as a result of additional groundwater input/yield to the aquifers, the total of which is estimated to be 50 million trillion litre per year (Akujieze, et al. 2003). Hence, there is a notion of an assured abundant of fresh water resources in Nigeria to meet the rising populations of the country. However, a recent report by the United Nations Development Programme (UNDP) Human Development Index placed Nigeria 159 among 177 countries assessed for unavailability of safe water and also among the 30 nations with poorest quality of life worldwide (Ifabiyi, 2012). Another report by Central Bank of Nigeria as indicated in Ifabiyi (2012) stated that as much as 70% of the Nigeria’s population are living on less than One US Dollars ($1) daily income with about 40% of the entire population illiterates which may not be able to apply simple hygiene (Ifabiyi, 2012). These worrying findings suggest that relatively high percentage of Nigerians is vulnerable to water borne diseases and other related water problems/issues. Furthermore, the annual renewable per capita fresh water for Nigeria has been observed to be on the decrease- the development of which is complicating the already established challenges facing the nation. Ifabiyi (2012) stated that the annual renewable per capita freshwater in Nigeria was 2,203 Cubic Metres (Cu) in 1990, and the amount was discovered to be 1,292 Cubic metres in 2003. In a nutshell, millions of Nigerians have no access to safe water and sanitation- just like their fellows in other parts of the developing countries. They face daily problems in obtaining water for domestic purposes and other multifarious uses. Ifabiyi (2012) stated that the coverage of potable water in Nigeria was 20% in 1980 which later rose to 30% in 1985, 35% in 1991 and approximately to 55% in 2007 respectively. However, despite the increase in coverage the real service level in some rural and urban areas is about 10 and 30 litres per capita (lpcd) respectively. The service level in urban cities in Nigeria have been bedevilled by breakdown of water infrastructural facilities, the increasing negative effects of climatic changes in form of bouts of dry spells, and the geometric urban population increases as a result of rural-urban migration influx and the high birth rates which have placed so much demand on the limited urban water infrastructural facilities. All the above issues point to the fact that Nigeria is a water stressed nation, and every efforts must be geared at addressing the water issues in the country, especially in the urban cities. The consumption and usage of contaminated and polluted water has been noted to be one of the most important causes of ill health and sicknesses, particularly in developing country (Ford, 1999). Therefore, the surveillance of freshwater (drinking water especially) supplies in urban areas is a very significant efforts at protecting the public health (Howard, et al., 2002). However, the adoption and implementation of effective drinking-water surveillance is either limited or non-existence in many developing country, despite the importance of such programmes to urban dwellers and population (Howard, et al., 2002). Where such exist, they focus mainly on the distribution and maintenance of piped water supplies, irrespective of the existence and use of other source/form of water for domestic or industrial use. In many urban communities in developing countries, most of the households collect water from communal sources. The pattern of water usages in urban communities in developing countries is, however, often complex as a result of variety of different sources offering different acceptability, cost, reliability and qualities (Howard, et al., 2002).

12th World Wide Workshop for Young Environmental Scientists WWW-YES-2012 Urban waters: resource or risks? Arcueil, France (21 – 25 May 2012)
157 / 175
The information and knowledge of the variety of water sources available to the low-income urban population will lay a solid foundation for the initialisation of effective water supply surveillance, proper design and implementation of freshwater resources management, identification of the sources of water-related illnesses and diseases, and the cost-effective approaches of meeting the water needs of growing urban populations. The main purpose of this paper, therefore, is to assess the water usage pattern in Egbeda area, one of the urban communities in Ibadan, Oyo State of Nigeria. The paper focuses on the identification of household water usages in, and the quality of the available ones on, the urban community.
The study area Egbeda town is the current political headquarter of Egbeda Local Government Area (LGA) of Oyo State. It is one of the 33 LGAs of the state and one of the eleven (11) LGAs that make up Ibadan Metropolis. The town is located on latitude 70 21’-80N and longitude 4002’ - 4028’E with a total land area of approximately 191km2(Figure 1). The Egbeda LGA was carved out of the old Lagelu LGA in 1989 (Lawal, et al., 2011), the development of which has led to the rapid expansion of the town from the agrarian community to urban town.
Figure 1: Map of Oyo State Showing the study area (Egbeda). Inset: Map of Nigeria showing Oyo State.
The town lies generally on a gently rolling/undulating plain which falls below 180 metres (600ft) above sea level in most parts of the entire LGA, while the lower parts which are very close to the flood plain of River Osun, both on its right and left bank, are on the height as low as 150 metres (500 ft) above sea level. However, the entirety of Ibadan (the study area included) is made up of the rock basement complex principally. More than ¾ of the basement rock in Egbeda occur as banded gneisses, whole granite, gneisses and quartzites share the rest in almost equal proportions (Grant, 1970). The rock types are covered in most places by weathered materials and outcrop in a few places. River Osun is the main river in the study area and others like Omi, Idogun, Okesuru are tributaries to it. While these tributaries together with River Osun usually overflow their banks during the rainy season in May – October, they however dry up completely during the dry season- making River Osun to be the only permanent river in the area, the others are seasonal.

WWW-YES-2012 proceedings (draft version)
158 / 175
The current population figure of Egbeda area at the 2006 Housing and Population Census is 281,573 (National Population Commission- NPC, 2006). The earlier population figure of the community was 128,998 in 1991 Census. This indicates an increase of 54.2% in the total population within the space of 14 years. This sudden geometric increase in the population is expected to have led, as usual, to an increase in the demand and usage of water for various domestic uses (cooking, drinking, bathing, washing, etc). The research is carried out at Egbeda, Olode and Alakia- which are among the 11 communities/wards that make up the Egbeda LGA.
MATERIAL & METHODS A set of questionnaires was used to collect information from the communities on their water usages. The information derived from the questionnaire are used largely to determine the pattern of water usages in the study area. Complete interview of the inhabitants in Egbeda town is costly, time consuming and impracticable due to resource constraints. Consequently, a representative sample of 149 households in all was chosen from each of the three communities in the study area. The communities were chosen for the survey because they are relatively urban and are the main Central Business District of the LGA. The communities chosen have population of over 30,000 and they are devoid of agrarian activities. Also, the willingness of the heads of those communities to allow the researcher to carry out the survey questionnaire as well as the easy accessibility of the communities are another factor for their choice. The household heads were selected for interview from each of the communities. However, where the household heads could not provide some information/answers, the wife or any other family members are readily called upon to provide such information. The selection of the respondent at each community was done by reference to a systematic random sampling. Where any particular household head refused to grant the interview or allow the researcher to take the water samples, the house is omitted and another house was selected to replace it. The researcher ensured that both written and oral interview was conducted among the residents of the communities. The total percentage questionnaires distributed and retrieved in respect to each community visited are as shown in Figure 2 below.
Figure 2: Distribution of questionnaires in the communities within Egbeda town. Though there are quite a number of possible approaches to gathering information concerning water use behaviour in developing countries, including both qualitative and quantitative techniques (McGranahan, et al., 1997; Howard, et al., 2002), lack of data about water usage in the study area has left the researcher with no other option than the use of questionnaire to elicit information from the dwellers/residents. Apart from lack of data on water usage in the study area, the unwillingness of many households to participate in questionnaire interview is another challenge faced by the researcher. However, the use of questionnaires to elicit information on water usage remains a vital medium by which urban water usage can be evaluated in developing countries where there is no standard water metering supplying system. The questionnaire was

12th World Wide Workshop for Young Environmental Scientists WWW-YES-2012 Urban waters: resource or risks? Arcueil, France (21 – 25 May 2012)
159 / 175
developed for the purpose of the study and targeted at eliciting information about three (3) key main issues (after Howard, et al., 2002): -the source of domestic water use for the households, and their relative priority; -the factors which influence the choice of water source; and, -the extent to which differential use of water sources is in operation. The second methods adopted in the research involved the evaluation of the water samples from the different sources identified during the questionnaire administration. Twelve (12) water samples were collected from four (4) different locations at each of the three communities. About 30 millimetres of water samples were collected using clean plastic containers, then labelled and preserved in refrigerator until they were taken to the laboratory for chemical analysis. The major cations analysed for and the findings of which will be reported in this paper include calcium (Ca2+), magnesium (Mg2+), sodium (Na+) and anions such as sulphates (SO4
2-), chloride (Cl-) and iron (Fe2+). The analysed results are then compared with the World Health Organisation (WHO) recommended standard for drinking water quality. The table 2 below gives the summary example of these recommendation.
Table 2: Summary of Physical and Chemical Characteristics and WHO (1984) standards for drinking water
Measured
Parameter GW* SW*
Temperature (°C) 27.17 24.96
pH (pH Unit) 7.91 7.70
EC (ms/cm) 437.59 106.00
TH (mg/L) 16.14 3.84
TDS (mg/L) 250.98 46.50
SAR (mg/L) 0.56 0.99
Ca2+ (mg/L) 45.75 4.39
Mg2+ (mg/L) 4.58 3.97
Na+ (mg/L) 11.61 7.46
K+ (mg/L) 19.08 7.17
Fe2+ (mg/L) 0.19 0.14
HCO3- (mg/L) 31.71 25.82
Cl- (mg/L) 29.91 18.13
SO42- (mg/L) 1.40 1.64
PO43- (mg/L) 0.01 0.01
NO3- (mg/L) 3.81 6.39
GW*= Groundwater; EC = Electrical Conductivity; TH = Total Hardness; SAR = Sodium Absorption Ratio;
SW* = Surface water (mean concentration) for each group; TDS = Total Dissolved Solid Source: World Health Organization (1984, 1993, 2011)

WWW-YES-2012 proceedings (draft version)
160 / 175
RESULTS AND DISCUSSION
Choice of water supply and use The analysis of the findings indicate that 89.3% of the households depend on more than one source for their domestic water supply (Figure 3). In the three communities, none of the household make use of piped-borne water taps because of the unavailability of that source in the communities. The information collected from each of the households included questions on first choice water source type, use of more than one source and any other sources used outside the home. In Alakia, hand-dug wells represent the most common first choice, followed by rain-water during the rainy seasons and hand-held borehole during the dry season with the use of surface water as non-existence. In Egbeda and Olode communities on the other hand, the protected hand-held boreholes represent the first choice among the middle- and low- income earners, with as many as 38.2 % and 36.2% respectively making the hand-dug wells as their second choice. Other sources of water like rivers and streams are sought by the households for another uses apart from drinking and domestic consumptions. Rivers, streams and unprotected springs are being utilised in all the three communities for car washing and for laundry by low income earners (Figure 4).
Figure 3: The percentage of (a) first choice and (b) second choice drinking water source by households. The main reasons why no household source their domestic water supply from pipe-borne water tap is simply because there is no provision of such in the community. 76.4% of the respondents in the three communities indicate their willingness to be getting their water supply from public tap if there is a provision for it by the government while 34.6% of the respondents indicated that they would still prefer their reliance on hand-dug wells. The 76.4% who desired to source their water supply from public tap (if provided by the government) hinge their willingness on the belief that such a source will guarantee a high level of drinking water quality because of the level of treatments such would have to go through before being made available to the public. The 34.6% who are sceptical about sourcing their domestic water consumption from public taps are of the opinion that many of the government provision are not of high standard and quality. As such, the provisions of public water is expected to follow the similar patterns of other poorly provided social services by the government. They, therefore, concluded that knowing the source of their own water supply is a key to clear any doubt of what their un-trusted and selfish politicians/government may provide. Some stated that lack of continuity of such provisions and the speedy decaying nature of many public infrastructures/facilities are some of the attributes of government provided facilities which would discourage them from relying on the government supplied pipe-borne water. However, the widely indicated second choice source type for
(a) (b)

12th World Wide Workshop for Young Environmental Scientists WWW-YES-2012 Urban waters: resource or risks? Arcueil, France (21 – 25 May 2012)
161 / 175
drinking and domestic water consumption are public protected boreholes in all the communities sampled for the study (Figure 3b). The number of the households with their own hand-dug wells in Alakia (72%) are more than that of Egbeda (23%) and Olode (05%)) areas respectively where majority of the households source their domestic water needs from their neighbours who have hand-dug wells within their compounds.
Figure 4: Laundry at one of the streams at the study site (Egbeda). The high percentage (72%) of households with their own hand-dug wells in Alakia corresponds with the combined percentage of the households which identify themselves as either high income (#80,000 and above, monthly income) or middle income (#30,000 - #79,999 monthly income) which are 12% and 61% respectively compared to those with low monthly income of 27% (<#30,000 monthly income). The percentage of the households with low income is higher for Egbeda (54%) and Olode (71%) than for that of the middle and high income for both communities {Egbeda- middle (54%), high (01%); Olode- middle (28%), high (01%) respectively}. The logical conclusion that can be deduced is that the households with high and middle income tend to make provision for their own hand-dug wells to serve as continuous source of water supply for their multifarious water needs. Those with low income who could not afford such provision, however, have to rely on the generosity of their neighbours for their water supply or to make use of the public hand-held borehole in their community. Despite the differentiation of the choice of water sources for domestic usages in the households into first and second choices, evidences from the field study and the responses of the respondents suggest that second choice are typically used several times by the households per week as no single source could meet the growing needs of the households for multifarious domestic needs like cooking, drinking, bathing, sanitary, etc. There was, therefore, little overall differentiations in frequency of use between the first and second choice sources- as also observed by Howard, et al. (2002) in a study on Ugandan towns. This shows that it is regular pattern in the developing world where the households source for their own water supply provision. It is of importance to mention that the dependence of the households on different sources also depend on the seasons of the year. While many considers rainwater as the first or second choice during the rainy seasons, almost all of the respondents depend on either hand-dug wells (if they do no dry up during the dry seasons of October - February, as many as 62.3% of the hand-dug wells at the sampled households dry up during the dry season) or the protected hand-held public boreholes for their sources of water usage. However, some of the given reasons why the household depend on hand-dug wells or public protected boreholes for their source of water usages in the communities are:

WWW-YES-2012 proceedings (draft version)
162 / 175
(i)the relative ease at which they can be sourced; (ii) the relatively low cost of development, maintenance and operation; -available at the point of source; (iii) the belief that it is of high quality than surface water (streams, rivers, etc) or rainwater which might have been contaminated with the corrugated iron roofs which many of the buildings are covered with- that is, it is of high chemical and bacteriological quality than surface water; and, (iv) since no government has made provision for any reliable alternatives, the hand-dug wells remain their best options, etc. Most of the hand-dug wells in the communities (62.3% in the aggregate) do not serve as the source of water supply all year round as they dry up during the dry-season because of their limited depth which do not reach water table or over-withdrawals by the households and neighbours during the season. Many households had to depend on the public hand-held boreholes for drinking and domestic consumption, to which had to be regulated because of the intense pressure of the population on the source during the dry season. Rivers and streams are used for other uses like cleaning, car washing, toiletry/sanitary, etc (Figure 4 above). Water quality evaluation The water quality, whether it is used for drinking, irrigation or recreational purposes, is very important for health in both developed and developing countries worldwide. Water quality can, therefore, have impacts on health of the populace, either through the outbreaks of water borne diseases. In order to assist countries in establishing effective national or regional standards, the World Health Organisation (WHO) has developed a series of normative guidelines for the assessment of health risks and hazards through water (WHO, 1984, 1993 and 2011). The representative summary of physical and chemical characteristics of such standards is presented in Table 2 above. From the analysis of the choice of water use/supply in the study area for drinking and consumptive purposes (cooking, etc), it is discovered that aggregate 98% of the households depend on either hand-dug wells or the hand-held public boreholes for their water usages. In order to evaluate the quality of the water being used at the communities, about 30 millimetres of water samples were collected from a different hand-dug wells at the households and the central boreholes in the Egbeda community. The chemical parameters evaluated for in this paper are calcium (Ca2+), magnesium (Mg2+), sodium (Na+), iron (Fe2+), sulphates (SO4
2-), and chloride (Cl-). The findings from the analysis of the samples which are compared with WHO Drinking Standard are presented in Figure 5 a – c below.
(a) (b)

12th World Wide Workshop for Young Environmental Scientists WWW-YES-2012 Urban waters: resource or risks? Arcueil, France (21 – 25 May 2012)
163 / 175
Note: HDW: Hand-dug well, HHB: Hand-held Boreholes
Figure 5: The comparison of samples of groundwater chemical properties at the selected communities (a)
Egbeda (b) Alakia and (c) Olode with WHO established standard.
The characteristics of each chemical elements of water samples vary from one point to another as a reflection of the differences in the point of abstraction. Figure 5 above indicates the comparison of the evaluated chemical elements of water being used by the majority of the households with the WHO established standards (Table 2). The summary analyses of the selected six chemical parameters indicate that Ca2+, Mg2+, SO4
2-, and Cl- are far lesser than the WHO acceptable drinking water standards for the sampled water from the hand-dug wells predominantly in all the three communities except for sodium (Na+) whose values (mg/l) are higher than the WHO standard while the values (mg/l) for the hand-held boreholes of the same elements for Chlorine (Cl-) are very close to the WHO drinking standards at Egbeda. The magnitudes of values for iron (Fe2+), on the other hand, are higher than WHO recommended standards for the samples from the hand-dug wells in all the three communities within the Egbeda area. The likely effects of water ingestion below or above the WHO acceptable standard on human health has been proscribed by the WHO. The summary of such effects are presented in Table 3 below. Though there is urgent need to meet the present water needs of the community, the long-term effect of consuming water of low quality on human health is far more damaging (Table 3). There is, therefore, the need to ensure that the water to be supplied in meeting the domestic needs of the households in Egbeda area are of high quality. The major threats to the groundwater quality to which the majority of households in the study area depend on are septic tank and soak-away pits leakages as well as water table interception with latrines. These are common phenomenon in developing countries where there is no central water supply system nor central sanitary disposable facilities. These kind of anomalies do affect the physical and chemical components of groundwater parameters.
Table 3: The likely effect of water ingestion above/below acceptable level
Measured
Parameters
Acceptable
Level
Effect above/below level
Cadmium 0.003 mg/l Kidney damage
Chlorine Max 200mg/l Eye/nose irritation; stomach discomfort
Calcium Max 200mg/l Indigestibility of fat in the body
Magnesium Max 150mg/l Gastrointestinal, liver or kidney damage
Iron 0.30 mg/l Rusting, cancer
Sulphate Max 400 mg/l Allergic dermatitis
(c)

WWW-YES-2012 proceedings (draft version)
164 / 175
Sodium Max 200 mg/l Increased risk of cancer
Source: WHO, 1997
CONCLUSIONS Nigeria was ranked the worst Guinea-worm-infected country in the last millennium (1901 – 2001) with about 2.5 million cases out of the 5-15 million cases world-wide (Akujieze, et al., 2003). This is in part due to inadequate water supply, lack of access to qualitative water for consumption and contamination of available limited freshwater resources to the urban population. Ekpo (1990) reported Oyo State, of which Egbeda area is one of the cities within the state, to be among the worst hit area. The poor water supply in urban cities in Nigeria causes typhoid fever, cholera and bilharzias in areas where people depend on streams, shallow uncovered wells, pools from drilling water and where public water source are not appropriately or sufficiently treated (Akujieze, et al., 2003), as well as the interception of a shallow water table with pit latrines and soak-away pits at certain seasons of the year (Oteze, 1981) mostly in a basement complex aquifers like Egbeda area where households depend on groundwater as their water source. The findings from this study has shown that increasing urbanisation (as a result of rural – urban migration) of Egbeda town since 1989 when it was designated as the headquarter of a LGA has put more pressure on water resources with the households depending on groundwater predominantly through either hand-dug wells or hand-held boreholes in the communities. The groundwater to which the communities depend on for their domestic household consumption are, however, far below the acceptable WHO Drinking Water Standards. The governments at all levels (Federal, State and Local) are hereby encouraged to make conscious efforts to address the water supply issues and treatment in the entirety of the country (study area inclusive) so as to avoid the negative experience of the last millennium when the country was hit with water related sicknesses, illnesses and loss of lives. Lack of comprehensive knowledge of the quantity of or current water demands for both domestic and industrial uses, is responsible for the significant shortage or complete absence of potable water in urban and rural areas especially in South-western Nigeria where there is an apparent abundant of fresh water resources (Akujieze, et al., 2003). However, the method adopted in this paper remains a vital medium by which urban water usages can be evaluated in developing countries where there’s no standard metering supplying systems. It is, never-the-less, recommended that governments and NGOs should step into the water issues in the country so as to adopt the standard water metering, supplying and surveillance systems which are in operation in the developed countries of the world. The proper preservation and utilisation of water resources today is the proper preservation of lives and humanity tomorrow, because WATER IS LIFE!
REFERENCES • AKUJIEZE, C. N., Coker, S. J. L., and Oteze, G. E. (2003) Groundwater in Nigeria- a
millennium experience - distribution , practice, problems and solutions. Hydrogeology Journal, Volume 11, No 2. April, 2003. Pp259- 274
• CENTRAL BANK OF NIGERIA (CBN) (1999) Urbanization and related socio-economic problems in Ibadan Area. Research Departmental Occasional Paper No 25.
• EXPO, I. E. (1990) Nigeria’s water management strategy: the journey so far. Proceedings of the First Biennial National Hydrology Symposium, IHP Maiduguri, pp 294 – 301.
• FORD, T. E. (1999) Microbiological safety of drinking water: United States and Global perspectives. Environmental Health Perspective, 107, 191 - 205
• GRANT, N. K. (1970) Geochronology of Precambrian basement rocks from Ibadan, Southwestern Nigeria. Earth and Planetary Science Letter, 10, pp 29 – 38.
• HANIDU, J. A. (1990) National growth, water demand and supply strategies in Nigeria in the

12th World Wide Workshop for Young Environmental Scientists WWW-YES-2012 Urban waters: resource or risks? Arcueil, France (21 – 25 May 2012)
165 / 175
1990s. Water Resource Journal of Nigerian Assoc Hydrogeol 2(1), pp 1 – 6. • HOWARD, G., Teuton, J., Luyima, P. And Odongo, R. (2002) Water usage patterns in low-
income urban communities in Uganda: implications for water supply surveillance. International Journal of Environmental Health Research, 12, 63 – 73.
• IFABIYI, I. P. (2012) Hydrograph analysis and hydrological zones: tools for watershed and water resources planning in a sub humid tropical catchment, Nigeria. Journal of Geography and Geology, Vol. 4, No 1.
• LAWAL, J. O., Omonona, B. T. and Oyinleye, O. D. (2011) Effects of livelihood assets on poverty status of farming households in Southwestern Nigeria. Paper prepared for presentation at EAAE 2011 Conference. Change and Uncertainty: Challenges for Agriculture, Food and Natural Resources. August 30 to Septmber, 02, 2011, ETH Zurich, Switzerland. McGRANAHAN, G., Leitman, J. And Surjadi, C. (1997) Understanding environmental problems in disadvantaged neighbourhoods: Broad spectrum surveys, participatory appraisal and contigent valuation. Urban Management Programme Working Paper 16. Stockholm Environment Institute.
• OBATOYINBO, O and Oyedotun, T. D. T. (2011) Microbial/Bacteriological analysis of water resources in Ikare and Arigidi Akoko of Ondo State, Nigeria. Proceedings of the 1st EIT International Conference on Water Resources Engineering, 18 -19 August, 2011. Pages 279 -284
• OTEZE, G. E. (1981) Water resources in Nigerian environment, vol 3. Springer, Berlin Heidelberg New York, pp 177 – 184.
• MABOGUNJE, A. L. (1981) Towards an urban policy in Nigeria. In: Urbanization Processes and Problems in Nigeria, P. O. Sada and J. S. Oguntoyinbo (eds), Ibadan University Press, 1981.
• NATIONAL POPULATION COMMISSIONS (2006) National Population and Housing Census. National Population Commissions.
• RIJSWLJK, K. (1981) Small community Water Supplies. IRC Technical Paper Series no. 18, The Netherlands.
• WORLD HEALTH ORGANIZATION- WHO (1984): Guidelines for Drinking Water Vol. 1 Recommendations, Geneva, Switzerland.
• WORLD HEALTH ORGANIZATION (1997): Guidelines for drinking-water quality, Second Edition, Volume 3, Surveillance and control of community supplies, Geneva, Switzerland.
• WORLD HEALTH ORGANIZATION- WHO (2011): Guidelines for Drinking-water Quality Fourth Edition, Malta.

WWW-YES-2012 proceedings (draft version)
166 / 175
17. Low flow regionalization by regression and hybrid methods
Monireh BIABANAKI*, Seyed Saeid ESLAMIAN** and Alireza TABATABAEI***
*PhD Student, Water Engineering Department, Isfahan University of Technology, Isfahan, 8415683111, Iran (E-mail: [email protected]) **Associate Professor, Water Engineering Department, Isfahan University of Technology, Isfahan, 8415683111, Iran ***Graduated student, Water Engineering Department, Isfahan University of Technology, Isfahan, 8415683111, Iran (E-mail: [email protected] )
Abstract Usually, long-term datasets of hydrometric and hydrochemical information are needed to begin an evaluation of dominant low flow producing processes, however, in many catchments, these data are not available. A major research challenge in ungauged basins is to quickly assess the dominant hydrological processes of watersheds. In this paper, for developing regional models, low flow analysis has been performed by 3 regression methods (multivariate regression, low flow index method, regionalization model of frequency formula parameters) and Hybrid low flow model in Karkheh basin (southwestern of Iran). Estimated error for four methods show, multivariate regression and low flow index methods have more accuracy in comparing with regionalization model of frequency formula parameters and Hybrid low flow model.
Keywords Hybrid model; Multivariate regression; Low flow index; Hydrologic drought; Karkheh basin
INTRODUCTION Droughts are sustained and regionally extensive occurrences of below-average natural water availability. They affect all components of the water cycle: from deficits in soil moisture through reduced groundwater recharge and groundwater levels to low streamflows or dried-up rivers. Droughts are reoccurring and worldwide phenomena, with spatial and temporal characteristics that vary significantly from one region to another and can have wide-ranging social, environmental and economic impacts. So, estimates of the magnitude and frequency of annual low flow at ungaged sites on unregulated streams are necessary. A 7-day annual low flow is the lowest flow recorded at a given site, over seven consecutive days in a single year. Annual values for the entire period of data are averaged to give the 7-day annual low flow for that site. However, this is only accurate for long term monitoring sites (primary sites) with continuous data record, so for those sites where there is only a limited number of spot gaugings available (tertiary sites) or there is not any gauging, statistical regressions are carried out to ascertain tertiary site flow characteristics from primary sites with a similar flow regime.

12th World Wide Workshop for Young Environmental Scientists WWW-YES-2012 Urban waters: resource or risks? Arcueil, France (21 – 25 May 2012)
167 / 175
These regression equations are then used to estimate 7-day annual low flows (Bayazit and Onoz, 2002; Riggs, 1985 and Zaidment et al., 2003). It is necessary to determine the best-fitted distribution to studied data. The primary aim of frequency analysis is to relate the magnitude of extreme events to their frequency of occurrence using the probability of distributions (Chow et al., 1988). In this study seven well-known probable distributing models including two-parameter standard normal, two-parameter log normal, three-parameter log normal, two-parameter gamma, Pearson type III, log Pearson type III and Gumbel with moment and maximum likelihood parameters which are tested to determine the best fitted distributions as well as low flow in different return periods. A lot of effort was made to establish low flow procedures and to evaluate methods to estimate low flow parameters at an ungauged site. The most popular tools in this type of regionalization are based on empirical methods and statistical approaches (Stall, 1962). Empirical methods, beside detailed knowledge of the basin physiography (e.g. morphology, geology, pedology, etc.) need additional information about the hydrological behaviour of the basin under investigation. The statistical approaches can be separated into correlation analysis and multiple regression analysis. The latter are some statistical methods to estimate flow parameters at an ungauged site and has to be considered the method most used in hydrology and water resources management. Regional extreme value analysis involves three major steps: 1) Grouping of sites into homogeneous regions. 2) Estimation of the regional extreme value distribution for each homogeneous region (after dividing the random variable under study by the scale parameter). The data at different stations of the same homogeneous region can be combined for this task. 3) Estimation of at-site scale parameter and corresponding extreme value distribution. A region can be considered homogeneous for low flow frequency analysis if sufficient evidence can be established that data at different sites in the region are drawn from the same distribution (except for the scale parameter). Hosking and Wallis (1993) developed several homogeneity tests for use in regional studies. The aim of these tests is to estimate the degree of heterogeneity in a group of sites and to assess whether they might reasonably be treated as a homogeneous region. One of the low flow models is multivariate regression. In this model, the significant relationships between T-year low flows and characteristics of basin would be defined (Thomas and Benson (1970), Riggs (1973) and Tasker (1989), Dingman and Lawlor, 1995, Tasker, 1989, Vogel and Kroll, 1992). Another approach for analyzing low flows is low flow index method. The objective of this method is obtaining the regional frequency curves. Grover et al. (2002), Kumar et al. (2003) in India and Lim et al. (2003) in Sarawak have used the adjusted index method for regional flow frequency. They found, it is a suitable method for estimation of flow in the regions with insufficient records. Regionalizing the frequency formula parameters, mean and standard deviation, based on physiographic characteristics of basin is another method for low flow analysis (Tasker et al., 1989) One of the methods for regional flood frequency that was developed for overcoming problems in arid regions is Hybrid model. This method has been originally used by Hjalmarsom (1992) for the arid regions in southwestern of United States (Hjalmarsom et al., 1992). Chavoshi and Eslamian (1998) have used this model for flood frequency analysis of Zayandehrud basin in Iran. They have found that for low and moderate return periods, Hybrid model has more accuracy in

WWW-YES-2012 proceedings (draft version)
168 / 175
comparing with regression method and for the high return periods, both methods show similar results (Chavoshi et al., 1989). This report presents the results of a study to characterize the magnitude and frequency of the 7-day annual low flow for selected streamflow-gaging stations and to develop regional regression equations to estimate the low-flow frequency at ungaged sites on in southwestern of Iran (Karkhek river basin). The low flow analysis is done using Hybrid method and the results were compared with: multi-variable regression, low flow index and regionalization of frequency formula parameters methods.
MATERIAL & METHODS Homogeneity test Andrews curves are examples of the space transformed visualization techniques for visualizing multivariate data, which represent k-dimensional data points by a profile line (or curve) in two- or three-dimensional space using orthogonal basis functions. Andrews curves are based on Fourier series where the coefficients are the observation's values. One advantage of the plot is based on the Parseval's identity (energy norm), which indicates that the information through transformation from the data space into the parameter space is preserved, and information that can be deduced in the hyperdimensional original space can be easily deduced in the two-dimensional parameter space. This duality empowers the discovery of correlated records, clusters and outliers based on the curve's intersections, gaps and isolations, respectively (Andrews, 1972 ; Nathan and McMahon 1990 ; Brian, 2000; Manciola and Casadei, 1991; Smakhtin, 2001). For plotting Andrew’s curves, the following relation has been used:
12 3 4 5
XF(t) = + X Sin(t) + X Cos(t) + X Sin(2 t) + X Cos(2 t) + ...2
(1)
where, X1, X2, ... are the characteristics of basins. Low flow models
- Regression method Regression analysis is used to detect a relation between the values of two or more variables of which at least one is subject to random variation and to test whether such a relation, either assumed or calculated, is statistically significant. It is a tool for detecting relations between hydrologic parameters in different places, between the parameters of a hydrologic model and so on (Thompson, 1999). In this study the following relationship has been used :
1 2b bT 1 2Q = f[X ,X ,...] (2)
where, QT is low flow with T-year return period, Xi is characteristics of basin and bi is the constant parameters that should be estimated from the multivariate regression technique. Because a linear regression model is not always appropriate for the data, appropriateness of the model should assess by defining residuals and examining residual plots. The difference between
the observed value of the dependent variable (Yi) and the predicted value ( iY ) is called the residual (e). Each data point has one residual :
ii ie = Y - Y (3)
Both the sum and the mean of the residuals are equal to zero. That is, Σe=0 and e=0. Variance inflation factors (VIF) are a measure of the multi-colinearity in a regression design matrix (i.e., the independent variables) (Thompson, 1999). Multi-colinearity results when the

12th World Wide Workshop for Young Environmental Scientists WWW-YES-2012 Urban waters: resource or risks? Arcueil, France (21 – 25 May 2012)
169 / 175
columns of X have significant interdependence (i.e., one or more columns of X is close to a linear combination of the other columns). Multi-colinearity can result in numerically unstable estimates of the regression coefficients (small changes in X can result in large changes to the estimated regression coefficients). VIFs are a scaled version of the multiple correlation coefficient between variable j and the rest of the independent variables :
j 2j
1VIF =1- R
(4)
where Rj is the multiple correlation coefficient. Variance inflation factors are often given as the reciprocal of the above formula. In this case, they are referred to as the tolerances.
- Low flow index method Another method for regional analysis is low flow index method, follows by these steps: 1) Homogeneity test for the stations would be done, 2) For each station, flow frequency curve
draw, 3) Low flows with 2 years return period should be computed, 4) The ratio of T
2
QQ for
different return periods would be drawn (regional frequency curve), 5) Regression model for the low flows with 2 years return period be obtain (with basin physiographic characteristics) and Q2 calculate, 6) QT (low flow for ungauged stations in different return periods) could be determined.
- Hybrid method In this method, at first the study area divide into some homogeneity classes and the annual discharge would be standardized for each class (Hjalmarsom et al., 1992). For the next step, the standardized discharge would be corrected and parameters of Hybrid equation have been calculated in composed of regression and regional analysis (using iteration method). For each iteration, the regional relations for each class would be defined. The model for this method is:
b c dTQ = aA B C ... (5)
where, QT is discharge with T-year return period, A, B and C are independent hydrologic parameters and a, b, c and d are the constant components of the regression model. Previous studies have shown that the basin area is the most significant independent variable (Hjalmarsom et al., 1992). So, the basin area enters as the first independent variable in relation (5) and other parameters (B, C,…) would be equivalent with one. The maximum number of classes (j) for the area would be defined as follows:
fNj100
≤ (6)
where, Nf is the summation of number of data. The weighted mean of area for each class would be defined according to the following equation:
g hijkj=1 k=1
i
logAA = antilog
gh
⎡ ⎤⎢ ⎥⎢ ⎥⎣ ⎦
∑ ∑ (7)
where, Ai is the weighted mean of area for class i (i=1, 2,….,f), Aijk is the basin area for station j in class i and for station–year k, j is the number of stations in class i (j=1, 2,…,g) and k is the years of station j in class i (k=1, 2,…,h).

WWW-YES-2012 proceedings (draft version)
170 / 175
The first step of iteration process for the area begins with standardization of annual discharges. Standardized discharge is :
ijkijk b
ijk
QS =
A (8)
where, Sijk is kth standardized discharge for station j in class i, Qijk is kth annual discharge for station j in class i, Aijk is weighted mean of kth area for station j in class i, (the initial value of b is one) . For obtaining the discharge values with a specific T-year return period, the computed value of STi in each class should be standardized by:
biTi TiQ = S (A ) (9)
where, QTi is T-year discharge in class i, STi is the standard discharge in class i for T-year and Ai is weighted mean of area according to relation (7). Also bT is:
f f
i Tii=1 i=1
i Tii=1
T 2f
if 2 i=1i
i=1
A QA Q -
fb =A
A -f
⎡ ⎤⎢ ⎥⎣ ⎦
⎡ ⎤⎢ ⎥⎣ ⎦
∑ ∑∑
∑∑
(10)
The next step of the process continues with replacing b in relation (8) and the process needs to be done until finding out the stable amount of b. The value of b will be fixed after one or two iterations otherwise, the linear relation does not exist between the parameter and discharge, so this parameter will be removed from the model. Another parameters such as mean elevation and basin slope could be used in the same manner (Hjalmarsom et al., 1992). Estimated error In this paper, the differences between observed and estimated values calculated by relative error (RE) and root mean square of error (RMSE) (Chalise et al., 2003, Vogel and Kroll, 1990; Wiltshire, 1985). RE in data is the discrepancy between an exact value and some approximation to it.
T T
T
Q - QR E = ×100
Q (11)
where, TQ is the estimated low flow value and QT is the observed data. The root-mean-square deviation (RMSD) or RMSE is a frequently used measure of the differences between values predicted by a model or an estimator and the values actually observed. RMSE is a good measure of accuracy. These individual differences are also called residuals, and the RMSE serves to aggregate them into a single measure of predictive power.
2T T(Q - Q )
RMSE =N
∑ (12)
where, N is the number of stations in each homogeneous area. The models with more accuracy display the less RE and RMSE. Study area

12th World Wide Workshop for Young Environmental Scientists WWW-YES-2012 Urban waters: resource or risks? Arcueil, France (21 – 25 May 2012)
171 / 175
Karkheh basin is located in southwestern of Iran and south of Zagros Mountains. The basin area is about 51268 square kilometer (66 percent valley and 34 percent flat). The main slope of the basin is directed from north to the south. Karkheh River has been formed by the linkage of the following rivers: Gamasiab, Ghareso, Seimare and Kashkan. Figure 1 shows the location of study area and hydrometric stations.
Fig. 1. Study area and hydrometric stations
RESULTS AND DISCUSSION Data Sources For this study, daily low flow data for 41 hydrometric stations have been used (Fig. 1). These data received from Iranian Water Resources Management Company. The run test and lag plot used for randomness analysis of the series. 7-day low flow values have been calculated by the time series. The gamma distribution has the best fitting on these data in study area. Using this distribution, low flows with different return periods have been determined. Homogenity test For investigation of homogenous area, Andrew’s curves have been used. The results show that 35 stations are in a homogenous region. Low flow models
- Multivariate regression of low flow method For this method, 7-day low flows with different return periods (5, 10, 20, 25, 50 and 100 years) used. The most important physiographic characteristics that are effective on the low flow estimates have been selected (by maximum correlation coefficient; minimum standard error and variance inflation factor lower than 5). Estimated regression models are as follows:
-4 -4-0.442br-5.01×10 hm+1.38×10 area+0.5355Q = 10 (13)
-4 -4-0.460br-5.44×10 hm+1.405×10 area+0.45210Q = 10 (14)
-4 -4-0.481br-5.94×10 hm+1.411×10 area+0.38620Q = 10 (15)
-425Q = 2.539×10 area+ 0.124 wsa-1.767 (16)
-450Q = 2.211×10 area+ 0.111wsa-1.589 (17)

WWW-YES-2012 proceedings (draft version)
172 / 175
-4100Q = 1.945×10 area+ 0.101wsa-1.438 (18)
- Low flow index method
In this model, T
2
should be calculated for different return periods (Fig. 2).
Fig. 2. Regional frequency curve
The final developed equation is:
-1 -4-0.409bf-3.65×10 be+1.38×10 A+0.6342Q = 10 (19)
- Regionalizing the frequency formula parameters method
For this method, the relation between average and standard deviation of 7-day low flows and characteristics of the basin has been studied:
-4 -41.435×10 A-2.678Logbf-2.8×10 be+0.587Mean = 10 (20) -3 -26.147×10 lms-0.263Logbe-0.203bf+4.618×10Std = 10 (21)
where, Mean is the average of 7-day low flows (m3/s), A is the area of basin (km2), bf is bifurcation factor, be is basin elevation (m), lms is length of main stream (km) and Std is the standard deviation of low flows series. Finally, the value of low flows with different return periods is calculated by cumulative distribution function of 2 parameters gamma distribution as follows (Smakhtin, 2001):
0( : , )
( )Gt e tF x dt
t
β β ααα ββ
−∞=
Γ∫ (22)
where,α and β are the scale and shape parameters respectively.
- Hybrid Method Classifying the area is the basis of Hybrid method. In this step, two factors (area and mean slope) selected and the study area divided into five different parts (by cluster method). The Hybrid model is:
b cTQ = aA W (23)
where, QT is the 7-day low flow with T-year return period (m3/s), A is the basin area (km2), W is the mean slope (m/m) and a, b and c are the components of regression. Each regression’s component is determined separately. At the first step for determining component b, basin area is selected as the first factor and the others (mean slope of basin, W) are considered stable.

12th World Wide Workshop for Young Environmental Scientists WWW-YES-2012 Urban waters: resource or risks? Arcueil, France (21 – 25 May 2012)
173 / 175
The values of low flow with different return periods (5, 10, 20, 25, 50 and 100 years) extracted for each region and the b values has been determined (for different return periods). The regional models for estimating low flows by this method are:
-0.1575Q = 4.868A (24)
-0.031 -0.80810Q = 14.102A (bs) (25)
-0.012 -0.27320Q = 2.348A (bs) (26)
-0.008 -0.19725Q = 1.770A (bs) (27)
-0.003 -0.06450Q = 1.027 A (bs) (28)
-0.001 -0.016100Q = 0.780A (bs) (29)
Estimated error Estimated error of four mentioned methods have been considered by RE and RMSE (Fig. 3).
Fig. 3: Relative error (percent) and Root of mean square error (RMSE) for four methods
For all of return periods, the multivariate regression and low flow index methods have more accuracy in comparison with regionalizing the frequency formula parameters and Hybrid methods. In the basis of RE, low flow index and in the basis of RMSE multivariate regression methods are the suitable models for low flow analysis. Also the results show multivariate regression and low flow index methods for the low return periods and regionalizing the frequency formula parameters and Hybrid models for the high return periods (higher than 50 years) do not have a significant difference. Multivariate regression and low flow index methods are more suitable than Hybrid model. Accuracy of Hybrid method (that usually used for flood regionalization) in comparison with other models has been indicated in Table 1.
Table 1: RE (percent) for three methods in comparing with Hybrid model Return Periods Low Flow Models 5 10 20 25 50 100
multivariate regression 84.44 87.65 75.13 103.60 99.68 98.91 low flow index 86.73 88.47 78.48 77.09 74.65 73.46
regionalizing the frequency formula parameters 128.30 171.43 134.78 114.53 104.99 90.33

WWW-YES-2012 proceedings (draft version)
174 / 175
CONCLUSIONS Reliable estimation of low stream flows is necessary to investigate drought characteristics of the basin and to describe the capability of a stream to supply requirements for river navigation, municipal, industrial, liquid waste disposal, irrigation and maintenance of suitable conditions for aquatic life. The important characteristics in the study of low streamflow are its magnitude, frequency and duration. This study shows the evaluation of three regional low flow methods and also Hybrid method (a model for flood regionalization), for overcoming the problem of short record length of low flow data in an arid region (southwestern of Iran). The results indicate, Hybrid method can be used for hydrologic drought prediction. Using L-moments and probability weighted moment methods, for fitting the distribution function of low flow data may improve the results in future researches.
REFERENCES • ANDREWS D. F. (1972). Plots of high-dimensional data. Biometrics, vol. 28, no. 1, pp. 125-136. • BAYAZIT M. and Onoz B. (2002). L-moments for estimating low flow quantities. Hydrological
Sciences Journal, vol. 74, 5rd edn, pp. 707-720. • BRIAN S. C. (2000). Evaluation of low flow frequency analysis methods. Journal of Hydrology,
vol. 39, 1rd edn, pp 19-47. • CHALIE S. R., Kansakar S. R., Rees G., Croker K. and Zaydman, M. (2003). Management of
water resources and low flow estimation for the Himalayan basins of Nepal. Journal of Hydrology, vol. 282, 1-4rd edn, pp. 25-35.
• CHAVOSHI S. and Eslamian, S. S. (1989). Estimation of flood discharge with different recurrence intervals in Zayandehrud basin by Hybrid method. Iranian Journal of Science and Technology of Agriculture and Natural Resources, vol. 3, 3rd edn, pp. 1-11.
• CHOW V. T., Maidment D. R. and Mays L. W. (1988). Applied hydrology. McGraw-Hill, New York, NY.
• DINGMAN S. L. and Lawlor S. C. (1995). Estimating low flow quantiles in New Hampshire and Vermont. Water Resources Bulletin, vol. 31, 2rd edn, pp. 243-256.
• GROVER P. L., Burn D. H. and Cunderlik J. M. (2002). A comparison of index flood estimation procedures for ungauged catchments. Canadian Journal of Civil Engineering, vol. 29, 5rd edn, pp. 734-741.
• HJALMARSOM H. W. and Thomas B. E. (1992). A new look at regional flood frequency relations for arid lands. ASCE, Journal of Hydraulic Engineering, vol. 118, 6rd edn, pp. 868-886. HOSKING J. R. M and Wallis J.R. (1993). Some statistics useful in regional frequency analysis. Water Resources Research, vol. 29, 2rd edn, pp. 271-281.
• KUMAR R., Chatterjee, C. and Kumar, S. (2003). Regional flood formulas using L-moments for small watersheds of stone subzone of India. Applied Engineering in Agriculture, vol. 19, 1rd edn, pp. 47-53.
• LIM Y., Howe, L. and Leonard M. (2003). Regional flood estimation for ungauged basins in Sarawak, Malaysia. Hydrological Sciences Journal, vol. 48, 1rd edn, pp. 79-94.
• MANCIOLA P. and Casadei S. (1991). Low flow Index and hydrogeological characteristics. National Conference on Hydraulic Engineering, pp. 930-936.
• NATHAN R. J. and McMahon T. A. (1990). Identification of homogeneous regions for the purpose of regionalization. Journal of Hydrology, vol. 121, pp. 217-238.
• RIGGS H. C. (1985). Streamflow characteristics. Elsevier, 249 pp. • SMAKHTIN V. U. (2001). Low flow hydrology: a review. Journal of Hydrology, vol. 240, pp.
147-186. • STALL J. B. (1962). Reservoir mass analysis by a low flow series. J. Sanit. Eng. Div. ASCE
88(SA5). • THOMPSON S. A. (1999). Hydrology for water management. A.A. Balkema Publication
Rotterdam, 362 pp.

12th World Wide Workshop for Young Environmental Scientists WWW-YES-2012 Urban waters: resource or risks? Arcueil, France (21 – 25 May 2012)
175 / 175
• TASKER G. D. (1982). Comparing methods of hydrology regionalization. Water Resources Bulletin, vol. 18, 6rd edn, pp. 965-970.
• TASKER G. D. (1989). Regionalization of low flow characteristics using logistic and GLS regression. Proc. of New Direction for Surface Water Modeling, IAHS Publication, vol. 181, pp. 323-331.
• VOGEL R. M. and Kroll C. N. (1992). Regional geohydrologic-geomorphic relationships for the estimation of low-flow statistics. Water Resources Research, vol. 38, 9rd edn, pp. 2451-2458.
• VOGEL R. M. and Kroll C. N. (1990). Generalized low-flow frequency relationships for ungauged sites in Massachusetts. Water Resources Bulletin, vol. 26, 2rd edn, pp. 241-253.
• WILTSHIRE S. E. (1985). Grouping basins for regional flood frequency analysis. Hydrological Sciences Journal, vol. 30, pp. 151-159.
• YU P. S., Yang T. C. and Liu C. W. (2002). A regional model of low flow for southern Taiwan. Hydrological Processes, vol. 16, 10rd edn, pp. 2017-2034.
• ZAIDMENT M. D., Keller V., Young A. R. and Cadman D. (2003). Flow-duration-frequency behaviour of British rivers based on annual minima data. Journal of Hydrology, vol. 277, 3-4rd edn, pp. 195-213
WWW-YES-2012-Proceedings-Draft-Text-2012-06-11.doc

© Copyright WWW-YES ™ University Paris-Est, LEESU http://leesu.univ-paris-est.fr/ http://leesu.univ-paris-est.fr/yes/ Association H2o Paris Conseil général du Val de Marne (CG94), festival Oh ! www.cg94.fr Communauté d’Agglomération du Val de Bièvre (CAVB) http://www.agglo-valdebievre.fr/ May 2012