Industrial development and industrial finance in Brazil and ...
36
ANNUAL FORUM 2005 Trade and Uneven Development: Opportunities and Challenges Development Policy Research Unit School of Economics, University of Cape Town Industrial development and industrial finance in Brazil and South Africa: A comparative assessment Jorge Maia, Lumkile Mondi, Simon Roberts
-
Upload
khangminh22 -
Category
Documents
-
view
2 -
download
0
Transcript of Industrial development and industrial finance in Brazil and ...

ANNUAL FORUM 2005
Trade and Uneven Development: Oppo rtunities and Challenges
Development Policy Research UnitSchool of Economics, University of Cape Town
Industrial development and industrial finance in Brazil and South Africa: A comparative assessment
Jorge Maia, Lumkile Mondi, Simon Roberts

1
Industrial development and industrial finance in Brazil and South Africa: A comparative assessment
Jorge Maia, Lumkile Mondi, Simon Roberts Industrial Development Corporation and the University of the Witwatersrand
Abstract
Brazil and South Africa share similar development challenges. Both have very unequal income distributions, both have a strong resource orientation underpinning their industrial development trajectory, and both have undergone a sharp liberalisation and opening up of their economies in the past decade. At the same time, both countries are attempting to chart a progressive domestic economic path, while being important role players in the global economy. The most obvious difference is that of apartheid in South Africa. However, military regimes in Brazil pursued heavily state-influenced industrial development strategies which had similar objectives of self sufficiency and import substitution as did those of the apartheid regime in South Africa. The Banco Nacional de Desenvolvimento Econômico e Social (BNDES) is the government industrial development bank in Brazil and has been heavily involved in the development of minerals and resource-based industry in Brazil. In recent years it has diversified its activities and increased lending to services and infrastructure-related industries. It has also been successful, as part of government’s industrial policy, in supporting dynamic industries such as aerospace. Its lending increased rapidly in the 1990s from US$3bn at the beginning of the decade to almost US$10bn by the end of the decade. In addition to its activities as a development bank, BNDES also plays an important role in formulating Brazilian development policies and identifying solutions to structural problems in the Brazilian economy. The paper assesses the Brazilian experience and contrasts it with that of South Africa, in light of the restructuring of the Brazilian and South African economies and the development challenges they face.

2
1. Introduction Recent work has emphasised the importance of development finance in successful late industrialisation (Amsden, 2001). Much of the analysis has focused on the reasons for the high growth rates of East Asian newly industrialising countries (NICs). However, Brazil and South Africa are both examples, and are countries where there are important similarities in the challenges faced. This paper assesses the comparative experience of Brazil and South Africa. Through an evaluation of experience in the past decade we draw insights for development finance as part of a wider and more coordinated framework of economic development to address the challenges of growth, employment creation and more equitable development. Brazil and South Africa have both undergone major liberalisation and industrial restructuring in the past decade or so. However, economic performance has been relatively poor. Instead, the performance is in line with recent studies of growth which highlights the diversity of paths followed by countries, and that stabilisation, liberalisation and privatisation are not sufficient (Rodrik, 2004). This is consistent with growth accounting exercises which find that technology typically accounts for a large share of growth (Fagerberg, 1994) and the development of ‘new growth theory’ which studies the interplay of institutional, technological and educational factors in growth. South Africa and Brazil are both also examples of late industrialisers. For these countries the challenges of ‘catch-up’ involve the adoption and adaptation of production techniques to develop production capabilities, in a liberalised environment. The challenges relate to the accumulation of human and physical capital coupled with the dynamic development of capabilities to reap the full benefits of such investments. The financing of such investments is a crucial part of the picture. Background on Brazil and South Africa There are important similarities between South Africa and Brazil. Both have very unequal income distributions, both have a strong minerals orientation underpinning their industrial development trajectory, and both have undergone a sharp liberalisation and opening up of their economies in the past decade (Table 1). At the same time, both countries are attempting to chart a progressive domestic economic path, while being important role players in the global economy. The opportunities for cooperation and shared learning have been recognised by the two countries’ leaders, and there are also ongoing links being developed through the India-Brazil-South Africa Dialogue Forum. The Brazilian economy is approximately four times the size of the South African economy in absolute terms, but income per capita levels are similar, as are the very high levels of inequality. Both countries have also performed more poorly than the average for all middle income countries. The performance of manufacturing in Brazil and South Africa has been particularly poor at an average growth of just 1.6 per cent per annum from 1990-2002, compared with an average annual growth of 5.3 per cent for middle income countries. Both Brazil and South Africa therefore appear to have missed the industrialisation boat in the past decade or more. However, Brazil has (despite major episodes of macroeconomic instability) recorded higher GDP and industry growth rates, and higher rates of

3
investment. And, within manufacturing it has more successfully moved to develop hi-tech exports.
Table 1. Economic performance and industrial development in Brazil and South Africa
South Africa Brazil All middle Income Gross National Income, US$bn, 2002 113.4 494.5 Gross National Income per capita, US$, 2002 2500 2830 1850 Gross National Income per capita, PPP, 2002 9810 7450 5800 Population, 2002 45 174 Human Development Index, 2001 0.684 0.777 Inequality (Gini coefficient) 59.3 59.1 GDP, 2002, US$bn 104.2 452.4 GDP growth 1990-2002 2.2 2.7 3.2 Industry growth 1990-2002 1.3 2.2 3.4 Manuf growth 1990-2002 1.6 1.6 5.3 Industry, % of GDP, 2002 32 21 34 Manuf, % of GDP, 2002 19 13 21 Growth of export volume, 1990-2001 5.0 5.4 Exports of goods & services, % of GDP, 2002 34 16 32 Hi-tech exports, % of manuf exports 2002 5 19 19 Tariffs on manuf, weighted mean, 2002 5.8 12.0 Gross capital formation, % of GDP 2002 16 20 23 Notes: Growth rates are annual average percentages
Ores and metals are defined to exclude manufactures, however it includes non-ferrous metals (but excludes basic iron & steel)
Source: World Bank World Development Report 2004, UN Human Development Report, 2003 The larger size of the Brazilian economy partly explains its lower ratio of exports to GDP. In addition, Brazil has maintained higher average tariff levels despite a far-reaching programme of trade liberalisation. Macroeconomic performance and policies in Brazil South Africa and Brazil share striking similarities in macroeconomic policies and performance, as well as important differences. Both countries have implemented inflation targeting, which has meant high real interest rates and a volatile exchange rate. In the case of Brazil the interest rates are extremely high, much higher than in South Africa.1 Both countries have also had tight fiscal policy to reduce government debt, at the same time as high interest rates have increased the interest burden of the debt. This has meant running primary fiscal surpluses, at the expense of public investment in infrastructure. Private investment has also been weak in each country, and is a major concern of the respective governments in developing strategies for sustained growth to impact on high levels of poverty, inequality and unemployment. In the case of Brazil, volatility in inflation and exchange rates has been much greater than South Africa, with an episode of hyper inflation in the early 1990s. In South Africa, unemployment is much higher than in Brazil, where ‘crisis’ levels of unemployment are identified although the unemployment rate was only 11.5 per cent in 2004. This is partly 1 Although South African interest rates have also been very high until recently.

4
a reflection of the greater opportunities for productive activity by small businesses and those in the informal sector, whereas the apartheid legacy in South Africa means many informal activities are of a survivalist nature, and employment opportunities are limited outside of the formal sector. We now describe the Brazilian experience in more detail. In 1994, after experiencing hyperinflation, the Brazilian government implemented a new stabilization policy, the Real Plan, which was aimed at curbing high inflation as well as providing credibility to monetary policy. By pegging its currency to the dollar, Brazil was sending a strong signal that its monetary policy would have to be in line with that of the United States. After struggling initially to defend the new exchange rate, Brazil shifted to an upwardly crawling peg in 1995. The Real Plan was successful in taming inflation as the inflation rate, which was over 2000 per cent in 1994, slowed to 3.2 per cent in 1998 (Table 2). The policy was, however, unsustainable as it led to an overvaluation of the currency in real terms and an increasingly large trade deficit. Cheap imports increased (providing downward pressure on local prices) and exports were also hurt. The deflationary impact of the policy on the real economy stifled growth, which slowed from 5.9 per cent in 1994 to 0.1 per cent in 1998.
Table 2. Brazil: Basic Economic Indicators, 1994 - 2004
1994 1995 1996 1997 1998 1999 2000 2001 2002 2003 2004 Growth in GDP, % 5.9 4.2 2.7 3.3 0.1 0.8 4.4 1.3 1.9 0.5 5.2GDP (constant BRL bn) 826 861 884 913 914 921 962 974 993 998 1050GDP per capita (constant BRL) 5104 5248 5614 5719 5650 5620 5778 5768 5798 5754 5983
GDP (current US$ bn) 546 704 775 808 785 524 599.8 509 461 505 599.7GDP per capita (Current US$) 3375 4290 4924 5060 4854 3197 3604 3013 2689 2913 3417
Exchange rate (BRL/US$), avge 0.65 0.92 1 1.08 1.16 1.82 1.83 2.35 2.92 3.08 2.93
Inflation rate, % 2076 66 16 6.9 3.2 4.9 7.1 6.8 8.4 14.8 6.6Interest rate (daily SELIC rate, end of period)
-- -- 23.94 40.73 28.96 19.03 16.19 19.05 23.03 16.91 17.75
SELIC/TBC target rate1 (end of period) -- -- 1.74 2.9 29 19 15.75 19 25 16.5 17.75
TJLP (long-term interest rate) 11.5 9.75
Unemployment rate (%)2 -- -- -- -- -- -- 13.3 11.2 11.7 12.3 11.5Trade balance (US$ bn) 10.5 -3.5 -5.6 -6.8 -6.6 -1.2 -0.8 2.7 13.1 24.8 33.7Current acc balance (US$ bn) -2 -18 -23 -30 -33 -25 -24 -23 -7 4 12
FDI (US$ bn)
1.97 4.2 9.9 18.9 28.9 28.6 32.8 22.5 16.6 10.1 18.2
Source: International Monetary Fund, World Economic Outlook Database, April 2005; IPEA Database and BNDES Economic Bulletin No. 137 (July 2004) Notes: 1 From July 1996 the Monetary Policy Committee (Copom) set the TBC rate (basic interest rate), which ended in March 1999. Since then, Copom has been targeting the SELIC rate (short-term interest rate) as the main monetary instrument. TJLP is the long-term interest rate set quarterly by the Central Bank, and is the rate on the funds from the Employee Assistance Fund (FAT), similar to UIF. 2 Monthly Employment Survey (IBGE), new methodology from 2000.

5
Brazil was hit hard by the financial crises that swept Asia in 1997 and Russia in 1998. Like Russia, Brazil had a public debt problem and continued speculation against the real had raised domestic interest rates, while the government’s deficit ballooned. The large increases in interest rates, however, were not enough to keep foreign currency in the country and to maintain its pegged exchange rate, Brazil had to use its foreign reserves to defend the real. A stabilisation fund set up by the IMF that effectively doubled Brazil’s reserves did not alleviate investors fears, forcing Brazil to devalue the real and then allow it to float in 1999. The move to inflation targeting following the float of the real in 1999 has entrenched the use of high interest rates to address inflation and tight fiscal policy. An ancillary objective of inflation targeting was to reduce exchange rate volatility, which has been high in Brazil since changing to a free float. Although targets have been missed on several occasions since 1999, the inflation-targeting framework has gained credibility. The enactment of the Fiscal Responsibility Law in May 2000, also strengthened fiscal discipline at all levels of government (OECD, 2005). At the same time, the depreciation of the real following its float in 1999 has contributed to strong export performance. This has had a positive impact on Brazil’s current account, which moved into surplus territory in 2003, for the first time since 1992, making Brazil less reliant on foreign financing. Despite Brazil’s large internal market, the external sector has become increasingly important for the economy, with the robust export sector being the main factor driving growth in recent years. Indeed, while inflation targeting has had positive results, the ensuing high interest rate has constrained domestic demand and investment, while demand has further been limited as a consequence of severe income inequality. In turn, high real interest rates and short-term capital inflows have meant a strengthening in the currency from its weakest level of R$4:US$1 in 2003 to under R$2.5:US$1 in 2005. This has hurt exporters who had increased sales in 2004 on the weaker currency, and with higher international commodity prices. The high growth of 5.2 per cent recorded in 2004 is thus not going to be sustained in 2005. While the macroeconomic instability in Brazil has thus been of a different magnitude than South Africa, an important aspect is BNDES’ response to this reality. The role played by development finance in this context has interesting lessons and implications for countries such as South Africa. 2. Patterns of industrial development 2.1 Industry structure and industry development in South Africa While overall manufacturing output has grown relatively strongly over the past decade, at an average annual growth rate of 5.6 per cent per annum (2.5 per cent per annum for value-added), the real issue is over the structure of this performance and the employment outcomes. The best performing sectors in terms of output have been either heavy, capital-intensive industries, or sectors which have benefited from the Motor Industry Development Programme (which has driven the growth in leather products, in addition to motor vehicles). Few sectors have recorded employment increases when 2004 is compared with the levels in 1994. Aside from the ‘other manufacturing’ category there have been employment

6
increases in professional equipment, machinery & equipment, plastic products, printing & publishing, motor vehicles, other chemicals, other transport and rubber products. Where there have been net employment losses these have been very large in many cases, such as basic iron & steel, non-ferrous metals and footwear. While the past decade has been one of major restructuring as the economy underwent far-reaching trade liberalisation, it was also characterised by tight macroeconomic policy, exchange rate volatility, and low investment (by both state and private enterprises). The sectors which have performed well under liberalisation are generally those with strong competitive strengths based on previous policies and state support. This ‘path dependency’ explains the strong performance of the capital-intensive heavy industries such as basic iron & steel, non-ferrous metals and basic chemicals. To an extent, industrial policy has continued to support these industries with, for example, DTI’s SIP incentives being allocated disproportionately to firms in these areas. In recent years, there has been a resumption of economic growth as macroeconomic policy has been relaxed somewhat. At the same time, the currency has strengthened significantly. The combination of local demand growth and currency strength has meant a bifurcation within manufacturing - with firms making highly traded products performing badly and firms supplying largely non-traded products to the local market performing extremely well (CSID, 2005). Firms in commodities such as basic metals have also performed well, as the high international prices outweigh the strength of the Rand. These patterns are clearly evident in the performance of manufacturing across the Metros. Ekurhuleni has outperformed all others in terms of manufacturing value-added and employment, followed by Tshwane and Johannesburg (CSID, 2005). By comparison, Cape Town, Nelson Mandela and eThekwini have all experienced manufacturing employment losses over the period. Manufacturing in Ekurhuleni, the largest industrial concentration in sub-Saharan Africa, is predominantly locally oriented, while manufacturing in coastal metros has a greater exposure to export markets and faces greater competition from imports. Sub-sectoral patterns2 Despite sharply increased real interest rates, capital-intensive sectors have continued to dominate. Macroeconomic stability, characterised by low inflation and a budget deficit around two per cent of GDP, has also been attained but has not brought increased investment outside of the very capital-intensive industries (with the exception of motor vehicles). More specifically, coke & refineries, basic chemicals, basic iron & steel and basic non-ferrous metals accounted for 37 per cent of manufacturing investment and 22 per cent of manufacturing value-added, but only 7 per cent of employment in 2004. While these sectors have continued to perform well in terms of output and investment, the employment outcomes in manufacturing as a whole are due to restructuring occurring across industry, under trade liberalisation. The tariff liberalisation did not meet expectations in terms of stimulating export led growth. At the outset it is evident that there is no straight-forward relationship across manufacturing sectors between better trade performance and output and employment growth in the period 1994 to 2004, 2 This draws from Roberts (2005).

7
although imports and exports increased in significance (Table 3). The most export-oriented sectors are basic iron & steel, professional equipment, machinery & equipment, and leather products, all of which export more than one-third of their output. In terms of the increase in export orientation the best performers are TV, radio & communications equipment, other transport, machinery & equipment and professional equipment. In terms of the net export ratio, which takes into account imports to indicate in which sectors the largest positive net trade balances are recorded, the best performers are basic iron & steel, tobacco products, furniture, coke & refineries. By comparison, the best performing sectors in terms of value-added growth from 1994 to 2004 are furniture, leather, other chemicals, basic non-ferrous metals and basic iron & steel. And, the greatest employment creation has occurred in other manufacturing, professional equipment, plastic products and machinery & equipment. The relationship of increased trade with manufacturing performance cannot therefore be divorced from understanding the basis for firms’ competitiveness. In broad terms, liberalisation and increased trade has reinforced the existing patterns of comparative advantage based on natural resources, cheap energy and previous government support (Machaka and Roberts, 2003).
Table 3. Summary statistics on manufacturing performance, 1994-2004
Sector Avge ann
VA gr, % (1994 –2004)
Avge ann empl gr, %
(1994-2004)
X:Q ratio 2004,
%
X:Q ratio 1994,
%
M:Cons, 2004, %
M:Cons, 1994
% semi &
unskilled labour, 2004
K:L Rth/ empl
Net export
ratio 2004
Nom tariff
1993, %
Nom tariff
1999, %
Nom tariff
2001, %
Food 0.8 -2.7 5.1 6.8 8.8 7.7 53 169 -0.28 13.4 14.5 8.2Beverages 0.5 -5.4 9.8 6.9 4.7 3.7 52 961 0.38 14.3 10 18.1Tobacco -0.9 -2.6 5.6 3.5 2.0 1.9 52 256 0.49 27.8 31.3 42Textiles 0.1 -2.5 9.7 13.7 21.1 24.3 79 91 -0.43 49.1 25.7 15.7Wearing apparel 0.5 -0.2 13.7 9.8 22.6 8.4 83 14 -0.29 81 50.2 20.2Leather & leather prods 7.3 -1.7 33.7 38.2 26.8 35.9 79 37 0.16 24 28.3 15.4Footwear -4.6 -7.0 2.5 4.6 44.1 18.0 91 19 -0.94 38 28.9 27.5Wood & wood prods 2.5 -1.2 14.0 14.1 9.3 10.9 59 67 0.23 10.9 3.3 3.3Paper & paper prods 2.0 -0.1 13.4 20.1 10.4 14.2 61 233 0.14 5.6 5.9 7.4Printing, publishing -0.9 0.9 2.3 2.3 16.8 18.0 24 64 -0.79 9.8 2.1 1.0Coke & refineries 5.3 -0.5 13.6 14.2 6.3 12.6 39 5372 0.40 9.3 7.2 3.7Basic chemicals 4.4 -1.3 32.1 40.7 31.8 45.3 53 1479 0.01 1.9 1.4 2.2Other chemicals 6.4 0.1 6.4 5.3 17.8 22.1 42 215 -0.52 17.1 6.9 2.9Rubber products 1.2 0.1 18.9 9.7 28.8 21.8 68 106 -0.27 20.0 12.4 16.2Plastic products 5.2 1.6 6.0 4.7 9.8 9.9 68 57 -0.26 17.9 12.4 9.5Glass & glass products 2.7 -5.1 9.5 9.8 19.0 18.2 73 421 -0.38 11.2 6.2 8.1Non-metallic minerals -0.4 -4.1 7.9 7.8 14.3 10.4 73 264 -0.32 10.9 6.8 5.2Basic iron & steel 5.7 -5.0 50.9 44.1 9.0 10.9 53 994 0.83 7.2 2.6 4.4Basic non-ferrous 5.7 -4.2 25.8 44.5 19.9 17.4 53 1891 0.17 7.6 1.8 0.8Metal products 1.2 -0.8 13.1 10.9 13.5 10.5 63 72 -0.02 14.0 7.2 7.3Machinery & equipmt 1.6 1.6 33.8 16.8 64.4 56.1 48 65 -0.56 6.3 1.1 2.1Electrical machinery 2.6 -5.9 8.1 7.8 25.5 31.9 59 91 -0.59 13.7 4.3 6.1TV, radio & comm. -1.2 -4.5 32.3 9.7 80.3 59.5 59 114 -0.79 14.3 3.6 2.9Professional equipmt -0.9 2.5 34.4 23.9 78.5 72.9 59 43 -0.75 14.2 0.4 0.5Motor vehicles, parts 5.0 0.3 25.5 12.5 37.2 30.2 50 289 -0.27 37.0 32.9 10.1Other transport -1.1 0.1 29.8 15.9 74.5 43.6 50 162 -0.75 11.6 1.9 0.1Furniture 8.9 -1.3 32.9 21.9 17.0 5.4 70 24 0.41 22.5 19.5 15.7Other manufacturing 0.3 4.1 27.1 26.2 27.4 23.0 48 70 -0.01 14.2 0.4 4.7Total manufacturing 2.5 -1.2 19.6 15.5 25.7 23.3 59 286 -0.18
Source: Quantec Notes: The net export ratio is calculated as (exports-imports)/(exports+imports)
8
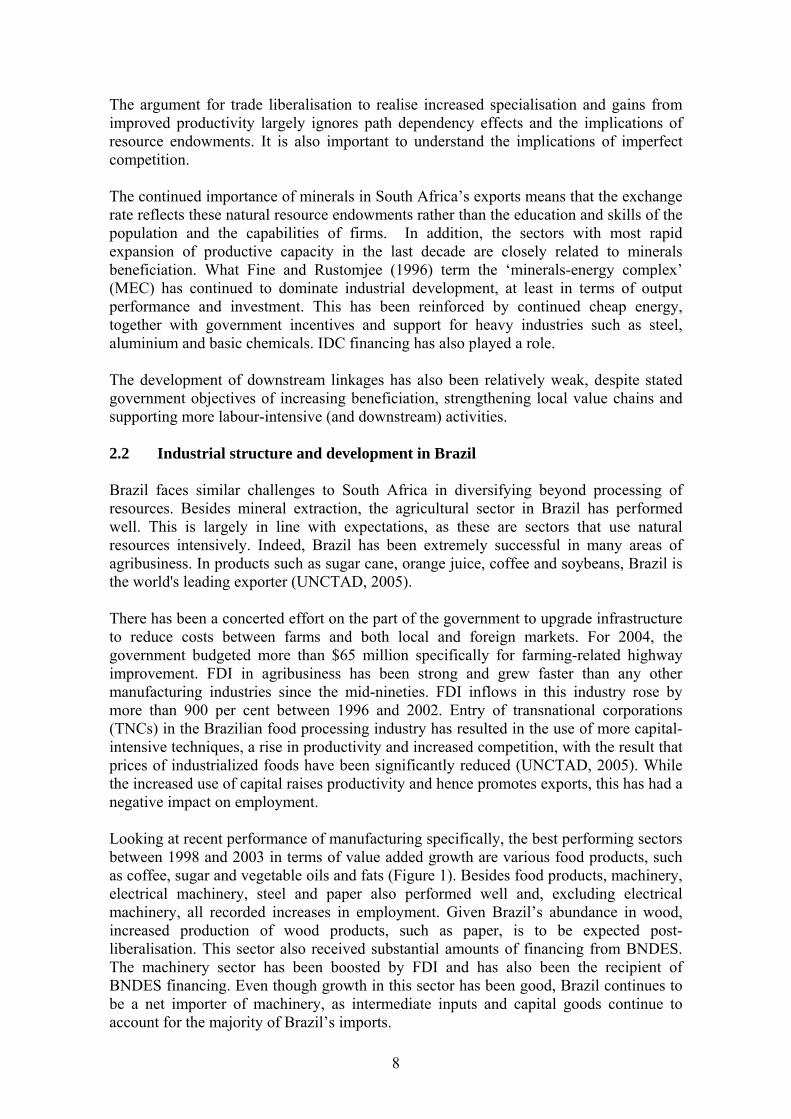
The argument for trade liberalisation to realise increased specialisation and gains from improved productivity largely ignores path dependency effects and the implications of resource endowments. It is also important to understand the implications of imperfect competition. The continued importance of minerals in South Africa’s exports means that the exchange rate reflects these natural resource endowments rather than the education and skills of the population and the capabilities of firms. In addition, the sectors with most rapid expansion of productive capacity in the last decade are closely related to minerals beneficiation. What Fine and Rustomjee (1996) term the ‘minerals-energy complex’ (MEC) has continued to dominate industrial development, at least in terms of output performance and investment. This has been reinforced by continued cheap energy, together with government incentives and support for heavy industries such as steel, aluminium and basic chemicals. IDC financing has also played a role. The development of downstream linkages has also been relatively weak, despite stated government objectives of increasing beneficiation, strengthening local value chains and supporting more labour-intensive (and downstream) activities. 2.2 Industrial structure and development in Brazil Brazil faces similar challenges to South Africa in diversifying beyond processing of resources. Besides mineral extraction, the agricultural sector in Brazil has performed well. This is largely in line with expectations, as these are sectors that use natural resources intensively. Indeed, Brazil has been extremely successful in many areas of agribusiness. In products such as sugar cane, orange juice, coffee and soybeans, Brazil is the world's leading exporter (UNCTAD, 2005). There has been a concerted effort on the part of the government to upgrade infrastructure to reduce costs between farms and both local and foreign markets. For 2004, the government budgeted more than $65 million specifically for farming-related highway improvement. FDI in agribusiness has been strong and grew faster than any other manufacturing industries since the mid-nineties. FDI inflows in this industry rose by more than 900 per cent between 1996 and 2002. Entry of transnational corporations (TNCs) in the Brazilian food processing industry has resulted in the use of more capital-intensive techniques, a rise in productivity and increased competition, with the result that prices of industrialized foods have been significantly reduced (UNCTAD, 2005). While the increased use of capital raises productivity and hence promotes exports, this has had a negative impact on employment. Looking at recent performance of manufacturing specifically, the best performing sectors between 1998 and 2003 in terms of value added growth are various food products, such as coffee, sugar and vegetable oils and fats (Figure 1). Besides food products, machinery, electrical machinery, steel and paper also performed well and, excluding electrical machinery, all recorded increases in employment. Given Brazil’s abundance in wood, increased production of wood products, such as paper, is to be expected post-liberalisation. This sector also received substantial amounts of financing from BNDES. The machinery sector has been boosted by FDI and has also been the recipient of BNDES financing. Even though growth in this sector has been good, Brazil continues to be a net importer of machinery, as intermediate inputs and capital goods continue to account for the majority of Brazil’s imports.

9
Figure 1. Performance of Brazilian manufacturing, 1998-2003
Source: IBGE Dept of National Accounts Relative to resource-intensive sectors, labour-intensive sectors have not done particularly well. Plastics, textiles and clothing all recorded contractions in value added. Despite this, plastics and clothing both recorded very high increases in employment, indicating a shift to more labour-intensive activities within these sectors. Employment for total industry has, however, been on an upward trend, driven mainly by increased employment in the manufacturing sector, although manufacturing employment levels have yet to reach the highs reached in the late eighties. While employment in the mineral extraction industry has also increased, given its capital-intensive nature, this has not contributed significantly to the increase in formal employment.
-7 -6 -5 -4 -3 -2 -1 0 1 2 3 4 5 6 7 8 9
Coffee
Sugar
Machinery
Vegetable oils and Fats
Other manufacturing
Electrical Machinery
Steel Industry
Paper and Printing
Other food and beverages
Furniture
Rubber
Petroleum and Petrochemicals
Milk and Dairy Products
Total manufacturing
Non-Ferrous Metals
Pharmaceuticals and Perfumery
Meat preparation
Other Metal Products
Other transport
Other Chemical Products
Basic Chemicals
Non-metallic Minerals
Clothing and Accessories
Vegetable products, incl tobacco
Leather and Leather Products
Textiles
Automobiles, trucks and buses
Plastics
Electronic equipment
Average annual growth, 1998-2003
EmploymentValue added

10
Although vehicle production recorded negative value added growth for 1998 to 2003, Brazil continues to be a net exporter of vehicles. The Brazilian automotive industry has benefited from an active industrial development policy and high rates of FDI, which enabled capacity to increase during the late nineties. However, local and regional demand for new vehicles declined in 1998 and resulted in an overcapacity for automakers. In response, carmakers increased exports, targeting the US and Europe and since 1999, this sector has recorded a surplus in trade (VMRC, 2005). The important role that FDI has had on Brazil’s industrial development needs to be highlighted3. Brazil's large internal market has always attracted substantial FDI. The import-substitution strategy employed, which kept the Brazilian market protected from foreign competition, together with its large domestic market, made Brazil one of the most attractive destinations for FDI until the early eighties. TNCs were instrumental in developing the Brazilian manufacturing sector and played an important role in capital and technology-intensive industries. During the 1970s, for example, TNCs accounted for almost half of the total capital in manufacturing. Although FDI shrunk during the 1980s, FDI began picking up, reaching a record level in 2000, and making it the second largest FDI recipient among developing countries, after China. The auto industry regime, in particular, has attracted large FDI, which has had a large impact on the industry. Although FDI has increased across all sectors, as a consequence of Brazil’s privatisation programme that opened up public utilities and financial services, FDI has shifted towards segments of the non-tradable sector, such as infrastructure and banking. TNCs currently account for almost half of national sales and total business assets. As FDI is concentrated in capital-intensive industries, TNCs are not significant employers. Even though foreign firms are more export-oriented than their local counterparts, foreign companies have typically invested in manufacturing in Brazil to serve the domestic market. FDI remains primarily market seeking, as the export propensity of TNCs in Brazil is much lower compared to other Latin American countries. TNCs’ preference for local sales is a reflection of the continued bias towards import substitution, while the shift towards services, most of which are non-tradable, has further shifted FDI towards market-seeking activities. FDI in manufacturing has been concentrated in chemicals, automotives and capital goods, and food and beverages industry. Recent FDI has continued this pattern, with capital-intensive industries accounting for 70 per cent of cumulative inflows into manufacturing during 1995-2002. Automotive FDI was responsible for a quarter of the total cumulative inflows. Among resource-based industries, food and beverages attracted the largest FDI. Trade liberalisation and trade performance After decades of following import substitution as the cornerstone of its development strategy, Brazil underwent a process of trade liberalisation that began in earnest only in 1990. The average import tariff came down from 32.2 per cent in 1990 to 10.8 per cent in the middle of 2004 (OECD, 2005). With the establishment of Mercosur, a common external tariff with seven bands, ranging from zero to 20 per cent, was put into effect in 3 This section draws on UNCTAD’s recent review of Brazil’s investment policy (2005).

11
1999, but capital goods, computer equipment and cars were excluded from the agreement. Trade liberalisation has brought increased trade. Brazil’s total trade flows in 2004 were equivalent to 26.6 per cent of GDP in 2004, while in 1990 this figure was only 11.1 per cent. Brazil’s export performance was, however, disappointing during the 1990s, mainly as a consequence of the sustained strength of the exchange rate during much of the decade. Accompanying the real depreciation of the exchange rate after the currency was allowed to float in the beginning of 1999, exports have trended upwards and by 2001 the trade account was in surplus and continued to improve. In 2003, exports grew by 21 per cent and imports grew only by 2 per cent (UNCTAD, 2005). A feature of Brazil’s export performance has been the heavy concentration on low value-added primary products. Commodities and raw materials accounted for approximately 30 per cent of Brazilian exports in 2003, up from about 25 per cent in 1999. Meanwhile, manufactured goods experienced a decline in their share of exports for the same period. Liberalisation has broadly tended to reinforce existing patterns of competitiveness in Brazil. If one distinguishes between labour-intensive, capital-intensive, technology-intensive and resource-intensive sectors, the sectors that use natural resources intensively show the greatest gains under liberalisation, while labour-intensive and capital-intensive sectors both experienced losses over the 1990s (Moreira, 2001). The sectors experiencing greatest levels of import penetration under liberalisation have been the technology-intensive and capital-intensive categories, which both recorded above-average import penetration coefficients, while import penetration did not have a significant impact on the labour and resource-intensive categories. The technology intensive sectors also recorded the highest export penetration coefficients, which points to a pattern of intra-industry specialisation. The ‘manufacture of other vehicles’ sector achieved the highest export coefficient for the industry as a whole, which is due to the success of Embraer airplanes. The domestic demand component (rather than trade flows) was, however, responsible for most of the changes over the 1990s. Despite relatively high unemployment, trade liberalisation has had limited impacts on labour market outcomes (Arbache and Carneiro, 2003). While trade has resulted in higher labour demand, the benefits of this have tended to be appropriated by the most skilled workers in the most trade-oriented sectors. The Brazilian government’s industrial policy has a renewed focus on export promotion, although, previous governments had made considerable efforts to promote exports. Even though Brazil followed import substitution during the 1970s and 1980s, promoting exports was nonetheless a key objective for the government. Export subsidies during the 1970s and 1980s averaged more than 50 per cent of the value of manufactured exports (Pinheiro and Moreira, 2000). The export and investment incentives were biased towards capital-intensive sectors and thus resulted in an increased share of capital-intensive goods in total exports. The trade performance of labour-intensive goods is mixed (Table 4). Footwear has consistently recorded a very high trade surplus, while other labour-intensive sectors, such as textiles and clothing, have not performed as well.

12
Table 4. Net Export Ratios for Selected Commodities
1994 2002 Meat and meat preparations 0.81 0.95Sugar,sugar preparations and honey 0.95 0.98Coffee,tea,cocoa,spices,manufactures thereof 0.97 0.85Tobacco and tobacco manufactures 0.96 0.94Oil seeds and oleaginous fruit 0.73 0.89Cork and wood 0.94 0.97Pulp and waste paper 0.82 0.73Metalliferous ores and metal scrap 0.69 0.84Coal,coke and briquettes -0.99 -0.99Petroleum,petroleum products and related materials -0.50 -0.29Gas,natural and manufactured -0.99 -0.94Organic chemicals -0.41 -0.31Inorganic chemicals -0.23 -0.28Medicinal and pharmaceutical products -0.68 -0.72Fertilizers,manufactured -0.88 -0.85Artif.resins,plastic mat.,cellulose esters/ethers 0.02 -0.36Leather,leather manuf.,n.e.s.and dressed furskisg 0.54 0.81Cork and wood manufactures (excl.furniture) 0.95 0.92Paper,paperboard,artic.of paper,paper-pulp/board 0.44 0.38Textile yarn,fabrics,made-upart.,related products 0.21 0.01Iron and steel 0.88 0.75Non-ferrous metals 0.48 0.35Power generating machinery and equipment -0.01 -0.25Machinery specialized for particular industries -0.31 -0.31Metalworking machinery -0.53 -0.51General industrial machinery & equipment,and parts -0.05 -0.27Office machines & automatic data processing equip. -0.73 -0.77Telecommunications & sound recording apparatus -0.60 -0.04Road vehicles (incl. air cushion vehicles -0.07 0.17Other transport equipment 0.15 0.23Articles of apparel and clothing accessories 0.56 0.12Footwear 0.91 0.93
Source: Calculated from World Trade Database (Analyzer) obtained from TIPS Classification: SITC (Rev 2) Notes: 1 The net export ratio is calculated as (exports-imports)/(exports + imports) Given Brazil’s success in agribusiness and its abundance in natural resources, food products, such as beef, sugar and coffee continue to perform well. Brazil has successfully managed to diversify its exports of traded food products, relying less on coffee exports and more on other goods, like soybeans and beef. Certain manufactured goods that are resource-intensive have also performed well. These include leather and leather products, cork and wood manufactures, and paper and paper products. Various chemicals and related products, such as pharmaceuticals, have not done as well, with the net deficits for most of these goods increasing between 1994 and 2002. The export performance of iron and steel and other non-ferrous metals, which have always been important export products for Brazil, has remained strong. Although these

13
metals continue to record high net export ratios, it is worth noting that in terms of contributing towards total exports, their shares have declined, which can also be attributed to the overall increased diversification of Brazil’s exports. Iron and steel accounted for over 9 per cent of total exports in 1994, but in 2002 its contribution declined to around 6 per cent. The average import tariff for steel remains fairly high at 12.8 per cent in mid-2004 compared to an average of 10.8 per cent for all goods (OECD, 2005). Of the machinery and transport sectors, Brazil continues to be a net importer of machinery and equipment. Motor vehicles and other transport equipment, such as aircraft, recorded a net surplus. After liberalisation, the trade balance for the car industry worsened, as imported cars became less expensive. In response, the government reintroduced high protection for cars and since 1999 Brazil has been a net exporter of road vehicles. Brazil continues to maintain high tariffs on transport equipment, which in mid 2004 were around 17 per cent. Martins and Price (2001) show how different market imperfections interact with trade to shape Brazil’s international specialization, as measured by revealed comparative advantages (RCAs)4. In Brazil, the top RCAs remained concentrated in primary goods including the iron and steel sector. There was a significant shift in RCA from primary goods in the early 1970s to consumption goods and basic manufacturing to the mid 1980s. Following liberalisation, this movement has been reversed, and by the end of the 1990s, primary goods had again become Brazil’s top comparative advantage. Thus, Brazil’s previous pattern of trade specialisation re-appeared again, even though trade barriers for agricultural goods are high. The overall value of the RCAs fell though, which indicates a greater diversification of trade. For the manufacturing sector, the highest RCA is concentrated in goods characterized by low R&D. Hence, Brazil has remained specialised in relatively homogeneous products, where competition is mainly by price. Exports of homogenous goods and low-processed products, however, suffer from high tariff and non-tariff barriers imposed by its trading partners. Despite the decline in the RCAs for manufactured goods since the 1980s, as already highlighted, Brazil does export sophisticated industrial products. Automobiles and aircrafts are becoming increasingly important contributors towards Brazil’s exports. Road vehicles (including parts) had the highest share in total exports in 2002, just over 7 per cent, while aircrafts are becoming more important for exports, increasing its share of less than one per cent of total exports in 1994 to over four per cent in 2002.
4 Revealed comparative advantage indicator: RCA = (Xi/Sum(Xi)-Mi/Sum(Mi))

14
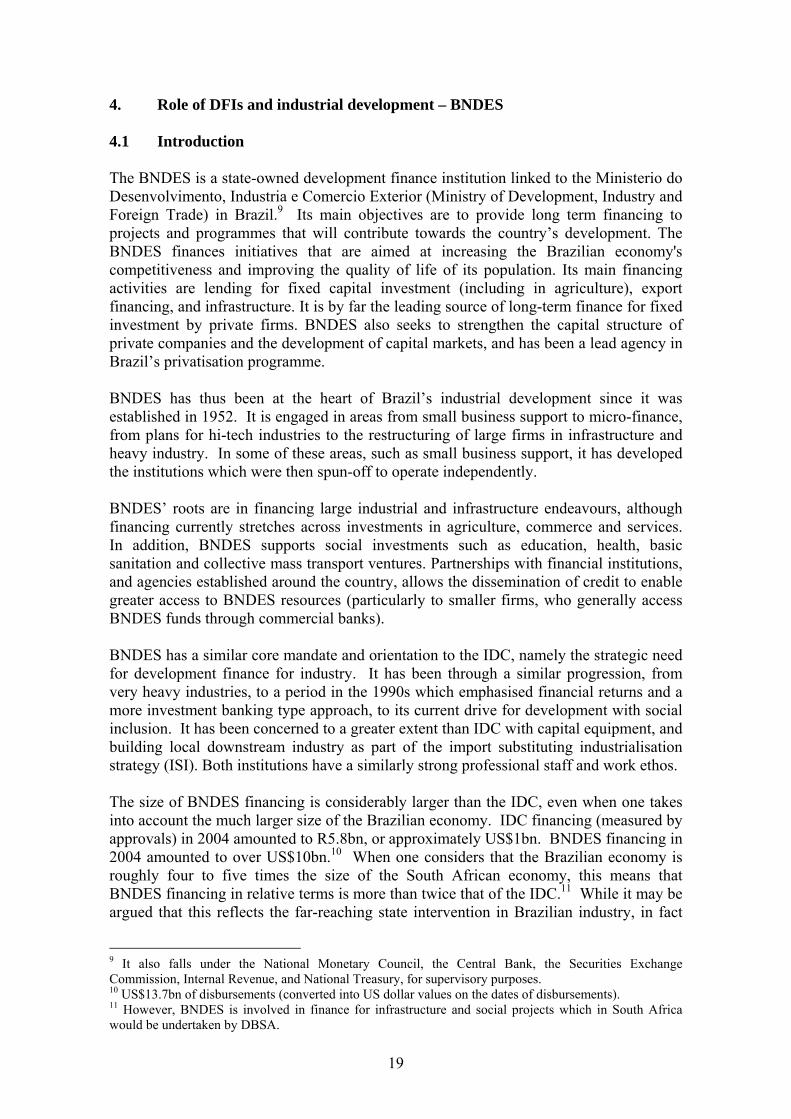
3. Role of DFIs and industrial development – the IDC The IDC’s mandate places it firmly in the realm of public development finance institutions with an emphasis on financing sound business opportunities that would otherwise not attract private sector finance.5 The IDC has historically played a major role in the structure of industrial development in South Africa, having arguably had the single biggest impact of any individual public agency or institution. In the past the provision of substantial support, subsidies and incentives, and IDC finance (much in the form of equity) was instrumental in developing the capital-intensive mineral-based industries around which much of manufacturing is focused. These previous development decisions continue to shape current patterns of industrial development, as the competitive advantages have become entrenched. And, the market power of large resource-based industries prevents the benefits flowing through to more labour-intensive downstream manufacturing. The record over the past decade6 The IDC’s 10-year review (1994-2003) and the 2004 Annual Report summarise the main highlights from the first decade of democracy. Over ten years to June 2004 the IDC approved more than 3500 applications amounting to over R51bn, and created over 176 000 new job opportunities in South Africa. IDC approvals were typically equivalent to between four and six per cent of private sector fixed investment (Figure 2).7 In the mid 1990s, the IDC’s financing continued the orientation to large resource-based projects, such as Saldanha Steel, Hulett Aluminium, Hillside Aluminium, which underpinned very large financing in several years.
Figure 2. IDC approvals, as % of private sector fixed investment
0
2
4
6
8
10
12
14
16
18
20
90 91 92 93 94 95 96 97 98 99 00 01 02 03 04 05
Financial year
Perc
ent
``
In addition, there was a range of targeted schemes such as the World Player Scheme, aimed at investments required to make textiles firms more competitive. And, the IDC played a major role in research and economic policy in the mid 1990s, with sector 5 The Industrial Development Amendment Act, no.40, 2001 6 The IDC’s record is examined in more detail in the accompanying paper by Mondi and Roberts (2005). 7 It must be remembered that not all finance approved is ultimately extended.

15
studies, projections and modelling, and the administration of several DTI incentive programmes. In the late 1990s there was a move to emphasise more aggressive pursuit of expansion in terms of financing and number of deals, along with a move to commercial interest rates. Financing broadly increased from the second half of the 1990s up to 2001. The IDC also increased the scope of its lending (both geographically, and in sector terms). The increase in scope, first to Southern African Development Community (SADC) countries and later across the African continent, was followed by financing of major projects, mainly in minerals, basic metals, agriculture and hotels.8 The largest proportions of finance have been extended to activities in the provinces with the larger industrial economies, namely Gauteng, Western Cape and KwaZulu-Natal. In addition, the IDC’s financing activities across the continent have increased rapidly and, by the end of June 2004, the IDC had 89 financing deals under consideration or in implementation in other African countries. The importance of major projects in mining and basic metals reflects the IDC’s historical strengths. The very large mining and metals projects are of benefit to South Africa provided that South African capital equipment and construction firms are involved, and source products from South Africa. In addition, the IDC provides finance to African buyers of South African capital goods and related services. In recent years, financing has fallen back (and especially in terms of number). The decline in the number of deals indicates that the average size is increasing once more, despite the overall emphasis on increasing lending to small and medium enterprises. Partly in response, the IDC has adopted a new mission, ‘Leadership in Development’ and has sought to focus once again on its developmental role. This implies more actively supporting investments which would not attract commercial bank financing and which have a strong developmental impact on the economy. Rather than quantity, the emphasis is also on the nature and quality of the IDC’s financing impact. The IDC has also established the Agency Development and Support Department in 2002 to support regional development agencies in South Africa. It is important, however, to also trace the evolution over the period to address important changes in orientation. We first review the overall patterns of lending by sector, before assessing the lending patterns in terms of small and medium enterprises and empowerment. Sectoral breakdown of IDC financing By value, IDC financing has been heavily oriented towards machinery and metals production, followed by mining & quarrying and chemicals & other mineral products (Figure 3). Together these sectors represented 56 per cent of all financing by value. This represents a continuation of IDC’s historical focus which effectively contributed to building the basic metals and basic chemicals industries in South Africa. By number, the pattern is quite different, with the largest sector being agriculture, hunting, forestry & fishing.
8 78 per cent of financing in 2004 was in South Africa, 2 per cent was for exports outside Africa, and 20 per cent was for financing projects in other African countries than South Africa. It was estimated that 3 740 employment opportunities were created in other African countries as a result.

16
0 5 10 15 20 25 30 35
Electricity, gas & water supply
Construction
Hotels & restaurants etc
Transport, storage & communication
Community, social & personal services
Financial, insurance and business services
Electrical & electronic products
Mining & quarrying
Wood, paper & printing
Wholesale & retail trade
Other manufacturing
Clothing, textiles & leather products
Food, beverages & tobacco
Machinery & metals products
Chemicals & other mineral products
Agriculture, hunting, forestry & fishing
% of total
0 5 10 15 20 25 30 35 40
% of total value% of total number
Figure 3. IDC’s financing by sector, July 1995 - June 2005
The main sectors receiving finance, such as basic iron & steel and basic non-ferrous metals, are highly capital intensive. And, IDC finance was crucial in the development of the metals and chemicals sectors in the 1990s. Investment in IDC projects in non-ferrous metals and basic iron & steel alone accounted for approximately 25 per cent of total manufacturing investment from 1992 to 1997. The IDC provided R14.1bn out of the R25.4bn of investment in these projects, implying a very significant level of support to these sectors. It is important to be clear that concern with capital intensity is not equivalent to a position against mega-projects. Rather, we need to critically assess the role that such projects can and do play in the economy in order to understand their contribution. This depends partly on the behaviour of the firms in question. The contribution of a steel plant or aluminium smelter will depend on the linkages it develops with downstream industries, the prices charged, quality of products, scheduling of deliveries, and collaboration in product development. The IDC itself is in a crucial role, as a major financer, in influencing the possible local economic linkages. Such a role requires a proactive approach to following up on downstream linkages and opportunities. In recent years there has not been such an unbalanced pattern in favour of capital-intensive industry. But the machinery & metals, mining & quarrying and chemicals sectors continued to account for the largest share of total IDC finance. There have, however, also been important changes. The past five years or so has been characterised in crude terms by:
• An increasing share of finance for services, increasing to 32 per cent by number and 27 per cent by value in 2004
• Increasing emphasis on BEE, with R2.6bn approved for 13 black-empowered companies in 2004
• Increased activity in other African countries

17
This, together with development patterns in the economy as a whole, has had a mixed effect on the IDC’s impact on the structure of the economy, although it has continued to favour relatively large-scale projects, and has not until very recently prioritised job creation and more labour-intensive activities. Small and medium enterprises The majority of the IDC’s financing (by number of approvals) goes to SMEs (defined as having total assets of less than R30mn, turnover of less than R50mn and fewer than 100 employees). The share of SME deals in the total has declined in recent year, but still stood at close to80 per cent in 2005. The largest number of SME approvals in the past decade has been for agriculture, followed by chemicals, while the largest share by value is chemicals. Machinery & metals and mining & quarrying, so important in the overall value of IDC approvals, are much less significant in the value of IDC approvals to SMEs. By value SMEs are clearly less significant. The number of jobs in SMEs stands at 6.65 jobs per million Rands of IDC finance (or R150 000 of finance per job). Black economic empowerment Black economic empowerment has been a major priority of the IDC since the late 1990s. The significance of BEE deals sharply increased from 1999, due to IDC financing of both BEE acquisitions and expansionary investments. In the two years from June 2002 to June 2004, 41 per cent of the gross value of approvals was for BEE deals, with just over half of this being for acquisitions. By value, a small number of BEE deals in mining and transport, storage & communication dominate the overall picture. This is to be expected as the IDC has played a role in the changes in ownership of major corporation at the ‘commanding heights’ of the economy. In terms of number, the patterns are similar to those of overall financing. However, expansionary BEE financing has been the most job creating, far ahead of non-BEE financing and BEE acquisitions financing. Expansionary BEE deals are also predominantly to SMEs and 41 per cent have been located in designated areas. Jobs and exports Jobs and exports have been criteria by which the IDC has assessed the impact of financing for some years. Both measures of the impact of IDC financing increased to a peak in 2001 (Figure 4). From this high point, jobs have fallen by less than exports, with close the 20 000 being created in 2004. Together with the higher levels of economic growth, and stronger domestic demand, significantly higher levels of job creation should be possible through effectively targeted IDC finance. The fall in exports generated partly reflects the lower amount of business being done by the IDC’s International Financing Unit.

18
Figure 4. Jobs and exports from IDC financing, July 1995 - June 2004 Pricing and prioritisation The IDC had a set of low interest schemes for targeted sectors and criteria until the mid 1990s, with varying outcomes. After an internal process of research and debate a new set of schemes has been launched once more in November 2005. The low interest schemes reflect that fact that there may be positive externality effects and linkages with other agents from investments, and that there are priority development criteria. A social cost benefit approach would involve a lower shadow price of labour than the going wage rate in conditions of mass unemployment, which could be significant in projects intensive in low-skilled labour. These considerations suggest that lower interest rates make economic sense, especially if they make the difference between a project being commercially viable or not. However, if lower interest rates are offered to attract business away from commercial banks this will not increase overall investment or have the developmental effect desired. In addition, the IDC due to its knowledge base, its insider status on industrial policy issues, and its power to aid in negotiations with other stakeholders including infrastructure providers and branches of government may have a different view of risk from a private financial institution and may change the risk by its very participation. These considerations carve out important areas of the economy for the expansion of IDC financing. The suppliers of capital equipment to the Transnet and Eskom capital expenditure programmes is only one of the more obvious examples.
0
2
4
6
8
10
12
1995 1996 1997 1998 1999 2000 2001 2002 2003 2004
Year
R'billion
0
5000
10000
15000
20000
25000
30000Exports generated
Number of jobs
Job number
19
4. Role of DFIs and industrial development – BNDES 4.1 Introduction The BNDES is a state-owned development finance institution linked to the Ministerio do Desenvolvimento, Industria e Comercio Exterior (Ministry of Development, Industry and Foreign Trade) in Brazil.9 Its main objectives are to provide long term financing to projects and programmes that will contribute towards the country’s development. The BNDES finances initiatives that are aimed at increasing the Brazilian economy's competitiveness and improving the quality of life of its population. Its main financing activities are lending for fixed capital investment (including in agriculture), export financing, and infrastructure. It is by far the leading source of long-term finance for fixed investment by private firms. BNDES also seeks to strengthen the capital structure of private companies and the development of capital markets, and has been a lead agency in Brazil’s privatisation programme. BNDES has thus been at the heart of Brazil’s industrial development since it was established in 1952. It is engaged in areas from small business support to micro-finance, from plans for hi-tech industries to the restructuring of large firms in infrastructure and heavy industry. In some of these areas, such as small business support, it has developed the institutions which were then spun-off to operate independently. BNDES’ roots are in financing large industrial and infrastructure endeavours, although financing currently stretches across investments in agriculture, commerce and services. In addition, BNDES supports social investments such as education, health, basic sanitation and collective mass transport ventures. Partnerships with financial institutions, and agencies established around the country, allows the dissemination of credit to enable greater access to BNDES resources (particularly to smaller firms, who generally access BNDES funds through commercial banks). BNDES has a similar core mandate and orientation to the IDC, namely the strategic need for development finance for industry. It has been through a similar progression, from very heavy industries, to a period in the 1990s which emphasised financial returns and a more investment banking type approach, to its current drive for development with social inclusion. It has been concerned to a greater extent than IDC with capital equipment, and building local downstream industry as part of the import substituting industrialisation strategy (ISI). Both institutions have a similarly strong professional staff and work ethos. The size of BNDES financing is considerably larger than the IDC, even when one takes into account the much larger size of the Brazilian economy. IDC financing (measured by approvals) in 2004 amounted to R5.8bn, or approximately US$1bn. BNDES financing in 2004 amounted to over US$10bn.10 When one considers that the Brazilian economy is roughly four to five times the size of the South African economy, this means that BNDES financing in relative terms is more than twice that of the IDC.11 While it may be argued that this reflects the far-reaching state intervention in Brazilian industry, in fact
9 It also falls under the National Monetary Council, the Central Bank, the Securities Exchange Commission, Internal Revenue, and National Treasury, for supervisory purposes. 10 US$13.7bn of disbursements (converted into US dollar values on the dates of disbursements). 11 However, BNDES is involved in finance for infrastructure and social projects which in South Africa would be undertaken by DBSA.

20
BNDES lending increased sharply in the mid 1990s at the time of liberalisation and a reduced role for the state. This is partly because the extremely high real interest rates mean the commercial banks invest a large proportion of their funds in government debt due to the good returns, and are very reluctant to lend to local industry. As a result, firms either invest out of retained earnings or borrow from the BNDES. This places BNDES in a particularly important position with regard to financing fixed capital investments by private firms. BNDES is able to fulfil this role partly due to its access to funds at the much lower long-term ‘TJLP’ interest rate, which is the rate payable on funds BNDES obtains from the employee assistance programme (FAT), in essence the compulsory unemployment insurance fund. The TJLP long-term interest rate is set by the Central Bank on a quarterly basis. For example, while the short-term rate (paid on government debt) in 2004 was 17.75 per cent compared with inflation of 6.6 per cent, the TJLP was set at 9.75 per cent. Although positive in real terms, the TJLP is clearly much lower than the short-term interest rate. BNDES lends at various margins, around one to four percentage points, above TJLP. After a brief review of the history of BNDES and of its main operations, we evaluate patterns of development finance for industry and the BNDES performance and development impact, including a review of the ways in which BNDES approaches the prioritisation of sectors and projects, the allocation of capital and the assessment and pricing of risk. Historical background The importance of BNDES is such that no major undertaking in the second half of the 20th century involving private Brazilian capital occurred without BNDES support. Its role was also crucial in strategic terms, as it was responsible for shaping much of industrial policy. In financing infrastructure, BNDES linked this to the development of the local capital goods sector (Amsden, 2001). The main stages of its 53 years in operations are: 1950s: Economic infrastructure (energy and transport); Steel-making 1960s: Basic industry; Consumption goods; Small and medium-sized companies;
Technological development 1970s: Basic input industries; Capital goods; Import substitution 1980s: Energy; Agriculture; Social; Competitive integration 1990s: Private sector infrastructure; Exports; Privatisation; Social and urban development 2000: Modernisation of industry; Regional development; Infrastructure; Export; Social
and urban development; Small and medium companies; Privatisation and capital markets.
(BNDES, 2002) A profound change in the Bank’s dynamic took place in the 1990s, when the bank departed from its traditional activities of support for new productive investments to be involved in managing the transfer of public productive assets to the private sector under the National Privatization Programme. The decade of the 1990s also saw a progressive move towards an increased investment banking orientation.

21
‘Development with social inclusion’ With new political guidance following the election of President Luiz Inácio ‘Lula’ da Silva, BNDES enthusiastically handled the task of realising government’s specified priority of ‘development with social inclusion’. This started with a broad internal restructuring of BNDES to redefine the priorities and adjust its operational mechanisms. This thrust is in line with the unemployment crisis in Brazil, which partly under-pinned the election of President Lula da Silva, and is broadly realised through the support of projects with significant employment creation. The new objective is to completely restore the development bank as an operational arm of industrial policy. The practical manner through which the BNDES brought the new strategies to the operational level involved linking ‘risk’ with ‘priority’. This does not represent any relaxation with regards to the risk evaluation of the projects that are submitted to the Bank, but the contribution of a project to ‘development with social inclusion’ is assessed alongside risk and lower interest rates are charged for financing projects in priority areas. 4.2 Activities BNDES has 1904 employees, most located in its headquarters in Rio de Janeiro. It also has offices in Sao Paulo, Brasilia and Recife. Its primary function of financing long-term investments works through BNDESPAR, for equity participation, and FINAME, for investment in fixed capital and financing of exports. The BNDES has four major interconnected lines of activity:
• Infrastructure: Investment in initiatives that improve access to electric power, telecommunications, transport, and other services that aid in developing communities. Aims to increase infrastructure in anticipation of demand in order to avoid restrictions to economic growth.
• Modernization and Expansion of Productive Structure: Investment in initiatives
that seek to increase the industry and service sectors’ production capacities making them more efficient and innovative, and to increase their ability to export. Priority is given to domestic companies, mainly small and medium sized enterprises12 as well as to initiatives aimed at reducing regional differences.
• Promotion of exports: The Bank's activities in this area seek to add value to
Brazilian sales in foreign markets, through investments in technology, financial assistance and technical support for exports. Particular focus on exports to South American countries and Mercosur. The development of an exporting sector for products with greater technological intensity will also serve the internal market, through improving capabilities and thus competitiveness vis-à-vis imports.
12 Micro Enterprise: operational gross revenues of up to R$1,200 thousand. Small enterprise: annual operational gross revenues of more than R$1,200 thousand and less than or equal to R$10,500 thousand. Medium Enterprise: annual operational gross revenues of more than R$10,500 thousand and less than or equal to R$ 60 million. Large Enterprise: annual operational gross revenues of more than R$60 million.

22
• Social Inclusion: Investments in social/cultural projects, and conditions/incentives to intensify social benefits are included in criteria for concessions on BNDES credit.
BNDES also participates as part of Brazil’s negotiating team in international forums, seeking to adapt its policies to the rules agreed upon by Brazil, and to contribute to the negotiations. Similarly BNDES’s policy of support for foreign trade, in line with the priorities of the federal government, has developed a different treatment for operations with Mercosur countries and other South American neighbours. Financing Clients can access finance through the following major programmes:
• Financing for the acquisition of new machinery and equipment for domestic manufacturing.
• Financing for projects of implementation, expansion or modernization of
endeavours; preservation, conservation and recovery of the environment; energy conservation; computerization; technological capacitating and/or improvement of quality and productivity.
• Finance for exports
Forms of support by the BNDES can be direct or indirect. Direct support is provided by BNDES itself whereas indirect funding is provided via an accredited financial institution. Loans below R$10mn are dealt with through commercial banks and other accredited institutions. The proportion of the value of disbursements extended through indirect operations was 55 per cent in 2004. Over the past decade it has fluctuated between a low of 38 per cent and a high of 61 per cent.13 Financing is in general very closely linked to fixed investment in capital stock. BNDES does not provide finance for vehicles, maintenance, real estate, gambling activities, banking/financial activities. BNDES has a major programme of support for the modernisation of machinery and equipment in agriculture, termed the ‘Moderfrota Programme’. It has recently created a similar programme, ‘Modermaq’, aimed at the capital equipment industry. In addition to the broad financing thrusts, there is a multitude of specific programmes. These usually have a limited budget or period of validity, and include:
• Cultural (movie theatres, books) • Social: Tax modernization programs, funds for higher learning, micro credit • Infrastructure: Electricity and Energy initiatives • Regional programs
13 BNDES also manages a ‘Guarantee Fund for Promotion of Competitiveness’ created using resources from the National Treasury to guarantee part of the credit risk incurred by financial institutions in operations with micro and small enterprises, and exporting medium enterprises that make use of the BNDES financing lines, specifically Automatic BNDES, FINAME, FINEM and Export Support.

23
• Profarma, aimed at the pharmaceutical sector • Finance for the film industry
4.3 BNDES and development finance for industry BNDES financing has grown strongly in the past decade. Total disbursements increased from R$9.7bn (US$9.7bn) in 1996 to R$40.1bn (US$13.7bn) in 2004 (Figure 5). There was particularly strong growth in 2004 in disbursements to agriculture, to infrastructure and to SMMEs.
Figure 5. Disbursements by BNDES 1996-2004
Note: The sharp increase in 2002 followed the major depreciation of the currency in preceding years. Breakdown of financing The largest share of BNDES financing is accounted for by industry, at 50 per cent in 2005, followed by infrastructure and agribusiness (Figure 6). It should be noted that the infrastructure financing is mainly of economic infrastructure such as electricity, and is also closely related to the development of the Brazilian capital equipment and construction sectors. For example, export finance is provided by BNDES for Brazilian value added in major infrastructure projects in other Latin American projects.
0
5
10
15
20
25
30
35
40
45
1996 1997 1998 1999 2000 2001 2002 2003 2004
R$
billi
ons

24
Figure 6. BNDES financing, breakdown by major sector
0%
10%
20%
30%
40%
50%
60%
70%
80%
90%
100%
2000 2001 2002 2003 2004 2005(Apr)
Health & educationInfrastructureAgribusinessRetail & servicesIndustry
BNDES financing to manufacturing increased sharply during the mid 1990s, but has fluctuated between five and six billion dollars since 1997. When lending patterns to manufacturing are disaggregated further, the very high level of support to the other transport equipment (which includes aerospace) is striking (Table 5). This is followed by finance extended to the automotive industry. Other large sectors are those one would expect given Brazil’s resource and agriculture base, being food and beverages, paper products and basic metals. There are also significant levels of financing to machinery and chemical products. In addition to prioritisation of sectors linked with industrial policy objectives, several actions seeking to restructure strategic sectors have been undertaken. A major challenge in this regard has been to combine actions seeking the corporate restructuring of companies, on one side, with the planning of expansion of productive capacity, on the other. This challenge has been particularly important in the petrochemical and steel sectors which have undergone radical restructuring under liberalisation and yet are still strategic sectors of industry in which BNDES is intimately involved. BNDES support to motor vehicles and transport equipment has included a major project for the development of a new line of 3.0 litre engines and the extension of electronic injection technology.14 A separate project was the development of a ‘flex’ engine that can use petrol and ethanol (derived from sugar cane in Brazil) mixed in any proportion. In addition, there is the recent ‘Modercarga’ programme to provide fixed interest rate finance for the acquisition of trucks, tractors, tow trucks, chassis and coachworks and wagons. 14 The financing is of R$31.4 million, for a total investment of R$67.3 million.

25
Table 5. BNDES financing by manufacturing sector, US$mn
1999 2000 2001 2002 2003 2004 Food & beverage products 819 658 874 771 661 650 Tobacco products 2 0.2 2 1 10 6 Textiles 203 212 125 114 127 65 Clothes and accessories 62 15 23 7 19 10 Leather & leather products 25 61 51 92 129 57 Wooden Products 57 109 90 75 85 43 Paper and paper Products 163 172 499 428 141 360 Publishing, printing etc. 19 15 18 13 10 10 Refining Oil, Coke and Alcohol
66 12 31 56 16 25
Chemical products 210 213 286 329 386 188 Rubber and Plastic Goods 107 103 97 74 83 95 Non metallic minerals prods 56 96 74 77 102 94 Basic Metals 512 932 738 322 324 254 Metal Products 114 60 74 107 87 86 Machines and Equipment 270 349 313 328 173 301 Clerical & computer equipmt 3 0.5 15 2 0 4 Elec mach & household equipmt
74 139 75 56 63 69
Communication equipmt 89 91 106 110 21 45 Medical and prof equipmt 1 3 7 5 3 3 Vehicles 693 838 550 463 890 903 Other Transport Equipment 903 1 447 1 424 2 346 1 948 2 065 Recycling 1 2 2 3 5 2 Furniture and other inds 23 29 30 32 48 46 Total manufacturing 4 472 5 557 5 503 5 811 5 331 5 384
A major and long-term concern of BNDES has been with the development of the local capital equipment industry. They do this through conditions on the financing of fixed investment which requires the purchase of locally made capital equipment. The machinery manufacturer must be a BNDES list, which means that it has qualified as having a minimum of 60 per cent local content in the manufacture of the capital equipment. Note, however, that the contribution of the company being financed can be used for the purchase of imported capital equipment. BNDES itself can finance up to 80 per cent of the purchase value of new capital equipment, while in equity BNDES can take up to 30 per cent. It is important for these conditions that Brazil already has a strong capital equipment industry (or at least with the potential for local manufacture) due to previous support. There is roughly balanced trade in capital equipment with both exports and imports of machinery and electrical machinery totalling approximately US$12bn. BNDES also actively participated in the expansion, modernization and consolidation process of the domestic mining and steel sectors, supporting investments in the main mining and metallurgy companies, in addition to the stimulation of geological research. An example is in the partnership with CVRD and a "risk contract" for geological research in the region of Carajás, with the value of R$410 million. BNDES holds, along with CVRD, 50 per cent of the mining rights at several locations in the region of Carajás, mainly in the exploration of copper ore, whose results should offer Brazil self-sufficiency in the production of this metal. In 2003, the finance approved by BNDES for projects in the electricity sector reached the value of R$5.5 billion. BNDES participated in the implementation of government

26
emergency programs aimed at recovering the economic-financial balance of companies in the sector (CVA and MEA). In a more structured direction, it created the Support Program for Capitalization of Electricity Energy Distributing Companies, encouraging the improvement of the bank debt profile of these companies along with the adoption of appropriate corporate governance practices. It also participated in the discussions involving the Incentives Program for Alternative Sources of Financing. Financial disbursements by firm size BNDES actively aims to support investment in productive capacity and the upgrading of capabilities by smaller firms. In January to April 2005 82 per cent of disbursements by firm size went to micro and small enterprises.15 By value, small & micro enterprises accounted for 25 per cent of BNDES financing (Figure 7). Schemes for the improvement of capital stock in sectors such as agriculture and trucking can be easily drawn on by small entities.
Figure 7. Disbursements by firm size (by value), January-April 2005
Micro & small25%
Medium8%
Large67%
Notes: Excludes secondary transactions 4.4 BNDES performance and development impact BNDES has maintained strong financial performance. It realised a net profit of R$1.5 billion in 2004, an increase of 44 per cent over 2003 (Figure 8), and the highest nominal net income in BNDES history. BNDES complies with the operating and prudential limits established by the Central Bank of Brazil.
15 Micro enterprise: operational gross revenues of up to R$1.2mn. Small enterprise: revenues of R$1.2mn to R$10.5mn. Medium enterprise: revenues of R$10.5mn to R$60mn. Large enterprise: revenues of more than R$60mn.

27
Figure8. Evolution of BNDES Net Income
The major source of BNDES funds is the workers assistance fund (FAT) (Figure 9). By law at least 40 per cent of the annual revenues from the workers assistance fund (FAT) are transferred to BNDES, with an interest rate on these funds set at the long term rate of interest set by the Central Bank (the TJLP rate).
Figure 9. BNDES Funding - Capital Structure, 2004
FAT (workers assistance fund)53%
Foreign funding22%
Net equity7%
Others18%
Financing patterns and BNDES development impact BNDES schemes for specific sectors are closely linked to industrial policy, and its financing in sectors such as capital equipment and aerospace is a major source of support. There is a wide range of programmes for different types of finance and targeted at different sectors, including finance for expansions, R&D, exports, to improve product quality, for brand development, and for internationalisation of company (that is, anything to improve value-added).
0
200
400
600
800
1000
1200
1400
1600
1997 1998 1999 2000 2001 2002 2003 2004
R$
milli
ons

28
Sector programmes include those for the sectors targeted in the government’s industrial policy. The Prosoft and Profarma programmes for the software and pharmaceuticals sectors enable BNDES to provide direct finance to smaller firms, taking more risk, and with better financing conditions. In addition, in these industries BNDES can provide finance for acquisitions and also for used equipment. The Modermaq programme for machinery & equipment involves a fixed interest rate for five years (currently set at 13.95 per cent) as small firms have been reluctant to borrow given uncertainties about interest rates. Under the scheme the risk of interest rate increases is born by BNDES and National Treasury - if the TJLP rate increases above the fixed rate, then BNDES will take the risk for two years, and the National Treasury will take the risk of the remaining period of up to three years. A recent programme (Progeren) has been created for the financing of the working capital requirements of small and medium companies for employment and wealth creation, with a guarantee based on a letter of credit and existing assets of the company. Interest rates (based on TJLP) are adjusted based on the employment and other targets agreed upon. Lower rates are charged to companies with higher employment creation targets. If the company does not meet the targets the firm is charged a higher rate in line with short-term rates (a much higher interest rate). The scheme is managed via commercial banks, and focused on selected sectors and regions. It uses outside auditors both in the initial evaluation and after finance has been drawn down to assess compliance with the conditions. When a special programme is designed it means that:
• a lower interest rate can be charged • larger participation of BNDES is allowed • longer-term loans can be granted • less collateral is required
The over-riding priorities of BNDES cut across the various financing activities: to small and medium firms; in labour-intensive activities; in targeted regions; promoting higher value added products; and for exports. There is also a strong emphasis on credit assessment and repayment. Capital equipment As noted above, an enduring and very important thrust is that generally BNDES provides financing to companies for fixed investment which involves the purchase of locally made machinery and equipment. The machinery manufacturer must be on the FINAME list, which means that it has qualified as having a minimum of 60 per cent local content in the manufacture of the capital equipment. Note, however, that the contribution of the company being financed can be used for the purchase of imported capital equipment. BNDES itself can finance up to 80 per cent of the purchase value of new capital equipment, while in equity BNDES can take up to 30 per cent. In addition, in the last quarter of 2003, BNDES participated in a work group at an inter-ministry level that sought to implement actions to promote the sector’s growth and competitiveness, a segment that is of priority in government’s industrial policy. Several major projects were supported.

29
Infrastructure The financing of economic infrastructure was one of the primary focuses of the BNDES, and is now once more returning to prominence. The main focus is on areas such as electricity generation, transmission and distribution, oil & gas (and supply ships for this), telecommunications, transport (both rail, and road, mainly toll roads), ports, air, and ship-building. In line with BNDES’ core orientation, financing is generally for fixed investment in the form of the purchase of machinery & equipment which meets local content requirements, so stimulating the local capital equipment industry. Both public and private firms can be financed, and foreign companies are also eligible. The greatest demand, due to current capacity constraints, is in power generation and telecommunications, with two major ship-building initiatives also underway. Financing is mainly in the form of loans, with development objectives realised through differential interest rates charged with, for example, lower interest rates charged for projects in the poorer North East region following the guidelines developed by the Planning Department of BNDES. The development role is thus to break the financing constraint for major projects, to lower the hurdle rate by providing cheaper finance to priority areas, and to anticipate economic infrastructure demands so that capacity constraints do not become an obstacle to growth. Infrastructure may be financed in other countries in South America to the extent that this results in the export of Brazilian equipment and services (and this would be financed as exports). Social inclusion The ‘social’ mandate was added to BNDES (and to its name) in 1982, when tax revenue was transferred to BNDES for this purpose, however the social programmes were stopped again in 1990. In 1996 the programmes were reinstated by the new President Cardoso and in 1997 a Social Fund was created, together with an additional mandate to work to support the modernisation of the public sector. BNDES Social Fund receives an annual amount which is set at the lower of 10 per cent of the profits of BNDES or 0.5 per cent of the shareholder’s equity. This amounts to a grant transfer of approximately R$70mn per year. The Social Inclusion Area has a staff of 90-100 people, in five departments dealing with areas of: development of poorer regions; municipalities; microfinance; social assistance – education, health; ‘solidarity’ - co-operatives, and development alternatives (such as, fair trade). BNDES is currently engaged in a process of classifying and clustering municipalities based on income and GGP in order to increase participation in the very poorest areas – which are concentrated in the north and north east. The aim is also to be more proactive, with outreach to develop projects. The lower interest rates by region also encourage the location of potentially mobile activities such as clothing. In addition, a new programme, PROINCO, provides finance for both infrastructure and productive investments, half from the social fund and half in the form of loan financing. This finance is aimed at projects in poorer regions to be undertaken by both regional governments and cooperatives.

30
Setting and monitoring priorities Both strategy development and management of the financing evaluation process fall within the Planning Area of BNDES. This also includes research. We focus on the cycle in which planning and strategy occurs, the two stage process in evaluating applications and the work of the ‘Priority Committee’, and the development of guidelines for pricing A four stage process is followed for the development of BNDES’ three year plans:
(i) Reflection (i.e. research and linking with government priorities) (ii) Studies into strategies (and so decisions on priorities and targets) (iii)Actions: Linking strategies with resources, and selecting/identifying existing
BNDES programmes and projects, and whether there is a need to initiate new projects
(iv) Review The Planning Department is thus responsible for the process from research through the operational policies required, to transform plans and priorities into BNDES actions. The research draws on researchers within the Planning Department, sector research specialists and external research capacity. For example, a recent study has been undertaken looking at the implications of China’s growth and trade for Brazil and BNDES. There has also recently been research on exposure to large firms in Brazil to establish credit limits for large groups and to set a methodology for units to do assessments of investment plans of large corporate groups. While the priorities of BNDES have broadly remained the same, the rolling-out of priorities through BNDES involves participation and consultations across the institution, particularly under stage 3, of identifying actions. Specifically, proposals are developed with the technical group of the Superintendents for Industry, Infrastructure etc. and then options are presented in the Planning Committee (Comite de Planejamento) to the five BNDES Directors, where hard decisions are taken on priorities and resources. The operationalisation of the plans by the Planning Department then includes the development of models used in determining the interest differential based on development criteria (separate from the risk assessment). The current emphasis has moved to a more proactive role for BNDES, to regain focus following the 1990s when the emphasis was on a supporting role for the ‘competitive integration’ of the Brazilian economy under liberalisation. The new approach recognises the importance of market failures and includes the anticipation of developments and obtaining better information in ‘real time’ on BNDES financing patterns. For example, the BNDES is focusing on new investments in steel given the impending shortages and growth of global demand. An initial screening process by the Priority Committee ensures that all applications are assessed in terms of the key focus areas and objectives of BNDES, as well as risk, following which a fuller evaluation takes place. Measuring job creation Currently BNDES is developing a job creation model to assess the direct and indirect jobs resulting from disbursements to enable it to measure its success against its new

31
mission. Different methodologies have been used across BNDES for indirect employment creation, and these are being reconciled. It appears as if the method to be adopted will be based on input:output coefficients. Risk assessment and pricing The operating policies represent a reduced rate dependent on meeting the specified development criteria. The calculation yields a spread of between 1 and 4.5 per cent above TJLP, such that fully meeting the development criteria effectively means a reduction in the interest rate by 3.5 percentage points. In addition, there are discretionary elements in determining the application of operating policies to determine the priority component of the interest spread. The final interest rate for the client is composed of a spread as follows (above base, such as TJLP):
Basic interest rate (including admin costs) + credit risk + operating policies (i.e. smaller additional for priorities for region, for sector, for size etc.)
One and a half years ago the credit risk was made a flat rate, thereby cross-subsidising from good to bad risks. The rating could thus only be used to establish conditions such as collateral, and to determine whether to approve the finance.16 4.5 BNDES’ strategic role in the economy The BNDES plays a central role in the Brazilian economy, particularly in relation to industrial development, due to its sheer size and expertise. The nature of this role has changed as the policy stance of government has changed, however, it has retained a high level of professionalism in the execution of its mandate as set by government. In addition, it plays an important role across the continent, through its links with infrastructure development and major capital investment projects, its influence on the policy debates, and in supporting the development of major Brazilian firms. In some respects the President of BNDES ranks alongside cabinet ministers in economic matters. The BNDES President is present when there are inter-ministerial meetings covering economic policy, similar to the cabinet lekgotla and the meetings of the economic cluster in South Africa. Specifically in relation to industrial policy, BNDES is acknowledged by different branches of government to be pivotal. BNDES initiates industrial policy debates, as it did with its study three years ago (even before the new government took office). The new industrial policy was then effectively written by the BNDES head of the Industry Area on secondment to MDIC (the Department of Industry Development and Commerce). More broadly, BNDES has participated actively in the development of industrial policy, involving both strategies for key sectors, such as capital goods, software, integrated circuits and pharmaceuticals, as well as cross-cutting activities that cover all sectors of the economy. The main focus is on the strengthening of productive chains, increasing exports and added value, and social inclusion. For example, BNDES participated in the development of an industrial policy for the capital goods sector, being 16 However, there is a move to reintroduce differential rates for credit risk.

32
a major driver of competitiveness and modernization in the entire productive chains of industry. The BNDES participates in the key forums with industry associations, government and other stakeholders. And, it draws on its information base through its long-term relationships with firms and industries. A recent example is the implementation of an export tax on leather in response to the large exports of leather and imports of finished leather products. Finally, it is a key implementer of industrial policy – through designing specific programmes for targeted sectors, and especially in its emphasis on the local capital equipment industry. Some of the programmes have been very successful, such as support for aerospace and the linking of export finance to development of the local capital equipment industry. Other programmes have been less successful. The key lesson is the importance of linking the programmes with clearly identified opportunities for growth, and with appropriate industrial policies. The programmes must then be critically monitored and evaluated in order to make amendments as required, or end programmes that are not meeting their objectives. 5. Conclusions: Development finance and industrial development The value of the comparison with BNDES is in the similar challenges faced by it and the IDC, as well as the similar development challenges faced by Brazil and South Africa. It is therefore not necessarily about learning from ‘best practice’ but about the differing approaches taken, their impact, and relative merits. It must also be remembered that there are important differences, in particular the even higher real interest rates in Brazil than in South Africa. We summarise the main points as follows: • Despite higher real interest rates in Brazil, it has maintained better rates of investment
than South Africa. This is partly due to the larger role BNDES plays in the economy, and its aggressive expansion. This is significant in the context of South Africa’s urgent need to reach a sustained higher growth path with significant employment generation. The role for BNDES vis-à-vis private financial institutions is more clearly defined than for the IDC, as the high short-term interest rates effectively mean there is little incentive for commercial banks to lend for fixed capital at the lower long-term rates. BNDES, however, has proactively responded to the needs arising from the macroeconomic environment, without compromising its rigorous risk assessment and financial stability. In the case of South Africa, arguably the financial sector has not been responsive in financing fixed investment, particularly by medium and small enterprises.
• BNDES has continued to develop specific programmes linked with the needs of the economy (as did IDC in the past). Such programmes are linked to lower interest rates and more favourable terms (such as longer-term repayment periods and lower collateral). There has been an ongoing willingness to adapt and change such programmes (such as the fixed interest loan introduced for small and medium business, and the low interest loan for working capital where linked to employment

33
creation targets). But, the BNDES has also allowed a proliferation of programmes such that business is confused as to what is on offer.
• Financing at BNDES is closely linked to their strategic view of the economy and
identified industrial development goals, including growth of the capital equipment, agro-processing and aerospace sectors. This is achieved through effective early screening of finance applications, without compromising the professionalism of the organisation. The consistent application of criteria to the prioritisation of projects characterises the organisation through a well defined planning cycle to achieve consistency and transparency in outcomes relative to goals. This is part of the ongoing functions of planning and determination of priorities.
• A very strong emphasis in financing fixed investment is the building of linkages with
industrial development through local content requirements by BNDES. In Brazil this is a key tool to develop the capital equipment sector, viewed as crucial to a strong industrial base. In South Africa, the capital equipment industry is weaker as a result of more than a decade of poor performance and weak demand (itself a result of low fixed investment, including by SOEs). Careful attention needs to be paid to specifying expectations linked to the provision of finance. This is only possible with a clear plan of the relationship between the strategies of the development finance institution and the industrial policy goals of government.
• Pricing for development criteria is achieved by BNDES through the application of a
few straightforward criteria in a transparent process (including allowance for some discretion). This is separate from pricing of risk, and is available to all on the BNDES website. The lower interest rate allows for the socio-economic returns of finance in targeted regions, sectors and to SMEs. By lowering the cost of finance, an increased number of projects become viable and investment is stimulated in these areas. IDC is currently revising its development pricing model.
• Export finance plays a large, and growing, role for the BNDES. But, IDC’s export
finance has declined over recent years. Here again it is important to note that BNDES links financing of major infrastructure projects on the South American continent with the development of Brazilian industry. While IDC plays a similar role, there is a need to re-evaluate the system of export financing in South Africa, across different agencies including ECIC of the DTI, and with particular reference to financing for exports to other African countries. The evaluation could assess whether the financing is competitive with those of other international agencies, and the extent to which linkages with South African production and employment need to be built in. In addition, the various guarantee arrangements operating in Brazil (for example, with Angola) and across projects in other South American countries provide useful examples of areas which could be further developed in South Africa.
• A similar reappraisal process is underway in BNDES and IDC as to their roles as
development agencies. In BNDES this has led to the creation of the Area for Social Inclusion, which is collecting detailed information on the development status of different municipalities, and designing appropriate interventions within the overall scope of BNDES’ operations.

34
• BNDES central role in industrial policy is widely recognised, is built on through its participation in developing policies and programmes, and is matched by BNDES representation at the highest levels of government. The IDC does not have such a prominent role, and its information base and analytical capacities do not appear to be drawn on to their fullest extent. At the highest level, development finance institutions are potentially a strong technocratic voice representing the needs of the real economy, and articulating practical solutions to meet government’s objectives. In essence, they represent autonomous professional institutions which can play a key role in a ‘developmental state’.
References
Acompanhamento da Politica Industrial, Technologica e de Comerico Exterior.
Amman, E. (2000) Economic Liberalization and Industrial Performance in Brazil, Oxford, Oxford University Press Amsden, A. (2001) The Rise of the Rest: Challenges to the West from Late-Industrialising Economies, Oxford, OUP Chang, H.J. (1996) The Political Economy of Industrial Development, Macmillan BNDES. (June 2005) <www.bndes.br.gov>. BNDES (2002) BNDES - Fifty Years of development Chabane, N. (2004) ‘Private Procurement and the Development of Black SMMEs in Ekurhuleni’, paper presented at Symposium on Sustainable Manufacturing, Ekurhuleni, July 2004. Fagerberg, J. (1994) ‘Technology and growth rates’, Journal of Economic Literature, XXXII, 1147-1175. Fine, B. and Z. Rustomjee (1996) The Political Economy of South Africa- from Minerals-Energy Complex to Industrialisation London: Hurst
Hay, D. (1988). ‘Industrial Policy in Brazil: A Framework’, Discussion Paper №551. IPEA, Rio de Janeiro.
IDC (2001a) Core Economic Indicators. Sandton: IDC. IDC (2001b) Annual Report. Sandton: IDC. IDC (2000) Annual Report. Sandton: IDC. IDC (1997) Annual Report. Sandton: IDC.

35
Machaka, J. and S. Roberts (2003) ‘The DTI’s new ‘Integrated Manufacturing Strategy’? Comparative industrial performance, linkages and technology’, South African Journal of Economics, 70(4), 679-704. OECD (2005) ‘Brazil OECD Country Survey’ <http://interdev.oecd/publications/e-book/>.
OECD ‘Annual Report on Competition Policy Developments in Brazil-2000-2003’ OECD Publications. <http://interdev.oecd/publications/e-book/>.
Resende, A. V. (2000) A Politica Industrial do Plano Real, Centro de Desenvolvimento e Planejamento Regional Universidad Federal de Minas Gerais Faculdad de Sciencas Economicas.
Rodrik, D. (2004). ‘Rethinking Growth Policies in the Developing World’, Luca d’Agliano lecture in Development Economics, 8 October 2004, Torino, Italy.
Secretaria De Comunicação De Governo Da Presidência Da República. (July 2005). https://www.planalto.gov.br/publi_04/COLECAO/3YEARS3.HTM
Schwartzman, S. (1993), Science and Technology policy in Brazil: A new policy for a Global world. <http://www.schwartzman.org.br/simon/scipol/realities.htm>.
Tavares de Araujo Jr, Jose. Office of Trade, Growth and Competitiveness. Mercosur, (July 2005) <http://www.sice.oas.org/tunit/staff_article/tav01_merc_e.asp>.
UNCTAD World Investment Report, 2003. ‘Country Fact Sheet, Brazil’ <www.unctad.org>.
World Bank Country Data. World Bank online, (July 2005) <www.worldbank.org>.