electrochemical detection of serotonin and epinephrine using ...
113
ELECTROCHEMICAL DETECTION OF SEROTONIN AND EPINEPHRINE USING MULTI -WALLED CARBON NANOTUBE/POL YANILINE NANOCOMPOSITE FILMS DOPED WITH TiO 2 AND RuƢ NANOPARTICLES TP TSELE orcid.org/0000000177-9426 B.Sc (NWU), BSc (Hons) (NWU) Dissertation submitted in lfilment of the requirements for the degree Master of Science (M.Sc.) in Chemistry at the Mahikeng Campus of the North-West Universi Supervisor: Co-supervisor: Prof. Eno . E. Ebenso Dr. A. S . Adekunle Graduation October 2017 Student number: 22619070 h:/ /www.nwu.ac .z Jf✄t, .. � ., MAP•KENG CMPUS CALL NO.: I 202 1 -02-0 1 ACC.NO.: ■■ NORTH-WEST UNII __ ®
-
Upload
khangminh22 -
Category
Documents
-
view
3 -
download
0
Transcript of electrochemical detection of serotonin and epinephrine using ...

ELECTROCHEMICAL DETECTION OF SEROTONIN AND EPINEPHRINE USING MULTI -WALLED CARBON NANOTUBE/POL YANILINE NANOCOMPOSITE FILMS
DOPED WITH TiO 2 AND RuOi NANOPARTICLES
TP TSELE
orcid.org/000().0003-0177-9426
B.Sc (NWU), BSc (Hons) (NWU)
Dissertation submitted in fulfilment of the requirements for the degree Master of Science (M.Sc.) in Chemistry at the Mahikeng
Campus of the North-West University
Supervisor:
Co-supervisor:
Prof. Eno. E. Ebenso
Dr. A. S . Adekunle
Graduation October 2017 Student number: 22619070 http:/ /www.nwu.ac.za/
J.fa3t, .... �... ., MAP•KENG Ct\MPUS
CALL NO.: I
2021 -02- 0 1 ACC.NO.:
■'-'■ NORTH-WEST UNIVERSITY__ ®

DECLARATION
I hereby declare that the work presented in this dissertation entitled "Electrochemical
detection of serotonin and epinephrine using multi-walled carbon nanotube/polyaniline
nanocomposite films doped with TiO2 and RuO2 nanoparticles" submitted to the Department
of Chemistry, North-West University, Mafikeng Campus in fulfilment of the requirements for
the degree of Masters of Science ~ Chemistry was compiled and written by me under the
supervision of Prof. Eno E. Ebenso and Dr. A.S Adekunle has not been included in any other
research work submitted previously by any other student at the North-West University or any
other University. Sources of my information are acknowledged in the reference pages .
. ,r ..... 1.t!.~'::f?. ..................... .
Tebogo Palesa Tsele

ACKNOWLEDGEMENTS
First and foremost, I will like to thank my research supervisors, Prof. Eno E. Ebenso and Dr.
A.S. Adekunle, through their support and active participation in every step of the study.
Special thanks to Dr. Esther Fayemi for her guidance and valuable support, for encouraging
me to always do better.
I would like to thank the National Research Foundation and the North-West University for
their financial support.
My sincere thanks go to North-West University Department of Chemistry staff and the
MaSIM Research Group. I would like to express my very great appreciation to Mr. Kagiso
Mokalane, Mr. Sizwe Loyilane, Dr. Lukman Olasunkanmi, Ms. Nomfundo Gumbi, and Mrs.
Maggy Medupe (late).
Thanks to my colleagues, Katlego Masibi, Mashuga Motsie, Henry Nwankwo,
Gnanapragasam Raphael, Taiwo Quadri, Kgomotso Masilo and Sinethemba Manquthu.
Special thanks to my family, my mother; Maki Tsele, thanks for standing by my side through
it all. My aunt; Thina Moselane, sister; onthatile Tsele, and cousin; Lesego Moselane, thanks
for their lovely support and encouragements.
Thanks to my lovely friends - Seipati Motsuenyane and Mogakolodi Theko for their moral
support.
ii

ABSTRACT
Electrochemical properties of functionalized multiwalled carbon nanotube MWCNT/ polyaniline (P ANI) doped with metal oxide {Ti 0 2, RuO2) nanoparticles were explored.
Successful synthesis of MWCNT, TiO2, RuO2, PANI, MWCNT-PANI-TiO2, and MWCNT
PANI-RuO2 nano materials were confirmed using suitable characterization techniques such
as fourier transform infrared spectroscopy {FTIR), ultraviolet-visible spectroscopy (UV-vis), high resolution scanning electron microscopy (HRSEM) and x-ray diffraction spectroscopy
(XRD). Successful modification of gold (Au) electrode with these nanoparticles was
confirmed using electrochemical techniques such as cyclic voltammetry (CV) and electrochemical impedance spectroscopy (EIS). Serotonin (ST) and epinephrine (EP) are
biomolecules, which are vital for message transfer in the mammalian central nervous system. Au-MWCNT-PANI-TiO2 and Au-MWCNT-PANI-RuO2 gave the best electron transport
properties towards the oxidation of EP and ST compared with other electrodes investigated. The electrodes were also characterized with some degree of adsorption attributed to analyte
oxidation intermediates products. The Tafel values of 0.448 V and 0.452 V (EP, ST) and
0.422 V and 0.445 V (EP, ST) were obtained for Au-MWCNT-PANI-TiO2 and Au
MWCNT-PANI-RuO2 respectively. The stability results had the RSD of (4.4, 10 %) EP and (3.6, 6.6 %) ST on the Au-MWCNT-PANI-TiO2 and Au-MWCNT-PANI-RuO2 respectively. The linear calibration plots were obtained over different concentrations ranging from 492 to 63 .2 µM (EP) and 14.3-1.5 µM (ST). The limit of detection were calculated to be 0.16, 0.26
µM {EP, ST) and 0.18, 0.32 µM . (EP, ST) for Au-MWCNT-PANI-TiO2 and Au-MWCNT
p ANI-RuO2 electrodes respectively. The interference study was conducted using differential pulse voltammetry (DPV) and three clear peaks were observed for AA, ST and EP. The
concentration of AA was 1000 times higher than that of ST and EP. Therefore, the modified electrodes can selectively detect epinephrine and serotonin without interference from ascorbic
acid signal. The performance of the fabricated sensors was evaluated for detection of epinephrine (EP) and serotonin (ST) in a pharmaceutical sample with satisfactory results.
iii

TABLE OF CONTENTS
DECLARA TION ....................................................................................................................... i
ABSTRACT ............................................................................................................................ iii
LIST OF ABBREVIATIONS ............................................................................................... vii
LIST OF SYMBOLS ........................................................................................................... viii
LIST OF FIGURES ................................................................................................................ ix
CHA.P'I'ERONE ...................................................................................................................... l
INTRODUCTION ........ ; ....................................................................................................... l
1.1 Nanostructured Materials ........................................................................................ 2
1.2 Sensor ...................................................................................................................... 2
1.2.1 Biosensors ........................................................................................................ 2
1.2.2 Chentlcal sensors .............................................................................................. 3
1.3 Neurotransmitters .................................................................................................... 4
1.4 Metal Oxide ............................................................................................................. 4
1.5 Polymer .................................................................................................................... 5
1.6 Carbon Nanotube ..................................................................................................... 5
1.7 Problem statement ................................................................................................... 6
1.8 Research aim and objectives .................................................................................... 6
CHAPTER TWO ..................................................................................................................... 8
LITERATURE REVIEW .................................................................................................... 8
2.1 Neurotransmitters ............ ..... ................................................................................... 9
2.1.1 Serotonin and its applications .......................................................................... 9
2.1 .2 Epinephrine and its applications ........................................................................ 11
2.2 Ascorbic and their applications ............................................................................. 13
2.3 Metal Oxide ........................................................................................................... 13
2.3.1 Titanium dioxide and its application .............................................................. 14
2.3.2 Ruthenium dioxide and its applications ......................................................... 14
2.4 Polymer .................................................................................................................. 15
2.4.1 Polyaniline (P ANI) and its applications ......................................................... 15
2. 5 Carbon Based Material .......................................................................................... 16
2.5 .1 Multiwall Carbon Nanotubes and its applications ......................................... 17
2.6 Nanocomposite materials ...................................................................................... 17
iv ,.

2. 7 Chemically Modified Electrodes (CMEs) ............................................................. 18
2.8 Electrochemistry techniques .................................................................................. 19
2.8.1 Voltammetry Methods .................................................................................... 20
2.8.1.1 Cyclic Voltammetry (CV) .......................................................................... 20
2.8.1.2 Differential Pulse Voltammetry (DPV) ...................................................... 22
2.8.1.3 Square Wave Voltammetry (SWV) ............................................................ 23
2.8.2 Electrochemical Impedance Spectroscopy .............. ....................................... 24
CHAP1'ER THREE ............................................................................................................... 26
MATERIALS AND METHODS ...................................................................................... 26
3.1 Materials and Reagents .......................................................................................... 27
3.2 Apparatus and Equipment ..................................................................................... 27
3.3 Synthesis of Titanium dioxide nanoparticles ......................................................... 28
3.4 Synthesis of Ruthenium dioxide nanoparticles ..................................................... 28
3.5 Treatment of MWCNT .......................................................................................... 28
3.6 Preparation of Polyaniline (P ANI) ........................................................................ 28
3.7 Electrode modification procedure ......................................................................... 29
3.8 Characterization of Synthesized Nano-materials .................................................. 29
3.9 Electrocatalytic Experiment .................................................................................. 29
3.10 Concentration Study .............................................................................................. 30
3 .11 Interference Study .................................................................................................. 30
3.12 Preparation of Real Sample Analysis ................................................................... .30
CHAP1'ER FOUR .................................................................................................................. 31
RESULTS AND DISCUSSION ......................................................................................... 31
4.1 FTIR. Characterisation ........................................................................................... 32
4.2 UV-vis Characterization ........................................................................................ 34
4.3 XRD Characterisation ............................................................................................ 35
4.4 Surface Morphology .............................................................................................. 37
4.5 Electrochemical Characterisation .......................................................................... 39
4.6 Electrochemical Impedance Studies ...................................................................... 40
4.7 Effects of Scan Rate .............................................................................................. 42
ELECTROCAT AL YTIC OXIDATION OF EPINEPHRINE ...................................... 44
4.8 Electrocatalytic Oxidation of Epinephrine ............................................................ 44
V

4.9 Electrochemical Impedance Spectroscopy ............................................................ 46
4.10 Stability Study ........ ............................................................................................... 49
4.11 The Effect of Scan Rate ......................................................................................... 50
4.12 Concentration Study ...... ........................................................................................ 52
4.13 Interference Study: Determination ofEP in the Presence of AA .......................... 54
4.14 Real Sample Analysis .................................................. ....................... ................... 55
ELECTROCATALYTIC OXIDATION OF SEROTONIN .......................................... 56
4.15 Electrochemical Characterisation .......................................................................... 56
4.16 Electrochemical impedance spectroscopy ............................................................. 58
4.17 Stability Study .................... .. ....... .............. .... ........................................................ 61
4.18 The Effect of Scan Rate ......................................................................................... 62
4.19 Concentration Study ............................................................................................ 65
CHAP'I'ER FIVE .. ................................................................................................................. 67
CONCLUSIONS ................................................................................................................ 67
REFERENCES ................................................................................................................... 69
APPENDICES ........... ... ................................ ..................................................... ..................... 99
Appendix 1 ............ ............................................................................................................... 99
Appendix 2 ............................... .................. .... ... .................. .............. ................................. 100
vi

NT
NPs
EP
ST
UA
AA
CNTs
MO
GO
PANI
CE
Ti02
Ru02
MS
FTIR
EDX
TEM
SEM
XRD
UV-Vis
CV
EIS
Ag/AgCI
DMF
LoD
LIST OF ABBREVIATIONS
Neurotransmitters
Nanoparticles
Epinephrine
Serotonin
Uric acid
Ascorbic acid
Carbon nanotubes
Metal oxide
Graphene oxide
Polyaniline
Capillary electrophoresis
Titanium dioxide
Ruthenium dioxide
Mass spectrometry
Fourier transform infrared spectroscopy
Energy dispersive X-ray
Transmission electron microscopy
Scanning electron microscopy
X-ray diffraction spectroscopy
UV-visible spectroscopy
Cyclic voltammetry
Electrochemical impedance spectroscopy
Silver/silver chloride reference electrode
Dimethylformamide
Limit of detection
vii

LIST OF SYMBOLS
Ei,a Anodic peak potential
Ep Cathodic peak potential
E Potential
Eo Standard potential
E 112 Half-wave potential
lpa Anodic peak current
lpc Cathodic peak current
r Surface coverage or concentration
rr Pi bonding
Cd! Double-layer capacitance
CPE Constant phase electrode
D Diffusion coefficient
F Faraday constant
Hz Hertz
K Kelvin
n Number of electron
R Universal gas constant
R:1 Charge transfer resistance
Rs Resistance of electrolyte
viii

LIST OF FIGURES
Figure DESCRIPTION PAGE No
4.1 FTIR spectra of (a) TiO2 (b) RuO2 (c) PANI (d) MWCNT (e) MWCN-PANI-TiO2
and (f) MWCNT-PANI-RuO2 ... .... .......... .......... ........... .............. ..... ......... .. .... ........ 33
4.2 UV-Vis spectra of (a) MWCNT, PANI, TiO2, MWCNT-PANI-TiO2 and (b)
MWCNT, PANI, RuO2, MWCNT-PANI-RuO2 . ........ . .. .. . . . .. .. . . ....... . ... ...... 34
4.3 XRD Spectra for TiO2, RuO2, PANI, MWCNT, MWCNT-PANI-TiO2 and MWCNT-
p ANI-RuO2 . . . ........... .... .... ... . .. . .. . . . . .. .. . ... . .... . .......... . . . . . . . .. .. . .... ..... . 36
4.4 SEM images of (a) TiO2, (b) RuO2, (c) MWCNT, (d) PANI, (e) MWCNT-PANI-TiO2
and (f) MWCNT-PANI-RuO2 ............... ....... .... ... .............. ... .... ......... ....... ............. . 38
4.5 Cyclic voltammetric evolutions of the modified electrodes in 5 mM [Fe(CN)6]4-
/[Fe(CN)6]3- (a) Au, TiO2, PANI, MWCNT and MWCNT-PANI-TiO2 modified
electrodes (b) Au, RuO2, PANI, MWCNT, and MWCNT-PANI-RuO2 modified
electrodes ... .... ... .......... ... ..... ...... ...... ............. .. ................................. ...... .................. 40
4.6 Nyquist plots obtained for (a) Au, TiO2, PANI, MWCNT and MWCNT-PANI-TiO2
modified electrodes (b) Au, RuO2, P ANI, MWCNT and RuO2 modified electrodes in
5mM [Fe(CN)6]4-/[Fe(CN)6]3- at a fixed potential of 1.0 V (vs AglAgCl, sat'd KCl).
( c) Represents the circuit used in the fitting of the EIS data for bare and modified
electrodes .... .. .. .... .. .......... .. ..... .......... ... ........... ... ..... .. ......... .... .... ......... ... ....... ... ........ 41
4.7 Cyclic voltammetric evolutions of (a) Au-MWCNT-PANI-TiO2 and (b) Au
MWCNT-PANI-RuO2 electrode obtained in 5mM [Fe(CN)6]4"/[Fe(CN)6]3- (scan rate
range 25 - 1000 mVs" 1; inner to outer) ..... .... ...... ..... ........ ....... ........ ....... ..... .... ........ 43
4.8 Plots of peak potential (Ep) versus log u of (a) Au-MWCNT-PANI-TiO2 and (b) Au-
MWCNT-PANI-RuO2 in 5mM [Fe(CN)6]4·1[Fe(CN)6]3-. .. . .. .......... ... . . ......... .44
ix

4.9 Current response of (a) Au, TiO2, PANI, MWCNT, MWCNT-PANI-TiO2 and (b) Au,
RuO2, PANI, MWCNT, MWCNT-PANI-RuO2modified electrodes in 0.1 pH 7.0 PBS
containing 3 10-4 M EP ..... ....... ..... .. ............... .. ...... ..... ........ ............ .. ................... .. 45
4.10 Nyquist plots obtained for (a) Au, TiO2, PANI, MWCNT, MWCNT-PANI-TiO2 and
(b) Au, RuO2, PANI, MWCNT, MWCNT-PANI-RuO2 in 0.IM pH 7.0 PBS
containing 3>C10-4 M of EP solutions at a fixed potential of 0.22 V (vs AgjAgCI, sat'd
KCI). (c) Au, TiO2, PANI, MWCNT, MWCNT-PANI-TiO2 and (d) Au, RuO2, PANI,
MWCNT, MWCNT-PANI-RuO2 respectively are the Bodes plots obtained in EP
showing the plots of -phase angle / deg. vs log (f / Hz), and the plot of log IZ / Qj vs
log (f I Hz ) (e) denotes the circuit used in the fitting of the EIS data in (a) and
(b) . ... . . ... .. ... .. ... ...... ........ ..... .. ... .... ....... . .. ..... ........... . .............. ........... 47
4.11 Current response (20 scans) of (a) Au-MWCNT-PANI-TiO2 and (b) Au-MWCNT
PANI-RuO2 in pH 7.0 PBS containing 3)(10-4 M ofEP at scan rate of 25 mVs- 1 .49
4.12 Cyclic voltammetric evolutions of (a) Au-MWCNT-PANI-TiO2 and (c) Au
MWCNT-PANI-RuO2 modified electrodes at scan rate (25 - 300 mvs-1) and (25 -
300 mvs·1) respectively in pH 7.0 PBS containing 3 10-4 M of EP. (b,d) are peak
current vs. square root of scan rate plots of Au-MWCNT-PANI-TiO2 and Au-
MWCNT-PANI-RuO2 . .. ....... ....... . .. .. ......... . .. ... ............ . . . .. ... .. ....... .. . 51
4.13 Plots of peak potential (Ep) versus log u of (a) Au-MWCNT-PANI-TiO2 and (b) Au-
MWCNT-PANI-RuO2 in pH 7.2 PBS containing 3 10-4 M ofEP .. .. .............. 52
4.14 Differential Pulse Voltammogram (DPV) of (a) Au-MWCNT-PANI-TiO2 and (b) Au
MWCNT-PANI-RuO2 electrode in (a) pH 7.0 PBS containing different concentrations
of EP (4.9, 18.7, 27.3 , 50.0, 56.8, 63.2, 76.9 µM; from inner to outer) and (b,d) are
peak current vs. concentration of EP plots using MWCNT-PANI-TiO2 and MWCNT-
PANI-RuO2 electrodes respectively .. .. ................ .... ........ ................... .. .... .............. 53
4.15 Square Wave Voltammetry (SWV) of (a) Au-MWCNT-PANI-TiO2 and (b) Au
MWCNT-PANI-RuO2 in pH 7.0 PBS containing AA Jx10·1 Mand (EP and ST)
3 x I 0-6 M solutions respectively .............................................................................. 54
X

4.16 Current response of (a) Au, TiO2, PANI, MWCNT, MWCNT-PANI-TiO2 and (b) Au,
RuO2, PANI, MWCNT, MWCNT-PANI-RuO2 modified electrodes in 3xl04 MST in
pH 7.0 PBS (scan rate = 25 mVs-1), (c) and (d) are the current responses of
MWCNT-PANI-MO modified electrodes in 3x l04 M ST (after background
current) ... ............ .. .... ....... ........ ........... .......... .. ... ... .... ............... ...... ... .......... ............. 57
4.17 Nyquist plots obtained for (a) Au, TiO2, PANI, MWCNT and MWCNT-PANI-TiO2
(b) Au, RuO2, PANI, MWCNT and MWCNT-PANI-RuO2 in 0.1 M PBS pH 7.0
containing 3 104 M of ST solutions at a fixed potential of 0.8 V (vs AglAgCl, sat' d
KCl). (c) and (d) are the Bode plots obtained for Au-MWCNT-PANI-TiO2 and
MWCNT-PANI-RuO2 in ST respectively showing the plots of -phase angle / deg. vs
log (f / Hz), and the plot of log IZ / n1 vs log (f / Hz) (e) represents the circuit used in
the fitting for the EIS data in (a) and (b) .... ..... .... ... ... ... ............... .... ..... ...... ....... ..... 60
4.18 Current response (20 scans) of (a) Au-MWCNT-PANI-TiO2 and (b) Au-MWCNT
PANI-RuO2 in pH 7.0 PBS containing 3Xl04 M of ST at scan rate of 25
mvs- 1 • •• ••• • ••• • •• ••••• ••••••• • • • • • • • ••••••••••••••••••••• • •• ••••••• • • • • • • •••••••••••••••••••• 62
4.19 Cyclic voltammetric evolutions of (a) Au-MWCNT-PANI-TiO2 and (b) Au
MWCNT-PANI-RuO2 modified electrodes at scan rate (25 - 300 mvs-1) and (25 -
200 mvs-1) respectively in pH 7.0 PBS containing 3 104 M of ST. (b) and (d) are
peak current vs. square root of scan rate plots of Au-MWCNT-PANI-TiO2 and Au-
MWCNT-P ANI-RuO2 ...... ...... . ... .. .. .. ........ . ........ . .......... . ...... ... .. . ....... 64
4.20 Plots of peak potential (Ep) versus log u of (a) Au-MWCNT-PANI-TiO2 and (b) Au-
MWCNT-P ANI-RuO2 in pH 7 .0 PBS containing 3 104 M of ST .... .. .... . .. . ... .. 65
4.21 Square Wave Voltammogram of (a) Au-MWCNT-PANI-TiO2 and (b) Au-MWCNT
PANI-RuO2 electrode in (a) pH 7.0 PBS containing different concentrations of ST
(0.14, 0.27, 0.69, 0.86, 1.00, 1.13 1.24 1.33 1.50 µM ; from inner to outer) and (b,d)
are peak current vs. concentration of ST plots using MWCNT-PANI-TiO2 and
MWCNT-P ANI-RuO2 electrodes respectively ......... .. ......... ................... ................ 66
xi

LIST OF TABLES
Table Page No
4.1 Impedance data obtained for bare and modified electrodes in 5mM [Fe(CN)6]4" /[Fe(CN)6]
3- at a fixed potential of 1.0 V (vs AglAgCl, sat'd KCI). Values m
parenthesis are percentage errors of the data fitting ... . ... .. ............ . . . ... . . . .. .. . .42
4.2 Cyclic voltammetric data obtained for bare and the modified electrodes in EP 3 x 10⁻⁴
M in pH 7.0 PBS . ... . ... . .. .. .... . ........ . . .. . .. .. . .. ....... . ....... ... . . . . . ... . . .. . . ..... .. 45
4.3 EIS data obtained for bare and modified electrodes in EP 3Xl0-4 Min pH 7.0 PBS.
Values in parenthesis are percentage errors of the data fitting . . . ... . .. ... ... .. ...... .48
4.4 Results of detection of EP in epinephrine injection (n = 3) ... . . .......... ... ...... . . .. 55
4.5 Cyclic voltammetric data obtained for bare and the modified electrodes in ST 1 X l 0-4
M in pH 7.0 PBS .... .. ........... . ... . .... ...... .......... . . . ...... . ... ... . .. . . .. . ............ 58
4.6 EIS data obtained for bare and modified electrodes in ST 3 l 0-4 M in pH 7.0 PBS.
Values in parenthesis are percentage errors of the data fitting .. . .. . . . .. . . . ....... . . . .. 61
xii

CHAPTER ONE
INTRODUCTION
1

1.1 Nanostructured Materials
Nano-structured functional materials and their applications have attracted a lot of interest
owing to many of their exceptional properties. These significant applications are involved in
lithium ion battery with high energy, super capacitor, catalysts, solar cells, nanodevices,
chemical sensors, biosensors and biomedical fields [ 1-7]. A chemical sensor has prospective
applications in many fields, such as environmental monitoring, detection of explosives,
medical diagnoses, and so on [8-10]. It is not compulsory to always stick sensors into the
body or to take blood samples in order to retrieve chemical information. Chemical
examination of urine, saliva, sweat and exhaled air can give information on the status of the
body. Moreover, these quantities do not require such delicate levels of care in the
encapsulation of the sensors [ 11].
1.2 Sensor
Sensors have been accredited as relevant tools for detection and quantification of several
biochemical compounds, chemicals, minerals, etc. When associated with various traditional
systems, sensors are devices composed of active sensing tools coupled with a signal
transducer. These devices transmit the signal from a change in reaction or selective
compound and hence produce a signal (such as electrical, thermal or optical output signals)
which is changed into digital signals for further processing [12-16). Future detection systems
have to satisfy traditional requirements such as sensitivity, response time, probability of
detection, and false-alarm rates, but they could also satisfy other constraining factors such as
cost, power consumption, and maintainability [17].
1.2.1 Biosensors
Biosensors are influential analytical tools whose series of applications in medical diagnostics
[18), food quality control [19) and environmental monitoring [20) is rapidly expanding. The
project of an electrochemical biosensor started with the target analyte and then the selection
of appropriate biological element, e.g. L-glutamate detection has been done using glutamate
receptor ion channels, glutamate oxidase [21] or glutamate dehydrogenase [22) and finally the
subsequent electrochemical processes. The majority of enzyme-based amperometric
2

biosensors exploit the biocatalytic oxidation of analyte by oxidase enzymes having the
prosthetic group, flavin adenine dinucleotide (FAD). In the modification of a biosensor
device, the main issue is to increase the selectivity and sensitivity of the sensor by sustaining
the movement of the immobilized biomolecules which are affected by pH, temperature,
humidity and toxic chemicals. The biosensor performance usually depends on the
immobilizing matrices and/or supporting materials, numerous conventional immobilizing
matrices such as inert materials such as platinum and gold or carbon-based materials were
broadly studied (23]. Another important point shaping the biosensor design is the nature of
the planned application matrix. Devices for monitoring the dynamic analyte concentration in
vivo should be biocompatible due to the course of the implantation, both in terms of tissue
effects on sensor functionality and physiological reaction to the probe (24-25]. The
appropriate level of biocompatibility, implantable oxidase-based biosensors should also
satisfy the following minimum criteria for reliable analyte monitoring, viz. appropriate size
and geometry (26-27].
1.2.2 Chemical sensors
Chemical sensors, with recent substantial developments for detection and quantification of
chemical species, are attractive and have a wide range of application such as clinical,
industrial, agricultural and military technologies thus resulting in public and economic
benefits. A chemical sensor is defined as a small device where in a chemical, relationship
occurs between the analyte gas and/or liquid and the sensor device, transforming chemical or
biochemical information of a quantitative or qualitative nature into an analytically useful
signal.
The sensor signal is a typically electronic in nature, being a current, voltage, or impedance/
conductance change produced by electron exchange. These devices have a physical
transducer and a chemically sensitive layer or recognition layer. Chemical sensors could be
characterized by numerous features such as stability, selectivity, sensitivity, response and
recovery time, and saturation (28].
3

1.3 Neurotransmitters
Neurotransmitters (NTs) are the major chemical messengers that are released from the neuron
terminals upon depolarization [29]. These chemicals are formed in pituitary and adrenal
glands and are usually found at the axon endings of motor neurons in muscle fibres .
Neurotransmitters are produced from simple precursors, such as amino acids, which are freely
available from the diet and which need a slight number of biosynthetic steps to convert. There
are several types of neurotransmitters, and they are classified as amino acids, peptides and
monoamines. Neurochemical measurements have improved our understanding of the
relationship between chemistry in the central nervous system (CNS) and the behavioural and
moods of an organism. Abnormal neurotransmission is related to extensive range of
conditions including depression [30] , drug dependence [31 ], schizophrenia [32] and
degenerative diseases [33].
To detect and monitor NTs, numerous methods have been applied. Capillary electrophoresis
(CE), microdialysis and liquid chromatography have been used for the separation and
fractionation of NTs, whereas laser-induced fluorescence, immunoassay and mass
spectrometry (MS) have been applied for their detection [34-36]. Because there is limited
information regarding the origin of urinary NTs, studies have focused on determining NTs in
vivo. Additionally, it has been observed that neurotransmission occurs on the millisecond to
minute time scale, which confirms the real-time analysis to be easily achieved [37].
1.4 Metal Oxide
Nanoporous metal oxide nanoparticles such as titanium oxide (TiO2), cerium oxide (CeO2),
zinc oxide (ZnO), tin oxide (SnO2), and zirconium oxide (Zr02) have lately been used for
modification of enzyme-based biosensors. Sol- gel derived nanostructured metal oxides such
as TiO2 [38-39] , CeO2 [40-41], ZnO [42-43], SnO2 [44] and Zr02 [45] because of their
fascinating properties such as better thermal stability, low cost, biocompatibility, non-toxicity
and low temperature of processing, etc. have provoked much interest for immobilization of
desired biomolecules. Among these, TiO2 nanoparticles has appealed much interest due to
their exclusive properties including high mechanical strength, oxygen ion conductivity, wide
band gap (3.2 eV), biocompatibility and retention of biological activities [38-39]. Curulli et
4

al. stated that nanoporous TiO2 electrodes have been used for electron transfer mechanisms of
H2O2, and many other exciting biological molecules, such as 3,4-dihydroxyphenylacetic acid,
ascorbic acid, guanine, I-tyrosine and acetaminophen, to assemble a different generation of
chemical sensors and biosensors [ 46].
1.5 Polymer
Polymer-semiconductor nanocomposites produce a different field for the development of
advanced materials in science and technology [ 4 7]. Nanocomposites have different properties
from the constituent materials due to interfacial interactions between nanostructured
semiconductors and polymers. The properties of these materials could be effortlessly be tuned
to the desired application through the difference of particle size, shape and distribution of the
nanoparticles. The main struggle is to synthesize inorganic nanoparticles in the matrix of
conducting polymers which are infusible and are not soluble in common ·solvents.
Nanoparticles with high surface energy restrict the preparation of nanostructured composites.
The composites of TiO2 with different polymers such as conducting polyaniline (P ANI) [ 48-
50], poly (phenylenevinylene) (PPV) [51] and poly (methylmethacrylate) (PMMA) have been
widely studied in the last recent years. The most recently studied conducting polymers in the
last 15 years, P ANI has absorbed considerable attention for the preparation of its composites
with inorganic particles [52] , such as conducting PANI-BaTiO2 composite [53], PANI
molybdenum trisulfide composite [54], conducting PANI-inorganic salt composite [55], and
PANI-V2O5 composite [56]. The conducting PANI-TiO2 composites were studied, which
show high piezosensitivity being maximum at a certain P ANI-TiO2 composition [ 49].
Majority of the studies are focused on optical properties of the polymer surface modified
TiO2 nanoparticles. The materials with high dielectric constant are very valuable in integrated
electronic circuits such as capacitor and gate oxides.
1.6 Carbon Nanotube
The carbon nanotubes have attracted extensive investigation since their discovery in the early
1990s due to their chemical, physical and mechanical properties [57]. They are considered
quasi-one dimensional nanostructures, which are graphite sheets rolled up into cylinders with
diameters of sufficient nanometers and up to some millimeters in length. There are three
5

kinds of nanotubes, which are the single-walled nanotubes (SWCNTs), double-walled
nanotubes (DWCNTs) and the multi-walled nanotubes (MWCNTs). The MWCNTs is known
to have multiple layers of graphite organized in concentric cylinders. CNTs have drawn
considerable attention because of their special structure and high mechanical strength which
influenced them to be great candidates for advanced composites. Depending on the helicity
and the diameter of the tube, they are either semiconducting, semimetallic or metallic. Based
on the structure and shape, they conduct electricity because of their delocalization of the pi
bond electrons. Furthermore, it is found that CNTs are efficient adsorbents because of their
large specific surface area, heavy and layered structures and the presence of pi bond electrons
on the surface [58-59]. The connection between TiO2 with CNTs has provided a synergistic
effect which can improve the overall efficiency of a photocatalytic process. CNTs/TiO2
nanocomposites have drawn attention in literature regarding the treatment of contaminated
water and air by heterogeneous photocatalysis [60-61] .
1. 7 Problem statement
Brain chemicals that deal with the transfer of information throughout the brain and the body
are known as Neurotransmitters (NTs). They are fundamental chemicals used by the brain to
aid heartbeat, breathing action through the lungs and digestion in the stomach.
Neurotransmitters are known to cause disturbance in the patterns of the moods, sleep,
concentration, weight, and while at abnormal concentration they can cause server severe
symptoms [62]. Therefore, it is very important to control the level of neurotransmitters in the
body because imbalance in their concentration can cause much disorderliness in the body.
Neurotransmitters that assist on creating a balance are known to be inhibitory
neurotransmitters. They stabilise the mood and are washed-out when there is intense
excitatory neurotransmitters. These electroactive neurotransmitters can be easily oxidised and
well determined by voltammetric techniques. The major problem is that, at bare electrode the
oxidation response was poor. In order to increase the sensitivity and selectivity in the
determination, modification of the working electrode has been proposed.
1.8 Research aim and objectives
The aim of this study is to conduct a comparative study of the electrochemical properties of
graphene oxide/polyaniline nanocomposite film doped with metal oxide (TiO2 and RuO2)
6

nanoparticles and also verify their electro activity towards biological analytes such as
serotonin and epinephrine.
The objectives of the work are to:
• Synthesize MWCNT, PANI, RuO2 TiO2, and MWCNT-PANI-MO nanocomposite
using suitable characterization techniques such as Fourier Transformation Infrared
{FTIR), Raman, Scanning Electron Microscopy (SEM), Transmission Electron
microscopy (TEM), Ultraviolet-visible spectroscopy (UV-vis), X-ray Diffraction
(XRD) and Electron Dispersive X-ray Spectroscopy (EDX);
• Confirm successful modification of gold electrode with nanoparticle materials using
electrochemical techniques namely cyclic voltammetry (CV), and electrochemical
impedance spectroscopy (EIS);
• Compare the electron transport properties of the synthesized materials using cyclic
voltammetry (CV) electrochemical impedance spectroscopy (EIS), square wave
voltammetry (SWV), and differential pulse voltammetry (DPV);
• Compare the electrocatalytic properties of the synthesized materials towards serotonin
and epinephrine oxidation using cyclic voltammetry (CV) electrochemical impedance
spectroscopy (EIS), square wave voltammetry (SWV), and differential pulse
voltammetry (DPV) and to explore the potential of the MWCNT-PANI-TiO2 and
MWCNT-PANI-RuO2 nanocomposite towards epinephrine real sample analysis.
7

CHAPTER TWO
LITERATURE REVIEW
8

2.1 Neurotransmitters
In recent decades, neurochemical measurements have steered to improvements of
understanding the relationship between chemistry in the central nervous system (CNS) and
the behavioral, cognitive, and emotional state of an organism [63]. The key monoamine
neurotransmitters are serotonin (ST) and the catecholamines dopamine (DA), norepinepbrine
(NE), and epinephrine (EP). DA is the most distant of the four monoamine neurotransmitters
[64). Significant dopaminergic pathways are associated with perceiving rewards and
regulation of learning and feeding. Abuse of drugs affect the DA system, hence there has
been much research focus on DA. NE and EP are both excitatory neurotransmitters and have
been associated with the control of the arousal, attention, mood, learning, memory, and stress
response [65]. ST is a pacemaker function in numerous regions of the brain during times of
alertness, coordinates sensory and motor activity [64], and contributes to good execution of
feeding, sleeping, and reproductive behaviours [66].
2.1.1 Serotonin and its Applications
Serotonin (5-hydroxytryptamine or ST) 1s a monoarrune neurotransmitter produced in
serotonergic neurons in the central nervous system and plays a vital role in the emotional
system collectively with other monoamine transmitters such as regulation of mood, sleep,
emesis (vomiting), sexuality and appetite. Small amounts of ST have been associated with
several disorders, notably depression, migraine, bipolar disorder and anxiety [67-68). In
addition, neurodegeneration of ST- and DA-containing neurons contributes to neurological
diseases, such as Parkinson' s and Alzheimer's diseases, and perhaps to normal ageing of the
brain [69). Selective serotonin reuptake inhibitors (SSRls) are the most approved class of
psychotropic medications and used as first-line agents to elevate serotonin levels [70-72). The
management of SSRls to serotonergic neurons indirectly reduces negative response
sensitivity to serotonin release, thus modifying the synthesis and transport of serotonin [73-
74]. There is uncertainty whether the effects of 5-HT are of physiological and pathogenic
importance in food digestion, mucosal defence against noxious components and in functional
intestinal disorders. The enteric nervous system (ENS) takes luminal sensory signalling and
monitors epithelia functions including secretions. Secretomotor reflexes are introduced by
chemical and mechanical interaction between luminal subjects and the mucosa, which results
9

in the release of ST and other neuroendocrine substances [75-76]. The main signs of the link
between ST and anxiety-related behaviour started from the observation that methysergide and
metergoline, later on known as 5-HT antagonists, had an anxiolytic outcome in animal
studies. The same anxiolytic effect was observed after inhibition of 5-HT synthesis by para
chlorophenylalanine in rats in the Geller-Seifter test. This conflict-reducing effect was
stopped by treatment with 5-hydxroxytryptophan (5-HTP), the precursor of 5-HT [77]. As a
result, an increased activity of the central serotonergic system would be connected with
anxiety and vice versa reduced activity with declined anxiety [78]. Effective quantity of 5-HT
levels is valuable because of their coexistence within biological systems. Several problems
are often encountered in the determination of 5-HT concentrations. One is the interference of
ascorbic acid (AA), which contains similar oxidation potential and is frequently present in
vivo at 0.2 mM concentrations. These evidences have encouraged chemists to develop faster,
simpler, and more sensitive techniques to meet the various demands and, various research
experiments have been published describing the amount of serum 5-HT concentrations using
chemically modified electrodes [79-80]. Tryptophan is an amino acid that is fundamental to
the protein biosynthesis. The reduction of tryptophan has been studied in the clinical and
preclinical studies to know the relationship between a lowered serotonin system and cognition
[81]. The reduced levels of tryptophan are used as a pathway to investigate the importance of
serotonin in neurological disorders. In Parkinson' s disease patients, it is evident that the
reduction in global cognitive function and verbal recognition through acute tryptophan
depletion is observed compared with placebo and control patients confirming an interaction
between serotonergic and cholinergic impairment [82]. A typical structure of the building
blocks of serotonin is shown in Figure 2.1 .
10

-~ H
CH2·CH-NH2
COCH
! tnplo/!mo ldlooilasJ
? I COCH HOWCH2"~H-NH2
~ -s-itoswiptotano H
! i.-ldo -co d«<7booilmi
HO Y')---1('. CHrCHrNH2
~} serotonina H
Figure 2.1: Typical Scheme of serotonin synthesis [83].
2.1.2 Epinephrine and its Applications
Epinephrine (EP) known as adrenaline, is a compound that neutrally channel the nerve
impulse and is a key hormone produced by the medulla of the adrenal glands [84].
Furthermore, it is recognized as the 'fight' or 'flight' hormone and released into the blood
stream in response to worry or anger and elevates the blood glucose stage [85]. It helps as a
chemical mediator for carrying the nerve pulse to different body parts. EP in the medical field
is used to stimulate the heartbeat and to manage emphysema, bronchitis, bronchial asthma
and other allergic conditions; it is also used in the eye treatment and glaucoma [84]. The
alterations in the concentration of EP lead to several diseases, such as, schizophrenia and
Parkinsonism [86], therefore it is important to improve quantitative means for epinephrine
detection to learn its physiological role and diagnosing certain illnesses in clinical medicine
field. The properties of epinephrine in local anesthetics have been well established.
Epinephrine is the vital constrictor of blood vessels and blood coagulation accelerator,
specifically on the skin or mucous membranes for bleeding control at the procedure site [87-
11

88]. It decreases the absorption of local anesthetics into the bloodstream, causing reduced
systemic toxic side effects, prolonged medical duration of action and decreased surgical blood
loss [89-90]. Relating to other neurotransmitters, epinephrine is known for its electroactive
groups and the oxidized quinone is widely explored from the electrochemical perspective [91-
95]. But so many problems have occurred studying its electrochemical behaviours, due to its
electron transfer proportions which are slow hence the adsorbed molecule on the surface of
electrode, resulting in a light coat of material. EP detection in biosensors is still encounting
problems of the irreversible redox reaction in standard environments, and experiences
interference from the coexisting ascorbic acid (AA). Recently, there has been interest in
improving electrocatalytical properties of fabricated electrochemical sensor towards the
electrode monitoring of EP [96-97]. Humans synthesize tyrosine from the important amino
acid phenylalanine (phe), which comes from food this is illustrated on Figure 2.2. The change
of phe to tyr is catalyzed by the enzyme phenylalanine hydroxylase, a monooxygenase. This
enzyme catalyzes the reaction forming an additional hydroxyl group to the end of the 6-
carbon aromatic ring of phenylalanine, hence we get tyrosine. In dopaminergic cells, tyrosine
is changed to L-DOPA by the enzyme tyrosine hydroxylase (TH). TH is the rate-limiting
enzyme which assists in the synthesis of the neurotransmitter dopamine. Dopamine can be
easily changed into catecholamines, such as norepinephrine (noradrenaline) and epinephrine
(adrenaline) [98].
Tytollne
Dopamine ..
hydroxyl ... ~ ~OH
Dlhydroxy ~(L-DOPA)
Phenethanolamlne
N-methyltranlfffllle
Noreplnephrtne
Figure 2.2: Mechanism of conversion of tyrosine to epinephrine [99].
12
Dopamine
Epinephrine

2.2 Ascorbic and their applications
Ascorbic acid, well known as vitamin C is the main water soluble compound present in fruits
and vegetables that acts as an antioxidant against a selection of diseases and is essential for
life, health, and regular physical activities [100]. The examination of ascorbic acid
concentration is crucial for monitoring of food and vegetables quality in daily basis. Ascorbic
acid concentration in food, drugs and plants can be determined with different analytical
techniques such as indirect spectrophotometric, solid-phase iodine technique and liquid
chromatography [101-104]. Interference in the electrochemistry from oxidizable species, such
as ascorbic acid and uric acid, in the biological samples impose a threatening problem to
apply amperometric -biosensors with a working potential of 0.4 V or higher [1 05]. The
modification of the gold nanoparticles on the glassy carbon electrode [106-107] has been
tested for determination of EP detection in the presence of AA and UA. Furthermore, the
deposition of the over oxidised dopamine on a gold electrode has been effectively tested for
selective EP detection in the existence of AA and UA [108].
2.3 Metal Oxide
Metal, semiconductor and magnetic elements performance as functional units for
electroanalytical applications has been explored previously [ I 09-112] . Metal nanoparticles
offer three significant functions for electroanalysis. These consist of the roughening of the
conductive sensing interface, the properties on the catalysis of the nanoparticles permitting
their expansion with metals and the improved electrochemical detection of the metal deposits
and the conductivity properties of nanoparticles at nanoscale phase that permit the electrical
contact of redox-centers in proteins with electrode surfaces [l 13]. Furthermore, metal and
semiconductor nanoparticles offer resourceful labels for improved electroanalysis [I 14].
Disbanding of the nanoparticles labels and the electrochemical assembly of the dissolved ions
on the electrode followed by the removal of the deposited metals present at the usual
electroanalytical method. The key functions of nanoparticles were engaged for developing
electrochemical gas sensors, electrochemical sensors constructed on a molecular- or polymer
functionalized nanoparticles sensing interfaces, and for the assembly of various biosensors as
well as immunosensors and DNA sensors [115] and enzyme form of electrodes [116].
13

2.3.1 Titanium Dioxide and its Application
Titanium dioxide (TiO2) occurs in nature in three types of polymorphs namely; rutile, anatase
and brookite consisting of octahedrally coordinated Ti cations organized in edge sharing
chains, but vary in the total shared edges and comers [117]. TiO2 has certainly become one of
the promising n-type semiconductors due to its wide band gap (3.2 eV) under ultraviolet light
[ 118]. Its high physical and chemical stability together with its high refractive index makes it
one of most researched material [119-120]. Because of its optical and electronic properties, it
is widely used in numerous fields such as photocatalyst, solar cells, sensors, self-cleaning,
and bactericidal action [121-123]. The required surface properties of TiO2 make it a
promising interface for the immobilization of biomolecules and its use [124] as a food
additive [125], in cosmetics [125] and as a possible tool in the treatment of cancer [126]. TiO2
is usually used in the destruction of toxic organic compounds and microorganisms such as
bacteria and viruses and thus used in the purification of polluted air and wastewaters [127-
129].
2.3.2 Ruthenium dioxide and its applications
Hydrous ruthenium dioxide, generally expressed as RuO2•xH2O is produced in amorphous or
crystalline form [ 130-13 I]. From reports, the nano-sized electroactive materials naturally
exhibit attractive properties for their electrochemical applications because of the small
particle size and high surface/volume ratio, which makes the best out of the electrochemical
application of the materials and therefore improve their electrochemical redox performances
[132]. RuO2 has different applications owing to its unique characteristics as well as its high
chemical and thermal stability [133-134] , good catalytic activity [135], good electrochemical
properties [136] and good metallic conductivity [137]. Crystalline RuO2 electrodes are
normally used for Ch development in water [138-139], water splitting into H2 and 0 2 [140] ,
CO oxidation in sensors [141 , 135, 142] and reduction of CO2 in photocatalysis [143]. In
contrast, amorphous hydrous RuO2 (RuO2nH2O) has been studied broadly as an electrode
material for supercapacitors [144-145] . The RuO2 thin films as an enzyme biosensor substrate
was studied and offered a low resistivity, high thermal stability, good corrosion resistance,
and diffusion barrier properties. Additionally the studied reports show a successful
modification of a pH sensor [146-149] by spluttering the thin film as a hydrogen ion sensing
14

membrane on silicon or PET substrates [150]. The resulting RuO2-based pH sensor was
studied as the bulk of enzyme biosensors for detecting uric acid and glucose
2.4 Polymer
Conducting polymers have been studied as vigorous materials in other optical applications,
such as photodetectors [151], optocouplers [152], filled colour image sensors [153] and lasers
[154]. It is significant to indicate the use of these materials in others areas of interest outside
the optical devices. Conducting polymers also have properties that enable them to be used in
batteries [154-156] , biosensors [157], drug-releasing agents [158], gas separation membranes
[159], electrochemical capacitors [160], electromagnetic radiation shielding [161-162],
transistors [163], polymer-polymer rectifying heterojunctions [164] and conductive textiles
[165]. The wide applications of conductive polymers using different optical properties upon
"doping" or oxidation reduction reactions interests many researchers and these materials have
been broadly studied. The possibility of reversible doping/undoping, is followed by broad
changes, is the main key for these studies [166].
2.4.1 Polyaniline (PANI) and its Applications
Polyaniline (shown in Figure 2.3) is a conducting polymer with a delocalized conjugated
structure, and electrochemical active units of benzenoid and quinonoid, [ 167-168]. Based on
the degree of oxidation P ANI exists in different forms such as: leuoemeraldine, emeraldine
and pemingraniline. The pemingraniline base is the completely oxidized constituent of
polyaniline shown in Figure 2.3. The main active constituent of polyaniline is emeraldin salt,
found by spiking or protonation of emeraldine structure [169]. It has attracted interest due to
its electrode material that enhances the sensing sensitivity because of its low cost, simple
synthesis, and quite high conductivity [170-172]. It has a large spectrum of adjustable
properties emerging from a structure that can easy adapt and direct possible applications in
several areas, such as battery electrodes, anticorrosive coatings, gas sensors, energy storage
systems, and electrocatalytic devices [173-174]. Furthermore, PANI has the highest
environmental stability and is the only known conducting polymer stable in air [175]. P ANI is
a biosensor interface because it performances as an effective mediator for electron transfer in
15

redox or enzymatic reactions and it is appropriate medium for the immobilization of
biomolecules [ 176]. The protection of metals and alloys in corrosion using P ANI is a very
important subject. The inspiration for application of polyaniline in corrosion protection
emerges from the environmental constraint for the replacement of toxic layers, mostly
chromates, from coating systems [ 177-178]. It used to be known as aniline blacks were it was
used as cotton dyes in textile industry [179].
f;-o-;-0-Mt-0-NH-Oj ,. Polyaniline ( emeraldine) salt
fN-O-N-0--Mf-O--Mf-Oj II
Polyaniline ( emeraldine) base I @ 2002 IUPAC I
Figure 2.3: Typical schematic diagram of different polyaniline [180]
2.5 Carbon Based Material
An excess of carbon allotropes like diamond, fullerenes, carbon nanotubes and graphene has
been studied for use in microelectronics over the years. The application of nanotubes and
graphene has been considered extensively because of their low specific resistivity. The real
applications for nanotubes and graphene require many layers to be bundled for parallel
operation to make their whole resistance comparable or to improve their conventional
metallization schemes [181]. A wide spectrum of applications in relation with the
environmental protection, energy storage and generation, semiconductors, transparent
conducting materials, . structural materials, biomaterials, chemical sensors, biosensors,
catalysis, and photocatalysis, points out the fields in which the presence of carbon materials
play an crucial role in [182-184].
16

2.5.1 Multiwall Carbon Nanotubes and its Applications
Multiwall carbon nanotubes (MWCNTs) are one of the good supporting materials with
photocatalytic properties because of their high mechanical [185] and chemical [186] stability
and their mesoporous nature which support the diffusion of the reacting species. Furthermore,
MWCNT-based electrodes appear to have high sensitivity with good detection limit [187]. It
is known to have unique properties which are capable to change electron transfer reaction
when used as modified electrode [188]. Several electrodes based on MWCNT have been
studied, such as MWCNT paste electrode [189-190], MWCNT film coated electrode [191] ,
MWCNT powder microelectrode [192], aligned CNT electrode [193-194] and CNT
composite electrode [195-196]. There has been an interest on the presence of MWCNT and
nano-sized material [197-199]. There has been a review on the function of MWCNT in
electroanalytical chemistry particularly in the improvement of new electrochemical sensor
and analytical application based on MWCNT-driven electrocatalytic [200]. Nano-sized
components constructively support the catalytic sensitivity of MWCNT due to their
arrangement of electronic, absorptive, mechanical and thermal properties [201]. For fuel cells,
the application of MWCNTs as a catalytic support can possibly decrease Pt usage by 60%
compared with carbon black [202], and modified MWCNTs could enable fuel cells that do
not need Pt [203-204]. For organic solar cells, continuing efforts influence the properties of
MWCNTs to decrease unwanted carrier recombination and improve resistance to
photooxidation [205]. MWCNT sensors applications have been seen in toxin detection and
gas in the food industry, military, and environmental purpose [206-207].
2.6 Nanocomposite materials
Nanocomposite materials were developed as appropriate alternatives to overcome limitations
of microcomposites and monolithics, while encountering problems regarding preparation
which determine the elemental composition and _stoichiometry in the nanocluster period.
They have attracted many researchers in recent year due to their unique design and property
combinations that are not found in normal composites. The common knowledge of these
properties is yet to be studied [208], although the first interpretation on them was recorded in
early 1992 [209]. The surface area/volume ratio of the supporting materials is used in the
preparation of nanocomposites and is vital to the understanding of their structure-property
17

relationships. Additional, sighting of carbon nanotubes (CNTs) in 1991 [210] and their
successive use to fabricate composites shows some of the unique CNT related mechanical,
thermal and electrical properties [211-213] added an innovative and stimulating aspect to this
area. The chance of turning CNTs into multiple products and textiles [214] created a pathway
for the processing and applications of CNT-containing nanomaterials. Currently,
nanocomposites offer innovative technology and commercial opportunities for all areas of
industry, they are also environmentally friendly [215]. Conducting polymer-based composites
have attracted interest for the past decade. It is said [216] that the total determination of the
whole conducting polymer-based compound system and improve their physical properties
(such as electrical conductivity and colloidal steadiness) are yet to be accomplished,
Although both their commercial availability in the future and a big rise forward for materials
science are expected with their suitable use. In the situation of biodegradable polymer-based
nanocomposites, current changes in preparation, characterization and properties, as well as
crystallization performance and melt rheology, of both the matrix and the layered
(montmorillonite) nanocomposites were debated [217-218]. Likewise, an emphasis on
durability and interfacial bonding between CNTs and polymer matrices is critically
considered [219] to emphasize the stress transfer from the matrix and the potential of the
composites for possible small scale CNT-polymer fabrication. the use of Both synthetic and
natural crystalline supports have been applied in Fe and other metal powders, clays, silica,
TiO2 and other metal oxides, whereas clays and layered silicates are regular [220]. This is
because of their accessibility of low particle sizes and common intercalation chemistry [221-
223 ], in addition to produce enhanced properties even though they are used at a very low
concentration [224]. Most of these supports are prepared by common methods: chemical,
mechanical (e.g. ball milling) and vapour deposition.
2.7 Chemically Modified Electrodes (CMEs)
Research has proven that proteins under investigation are actively immobilized on the surface
of an electrode. Though, this immobilization process may denaturalize many proteins with the
form of change, they also disturb the further analysis of the proteins. Thus, bare electrodes are
not the best interfaces to find direct electrochemistry of many proteins; hence, CMEs are
established to enhance the situation. CMEs emerged in 1973 when Lane and Hubbard
modified different olefin compounds on clean platinum electrode through chemisorption,
18

which effectively changed the electrochemical response of the electrode [225-226] . Later on
the CMEs have been increasing the development of direct electrochemistry of proteins and
the mechanisms of redox reactions. The establishment of CMEs is to immobilize particles
with definite functions on the regular electrode surface by chemical or physical means. The
modification of the CME maintains the biological activities to a certain level hence,
electrochemical performance of the electrode is enhanced for the analysis of pr-0teins [227].
Electrodes such as platinum, gold and silver have been broadly used. These electrodes
provide favourable electron transfer kinetics and a range of anodic potential. The cathodic
potential phase of thes·e electrodes is normally limited due to the low hydrogen overvoltage.
Gold and platinum electrodes have stable chemical properties. Thus, these electrodes have
turn out to be the most popular electrodes. Silver is decent electrode substrate, which is
generally used for the preparation of CMEs in different electrochemical researches [228-231].
Besides noble metal electrodes, there was an opportunity to use other metal as electrode
substrates. For example, copper electrode and nickel electrode have been developed for the
detection of carbohydrates or amino acids in alkaline media. Associated with platinum or
gold electrodes, these two types of electrodes have a stable response for carbohydrates at
fixed potentials [232]. Furthermore, alloy electrodes like platinum- ruthenium and nickel
titanium electrodes have been studied, which are regularly used for the preparation of fuel
cells, due to their bifunctional catalytic mechanism [233].
2.8 Electrochemistry techniques
Most transducers in electrochemical research are established on potentiometric,
amperometric, or conductivity measurements. A sensor is known as a device that measures a
physical amount by measuring features of an electrical nature ( charge, voltage, or current).
The amperometric electrochemical is composed of working ( or sensing) electrode (WE), a
counter electrode (CE), and a reference electrode (RE). The three electrodes are bounded in
the sensor housing which they will be in contact with a liquid electrolyte. An oxidation
reaction effects in the flow of electrons from the working electrode to the counter electrode
across the external circuit. Equally, a reduction reaction effects in the flow of electrons from
the counter electrode to the working electrode. The detection ideologies of the amperometric
19

biosensor (234] should increase the voltage for the reaction tank and provide enough energy
of electrode surface to development the electron transformation (235-236].
2.8.1 Voltammetry Methods
Voltammetry involves different electroanalytical methods in which electrochemical currents
are measured as roles of the applied potentials on an operational microelectrode. Depending
on the shown current vs potential relationship, the data on the analytes present can be derived.
In these case the solution equilibria involves metal ions and metal complexes, voltammetry
offers facts about the speciation of the system. Although, in these circumstances the
interpretation of voltammetric data is often rather difficult, especially when numerous signals
overlap in the experimental voltammograms and their relative sizes and morphologies change
during the experiment. The use of voltammetric procedures to determine the metal ions along
with biological molecules are of interest as a classical subject from the innovative research on
polarography (237-238]. As a result, classical methods such as direct current polarography
(DCP) and cyclic voltammetry (CV), at mercury drop electrodes, and other modem ones such
as differential pulse voltammetry (DPV), square wave voltammetry (SWV) and linear sweep
voltammetry (LSV) have been used for the detection and the clarification of electrochemical
mechanisms at rather low concentrations.
2.8.1.1 Cyclic Voltammetry (CV)
Cyclic voltammetry is one of the most resourceful electroanalytical method for the
investigation of electroactive species. It is the main characterization in the electrochemical
study for biological compounds on the surface of the electrode. CV involves the response of
potential of an electrode, which is immersed in an electrolyte solution, and measuring the
resulting current (239]. The potential of this working electrode and a reference electrode are
controlled by a saturated calomel electrode (SCE) or a silver/silver chloride electrode
(Ag/ AgCl) respectively. The significant parameters of a cyclic voltammogram are the sizes of
the anodic peak current (ipa) and cathodic peak current (ipc), and the anodic peak potential
(Ei,a) and cathodic peak potential (Epc). The procedure of measuring ip includes extrapolation
20

of a baseline current. The development of a correct baseline is crucial for the precise
measurement of peak currents.
A redox couple that quickly exchange electrons with the working electrode is labelled an
electrochemically reversible couple. The official reduction potential (E0) for a reversible
couple is placed between Ei,a and Epc.
{1)
The total of electrons transferred in the electrode reaction (n) for a reversible couple can be
confirmed from the separation between the peak potentials.
Hence, a one-electron practice such as the reduction of Fe111(CN)/- to Fe 11(CN)64- shows a
6£,p, of 0.059 V. Prolonged electron transfer at the electrode surface, "irreversibility," makes
the peak separation to increase. The peak current for a reversible system can be determined by
the Randles-Sevcik equation for the forward first cycle.
3 1 1
i11
= (2.69 X 10⁵)niADi°Cv2 n ( 3)
where ip is peak current (A), n is electron stoichiometry, A is electrode area (cm2) , D is
diffusion coefficient (cm2/s), C is concentration (mol/cm\ and u is scan rate (V/s).
Therefore, ip increases with v112 and is relatively proportional to concentration. The
concentration relationship is particularly essential in analytical applications and in the
research of electrode mechanisms [240]. The Tafel equation can be used for the irreversible
diffusion controlled process [241]
2.303RT Ep = ( ) logv (4)
2 1 - a naF
where a is the transfer coefficient, b is the Tafel value, Ila is the number of electrons involved
in the rate-determining step. R, T and F are gas constant, temperature and Faraday constant,
respectively.
21
f I ._,,. •

2.8.1.2 Differential Pulse Voltammetry (DPV)
DPV is derived from linear sweep voltammetry and staircase voltammetry, which is
exceptionally useful to identify trace levels of organic and inorganic analytes. In this method,
there are sequences of consistent voltage pulses superimposed on the potential linear sweep or
stair steps. Before each potential transition and late in the pulse life, the currents are
documented. The current change is then plotted against the applied potential. In the
differential pulse voltammogram, the peak current height can be directly proportional to the
concentration of equivalent analytes. The peak potential differs with different analytes, which
could be used to differentiate the detected species like the one presented in Figure 2.4. DPV
can also help increase the sensitivity of the detection and the resolution of the voltammogram,
but also offers records about the chemical form of the analytes, such as oxidation and
complexation rank, which is essential for an analysis. Hence, this technology has been
extensively used for the electrochemical analysis of proteins and cells [242].
20
i 1s +:)
5 810
5 0.0 -0.3
1.5
11.0 .:I GO .90.5
0.0
-0.6 c(AFP/ ng/mL
• 1 0 1 2 Joi C1m/(nglmL)
-0 .9
Figure 2.4: Typical differential Pulse Voltammetry plot [243].
22
-1 .2

2.8.1.3 Square Wave Voltammetry (SWV)
Square wave voltammetry (SWV) (shown in Figure 2.5) has been a primary production of
sensitive electrochemical sensors and biosensors. The success of a sensor is directly
proportional to how sensitive and selective it connects to its analyte [244]. This may be
improved by applying a more sensitive electrochemical method such as SWV. Other
procedures for increasing sensitivity comprise the adjustment or improvement of more
effective electrodes. Research regarding the outcome of electrodes on sensitivity and
detection limits have been applied using boron-doped diamond film electrodes [245], carbon
paste electrodes [246], metal oxide based nanowires/ nanotubes [247] , and carbon n,anotubes
[248]. Each of these lessons include the employment of modified or bare electrodes in which
SWV was active as the main practice. An analysis of relevant papers dating ten years back in
which SWV was used as a technique in sensor study which reveals that the method is
increasing in popularity. This technique has affected various fields including diagnostics,
environmental analysis, food sciences, enzyme kinetics and pharmaceuticals. This assessment
will determine each of these fields derived from the literature over the past five years, but
save for pharmaceutical uses, which have been widely recorded [249-254].
,
• r
•
,U
Figure 2.5: Typical square wave voltammetry plot (255]
23

2.8.2 Electrochemical Impedance Spectroscopy
Electrochemical impedance spectroscopy (EIS) has been used to investigate the
electrochemical systems (256], which is involved in studies such as corrosion,
electrodeposition (257], batteries (258] and fuel cells (259]. For impedance quantities, a small
sinusoidal AC voltage probe (typically 2-10 mV) is used, and the current response is fixed.
The current response in-phase controls the real (resistive) component of the impedance,
whereas the out-of-phase current response determines the imaginary (capacitive) component.
The AC investigation voltage must be small enough so that the system response is linear,
enabling easy equivalent circuit analysis. Impedance procedures are powerful, because they
are able to characterize physicochemical processes of broadly differing time constants, testing
electron transfer at high frequency and mass transfer at low frequency. Impedance results are
usually fitted to equivalent circuits of resistors and capacitors, of the Randles circuit
presented in Figure 2.6 (260], which is often used to understand simple electrochemical
systems.
400
Au/N-TiO2- dark • • 350-0 Au/N-Ti02 - vis 0 CPE • ~J-300-
0
• e 250-.g 0 Rct Ws • > 200-N 0 • I
0 • 150 0 • . Par-.S Dari< Vit
0 • Rs(ocrn·'i 24.S 19.S
JOO 0 • Rd (Ocm") 185 146 1~w CPE- lo' (F cm 1) 1.61 1.95
v. •to• (ff1 cm" s"·', 5.64 6.76
SO-
0 I I I I I
0 100 200 300 400 500 600
Z'/ohm
Figure 2.6: Typical electrochemical impedance spectroscopy plot and Randles equivalent
circuit (261].
This corresponding circuit produces the Nyquist plot shown in Fig. b, which offers visual
understanding of the system' s dynamics. Re, is the charge-transfer resistance, which is
inversely proportional to the rate of electron transfer; Cd is the double-layer capacitance; Rs is
24

the solution- phase resistance; and, ~ is the Warburg impedance, which emerges from mass
transfer boundaries. If an analyte disturbs one or more of these equivalent circuit parameters
and these parameters are not disturbed by intrusive species, then impedance procedures can
be used for analyte detection. Rs emerges primarily from the electrolyte resistance and it is
mostly used in analytical application in conductivity sensors, The Warburg impedance, which
is used to measure active diffusion coefficients, is rarely useful for analytical applications.
The equivalent circuit components in Figure 2.6 are mostly used in the analyte detection
[262].
25

CHAPTER THREE
MATERIALS AND METHODS
26

3.1 Materials and Reagents
About 2 mm diameter working electrode (Au) was obtained from CH instrument (USA).
sulfuric acid (H2SO4), potassium permanganate (K.MnO4), hydrogen peroxide (H2O2),
hydrochloric acid (HCl), nitric acid (HNO3), ethanol absolute (CH3CH2OH),
dimethylformamide (DMF), sodium Nitrate (NaNO3), potassium ferricyanide (K3F e(CN)6) ,
potassium phosphate monobasic (KH2PO4), sodium dihydrogen phosphate (NaH2PO4.2H2O)
titanium dioxide (TiO2) precursor powder, ruthenium (111) chloride hydrate (RuCh.xH2O),
octanoic acid, pristine multi-walled carbon nanotubes (MWCNT), aniline, ammonium
persulfate, serotonin hydrochloride, (±) epinephrine hydrochloride, ascorbic acid, sodium
hydroxide (NaOH) used were of analytical grade and purchased from Sigma-Aldrich
chemicals, Merck chemicals and LabChem. Phosphate buffer mixture (PBS, pH 7 .0) was
composed with suitable amounts of NaH2PO4.2H2O and Na2HPO4.2H2O and the pH
monitored with already calibrated pH meter.
3.2 Apparatus and Equipment
Petri dishes, conical flasks, beakers, volumetric flasks , measuring cylinder, Buchner funnel
and Buchner flask used were washed in detergent solution and rinsed several times with
distilled water. Other apparatus and equipment used include oven, magnetic stirrer, and
magnetic bar. Fourier transformed infrared spectrometer (Agilent Technology, Cary 600
series FTIR spectrometer, USA), UV-visible spectrophotometer (Agilent Technology, Cary
series UV-vis spectrometer, USA), Transmission electron microscopy (Tecnai G2 spirit FEI,
USA), while the high resolution scanning electron microscope uses (Zeiss Ultra Plus 55
HRSEM, Germany) and X-ray diffraction spectrophotometer (Bruker-AXS, Madison,
Wisconsin). Electrochemical experiments were performed on an Autolab Potentiostat
PGSTAT (Eco Chemie, Utrecht, and The Netherlands) determined by the GPES software
version 4.9. Electrochemical impedance spectroscopy (EIS) quantities were achieved with
Auto lab NOV A software ranging from 100 kHz and 0.1 Hz using a 5 m V rms sinusoidal
modulation with the oxidation of the analyte individual peak potential (vs. AglAgCI in sat' d
KCl). A AglAgCl in saturated KCI and platinum wire were used as reference and counter
electrodes respectively. Every experiment was carried out at 25 ± 1 °C whereas the solutions
were de-aerated before each electrochemical experiment.
27

3.3 Synthesis of Titanium dioxide nanoparticles
TiO2 (2 g) precursor powder (bulk) was mixed in 10 mL NaOH and was treated with
hydrothermal at 150 °C for 24 hours in a furnace. The white solid was recovered after the
reaction was completed and washed with HCl (0.1 M), accompanied by distilled water. The
white solid was dried at 80 °C for 24 hours. Afterward, the powder acquired was constantly
heated at 500 °C for 2 hours to produce TiO2 nanoparticles [263].
3.4 Synthesis of Ruthenium dioxide nanoparticles
Doubled distilled, deionized water was mixed with RuCh.xH2O (0.28 g). 2 mL of octanoic
acid was then introduced as a pro-surfactant. About 1.5 M NaOH was gradually added to the
solution to produce a precipitate under continuoµs stirring at a pH 8. The reaction was then
heated for an hour at 80 °C. The reaction was chilled and the formed product was washed
with distilled water till the product became impartial. It was then again washed with ethanol
numerous times. The product was dried for 3 hours at 100 °C and lastly calcinated at 950 °C
for 4 hours [264].
3.5 Treatment of MWCNT
MWCNT, 110 mg was treated with a mixture of concentrated H2SO4 and HNO3 acid (120
mL) (v/v 3:1). This mixture was sonicated for 3 hours at 40 °C, and then cooled to room
temperature. The solution was slowly added dropwise to 300 mL cold deionised water. It was
then filtered and washed with deionised water till pH was neutral. The product was dried at
70 °C for 8 hours [265].
3.6 Preparation of Polyaniline (P ANI)
Aniline (0.5 g) was mixed with 40 mL of HCl (IM) and H2SO4 solution, stirring at room
temperature. The solution was cooled in an ice bath at 5 °C. A mixture of ammonium
persulfate (1.22 g), 40 mL of HCI (1 M) and H2SO4 solution at 5 °C was slowly added
dropwise to the above solution as an oxidant. The mixture took 40 hours to react, and it was
then filtered. The filtrate was then washed with deionised water and acetone numerous times.
It was then dried at 50 °C for 24 hours (266] .
28

3.7 Electrode Modification Procedure
The surface of the working electrode (Au) was prepared by polishing in aqueous slurry of
alumina nanopowder (LabChem) using a SiC-emery paper. The electrode was put through the
ultrasonic vibration for 5 minutes in distilled water and absolute ethanol to eliminate the
remaining alumina particles that may be caught on the surface. Six suspensions (MWCNT,
PANI, TiO2, RuO2, MWCNT-PANI-TiO2 and MWCNT-PANI-RuO2) were prepared and in
each suspension 5 mg of each synthesized samples (MWCNT, PANI, RuO2, TiO2, MWCNT
p ANI-TiO2 and MWCNT-P ANI-RuO2) were dissolved in 0.5 mL DMF and ultrasonicated for
30 minutes. Au-PANI, Au-MWCNT, Au-RuO2, Au-TiO2, Au-MWCNT-PANI-TiO2 and Au
MWCNT-PANI-RuO2 were prepared by drop-dry method. Five microliter drops of the PANI,
MWCNT, RuO2 and TiO2 suspensions were dropped on the bare Au electrode and dried in an
oven at 50 °C for 5 minutes.
3.8 Characterization of Synthesized Nano-materials
Successful synthesis of the nano-materials and the nanocomposite were confirmed using
techniques such as transmission electron microscopy (TEM), Fourier transform infrared
spectroscopy (FTIR), UV-visible spectroscopy, Raman spectroscopy, x-ray diffraction
spectroscopy (XRD) and scanning electron microscopy (SEM). Successful modification of
the electrodes was confirmed by using cyclic voltammetry (CV) and electrochemical
impedance spectroscopy (EIS). Electrochemical characterization was carried out in 5 mM
([Fe(CN)6]3-
14- ) redox probe and 0.1 M PBS to study the electron transport properties of the
modified electrodes. During electrochemical experiment, bare gold (Au) and Au modified
electrodes (Au-PANI, Au-MWCNT, Au-MWCNT-PANI-RuO2 and Au-MWCNT-PANI
TiO2) were used as the working electrodes, a platinum wire as the auxiliary electrode, and an
Ag/ AgCl sa_turated KCl as the reference electrode respectively. Every experiment was carried
out at 25 ± 1 °C, and the solutions were de-aerated before each electrochemical experiment.
3.9 Electrocatalytic Experiment
The electrochemical cell used had three electrodes with separate compartments for the
reference (Ag/AgCI) and for the counter electrode. Gold electrode (Au) served as a working
electrode. The electrocatalytic experiment was carried out using cyclic voltammetry
techniques in 3 )( 10 M epinephrine and serotonin as analytical probe, prepared in 0.1 M
pH 7.0 PBS. Different electrodes were prepared to determine the oxidation of the analytes at
29

scan rate 25 mvs·1 with the potential ranging between 0.2 and 0.8 V. Electrochemical
impedance spectroscopy experiment was conducted to study the electron transport
performance of electrodes towards epinephrine and serotonin oxidation.
3.10 Concentration Study
Methods such as square wave voltammetry (SWV) and differential pulse voltammetry (DPV)
were carried out using Au-MWCNT-PANI-TiO2 and Au-MWCT-PANI-RuO2 in 0.1 M pH
PBS containing 3X 10 - ' M of EP and ST respectively. The prepared concentrations were
used to determine the sensitivity of the electrodes towards the analytes, and the limit of
detection (LOD) was calculated.
3.11 Interference Study
The interference study was carried out on Au-MWCNT-PANI-TiO2 and Au-MWCT-PANI
RuO2 electrode. The effect of ascorbic acid on the electrocatalysis of 3 X 1 o--' M of EP and
ST were carried out in 0.1 M PBS pH 7.0. The concentration of AA examined was 1000
times greater than the concentration of EP and ST. The square wave voltammetry was the
effective method to determine the increasing concentrations of EP and ST while the ascorbic
acid was kept constant.
3.12 Preparation of Real Sample Analysis
The adrenaline injection sample (1 g/mL) was diluted with 0.1 M pH 7.0 PBS. 2 mL of the
diluted solution was spiked in six 50 mL volumetric. Five flasks were spiked with another
two microliter of different concentration of the standard EP solution, and filled to the mark
with 0.1 M PBS pH 7.0. The concentrations were determined using differential pulse
voltammetry. The experiment was repeated 3 times.
30

CHAPTER FOUR
RESULTS AND DISCUSSION
31

4.1 FTIR Characterisation
The spectra in Figure 4.l(a) is the FTIR spectrum of TiO2, showing a peak around 700 cm-1
which agrees with the Ti-O stretching vibration band, suggesting the formation of TiO2 [267] .
The spectra in Figure 4. l(b) is the FTIR spectrum of RuO2, showing the distinctive peak at
600 cm-1 indicating the Ru-O vibrations band, also confirming the formation of RuO2 [268].
The spectra in Figure 4.l(c) is the FTIR spectrum of PANI, showing distinctive peaks at 1583
and 1494 cm-1 which are related to the C=C vibration bands of quinoid and benzenoid rings in
PAN! [269], while peaks at 1303 and 1243 cm-1 correspond to the C-N and C=N stretching
types [270]. Also, the peak at 1150 cm·1 is attributed to the in-plane flexibility of C-H [271 ],
and the peak at 826 cm·1 is assigned to the out-of-plane flexibility of C-H [272]. Figure 4.l(d)
is the spectrum of MWCNT, indicating a broad peak at 1960 cm-1 which is associated to the
stretch of the carboxylate anion mode. The peak around 2361 cm - I is attributed to the O- H
stretching vibration from firmly hydrogen-bonded --COOH [273-274]. The absorption peak
around 3723 cm- 1 is associated to the hydroxyl (OH) groups [275]. The FTIR spectrum of
MWCNT-PANI-TiO2 in figure 4.l(e) and MWCNT-PANI-RuO2 in figure 4.l(f) show the
characteristics of the metal oxide and MWCNT which confirms the successful formation of
the nanocomposites.
32

101 ...,------------------,
(a)
1-no,j
98-+----r---~--.--~--.--~--.--' 1000 2000 3000 4000
Wavenumber (cm-1)
98 (c)
~96 ~ G) 0 C 9"
~ .E t11 92 Ill ... I-
90 1- PANI I 88
1000 2000 3000 4000
Wavenumber (cm-1)
0.08 (e)
0.02 I - MWCNT-PANI-TiO, I
1000 2000 3000 4000
Wavenumber (Cm-11
(b) 100
j - Ruo, j
70 +..L.---,--~---,--~---,--~-.--~-.----1
0.30
0.25
~ ~
~ 0.20 C Ill :t: -~ 0.15
~ I-
0.10
0.05
0.07
-0.06 ~ ~ ~ 0.05 C Ill
~ 0.04 1/) C ~ 0.03 1-
0.02
600
1000
1000
800 1000 1200
Wavenumber (cm-1)
1400
(d)
1-MWCNT I
2000 3000 4000
Wavenumber (cm-11
(f)
- MWCNT-PANI-Ruo,
2000 3000 4000
Wavenumber (cm-11
Figure 4.1: FTIR spectra of (a) Ti02 (b) Ru02 (c) PAN! (d) MWCNT (e) MWCN-PANI
Ti02 and (f) MWCNT-PANI-Ru02.
33

4.2 UV-vis Characterization
Figure 4.2(a) is the UV-vis spectra of MWCNT, PAN!, TiO2 and MWCNT-PANI-TiO2
nanoparticles. It can be seen that the UV-Vis spectrum of PAN! shows two clear peaks at 329
and 615 run. These observed peaks correspond to 1t- 1t * transitions centered on the benzenoid
and quinoid units, respectively [276]. The spectrum of MWCNT-P ANI-MO nanocomposites
typically contains two broad bands placed around 620 nm and 330-360 nm which indicates 1t
➔ polaron, polaron ➔ 7t * and 7t ➔ 7t * changes in the emeradine salt of PANT. The shifted
blue band relies on the concentration of the metal oxide. The shift shows a rearrangement of
polaron density in the PAN! emeradine band gap which is affected by the metal oxide
nanoparticles [277]. No observed peaks in the 300-800 run range for MWCNT sample as
reported by Wu et al. [278]. A broad absorption peak was observed for RuO2 Figure 4.2(b).
0.6 0.8 ~ ------------~
0.5
-"' 0.4 :!:
_ 0.6
"' -C ::::>
0.3 .ci ... ~ 0.2
·2: ::::> .ci 0.4 ... <( ........
~ "iii 0.1 C Q) -E 0.0
-0.1 (a)
-MWCNT - PANI - Ti0
2
- MWCNT-PANI-Ti02
f 0.2 C Q) -E
0.0
(b)
-MWCNT - PANI - Ru0
2
- MWCNT-PANI-Ruo, -0.2 -0.2
300 400 500 600 700 300 400 500 600 700 800 Wavelength " (nm) Wavelength " (nm)
Figure 4.2: UV-Vis spectra of (a) MWCNT, PAN!, TiO2, MWCNT-PANI-TiO2 and (b)
MWCNT, PAN!, RuO2, MWCNT-PANI-RuO2.
34

4.3 XRD Characterisation
XRD can offer valuable information on the crystallographic structure of the specimen. Figure
4.3(a), show that no peak patterns were observed in the XRD of TiO2, indicating an
amorphous structure. XRD spectrum of RuO2 nanoparticle is presented in Figure 4.3(b ). The
concentrated peaks validate the crystalline nature of the fabricated RuO2 nanoparticles. The d
lines patterns indicated for RuO2 nanoparticles goes as follows (diffraction plan: 110, 101 ,
200, 211 , 220, 002, 310, 112, 301,202) could be recorded as tetragonal RuO2 [267]. The pure
MWCNTs showed an intense peak centered at 28 value of 26 a which confirm the (002)
planes of MWCNTs in Figure 4.3(c). The peaks centered at 53 a were because of the (110)
and (100) graphitic planes and small amount of the constituent enclosed inside MWCNTs
walls [279]. Figure 4.3(d) indicates a broad peak around 25.3, assigned to the diffraction of
(110) plane of the crystalline phase of P ANI, confirming the effective synthesis of P ANI
[280]. When carbon nanotubes were integrated into the P ANI medium, the sharp and strong
diffraction peak of MWCNT at (26.28) was observed as an overlap with the P ANI peak
resulting in a wide peak in the composite as shown in Figure 4.3(e). The information indicates
that no other crystalline order was added into the composite [281]. Similarly, Figure 4.3(f)
clearly showed the enhanced crystalinity nature of the MWCNT-P ANI-RuO2 composite due
to the well-defined peaks of the RuO2 nanopartilces overlaying the PANI molecules.
35

5000
(a) (b) 600 4000
';fl ~
~400 0 3000 ~
U) "iii C C .! .! 2000 .f C
200 1000
0 0
20 40 80 80 100 120 20 40 60 80 100 120
2 8 (degrees) 2 8 (degrees)
(c) 1200
(d) 3000
900
~ ~ ~ 2000 0
~ "iii "iii 600 C C .! .! £ £
1000 300
0 0
20 40 60 80 100 120 20 40 60 80 100 120
2 8 (degrees) 2 8 (degrees)
800 (e) 1600 (f)
600 1200 ~ ~ 0 0
~ ~ -~ 400 "iii
C: 800 .! .! .f C:
200 400
0 0
20 40 60 80 100 120 20 40 60 10 100 120
2 8 (degrees) 2 a (degrees)
Figure 4.3: XRD spectra of (a) Ti02 (b) Ru02 (c) MWCNT (d) PANI and (e) MWCNT-
PANI-Ti02and (f) MWCNT-PANI-Ru02.
36

4.4 Surface Morphology
The surface morphologies of the prepared nanocomposites were analysed by SEM. The
samples were first gold coated to make the surface well conducting. Figure 4.4 (a-f) represent
the SEM images of TiO2, RuO2, MWCNT, PANI, MWCNT-PANI-TiO2 and MWCNT
PANI-RuO2. Figure 4.4(a) shows the morphology ofTiO2 nanoparticles due to heat treatment.
The tube~like structure which broke into smaller particles was observed and this was due to
dehydration of inter-layered OH groups that destroyed the nanotubes structure after heat
treatment at 500 °C for 2 hours [282]. The SEM image of RuO2 (Figure 4.4(b)) showed
uniformly distributed nanoparticles with some aggregation forming spherical shaped particles
with larger sizes (283]. Figure 4.4(c) for the MWCNT material appeared to show thin
nanofibers which merged to form bundles, entwined together. PAN! Figure 4.4(d) shows
more of a spherical structure and Figures 4.4( e and f) shows the SEM images of the
MWCNT-PANI-TiO2 and MWCNT-PANI-RuO2 respectively, indicating the encapsulation of
the TiO2/RuO2 nanoparticles inside the PANI/MWCNT fibres resulting in a more porous
nanocomposite materials.
37

Figure 4.4: SEM images of (a) Ti02, (b) Ru02, (c) MWCNT, (d) PANI, (e) MWCNT-PANI
Ti02 and (f) MWCNT-PANI-Ru02.
38

4.5 Electrochemical Characterization
Comparative cyclic voltammetric evolutions of modified electrodes in 5 mM [Fe(CN)6]4-
/[Fe(CN)6]3- preparation in PBS pH 7.0 is shown in Figures 4.5 for different electrodes. The
significance of this study was to explore the best electrode with enhanced electron transport
properties. In Figure 4.5(b), the redox peaks observed around 0.2 V is ascribed to the
[Fe(CN)6]3-14- redox process while the oxidation peak around 1.0 V observed on the modified
Au-MWCNT-PANI-RuO2 is attributed to Au to Au3+ or Au4+ [284], when MO (TiO2, RuO2)
nanoparticles were incorporated into MWCNT/PANI in MWCNT-PANI-MO composite
modified Au electrode as compared with that of MWCNT modified Au. The redox couple of
[Fe(CN)6]3-/[Fe(CN)6]4- appears rather reversible at the Au-MWCNT-PANI-TiO2. It is
because the peak currents acquired are well-defined with Ipa/Ipc= l.01 , and a peak separation
of 154 mV as its Epa = +276 mV and Epc= +122 mV vs. Ag/AgCl. On the other hand, Au
MWCNT-PANI-RuO2 appeared to be quasireversible due to the different intensity of the
anodic and the cathodic currents. It can be seen that peak current of the composites modified
electrodes were higher than other electrodes, which are ascribed to the more electroactive
sites of PANI which supported the MWCNT-MO fast rate electron .transfer due to the
synergic effect of MWCNT-MO. The results show that MWCNT contributes to significant
improvement of the increase in electrochemical response observed on MWCNT-P ANI-MO
modified electrodes. Therefore, the comparative cyclic voltammetry studies reveal that the
best electrodes are Au-MWCNT-PANI-TiO2 and Au-MWCNT-PANI-RuO2 due to their
improved current responses [285-286]. Changes observed throughout the CV during the
modification processes are another considerable proof for the successful immobilization of
PANI, MWCNT, TiO2 and RuO2 on the electrode surface. The results showed that MWCNT
PANI-MO nanocomposite modified electrodes demonstrated enhanced electrochemical
response suggesting that they could be potential electrode materials for electrochemical
sensors applications [287].
39

0.9 (a) 1.2
(b)
0.9
0.6
0.6
<{ 0.3
E :::::
0.0
c{ E o.3 :::::
0.0
-0.3 -Au - Au-Ti0
2 -0.3
-Au - Au-Ru0
2 - Au-PANI - Au-PANI
-0.6 - Au-MWCNT -0.6 - Au-MWCNT - Au-MWCNT-PANI-TI0
2 - Au-MWCNT-PANI-Ruo,
-0.3 0.0 0.3 0.6 0.9 1.2 -0.3 0.0 0.3 0.6 0.9 1.2 EN (Ag/AgCI, sat'd KCI) EN (Ag/AgCI, sat'd KCI)
Figure 4.5: Cyclic voltammetric evolutions of the modified electrodes in 5 mM [Fe(CN)6]4-/[Fe(CN)6]3. (a) Au, TiO2, PANI, MWCNT and MWCNT-PANI-TiO2 modified electrodes (b)
Au, RuO2, PANI, MWCNT, and MWCNT-PANI-RuO2 modified electrodes.
4.6 Electrochemical Impedance Studies
Electrochemical impedance spectroscopic studies (EIS) was used to investigate the
electrochemical behaviors ( electron transfer properties) of various modified electrodes in the
presence of [Fe(CN)6]3·14· redox probe. The Nyquist plots are shown for different modified
electrodes in Figure 4.6(a and b). This platform examines the surface status and the
difficulties of modified electrodes due to electron transfer amongst the electrolyte and the
electrode channeling through the drawbacks or through defects in their limitation [288].
Figure 4.6(c) denotes the circuit model used in the fitting and the fitting parameters obtained
are presented in Table 4.1. In the circuit model, Rs is the solution resistance, Q is the constant
phase angle, and Rei is the charge transfer. The observed impedance spectra showed a linear
portion and a semicircle portion. The linear part at lesser frequencies reflects the diffusion
procedure, and the electron transfer resistance {R:1), is symbolized by the semicircle at a high
frequency, which monitors the electron-transfer kinetics at the electrode/electrolyte interface
in the redox probe. Therefore, Re, is used to determine the interfacial properties of the
electrode. For the bare gold electrode, the probe can effortlessly transfer an electron to the
surface of the electrode. On the other hand, redox process of the [Fe(CN)6]3-;4· probe on
MWCNT-PANI-TiO2 (Re, = 0.977 k!l) and MWCNT-PANI-RuO2 (Re, = 0.989 k!l) modified
40

electrodes show an electron-transfer resistance that is considerably lower than that of the bare
gold electrode CRc, = 193 kn). The results showed enhanced electron transport properties and
successful modification of the gold electrode with the MO nanocomposite materials.
Therefore, the Au-MWCNT-PANI-MO electrodes showed exceptional electron conducting
transport properties. This can be ascribed to the negative [Fe(CN)6]3-14
- ions which were
attracted by the abundant positive charges contained on the Au-MWCNT-PANI-MO
electrode surface.
60 60
■ Au (a) ■ (b) ■
50 • Au-no2 50
• Au-PANI Au-MWCNT ■ ■ ..
40 • Au-MWCNT-PANI-TiO2 40
C: ■ C: ■ ..... ..... I I ~ 30 ■ ~30 ■
::-- • • ::--N ■ • N ■ ■ Au
• Au-RuO2 20 • • 20 ■
• • Au-PANI ■ ■ Au-MWCNT • ..
■ Au-MWCNT-PANI-RuO2 10 10 • •
I • . . . . . .. ~ ... ........... 0 • • 0 • •
0 5 10 15 20 25 30 35 0 10 20 30
Z'/K-1n Z'/K-1n
•
Q
Figure 4.6: Nyquist plots obtained for (a) Au, Ti02, PANI, MWCNT and MWCNT-PANI
Ti02 modified electrodes (b) Au, Ru02, PANI, MWCNT and Ru02 modified electrodes in
5mM [Fe(CN)6]4"/[Fe(CN)6]3- at a fixed potential of 1.0 V (vs AglAgCl, sat'd KCl). (c)
Represents the circuit used in the fitting of the EIS data for bare and modified electrodes.
41

Table 4.1: Impedance data acquired for bare and modified electrodes in 5 mM [Fe(CN)6]4-
/[Fe(CN)6]3- at a fixed potential of 1.0 V (vs AglAgCI, sat'd KCI). Values in parenthesis are
percentage errors of the data fitting.
Electrode Rs (fi) Q(µF) Rct (kfi)
Au 281 (3 .91) 5.99 (13.59) 193 (6.51)
Au-TiO2 231 (4.74) 6.10 (9.61) 7.72 (10.21)
Au-RuO2 225 (4.28) 7.82 (16.10) 6.12 (6.68)
Au-PANI 268 (4.33) 6.74 (12.2) 15.4 (7.47)
Au-MWCNT 85.2 (4.57) 582 (20.23) 2.73 (12.84)
Au-MWCNT-P ANI-TiO2 94.8 (4.28) 1220 (12.79) 0.977 (17.78)
Au-MWCNT-P ANI-RuO2 188(4.00) 1.46 (18.67) 0.989 (14.16)
4. 7 Effects of Scan Rate
The effect of the scan rate (25 - 1000 mvs-1) on the anodic peak current was investigated for
the Au-MWCNT-PANI-TiO2 and Au-MWCNT-PANI-RuO2 modified electrodes respectively
in 0.1 M PBS (pH = 7) containing 5 mM [Fe(CN)6]4°/[Fe(CN)6]3- solution. The study was
conducted using cyclic voltammetry method and the plot of peak current (Ip) versus the
square root of scan rate (v112) , are shown in Figure 4.7. The anodic oxidation peak current is
proportional to the square root of scan rate. This plot was found to be linear in Figure 4. 7(b
and d), signifying that, at appropriate over potential, the process was diffusion-controlled
[289] with a correlation coefficient of 0.9709 and 0.9994 for Au-MWCNT-PANI-TiO2 and
Au-MWCNT-PANI-RuO2 modified electrode respectively. The potential shift due to the
oxidation increased with the scan rate, signifying the quasi-reversible character of the
electrode reaction [290], which indicates that there was some level of adsorption on the
electrode surface due to oxidation product. A linear plot for Epa vs. the log v was obtained for
Au-MWCNT-PANI-TiO2 (Figure 4.8a) and Au-MWCNT-PANI-RuO2 (Figure 4.8b)
modified electrodes in 5 mM [Fe(CN)6]4-/[Fe(CN)6]3- respectively. From the slope of the
Tafel plots (Ep vs. logo), (as shown in equation 5) the Tafel values ' b' was calculated to be 42
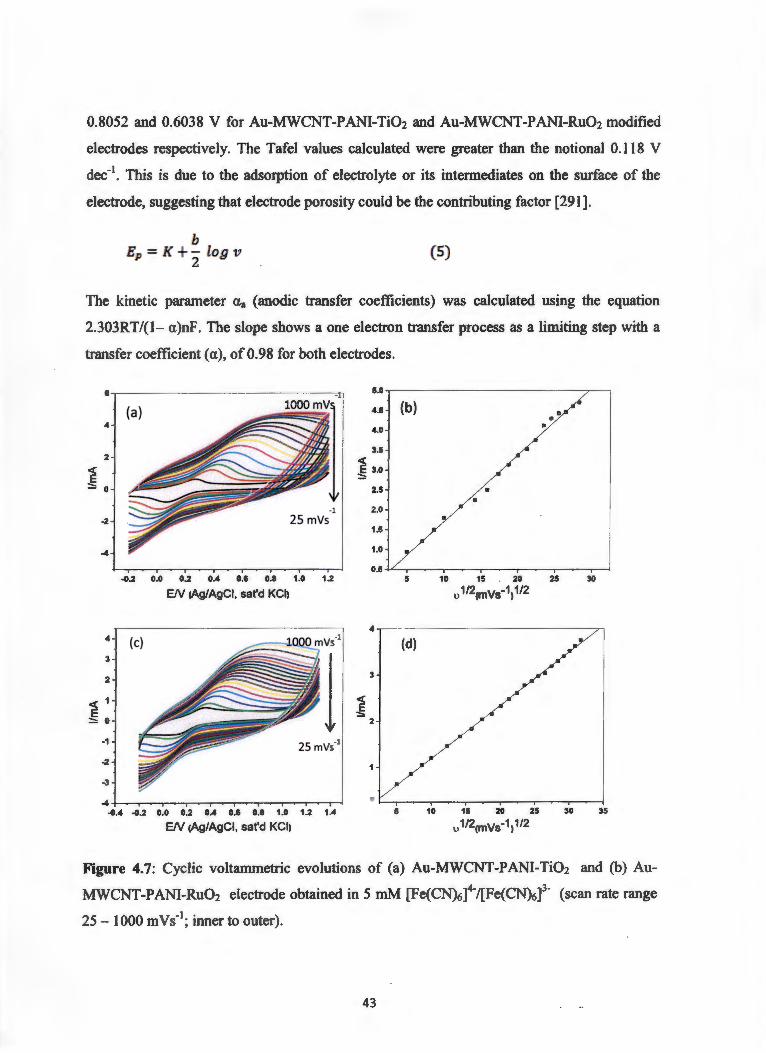
0.8052 and 0.6038 V for Au-MWCNT-PANI-TiO2 and Au-MWCNT-PANI-RuO2 modified
electrodes respectively. The Tafel values calculated were greater than the notional 0.118 V
dec·1• This is due to the adsorption of electrolyte or its intermediates on the surface of the
electrode, suggesting that electrode porosity could be the contributing factor [291] .
b - logv 2
(5)
The kinetic parameter aa ( anodic transfer coefficients) was calculated using the equation
2.303RT/(1- a)nF. The slope shows a one electron transfer process as a limiting step with a
transfer coefficient (a), of 0.98 for both electrodes.
6 -.----------------c-n
4
2
< E
::::: 0
·2
4
3
2
< 1
:§ 0
-1
-2
-3
(a) 1000 mV
· 1 25mVs
-0.2 0.0 0.2 0.4 0.6 0.8 1.0 1.2
EN (Ag/AgCI, sat'd KCh
(c)
j -4 +--,-,-...,.....,.~"T""""'-,-...,.....,.~"T""""'-,-.....--,~....--;
-0.4 -0.2 0.0 0.2 0.4 0.6 0.8 1.0 1.2 1.4
EN (Ag/AgCI, sat'd KCI)
5.0 -.-----------------,--,
4.5 (b)
4.0
3.5
< :§ 3.0
< :§
2.5
2.0
1.5
1.0
2
5
5
• • •
•
10 15 20 25 30
u 1/21mvs-1, 1/2
10 15 20 25 30 35
0 1121mvs·1, 1/2
Figure 4.7: Cyclic voltammetric evolutions of (a) Au-MWCNT-PANI-TiO2 and (b) Au
MWCNT-P ANI-RuO2 electrode obtained in 5 mM [Fe(CN)6]4"/[Fe(CN)6]3. (scan rate range
25 - 1000 mvs·1; inner to outer).
43

0.8
(a) • 0.8 (b) • • 0.7 ;I
• 0.7
0.6
> • •• > 0.6 ~o.s • -- • • w a.
• w • 0.4
. 0.5 • • •
0.3 0.4
• • 0.2 0.3
1.2 1.6 2.0 2.4 2.8 1.2 1.6 2.0 2.4 2.8 3.2
log u / Decade log u / Decade
Figure 4.8: Plots of peak potential (Ep) versus log u for (a) Au-MWCNT-PANI-TiO2 and (b)
Au-MWCNT-PANI-RuO2 in 5 mM [Fe(CN)6]4-/[Fe(CN)6]3-.
ELECTROCATALYTIC OXIDATION OF EPINEPHRINE
4.8 Electrocatalytic Oxidation of Epinephrine
Figure 4.9 shows the cyclic voltammograms for the electrocatalytic behaviour of bare Au and
Au modified electrodes towards 3>Cl 04 M EP in 0.1 M PBS solution (pH = 7) at a scan rate of
25 mVs- 1• An enhanced EP oxidation current was observed at Au-MWCNT-PANI-MO
modified electrode compared with bare Au and other electrodes investigated, signifying that
the Au-MWCNT-PANI-MO modified electrode possessed faster electron transfer kinetics
[292]. The electrochemical data due to EP oxidation at the electrodes are presented in Table
4.2. The anodic peak at 0.24 V is attributed to the epinephrine oxidation of the open-chain
quinone, and the peak at -0.17 and -1.12 V respectively are attributed to the reduction of
adrenochrome to leucoadrenochrome [293]. The modified electrode of the EP oxidation
current was almost three times greater than that of the bare electrode. The higheF current
response observed at the modified electrode evidently shows that MWCNT-P ANI-MO
modified electrode successfully enhanced electrocatalysis of EP probably due to the presence
of porous MWCNT and P ANI nanoparticles, leading to increased surface area of the
electrode, and the electrical conductive nature of the metal oxide nanoparticles [294] .
44

0.4 0.4
(a) (b)
0.2 0.2
0.0 <( <( E o.o E
::::: ::::: -0.2
-AJJ -0.2 -Au - Au-Ti02 - Au-Ru0
2 - AJJ-PANI -0.4 - Au-MWCNT - Au-PANI - Au-MWCNT-PANI-Ti0
2 - Au-MWCNT
-0.4 - Au-MWCNT-PANI-Ru02
-0.6 -0.2 0.0 0.2 0.4 0.6 0.8 -0.2 0.0 0.2 0.4 0.6 0.8
EN (Ag/AgCI, sat'd KCI) EN (Ag/AgCI, sat'd KCI)
Figure 4.9: Current response of (a) Au, TiO2, PAN!, MWCNT, MWCNT-PANI-TiO2 and (b)
Au, RuO2, PANI, MWCNT, MWCNT-PANI-RuO2 modified electrodes in 0.1 pH 7.0 PBS
containing 3 104 M EP.
Table 4.2: Cyclic voltammetric data acquired for bare and the modified electrodes in EP
3>C104 Min pH 7.0 PBS.
Electrode Ipa(mA) Epa
Au 0.003 0.231
Au-TiO2 0.002 0.318
Au-RuO2 0.003 0.275
Au-PANI 0.013 0.509
Au-MWCNT 0.17 0.205
Au MWCNT-PANI-TiO2 0.29 0.211
Au-MWCNT-P ANI-RuO2 0.40 0.241
45

4.9 Electrochemical impedance spectroscopy
The impedance spectral information recorded for bare Au, Au-TiO2, Au-RuO2, Au-P ANl,
Au-MWCNT, Au-MWCNT-PANl-MO (in the form of Nyquist plots) in 0.1 M PBS
containing 3x10⁴ M EP at potential of 0.22 V with the range from 100 KHz to 0.1 Hz are
presented in Figure 4.10. The Nyquist plot comprised of a semi-circular portion and a linear
portion. The semicircular section relates to the charge transfer limited process and its
diameter is equivalent to the charge transfer resistance (R:1}, which determines the electron
transfer kinetics, whereas, linear part of the plot at lower frequencies relates to the mass
diffusion limited process [295]. The value broadly differs based on the modification of the
electrode surfaces. To determine the Rc1 values, the impedance values were fitted to Randles
equivalent circuit due to the features of the obtained impedance spectrum. The modification
of MWCNT on the Au electrode, responded with a higher diameter of semicircle (R:1 = 11.0
Kn) due to the surface fouling activity. The ~ value for the Au-MWCNT-PANI-TiO2
electrode (3.27 Kn) and Au-MWCNT-PANI-RuO2 electrode (5.20 Kn) in EP are lower
compared with other investigated electrodes as reported in Table 4.3. Therefore, Au
MWCNT-PANI-TiO2 electrode proved to have a lower charge-transfer resistance, indicating
remarkable enhancement of the catalytic reaction and electron transfer [296].
46

C -~ :--N
-
50
.co
30
20
10
11
•
.!!e Ct C
•• • -• =a a. I
• I
(a) ... 50 (b) ... ... ... ... ...
... ... ... ...
• 40 • • ... • • ... • • • • • ... • ... • • • • ~c 30 • ... • ... • • • • • ~ • • ... • ...
•• :-- • ..... N • ... . ... 20 -· Au • Au • • Au-Ru02 • Au-Tio, •
10 " Au-PANI • " Au-PANI Au-MWCNT • Au-MWCNT • ♦ Au-MWCNT-PANI-RuO,
♦ Au-MWCNT-PANI-Ti02 0
20 .co 60 BO 100 0 20 40 60 80 100
Z'/K1n Z'/K1n
--------------~• ao~-------------~10
(c) • •• • •• . .. ..
• ♦ •• •• •
j( • • •
nm;m,;::.
. ,,, " .-.tJD, • afl'MI ■ MIIIICNf I
t. ·.• NIIWClll'-4tMJ.'ID, •• • • • • • • I • • ♦ • I • ·-·~ · •• • •
Ii I I 11111111
2
I t 2 I .. I
bg (f / Hz)
•
70
C) 80 4l
~ 50 4l c, 40 C a,
~ 30 a,
[ 20 I
10
0
(d)
-1 0
A Au ♦ Au-RuO, I Au-PANI ■ Au-MWCNT ■ Au-MWCNT-PANI-RuO,
•
1 2 3 .4 5
log (f / Hz)
8
2
Figure 4.10: Nyquist plots obtained for (a) Au, TiO2, PANI, MWCNT, MWCNT-PANI-TiO2
and (b) Au, RuO2, PANI, MWCNT, MWCNT-PANI-RuO2 in 0.IM pH 7.0 PBS containing
3 >C l 0-4 M of EP solutions at a fixed potential of 0.22 V (vs AgJAgCI, sat' d KCI). ( c) Au,
TiO2, PANI, MWCNT, MWCNT-PANI-TiO2 and (d) Au, RuO2, PANI, MWCNT, MWCNT
p ANI-RuO2 respectively are the Bodes plots obtained in EP showing the plots of -phase angle
/ deg. vs log (f / Hz), and the plot of log JZ / QJ vs log (f /Hz) (e) denotes the circuit used in
the fitting of the EIS data in (a) and (b).
47

From the Bode plots of -phase angle vs. log (f / Hz) for the electrodes (Figs. 10 c and d),
except for Au-MWCNT, Au-MWCNT-PANI-TiO2, and Au-MWCNT-PANI-RuO2, all the
electrodes presented a phase angle greater than -60°, but less than -90° expected for ideal
capacitive behaviour indicating pseudocapacitive behaviour of the electrodes towards EP
electrocatalytic oxidation. Au-MWCNT-PANI-TiO2 and Au-MWCNT-P ANI-RuO2
electrodes demonstrated much lower phase angles (less than 10°) in EP. This showed that the
two composite modified electrodes are less capacitive, and transported EP oxidation current
faster than other electrodes in the analyte. This result agreed with high current recorded
under the CV experiment, and the low Re, values. The lower capacitance, enhanced electron
transport and catalytic behaviour of this electrode can be ascribed to the conductive nature of
the MWCNT and RuO2 and the synergic effect contributed by the two nanoparticles. Since
Au-MWCNT-PANI-TiO2 and Au-MWCNT-PANI-RuO2 electrodes exhibited the best
performance in this study, further studies were carried out using the two electrodes.
Table 4.3: EIS data acquired for bare and modified electrodes in EP 3>< 10-4 M in pH 7.0
PBS. Values in parenthesis are percentage errors of the data fitting.
Electrode Rs (kn) Q(µF) Re, (k!l)
Au 0.30 (3.16) 4.49 (5.33) 102 (5.86)
Au-TiO2 0.28 (1.97) 9.05 (3.62) 85.9 (5.44)
Au-RuO2 0.36 (7.53) 62.5 (15.94) 110 (6.56)
Au-PANI 4.38 (1.79) 6.72 (5.42) 134 (5.42)
Au-MWCNT 0.16 (1.79) 38.2 (3.26) 11.0 (14.63)
Au-MWCNT-P ANI-TiO2 3.10 (1.91) 0.136 (6.64) 3.27 (20.78)
Au-MWCNT-P ANI-RuO2 4.87 (10.53) 0.545 (20.40) 5.20 (8.28)
48

4.10 Stability Study
The stability of MWCNT-PANI-TiO2 and MWCNT-PANI-RuO2 sensor towards EP
determination was observed by measuring the current response (20 scans) at constant
concentration of EP (3 x l0-4 M) in pH 7.0 PBS (Figure 4.11). After 20 scans, Au-MWCNT
p ANI-TiO2 and Au-MWCNT-P ANI-RuO2 electrodes comparatively showed a low drop in
current from the first scan to the second scan and this slight decrease was obtained with the
relative standard deviation (R.S.D.) of 4.4 % and 3.6 % respectively, indicating that the
modified electrodes possesses efficient stability for the determination of EP. This further
confirms that the modified electrodes have efficient reproducibility and strong ability to avoid
fouling of the electrode due to the oxidation product. The adsorptive nature of the electrodes
towards EP can be assigned to the porous MWCNT in the composite [297]. The Au
MWCNT-P ANI-RuO2 electrode performs better toward the analyte compared with Au
MWCNT-PANI-TiO2 electrode. After experiment, the modified electrodes were kept at 4 °C
in the refrigerator. The EP oxidation peak current reduced by 6.8 %, and 6.0 % for Au
MWCNT-PANI-TiO2 and Au-MWCNT-PANI-RuO2 electrodes respectively after three days.
The above results indicate that the stability of the sensor was satisfactory for the
determination of EP.
0.3 0.4 st st th
(a) 1 scan (b) 1 scan 20 scan 0.2
0.2
0.1 <( <(
E E o.o .... ::::: - 0.0
-4.2 -4.1
-4.2 -4.4
-4.2 0.0 0.2 0.4 0.6 0.8 -4.2 0.0 0.2 0.4 0.6 0.8 EN (Ag/AgCI, sat'd KCl1 EN (Ag/AgCI, sat'd KCIJ
Figure 4.11: Current response (20 scans) of (a) Au-MWCNT-PANI-TiO2 and (b) Au
MWCNT-PANI-RuO2 in pH 7.0 PBS containing 3}(10-4 M ofEP at scan rate of 25 mVs- 1•
49

4.11 The Effect of Scan Rate
The effect of scan rate on the peak current due to oxidation of EP was explored at the surface
of MWCNT-PANI-TiO2 and MWCNT-PANI-RuO2 electrodes at a constant concentration of
3x10⁴ M EP using cyclic voltammetry in Figure 4.12 (a-d). The anodic current for both
electrode composites increased with the increasing scan rate (25 to 300 mvs-1) . Figure 4.12(b
and d) showed linear graphs of peak current versus square root of scan rate (Ip vs v112), with a
correlation factor R2 = 0.9872, and R2 = 0.9986 for MWCNT-PANI-TiO2 and MWCNT
p ANI-RuO2 electrodes respectively. The linear plot between peak currents and square root of
scan rates symbolise that the oxidation currents were diffusion controlled, which clarifies the
quantitative measurements. These occurrences might be due to the rates of adsorption of Ep
on the electrode surface being slower than the diffusion rates in that scan rate range [298].
The plot of Ip vs v112 was used to estimate the surface coverage of the electrode by adopting
the method used by Sharp et al [299] . Therefore the must be a relationship between the peak
current and the surface concentration of electroactive species, r , using the following equation
(6) below;
n2f2AI'v Ip =-4-RT-- (6)
where the number of electron transfer is n, the geometric surface area of the electrode (A) is
(0.0629 cm2), r the surface coverage (mol cm-2), v is the scan rate, and T, R, and F are the
absolute temperature, molar gas constant, and Faraday constant, respectively. The calculated
surface concentration of MWCNT-PANI-TiO2 and MWCNT-PANI-RuO2 in EP were
6.41 )C 10-s mol cm-2 and 7 .11 )C 10-s mol cm-2 respectively. The Tafel values were obtained
using equation (5), where Ep was plotted against log v in Figure 4.13, the Tafel ' b' values
were estimated to be 0.448 V and 0.422 V. This is due to the adsorption of EP or its
intermediates on the surface of the electrode, suggesting that electrode porosity could be the
contributing factor [291]. The slope shows a one electron transfer process as a limiting step
assuming a transfer coefficient ( a), of 0.99 for both electrodes.
so

1.5
1.0
<( 0.5
E :::::
0.0
-0.5
-1.0
1.6
1.2
0.8
<( 0.4
E ::::: 0.0
-0.4
-0.8
-1 .2
-0.2
-0.2
0.0 0.2 U 0.6
EN (Ag/AgCI, sat'd KCI)
0.0 0.2 0.4 0.6
EN (Ag/AgCI, sat'd KCI)
300mvs·
0.8
0.8
0.45 (b) •
0.40
0.35 <( E
::::, 0.30
0.25
0.20
1.6
u
1.2
11.0 :::::
0.8
0.6
0.4
• •
•
U 1.6 1.8 2.0 2.2 2.4 2.6
0 1 /2(mVs-1) 1/2
(d)
0.2 +-.....-,,.........--.-~-r-~-r-.....-,,.........--r-~...,........., 4 6 8 10 12 14 16 18
0 1/2(mVs-1) 1/2
Figure 4.12: Cyclic voltammetric evolutions of (a) Au-MWCNT-PANI-TiO2 and (c) Au
MWCNT-PANI-RuO2 modified electrodes at scan rate (25 - 300 mVs"1) respectively in pH
7.0 PBS containing 3>C l0-4 M of EP. (b,d) are peak current vs. square root of scan rate plots
for Au-MWCNT-PANI-TiO2 and Au-MWCNT-P ANI-RuO2•
51

0.50 u (a) (b) • • 1.2 0.45
1.0 • >OAO
> 0.8 ---- C. C. W 0.35 • W 0.6 • •
0.4 • 0.30 • 0.2
0.25 • 0.0
4 6 8 10 12 14 16 18 u 1.6 u 2.0 2.2 2.4 2.6 log u / Decade log u / Decade
Figure 4.13: Plots of peak potential (Ep) versus log u of (a) Au-MWCNT-P ANI-TiO2 and
(b) Au-MWCNT-PANI-RuO2 in pH 7.0 PBS containing 3>C 10-4 M ofEP.
4.12 Concentration Study
Figure 4.14(a) illustrates the DPV results at different concentrations of EP at the Au
MWCNT-PANI-TiO2. It can be seen that the modified gold electrodes improve the sensitivity
towards EP detection. The EP concentration range from 4.9-76.9 µM . The results obtained
indicated that the oxidation peak currents increased with the increase of the concentrations of
EP. This shows the proportionality of the EP current with EP concentration, with the linear
regression equation as : Ip (µA) = 79.122 [EP] (µM) + 122.58. The plots showed good
linearity, with a correlation coefficient of 0.969 and the detection limit of 0.16 µM . The LOD
was calculated using the following equation, LOD = 3.3 SIM where, S is the standard
deviation and Mis the slope (sensitivity) obtained from the calibration curves [300].
It is well known that peak current depends on the concentration of analyte; hence, DPV was
recorded for various concentration of EP in phosphate buffer of pH 7.0 using Au-MWCNT
PANI-RuO2 electrode is shown in Figure 4.14(b). A linear increase in peak current was
observed with increase in concentration of EP in the range 4.9-76.9 µM . The oxidation
current of EP was proportional to the concentration of EP, following the linear regression
equation given in graph below. The plots showed good linearity, with a correlation coefficient
of0.9758, and the detection limit of 0.18 µM .
52

128
127 (a)
126
125
l 124
123
122
121
120 --0.1 0.0 0.1 0.2 0.3
EN (Ag/AgCI, sat'd KCI)
365
360
355
350
1345 :::::
340
335
330
325 --0.2 0.0 0.2 0.4 0.6 0.8
EN (Ag/AgCI, sat'd KCI)
128 (c)
127
126
l 125
124
123
•
0.00 0.01 0.02 0.03 0.04 0.05 0.06 0.07
[EP]/µM
362 (d)
361
1360 :::.
359 •
358 •
0.00 0.05 0.10 0.15 0.20 0.25 0.30 0.35
[EP)/µM uo
Figure 4.14: Differential pulse voltammogram (DPV) of (a) Au-MWCNT-PANI-TiO2 and
(b) Au-MWCNT-PANI-RuO2 electrode in (a) pH 7.0 PBS containing different concentrations
of EP (4.9, 18.7, 27.3, 50.0, 56.8, 63.2, 76.9 µM; from inner to outer) and (b,d) are peak
current vs. concentration of EP plots using MWCNT-PANI-TiO2 and MWCNT-PANI-RuO2
electrodes respectively.
53

4.13 Interference Study: Determination of EP in the Presence of AA
The main purpose of this study was to establish a modified electrode that is suitable to
separate the electrochemical response of EP and ST under the influence of foreign species
such as AA. Thus, square wave voltammetry was used to determine EP (3 x 10⁻⁶ M), ST (3 x 10-
6 M), and AA (AA 1x10⁻¹ M) simultaneously. The experiment was carried out at different
concentrations of EP and ST in the presence of constant concentration of AA in PBS pH 7 .0
as shown in Figure 4.15. The use of Au-MWCNT-PANI-TiO2 and Au-MWCNT-PANI-RuO2
electrodes for the determination of EP, ST, and AA simultaneously was concurrently. Figure
4.15(a) showed three distinctive anodic peaks at potentials of 0.002, 0.222, 0.568 V relating
to AA, EP and ST respectively for Au-MWCNT-PANI-TiO2 electrode, while in Figure
4.1 5(b) the observed three peaks for Au-MWCNT-PANI-RuO2 at potentials of -0.071, 0.227
and 0.521 V for AA, EP and ST respectively, confirming the successful simultaneous
determination of the biomolecules on the electrode. In the biological fluids normally AA
concentration is greater than other biological constituents. Hence, we have studied the
sensitivity of the developed nanocomposite modified electrode towards EP and ST in the
presence of large amounts of AA. The three analytes peaks were separately visible without
any signal interference from one another. Thus, Au-MWCNT-PANI-TiO2 and Au-MWCNT
p ANI-RuO2 nanocomposite electrodes could potentially be used for electrochemical sensing
of these biomolecules in samples.
EP 0.305 0.35 EP
0.300
0.34 0.295 AA
~ ~ E E o.33 ::::: 0.290
:::::
0.32 0.285
0.280 0.31
0.275 --0.4 --0.2 0.0 0.2 0.4 0.6 0.8 --0.2 0.0 0.2 0.4 0.6
EN (Ag/AgCI, sat'd KCI) EN (Ag/AgCI, sat'd KCI)
Figure 4.15: Square Wave Voltammetry of (a) Au-MWCNT-PANI-TiO2 and (b) Au
MWCNT-PANI-RuO2 in pH 7.0 PBS containing AA t x10-1 Mand (EP and ST) 3x l0-6 M
solutions respectively.
54

4.14 Real Sample Analysis
Analytical performance of this sensor was investigated for the determination of EP in
epinephrine injection. One microliter epinephrine injection solution was diluted 250 times
with 0.1 M PBS at pH 7.0 without any other pretreatment. Table 4.4, shows the results of the
percentage recovery test and relative standard deviation. The EP concentration in the injection
solution was found to be 4.02, and 4.13 mg/mL (n = 3) and recovery was more than 99 % for
Au-MWCNT-PANI-TiO2 and Au-MWCNT-PANI-RuO2 modified electrode respectively.
Table 4.4: Results of detection of EP in epinephrine injection (n = 3)
Electrode Sample Added Detected Recovery RSD% (mg/ml) (mg/ml) %
Au-MWCNT-P ANI-TiO2 A 4 3.98 99.5 0.25
B 4 4.02 100.4 0.13
C 4 4.05 101.3 0.14
Au-MWCNT-P ANI-RuO2 A 4 4.10 102.5 0.24
B 4 4.13 103.3 0.17
C 4 4.13 103.3 0.14
55

ELECTROCATALYTIC OXIDATION OF SEROTONIN
4.15 Electrochemical Characterisation
Figure 4.16 shows the CVs of the electrocatalytic behaviour of bare Au and Au modified
electrodes towards Serotonin (ST) oxidation in 0.1 M PBS solution (pH = 7.0) at a scan rate
of 25 mVs - i , while Table 4.5 presents the electrochemical data obtained from the CVs. The
ST oxidation current of the modified electrode was almost three times higher than the bare Au
electrode. It can be seen that the shift at the high current response for the oxidation of ST at
the modified electrode proves that MWCNT-PANI-MO modified electrode successfully
electrocatalyzes the oxidation of ST. Figure 4.16(a and b) showed a broad oxidation peak and
ill-defined reduction peaks at the Au-MCNT-PANI-MO. Such reflection is due to the
distinctive structure of MWCNT with enhanced surface area and conductivity. The MWCNT
PANI-TiO2 and MWCNT-PANI-RuO2 electrodes shows typical two pairs of redox peaks
(A1/B1 and A2/B2) as indicated in Figure 4.16. The first pair of peaks A 1/B 1 is attributed to the
redox transition from the leucoemeraldine form to polaronic emeraldine of P ANI. The
second pair of peaks A2/B2 resembles the Faradaic transformation of emeraldine/
pemigraniline characteristics of PANI [301-302). The CV plot of the MWCNT-PANI-MO
electrode have a different shape from P ANI and MWCNT with a larger bounded area, which
shows that MWCNT-PANI-MO electrode displays an important synergistic effect which
occur between the PANI layer and MWCNT-MO network [303). After background current
subtraction as shown Figure 4.16( c and d), ST oxidation current at the electrodes follow the
order: Au-MWCNT-PANI-RuO2 (0.118 mA) > Au-MWCNT-PANI-TiO2 (0.132 mA) > Au
MWCNT (0.051 mA) > Au-PANI (0.0036 mA) > Au-TiO2 (0.0038 mA) > Au-RuO2 (0.0045
mA) > Au (0.011 mA) respectively which is approximately three times their oxidation current
at the bare Au electrode signifying the importance of chemically modified electrodes in
electrocatalysis. Similar factors such as presence of porous MWCNT and P ANI, increase
electrode surface area and the electrical conductive nature of the metal oxide nanoparticles
could be responsible for the improved response of the analyte at the electrode [304).
56

-Au 0.3 - Au-Ti0
2
- Au-PANI - Au-MWCNT
0.2 - Au-MWCNT-PANI-Ti02
A
< 0.1
E :::::
0.0
-0.1
-0.2
-0.2 0.0 0.2 0.4 0.6
EN (Ag/AgCI, sat'd KCI)
< E
0.20 -Au - Au-Ti0
2
- Au-PANI 0.15 - Au-MWCNT
- Au-MWCNT-PANI-Ti02
0.10
::::: 0.05
0.00
-0.05
(a)
0.8
(c)
-0.10 +---.-~----.-~-.--~-.--r---r~-.----< -0.2 0.0 0.2 0.4 0.6 0.8
EN (Ag/AgCI, sat'd KCI)
0.6 ....----------------,
0.4
0.2
< E o.o :::::
-0.2
-0.4
(b)
-Au - Au-Ru0
2
- Au-PANI - Au-MWCNT - Au-MWCNT-PANI-Ru0
2 -0.6 -1----rl-~--.---,,.......::::;:::::::::;::::::::::;::=;:::::::;::::=:;;:::::::::::::~
0.20
0.15
0.10
< E ::::: 0.05
0.00
-0.05
-0.2 0.0 0.2 0.4 0.6 0.8
EN (Ag/AgCI, sat'd KCI)
-Au - Au-Rua,
(d)
- Au-PANI - Au-MWCNT - Au-MWCNT-PANI-Ru0
2
-0.10 +---.--~~~--.-~ -.--~-.---.--r-~ -0.2 0.0 0.2 0.4 0.6 0.8
EN (Ag/AgCI, sat'd KCI)
Figure 4.16: Current responses of (a) Au, Ti02, PANI, MWCNT, MWCNT-PANI-Ti02 and
(b) Au, Ru02, PANI, MWCNT, MWCNT-PANI-Ru02 modified electrodes in 3x10⁻⁴ MST
in pH 7.0 PBS (scan rate = 25 mVs-1 ); (c) and (d) are the current responses of MWCNT
PANI-MO modified electrodes in 3xI0-4 MST (after background current).
57

Table 4.5: Cyclic voltammetric data obtained for bare and the modified electrodes in ST
3>Cl 04 Min pH 7.0 PBS.
Electrode lpa(mA) Epa
Au 0.002 0378
Au-TiO2 0.004 0.338
Au-RuO2 0.005 0.338
Au-PANI 0.005 0.432
Au-MWCNT 0.165 0.387
Au MWCNT-PANI-TiO2 0.177 0.378
Au-MWCNT-P ANI-RuO2 0.33 0.442 -
4.16 Electrochemical impedance spectroscopy
Figure 4.17 shows the impedance spectra for bare Au, Au-TiO2, Au-RuO2, Au-PANI, Au
MWCNT, Au-MWCNT-PANI-MO (in the form of Nyquist plots) in 0.1 PBS containing
3x 10⁴ M ST as a redox probe at the initial potential of 0.38 V with the frequency range from
100 KHz to 0.1 Hz while the circuit model used in the fitting of the impedance data is
represented in Figure 4.17(e). The Nyquist plot consist of semicircle diameters which reflect
the electron transfer resistance {R:1), which is associated with the electron transfer kinetics of
the redox probe at the surface of the electrode. From the plot and Table 4.6, it can be seen that
the values of Rc1 on Au-MWCNT-PANI-MO are smaller than other electrodes observed, due
to the outstanding electrical property of MWCNT that formed a high electron conduction
pathway between the electrode and electroactive indicator. The impedance interface indicates
that metal oxide integrated with MWCNTs could successfully increase the electron transfer
rate between the electrode surface and ST due to the good conductivity of MWCNT-MO. The
electron transfer resistances of Au-MWCNT-PANI-TiO2 (2.19 kn) and Au-MWCNT-PANI
RuO2 (0.17 kn) modified electrodes are much lower than that of bare electrode, due to the
materials-modified on the surface of the electrode partially block the electron transfer of ST
solution to the electrode [305]. Therefore, Au-MWCNT-PANI-RuO2 electrode proved to
58

have a lower charge-transfer resistance, indicating exceptional improvement of the catalytic
reaction and electron transfer [296] thus, the higher ST oxidation current recorded for its CV
in Table 4.5. Figure 4.l 7(c and d) show the Bode plots charge transfer resistance towards the
modified electrodes which possess a phase angle lower than -9011• Au-MWCNT-PANI-TiO2
and Au-MWCNT-PANI-RuO2 modified electrodes showed a much lower phase angle of less
than 2011 compared with other electrodes studied. Furthermore the results confirm the R:1
values which clarifies that there was fast charge transfer development at Au-MWCNT-PANI
MO electrode. Hence the higher the conductive or charge transfer properties of the sensor
[306].
59

140
120
100
C: 80 -~ =- 60 N
40
20
• Au ■ Au-TiO
2
• Au-PANI • Au-MWCNT ♦ Au-MWCNT-PANI-TiO •
,~------~
0 -1"-~-.-~--.-~---.-~----.~~..---+a...L.,---1 0 20 40 60 80 100 120 140
Z'/K1n
80 ~ --------;:======:::;, 10
70
o, 60 Q)
'O
- 50 Q)
g, 40 Ill
~ 30 Ill ..c Cl. 20
I
10
0
•
-1
(c) • I\JJ
8
2
0 1 2 3 4 5
log(f / Hz)
•
120 T_-=..-=..-=..--:....-_-_-_-_-_-_-_-_- _- _-------
100
80
C: ~ 60
:N 40
70
~ 30 Ill
[ 20 I
10
0
Q
• Au ■ Au-RuO, • Au-PANI T Au-MWCNT ♦ Au-MWCNT-PANI-RuO
2
100 120
,--------====== 10 • 1w
(d) • AJJ-RuO,
•• ◄ Au-PANI ...... , t AIJ.MWCNT .. .......... ~.• ··. F .-. ■ Au-MWCNT-PANI-RuO,
·""" .. ◄ :t.. ...._ _____ _,, • • ◄ • • : ◄ •• .. ◄ •
•• •• • ◄ • . ~ . ◄' . •• ◄ • • • •• •
8
6 C: ..... N
Cl 4 .2
◄◄◄
2
-1 0 1 2 3 4 5
log (f / Hz)
Figure 4.17: Nyquist plots obtained for (a) Au, TiO2, PANI, MWCNT and MWCNT-PANI
TiO2 (b) Au, RuO2, PANI, MWCNT and MWCNT-PANI-RuO2 in 0.1 M PBS pH 7.0
containing 3:Xl 0-4 M of ST solutions at a fixed potential of 0.8 V (vs AgJAgCl, sat' d KCI). ( c)
and (d) are the Bode plots obtained for Au-MWCNT-PANI-TiO2 and MWCNT-PANI-RuO2
in ST respectively showing the plots of -phase angle / deg. vs log (f / Hz), and the plot of log
IZ I 01 vs log (f /Hz) (e) represents the circuit used in the fitting for the EIS data in (a) and
(b).
60

Table 4.6: EIS data obtained for bare and modified electrodes in ST 3>C l0-4 M in pH 7.0
PBS. Values in parenthesis are percentage errors of the data fitting.
Electrode Rs(k.O) Q(JIF) Rct(k.O)
Au 0.45 (2.23) 4.31 (3.49) 275 (7.29)
Au-TiO2 0.41 (2.30) 3.48 (3.24) 555 (10.75)
Au-RuO2 426 (8.30) 134 (14.52) 11.9 (18.4)
Au-PANI 0.45 (2.20) 4.47 (3.24) 128 (10.73)
Au-MWCNT 0.064 (3.30) 8800 (10.98) 3.21 (29.38)
Au-MWCNT-PANI-TiO2 1.49 (2.56) 289 (6.89) 2.19 (14.01)
Au-MWCNT-P ANI-RuO2 0.055 (8.54) 1590 (23 .29) 0.17 (16.54)
4.17 Stability Study
Figure 4.18 shows the stability of the Au-MWCNT-PANI-TiO2 and MWCNT-PANI-RuO2
modified electrodes towards ST by running the electrode (20 scans) in 3>< 10-4 M ST solution
at a scan rate of 25 mvs·1• Both electrodes displayed measurable oxidation peaks in
supporting electrolyte. Au-MWCNT-PANI-TiO2 and Au-MWCNT-PANI-RuO2 electrodes
moderately displayed a low drop from the first scan to the second scan and this minimal
decrease was observed with the relative standard deviation (R.S.D.) of 10 % and 6.6 % for
modified electrodes Au-MWCNT-PANI-TiO2 and Au-MWCNT-PANI-RuO2 respectively,
indicating that the modified sensors hold excellent stability for the determination of ST. The
modified electrodes possess outstanding reproducibility and robust ability to prevent the
electrode from fouling by the oxidation product. The electrode' s adsorption nature towards
the ST can be ascribed to the porous MWCNT in the composite [297]. This study shows that
Au-MWCNT-PANI-RuO2 electrode performs better toward the analyte compared with Au
MWCNT-PANI-TiO2 electrode. After measurements, the modified electrode was stored at 4
°C in the freezer. After three days, the respective decrease in peak current intensity of 12.4 %,
61

and 8.2 % for Au-MWCNT-PANI-TiO2 and Au-MWCNT-PANI-RuO2 electrodes
respectively. The above results showed that the stability of the sensor was good and
appreciable for the determination of ST.
0.3 (a)
0.2
~ 0.1
E ::::
0.0
--0.1
--0.2
--0.2 0.0 0.2 0.4 0.6 0.8
EN (Ag/AgCI, sat'd KCI)
0.
0 .
~ 0 . E ::::
• 0 2
· 0 4
-0.2 0.0 0.2 0 . 4 0 . 6 0 . 8
E/V (Ag/AgCI, sa
Figure 4.18: Current response (20 scans) of (a) Au-MWCNT-PANI-TiO2 and (b) Au
MWCNT-PANI-RuO2 in pH 7.0 PBS containing 3X l0-4M of ST at scan rate of25 mVs- 1•
4.18 The Effect of Scan Rate
The effect of scan rate on the anodic peak current of ST was studied on the surface of
electrodes modified with Au-MWCNT-PANI-TiO2 and Au-MWCNT-PANI-RuO2 at a
constant concentration of ST (3x10⁻⁴ M) as shown in Figure 4.19 (a,d) using cyclic
voltammetry. The anodic current for both composites increased with the increasing scan rate
(25 to 300 mVs.1) for Au-MWCNT-PANI-TiO2 and (25-200 mVs.1
) for Au-MWCNT-PANI
RuO2. Figure 4.19 (b,d) shows a linear graph with a correlation factor of R2 = 0.9883 and R2
= 0.9719 for Au-MWCNT-PANI-TiO2 and Au-MWCNT-PANI-RuO2 respectively acquired
for peak current versus square root of scan rate. These indicate that peak currents are
proportional to the square root of scan rates, symbolising that the oxidation currents were
diffusion controlled [298]. The plot of Ip vs u112 was used to estimate the surface coverage of
the electrode by adopting the method used by Sharp et al [299]. Therefore, the relationship
between the peak current and the surface concentration of electroactive species, r , is
62

expressed by Equation (6). The calculated surface concentration of MWCNT-PANI-TiO2 and
MWCNT-PANI-RuO2 in ST were 5.04 X O mol cm-2 and 8.1 6): 10◄ mol cm-2
respectively. This provides evidence from the value calculated for the modified electrodes
surface concentration of electroactive species. The Au-MWCNT-PANI-RuO2 electrode has a
value which is higher than the Au-MWCNT-PANI-TiO2 electrode. This further confirms the
higher anodic current for the Au-MWCNT-PANI-RuO2 as shown in Figure 4.19b and Table
4.5 . A positive shift was observed with increasing scan rate, signifying that the electron
transfer is irreversible. The Tafel ' b' values were calculated to be 0.452 V and 0.445 V from
the slope for Ep vs log u for Au-MWCNT-PANI-TiO2 and Au-MWCNT-PANI-RuO2
modified electrodes respectively as shown in Figure 4.20. High Tafel values can be associated
with electrode fouling by oxidation product. Therefore, the porosity of the electrode affected
the adsorption nature towards ST [297]. The slope shows a one electron transfer process as a
limiting step assuming a transfer coefficient a, of 0.99 for both electrodes.
63

1.0 (a) 1.0 (b)
0.5 0.8
<( <( 0.6 E o.o E
::::: ::::: 25 mvs·l 0.4
-0.5
0.2
-1.0
0.0 -0.2 0.0 0.2 0.4 0.6 0.8 4 6 8 10 12 14 16 18
EN (Ag/AgCI, sat'd KCI) u 112(mvs·1
) 112
1.5
1.2 (d)
1.0
1.0 0.5
<( 0.8 ~ 0.0 <(
E :::::
-0.5 0.6
-1.0 0.4
-1.5 -0.2 0.0 0.2 0.4 0.6 0.8 6 8 10 12 14
EN (Ag/AgCI, sat'd KCI) u 112(mvs·1)
112
Figure 4.19: Cyclic voltammetric evolutions for (a) Au-MWCNT-PANI-TiO2 and (b) Au
MWCNT-PANI-RuO2 modified electrodes at scan rate (25 - 300 mVs.1) and (25 - 200
mVs.1) respectively in pH 7.0 PBS containing 3>C 10-4 M of ST. (b) and (d) are peak current
vs. square root of scan rate plots of Au-MWCNT-PANI-TiO2 and Au-MWCNT-PANI-RuO2.
64

0.65 0.65
(b) 0.60
0.60
0.55
> > 0.55 -- --~ 0.50 a. w
0.50 0.45
0.40 0.45
0.35 1.4 1.6 1.8 2.0 2.2 2.4 2.6
G.40 · 1.4 1.6 1.8 2.0 2.2 2.4
log u / Decade logu / Decade
Figure 4.20: Plots of peak potential (Ep) versus log u of (a) Au-MWCNT-PANI-TiO2 and (b)
Au-MWCNT-PANI-RuO2 in pH 7.0 PBS containing 3><104 M of ST.
4.19 Concentration Study
Figure 4.21 shows that square wave voltammetry (SQW) has the effect of increasing the
sensitivity and improving the characteristics for analytical applications. The plot of current
response versus concentration showed a linear range of 0.14-1.5 µM with a calibration
equation oflp (µA)= 56.524 [ST] (µM) + 198.3 (R2 = 0.9928) and Ip (µA)= 9.627 [ST] (µM)
+ 323.8 (R2 = 0.9906) for Au-MWCNT-PANI-TiO2 and Au-MWCNT-PANI-RuO2 modified
electrode respectively. The limit of detection was calculated to be 0.26 and 0.32 µM for Au
MWCNT-PANI-TiO2 and Au-MWCNT-PANI-RuO2 modified electrode respectively. The
limits of detection of the electrodes were in line with values reported in literature toward
serotonin detection [307-308]. The analyte concentration level in biological fluids is present
at micromolar levels. Hence 0.26 and 0.32 µM limit of detection for Au-MWCNT-PANI
TiO2 and Au-MWCNT-PANI-RuO2 obtained in the study indicating that the fabricated sensor
could be suitable for the modification of ultra-microelectrodes for in vivo detection of
serotonin [309].
65

1201 ::::
198
(a) 195+--~---.---.-------,,--~---.---~-
208 ....------------~
206
1204 ::::
202
200
(b) 198 +--,--,-...,........,,----,---.--T"""T"~.,..........-,-....-,--,.-~
0.1 0.2 0.3 0.4 0.5 0.0 0.2 0.4 0.6 0.8 1.0 1.2 U 1.6
340
330
1320 ::::
310
300
-0.2
EN {Ag/AgCI, sat'd KCI)
0.0 0.2 0.4 0.6
EN {Ag/AgCI, sat'd KCI)
[STI/µM
336
33-4
332
1330 ::::
328
326
(d) 324
0.0 0.2 0.4 0.6 0.8 1.0 1.2 1.•
[ST]/µM
Figure 4.21: Square Wave Voltammogram of (a) Au-MWCNT-PANI-TiO2 and (b) Au
MWCNT-PANI-RuO2 electrode in (a) pH 7.0 PBS containing different concentrations of ST
(0.14, 0.27, 0.69, 0.86, 1.00, 1.13 1.24 1.33 1.50 µM ; from inner to outer) and (b,d) are peak
current vs. concentration of ST plots using MWCNT-PANI-TiO2 and MWCNT-PANI-RuO2
electrodes respectively.
66

CHAPTER FIVE
CONCLUSIONS
67

CONCLUSIONS
This work described the successful modification of Au electrode with P ANI, MWCNT, TiO2
and RuO2 nanoparticles. Au-MWCNT-PANI-TiO2 and Au-MWCNT-PANI-RuO2
nanocomposite modified electrode were also developed and characterized using different
spectroscopic techniques. Au-MWCNT-PANI-TiO2 and Au-MWCNT-PANI-RuO2 electrodes
proved to have fast electron transport and better catalytic behaviour towards epinephrine and
serotonin oxidation compared with other electrodes studied. Electrochemical impedance
spectroscopy results showed a low charge transfer resistance of 3.27, 321 kn (EP, ST) and
5.20, 0.17 kn (EP, ST) for the analyte using Au-MWCNT-PANI-TiO2 and Au-MWCNT
PANI-RuO2 respectively, which confirms the reproducibility of the cyclic voltammetry on the
electrode. The comparative study between the two electrodes has shown that Au-MWCNT
P ANI-RuO2 gave the best current response, because RuO2 and MWCNT improved the
electrochemical properties of the electrode. Electrocatalytic oxidation of epinephrine and
serotonin on the Au-MWCNT-PANI-MO electrodes were diffusion controlled. This was
through adsorption on the analytes on the surface of the electrode. A good stability was
observed after cleaning and reusing the electrode. There was a current drop of less than 15 %.
The electrode showed good resistance to electrode poisoning, and Au-MWCNT-PAINI-RuO2
gave the best limit detection of 0.18 µM and 0.26 µM towards epinephrine and serotonin, and
this is in line with values previously reported in literature. Au-MWCNT-PANI-TiO2 and Au
MWCNT-PANI-RuO2 electrode can easily detect epinephrine without interferences from
ascorbic acid. The fabricated sensor shows excellent recovery towards epinephrine injection.
The fabricated sensor is fast and easy to prepare.
68

REFERENCES
[l] F. Liu, J.Y. Choi, T.S. Seo, Graphene oxide arrays for detecting specific DNA
hybridization by fluorescence resonance energy transfer, Biosens. Bioelectron. 25
(2010) 2361 -2365.
[2] Y. Fang, S. Guo, C. Zhu, Y. Zhai, E. Wang, Self-Assembly of Cationic
Polyelectrolyte-Functionalized Graphene Nanosheets and Gold Nanoparticles: A
Two-Dimensional Heterostructure for Hydrogen Peroxide Sensing, Langmuir 26
(2010) 11277-11282.
[3] K. Zhou, Y. Zhu, X. Yang, J. Luo, C. Li, S. Luan, A novel hydrogen peroxide
biosensor based on Au- graphene-HRP-chitosan biocomposites, Electrochim. Acta 55
(2010) 3055-3060.
[4] J.T. Robinson, F.K. Perkins, E.S. Snow, Z. Wei, P.E. Sheehan, Reduced Graphene
Oxide Molecular Sensors, Nano Lett. 8 (2008) 3137-3140.
[5] J.D. Fowler, M.J. Mallen, V.C. Tung, Y. Yang, R.B. Kaner, B.H. Weiller, Practical
Chemical Sensors from Chemically Derived Graphene, ACSNano. 3 (2009) 301-306.
[6] S. Vaddiraju, K.K. Gleason, Selective sensing of volatile organic compounds using
novel conducting polymer-metal nanoparticle hybrids, Nanotechnology 21 (20 I 0)
125503-125511.
[7] A. Laith, S. Koo, K. Kourosh, D.P. Johan, H.H. Seung, W.K. Robert, B.K. Richard,
D. Li, X. Gou, J.I. Samuel, W. Wojtek, Graphene/Polyaniline Nanocomposite for
Hydrogen Sensing, J Phys. Chem. C 114 (2010) 16168- 16173.
[8] N. Prabhakar, K. Arora, H. Singh, B.D. Malhotra, Polyaniline Based Nucleic Acid
Sensor, J Phys. Chem. B 112 (2008) 4808-4816.
69

[9] Y. Zhang, L. Lin, Z. Feng, J. Zhou, Z. Lin, Fabrication of a P ANI/ Au nanocomposite
modified nanoelectrode for sensitive dopamine nanosensor design, Electrochim. Acta
55 (2009) 265-270.
[1 O] G. Lu, L.E. Ocola, J. Chen, Reduced graphene oxide for room-temperature gas
sensors, Nanotechnology 20 (2009) 445502-445511.
[ 11] J .M.L. Engels, M.H. Kuypers. Medical applications of silicon sensors, J Phys. E: Sci.
lnstrum. 16 (1983) 987-94.
[12] H.J. Kim, S.H. Yoon, H.N. Choi, Y.K. Lyu, W.Y. Lee, Opportunities in nano
structured metal oxides based biosensors, Korean Chem. Soc. 27 (2006) 65-70.
[13] P. Pandey, M. Datta, B.D. Malhotra, Prospects ofNanomaterials in Biosensors, Anal.
Lett. 41 (2008) 159-209.
[14] C. Jianrong, M. Yuqing, H. Nongyue, W . Xiaohua, L. Sijiao, Nanotechnology and
biosensors, Biotechnol. Adv. 22 (2004) 505-518.
[15] A.K. Gupta, M. Gupta, Synthesis and surface engineering of iron oxide nanoparticles
for biomedical applications, Biomaterials 26 (2005) 3995-4021 .
[16] R. Doong, H. Shih, Array-based titanium dioxide biosensors for ratiometric
determination of glucose, glutamate and urea, Biosens. Bioelectron. 25 (2010) 1439-
1446.
[17] J. Carrano, Defense advanced research projects agency, Arlington, Va. Aug (2007).
[18] A. Hirano, M. Sugawara, Receptors and enzymes for medical sensing of L-Glutamate,
Mini-Rev. Med. Chem. 6 (2006) 1091-1100.
[19] V. Andreu, C. Blasco, Y. Pico, Analytical strategies to determine quinolone residues
in food and the environment, Trends Anal. Chem. 26 (2007) 534-556.
70

[20] S. Rodriguez-Mozaz, M.J.L. de Alda, D. Barcelo, Biosensors as useful tools for
environmental analysis and monitoring, Analytical and Bioanalytical Chemistry, 386
(2006) 1025-1041.
[21] N. Hamdi, J.J. Wang, E. Walker, N.T. Maidment, H.G. Monbouquette, An
electroenzymatic L-glutamate microbiosensor selective against dopamine. J
Electroanal. Chem. 591 (2006) 33-40.
[22] S. Chakraborty, C.R. Raj, Amperometric biosensing of glutamate using carbon
nanotube based electrode, Electrochem. Commun. 9 (2007) 1323-1330.
[23] Y. Hahn, R. Ahmadwa, N. Tripathyw, Chemical and biological sensors based on
metal oxide nanostructures, Chem. Commun. 48 (2012) 10369-10385
[24] F. Ahmad, A. Christenson, M. Bainbridge, A.P.M. Yusof, S.A. Ghani, Minimizing
tissue-material interaction in microsensor for subcutaneous glucose monitoring,
Biosens. Bioelectron. 22 (2007) 1625-1632.
[25] C.P McMahon, R.D. O'Neill, Polymer-enzyme composite biosensor with high
glutamate sensitivity and low oxygen dependence, Anal. Chem. 77 (2005) 1196-1199.
[26] E.C. Rutherford, F. Pomerleau, P. Huettl, I. Stromberg, G.A. Gerhardt, Chronic
second-by-second measures of L-glutamate in the central nervous system of freely
moving rats, J N eurochem.102 (2007) 712-722.
[27] H.E. Koschwanez, W.M. Reichert, In vitro, in vivo and post explantation testing of
glucose-detecting biosensors: current methods and recommendation, Biomaterial 28
(2007) 3687-3703.
[28] J.R. Stetler, W.R. Penrose and S. Yao, Sensors, chemical sensors, electrochemical
sensors and ECS. J Electrochem. Soc., 150 (2003) 11 -16.
71

[29] First Official Purple Day in Canada Brings Epilepsy Awareness to Parliament Hill .
Available online: http://www.epilepsymatters.com/english/index.html (accessed on 12
September 2014).
[30] N. Clausius, C. Born, H. Grunze, The relevance of dopamine agonists in the treatment
of depression, Neuropsychiatrie 23 (2009) 15-25.
[31] K.C. Berridge, T.E. Robinson, J.W. Aldridge, Dissecting components of reward:
' liking', 'wanting' , and learning, Curr. Opin. Pharmacol. 9 (2009) 65-73.
[32] H. Gunduz-Bruce, The acute effects of NMDA antagonism: From the rodent to the
human brain, Brain Research Reviews 60 (2009) 279-286.
[33] S.J.G. Lewis, R.A. Barker, Understanding the dopaminergic deficits in Parkinson' s
disease: Insights into disease heterogeneity, J. Clin. Neuroscience 16 (2009) 620-625.
[34] T. Li, Z. Wang, H. Xie, Z. Fu, Highly sensitive trivalent copper chelate-luminol
chemiluminescence system for capillary electrophoresis detection of epinephrine in
the urine of smoker, J. Chromatogr. B Anal. Technol. Biomed. Life Sci. 911 (2012) 1-
5.
[35] M. Wang, T. Slaney, 0. Mabrouk, R.T. Kennedy, Collection of nanoliter
microdialysate fractions in plugs for off-line in vivo chemical monitoring with up to
2 s temporal resolution, J. Neurosci. Methods 190 (2010) 39-48.
[36] C.M. Schmerberg, L. Li, Mass Spectrometric Detection of Neuropeptides Using
Affinity-Enhanced Microdialysis with Antibody-Coated Magnetic Nanoparticles,
Anal. Chem. 85 (2013) 915-922.
[37] C.A. Croushore, J.V. Sweedler, Microfluidic Systems for Studying Neurotransmitters
and Neurotransmission, Lab Chip 13 (2013) 1666-1676.
72

(38] J. Yu, H. Ju, Preparation of porous titania sol-gel matrix for immobilization of
horseradish peroxidase by a vapor deposition method, Anal. Chem. 74 (2002) 3579-
3583.
(39] Q. Li, G. Luo, J. Feng, Q. Zhou, L. Zhang, Y. Zhu, Amperometric detection of
glucose with glucose oxidase absorbed on porous nanocrystalline TiO2 Film,
Electroanalysis 13 (2001) 413-416.
[40] A.A. Ansari , A. Kaushik, P.R. Solanki, B.D. Malhotra, Sol- gel derived nanoporous
cerium oxide film for application to cholesterol biosensor, Electrochem. Commun. 10
(2008) 1246-1249.
(41] A.A. Ansari, P.R. Solanki, B.D. Malhotra, Sol-gel derived nanostructured cerium
oxide film for glucose sensor, Appl. Phys. Lett. 92 (2008) 263901-263903.
(42] J.X. Wang, X.W. Sun, A. Wei, Y. Lei, X.P. Cai, C.M. Li, Z.L. Dong, Zinc oxide
nanocomb biosensor for glucose detection, Appl. Phys. Lett. 88 (2006) 233106.
[43] A.Wei, X.W. Sun, J.X. Wang, Y. Lei, X.P. Cai, C.M. Li, Z.L. Dong, W. Huang,
Enzymatic glucose . biosensor based on Z:nO nanorod array grown by hydrothermal
decomposition, Appl. Phys. Lett. 89 (2006) 123902-123905.
[44] N. Jia, Q. Zhou, L. Liu, M.M. Yan, Z.Y. Jiang, Direct electrochemistry and
electrocatalysis of HRPimmobilized in sol-gel-derived tin oxide/gelatin composite
films, J. Electroanal. Chem., 580 (2005) 213-221.
[45] H.J. Kim, S.H. Yoon, H.N. Choi, Y.K. Lyu,W.Y. Lee, Amperometric Glucose
Biosensor Based on Sol-Gel-Derived Zirconia/Nafion Composite Film as
Encapsulation Matrix. Bull, Korean Chem. Soc. 27 (2006) 65-70.
[46] A.Curulli, Smart (Nano) materials: TiO2 nanostructured films to modify electrodes
for assembling of new electrochemical probes, Sens. Actuators, B 111 (2005) 441 -
449.
(47] R. Gangopadhyay, A. De, Hand book of Organic- Inorganic Hybrid Materials and
Nanocomposites, CA: American Scientific Publishers (2003).
73

[48] D.N. Huyen, N.T. Tung, N. D. Thien, L.H. Thanh, Effect of TiO2 on the gas sensing
features of TiO2/P ANi nanocomposites, Sensors 11 (2011) 1924-1931 .
[49] S. Su, N. Kuramoto, Processable polyaniline- titanium dioxide nanocomposites: effect
of titanium dioxide on the conductivity, Synth. Met. 114 (2000) 147-153.
[50] H. Xia, Q. Wang, Ultrasonic Irradiation: A novel approach to prepare conductive
polyaniline/nanocrystalline titanium oxide composites, Chem. Mater. 14 (2002) 2158-
2165
[51] X. Li, W, Chen, C. Bian, J. He, N. Xu, G. Xue, Surface modification of TiO2
nanoparticles by polyaniline, Appl. Surf. Sci. 217 (2003) 16-22.
[52] J. Zhang, X. Ju, B. Wang, Q. Li, T. Liu, T. Hu, Study on the optical properties of
PPV/TiO2 nanocomposites, Synth. Met. 118 (2001) 181-185.
[53] H. Elim, W. Ji, A. H. Yuyono, J. M. Xue, J. Wang. Ultrafast optical nonlinearity in
PMMA-TiO2 nanocomposites, Appl. Phys. Lett. 82 (2003) 2691-2703.
[54] P. Somani, B.B. Kale, D.P. Amalnerkar, Charge transport mechanism and the effect of
poling on the current-voltage characteristics of conducting polyaniline- BaTiO3
composites, Synth. Met. 106 (1999) 53-58.
[55] F. Fusalba, D. J. Belanger, Chemical synthesis and characterization of polyaniline
molybdenum trisulfide composite, Mater. Res. 14 (1999) 1805-1813.
[56] I. Krivka, J. Prokes, E. Tobolkova, J. J. Stejskal, Application of percolation concepts
to electrical conductivity of polyaniline- inorganic salt composites, Mater. Chem. 9
(1999) 2425-2428.
[57] S. Iijima, Helical Microtubules of Graphitic Carbon. Nature 354 (1991) 56-58.
(58] T.W Ebbesen, H.J. Lezec, H. Hiura, J.W. Bennett, H.F Ghaemi, T. Thio, (2010).
Electrical conductivity of individual carbon nanotubes. Nature 382 (1996) 54-56.
(59] C. Yang, M. Wohlgenannt, Z.V. Vardeny, W.J. Blau, A.B. Dalton, R. Baughman,
A.A. Zakhidov, Photoinduced charge transfer in poly(p-phenylene vinylene)
derivatives and carbon nanotube/C60 composites. Physica B: Condensed Matter, 338
(2003) 366-369.
74

[60] W. Wang, P. Serp, P. Kalck, J.L. Faria, Photocatalytic degradation of phenol on
MWNT and titania composite catalysts prepared by a modified sol-gel method, Appl.
Cata/. B: Environ. 56 (2005) 305-312.
[61] Y. Yu, J.C. Yu, C.Y. Chan, Y.K. Che, J.C. Zhao, L. Ding, W.K. Ge, P.K. Wong,
Enhancement of adsorption and photocatalytic activity of TiO2 by using carbon
nanotubes for the treatment of azo dye, Appl. Cata/. B: Environ. 61 (2005) 1-11.
[ 62] http://science.jrank.org/pages/4621/Neurotransmitter-Neurotransmitters disease. Html
on (29 October 2007).
[63] N. Clausius, C. Born, H. Grunze, The ~levance of dopamine agonists in the treatment
of depression, Neuropsychiatrie 23 (2009) 15-23.
[64] J.R. Cooper, F.E. Bloom, R.H. Roth, The Biochemical Basis ofNeuropharmacology,
Oxford University Press, New York, (1996).
[65] M. Sofuoglu, RA. Sewell, Norepinephrine and stimulant addiction, Addiction Biology
14 (2009) 119-129.
[66] K.P. Lesch, D. Bengel, A. Heils, S.Z. Sabol, B.D. Greenberg, S. Petri, J. Benjamin,
C.R. Maller, D.H. Hamer, D.L. Murphy, Association of anxiety-related traits with a
polymorphism in the serotonin transporter gene regulatory region, Science 274 (1996)
1527-1531.
[67] J.M. Zen, I.L. Chen, Y. Shih, Voltammetric determination of serotonin in human
blood using a chemically modified electrode, Anal. Chim. Acta 369 (1998) l 03-108.
[68] Z.H. Wang, Q.L. Liang, Y.~. Wang, G.A. Luo, Carbon nanotube-intercalated
graphite electrodes for simultaneous determination of dopamine and serotonin in the
presence of ascorbic acid, J Electroana/. Chem. 540 (2003) 129-134.
[69] A.M. Sardar, C. Czudek, G.P. Reynolds, Dopamine deficits in the brain: the
neurochemical basis of parkinsonian symptoms in AIDS, NeuroReport 7 (1996) 910-
912.
75

[70] B.N. Frey, P. Rosa-Neto, S. Lubarsky, M. Diksic, Correlation between serotonin
synthesis and 5-HT IA receptor binding in the living human brain: A combined a
[llC] MT and [18F] MPPF positron emission tomography study, Neurolmage 42,
· (2008) 850-857
[71] P. Celada, M.V. Puig, M. Amargos-Bosch, A. Adell, F. Artigas, The therapeutic role
of 5-HTlA and 5-HT2A receptors in depression, J. Psychiatr. Neurosci. 29 (2004)
252-265.
[72] T. Fulmer, Revoking serotonin' s auto license. SciBX: Science-Business eXchange, 3
(2010)
[73] I. Hervas, M.T. Vilaro, L. Romero, M. Scorza, G. Mengod, F. Artigas, Desensitization
of 5-HTlA autoreceptors by a low chronic fluoxetine dose effect of the concurrent
administration of WA Y-100635, Neuropsychopharmacology 24, (2001) 11 -20.
[74] M.B. Hansen, Neurohumoral control of gastrointestinal motility, Physiol. Res. 52,
(2003) 1-30.
[75] M.B. Hansen, The enteric nervous system I: organisation and classification,
Pharmacol. Toxicol. 92, (2003) I 05-113.
[76] M.B. Hansen, The enteric nervous system II: gastrointestinal functions, Pharmacol.
Toxicol. 92, (2003) 249-257.
[77] I. Geller, K. Blum, The effects of 5-HTP on para-Chlorophenylalanine (p-CPA)
attenuation of conflict behavior, Eur. J. Pharmacol. 9 ( 1970) 319-324.
[78] S.D. Iversen, The importance of understanding substrains in the genomic age,
Neuropharmaco/ogy 23 (1984) 1553-1560.
[79] K. Miyazaki, G. Matsumoto, M. Yamada, S. Yasui, H. Kaneko, Simultaneous
voltammetric measurement of nitrite ion, dopamine, serotonin with ascorbic acid on
the GRC electrode, Electrochim. Acta 44 (1999) 3809-3820.
[80) J. Oni, T. Nyokong, Simultaneous voltammetric determination of dopamine and
serotonin on carbon paste electrodes modified with iron (IQ phthalocyanine
complexes, Anal. Chim. Acta 434 (2001) 9-2 1.
76

[81) P. Cowen, A.C. Sherwood, The role of serotonin in cognitive function: Evidence
from recent studies and implications for understanding depression, J.
Psychopharmacol. 27 (2013) 575-583.
[82) J.L. Mace, R.J. Porter, C.J. Dalrymple-Alford, K.A. Wesnes, T.J. Anderson, Effects
of acute tryptophan depletion on neuropsychological and motor function in
parkinson' s disease. J. Psychopharmacol. 24 (2010) 1465-1472.
[83) Lorenzo Bono, www.PSILOCYBIN.com (17 February 2014)
[84) H. Li, W. Luo, X.M. Hu, Determination of Enantiomeric Purity for Epinephrine by
High Performance Liquid Chromatography, Chin. J. Chromatogr. 17 (I 999) 403-405.
[85) C.K. Mathews, K.E.V. Holde, K.G. Ahem, Biochemistry, 3rd ed., Benjamin
Cummings, San Francisco (I 999).
(86) H.R. Zare, N. Nasirizadeh, Simultaneous determination of ascorbic acid, adrenaline
and uric acid at a hematoxylin multi-wall carbon nanotube modified glassy carbon
electrode, Sens. Actuators, B: Chem. 143 (2010) 666-672.
(87) C. Folwaczny, W. Heldwein,- G. Obermaier, N. Schindlbeck, Influence of prophylactic
local administration of epinephrine on bleeding complications after polypectomy,
Endoscopy 29 (1997) 31-33.
(88) J. Koay, I. Orengo, Application of local anest anesthetics in dermatologic surgery,
Dermatol. Surg. 28 (2002) 143-48.
(89) B.R. Fink, G.M. Aasheim, B.A. Levy, Neural pharmacokb:ietics of epinephrine,
Anesthesiology 48 (1978) 263-266.
[90) T.M. Dunlevy, T.P. O'Malley, G.N. Postma, Optimal concentration of epinephrine for
vasoconstriction in neck surgery, Laryngoscope 106 (1996) 1412-1414.
[91 ) S.M. Chen, M. Liu, Electrochemical self-assembly of nordihydroguaiaretic
acid/Nafion modified electrodes and their electrocatalytic properties for
catecholamines and ascorbic acid, J. Electroanal. Chem. 579 (2005) 153-162.
77

[92] E. Dempsey, A. Kennedy, N. Fay, T. Mcconnac, Investigations into
Heteropolyanions as Electrocatalysts for the Oxidation of Adrenaline, Electroanal. 15
(2003) 1835-1842.
[93] J.M. Gong, X.Q. Lin, A glassy carbon supported bilayer lipid-like membrane of 5,5-
ditetradecyl-2-(2-trimethyl-ammonioethyl)-l,3-dioxane bromide for electrochemical
sensing of epinephrine, Electrochim. Acta 49 (2004) 4351-4357.
[94] S.F. Wang, D. Dan, Q.C. Zou, Electrochemical behavior of epinephrine at 1-cysteine
self-assembled monolayers modified gold electrode, Talanta 57 (2002) 687-692.
[95] H.M. Zhang, X.L. Zhou, R.T. Hui, N.Q. Li, Studies of the electrochemical behavior
of epinephrine at a homocysteine self-assembled electrode, Talanta 56 (2002) 1081-
1088.
[96] H.S. Wang, D.Q. Huang, R.M. Liu, Study on the electrochemical behavior of
epinephrine at a poly(3-methylthiophene)-modified glassy carbon electrode, J
Electroanal. Chem. 570 (2004) 83-90.
[97] S.M. Chen, K.T. Peng, The electrochemical properties of dopamine, epinephrine,
norepinephrine, and their electrocatalytic reactions on cobalt (II) hexacyanoferrate
films, J Electroanal. Chem. 547 (2003) 179-189.
[98] A.N. Booth, M.S. Masri, D.J. Robbins, O.H. Emerson, F.T. Jones, F. Deeds, Urinary
phenolic acid metabolities of tyrosine, J Biol. Chem. 235 (1960) 2649-2652.
[99] http://www.smartnootropics.co.uk/tyrosine/ (02 June 2016)
[100] N.J. Temple, Antioxidants and disease: More questions than answers, Nutr. Res. 20
(2000) 449-459.
[101] A.G. Frenich, M.E.H. Torres, AB. Vega, Determination of Ascorbic Acid and
Carotenoids in Food Commoditi~s by Liquid Chromatography with Mass
Spectrometry Detection, J Agri. Food Chem. 53 (2005) 7371-7376.
[I 02] F.O. Silva, Total ascorbic acid determination in fresh squeezed orange juice by gas
chromatography, Food Conti. 16 (2005) 55-58.
78

[103] M.J.R. Lima, I.V. Toth, A.O.S.S. Rangel, A new approach for the sequential injection
spectrophotometric determination of the total antioxidant activity, Talanta 68 (2005)
207-213.
[104] M. Noroozifar, M. K.horasani-Motlagh, Solid-phase iodine as an oxidant in flow
injection analysis: determination of ascorbic acid in pharmaceuticals and foods by
background correction, Ta/anta 61 (2003) 173-179.
[105] F. Mizutani, Y. Sato, T. Sawaguchi, S. Yabuki, S. Iijima, Rapid measurement of
transaminase activities using an amperometric I-glutamate-sensing electrode based on
a glutamate oxidase-polyion complex-bilayer membrane, Sens. Actuators B 52 (1998)
23-29.
[106] Z. Yang, G. Hu, X. Chen, J. Zhao, and G. Zhao, "The nano-Au self-assembled glassy
carbon electrode for selective determination of epinephrine in the presence of ascorbic
acid," Colloids Surf., B 54 (2007) 230-235.
(l 07] B. Jin and H. Zhang, Nano-gold modified glassy carbon electrode for selective
determination of epinephrine in the presence of ascorbic acid, Anal. Lett. 35 (2002)
1907-1918.
[108] T. Luczak, Electrocatalytic application of an overoxidized dopamine film prepared on
a gold electrode surface to selective epinephrine sensing, Electroanal. 20 (2008)
1317-1322.
[109] C. Ozdemir, F. Yeni, D. Odaci, S. Timur, Electrochemical glucose biosensing by
pyranose oxidase immobilized in gold nanoparticle-polyaniline/AgCl/gelatin
nanocomposite matrix, Food Chem. 119 (2010) 380-385.
[110] M. Mazloum Ardakani, Z. Taleat, H. Beitollahi, M. Salavati-Niasari, B.B.F. Mirjalili,
N. Taghavinia, Electrocatalytic oxidation and nanomolar determination of guanine at
the surface of a molybdenum (VI) complex- TiO2 nanoparticle modified carbon paste
electrode, J. Electroanal. Chem. 624 (2008) 73-78.
[111] L. Zhang, Z. Fang, G.C. Zhao, X.W. Wei, Electrodeposited platinum nanoparticles on
the multi-walled carbon nanotubes and its electrocatalytic for nitric oxide, Int. J.
Electrochem. Sci. , 3 (2008) 746-754.
79

[112] H.J. Wang, C.M. Zhou, F. Peng, H. Yu, Glucose biosensor based on platinum
nanoparticles supported sulfonated-carbon nanotubes modified glassy carbon
electrode, Int. J Electrochem. Sci., 2 (2007) 508-516.
[113] N. Zheng, X. Zhou, W. Yang, X. Li, Z. Yuan, Direct electrochemistry and
electrocatalysis of hemoglobin immobilized in a magnetic nanoparticles-chitosan film,
Talanta 79 (2009) 780-786.
[114] S. Jingyu, H. Jianshu, C. Yanxia, Z. Xiaogang, Hydrothermal Synthesis of Pt
Ru/MWCNTs and its Electrocatalytic Properties for Oxidation of Methanol, Int. J
Electrochem. Sci. , 2 (2007) 64-71.
[115] H. Gao, J. Zhong, P. Qin, C. Lin, W. Sun, Microplate electrochemical DNA detection
for phosphinothricin acetyltransferase gene sequence with cadmium sulfide
nanoparticles, Microchem. J 93 (2009) 78-81.
[116] K. Can, M. Ozmen, M. Ersoz, Immobilization of albumin on aminosilane modified
superparamagnetic magnetite nanoparticles and its characterization, Colloids Su,f. B
71 (2009) 154-159.
[117] E. Stathato, P. Lianos, F.D. Monte, D. Levy, D. Tsiourvas, Formation of TiO2
nanoparticles in reverse micelles and their deposition as thin films on glass substrates,
Langmuir 13 (1997) 4295-4300.
[118] A. Zaleska, Doped-TiO2: a review, Recent Patents on Engineering 2 (2008) 157-164.
[119] Y. Xie, Y. Qian, Y. Zhong, H. Guo, Y. Hu, "Facile low-temperature synthesis of
carbon nanotube/TiO2 nanohybrids with enhanced visible-light-driven photocatalytic
activity," Int. J Photoenergy 2012 (2012) 1-6.
[120] F. Sayilkan, M. Asiltiirk, H. Sayilkan, Y. Onal, M. Akarsu, E. Arpa9, Characterization
of TiO2 synthesized in alcohol by a sol-gel process: the effects of annealing
temperature and acid catalyst, Turkish J Chem. 29 (2005) 697-706.
[121] R. Gomez, T. Lopez, E. Ortiz-Isla, Effect of sulfation on the photoactivity of TiO2 sol
gel derived catalysts, J Mo/. Cata/. A 193 (2003) 217-226.
80

[122] U. Yogeswaran, S.M. Chen, A review on the electrochemical sensors and biosensors
composed ofnanowires as sensing material, Sensors 8 (2008) 290-313.
[123] K.K. Gupta, M. Jassal, A.K. Agrawal, Sol-gel derived titanium dioxide enishing of
cotton fabric for self-cleaning, Indian J Fibre and Textile Research 33 (2008) 443-
450.
[124] E. Topoglidis, A.E.G. Cass, G. Gilardi, S. Sadeghi, N. Beaumont, J.R. Durrant,
Protein Adsorption on Nanocrystalline TiO2 Films: An ~obilization Strategy for
Bioanalytical Devices, Anal. Chem. 70 (1998) 5111-5113.
(125] L.G. Phillips, D.M. Barbeno, Anatase-TiO2 nanomaterials: Analysis of key
parameters controlling crystallization, J Dairy Sci. 80 (1997) 2726-2731 .
[126] H. Selhofer, R. Miiller, Comparison of pure and mixed coating materials for AR
coatings for use by reactive evaporation on glass and plastic lenses, Vacuum Thin
Films 351 (1999) 180-183.
(127] A. Fujishima, T.N. Rao, D.A. Tryk, Titanium dioxide photocatalysis, J Photochem.
Photobiol. C: Photochem. Rev. 1 (2000) 1-21 .
(128] E. Pellizzetti, M. Schiavello. Photochemical Conversion and Storage of Energy
Dordrecht, the Netherlands 1991 : 427-449.
[129] R.J. Berry, M.R. Mueller, Photocatalytic Decomposition of Crude Oil Slicks Using
TiO2 on a Floating Substrate, Microchem. J 50 (1994) 28-32.
[130] S. Trasatti, G. Buzzanca, Ruthenium dioxide: A new interesting electrode material,
Solid state structure and electrochemical behaviour, J Electroanal. Chem. Inte,f.
Electrochem. 29 (1971) 1-5.
[131] D. Galizzioli, F. Tantardini, S. Trasatti, Ruthenium dioxide: a new electrode material.
I. Behaviour in acid solutions of inert electrolytes, J Appl. Electrochem. 4 (1 974) 57-
67.
[132] C. Yuhan, L. Chen, B. Gao, L. Su, X. Zhang, Synthesis and utilization ofRuO2·xH2O
nanodots well dispersed on poly(sodium 4-styrene sulfonate) functionalized multi
walled carbon nanotubes for supercapacitors, J Mater. Chem. 19 (2009) 246-252.
81

[133] P.F. Campbell, M.H. Ortner, CJ. Anderson, Differential thermal analysis and
thermogravimetric analysis of fission product oxides and nitrates to 1500 C, Anal.
Chem. 33 (1961) 58-61.
[134] R.G. Vadimsky, R.P. Frankenthal, D.E. Thompson, Ru and RuO2 as electrical contact
materials: Preparation and environmental interactions, J. Electrochem. Soc. 126
(1979) 2017-2023.
[135] H. Over, Y.D. Kim, A.P. Seitsonen, S. Wendt, E. Lundgren, M. Schmid, P. Varga, A.
Morgante, G. Ertl, Atomic-scale structure and catalytic reactivity of the RuO2 (110)
surface, Science 287 (2000) 1474-1476.
[136] 0 . Delmer, P. Balaya, L. Kienle, J. Maier, Enhanced potential of amorphous electrode
materials: Case study ofRuO2, J. Adv. Mater. 20 (2008) 501-505.
[137] H. Schafer, G. Schneidereit, W. Gerhardt, Zur Chemie der Platinmetalle. RuO2
Chemischer Transport, Eigenschaften, thermischer Zerfall, Z. Anorg. Allg. J. Inorg.
General Chem. 319 (1963) 327-336
[138] S. Trasatti, Physical electrochemistry of ceramic oxides, Electrochim. Acta 36 (1991)
225-241.
[139] S. Trasatti, Electrocatalysis: Understanding the success of DSAl , Electrochim. Acta
45 (2000) 2377-2385.
[140] E.R. Kotz, S. Stucki Ruthenium dioxide as a hydrogen-evolving cathode, J. Appl.
Electrochem. 17 (1987) 1190-1197.
[141) Z.P. Liu, P. Hu, A. Alavi, Mechanism for the high reactivity of CO oxidation on a
ruthenium-oxide, J. Chem. Phys. 114 (2001) 5956-5957.
[142] K. Reuter, M. Scheffler, First-principles kinetic Monte Carlo simulations for
heterogeneous catalysis: Application to the CO oxidation at RuO2 (110), Phys. Rev. B:
Condens. Matter 73 (2006) 045433-045447.
[143) J.P. Popic', M.L. Avramov-Ivic ', N.B. Vukovic ', Reduction of carbon dioxide on
ruthenium oxide and modified ruthenium oxide electrodes in 0.5M NaHCO3, J.
Electroanal. Chem. 421 (1997) 105-110.
82

[144) P., Simon, Y. Gogotsi, Materials for electrochemical capacitors, Nat. Mater. 7 (2008)
845-854.
[145) J.P. Zheng, P.J. Cygan, T.R. Jow, Hydrous ruthenium oxide as an electrode material
for electrochemical capacitors, J. Electrochem. Soc. 142 (1995) 2699-2703.
[146) J.C. Chou, S.I. Liu, S.H. Chen, Sensing characteristics of ruthenium films fabricated
by radio frequency sputtering, Jpn. J. Appl. Phys. 44 (2005) 1403-1408.
[147) Y.H. Liao, J.C. Chou, Preparation and characteristics of ruthenium dioxide for pH
array sensors with real-time measurement system, Sens. Actuators B 128 (2008) 603-
612.
[148) Y.H. Liao, J.C. Chou, Comparison of polypyrrole-conducting polymer and Ag/AgCl
reference electrodes used for ruthenium dioxide pH electrode, J. Electrochem. Soc.
155 (2008) 257-262.
[149) Y.H. Liao, J.C. Chou, Drift and hysteresis characteristics of drug sensors based on
ruthenium dioxide membrane, Sensors 8 (2008) 5386-5396.
[150) Y.H. Liao J.C. Chou, "Comparison of sensing characteristics of ruthenium dioxide
using ruthenium sputtered deposited onto different substrates," in Proc. Int. Electron
Devices and Materials Symp. (IEDMS), Taichung, Taiwan 4 (2008) 28-29.
[151) C.H. Lee, G. Yu, C. Zhang, A. Heeger, Dual-function semiconducting polymer
devices: Light-emitting and photodetecting diodes. J. Appl. Phys. Lett. 64 (1994)
1540-1542.
[152) G. Yu, K. Pakbaz, A.J. Heeger, Optocoupler made from semiconducting polymers,
J. Electron. Mater. 23 (1 994) 925-928.
[153] G. Yu, J. Wang, J. McElvain, A. Heeger, Large-area, full-color image sensors made
with semiconducting polymers, J. Adv. Mater. 10 (1998) 1431-1434.
[154] S.V. Frolov, A. Fujii, D. Chinn, M. Hirohata, R. Hidayat, M. Taraguchi, T. Masuda,
K. Yoshino, Z.V. Vardeny, Microlasers and micro-LEDs from disubstituted
polyacetylene, Adv. Mater. 10 (1998) 869-872.
83

[155] T. Matsunaga, H. Daifuku, T. Nakajima, T.; Kavagoi, Development of polyaniline
lithium secondary battery, Po/ym. Adv. Techno/. l (1990) 33-39.
[156] C. Arbizzani, M. Mastragostino, S. Panero, P. Prosperi, B Scrosati, Electrochemical
characterization of a polymer/polymer rechargeable lithium solid-state cell, Synth.
Met. 28 (1989) 663-668.
[157] B. Scrosati, "Conducting polymers: advanced materials for new design, rechargeable
lithium batteries, Polym. Int. 47 (1998) 50-55.
[I 58] C.G.J. Koopal, B. Ruiter, R.J.M. Nolte, Amperometric biosensor based on direct
communication between glucose oxidase and a conducting polymer inside the pores of
a filtration membrane, J. Chem. Soc. Chem. Commun. 12 (1991) 1691-1692.
[ 159] Y.K. Dong, S.S. Lee, G.C. Papaefthymiou , J.Y. Ying, Nanoparticle architectures
templated by SiO2/Fe2O3 nanocomposites. Chem. Mater. 18 (2006) 614-61 9.
[160] N. Langsam, L.M. Robeson, Substituted propyne polymers-part II. Effects of aging
on the gas permeability properties of poly (1-(trimethylsilyl) propyne] for gas
separation membranes, Polym. Eng. Sci. 29 (1989) 44-54.
(161] C. Arbizzani M. Mastragostino, L. Meneghello. Characterization by impedance
spectroscopy of a polymer-based supercapacitor, Electrochim. Acta 40 · ( 1995) 2223-
2228.
[162] R. Racicot, R. Brown, S.C.Yang, Corrosion protection of aluminum alloys by double
strand polyaniline, Synth. Met. 85 (1997) 1263-1264.
(163] B. Wessling, Passivation of metals by coating with polyaniline: Corrosion potential
shift and morphological changes, Adv. Mater. 6 (1994) 226-228.
[164] A. Tsumura, H. Fuchigami, H. Koezuka, Field-effect transistor with a conducting
polymer film, Synth. Met. 41(1991) 1181-1184.
[165] Y. Greenwald, X. Xu, M. Fourmigue, G. Srdanov, C. Koss, F. Wudl, A.J. Heeger,
Polymer-polymer rectifying heterojunction based on poly(3,4-dicyanothiophene) and
MEH-PPV, J. Polym. Sci. A Po/ym. Chem. 36 (1998) 3115-3120.
84

[166] R.V. Gregory, W.C. Kimbell, H.H. Kuhn, Conductive textiles, Synth. Met. 28 (1989)
823-835.
[167] S. Xiong, S.L. Phua, B.S. Dunn, J. Ma and X. Lu, Covalently bonded
polyaniline-TiO2 Hybrids: A facile approach to highly stable anodic electrochromic
materials with low oxidation potentials, Chem. Mater. 22 (2010) 255-260.
[168] Q. Li, C. Zhang and J. Li, Photocatalysis and wave-absorbing properties of
polyaniline/TiO2 microbelts composite by in situ polymerization method, Appl. Surf
Sci. 257 (2010) 944-948.
[169] N. Gospodinova, L. Terlemezyan, Conducting polymers prepared by oxidative
polymerization: polyaniline, Prog. Po/ym. Sci. 23 (1998) 1443-1484.
[170] M.U.A. Prathap, R. Srivastava, Tailoring properties of polyaniline for simultaneous
determination of a quaternary mixture of ascorbic acid, dopamine, uric acid, and
tryptophan, Actuat. 177 (2013) 239-250.
[171] H.Q. Liu, J. Kameoka, D.A. Czaplewski, H.G. Craighead, Polymeric nanowrre
chemical sensor, Nano Lett. 4 (2004) 671-675.
[172] Y.G. Wang, H.Q. Li, Y.Y. Xia, Ordered whisker like polyaniline grown on the surface
of mesoporous carbon and its electrochemical capacitance performance, Adv. Mater.
18 (2006) 2619-2623.
[173] S. Bhadra, D. Khastgir, N.K. Singha, J.H. Lee, Progress in preparation, processing and
applications ofpolyaniline, Prog. Polym. Sci. 34 (2009) 783-810.
[174] T.A. Sergeyeva, N.V. Lavrik, S.A. Piletsky, A.E. Rachkov, A.V. Elskaya, Polyaniline
label-based conductometric sensor for IgG detection, Sens. Actuators, B: Chem. 34
(1996) 283-288.
[175] Y.C. Luo, J.S . Do, Urea biosensor based on PANI (urease)-Nafion/Au composite
electrode, Biosens. Bioelectron. 20 (2004) 15-23.
[I 76] Y. Wang, Z. Li, J. Wang, J. Li, Y. Lin, Graphene and graphene oxide:
biofunctionalization and applications in biotechnology~ Trends Biotechnol. 29 (2011 )
205-212.
85

[177] H. Laterby, On the production of a blue substance by the electrolysis of sulphate of
aniline, J. Chem. Soc. 15 (1862) 161-163.
[178] D.E. Tallman, G. Springs, A. Dominis, G.G. Wallace, Electroactive conducting
polymers for corrosion control, J. Solid State Electrochem. 6 (2002) 73-84.
[ 179] H. Yang, H. Zeng, Preparation of hollow anatase TiO2 nanospheres via ostwald
ripening. J. Phys. Chem. B 108 (2004) 3492-3495.
[180] J. Stejskal, R.G. Gilbert, Polyaniline, Preparation of a Conducting Polymer, Pure
Appl. Chem. 74 (2002) 857-867.
[181] F. K.reupl , A.P. Graham , G.S. Duesberg , W. Steinhoegl, M. Liebau , E. Unger , W.
Hoenlein , Microelectron. Eng. 64 (2002) 399-408.
[182] T.D. Burchell, Carbon Materials for Advanced Technologies. Oxford: Elsevier
Science Ltd (1999).
[183] M. Inagaki, F. Kang, M. Toyoda, H. and Konno, Advanced Materials Science and
Engineering of Carbon. Oxford: Butterworth-Heinemann, Elsevier (2014)
[184] M.A. Alvarez-Merino, F. Carrasco-Marin, F.J. and Maldonado-Rodar, Desarrollo y
Aplicaciones de Materiales A vanzados de Carbon. Sevilla: Universidad Internacional
de Andalucia (2014).
[185] J.P. Salvetat-Delmontte, A. Rubio, Mechanical properties of carbon nanotubes: a fiber
digest for beginners, Carbon 40 (2000) 1729-1734.
[186] T. Saito, K. Matsushige, K, Tanaka, Chemical treatment and modification of multi
walled carbon nanotubes, Physica B 323 (2002) 280-283.
[187] Y.H. Yun, Z. Dong, V. Shanov, W.R. Heineman, H.B. Halsall, A. Bhattacharya, L.
Conforti, R.K.Narayan, W.S. Ball, M.J. Schulz, Nanotube electrodes and biosensors,
Nano Today 2 (2007) 30-37.
[188] P.M. Ajayan, Nanotubes from carbon, Chem. Rev. 99 (1999) 1787-1800.
[l 89] M.D. Rubianes, G.A. Rivas, Carbon nanotubes paste electrode, Electrochem.
Commun. 5 (2003) 689-694.
86

(190] F. Valentini, A. Amine, S. Orlanducci, M.L. Terranova, G. Palleschi, Carbon
nanotube purification: Preparation and characterization of carbon nanotube paste
electrodes, Anal. Chem. 75 (2003) 5413-5421.
(191] M.M. Rahman, LC. Jeon, Studies of electrochemical behavior of SWNT-film
electrodes, J. Braz. Chem. Soc. 18 (2007) 1150-1157.
[192] Y.D. Zhao, W.D. Zhang, H. Chen, Q.M. Luo, Electrocatalytic oxidation of cysteine at
carbon nanotube powder microelectrode and its detection, Sens. Actuators, B 92
(2003) 279-285.
[193] L.C. Jiang, W.D. Zhang, Electrodeposition ofTiO2 nanoparticles on multiwalled carbon
nanotube arrays for hydrogen peroxide sensing, Electroanal. 21 (2009) 988-993
[194] H. Tang, J. Chen, L. Nie, S. Yao, Y. Kuang, Electrochemical oxidation of glutathione
at well-aligned carbon nanotube array electrode, Electrochim. Acta 51 (2006) 3046-
3051.
[195] F. Faridbod, M.R. Ganjali, M. Pirali-Hamedani, P. Norouzi, MWCNTs-ionic liquids
ionophore-graphite nanocomposite based sensor for selective determination of
Ytterbium(Ill) Ion, Int. J. Electrochem. Sci. 5 (2010) 1103-1112.
[196) K.. Gong, Y. Dong, S. Xiong, Y. Chen, L. Mao, Novel electrochemical method for
sensitive determination of homocysteine with carbon nanotube-based electrodes,
Biosens. Bioelectron. 20 (2004) 253-259.
[197) D. Zhang, S. Tadashi, 0. Take, Dual catalysts_system based on nano-manganese oxide
and multiwall carbon nanotube for four-electron oxygen reduction, Chem. Lett. 35
(2006) 520-531.
[198) N. Alexeyeva, T. Laaksonen, K.S. Kontturi, F. Mirkhalaf, DJ. Schiffrin, K.
Tammeveski, Oxygen reduction on gold nanoparticle/multi-walled carbon nanotubes
modified glassy carbon electrodes in acid solution, Electrochem. Commun. 8 (2006)
1475-1480.
[199) S.F. Wang, F. Xie, R.F. Hu, Carbon-coated nickel magnetic nanoparticles modified
electrodes as a sensor for determination of acetaminophen, Sens. Actuators, B 123
(2007) 495-500.
87

[200] L.A. Agiii, P.Y. Yafiez-Sedefio, J.M. Pingarro ', Role of carbon nanotubes m
electroanalytical chemistry, Anal. Chim. Acta 622 (2008) 11-47.
[201] P. Serp, M. Corrias, P. Kalck, Carbon nanotubes and nanofibers in catalysis, Appl.
Cata/. A 253 (2003) 337-358.
[202] T. Matsumoto et al. , Reduction of Pt usage in fuel cell electrocatalysts with carbon
nano tube electrodes, Chem. Commun. 2004 (2004) 840-841.
[203] K. Gong, F. Du, Z. Xia, M. Durstock, L. Dai, Nitrogen-doped carbon nanotube arrays
with high electrocatalytic activity for oxygen reduction, science 323 (2009) 760-764.
[204] A. Le Goff, V. Artero, B. Jousselme, P.D. Tran, N. Guillet, R. Metayel , A. Fihri, S.
Palacinl , M. Fontecave,, From hydrogenases to noble metal- free catalytic
nanomaterials for H2 production and uptake, Science 326 (2009) 1384-1387.
[205] J.M. Lee, J.S. Park, S.H. Lee, H. Kim, S. Yoo, S.O. Kim, Selective Electron-or
Hole-Transport Enhancement in Bulk-Heterojunction Organic Solar Cells with N-or
B-Doped Carbon Nanotubes, Adv. Mater. 23.5 (2011) 629-633.
[206] E.S. Snow, F.K. Perkins, E.J. Houser, S.C. Badescu, T.L. Reinecke, Chemical
detection with a single-walled carbon nanotube capacitor, Science 307 (2005) 1942-
1945.
[207] B. Esser, J.M. Schnorr, T.M. Swager, Angew. Selective detection of ethylene gas
using carbon nanotube-based devices: utility in determination of fruit ripeness, Chem.
Int. Ed. 51 (2012) 5752-5756.
[208] D. Schmidt, D. Shah, E.P. Giannelis, New advances in polymer/layered silicate
nanocomposites, Curr. Opin. Solid State Mater. Sci. 6 (2002) 205-212.
[209] H. Gleiter, Materials with ultrafme microstructures: retrospectives and perspectives,
Nanostruct. Mater. 1 (1992) 1-19.
[210] S. Iij ima, Helical microtubes of graphitic carbon, Nature 354 (1991) 6-58.
[211] M.J. Biercuk, M.C. Llaguno, H.J. Radosvljevicm, Carbon nanotube composites for
thermal management, Appl. Phys. Lett. 80 (2002) 2767-2769.
88

[212) Z. Ounaies, C. Park, K.E. Wise, E.J. Siochi, J.S. Harrison, Electrical properties of
single wall carbon nanotube reinforced polyimide composites, Compos. Sci. Technol.
63 (2003) 1637-164.
[213] M.C. Weisenberger, E.A. Grulke, D. Jacques, T. Ramtell, R. Andrews, Enhanced
mechanical properties of polyacrylonitrile: multiwall carbon nanotube composite
fibers, J. Nanosci. Nanotechnol. 3 (2003) 535-539.
[214] A.B. Dalton, S. Coolins, E. Munoz, J.M. Razal, V.H. Ebron, J.P. Ferraris, Super-tough
carbon-nanotube fibres: these extraordinary composite fibres can be woven into
electronic textiles, Nature 423 (2003) 703-703.
[215] Y.H. Choa, J.K. Yang, B.H. Kim, Y.K. Jeong, J.S. Lee, T. Nakayama, Preparation
and characterization of metal: ceramic nanoporous nanocomposite powders, J. Magn.
Magn. Mater. 266 (2003) 12-19.
[216] R. Gangopadhyay, D. Amitabha, Conducting polymer nanocomposites: a brief
overview, Chem.Mater. 12 (2000) 608-622.
[217] S.S. Ray, M. Bousmina, Biodegradable polymers and their layered silicate
nanocomposites: in greening the 21st century materials world, Prag. Mater Sci. 50
(2005) 962-1079.
[218] J.K. Pandey, A.P. Kumar, M. Misra, A.K. Mohanty, L.T. Drzal, R.P. Singh, Recent
advances in biodegradable nanocomposites, J. Nanosci. Nanotechnol. 5 (2005) 497-
526.
[219] R. Andrews, M.C. Weisenberger, Carbon nanotube polymer composites, Curr. Opin.
Solid State Mater. Sci. 8 (2004) 31-37.
[220] Z.H. Mbhele, M.G. Salemane, C.G.C.E. Van Sittert, J.M. Nedeljkovic, V. Djokovic,
A.S. Luyt, Fabrication and characterization of silverpolyvinyl alcohol
nanocomposites, Chem.Mater. 15 (2003) 5019-5024.
[221] M. Alexandre, P. Dubois, Polymer-layered silicate nanocomposites: preparation,
properties and uses of a new class of materials, Mater. Sci. Eng. 28 (2000) 1-63.
[222] B.K.G. Theng, The chemistry of clay-organic reactions. New York: Wiley; (1974).
89
[223] M. Ogawa, K. Kuroda, Preparation of inorganic composites through intercalation of
organoammoniumions into layered silicates, Bull. Chem. Soc. Jpn. 70 (1997) 2593-
2618.
[224] M.W. Noh, D.C. Lee, Synthesis and characterization of ps-clay nanocomposite by
emulsion polymerization, Polym. Bull. 42 (1999) 619-662.
[225] R.F. Lane, AT. Hubbard, Electrochemistry of chemisorbed molecules. 1. Reactants
connected to electrodes through olefinic substituents, J. Phys. Chem. 77 (1973) 1401-
1410.
[226] R.F. Lane, AT. Hubbard, Electrochemistry of chemisorbed molecules. 2. Influence of
charged chemisorbed molecules on electrode-reactions of platinum complexes, J.
Phys. Chem. 77 (1973) 1411-1421.
[227] T.M. Heme, M.J. Tarlov, Characterization of DNA probes immobilized on gold
surfaces, J. Am. Chem. Soc. 119 (1997) 8916-8920.
[228] B. Bas, M. Jakubowska, Z, Kowalski, (2006) Rapid pretreatment of a solid silver
electrode for routine analytical practice, Electroanal. 18 (2006) 1710-1717.
[229] C.H. Fan, G.X. Li, Y. Zhuang, J.Q. Zhu, D.X. Zhu, Iodide modified silver elec:trode
and its application to the electroanalysis of haemoglobin, Electroanal. 12 (2000) 205-
208.
[230] A. Gutes, C. Carraro, R. Maboudian, Nonenzymatic glucose sensmg based on
deposited palladium nanoparticles on epoxy-silver electrodes, Electrochim. Acta. 56
(2011) 5855-5859.
[231] G.X. Li, X.M. Liao, H.Q. Fang, H.Y. Chen, Direct electron-transfer reaction of
hemoglobin at the bare silver electrode, J. Electroanal. Chem. 369 (1994) 267-269.
[232] L.A. Colon, R. Dadoo, R.N. Zare, Determination of carbohydrates by capillary zone
electrophoresis with amperometric detection at a copper microelectrode, Anal. Chem.
65 (1993) 476-481.
[233] M.J. Eddowes, H.A.O. Hill, Novel method for investigation of electrochemistry of
metalloproteins- cytochrome-c, J. Chem. Soc, Chem. Commun. 21 (1977) 771-772.
90

(234] S. Wasmus, A. Kuver, Methanol oxidation and direct methanol fuel cells: a selective
review, J. Electroana/. Chem. 461 (1999) 14-31.
(235] M.S. Belluzo, M.E. Ribone, C.M. Lagier, Assembling amperometric biosensors for
clinical diagnostics, Sensors 8 (2008) 1366-1399.
(236] T. Yamamoto, Y. Moriwaki, and S. Takahashi, Effect of ethanol on metabolism of
purine bases (hypoxanthine, xanthine, and uric ·acid), Clin. Chim. Acta 356 (2005) 35-
57.
(237] J.Q. Chen, T.R. Brown, J. Russo, Regulation of energy metabolism pathways by
estrogens and estrogenic chemicals and potential implications in obesity associated
with increased exposure to endocrine disruptors, Biochim. Biophys. Acta 1793 (2009)
1128-1143.
[238] J. Heyrovsky, J. Kuta, Principles of Polarography. Academic Press, Prague, (1966).
[239] J.M. Sequaris, Analytical voltammmetry of biological molecules, in M.R. Smyth, J.G.
Vos, Analytical voltammetry, Vol. XXVII, wilson and wilson's comprehensive
analytical chemistry. Elsevier, Amsterdam, (1992).
[240] A.J Bard, L.R Faulkner, Electrochemical methods, fundamentals and applications,
Wiley. New York, (1980).
(241] A.J. Bard, L.R. Faulkner, Electrochemical Methods: Fundamentals and Applications,
John Wiley & Sons, Hoboken, NJ, (2001).
(242] P.T Kissinger, W.R Heineman, Cyclic Voltammetry, J. Chem. Educ. 60 (1983) 702-
706.
[243] L. Meng, N. Gan, T. Li , Y.Cao , F. Hu, L. Zheng, A three-dimensional, magnetic and
electroactive nanoprobe for amperometric determination of tumor biomarkers, Int. J.
Mo/. Sci. 12 (2011) 362-375.
[244] G. Li, P. Miao, Electrochemical Analysis of Proteins and Cells, SpringerBriefs in
Molecular Science, (2013).
[245] S. Lee, J . Sung and T. Park, Nanomaterial-based biosensor as an emerging tool for
biomedical applications, Ann. Biomed. Eng., 40 (2012) 1384-1397.
91

[246] K. Peckova, J. Musilova, J. Barek, Boron-doped diamond film electrodes-new tool for
voltammetric determination of organic substances, Crit. Rev. Anal. Chem. 39 (2009)
148-172.
[247] J. Zima, I. Svancara, J. Barek, K. Vytras, Recent advances in electroanalysis of
organic compounds at carbon paste electrodes, Crit. Rev. Anal. Chem. 39 (2009) 204-
227.
[248] A. Liu, Towards development of chemosensors and biosensors with metal-oxide
based nanowires or nanotubes, Biosens. Bioelectron. 24 (2008) 167-177.
[249] L. Agui, P. Yanez-Sedeno, J. Pingarron, Role of carbon nanotubes in electroanalytical
chemistry: A review, Anal. Chim. Acta. 622 (2008) 11-47.
[250] V. Gupta, R. Jain, K. Radhapyari, N. Jadon and S. Agarwal, Voltammetric techniques
for the assay of pharmaceuticals--a review, Anal. Biochem. 408 (2011) 179-196.
[251] B. Uslu and S. Ozkan, Electroanalytical methods for the determination of
pharmaceuticals: A review of recent trends and developments, Anal. Lett. 44 (2011)
2644-2702.
[252] B. Dogan-Topal, S. Ozkan and B. Uslu, The analytical applications of square wave
voltammetry on pharmaceutical analysis, Open Chem. Biomed. Methods J. 3 (2010)
56-73.
[253] D. Souza, L. Codognoto, A. Malagutti, R. Toledo, V. Pedrosa, R. Oliveira, L. Mazo,
L. A vaca and S. Machado, Voltametria de onda quadrada. Segunda parte: aplica<;oes.
Quimica Nova 27 (2004) 790-797.
[254] S. Ozkan, B. Uslu and H. Aboul-Enein, Analysis of pharmaceuticals and biological
fluids using modem electroanalytical techniques, Crit. Rev. Anal. Chem. 33 (2003)
155-181.
[255] M.A. Mhammedi, A. Chtaini, Electrochemical studies of adsorption of paraquat onto
Ca10 (PO4)6(OH)2 from aqueous solution, Leonardo Journal of Sciences 12 (2008) 25-
34.
92

[256] A. Lasia, B.E. Conway, J.O.M. Bockris, R. White, Electrochemical impedance
spectroscopy and its applications, Modern Aspects of Electrochemistry 32 (1999)
143-248.
[257] R. Wiart, Elementary steps of electrodeposition analysed by means of impedance
spectroscopy, Electrochim Acta. 35 (1990) 1587-1593.
[258] F. Huet, A review of impedance measurements for determination of the state-of
charge or state-of-health of secondary batteries, J. Power Sources 70 (1998) 59-69.
[259] LS. Chang, J.K. Jang, G.C. Gil, M. Kim, H.J. Kim, B.W. Cho, B.H. Kim, Continuous
determination of biochemical oxygen demand using microbial fuel cell type biosensor,
Biosensors & Bioelectronics, 19 (2004) 607-613.
[260] J.E.B. Randles, Kinetics of rapid electrode reactions. Discuss. faraday Soc. 1 (1947)
11-19.
[261] W. Zhao, Z. Ai, J. Dai. M. Zhang, EIS Nyquist plots for Au/N-TiO2 in dark and under
the irradiation of visible light, ACS Appl. Mater. Interfaces 7 (2014) 6909-6918.
[262] S.Q. Hu, Z.Y. Wu, Y.M. Zhou, Z.X. Cao, G.L. Shen, R.Q. Yu, Capacitive
immunosensor for transferrin based on an o-aminobenzenthiol oligomer layer, Anal.
Chim. Acta. 458 (2002) 297-304.
[263] M.H. Razali, M.N. Ahmad-Fauzi, A.R. Mohamed, S. Sreekantan, Physical properties
study of TiO2 nanoparticle synthesis via hydrothermal method using TiO2
microparticles as precurso, Adv. Mater. Res. 772 (2013) 365-370.
[264] M.M. Khorasani, M. Noroozifar, M. Yousefi, A simple new method to synthesize
nanocrystalline ruthenium dioxide in the presence of octanoic acid as organic
surfactant, Int. J. Nanosci. Nanotechnol. 7 (2011) 167-172.
[265] W.L.F. Armarego, C.L.L. Chai, Purification oflaboratory chemicals, (2003).
[266] Q. Yu, M. Shia, M. Denga, M. Wanga, H. Chena, Morphology and conductivity of
polyaniline sub-micron fibers prepared by electrospinning, Mater. Sci. Eng. B 150
(2008) 70-76.
93

[267] S. Nam, S.Cho, J. Boo, Growth behavior of titanium dioxide thin films at different
precursor temperatures, Nanoscale Research Letters 7 (2012) 89-95.
[268] M. Khorasani-Motlagh, M. Noroozifar, M. Y ousefi, A simple new method to
synthesize nanocrystalline ruthenium dioxide in the presence of octanoic acid as
organic surfactant, Int. J. Nanosci. Nanotechnol. 7 (2011) 167-172.
[269] K. Huang, M.X. Wan, Self-assembled polyaniline nanostructures with
hotoisomerization function, Chem. Mater. 14 (2002) 3486-3492.
[270] P. A McCarthy, J Huang, S. C Yang, H. L, Wang, Synthesis and Characterization of
Water-Soluble Chiral Conducting Polymer Nanocomposites, Langmuir 18 (2002)
259-263 .
[271] G. C Li, Z. K Zhang, Synthesis of dendritic polyaniline nanofibers in a surfactant gel,
Macromolecules 37 (2004) 2683-2685.
[272] S. Trakhtenberg, Y. Hangun-Balkir, J.C. Warner, F.F Bruno, Kumar, R Nagarajan, L.
A samuelson, Photo-cross-linked immobilization of polyelectrolytes for enzymatic
construction of conductive nanocomposites, J. Am. Chem. Soc. 127 (2005) 9100-9104.
[273] K. Balasubramanian, M. Burghard, Chemically functionalized carbon nanotubes,
Small l (2005) 180-192.
[274] F. Abuilaiwi, T. Laoui, M. Al-HArthi, A. Mautaz, Modification and functionalization
of multiwalled carbon nanotube (MWCNT) via fischer esterification, The Arabian
Journal for Science and Engineering 35 (2010) 37-48.
[275] J. Kathi, K.Y. Rhee, J.H. Lee, Effect of chemical functionalization of multi-walled
carbon nanotubes with 3-aminopropyltriethoxysilane on mechanical and
morphological properties of epoxy nanocomposites, Composites 40 (2009) 800-809.
[276] H. Zengin, W. Zhou, J. Jin, R. Czerw, D.W. Smith. Jr, L. Echegoyen, D.L. Carroll,
S.H. Foulger, J. Ballato, Carbon nanotube doped polyaniline, Adv. Mater. 14 (2002)
1480-1483.
[277] N.H. Duong, T.T. Nguyen, D.T. Nguyen, H.T. Le, Effect ofTiO2 on the gas sensing
features of TiO2/P ANi nanocomposites, Sensors 11 (2011) 1924-1931.
94

[278] T.M. Wu, H.L. Chang, and Y.W. Lin, Synthesis and characterization of conductive
polypyrrole/multi-walled carbon nanotubes composites with improved solubility and
conductivity, Compos. Sci. Technol. 69 (2009) 639-644.
[279] M. Endo, K. Takeuchi, T. Hiraoka, T. Furuta, T. Kasai, X. Sun, C.H. Kiang, M.S.
Dresselhaus, Stacking nature of graphene layers in carbon nanotubes and nanofibers,
J. Phys. Chem. 58 (1997) 1707-1712.
[280] H. Yang, H. Zeng, Preparation of hollow anatase TiO2 nanospheres via ostwald
ripening, J. Phys. Chem. B 108 (2004) 3492-3495.
[281] S.B. Kondawar, M.D. Deshpande, S.P. Agrawal, Transport properties of conductive
polyaniline nanocomposites based on carbon nanotubes, Int. J. Compos. Mater. 2
(2012) 32-36.
[282] L. Chung-Kung, W. Cheng-Cai, L. Meng-Du, J. Lain-Chuen, L. Shin-Shou, H. Shui
Hung, Effects of sodium content and calcination temperature on the morphology,
structure and photocatalytic activity of nanotubular titanates, J. Colloid Interface Sci.
316 (2007) 562-569.
[283] M. Khorasani-Motlagh, M. Noroozifar, M. Yousefi, A simple new method to
synthesize nanocrystalline ruthenium dioxide in the presence of octanoic acid as
organic surfactant, Int. J. Nanosci. Nanotechnol. 7 (2011) 167-172
[284] M. Musameh, N.S. Lawrence, J. Wang, Electrochemical activation of carbon
nano tubes, Electrochem. Commun. 7 (2005) 14-18.
[285] W. Sun, Y. Li, Y. Duan, K. Jiao, Direct electrochemistry of guanosine on multi
walled carbon nanotubes modified carbon ionic liquid electrode, Electrochim. Acta 54
(2009) 4105-4110.
[286] S.Z. Kang, Z. Cui, J. Mu, Electrochemical behavior of K3[Fe(CN)6] on the electrode
coated with modified multi-walled carbon nanotubes, J. Dispersion Sci. Technol. 28
(2007) 573-576.
[287] M.A Mohammad, K Alireza, Electrocatalytic properties of functionalized carbon
nanotubes with titanium dioxide and benzofuran derivative/ionic liquid for
95

. simultaneous determination of isoproterenol and serotonin, Electrochim. Acta 130
(2014) 634-641.
(288] D. Tang, R. Yuan, Y. Chai and Y. Fu, Study on electrochemical behavior of a
diphtheria immunosensor based on silica/silver/gold nanoparticles and polyvinyl
butyral as matrices, Electrochem. Commun. 7 (2005) 177-182.
(289] A.J. Bard, L.R. Faulkner, Bard, Allen J. , and Larry R. Faulkner. Basic potential step
methods, Electrochemical Methods: Fundamentals and Applications (2001) 156-225.
(290] S. Hou , M.L. Kasner, S. Su, K. Patel, R. Cuellari, Highly sensitive and selective
dopamine biosensor fabricated with silanized graphene, J. Phys. Chem. C 114 (2010)
14915-14921.
(291] Z. Xu, N. Gao, H. Chen, S. Dong, Biopolymer and carbon nanotube interface prepared
by self-assembly for studying the electrochemistry of microperoxidase-11 , Langmuir
21 (2005) 10808-10813.
[292] H. Liu, Y. Wei, P. Li, Y.Zhang, Y. Sun, Catalytic synthesis of nanosized hematite
particles in solution, Mater. Chem. Phys. 102 (2007) 1-6.
[293] L. Wang , J. Bai, P. Huang , H. Wang, L. Zhang, Y. Zhao, Electrochemical behavior
and determination of epinephrine at a penicillamine self-assembled gold electrode, Int.
J. Electrochem. Sci. , 1 (2006) 238-249.
[294] P. Wang, Z. Mai, Z. Dai, Y. Li, X. Zou, Construction of Au nanoparticles on choline
chloride modified glassy carbon electrode for sensitive detection of nitrite, Biosens.
Bioelectron. 24 (2009) 3242-3247.
[295] H.L. Zhang, Y. Liu, G.S. Lai, A.M. Yu, Y.M. Huang, C.M. Jin, Calix (4] arenecrown-
4 ether modified glassy carbon electrode for electrochemical determination of
norepinephrine, Analyst 134 (2009) 2141-2146.
[296] Z. Wen, S. Ci, S. Mao, J. Chen, TiO2 nanoparticles-decorated carbon nanotubes for
significantly improved bioelectricity generation in microbial fuel cells, J. Power
Sources 234 (2013) 100-106
96

[297] Z. Xu, N. Gao, H. Chen, S. Dong, Biopolymer and carbon nanotubes interface
prepared by self-assembly for Studying the electrochemistry of microperoxidase-11 ,
Langmuir 2 (2005) 10808-10813.
[298] B. Ali, M. Somaieh, K. Balal, A. sensitive simultaneous determination of
epinephrine and tyrosine using an iron(Ill) doped zeolite-modified carbon paste
electrode, J Braz. Chem. Soc. 20 (2009) 1862-1869.
[299] M. Sharp, M. Peterson, K. Edstorm, Preliminary determination of electron transfer
kinetics involving ferrocene covalently attached to a platinum surface, J electroanal.
Chem. 95 (1979) 123-130.
[300] U. Chandra, B.E. Kumara Swamy, 0. Gilbert, B.S. Sherigara, Voltammetric
resolution of dopamine in the presence of ascorbic acid and uric acid at poly
(calmagite) film coated carbon paste electrode, Electrochim. Acta 55 (2010) 7166-
7174
[301] S.P. Zhou, H.M. Zhang, X.H. Wang, J. Li, F.S. Wang, Sandwich nanocomposites of
polyaniline embedded between graphene layers and multi-walled carbon nanotubes
for cycle-stable electrode materials of organic supercapacitors, RSC Adv. 3 (2013)
1797-1807.
[302] J.Y. Wei, J.N. Zhang, Y. Liu, G.H. Xu, Z.M. Chen and Q. Xu, Controlled growth of
whisker-like polyaniline on carbon nanofibers and their long cycle life for
supercapacitors, RSC Adv. 3 (2013) 3957-3962.
[303] D.W. Wang, F. Li, J.P. Zhao, W.C. Ren, Z.G. Chen, J. Tan, Z.S. Wu, I. Gentle, G.Q.
Lu, H.M. Cheng, Fabrication of graphene/polyaniline composite paper via In Situ
Anodic electropolymerization for high-performance flexible electrode, ACS Nano. 3
(2009) 1745-1752.
[304] Y.G. Wang, H.Q. Li, Y.Y. Xia, Ordered whiskerlike polyaniline grown on the surface
of mesoporous carbon and its electrochemical capacitance performance, Adv. Mater.
18 (2006) 2619-2623.
[305] H.O. Finklea, D.A. Snider, J. Fedyk, E. Sabatani, Y. Gafni, I. Rubinstein
Characterization of octadecanethiol-coated gold electrodes as microarray electrodes
97

by cyclic voltammetry and ac impedance spectroscopy, Langmuir 9 (1993) 3660-
3667.
[306] O.A. Arotiba, P.G. Baker, B.B. Mamba, E.I. Iwuoha, The application of
electrodeposited poly(propylene imine) dendrimer as an immobilisation layer in a
simple electrochemical DNA biosensor, Int. J. Electrochem. Sci. 6 (2011) 664-683.
[307] Y.F. Zhao, Y.Q. Gao, D.P. Zhan, H. Liu, Q. Zhao, Y. Kou, Y.H. Shao, M.X. Li, Q.K.
Zhuang, Z.W. Zhu, Selective detection of dopamine in the presence of ascorbic acid
and uric acid by a carbon nanotubes-ionic liquid gel modified electrode, Talanta 66
(2005) 51-57.
[308] S. Shahrokhian, H.R. Zare-Mehrjardi, Cobalt salophen-modified carbon-paste
electrode incorporating a cationic surfactant for simultaneous voltammetric detection
of ascorbic acid and dopamine, Sens. Actuators B: Chem. 121 (2007) 530-537.
[309] T. Selvaraju, R. Ramaraj, Electrochemically deposited nanostructured platinum on
Nafion coated electrode for sensor applications, J. Electroanal. Chem. 585 (2005)
290-300.
98

APPENDICES
Appendix 1
Formulae used
1. Tafel equation: b Ep = K+- logv
2
n11/
11Arv 2. Laviron equation: Ip = --UT
3. limit of detection: LoD = 336/m
99

Appendix 2
1. Synthesis, spectroscopic and electrochemical characterization of ternary Au-P ANITiO2 nanocomposite Authors: Tebogo P. Tsele 1
'2, Omolola E. Fayemi 1.2, Abolanle S. Adekunle 1
'2'3 Eno.
E. Ebenso 1'2'• ·
Conference: MAPET-15 3rd International Symposium on Electrochemistry (26-28 May 2015, University of the Western Cape, SOUTH AFRICA) Poster presentation by: Palesa Tsele
2. Electrochemical detection of Epinephrine using Polyaniline nanocomposite films doped with TiO2 and RuO2 Nanoparticles on Multi-walled Carbon Nanotube Tebogo P. Tsele, Abolanle S. Adekunle, Omolola E. Fayemi, Eno E. Ebenso Electrochimica Acta 243 (2017) 331-348
Eltctrocl'lmia Acta 243 (2017) 331 -348
Contents lists available at ScienoeDirect
Electrochimica Acta
jou rn al hom epage : www .elsev ier .com/locate/electacta
Electrochemical detection of Epinephrine using Polyaniline nanocomposite films doped with Ti02 and Ru02 Nanoparticles on Multi-walled Carbon Nanotube
Tebogo P. Tselea,b, Abolanle S. Adekunlea,b,c_ Omolola E. Fayemia.b. Eno E. Ebensoa.b.• • Dtpartm,nr o/O!tmisrr)', School of Marhtmoriall end Physical Sritlt<l'i FOCJJ/ty of ,lgricu/111r,, Scitnct ond Tn:hno/ogy, Horrh-W<Sr Unhmity (Ma/ik,ni CampusJ lfl1111t Ba, X2046, Mmabarho 2735, South !{rica b MortrioJ Scitnct lnnowrion & Maddin& (M<ISIM) Focus ma. fOCJJlty of '«rl<Ullllrt. Scitnet and Tn:hnology. North-West Uniwnity (Majik,ni Campusl Prtvart Ba, X2046. Mmabarflo 2735, South ,lfrk'a < O.parrmtnt of O,,niwy, 0/Jqftni Awo/owo University. /It-If,. Nlrtria
ARTICLE INFO ABSTRACT
Arridt hisro,y:
100
~ CrossMarl<