Further assessment of emerging CO2 capture technologies for ...
Upload
khangminh22Category
view
0download
0
JOHANNES KEPLER
UNIVERSITY LINZ
Altenberger Str. 69
4040 Linz, Austria
www.jku.at
DVR 0093696
Submitted by
Dominik Wielend
Submitted at
Linz Institute for Organic Solar
Cells (LIOS) / Institute of
Physical Chemistry
Supervisor
o.Univ. Prof. Mag. Dr. DDr. h.c.
Niyazi Serdar Sariciftci
Co-Supervisor
Dogukan Hazar Apaydin MSc
October 2017
Electrochemical capture
and release of CO2 using
organic pigments
Master Thesis
to obtain the academic degree of
Diplom-Ingenieur
in the Master’s Program
Technical Chemistry

October 4, 2017 Dominik Wielend ii/74
STATUTORY DECLARATION
I hereby declare that the thesis submitted is my own unaided work, that I have not used other than
the sources indicated, and that all direct and indirect sources are acknowledged as references.
This printed thesis is identical with the electronic version submitted.
…………………………. …………………………….
Place, Date Signature

October 4, 2017 Dominik Wielend iii/74
Acknowledgements
First of all, I would like to express my gratitude to o.Univ. Prof. Mag. Dr. DDr. h.c. Niyazi Serdar
Sariciftci: for supporting and encouraging me towards science over many years and giving me the
opportunity to work and develop at the Linz Institute of Organic Solar Cells (LIOS) / Institute of
Physical Chemistry.
I deeply want to acknowledge Dogukan Hazar Apaydin MSc as the best supervisor. Thank you for
not only guiding me through this project but also giving inputs for a deeper knowledge about the
entire field. Thank you as well for your hands-on demonstration of all the techniques used, help in
the laboratory and also for great discussions about this and various other topics.
In the case of knowledge about sublimation / evaporation station and evaporation of most of the
compounds used, this work would not have been possible without the help of Dr. Cigdem Yumusak
and DI Halime Coskun Aljabour.
Great thanks go to the members of the “CO2 sub-group”, namely Dr. Dong Ryeol Whang, Dr. Liviu
Dumitru, Hathaichanok Seelajaroen MSc and Nikolas Heitzmann BSc, for the supportive
environment in the laboratory as well as all the nice discussions and meetings in- and outside the
laboratory. Furthermore, I would like to thank Patrick Denk, Gabriele Hinterberger and Gerda
Kalab for their help in organizing the equipment needed and all the technical support given.
Sarah Gusner, Birgit Paulik and Isolde Wandling helped me a lot in administrative and bureaucratic
concerns – thank you very much! Of course, I want to thank the whole LIOS team for the nice time
here and letting me be part of the group.
Great thanks also go to Univ.-Prof. Dr. Günther Knör and his team, namely Dr. Mariusz Wolff and
Dr. Elham Kianfar, for their help concerning UV-Vis spectroelectrochemistry and letting me
conduct experiments in their facilities.
Special thanks go to Assoz. Univ. Prof. Dr. Uwe Monkowius for providing lots of help around XRD;
not only for operating the measurements but also for fruitful discussions.
All this work would not have been possible without the wonderful support from my partner, family,
friends and colleagues. At this point I especially want to emphasize the support provided by my
parents. Thank you all for your encouragement and help throughout the years!

October 4, 2017 Dominik Wielend iv/74
Abstract
Cost-effective capturing methods for carbon dioxide at ambient conditions might be a key for a
sustainable carbon economy. As electrochemically activated nucleophiles for CO2 binding are
emerging the scientific community, selected organic pigments already in use for organic
electronics are investigated. This work focusses on pigment groups which contain at least one
carbonyl moiety.
The first screening of the materials is done electrochemically with cyclic voltammetry (CV) and
scanning electron microscopy (SEM). In-depth studies on the pigment of choice are done with
UV-Vis and IR spectroelectrochemistry and proof for reversible electrochemical capture and
release of carbon dioxide with IR.
Going one step further towards CO2 reduction, the catalytic behaviour of pigment in junction with
catalytically active metals like gold, platinum, nickel, tin and copper is investigated.

October 4, 2017 Dominik Wielend v/74
Table of Contents
Abstract ..................................................................................................................................... iv
Table of Contents ........................................................................................................................ v
1. Introduction ........................................................................................................................... 1
1.1. Carbon dioxide capture and storage (CCS) ................................................................... 1
1.1.1. Industrial capturing approaches .......................................................................... 2
1.1.2. Carbonyl capturing approaches .......................................................................... 4
1.1.3. Further research on capturing approaches ......................................................... 9
1.2. Carbon dioxide capture and utilization (CCU) .............................................................. 11
1.2.1. Technical CO2 utilization ................................................................................... 11
1.2.2. Heterogeneous CO2 reduction .......................................................................... 13
1.2.3. Homogeneous CO2 reduction ........................................................................... 14
1.2.4. Enzymatic CO2 reduction .................................................................................. 15
1.3. Organic semiconductors .............................................................................................. 16
1.3.1. Application ........................................................................................................ 16
1.3.2. Industrial synthesis - selected pigments ........................................................... 18
2. Experimental ....................................................................................................................... 21
2.1. Materials ...................................................................................................................... 21
2.2. Electrode preparation .................................................................................................. 22
2.3. Evaporation of organic materials ................................................................................. 22
2.4. Electrochemical characterization ................................................................................. 23
2.5. Scanning electron microscopy (SEM) and energy dispersive X-ray spectroscopy
(EDX) .......................................................................................................................... 24
2.6. Single crystal x-ray diffraction (XRD) ........................................................................... 24
2.7. Chromatography .......................................................................................................... 25
2.7.1. Gas injection gas chromatography ................................................................... 25
2.7.2. Liquid injection gas chromatography................................................................. 25
2.7.3. Ion chromatography .......................................................................................... 25
2.8. UV-Vis spectroscopy ................................................................................................... 26
2.9. Fourier transform infrared spectroscopy (FTIR) ........................................................... 26
2.10. Metal island depositions ................................................................................... 27
2.10.1. Platinum ........................................................................................................... 27
2.10.2. Nickel ............................................................................................................... 27
2.10.3. Tin .................................................................................................................... 27
2.10.4. Copper ............................................................................................................. 28

October 4, 2017 Dominik Wielend vi/74
3. Results and discussion ....................................................................................................... 29
3.1. Blank electrode characterization .................................................................................. 29
3.2. Perylenetetracarbonyldiimide (PTCDI) ......................................................................... 31
3.3. Adamantyl-Diketopyrrolopyrrole (DPP) ........................................................................ 34
3.4. Anthraquinone ............................................................................................................. 36
3.4.1. Electrochemical characterization ...................................................................... 36
3.4.2. Morphological changes ..................................................................................... 39
3.4.3. Single crystal XRD ............................................................................................ 40
3.4.4. UV-Vis spectroelectrochemistry ........................................................................ 41
3.4.5. IR spectroelectrochemistry ............................................................................... 45
3.4.6. Investigation of CO2 release ............................................................................. 49
3.4.7. Investigation of CO2 reduction .......................................................................... 50
3.4.8. Surface functionalization with metal islands ...................................................... 51
3.4.8.1. Platinum islands ................................................................................. 51
3.4.8.2. Nickel islands ..................................................................................... 54
3.4.8.3. Tin islands .......................................................................................... 57
3.4.8.4. Copper islands ................................................................................... 60
4. Conclusion .......................................................................................................................... 64
5. Bibliography ........................................................................................................................ 65

October 4, 2017 Dominik Wielend 1/74
1. Introduction
The global warming caused by anthropogenic greenhouse gases is a topic of big discussion in
world politics of the 21st century. Examples for anthropogenic greenhouse gases are carbon
dioxide (CO2), chloroflourocarbons (CFCs), methane (CH4), nitrous oxide (N2O) and even water
(H2O). Although water has larger greenhouse effect compared to CO2 and methane (x30 more
effective, carbon dioxide seems to be the greenhouse gas mainly discussed by scientists and
politicians. The main reason for this is the residence time in the atmosphere. Water vapour has a
residence time of few days while carbon dioxide has a significantly longer residence time of several
years in atmosphere [1], [2].
Besides, the increase of anthropogenic carbon dioxide in the atmosphere is a much-debated topic.
Attempting this challenge from a technical point of view, the tasks are split into two. At first CO2 is
captured, saturated and stored in a system. By this, the enriched CO2 system simplifies the second
step, the reaction of carbon dioxide to a useful product.
In this context, the terms of carbon capture and storage (CCS) and carbon capture and utilization
(CCU) have established [3]. Therefore this classification is also used in this work.
1.1. Carbon dioxide capture and storage (CCS)
This first sub-chapter will highlight some selected possibilities how to capture carbon dioxide.
According to chapter 1. it might appear that enrichment of CO2 from the atmosphere is the main
industrial use. However, up to now the focus for industrial scale carbon dioxide capture is to apply
it after combustion plants as a much higher concentration of CO2 is present. The international
Energy Agency (IEA) set a global goal, that the concentration of carbon dioxide in the atmosphere
should stay below 450 ppm. To achieve this target, they claim that capturing carbon dioxide before
exhaust to the environment is the only way [3].
Peter Eisenberger has built a prototype for “sucking” out carbon dioxide from air with amines.
Nevertheless, other scientists as Robert Socolow are sceptical if CO2 capture from ambient air
can ever be cost competitive with carbon dioxide capture after combustion plants [4].
In order to achieve a desirable higher CO2 amount in combustion units, also pre-treatment is
possible. For example, using pure oxygen for combustion avoids the dilution by nitrogen. The
conversion of fuels to syngas and afterwards converting the carbon monoxide (CO) to hydrogen
and carbon dioxide by the so-called water-gas shift reaction enables CO2 separation prior to
combustion [3], [5]:
𝐶𝑂 + 𝐻2𝑂 ⇌ 𝐶𝑂2 + 𝐻2
To focus on some of the most relevant possibilities to capture carbon dioxide in the upcoming
chapters will give a short overview on the use of CO2 enriched sources or after industrial
combustion plants.
(1.1_1)

October 4, 2017 Dominik Wielend 2/74
1.1.1. Industrial capturing approaches
A method well-known from laboratory daily life is to feed acidic gases (e.g. CO2, SO2, H2S, HCl…)
through an aqueous solution of sodium or potassium hydroxide. The hydroxides are readily
reacting with CO2 and the other acidic gases to form salts of the corresponding acids [6].
Considering carbon dioxide as the gas of main interest in this thesis, the following equation
describes the dissolving process of CO2 in a potassium carbonate solution:
𝐾2𝐶𝑂3 + 𝐶𝑂2 + 𝐻2𝑂 ⇌ 2 𝐾𝐻𝐶𝑂3
To allow comparison between different capturing methods, alkali metal carbonates are able to
bind one mole CO2 per mole carbonate [3], [5]. Although the principles of this reaction are known
centuries before, in 1950 Benson and Field developed a technical process for removal of CO2 and
H2S from natural gas and syngas by this method. This so-called UOP Benfield process is still in
use and captures the CO2 at 105 °C and high pressure (20 bar). After the capturing regeneration
at high temperature is performed [5], [7], [8].
To underline the relevance of this simple process, up to now more than 700 such units are in use
and more than 50 natural gas extracting plants use the Benfield process [7].
The next method to be discussed is the well-established Rectisol process, firstly introduced by
Lurgi and later also Linde in 1950. In this process, the gas is cleaned in an absorption column by
pressurized methanol at -75 °C removing mainly CO2 and H2S. Thereby no chemical reaction is
taking place as the acidic gases are just dissolved in the methanol - which is referred to as physical
absorption [3], [8].
Due to the lack of new chemical bond formation, the regeneration does not absolutely require
input of heat but just stepwise desorption by depressurizing – also referred to as flashing. (Unless
high quality of the absorbent is required) [3], [8].
Rectisol plants can be operated in two different modes. In the simple Rectisol process both, CO2
and H2S, are simultaneously stripped by a single flash tower resulting in a mixed gas stream. The
stepwise pressure reduction of the selective Rectisol process allows selective desorption of CO2
and H2S which is favourable as this makes a further separation step redundant. Thereby this
process delivers a pure carbon dioxide gas stream and a second sulphur rich gas stream, which
can be further used for sulphur production [8].
This Rectisol process is well-fitted for CO2 removal from syngas plants and therefore widely used.
In 2005, more than 60 syngas production plants were using the Rectisol process purifying more
than 75% of the global syngas production. Although the procedure is operating at low temperature,
due to thermodynamics in gas expansion and compression only very low energy input is needed.
Furthermore, the low temperature prevents large methanol losses due to evaporation. Methanol
(1.1.1_2)

October 4, 2017 Dominik Wielend 3/74
is considered to be a suitable fluid for this application not only because of the absorption
coefficients for CO2 and H2S but also due to its low viscosity [8].
Nevertheless, the required changes in pressure in this scale are also very energy consuming and
processes using solvents operating at ambient temperatures are still favourable [3], [5], [8].
Another method for absorbing CO2 in industrial plants is offered using organic amines like
monoethanolamine (MEA), diethanolamine (DEA) or more complicated amine structures. In
contrast to the methanol in the Rectisol process, the amines used are forming a chemical bond
upon absorption resulting in a carbamate structure [8], [9]:
Figure 1: Reaction of MEA with carbon dioxide.
MEA is used to illustrate the general reaction. Compared to the Benfield process, two moles of
amine are needed to capture one mole of CO2 instead of only one. Furthermore, the carbamate
formation reaction shown in Figure 1 is highly exothermic [3], [5], [8].
As chemical bonds are broken, the back-reaction in case of regeneration requires a high input of
thermal energy [3], [5]. Beside energy losses caused by the regeneration, mono- and
diethanolamines are also degrading upon reaction with carbon dioxide. For this reason, tertiary or
hindered amines are frequently used as no carbamate formation is possible. Processes licensed
by companies are usually using tailor-made amines or blends of different amines to adjust the
selectivity for CO2 / H2S and the lifetime [8].
Beside the technologies mentioned above a further great variety of processes and solvents is
established. Just to name a few more, polyethylene glycol derivatives (Selexol) or
N-methyl 2-pyrrolidone (NMP) (Purisol) are solvents capable of physical absorption at ambient
temperature. Beside classical absorption methods also adsorption with molecular sieves or
membrane technology can also be used for removal of CO2 and other gases [3], [5], [8].
To determine the CO2 capture process of choice in an industrial plant, several factors must be
considered. Physical absorption requires high partial pressures of carbon dioxide according to
Henry’s law, ideally above 8 bar. Chemical absorptions are usually limited by the capture-reaction
kinetics and the thermal energy demand. Furthermore, in both cases the selectivity for other gases
beside CO2 has to be considered choosing the chemicals of choice [3], [8].

October 4, 2017 Dominik Wielend 4/74
1.1.2. Carbonyl capturing approaches
Beside the established industrial attempts to capture carbon dioxide often requiring energy
demanding thermal recovery fruitful research is going on searching for alternatives. One possibility
is the electrochemical capture and release of carbon dioxide. Rheinhardt et al. (2017) and Apaydin
et al. (2014) summarize research trends in electrochemical CO2 capture [9], [10]. In this chapter, a
short historical development of publications concerning conjugated carbonyl compounds will be
given.
Before highlighting the historical avenue of capturing carbon dioxide with carbonyl bearing
compounds, a small side note will be given. In mitochondria of living cells, beside others like NAD,
the compound ubiquinone is used as lipophilic electron shuttle. Due to its benzoquinone core it is
able to undergo and moderate one electron reductions as well as two electron reductions or
oxidations [11]. The chemical structure of ubiquinone is shown in Figure 2:
Figure 2: Chemical structure of the natural occurring electron shuttle ubiquinone [11].
The reduction and protonation reaction pathways are similar to the ones of anthraquinone shown
in Figure 45.
The Kolbe-Schmitt reaction, illustrated in Figure 3, is a historically very prominent reaction as it
enabled the industrial scale production of salicylic acid in 1890 [3], [12]:
Figure 3: Kolbe-Schmitt reaction of phenol with CO2 [3], [12].
Although the reaction shown in Figure 3 does not involve a carbonyl group, the deprotonated
hydroxyl group in the phenol is the driving force for reacting with carbon dioxide [12].

October 4, 2017 Dominik Wielend 5/74
In 1984 Harada and co-workers report the reductive reaction of α,β-unsaturated aromatic ketones
with CO2 in acetonitrile [13]. Several derivatives are investigated by Harada et al. (1984) and the
reaction scheme for the simplest molecule tested is shown in Figure 4:
Figure 4: Electrochemical reduction and reaction with CO2 of benzylideneacetone [13].
It is reported that based on electrochemical studies, initially the anion radical is formed followed
by reaction with CO2 [13]. In contrast to the Kolbe-Schmitt reaction in Figure 3, the carboxylic acid
is in β position to the carbonyl and not in α or ortho position to the OH group.
In 1989 Mizen and Wrighton report the addition of carbon dioxide to 9,10-phenanthrenequinone
(PAQ) upon electrochemical reduction [14]. The overall reaction reported is summarized in Figure
5:
Figure 5: Electrochemical reduction of 9,10-phenanthrenequinone followed by CO2 addition [14].
Like Harada et al. (1984), also Mizen and Wrighton (1989) report that the first step is a one electron
reduction forming an anion radical. In the second step, one molecule of carbon dioxide is adding
which results in a movement of the radical to the second oxygen. After another one electron
reduction, this second oxygen anion is reacting with a second molecule of CO2 [14].
This PAQ molecule is, per contra to the previous reactions shown, adding to carbon dioxide with
an oxygen atom forming a carbonate derivative. Highly interesting is the fact, that in contrast the
previous reactions and chemical absorption media in chapter 1.1.1. one molecule of 9,10-
phenanthrenequinone is able to bind two molecules of CO2.

October 4, 2017 Dominik Wielend 6/74
Gurkan et al. (2015) come up with a report about a complete electrochemical capture and release
cell using 1,4-naphthaquinone (NQ) in ionic liquids [15]. The fully reversible chemical reactions are
summarized in Figure 6:
Figure 6: Electrochemical reduction of 1,4-naphthaquinone followed by CO2 addition [15].
The electrochemical CO2 capture process of 1,4-naphthaquinone is mechanistically nearly
identical to the one of PAQ in Figure 5. Again, the sequence one electron reduction, carbon dioxide
addition, one electron reduction and finally again CO2 addition is reported. Gurkan et al. (2015)
report the use of this mechanism in a cell with porous electrode using ionic liquids as electrolyte.
On the cathode, the forward reaction capturing CO2 shown in Figure 6 is taking place. This
naphthaquinone-carbonate derivative is diffusing to the anode where CO2 is oxidatively released
(backward reaction). The reason for using ionic liquids is higher solubility of NQ and CO2 and less
solvent loss due to very high vapour pressure. Furthermore, they report that the ionic liquid used
is dissolving roughly three times more NQ than PAQ [15].
Up to now, all the reported carbon dioxide capture approaches in this chapter work
homogeneously in solution. In 2014 Apaydin and co-workers report the electrochemical CO2
capture with the industrial pigment quinacridone (QNC) evaporated on an indium tin oxide (ITO)
electrode. This quinacridone is a hydrogen bonded pigment mainly used in magenta ink tanks.
The following Figure 7 shows the proposed electrochemical reduction and CO2 addition of the
carbonyl pigment QNC [10]:
Figure 7: Electrochemical reduction and CO2 capture by quinacridone [10].

October 4, 2017 Dominik Wielend 7/74
Although the postulated bis-carbonate structure is not detected in any way, cyclic voltammetry in
acetonitrile is confirming the reaction shown in Figure 7. The CV cycles reported by Apaydin et al.
(2014) are illustrated in the following Figure 8:
Figure 8: Cyclic voltammetry of QNC on ITO in 0.1 M TBAPF6 / MeCN under different conditions. Reprinted with
permission of Wiley-VCH Verlag [10].
Under nitrogen, the reduction and re-oxidation of QNC is visible but under CO2 conditions those
features disappear. Repurging the system with nitrogen and oxidatively releasing the CO2
recovers again the electrochemical features of QNC. The actual amounts of CO2 released are
quantified by FTIR and are 0.7 and 1.43 moles CO2 per mole QNC under thermal and
electrochemical release [10].
This result means that ¾ of the theoretical amount of carbon dioxide can be captured and released
by this pigment electrochemically. Although QNC would be available for large-scale production,
the use of organic solvents like acetonitrile is not favourable for industrial application. Furthermore,
QNC is, as a so-called vat dye, soluble in its reduced state and therefore only stable on the
heterogeneous electrode for a limited amount of cycles [10].
Three years later, again Apaydin and co-workers (2017) investigate a tailor-made naphthalene
bisimide derivative, 2,7-bis(4-(2-(2-ethylhexyl)thiazol-4-yl)phenyl)benzo[lmn][3,8]-phenanthroline-
1,3,6,8(2H,7H)-tetraone (NBIT) in an aqueous solution, shown in Figure 9 [16]:
Figure 9: Chemical structure of the naphthalene bisimide derivative NBIT.

October 4, 2017 Dominik Wielend 8/74
The reported reduction and CO2 capture mechanism as well as the cyclic voltammograms are
shown in the following Figure 10:
Figure 10: Cyclic voltammetry of NBIT on glassy carbon in 0.1 M Na2SO4 / H2O under different conditions (left). On the
right side the capture mechanism according to Apaydin et al. (2017) is shown [16].
This reductive capture of carbon dioxide shown in Figure 10 is the first one in this work reported
in an aqueous solution. Again, this NBIT pigment is used in heterogeneous way on an electrode
and is more stable upon dissolving under reducing conditions. Furthermore, in contrast to QNC in
Figure 8, NBIT shows two distinct reduction and re-oxidation peaks.
Although in this core four carbonyl groups are present, only two of them can be addressed
electrochemically. The capability of this pigment working under ambient conditions in aqueous
solution would be beneficial for a possible large-scale industrial application [16]. Nevertheless, the
synthesis of NBIT for large scale might be challenging.
Motivated by the previous studies on electrochemical capture and release of carbon dioxide this
thesis aims to seek answers for the following questions: Are further organic pigments capable of
reversible electrochemical capture and release of CO2 under ambient aqueous conditions, which
are cheap and available in industrial scale?
Is it possible to address the captured carbon dioxide electrochemically to reduce it forming fuels?

October 4, 2017 Dominik Wielend 9/74
1.1.3. Further research on capturing approaches
Beside carbonyl bearing molecules also a great variety of different approaches towards capturing
carbon dioxide exist. Before showing further recent scientific achievements capturing carbon
dioxide, the different types of solvents used for carbon dioxide capture should be highlighted
briefly. As already discussed in chapter 1.1.1. organic solvents show a high physical solubility
towards CO2 but aqueous amine solutions are capable of chemical absorbing carbon dioxide. Both
ways have advantages for different conditions but in general cheap and non-toxic solvents like
water are preferred in technical applications. In case of amines used, many have a significant
vapour pressure which might cause severe health problems.
Bates et al. (2002) are the first to suggest the use of CO2 capturing amines as cations in ionic
liquids (IL). After 3 h the maximum uptake of carbon dioxide for carbamate forming amines,
0.5 mols CO2 per mole amine is reached. They simply see it as an alternative way of capturing
carbon dioxide with amines and releasing it thermally [17].
As already discussed in chapter 1.1.2. Gurkan et al. (2015) use an ionic liquid as solvent capable
of dissolving higher quantities of naphthaquinone [15]. Ranjan et al. (2015) report a one electron
reduction of 4,4’-bipyridine followed by addition to carbon dioxide [18]:
Figure 11: Electrochemical reduction of 4,4’-bipyridine followed by CO2 addition [18].
This radical CO2 adduct is reported to be stable at room temperature in the ionic liquid used as
electrolyte. In contrast to a similar bipyridine molecule reported by Ishida et al. (1994) one mole
carbon dioxide can be captured per mol electron injected instead of only ½. In their case the
neutral radical generated is not nucleophilic enough to form a stable adduct CO2 – for this a second
electron needs to be introduced [9], [19].
As a third class of electrogenerated nucleophiles reported by this group, Singh and co-workers
(2017) investigate and characterize benzyldislfide (BDS) in ionic liquids [20]. The report cyclic
mechanism is summarized in Figure 12:

October 4, 2017 Dominik Wielend 10/74
Figure 12: Electrochemical reduction of benzyldisulfide followed by CO2 addition [9], [20].
This mechanism shown in Figure 12 consists of the initial formation of a thiolate which can perform
addition to carbon dioxide. Although in general oxygen and sulphur show a similar chemical
behaviour, this first report of using thiolates for capturing CO2 might open an avenue for sulphur
compounds in the field, as they frequently tend to build disulphuric bonds.
A completely different approach is reported by Lyndon et al. (2015) [21].
They built metal organic frameworks (MOF’s) based on the dye methyl red and aluminium or
magnesium metal cations. Upon visible light irradiation, the methyl red isomerizes and this
controlled change in MOF morphology opens pores for carbon dioxide incorporation. This method
opens a controlled version of classical gas adsorption on inorganic substrate like e. g. zeolites as
it cannot only be controlled by pressure but also by light triggering [21].

October 4, 2017 Dominik Wielend 11/74
1.2. Carbon dioxide capture and utilization (CCU)
As already outlined in chapter 1. two distinct steps are needed for a sustainable carbon dioxide
economy. Chapter 1.1. deals with the first part of separating and storing CO2 whereas now the
focus lies on the conversion and utilization of carbon dioxide. Carbon dioxide utilization, especially
reduction to valuable fuels is a very present and frequently discussed scientific topic in the
community. As a matter of fact, numerous publications on this topic are published every year which
is why only a brief overview on the topic can be given in this chapter.
1.2.1. Technical CO2 utilization
Carbon dioxide is a versatile chemical that can be used in various niche applications. Besides
using it as heat exchange medium supercritical CO2 can be used for solvent-free extraction of
flavour compounds. A big economical market for carbon dioxide is the production of carbonated
drinks [3].
As those application use the CO2 in an unchanged way one cannot really speak of chemical
utilization. Therefore, some examples for utilizing carbon dioxide as chemical feedstock are given.
One example is the industrial synthesis of salicylic acid shown in Figure 3 which converts some
kilotons of carbon dioxide per year. The largest use of CO2 as educt is the production of urea
shown in Figure 13:
Figure 13: Synthesis of urea from CO2 and ammonia [3].
More than 100 Mt of carbon dioxide are converted by this reaction per year. However, one has to
keep in mind that the production of ammonia emits more CO2 than used for urea when the
hydrogen is produced by steam reforming of methane [3], [22].
The production of carbonate esters also involves carbon dioxide as feedstock. One example is
shown for mechanistic illustration in Figure 14:

October 4, 2017 Dominik Wielend 12/74
Figure 14: Synthesis of propylene carbonate and dimethyl carbonate [3].
Carbonate esters in general can be synthesized by reaction of CO2 with the appropriate epoxide
as shown in Figure 14 for the synthesis of propylene carbonate (PC). PC is frequently used as
solvent for electrochemistry in non-protic media. Further reacting this cyclic carbonate with
alcohols like methanol results in the acyclic carbonate ester and the according diol. The example
of dimethyl carbonate is a frequently used mild methylation reagent [3].
Based on the same reaction mechanism shown in Figure 14 polymerizations with epoxides and
carbon dioxide can be performed [3], [22].
Literature assumes that only less than 1% of the captured carbon dioxide can replace other
chemicals in chemical industry [3], [22]. For this reason alternatives for storing and converting CO2
are required. Conversion back into fuels will not reduce the amount of carbon dioxide in the
atmosphere but can help stabilizing it when regenerative energy sources are used for the CO2
conversion [22].
Technologies exist for converting carbon dioxide to fuels like methane, methanol or formate with
hydrogen [3]. Besides looking for regenerative ways of producing hydrogen also research is done
in direction of directly reducing CO2 to useful fuels [23].
In the following chapters the focus lies on examples for CO2 reduction under ambient conditions
using electrical energy as driving force.

October 4, 2017 Dominik Wielend 13/74
1.2.2. Heterogeneous CO2 reduction
Electrochemically reducing carbon dioxide on heterogeneous metal electrodes is extensively
studied during the last centuries. According the reaction products gained metals can be classified
in certain groups which are summarized by the work of Hori (2010) [24]. Thereby carbon monoxide
(CO), formic acid (HCOOH), methanol (CH3OH) and methane (CH4) are the main products
reported. A more detailed summary on which metals tend to produce which products will be given
in chapter 3.4.8.
Research is focusing on investigation of the origin for the different tendencies of the metals
towards different products. Besides the obvious fact that all products beside CO require a proton
source and therefore protic solvents are needed and the binding properties of reaction
intermediates on the metal surface are determining.
Recently Feaster et al. (2017) report that the binding energy for intermediates can be correlated
with the tendency to form certain products (CO and HCOOH respectively) [25]. They discover that
either a monodentate or bidentate species on the metal electrode is determining the reaction
pathway. Plotting the binding energies of those intermediates versus current densities results in
volcano like plots which are usually known from metal hydride bond strengths for hydrogen
evolution.
In heterogeneous catalysis adsorption mechanisms are significant which are influenced by the
crystallographic orientation of the surface atoms. A work by Liu et al. (2012) calculates the binding
energies of CO2 with metals in specific orientation and compares heterogenous and homogenous
catalysis [26].
These examples are reflecting the current research trends for heterogenous reduction of carbon
dioxide. The mechanistic insights why different metals tend to produce different products are
investigated. Further optimizations of working systems is mainly done by producing defined
(crystallographic) structures [27] and synthesize them in micro or even nanostructured way for
enhanced surfaces and better mechanistic insights [28].
Besides these aforementioned materials scientists also investigate electrodes with immobilized
metal organic frameworks (MOFs) [29] or metal complexes. More details about immobilization
techniques of originally homogenous metal complexes are given in chapter 1.2.3.

October 4, 2017 Dominik Wielend 14/74
1.2.3. Homogeneous CO2 reduction
Speaking of homogenous catalysis is in most cases referring to catalysis by metal complexes.
One of the famous benchmark complex is the so-called Lehn catalyst, a rhenium 2,2’-bipyridine
complex shown in Figure 15:
Figure 15: Structure of the Lehn catalyst.
Originally at first reported for photochemical reduction of carbon dioxide, Hawecker, Lehn and
Ziessel in 1984 also show the high efficiency of this complex in electro-catalysis in DMF [23], [30].
Over the years many papers concerning the actual reaction mechanism and chemical modification
of the catalyst for higher performance were published. The major drawback of this complex is the
expensive and rare rhenium as central atom. For this reason many attempts replacing rhenium
have been made and manganese seems to be a promising candidate [23].
Another attempt firstly reported by Seshadri, Lin and Bocarsly (1994) is using metal free systems
(beside the electrodes) for reducing carbon dioxide. They report the formation of methanol and
formaldehyde by reduction in a solution containing pyridine [31].
Besides trying to avoid the use of precious metals some groups are focussing on immobilizing
metal complexes on substrates. In such a heterogenized case all metal centres can more easily
be addressed electrochemically and separation of liquid products forming is easier. Various
methods of immobilizing metal complexes are reported in literature. Attaching anchoring groups
to the catalysts for metal oxide immobilization, introducing hydrophobic groups like pyrenes for
attachment to graphite nanorods or polymerization of catalyst bearing monomers are just some
examples [23], [32].
Two specific examples from our group are the immobilization of the Lehn catalyst on an alkenyl
backbone by Portenkirchner et al. (2013) [33] and on a polythiophene backbone by Apaydin et al.
(2016) [34].

October 4, 2017 Dominik Wielend 15/74
1.2.4. Enzymatic CO2 reduction
In the definition of classical catalysis enzyme catalysed reactions are the third class beside
homogenous and heterogeneous. In natural organisms many redox enzymes exist being able to
also catalyse the reduction of carbon dioxide.
One major challenge in this field is that organisms use cofactors like NADPH as energy source
which would be too expensive for application. Therefore research for effective immobilization and
electrical connection to an electrode for bioelectric application is going on.
Schlager et al. (2016) reported the successful immobilization of a cascade of three enzymes into
an alginate matrix [35]. Formatedehydrogenase (FDH), formaldehydedehydrogenase and
alcoholdehydrogenase (ADH) were all three immobilized onto a carbon felt electrode with alginate
and addressed electrochemically. The success can be seen in a faradaic efficiency for methanol
of 10% which means that the cascade is working.
In many cases the actual chemical structure and reaction mechanisms of the enzyme are not
resolved completely. Also various FDH enzymes are known which can differ in the central metal
atom which is determining the catalytic performance.
Bassegoda et al. (2014) reported the reversible reduction of carbon dioxide with an FDH enzyme
containing a molybdenum metal centre [36]. In 2017 the same group with Robinson et al. reported
an in-depth analysis of the reaction mechanism of CO2 reduction in this Mo containing FDH
resolved by inhibition experiments [37].
Requiring significantly lower overpotential for reduction of carbon dioxide than metal complexes
or metal electrodes they are more prone to changes in pH and oxygen. Furthermore, effective
linkage and wiring of the whole enzyme is also still challenging.

October 4, 2017 Dominik Wielend 16/74
1.3. Organic semiconductors
The aim of this work is the investigation of organic semiconductors towards electrochemical
capturing of carbon dioxide, similar to the examples summarized in chapter 1.1.2. Further
experiments on the pigments are necessary to clearly classify them as actual semiconductors.
However those experiments and studies are not included in this thesis since they are beyond the
scope.
According to Hunger and Herbst (2012) a pigment is a coloured substance which is not soluble in
the medium used. Thereby organic as well as inorganic materials can be referred to as
pigments [38]. In contrast to pigments, colouring agents soluble in the medium used are usually
called dyes. Although pigments are usually processed to the desired to coloured composite in their
solid state, this does not mean that they cannot be made soluble in solvents. Ways of modifying
pigments for dissolving are introducing functional groups or chemically reducing them (as
discussed in chapter 1.1.2. A general well-accepted classification of organic pigments is hard to
make. According to chemical structure a big separation is distinguishing between azo pigments
(bearing the R-N=N-R’ group) and polycyclic pigments [38].
In this work, solely polycyclic pigments are investigated and although some of them are (partially)
soluble in some solvents, they are exclusively tested in media where they are insoluble in their
ground state. For this reason, all compounds tested are referred to as pigments. Furthermore, all
the pigments investigated consist of at least one carbonyl group and can therefore be referred to
as carbonyl pigments.
1.3.1. Application
Details about colouring textiles, polymers or application in printing inks are beyond the scope of
this work. Anthraquinone for example is a precursor for a whole class of pigments containing the
polycyclic anthraquinone structure as core unit.
As electroactive or electrocatalytic properties are investigated, a short overview about reported
electrochemical or catalytic properties of pigments will be given.
The capability of carbonyl pigments to capture carbon dioxide upon reduction reported by Apaydin
and co-workers in 2014 and 2017 is already discussed in chapter 1.1.2. [10], [16]. In the same
research group Jakêsová and co-workers (2016) report electrocatalytic oxygen reduction to
hydrogen peroxide (H2O2) by the two hydrogen-bonded pigments quinacridone and
epindolidione [39].
Hydrogen peroxide is an important chemical used for various applications like paper industry,
cleaning and synthesis. Interestingly more than 95% of all H2O2 is produced by a process using
an anthraquinone derivative as catalyst. This process was introduced in 1935 and the chemical
reactions involved are illustrated in the following Figure 16 [5], [6]:

October 4, 2017 Dominik Wielend 17/74
Figure 16: Reaction scheme of H2O2 production using the anthraquinone process [5], [6].
In this anthraquinone process, an alkyl (R) substituted anthraquinone derivative is catalytically
hydrogenated on palladium or platinum at 5 bar. A rapid autoxidation with oxygen is forming the
endoperoxide which can be regenerated to the initial anthraquinone and H2O2 [5].
As this process is very costly, the search for alternatives for cheaper and direct hydrogen oxidation
by oxygen methods is intensified [5], [6].
Not only is hydrogen peroxide, produced by anthraquinone, but also anthraquinone itself used as
a pulping catalyst in paper production. Thereby anthraquinone is enhancing the rate of lignin
degradation and at the same time stabilising the carbohydrates in cellulose [40].
Many organic pigments exhibit semiconducting properties and are therefore used in electronic
application. Perylenediimide derivatives (see Figure 27) are a well-studied class of n-type organic
semiconductors for organic photovoltaics (OPV) [41].
Diketopyrrolopyrrole (DPP) dyes are attracting the attention of the scientific community for a long
time since they show promising features like easy synthetic pathways, high stability and high PL
yields. Figure 17 illustrates the core structure of DPP dyes:
Figure 17: Chemical structure of a DPP core unit [38].

October 4, 2017 Dominik Wielend 18/74
On both sides of the symmetric core in Figure 17 usually aromatic sides (Ar) are attached.
Furthermore, they are also part of organo-electronic research towards OPV, organic light emitting
diodes (OLEDs), organic field effect transistors (OFETs) and analytical detection methods [42], [43].
Most of the DPP derivatives are barely soluble and therefore classical pigments. For application
in paints this feature is essential. For various other applications, soluble versions of DPP
derivatives are needed. Warnan et al. (2017) modified DPP in a way, that immobilization on TiO2
for photocatalytic H2 evolution is achieved [44]. Kovalenko et al. (2017) introduce an adamantane
group to the DPP core not only for enhancing the solubility but also to achieve higher hole
mobilities by a specific adamantyl induced packing [45].
1.3.2. Industrial synthesis - selected pigments
As usual in synthesis of organic materials, many synthetic routes are possible. Nevertheless,
usually only certain ways of synthesis are applied in industrial scale as cheap and abundant
materials as well as ambient conditions are favoured. For this reason only selected synthetic
pathways applied in industrial synthesis of pigments are presented.
In a chronological order following chapter 1.3.1. the large-scale synthesis of quinacridone is the
first one to be discussed. The historical industrial synthetic route introduced in 1955 by DuPont is
still frequently used and shown in Figure 18:
Figure 18: Synthesis of quinacridone via DuPont process [38].
For this synthesis the main product, succinosuccinate ester, is produced from a succinic acid ester
and aniline is also an important chemical produced in large scale. Beside the DuPont process also
other companies develop other synthetic routes which have similar reaction chemistry [38].
Anthraquinone is as well as quinacridone also a carbonyl pigment consisting of a core of
condensed six membered rings. One of the simplest methods is the oxidation of anthracene:

October 4, 2017 Dominik Wielend 19/74
Figure 19: Synthesis of anthraquinone via anthracene oxidation [5], [46].
Although the oxidation in Figure 19 does not involve any regioselective auxiliary, anthraquinone
is received with a selectivity of more than 90%. This oxidation can either be done in liquid phase
as shown in laboratory or industrial scale but also in gas phase. For this, industrial only, synthesis
the anthracene is oxidized with air at an iron vanadate catalyst at more than 340°C. More than
85% of the anthraquinone produced is synthesized by this anthracene oxidation [5], [46].
As anthraquinone is of great importance for several industry branches, further synthetic routes are
investigated. Two of those can be started from naphthalene oxidation and are illustrated in Figure
20:
Figure 20: Alternative synthetic routes to anthraquinone starting from naphthalene oxidation [5], [46].
The same methods of oxidation explained for anthracene are also applicable for naphthalene. A
major difference is that more than one oxidation product is obtained. Reacting one of those
products, phthalic anhydride with benzene in a Friedel-Crafts reaction is producing anthraquinone
via the Bayer process. The 1,4-naphthoquinone can be reacted in the Kawasaki process with 1,3-
butadiene via a Diels-Alder reaction type followed by oxidation [5], [46].
Beside those two processes reported also other more exotic synthetic pathways to anthraquinone
are possible [5].
An overview of various synthetic pathways to diketopyrrolopyrrole dyes is given in detail in a review
by Grzybowski and Gryko (2015) [42]. As illustrated in Figure 17 not only the aromatic residues Ar
can be varied but also the nitrogen atoms can be derivatised. Symmetric DPPs are most common
in industrial synthesis and application but as well also asymmetric DPP derivatives can be

October 4, 2017 Dominik Wielend 20/74
synthesised using more advanced methods. Just to give one example, the synthetic route starting
from succinic acid esters frequently used in large-scale production is given in Figure 21:
Figure 21: Synthesis of symmetric DPP dyes via succinic acid ester route [38], [42].
The reaction scheme in Figure 21 underlines the possibilities how to produce DPPs with different
aromatic side chains. This can be simply achieved by varying the aromatic nitrile compound.
Alkylating the nitrogen atoms can be done subsequently by reaction with alkyl halides as reported
by Kovalenko et al. (2017) [45].

October 4, 2017 Dominik Wielend 21/74
2. Experimental
2.1. Materials
The chemicals, solvents, gases, metals and other materials used are summarized in alphabetical
order in the following Table 1:
Material Formula Supplier Purity Abbreviation
Acetone C3H6O VWR Chemicals technical -
Acetonitrile C2H3N Roth > 99.9% MeCN
Ammonium chloride NH4Cl Merck for analysis -
Anthracene C14H10 Sigma Aldrich >96% -
Anthraquinone C14H8O2 Sigma Aldrich 97% AQ
Boric acid H3BO3 Alfa Aesar 99.99% -
Carbon dioxide CO2 Linde 99.995% -
Chlorobenzene C6H5Cl VWR Chemicals 100% -
Chromium on tungsten rod Cr Kurt J. Lesker 99.9% -
Copper sulphate
pentahydrate
CuSO4 * 5 H2O Sigma Aldrich p.a. >99.0% -
N,N-diemthylformamide C3H7NO VWR Cemicals 100% DMF
Fluorine-doped tin oxide on
glass
FTO on glass LIOS 15 ohm/sq FTO
Glass Thermo Scientific Pre-cleaned -
Glassy Carbon, 2 mm Alfa Aesar type 1 GC
Gold Au Ögussa 99.99% -
Hellmanex solution Hellma-Analytics -
Isopropanol C3H8O VWR Chemicals AnalaR
Normapur
IPA
Nickel chloride hexahydrate NiCl2 * 6 H2O Alfa Aesar 99.95% -
Nickel sulphate hexahydrate NiSO4 * 6 H2O Alfa Aesar 98.0% -
Nitrogen N2 JKU -
Perylenetetracarbonyldiimide C24H10N2O4 TCI PTCDI
Quinacridone C20H12N2O2 TCI > 93.0% QNC
Sodium chloride NaCl ACM 99.98% -
Sodium sulphate anhydrous Na2SO4 Sigma Aldrich > 99.0% -
Sulfuric acid H2SO4 J. T Baker 95 - 97% -
Tetrabutylammonium
hexafluorophophate
C16H36NPF6 Sigma Aldrich >99.0% TBAPF6
Tin chloride dihydrate SnCl2 * 2 H2O Acros Organics 98%+ -
Table 1: Overview materials used.

October 4, 2017 Dominik Wielend 22/74
2.2. Electrode preparation
Glass-based electrodes were at first cut to the appropriate size with a diamond glass cutter. The
size for Cr-Au standard electrodes is 6.0 x 0.7 cm, the one for FTO substrates 2.5 x 1.5 cm. For
cleaning, those electrodes were sonicated in the following solvents for 15 min each:
Acetone
2% Hellmanex solution
DI water
Isopropanol
Afterwards the electrodes were dried with pressurized air. FTO electrodes were afterwards ready
to use. The glass slides then were transferred into an evaporation chamber for thermal evaporation
of Cr/Au (5 nm / 80 nm).
2.3. Evaporation of organic materials
Commercially available chemicals usually require further purification by sublimation prior to
evaporation. Two glass test tubes were cleaned with DI water and isopropanol, which are finally
burned. One test tube was broken at the sealed end and the two tubes fused together at the
smooth edges. 1.0 g of the desired material was transferred into a tube furnace equipped with a
temperature controlling unit. As the further process parameters were dependent on the material,
they are compared for anthraquinone and quinacridone in Table 2:
Parameter Anthraquinone Quinacridone
Pre-heating time / min 30 30
Pre-heating temperature / °C 100 140
Sublimation temperature / °C 250 355
Sublimation time / h ≈20 ≈20
Sublimation yield / % ≈90 ≈15
Table 2: Parameters for sublimation purification.
After roughly 1 g of 1x sublimed material was gained, the same process is repeated to finally
receive a twice sublimed material with sufficient purity. In case of anthraquinone the material was
transferred to a LIOS self-made organic material evaporator. Other organic materials were
evaporated by Cigdem Yumusak in a Vaksis organic evaporation system resulting in a thickness
of 100 nm.
Glassy Carbon electrodes were at the beginning cleaned with acetone and MQ water. Then a
polishing process with Buehler Micropolish II deagglomerated alumina for 30 s each side in a
sequence from 1.0 to 0.3 to 0.05 µm was applied. In between sonication in IPA and MQ water was

October 4, 2017 Dominik Wielend 23/74
done for 15 min each. To get rid of excess Al2O3, a final polishing was done with toothpaste again
followed by the same sonication cleaning.
Finally electrochemical cleaning in 0.5 M H2SO4 according to Table 3 was performed:
Start potential: 0 mV
1st return potential: + 1500 mV
2nd return potential: - 1000 mV
Polarization speed: 50 mV s-1
No of cycle: 30
Table 3: Parameters for GC electro-cleaning.
Thereby a platinum plate was used as counter electrode and an Ag/AgCl/3M KCl as reference
electrode.
2.4. Electrochemical characterization
For all electrochemical investigations a Jaissle Potentiostat-Galvanostat 1030 PC.T (ECM-1) was
used. For standard cyclic voltammetry (CV) experiments a scan rate of 25 mV s-1 was used and
two cycles were recorded.
The standard electrochemical cell looked like shown in the following Figure 22:
Figure 22: Standard electrochemical 2-compartment cell.
This standard cell for aqueous solutions shown in Figure 22 contained a total volume of 45.9 mL
and was always filled with 20.0 mL of a 0.1 M Na2SO4 solution in MQ water. A platinum plate was
cleaned by burning prior to use as counter electrode. A commercial Ag/AgCl/3M KCl electrode
stored in 3 M KCl solution was always used as reference electrode in aqueous solutions.

October 4, 2017 Dominik Wielend 24/74
The working electrode could be Cr-Au/glass, FTO/glass or glassy carbon based and was always
linked to an isolated wire with help of a silver paste and Teflon tape.
To remove dissolved oxygen in the electrolyte solution, the cell was always purged with nitrogen
for 1 h prior to the experiment. For experiments concerning CO2 capture/release or electrolysis,
the cell was afterwards purged with CO2 for 1 h. In order to get rid of dissolved CO2 and study the
CO2 release, the cell was finally purged again for 2 h with N2.
For electrochemical experiments in organic solvents, a one-compartment cell inside the glove box
was used. Instead of the Ag/AgCl/3M KCl reference electrode, an Ag/AgCl quasi-reference
electrode was used. 10.0 mL of a 0.1 M TBAPF6 in acetonitrile solution were used as electrolyte
solution.
As the experiments were conducted under inert N2 glove box atmosphere, no N2 purging prior to
electrochemical characterization was required. For saturating the electrolyte solution with CO2 a
purging time of 15 min was sufficient. To get rid of CO2 again, purging with N2 for again 2 h was
needed.
2.5. Scanning electron microscopy (SEM) and energy dispersive X-ray spectroscopy (EDX)
For standard SEM measurements a JEOL JSM-6360 LV scanning electron microscope was used.
According to the samples, an acceleration voltage for the electron beam was varied between 7
and 15 keV. For EDX measurements the acceleration voltage was always kept at 15 keV and a
Bruker Nano X-Flash detector 410-M was used for X-ray detection.
The second SEM machine used was a Zeiss 1540xb operated at an acceleration voltage for the
electron beam of 3 keV.
All SEM measurements were operated by Dogukan H. Apaydin.
2.6. Single crystal x-ray diffraction (XRD)
Needles of anthraquinone were produced by drop-casting a 10 mM solution in DMF. Single crystal
structure analysis was carried out on a Bruker D8 Quest Eco diffractometer operating with MoKα
radiation (λ=0.71073 Å). The structures were solved by direct methods (SHELXS-97) [47] and
refined by full-matrix least squares on F2 (SHELXL-97) [48]. The H atoms were calculated
geometrically, and a riding model was applied in the refinement process.
All XRD measurements were operated by Uwe Monkowius.

October 4, 2017 Dominik Wielend 25/74
2.7. Chromatography
2.7.1. Gas injection gas chromatography
For analysing gaseous products, gas injection chromatography was used. For each sample, 2 mL
of headspace were injected into a Thermo Scientific Trace GC Ultra. Two channels existed – one
with nitrogen as carrier gas for detecting H2 and CH4 and one with He as carrier gas for detecting
CO. Both channels consisted of a Restek molecular sieve packed column. In both channels the
following temperature ramp was applied and a thermal conductivity detector (TCD) was used:
Thermo Scientific Trace GC Ultra
30 °C Hold for 2 min
30 – 130 °C 10 °C/min
130°C Hold for 10 min
Table 4: Temperature program for both gas GC channels.
2.7.2. Liquid injection gas chromatography
The analysis of methanol in the electrolyte solution was done in a Thermo Fisher Trace 1310 gas
chromatograph. Prior to injection the electrolyte solution was diluted 1 : 20 and for each injection
1 µL was used in a splitless mode. A Thermo Scientific TR Wax column (30m x 0.32 mm x 0.5 µm)
was used for gas separation. For analyte detection a flame ionization detector (FID) was used and
the following temperature ramp:
Thermo Scientific Trace 1310
50 °C Hold for 1 min
50 – 250 °C 20 °C/min
250°C Hold for 10 min
Table 5: Temperature program for the liquid GC.
2.7.3. Ion chromatography
For analysing formate an ICS-5000 Dionex chromatograph with a Dionex Ion PacTM AS19 column
was used. The column temperature was kept constant at 30 °C with a flow of 0.25 mL min-1. Table
6 summarizes the concentration of the KOH eluent:
ICS-5000 Dionex
0 – 7 min 10 mM KOH
7 – 14 min 100 mM KOH
14 – 27 min 10 mM KOH
Table 6: Eluent gradient for the IC.

October 4, 2017 Dominik Wielend 26/74
2.8. UV-Vis spectroscopy
For standard UV-Vis investigations, the double beam Perkin Elmer Lambda 1050 machine was
used for measurements between 250 and 700 nm.
Benefitting of a real measurement time of 20 sec, a Jasco V-670 Spectrophotometer was used for
spectroelectrochemical measurements where a scan between 250-600 nm was performed for
each measurement.
Speaking of cuvettes, a normal quartz fluorescence cuvette shown in Figure 23 shows a typical
spectroelectrochemical cell with stopper where electrodes were pierced through the septum:
Figure 23: Picture of the cuvette for UV-vis spectroelectrochemistry.
A 100 nm film of anthraquinone of FTO/glass was used as working electrode (WE) and contacted
with silver paste to a copper wire. An Ag/AgCl electrode was used as quasi reference electrode
(RE) and a platinum wire as counter electrode (CE).
2.9. Fourier transform infrared spectroscopy (FTIR)
For attenuated total reflection (ATR-FTIR) studies a Bruker Vertex 80-ATR machine was used
averaging 32 scans. For in-situ ATR-FTIR spectroelectrochemical measurements a Bruker IFS-
66/S machine was used. 100 nm of anthraquinone were evaporated onto a germanium element,
which served as working electrode, and is shown in Figure 24:
Figure 24: Equipment used for IR spectroelectrochemistry. On the left side the germanium electrode is shown without
and with anthraquinone. On the right side, the “electrochemical cell” is shown.

October 4, 2017 Dominik Wielend 27/74
2.10. Metal island depositions
In all cases at first the metal was deposited onto glassy carbon followed by anthraquinone
evaporation.
2.10.1. Platinum
The potentiostatic deposition of platinum nanoparticles was done in analogy to Duarte et al.
(2005) [49]. The major difference was that instead of H2PtCl6 the available K2PtCl4 was used. In the
following Table 7 the composition of the solution and the deposition parameters were summarized:
Metal source 2 mM K2PtCl4
Further electrolytes 0.5 M H2SO4
Applied potential + 39 mV vs. Ag/AgCl/3M KCl
Deposition time 300 s
Table 7: Deposition parameters for Pt islands.
2.10.2. Nickel
The procedure for potentiostatic deposition of nickel islands onto glassy carbon was done
according to Gómez et al. (1992) [50]. In Table 8 the deposition solution and parameters were
described:
Metal source 10 mM NiCl2
Further electrolytes 0.98 M NaCl
Applied potential - 916 mV vs. Ag/AgCl/3M KCl
Deposition time 45 s
Table 8: Deposition parameters for Ni islands.
2.10.3. Tin
Rudnik and Włoch (2013) reported the influence of gluconate in tin deposition baths on the
morphology [51]. To not introduce further possible impurities, a solution without gluconate was used
and the parameters summarized in Table 9:
Metal source 50 mM SnCl2
Further electrolytes 0.5 M NH4Cl
0.5 M H3BO3
Applied potential - 700 mV vs. Ag/AgCl/3M KCl
Deposition time 45 s
Table 9: Deposition parameters for Sn islands.

October 4, 2017 Dominik Wielend 28/74
2.10.4. Copper
The procedure for potentiostatic deposition of copper onto carbon based electrodes was used
from the paper of Luo et al. (2012) [52]. All the deposition parameters were summarized in Table
10:
Metal source 10 mM CuSO4
Further electrolytes 0.1 M Na2SO4
Applied potential - 361 mV vs. Ag/AgCl/3M KCl
Deposition time 480 s
Table 10: Deposition parameters for Cu islands.

October 4, 2017 Dominik Wielend 29/74
3. Results and discussion
In the beginning also QNC and NBIT were tested towards CO2 capture to check the reproducibility
of the results from literature of Apaydin et al. (2014) [10] and (2017) [16]. The cyclic voltammetry
curves were reproduced successfully.
In this chapter other abundant organic pigments are tested in a similar way towards their
application for electrochemical capture and release of carbon dioxide.
3.1. Blank electrode characterization
To avoid misinterpretations in CV curves of unknown materials, the knowledge of CV curves of
the blank electrodes is required. As Cr-Au/glass electrodes could be easily prepared in a very
reproducible way by avoiding cross-contaminations by insufficient cleaning, they were used as
first screening electrodes for all materials. For this blank characterization and also upcoming
experiments, the procedure from chapter 2.4. was followed and the 2nd CV cycles under N2 and
CO2 were compared in Figure 25:
Figure 25: Comparison of a Cr-Au on glass electrode under N2 and CO2.
The black curve in Figure 25 under N2 did not show any characteristic peak except the onset for
H2 evolution at -1100 mV, as expected. In contrast, under CO2 saturated conditions an irreversible
reductive peak at -760 mV appeared. As gold was reported in literature as potent heterogeneous
catalyst for CO2 reduction, this peak could be most probably assigned to this feature [24].
Furthermore, the onset for H2 evolution was shifted to a more positive potential. This could be
assigned to the change in pH caused by CO2 purging. In fact, due to CO2 purging the pH value of
the 0.1 M Na2SO4 solution changed from initial 6.4 to 4.1.

October 4, 2017 Dominik Wielend 30/74
Another electrode used for electrochemical experiments was glassy carbon (GC). Due to its high
overpotential for H2 evolution and inertness towards CO2 reduction it was the electrode of choice
for further material characterization towards CO2 reduction electrolysis. Due to the time-consuming
cleaning process described in chapter 2.3. glassy carbon was only used for the most promising
pigment candidates. In analogy to the Cr-Au characterization in Figure 25, glassy carbon was
examined by CV and the curves compared in Figure 26:
Figure 26: Comparison of a glassy carbon electrode under N2 and CO2.
In contrast to Figure 25, a glassy carbon electrode did not show any peaks in the CV beside the
faint onset for H2 evolution. This onset was again shifted to a bit more positive potential under CO2
than under N2.
Besides Cr-Au and glassy carbon more inert electrodes were available. One is FTO covered glass,
which was in addition also transparent in the visible range. Unfortunately, it only exhibited limited
stability under strong reducing conditions over time, for example when performing 1 h electrolysis.
Although this feature excluded FTO as candidate for long-term characterization it was still the
electrode of choice performing spectroelectrochemistry (see chapter 3.4.4.

October 4, 2017 Dominik Wielend 31/74
3.2. Perylenetetracarbonyldiimide (PTCDI)
As already discussed in chapter 1.3.1. perylenediimide derivatives are used for organic
photovoltaics (OPV) [41]. They consist of a similar structure to naphthalene bisimide derivatives
(Figure 9) with a larger extended conjugated π-system in the core, the easiest representative
shown in Figure 27 was investigated towards CO2 capture:
Figure 27: Chemical structure of the perylene diimide derivative PTCDI.
In analogy to the investigation of QNC/Cr-Au in literature [10], a 100 nm PTCDI/Cr-Au electrode
was electrochemically tested in 0.1 M TBAPF6 / MeCN:
Figure 28: Comparison of PTCDI on Cr-Au in 0.1 M TBAPF6 / MeCN.
Comparing the two CV curves in Figure 28, completely the same reductive / oxidative peak
features were observed. The significantly lower current density under CO2 could be fully explained
by dissolving of PTCDI upon reduction as after the electrochemical analysis nearly no film was left
on the electrode.
Nevertheless, as the onset for reduction was below -1000 mV, the same electrode configuration
was tested in aqueous solution, shown in Figure 29:

October 4, 2017 Dominik Wielend 32/74
Figure 29: Comparison of PTCDI on Cr-Au in 0.1 M Na2SO4 in H2O.
The CV curve characteristics in aqueous solution (Figure 29) in general looked like the ones in
acetonitrile (Figure 28). The higher current densities in aqueous solution could be assigned to a
lower tendency of dissolving upon reduction. Furthermore also the current densities under N2 and
CO2 were nearly identical. On one hand this was a hint for no / slight dissolving upon reduction
but on the other hand also proved that no CO2 was captured upon reduction. An obvious difference
between the two curves in Figure 29 was the shifted onset for H2 evolution.
Concerning the characteristics of the CV curves the reductive peak at -625 mV could be assigned
to a multiple electron reduction. Integration of the reductive peak and the two oxidative peaks
revealed that the same amount of charges was transferred in each case. Most likely, PTCDI was
at first reduced by a concerted two electron reaction whereas the re-oxidation was taking place in
two separated one electron reactions. Although literature reported two waves each in solution for
many substituted PTCDIs, the two step reduction involving a radical as intermediate might became
a concerted two electron reduction in aqueous solution [53].
Interestingly the onset for reduction in a protic solvent was with -625 mV significantly more positive
than -845 mV in aprotic solvent. This shift of more than 200 mV indicated a proton assisted
reduction pathway at lower pH than the pKA of PTCDI. A proton dependent reduction potential
was not only observed when comparing completely aprotic solvents with aqueous solutions but
also in aqueous solutions at different pH values. The pH change upon CO2 purging did not affect
reduction / re-oxidation potentials which was hint, that the pKA value of the reduced PTCDI species
was higher than the initial pH of 6.4 [54].
While performing the electrochemical characterization of the PTCDI/Cr-Au electrode, pictures
shown in Figure 30 of the electrode were made at different potentials:

October 4, 2017 Dominik Wielend 33/74
Figure 30: PTCDI during electrochemical treatment under N2. Before CV (left), at -1000 mV (middle) and at -200 mV (right).
Figure 30 showed that PTCDI possessed electrochromic features. The pristine film was only pink
which underwent a bathochromic shift upon reduction to a blue/black colour. At -200 mV the
PTCDI film seemed to be of lighter colour which might be caused by slightly dissolving material.
Finally the PTCDI electrode was investigated by SEM before and after electrochemical treatment
in aqueous solution:
Figure 31: SEM images of the PTCDI/Cr-Au electrode before (left) and after the electrochemistry (right).
As seen in Figure 31, PTCDI did not undergo a detectable morphological change upon reduction.
The changes detected were most probably caused by partial dissolving of the pigment.
Summing up, the frequently in OPV technology used n-type pigment PTCDI showed interesting
peaks in CV in aqueous solution. Unfortunately, as no real changes in CV were recorded between
N2 and CO2 environment, no electrochemical CO2 capturing features were observed. PTCDI
seemed to be quite stable upon reduction in aqueous media whereas it was rapidly dissolving
upon reduction in acetonitrile.

October 4, 2017 Dominik Wielend 34/74
3.3. Adamantyl-Diketopyrrolopyrrole (DPP)
The discussion in chapter 1.3.1. named some electronic and catalytic applications DPP dyes and
refered to the publication by Kovalenko et al. (2017) introducing an adamantyl group to the DPP
core [45]. This ambipolar DPP derivative (2,5-bis(2-(adamantan-1-yl)ethyl)-3,6-di(thiophen-2-yl)-
2,5-dihydropyrrolo[3,4-c]pyrrole-1,4-dione), whose synthesis was performed and reported by
Kovalenko et al. (2017) is shown in Figure 32:
Figure 32: Chemical structure of the adamantyl substituted DPP [45].
This DPP derivative shown in Figure 32 possessed, like all DPP dyes, two carbonyl groups in the
core which is the reason why the DPP class is investigated for electrochemical CO2 capture.
Similar to the previous investigations, at first a 100 nm film of DPP on Cr-Au was tested in an
acetonitrile solution. As expected from the purpose of the adamantly groups, this DPP dye was
rapidly dissolving and no electrochemical investigation was possible.
An attempt of immobilizing this DPP onto an electrode was made by CV in a 5 mM solution of DPP
in 0.1 M TBAPF6 in MeCN. In theory the thiophene groups might be electro-polymerized but in this
case no stable film was achieved.
The result of electrochemical investigations of the DPP/Cr-Au electrode in aqueous solution is
shown in Figure 33:

October 4, 2017 Dominik Wielend 35/74
Figure 33: Comparison of DPP on Cr-Au in 0.1 M Na2SO4 in H2O.
Although a small reductive peak was observed under CO2 in Figure 33 it again had to be stated
that this DPP dye cannot be addressed electrochemically in water. The reason was that this CV
curves looked nearly identically like the blank ones of Cr-Au inFigure 25.
Furthermore no colour change was observed during cyclic voltammetry and in the SEM images
no structural changes were observed.
This DPP derivative could not be used in either organic or aqueous electrolyte solutions for
electrochemical CO2 capturing. Towards immobilizing a DPP core onto an electrode, derivatives
with two thiophene groups on each side could be more promising.

October 4, 2017 Dominik Wielend 36/74
3.4. Anthraquinone
In this chapter anthraquinone, a pigment precursor which is produced in kilotons scale is
investigated.
Figure 34: Chemical structure of anthraquinone.
Possessing two carbonyl groups as solely functional groups, all reactions taking place under the
conditions applied can be correlated to those groups.
As already described in detail in chapter 1.3.1. anthraquinone is not only used in classical catalysis
like in wood pulping or H2O2 production. It is also one of the smallest molecules used for organic
carbonyl batteries and therefore under investigation for electrochemical research. Furthermore the
two carbonyl groups in para position are also present in the natural electron shuttle ubiquinone.
3.4.1. Electrochemical characterization
In a first attempt, a 100 nm layer of anthraquinone on Cr-Au was investigated for cyclic
voltammetry. Although anthraquinone was hardly soluble in common solvents, it rapidly dissolved
in acetonitrile. Therefore, no electrochemical characterization of heterogeneous AQ films was
possible in MeCN. The result of cyclic voltammetry in aqueous solution was shown in Figure 35:
Figure 35: Comparison of anthraquinone on Cr-Au in 0.1 M Na2SO4 in H2O (left). On the right side, the two cycles under CO2 are compared.

October 4, 2017 Dominik Wielend 37/74
Figure 35 showed that AQ was quasi-reversibly reduced at -800 mV under nitrogen. The re-
oxidation peak was smaller than the reduction peak and appearing at -670 mV. Under CO2
atmosphere the large, characteristic peaks nearly disappeared. When the system was again freed
from CO2 and N2 saturated, the characteristic peaks were recovered similar to NBIT in Figure 10.
In the first nitrogen environment, the current density of the reductive peaks decreased from the
first to the second cycle from -3 to -1.7 mA cm-2, which could be explained by fast dissolving of
the reduced anthraquinone species. (see Figure 36) The comparison of the two cycles under CO2
in Figure 35 enabled insights into the CO2 capturing mechanism. As in the first cycle the attempts
of the reductive AQ peak was visible, the anthraquinone was first reduced and this reduced form
was capturing the CO2. If the pristine anthraquinone were to capture CO2, also in the first CO2
cycle the reductive peak at -800 mV would not be visible.
After re-purging the system with N2 and starting the CV to positive side, CO2 was released and
the electrochemical activity of anthraquinone was restored again. Similar to the first two cycles
under initial N2 conditions, the current densities of the anthraquinone reduction peak decreased
from the first to the second cycle from -0.7 to -0.5 mA cm-2. In analogy to the literature examples
of electrochemical CO2 capture of quinacridone (Figure 8) and NBIT (Figure 10), anthraquinone
was suggested to also show the same features in aqueous media.
Mentioning the dissolving of reduced anthraquinone, images of the AQ/Cr-Au electrode at different
potentials / gas atmospheres were made and shown in Figure 36:
Figure 36: Pictures of AQ/Cr-Au at different conditions. A is under N2 without bias applied. B is under N2 at -1000 mV.
C is under CO2 at -1000 mV. D is after re-purging with N2 and releasing CO2 at -1000 mV.
Comparing the AQ/Cr-Au electrode at different conditions in Figure 36, significant changes were
observed. Initially in picture A, the yellow colour of pristine AQ could be seen, which was quite
similar to the one of gold. Upon reduction under nitrogen on the one hand a colour change to
orange-red was observed in picture B. On the other hand, the dissolving of the reduced
anthraquinone species could be seen as yellow diffusion trace. Reducing conditions under CO2
atmosphere generated completely different circumstances, as an intensive yellow colour could be

October 4, 2017 Dominik Wielend 38/74
observed in picture C. After re-purging the cell with nitrogen and oxidatively releasing the CO2, the
orange-red colour from reduced anthraquinone was observed again in picture D. It had to be
mentioned, that in picture D the colour change was much less visible due to the dissolving
processes going on.
As already mentioned before, Cr-Au substrates were only used for the first electrochemical
experiments. Due to its catalytic inertness shown in chapter 3.1. glassy carbon was used as
electrode for further electrochemical investigations. Under the same conditions applied in Figure
35 an AQ/GC electrode was tested electrochemically:
Figure 37: Comparison of anthraquinone on glassy carbon in 0.1 M Na2SO4 in H2O.
Comparing the CV cycles on glassy carbon from Figure 37 with the ones on Cr-Au in Figure 36
revealed a nearly identical picture. The major difference was that, due to lower conductivity of
glassy carbon lower peak current densities were observed. Interestingly on glassy carbon a
presumed peak of the oxidative release of CO2 at +270 mV was visible.
In accordance to CO2 capture mechanisms summarized in chapter 1.1.2. a mechanism for AQ
under CO2 conditions is proposed which will be investigated in the following chapters:
Figure 38: Proposed reduction and CO2 capture of anthraquinone under CO2 conditions.

October 4, 2017 Dominik Wielend 39/74
3.4.2. Morphological changes
Motivated by the results of SEM pictures of NBIT before and after CO2 capturing, the surface of
AQ/Cr-Au was also investigated by SEM. Figure 39 showed the SEM pictures before
electrochemistry:
Figure 39: SEM images of AQ/Cr-Au as casted.
The images of as-casted anthraquinone on Cr-Au in Figure 39 showed a very uniform surface
after evaporation. Although the structure was on the edge of the resolution limit of the SEM used,
a cubic crystal alignment was suggested. In the following Figure 40, the surface after
electrochemical treatment was shown:
Figure 40: SEM images of AQ/Cr-Au after electrochemistry in 0.1 M Na2SO4.
Comparing the SEM images of the anthraquinone surface in Figure 39 with the one in Figure 40,
an interesting re-crystallization process was taking place. The initial cubic structure was lost
whereas a Mikado-like needle structure was formed. That sub-micrometre thick needles showed
a quite uniform length distribution between 5 and 10 µm.

October 4, 2017 Dominik Wielend 40/74
3.4.3. Single crystal XRD
Motivated by the morphological changes upon reduction in chapter 3.4.2. and to get a possible
idea of the CO2 capturing geometry, the crystal structure of an anthraquinone crystal was
determined by single crystal XRD:
Figure 41: Plot of the unit cell of measured anthraquinone sample, depicting the packing.
Anthraquinone crystallized in the monoclinic space group P 21/c with Z=4 asymmetric units per
unit cell (whereas the asymmetric unit was composed by one half of an anthraquinone molecule)
In Figure 41 the expected π-π stacking of the anthraquinone molecules in the unit cell was
observed. Between such stacked blocks the molecules were shifted by 5.3 Å and tilted by 45° to
minimize repulsion of the sticking out oxygen atoms.
In order to confirm the measured packing geometry, the data of anthraquinone reported by Fu and
Brock (1998) were downloaded from the Cambridge Structural Database (CSD) and plotted [55]:
Figure 42: Packing unit of anthraquinone from Fu and Brock [55].
Both crystal structures were identical, the apparently different unit cell was only a result of a
different setting in the disposed data file.

October 4, 2017 Dominik Wielend 41/74
3.4.4. UV-Vis spectroelectrochemistry
As the changes in optical properties of anthraquinone upon reduction shown in Figure 36 were
clearly visible by eye, spectroelectrochemical investigations were conducted in a setup shown in
Figure 23. To get a deeper insight into anthraquinone as molecule, UV-Vis spectra of
anthraquinone and anthracene (as films on glass substrates) were recorded and compared in
Figure 43:
Figure 43: UV-Vis spectra of anthraquinone and anthracene on glass.
Anthraquinone showed two distinct absorption peaks at 282 and 335 nm at reasonable
absorbance units. Due to reasons of clarification, the two spectra were normalized. In contrast,
anthracene showed the typical sharp absorption band at 393 nm followed by several peaks in
equi-energetic distance. They were caused by absorptions from the vibronic ground state of the
ground state anthracene to higher vibronic states of the excited anthracene.
Due to inhomogeneity of the film, significant light scattering was causing the increase in baseline
from 700 to 400 nm. As the spectroelectrochemical measurements were also performed as thin
films on substrates, these measurements of heterogeneous films were still preferred.
The results of spectroelectrochemistry of AQ/FTO/Glass was shown in the following Figure 44:

October 4, 2017 Dominik Wielend 42/74
Figure 44: Graphs of spectroelectrochemistry under N2. On the left side, the current from the step potentials applied
were plotted. On the right side, the UV-Vis spectra at certain potentials were shown.
The current-potential curve from Figure 44 in principle had the same shape as the one on Cr-Au
in Figure 35. Only, the curve in the photo-electrochemical cell seemed to be shifted to more
negative potentials by roughly 400 mV.
Similar to the I-E curves, also the response of the UV-Vis spectra was shifted to more negative
potentials. Starting from -1300 mV three new, distinct absorption peaks at 390, 416 and 460 nm
were appearing. For a better understanding of those three peaks, according to literature the
possible reduction reactions of AQ at neutral pH were summarized in Figure 45 [54], [56], [57]:
Figure 45: Scheme of reduction pathways of anthraquinone [56], [57].

October 4, 2017 Dominik Wielend 43/74
Discussing the reduction pathways shown in Figure 45, the first on the top was a one electron
reduction to the AQ.- radical. As radicals were not very stable in aqueous solutions and in this
pathway no protons were involved, this pathway to AQ.- was not very likely to happen in aqueous
media [56]. In non-aqueous media the transformation of AQ.- to AQH- was observed via direction
reduction or disproportionation of two radical molecules [56], [57].
Revenga et al. (1994) found out, that electrolyte solutions containing more than 40 % (v/v) water
followed a concerted two electron reduction pathway and therefore only one peak was visible in
CV and not two as in more/pure non-protic solvents. This conclusion was in perfect accordance
to the results gained in this work, especially in Figure 35. Concerning the last, acid-base
equilibrium shown in Figure 45, they reported an E-pH diagram which assigned a pKA for this
equilibrium of 9 [56]. According to this, in this particular set of experiments the equilibrium was far
on the AQH2 side.
Babaei et al. (1997) assigned the evolving peaks of anthraquinone reduction in aprotic DMF
solutions and their absorption spectrum at -1600 mV vs. SCE looked very comparable. The major
difference was, that they report a broad peak at 550 nm, which together with twin peaks at 395
and 411 nm they correlated to the AQ.- radical. In their aprotic medium they correlated the band
at 414 nm to AQH- and one at 470 nm to AQ2-. Although the presence of AQ2- seemed to be
unlikely according to the pKA, the reported 470 nm would fit quite well to the measured 460 nm.
Furthermore Babaei et al. (1997) concluded that further protonation of the molecule was shifting
the absorption bands to lower wavelengths. According to this, the peak at 390 nm was most likely
arising from AQH2 [57].
As the probability and furthermore the absorbance of the correlated peaks decreased with less
degree of protonation, the explanation given seemed to be reasonable. Nevertheless, according
to Revenga et al. (1994) nearly no AQ2- should be present, the origin of the peak at 460 nm was
not completely clear.
In picture C of Figure 36 under CO2 atmosphere a different colour change to a brighter yellow was
observed. An AQ/FTO/Glass electrode was also investigated under those conditions and the
results shown in Figure 46:

October 4, 2017 Dominik Wielend 44/74
Figure 46: Graphs of spectroelectrochemistry under CO2. On the left side, the current from the step potentials applied
were plotted. On the right side, the UV-Vis spectra at certain potentials were shown.
The most significant difference of the absorption spectrum in Figure 46 compared to the one in
Figure 45 was the lack of the three strong absorption bands. However the appearance of a weak
absorption shoulder at 440 nm was observed. This new peak was most likely caused by formation
of a new molecular species, presumably an anthraquinone carbonate species.

October 4, 2017 Dominik Wielend 45/74
3.4.5. IR spectroelectrochemistry
In analogy to Apaydin et al. (2017), structural changes upon reduction on anthraquinone should
also be detectable with in-situ FTIR measurements [16]. At first ATR-IR of anthracene and
anthraquinone was recorded and shown in Figure 47:
Figure 47: ATR-IR spectra of anthracene and anthraquinone.
To clarify the band assignment, the measured bands in Figure 47 were compared with literature
values from the SDBS database [58] and some peaks correlated with functional groups according
to literature [59], [60].
Anthracene Anthraquinone
vexp / cm-1 vSDBS / cm-1 Group vexp / cm-1 vSDBS / cm-1 Group
3428 3428 aromatic
C - H
3321 3323 aromatic C- H
3048 3066 3073 3074
1784 1785 1674 1703 aromatic ketone
C = O
1620 1621
aromatic
C = C
1589/1573 1592/1581 C = C next to
C = O
1533 1535 1472 1474 aromatic C = C
1447 1449 1332 1333
1397 1398 1282 1286
1315 1317 1169 1171
1272 1273 1098 1099
1146 1148 968 969
997 998
= C - H
bending
936 937
= C - H bending 956 957 893 894
881 884 803 810
723 727 691 696
602 605 620 622
Table 11: IR band correlation of anthracene and anthraquinone with literature [58], [59], [60].

October 4, 2017 Dominik Wielend 46/74
According to Table 11, all the peaks determined in the spectra were also found in the SDBS data
base within ± 2 cm-1, apart from a slightly shifted C = O peak. Many of them could be correlated
to specific functional groups whereas others refer to fingerprints.
For the purpose of examining the structural changes upon anthraquinone reduction in the IR
range, an AQ/Ge electrode showed in Figure 24 was prepared and put into the setup. The
proposed reaction under nitrogen atmosphere is illustrated in Figure 48:
Figure 48: Reduction of anthraquinone under nitrogen conditions.
The results of the IR spectroelectrochemistry under nitrogen were shown in the following Figure
49:
Figure 49: Graphs of spectroelectrochemistry under N2. On the left side, the current from the step potentials applied
were plotted. On the right side, the IR spectra at certain potentials were shown.
The I-E curve in Figure 49 showed an even later onset for the reduction as the one on FTO in
Figure 44 which was due to the electronic properties of germanium. The IR spectrum, where the
change of bands was plotted, several appearing and disappearing peaks identified and
summarized in Table 12:

October 4, 2017 Dominik Wielend 47/74
Direction vexp / cm-1 vliterature / cm-1 Group
disappear ↓ 1675 1685 - 1665 aromatic ketone
C = O
disappear ↓ 1591 / 1579 1640 - 1590 C = C next to
C = O
appear ↑ 1135 / 1065 1050 - 1200 C - O phenol /
tert. alcohol
Table 12: IR band assignment of the spectroelectrochemistry under N2 [59], [60].
The IR spectrum in Figure 49 clearly showed the disappearance of the C=O group upon reduction.
Furthermore the disappearing doublet band at 1591/1579 could be clearly assigned to C=C group
next to C=O. In a less pronounced way, also the appearing of C-O bands assigned to tertiary
alcohols or phenols was observed.
The first slightly appearing and then finally disappearing band at 3394 cm-1 was quite startling as
one would expect it to fully appear, as this would correlate to O-H group of a phenol. This behaviour
could be attributed to the fluctuations inflicted by the flow of electrolyte.
As a next step, this experiment was repeated under CO2 saturated conditions and the proposed
reduction followed by CO2 capturing was shown in Figure 50:
Figure 50: Proposed reduction and CO2 capture of anthraquinone under CO2 conditions.
The results of the spectroelectrochemistry under those conditions are shown in the following
Figure 51:

October 4, 2017 Dominik Wielend 48/74
Figure 51: Graphs of spectroelectrochemistry under CO2. On the left side, the current from the step potentials applied
were plotted. On the right side, the IR spectra at certain potentials were shown.
In contrast to the nitrogen conditions, the I-E curve in Figure 51 looked quite comparable to the
one in Figure 46. On the first sight, also the IR spectrum looked similar to before, but a detailed
band identification and assignment was done in Table 13:
Direction vexp / cm-1 vliterature / cm-1 Group
appear ↑ 3334 > 3000 COO-H hydrogen
bonded
disappear ↓ 1675 1685 - 1665 aromatic ketone
C = O
disappear ↓ 1589 / 1579 1640 - 1590 C = C next to
C = O
disappear ↓ 1171 1050 - 1200 C - O phenol /
tert. alcohol
appear ↑ 1051 ether C - O
stretch
Table 13: IR band assignment of the spectroelectrochemistry under CO2 [59], [60].
In Figure 51 a broad band was appearing at 3334 cm-1 which could be assigned to an O-H
stretching of hydrogen bonded carboxylic acid. In analogy to the nitrogen conditions before, bands
assigned to aromatic C=O bonds were clearly disappearing.
At 2350 cm-1 a characteristic double peak from gaseous CO2 was disappearing, which could be
caused by insufficient purging the IR chamber prior the experiment.
Summing up, IR spectroelectrochemistry revealed some insights into molecular changes on the
anthraquinone core upon reduction. Unfortunately the structure of CO2 captured anthraquinone
species could not be resolved.
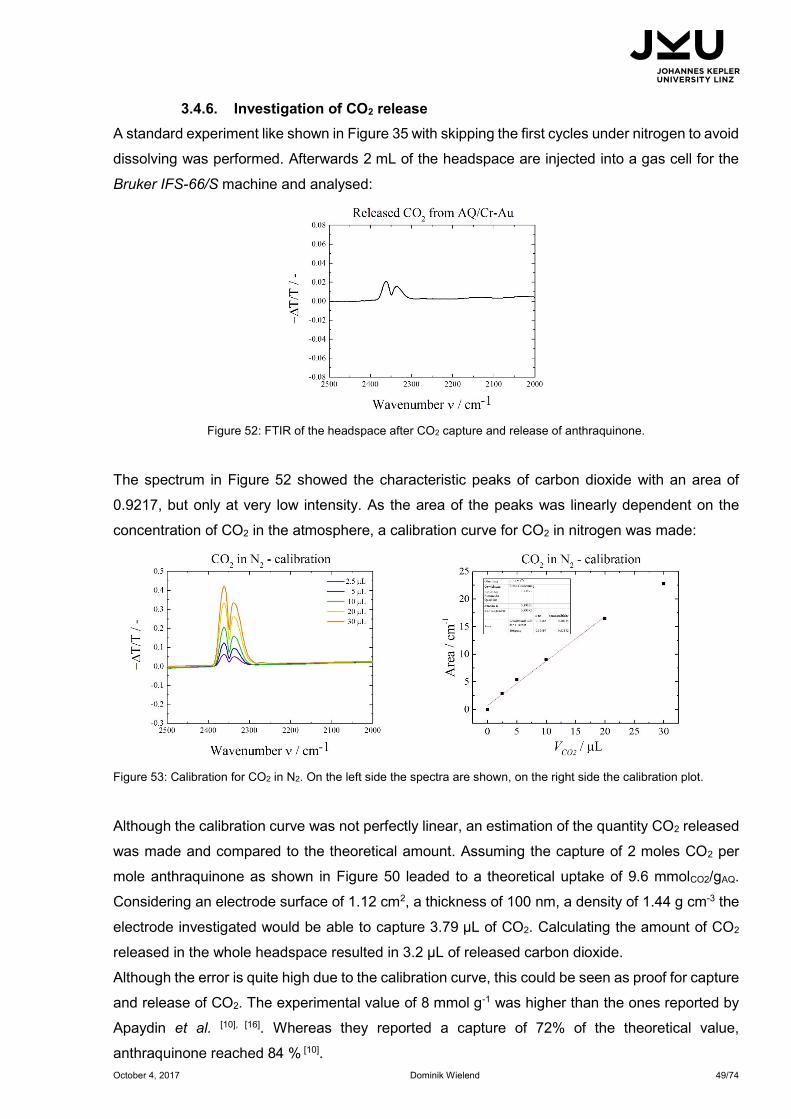
October 4, 2017 Dominik Wielend 49/74
3.4.6. Investigation of CO2 release
A standard experiment like shown in Figure 35 with skipping the first cycles under nitrogen to avoid
dissolving was performed. Afterwards 2 mL of the headspace are injected into a gas cell for the
Bruker IFS-66/S machine and analysed:
Figure 52: FTIR of the headspace after CO2 capture and release of anthraquinone.
The spectrum in Figure 52 showed the characteristic peaks of carbon dioxide with an area of
0.9217, but only at very low intensity. As the area of the peaks was linearly dependent on the
concentration of CO2 in the atmosphere, a calibration curve for CO2 in nitrogen was made:
Figure 53: Calibration for CO2 in N2. On the left side the spectra are shown, on the right side the calibration plot.
Although the calibration curve was not perfectly linear, an estimation of the quantity CO2 released
was made and compared to the theoretical amount. Assuming the capture of 2 moles CO2 per
mole anthraquinone as shown in Figure 50 leaded to a theoretical uptake of 9.6 mmolCO2/gAQ.
Considering an electrode surface of 1.12 cm2, a thickness of 100 nm, a density of 1.44 g cm-3 the
electrode investigated would be able to capture 3.79 µL of CO2. Calculating the amount of CO2
released in the whole headspace resulted in 3.2 µL of released carbon dioxide.
Although the error is quite high due to the calibration curve, this could be seen as proof for capture
and release of CO2. The experimental value of 8 mmol g-1 was higher than the ones reported by
Apaydin et al. [10], [16]. Whereas they reported a capture of 72% of the theoretical value,
anthraquinone reached 84 % [10].

October 4, 2017 Dominik Wielend 50/74
3.4.7. Investigation of CO2 reduction
As explained in chapter 3.1. Cr-Au electrodes were substrates of choice for screening different
pigments, they were also used for the first trials of AQ/Cr-Au electrodes towards electrolysis. In a
CO2 saturated system, -1200 mV vs. Ag/AgCl/3M KCl were applied for 1 h and the gas headspace
as well as the electrolyte solution was analysed with gas chromatography and ion chromatography
for H2, CO and formate. The results of AQ/Cr-Au electrodes were compared with blank Cr-Au
electrodes, as gold is a well-known catalyst for CO2 reduction to CO [24]. For determination of the
faradaic efficiency (FE), the following formula was used:
𝐹𝑎𝑟𝑎𝑑𝑎𝑖𝑐 𝑒𝑓𝑓𝑖𝑒𝑛𝑐𝑦/% = 𝑚𝑜𝑙𝑒𝑠 𝑜𝑓 𝑝𝑟𝑜𝑑𝑢𝑐𝑡 ∙ 𝑁𝑜 𝑜𝑓 𝑒𝑙𝑒𝑐𝑡𝑟𝑜𝑛𝑠 𝑝𝑒𝑟 𝑚𝑜𝑙𝑒 𝑝𝑟𝑜𝑑𝑢𝑐𝑡
𝑠𝑢𝑚 𝑜𝑓 𝑚𝑜𝑙𝑒𝑠 𝑜𝑓 𝑒𝑙𝑒𝑐𝑡𝑟𝑜𝑛𝑠
The comparison of absolute volumes of product and the faradaic efficiencies of quadruple
experiments in each case is shown in Table 14 (in no case, formate was detected):
VCO
/ µL VH2
/ µL FECO
/ % FEH2
/ %
AQ/Cr-Au 32 ± 3 83 ± 4 19 ± 7 51 ± 16
Blank – Cr/Au 16 ± 10 90 ± 32 10 ± 7 60 ± 20
Table 14: Comparison of CO2 reduction results of AQ/Cr-Au and Cr-Au electrodes after 1 h at -1200 mV.
Looking at the results in Table 14 it was obvious that the Cr-Au electrodes show a potent catalytic
activity for reducing CO2 to CO and proton reduction. According to Hori (2010), gold showed
faradaic efficiencies of 87 % towards CO and 10 % towards H2 [24]. Although those values were far
away from the experimental data, they indicated a trend towards CO formation. Furthermore, the
electrolysis from literature as performed at different current densities and electrolyte solutions.
Displayed in Table 14, blank Cr-Au electrodes showed FE’s of 10 % for CO and 60 % for H2. Due
to unknown reasons, the results were more disperse than with anthraquinone. The additional
anthraquinone layer increased the FE for CO, but as the errors were quite large; this enhancement
could not be stated to be significant.
To prove, if the CO2 capturing of AQ could enhance or even enable CO2 reduction, glassy carbon
(GC) as inert electrode was introduced. After applying -1200 mV for 1 h under CO2 saturated
conditions, only hydrogen was detected. Not only was the current only roughly 1/5 of Cr-Au also
the FE was significantly lower for H2 with 23 %. Furthermore, AG/GC was also not showing
catalytic activity towards CO2 reduction as H2 was the only detectable product produced at a FE
of 25 %.
Based on this knowledge that GC and even AQ/GC did not produce any CO2 reduction product,
further attempts towards CO2 reduction were made.
(3.4.7_3)

October 4, 2017 Dominik Wielend 51/74
3.4.8. Surface functionalization with metal islands
According to Hori (2010) metal electrodes could be classified in four groups depending on their
tendency towards CO2 reduction. The first class contained metals like platinum and iron, which
showed no tendency at all for CO2 reduction but only high selectivity for H2 evolution. Noble metals
from the second class like silver and gold showed a high tendency of producing CO as main
product followed by hydrogen and traces of formate. The third class containing metals like tin,
mercury and lead was mainly producing formate and also some hydrogen and CO. Copper alone
was forming the fourth class as it is forming a mix of products like formate, ethylene, methane,
and various alcohols and aldehydes [24].
As one theory was, that metal hydrides in near proximity of AQ-CO2 adducts might enable
reduction of CO2, several metals were chosen and tried to deposit onto the electrode for
electrochemical investigations. In the following Table 15 faradaic efficiencies for methane, CO, H2
and formate for the selected metals are displayed, according to Hori (2010) [24]:
Metal FECH4 / % FEformate / % FECO / % FEH2 / %
Platinum - 0.1 - 95.7
Nickel 1.8 1.4 - 88.9
Tin - 88.4 7.1 4.6
Copper 33.3 9.4 1.3 20.5
Table 15: Faradaic efficiencies for selected CO2 reduction products and H2 in 0.1 M KHCO3. Values taken from Hori
(2010) [24].
3.4.8.1. Platinum islands
For depositing Pt nanoparticles (NP) onto a glassy carbon electrode, the procedure from Duarte
et al. (2006) described in Table 7 was followed and the deposition diagram is shown in Figure 54:
Figure 54: Graphic progress of the potentiostatic Pt deposition.

October 4, 2017 Dominik Wielend 52/74
After the deposition shown in Figure 54 the glassy carbon showed a blueish / greyish colour from
the nanoparticles. Onto this electrode 100 nm of anthraquinone were evaporated and afterwards
the standard cyclic voltammograms recorded:
Figure 55: Comparison of AQ/Pt/GC in 0.1 M Na2SO4 in H2O.
Comparing the CV curves in Figure 55 with the ones of only anthraquinone in Figure 37, on the
one hand no reduction or re-oxidation wave of anthraquinone was observed. Although the onset
for hydrogen evolution was earlier in the case of platinum, this was still more negative than the
one for anthraquinone reduction usually occurs. Concerning the hydrogen evolution - with platinum
not only the potential was shifted to more positive values, also the current density at -1350 mV
was with -2 mA significantly larger than the largest value of pure anthraquinone with -0.7 mA.
On the other hand, under nitrogen and under CO2 one new oxidation peak each was appearing.
The one under nitrogen conditions might be overlapping with a possible anthraquinone re-
oxidation peak - but the current density of 1 mA was far too high for this.
Under CO2 atmosphere this oxidation peak was also visible but another new oxidation peak was
appearing. After releasing and re-purging the system with nitrogen, a nearly identical curve to the
initial one was observed.
As the first re-oxidation peak was in the proximity of the one of anthraquinone (Figure 37) it might
be originating from anthraquinone. Concerning the second peak occurring only under CO2 one
assumption would be an adsorbed CO2 species.
It is well-known that the interaction of hydrogen on platinum electrodes like adsorption and
desorption could be seen in cyclic voltammetry. Besides hydrogen many other compounds could
be adsorbed to platinum [61].

October 4, 2017 Dominik Wielend 53/74
A work by Vassiliev et al. (1985) described condition for adsorbed carbon dioxide species. They
reported tightly bonded CO2 at pH values up to 6 reducing the coverage of adsorbed hydrogen
which could only be released oxidatively or at higher pH [62].
Still the current density for oxidative release of adsorbed CO2 was most probably too high. To
verify or falsify this assumption by investigation of the possible adsorptions would go far beyond
the scope of this work.
Beside cyclic voltammetry also electrolysis at -1200 mV for 1 h under CO2 conditions was
performed. The only product detected was H2 with a FE of 98.7%, which was even higher than the
96% reported by Hori (2010) [24].
Summing up, the lack of an anthraquinone reduction peak and a behaviour towards CO2 reduction
very similar to literature might mean that only the Pt-NPs were electrochemically addressed and
not the anthraquinone.
To verify the deposition of platinum and investigate the surface upon deposition, SEM images of
the AQ/Pt/GC electrode were made before and after the electrochemistry:
Figure 56: SEM images of the AQ/Pt/GC electrode before (left) and after the electrochemistry (right).
The left picture in Figure 56 was recorded at the Zeiss SEM machine offering higher resolution. In
this picture both, the white platinum NPs and the grey anthraquinone parts were clearly visible.
The size of the Pt-NP was roughly 170 to 400 nm, but some particles stick together forming
caterpillar-like shapes. After the electrochemical characterization, no anthraquinone could be seen
any more. This might be due to peeling AQ off the surface by hydrogen evolution.
Summing up, the anthraquinone and platinum particles seemed to be well distributed, but only the
Pt-NPs could be addressed electrochemically. This meant that most probably no reduction of AQ
was happening and therefore no CO2 capturing or CO2 reduction on AQ could take place.

October 4, 2017 Dominik Wielend 54/74
3.4.8.2. Nickel islands
According to Hori (2010) nickel was in the same classification group for electrochemical CO2
reduction. Nevertheless it were a cheaper alternative to platinum which was furthermore even
reported to be able to produce traces of methane and CO on its own [24].
Following the potentiostatic deposition procedure from Gómez et al. (1992) summarized in Table
8 resulted in the following current-time curve:
Figure 57: Graphic progress of the potentiostatic Ni deposition.
The curve in Figure 57 was a bit different from the one of platinum in Figure 54. In both figures,
the current was becoming less negative in the beginning due to impoverishing of metal ions next
to the electrode. In case of platinum this period was followed by a period of constant current
whereas in case of nickel a plateau was observed and the current was becoming more negative
again. This might be hint that after an initial nucleation of nickel ions on the surface the further
incorporation of atoms was facilitated.
During this procedure only a slight colour change to grey was observed. Again, after evaporation
of 100 nm of anthraquinone the electrode was tested electrochemically towards CO2 capturing /
reduction:

October 4, 2017 Dominik Wielend 55/74
Figure 58: Comparison of AQ/Ni/GC in 0.1 M Na2SO4 in H2O.
The CV curve under N2 in Figure 58 was quite different from the one of pure anthraquinone in
Figure 37Figure 35. Although a faint hint of the anthraquinone reduction peak as shoulder was
observable, the re-oxidation peak at roughly -660 mV was more visible. The shape of the reduction
peak up to -1350 mV (most probably hydrogen evolution) was also broader than without nickel.
Under CO2 atmosphere, similar to Figure 35, a small oxidation peak at -380 mV as observed which
as due to the electrode. Although upon CO2 purging a more acidic medium was present, the
reduction peak was much less pronounced than under nitrogen.
Repurging the cell with nitrogen recovers the initial shape of the CV curve again. Due to
anthraquinone dissolving, the characteristic features were hard to detect - but the re-oxidation
peak was again observable.
In addition to cyclic voltammetry also -1200 mV were applied for 1 h under CO2 atmosphere.
Thereby H2 as the only detectable product formed at a faradaic efficiency of 86.3 %, which was a
bit lower than the value reported by Hori (2010) [24].
Summing up, in contrast to the Pt-NPs, the AQ/Ni/GC electrode still showed hints of the
anthraquinone peaks but also an enhanced hydrogen production. This meant that from CV,
features of nickel and AQ were observed which might be a hint for coupling electronic properties.
Electrolysis revealed that no real coupling was observed but only nickel as addressed
electrochemically for hydrogen evolution.
Furthermore the electrode was analysed before and after electrochemistry under SEM in Figure
59:

October 4, 2017 Dominik Wielend 56/74
Figure 59: SEM images of the AQ/Ni/GC electrode before (left) and after the electrochemistry (right).
On the left picture in Figure 59 a gathering of nickel islands and anthraquinone was observed.
After the CV no defined anthraquinone structures were observed any more. If this was due to
complete dissolution or forming of smooth film could not be clarified by the SEM images.
Nevertheless no needle formation like in Figure 40 happened.
To prove that the metal nanoparticles seen were formed by nickel, EDX of a grey part (carbon
surface) was compared with a white part (metal nanoparticle) in Figure 60:
Figure 60: EDX of the AQ/Ni/GC electrode. Spectrum of a grey part (left figure) and the spectrum of a white part (right
image).
In both images of Figure 60 a peak of sodium was visible, which as most probably due to residues
of NaCl from the nickel deposition procedure. The image of a grey, carbon part (left image) only
carbon, oxygen and sodium as elements were identified. In the image of the white metal part (right
image) in addition also shows the characteristic peaks of nickel.
These results show that the deposition of nicely distributed nickel nanoparticles was successful
and that only the white parts of the image were formed by nickel.

October 4, 2017 Dominik Wielend 57/74
3.4.8.3. Tin islands
According to the classification of metals by Hori (2010), tin was reported to form formate as the
main CO2 reduction product [24]. This fact was caused by different tendency of reaction pathway
dependent on the metal used, studied and reported in detail by Feaster et al. (2017) [25].
Therefore the possible interaction of anthraquinone and tin was part of this chapter. Potentiostatic
deposition of tin was done according to Rudnik and Włoch (2013) summarized in Table 9 resulting
in the following current-time curve [51]:
Figure 61: Graphic progress of the potentiostatic Sn deposition.
Analysing the graphs in Figure 61 revealed that significantly higher current was present than in Pt
or Ni depositions. One had to mention that the deposition bath described in Table 9 was actually
not a clear solution but a turbid suspension due to formation of a hydroxide species [6].
After this process a grey deposition of Sn was observed, 100 nm of anthraquinone evaporated
onto it and tested electrochemically:
Figure 62: Comparison of AQ/Sn/GC in 0.1 M Na2SO4 in H2O.

October 4, 2017 Dominik Wielend 58/74
All three CV curves shown in Figure 62 were very comparable to the ones with nickel in Figure 58.
The two curves under N2 were nearly identical and show a small, even less pronounced re-
oxidation peak from anthraquinone as with Ni. With tin, no reduction peak correlated to
anthraquinone alone was detected. Interestingly and in contrast to Figure 58 the AQ re-oxidation
was present in the most pronounced way under CO2.
Applying -1200 mV for 1 h under CO2 atmosphere produced hydrogen at a FE of 47.8 % and CO
at a FE of 2.3 % and no formate as detected. This result was quite different from the reported
values in Table 15. With help of a Sn/GC blank experiment those reaction products, especially CO
could solely be correlated to the Sn particles (FECO = 1.7%) and no significant enhancement by
anthraquinone was observed.
Summarising the results from the electrochemical characterization AQ/Sn/GC showed that AQ
was hardly - if even - addressed electrochemically. Performing electrolysis with and without
anthraquinone did not show any significant difference.
Again, beside electrochemical characterization the electrode was also analysed with SEM before
and after electrochemistry in Figure 63:
Figure 63: SEM images of the AQ/Sn/GC electrode before (left) and after the electrochemistry (right).
The SEM images shown in Figure 63 showed a quite different picture of deposited metal islands.
In contrast to the spherical particles of Pt and Ni, the tin particles showed a cubic structure.
Besides the shape also the size of the tin particles was in the micrometre range instead of several
hundred nanometres. On the left image (before electrochemistry) small grey particles could be
seen, which were most likely evaporated anthraquinone. After the electrochemistry no such
particles were observed any more on the smooth flat GC surface.
Naming the interesting shape and morphology of the tin particles, another image with changed
SEM parameters is shown in Figure 64:

October 4, 2017 Dominik Wielend 59/74
Figure 64: SEM image of AQ/Sn/GC before electrochemistry.
In this Figure 64 not only the flat top surface of the tin particles could be seen but also interesting
shapes were observed.
To prove again that the metal particles seen were formed by tin, EDX of a grey part (carbon surface
/ anthraquinone) was compared with a white cube (metal nanoparticle) in Figure 65:
Figure 65: EDX of the AQ/Sn/GC electrode. Spectrum of a grey part (left figure) and the spectrum of a white cube (right
image).
In accordance with the nickel particles in Figure 60, there were still some small residues of sodium
observable. The grey carbon surface (left image) showed nearly no Sn at all whereas the white
tin cubes were mainly formed by tin.
Summing up, this deposition did again result in isolated metal islands - this time not in nanometre
scale but in micrometre scale.

October 4, 2017 Dominik Wielend 60/74
3.4.8.4. Copper islands
Copper was an interesting and well-studied metal catalyst in CO2 reduction forming various
different reaction products. Luo et al. (2012) reported a procedure for deposition of copper NPs,
which is reported in Table 10 [52]. The result of the deposition as current-time curve is shown in
Figure 66:
Figure 66: Graphic progress of the potentiostatic Cu deposition.
The deposition curve in Figure 66 exhibited the expected shape with a maximum (most positive
current) due to depletion of copper ions in the near proximity of the electrode followed by a quite
constant current caused by diffusion (very similar to Figure 57 and Figure 61).
During deposition the progress could be monitored by eye as a uniform red copper layer was
forming. After evaporating 100 nm of anthraquinone on top, electrochemical investigations of the
AQ/Cu/GC electrode were performed:

October 4, 2017 Dominik Wielend 61/74
Figure 67: Comparison of AQ/Cu/GC in 0.1 M Na2SO4 in H2O.
Comparing the CVs in Figure 67 to all previous ones showed that the presence of copper
introduced many more peaks. Starting under N2 conditions when going to the positive side, an
oxidative peak at +140 mV was present, followed by two small waves. Taking the pH of 6.4 into
account, the one at +140 mV was originating from oxidation of metallic Cu0 to Cu+ (as Cu2O) and
one of the further peaks from Cu+ oxidation to Cu2+. Sweeping to more negative potentials the
corresponding re-reduction peaks at +30 mV and -270 mV were observed. The fourth reductive
peak at -824 mV could be correlated to anthraquinone reduction, with the corresponding re-
oxidation peak at -679 mV. All the correlations concerning copper were based on the Pourbaix
diagram of copper in the work of Badawy et al. (2013) [63].
The origin of third reduction peak at -575 mV as well as the corresponding re-oxidation peak at -
310 mV could not be understood with help of the Pourbaix diagram or the knowledge about
anthraquinone.
Under CO2 atmosphere all peaks except one at -350 mV disappeared and a flatter cyclic
voltammogram was observed. As this peak was also observed at an AQ/GC electrode (Figure 35)
an influence by copper was unlikely.
After re-purging the system with nitrogen only one oxidative peak at +140 mV together with the
re-reduction at +30 mV was present. In the cathodic region the anthraquinone reduction could be
guessed to be present as faint step. Although the resolution in Figure 67 was not high enough -
the anthraquinone re-oxidation was present as small peak, similar to Figure 58. Furthermore a
significant drop in current density at -1350 mV from -4.7 to -2.8 mA cm-2 from the initial curve under
N2 to the re-purged conditions was observed. This indication together with copper particles
dissolving from the electrode while scanning was a hint for loss of active material during the
investigations. The result of SEM images before and afterwards is shown later in Figure 68.
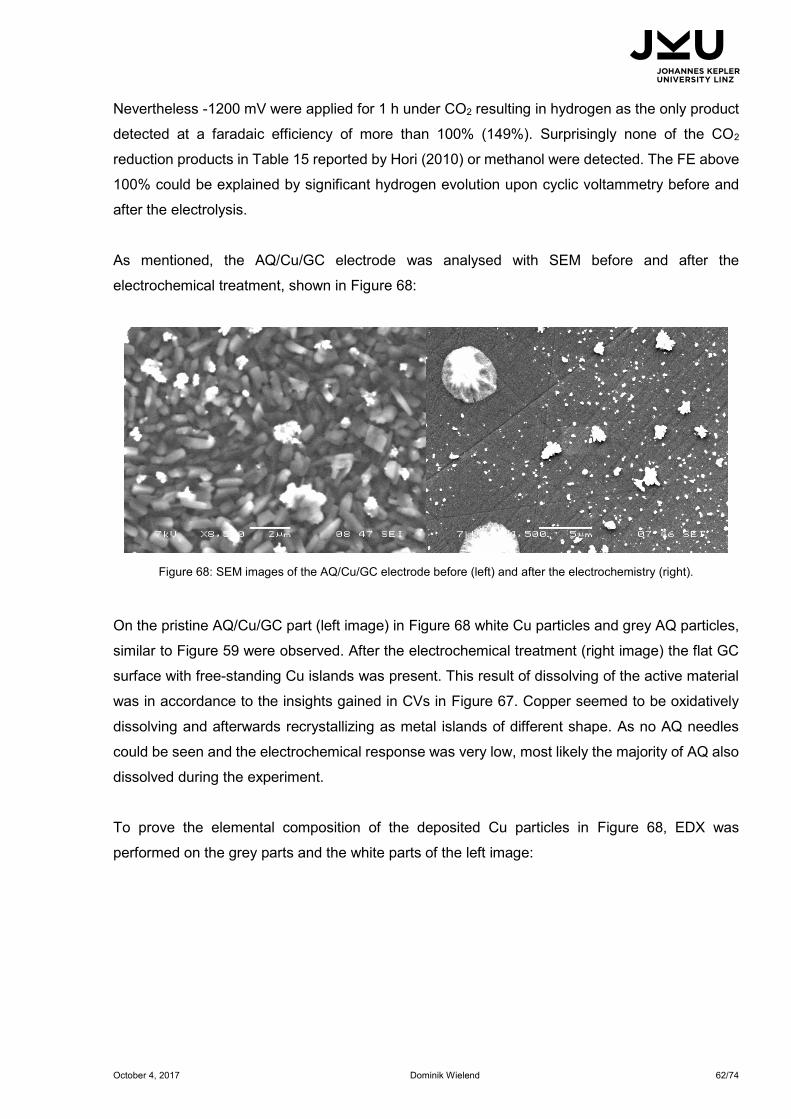
October 4, 2017 Dominik Wielend 62/74
Nevertheless -1200 mV were applied for 1 h under CO2 resulting in hydrogen as the only product
detected at a faradaic efficiency of more than 100% (149%). Surprisingly none of the CO2
reduction products in Table 15 reported by Hori (2010) or methanol were detected. The FE above
100% could be explained by significant hydrogen evolution upon cyclic voltammetry before and
after the electrolysis.
As mentioned, the AQ/Cu/GC electrode was analysed with SEM before and after the
electrochemical treatment, shown in Figure 68:
Figure 68: SEM images of the AQ/Cu/GC electrode before (left) and after the electrochemistry (right).
On the pristine AQ/Cu/GC part (left image) in Figure 68 white Cu particles and grey AQ particles,
similar to Figure 59 were observed. After the electrochemical treatment (right image) the flat GC
surface with free-standing Cu islands was present. This result of dissolving of the active material
was in accordance to the insights gained in CVs in Figure 67. Copper seemed to be oxidatively
dissolving and afterwards recrystallizing as metal islands of different shape. As no AQ needles
could be seen and the electrochemical response was very low, most likely the majority of AQ also
dissolved during the experiment.
To prove the elemental composition of the deposited Cu particles in Figure 68, EDX was
performed on the grey parts and the white parts of the left image:

October 4, 2017 Dominik Wielend 63/74
Figure 69: EDX of the AQ/Cu/GC electrode. Spectrum of a grey AQ part (left figure) and the spectrum of a white crystal
(right image).
Interestingly, in both parts / images significant amounts of Cu were detected, although in the white
crystal (right image) twice the amount of counts is detected. Together with the SEM and EDX
images of the pristine Cu/GC electrode (not shown), this result proved that not isolated Cu islands
like in case of the metals were formed but a rough compact film with particles of different sizes.
Therefore some of those particles were poking out of the AQ parts in Figure 68 but one had to
keep in mind that with the deposition procedure from Luo et al. (2012) the whole GC surface was
covered [52].
Summing up, the Cu deposition resulted in a rough but compact film of copper. The descriptive
electrochemistry of copper was still present at an AQ/Cu/GC electrode. Although most of all the
peaks occurring in Figure 67 could be correlated and identified, the origin of one peak was still
startling.
No real CO2 capture or reduction was observed which might be mainly caused by rapid dissolution
of anthraquinone and copper.

October 4, 2017 Dominik Wielend 64/74
4. Conclusion
Various carbonyl pigments were screened electrochemically for their possible capability of
capturing carbon dioxide. The results already reported in literature about QNC and NBIT could be
reproduced. Anthraquinone was found to be the best suitable candidate for this purpose among
the other pigments tested as illustrated in Figure 37.
The process of electrochemical capturing of CO2 by anthraquinone evaporated onto an electrode
was examined via cyclic voltammetry and SEM. During this reversible capture-release process
the morphology of initially cubic structured AQ changed to a Mikado-like structure (see Figure 40).
Upon reduction under CO2 atmosphere, AQ did not dissolve when reduced and changed colour.
Those colour changes were recorded with camera as well as with UV-vis spectroelectrochemistry.
In-situ ATR-IR spectroelectrochemistry detected the chemical changes in anthraquinone upon
electrochemical reduction and a possible formation of a carbonate-like species.
In an attempt to quantify the amount of captured and released carbon dioxide, an experimental
capture ability of 84% compared to the theoretical value was measured. Although the precise
number should not be referred to as set in stone, this experiment could be seen as proof for the
reversible electrochemical capture and release of CO2.
Anthraquinone alone was not capable of electrochemical reduction of carbon dioxide.
Nevertheless, deposited on gold it showed vague tendencies to enhance the catalytic CO2
reduction. This might be caused by higher concentration of CO2 in near proximity of the catalytic
gold electrode.
To test this theory, electrode surface modification by electrodeposited metal nanostructures
followed by anthraquinone deposition was performed. Platinum, nickel, tin and copper were
chosen. Those electrodes were investigated in the same way electrochemically and with SEM.
Electrolysis was also performed and the presence of possible CO2 reduction products was
checked.
Metals which were usually only capable of hydrogen reduction (Pt, Ni) produced only hydrogen at
faradaic efficiencies reported in literature. Tin and copper also mainly produced hydrogen although
the blank metals were reported to produce other products like formate, CO, methane.
In all cases the anthraquinone depositions were gone after the electrochemistry, most probably
dissolved due to hydrogen bubbles. None of those metals showed synergistic electrochemical
features in the CV together with anthraquinone. This could be seen as hint that the desired
electrochemical linking of anthraquinone with metal nanostructures was not successful.
Looking forward to a possible way of combining capturing the CO2 and reducing it
electrochemically, this target might be achieved by covalently linking the capturing unit (like AQ)
to a catalytic reducing unit (metal complex, proton source from an amine,…).

October 4, 2017 Dominik Wielend 65/74
5. Bibliography
[1] United States Environmental Protection Agency (EPA), „Climate Change Indicators:
Greenhouse Gases,“ February 2017. [Online]. Available: https://www.epa.gov/climate-
indicators/greenhouse-gases. [Access at 13 September 2017].
[2] D. Clark and www.carbonbrief.org, „How long do greenhouse gases stay in the air?,“ The
Guardian, 16 January 2012. [Online]. Available:
https://www.theguardian.com/environment/2012/jan/16/greenhouse-gases-remain-air.
[Access at 13 September 2017].
[3] S. Topham, A. Bazzanella, S. Schiebahn, S. Luhr, L. Zhao, A. Otto and D. Stolten, „Carbon
Dioxide,“ in Ullmann's Encyclopedia of Industrial Chemistry, Weinheim, Wiley-VCH, 2014,
pp. 1-43.
[4] E. Kintisch, „Can Sucking CO2 Out of the Atmosphere Really Work?,“ MIT Technology
Review, 7 October 2014. [Online]. Available:
https://www.technologyreview.com/s/531346/can-sucking-co2-out-of-the-atmosphere-
really-work/. [Access at 31 August 2017].
[5] K. Weissermel and H.-J. Arpe, Industrial Organic Chemistry, 4. Ed., Weinheim: WILEY-VCH,
2003, pp. 21-22, 328-331.
[6] A. F. Hollemann, E. Wiberg and N. Wiberg, Lehrbuch der Anorganischen Chemie, 102. Ed.,
Berlin: Walter de Gruyter & Co, 2007, pp. 534-535, 1014, 1284-1291.
[7] UOP LLC, A Honeywell Company, „UOP BenfieldTM Process,“ March 2013. [Online].
Available: https://www.uop.com/?document=benfield-process-datasheet&download=1.
[Access at 31 August 2017].
[8] W. Boll, G. Hochgesand, C. Higman, E. Supp, P. Kalteier, W.-D. Müller, M. Kriebel, H.
Schlichting and H. Tanz, „Gas Production, 3. Gas Treating,“ in Ullmann's Encyclopedia of
Industrial Chemistry, Weinheim, Wiley-VCH, 2012, pp. 483-539.
[9] J. H. Rheinhardt, P. Singh, P. Tarakeshwar and D. A. Buttry, „Electrochemical Capture and
Release of Carbon Dioxide,“ ACS Energy Lett., 2, pp. 454-461, 2017.
[10] D. H. Apaydin, E. D. Głowacki, E. Portenkirchner and N. S. Sariciftci, „Direct Electrochemical
Capture and Release of Carbon Dioxide Using an Industrial Organic Pigment: Quinacridone,“
Angew. Chem. Int. Ed., 53, p. 6819 –6822, 2014.
[11] D. Nelson and M. Cox, Lehninger Biochemie, 4. Ed., Berlin: Springer, 2011, p. 938.
[12] J. Clayden, N. Greeves and S. Warren, Organic Chemsitry, 2. Ed., Oxford: Oxford Univeristy
Press, 2012, pp. 481-482.
[13] J. Harada, Y. Sakakibara, A. Kunai and K. Sasaki, „Electrochemical Carboxylation of α,β-
Usaturated Ketones with Carbon Dioxide,“ Bull. Chem. Soc. Jpn., 57, pp. 611-612, 1984.
[14] M. B. Mizen and M. S. Wrighton, „Reductive Addition of CO2 to 9,10-Phenanthrenequinone,“
J. Electrochem. Soc., 136, pp. 941-946, 1989.
[15] B. Gurkan, F. Simeon and A. T. Hatton, „Quinone Reduction in Ionic Liquids for
Electrochemical CO2 Separation,“ ACS Sustainable Chem. Eng., 3, p. 1394−1405, 2015.
[16] D. H. Apaydin, M. Gora, E. Portenkirchner, K. T. Oppelt, H. Neugebauer, M. Jakesova, E. D.
Głowacki, J. Kunze-Liebhauser, M. Zagorska, J. Mieczkowski and N. S. Sariciftci,
„Electrochemical Capture and Release of CO2 in Aqueous Electrolytes Using an Organic
Semiconductor Electrode,“ ACS Appl. Mater. Interfaces, 9, p. 12919−12923, 2017.

October 4, 2017 Dominik Wielend 66/74
[17] E. D. Bates, R. D. Mayton, I. Ntai and J. H. Davis Jr., „CO2 Capture by a Task-Specific Ionic
Liquid,“ J. Am. Chem. Soc., 124, pp. 926-927, 2002.
[18] R. Ranjan, J. Olson, P. Singh, E. D. Lorance, D. A. Buttry and I. R. Gould, „Reversible
Electrochemical Trapping of Carbon Dioxide Using 4,4′- Bipyridine That Does Not Require
Thermal Activation,“ J. Phys. Chem. Lett., 6, p. 4943−4946, 2015.
[19] H. Ishidia, T. Ohba, T. Yamaguchi and K. Ohkubo, „Interaction between CO2 and
Electrochemically Reduced Species of N-propyl-4,4′-bipyridinium Cation,“ Chem. Lett., 23,
pp. 905-908, 1994.
[20] P. Singh, J. H. Rheinhardt, J. Z. Olson, P. Tarakeshwar, V. Mujica and D. A. Buttry,
„Electrochemical Capture and Release of Carbon Dioxide Using a Disulfide−Thiocarbonate
Redox Cycle,“ J. Am. Chem. Soc., 139, pp. 1033-1036, 2017.
[21] R. Lyndon, K. Konstas, A. W. Thornton, A. J. Seeber, B. P. Ladewig and M. R. Hill, „Visible
Light-Triggered Capture and Release of CO2 from Stable Metal Organic Frameworks,“
Chem. Mater., 27, p. 7882−7888, 2015.
[22] F. Ausfelder and A. Bazzanella, „Verwertung und Speicherung von CO2,“ October 2008.
[Online]. Available: https://dechema.de/dechema_media/diskussionco2-view_image-1-
called_by-dechema-original_site-dechema_eV-original_page-124930.pdf. [Access at 7
September 2017].
[23] D. H. Apaydin, S. Schlager, E. Portenkirchner and N. S. Sariciftci, „Organic, Organometallic
and Bioorganic Catalysts for Electrochemical Reduction of CO2,“ ChemPhysChem, 18,
2017.
[24] Y. Hori, „CO2-reduction, catalyzed by metal electrodes,“ in Handbook of Fuel Cells –
Fundamentals, Technology and Applications, New Jersey, John Wiley & Sons, 2010, 1-14.
[25] J. T. Feaster, C. Shi, E. R. Cave, T. Hatsukade, D. N. Abram, K. P. Kuhl, C. Hahn, J. K.
Nørskov and T. F. Jaramillo, „Understanding Selectivity for the Electrochemical Reduction of
Carbon Dioxide to Formic Acid and Carbon Monoxide on Metal Electrodes,“ ACS Catal., 7,
p. 4822−4827, 2017.
[26] C. Liu, T. R. Cundari and A. K. Wilson, „CO2 Reduction on Transition Metal (Fe, Co, Ni, and
Cu) Surfaces in Comparison with Homogeneous Catalysis,“ J. Phys. Chem. C, 116, p.
5681−5688, 2012.
[27] N. Hoshi, M. Kato and Y. Hori, „Electrochemical reduction of CO2 on single crystal electrodes
of silver Ag(111) , Ag(100) and Ag(110),“ J. Electroanal. Chem., 440, pp. 283-286, 1997.
[28] S. Gao, Y. Lin, X. Jiao, Y. Sun, Q. Luo, W. Zhang, D. Li, J. Yang and Y. Xie, „Partially oxidized
atomic cobalt layers for carbon dioxide electroreduction to liquid fuel,“ Nature, 529, pp. 68-
71, 2016.
[29] N. Kornienko, Y. Zhao, C. S. Kley, C. Zhu, D. Kim, S. Lin, C. J. Chang, O. M. Yaghi and P.
Yang, „Metal−Organic Frameworks for Electrocatalytic Reduction of Carbon Dioxide,“ J. Am.
Chem. Soc., 137, p. 14129−14135, 2015.
[30] J. Hawecker, J.-M. Lehn and R. Ziessel, „Electrocatalytic Reduction of Carbon Dioxide
Mediated by Re(bipy)(CO)&I (bipy = 2,2’-bipyridine),“ J. Chem. Soc., Chem. Commun., pp.
328-330, 1984.
[31] G. Seshadri, C. Lin and A. B. Bocarsly, „A new homogeneous electrocatalyst for the
reduction of carbon dioxide to methanol at low overpotential,“ J. Electroanal. Chem., 372,
pp. 145-150, 1994.

October 4, 2017 Dominik Wielend 67/74
[32] T. E. Rosser and E. Reisner, „Understanding Immobilized Molecular Catalysts for Fuel-
Forming Reactions through UV/Vis Spectroelectrochemistry,“ ACS Catal., 7, pp. 3131-3141,
2017.
[33] E. Portenkirchner, J. Gasiorowski, K. Oppelt, S. Schlager, C. Schwarzinger, H. Neugebauer,
G. Knör and N. S. Sariciftci, „Electrocatalytic Reduction of Carbon Dioxide to Carbon
Monoxide by a Polymerized Film of an Alkynyl-Substituted Rhenium(I) Complex,“
ChemCatChem, 5, p. 1790 – 1796, 2013.
[34] D. H. Apaydin, E. Tordin, E. Portenkirchner, G. Aufischer, S. Schlager, M. Weichselbaumer,
K. Oppelt and N. S. Sariciftci, „Photoelectrochemical Reduction of CO2 Using Third-
Generation Conjugated Polymers,“ ChemistrySelect, 6, p. 1156– 1162, 2016.
[35] S. Schlager, L. M. Dumitru, M. Haberbauer, A. Fuchsbauer, H. Neugebauer, D.
Hiemetsberger, A. Wagner, E. Portenkirchner and N. S. Sariciftci, „Electrochemical
Reduction of Carbon Dioxide to Methanol by Direct Injection of Electrons into Immobilized
Enzymes on a Modified Electrode,“ ChemSusChem, 9, pp. 631-635, 2016.
[36] A. Bassegoda, C. Madden, D. W. Wakerley, E. Reisner and J. Hirst, „Reversible
Interconversion of CO2 and Formate by a Molybdenum-Containing Formate
Dehydrogenase,“ J. Am. Chem. Soc., 136, pp. 15473-15476, 2014.
[37] W. E. Robinson, A. Bassegoda, E. Reisner and J. Hirst, „Oxidation-State-Dependent Binding
Properties of the Active Site in a Mo-Containing Formate Dehydrogenase,“ J. Am. Chem.
Soc., 139, p. 9927−9936, 2017.
[38] K. Hunger and W. Herbst, „Pigments, Organic,“ in Ullmann's Encyclopedia of Industrial
Chemistry, Weinheim, Wiley VCH, 2012, pp. 379-423.
[39] M. Jakešová, D. H. Apaydin, M. Sytnyk, K. Oppelt, W. Heiss, N. S. Sariciftci and E. D.
Głowacki, „Hydrogen-Bonded Organic Semiconductors as Stable Photoelectrocatalysts for
Efficient Hydrogen Peroxide Photosynthesis,“ Adv. Funct. Mater., 26, p. 5248–5254, 2016.
[40] M. Ragnar, G. Henriksson, M. E. Lindström, M. Wimby, J. Blechschmidt and S. Heinemann,
„Pulp,“ in Ullmann's Encyclopedia of Industrial Chemistry, Weinheim, Wiley VCH, 2014, 15.
[41] C. Li and H. Wonneberger, „Perylene Imides for Organic Photovoltaics: Yesterday,Today,
and Tomorrow,“ Adv. Mater., 24, p. 613–636, 2012.
[42] M. Grzybowski and D. T. Gryko, „Diketopyrrolopyrroles: Synthesis, Reactivity, and Optical
Properties,“ Adv. Optical Mater., 3, p. 280–320, 2015.
[43] M. Kaur and D. H. Choi, „Diketopyrrolopyrrole: brilliant red pigment dye-based fluorescent
probes and their applications,“ Chem. Soc. Rev., 44, pp. 58-77, 2015.
[44] J. Warnan, J. Willkomm, J. N. Ng, R. Godin, S. Prantl, J. R. Durrant and E. Reisner, „Solar
H2 evolution in water with modified diketopyrrolopyrrole dyes immobilised on molecular Co
and Ni catalyst–TiO2 hybrids,“ Chem. Sci., 8, pp. 3070-3079, 2017.
[45] A. Kovalenko, C. Yumusak, P. Heinrichova, S. Stritesky, L. Fekete, M. Vala, M. Weiter, N. S.
Sariciftci and J. Krajcovic, „Adamantane substitutions: a path to high-performing, soluble,
versatile and sustainable organic semiconducting materials,“ J. Mater. Chem. C, 5, pp. 4716-
4723, 2017.
[46] H. G. O. Becker, W. Berger, G. Domschke, E. Fanghänel, J. Faust, M. Fischer, F. Gentz, K.
Gewald, R. Gluch, R. Mayer, K. Müller, D. Pavel, H. Schmidt, K. Schollberg, K. Schwetlick,
E. Seiler and G. Zeppenfeld, Organikum - Organisch-chemisches Grundpraktikum, 21. Ed.,
Weinheim: Wiley VCH, 2001, pp. 417, 438-440.

October 4, 2017 Dominik Wielend 68/74
[47] G. M. Sheldrick, SHELXS-97, Program for the solution of Crystal Structures, Göttingen:
University of Göttingen, 1997.
[48] G. M. Sheldrick, SHELXL-97, Program for Crystal Structure refinement, Göttingen: University
of Göttingen, 1997.
[49] M. M. E. Duarte, A. S. Pilla, J. M. Sieben and C. E. Mayer, „Platinum particles
electrodeposition on carbon substrates,“ Electrochem. Commun., 8, pp. 159-164, 2006.
[50] E. Gómez, C. Muller, W. G. Proud and E. Vallés, „Electrodeposition of nickel on vitreous
carbon: influence of potential on deposit morphology,“ J. Appl. Electrochem., 22, pp. 872-
876, 1992.
[51] E. Rudnik and G. Włoch, „Studies on the electrodeposition of tin from acidic chloride–
gluconate solutions,“ Appl. Surf. Sci., 265, pp. 839-849, 2013.
[52] J. Luo, S. Jiang, H. Zhang, J. Jiang and X. Liu, „A novel non-enzymatic glucose sensor based
on Cu nanoparticle modified graphene sheets electrode,“ Anal. Chim. Acta, 709, pp. 47-53,
2012.
[53] S. K. Lee, Y. Zu, A. Herrmann, Y. Geerts, K. Müllen and A. J. Bard, „Electrochemistry,
Spectroscopy and Electrogenerated Chemiluminescence of Perylene, Terrylene, and
Quaterrylene Diimides in Aprotic Solution,“ J. Am. Chem. Soc., 121, pp. 3513-3520, 1999.
[54] R. G. Compton and C. E. Banks, Understanding Voltammetry, 2. Ed., London: Imperial
College Press, 2011, pp. 147-152.
[55] Y. Fu and C. P. Brock, „Temperature Dependence of the Rigid-Body Motion of
Anthraquinone,“ Acta Cryst., B54, pp. 308-315, 1998.
[56] J. Revenga, F. Rodríguez and J. Tijero, „Study of the Redox Behavior of Anthraquinone in
Aqueous Medium,“ J. Electrochem. Soc., 141, pp. 330-333, 1994.
[57] A. Babaei, P. A. Connor, J. McQuillan and S. Umapathy, „UV-Visible
Spectroelectrochemistry of Reduction Products of Anthraquinone in Dimethylformamide
Solutions,“ J. Chem. Educ., 74, pp. 1200-1204, 1997.
[58] S. Kinugasa, K. Tanabe and T. Tamura, „Spectral Database for Organic Compounds
(SDBS),“ National Institute of Advanced Industrial Science and Technology (AIST), [Online].
Available: http://sdbs.db.aist.go.jp. [Access at 08 August 2017].
[59] M. Hesse, H. Meier and B. Zeeh, Spektroskopische Methoden in der organischen Chemie,
7. Ed., Stuttgart: Georg Thieme Verlag, 2005, pp. 52-57.
[60] J. Hanson, „Characteristic IR Absorption Frequencies of Organic Functional Groups,“
University of Puget Sound, [Online]. Available:
http://www2.ups.edu/faculty/hanson/Spectroscopy/IR/IRfrequencies.html. [Access at 24
August 2017].
[61] A. J. Bard and L. R. Faulkner, Electrochemical Methods - Fundamentals and Applications,
2. Ed., New York: John Wiley & Sons, Inc., 2001, pp. 569-571.
[62] Y. B. Vassiliev, V. S. Bagotzky, N. V. Osetrova and A. A. Mikahailova, „Electroreduction of
Carbon Dioxide - Part III: Adsorption and reduction of CO2 on platinum metals,“ J.
Electroanal. Chem., 189, pp. 311-324, 1985.
[63] W. A. Badawy, M. M. El-Rabiei, N. H. Helal and H. M. Nady, „Electrochemical Behavior and
Stability of Cu-Al-Ni Alloys in NaOH Solutions,“ Z. Phys. Chem., 227, pp. 1143-1158, 2013.
Copyright © 2022 FDOKUMEN