Cycle Integration - A Method to reduce Penalty due to Post-Combustion CO2 Capture
26
Energy Research Center 36 th International Technical Conference on Clean Coal & Fuel Systems, Clearwater, June 5-9, 2011 Nenad Sarunac Carlos E. Romero Energy Research Center Lehigh University Bethlehem, PA Integration of Rankine and Brayton Cycles Reduces Penalty Due to Post-Combustion CO 2 Capture
Transcript of Cycle Integration - A Method to reduce Penalty due to Post-Combustion CO2 Capture

En
erg
y R
es
ea
rch
Ce
nte
r
36th International Technical Conference on Clean Coal & Fuel Systems, Clearwater, June 5-9, 2011
Nenad Sarunac
Carlos E. Romero Energy Research Center
Lehigh University
Bethlehem, PA
Integration of Rankine and Brayton Cycles Reduces Penalty Due to Post-Combustion
CO2 Capture

En
erg
y R
es
ea
rch
Ce
nte
r
2
Presentation Outline
◙ Introduction
◙ Post-Combustion CO2 Capture ◘ Conventional Thermal Integration of CO2 Capture
Process
◘ Advanced Thermal Integration of CO2 Capture Process
◙ Cycle Integration ◘ Hydrogen-Fueled Brayton Cycle
◘ Syngas-Fueled Brayton cycle
◙ Conclusions
En
erg
y R
es
ea
rch
Ce
nte
r
3
Introduction
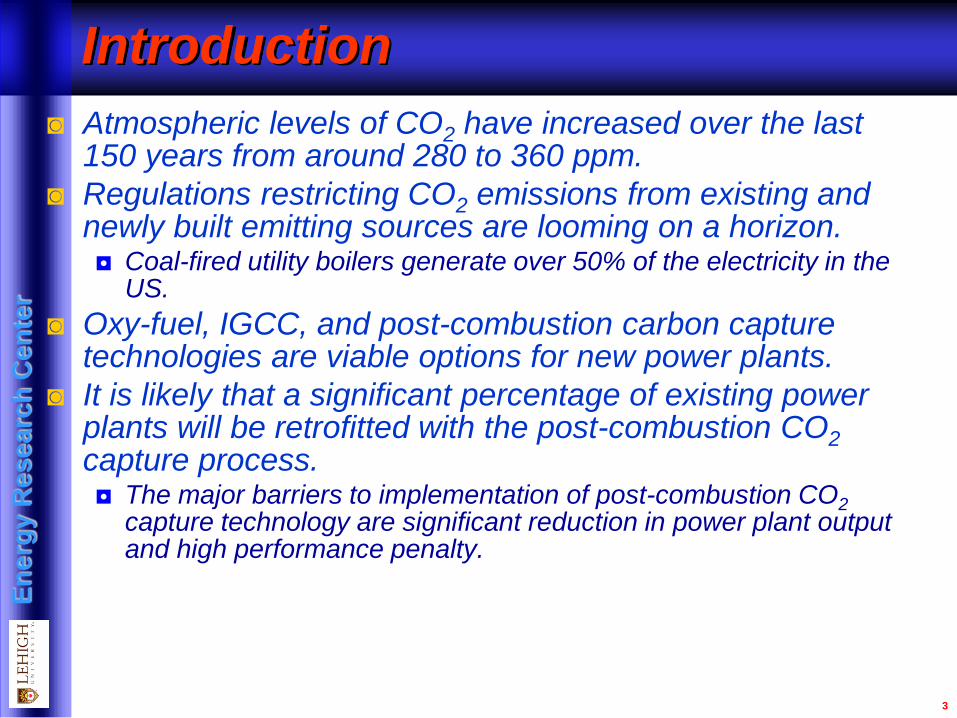
◙ Atmospheric levels of CO2 have increased over the last 150 years from around 280 to 360 ppm.
◙ Regulations restricting CO2 emissions from existing and newly built emitting sources are looming on a horizon. ◘ Coal-fired utility boilers generate over 50% of the electricity in the
US.
◙ Oxy-fuel, IGCC, and post-combustion carbon capture technologies are viable options for new power plants.
◙ It is likely that a significant percentage of existing power plants will be retrofitted with the post-combustion CO2 capture process. ◘ The major barriers to implementation of post-combustion CO2
capture technology are significant reduction in power plant output and high performance penalty.
En
erg
y R
es
ea
rch
Ce
nte
r
Introduction
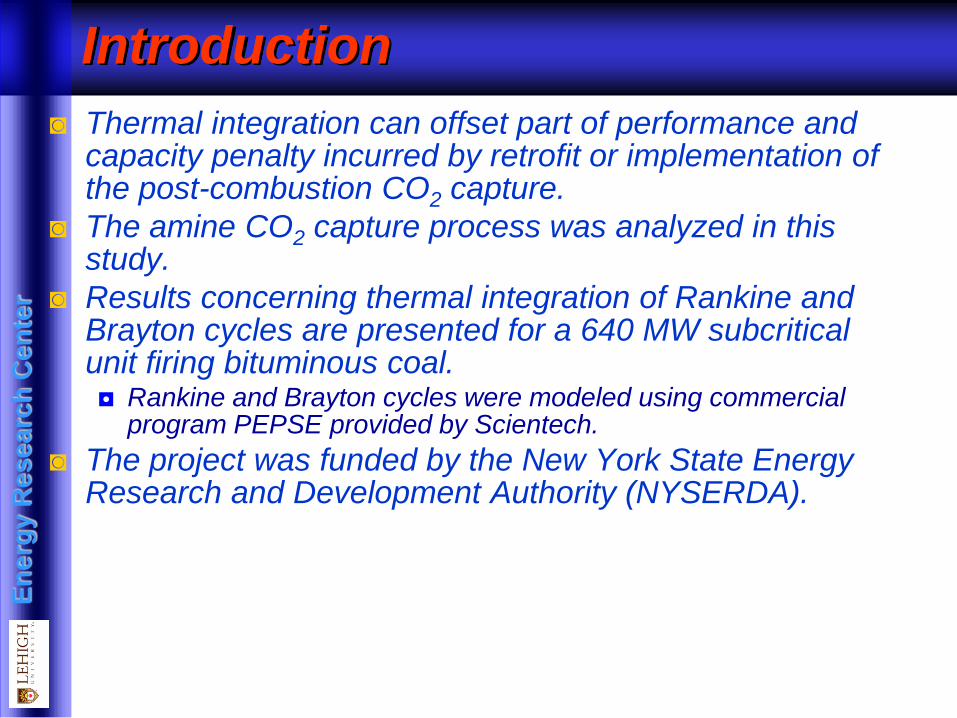
◙ Thermal integration can offset part of performance and capacity penalty incurred by retrofit or implementation of the post-combustion CO2 capture.
◙ The amine CO2 capture process was analyzed in this study.
◙ Results concerning thermal integration of Rankine and Brayton cycles are presented for a 640 MW subcritical unit firing bituminous coal. ◘ Rankine and Brayton cycles were modeled using commercial
program PEPSE provided by Scientech.
◙ The project was funded by the New York State Energy Research and Development Authority (NYSERDA).

En
erg
y R
es
ea
rch
Ce
nte
r
6
Schematic Diagram of a Post-Combustion CO2 Capture Process
100100--140F140F
4040--60C60C230230--250F250F
110110--120C120C
Steam forSteam for
RegenerationRegeneration
100100--140F140F
4040--60C60C230230--250F250F
110110--120C120C
Steam forSteam for
RegenerationRegeneration

En
erg
y R
es
ea
rch
Ce
nte
r
7
Conventional Thermal Integration of CO2 Capture Process

En
erg
y R
es
ea
rch
Ce
nte
r
8
Advanced Thermal Integration of CO2 Capture Process
En
erg
y R
es
ea
rch
Ce
nte
r
11
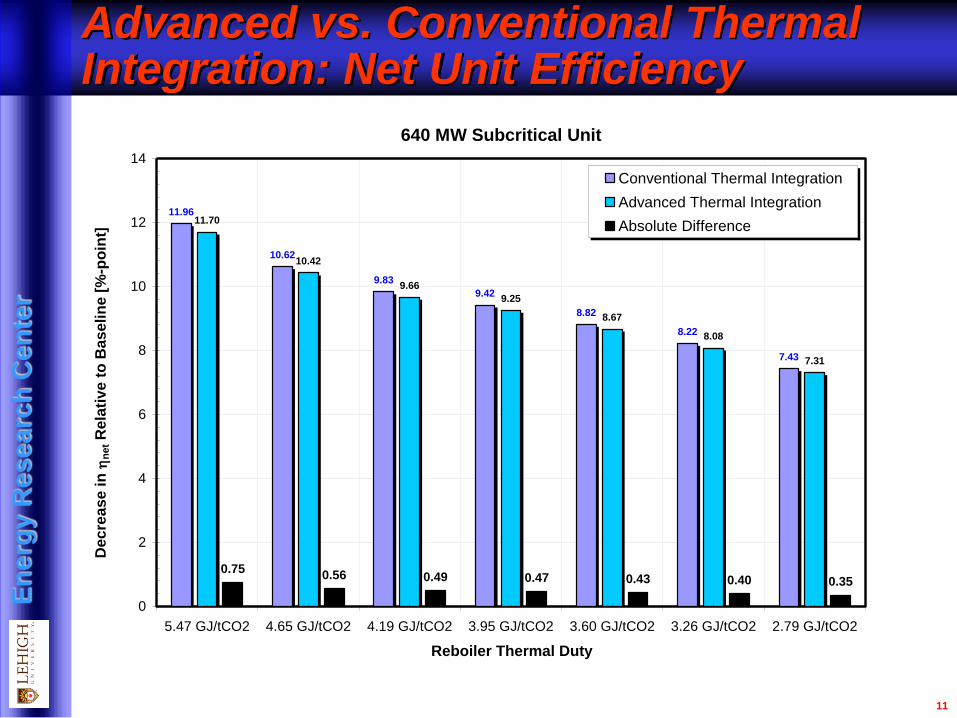
Advanced vs. Conventional Thermal Integration: Net Unit Efficiency
640 MW Subcritical Unit
11.96
10.62
9.83
9.42
8.82
8.22
7.43
11.70
10.42
9.66
9.25
8.67
8.08
7.31
0.750.56 0.49 0.47 0.43 0.40 0.35
0
2
4
6
8
10
12
14
5.47 GJ/tCO2 4.65 GJ/tCO2 4.19 GJ/tCO2 3.95 GJ/tCO2 3.60 GJ/tCO2 3.26 GJ/tCO2 2.79 GJ/tCO2
Reboiler Thermal Duty
De
cre
as
e i
n h
ne
t R
ela
tiv
e t
o B
as
eli
ne
[%
-po
int]
Conventional Thermal Integration
Advanced Thermal Integration
Absolute Difference

En
erg
y R
es
ea
rch
Ce
nte
r
12
Cycle Integration
◙ Thermal integration of Rankine and Brayton cycles in combination with heat recovery from flue gas and CO2 compression was analyzed.
◙ Goal: Efficiency improvement of the Rankine cycle and reduction of capacity penalty incurred by implementation of the post-combustion CO2 capture.
◙ Fueling options considered for the Brayton cycle: ◘ Hydrogen
◘ Syngas (Biogas) produced by gasification of biomass
■ Leftover chair burned in boiler
◙ Both fueling options result in zero CO2 emissions from the Brayton cycle. ◘ Brayton cycle power output and heat provided to the Rankine cycle
through thermal integration do not contribute to plant CO2 emissions.

En
erg
y R
es
ea
rch
Ce
nte
r
13
Hydrogen-Fueled Brayton Cycle
En
erg
y R
es
ea
rch
Ce
nte
r
Sources of Hydrogen
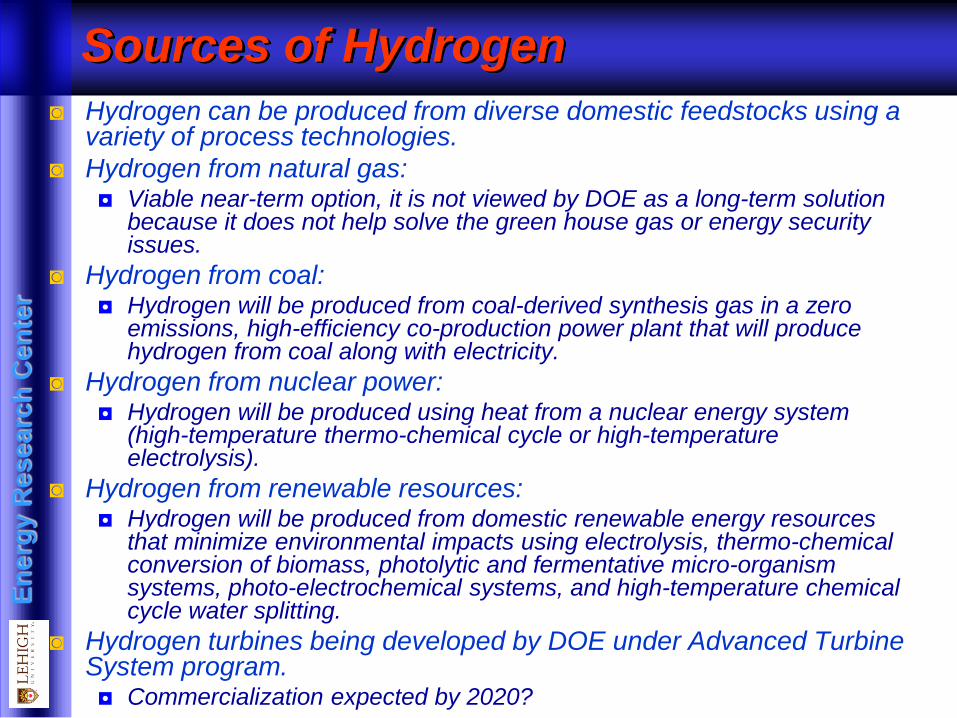
◙ Hydrogen can be produced from diverse domestic feedstocks using a variety of process technologies.
◙ Hydrogen from natural gas: ◘ Viable near-term option, it is not viewed by DOE as a long-term solution
because it does not help solve the green house gas or energy security issues.
◙ Hydrogen from coal: ◘ Hydrogen will be produced from coal-derived synthesis gas in a zero
emissions, high-efficiency co-production power plant that will produce hydrogen from coal along with electricity.
◙ Hydrogen from nuclear power: ◘ Hydrogen will be produced using heat from a nuclear energy system
(high-temperature thermo-chemical cycle or high-temperature electrolysis).
◙ Hydrogen from renewable resources: ◘ Hydrogen will be produced from domestic renewable energy resources
that minimize environmental impacts using electrolysis, thermo-chemical conversion of biomass, photolytic and fermentative micro-organism systems, photo-electrochemical systems, and high-temperature chemical cycle water splitting.
◙ Hydrogen turbines being developed by DOE under Advanced Turbine System program. ◘ Commercialization expected by 2020?

En
erg
y R
es
ea
rch
Ce
nte
r
15
Cycle Integration
Hot Cooling Water Cold Cooling Water
D
FWH A
FD Fan
Flue Gas
FUEL
SAPH
BFP
Main
Condenser
To Post-Combustion
CO 2 Capture
ID Fan
Extr
acti
on
E
Ex
tra
cti
on
D
Ex
tra
cti
on
C
LP Turbine LP Turbine
Ex
tra
cti
on
A
Ex
tra
cti
on
B
Generator
Main Steam
Hot Reheat Steam
Cold Reheat Steam
HP
Turbine IP Turbine
FWH BFWH C FWH D FWH E
PA Fan
PAPH
SCR
Extr
acti
on
F
SSR
FWH F FWH G
Extr
acti
on
GBFP
To Condenser
FGD
LSTG
Reboiler
Desuperheater
Reboiler Steam
Make-up
10 k
g/s
PA SAH
SA SAH
3.24 bar (47 psia)
3.10 bar (45 psia)
Ambient Air at T amb
M SAH = 0 kg/s
Q SAH = 0 MW th
FGRHT
X
C T G
F uel (H 2)
HRSG
Compressor
Steam
670 oC (1,238
oF )
188 oC (370
oF )
TSteam, PSteam, MSteam
LP HXE
HP HXE
Pump
QR eb
Brayton cycle sized to provide heat for HP FWHs A and B.
En
erg
y R
es
ea
rch
Ce
nte
r
16
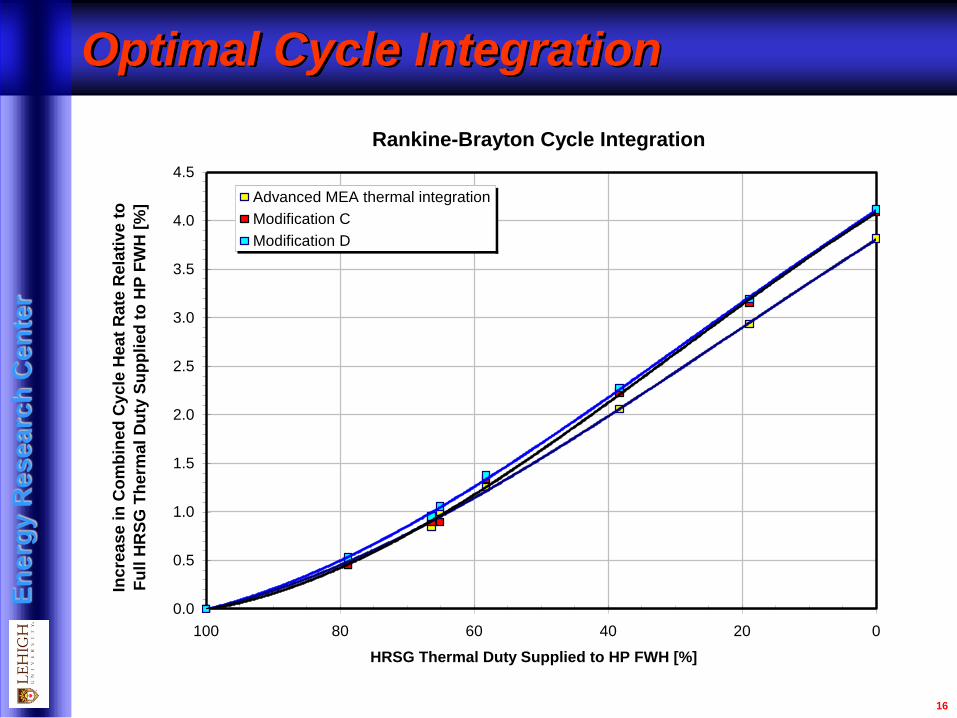
Optimal Cycle Integration
Rankine-Brayton Cycle Integration
0.0
0.5
1.0
1.5
2.0
2.5
3.0
3.5
4.0
4.5
020406080100
HRSG Thermal Duty Supplied to HP FWH [%]
Incre
ase in
Co
mb
ined
Cycle
Heat
Rate
Rela
tive t
o
Fu
ll H
RS
G T
he
rmal
Du
ty S
up
pli
ed
to
HP
FW
H [
%] Advanced MEA thermal integration
Modification C
Modification D
En
erg
y R
es
ea
rch
Ce
nte
r
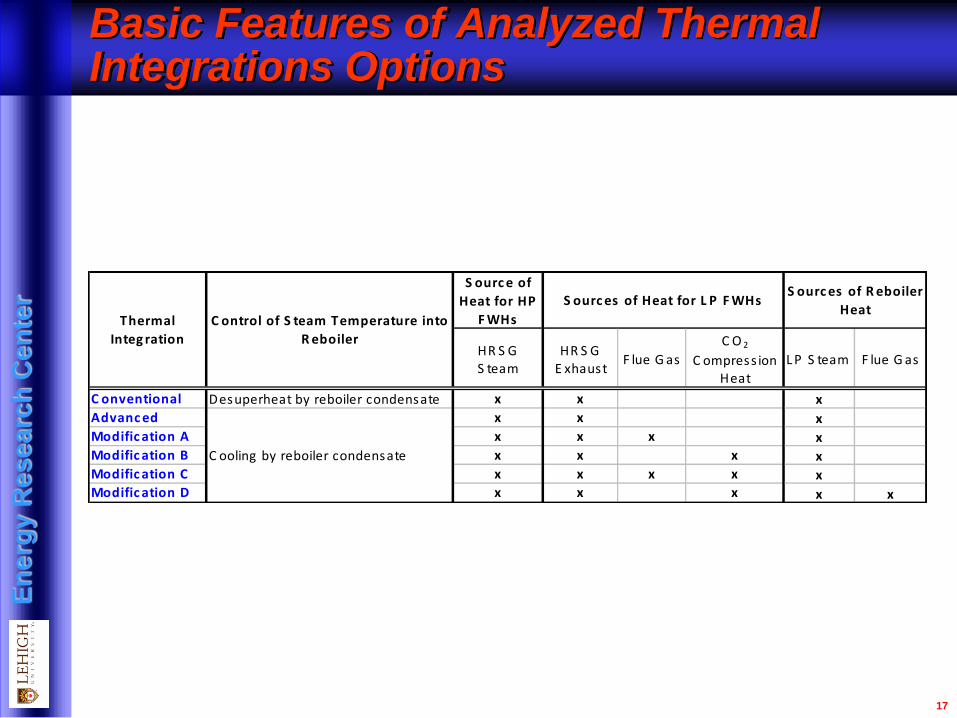
Basic Features of Analyzed Thermal Integrations Options
17
S ourc e of
Heat for HP
F WHs
HR S G S team
HR S G E xhaust
F lue G as
C O 2
C ompress ion Heat
L P S team F lue G as
C onventional Desuperheat by reboiler condensate x x x
Advanc ed x x xModific ation A x x x xModific ation B x x x xModific ation C x x x x xModific ation D x x x x x
S ourc es of R eboiler
Heat
C ooling by reboiler condensate
Thermal
Integ ration
C ontrol of S team Temperature into
R eboiler
S ourc es of Heat for L P F WHs

En
erg
y R
es
ea
rch
Ce
nte
r
Rankine - Brayton Cycle Integration
23.26
19.59
17.44
16.32
14.67
13.04
10.8811.52
7.62
5.53
4.48
3.00
1.58
0.26
8.35
4.75
2.87
1.98
0.70 0.62
2.24
19.83
16.47
14.20
13.16
11.65
10.21
8.40
0
5
10
15
20
25
5.47 4.65 4.19 3.95 3.60 3.26 2.79
Reboiler Thermal Duty [GJ/tonne CO2]
Re
du
cti
on
in
Ra
nk
ine
Cy
cle
Gro
ss
Po
we
r
Ou
tpu
t R
ela
tiv
e t
o B
as
eli
ne
[%
]
Conventional Thermal Integration, No Cycle Integration
Conventional Thermal Integration
Advanced Thermal Integration
Modification A
Modification B
Modification C
Modification D
Modification D, No Cycle Integration
Gross Rankine Cycle Power Output:
Comparison to Baseline
18
State of the art amines Baseline: Rankine Cycle no CO2 Capture

En
erg
y R
es
ea
rch
Ce
nte
r
Rankine - Brayton Cycle Integration
-23.26
-19.59
-17.44-16.32
-14.67-13.04
-10.88
10.64
14.53
16.6317.68
19.1620.57
22.42
13.81
17.4119.29
20.1821.46
22.7824.39
-19.83
-16.47
-14.20-13.16
-11.65-10.21
-8.40
-30
-25
-20
-15
-10
-5
0
5
10
15
20
25
30
5.47 4.65 4.19 3.95 3.60 3.26 2.79
Reboiler Thermal Duty [GJ/tCO2]
Ch
an
ge
in
Co
mb
ine
d C
yc
le P
ow
er
Ou
tpu
t R
ela
tive
to
Bas
eli
ne [
%]
Conventional Thermal Integration, No Cycle Integration
Conventional Thermal Integration
Advanced Thermal Integration
Modification A
Modification B
Modification C
Modification D
Modification D, No Cycle Integration
Gross Combined Cycle Power Output:
Comparison to Baseline
19
State of the art amines
Baseline: Rankine Cycle no CO2 Capture
En
erg
y R
es
ea
rch
Ce
nte
r
Rankine - Brayton Cycle Integration
11.96
10.62
9.839.42
8.82
8.22
7.43
6.95
5.82
5.214.91
4.484.07
3.53
5.98
4.94
4.404.14
3.773.39
2.92
10.71
9.48
8.658.26
7.71
7.19
6.52
0
2
4
6
8
10
12
14
5.47 4.65 4.19 3.95 3.60 3.26 2.79
Reboiler Thermal Duty [GJ/tonne CO2]
De
cre
as
e i
n C
om
bin
ed
Cy
cle
Ne
t E
ffic
ien
cy
Re
lati
ve
to
Ba
se
lin
e [
%-p
oin
t]
Advanced Thermal Integration, No Cycle Integration
Conventional Thermal Integration
Advanced Advanced Thermal Integration
Modification A
Modification B
Modification C
Modification D
Modification D, No Cycle Integration
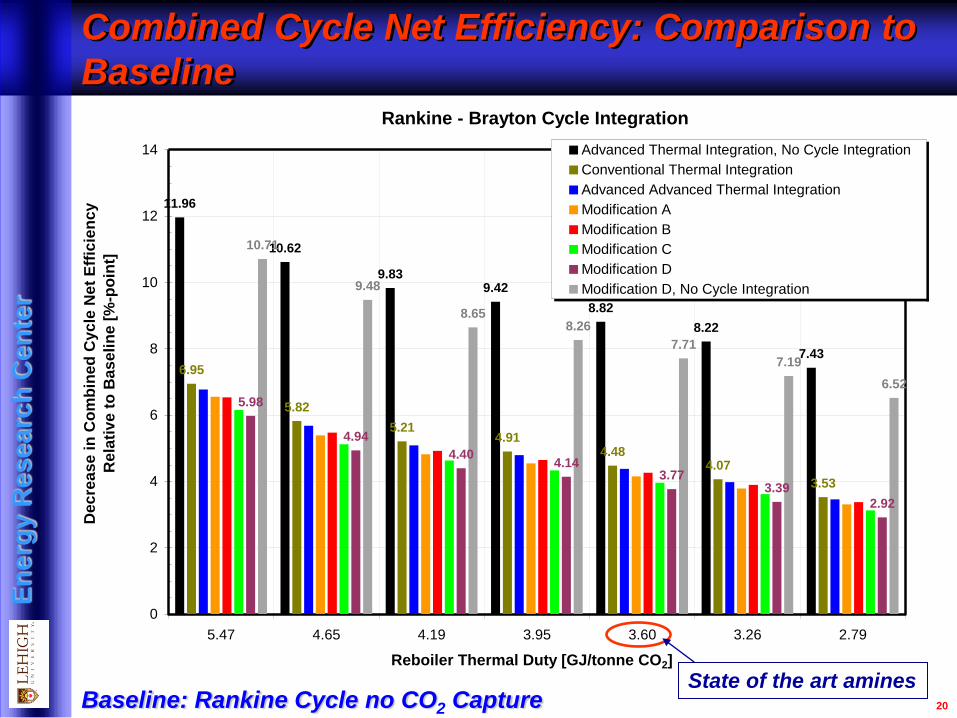
Combined Cycle Net Efficiency: Comparison to
Baseline
20
State of the art amines Baseline: Rankine Cycle no CO2 Capture

En
erg
y R
es
ea
rch
Ce
nte
r
Comparison to Baseline
21
Thermal Integration % % %-point
Conventional w/o Cycle Integration -14.67 34.04 8.82
Advanced 19.82 14.44 4.38
Modification D 21.46 12.19 3.77
Baseline = Rankine Cycle, No CO2 Capture
Integrated Combined Rankine-Brayton Cycle
State-of-the-Art Amines
Change in Gross
Power Output
Relative to
Baseline
Decrease in Net
Unit Efficiency
Relative to
Baseline
Increase in Net
Unit Heat Rate
Relative to
Baseline
Hydrogen-Fired Turbine, HP FWHs A and B
Thermal Integration % % %-point
Conventional w/o Cycle Integration -14.67 34.04 8.82
Advanced 8.35 19.06 5.56
Modification D 10.61 16.21 4.84
Baseline = Rankine Cycle, No CO2 Capture
Increase in Net
Unit Heat Rate
Relative to
Baseline
Hydrogen-Fired Turbine, HP FWH A
State-of-the-Art Amines
Integrated Combined Rankine-Brayton Cycle
Change in Gross
Power Output
Relative to
Baseline
Decrease in Net
Unit Efficiency
Relative to
Baseline

En
erg
y R
es
ea
rch
Ce
nte
r
22
Syngas-Fueled Brayton Cycle

En
erg
y R
es
ea
rch
Ce
nte
r
Gasification of Biomass
◙ EIA estimates there are 590 million wet tons of biomass available in the US on an annual basis.
◙ Dedicated biomass and biomass co-firing are used in the electricity generation sector.
◙ Biomass gasification is the conversion of an organically derived, carbonaceous feedstock by partial oxidation into a gaseous product, synthesis gas “syngas” or biogas consisting primarily of H2 and CO2.
◙ New dedicated biomass capacity is represented in the National Energy Modeling System as biomass integrated gasification combined-cycle (BIGCC) technology. ◘ The reactions in a gasifier are carried out at elevated temperatures, 500-1400 oC,
and atmospheric or elevated pressures up to 33 bar (480 psia).
◘ The oxidant can be air, pure oxygen, or a mixture of these gases with steam. ■ Air-blown gasifiers typically produce a product gas containing a relatively high
concentration of nitrogen with a low heating value.
◘ The syngas leaving the gasifier has to be cleaned to remove particulates and tar by employing either a low-temperature or high-temperature gas cleaning.
◘ In low-temperature cleaning, the gas is cooled with water, and particulates are removed in a series of cyclone vessels.
◘ Hot gas cleanup technology is relatively new, and DOE and many industrial partners are conducting tests to demonstrate the technology.
◘ There are advantages and disadvantages associated with both gas cleanup processes.

En
erg
y R
es
ea
rch
Ce
nte
r
Cycle Integration
24
Hot Cooling Water Cold Cooling Water
D
FWH A
FD Fan
Flue Gas
FUEL
SAPH
BFP
Main
Condenser
To Post-Combustion
CO 2 Capture
ID Fan
Extr
ac
tio
n E
Extr
acti
on
D
Extr
acti
on
C
LP Turbine LP Turbine
Extr
acti
on
A
Extr
acti
on
B
Generator
Main Steam
Hot Reheat Steam
Cold Reheat Steam
HP
Turbine IP Turbine
FWH BFWH C FWH D FWH E
PA Fan
PAPH
SCR
Extr
ac
tio
n F
SSR
FWH F FWH G
Extr
ac
tio
n GBFP
To Condenser
FGD
LSTG
Reboiler
Desuperheater
Reboiler Steam
Make-up
10 k
g/s
PA SAH
SA SAH
3.24 bar (47 psia)
3.10 bar (45 psia)
Ambient Air at T amb
M SAH = 0 kg/s
Q SAH = 0 MW th
FGRHT
X
C T GG as ifier
HP HXE A1
A ir
S yng as
C har
B iomas s
A ir
HP HXE B 1
L P HXE 1
HT HR L T HR 1 L T HR 2
900 o
C
90 to 120 o
C
HP HXE HP HXE B 2
1 2 3 4
2
1 3
4
QR eb
L P HX E 2
518 o
C
Gasifier sized taking biomass availability into consideration.
En
erg
y R
es
ea
rch
Ce
nte
r
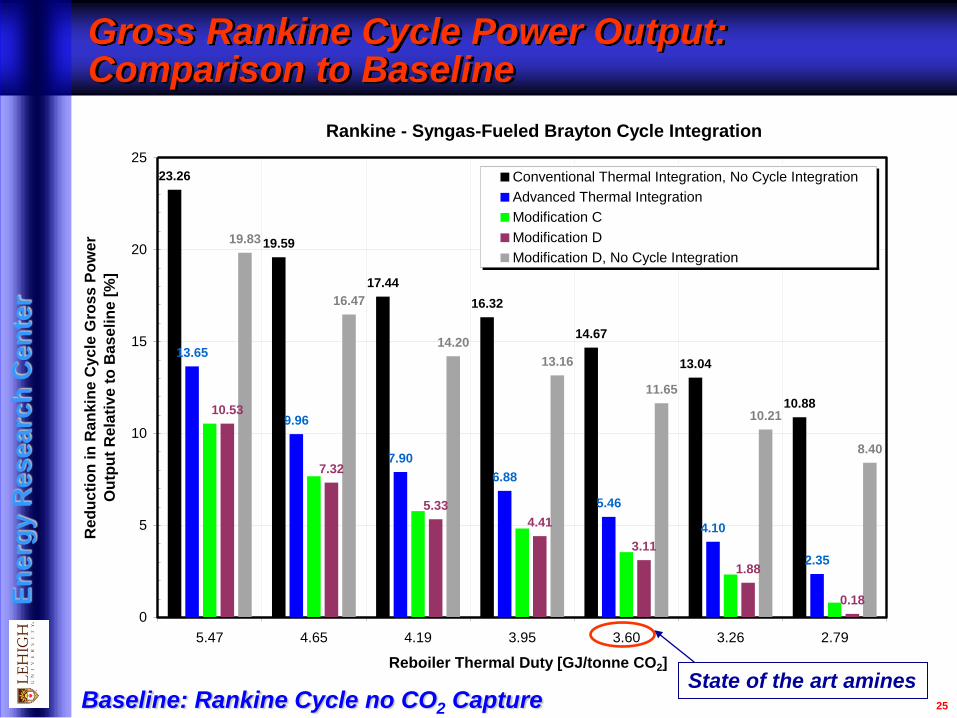
25
Gross Rankine Cycle Power Output: Comparison to Baseline
Rankine - Syngas-Fueled Brayton Cycle Integration
23.26
19.59
17.44
16.32
14.67
13.04
10.88
13.65
9.96
7.90
6.88
5.46
4.10
2.35
10.53
7.32
5.33
4.41
3.11
1.88
0.18
19.83
16.47
14.20
13.16
11.65
10.21
8.40
0
5
10
15
20
25
5.47 4.65 4.19 3.95 3.60 3.26 2.79
Reboiler Thermal Duty [GJ/tonne CO2]
Re
du
cti
on
in
Ra
nk
ine
Cy
cle
Gro
ss
Po
we
r
Ou
tpu
t R
ela
tiv
e t
o B
as
eli
ne
[%
]
Conventional Thermal Integration, No Cycle Integration
Advanced Thermal Integration
Modification C
Modification D
Modification D, No Cycle Integration
Baseline: Rankine Cycle no CO2 Capture State of the art amines

En
erg
y R
es
ea
rch
Ce
nte
r
26
Gross Combined Cycle Power Output:
Comparison to Baseline
Rankine - Syngas-Fueled Brayton Cycle Integration
-23.26
-19.59
-17.44-16.32
-14.67
-13.04
-10.88
8.45
4.75
2.691.67
0.261.10
2.85
5.32
2.12
0.120.79
2.103.32
5.02
-19.83
-16.47
-14.20-13.16
-11.65-10.21
-8.40
-30
-25
-20
-15
-10
-5
0
5
10
15
5.47 4.65 4.19 3.95 3.60 3.26 2.79
Reboiler Thermal Duty [GJ/tonne CO2]
Ch
an
ge
in
Co
mb
ine
d C
yc
le P
ow
er
Ou
tpu
t R
ela
tiv
e t
o B
as
eli
ne
[%
]
Conventional Thermal Integration, No Cycle Integration
Advanced Thermal Integration
Modification C
Modification D
Modification D, No Cycle Integration
Baseline: Rankine Cycle no CO2 Capture
State of the art amines
En
erg
y R
es
ea
rch
Ce
nte
r
27
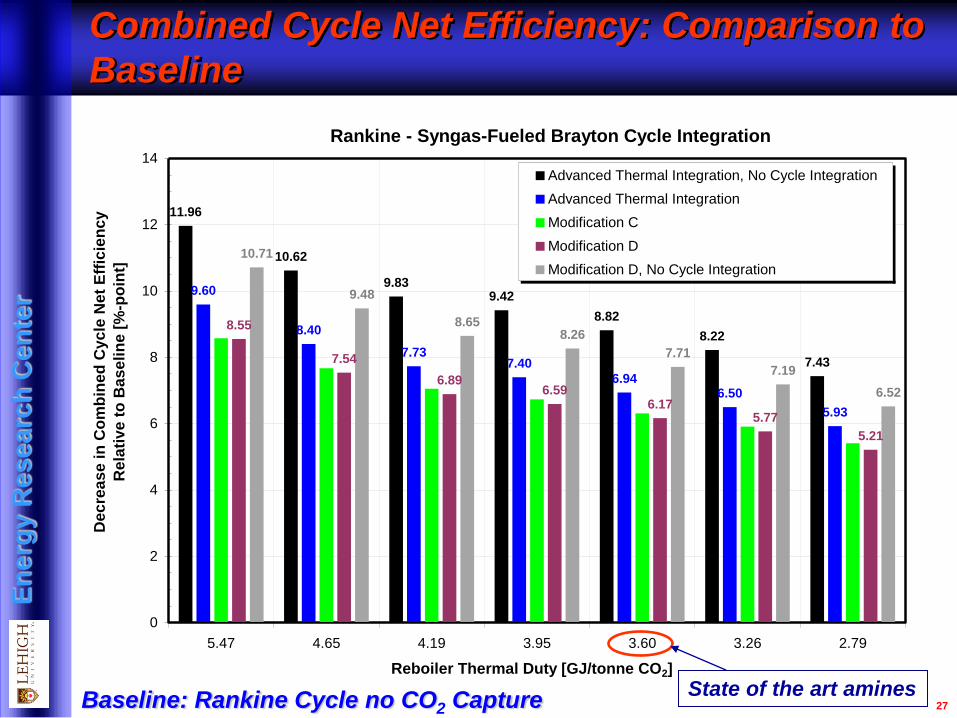
Combined Cycle Net Efficiency: Comparison to
Baseline
Rankine - Syngas-Fueled Brayton Cycle Integration
11.96
10.62
9.839.42
8.82
8.22
7.43
9.60
8.40
7.737.40
6.946.50
5.93
8.55
7.54
6.896.59
6.175.77
5.21
10.71
9.48
8.658.26
7.71
7.19
6.52
0
2
4
6
8
10
12
14
5.47 4.65 4.19 3.95 3.60 3.26 2.79
Reboiler Thermal Duty [GJ/tonne CO2]
De
cre
as
e i
n C
om
bin
ed
Cy
cle
Ne
t E
ffic
ien
cy
Re
lati
ve
to
Ba
se
lin
e [
%-p
oin
t]
Advanced Thermal Integration, No Cycle Integration
Advanced Thermal Integration
Modification C
Modification D
Modification D, No Cycle Integration
Baseline: Rankine Cycle no CO2 Capture State of the art amines
En
erg
y R
es
ea
rch
Ce
nte
r
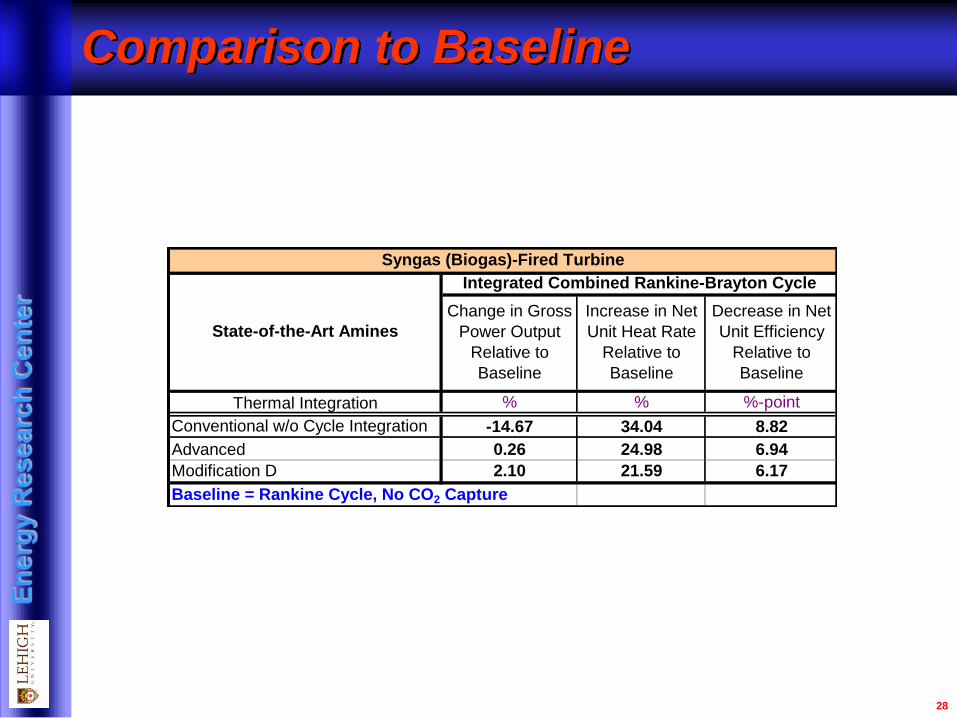
Comparison to Baseline
28
Thermal Integration % % %-point
Conventional w/o Cycle Integration -14.67 34.04 8.82
Advanced 0.26 24.98 6.94
Modification D 2.10 21.59 6.17
Baseline = Rankine Cycle, No CO2 Capture
Syngas (Biogas)-Fired Turbine
Integrated Combined Rankine-Brayton Cycle
State-of-the-Art Amines
Change in Gross
Power Output
Relative to
Baseline
Decrease in Net
Unit Efficiency
Relative to
Baseline
Increase in Net
Unit Heat Rate
Relative to
Baseline
En
erg
y R
es
ea
rch
Ce
nte
r
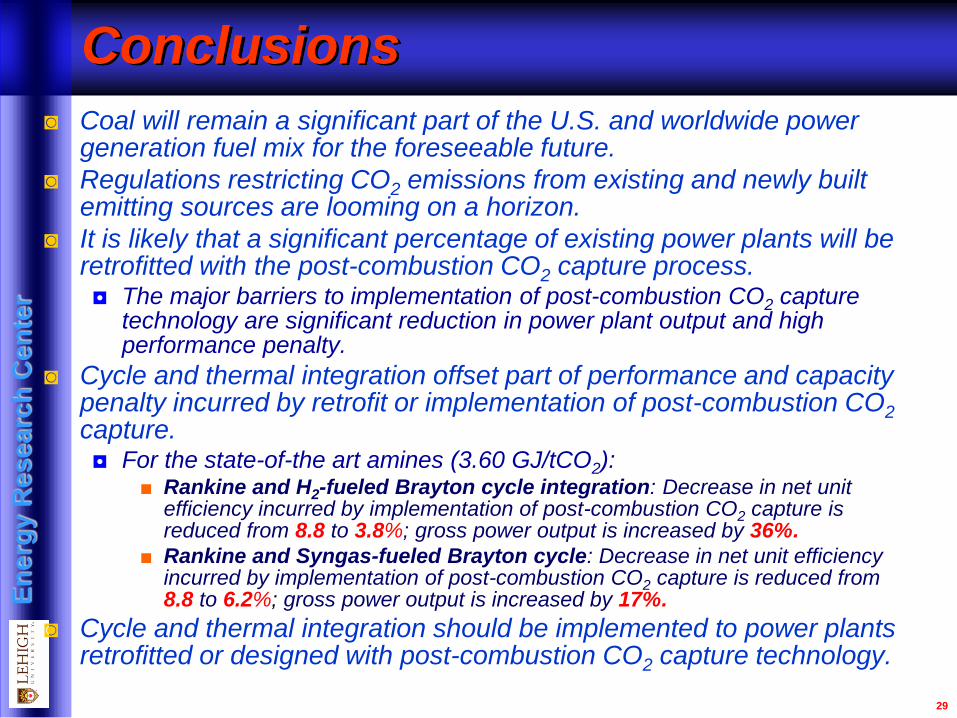
Conclusions
◙ Coal will remain a significant part of the U.S. and worldwide power generation fuel mix for the foreseeable future.
◙ Regulations restricting CO2 emissions from existing and newly built emitting sources are looming on a horizon.
◙ It is likely that a significant percentage of existing power plants will be retrofitted with the post-combustion CO2 capture process. ◘ The major barriers to implementation of post-combustion CO2 capture
technology are significant reduction in power plant output and high performance penalty.
◙ Cycle and thermal integration offset part of performance and capacity penalty incurred by retrofit or implementation of post-combustion CO2 capture. ◘ For the state-of-the art amines (3.60 GJ/tCO2):
■ Rankine and H2-fueled Brayton cycle integration: Decrease in net unit efficiency incurred by implementation of post-combustion CO2 capture is reduced from 8.8 to 3.8%; gross power output is increased by 36%.
■ Rankine and Syngas-fueled Brayton cycle: Decrease in net unit efficiency incurred by implementation of post-combustion CO2 capture is reduced from 8.8 to 6.2%; gross power output is increased by 17%.
◙ Cycle and thermal integration should be implemented to power plants retrofitted or designed with post-combustion CO2 capture technology.
29