Demonstration of CO2 capture in biomass combustion - LUTPub
122
LUT University LUT School of Energy Systems Energy Technology Onni Linjala Review on Post-Combustion Carbon Capture Technologies and Capture of Biogenic CO2 Using Pilot-Scale Equipment Master’s Thesis Examiners: Professor, D.Sc. (Tech.) Esa Vakkilainen D.Sc. (Tech.) Katja Kuparinen Supervisors: M.Sc. (Tech.) Janne Kärki M.Sc. (Tech.) Timo Leino
-
Upload
khangminh22 -
Category
Documents
-
view
0 -
download
0
Transcript of Demonstration of CO2 capture in biomass combustion - LUTPub

LUT University
LUT School of Energy Systems
Energy Technology
Onni Linjala
Review on Post-Combustion Carbon Capture Technologies
and Capture of Biogenic CO2 Using Pilot-Scale Equipment
Master’s Thesis
Examiners: Professor, D.Sc. (Tech.) Esa Vakkilainen
D.Sc. (Tech.) Katja Kuparinen
Supervisors: M.Sc. (Tech.) Janne Kärki
M.Sc. (Tech.) Timo Leino

ABSTRACT
LUT University
School of Energy Systems
Energy Technology
Onni Linjala
Review on Post-Combustion Carbon Capture Technologies and Capture of Biogenic
CO2 Using Pilot-Scale Equipment
Master’s Thesis 2021
103 pages, 11 figures, 23 tables and one appendix
Examiners: Professor, D.Sc. (Tech.) Esa Vakkilainen
D.Sc. (Tech.) Katja Kuparinen
Supervisors: M.Sc. (Tech.) Janne Kärki
M.Sc. (Tech.) Timo Leino
Keywords: BECCU, CCU, bioenergy with carbon capture and utilization, biogenic
carbon capture, post-combustion carbon capture, CO2 utilization, pilot experiment
Bioenergy with carbon capture has emerged as a promising technological pathway in the
pursuit of carbon-neutral energy production and industry. However, profitability of
carbon capture remains as a large barrier in wide-scale deployment and as incentives are
lacking benefit has to be sought, for instance, via CO2 utilization.
In this thesis biogenic CO2 emission sources as well as status and performance of state-
of-the-art and emerging post-combustion capture technologies were reviewed.
Additionally, absorption-based post-combustion capture technologies developed by
CarbonReUse, Kleener Power Solutions and VTT were experimented at pilot-scale by
using synthetic gas mixtures, biogenic flue gases and raw biogas.
Multiple industrial sources of biogenic CO2 emissions into which carbon capture could
possibly be applied were recognized. Numerous different carbon capture technologies
based on various capture methods are currently in development with multiple large-scale
demonstration projects ongoing and planned for the near future. Capture cost in post-
combustion carbon capture is currently at around 34–80 €/tCO2.
In the pilot tests, all tested technologies were proven functional in carbon capture at
realistic conditions, while achieving promising results regarding capture performance.
However, further work is required to evaluate the economic performance and commercial
potential of the tested technologies.

TIIVISTELMÄ
LUT University
School of Energy Systems
Energiatekniikan koulutusohjelma
Onni Linjala
Katsaus polton jälkeiseen hiilidioksidin talteenottoon kehitettyihin teknologioihin
sekä bioperäisen hiilidioksidin talteenotto pilot-mittakaavan koelaitteistolla
Diplomityö 2021
103 sivua, 11 kuvaa, 23 taulukkoa ja yksi liite
Tarkastajat: Professor, D.Sc. (Tech.) Esa Vakkilainen
D.Sc. (Tech.) Katja Kuparinen
Ohjaajat: M.Sc. (Tech.) Janne Kärki
M.Sc. (Tech.) Timo Leino
Avainsanat: BECCU, CCU, bioenergia, bioperäisen hiilidioksidin talteenotto, polton
jälkeinen hiilidioksidin talteenotto, hiilidioksidin hyötykäyttö, pilottikoe
Bioperäisen hiilidioksidin talteenotto on noussut lupaavaksi teknologiseksi ratkaisuksi
hiilineutraalin energiantuotannon ja teollisuuden tavoittelussa. Talteenoton kannattavuus
on kuitenkin suuri haaste sen laajamittaisessa käyttöönotossa ja koska kannustimia ei ole,
on hyötyä haettava esimerkiksi hiilidioksidin hyötykäytön kautta.
Tässä työssä tarkasteltiin bioperäisten hiilidioksidipäästöjen lähteitä sekä polton jälkeisen
talteenottoon kehitettyjen teknologioiden tilaa ja suorituskykyä. Lisäksi CarbonReUsen,
Kleener Power Solutionsin ja VTT:n kehittämiä absorptioon perustuvia
talteenottoteknologioita testattiin pilottimittakaavassa polton jälkeisessä talteenotossa
käyttäen synteettisiä kaasuseoksia, bioperäisiä savukaasuja sekä raakaa biokaasua.
Työssä tunnistettiin useita bioperäisiä hiilidioksidipäästöjen lähteitä, joihin voitaisiin
mahdollisesti soveltaa hiilidioksidin talteenottoa. Kehitteillä on lukuisia erilaisiin
ilmiöihin perustuvia talteenottoteknologioita ja useita suuren mittakaavan
demonstraatiohankkeita on meneillään ja suunniteltuna lähitulevaisuuteen. Hiilidioksidin
talteenottokustannus polton jälkeisessä talteenotossa on tällä hetkellä noin 34–80 €/tCO2.
Pilottikokeissa testatut teknologiat todistettiin toimivaksi todenmukaisissa olosuhteissa,
saavuttaen myös lupaavia tuloksia suorituskyvyn osalta. Lisätutkimusta kuitenkin
tarvitaan, jotta teknologioiden taloudellinen suorituskyky ja kaupallinen potentiaali
voidaan tarkemmin selvittää.

PREFACE AND ACKNOWLEDGEMENTS
This thesis is conducted for the VTT Technical Research Centre of Finland as a part of
the BECCU project. Led by VTT and financed primarily by Business Finland, BECCU
is a co-operative project between a consortium formed by several Finnish companies and
stakeholders from multiple industries together with international research partners.
Objective of BECCU is to evaluate feasibility of a value chain utilizing captured industrial
biogenic CO2 emissions and clean hydrogen in CO2-derived polyol production.
I wish to express my gratitude towards my supervisors and advisors Janne Kärki, Timo
Leino, Kristian Melin and Tuula Kajolinna for their valuable assistance and
encouragement. I am grateful for the trust and responsibility that I was given. I wish to
thank Professor Esa Vakkilainen for his guidance on this thesis and for all the knowledge
and expertise he has passed on during my studies. I also wish to thank the personnel of
Kleener Power Solutions and CarbonReUse Finland for their co-operation in this project.
Most importantly, I wish to thank my family and friends for all the support that I have
received throughout the years.
Jyväskylä, 25.2.2021
Onni Linjala

TABLE OF CONTENTS
ABSTRACT 2
TIIVISTELMÄ 3
PREFACE AND ACKNOWLEDGEMENTS 4
SYMBOLS AND ABBREVIATIONS 8
1 INTRODUCTION 10
1.1 The role of carbon capture in future energy systems .............................. 11
1.2 Concept of BECCU ................................................................................. 12
1.3 Objectives of the thesis ............................................................................ 13
1.4 Structure of the thesis .............................................................................. 14
2 BIOGENIC CO2 SOURCES IN ENERGY PRODUCTION AND ENERGY-
INTENSIVE INDUSTRIES 15
2.1 Biomass combustion ................................................................................ 15
2.1.1 Biomass composition .................................................................. 16
2.1.2 Flue gas properties ...................................................................... 17
2.1.3 Impurities in biomass combustion .............................................. 18
2.1.4 Effect of combustion conditions on impurity formation ............. 19
2.1.5 Flue gas purification and emission control ................................. 20
2.2 Biogas ...................................................................................................... 22
2.2.1 Composition of raw biogas ......................................................... 22
2.2.2 Impurities in raw biogas .............................................................. 23
2.2.3 Biogas upgrading ........................................................................ 24
2.3 Liquid biofuel production ........................................................................ 25
2.3.1 Bioethanol ................................................................................... 25
2.3.2 Biomass-to-Liquid (BtL) ............................................................. 26
2.3.3 Hydrotreated Vegetable Oils (HVO) .......................................... 28
2.4 Chemical pulping .................................................................................... 29
3 CO2 CAPTURE, TREATMENT, TRANSPORTATION AND UTILIZATION
31
3.1 Carbon capture ........................................................................................ 31
3.1.1 Post-combustion capture ............................................................. 32
3.1.2 Pre-combustion capture ............................................................... 32
3.1.3 Oxyfuel combustion .................................................................... 33
3.2 Pre-treatment and transportation of CO2 ................................................. 34
3.2.1 Effect of impurities on handling and transportation ................... 34
3.2.2 Pre-treatment ............................................................................... 35
3.2.3 Transportation ............................................................................. 35

3.3 CO2 utilization ......................................................................................... 37
3.3.1 CO2-derived polyols .................................................................... 38
4 STATE-OF-THE-ART AND EMERGING POST-COMBUSTION CARBON
CAPTURE TECHNOLOGIES 40
4.1 Liquid absorbents .................................................................................... 40
4.2 Amine-based liquid absorbents ............................................................... 42
4.2.1 MEA ............................................................................................ 43
4.2.2 EFG+ by Fluor ............................................................................ 44
4.2.3 PZ + AMP ................................................................................... 45
4.2.4 KS-1 & KS-21 by MHI ............................................................... 46
4.2.5 CANSOLV by Shell .................................................................... 47
4.3 Multi-phase absorbents ............................................................................ 48
4.3.1 Aqueous ammonia (NH3) ............................................................ 48
4.3.2 Chilled Ammonia Process by GE ............................................... 49
4.3.3 UNO MK 3 by CO2CRC ............................................................ 50
4.3.4 Hot-CAP by the University of Illinois ........................................ 51
4.3.5 Hot Potassium Carbonate process by Stockholm Exergi ............ 52
4.3.6 DMX by IFPEN .......................................................................... 53
4.4 Water-lean solvents ................................................................................. 54
4.4.1 eCO2Sol by RTI .......................................................................... 54
4.5 Solid adsorbents ...................................................................................... 55
4.6 Pressure-swing adsorption ....................................................................... 56
4.6.1 13X VSA by the National University of Singapore .................... 56
4.6.2 Rapid PSA by the University of South Carolina ......................... 57
4.7 Temperature-swing adsorption ................................................................ 57
4.7.1 VeloxoTherm by Svante ............................................................. 57
4.7.2 Dry-sorbent process by KIER & KEPCO ................................... 58
4.8 Membranes .............................................................................................. 58
4.8.1 Polaris membrane by MTR ......................................................... 60
4.8.2 Membrane-sorbent hybrid system by MTR & TDA ................... 61
4.9 Electrochemical separation ...................................................................... 61
4.9.1 SureSource MCFC by FuelCell Energy ...................................... 63
4.10 Status, performance and potential of the reviewed post-combustion carbon
capture technologies ................................................................................ 63
4.10.1 Potential of carbon capture technologies .................................... 68
5 DESCRIPTION OF THE PILOT-SCALE CARBON CAPTURE
EXPERIMENTS 71
5.1 Enhanced soda scrubbing process by VTT ............................................. 73
5.1.1 Sodium carbonate as CO2 absorbent ........................................... 74
5.1.2 Description of the enhanced soda scrubbing process .................. 75
5.2 Enhanced water washing process by CarbonReUse Finland .................. 77

5.2.1 Water as CO2 absorbent .............................................................. 77
5.2.2 Description of the enhanced water scrubbing process ................ 78
5.3 Kleener liquid by Kleener Power Solutions ............................................ 79
5.4 50 kW CFB pilot combustor ................................................................... 80
5.5 Flue gas purification ................................................................................ 81
5.6 Measurement arrangements ..................................................................... 82
5.7 Data processing ....................................................................................... 83
6 TEST RESULTS 85
6.1 Synthetic gas mixtures ............................................................................. 85
6.2 Pine chips combustion ............................................................................. 86
6.3 Washed straw combustion ....................................................................... 87
6.4 Spruce bark combustion .......................................................................... 89
6.5 Raw biogas .............................................................................................. 91
7 EVALUATION OF PERFORMANCE, SCALABILITY AND
APPLICABILITY OF THE TESTED CARBON CAPTURE
TECHNOLOGIES 92
7.1 Performance ............................................................................................. 92
7.1.1 CO2 purity ................................................................................... 92
7.1.2 Capture rate ................................................................................. 94
7.1.3 Energy consumption ................................................................... 96
7.1.4 Chemicals, additives and waste-streams ..................................... 97
7.1.5 Economic performance ............................................................... 98
7.2 Scalability and applicability .................................................................... 99
8 SUMMARY 101
REFERENCES 104
APPENDIX I: Schematic structure of the 50 kW CFB pilot 122

SYMBOLS AND ABBREVIATIONS
Abbreviations
AMP 2-amino-2-methyl-1-propanol
ASU Air Separation Unit
BAT Best Available Technology
BECCU Bioenergy with Carbon Capture and Utilization
BECCS Bioenergy with Carbon Capture and Storage
BtL Biomass-to-Liquid
CFB Circulating Fluidized Bed
CHP Combined Heat and Power
DeCO Decarbonylation
DeCO2 Decarboxylation
ESA Electrical-Swing Adsorption
ESP Electrostatic Precipitator
GHG Greenhouse Gas
HDO Deoxygenation
HEFA Hydroprocessed Esters and Fatty Acids
HVO Hydrotreated Vegetable Oil
LCOE Levelized Cost of Electricity
L/G Liquid-to-Gas -ratio
MCFC Molten Carbonate Fuel Cell
MEA Monoethanolamine
MSR Microwave-Swing Regeneration
NGCC Natural Gas Combined Cycle
NET Negative Emissions Technology
PAH Polycyclic Aromatic Hydrocarbons

PM Particulate Matter
PZ Piperazine
PSA Pressure-Swing Adsorption
SCR Selective Catalytic Reduction
SNCR Selective Non-Catalytic Reduction
SOFC Solid Oxide Fuel Cell
TRL Technology Readiness Level
TSA Temperature-Swing Adsorption
VOC Volatile Organic Compounds
VSA Vacuum-Swing Adsorption
Symbols
v̇ volumetric flow rate [m3/s, l/min]
x volumetric concentration [vol-%]
Indices
in inlet
out outlet

10
1 INTRODUCTION
The ever-rising greenhouse gas emissions with global warming effect have created an
alarming need for a shift towards more sustainable actions and policies in all sectors of
society. Majority of these harmful emissions derive from energy utilization, such as
power and heat production, energy use in transportation and other energy-intensive
industrial processes. Stricter emissions standards are required for these sectors to
neutralize the adverse effects on climate. Inability to reach significant emission reductions
will accelerate pace of global warming as energy demand continues to increase.
In their Special Report on Global Warming of 1.5 °C (2018) IPCC estimate carbon budget
– i.e., the tolerable amount of emissions – for a 66 % chance to avoid global warming of
1.5 °C to be 420 GtCO2 from 2018 onwards. According to UNEP (2019), the global
greenhouse gas emission rate with land-use change emissions included was 55.3 GtCO2
in 2018. Thus, the IPCC’s carbon budget is equivalent to roughly 8 years of global
emissions from 2018 onwards. Based on these estimates there is very little time and
practically a non-existing chance to change the course of global warming from exceeding
the limit of 1.5 °C, worsen by the fact that global GHG emissions are in a rising trend.
IPCC states the limit of 1.5 °C will very likely be exceeded. With current policies –
including implementation of Paris Agreement contributions – global warming is
estimated to reach around 2.8–3.2 °C by the end of the century (CAT 2019; UNEP 2019).
Clean and cost-competitive energy sources (e.g., solar and wind) are already available to
replace the emissive energy sources. However, rapid transformation of global energy
system and energy-intensive industries to solely base on these clean energy alternatives
is challenging. Too rapid system transition could endanger the security of supply due to
high variability of renewable energy, especially since efficient and large-scale energy
storages are still lacking (Heuberger & MacDowell 2018). Other slowing factors on
system transition include lack of determined and global-scale policymaking, slow
construction pace of electrification infrastructure and subsidies for fossil-fuels.
Nevertheless, striving for a fully renewable and sustainable energy system should remain

11
as a top priority and it should be pursued urgently to neutralize the undeniably harmful
effects caused by non-renewable energy. According to a study by LUT and EWG (Ram
et al. 2019) a more cost-effective global energy system based solely on renewables with
net-zero greenhouse gas emissions could be reached before 2050.
1.1 The role of carbon capture in future energy systems
Carbon capture can offer a complementary solution to climate change mitigation by
capturing carbon dioxide (CO2) emissions from large emission point sources, preventing
to release the CO2 into the atmosphere. Initially, carbon capture has been developed to
reduce emissions in fossil-based energy conversion processes. However, it has not
reached commercial popularity due to high costs and weak competitiveness against
renewable alternatives (Sgouridis et al. 2019).
When combined with applications that generate biogenic emissions (i.e., emissions that
originate from renewable biomass), the climate benefit of carbon capture is higher. Fossil-
based carbon capture merely reduces the amount of released fossil-based emissions,
which still increases the amount of GHG’s in the atmosphere since all of the emissions
cannot be typically captured. Biogenic carbon capture targets the carbon, which is in
natural circulation between the atmosphere and growing biomass. Depending on how the
captured biogenic CO2 is dealt with, carbon neutrality or even negative emissions can be
achieved. Negative emissions can be achieved by storing the captured biogenic CO2 in a
way that prevents it from returning into the atmosphere – a concept known as BECCS
(bioenergy with carbon capture and storage). In theory, even if the carbon budget for the
1.5 °C target was momentarily exceeded, it could be reached afterwards with negative
emissions achieved via biogenic carbon capture. However, too much reliance on negative
emissions should be avoided since many of these technologies are still unproven at
industrial-scale (EASAC 2018). The captured CO2 can also be utilized directly or
indirectly as feedstock for value-added products, like chemicals, fuels, or materials via a
concept known as BECCU (bioenergy with carbon capture and utilization). BECCU can
offer significant climate benefit by replacing conventional unsustainable production that

12
is based on fossil sources with production that utilizes biogenic CO2 as feedstock. Further
research and industrial-scale demonstration are still required to unravel the true potential
of carbon capture technologies.
Role of carbon capture is emphasized in several climate scenarios. For instance, it plays
a crucial role in three of the four pathways presented in IPCC’s SR 15 (2018). An
interquartile range of 550–1017 GtCO2 is estimated for cumulative captured carbon until
2100, of which bioenergy applications account for 364–662 GtCO2. Also, IEA’s
Sustainable Development Scenario, targeting to limit temperature increase to well below
2 °C, includes rapid commercial deployment of carbon capture and storage or utilization
in energy and industrial sectors. The scenario is targeting to annually capture 310 MtCO2
in 2030 and 1320 MtCO2 in 2040 in the power sector (IEA 2019b) and 450 MtCO2 in
2030 and 1030 MtCO2 in 2040 in the industrial sector (IEA 2019a). Trend to reach these
targets is currently way off track: in 2019 capture capacity was only 2.4 MtCO2 in the
power sector and 32 MtCO2 in the industrial sector (IEA 2019a; IEA 2019b).
1.2 Concept of BECCU
Bioenergy with carbon capture and utilization (BECCU) is a concept that combines
bioenergy production, carbon capture, and utilization of the captured CO2. It offers a way
for carbon-neutral energy production, while producing feedstock for various CO2
utilization applications. The objective is to capture biogenic CO2 from side-streams of
processes using biomass either directly or indirectly for energy production. The captured
CO2 can be used as feedstock to produce value-added products like chemicals, fuels, and
materials, thus offering more sustainable alternatives for conventional fossil-based
products. If proven viable after further research and industrial-scale demonstration, value
chains based on the concept of BECCU offer a potential solution to reach emission
reductions alongside energy production by replacing fossil-based products with
sustainable biogenic alternatives. Potential of BECCU is increasing due to the significant
and constantly growing role of bioenergy in the global energy supply as a source of
renewable energy. The potential is especially high in countries with strong bioeconomies,
13
such as in Finland, which has a lot of bioenergy production and a strong forest industry
sector.
Combustion of solid biomass is globally a traditional way to produce energy, but also
liquid biofuels, biogas and the use of biogenic wastes are conquering a constantly growing
share of the modern energy market. In 2018, share of bioenergy in global final energy
consumption was 12 % (45.2 EJ), making it currently the largest renewable source of
energy in global energy supply (REN21 2020). CO2 emission factor for biomass is
generally around 100 tCO2/TJ (Alakangas et al. 2016). Thus, with a rough estimate the
global bioenergy consumption of 45.2 EJ results to around 4.5 Gt of biogenic CO2
emissions annually. These emissions can be considered as target emissions of BECCU
and BECCS.
1.3 Objectives of the thesis
This thesis is conducted as part of VTT’s BECCU project. Aim of the project is to
evaluate feasibility and performance of a value chain utilizing industrial biogenic CO2
emissions and clean hydrogen in CO2-derived polyol production. In this thesis the value
chain is examined in terms of biogenic CO2 emissions sources and carbon capture
technologies via a literature review and pilot-scale carbon capture experiments. The main
objectives of the thesis are to:
1) Identify typical operating conditions in various sources of biogenic CO2 emissions
and evaluate the applicability of these sources to carbon capture.
2) Review the status and techno-economic performance of state-of-the-art and emerging
carbon capture technologies, focusing on post-combustion capture.
3) Present results from the pilot-scale carbon capture experiments that were conducted
as part of VTT’s BECCU-project during autumn of 2020 by using three different
absorption-based carbon capture technologies and multiple CO2 sources.

14
4) Evaluate performance, applicability and scalability of technologies tested in the pilot
experiments and compare the results to the technologies examined in the literature
review.
1.4 Structure of the thesis
The thesis is divided into a literature review (Chapters 1–4) and an experimental part that
focuses on pilot-scale carbon capture tests (Chapters 5–7). The first chapter introduces
the subject, presents the research methods and summarizes the main objectives of the
thesis. The second chapter reviews the typical operating conditions in sources of biogenic
CO2 emissions. The third chapter provides an overview on the various stages of a value
chain based on the concept of BECCU. In the fourth chapter, status and performance of
various state-of-the-art and emerging carbon capture technologies are reviewed, with a
focus on post-combustion capture. In the fifth chapter objectives and arrangements of the
pilot-scale carbon capture tests are presented, whereas the sixth chapter presents the test
results. Performance, applicability and scalability of the tested technologies are evaluated
in the seventh chapter. Summary of the work is presented in the eighth chapter.

15
2 BIOGENIC CO2 SOURCES IN ENERGY PRODUCTION AND
ENERGY-INTENSIVE INDUSTRIES
In this thesis carbon capture is examined from perspective BECCU, thus focusing on
carbon capture from large point sources of biogenic CO2 emission with a further objective
to utilize the captured CO2. The target industries are the bioenergy sector and energy-
intensive industries that utilize biomass. Fossil-based processes are not addressed since
renewable and cost-competitive alternatives are often available for these processes.
However, data from fossil fuel -based carbon capture projects is used to evaluate techno-
economic performance of various capture technologies due to the roughly similar
operating conditions.
This chapter focuses on reviewing various processes of the chosen target industries to
recognise typical conditions in possible carbon capture applications. Objective is to
identify typical gas compositions, occurring impurities, and how operating conditions and
choice of fuel or feedstock affect these factors. By understanding the conditions, suitable
carbon capture technologies that could be implemented into the processes can be more
easily identified.
2.1 Biomass combustion
Combustion of biomass is the most traditional way to produce energy. It is used in heat
generation, power production and in combined heat and power (CHP) systems. At
industrial-scale, biomass is typically combusted in a boiler, where heat released in
combustion is transferred to water circulating in walls of the boiler to generate either
steam or high temperature water to produce power, heat, or both. Several boilers types
with varying water-steam circulation systems, furnace structures and combustion
methods are used.
Primarily solid biomass is used as fuel, but alternative sources are also gaining popularity.
Globally, solid biomass accounted for an 86 % share of total primary energy supply of
biomass in 2017, whereas the share of various biogenic wastes was roughly 5 %.

16
Additionally, agricultural residues have great potential: theoretical energy potential of
agricultural residues that currently are not utilized is estimated to be 18–82 EJ, which
would account for a 3–14 % share of the current global total energy supply. (WBA 2019.)
2.1.1 Biomass composition
Chemical composition of biomass is the most important factor affecting flue gas
composition. Many types of feedstock can be used as fuel in combustion processes such
as wood-based biomass, herbaceous and agricultural biomass, as well as biogenic wastes.
Different biomass types have varying chemical compositions, thus resulting in varying
flue gas compositions in combustion. Mean compositions for biomass types that are
typically used in bioenergy applications are presented in Table 2.1 by using proximate
and ultimate analysis.
Table 2.1. Mean composition values (%) for biomass types typically used in bioenergy applications.
Ultimate analysis values are measured for dried and ash-free biomass, except for Cl which is measured for
dried biomass. (Vassilev et al. 2010.)
Method Component Wood and woody
biomass
Herbaceous and
agricultural biomass
Contaminated biomass
(e.g., wastes, sludges)
Proximate
analysis
Volatile matter 62.9 66.0 63.7
Fixed carbon 15.1 16.9 8.0
Moisture 19.3 12.0 11.6
Ash 2.7 5.1 16.7
Ultimate
analysis
C 52.1 49.9 53.6
O 41.2 42.6 37.0
H 6.2 6.2 7.3
N 0.4 1.2 1.7
S 0.08 0.15 0.46
Cl(db) 0.02 0.20 0.31
All biomass types generally contain a lot of volatile matter. Other components, like
moisture and ash content, may significantly vary depending on the biomass type. Wood-
based biomass can be considered as the purest type of biomass since it has the lowest

17
content of impurities like sulphur, chlorine and ash components. In herbaceous biomass,
like grasses and straws, these contents are slightly higher, whereas biogenic wastes and
sludges have significantly higher contents of these impurities. CO2 concentration of the
flue gas is related to the carbon content of the fuel. All biomass types have roughly similar
carbon contents at around 50 %, but the amount of fixed carbon, i.e., non-volatile carbon
varies.
2.1.2 Flue gas properties
In combustion, the fuel reacts with combustion air in high temperature and releases
energy in formation of combustion compounds (i.e., flue gas). When the fuel composition
is known, the expected flue gas composition can be solved via stoichiometry. A simplified
stoichiometric equation for a combustion process is presented in Equation 1.
Fuel (C, H, O, N) + Air (O2, N2) → CO2 + H2O + N2 (1)
In actual combustion processes both fuel and combustion air contain more elements than
is presented above and more combustion compounds are formed. Fuels contain elements
like sulphur, chlorine, and metals, some of which take part in the combustion process
creating compounds like sulphates, chlorides, and metal oxides (Jones et al. 2014). Some
of these compounds are harmful and can cause damage to the equipment and
environment. Also, due to lack of optimal conditions, the combustion processes are partly
incomplete meaning that all the carbon does not burn into carbon dioxide. Concentration
of CO2 in flue gases is relative to the carbon content of the fuel. Typically, it ranges
somewhere around 8–15 % in biomass combustion.
Exit temperature of flue gas in a thermal power plant is typically around 150–180 °C, but
if a wet flue gas scrubber is used, significantly lower exit temperatures at around
50–70 °C occur (Zagala & Abdelaal 2017). Flue gas exit pressure is slightly above

18
atmospheric pressure. To avoid water corrosion and condensate formation in the stack,
exit temperature is limited by the water dew point of the flue gas (Kaltschmitt 2019),
which is typically 40–60 °C (Huhtinen et al. 1994). When using sulphur-rich fuels,
another limiting factor for exit temperature is the acid dew point. Vapour containing SO3
condensates in a much higher temperature than water dew point and forms highly
corrosive sulfuric acid (H2SO4). Sulphuric acid dew point typically ranges around 110–
160 °C (Hupa et al. 2017). In biomass combustion, sulphuric acid formation must be
noted with fuels of high sulphur content, like wastes and possibly agricultural residues.
Chemically untreated wood fuels rarely face this problem due to naturally low sulphur
contents. (Kaltschmitt 2019.)
2.1.3 Impurities in biomass combustion
Common impurities and pollutants that occur in biomass combustion flue gas are sulphur
and chlorine compounds, nitrous oxides and other nitrogen compounds, carbon
monoxide, unburnt matter, volatile organic compounds, and smoke containing particulate
matter and ash (Jones et al. 2014). Chlorine and sulphur can be found in biomass as
organic compounds and as inorganic salts. In combustion process, chlorine is released as
KCl, which causes formation of deposits on the boiler surfaces, and as HCl, which has a
corrosive effect due to its strong acidity. Sulphur releases mainly as SO2, which is an
acidic air pollutant. Small amount of SO2 is oxidized into SO3, which further reacts with
water to form highly acidic H2SO4. Nitrogen oxides (NOx) release in combustion mostly
as NO of which some converts to NO2 when reacting with oxygen. NOx emissions cause
acid rain, harmful tropospheric ozone and have toxic health effects. Also, some nitrous
oxide (N2O) is formed, which is a direct greenhouse gas. Carbon monoxide (CO) is a
toxic gas formed in incomplete combustion due to lack of oxygen. In addition to its
toxicity, a significant amount of energy is not released if the carbon does not fully burn
to carbon dioxide. Unburnt matter like methane and other volatile organic compounds
(VOC’s), as well as polycyclic aromatic hydrocarbons (PAH’s), occur in incomplete
combustion and cause direct and indirect greenhouse effects and health problems. Some

19
inorganic elements release as particulate matter, which can have harmful health effects,
such as respiratory problems and carcinogenic effects. (Jones et al. 2014; Kaltschmitt
2019). Table 2.2 presents typical emission levels from combustion of woody biomass
with different boiler types.
Table 2.2. Typical emissions levels (mg/Nm3) from combustion of woody biomass. (Vakkilainen 2016.)
Boiler type Grate BFB CFB Recovery boiler
CO2 150 000–~200 000 150 000–~200 000 150 000–~200 000 210 000–~240 000
CO 100–600 100–250 50–100 50–200
H2S 3–20 1–20 1–5 0–4
SO2 250–400 30–150 5–50 0–5
NOx 100–400 250–450 150–250 150–250
N2O 0–1 4–8 5–10 0–1
HF 1–5 1–5 1–5 0
HCl 5–30 5–30 5–30 0–2
Dust, ESP 10–20 10–20 10–20 10–50
Dust, FF 1–5 1–5 1–5 n.a.
Dioxins and furans <0.0001 <0.0001 <0.0001 <0.00001
Boiler type, which is mainly determined by scale and fuel type, affects, for instance, on
how complete the combustion process is. Large-scale boilers that are typically equipped
with fluidized beds have better mixing properties due to the more dynamic nature of the
bed, thus resulting in more complete combustion. The CO2 level in combustion of woody
biomass is often quite similar regardless of the boiler type, at around 8–14 %.
2.1.4 Effect of combustion conditions on impurity formation
Combustion temperature above 1300 °C significantly increases thermic NOx formation,
whereas too low temperature (<800 °C) leads to incomplete combustion, i.e., unburnt
matter and toxic CO emissions. More complete combustion can be achieved by using a
secondary air flow to improve mixing, sufficient residence time of gas compounds and
excess air. Excess combustion air means using more air than the combustion process
would require in theory. Increasing the amount of combustion air increases the amount
of oxygen, which is needed for the carbon to fully combust to CO2. On the other hand,

20
too much excess air can result in increasing amount of NOx emissions since the amount
of nitrogen increases as well. This occurs especially in high burning temperatures. NOx
emissions are typically reduced with staged combustion (i.e., air or fuel staging), which
means creating separate combustion stages in the furnace by supplying air/fuel at multiple
locations. Staged combustion increases the residence time of compounds in the
combustion area leading to more complete combustion, while also allowing better control
of the combustion process. Boiler type has a large effect on the combustion conditions.
For instance, fluidized bed boilers generally offer significantly better control over the
combustion conditions than grate-firing boilers. Also, different burner configurations for
different conditions and fuels can be used to reach suitable combustion conditions.
(Kaltschmitt 2019.)
2.1.5 Flue gas purification and emission control
National and regional policies have set emission limits that energy production facilities
must fulfil. These limits aim to ensure that operation of the facilities follow the BAT-
principle (Best Available Technology) to minimize harmful effects of pollutants on
environment and society. Meeting these emission limits often requires using flue gas
purification technologies or specific combustion configurations. Flue gas purification is
typically done by using flue gas scrubbers, impurity-binding additives, electrostatic
precipitators, and filters. Some purification methods can be combined with heat recovery
to improve the energy efficiency of the facility.
Common methods to remove NO2 from the flue gas stream are SCR (Selective Catalytic
Reduction) or SNCR (Selective Non-Catalytic Reduction). In SCR a reactant (e.g.
ammonia/urea) is fed to the flue gas stream, which is then led to a catalytic reactor where
NO and NO2 compounds reduce to H2O and N2 (Huhtinen et al. 1994). SCR is an effective
method, reducing 80–95 % of the NOx emissions. In SNCR a catalytic reactor is not used,
but a reactant (typically ammonia) is fed to the combustion chamber, causing reduction
reactions of the NOx’s due to high temperature (850–1000 °C). SNCR is not as effective,
21
achieving a 30–60 % reduction in NOx emissions. Also, it is a costly method and sensitive
to changes in combustion conditions and fuel properties. (Zagala & Abdelaal 2017.)
Sulphur emissions are often removed with methods based on absorption, adsorption, or
catalysis, typically by using flue gas scrubbing. These methods can be categorized into
wet, semi-dry and dry processes as well as regenerative or non-regenerative processes.
Most common and effective method is a non-regenerative wet absorption process, which
is applicable for all fuel types. The flue gas is led to an absorber column, where wet
absorbent is sprayed against the flue gas stream, often resulting in a desulphurization rate
of >90 %. Wet scrubbers are commonly operated by using water, possibly with additive
absorbent materials like calcium compounds (e.g., lime or limestone), which react with
SO2 to form slurry of calcium sulphite. The slurry is oxidized into calcium sulphate,
concentrated, and dried to produce gypsum, which is utilizable for example in
construction. In semi-dry processes, an absorbent slurry is sprayed to the flue gas stream
as droplets to form dry calcium sulphate, which is collected from the bottom of the reactor
or in a specific separator. Semi-dry processes have a good desulphurization rate (~85%)
and compared to wet processes they are more cost-effective in small and low-usage
boilers. Dry processes include methods like adsorption through sorbent injection into
combustion chamber or flue gas duct, mixing sorbents into bed material, and dry reactor
processes. Dry processes are generally simpler and cheaper, but not as effective, reaching
a desulphurization rate of 30–50 %. (Zagala & Abdelaal 2017; Huhtinen et al. 1994.)
Particulate matter (PM) such as inorganic solid particles, soot, and liquid droplets travel
in the flue gas as fly-ash and smoke. Several techniques can be used to remove PM
emissions, most common ones being cyclones, electrostatic precipitators (ESP), fabric
filters and scrubbing. In a cyclone a centrifugal force, generated with a spiral stream,
drives the particles to the outer walls from where they move to the collector. Cyclones
are not effective enough to be a sole PM purification method, but they are used with other
purification methods to control dust emissions. ESP’s utilize an electrostatic field to
capture electronically charged particles, generally located before or after an air preheater.
With fabric filters (e.g., polyester, fibre glass), particles are filtrated from the flue gas
22
stream, typically operating at a temperature level of 120–220 °C. Both ESP’s and fabric
filters are very effective and widely used techniques to remove PM emissions. Scrubbing
is less effective and less popular, but it can be combined for example with
desulphurization scrubbers. (Lecomte et al. 2017.)
2.2 Biogas
Biogas is a flammable and clean-burning gas mixture that is formed in anaerobic digestion
of organic matter. By removing impurities, biogas can be upgraded into higher calorific
value biomethane, which can be used as a sustainable alternative for fossil-based natural
gas. CO2 is formed in the digestion process as well as in combustion of biogas or
biomethane. Therefore, carbon capture could be applied to raw biogas purification as well
as biogas-fired combustion processes.
2.2.1 Composition of raw biogas
Chemical composition of biogas depends on the used feedstock and digestion conditions.
Energy crops, residues and biogenic wastes are typically used as a feedstock for biogas
production. Table 2.3 presents typical biogas compositions for feedstock sources that are
commonly used in biogas production.

23
Table 2.3. Typical biogas compositions for various feedstock sources. (Carillo, cited in Huertas et al. 2011.)
Component (%) Agricultural waste Landfills Industrial waste
CH4 50–80 50–80 50–70
CO2 30–50 20–50 30–50
N2 0–1 0–3 0–1
H2 0–2 0–5 0–2
O2 0–1 0–1 0–1
H2S 0.7 0.1 0.8
CO 0–1 0–1 0–1
NH3 Traces Traces Traces
Siloxanes Traces Traces Traces
H2O Saturation Saturation Saturation
Raw biogas consists mainly of methane and CO2. Compared to flue gases, concentration
of CO2 in raw biogas is significantly higher, at around 20–50 %.
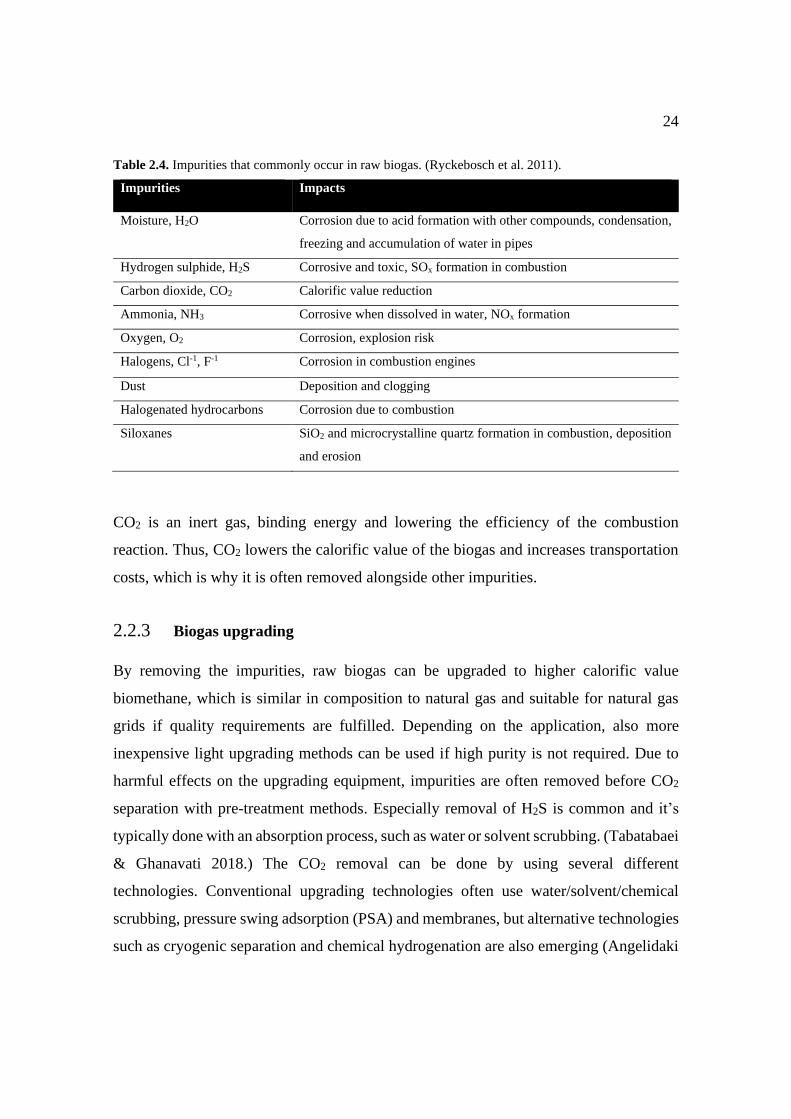
2.2.2 Impurities in raw biogas
Raw biogas can contain compounds that are toxic or have harmful impacts to equipment
or environment and depending on the application, removal of these impurities may be
required. Some impurities can be removed during biogas upgrading, but it may be
necessary to purify the biogas in advance to avoid any impurity-caused damage to the
upgrade equipment. Impurities that are commonly present in raw biogas are summarized
in Table 2.4.
24
Table 2.4. Impurities that commonly occur in raw biogas. (Ryckebosch et al. 2011).
Impurities Impacts
Moisture, H2O Corrosion due to acid formation with other compounds, condensation,
freezing and accumulation of water in pipes
Hydrogen sulphide, H2S Corrosive and toxic, SOx formation in combustion
Carbon dioxide, CO2 Calorific value reduction
Ammonia, NH3 Corrosive when dissolved in water, NOx formation
Oxygen, O2 Corrosion, explosion risk
Halogens, Cl-1, F-1 Corrosion in combustion engines
Dust Deposition and clogging
Halogenated hydrocarbons Corrosion due to combustion
Siloxanes SiO2 and microcrystalline quartz formation in combustion, deposition
and erosion
CO2 is an inert gas, binding energy and lowering the efficiency of the combustion
reaction. Thus, CO2 lowers the calorific value of the biogas and increases transportation
costs, which is why it is often removed alongside other impurities.
2.2.3 Biogas upgrading
By removing the impurities, raw biogas can be upgraded to higher calorific value
biomethane, which is similar in composition to natural gas and suitable for natural gas
grids if quality requirements are fulfilled. Depending on the application, also more
inexpensive light upgrading methods can be used if high purity is not required. Due to
harmful effects on the upgrading equipment, impurities are often removed before CO2
separation with pre-treatment methods. Especially removal of H2S is common and it’s
typically done with an absorption process, such as water or solvent scrubbing. (Tabatabaei
& Ghanavati 2018.) The CO2 removal can be done by using several different
technologies. Conventional upgrading technologies often use water/solvent/chemical
scrubbing, pressure swing adsorption (PSA) and membranes, but alternative technologies
such as cryogenic separation and chemical hydrogenation are also emerging (Angelidaki
25
et al. 2018). Generally, the removed CO2 is led into the atmosphere as incentives for
carbon capture are lacking.
2.3 Liquid biofuel production
Liquid biofuels are currently the fastest growing form of bioenergy, having increased
their production nearly sevenfold from beginning of the century. In 2017, liquid biofuels
accounted for a 7 % share of total primary energy supply of biomass. (WBA 2019.)
Biofuel production processes that possibly could be applicable for carbon capture are
reviewed below.
2.3.1 Bioethanol
Bioethanol is the most common liquid biofuel, accounting for a 62 % share of global
biofuel production (WBA 2019). It can be used as an alternative for conventional fuels,
like gasoline. Bioethanol has been typically produced from biomass containing sucrose
or starch, such as sugarcane and corn. However, conventional bioethanol production is
often critiqued since it requires large land areas and endangers food security by competing
of the same areas with food production. With more advanced technologies cellulosic
biomass and biogenic wastes can be used as feedstock for bioethanol production. St1 is
one of the leading developers of these advanced bioethanol production processes with
their Etanolix, Cellunolix and Bionolix processes (St1 2020). These advanced processes
are more sustainable since forestry residues as well as municipal and industrial wastes
can be used to produce bioethanol.
Bioethanol is typically produced in a fermentation process, where sugars of the biomass
are converted to ethanol. The process also consists of different pre-treatment methods to
obtain fermentable sugars and after-treatment methods to ensure high ethanol quality.
Exhaust stream from fermentation is nearly pure CO2 (Fry et al. 2017) and if carbon
capture is desired, specific carbon capture technology is not required. Amount of
impurities in exhaust stream is also generally low and depending on the application only

26
minor purification, if none, is required. Typical impurities are organic compounds, such
as ethanol and methanol, and sulphur compounds, such as H2S and dimethyl sulphide.
(Xu et al. 2010.) Since specific carbon capture technology is not required, CO2 capture
cost in bioethanol production processes is significantly lower than in combustion
processes. Cost of CO2 capture and compression alongside bioethanol production is
estimated to be around 30 $/tCO2 (Sanchez et al. 2018). It is already at a mature level,
having been used for decades in the U.S. to provide CO2 for enhanced oil recovery.
2.3.2 Biomass-to-Liquid (BtL)
Biomass-to-Liquid refers to multi-phase processes producing synthetic liquid biofuels
from biomass. Generally, the process involves gasification of solid biomass to produce
syngas – a gas mixture consisting mainly of H2, CO and CO2. The syngas is purified and
converted into liquid hydrocarbons or alcohols through various conversion processes, like
the Fischer-Tropsch synthesis. (Kaltschmitt 2019.) Composition of the syngas depends
on feedstock and gasification technology, as seen from Table 2.5.

27
Table 2.5. Typical compositions for wet syngas and dry syngas produced with different gasification
technologies. (Mansfield & Wooldridge 2015; Rauch et al. 2014.)
Compound
Wet syngas
typical
industrial
applications
Dry syngas
biomass oxygen
gasification,
entrained flow
Dry syngas
biomass oxygen
gasification,
fluidized bed
Dry syngas
biomass steam
gasification, indirect
H2 vol-% 25–30 15–20 20–30 30–45
CO vol-% 30–60 40–60 20–30 20–25
CO2 vol-% 5–15 10–15 25–40 20–25
H2O vol-% 2–30 - - -
CH4 vol-% 0–5 0–1 5–10 6–12
N2 vol-% 0–4 0–1 0–1 0–1
Ar, N2, H2S, COS,
NH3, Ash
vol-% 0–1 n.m. n.m. n.m.
Trace Impurities (e.g.,
Fe, Cl, Si, metals)
ppm <100 n.m. n.m. n.m.
Tar g/Nm3 n.m. <0.1 1–20 1–10
Typically, a water-gas shift reaction (Eq. 2) is used to improve the H2/CO ratio of the
syngas, which also increases CO2 concentration.
CO + H2O ⇌ CO2 + H2 (2)
The shift reaction increases CO2 concentration of the syngas to 15–50 % (U.S. DOE n.d.).
Carbon capture could be applied to the process after the shift reaction, by using various
technologies applicable for pre-combustion capture, such as absorbents (See Section 4.1)
and membranes (See Section 4.8).
28
2.3.3 Hydrotreated Vegetable Oils (HVO)
Hydrotreated vegetable oils, also known as hydroprocessed esters and fatty acids (HEFA)
and renewable diesel (not to be mistaken with conventional biodiesel), are second-
generation biofuels with great potential in the liquid biofuel market. HVO’s are paraffinic
hydrocarbons chemically equivalent to fossil diesel fuel and therefore suitable to replace
fossil diesel fuel without any blending. Market for commercial HVO production is
growing rapidly. The current market leader is Neste with their NEXBTL technology.
Currently, Neste has capacity to produce 3 million tonnes of renewable diesel annually
(Neste 2020).
HVO’s are produced from oils and fats in hydroprocessing. Various plant- and animal-
based oils, as well as oil-wastes, can be used as feedstock for HVO production. In the
process, hydrogen is used to convert unsaturated compounds of oils or fatty acids to
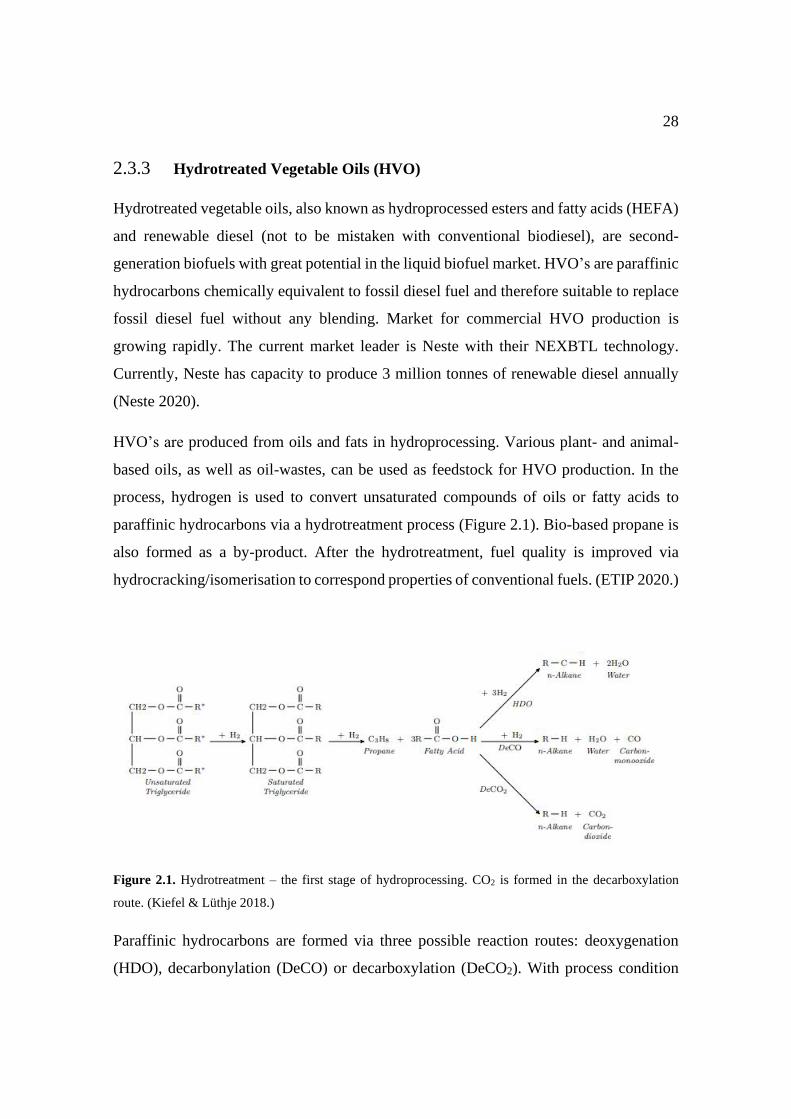
paraffinic hydrocarbons via a hydrotreatment process (Figure 2.1). Bio-based propane is
also formed as a by-product. After the hydrotreatment, fuel quality is improved via
hydrocracking/isomerisation to correspond properties of conventional fuels. (ETIP 2020.)
Figure 2.1. Hydrotreatment – the first stage of hydroprocessing. CO2 is formed in the decarboxylation
route. (Kiefel & Lüthje 2018.)
Paraffinic hydrocarbons are formed via three possible reaction routes: deoxygenation
(HDO), decarbonylation (DeCO) or decarboxylation (DeCO2). With process condition

29
adjustments and catalyst choice, the reaction can be shifted to favour one over the other.
Choice of reaction significantly affects hydrogen consumption and output composition,
as seen in Table 2.6. Note that the third plausible reaction, decarbonylation (DeCO), is
not presented in the table.
Table 2.6. Theoretical hydrogen consumption and output compositions for decarboxylation (DeCO2) and
deoxygenation (HDO) of brown grease. (Marker 2005).
Method H2 H2S+NH3 C1-C4 Naphtha CO2 H2O nC17 nC18
DeCO2 0.8 0.04 0.6 2.5 15.5 0 82.2 0
HDO 2.9 0.04 0.7 2.4 0 12.7 0 87.2
Deoxygenation results in H2O formation and high hydrocarbon yield as carbon does not
bound to the by-product compounds. In decarboxylation CO2 is released in relatively pure
state as a by-product. However, the hydrocarbon yield is lower compared to
deoxygenation as some of the carbon bounds to CO2. In decarbonylation H2O and CO are
released as by-product. Presumably, highest potential for carbon capture in HVO
production lies in hydrotreatment processes favouring the decarboxylation route.
Additionally, decarboxylation has lower hydrogen consumption and better catalyst
performance preservation properties than deoxygenation and decarbonylation (Marker
2005; Kiefel & Lüthje 2018). There may occur some catalyst-derived impurities such as
diglycerides, monoglycerides, olefins, esters, and alcohols (Kiefel & Lüthje 2018). Since
decarboxylation results in relatively pure stream of CO2, specific carbon capture
technologies would presumably not be required and the CO2 could be captured only after
minor purification and drying. However, research on carbon capture in HVO production
processes has not been conducted.
2.4 Chemical pulping
Modern pulp and paper industry is predominantly based on chemical pulping (e.g., kraft
pulping). Chemical pulping is energy-intensive and a significant source of biogenic CO2

30
emissions. Around 75–100 % of pulp mills’ CO2 emissions are biogenic (Onarheim et al.
2017). Via carbon capture pulp mills could become a major source of biogenic CO2.
Majority of the CO2 emissions from kraft pulp mills originate from combustion processes
at biomass/multi-fuel boiler, recovery boiler and lime kiln. Biomass and recovery boilers
produce steam and electricity for the pulping process. Often excess electricity and heat is
produced, which can be utilized internally or sold to the energy market. Biomass boilers
typically use biomass residues from wood handling as fuel, whereas in recovery boilers
the organic pulping process residues (black liquor) are combusted. Fossil-based CO2
emissions typically derive from the lime kiln that is used to produce lime from lime-mud
in high temperature calcination reaction, also releasing CO2. Lime kilns often use fossil
fuels, like oil or natural gas, due to stable combustion conditions and high adiabatic flame
temperature that are needed for optimal lime kiln operation. Fossil-based CO2 emissions
from lime kilns could be neutralized by using alternative fuels, such as biogas, pulverized
wood or hydrogen. (Kuparinen 2019.) The combustion processes are separate and if all
CO2 emissions would be targeted, each flue gas stream would require carbon capture
equipment. Kuparinen (2019) discusses that applying carbon capture into all the streams
is likely not feasible and that only the most significant streams should be focused upon.
Recovery boiler is the largest source of emissions. Via reference case calculations,
Kuparinen estimates that with a capture rate of 90 %, around 60–80 % of typical kraft
pulp mill’s total CO2 emissions could be recovered when carbon capture is applied only
to the recovery boiler. Operating conditions and flue gas composition in recovery boilers
are similar as in other biomass combustion processes, although the CO2 concentration in
the flue gas is often slightly higher (See Table 2.2).
Onarheim et al. (2017) estimate that cost of CO2 avoided in typical modern Finnish kraft
pulp mills and integrated pulp and board mills are 52–66 €/tCO2 and 71–89 €/tCO2,
respectively, when capturing 60–90 % of the emissions with amine-based post-
combustion capture technology. They conclude that negative emission credits or other
supporting policies are required to implement carbon capture to the pulp and paper
industry.
31
3 CO2 CAPTURE, TREATMENT, TRANSPORTATION AND
UTILIZATION
This chapter provides an overview on the various stages of BECCU, including carbon
capture, after-capture treatment, transportation, as well as utilization. Utilization is
reviewed from the point of view of polyol production, as it is the focus of VTT’s BECCU
project.
3.1 Carbon capture
Carbon capture refers to a process that separates and captures carbon dioxide from CO2
emission point sources instead of releasing the CO2 to the atmosphere. Additionally, the
objective is to capture a relatively pure stream of CO2. Research and development
regarding carbon capture has mostly been focusing on energy production but
opportunities have been identified also in other energy-intensive and high-emissive
industries, such as in forest, steel and cement industries and in refineries.
Carbon capture technologies are often categorized into post-combustion technologies,
pre-combustion technologies and oxyfuel combustion technologies. There are also
applications with high CO2 concentrations that do not need specific carbon capture
technology, requiring only purification. The capture technologies can be further
categorized based on the method of capture such as absorption, adsorption, membranes
or electrochemical potential. Various capture methods and promising technologies based
on these methods are reviewed in Chapter 4.
Implementing carbon capture on a power plant or other industrial facility has drawbacks.
It increases both capital and operational cost, often weakens the energy efficiency of the
plant or increases need for external energy and requires installation and maintenance of
possibly large-sized capture equipment. Depending on the capture method it can also
increase waste streams and cause additional pollutant formation.
32
3.1.1 Post-combustion capture
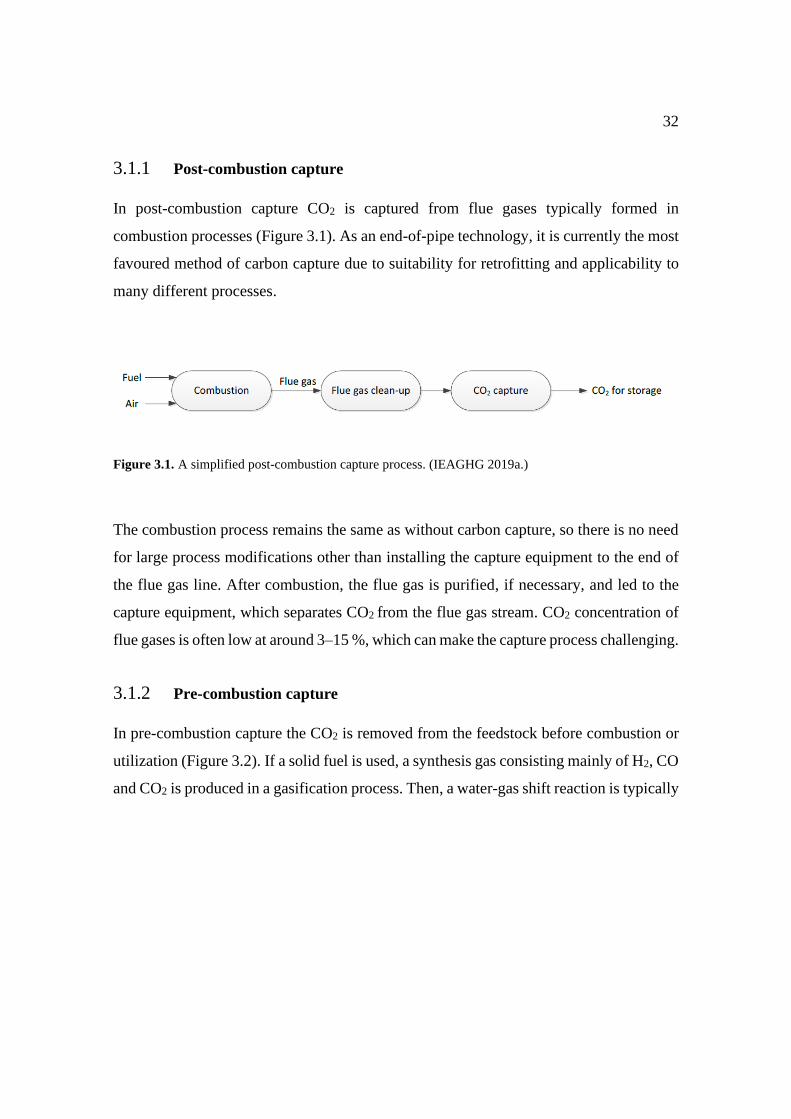
In post-combustion capture CO2 is captured from flue gases typically formed in
combustion processes (Figure 3.1). As an end-of-pipe technology, it is currently the most
favoured method of carbon capture due to suitability for retrofitting and applicability to
many different processes.
Figure 3.1. A simplified post-combustion capture process. (IEAGHG 2019a.)
The combustion process remains the same as without carbon capture, so there is no need
for large process modifications other than installing the capture equipment to the end of
the flue gas line. After combustion, the flue gas is purified, if necessary, and led to the
capture equipment, which separates CO2 from the flue gas stream. CO2 concentration of
flue gases is often low at around 3–15 %, which can make the capture process challenging.
3.1.2 Pre-combustion capture
In pre-combustion capture the CO2 is removed from the feedstock before combustion or
utilization (Figure 3.2). If a solid fuel is used, a synthesis gas consisting mainly of H2, CO
and CO2 is produced in a gasification process. Then, a water-gas shift reaction is typically

33
used to increase the H2/CO ratio, creating a gas mixture rich in H2 and CO2 from which
the CO2 could be captured.
Figure 3.2. A simplified pre-combustion capture process. (IEAGHG 2019a.)
If a gaseous fuel is used, the syngas can be produced via steam methane reforming (Eq.
3), catalytic partial oxidation (Eq. 4) or dry reforming (Eq. 5).
CH4 + H2O ⇌ CO + 3 H2 (ΔHr = 206 kJ/mol) (3)
O2 + 2 CH4 ⇌ 2 CO + 4 H2 (ΔHr = –36 kJ/mol) (4)
CH4 + CO2 ⇌ 2CO + 2H2 (ΔHr = 247 kJ/mol) (5)
Compared to post-combustion applications CO2 concentration in pre-combustion is
generally higher, at around 15–50 %. Syngas properties are more specifically reviewed
in Subsection 2.3.2.
3.1.3 Oxyfuel combustion
Oxyfuel technologies utilize combustion in oxygen-rich conditions instead of regular air
(Figure 3.3), which increases CO2 concentration of the flue gas. This requires separation
of nitrogen from the combustion air with an air separation unit or using an external source
of high purity oxygen.
34
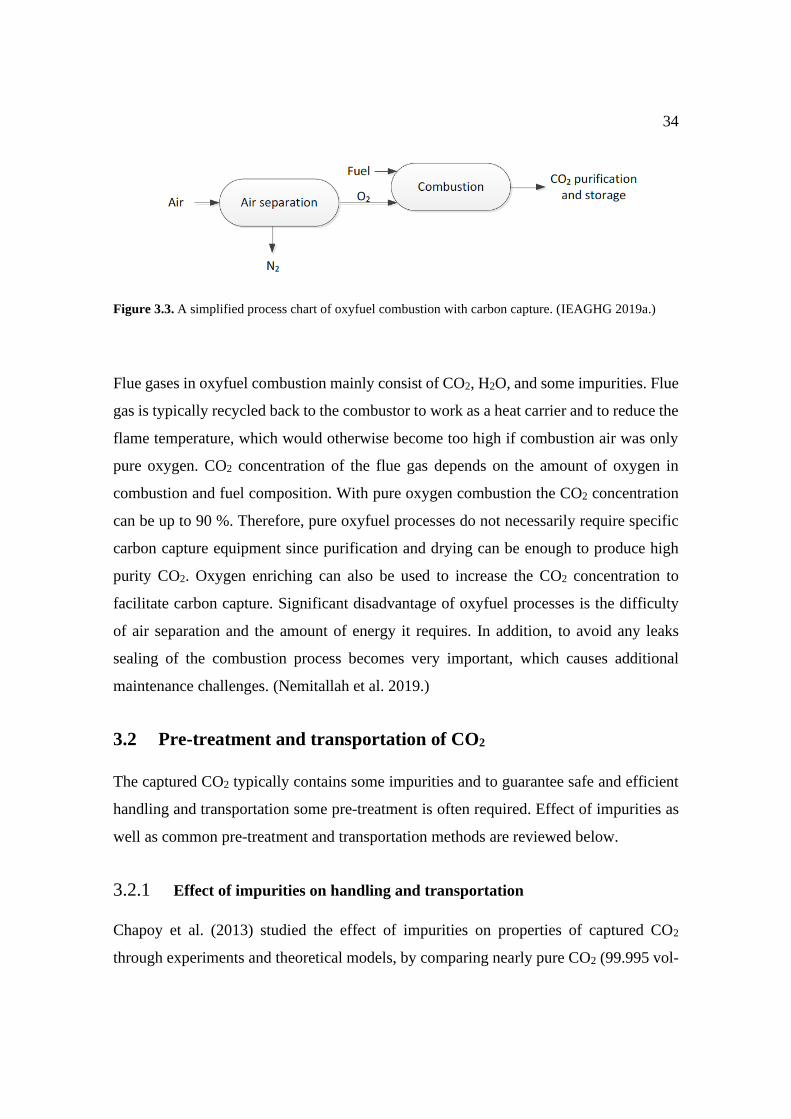
Figure 3.3. A simplified process chart of oxyfuel combustion with carbon capture. (IEAGHG 2019a.)
Flue gases in oxyfuel combustion mainly consist of CO2, H2O, and some impurities. Flue
gas is typically recycled back to the combustor to work as a heat carrier and to reduce the
flame temperature, which would otherwise become too high if combustion air was only
pure oxygen. CO2 concentration of the flue gas depends on the amount of oxygen in
combustion and fuel composition. With pure oxygen combustion the CO2 concentration
can be up to 90 %. Therefore, pure oxyfuel processes do not necessarily require specific
carbon capture equipment since purification and drying can be enough to produce high
purity CO2. Oxygen enriching can also be used to increase the CO2 concentration to
facilitate carbon capture. Significant disadvantage of oxyfuel processes is the difficulty
of air separation and the amount of energy it requires. In addition, to avoid any leaks
sealing of the combustion process becomes very important, which causes additional
maintenance challenges. (Nemitallah et al. 2019.)
3.2 Pre-treatment and transportation of CO2
The captured CO2 typically contains some impurities and to guarantee safe and efficient
handling and transportation some pre-treatment is often required. Effect of impurities as
well as common pre-treatment and transportation methods are reviewed below.
3.2.1 Effect of impurities on handling and transportation
Chapoy et al. (2013) studied the effect of impurities on properties of captured CO2
through experiments and theoretical models, by comparing nearly pure CO2 (99.995 vol-

35
%) and a CO2-rich mixture including Ar, O2, N2 and H2O. The impurities caused an
increase in the mixture’s liquid phase region, thus requiring higher liquefaction pressure.
Other effects were decrease of water dissolution to the stream and decrease of density,
which increases compression and transportation costs.
According to Race et al. (cited in Rabindran et al. 2011) impurities (SOx, NOx, H2, Ar) in
pipeline transportation of CO2 change the design conditions of equipment such as
compressors and pumps, cause toxicity and corrosivity, reduce the transport capacity,
cause the need for higher inlet pressure and/or more recompression stations, increase the
risk of fractures due to higher pressure and cause embrittlement.
3.2.2 Pre-treatment
Stages of CO2 pre-treatment depend on the desired CO2 properties that is often determined
by the transportation method and the end-use application. Generally, pre-treatment
includes purification, dehydration and compression. CO2 is compressed into a dense and
easily transportable state to maximize transport efficiency and to lower transport costs.
Impurities are removed due to their negative effects in handling and transportation and to
match the quality requirements of end-use applications. Water-soluble impurities, like
SO2, can be removed with water-wash process during the first stages of compression.
Moisture is removed due to its corrosive nature in pipelines and risk of ice formation in
low liquefaction temperatures. Moisture removal can be done via cooling during the
compression stages. Possible volatile impurities and non-condensable gases are removed
via distillation or flashing at a pressure of ~60 bar. (Teir et al. 2011.)
3.2.3 Transportation
If the captured CO2 is not utilized in-situ it must be transported to the place of utilization.
At industrial-scale, suitable methods of transportation are pipelines and ships due to large
transport capacities. Road and railway transportation, which are more suitable for
demonstration-scale, have large costs per transported unit due to small capacities.
Pipeline transportation of CO2 is already successfully implemented commercially: in the

36
US millions of tonnes of CO2 is transported via pipelines for enhanced oil recovery
(IEAGHG 2013). Ship transportation of CO2 is comparable to transportation of liquefied
petroleum gases due to similar properties and thus it is also considered as a mature method
of CO2 transportation (Brownsort 2015). In pipeline transportation the CO2 is compressed
above its critical pressure to over 80 bar to avoid gas formation and two-phase flows. In
ship transportation the CO2 is liquefied near its triple point to reach high density. Typical
conditions in pipeline transportation are 110 bar and 35 °C and in ship transportation 7
bar and -50 °C (Wilcox 2012). To avoid technical difficulties and health concerns, the
CO2 must meet necessary quality recommendations, such as the DYNAMIS quality
recommendations for pipeline transportation presented in Table 3.1.
Table 3.1. DYNAMIS CO2 quality recommendations for pipeline transportation. (de Visser & Hendricks
2007.)
Component Limit Cause of limitation
H2O 500 ppm Technical
H2S 200 ppm Health and safety
CO 2000 ppm Health and safety
O2 Aquifer < 4 vol%, EOR 100 – 1000 ppm Technical
CH4 Aquifer < 4 vol%, EOR < 2 vol% ENCAP project
N2 < 4 vol % (all non-condensable gases) ENCAP project
Ar < 4 vol % (all non-condensable gases) ENCAP project
H2 < 4 vol % (all non-condensable gases) High energy content
SOx 100 ppm Health and safety
NOx 100 ppm Health and safety
CO2 > 95.5 % Balanced with other compounds
Cost of transportation depends on distance and method of transportation. Cost estimates
for CO2 transportation at demonstration-scale and large-scale are presented in Table 3.2.

37
Table 3.2. Transportation cost estimates (€/tCO2) for demonstration-scale (2.5 MtCO2/a) and large-scale
networks (20 MtCO2/a) in natural gas or coal-based CCS projects. (GCCSI 2011.)
Spine distance 180 km 500 km 800 km 1500 km
Demonstration-scale
Onshore pipe 5.4 n.a. n.a. n.a.
Offshore pipe 9.3 20.4 28.7 51.7
Ship 8.2 9.5 10.6 14.5
Liquefaction (for ship transport) 5.3 5.3 5.3 5.3
Large-scale
Onshore pipe 1.5 3.7 5.4 n.a.
Offshore pipe 3.4 6.0 8.2 16.3
Ship (incl. liquefaction) 11.1 12.2 13.2 16.1
At demonstration-scale ships are the most cost-efficient method in long distances,
whereas in short distances (e.g., domestic networks) pipe transportation reaches the
lowest cost. At larger scale pipe networks are the most cost-efficient method of
transportation all the way up to 1500 km distances, at which point ship transportation
becomes slightly more inexpensive method compared to offshore pipe networks.
3.3 CO2 utilization
Wide deployment of carbon capture at industrial-scale would provide a large source of
CO2. If it is not stored underground, the captured CO2 can be utilized either directly or
indirectly as a feedstock for various value-added products. As the current operating
environment lacks incentives for CO2 storage, utilization presents an option to profit from
carbon capture.
Global CO2 demand is currently relatively small at around 250 Mt in 2020. Majority of
current CO2 consumption is direct, i.e., used in non-conversion processes. Largest
commercial consumers of CO2 are fertiliser industry in urea manufacturing, oil industry
in enhanced oil recovery, and food and beverage industry. Current CO2 demand is
imbalanced and depends highly on the season, which also affects the price of CO2.
Typically, the demand is at highest before spring due to increasing fertilizer production
ahead of planting season. Price of CO2 differs a lot depending on purity, region and

38
industry. Prices of 3–15 USD per CO2 tonne are typical in long-term contracts with
ammonia producers, whereas in niche-markets the price of highly pure CO2 can exceed
even 400 USD/tCO2. (IEA 2019c.)
Demand of CO2 is expected to grow as CO2 utilization increases. Especially indirect
utilization of CO2 to produce fuels, chemicals and materials via various conversion
processes has generated a lot of interest. CO2-derived products can provide climate
benefit if that production is used to replace conventional unsustainable production
methods based on fossil sources. IEA (2019c) estimates an annual demand of 272 Mt for
2025. Estimates for global annual demand in 2030 range from <1 Gt to 7 Gt. Estimating
future demand is challenging due to dependence on policies and because the technologies
aiming for CO2-derived products are still at an early stage. (Winberg & Mäki 2020.)
3.3.1 CO2-derived polyols
In VTT’s BECCU project, CO2 utilization is studied in polyol production. According to
a recent publication by VTT (Lehtonen et al. 2019), CO2-derived polyols are high-value
products that possess high commercialization potential in the CO2 utilization market.
Polyols can be used as building blocks to produce polymers such as polycarbonates,
polyesters or polyurethanes. Figure 3.4 presents CO2 utilization route in polyurethane
production.
Figure 3.4. CO2 utilization in polyurethane production. (Lehtonen et al. 2019.)
Polymers are one of the most desirable CO2-derived products due to high versatility and
applicability. Polymers are long-chain macromolecules with various unique properties
depending on the bonding of the molecule. They are building blocks for variety of
materials like plastics, rubbers, synthetic fibres, resins, and foams. Polymers are

39
conventionally produced in petrochemical processes via fossil-based carbon.
Alternatively, CO2 can be used to produce polymers via multiple routes such as chemo-
catalytic reactions, electrochemistry or by producing indirect products like methanol or
syngas to be used as source of polymers via various conversion reactions (Nova Institute
in Bioenergy International 2019a). Some CO2-derived polymer production can even
compete with conventional production due to low energy requirement. For example,
carbonates have a lower energy state than CO2, meaning that CO2-to-polycarbonate
conversion process require only little energy. Some CO2-derived polymer production is
currently on operation, but the potential market is still relatively small. Highest potential
for CO2-derived polymer production lies in polymer plants that can be modified to use
CO2 as feedstock and in areas where cost of fossil sources used in polymer production is
high. (IEA 2019c.)

40
4 STATE-OF-THE-ART AND EMERGING POST-COMBUSTION
CARBON CAPTURE TECHNOLOGIES
In this chapter various methods of carbon capture and some of the most promising
technologies are reviewed. The reviews include rough operational description, current
state of the technology and techno-economic performance properties like energy
consumption, capture rate and capture cost. Maturity of the technologies is evaluated by
using Technology Readiness Level (TRL). The TRL scale is presented in Table 4.1.
Table 4.1. Technology Readiness Level scale. (IEAGHG 2019a.)
State of technology TRL Description
Demonstration 9 Normal commercial service
8 Commercial demonstration, full-scale deployment in final form
7 Sub-scale demonstration, fully functional prototype
Development 6 Fully integrated pilot tested in relevant environment
5 Sub-system validation in relevant environment
4 System validation in laboratory experiment
Research 3 Proof-of-concept tests, component level
2 Formulation of the application
1 Basic principles observed, initial concept
In addition to the technologies addressed in the literature review of this study, there are
numerous of other technologies currently under research and development. The reviewed
technologies are chosen due to being among the most mature representatives of various
carbon capture methods with ongoing development and upcoming demonstration
projects. Also, most of these technologies have at least some demonstration experience
in realistic conditions, meaning that their techno-economic performance and potential can
be assessed with some realistic basis.
4.1 Liquid absorbents
Carbon capture via liquid absorbents is currently the most mature capture method
available. These technologies are based on absorption/desorption process where CO2
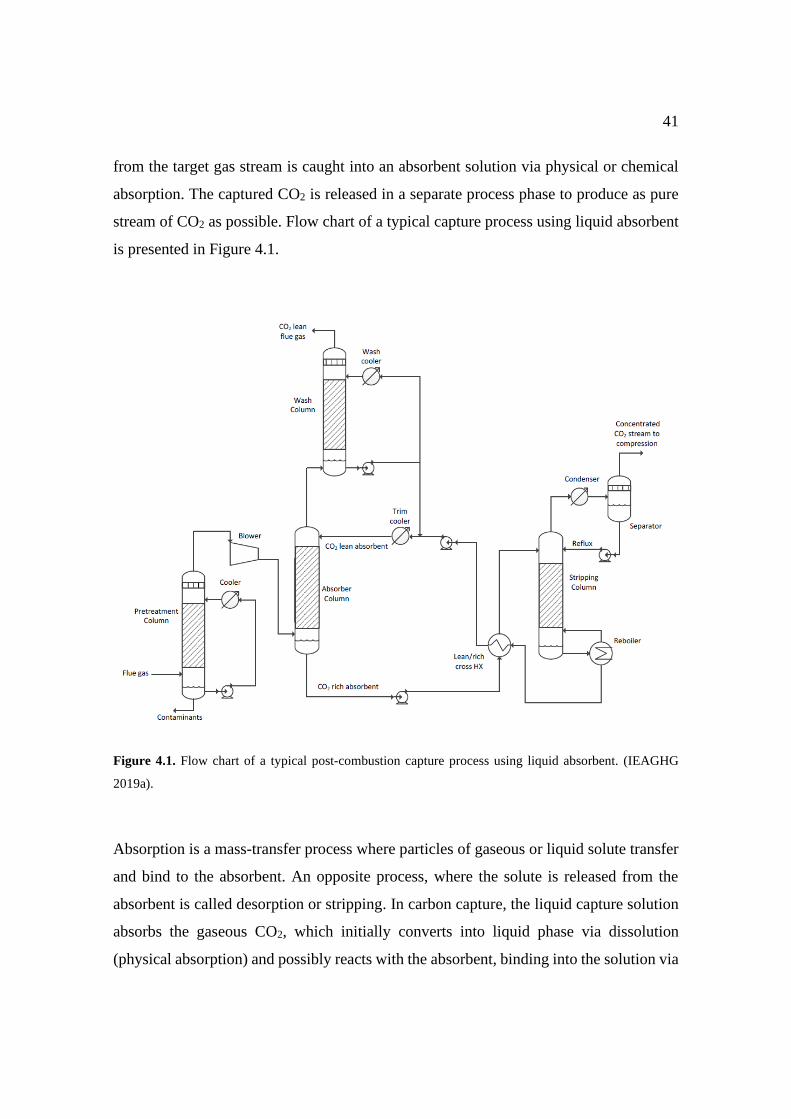
41
from the target gas stream is caught into an absorbent solution via physical or chemical
absorption. The captured CO2 is released in a separate process phase to produce as pure
stream of CO2 as possible. Flow chart of a typical capture process using liquid absorbent
is presented in Figure 4.1.
Figure 4.1. Flow chart of a typical post-combustion capture process using liquid absorbent. (IEAGHG
2019a).
Absorption is a mass-transfer process where particles of gaseous or liquid solute transfer
and bind to the absorbent. An opposite process, where the solute is released from the
absorbent is called desorption or stripping. In carbon capture, the liquid capture solution
absorbs the gaseous CO2, which initially converts into liquid phase via dissolution
(physical absorption) and possibly reacts with the absorbent, binding into the solution via

42
chemical bonds (chemical absorption). Capture technologies based on absorption require
a separate regeneration process phase to strip the CO2 from the solution. The solution is
typically regenerated in high temperature or low pressure to release the absorbed the CO2,
which can then be captured as a relatively pure stream. Regeneration also allows the
absorbent solution to be recycled in the process, although some of it might degrade,
meaning that some additive absorbent must be added to the process. (Wilcox 2012.)
Regeneration is generally very energy-intensive since it requires heating of large solution
volumes, which is significant disadvantage of absorption-based capture since it vastly
decreases the energy efficiency of the facility, increases capture costs, and often also
requires large-sized equipment for the large solution flows.
Various absorbents with diverse properties have been researched for carbon capture
purposes, mainly for post-combustion capture applications. However, many of the
absorbents are also applicable for pre-combustion capture. The most mature and
promising liquid absorbents are reviewed below.
4.2 Amine-based liquid absorbents
The most mature liquid absorbents are currently based on amines, which are nitrogen-
containing organic compounds considered as derivatives of ammonia. Amines have
suitable properties for catch-and-release type of capture, such as good reversibility and
fast transfer kinetics. However, amine absorbents face challenges such as high energy-
intensity, corrosivity, volatility and sensitivity to impurities. Amine-based absorbents
generally release some amine emissions, which result in formation of toxic and harmful
compounds, such as nitrosamines and nitramines (Karl et al. 2011). To lower the amount
of these harmful emissions emission limits are being introduced for carbon capture
facilities, as has been done, for instance, in Norway (CLIMIT 2020). Various amines and
amine blends have been researched for carbon capture purposes, of which the most mature
and potential ones are reviewed below.
43
4.2.1 MEA
The most mature and well-known liquid absorbent is a primary amine called
monoethanolamine (MEA), which has been proven feasible in commercial-scale carbon
capture, achieving a TRL of 9. For a long time, MEA was considered as the state-of-the-
art technology for carbon capture, but in recent studies it has been displaced it with
emerging technologies that reach better techno-economic performance, such as the
PZ+AMP solution (IEAGHG 2019a). Due to the long-term state-of-the-art status, MEA
has often been used as benchmark technology to evaluate the performance of emerging
technologies. This may however change in future research, since MEA is no longer
considered as state-of-the-art technology.
Advantages of MEA include fast reactivity, high loading capacity and suitability to
applications with low CO2 concentration. Challenges include high energy-intensity, high
corrosivity, solvent degradation and degradation-derived amine emissions. (Bui et al.
2018.) In addition, the production of MEA from ammonia is energy-intensive and causes
direct and indirect CO2 emissions (Luis 2015). Due to the significant disadvantages of
MEA, a lot of research has been conducted aiming to find alternative technologies with
better techno-economic performance.
A typical benchmark MEA solution contains 30 wt. % MEA and 70 wt. % water.
Inhibitors can be used to decrease harmful properties like corrosivity and volatility. MEA
reacts with CO2 via chemical absorption to form relatively stable carbamates. Absorption
occurs at atmospheric pressure and a temperature of 40–60 °C (Ziaii et al. 2009).
Regeneration is typically done with hot steam at a temperature of 120–140 °C and a
pressure of 1–2 bar, which is highly energy-intensive (McGurk et al. 2017). Reboiler duty
for a conventional 30 wt. % MEA process with a 90 % capture rate is typically around
3.6–4.0 GJ/tCO2 (Bui et al. 2018), whereas more advanced formulations, such as Fluor’s
EFG+ process, can reach lower reboiler duties at around 3.3–3.7 GJ/tCO2 (Svendsen
2014). Due to the high-energy intensity of conventional steam-regeneration alternative
methods, such as microwave-swing regeneration (MSR), have been proposed. MSR could

44
improve rate of regeneration, decrease energy-intensity (regeneration at 70–90 °C) and
reduce corrosion, solvent degradation, and equipment size. (McGurk et al. 2017.)
MEA degrades via carbamate polymerization and oxidative and thermal degradation,
meaning that some additive solvent is generally needed. According to Chapel et al. (1999)
amine consumption in conventional post-combustion capture process is around
1.6 kg/tCO2. Thorough flue gas cleaning is required due to sensitivity of MEA to
impurities. NOx causes MEA to degrade into a secondary amine, diethanolamine (DEA),
which further reacts to form harmful nitrosamines and nitramines (Fostås et al. 2011). At
some levels SO2 can even inhibit oxidative degradation of MEA, but thermal degradation
is significantly increased since sulphites promote the formation of ammonia through
degradation (Zhou et al. 2013). Presence of oxygen also increases oxidative degradation
of MEA (Chi & Rochelle 2002).
Based on data collected from related literature, IEAGHG (2019a) estimates that capture
costs for MEA-based capture processes are around 44 €/tCO2 in coal-firing and 64 €/tCO2
in gas-firing.
4.2.2 EFG+ by Fluor
One of the developers of MEA-based carbon capture is Fluor with their post-combustion
applicable Econamine FG Plus (EFG+) technology. The precursory Econamine FG
process was based on a 30 wt. % MEA solution together with some corrosion resistant
inhibitors (Chapel et al. 1999). The more advanced EFG+ process uses an advanced
solvent formulation, with MEA still being the base absorbent. EFG+ can use higher amine
concentrations together with corrosion and degradation resistant inhibitors, resulting in
faster reaction rate and higher loading capacity. (Reddy et al. 2003.) Typical reboiler duty
for the EFG+ process is 3.3–3.7 GJ/tCO2, while reaching high CO2 purity (>99.8 %)
(GCCSI in Svendsen 2014). The process is suitable for multiple applications such as
power plants, refineries, and chemical applications. It has been demonstrated at several
45
commercial applications for nearly 20 years, with 27 licensed plants currently in
commercial operation. (Fluor 2020.)
4.2.3 PZ + AMP
One of the most potential challengers for MEA is an aqueous amine blend consisting of
piperazine (PZ) and 2-amino-2-methyl-1-propanol (AMP). PZ is an advanced amine that
has high loading capacity and fast absorption rate, whereas AMP is a sterically hindered
amine, which when reacting with CO2 forms unstable carbamates that require only low
regeneration energy (Bougie & Iliuta 2012). IEAGHG (2019a) chose PZ+AMP as their
state-of-the-art technology of carbon capture as it reached the highest techno-economic
performance off all the capture technologies assessed in their study regarding emerging
carbon capture technologies. Their benchmark solution consists of a 40 wt. % PZ+AMP
blend with 1:2 molar ratio. The technology currently reaches a TRL of 6, having been
demonstrated at pilot-scale, while still lacking large-scale industrial demonstration.
Compared to MEA, PZ+AMP has lower energy requirement, cost, and degradation rate.
By adjusting the PZ/AMP ratio, the process can be shifted to favour faster mass transfer
(larger ratio) or lower reboiler duty (smaller ratio) (Khan et al. 2015). PZ+AMP also faces
the challenge of solvent degradation resulting in harmful amine emissions.
In an experimental study based on a PZ/AMP capture process with synthetic flue gases,
Spietz et al. (2020) evaluated the amine emission levels in the treated flue gas and in the
produced CO2. The major contaminants in the treated flue gas were ammonia (6–8 ppm)
and AMP (9–13 ppm), whereas the product CO2 contained AMP (7 ppm), ammonia (3–
5 ppm) and formic acid (2 ppm). The amine emissions significantly increased with higher
temperature lean solvent and during the absence of make-up water in the absorber.
In a pilot-scale study Rabensteiner et al. (2016) calculated a reboiler duty of 3.15 GJ/tCO2
for a 17/28 wt. % PZ/AMP solution used in post-combustion capture in coal-firing. Based
on simulations IEAGHG (2019a) calculated a reboiler duty of 2.46 GJ/tCO2 for a
PZ+AMP-based post-combustion capture in an ultra-supercritical pulverized coal plant.
46
Based on data collected from related literature, IEAGHG (2019a) estimates that capture
costs for PZ+AMP-based capture are 34 €/tCO2 in coal-firing and 56 €/tCO2 in gas-firing.
IEAGHG updated PZ+AMP as their state-of-the-art representative of carbon capture
technology due to reaching better techno-economic performance than their previous state-
of-the-art technology, MEA. There are currently no commercial developers for a
PZ+AMP -based carbon capture technology.
4.2.4 KS-1 & KS-21 by MHI
KS-1 and KS-21 are advanced amine capture solvents based on sterically hindered
amines. The solvents are developed by Mitsubishi Heavy Industries (MHI) together with
The Kansai Electric Power Company (KEPCO) for their KM CDR -capture process
suitable for various flue gas applications. KS-1 is an earlier version of the two and it has
been proven commercially viable (TRL 9). KS-21 is an advanced version developed to
achieve better techno-economic performance than its earlier counterpart and it has been
demonstrated at small industrial scale (TRL 7).
Compared to MEA, KS-1 has lower regeneration energy, higher loading capacity and
lower degradation rate and corrosivity. Loading capacity is up to 40 % higher, meaning
that the solvent circulation rate is lower, which also reduces equipment size and capital
costs. (Iijima 2005.) Reboiler duty is estimated to be 2.6 GJ/tCO2. The solvent suffers
from amine losses mainly caused by thermal degradation, but at around 0.35 kg/tCO2 the
amine consumption is still significantly lower than with MEA. (Yagi et al. in IEAGHG
2019a.) KS-1 has been demonstrated and proven commercially viable together with
MHI’s KM CDR -capture process. The process is used, for instance, in the Petra Nova
project at coal-fired W.A. Parish power plant located in Texas, where of 4776 tonnes of
CO2 per day is captured with a capture rate of 90 %. (MHI n.d.)
KS-21 is an advanced version of the KS-1 aiming to reduce the amine losses to increase
the overall techno-economic performance of the KM-CDR capture process. Both solvents
were demonstrated in preliminary piloting at KEPCO’s gas-fired Nanko Pilot Plant

47
capturing 2 tonnes of CO2 a day with a 90 % capture rate. KS-21 performed better than
KS-1 in volatility, thermal degradation rate, oxidation rate, heat of absorption and cost. It
reached 50 % lower amine emissions levels, while still reaching equal capture
performance as KS-1. However, a higher solvent rate was required to achieve an equal
capture rate, though the reboiler duty remained similar to its predecessor. (Tanaka et al.
2018.)
Small industrial scale (25 MW) demonstration with the KM-CDR process and both
solvents was conducted at the coal-fired Plant Barry Power Station in Alabama, U.S.
Fluor’s MEA-based Econamine FG+ process was used for benchmarking. With a capture
rate of 90 %, 500 tonnes of CO2 per day was captured. Following capture costs were
achieved: $66.4/tCO2 for EFG+; $58.8/tCO2 for KS-1; $56.0/tCO2 for KS-21; and
$54.8/tCO2 for KS-21 with auxiliary turbine. (Carroll 2017.)
Starting from autumn of 2020 both solvents will be demonstrated in a biomass-firing at
Drax Power Station in UK, aiming to capture around 300 tCO2/d (MHI 2020). Successful
demonstration at Drax will advance the TRL of KS-21 to 7–8.
4.2.5 CANSOLV by Shell
Shell’s CANSOLV process represents another amine-based post-combustion capture
process that has reached commercial status (TRL 9). In addition to CO2 recovery, the
process can recover SO2 emissions as a useful by-product (e.g., as sulphuric acid or liquid
SO2). Shell has researched multiple solvents for the CANSOLV process, such as the DC-
103, which is a 50 wt. % aqueous amine blend formulation. In commercial-scale operation
(120 tCO2/d) the DC-103 has reached an average capture rate of 90 %, while producing
high purity CO2 (>99.75 %). A steam demand worth of 2.3 GJ/tCO2 was required for
solvent regeneration. (Singh & Stéphenne 2014.) The process is in operation at the coal-
fired Boundary Dam power station located in Saskatchewan, Canada, with an annual
capture capacity of 1 Mt of CO2. The captured CO2 is mainly utilized in enhanced oil
recovery. (Shell 2020.)

48
4.3 Multi-phase absorbents
Multi-phase absorbents (or phase-separating absorbents) go through a phase change upon
certain amount of loading in absorption. When entering the absorber, the CO2-lean
solvent is at liquid phase but during absorption the solvent can form a separate immiscible
liquid phase or precipitate into a solid phase. Due to phase difference between the CO2-
lean solvent and the CO2-rich solvent, they can be easily separated, which reduces the
high regeneration volumes that are characteristic to liquid absorbents. Multi-phase
absorbents can be categorized into liquid-solid and liquid-liquid phase separating
absorbents. (Bui et al. 2018.) Solid formation complicates the process and requires a
specific solid handling system, such as hydrocyclone separator. However, multi-phase
absorbents can also be operated in non-solid mode, where unwanted solid formation is
avoided by adjusting the process conditions and/or sorbent concentration. Non-solid
mode is often desired due to simplicity. Development of multi-phase absorbents has
mainly focused on post-combustion applications.
4.3.1 Aqueous ammonia (NH3)
Ammonia-based solvents are one of the most mature multi-phase absorbents. Ammonia
reacts with CO2 to form ammonium and bicarbonate ions, which further react to form
compounds such as ammonium carbamates, carbonates, and bicarbonates. Depending on
the process conditions, the solvent may precipitate and form a slurry during absorption.
Precipitation can be avoided with low ammonia concentration or high temperature
conditions, which in turn reduces absorption capacity. Aqueous ammonia capture has
several advantages: common and low-cost solvent chemical, non-corrosive process, good
absorption capacity and a low reboiler duty of 2–3 GJ/tCO2. Ammonia can also capture
NOx and SOx emissions by forming ammonium sulphate and ammonium nitrate, which
can be recovered and utilized, e.g., in fertilizing. Challenges of ammonia-based capture
include a risk of unwanted precipitation and high volatility, which causes solvent losses
and harmful ammonia emissions via ammonia slip. (Yang et al. 2014.) Higher ammonia
concentrations result in better capture rate but also in higher ammonia slip and
49
precipitation. Ammonia slip can be reduced with a low absorption temperature, which in
turn increases precipitation. (Versteeg & Rubin 2011.)
CSIRO conducted a pilot-scale demonstration for post-combustion capture using aqueous
ammonia solvent at the Munmorah black coal fired power station located in Australia.
Even with low ammonia concentrations (up to 6 wt. %) a capture rate of 85 % with high
CO2 purity (99–100 %) was achieved, while also removing over 95 % of the SO2
emissions. (Yu et al. 2012.)
According to a model-based techno-economic assessment by Li et al. (2016), an advanced
aqueous ammonia post-combustion capture process can reach capture cost of $53/tCO2
in coal-firing (vs. MEA $75/tCO2). Reboiler duty of the process was calculated at
2.46 GJ/tCO2 and ammonia emissions after the wash column at 15 ppmv.
4.3.2 Chilled Ammonia Process by GE
GE (formerly Alstom) has aimed to advance aqueous ammonia capture with their Chilled
Ammonia Process (CAP). By cooling the aqueous ammonia solvent to a temperature of
0–10 °C solubility of ammonia to water can be improved, which improves CO2 absorption
capacity since the solvent can contain more ammonia. Cooling also reduces ammonia
vaporization thus lowering the harmful ammonia slip. Due to the low temperature the
solvent precipitates in lower loading compared to non-chilled process. GE has researched
both solid-mode and non-solid mode CAP processes. GE has successfully demonstrated
the process in several pilot-scale applications (TRL 6), such as with synthetic gases and
flue gases from coal-, gas- and oil-firing. (Augustsson et al. 2017.)
One of the demonstration projects was conducted at AEP’s Mountaineer coal-fired power
plant for a flue gas feed flow of ~84 t/h. The process reached a capture rate of 65–85 %
and resulted in a feed of very high purity CO2 (>99.9 %). CAP caused a 9.5 %-point loss
on power generation efficiency and a 59 $/MWh increase in the LCOE, nearly doubling
50
the LCOE compared to non-CCS operation. Reboiler duty of 2.8 GJ/tCO2 was measured
for the process. However, the process was initially designed for solid-mode operation but
was operated in non-solid mode, which significantly impacted the measured energy
consumption. A corrected reboiler duty, taking into account the effect of non-solid
operation in solid mode design, was calculated at 2.2 GJ/tCO2. Ammonia emissions
remained under 10 ppmv. (Augustsson et al. 2017.) There are currently no plans for future
demonstration.
4.3.3 UNO MK 3 by CO2CRC
CO2CRC has developed a precipitating UNO MK 3 process based on an aqueous
potassium carbonate (K2CO3) absorbent, aiming to reach a 90 % capture rate in pre- and
post-combustion applications. Aqueous potassium carbonate has several advantages as a
CO2 capture absorbent: low regeneration energy (2.0–2.5 GJ/tCO2); low volatility and
corrosivity; non-toxic sorbent; good oxidative degradation resistance; applicability to
high absorption temperatures; and ability to capture also SOx and NOx emissions
(Mumford al. 2015; Smith et al. 2014). SOx and NOx emissions react with K2CO3 to form
potassium sulphate (K2SO4) and potassium nitrate (KNO3), which can be recovered and
utilized as fertilizers (UNO 2014). Biggest disadvantage of the process is the slow
reaction rate, which can be improved by using catalysts or promoters, such as boric acid,
amines or amino acids (Hu et al. 2016). With unpromoted solvent the capture rate remains
low at around 20–25 % (Mumford et al. 2012).
CO2CRC has successfully demonstrated the process in laboratory-conditions and at pilot-
scale, thus achieving a TRL of 6. Pilot-scale demonstration was conducted at the coal-
fired Hazelwood Power Station located in Australia, capturing 1 tCO2/d from the plant’s
flue gases. With an unpromoted solvent containing 20−40 wt.-% of K2CO3, a CO2
removal efficiency of only 5–15 % was achieved. (Smith et al. 2014.) In more recent
pilot-scale experiments Smith et al. (2017) reached capture rates of 10–50 % by using a
promoted K2CO3 solvent. With high solvent concentration (45 wt. %) the process faced

51
some difficulties such as absorber flooding and blockages due to solvent foaming and
precipitation.
UNO Technology Ltd. has scaled-up the process, aiming for full commercial scale
operation. The company estimates the capture cost for the UNO MK 3 process to be
around $60 AUD (≈$45 USD) per CO2 tonne. (UNO 2014.) Uno Technology is among
the partners of 8 Rivers, which received funding from U.S. DOE to develop emerging
carbon capture technologies. The companies have preliminary plans to retrofit and
demonstrate the UNO MK 3 process in natural gas power generators. (UNO 2020.)
4.3.4 Hot-CAP by the University of Illinois
Hot carbonate processes use a solution of concentrated carbonate salt (e.g., K2CO3) at an
elevated temperature to chemically absorb CO2, and possibly SO2. Hot carbonate
processes have been used in several industries to remove CO2 from various industrial
gases (Chapel et al. 1999), but in carbon capture it is still a relatively novel technology.
Lu et al. (2014) from the University of Illinois are one of the developers of hot carbonate
-based capture with their Hot-CAP process. Hot-CAP is a hot potassium carbonate
capture process that utilizes sorbent crystallization and high-pressure stripping.
Absorption takes place at atmospheric pressure and a temperature of 60–80 °C. After
absorption, the solution is cooled to ~35 °C and led to a crystallization reactor, where
solid potassium bicarbonate (KHCO3) crystals are filtered to produce a bicarbonate slurry.
The CO2-rich bicarbonate slurry is then led to a high-pressure stripper, where desorption
occurs at a temperature of 140–200 °C and a pressure of 6–40 bar. Lowest reboiler duties
are achieved with high stripping temperature, high carbonate concentration and high
carbonate-to-bicarbonate rate. With solutions of 30–50 wt.-% K2CO3 concentration and
80 % carbonate-to-bicarbonate rate, reboiler duties around 1.8 GJ/tCO2 have been
achieved in bench-scale evaluations. Advantages of Hot-CAP process are low-cost and
non-degradable solvent, low volatility and corrosivity, and possibility for high
temperature desorption. Challenges include slow absorption rate, unfavourably low

52
desorption pressure of KHCO3 of <10 bar (high stripping pressure reduces the required
stripping heat), handling of the slurry regarding fast cooling demand and possible fouling,
and availability of strippers suitable for handling slurry at high pressures.
In their laboratory- and bench-scale techno-economic analysis Lu et al. (2014) calculated
an LCOE of $120/MWh for a Hot-CAP process including transportation and storage,
causing a 60 % LCOE increase compared to non-CCS operation (c.f. MEA $139/MWh
& 85 % increase). The process lacks demonstration in relevant environment and currently
reaches only a TRL of 4. Further demonstration has not been planned.
4.3.5 Hot Potassium Carbonate process by Stockholm Exergi
Starting from the autumn of 2019, a Hot Potassium Carbonate technology has been under
demonstration in post-combustion capture at Stockholm Exergi’s biomass-fired KVV8
unit, located in Värtan, Sweden. The technology is based on a Sargas process, which is a
simplified version of a Benfield process developed to remove acidic compounds (e.g.,
CO2 and H2S) from various industrial gases. The HPC process configuration is relatively
simple: compressed flue gas is led to an absorber where CO2 and H2O react with hot
potassium carbonate solvent to form bicarbonate. The bicarbonate is led to an
unpressurized desorber column where it regenerates back to carbonate releasing the CO2
and the H2O. The carbonate is then circulated back to absorption after energy recovery.
Previously, the technology has been commercially operated in Stockholm at a gas refinery
from 1971 to 2011. It has also been trialled in pilot-scale carbon capture operation with
coal-fired flue gases at a CHP-plant in Värtan during 2007–2008. (Levihn et al. 2019.)
The technology is at commercial level in industrial gas purification processes, but in
carbon capture HPC has been demonstrated only at pilot-scale (TRL 6).
In the demonstration project at Värtan, around 700 kg of CO2 is captured per day, while
expectedly reaching a capture rate of 80–95 %. The programme includes practical tests,
simulations, and a feasibility study to evaluate possibilities for larger scale carbon capture
operation at Värtan. The company estimates that CO2 capture cost at Värtan, including

53
capture, treatment, and storage, is around 100 € (1000 SEK) per CO2 tonne. (Bioenergy
International 2019b; Nohrstedt 2019.) Full-scale carbon capture operation at Värtan could
be achieved by 2025 (Stiernstedt 2019).
4.3.6 DMX by IFPEN
DMX, which is based on 1, 3-dipropyl-7-methylxanthine, is a liquid-liquid phase
separating process developed by IFPEN for post-combustion capture applications. Upon
absorption the solvent divides into two immiscible liquid phases, of which the CO2-rich
phase is separated and led to regeneration. Advantages of the process are high absorption
capacity (0.1–1 molCO2/molsolvent), low regeneration energy (<2.5 GJ/tCO2), high
degradation resistance, non-corrosive solvent, and low operation costs compared to
conventional processes. (Broutin et al. 2017.)
The DMX process has been evaluated as a part of IFPEN’s OCTAVIUS (Broutin et al.
2017) and VALORCO (Dreillard et al. 2017) projects in mini-pilot facilities, where it has
showed good promise with flue gases from coal-firing and from blast furnace processes.
In IFPEN’s OCTAVIUS project (Broutin et al. 2017), where DMX process was used to
capture CO2 from coal-firing flue gases at mini-pilot scale, a capture cost of 42.6 €/tCO2
was reached. The process caused an efficiency loss of 9.3 %-points. DMX outperformed
MEA-based capture, which reached a capture cost of 56.5 €/tCO2. Based on data collected
from related literature, IEAGHG (2019a) estimates a capture cost of 39 €/tCO2 for DMX
capture in coal-firing.
As part of the European 3D project DMX is currently being demonstrated at industrial
scale capturing 0.5 tCO2/hr from blast furnace exhaust gases at Dunkirk, France (Broutin
et al 2018; IFPEN 2019). TRL of the process is currently at 4–5 (IEAGHG 2019a),
increasing to 7 after successful demonstration at Dunkirk.
54
4.4 Water-lean solvents
Water-lean (or non-aqueous) solvents have been developed to reduce the high energy-
intensity that is characteristic to conventional aqueous solvents. This high energy-
intensity is a result of regeneration of large volume flows that mainly consist of water.
By using solvents that have lower specific heat values than water the amount of
regeneration energy can be reduced. (Heldebrandt et al. 2017). The principle of operation
with water-lean absorbents is otherwise same as with other liquid absorbent capture
processes. The most advanced water-lean solvents are mainly based on organic liquids
and amine blends. IEAGHG (2019a) estimates that the TRL of water-lean solvents is
currently at 5, while having an upward development trajectory and a medium (10–30 %)
LCOE reduction potential compared to benchmark 30 wt. % MEA capture.
4.4.1 eCO2Sol by RTI
The eCO2Sol (researched under the name NAS) is a novel non-aqueous solvent
developed by the Research Triangle Institute (RTI) for post-combustion applications. RTI
has researched multiple non-aqueous solvent formations, mainly based on hydrophobic
diluents and sterically hindered amine blends. Advantages of the process are low
regeneration energy requirement (potentially 2.0 GJ/tCO2), high stability, high loading
capacity, and low corrosivity. (Zhou et al. 2018; RTI 2020.) Characteristic to all amine
containing solvents, the solvent-based amine emissions present a challenge that must be
overcome in the pursuit of further technology scale-up (Tanthana et al. 2018).
NAS-5 formulation of the solvent was demonstrated at small pilot-scale at 250 kW coal-
fired Tiller pilot plant. For a capture rate of 90 % an L/G ratio of 2.5 was found to be the
most optimal, resulting in a reboiler duty of 2.3 GJ/tCO2. Properties of very low
corrosivity and low volatility were also measured for the solvent. (Zhou et al. 2018.) Other
pilot-scale demonstration was conducted at the NCCC where 1 tCO2/d was captured from
coal-fired flue gases (RTI 2020). In bench-scale evaluation, a precursory formulation of
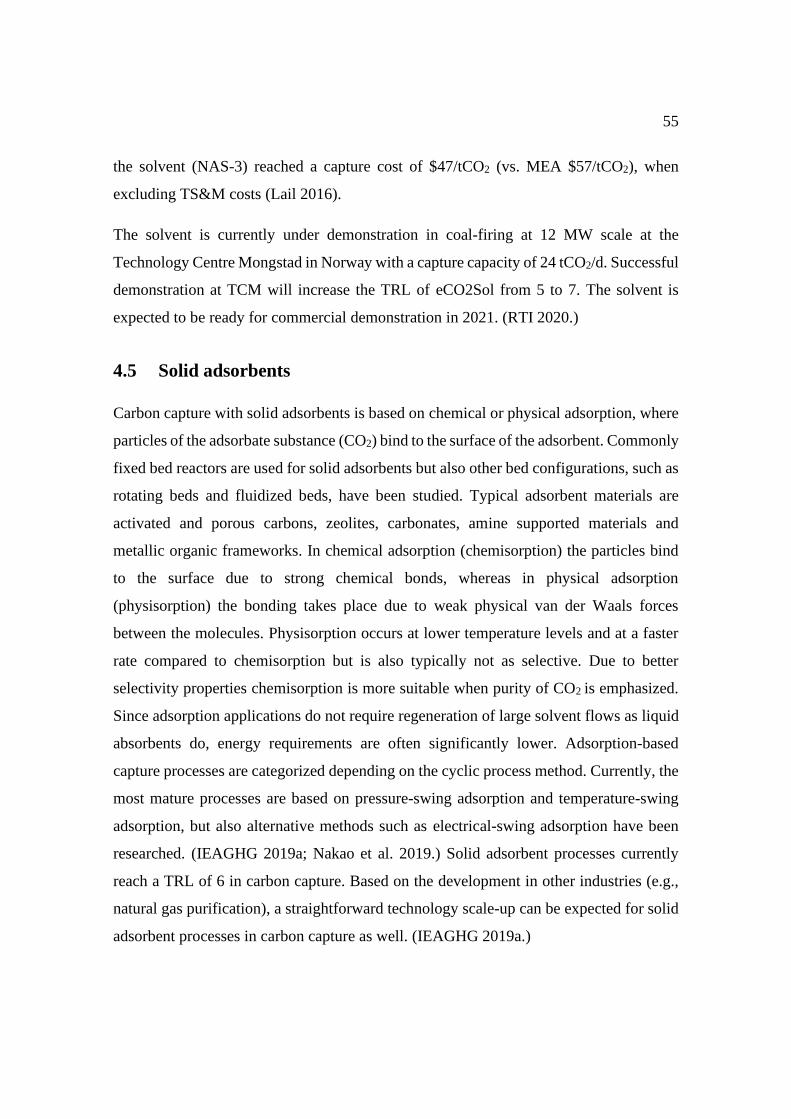
55
the solvent (NAS-3) reached a capture cost of $47/tCO2 (vs. MEA $57/tCO2), when
excluding TS&M costs (Lail 2016).
The solvent is currently under demonstration in coal-firing at 12 MW scale at the
Technology Centre Mongstad in Norway with a capture capacity of 24 tCO2/d. Successful
demonstration at TCM will increase the TRL of eCO2Sol from 5 to 7. The solvent is
expected to be ready for commercial demonstration in 2021. (RTI 2020.)
4.5 Solid adsorbents
Carbon capture with solid adsorbents is based on chemical or physical adsorption, where
particles of the adsorbate substance (CO2) bind to the surface of the adsorbent. Commonly
fixed bed reactors are used for solid adsorbents but also other bed configurations, such as
rotating beds and fluidized beds, have been studied. Typical adsorbent materials are
activated and porous carbons, zeolites, carbonates, amine supported materials and
metallic organic frameworks. In chemical adsorption (chemisorption) the particles bind
to the surface due to strong chemical bonds, whereas in physical adsorption
(physisorption) the bonding takes place due to weak physical van der Waals forces
between the molecules. Physisorption occurs at lower temperature levels and at a faster
rate compared to chemisorption but is also typically not as selective. Due to better
selectivity properties chemisorption is more suitable when purity of CO2 is emphasized.
Since adsorption applications do not require regeneration of large solvent flows as liquid
absorbents do, energy requirements are often significantly lower. Adsorption-based
capture processes are categorized depending on the cyclic process method. Currently, the
most mature processes are based on pressure-swing adsorption and temperature-swing
adsorption, but also alternative methods such as electrical-swing adsorption have been
researched. (IEAGHG 2019a; Nakao et al. 2019.) Solid adsorbent processes currently
reach a TRL of 6 in carbon capture. Based on the development in other industries (e.g.,
natural gas purification), a straightforward technology scale-up can be expected for solid
adsorbent processes in carbon capture as well. (IEAGHG 2019a.)

56
4.6 Pressure-swing adsorption
Pressure-swing adsorption (PSA) processes use a pressure difference as a driving force
of adsorbent regeneration, meaning that the CO2 is released from the sorbent via pressure
reduction. PSA can offer rapid and low-energy regeneration for physisorption
applications, where weak physical binding forces occur and only low regeneration energy
is needed. However, typically two or more adsorption/desorption cycles are required to
achieve high (>95 %) CO2 purity. (IEAGHG 2019a.) Pressure-difference is typically
generated by pressurising the feed-side gas, but also outlet-side vacuum can be used as a
driving force of desorption, in which case the process is referred to as vacuum-swing
adsorption (VSA). Single stage VSA process would however require high vacuum levels
to reach high CO2 purity. By combining pressurised feed-side gas and outlet-side vacuum,
a more efficient but also costly VPSA cycle can be created. In post-combustion capture
the chances of PSA/VSA limit to small scale applications (<50 MW) due to the weak
scalability of the fixed bed processes. Higher potential lies in processes with high CO2
concentrations and smaller flow rates, such as in IGCC’s and in various industrial
processes like in cement and refinery industries. (Bui et al. 2018.) In PSA pilots with coal
flue gases, mostly utilizing zeolite sorbents, reboiler duties of >2.3 GJ/tCO2 have been
achieved. Development of PSA has not reached industrial scale, but some pilot-scale
demonstration has been conducted, indicating that PSA processes have reached a TRL of
6. (IEAGHG 2019a.) Some demonstration experiments based on pressure-swing
adsorption are reviewed below.
4.6.1 13X VSA by the National University of Singapore
Krishnamurthy et al. (2014) from the National University of Singapore conducted a pilot
plant study for a vacuum-swing adsorption process by using synthetic flue gases with a
CO2 concentration of 15 %. Adsorption took place in columns packed with zeolite-based
13X adsorbent developed by Zeochem. With a single-stage and four-step VSA cycle they
reached a capture rate of 86 % and CO2 purity of 96 %, whereas the energy consumption
of the system was measured at 472 kWh (=1.7 GJ) per CO2 tonne.

57
4.6.2 Rapid PSA by the University of South Carolina
Ritter et al. (2015) from the University of South Carolina conducted a bench-scale (TRL
5) techno-economic analysis for a rapid PSA process based on 13X adsorbent material.
The process can reach >90 % capture rate with >95 % CO2 purity. Cycle time is 30
seconds, which is significantly higher compared to conventional PSA processes with
~300 second cycle times. A capture cost of $39.7/tCO2 and a COE increase of 52.7 % was
calculated for the process.
4.7 Temperature-swing adsorption
Temperature-swing adsorption (TSA) processes utilize a temperature difference for
sorbent regeneration, meaning that the CO2 is released via temperature increase. TSA is
typically used in chemisorption applications due to the strong chemical bonding forces,
which require more regeneration energy. Compared to PSA, conventional TSA is more
energy-intensive and occurs at a slower rate. However, advanced TSA processes have
also been developed, such as the VeloxoTherm process reviewed below. (IEAGHG
2019a.) Conventional TSA processes take place in packed bed reactors, but fluidized bed
configurations with better mixing properties have been developed to speed up the process,
though also resulting in lower CO2 loadings on average (Bui et al. 2018).
4.7.1 VeloxoTherm by Svante
One of the leading developers of TSA is Svante (ex-Inventys) with their VeloxoTherm
capture process, which is an intensified rapid cycle temperature swing adsorption process
developed to reach a capture rate of 90 % in post-combustion applications. The process
consists of structured adsorbents fixed into a rotating frame, which is divided into
adsorption and regeneration zones. A full cycle of adsorption, regeneration and cooling
takes approximately 60 seconds, occurring at a rate 40–100 times faster than a
conventional TSA process. Regeneration is done by using low-pressure steam at a
temperature swing range of 40–110 °C. Regeneration energy requirement of the process
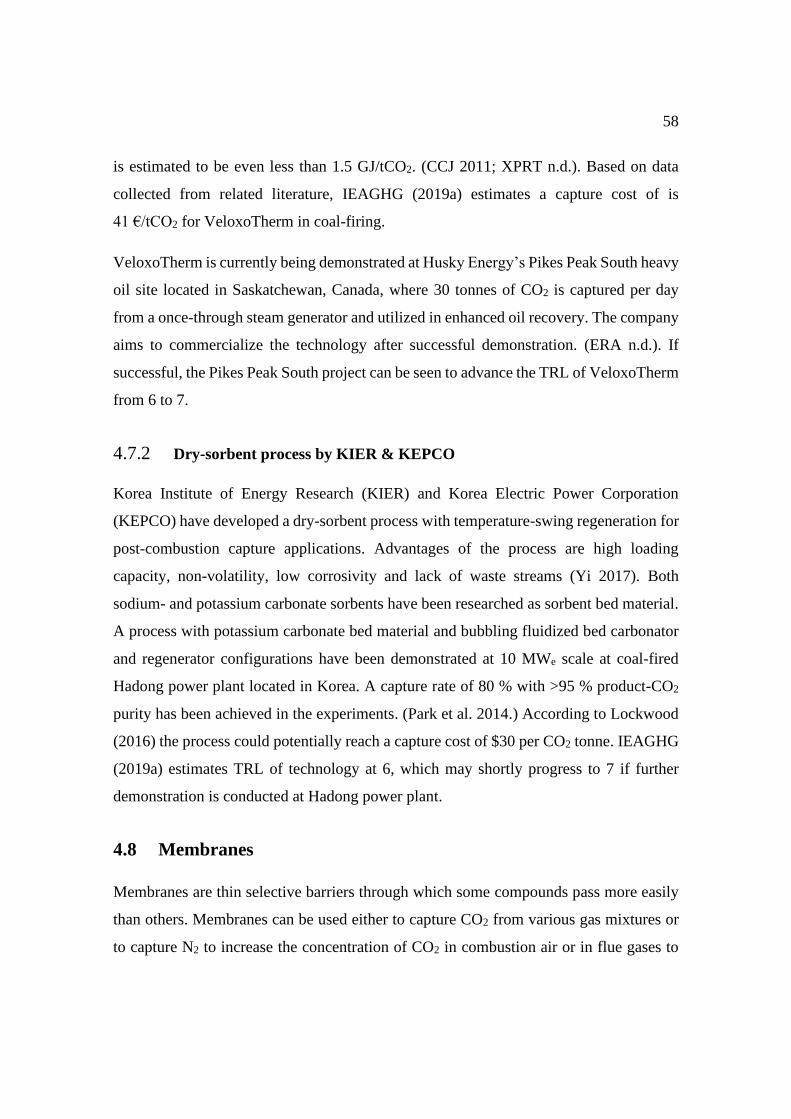
58
is estimated to be even less than 1.5 GJ/tCO2. (CCJ 2011; XPRT n.d.). Based on data
collected from related literature, IEAGHG (2019a) estimates a capture cost of is
41 €/tCO2 for VeloxoTherm in coal-firing.
VeloxoTherm is currently being demonstrated at Husky Energy’s Pikes Peak South heavy
oil site located in Saskatchewan, Canada, where 30 tonnes of CO2 is captured per day
from a once-through steam generator and utilized in enhanced oil recovery. The company
aims to commercialize the technology after successful demonstration. (ERA n.d.). If
successful, the Pikes Peak South project can be seen to advance the TRL of VeloxoTherm
from 6 to 7.
4.7.2 Dry-sorbent process by KIER & KEPCO
Korea Institute of Energy Research (KIER) and Korea Electric Power Corporation
(KEPCO) have developed a dry-sorbent process with temperature-swing regeneration for
post-combustion capture applications. Advantages of the process are high loading
capacity, non-volatility, low corrosivity and lack of waste streams (Yi 2017). Both
sodium- and potassium carbonate sorbents have been researched as sorbent bed material.
A process with potassium carbonate bed material and bubbling fluidized bed carbonator
and regenerator configurations have been demonstrated at 10 MWe scale at coal-fired
Hadong power plant located in Korea. A capture rate of 80 % with >95 % product-CO2
purity has been achieved in the experiments. (Park et al. 2014.) According to Lockwood
(2016) the process could potentially reach a capture cost of $30 per CO2 tonne. IEAGHG
(2019a) estimates TRL of technology at 6, which may shortly progress to 7 if further
demonstration is conducted at Hadong power plant.
4.8 Membranes
Membranes are thin selective barriers through which some compounds pass more easily
than others. Membranes can be used either to capture CO2 from various gas mixtures or
to capture N2 to increase the concentration of CO2 in combustion air or in flue gases to

59
facilitate the capture of CO2. Membrane capture has several advantages such as modular
and compact nature of the equipment, simplicity, lack of regeneration, waste streams and
phase changes, as well as low energy consumption. (Wilcox, 2012; IEAGHG 2019a.)
Nakao et al. (2019) consider membrane capture to be one of the most promising capture
technologies from the point of view of capital and operational costs.
The capture process is driven by a pressure difference over the membrane. The process is
more efficient when the pressure difference across the membrane is high, meaning that
with mixtures of low CO2-concentration (i.e., low partial pressure of CO2) the capture
process can be challenging. In combustion processes concentration of CO2 in the flue
gases is relatively low at around 3–15 %, which is problematic for sole membrane capture
systems. Post-combustion capture applications might have to utilize feed-side
compression, permeate-side vacuum pumping, and larger membrane areas to create
efficient capture in low-pressure flue gas conditions, which significantly increase capture
costs. (IEAGHG 2019a; Nakao et al. 2019.) To reduce costs in conditions where partial
pressure of CO2 is low, high membrane permeability should be preferred over high
selectivity (Nakao et al. 2019).
In pre-combustion capture applications, the concentration of CO2 in the syngas mixtures
is higher compared to combustion flue gases, making the capture conditions more
suitable. In high-pressure conditions there is no need for compressors or vacuum pumps,
which expectedly results in significant cost reductions compared to post-combustion
capture applications. In these conditions both permeability and selectivity of the
membrane should be focused upon. (Nakao et al. 2019.)
Several membrane materials are applicable for carbon capture, such as polymers,
microporous organic polymers, fixed site carrier membranes, mixed matrix membranes,
carbon molecular sieve membranes and inorganic membranes. Membrane material choice
depends on factors like capture conditions and desired operational properties, lifetime,
stability, and selectivity of the membrane. For example, polymer-based membranes
typically provide good separation performance with low cost but weak stability, which

60
means poor resistance to impurities and challenging conditions like high pressure and
temperature. Inorganic membranes are better at withstanding challenging conditions but
have more complex module construction and thus higher cost. (He 2018.)
4.8.1 Polaris membrane by MTR
MTR is one of the leading developers of membrane capture with their commercially
available high-permeable and CO2-selective Polaris membrane, suitable for pre- and post-
combustion processes. (MTR 2020a.) Material of the Polaris membrane is based on thin-
film composite polymer structures (Figueroa et al. 2008). Gen-1 Polaris membranes have
reached commercial-scale and have been used, for instance, in natural gas applications
and refineries. Gen-2 Polaris membranes are more permeable compared to Gen-1, which
reduces capital cost of the system since the required capture area is smaller. Gen-2
membranes have been demonstrated in several pilot-scale projects, for example at
National Carbon Capture Center at 1 MWe scale capturing 20 tCO2/d from coal-derived
flue gases. Development of Gen-3 membranes with even higher permeability is currently
at laboratory-scale. (Merkel 2018.)
Power requirement for a two-stage Gen-2 Polaris membrane post-combustion capture
with CO2 selective flue gas recycling is estimated to be as low as 277 kWh/tCO2
(= 1 GJ/tCO2) with a capture rate of 80 % (Baker et al. 2018). Based on data collected
from related literature, IEAGHG (2019a) estimate capture costs to be 47 €/tCO2 in coal-
firing and 80 €/tCO2 in gas-firing for MTR’s Polaris membranes. However, it is noted
that the calculations were done for a capture rate of 90 % in conditions of relatively low
CO2-concentration and that the cost benefits of membrane capture emerge in hybrid
processes, partial capture or combustion air enriching. (IEAGHG 2019a.) A capture cost
of 30 $/tCO2 is considered feasible for scaled-up Gen-2 membranes (Merkel 2018).
A large pilot-scale post-combustion capture project designed to capture 140 tonnes of
CO2 per day in coal-firing at Wyoming Integrated Test Center is currently underway. The
project aims to successfully operate a partial post-combustion capture process based on
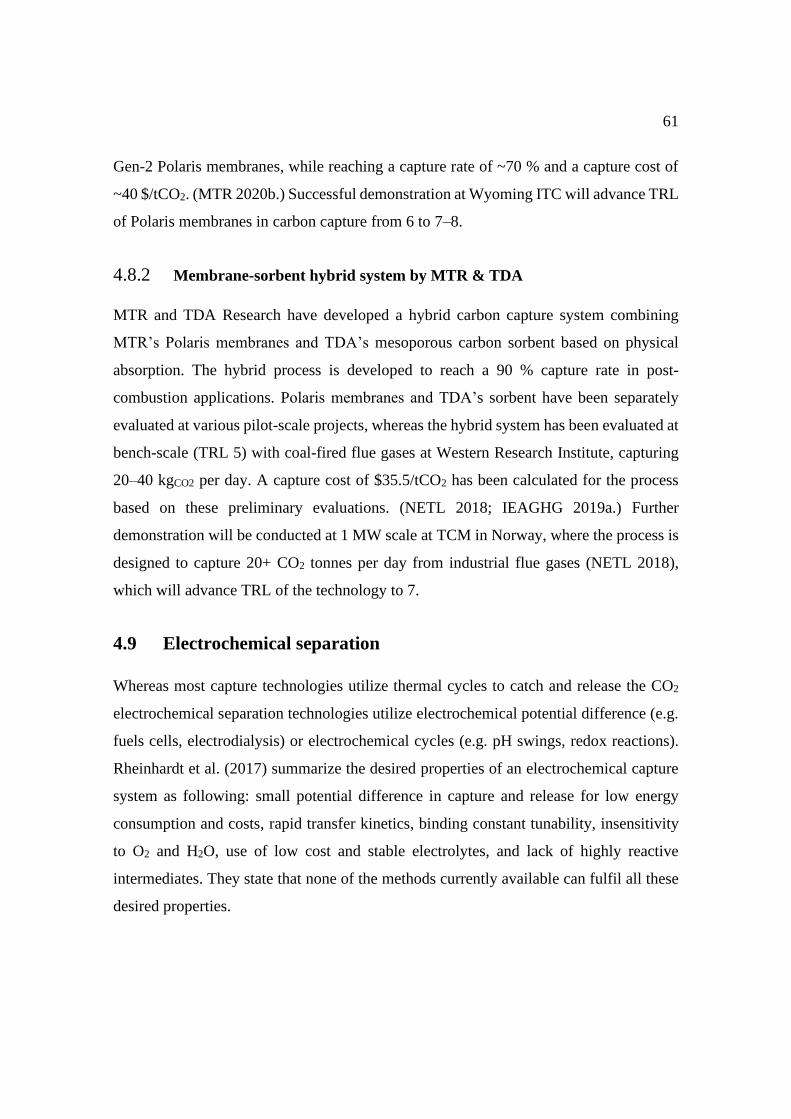
61
Gen-2 Polaris membranes, while reaching a capture rate of ~70 % and a capture cost of
~40 $/tCO2. (MTR 2020b.) Successful demonstration at Wyoming ITC will advance TRL
of Polaris membranes in carbon capture from 6 to 7–8.
4.8.2 Membrane-sorbent hybrid system by MTR & TDA
MTR and TDA Research have developed a hybrid carbon capture system combining
MTR’s Polaris membranes and TDA’s mesoporous carbon sorbent based on physical
absorption. The hybrid process is developed to reach a 90 % capture rate in post-
combustion applications. Polaris membranes and TDA’s sorbent have been separately
evaluated at various pilot-scale projects, whereas the hybrid system has been evaluated at
bench-scale (TRL 5) with coal-fired flue gases at Western Research Institute, capturing
20–40 kgCO2 per day. A capture cost of $35.5/tCO2 has been calculated for the process
based on these preliminary evaluations. (NETL 2018; IEAGHG 2019a.) Further
demonstration will be conducted at 1 MW scale at TCM in Norway, where the process is
designed to capture 20+ CO2 tonnes per day from industrial flue gases (NETL 2018),
which will advance TRL of the technology to 7.
4.9 Electrochemical separation
Whereas most capture technologies utilize thermal cycles to catch and release the CO2
electrochemical separation technologies utilize electrochemical potential difference (e.g.
fuels cells, electrodialysis) or electrochemical cycles (e.g. pH swings, redox reactions).
Rheinhardt et al. (2017) summarize the desired properties of an electrochemical capture
system as following: small potential difference in capture and release for low energy
consumption and costs, rapid transfer kinetics, binding constant tunability, insensitivity
to O2 and H2O, use of low cost and stable electrolytes, and lack of highly reactive
intermediates. They state that none of the methods currently available can fulfil all these
desired properties.

62
Electrochemical CO2 separation has been successfully demonstrated in laboratory
conditions thus reaching a TRL of 4, but industrial-scale demonstration with fuel cells is
soon taking place (FCB 2016), which will advance the TRL significantly. IEAGHG
(2019a) predicts that electrochemical separation is among the most potential technologies
for widespread deployment in the next 5–10 years and that it has high potential for cost
reduction. They estimate a high LCOE reduction potential (31 %) for fuel cell based
electrochemical separation capture compared to a benchmark 30 wt. % MEA capture
process.
Fuel cells, which produce electricity and thus increase the power output of the facility,
are one of the most potential methods of electrochemical CO2 separation. Fuel cells with
recognized potential on carbon capture are molten carbonate fuel cells (MCFC’s) and
solid oxide fuel cells (SOFC’s). The most promising techno-economic performance
properties have been achieved by combining the fuel cells with various hybrid-cycles
(e.g., IGCC, NGCC and NGFC). Depending on the purity of the oxidizer stream, further
CO2 purification might be required by using other capture methods such as cryogenic
separation or membranes. (IEAGHG 2019b.)
MCFC’s can concentrate the CO2 from a gas stream, like combustion flue gases. Flue gas,
which functions as an oxidizer, is fed to the cathode side and hydrogen/syngas to the
anode side. On the cathode side O2 and CO2 form carbonate (CO3-2), which travels
through the electrolyte layer and reacts with hydrogen on the anode side forming CO2 and
H2O. The CO2 is captured from the anode side exhaust gas by separating the moisture and
possible hydrogen remains. SOFC’s are suitable for non-combustion processes. Chemical
energy of a gaseous fuel (e.g., syngas, hydrogen, methane) is converted to electricity by
using regular air as oxidizer. CO2 from the fuel is separated either before or after the fuel
cell. (IEAGHG 2019b.)
IEAGHG (2019b) conducted a techno-economic analysis for fuel cells combined with
carbon capture by using multiple literature-based hybrid-cycle case arrangements and
reference cases. The best performance was achieved with a hybrid cycle consisting of a

63
NGCC power plant equipped with an atmospheric pressure MCFC and cryogenic capture
technology. With a capture rate of 72 % the case resulted in a capture cost of 33.5 €/tCO2.
4.9.1 SureSource MCFC by FuelCell Energy
FuelCell Energy is one of the leading developers of the fuel cell capture technology, with
their SureSource MCFC technology. In theory, by capturing 90 % of the CO2 from a
typical coal plants flue gas stream with fuel cells, the power output could be increased by
80 % while the overall cost of electricity would only increase by 33 %. In addition, NOx
emissions are reduced by 70 %. (FuelCell Energy n.d.) FCE’s SureSource technology
will soon be demonstrated at 3 MW pilot-scale at coal- and gas-fired Plant Barry located
in Alabama, targeting to reach a capture rate of 90 %. The demonstration is conducted
under a joint-development agreement by ExxonMobil and FuelCell Energy. (FCB 2016.)
4.10 Status, performance and potential of the reviewed post-
combustion carbon capture technologies
The most relevant information regarding the carbon capture technologies assessed in the
literature review are summarized in this section by presenting key technologies and
developers, status of the technologies, ongoing or near-future demonstration projects, as
well as essential energy requirement and capture cost. Additionally, the potential of
various carbon capture technologies is roughly assessed.
The key technologies assessed in the literature review, as well as the developers and
maturity of these technologies, are presented in Table 4.2.

64
Table 4.2. The key carbon capture technologies and developers assessed in the literature review. TRL level
indicates maturity of the technology on a scale of 0–9. Higher TRL indicates higher maturity.
Capture method Key technologies and developers TRL (after ongoing or near-
future demonstration)
Aqueous amines EFG+ Fluor 9
PZ+AMP - 6
KS-1 MHI 9
KS-21 MHI 7 (8)
CANSOLV Shell 9
Aqueous ammonia Aq. NH3 CSIRO 6
CAP GE 6
Aqueous carbonate UNO MK 3 CO2CRC & Uno Technology 6
Hot-CAP University of Illinois 4
HPC Stockholm Exergi 6
Liquid-liquid
separating
DMX IFPEN 4–5 (7)
Water-lean solvents eCO2Sol RTI 5 (7)
Pressure-swing
adsorption
VSA with 13X National University of Singapore 5–6
Rapid PSA with 13X University of South Carolina 5
Temperature-swing
adsorption
VeloxoTherm Svante 6 (7)
Dry-sorbent KIER & KEPCO 6 (7)
Membranes Polaris MTR 6 (7–8)
A membrane-sorbent
hybrid system
MTR & TDA Reseach 5 (7)
Fuel cells SureSource MCFC FuelCell Energy 4 (7)
Of the reviewed technologies, only the amine-based EFG+, KS-1 and CANSOLV have
reached commercial-scale operation (TRL 9). Most of the other reviewed technologies
have at least some demonstration experience in realistic conditions from various pilot-
scale projects (TRL 6), while many technologies are also facing larger industrial-scale
demonstration in the near-future, as seen in Table 4.3.
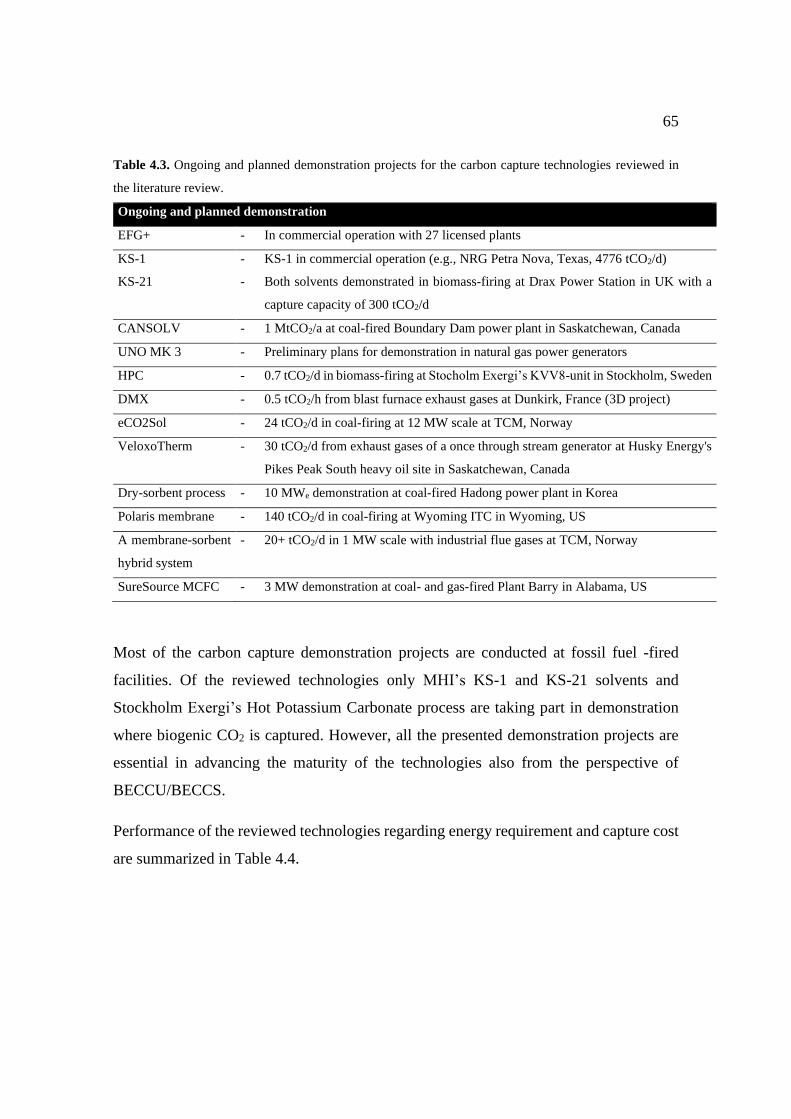
65
Table 4.3. Ongoing and planned demonstration projects for the carbon capture technologies reviewed in
the literature review.
Ongoing and planned demonstration
EFG+ - In commercial operation with 27 licensed plants
KS-1 - KS-1 in commercial operation (e.g., NRG Petra Nova, Texas, 4776 tCO2/d)
KS-21 - Both solvents demonstrated in biomass-firing at Drax Power Station in UK with a
capture capacity of 300 tCO2/d
CANSOLV - 1 MtCO2/a at coal-fired Boundary Dam power plant in Saskatchewan, Canada
UNO MK 3 - Preliminary plans for demonstration in natural gas power generators
HPC - 0.7 tCO2/d in biomass-firing at Stocholm Exergi’s KVV8-unit in Stockholm, Sweden
DMX - 0.5 tCO2/h from blast furnace exhaust gases at Dunkirk, France (3D project)
eCO2Sol - 24 tCO2/d in coal-firing at 12 MW scale at TCM, Norway
VeloxoTherm - 30 tCO2/d from exhaust gases of a once through stream generator at Husky Energy's
Pikes Peak South heavy oil site in Saskatchewan, Canada
Dry-sorbent process - 10 MWe demonstration at coal-fired Hadong power plant in Korea
Polaris membrane - 140 tCO2/d in coal-firing at Wyoming ITC in Wyoming, US
A membrane-sorbent
hybrid system
- 20+ tCO2/d in 1 MW scale with industrial flue gases at TCM, Norway
SureSource MCFC - 3 MW demonstration at coal- and gas-fired Plant Barry in Alabama, US
Most of the carbon capture demonstration projects are conducted at fossil fuel -fired
facilities. Of the reviewed technologies only MHI’s KS-1 and KS-21 solvents and
Stockholm Exergi’s Hot Potassium Carbonate process are taking part in demonstration
where biogenic CO2 is captured. However, all the presented demonstration projects are
essential in advancing the maturity of the technologies also from the perspective of
BECCU/BECCS.
Performance of the reviewed technologies regarding energy requirement and capture cost
are summarized in Table 4.4.
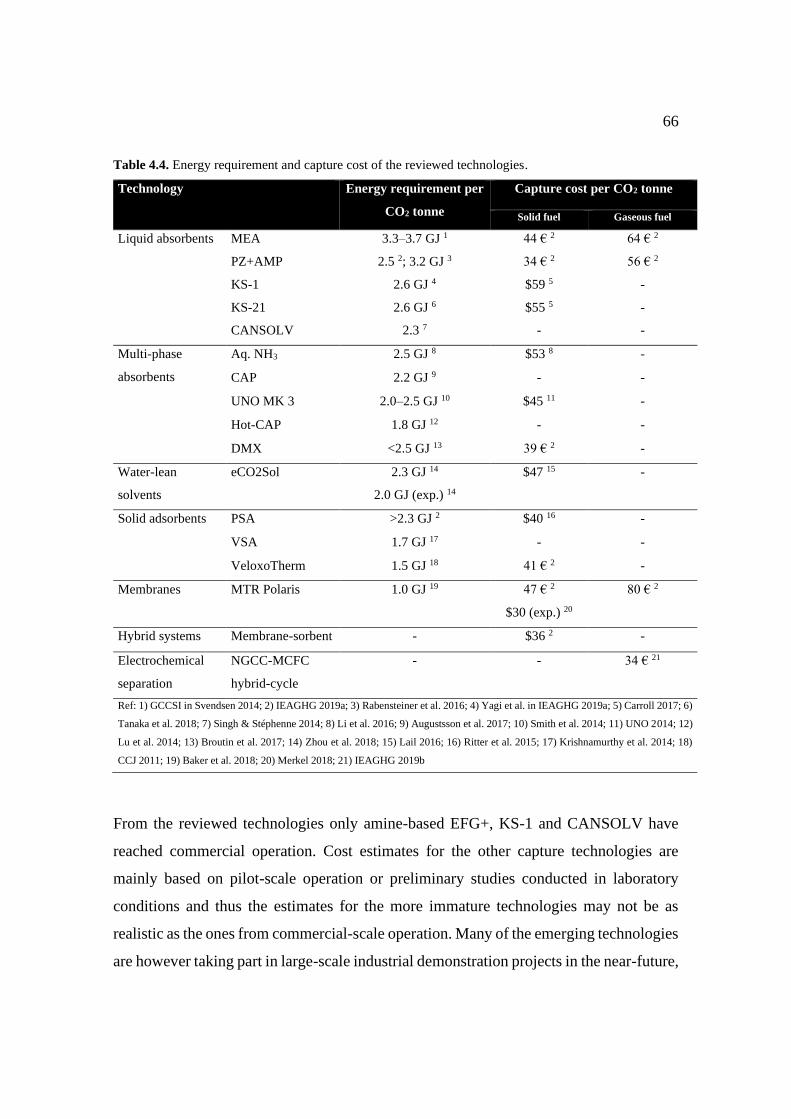
66
Table 4.4. Energy requirement and capture cost of the reviewed technologies.
Technology Energy requirement per
CO2 tonne
Capture cost per CO2 tonne
Solid fuel Gaseous fuel
Liquid absorbents MEA 3.3–3.7 GJ 1 44 € 2 64 € 2
PZ+AMP 2.5 2; 3.2 GJ 3 34 € 2 56 € 2
KS-1 2.6 GJ 4 $59 5 -
KS-21 2.6 GJ 6 $55 5 -
CANSOLV 2.3 7 - -
Multi-phase
absorbents
Aq. NH3 2.5 GJ 8 $53 8 -
CAP 2.2 GJ 9 - -
UNO MK 3 2.0–2.5 GJ 10 $45 11 -
Hot-CAP 1.8 GJ 12 - -
DMX <2.5 GJ 13 39 € 2 -
Water-lean
solvents
eCO2Sol 2.3 GJ 14 $47 15 -
2.0 GJ (exp.) 14
Solid adsorbents PSA >2.3 GJ 2 $40 16 -
VSA 1.7 GJ 17 - -
VeloxoTherm 1.5 GJ 18 41 € 2 -
Membranes MTR Polaris 1.0 GJ 19 47 € 2 80 € 2
$30 (exp.) 20
Hybrid systems Membrane-sorbent - $36 2 -
Electrochemical
separation
NGCC-MCFC
hybrid-cycle
- - 34 € 21
Ref: 1) GCCSI in Svendsen 2014; 2) IEAGHG 2019a; 3) Rabensteiner et al. 2016; 4) Yagi et al. in IEAGHG 2019a; 5) Carroll 2017; 6)
Tanaka et al. 2018; 7) Singh & Stéphenne 2014; 8) Li et al. 2016; 9) Augustsson et al. 2017; 10) Smith et al. 2014; 11) UNO 2014; 12)
Lu et al. 2014; 13) Broutin et al. 2017; 14) Zhou et al. 2018; 15) Lail 2016; 16) Ritter et al. 2015; 17) Krishnamurthy et al. 2014; 18)
CCJ 2011; 19) Baker et al. 2018; 20) Merkel 2018; 21) IEAGHG 2019b
From the reviewed technologies only amine-based EFG+, KS-1 and CANSOLV have
reached commercial operation. Cost estimates for the other capture technologies are
mainly based on pilot-scale operation or preliminary studies conducted in laboratory
conditions and thus the estimates for the more immature technologies may not be as
realistic as the ones from commercial-scale operation. Many of the emerging technologies
are however taking part in large-scale industrial demonstration projects in the near-future,
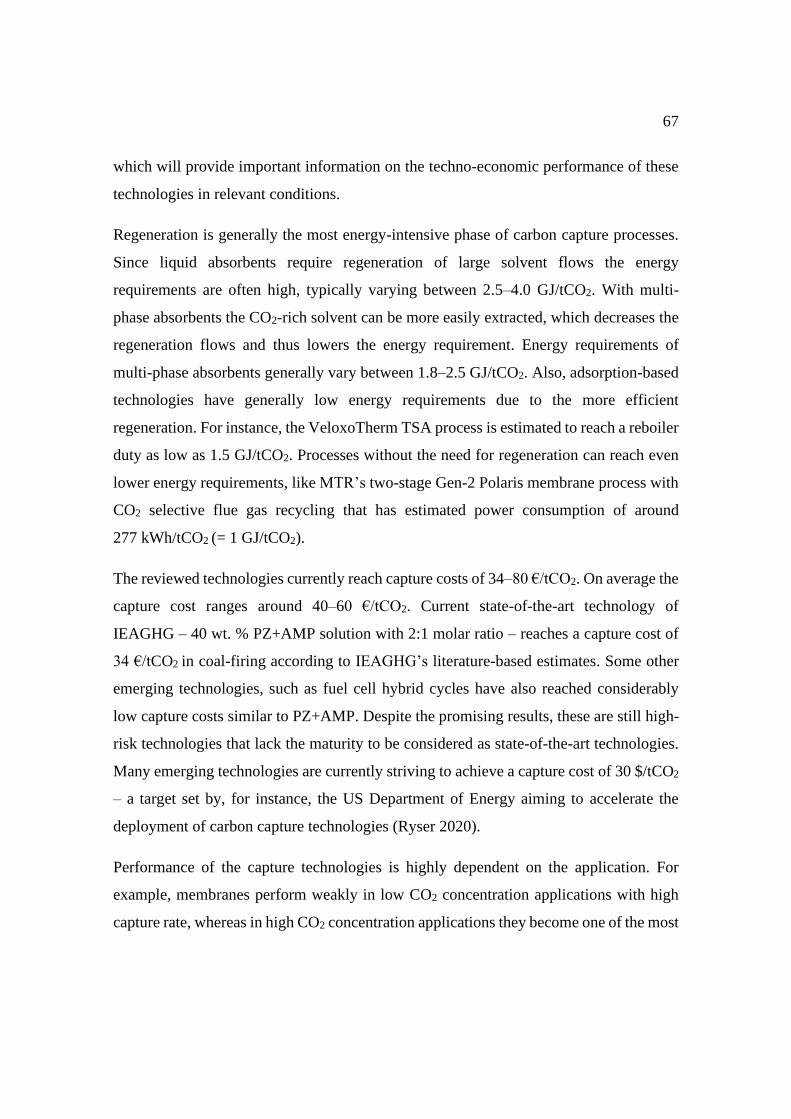
67
which will provide important information on the techno-economic performance of these
technologies in relevant conditions.
Regeneration is generally the most energy-intensive phase of carbon capture processes.
Since liquid absorbents require regeneration of large solvent flows the energy
requirements are often high, typically varying between 2.5–4.0 GJ/tCO2. With multi-
phase absorbents the CO2-rich solvent can be more easily extracted, which decreases the
regeneration flows and thus lowers the energy requirement. Energy requirements of
multi-phase absorbents generally vary between 1.8–2.5 GJ/tCO2. Also, adsorption-based
technologies have generally low energy requirements due to the more efficient
regeneration. For instance, the VeloxoTherm TSA process is estimated to reach a reboiler
duty as low as 1.5 GJ/tCO2. Processes without the need for regeneration can reach even
lower energy requirements, like MTR’s two-stage Gen-2 Polaris membrane process with
CO2 selective flue gas recycling that has estimated power consumption of around
277 kWh/tCO2 (= 1 GJ/tCO2).
The reviewed technologies currently reach capture costs of 34–80 €/tCO2. On average the
capture cost ranges around 40–60 €/tCO2. Current state-of-the-art technology of
IEAGHG – 40 wt. % PZ+AMP solution with 2:1 molar ratio – reaches a capture cost of
34 €/tCO2 in coal-firing according to IEAGHG’s literature-based estimates. Some other
emerging technologies, such as fuel cell hybrid cycles have also reached considerably
low capture costs similar to PZ+AMP. Despite the promising results, these are still high-
risk technologies that lack the maturity to be considered as state-of-the-art technologies.
Many emerging technologies are currently striving to achieve a capture cost of 30 $/tCO2
– a target set by, for instance, the US Department of Energy aiming to accelerate the
deployment of carbon capture technologies (Ryser 2020).
Performance of the capture technologies is highly dependent on the application. For
example, membranes perform weakly in low CO2 concentration applications with high
capture rate, whereas in high CO2 concentration applications they become one of the most

68
potential capture technologies available, which also explains the relatively high capture
costs estimated by IEAGHG for membrane capture in Table 4.4.
When assessing techno-economic performance of capture technologies it is important to
understand differences between theoretical estimates and experimental data. Theoretical
estimates often provide information on the maximum potential, whereas experimental
data presents the current state of the technology. Theoretical performance estimates can
be seemingly promising for some immature technologies and these estimates are often
not even remotely reached in the initial demonstration projects at realistic conditions.
However, these initial projects generally aim to validate the proper function of technology
rather than to optimize techno-economic performance, which is improved in further
demonstration projects.
4.10.1 Potential of carbon capture technologies
Most of the reviewed technologies reach roughly similar techno-economic properties and
there are no clear standout technologies that have emerged over the others. Each
technology has its specific advantages and challenges, and primarily, capture
environment, feed gas composition and end-use application of the captured CO2
determines the most suitable technology for various applications. The applicability is
determined by factors like scale, energy requirement, form of energy required, desired
capture rate and CO2 purity, waste stream handling, equipment size, and most
importantly, cost. It can be expected that future development of carbon capture
technologies will include multiple different methods of carbon capture for various
applications. If any major technological breakthroughs do not occur, it is unlikely that a
single technology would take over the whole carbon capture market.
Post-combustion capture with liquid absorbents is currently the most mature method of
carbon capture available, with lots of commercial-scale demonstration to prove its
credibility. It is considered as one of the low-risk technologies with the most realistic cost
estimates available. More advanced versions of the absorbents with proven feasibility are

69
constantly being developed, which will expectedly improve the techno-economic
properties of these absorbents. Conventional absorbents, such as the previous state-of-
the-art technology MEA, suffer from obvious shortcomings such as high energy-intensity
and harmful nature to equipment and environment. Despite the high technological
maturity, the conventional absorbents are being displaced by more advanced absorbents
like advanced amines and multi-phase absorbents.
In addition to absorption-based capture, many other emerging technologies have shown
great promise in preliminary and pilot-scale assessments. Many of these technologies
have not yet reached large industrial-scale demonstration, which makes it difficult to
realistically assess their true potential. For example, fuel cell hybrid cycles have shown
very promising techno-economic performance in preliminary assessments but are still
considered as high-risk technologies since demonstration in realistic conditions has not
yet been conducted. Industrial-scale demonstration is however underway for both
technologies, as well as for many other emerging carbon capture technologies, meaning
that the true potential of these technologies can be more accurately assessed in the near-
future.
In their report on emerging CO2 capture technologies IEAGHG (2019a) ranked the
emerging CO2 capture technologies based on the potential of widespread deployment for
the near future. The ranking is presented on Figure 4.2. It is based on to a scoring system
taking into account each technology’s demonstration level, cost reduction potential,
experience from other sectors, component availability, retrofitting compatibility and
requirement for further research.

70
Figure 4.2. Carbon capture technologies ranked by their potential for widespread deployment in 5–10 years
from 2019 onwards. Higher score indicates greater potential. (IEAGHG 2019a.)
According to IEAGHG’s technology ranking the highest potential for widespread
deployment lies in post-combustion technologies. From these technologies, the highly
mature amine-based absorbents rank the highest, closely followed by electrochemical
separation (e.g., fuel cells) and adsorption-based capture, which are yet to prove their
feasibility in large-scale industrial operation. Membranes and solid sorbents reach good
potential in pre-combustion applications, whereas the still immature oxyfuel processes
rank notably lower compared to post- and pre-combustion technologies. Based on related
literature IEAGHG (2019a) summarize the challenges of widespread carbon capture
deployment as following: high cost, investment risk of the initial projects due to weak
investment returns, lack of infrastructure regarding transportation and storage of CO2,
long duration of the projects, lack of related legislation as well as unclear policymaking
regarding carbon capture.

71
5 DESCRIPTION OF THE PILOT-SCALE CARBON CAPTURE
EXPERIMENTS
Experimental part of this thesis is focused on the carbon capture experiments that were
conducted as part of VTT’s BECCU project between August and October of 2020. Three
absorption-based post-combustion capture technologies were tested at pilot-scale by
using synthetic gas mixtures, biogenic flue gases and raw biogas. The tests were
conducted by using a 50 kW circulating fluidized bed (CFB) pilot combustor located at
VTT’s facilities in Jyväskylä, Finland. Objective was to validate proper function of the
technologies in realistic conditions and to gain information about capture performances
with various CO2 sources. Additionally, some CO2 was captured, compressed and bottled
for further research regarding CO2 utilization via Fischer-Tropsch synthesis. The
utilization experiments are not however reviewed in this thesis.
The tested carbon capture technologies were:
• Enhanced soda scrubbing process by VTT,
• Enhanced water scrubbing process by CarbonReUse Finland,
• Kleener liquid – a novel capture absorbent by Kleener Power Solutions.
Compared to more mature amine absorbents these technologies use more eco-friendly
capture solvents, which supposedly do not cause any harmful emissions to the
environment or to the captured CO2 stream. It is estimated that the solvents are also not
as volatile as amines and could require less energy in the capture process, at least when
compared to conventional amines like MEA.
Schedule, content and objectives of the experiments are presented in Table 5.1. As seen
from the table, not all technologies were tested with all the CO2 sources.

72
Table 5.1. Schedule, content and objectives of the carbon capture experiments.
Week CO2 source Tested technologies Test objectives
#36 Synthetic gas
mixtures
VTT Soda
CarbonReUse
• Verifying proper function of the test
equipment
• Testing capture performance with modifiable
gas compositions
#37
Flue gas from
combustion of
pine chips
VTT Soda
CarbonReUse
Kleener liquid
• Post-combustion capture in realistic flue gas
conditions
• Technology performance comparison
#38
Flue gas from
combustion of
washed straw
VTT Soda
CarbonReUse
• Post-combustion capture in realistic flue gas
conditions
• Technology performance comparison
• Effect of another biomass type on capture
performance
#40
Flue gas from
combustion of
spruce bark &
raw biogas
VTT Soda
• Post-combustion capture in realistic flue gas
conditions
• Effect of another biomass type on capture
performance
• Performance of VTT’s soda process in biogas
purification
The technologies were tested by using capture equipment built inside two shipping
containers, which ensure effective mobility of the equipment. CarbonReUse’s technology
was tested by using their self-constructed pilot-scale capture container, whereas VTT’s
soda solution and the Kleener liquid were both tested in a capture container built by VTT.
The two containers were placed outdoors next to VTT’s 50 kW CFB-pilot facility (Figure
5.1) and the containers were connected to the flue gas line of the CFB.

73
Figure 5.1. The carbon capture technologies were tested by using capture equipment built inside two
shipping containers. The 50 kW CFB-pilot is located in the building behind the containers.
The tested technologies and test arrangements are more specifically reviewed below.
5.1 Enhanced soda scrubbing process by VTT
In the enhanced soda scrubbing process developed by VTT, an aqueous sodium carbonate
(Na2CO3) solution is used to capture CO2 via chemical absorption. Originally, the process
has been developed for biogas purification applications, but potential has been recognized
also in post-combustion carbon capture. The process has been previously experimented
in synthetic biogas purification at laboratory-scale by VTT (TRL 4). Via the discussed
experiments TRL of the process advanced to 5.
The process includes a novel technical improvement to enhance the slow absorption
kinetics of soda-based carbon capture. Instead of using a conventional large-sized
absorption column that are typically used in absorbent capture, an ejector is used to mix
the flue gas and the solvent flows. Efficient mixing properties of the ejector improve
dissolution of CO2 into the solvent, thus enhancing absorption rate. Furthermore, the
improved absorption rate decreases size of the absorption equipment, which could

74
expectedly lower the capital cost of the equipment compared to conventional absorption
columns.
5.1.1 Sodium carbonate as CO2 absorbent
Sodium carbonate (commonly known as soda) can be used to capture CO2 via chemical
absorption. Soda can be used as an aqueous liquid solution (or possibly slurry), reacting
with CO2 and water to form sodium bicarbonate (Eq. 6).
Na2CO3 + CO2 + H2O→ 2 NaHCO3 (6)
Due to low solubility of sodium carbonate and bicarbonate into water, unwanted solvent
precipitation may occur with high soda concentrations. The risk of precipitation limits the
soda concentration of the solution unless solid- or slurry-mode operation is desired, which
requires more complex process configuration with specific solid handling equipment.
Previous research on using soda as CO2 absorbent has been conducted e.g., by Knuutila
et al. (2009). In their model-based study, they studied feasibility of carbon capture in coal-
firing by using a sodium carbonate-bicarbonate slurry. For a capture rate of 90 % by using
a 30 wt. % soda solution they calculated a reboiler heat duty of 3.2 GJ/tCO2 for the
process. They conclude that in carbon capture soda has advantages like eco-friendly and
non-corrosive nature, stability and low sorbent cost. However, a significant drawback of
soda-based capture, when used in a conventional absorption column, is the slow
absorption rate, which is why the process requires large-sized capture equipment.
Soda is not as sensitive to various impurities as the more conventionally used amines are.
Impurities may cause degradation of soda, but without leading to formation of harmful
compounds such as nitrosamines and nitramines that occur with amine absorbents. Soda
could possibly be even used to remove some impurities alongside carbon capture. Soda

75
may react with impurities that are commonly present in flue gases and biogas according
to the reactions presented in Equations 7–11.
Na2CO3 + SO2 → Na2SO3 + CO2 (7)
Na2CO3 + 2HCl → 2NaCl + CO2 + H2O (8)
Na2CO3 + 2H2S → 2NaHS + CO2 + H2O (9)
2Na2CO3 + 4NO + 3O2 → 4NaNO3 + 2CO2 (10)
Na2CO3 + 2NO2 → NaNO2 + NaNO3 + CO2 (11)
Non-regenerable compounds that are formed in reactions with impurities can be removed
from the process via a purge stream. The purge stream also removes some soda from the
process, creating a need for make-up soda. The purge stream is expectedly small and thus
not a lot of make-up soda is required. Additionally, the soda solution does not require any
performance enhancing additives, which some carbonates (e.g., K2CO3) often require to
reach high capture performance.
5.1.2 Description of the enhanced soda scrubbing process
In this process configuration a soda concentration of 8 wt. % was used. The process was
operated with a volumetric L/G (liquid-to-gas) ratio of ~1 l/l. Flue gas and solvent flow
rates were both around 8–12 Nl/min. A schematic flow diagram of the enhanced soda
scrubbing process is presented in Figure 5.2.
76
Figure 5.2. A schematic flow diagram of VTT’s enhanced soda scrubbing process.
Solvent flow and CO2-rich target gas are mixed at atmospheric pressure by using an
ejector. Majority of the CO2 dissolves into the solvent and reacts with soda and water via
chemical absorption to form sodium bicarbonate (NaHCO3). The solution is led through
a delay tank to achieve a sufficient residence time for the absorption reactions to occur,
which in this configuration is around one minute. Non-dissolved gases, mainly consisting
of N2 and O2, are removed at a gas/liquid separator. The removed gas can be led through
a second purification stage, which can be used, for instance, in biogas purification to
produce high quality biomethane. About a fourth of the absorption cycle flow is led to a
regeneration cycle, where the CO2-rich solvent is regenerated at a pressure of 0.2–0.5 bar
and a temperature of 60–80 °C. In the experiments the regeneration conditions were
around 0.25 bar and 65 °C. Low-pressure-conditions are created with a vacuum pump,
which enables low-temperature desorption. In this configuration heat source of
regeneration was resistance heating by using electricity, which is not an optimal heat
source regarding performance but easy to implement at this scale.
77
In these experiments, the process configuration was built rather for system validation than
to reach optimal performance properties. In future development, the performance could
be further improved by using a more optimal regeneration heat source, like waste heat.
Additionally, higher soda concentration and higher absorption pressure could expectedly
improve performance of the process.
5.2 Enhanced water washing process by CarbonReUse Finland
CarbonReUse Finland has scaled-up the enhanced water washing capture process
developed by Kuopanportti & Linnanen (2014). In the process, regular water is used to
bind CO2 from the target gas via physical absorption. The absorbent water is regenerated
via flash evaporation (flashing) by using pressure reduction. Water-washing is a mature
technology in gas purification such as in biogas upgrading. However, it is a novel concept
in post-combustion carbon capture. Previous evaluations on the process have been
conducted e.g., by Linnanen (2012) and Teir et al. (2014).
5.2.1 Water as CO2 absorbent
Advantages of using regular water as CO2 absorbent are simplicity, low-cost solvent and
eco-friendly nature compared to chemical absorbents. Since chemicals are not used,
degradation and solvent-based emissions do not occur, and additive solvent is not
required. The biggest disadvantage is the low solubility of CO2 into water in conditions
of low CO2 partial pressure, which is why water washing requires larger solvent volume
flows compared to chemical solvent processes. CO2 solubility can be improved by
absorbent water cooling and by increasing absorption pressure. However, the solvent
mass flows are still up to ten times higher than in conventional amine solvent processes
(Suomalainen & Arasto, cited in Teir et al. 2014), requiring around 830 tonnes of water
per captured CO2 tonne (Linnanen 2012). Water-soluble impurities must be removed
from the target gas prior to the capture process. For instance, SO2 and HCl react with
water forming sulphurous acid (H2SO3) and hydrochloric acid (HCl), which are strongly
acidic compounds that would cause harm to the equipment.

78
5.2.2 Description of the enhanced water scrubbing process
The capture equipment used in this test configuration is designed for flue gas flow rate of
around 160–170 Nl/min. The process is fully electric. Majority of the required electricity
is consumed in flue gas compression and solvent and coolant flow pumping. Schematic
flow diagram of the enhanced water scrubbing process is presented in Figure 5.3.
Figure 5.3. A schematic flow diagram of the enhanced water scrubbing process. (Teir et al. 2014.)
Prior to entering the capture cycle, flue gas is scrubbed in a packed-bed counter-flow
water scrubber to remove water-soluble impurities. The flue gas is then led to a packed-
bed post-desorber column, where it flows upwards against a water stream led from
desorber at atmospheric pressure. In the post-desorber, the CO2 which remains in the
water after desorption is stripped into the flue gas flow. The post-desorber is an important
technical improvement compared to conventional water scrubbing processes, since it
increases CO2 loading capacity of the water and improves CO2 capture rate.
After the post-desorber the CO2-rich gas stream is compressed and led through a heat
exchanger, where it releases heat into a stream of CO2-lean gas. The compressed CO2-
79
rich gas stream is led to an absorption tank, where the gas is fed from the bottom into the
solvent water. Before entering the absorption tank, the water stream that is entering the
absorber is cooled to around 5 °C by using a heat pump to improve CO2 solubility. The
heat pump is not required if there is cool water available, for instance, during cold
seasons. The gas flow is led through a fine bubble diffuser, which turns the flow into a
stream of numerous small bubbles, thus improving the dissolution of the gas to the water.
The gaseous CO2 transfers into a liquid phase, binding it into the water via physical
absorption. Absorption tank is at an elevated pressure of 4–5 bar since higher absorption
pressure improves the solubility of CO2 into water. Majority of the CO2 from the gas flow
is absorbed into the water, but also some unwanted compounds, such as N2 and O2,
dissolute to the stream. Non-dissolved CO2-lean gas, mainly consisting of N2, is removed
from the cycle from the top of the absorption tank after going through an expander to
generate mechanical energy for compression of the CO2-rich gas stream.
A pre-desorber is used decrease the amount of unwanted compounds in the product CO2
stream. In the pre-desorber the pressure of the water is lowered to around 1.6–2.5 bar,
which releases most of the N2 and O2 from the water, without releasing CO2. The stripped
gases are led to the post-desorber. The CO2 is stripped and captured from the water in a
desorber. A vacuum pump is used to achieve a regeneration pressure of around 0.4 bar
for desorption.
5.3 Kleener liquid by Kleener Power Solutions
Kleener Power Solutions is a Finnish company specialized in utilization of power plant
waste streams with special expertise on ash handling. They have developed a novel CO2
capture absorbent called the Kleener liquid, which is also a derivative from the company’s
ash handling expertise. In manufacturing of the Kleener liquid, power plant ashes are
used, offering also a great option for ash utilization. The Kleener liquid is an alkaline
solution that captures CO2 via chemical absorption. Due to patent-related reasons
chemical composition of the absorbent is not further specified. Regeneration of the liquid
80
is done by heating the solution. Regeneration temperature can be reduced by using a
vacuum pump to create low-pressure regeneration conditions.
According to Kleener (2021), absorption capacity of the Kleener liquid is 150 times
higher compared to regular water. The company estimates that a 50 % reduction in
investment cost could be achieved with their capture technology compared to amine-
based capture processes. Energy consumption is estimated at 2.6 GJ/tCO2 and capture
cost at 29 €/tCO2. The estimates are calculated to be comparable with results of the
CO2stCap Project conducted by SINTEF.
In the pilot tests, the Kleener liquid was demonstrated by using VTT’s capture equipment
with similar process parameters regarding solvent and flue gas flow rates and regeneration
conditions (Reviewed in Section 5.1.2). Kleener Power Solutions is conducting their own
research to find the most cost-effective formula for the Kleener liquid. In the pilot tests,
the Kleener liquid was used as a diluted solution that was not optimized, for instance, to
achieve high absorption capacity. Therefore, the results from these test runs do not
necessarily present the true performance of the Kleener liquid. Also, the Kleener liquid
was only tested in one test run (pine chips combustion), meaning that evaluation of
Kleener liquid’s performance is more limited compared to VTT’s and CarbonReUse’s
technologies, as there is less test data available.
5.4 50 kW CFB pilot combustor
The experiments were conducted by using VTT’s 50 kW CFB pilot combustor. With the
pilot combustor, the carbon capture technologies can be tested in realistic flue gas
conditions while still maintaining good control over the process conditions. The process
conditions can be modified, for instance, with air staging and separately controlled
electrically heated and water/air-cooled zones. The combustor is controlled via an
automation system equipped with automatic data-logging. Schematic structure of the
CFB pilot is presented in Appendix I.
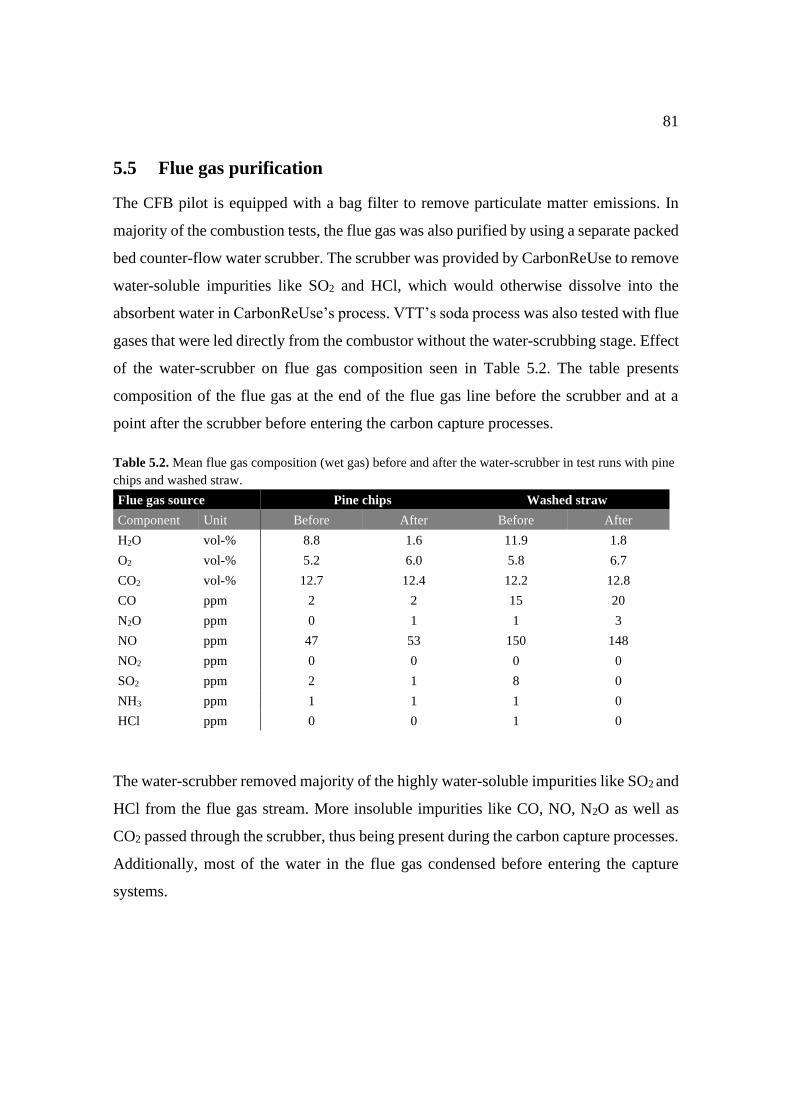
81
5.5 Flue gas purification
The CFB pilot is equipped with a bag filter to remove particulate matter emissions. In
majority of the combustion tests, the flue gas was also purified by using a separate packed
bed counter-flow water scrubber. The scrubber was provided by CarbonReUse to remove
water-soluble impurities like SO2 and HCl, which would otherwise dissolve into the
absorbent water in CarbonReUse’s process. VTT’s soda process was also tested with flue
gases that were led directly from the combustor without the water-scrubbing stage. Effect
of the water-scrubber on flue gas composition seen in Table 5.2. The table presents
composition of the flue gas at the end of the flue gas line before the scrubber and at a
point after the scrubber before entering the carbon capture processes.
Table 5.2. Mean flue gas composition (wet gas) before and after the water-scrubber in test runs with pine
chips and washed straw.
Flue gas source Pine chips Washed straw
Component Unit Before After Before After
H2O vol-% 8.8 1.6 11.9 1.8
O2 vol-% 5.2 6.0 5.8 6.7
CO2 vol-% 12.7 12.4 12.2 12.8
CO ppm 2 2 15 20
N2O ppm 0 1 1 3
NO ppm 47 53 150 148
NO2 ppm 0 0 0 0
SO2 ppm 2 1 8 0
NH3 ppm 1 1 1 0
HCl ppm 0 0 1 0
The water-scrubber removed majority of the highly water-soluble impurities like SO2 and
HCl from the flue gas stream. More insoluble impurities like CO, NO, N2O as well as
CO2 passed through the scrubber, thus being present during the carbon capture processes.
Additionally, most of the water in the flue gas condensed before entering the capture
systems.
82
5.6 Measurement arrangements
Measurement arrangements were planned to provide the necessary data to assess the
performance of the tested technologies, including flue gas and solvent flow rates, flue gas
compositions at various process stages as well as composition of the captured CO2.
The pilot combustor is equipped with a FTIR-spectrometer to measure flue gas
composition. Measurement point of the FTIR was located between primary and secondary
cyclones. Since the FTIR does not measure O2 level, it was measured by using a ZrO2
sensor. A conventional on-line analyser was also connected to the flue gas duct between
the gas cooler and bag house filter to measure flue gas composition. Composition of the
captured CO2 flows were measured by using Gasmet Dx4000 FTIR with a 2.6 m path
length. Synthetic gas mixtures were created by mixing carbon dioxide (99.9 %),
instrument nitrogen (99.999 %) and purified compressed air with two mass flow
controller units manufactured by Environics Ltd.
In VTT’s container CO2 concentration was measured in the range of 0–50 vol-% by using
ETG MCA 100 Bio with an interval of five seconds. Gas samples were taken
automatically through a sample gas sequencer GWB Model 228-4 manufactured by
J.U.M. Engineering Ltd. Gas sampling interval was about three minutes per sampling line
with 1 l/min gas flow.
CarbonReUse’s container was equipped with their self-developed digital interface that
was used to control the process, such as to modify absorption and desorption conditions.
The interface was also used to review and log various process parameter values like
absorbent and flue gas pressure, temperature and flow rates at different process stages.
During the experiments, some minor technical problems emerged that caused temporary
reduction in carbon capture performance, short interruptions or rescheduling. However,
any major difficulties were avoided, and all the planned test runs were successfully
executed. On average, the carbon capture processes were kept running for around
3–12 hours at a time and therefore experience from long-term carbon capture operation
was not achieved in these test runs.

83
Multiple different measuring devices were used in the test runs, emerging a possibility
for instrument errors. Since the capture processes were not fully automatic and human
input was required for process operation the possibility of human error was present.
However, any detrimental errors would have been most likely noticed in real-time via
various measurements and such errors did not occur in the test runs. The measurement
data and results have also been processed manually, which poses a risk of human error in
data processing.
5.7 Data processing
Data gathered from the tests was processed manually. To facilitate data processing, the
individual test runs were drawn into graphs as in Figure 5.4, which presents measured
CO2 levels (vol-%) of the flue gas and the captured CO2 during CarbonReUse’s carbon
capture process in the pine chips combustion tests.
Figure 5.4. CO2 level (vol-%) in flue gas and captured CO2 during CarbonReUse’s capture process in pine
chips combustion on 8th of September 2020.
From the above-like graphs suitable stabilized test periods were chosen over which flue
gas and captured CO2 mean compositions were calculated. The compositions are
presented as gas component mean values. The time periods have been selected manually
from each test run. Length of the periods vary from 5 minutes to multiple hours depending
on the length of the measurements. On average, the periods are rather short, around
10–30 min, as long-term steady-state operation was not one of the primary objectives in
0
20
40
60
80
100
12:45 13:45 14:45 15:45 16:45 17:45
CO
2vo
l-%
Captured CO2 Flue gas

84
these test runs. For instance, from Figure 5.4, a period of 13:30–14:00 was chosen as it
provides a stabilized data from CarbonReUse’s capture process in that test run.
Capture rate presents how much of the CO2 from the gas that enters the capture system is
recovered into the captured product gas. The capture rates are calculated by using two
different methods due to differences in flow rate measurement arrangements between the
two containers. For VTT’s container – that was used for soda solution and the Kleener
liquid – the capture rate is calculated via mass balances, by using properties of the CO2-
rich inlet flue gas flow and the CO2-lean outlet flue gas flow (Eq. 12). For CarbonReUse’s
process the capture rate is calculated by using properties of the CO2-rich inlet flue gas
flow and the captured CO2 flow (Eq. 13).
𝐶𝑅 =𝑥(𝐶𝑂2)𝑖𝑛 �̇�𝑖𝑛– 𝑥(𝐶𝑂2)𝑜𝑢𝑡 �̇�𝑜𝑢𝑡
𝑥(𝐶𝑂2)𝑖𝑛 �̇�𝑖𝑛 (12)
Example: 𝐶𝑅 (𝑉𝑇𝑇, 𝑝𝑖𝑛𝑒 𝑐ℎ𝑖𝑝𝑠) = 13,2 % ∙ 11,2 𝑙/ min − 3,3 % ∙ 9,5 𝑙/ min
13,2 % ∙ 11,2 𝑙/𝑚𝑖𝑛= 79 %
𝐶𝑅 =𝑥(𝐶𝑂2)𝑐𝑎𝑝𝑡𝑢𝑟𝑒𝑑 �̇�𝑐𝑎𝑝𝑡𝑢𝑟𝑒𝑑
𝑥(𝐶𝑂2)𝑖𝑛 �̇�𝑖𝑛 (13)
Example: 𝐶𝑅 (𝐶𝑎𝑟𝑏𝑜𝑛𝑅𝑒𝑈𝑠𝑒, 𝑝𝑖𝑛𝑒 𝑐ℎ𝑖𝑝𝑠) = 94,0 % ∙ 15,9 𝑙/ min
13,5 % ∙ 144,9/𝑚𝑖𝑛= 76 %
The capture rates are calculated by using data from stabilized capture processes.

85
6 TEST RESULTS
As part of the BECCU-project carbon capture was tested with three different capture
technologies by using different CO2 sources: synthetic gas mixtures, flue gases from
biomass combustion as well as raw biogas. Main objectives of the tests were to verify
proper function of the technologies, evaluate capture performance and assess the effects
of various gas compositions and impurities on the capture processes. Results from the
tests are presented in this chapter.
6.1 Synthetic gas mixtures
Carbon capture was tested with synthetic gas mixtures during weeks #36 and #38.
Objective of the test runs was to ensure proper function of the test equipment before the
combustion tests, while also providing preliminary data on capture performance. With
synthetic mixtures the gas composition was easily modified, enabling to test the capture
performance with various gas compositions, such as with low and high CO2
concentrations and different oxygen levels. In tests, the synthetic gas mixtures were
mainly used to imitate typical flue gas compositions. The Kleener liquid was not tested
in these test runs.
VTT’s soda process was tested with three synthetic gas mixtures with different CO2 and
O2 levels. Test parameters and results are presented in Table 6.1.
Table 6.1. Results from synthetic gas mixture tests done with VTT’s soda process. Test date: 15th of
September 2020.
Parameter Unit Test #1 Test #2 Test #3
CO2 in inlet vol-% 15 15 10
O2 in inlet vol-% 5 0 5
Flue gas inlet flow l/min 8 8 8
Soda solvent flow l/min 10 10 10
L/G ratio l/l 1.25 1.25 1.25
CO2 after absorption vol-% (dry) 3.0 2.9 2.4
CO2 in captured gas vol-% (dry) - 96.7 96.7
O2 in captured gas vol-% (dry) - 0 0
Capture rate % 83 84 86
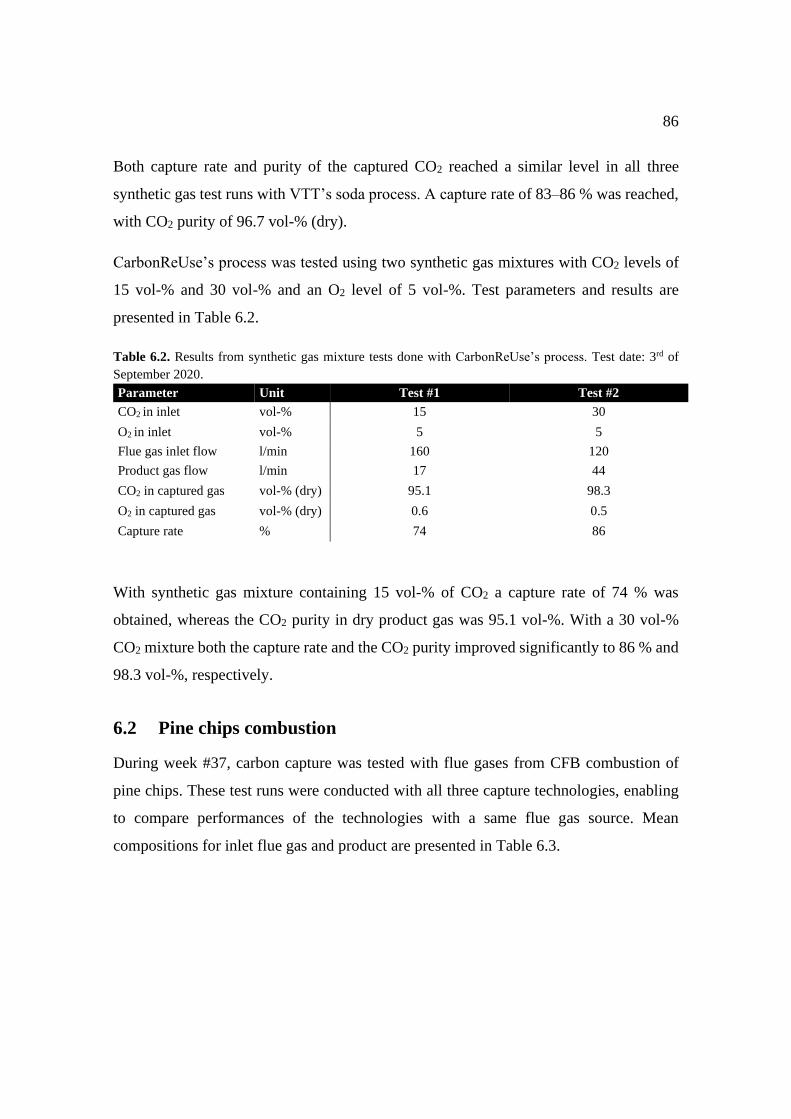
86
Both capture rate and purity of the captured CO2 reached a similar level in all three
synthetic gas test runs with VTT’s soda process. A capture rate of 83–86 % was reached,
with CO2 purity of 96.7 vol-% (dry).
CarbonReUse’s process was tested using two synthetic gas mixtures with CO2 levels of
15 vol-% and 30 vol-% and an O2 level of 5 vol-%. Test parameters and results are
presented in Table 6.2.
Table 6.2. Results from synthetic gas mixture tests done with CarbonReUse’s process. Test date: 3rd of
September 2020.
Parameter Unit Test #1 Test #2
CO2 in inlet vol-% 15 30
O2 in inlet vol-% 5 5
Flue gas inlet flow l/min 160 120
Product gas flow l/min 17 44
CO2 in captured gas vol-% (dry) 95.1 98.3
O2 in captured gas vol-% (dry) 0.6 0.5
Capture rate % 74 86
With synthetic gas mixture containing 15 vol-% of CO2 a capture rate of 74 % was
obtained, whereas the CO2 purity in dry product gas was 95.1 vol-%. With a 30 vol-%
CO2 mixture both the capture rate and the CO2 purity improved significantly to 86 % and
98.3 vol-%, respectively.
6.2 Pine chips combustion
During week #37, carbon capture was tested with flue gases from CFB combustion of
pine chips. These test runs were conducted with all three capture technologies, enabling
to compare performances of the technologies with a same flue gas source. Mean
compositions for inlet flue gas and product are presented in Table 6.3.
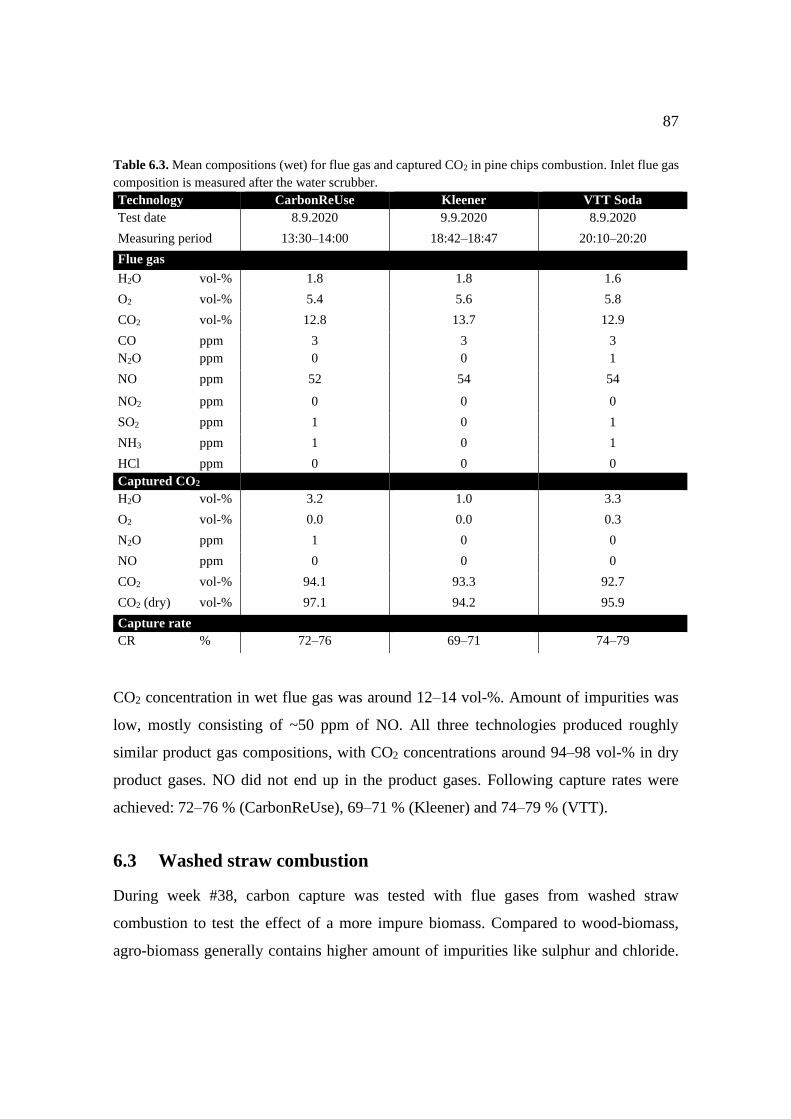
87
Table 6.3. Mean compositions (wet) for flue gas and captured CO2 in pine chips combustion. Inlet flue gas
composition is measured after the water scrubber.
Technology CarbonReUse Kleener VTT Soda
Test date 8.9.2020 9.9.2020 8.9.2020
Measuring period 13:30–14:00 18:42–18:47 20:10–20:20
Flue gas
H2O vol-% 1.8 1.8 1.6
O2 vol-% 5.4 5.6 5.8
CO2 vol-% 12.8 13.7 12.9
CO ppm 3 3 3
N2O ppm 0 0 1
NO ppm 52 54 54
NO2 ppm 0 0 0
SO2 ppm 1 0 1
NH3 ppm 1 0 1
HCl ppm 0 0 0
Captured CO2
H2O vol-% 3.2 1.0 3.3
O2 vol-% 0.0 0.0 0.3
N2O ppm 1 0 0
NO ppm 0 0 0
CO2 vol-% 94.1 93.3 92.7
CO2 (dry) vol-% 97.1 94.2 95.9
Capture rate
CR % 72–76 69–71 74–79
CO2 concentration in wet flue gas was around 12–14 vol-%. Amount of impurities was
low, mostly consisting of ~50 ppm of NO. All three technologies produced roughly
similar product gas compositions, with CO2 concentrations around 94–98 vol-% in dry
product gases. NO did not end up in the product gases. Following capture rates were
achieved: 72–76 % (CarbonReUse), 69–71 % (Kleener) and 74–79 % (VTT).
6.3 Washed straw combustion
During week #38, carbon capture was tested with flue gases from washed straw
combustion to test the effect of a more impure biomass. Compared to wood-biomass,
agro-biomass generally contains higher amount of impurities like sulphur and chloride.

88
The Kleener liquid was not tested in these test runs. Mean compositions for inlet flue gas
and product gas are presented in Table 6.4.
Table 6.4. Mean compositions (wet) for flue gas and captured CO2 in washed straw combustion. Inlet flue
gas composition is measured after the water scrubber. The Kleener liquid was not tested.
Composition of the flue gas was roughly similar as in the pine chips tests. This was partly
because of the water-scrubber, which removed the water-soluble impurities like SO2. CO2
concentration in wet flue gas was at similar level at ~13 vol-%. In dry product gases CO2
concentrations were 96.0 vol-% (CarbonReUse) and 96.6 vol-% (VTT) – also similar to
the results in the pine chips tests. A capture rate of 64–70 % was achieved with
CarbonReUse’s process, whereas VTT’s process reached a rate of 78–83 %.
Technology CarbonReUse VTT Soda
Test date 15.9.2020 14.9.2020
Measuring period 15:34–17:30 16:15–16:32
Flue gas
H2O vol-% 1.8 1.8
O2 vol-% 6.6 6.3
CO2 vol-% 13.0 13.3
CO ppm 20 19
N2O ppm 3 7
NO ppm 148 173
NO2 ppm 0 0
SO2 ppm 0 0
NH3 ppm 0 0
HCl ppm 0 0
Captured CO2
H2O vol-% 3.1 1.8
O2 vol-% 0.4 0.5
N2O ppm 18 3
NO ppm 0 0
CO2 vol-% 93.0 94.9
CO2 (dry) vol-% 96.0 96.6
Capture rate
CR % 64–70 78–83

89
Biggest difference in flue gas composition occurred in CO and NO levels, which were
roughly seven and three times higher, respectively. However, either of these compounds
did not end up in the product gases due to their low solubility. Some N2O (3–7 ppm),
which is roughly as soluble into water as CO2, was also present in the flue gas. Some of
it ended up in the product gases: 18 ppm in CarbonReUse’s process and 3 ppm in VTT’s
process.
6.4 Spruce bark combustion
A third biomass type, spruce bark, was tested in week #40. This test run was only done
by using VTT’s soda process. Also, the water-scrubber was not used to purify the flue
gas prior to carbon capture. Mean compositions for inlet flue gas and product gas are
presented in Table 6.5. The compositions are calculated over different time periods as
there was no simultaneous composition measurements for the gas streams in this test run.

90
Table 6.5. Mean compositions (wet) for flue gas and captured CO2 in spruce bark combustion. In this test
run carbon capture was only done by using VTT’s technology and without the flue gas water-scrubber.
Technology VTT Soda
Test date 28.9.2020
Measuring period 14:41–15:10 (captured CO2)
15:15–15:23 (flue gas)
Flue gas
H2O vol-% 2.6
O2 vol-% 6.3
CO2 vol-% 13.3
CO ppm 36
N2O ppm 2
NO ppm 219
NO2 ppm 0
SO2 ppm 0
NH3 ppm 1
HCl ppm 0
Captured CO2
H2O vol-% 2.3
O2 vol-% 0.2
N2O ppm 0
NO ppm 0
CO2 vol-% 94.4
CO2 (dry) vol-% 96.5
Capture rate
CR % 88–90
In the spruce bark combustion higher levels of NO and CO occurred in the flue gas.
Otherwise, the composition was fairly similar to the previous combustion tests. Compared
to the pine chips tests, the amount of NO was around four times higher at 219 ppm,
whereas the amount of CO was roughly twelvefold at 36 ppm. However, this did not seem
to have any effect on the capture performance of VTT’s soda process. Composition of the
captured CO2 was similar as in other tests, reaching a CO2 purity of 96.5 % in dry product
gas. Additionally, any NO or CO did not end up in the product gas. A capture rate of 88–
90 % was achieved, which was highest of all the test runs. Presumably, the improvement
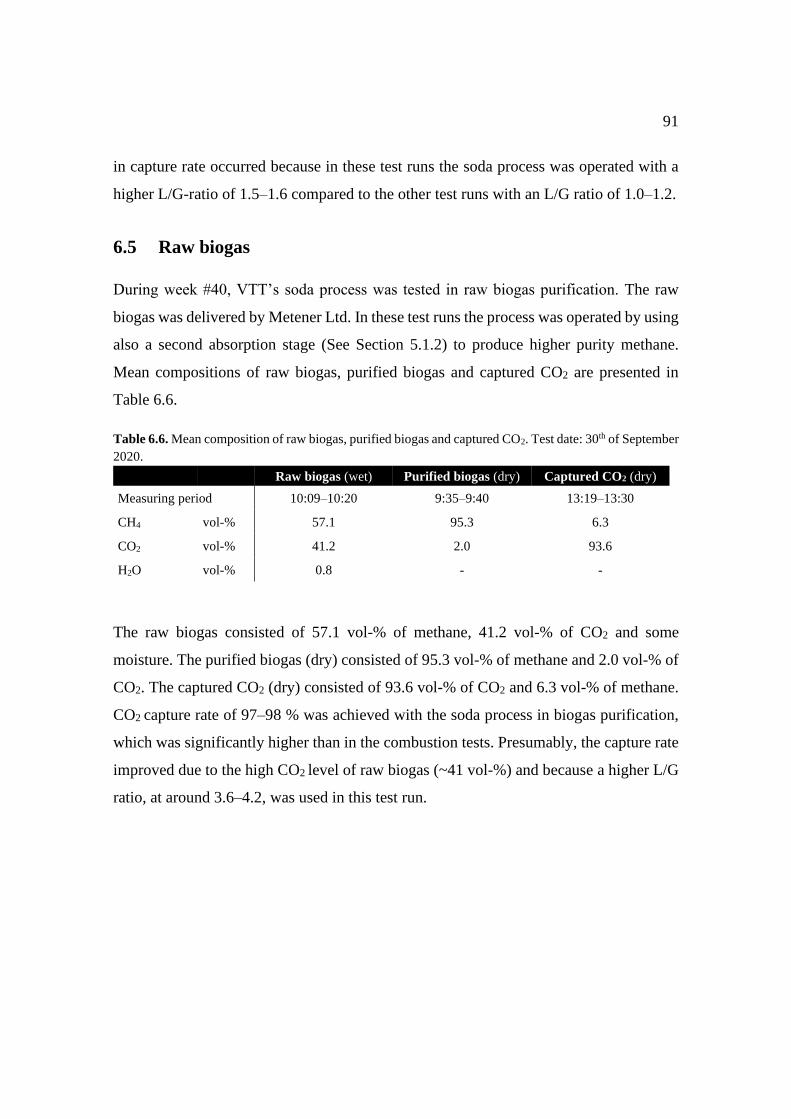
91
in capture rate occurred because in these test runs the soda process was operated with a
higher L/G-ratio of 1.5–1.6 compared to the other test runs with an L/G ratio of 1.0–1.2.
6.5 Raw biogas
During week #40, VTT’s soda process was tested in raw biogas purification. The raw
biogas was delivered by Metener Ltd. In these test runs the process was operated by using
also a second absorption stage (See Section 5.1.2) to produce higher purity methane.
Mean compositions of raw biogas, purified biogas and captured CO2 are presented in
Table 6.6.
Table 6.6. Mean composition of raw biogas, purified biogas and captured CO2. Test date: 30th of September
2020.
Raw biogas (wet) Purified biogas (dry) Captured CO2 (dry)
Measuring period 10:09–10:20 9:35–9:40 13:19–13:30
CH4 vol-% 57.1 95.3 6.3
CO2 vol-% 41.2 2.0 93.6
H2O vol-% 0.8 - -
The raw biogas consisted of 57.1 vol-% of methane, 41.2 vol-% of CO2 and some
moisture. The purified biogas (dry) consisted of 95.3 vol-% of methane and 2.0 vol-% of
CO2. The captured CO2 (dry) consisted of 93.6 vol-% of CO2 and 6.3 vol-% of methane.
CO2 capture rate of 97–98 % was achieved with the soda process in biogas purification,
which was significantly higher than in the combustion tests. Presumably, the capture rate
improved due to the high CO2 level of raw biogas (~41 vol-%) and because a higher L/G
ratio, at around 3.6–4.2, was used in this test run.
92
7 EVALUATION OF PERFORMANCE, SCALABILITY AND
APPLICABILITY OF THE TESTED CARBON CAPTURE
TECHNOLOGIES
In the carbon capture tests, all of the three tested technologies were proven functional in
post-combustion carbon capture by using pilot-scale equipment. However, as discussed
in the literature review, numerous carbon capture technologies are currently emerging in
the carbon capture market. Therefore, potential of VTT’s, CarbonReUse’s and Kleener’s
technologies on this growing but already contested market depend on techno-economic
performance, scalability and applicability. In this chapter, these matters are evaluated and
compared to other carbon capture technologies that were studied in the literature review.
7.1 Performance
Performances of the tested technologies are evaluated by assessing purity of the captured
CO2, capture rate, energy consumption, chemicals, additives and waste-streams as well
as economic performance. As the tests were conducted at pilot-scale with configurations
that were not optimized for high performance but rather for proof-of-concept, it can be
assumed that results achieved in these test runs could be improved after further
development.
7.1.1 CO2 purity
Purity of the captured CO2 is essential when assessing performance of carbon capture
technologies. Generally, high purity is desired since impurities can cause challenges in
CO2 transportation, utilization and storage (Reviewed in Section 3.2.1). Higher purity
CO2 is also more valuable. Furthermore, if additional purification of the captured CO2 is
required, the overall capture cost increases. However, the required purity depends on the
application of the captured CO2 and if high purity is not required, it is often more cost-
effective to produce or capture CO2 with lower quality.
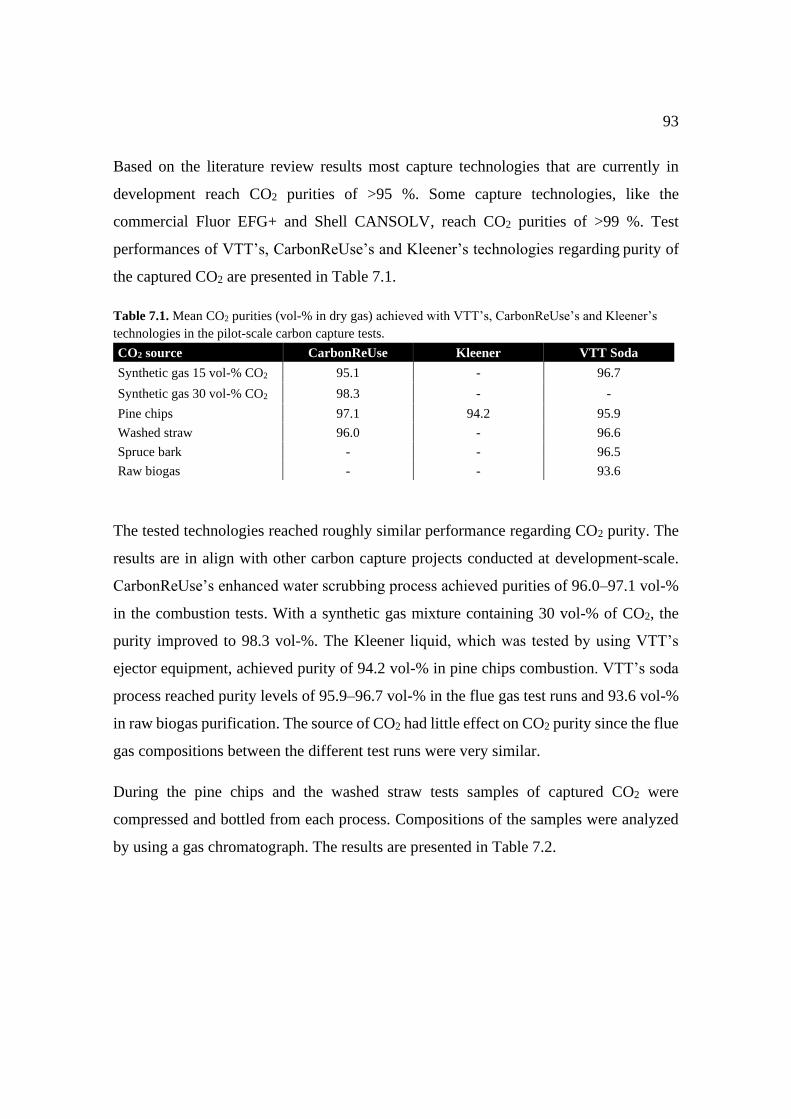
93
Based on the literature review results most capture technologies that are currently in
development reach CO2 purities of >95 %. Some capture technologies, like the
commercial Fluor EFG+ and Shell CANSOLV, reach CO2 purities of >99 %. Test
performances of VTT’s, CarbonReUse’s and Kleener’s technologies regarding purity of
the captured CO2 are presented in Table 7.1.
Table 7.1. Mean CO2 purities (vol-% in dry gas) achieved with VTT’s, CarbonReUse’s and Kleener’s
technologies in the pilot-scale carbon capture tests.
CO2 source CarbonReUse Kleener VTT Soda
Synthetic gas 15 vol-% CO2 95.1 - 96.7
Synthetic gas 30 vol-% CO2 98.3 - -
Pine chips 97.1 94.2 95.9
Washed straw 96.0 - 96.6
Spruce bark - - 96.5
Raw biogas - - 93.6
The tested technologies reached roughly similar performance regarding CO2 purity. The
results are in align with other carbon capture projects conducted at development-scale.
CarbonReUse’s enhanced water scrubbing process achieved purities of 96.0–97.1 vol-%
in the combustion tests. With a synthetic gas mixture containing 30 vol-% of CO2, the
purity improved to 98.3 vol-%. The Kleener liquid, which was tested by using VTT’s
ejector equipment, achieved purity of 94.2 vol-% in pine chips combustion. VTT’s soda
process reached purity levels of 95.9–96.7 vol-% in the flue gas test runs and 93.6 vol-%
in raw biogas purification. The source of CO2 had little effect on CO2 purity since the flue
gas compositions between the different test runs were very similar.
During the pine chips and the washed straw tests samples of captured CO2 were
compressed and bottled from each process. Compositions of the samples were analyzed
by using a gas chromatograph. The results are presented in Table 7.2.

94
Table 7.2. Composition of the captured CO2 samples (dry).
Technology CarbonReUse CarbonReUse Kleener VTT Soda
Flue gas source Pine chips Washed straw Pine chips Pine chips
CO2 vol-% 93.3 92.1 97.1 97.6
H2 vol-% 0 0 0 0
O2 vol-% 1.8 2.5 0.8 0.5
N2 vol-% 4.8 5.3 2.1 1.9
CO ppm 0 0 0 0
CH4 ppm 1 2 <5 <5
C2H6 ppm 1 0 0 0
N2O ppm 2 12 0 0
The compositions somewhat vary from the FTIR measurements presented in Chapter 6.
For instance, CO2 purity with CarbonReUse’s technology is significantly lower on these
results, which may have been caused e.g., by air leaks in the CO2 compression line.
In addition to CO2, the captured gases consisted mainly of N2 and O2. In the washed straw
tests also some N2O ended up in the gas with CarbonReUse’s technology, presumably
since N2O is roughly as soluble into water as CO2. Other impurities that were present in
the flue gas streams, like NO or CO, did not end up in the product gases. The effect of
SO2 or HCl on the capture processes could not be determined in these test runs as the
amount of these compounds in the feed gases was very low or non-existent. Based on
these results, the tested technologies do not cause solvent-based emissions, which is often
a problem, for instance, with conventional amine-based absorbents.
7.1.2 Capture rate
Capture rate presents how much of the CO2 from the gas that enters the capture system is
recovered into the captured product gas. Often post-combustion carbon capture
technologies are designed to capture around 90 % of the CO2 present in the feed gas
stream. During development phase lower capture rates are often achieved as can be seen
with the technologies studied in the literature review. Commercial carbon capture
technologies, such as Shell’s CANSOLV and MHI’s KM CDR, have reached capture
rates of around 90 % in industrial-scale operation. However, in biogenic carbon capture,

95
the capture rate does not have as significant role as in fossil-based CCS applications. All
excess fossil-based CO2 emissions are harmful, whereas biogenic CO2 emissions are
climate-neutral in the long run. Therefore, focus in biogenic carbon capture and utilization
applications should be on affordable capture cost and CO2 purity rather than on high
capture rate as it is more beneficial to achieve decent capture rate with affordable
technology than high capture rate with expensive technology.
Test performance of VTT’s, CarbonReUse’s and Kleener’s technologies regarding
capture rate is presented in Table 7.3. The capture rates are calculated by using data from
stabilized processes.
Table 7.3. Capture rates achieved with VTT’s, CarbonReUse’s and Kleener’s technologies in the pilot-
scale carbon capture tests.
CO2 source CarbonReUse Kleener VTT Soda
Synthetic gas 15 vol-% CO2 74 - 83–86
Synthetic gas 30 vol-% CO2 86 - -
Pine chips 72–76 69–71 74–79
Washed straw 64–70 - 78–83
Spruce bark - - 88–90
Raw biogas - - 97–98
All three technologies achieved promising results regarding capture rate, which are in
align with other development-scale carbon capture experiments. CarbonReUse’s water-
scrubbing process achieved capture rates of 64–76 % in the combustion tests and 86 %
by using synthetic gas with CO2 level of 30 vol-%. The Kleener liquid reached capture
rates of 69–71 % in the pine chips combustion tests, whereas VTT’s soda process reached
capture rates of 74–90 % in the combustion tests and 97–98 % in raw biogas purification.
Capture rate with the Kleener liquid and VTT’s soda process could possibly be improved
by modifying solvent concentration, absorption conditions or L/G ratio. Higher solvent
concentration emerges a risk of solvent precipitation, which should be avoided as it can
cause uneven flow conditions or even clogging. Higher absorption pressure would
presumably improve absorption rate but also increase operational costs since compression
96
would be required. Higher L/G ratio would also increase operational costs as process
energy consumption, like required pumping power, would increase.
In CarbonReUse’s water-scrubbing process the absorption capacity is already fairly
optimized by using absorbent water cooling, flue gas compression and a novel post-
desorber column. Presumably, there are not many options to further improve the capture
rate other than increasing CO2 concentration of the feed gas if it can be done in a cost-
effective way.
7.1.3 Energy consumption
CarbonReUse’s enhanced water scrubbing process is fully electrically operated.
Electricity is required for flue gas compression, circulation and vacuum pumps and heat
pump, if it is required. The fully electric process offers good process control and
adjustability like rapid start-ups, shutdowns and process parameter changes. However,
electricity is generally more expensive than low-heat steam or waste heat that is often
available in power plants or other industrial facilities. Many absorbent capture processes
aim to utilize heat in absorbent regeneration. Since CarbonReUse’s process is fully
electric, heat sources cannot be utilized. Feed water temperature is also a significant factor
affecting energy consumption in CarbonReUse’s process. An external source of cold
water would reduce or eliminate the need for a heat pump in absorbent cooling and
therefore lower the energy consumption. According to previous evaluation by Linnanen
(2012), with a feed water temperature of 5 °C power requirement of the process would be
0.34 MWh/tCO2. If a feed water temperature of 15 °C is used, the power requirement
increases to 0.40 MWh/tCO2. According to Teir et al. (2014), the power requirement is at
a similar level to the power losses that occur in amine-based capture processes.
The ejector process, which was used for VTT’s soda solution and the Kleener liquid,
requires both electricity and heat. Electricity is required for circulation and vacuum
pumps. In this process configuration, also regeneration was done with electricity by using
resistance heating, as it was easy to implement at this scale for proof-of-concept.

97
However, from an economic point-of-view, such configuration is not in any way efficient.
In a more optimal configuration, low-grade heat should be used for regeneration due to
being more cost-effective choice compared to electricity.
7.1.4 Chemicals, additives and waste-streams
CarbonReUse’s enhanced water scrubbing process does not require any chemicals or
additives since regular water acts as CO2 absorbent. After reaching stationary operation,
the process does not require additional water either. However, over long-time operation
some impurities may dissolve into the absorbent water flow. If such accumulation of
impurities occurs, some water must be replaced with make-up water. Presumably, any
water removed from CarbonReUse’s process does not require specific wastewater
treatment as the amount of contaminants is low since the flue-gas is purified from water-
soluble impurities before entering the capture process.
VTT’s soda process utilizes an aqueous sodium carbonate solvent to absorb CO2. During
operation, the process may require some make-up soda depending on flue gas
composition and process conditions, which affect degradation of the solvent. As
discussed in Section 5.1.1, soda may react with some impurities that commonly occur in
flue gases. The non-regenerable compounds that are formed in these reactions could be
removed from the process via a purge stream. The make-up soda requirement is
determined by the amount of soda that is removed from the process via this purge stream.
VTT’s soda solution and the Kleener liquid are alkaline and before disposal, the solutions
must be neutralized by using a suitable acid. Additionally, the neutralized solutions could
be utilized, for instance, as fertilizers.
Due to patent-related reasons chemicals or additives used with the Kleener liquid are not
elaborated.
98
7.1.5 Economic performance
Economic performances of the technologies derive from investment costs and operational
costs. Investment costs mainly consist of manufacturing and installation of the capture
equipment and it is affected mainly by the size and complexity of the design, used
materials and required labour. Operational costs consist of energy consumption, use of
chemicals and additives, waste treatment, labour and maintenance.
Compared to chemical absorbent processes CarbonReUse’s process requires relatively
large-sized equipment because of the large mass flows caused by weak CO2 absorption
properties of regular water. According to Suomalainen & Arasto (cited in Teir et al. 2014),
the solvent mass flow is up to ten times higher than in conventional amine solvent
processes, requiring roughly 830 tonnes of water per captured CO2 tonne. Teir et al.
(2014) evaluate that for a small-scale capture facility (~50 ktCO2/a) the investment cost
is at similar level as in amine-based capture plants. They also note that at large scale
(>1MtCO2/a) some extra costs could emerge as the size of the equipment would
expectedly grow very large. Operational costs of the process derive mainly from
electricity consumption (Reviewed in Section 7.1.3). Since the process can be automated
and operated remotely, it can be expected that effect of labour costs is low.
The novel ejector technology developed by VTT could possibly reduce size of the
absorption equipment compared to conventional absorption columns due to efficient
mixing of solvent and feed gas. However, due to lower CO2 absorption capacities VTT’s
and Kleener’s capture solvents require higher flow rates and therefore expectedly larger
capture equipment than, for instance, amine absorbents. In the pilot tests, the ejector
process was operated with a volumetric L/G ratio of ~1l/l. With amine-based absorbents,
such as MEA and PZ/AMP, the ratio is significantly lower at around 2–4 l/m3
(Rabensteiner et al. 2016). However, L/G ratio of the ejector process could possibly be
reduced with more optimized equipment and process conditions. Further research is
required to evaluate the investment cost of the ejector equipment. Operational costs of
VTT’s and Kleener’s capture processes derive mainly from energy consumption
99
(Reviewed in Section 7.1.3). Other essential factors are make-up chemicals and waste
treatment requirements.
The economic performance of the technologies is not assessed based on the pilot test
results since capture configurations used in the tests were not optimized for cost-efficient
performance but rather for proof-of-concept operation. Therefore, economic assessment
based solely on the pilot test data would not provide relevant information about economic
performance of these technologies. To evaluate economic performance further
assessment with more optimized configurations is required, for instance, by using
simulation-based studies. Additionally, it is essential to recognize the most suitable
applications for each technology, as the performance is dependent on the operating
environment. Some possible applications for each technology are discussed below.
7.2 Scalability and applicability
To achieve the highest potential regarding economic performance VTT’s and Kleener’s
capture technologies require heat integration to achieve efficient use of energy in
absorbent regeneration. Therefore, these technologies are most suitable for applications
where there are utilizable heat sources available. However, heat integration may reduce
energy generation efficiency of the facility. If possible, the most benefit would be
achieved by utilizing waste heat as the negative economic effect derived from energy
consumption in carbon capture would be minimal. Applicability to waste heat utilization
is supported by the fact that both solvents can be regenerated at relatively low temperature
level at around 60–80 °C when a vacuum pump is used to create sub-atmospheric
conditions at around 0.2–0.5 bar. There are utilizable heat sources often available in
energy production processes and other energy-intensive industrial processes, which can
be seen as the most suitable processes for VTT’s and Kleener’s capture technologies. In
the absence of utilizable heat sources, also a heat pump could be used to provide heat for
regeneration. Both VTT’s and Kleener’s solvents could possibly be also utilized to
remove some common flue gas impurities alongside carbon capture, although in the
expense of higher solvent degradation. These alkaline solvents can react with some
100
common impurities (e.g., SO2) and form non-regenerable compounds that could be
collected and utilized, for instance, as fertilizers. However, further research is required to
examine the applicability of impurity removal as it was not tested in the pilot tests.
CarbonReUse’s process is fully electric and it does not benefit from heat integration. On
the other hand, it is not dependent on heat integration either. Many carbon capture
processes are often developed by using heat integration as a default, meaning that
CarbonReUse’s technology could provide a viable solution for applications, which lack
utilizable heat sources or otherwise seek a simple and fully electric process. Since heat
integration is not required the process offers a more modular nature compared to
conventional absorbent processes. The process is also fairly simple as it requires only
electricity and water, which facilitates retrofitting as there is no need for large process
modifications in the original process. Since cooling of absorbent water increases capture
efficiency of the process, an external source of cold water or utilizable cooling loads
would be beneficial regarding process economics, as the heat pump would not be
necessarily required. During cold seasons, the cooling load could be reduced or
eliminated by using natural water sources such as lakes, rivers or seas. Due to the large
mass flows caused by low absorption capacity of water, the capture equipment is larger
compared to chemical absorbent processes, which can act as a restricting factor at larger
scale if there are strict space limitations. As the CO2 is captured via physical absorption,
the process is more effective with feed gas of high CO2 concentration, as was seen in the
pilot tests. Therefore, if CO2 concentration of the feed gas could be increased by using a
cost-effective method (e.g., membranes) performance and process economics could be
improved. However, further research is required to evaluate feasibility of such hybrid
processes. Based on the discussed factors, CarbonReUse’s enhanced water-scrubbing
process could provide a viable carbon capture solution for industries seeking a simple and
modular turnkey solution for carbon capture. A significant advantage is that the process
does not use any chemicals, making it suitable for chemically sensitive applications like
food- and beverage industry. The process could be also applicable for carbon capture in
biogas upgrading, where water scrubbing is already a mature technology.
101
8 SUMMARY
Capture and utilization of biogenic CO2 emissions (BECCU) could provide sustainable
value chains to replace conventional fossil-based production of various products like
fuels, materials and chemicals. Potential of BECCU is high especially in areas with strong
bioeconomies, where biogenic emissions of bioenergy production and other biomass
utilizing industries could be harnessed to provide feedstock for CCU value chains by
using carbon capture technologies.
Numerous carbon capture technologies based on different phenomena are currently under
development. Amine absorbents are the most mature capture method available, as amines
perform well especially in large-scale fossil-based CCS applications, where high capture
rate is important. However, amine absorbents often suffer from harmful solvent-based
emissions, high energy-intensity and sensitivity to impurities, although these challenges
have been reduced with more advanced formulations. In addition to amines, there are
many other capture technologies emerging, such as multi-phase absorbents, solid
sorbents, membranes, and fuel cells. Many of these technologies are facing industrial-
scale demonstration in the near-future. Capture technologies that are approaching
industrial-scale operation are at quite similar level regarding performance. Technologies
studied in the literature review currently reach capture costs of 34–80 €/tCO2 and on
average the capture cost is around 40–60 €/tCO2 in post-combustion capture. There does
not seem to be any clear breakthrough technologies that would emerge over the other
technologies cost-wise. Each technology has its own strengths and challenges, and the
most suitable capture technology for different applications is presumably determined by
the capture environment, feed gas composition and how the CO2 is used after capture.
The capture rate is not as significant in bio-CCU as it is in fossil-CCS, and the focus
should primarily be on developing affordable technologies that can capture CO2 with high
purity.
As part of VTT’s BECCU project three novel absorption-based technologies were tested
in post-combustion capture by using pilot-scale equipment. The tested technologies were
an enhanced water scrubbing process by CarbonReUse, an enhanced soda scrubbing
102
process by VTT and Kleener liquid – a novel capture absorbent by Kleener Power
Solutions, which was tested by using VTT’s novel ejector equipment. The pilot tests were
conducted by using synthetic gas mixtures with different CO2 levels and biogenic flue
gases from a 50 kW CFB-pilot combustor. VTT’s soda process was also tested in
purification of raw biogas. All three technologies were proven functional in post-
combustion capture at realistic conditions, while reaching promising performances that
are in align with other similar-scale carbon capture projects. The three technologies
reached roughly similar performance in biomass combustion tests achieving captured
CO2 purity of 94–97 vol-% and capture rates of 64–90 %. VTT’s soda process was also
proven functional in purification of raw biogas, reaching a capture rate of 97–98 %, while
producing streams of 95 vol-% CH4 and 94 vol-% CO2. During the biomass combustion
tests, captured CO2 streams from each technology were compressed, bottled and analyzed
by using gas chromatography. Based on the analysis, any solvent-based emissions did not
end up in the captured CO2 streams. In addition to the CO2, the captured gas streams
consisted mainly of N2 and O2. Small amount of N2O (2–12 ppm) ended up in the captured
CO2 stream with CarbonReUse’s water-scrubbing process. The capture equipment used
in the pilot tests were built rather for proof-of-concept than for optimal performance and
therefore performance of the technologies could possibly be improved after further
development with more optimized equipment.
As numerous technologies are currently emerging in the carbon capture market, potential
of VTT’s, Kleener’s and CarbonReUse’s technologies depend on techno-economic
performance, scalability and applicability. A significant advantage of these technologies
is that the capture processes do not cause any harmful emissions, which is often a problem
with the more mature amine absorbents. Regarding process economics, VTT’s and
Kleener’s chemical absorbent technologies could be suitable for applications where
inexpensive low-grade heat could be utilized in solvent regeneration. The aqueous soda
solution and the Kleener liquid can be regenerated at a relatively low temperature level
of 60–80 °C when a vacuum pump is used to create sub-atmospheric regeneration
conditions, meaning that, for instance, waste heat sources could be utilized in solvent
103
regeneration. Soda and the Kleener liquid could possibly be even suitable to remove some
common flue gas impurities like SO2 while forming compounds that could be recovered
and utilized as fertilizers. CarbonReUse’s fully electric process uses regular water without
any chemicals to capture CO2 and it offers a more modular and a fairly simple carbon
capture solution with easy retrofitting. The water-scrubbing process could be possibly
suitable for chemically sensitive industries such as the food and beverage industry and
industrial facilities that seek an easily retrofittable turnkey solution for carbon capture.
Due to the large solvent flows that occur in the process, equipment size can act as
restricting factor at large-scale. Since the CO2 capture occurs via physical absorption, the
process is more effective in applications where high CO2 concentrations occur. Capture
performance is improved by using cool absorbent water (~5 °C) and therefore utilizable
sources of cold water or other cooling loads would be beneficial regarding process
economics.
In the pilot tests the tested carbon capture technologies were proven functional in realistic
conditions while achieving promising capture performance. However, the capture cost is
often the most significant factor when evaluating competitiveness of the technologies in
the carbon capture market. Evaluation of process economics – which is also highly
dependent on the capture environment – requires more work to unravel the realistic
commercial potential of these technologies.

104
REFERENCES
Alakangas, E. Hurskainen, M. Laatikainen-Juntama, J. Korhonen, J. (2016). Suomessa
käytettävien polttoaineiden ominaisuuksia [Properties of fuels used in Finland]. VTT
Technology 258. VTT Technical Research Centre of Finland Ltd. ISBN 978-951-38-
8419-2. Available at: http://urn.fi/URN:ISBN:978-951-38-8419-2
Angelidaki, I. Treu, L. Tsapekos, P. Luo, G. Campanaro, S. Wenzel, H. Kougias, P.
(2018). Biogas upgrading and utilization: Current status and perspectives.
Biotechnology Advances, 2018, Vol.36 (2), pp.452-466. DOI
10.1016/j.biotechadv.2018.01.011.
Augustsson, O. Baburao, B. Dube, S. Bedell, S. Strunz, P. Balfe, M. Stallmann, O. (2017).
Chilled Ammonia Process Scale-up and Lessons Learned. Energy Procedia, 2017,
Vol.114, pp.5593-5615. DOI 10.1016/j.egypro.2017.03.1699.
Baker, R. Merkel, T. Freeman, B. (2018). Large Pilot Testing of the MTR Membrane
Post-Combustion CO2 Capture Process. Membrane Technology and Research, Inc.
Project Kickoff Meeting May 22, 2018. [Presentation]. [Online]. [Accessed at:
28.8.2020]. Available at: https://www.netl.doe.gov/sites/default/files/netl-file/MTR-
Kickoff-Presentation-Public-FE0031587-FOA1788.pdf
Bioenergy International. (2019a). Green CO2 essential for RE-carbonising organic
chemical and polymer industry. March 1, 2019. [Online article]. [Accessed at: 27.7.2020].
Available at: https://bioenergyinternational.com/biochemicals-materials/green-carbon-
essential-for-re-carbonising-organic-chemical-and-polymer-industry
Bioenergy International. (2019b). Stockholm Exergi to test carbon capture at Värtan
bioenergy plant. May 5, 2019. [Online article]. [Accessed at: 31.8.2020]. Available at:
https://bioenergyinternational.com/heat-power/stockholm-exergi-to-test-carbon-capture-
at-vartan-biomass-chp-plant

105
Bougie, F. & Iliuta, M. (2012). Sterically Hindered Amine-Based Absorbents for the
Removal of CO2 from Gas Streams. Journal of Chemical & Engineering Data, 2012,
Vol.57 (3), pp.635-669. DOI 10.1021/je200731v.
Broutin, P. Briot, P. Ehlers, S. Kather, A. (2017). Benchmarking of the DMXTM CO2
Capture Process. Energy Procedia, 2017, Vol.114, pp.2561-2572. DOI
10.1016/j.egypro.2017.03.1414.
Broutin, P. Carlier, V. Grancher, F. Bertucci, S. Allemand, J. Coulombet, D. Valette, P.
Baron, H. Laborie, G. Normand, L. (2018). Pilot Plant in Dunkirk for Demonstrating the
DMX TM Process. August 18, 2018. 14th Greenhouse Gas Control Technologies
Conference Melbourne 21-26 October 2018 (GHGT-14). Available at:
https://ssrn.com/abstract=3365824
Brownsort, P. (2015). Ship transport of CO2 for Enhanced Oil Recovery – Literature
Survey. Scottish Carbon Capture & Storage. Available at:
https://www.sccs.org.uk/images/expertise/misc/SCCS-CO2-EOR-JIP-Shipping.pdf
Bui, M. Adjiman, C. Bardow, A. Anthony, E. Boston, A. Brown, S. Fennell, P. Fuss, S.
Galindo, A. Hackett, L. Hallett, J. Herzog, H. Jackson, G. Kemper, J. Krevor, S. Maitland,
G. Matuszewski, M. Metcalfe, I. Petit, C. Puxty, G. Reimer, J. Reiner, D. Rubin, E. Scott,
S. Shah, N. Smit, B. Trusler, J. Webley, P. Wilcox, J. Mac Dowell, N. (2018). Carbon
capture and storage (CCS): the way forward. Energy & Environmental Science, 2018,
Vol.11(5), pp.1062-1176. DOI 10.1039/c7ee02342a.
Carbon Capture Journal. (2011). Inventys - CO2 capture for $15 per tonne. Feb 14, 2011.
[Online article]. [Accessed: 31.7.2020]. Available at:
http://www.carboncapturejournal.com/news/2896.aspx
Carroll, J. (2017). Demonstration of Advanced CO2 Capture Process Improvements for
Coal-Fired Flue Gas. United States. DOI 10.2172/1394632.

106
Chapel, D. Mariz, C. Ernest, J. (1999). Recovery of CO2 from flue gases: Commercial
trends. Canadian Society of Chemical Engineers annual meeting October 4-6, 1999,
Saskatoon, Saskatchewan, Canada.
Chapoy, A. Nazeri, M. Kapatech, M. Burgass, R. Coquelet, C. Tohidi, B. (2013). Effect
of impurities on thermophysical properties and phase behaviour of a CO2-rich system in
CCS. International Journal of Greenhouse Gas Control, 2013, Vol.19, pp.92-100. DOI
10.1016/j.ijggc.2013.08.019.
Chi, S. Rochelle, G. (2002). Oxidative Degradation of Monoethanolamine. Industrial &
Engineering Chemistry Research, 2002, Vol.41 (17), pp. 4178-4186. DOI
10.1021/ie010697c.
Climate Action Tracker. (2019). Governments still showing little sign of acting on climate
crisis. 10th of December 2019. [Online]. [Accessed: 29.6.2020]. Available at:
https://climateactiontracker.org/publications/governments-still-not-acting-on-climate-
crisis/
CLIMIT. (2020). Improved environmental knowledge about amine-based CO2 capture.
12.02.2020. [Online]. [Accessed: 24.9.2020]. Available at:
https://climit.no/en/news/improved-environmental-knowledge-about-amine-based-co2-
capture/
CRI. (2020). CRI demonstrates chemical storage of wind energy is possible at industrial
scale. June 25th, 2020. [Online]. [Accessed: 10.9.2020]. Available at:
https://www.carbonrecycling.is/news-media/2020/6/25/cri-demonstrates-chemical-
storage-of-wind-energy-is-possible-at-industrial-scale
de Visser, E. & Hendricks, C. (2007). Towards Hydrogen and Electricity Production with
Carbon Dioxide Capture and Storage: DYNAMIS CO2 quality recommendations.
DYNAMIS. Project no.: 019672.

107
Dreillard, M. Broutin, P. Briot, P. Huard, T. Lettat, A. (2017). Application of the DMXTM
CO2 Capture Process in Steel Industry. Energy Procedia, 2017, Vol.114, pp.2573-2589.
DOI 10.1016/j.egypro.2017.03.1415.
EASAC. (2018). Negative emission technologies: What role in meeting Paris Agreement
targets? European Academies' Science Advisory Council Policy Report 35. ISBN 978-3-
8047-3841-6. Available at: https://easac.eu/publications/details/easac_net/
ERA. (n.d.) Inventys To Demonstrate Carbon Capture Technology at Husky. Emissions
Reduction Albeta. [Online]. [Accessed at: 19.8.2020]. Available at:
https://eralberta.ca/story/inventys-to-demonstrate-carbon-capture-technology-at-husky/
ETIP. (2020). Hydrotreatment to HVO. European Technology and Innovation Platform
Bioenergy. [Online]. [Accessed at: 14.7.2020]. Available at:
https://www.etipbioenergy.eu/value-chains/conversion-technologies/conventional-
technologies/hydrotreatment-to-hvo
Figueroa, J. Fout, T. Plasynski, S. McIlvried, H. Srivastava, R. (2008). Advances in CO2
capture technology—The U.S. Department of Energy's Carbon Sequestration Program.
International journal of greenhouse gas control, 2008, Vol.2 (1), pp.9-20. DOI
10.1016/s1750-5836(07)00094-1.
Fluor. (2020). Company website. [Online]. [Accessed at: 7.8.2020]. Available at:
https://www.fluor.com/
Fostås, B. Gangstad, A. Nenseter, B. Pedersen, S. Sjøvoll, M. Sørensen, A. (2011). Effects
of NOx in the flue gas degradation of MEA. Energy procedia, 2011, Vol.4, pp.1566-1573.
DOI 10.1016/j.egypro.2011.02.026.
Fry, M. Ellsworth, S. Ahmad, F. Crabtree, B. (2017). Capturing and Utilizing CO2 from
Ethanol: Adding Economic Value and Jobs to Rural Economies and Communities While
Reducing Emissions. State CO2-EOR Deployment Work Group. [Online]. [Accessed at:
15.10.2020]. Available at:

108
http://www.kgs.ku.edu/PRS/ICKan/2018/March/WhitePaper_EthanolCO2Capture_Dec
2017_Final2.pdf
Fuel Cells Bulletin. (2016). FuelCell Energy and ExxonMobil to pilot MCFC carbon
capture. Fuel Cells Bulletin November 2016, Vol. 2016 (11), pp.4-5.
FuelCell Energy. (n.d) SureSource Capture. [Online brochure]. [Accessed at: 28.7.2020].
Available at: https://www.fuelcellenergy.com/recovery-2/recovery-2/
GCCSI. (2011). The costs of CO2 capture, transport and storage: Post-demonstration
CCS in the EU. Global CCS Institute, 20th July 2011. [Online]. [Accessed: 10.11.2020].
Available at: https://www.globalccsinstitute.com/resources/publications-reports-
research/the-costs-of-co2-capture-transport-and-storage-post-demonstration-ccs-in-the-
eu/
He, X. (2018). A review of material development in the field of carbon capture and the
application of membrane-based processes in power plants and energy-intensive
industries. Energy, Sustainability and Society, 2018, Vol.8 (1), pp.1-14. DOI
10.1186/s13705-018-0177-9.
Heldebrant, D. Koech, P. Glezakou, V. Rousseau, R. Malhotra, D. Cantu, D. (2017).
Water-Lean Solvents for Post-Combustion CO2 Capture: Fundamentals, Uncertainties,
Opportunities, and Outlook. Chemical reviews, 2017, Vol.117 (14), pp.9594-9624. DOI
10.1021/acs.chemrev.6b00768.
Heuberger, C & Mac Dowell, N. (2018). Real-World Challenges with a Rapid Transition
to 100% Renewable Power Systems. Joule, 2018, Vol.2 (3), pp.367-370. DOI
10.1016/j.joule.2018.02.002.
Ho, M. Allinson, G. Wiley, D. (2009). Factors affecting the cost of capture for Australian
lignite coal fired power plants. Energy Procedia, 2009, Vol.1 (1), pp.763-770. DOI
10.1016/j.egypro.2009.01.101.

109
Hu, G. Nicholas, N. Smith, K. Mumford, K. Kentish, S. Stevens, G. (2016) Carbon
dioxide absorption into promoted potassium carbonate solutions: A review. International
Journal of Greenhouse Gas Control, 2016, Vol.53, pp.28-40. DOI
10.1016/j.ijggc.2016.07.020.
Huertas, J.I. Giraldo, N. Izquierdo, S. (2011). Removal of H2S and CO2 from Biogas by
Amine Absorption. Mass Transfer in Chemical Engineering Processes, Dr. Jozef Markoš
(Ed.). ISBN 978-953-307-619-5.
Huhtinen, M. Kettunen, A. Nurminen, P. Pakkanen, H. (1994). Höyrykattilatekniikka
[Steam boiler technology]. 2nd edition. Edita, Helsinki. ISBN 951-37-1327-X.
Hupa, M. Karlström, O. Vainio, E. (2017). Biomass combustion technology development
– It is all about chemical details. Proceedings of the Combustion Institute, 2017, Vol.36
(1), pp.113-134. DOI 10.1016/j.proci.2016.06.152.
IEA. (2019a). Tracking Industry 2019. International Energy Agency, Paris. Available at:
https://www.iea.org/reports/tracking-industry
IEA. (2019b). Tracking Power 2019. International Energy Agency, Paris. Available at:
https://www.iea.org/reports/tracking-power-2019
IEA. (2019c). Putting CO2 to Use – Creating value from emissions. International Energy
Agency, Paris. Available at: https://www.iea.org/reports/putting-co2-to-use
IEAGHG. (2019a). Further assessment of emerging CO2 capture technologies for the
power sector and their potential to reduce cost. [Cousins, A. Feron, P. Hayward, J. Jiang,
K. Zhai, R.]. IEA Greenhouse Gas R&D Programme. CSIRO report EP189975, CSIRO,
Australia.
IEAGHG. (2019b). Review of Fuel Cell Technologies with CO2 Capture for the Power
Sector. IEAGHG Technical Report, 18 April 2019. Available at:
https://ieaghg.org/publications/technical-reports/reports-list/9-technical-reports

110
IEAGHG. (2013). CO2 Pipeline Infrastructure. IEAGHG Technical Report 2013/18,
December 2013. Available at: https://ieaghg.org/docs/General_Docs/Reports/2013-
18.pdf
IFPEN. (2019). Launch of the Innovative European “3D” Project for the Capture and
Storage of CO2 on an Industrial Scale. IFP Énergies Nouvelles, 28.05.2019. [Online
Press Release]. [Accessed at: 24.8.2020]. Available at:
https://www.ifpenergiesnouvelles.com/article/launch-innovative-european-3d-project-
capture-and-storage-co2-industrial-scale
Iijima, M. (2005). FLUE GAS CO2 CAPTURE (CO2 CAPTURE TECHNOLOGY OF KS
CAPTURE TECHNOLOGY OF KS-1). Mitsubishi Heavy Industries, Ltd. [Presentation].
[Online]. [Accessed at: 7.8.2020]. Available at:
https://gcep.stanford.edu/pdfs/energy_workshops_04_04/carbon_iijima.pdf
IPCC. (2018). Global Warming of 1.5°C. An IPCC Special Report on the impacts of
global warming of 1.5°C above pre-industrial levels and related global greenhouse gas
emission pathways, in the context of strengthening the global response to the threat of
climate change, sustainable development, and efforts to eradicate poverty. [Masson-
Delmotte, V., P. Zhai, H.-O. Pörtner, D. Roberts, J. Skea, P.R. Shukla, A. Pirani, W.
Moufouma-Okia, C. Péan, R. Pidcock, S. Connors, J.B.R. Matthews, Y. Chen, X. Zhou,
M.I. Gomis, E. Lonnoy, T. Maycock, M. Tignor, and T. Waterfield (eds.)]. In Press.
Jones, J. Lea-Langton, A. Ma, L. Pourkashanian, M. Williams, A. (2014). Pollutants
Generated by the Combustion of Solid Biomass Fuels. Springer, London. ISBN 978-1-
4471-6436-4.
Kaltschmitt, M. (2019). Energy from Organic Materials (Biomass). Springer, New York,
NY. ISBN 978-1-4939-7813-7.
Karl, M. Wright, R. Berglen, T. Denby, B. (2011). Worst case scenario study to assess
the environmental impact of amine emissions from a CO2 capture plant. International

111
Journal of Greenhouse Gas Control, 2011, Vol.5 (3), pp.439-447. DOI
10.1016/j.ijggc.2010.11.001.
Khan, A. Halder, G. Saha, A. (2016). Experimental investigation of sorption
characteristics of capturing carbon dioxide into piperazine activated aqueous 2-amino-
2-methyl-1-propanol solution in a packed column. International Journal of Greenhouse
Gas Control, 2016, Vol.44, pp.217-226. DOI 10.1016/j.ijggc.2015.11.020.
Kiefel, R. Lüthje, J. (2018). Conceptual Process Design: Production of Hydrotreated
Vegetable Oil as an Additive for Petro-Diesel. Aachener Verfahrenstechnik - Process
Systems Engineering, RWTH Aachen University, Aachen, Germany.
Kleener Power Solutions. (2021). Company presentation. Presented at VTT’s BECCU
Workshop, 10.2.2021. [Online]. [Accessed at: 19.2.2021]. Available at:
https://www.beccu.fi/workshop/
Knuutila, H. Svendsen, H. Anttila, M. (2009). CO2 capture from coal-fired power plants
based on sodium carbonate slurry; a systems feasibility and sensitivity study.
International journal of greenhouse gas control, 2009, Vol.3 (2), pp.143-151. DOI
10.1016/j.ijggc.2008.06.006.
Krishnamurthy, S. Rao, V. Guntuka, S. Sharratt, P. Haghpanah, R. Rajendran, A.
Amanullah, M. Karimi, I. Farooq, S. (2014). CO2 capture from dry flue gas by vacuum
swing adsorption: A pilot plant study. AIChE Journal, 2014, Vol.60 (5), pp.1830-1842.
DOI 10.1002/aic.14435.
Kuopanportti, H. Linnanen, T. (2014). Menetelmä ja järjestelmä hiilidioksidin talteen
ottamiseksi kaasusta [Method and system for recovery of carbon dioxide from gas].
Patent publication FI124060B.
Kuparinen, K. (2019). Transforming the chemical pulp industry: From an emitter to a
source of negative CO2 emissions. Doctoral dissertation, Lappeenranta-Lahti University

112
of Technology LUT, School of Energy Systems. Available at:
http://urn.fi/URN:ISBN:978-952-335-423-4
Lail, M. (2016). Bench-Scale Development of a Non-Aqueous Solvent (NAS) CO2
Capture Process for Coal-Fired Power Plants (DE-FE0013865). RTI International.
August 11, 2016. [Online presentation]. Available at:
https://www.netl.doe.gov/sites/default/files/event-
proceedings/2016/c02%20cap%20review/4-Thursday/M-Lail-RTI-Non-Aqueous-
Solvent-CO2-Capture.pdf
Lecomte, T. Ferrería de la Fuente, J. Neuwahl, F. Canova, M. Pinasseau, A. Jankov, I.
Brinkmann, T. Roudier, S. Delgado Sancho, L. (2017). Best Available Techniques (BAT)
Reference Document for Large Combustion Plants. EUR 28836 EN. Publications Office
of the European Union. DOI 10.2760/949.
Lehtonen, J. Järnefelt, V. Alakurtti, S. Arasto, A. Hannula, I. Harlin, A. Koljonen, T.
Lantto, R. Lienemann, M. Onarheim, K. Pitkänen, J-P. Tähtinen, M. (2019). The Carbon
Reuse Economy: Transforming CO2 from a pollutant into a resource. VTT Technical
Research Centre of Finland. DOI 10.32040/2019.978-951-38-8709-4.
Levihn, F. Linde, L. Gustafsson, K. Dahlen, E. (2019). Introducing BECCS through HPC
to the research agenda: The case of combined heat and power in Stockholm. Energy
Reports, 2019, Vol.5, pp.1381. DOI 10.1016/j.egyr.2019.09.018.
Li, K. Yu, H. Yan, S. Feron, P. Wardhaugh, L. Tade, M. (2016). Technoeconomic
Assessment of an Advanced Aqueous Ammonia-Based Postcombustion Capture Process
Integrated with a 650-MW Coal-Fired Power Station. Environmental Science &
Technology, 2016, Vol.50 (19), pp.10746-10755. DOI 10.1021/acs.est.6b02737.
Linnanen, T. (2012). CO2:n fysikaaliset erotusprosessit savukaasuista – vesiabsorption
soveltuvuus ja kustannukset [Physical processes of CO2 separation from fuel gases –
application and costs of water absorption]. Mikkeli University of Applied Sciences.
Confidential research report.

113
Lockwood, T. (2017). A Comparative Review of Next-generation Carbon Capture
Technologies for Coal-fired Power Plant. Energy Procedia, 2017, Vol.114, pp.2658-
2670. DOI 10.1016/j.egypro.2017.03.1850.
Luis, P. (2015). Use of monoethanolamine (MEA) for CO2 capture in a global scenario:
Consequences and alternatives. Desalination, 2016, Vol.380, pp.93-99. DOI
10.1016/j.desal.2015.08.004.
Lu, Y. DeVries, N. Ruhter, D. Sahu, M. Ye, Q. Ye, X. Zhang, S. Chen, S. Li, Z. O'Brien,
K. (2014). Bench-Scale Development of a Hot Carbonate Absorption Process with
Crystallization-Enabled High-Pressure Stripping for Post-Combustion CO2 Capture.
Univ. of Illinois at Urbana-Champaign, IL, United States. DOI 10.2172/1134749.
Mansfield, A. Wooldridge, M. (2015). The effect of impurities on syngas combustion.
Combustion and Flame, 2015, Vol.162 (5), pp.2286-2295. DOI
10.1016/j.combustflame.2015.01.026.
Marker, T. L. (2005). Opportunities for Biorenewables in Oil Refineries. United States.
DOI 10.2172/861458.
McGurk, S.Martín, C. Brandani, S. Sweatman, M. Fan, X. (2017). Microwave swing
regeneration of aqueous monoethanolamine for post-combustion CO2 capture. Applied
Energy, 2017, Vol.192, pp.126-133. DOI 10.1016/j.apenergy.2017.02.012.
Merkel, T. (2018). Scale-Up and Testing of Advanced Polaris Membrane CO2 Capture
Technology. NETL Project FE0031591. [Online]. [Accessed at: 28.8.2020]. Available at:
https://www.netl.doe.gov/node/7142
MHI. (2020). Negative emissions pioneer Drax and leading global carbon capture
company - Mitsubishi Heavy Industries group - announce new BECCS pilot. Mitsubishi
Heavy Industries, Ltd. Global Website. Press information, 2020-06-24. [Online].
[Accessed at: 3.8.2020]. Available at: https://www.mhi.com/news/story/200624.html

114
MHI. (n.d). CO2 Recovery Plants. Mitsubishi Heavy Industries, Ltd. Global Website.
[Online]. [Accessed at: 3.8.2020]. Available at:
https://www.mhi.com/products/environment/carbon_dioxide_recovery_process.html
MTR. (2020a). Carbon Capture. [Company website]. [Online]. [Accessed at: 19.8.2020].
Available at: https://www.mtrinc.com/our-business/carbon-capture/
MTR. (2020b). Large Pilot Testing of the MTR Membrane Post-Combustion CO2
Capture Process. News Release. [Online]. [Accessed at: 14.9.2020]. Available at:
https://www.mtrinc.com/news/large-pilot-testing-of-the-mtr-membrane-post-
combustion-co-2-capture-process/
Mumford, K. Smith, K. Anderson, C. Shen, S. Tao, W. Suryaputradinata, Y. Qader, A.
Hooper, B. Innocenzi, R. Kentish, S. Stevens, G. (2012). Post-combustion capture of
CO2: Results from the solvent absorption capture plant at Hazelwood power station using
potassium carbonate solvent. Energy and Fuels, 2012, Vol.26 (1), pp.138-146. DOI
10.1021/ef201192n.
Mumford, K. Wu, Y. Smith, K. Stevens, G. (2015). Review of solvent based carbon-
dioxide capture technologies. Frontiers of Chemical Science and Engineering, 2015,
Vol.9 (2), pp.125-141. DOI 10.1007/s11705-015-1514-6.
Nakao, S. Yogo, K. Goto, K. Kai, T. Yamada, H. (2019). Advanced CO2 Capture
Technologies: Absorption, Adsorption, and Membrane Separation Methods. Springer
International Publishing 2019. 1st ed. 2019. ISBN 978-3-030-18857-3.
Nemitallah, M. Habib, M. Badr, H. (2019). Oxyfuel Combustion for Clean Energy
Applications. Springer International Publishing 2019. 1st ed. ISBN 978-3-030-10587-7.
Neste. (2020). NEXBTL technology is our own innovation. [Online]. [Accessed at:
14.7.2020]. Available at: https://www.neste.com/about-neste/who-we-
are/production/nexbtl-technology
115
Nohrstedt, L. (2019). Första steget mot bio-CCS i Stockholm [The first step towards bio-
CCS in Stockholm]. NyTeknik, 30.4.2019. [Online article]. [Accessed at: 31.8.2020].
Available at: https://www.nyteknik.se/miljo/forsta-steget-mot-bio-ccs-i-stockholm-
6957004
Onarheim, K. Santos, S. Kangas, P. Hankalin, V. (2017). Performance and cost of CCS
in the pulp and paper industry part 2: Economic feasibility of amine-based post-
combustion CO2 capture. International Journal of Greenhouse Gas Control, 2017,
Vol.66, pp.60-75. DOI 10.1016/j.ijggc.2017.09.010.
Park, Y. Jo, S. Kyung, D. Kim, J. Yi, C. Ryu, C. Shin, M. (2014). Test Operation Results
of the 10 MWe-scale Dry-sorbent CO2 Capture Process Integrated with a Real Coal-
fired Power Plant in Korea. Energy Procedia, 2014, Vol.63, pp.2261-2265. DOI
10.1016/j.egypro.2014.11.245.
Rabensteiner, M. Kinger, G. Koller, M. Hochenauer, C. (2016). Pilot plant study of
aqueous solution of piperazine activated 2-amino-2-methyl-1-propanol for post
combustion carbon dioxide capture. International journal of greenhouse gas control,
2016, Vol.51, pp.106-117. DOI 10.1016/j.ijggc.2016.04.035.
Rabindran, P. Cote, H. Winning, I. (2011). Integrity management approach to reuse of
oil gas pipelines for CO2 transportation. 6th Pipeline technology conference, 2011.
Available at: https://www.pipeline-
conference.com/sites/default/files/papers/Rabindran_0.pdf
Ram, M. Bogdanov, D. Aghahosseini, A. Gulagi, A. Oyewo, A.S. Child, M. Caldera, U.
Sadovskaia, K. Farfan, J. Barbosa, LSNS. Fasihi, M. Khalili, S. Dalheimer, B. Gruber, G.
Traber, T. De Caluwe, F. Fell, H.-J. Breyer, C. (2019). Global Energy System based on
100% Renewable Energy – Power, Heat, Transport and Desalination Sectors. Study by
Lappeenranta University of Technology and Energy Watch Group, Lappeenranta, Berlin,
March 2019. ISBN 978-952-335-339-8.

116
Rauch, R. Hrbek, J. Hofbauer, H. (2014). Biomass gasification for synthesis gas
production and applications of the syngas. Wiley Interdisciplinary Reviews: Energy and
Environment, 2014, Vol.3(4), pp.343–362. DOI 10.1002/wene.97.
Reddy, S. Scherffius, J. Freguia, S. (2003). Fluor's Econamine FG PlusSM technology -
An enhanced amine-based CO2 capture process. 2nd Annual Conference on Carbon
Sequestration. National Energy Technology Laboratory/Department of Energy
Alexandria, VA May 5-8, 2003.
REN21. (2020). Renewables 2020 Global Status Report. Paris: REN21 Secretariat. ISBN
978-3-948393-00-7. Available at: https://www.ren21.net/reports/global-status-report/
RTI. (2020). eCO2Sol™—Improving Sustainability of Fossil Fuel Resources.
[Brochure]. [Online]. [Accessed at: 1.10.2020]. Available at:
https://www.rti.org/brochures/eco2sol%E2%84%A2%E2%80%94improving-
sustainability-fossil-fuel-resources
Rheinhardt, J. Singh, P. Tarakeshwar, P. Buttry, D. (2017). Electrochemical capture and
release of carbon dioxide. ACS Energy Letters, 2017, Vol.2 (2), pp.454-461. DOI
10.1021/acsenergylett.6b00608.
Ritter, J. (2015). Rapid Pressure Swing Adsorption for CO2 Capture. University of South
Carolina, 2015 NETL CO2 Capture Technology Meeting, Pittsburgh, PA, June 2015.
[Presentation]. [Online]. [Accessed at: 8.8.2020]. Available at:
https://www.netl.doe.gov/node/1618
Ryckebosch, E. Drouillon, M. Vervaeren, H. (2011). Techniques for transformation of
biogas to biomethane. Biomass and Bioenergy, 2011, Vol.35 (5), pp.1633-1645. DOI
10.1016/j.biombioe.2011.02.033.
Ryser, J. (2020). DOE hopes to see carbon capture costs cut 50%; NETL says it has
stored 10 million mt of CO2. S&P Global, 10th of June 2020. [Online]. [Accessed at:
29.9.2020]. Available at: https://www.spglobal.com/platts/en/market-insights/latest-

117
news/natural-gas/061020-doe-hopes-to-see-carbon-capture-costs-cut-50-netl-says-it-
has-stored-10-million-mt-of-co2
Sanchez, D. Johnson, N. Mccoy, S. Turner, P. Mach, K. (2018). Near-term deployment
of carbon capture and sequestration from biorefineries in the United States. Proceedings
of the National Academy of Sciences of the United States of America, 2018, Vol.115
(19), pp.4875-4880. DOI 10.1073/pnas.1719695115.
Sgouridis, S. Carbajales-Dale, M. Csala, D. Chiesa, M. Bardi, U. (2019). Comparative
net energy analysis of renewable electricity and carbon capture and storage. Nature
Energy, 2019, Vol.4 (6), pp.456-465. DOI 10.1038/s41560-019-0365-7.
Shell. (2020). CARBON CAPTURE AND STORAGE PROJECTS. Company website.
[Online]. [Accessed at: 2.10.2020]. Available at:
https://www.shell.com/sustainability/environment/climate-change/carbon-capture-and-
storage-projects.html
Singh, A. Stéphenne, K. (2014). Shell Cansolv CO2 capture technology: Achievement
from First Commercial Plant. Energy Procedia, 2014, Vol.63, pp.1678-1685. DOI
10.1016/j.egypro.2014.11.177.
Smith, K. Xiao, G. Mumford, K. Gouw, J. Indrawan, I. Thanumurthy, N. Quyn, D.
Cuthbertson, R. Rayer, A. Nicholas, N. Lee, A. Da Silva, G. Kentish, S. Harkin, T. Qader,
A. Anderson, C. Hooper, B. Stevens, G. (2014). Demonstration of a Concentrated
Potassium Carbonate Process for CO2 Capture. Energy & Fuels, 2014, Vol.28 (1),
pp.299-306. DOI 10.1021/ef4014746.
Smith, K. Harkin, T. Mumford, K. Kentish, S. Qader, A. Anderson, C. Hooper, B.
Stevens, G. (2017). Outcomes from pilot plant trials of precipitating potassium carbonate
solvent absorption for CO2 capture from a brown coal fired power station in Australia.
Fuel processing technology, 2017, Vol.155, pp.252-260. DOI
10.1016/j.fuproc.2016.08.008.
118
Spietz, T. Dobras, S. Chwoła, T. Wilk, A. Krótki, A. Więcław-Solny, L. (2020).
Experimental results of amine emission from the CO2 capture process using 2-amino-2-
methyl-1-propanol (AMP) with piperazine (PZ). International journal of greenhouse gas
control, 2020, Vol.102, pp.103155. DOI 10.1016/j.ijggc.2020.103155.
St1. (2020). Advanced fuels from waste. Company website. [Online]. [Accessed at:
28.8.2020]. Available at: https://www.st1.com/about-st1/company-information/areas-
operations/advanced-fuels-waste
Stiernstedt, J. (2019). Teknik för att fånga in koldioxid testas i Stockholm. [Technology
for capturing carbon dioxide is being tested in Stockholm]. Dagens industri, 29th of April
2019. [Online article]. [Accessed at: 6.10.2020]. Available at: https://www.di.se/hallbart-
naringsliv/teknik-for-att-fanga-in-koldioxid-testas-i-stockholm/
Svendsen, H. (2014) State of the art on post combustion capture technologies. 7th Dutch
CCS Symposium Amsterdam, 19-20 June 2014. [Presentation]. [Online]. [Accessed at:
7.8.2020]. Available at: https://www.co2-cato.org/publications/library1/state-of-the-art-
on-post-combustion-capture-technologies
Tabatabaei, M. Ghanavati, H. (2018). Biogas: Fundamentals, Process, and Operation.
Biofuel and Biorefinery Technologies, Vol. 6. Springer International Publishing. ISBN
978-3-319-77334-6.
Tanaka, H. Tsujiuchi, T. Kamijo, T. Kishimoto, S. Lin, Y. Kawasaki, S. Nakagami, Y.
Nojo, T. (2018). Advanced KM CDR Process Using New Solvent. 14th Greenhouse Gas
Control Technologies Conference Melbourne 21-26 October 2018 (GHGT-14), Available
at SSRN: https://ssrn.com/abstract=3366174
Tanthana, J. Mobley, P. Rayer, A. Gupta, V. Thornburg, J. Chartier, R. Soukri, M. Lail,
M. (2019). Emissions Mitigation Technology for Advanced Water-Lean Solvent Based
CO2 Capture Processes. Carbon Capture, Utilization, Storage, and Oil & Gas
Technologies Integrated Review Meeting, Aug. 26th, 2019. [Presentation]. [Online].

119
[Accessed at: 2.10.2020]. Available at: https://netl.doe.gov/sites/default/files/netl-file/J-
Tanthana-RTI-Solvent-Emissions-Mitigtion.pdf
Teir, S. Pikkarainen, T. Kujanpää, L. Tsupari, E. Kärki, J. Arasto, A. Aatos, S. (2011).
Hiilidioksidin talteenotto ja varastointi (CCS), Teknologiakatsaus [Carbon capture and
storage (CCS), Technology review]. VTT Working Papers 161. ISBN 978-951-38-7503-
9.
Teir, S. Suomalainen, M. Onarheim, K. (2014). Pre-evaluation of a new process for
capture of CO2 using water. VTT Research Report, VTT-R-04035-14.
United Nations Environment Programme. (2019). Emissions Gap Report 2019. UNEP,
Nairobi. Available at: https://www.unenvironment.org/resources/emissions-gap-report-
2019
UNO. (2014). UNO Technology Pty Ltd. [Company website]. [Online]. [Accessed at:
23.7.2020]. Available at: http://unotech.com.au/
UNO. (2020). Australia – U.S. partners to capture carbon more cheaply. Media release,
30th of July 2020. [Online]. [Accessed at: 10.9.2020]. Available at:
http://unotech.com.au/news/
U.S. DOE. (n.d.). Pre-Combustion Carbon Capture Research. United States Department
of Energy, Office of Fossil Energy. [Online]. [Accessed at: 14.7.2020]. Available at:
https://www.energy.gov/fe/science-innovation/carbon-capture-and-storage-
research/carbon-capture-rd/pre-combustion-carbon
Vakkilainen, E. (2016). Steam Generation from Biomass: Construction and Design of
Large Boilers. Oxford: Elsevier Science & Technology, 2016. ISBN: 978-0-12-804389-
9.
Vassilev, S. Baxter, D. Andersen, L. Vassileva, C. (2010). An overview of the chemical
composition of biomass. Fuel, 2010, Vol.89 (5), pp.913-933. DOI
10.1016/j.fuel.2009.10.022.
120
Versteeg, P. Rubin, E. (2011). A technical and economic assessment of ammonia-based
post-combustion CO2 capture at coal-fired power plants. International journal of
greenhouse gas control, 2011, Vol.5 (6), pp.1596-1605. DOI 10.1016/j.ijggc.2011.09.006
Winberg, I. Mäki, E. (2020). CO2 Market outlook. VTT. Available at:
https://www.decarbonate.fi/publications/
World Bioenergy Association. (2019). Global Bioenergy Statistics 2019. Available at:
https://worldbioenergy.org/global-bioenergy-statistics
Wilcox, J. (2012). Carbon Capture. Springer New York: Imprint: Springer 2012. ISBN
978-1-4614-2214-3.
Wyoming ITC. (2018). Wyoming ITC Announces Partnership on Large-Scale Pilot
Project. Wyoming Integrated Test Center. News Release, August 13, 2018. [Online].
[Accessed at: 28.8.2020]. Available at: https://www.wyomingitc.org/media/
XPRT. (n.d.) VeloxoTherm™ - Carbon Capture Process System. [Online]. [Accessed at:
31.7.2020]. Available at: https://www.xprt.com/products/veloxotherm-carbon-capture-
process-system-302992
Xu, Y. Isom, L. Hanna, M. A. (2010). Adding value to carbon dioxide from ethanol
fermentations. Bioresource Technology, 2010, Vol.101 (10), pp.3311-3319. DOI
10.1016/j.biortech.2010.01.006.
Yang, N. Yu, H. Li, L. Xu, D. Han, W. Feron, P. (2014). Aqueous Ammonia (NH3) Based
Post Combustion CO2 Capture: A Review. Oil & Gas Science and Technology, Rev. Ifp
Energies Nouvelles, 2014, Vol.69 (5), pp.931-945. DOI 10.2516/ogst/2013160.
Yi, C. (2017). 10 MW Dry CO2 Capture Plant in Korea. Korea Institute of Energy
Research (KIER). ITCN Meeting, June 7th, 2017. Beijing, China. [Presentation].
[Online]. [Accessed at: 2.10.2020]. Available at: https://itcn-
global.org/downloads/meeting-notes/AGM-2017/KIER-ITCN-AGM-7.10.17.pdf

121
Yu, H. Qi, G. Wang, S. Morgan, S. Allport, A. Cottrell, A. Do, T. McGregor, J.
Wardhaugh, L. Feron, P. (2012). Results from trialling aqueous ammonia-based post-
combustion capture in a pilot plant at Munmorah Power Station: Gas purity and solid
precipitation in the stripper. International Journal of Greenhouse Gas Control, 2012,
Vol.10, pp.15-25. DOI 10.1016/j.ijggc.2012.04.014.
Zagala, M. & Abdelaal, H. (2017). Flue Gas Cleaning Systems – A Review Paper.
Proceedings of the 5th Conference on Contemporary Problems of Power Engineering and
Environmental Protection, At Gliwice, Poland. [Conference paper]. Available at:
https://www.researchgate.net/publication/330811594_Flue_Gas_Cleaning_Systems-
A_Review_Paper
Zhou, S. Wang, S. Sun, C. Chen, C. (2013). SO2 effect on degradation of MEA and some
other amines. Energy Procedia, 2013, Vol. 37, pp. 896-904. DOI
10.1016/j.egypro.2013.05.184.
Zhou, J. Tanthana, J. Mobley, P. Rabindran, A. Gupta, V. Lesemann, M. Soukri, M. Lail,
M. Tobiesen, A. Mejdell, T. Aronu, U. Grimstvedt, A. Hjarbo, K. Hovdahl, L. (2018).
Pilot Testing of a Non-Aqueous Solvent (NAS) CO2 Capture Process. 14th Greenhouse
Gas Control Technologies Conference Melbourne 21-26 October 2018 (GHGT-14),
Available at: https://ssrn.com/abstract=3365724
Ziaii, S. Rochelle, G. Edgar, T. (2009). Dynamic Modeling to Minimize Energy Use for
CO2 Capture in Power Plants by Aqueous Monoethanolamine. Industrial & Engineering
Chemistry Research, 2009, Vol.48(13), pp.6105–6111. DOI 10.1021/ie801385q.

122
APPENDIX I: Schematic structure of the 50 kW CFB pilot