Effects of unipolar stimulation on voltage and calcium distributions in the isolated rabbit heart
21
Effects of unipolar stimulation on voltage and calcium distributions in the isolated rabbit heart Veniamin Y. Sidorov, Ph.D. 1,2,3 , Mark R. Holcomb, Ph.D. 2 , Marcella C. Woods, Ph.D. 1 , Richard A. Gray, Ph.D. 1,3,5 , and John P. Wikswo, Ph.D. 1,2,3,4 1 Department of Biomedical Engineering, Vanderbilt University, Nashville, Tennessee 2 Department of Physics and Astronomy, Vanderbilt University, Nashville, Tennessee 3 Vanderbilt Institute for Integrative Biosystems Research and Education, Vanderbilt University, Nashville, Tennessee 4 Department of Molecular Physiology and Biophysics, Vanderbilt University, Nashville, Tennessee 5 Department of Biomedical Engineering, University of Alabama, Birmingham, Alabama Abstract Background—The effect of electric stimulation on the polarization of cardiac tissue (virtual electrode effect) is well-known; the corresponding response of intracellular calcium concentration ([Ca 2+ ] i ) and its dependence on coupling interval between conditioning stimulus (S1) and test stimulus (S2) has yet to be elucidated. Objective—Because uncovering the transmembrane potential (V m ) - [Ca 2+ ] i relationship during an electric shock is imperative for understanding arrhythmia induction and defibrillation, we aimed to study simultaneous V m and [Ca 2+ ] i responses to strong unipolar stimulation. Methods—We used a dual-camera optical system to image concurrently V m and [Ca 2+ ] i responses to unipolar stimulation (20 ms, ±20 mA) in Langendorff-perfused rabbit hearts. RH-237 and Rhod-2 fluorescent dyes were used to measure V m and [Ca 2+ ] i , respectively. The S1-S2 interval ranged from 10 to 170 ms to examine stimulation during the action potential. Results—The [Ca 2+ ] i deflections were less pronounced than changes in V m for all S1-S2 intervals. For cathodal stimulation, [Ca 2+ ] i at the central virtual cathode region increased with prolongation of S1-S2 interval. For anodal stimulation, [Ca 2+ ] i at the central virtual anode area decreased with shortening of the S1-S2 interval. At very short S1-S2 intervals (10-20 ms), when S2 polarization was superimposed on the S1 action potential upstroke, the [Ca 2+ ] i distribution did not follow V m and produced a more complex pattern. After S2 termination [Ca 2+ ] i exhibited three outcomes in a manner similar to V m : non-propagating response, break stimulation, and make stimulation. Conclusions—Changes in the [Ca 2+ ] i distribution correlate with the behavior of the V m distribution for S1-S2 coupling intervals longer than 20 ms; at shorter intervals S2 creates more heterogeneous [Ca 2+ ] i distribution in comparison with V m . Stimulation in diastole and at very short coupling intervals caused V m - [Ca 2+ ] i uncoupling at the regions of positive polarization (virtual cathode). Keywords calcium dynamics; cardiac electrophysiology; membrane potential; optical mapping Corresponding author: Dr. John P. Wikswo Department of Physics and Astronomy Vanderbilt University VU Station B 351807 Nashville, TN 37235-1807 Email: [email protected] Tel: 615-343-4124 Fax: 615-322-4977. NIH Public Access Author Manuscript Basic Res Cardiol. Author manuscript; available in PMC 2009 November 1. Published in final edited form as: Basic Res Cardiol. 2008 November ; 103(6): 537–551. doi:10.1007/s00395-008-0740-1. NIH-PA Author Manuscript NIH-PA Author Manuscript NIH-PA Author Manuscript
-
Upload
independent -
Category
Documents
-
view
2 -
download
0
Transcript of Effects of unipolar stimulation on voltage and calcium distributions in the isolated rabbit heart
Effects of unipolar stimulation on voltage and calciumdistributions in the isolated rabbit heart
Veniamin Y. Sidorov, Ph.D.1,2,3, Mark R. Holcomb, Ph.D.2, Marcella C. Woods, Ph.D.1,Richard A. Gray, Ph.D.1,3,5, and John P. Wikswo, Ph.D.1,2,3,41Department of Biomedical Engineering, Vanderbilt University, Nashville, Tennessee2Department of Physics and Astronomy, Vanderbilt University, Nashville, Tennessee3Vanderbilt Institute for Integrative Biosystems Research and Education, Vanderbilt University,Nashville, Tennessee4Department of Molecular Physiology and Biophysics, Vanderbilt University, Nashville, Tennessee5Department of Biomedical Engineering, University of Alabama, Birmingham, Alabama
AbstractBackground—The effect of electric stimulation on the polarization of cardiac tissue (virtualelectrode effect) is well-known; the corresponding response of intracellular calcium concentration([Ca2+]i) and its dependence on coupling interval between conditioning stimulus (S1) and teststimulus (S2) has yet to be elucidated.
Objective—Because uncovering the transmembrane potential (Vm) - [Ca2+]i relationship during anelectric shock is imperative for understanding arrhythmia induction and defibrillation, we aimed tostudy simultaneous Vm and [Ca2+]i responses to strong unipolar stimulation.
Methods—We used a dual-camera optical system to image concurrently Vm and [Ca2+]i responsesto unipolar stimulation (20 ms, ±20 mA) in Langendorff-perfused rabbit hearts. RH-237 and Rhod-2fluorescent dyes were used to measure Vm and [Ca2+]i, respectively. The S1-S2 interval ranged from10 to 170 ms to examine stimulation during the action potential.
Results—The [Ca2+]i deflections were less pronounced than changes in Vm for all S1-S2 intervals.For cathodal stimulation, [Ca2+]i at the central virtual cathode region increased with prolongation ofS1-S2 interval. For anodal stimulation, [Ca2+]i at the central virtual anode area decreased withshortening of the S1-S2 interval. At very short S1-S2 intervals (10-20 ms), when S2 polarization wassuperimposed on the S1 action potential upstroke, the [Ca2+]i distribution did not follow Vm andproduced a more complex pattern. After S2 termination [Ca2+]i exhibited three outcomes in a mannersimilar to Vm: non-propagating response, break stimulation, and make stimulation.
Conclusions—Changes in the [Ca2+]i distribution correlate with the behavior of the Vmdistribution for S1-S2 coupling intervals longer than 20 ms; at shorter intervals S2 creates moreheterogeneous [Ca2+]i distribution in comparison with Vm. Stimulation in diastole and at very shortcoupling intervals caused Vm - [Ca2+]i uncoupling at the regions of positive polarization (virtualcathode).
Keywordscalcium dynamics; cardiac electrophysiology; membrane potential; optical mapping
Corresponding author: Dr. John P. Wikswo Department of Physics and Astronomy Vanderbilt University VU Station B 351807Nashville, TN 37235-1807 Email: [email protected] Tel: 615-343-4124 Fax: 615-322-4977.
NIH Public AccessAuthor ManuscriptBasic Res Cardiol. Author manuscript; available in PMC 2009 November 1.
Published in final edited form as:Basic Res Cardiol. 2008 November ; 103(6): 537–551. doi:10.1007/s00395-008-0740-1.
NIH
-PA Author Manuscript
NIH
-PA Author Manuscript
NIH
-PA Author Manuscript
IntroductionThe intracellular calcium concentration ([Ca2+]i) plays a central role in the process ofexcitation-contraction coupling [33]. The behavior of [Ca2+]i is tightly coupled withtransmembrane potential (Vm) dynamics and is governed by sarcolemmal Ca2+ fluxes and byCa2+-transporting systems of the sarcoplasmic reticulum (SR) and mitochondria [4,42]. Innormal conditions the activation of Ca2+ release from the SR is controlled by means of theCa2+-induced Ca2+ release mechanism mediated by sarcolemmal Ca2+ channels [5].
Alteration of the normal Vm - [Ca2+]i relationship can underlie ectopic arrhythmias, such asthose occurring during delayed afterdepolarizations [61] when SR Ca2+ overload promotesrelease of Ca2+ from the SR and activation of [Ca2+]i-dependent currents, resulting in thegeneration of an action potential (AP) [51]. Because Vm - [Ca2+] cycling is coupledbidirectionally [50] their relationship becomes more complex during ventricular tachycardia(VT) [12] and especially during ventricular fibrillation (VF) when Ca2+ waves could eitherprecede or follow membrane depolarization [46]. However, the primary role of the Vm -[Ca2+]i dissociation with respect to wave fragmentation remains controversial [64].
Since there is strong coupling between Vm and [Ca2+]i, it is reasonable to expect involvementof [Ca2+]i in the process of defibrillation. Recently Hwang et al. observed that shock-inducedhigh [Ca2+]i heterogeneity is followed by an unsuccessful defibrillation shock and the regionsof lower [Ca2+]i were associated with first postshock activation [30]. On the single cell levelthe effect of electric field stimulation on the calcium transients (CT) was investigated bySharma and Tung who showed uniform field-mediated polarization of the cell membrane canproduce spatial heterogeneity of [Ca2+]i in isolated guinea pig cardiomyocytes [54]. Elegantstudies of Vm - [Ca2+]i relationship during field shock were conducted in Vladimir Fast'slaboratory [20,48]. The authors demonstrated shock-induced reduction of [Ca2+]i in both thepositively and negatively polarized sides of cultured cell strips obtained from neonatal ratmyocytes [20]. They showed that current through the L-type voltage-dependent Ca2+ channels(ICaL) may play an important role in the decrease of [Ca2+]i. In spite of the importantcontribution of this work it should be noted that developmental differences between neonataland maturated cardiomyocytes, including T-tubular and SR structures [44,45], ryanodinereceptor sensitivity [13,65], and variation in sarcolemmal Ca2+ channel activity [18,23,27,60], could modify the Ca2+ response to electric shock in these two types of cells.
It is known that electric field stimulation of cardiac tissue occurs via virtual electrodemechanisms and that bidomain properties play a key role in this process [52,53]. Unipolarstimulation creates a polarization pattern consisting of a central dog-bone shaped area with thepolarity of the stimulus flanked by two virtual electrode regions of opposite polarity [37,43,66]. In our work we utilized unipolar electrical stimulation of the isolated rabbit heart toproduce predictable virtual electrode polarization patterns and investigate systematically, forthe first time, the spatio-temporal distributions of [Ca2+]i and the Vm - [Ca2+]i relationshipthrough the cardiac cycle as well as test the hypothesis that the Vm - [Ca2+]i relationship duringelectrical stimulation of adult cardiac cells in the whole heart preparation differs from theVm - [Ca2+]i relationship in a monolayer of neonatal cardiomyocytes in a culture dish due todevelopmental and anatomical differences.
Sidorov et al. Page 2
Basic Res Cardiol. Author manuscript; available in PMC 2009 November 1.
NIH
-PA Author Manuscript
NIH
-PA Author Manuscript
NIH
-PA Author Manuscript
MethodsExperimental Preparation
All experiments were conducted in accordance with the National Institutes of Healthregulations for the ethical use of animals in research and were approved in advance by theVanderbilt Institutional Animal Care and Use Committee.
New Zealand white rabbits (N = 7) of either sex weighing 2.7 to 3.1 kg were used in theexperiments. The detailed description of the heart preparation has been published previously[56]. The animals were preanesthetized with ketamine (50 mg/kg), heparinized (1,000 units)and anesthetized with sodium pentobarbital (60 mg/kg). The heart was quickly removed fromthe chest and mounted on a Langendorff apparatus for retrograde perfusion with oxygenatedTyrode's solution of the following composition (mM): 133 NaCl, 4 KCl, 2 CaCl2, 1 MgCl2,1.5 NaH2PO4, 20 NaHCO3, and 10 glucose. The excitation-contraction uncoupler 2,3-butanedione monoxime (BDM [Sigma-Aldrich, St. Louis, MO]) was added to the perfusate(15 mM) to eliminate contractile optical artifacts. The hearts were exposed to air during theexperiments. To stain the heart with the calcium-sensitive dye Rhod-2AM [11,46,49], 1 mLof the dye stock solution (0.5 mg/mL DMSO) was slowly delivered via an injection port abovethe aorta. Thereafter 10 μL of the voltage-sensitive dye RH-237 (1 mg/mL DMSO) wasgradually administered through the same injection port.
To examine the potential effect of BDM on the calcium response, an additional series ofexperiments (N = 3) with blebbistatin (Sigma-Aldrich, St. Louis, MO) as the excitation-contraction uncoupler [16,21] were conducted. Stock solution of blebbistatin (2.5 mg/mLDMSO) was added to the perfusate to obtain a concentration of 3 μM. In these experimentsthe hearts were stained only with the calcium-sensitive dye Rhod-2AM.
Optical SystemFor the hearts stained with both RH-237 and Rhod-2AM a dual-camera system was used[28]. Each DALSA CCD camera (DS-12-16K5H, 128×128 pixels, 490 fps, Dalsa Inc.,Waterloo, ON, Canada) is supported by a custom mount on a tilt rotation stage (NewportP080N, Irvine, CA), which allows quick and accurate mechanical alignment of the cameras.The base plate accommodates the cameras horizontally and allows various combinations oflenses and working distances. A dichroic mirror is situated at 45 degrees with respect to bothcameras and reflects the [Ca2+] signal (< 635 nm) and transmits the Vm signal (>635 nm). TheVm camera uses a 710 nm long pass filter (710AELP, Omega Optical), and the [Ca2+] camerauses a 585 ± 20 nm band pass filter (585AF40, Omega Optical). Both cameras have a lens (25mm 1” format C-mount, Navitar) to which the filters are attached by a custom connector. Themagnification was adjusted to focus on a 15 × 15 mm2 area. Two Bitflow R3 frame grabbers(Bitflow, Boston, MA) and a timer board (National Instruments PCI 6602) are installed in aDell 650 Pentium IV/3 GHz Precision Workstation to synchronize the cameras and controlstimulation. Custom-developed “C”-based software controls data acquisition, camerasynchronization, external stimulation and laser illumination. The fluorescence is excited bydiode-pumped, solid-state laser (Verdi, Coherent, Santa Clara, CA) at a wavelength of 532 nm.
In the blebbistatin experiments in which only Rhod-2AM was used, a single high-speed, lower-noise RedShirt CCD camera (14-bit, 80×80 pixels, 1000 fps, CardioCCD-SMQ, RedShirtImaging) was utilized to image [Ca2+]i over 8 × 8 mm2. The band pass filter (585AF40, OmegaOptical) and lens (25 mm 1″ format C-mount, Navitar) were the same as in DALSA dual-camera setup.
Sidorov et al. Page 3
Basic Res Cardiol. Author manuscript; available in PMC 2009 November 1.
NIH
-PA Author Manuscript
NIH
-PA Author Manuscript
NIH
-PA Author Manuscript
Stimulation ProtocolThe anterior left ventricle was mapped. The heart was continuously paced (2 ms duration, 2×diastolic threshold) at a cycle length of 300 ms via a bipolar platinum electrode [56] placed onthe right ventricle close to the septum, 8–9 mm from the unipolar testing electrode. The unipolartesting electrode (delivering the S1 conditioning stimuli and S2 test stimuli), also made fromplatinum wire (0.25-mm diameter), was positioned on the anterior left ventricle, and thecameras' fields of view were centered with respect to the testing electrode. For the S1conditioning stimuli (2-ms duration), the current strength was set slightly above diastolicthreshold and the interval between S1 and the previous pacing stimulus was 300 ms. Threesequential S1 stimuli were applied prior to the delivery of the S2 premature test stimulus ofeither negative or positive polarity. The duration and amplitude of S2 were 20 ms and 20 mA,respectively. The S1-S2 coupling intervals were progressively shortened beginning at 190 msin 20-ms steps down to 50 ms and after that in 10-ms steps down to the shortest S1-S2 intervaltested, 10 ms. A piece of titanium mesh against the posterior LV served as the referenceelectrode for the S1 and S2 stimuli.
Spectral Overlap EstimationTo estimate the spectral overlap between RH-237 and Rhod-2AM fluorescence, an additionalsix hearts underwent two separate experimental protocols. In the first protocol (3 hearts), atthe beginning of the experiment the heart was stained only with the Vm-sensitive dye RH-237and both voltage and “calcium” images were recorded using the respective filters. The dataacquired through the calcium filter represented the bleed-through of the voltage signal, whichwe termed the calcium error (error [Ca2+]i). Thereafter the Ca2+-sensitive dye Rhod-2AM wasadministered, and data were acquired while the heart was continuously stimulated at a pacingrate of 300 ms. In the second experimental protocol (3 hearts), only Rhod-2AM was used atfirst. In this situation, the “voltage” images represented the voltage error (error Vm). Aftercollecting data, the heart was then stained with RH-237, the pacing protocol was repeated, andvoltage and calcium fluorescence were recorded again. To calculate the error due to overlapof the voltage and calcium spectra, the amplitude of the calcium transient error was normalizedto the amplitude of [Ca2+]i:
The error for voltage measurements was calculated as the amplitude of the voltage errornormalized to the amplitude of the Vm signal:
Spectral RecordingA miniature fiber optic spectrometer (USB2000, Ocean Optics, FL, USA) was used to recordthe fluorescence spectra of RH-237 and Rhod-2AM from 200 to 1100 nm. The spectrometercomprises optical elements coupled with 2048-element linear silicon CCD array detector whichis responsive from 200 to 1100 nm.
Data Processing and Statistical AnalysisThe optical data collected with the Dalsa dual-camera system were first processed by an 8 × 8Gaussian spatial filter and a 3-point mean temporal filter. The data acquired with RedShirtcamera were filtered only using a 5 × 5 Gaussian spatial filter. Thereafter the [Ca2+]i and Vmdata were normalized pixel-by-pixel according to fluorescence changes during the last pacing
Sidorov et al. Page 4
Basic Res Cardiol. Author manuscript; available in PMC 2009 November 1.
NIH
-PA Author Manuscript
NIH
-PA Author Manuscript
NIH
-PA Author Manuscript
response and are presented as the percentage of this AP amplitude. To demonstrate the neteffect of S2 stimulation on Vm and [Ca2+]i distributions, the previous S1 response wassubtracted from the S2 response for some analyses. We will refer to these potential andintracellular calcium distributions as ΔVm and Δ[Ca2+]i accordingly. The conduction velocitywas computed using the time-space plot method [56]. To construct the temporal derivativemaps, the data were additionally preprocessed with a 5×5 spatial and 5-point mean temporalfilters.
Six rabbit hearts were studied to estimate the optical overlap between calcium and voltagefluorescence; seven rabbit hearts were used to examine the effects of cathodal and anodalstimulation; and three rabbit hearts were utilized to estimate the effects of BDM on [Ca2+]idynamics. Group data are presented as mean ± standard deviation. Statistical analysis wasperformed utilizing the paired t-test. Differences were considered significant when P < 0.05.
ResultsEmission spectra and estimation of spectral overlap
Figure 1A illustrates the emission spectra of Rhod-2AM and RH-237 measured separately intwo different experiments. Based on these measurements, a band pass filter (585 ± 20 nm) anda long pass filter (> 710 nm) were chosen to minimize spectral overlap without significantlysacrificing signal intensity. Figure 1B and 2C demonstrate the fluorescence recordings whenhearts were stained with either RH-237 or Rhod-2AM, respectively. No prominent RH-237fluorescence bleeding through the band pass filter is observed in Fig 1B (lower trace). Themean % error of [Ca2+]i was 3.97 ± 1.66 (3 hearts). If the heart was stained only with Rhod-2AM(Fig. 1C), slight leakage of [Ca2+]i fluorescence through the long pass filter is observed (lowertrace). The mean % error of Vm was 4.45 ± 1.94 (3 hearts).
Changes in Vm and [Ca2+]i during the shockFigure 2 shows the voltage and calcium responses during stimulation of –20 mA amplitudeand 20 ms duration at different S1-S2 coupling intervals. Panel A demonstrates the maps ofVm and [Ca2+]i distribution at the end of S2. Net Vm and [Ca2+]i changes after subtraction ofthe previous S1 response (ΔVm and Δ[Ca2+]i) are illustrated in panel B. The characteristicvirtual electrode polarization pattern [66] for cathodal stimulation is observed in the Vmimages: a dogbone-shaped region of positive polarization (virtual cathode, VC) orientedtransverse to the fiber direction with flanking regions of negative polarization (virtual anodes,VA) aligned parallel to the fiber direction. Traces from the VC (white dot) and VA (blue dot)regions superimposed with traces recorded at the same locations from the previous S1 wave(black) are shown in panels C and D, respectively.
The magnitudes of ΔVm are larger than the magnitudes of Δ[Ca2+]i over the full range of testedS1-S2 intervals. The maps of Vm and ΔVm distribution (panels A and B) reveal nonlinearbehavior: the magnitude of VA hyperpolarization decreases with prolongation of the S1-S2interval whereas VC depolarization becomes more prominent [2,9,19,25]. For couplingintervals of 30 ms or longer, the distribution of Δ[Ca2+]i correlates with the distribution ofΔVm. When S2 is delivered very soon after S1 (S1-S2 coupling interval of 10 ms), two blueareas oriented transverse to the fiber direction on opposite sides of the central electrode appearin the Δ[Ca2+]i map in Fig. 2B; these areas indicate delayed [Ca2+]i. The Vm and [Ca2+]i tracesfor the VC pixel located within these areas (white dot in top of panel A) show that S2 increasesthe slope of the AP upstroke, but decreases the slope of CT upstroke (Fig. 2C, top row). In theVA region (blue dot in top of panel A), both voltage and calcium optical signals decrease duringS2 (Fig. 2D, top row). When the S1-S2 interval was increased to 20 ms, the blue areas locatedcentrally the in Δ[Ca2+]i image (panel B, S1-S2 interval of 10 ms) moved away from the center
Sidorov et al. Page 5
Basic Res Cardiol. Author manuscript; available in PMC 2009 November 1.
NIH
-PA Author Manuscript
NIH
-PA Author Manuscript
NIH
-PA Author Manuscript
transversely to the fiber direction such that four blue regions are clearly observed (panel B,S1-S2 interval of 20 ms). This four-petalled pattern of negative Δ[Ca2+]i deflection wasdetected in all seven experiments.
Figure 3 illustrates the voltage and calcium responses during stimulation of the oppositepolarity (anodal). S2 amplitude (20 mA) and duration (20 ms) as well as S1-S2 couplingintervals are the same as in Figure 2. The central VA area reveals a strongly negative Δ[Ca2+]i for the 10-ms coupling interval (Fig. 3B): the delays in AP and CT upstrokes are clearlyseen in top row in Figure 3D. When the S1-S2 interval is lengthened to 20 ms, the VA-relatednegative Δ[Ca2+]i becomes weaker and the only easily visible region of strong negative changein [Ca2+]i occurs at the upper right edge of the VA (Fig. 3B). The four-petalled pattern, whichwas detected during negative S2 stimulation as shown in Figure 2B, was not as pronouncedfor this polarity. The central blue area of negative Δ[Ca2+]i correlates with the region ofnegative Vm (the VA) in all seven experiments, becoming less prominent with S1-S2prolongation. The areas of elevated Δ[Ca2+]i corresponding to the VCs become evident onlyfor coupling intervals 70 ms and longer.
Figures 4 A and B demonstrate the mean values of net ΔVm and Δ[Ca2+]i near the stimulatingelectrode during cathodal (grey) and anodal (black) S2 as a function of coupling interval. Theintersection of the black curves and the zero lines in panels A and B correspond to the transitionof stimulation mechanism from break to make. Figure 4 C includes all measurements acquiredin seven experiments; here, the differences in the magnitude of Δ[Ca2+]i resulting from changesin S2 polarity and in coupling interval are shown to correlate well with those for Vm.
Figure 5 shows the calcium response when blebbistatin was applied as an excitation-contractionuncoupler. As in the experiments with BDM, stimuli of 20 mA magnitude and 20 ms durationof both polarities were tested. At the 10-ms coupling interval, two dark blue areas indicatedelay in CT upstroke during both cathodal and anodal stimulations (Fig. 5A). Beginning withthe S1-S2 interval of 30 ms the VA-associated decrease in [Ca2+]i is evident during bothcathodal and anodal stimulations. The increase of [Ca2+]i related with the VC becomesprominent at the 110-ms coupling interval.
Postshock Vm and [Ca2+]i activityTypical outcomes from cathodal and anodal stimulation are represented in Figures 6 and 7,respectively. These data were obtained in a separate experiment from those shown in Figures2 and 3. Vm and [Ca2+]i dynamics are illustrated in terms of derivatives of optical signals.
Figure 6A represents the situation when the S1-S2 interval of 90 ms was too short to allowglobal propagation, such that charge diffusion after cathodal S2 termination (20 ms) inducesonly local Vm arising in the VAs but not a propagating AP. The images of d[Ca2+]i/dt do notreveal detectable elevation of [Ca2+]i at the VC during the 20-ms stimulus. After S2termination, the increasing Vm in the VAs causes prominent changes in [Ca2+]i (Fig. 6A, 30and 40 ms). Figure 6B demonstrates break stimulation at the S1-S2 interval of 150 ms. Theincreasing [Ca2+]i in the VC becomes noticeable in the 10 and 20-ms frames. After cessationof S2, charge diffusion initiates excitation at the VAs. In the time interval between 30 and 70ms, the S2-induced Vm wave revolves around four sites marked with four green dots (Fig. 6B,40 ms) and invades the central VC region. Due to depressed excitability at the VC, the wavefront decays and disappears, completing one cycle of quatrefoil reentry. [Ca2+]i exhibits thesame dynamics, but with delay. Figure 6C illustrates Vm and [Ca2+]i dynamics duringstimulation in diastole using a coupling interval of 300 ms. Excitation occurs before S2termination. Two dark VA regions in the 10-ms image of dVm/dt indicate delay in excitationcaused by negative polarization. After S2 termination the rising Vm at the VAs produces a two-petalled pattern in the 30-ms dVm/dt image. The behavior of [Ca2+]i is different. In addition
Sidorov et al. Page 6
Basic Res Cardiol. Author manuscript; available in PMC 2009 November 1.
NIH
-PA Author Manuscript
NIH
-PA Author Manuscript
NIH
-PA Author Manuscript
to the delay in the VAs, the central VC region also exhibits lagging [Ca2+]i response (10-msimage of d[Ca2+]i/dt). As a result the S2 cessation promotes increasing [Ca2+]i in the VAs andVC areas, thereby causing a four-petalled pattern that is clearly seen in the 30 and 40-msimages.
The conduction velocities for Vm propagation in diastolic tissue along (CVL) and transverse(CVT) to the fiber direction were 61.57 ± 4.02 cm/s and 22.09 ± 3.24 cm/s, respectively (N =7). These values for [Ca2+]i statistically differed from Vm (P < 0.05) and comprised 55.86 ±4.68 cm/s and 18.94 ± 3.61 cm/s (N = 7). The mean value of the CVL/ CVT ratio for [Ca2+]ipropagation (3.01 ± 0.43) was higher than that for Vm propagation (2.82 ± 0.31) (P < 0.05).To investigate if pacing rate influences the difference between CVs for Vm and [Ca2+]ipropagation, three additional experiments were conducted (not shown). In these experimentsthe hearts were stimulated transverse and along the fiber direction at different pacing rates.Progressively decreasing the pacing interval from 300 ms down to 140 ms did not produce anysubstantial effect on the CV disparity for steadily propagating Vm and [Ca2+]i waves.
Figure 7 shows the outcomes for anodal S2 stimulation. Three cases, no propagating response(Fig. 7A), break stimulation (Fig. 7B), and make stimulation (Fig. 7C), were created with S1-S2 intervals of 90, 150, and 300 ms, respectively. In Figure 7A the elevation of [Ca2+]i duringstimulation is too slow to be detected with the derivative (10 and 20-ms images). After S2termination, charge spreads from the VCs into the central VA area resulting in elevation ofVm and [Ca2+]i (Fig. 7A, 30-ms image). The 40-ms images reveal decay of the local Vm and[Ca2+]i responses. When the coupling interval is increased to 150 ms (Fig. 7B), after S2cessation charge diffusion from the VCs was sufficient to initiate a propagating wave at thecentral VA region (20 and 30-ms images). During propagation the wave fronts become convexand turn around four sites (Fig. 7B, 40 ms). Because the VCs have not sufficiently recovered,after collision the waves do not enter the VCs to complete one full cycle of reentry but, instead,form a common ellipsoid wave front propagating outwardly (Fig. 7B, 50 ms). Stimulation indiastole causes fast elevation of Vm at the VCs (Fig. 7C, 10 ms). The central dark regionslocated transversely to the fiber direction indicate delayed Vm elevation at the VA area duringS2, which then exhibit increasing Vm after S2 termination (30 ms). The images of d[Ca2+]i/dtshow deceleration of [Ca2+]i response in both central VA and flanked VCs regions during S2(10 ms). After S2 cessation the delayed [Ca2+]i increase at the VA and VCs results in a four-petal pattern in the 30 and 40-ms images. Note that although cathodal and anodal stimulationproduce reversed patterns of dVm/dt distribution during stimulation in diastole, the d[Ca2+]i/dt images after S2 termination reveal similar patterns for both polarities (Fig. 6C and Fig. 7C).
Another of our observations was prolongation of CT at regions of both positive and negativepolarization (Fig. 2C, D and Fig. 3C, D). The largest increase in CT duration, measured at the50% level of recovery, was 27.4 ± 6.5 % (7 hearts) for cathodal stimulation and 31.5 ± 10 %(7 hearts) when S2 was anodal.
DiscussionIn this study we show that for coupling intervals longer than 20 ms the changes in the[Ca2+]i distribution resemble the behavior of Vm distribution for both negative and positivestimulation. However [Ca2+]i fractional changes are smaller than those changes in Vm. Theaverage ΔVm/Δ[Ca2+]i ratio in the central virtual electrode for coupling intervals of 30 – 130ms is 4.52 ± 1.39 and 4.54 ± 0.49 (N = 49: 7 hearts for 7 tested coupling intervals) for cathodaland anodal S2, respectively. When stimulation is cathodal, [Ca2+]i at the central VC regionincreases with prolongation of the S1-S2 interval. If stimulation is anodal, [Ca2+]i at the centralVA area decreases with shortening of the S1-S2 interval. For very short coupling intervals(10-20 ms), the S1 wave front only begins to spread before S2 is applied. Therefore S2 is
Sidorov et al. Page 7
Basic Res Cardiol. Author manuscript; available in PMC 2009 November 1.
NIH
-PA Author Manuscript
NIH
-PA Author Manuscript
NIH
-PA Author Manuscript
applied while the tissue exhibits greatly different stages of excitation: Vm around the electrodeis in the upstroke phase, while tissue outside of the elliptical S1 wave front is at rest. In thiscase the largest Vm and [Ca2+]i gradients exist at the vicinity of stimulation location. As a resultthe Δ[Ca2+]i distribution exhibits patterns dissimilar to ΔVm. The distinction is more evidentfor cathodal stimulation when mismatch exists between ΔVm elevation and Δ[Ca2+]i reductionat the central VC area. During anodal stimulation the S2 hyperpolarization delays excitationcausing negative Δ[Ca2+]i (Fig. 3B 10-ms S1-S2 interval).
It was demonstrated recently that uniform field stimulation at the beginning of plateau phasecan induce declining [Ca2+]i at both the negatively and positively polarized sides in neonatalrat cell culture strands [20,48]. Nifedipine eliminated the shock-induced decrease in [Ca2+]i atthe depolarized side of the cell culture strand, indicating the main role of ICaL in this effect. Itwas suggested that when Vm exceeds reversal potential for ICaL, the current changes directionfrom inward to outward and, consequently, could be responsible for [Ca2+]i reduction at thecathodal end of the cell culture preparation. The hyperpolarization at the opposite side of thestrand can also cause a decline of [Ca2+]i because of inactivation of the L-type Ca2+ channels,Ca2+ efflux via Na+/Ca2+ exchangers (NCX), and binding with troponin [20,48].
In our experiments we did not detect decreasing [Ca2+]i at the VC during stimulation early inthe plateau at 30 and 40-ms S1-S2, while the negative changes of [Ca2+]i at the VA areas (∼12 %) were comparable to those observed by Fast et al. in neonatal rat cardiomyocyte cultures(∼ 15 %) [20,48]. Furthermore, as we have mentioned above, VC depolarization causedelevation of [Ca2+]i with increasing S1-S2 interval. In the range of coupling intervals between30 ms and 130 ms, the values of Δ[Ca2+]i due to cathodal S2 had a minimum of 3.1% andmaximum of 16.6%. Those values due to anodal S2 were -12.6% and -6.4%, respectively (Fig.4B). These results are qualitatively in agreement with those detected with S1-S2 prolongationin strands of cultured cardiomyocytes [48]. The discrepancy in [Ca2+]i behavior observed inthe VC region is probably due to either one or both of the following reasons: (1) inadequatedepolarization magnitude to cause reversal of ICaL and (2) the distinction in [Ca2+]i handlingdue to species-dependent and developmental disparities between neonatal and mature cells.
The magnitudes of polarization observed in our preparations were weaker than those reportedin cultured myocytes [8]. The maximum ΔVm values during stimulation at the beginning ofAP plateau for S1-S2 coupling intervals between 30 and 50 ms were 28% and 46% for positiveand negative deflections, respectively. These values in cell culture preparations were about60% and 200% for cathodal and anodal polarizations [8,20]. Such substantial disparity couldbe result of differing stimulation modes. Point stimulation on the surface of the heart producespolarization that decays exponentially with depth at a distance comparable to the lengthconstant [31]. The value of length constant depends on the cardiac cell type and the fiberdirection. The length constant is typically less than 1 mm [35,36] and is shorter transverse tothe fiber direction [38]. In addition, the length constant is also affected by anatomical structuredue to differences in electrotonic coupling. Because current spreads multi-dimensionally, theelectrotonic voltage decrement in a three-dimensional preparation would be steeper withdistance causing the length constant to be shorter than in one- or two- dimensional preparations.
In addition, bidomain effects visible in the intact myocardium can be severely attenuated in aconfluent layer of cardiomyocytes at the bottom of a culture dish. In culture, the depth of theculture media may be one hundred to one thousand times the thickness of the cell layer. Inmyocardium, the extracellular space may account for less than 20 % of the tissue volume.Hence the effect of extracellular resistivity, anisotropy and current distributions may be quitedifferent between the two preparations.
Sidorov et al. Page 8
Basic Res Cardiol. Author manuscript; available in PMC 2009 November 1.
NIH
-PA Author Manuscript
NIH
-PA Author Manuscript
NIH
-PA Author Manuscript
Optical signals measured from the heart surface are weighted averages of fluorescence from atissue depth [24,31] estimated to be between 0.3 – 0.5 mm [22,37] and 1 – 2 mm [3,7,15,17].If the optical decay constant is greater than the electrical length constant, the optical signalsarising from the deeper layers, unaffected by the stimulus, can cause underestimation of thesurface ΔVm. In monolayer cell cultures the optical signals are not attenuated by averagingover depth and therefore exhibit larger deflections.
It is known that excitation-contraction coupling undergoes extensive transformations duringpostnatal development [27,57,63]. In contrast with adult cardiomyocytes, neonatal cells haveunderdeveloped SR [45], so the significant fraction of activator Ca2+ enters through thesarcolemmal Ca2+ transportation system [62]. Among the most essential electrophysiologicalproperties of neonatal cells which could modify the [Ca2+]i response of cell cultures to electricshock are longer AP [27,63], increased sarcolemmal Ca2+ current [23,27], and lower sensitivityto ryanodine [13]. Besides developmental changes, the cell culture procedure itself can promotecellular remodeling, affect the excitation-contraction coupling and, consequently, could alterthe response to electrical stimulation. In particular, Snopko et al. recently reported thatsarcolemmal Ca2+ entry is enhanced at least two-fold in rat cardiomyocytes at the fourth dayof culturing in comparison to acutely dissociated cardiomyocytes from new born rat hearts ofthe equivalent age [57].
The unexpected finding of our study was the counter effect of strong negative stimulation onthe upstroke dynamics of AP and CT when S2 was delivered with a 10-ms coupling interval(Fig. 2C). Although detailed simulations are required to elucidate accurately the mechanismof CT delay, examining the current-voltage relationships for ICaL and NCX current (INa/Ca)would be a reasonable way to estimate the approximate contributions of these two mainCa2+ currents in the effect of Vm – Ca dissociation. In diastole, INa/Ca has a reversal potentialbetween −20 and −40 mV [6,41] and becomes more positive during the AP [67]. At thebeginning of the AP, when Vm exceeds the NCX equilibrium potential, INa/Ca changes directionand brings Ca2+ into the cell. The strong stimulus during depolarization phase of the APincreases upstroke velocity and AP amplitude at the VC region and thereby facilitates NCX-mediated entry of Ca2+. The current-voltage relationship for ICaL in rabbit cardiomyocytes hasa minimum near 10 mV and a reversal potential of about 60 mV [32,47]. The quick and strongdepolarization due to rapidly approaching the reversal potential will reduce the driving forcefor Ca2+ entry and hence lessen ICaL. Because ICaL is primarily responsible for activation ofryanodine receptors, the net result is observed in delayed CT dynamics. While the Vm – Cadissociation was observed under normal conditions during steady pacing, it may play a role indefibrillation outcome by means of APD alteration. It could also be involved in the shock-induced heterogeneous distribution of Ca2+. Recently Hwang et al. found that the firstactivation during unsuccessful defibrillation associates with a region of low [Ca2+]i surroundedby elevated [Ca2+]i (“Ca2+ sinkholes”) [30]. The shock-mediated delay of CT upstroke at areaswith lower Vm could be responsible for the occurrence of “Ca2+ sinkholes”.
The VC-associated lengthening of CT, which becomes more prominent for coupling intervalslonger than 50 ms, occurs by elevation of [Ca2+]i due to VC positive polarization (Fig. 2C andFig. 3C). The CT prolongation at VA areas is caused by elevation of Vm after S2 termination(Fig. 2D and Fig. 3D). Analysis of stimulation in the refractory period and in resting tissuerevealed that [Ca2+]i, similar to Vm, exhibits four basic stimulation modes: cathodal and anodalmake, and cathodal and anodal break stimulation. Furthermore, break stimulation can befollowed by reentry (Fig. 5B). Similar results were reported by Sidorov et al., [55] and recentlyobserved by Gray et al. [26], where Vm and Ca2+ state-space dynamics were studied duringquatrefoil reentry initiation. Stimulation in resting tissue exhibited VA and VC-related delaysin CT upstroke resulting in four-petalled d[Ca2+]i/dt patterns that were observed under bothcathodal and anodal stimulation (Fig. 5C and 6C).
Sidorov et al. Page 9
Basic Res Cardiol. Author manuscript; available in PMC 2009 November 1.
NIH
-PA Author Manuscript
NIH
-PA Author Manuscript
NIH
-PA Author Manuscript
Many optical imaging studies minimize motion artifacts by the use of one of a variety ofcontraction blocking agents. Of these, BDM is cost-effective, widely accepted, and was chosenwhen this study was designed and implemented. Only recently has a novel selective excitation-contraction uncoupler, blebbistatin [1,59], been applied to cardiac imaging [16,21]. BecauseBDM exhibits a phosphatase-like activity [14,29] and has additional side effects on the SR[58], Ca2+ channel currents [39] and AP characteristics [34], we conducted a series ofexperiments with blebbistatin, which acts by inhibiting myosin II isoforms and does not affectintracellular CT. The results were qualitatively similar to those obtained in experiments usingBDM. Specifically, the VC and VA-associated changes in [Ca2+]i during the early AP plateauphase for coupling intervals between 30 and 70 ms in Figure 5A correlate with those illustratedin Figures 2B and 3B. However, some differences do exist in the behavior of [Ca2+]i as afunction of S1-S2 interval between experiments with BDM (Fig. 4B) and blebbistatin (Fig.5B). The Δ[Ca2+]i curves are more horizontal when blebbistatin was utilized (Fig. 5B) thanunder BDM (Fig. 4B). In particular, the anodal curve intersects the zero line at coupling intervalof 175 ms (Fig. 5B), whereas this value is 155 ms when BDM was applied (Fig. 4B). Thisdiscrepancy is a result of AP shortening due to BDM [10,40] and slight prolongation of APduration caused by blebbistatin [21].
In summary, our results demonstrate the variety of spatial and temporal responses of twovariables (Vm and [Ca2+]i) induced on the surface of the whole heart by unipolar stimuli as afunction of polarity and coupling interval. For the majority of coupling intervals the Ca2+
response was directly related to the Vm response after a short delay, as occurs during normalheart function. However, at very short coupling intervals the Vm and [Ca2+]i responses werenot positively correlated. This fact has implications, especially for defibrillation because anydifferences in Vm and [Ca2+]i responses are likely to be important (e.g., either proarrhythmicor antiarrhythmic). This in turn suggests that Vm and [Ca2+]i are well-suited as orthogonalvariables for recording phase plane trajectories during shocks and reentry [26]. In addition, thequality and detail of our data and the range of parameters over which it was collected offer anopportunity for quantitative tests of the accuracy and ability of numerical models of cardiactissue to fully reproduce and explain the spatiotemporal relationships between Vm and Ca2+
signals during point stimulation [2], AP propagation, and calcium transport in the cardiacbidomain.
AcknowledgmentsThis work was supported by the NIH (RO1-HL58241, RO1-HL63267), the American Heart Association (0635037N),and the Vanderbilt Institute for Integrative Biosystems Research and Education. We thank Allison Price and DonBerry for their editorial assistance.
Abbreviations[Ca2+]i, intracellular calcium concentrationVm, transmembrane potentialAP, action potentialCT, calcium transientS1, conditioning stimulusS2, testing stimulusSR, sarcoplasmic reticulumVT, ventricular tachycardiaVF, ventricular fibrillationVC, virtual cathodeVA, virtual anodeNCX, Na+/Ca2+ exchanger
Sidorov et al. Page 10
Basic Res Cardiol. Author manuscript; available in PMC 2009 November 1.
NIH
-PA Author Manuscript
NIH
-PA Author Manuscript
NIH
-PA Author Manuscript
ICaL, current via the L-type Ca2+ channelsINa/Ca, current via Na+/Ca2+ exchanger
References1. Allingham JS, Smith R, Rayment I. The structural basis of blebbistatin inhibition and specificity for
myosin II. Nat Struct Mol Biol 2005;12:378–379. [PubMed: 15750603]2. Ashihara T, Trayanova NA. Asymmetry in membrane responses to electric shocks: insights from
bidomain simulations. Biophys J 2004;87:2271–2282. [PubMed: 15454429]3. Baxter WT, Mironov SF, Zaitsev AV, Jalife J, Pertsov AM. Visualizing excitation waves inside cardiac
muscle using transillumination. Biophys J 2001;80:516–530. [PubMed: 11159422]4. Bers DM. Ca transport during contraction and relaxation in mammalian ventricular muscle. Basic Res
Cardiol 1997;92(Suppl 1):1–10. [PubMed: 9202838]5. Bers, DM. Excitation-contraction coupling and cardiac contractile force. Kluwer Academic; Dordrecht:
2001.6. Bers DM, Barry WH, Despa S. Intracellular Na+ regulation in cardiac myocytes. Cardiovasc Res
2003;57:897–912. [PubMed: 12650868]7. Bray MA, Wikswo JP. Examination of optical depth effects on fluorescence imaging of cardiac
propagation. Biophys J 2003;85:4134–4145. [PubMed: 14645100]8. Cheek ER, Fast VG. Nonlinear changes of transmembrane potential during electrical shocks: role of
membrane electroporation. Circ Res 2004;94:208–214. [PubMed: 14670844]9. Cheng DK, Tung L, Sobie EA. Nonuniform responses of transmembrane potential during electric field
stimulation of single cardiac cells. Am J Physiol 1999;277:H351–H362. [PubMed: 10409215]10. Cheng Y, Li L, Nikolski V, Wallick DW, Efimov IR. Shock-induced arrhythmogenesis is enhanced
by 2,3-butanedione monoxime compared with cytochalasin D. Am J Physiol Heart Circ Physiol2004;286:H310–H318. [PubMed: 12958029]
11. Choi BR, Salama G. Simultaneous maps of optical action potentials and calcium transients in guinea-pig hearts: mechanisms underlying concordant alternans. J Physiol (Lond) 2000;529:171–188.[PubMed: 11080260]
12. Chudin E, Goldhaber J, Garfinkel A, Weiss J, Kogan B. Intracellular Ca(2+) dynamics and the stabilityof ventricular tachycardia. Biophys J 1999;77:2930–2941. [PubMed: 10585917]
13. Cohen NM, Lederer WJ. Changes in the calcium current of rat heart ventricular myocytes duringdevelopment. J Physiol 1988;406:115–146. [PubMed: 2855434]
14. Davies DR, Green AL. The kinetics of reactivation, by oximes, of cholinesterase inhibited byorganophosphorus compounds. Biochem J 1956;63:529–535. [PubMed: 13355845]
15. Ding L, Splinter R, Knisley SB. Quantifying spatial localization of optical mapping using MonteCarlo simulations. IEEE Trans Biomed Eng 2001;48:1098–1107. [PubMed: 11585033]
16. Dou Y, Arlock P, Arner A. Blebbistatin specifically inhibits actin-myosin interaction in mouse cardiacmuscle. Am J Physiol Cell Physiol 2007;293:C1148–C1153. [PubMed: 17615158]
17. Efimov IR, Sidorov V, Cheng Y, Wollenzier B. Evidence of three-dimensional scroll waves withribbon-shaped filament as a mechanism of ventricular tachycardia in the isolated rabbit heart. JCardiovasc Electrophysiol 1999;10:1452–1462. [PubMed: 10571365]
18. Escobar AL, Ribeiro-Costa R, Villalba-Galea C, Zoghbi ME, Perez CG, Mejia-Alvarez R.Developmental changes of intracellular Ca2+ transients in beating rat hearts. Am J Physiol HeartCirc Physiol 2004;286:H971–H978. [PubMed: 14644760]
19. Fast VG, Rohr S, Ideker RE. Nonlinear changes of transmembrane potential caused by defibrillationshocks in strands of cultured myocytes. Am J Physiol Heart Circ Physiol 2000;278:H688–H697.[PubMed: 10710335]
20. Fast VG, Cheek ER, Pollard AE, Ideker RE. Effects of electrical shocks on Cai2+ and Vm in myocytecultures. Circ Res 2004;94:1589–1597. [PubMed: 15155528]
21. Fedorov VV, Lozinsky IT, Sosunov EA, Anyukhovsky EP, Rosen MR, Balke CW, Efimov IR.Application of blebbistatin as an excitation-contraction uncoupler for electrophysiologic study of ratand rabbit hearts. Heart Rhythm 2007;4:619–626. [PubMed: 17467631]
Sidorov et al. Page 11
Basic Res Cardiol. Author manuscript; available in PMC 2009 November 1.
NIH
-PA Author Manuscript
NIH
-PA Author Manuscript
NIH
-PA Author Manuscript
22. Girouard SD, Laurita KR, Rosenbaum DS. Unique properties of cardiac action potentials recordedwith voltage-sensitive dyes. J Cardiovasc Electrophysiol 1996;7:1024–1038. [PubMed: 8930734]
23. Gomez JP, Potreau D, Branka JE, Raymond G. Developmental changes in Ca2+ currents fromnewborn rat cardiomyocytes in primary culture. Pflugers Arch 1994;428:241–249. [PubMed:7816546]
24. Gray RA. What exactly are optically recorded “action potentials”? J Cardiovasc Electrophysiol1999;10:1463–1466. [PubMed: 10571366]
25. Gray RA, Huelsing DJ, Aguel F, Trayanova NA. Effect of strength and timing of transmembranecurrent pulses on isolated ventricular myocytes. J Cardiovasc Electrophysiol 2001;12:1129–1137.[PubMed: 11699521]
26. Gray RA, Iyer A, Bray MA, Wikswo JP. Voltage-calcium state-space dynamics during initiation ofreentry. Heart Rhythm 2006;3:247–248. [PubMed: 16443544]
27. Guo W, Kamiya K, Cheng J, Toyama J. Changes in action potentials and ion currents in long-termcultured neonatal rat ventricular cells. Am J Physiol 1996;271:C93–102. [PubMed: 8760034]
28. Holcomb MR, Woods MC, Uzelac I, Wikswo JP, Gilligan JM, Sidorov VY. Dual camera system formultimodal imaging of cardiac electrophysiology and metabolism. 2008Submitted
29. Holmstedt B. Pharmacology of organophosphorus cholinesterase inhibitors. Pharmacol Rev1959;11:567–688. [PubMed: 14402820]
30. Hwang GS, Hayashi H, Tang L, Ogawa M, Hernandez H, Tan AY, Li H, Karagueuzian HS, WeissJN, Lin SF, Chen PS. Intracellular calcium and vulnerability to fibrillation and defibrillation inLangendorff-perfused rabbit ventricles. Circulation 2006;114:2595–2603. [PubMed: 17116770]
31. Janks DL, Roth BJ. Averaging over depth during optical mapping of unipolar stimulation. IEEE TransBiomed Eng 2002;49:1051–1054. [PubMed: 12214878]
32. Josephson IR, Sanchez-Chapula J, Brown AM. A comparison of calcium currents in rat and guineapig single ventricular cells. Circ Res 1984;54:144–156. [PubMed: 6319043]
33. Katz, AM. Excitation-contraction coupling: calcium fluxes across the sarcoplasmic reticulum. In:Katz, AM., editor. Physiology of the heart. Lippincott Williams & Wilkins; Philadelphia: 2001. p.216-239.
34. Kettlewell S, Walker NL, Cobbe SM, Burton FL, Smith GL. The electrophysiological and mechanicaleffects of 2,3-butane-dione monoxime and cytochalasin-D in the Langendorff perfused rabbit heart.Exp Physiol 2004;89:163–172. [PubMed: 15123545]
35. Keung EC, Keung CS, Aronson RS. Passive electrical properties of normal and hypertrophied ratmyocardium. Am J Physiol 1982;243:H917–H926. [PubMed: 6216816]
36. Kleber AG, Riegger CB. Electrical constants of arterially perfused rabbit papillary muscle. J Physiol1987;385:307–324. [PubMed: 3656162]
37. Knisley SB. Transmembrane voltage changes during unipolar stimulation of rabbit ventricle. CircRes 1995;77:1229–1239. [PubMed: 7586236]
38. Kukushkin NI, Bukauskas FF, Sakson ME, Nasonova VV. [Anisotropy of stationary rates and delaysin extrasystolic waves in the dog heart]. Biofizika 1975;20:687–692. [PubMed: 1201305]
39. Lang RJ, Paul RJ. Effects of 2,3-butanedione monoxime on whole-cell Ca2+ channel currents insingle cells of the guinea-pig taenia caeci. J Physiol 1991;433:1–24. [PubMed: 1726794]
40. Lee MH, Lin SF, Ohara T, Omichi C, Okuyama Y, Chudin E, Garfinkel A, Weiss JN, KaragueuzianHS, Chen PS. Effects of diacetyl monoxime and cytochalasin D on ventricular fibrillation in swineright ventricles. Am J Physiol Heart Circ Physiol 2001;280:H2689–H2696. [PubMed: 11356625]
41. Litwin SE, Li J, Bridge JH. Na-Ca exchange and the trigger for sarcoplasmic reticulum Ca release:studies in adult rabbit ventricular myocytes. Biophys J 1998;75:359–371. [PubMed: 9649393]
42. Maack C, O'Rourke B. Excitation-contraction coupling and mitochondrial energetics. Basic ResCardiol 2007;102:369–392. [PubMed: 17657400]
43. Neunlist M, Tung L. Spatial distribution of cardiac transmembrane potentials around an extracellularelectrode: dependence on fiber orientation. Biophys J 1995;68:2310–2322. [PubMed: 7647235]
44. Nuss HB, Marban E. Electrophysiological properties of neonatal mouse cardiac myocytes in primaryculture. J Physiol 1994;479(Pt 2):265–279. [PubMed: 7799226]
Sidorov et al. Page 12
Basic Res Cardiol. Author manuscript; available in PMC 2009 November 1.
NIH
-PA Author Manuscript
NIH
-PA Author Manuscript
NIH
-PA Author Manuscript
45. Olivetti G, Anversa P, Loud AV. Morphometric study of early postnatal development in the left andright ventricular myocardium of the rat. II. Tissue composition, capillary growth, and sarcoplasmicalterations. Circ Res 1980;46:503–512. [PubMed: 6444555]
46. Omichi C, Lamp ST, Lin SF, Yang J, Baher A, Zhou S, Attin M, Lee MH, Karagueuzian HS, KoganB, Qu Z, Garfinkel A, Chen PS, Weiss JN. Intracellular Ca dynamics in ventricular fibrillation. AmJ Physiol Heart Circ Physiol 2004;286:H1836–H1844. [PubMed: 14704235]
47. Puglisi JL, Yuan W, Bassani JWM, Bers DM. Ca2+ influx through Ca2+ channels in rabbit ventricularmyocytes during action potential clamp: Influence of temperature. Circ Res 1999;85:7e–16.
48. Raman V, Pollard AE, Fast VG. Shock-induced changes of Ca(i)2+ and Vm in myocyte cultures andcomputer model: Dependence on the timing of shock application. Cardiovasc Res 2007;73:101–110.[PubMed: 17134687]
49. Ruiz-Meana M, Abellan A, Miro-Casas E, Garcia-Dorado D. Opening of mitochondrial permeabilitytransition pore induces hypercontracture in Ca(2+) overloaded cardiac myocytes. Basic Res Cardiol2007;102:542–552. [PubMed: 17891523]
50. Sato D, Shiferaw Y, Garfinkel A, Weiss JN, Qu Z, Karma A. Spatially discordant alternans in cardiactissue: role of calcium cycling. Circ Res 2006;99:520–527. [PubMed: 16902177]
51. Schlotthauer K, Bers DM. Sarcoplasmic reticulum Ca(2+) release causes myocyte depolarization.Underlying mechanism and threshold for triggered action potentials. Circ Res 2000;87:774–780.[PubMed: 11055981]
52. Sepulveda NG, Roth BJ, Wikswo JP Jr. Current injection into a two-dimensional anisotropicbidomain. Biophys J 1989;55:987–999. [PubMed: 2720084]
53. Sepulveda NG, Wikswo JP Jr. Electric and magnetic fields from two-dimensional anisotropicbisyncytia. Biophys J 1987;51:557–568. [PubMed: 3580484]
54. Sharma V, Tung L. Effects of uniform electric fields on intracellular calcium transients in singlecardiac cells. Am J Physiol Heart Circ Physiol 2002;282:H72–H79. [PubMed: 11748049]
55. Sidorov VY, Woods MC, Holcomb MR, Wikswo JP. Optical mapping of calcium distribution revealsmake and break excitation modes. Heart Rhythm 2005;2:S216.
56. Sidorov VY, Woods MC, Wikswo JP. Effects of elevated extracellular potassium on the stimulationmechanism of diastolic cardiac tissue. Biophys J 2003;84:3470–3479. [PubMed: 12719272]
57. Snopko RM, Aromolaran AS, Karko KL, Ramos-Franco J, Blatter LA, Mejia-Alvarez R. Cell culturemodifies Ca2+ signaling during excitation-contraction coupling in neonate cardiac myocytes. CellCalcium 2007;41:13–25. [PubMed: 16908061]
58. Steele DS, Smith GL. Effects of 2,3-butanedione monoxime on sarcoplasmic reticulum of saponin-treated rat cardiac muscle. Am J Physiol 1993;265:H1493–H1500. [PubMed: 8238560]
59. Straight AF, Cheung A, Limouze J, Chen I, Westwood NJ, Sellers JR, Mitchison TJ. Dissectingtemporal and spatial control of cytokinesis with a myosin II inhibitor. Science 2003;299:1743–1747.[PubMed: 12637748]
60. Studer R, Reinecke H, Vetter R, Holtz J, Drexler H. Expression and function of the cardiac Na+/Ca2+ exchanger in postnatal development of the rat, in experimental-induced cardiac hypertrophy andin the failing human heart. Basic Res Cardiol 1997;92(Suppl 1):53–58. [PubMed: 9202844]
61. ter Keurs HE, Wakayama Y, Sugai Y, Price G, Kagaya Y, Boyden PA, Miura M, Stuyvers BD. Roleof sarcomere mechanics and Ca2+ overload in Ca2+ waves and arrhythmias in rat cardiac muscle.Ann N Y Acad Sci 2006;1080:248–267. [PubMed: 17132788]
62. Tibbits GF, Xu L, Sedarat F. Ontogeny of excitation-contraction coupling in the mammalian heart.Comp Biochem Physiol A Mol Integr Physiol 2002;132:691–698. [PubMed: 12095856]
63. Wahler GM, Dollinger SJ, Smith JM, Flemal KL. Time course of postnatal changes in rat heart actionpotential and in transient outward current is different. Am J Physiol 1994;267:H1157–H1166.[PubMed: 8092281]
64. Warren M, Huizar JF, Shvedko AG, Zaitsev AV. Spatiotemporal relationship between intracellularCa2+ dynamics and wave fragmentation during ventricular fibrillation in isolated blood-perfused pighearts. Circ Res 2007;101:e90–101. [PubMed: 17932324]
65. Wibo M, Bravo G, Godfraind T. Postnatal maturation of excitation-contraction coupling in ratventricle in relation to the subcellular localization and surface density of 1,4-dihydropyridine andryanodine receptors. Circ Res 1991;68:662–673. [PubMed: 1660357]
Sidorov et al. Page 13
Basic Res Cardiol. Author manuscript; available in PMC 2009 November 1.
NIH
-PA Author Manuscript
NIH
-PA Author Manuscript
NIH
-PA Author Manuscript
66. Wikswo JP Jr. Lin SF, Abbas RA. Virtual electrodes in cardiac tissue: a common mechanism foranodal and cathodal stimulation. Biophys J 1995;69:2195–2210. [PubMed: 8599628]
67. Wu S, Weiss JN, Chou C-C, Attin M, Hayashi H, Lin S-F. Dissociation of membrane potential andintracellular calcium during ventricular fibrillation. J Cardiovasc Electrophysiol 2005;16:186–192.[PubMed: 15720458]
Sidorov et al. Page 14
Basic Res Cardiol. Author manuscript; available in PMC 2009 November 1.
NIH
-PA Author Manuscript
NIH
-PA Author Manuscript
NIH
-PA Author Manuscript
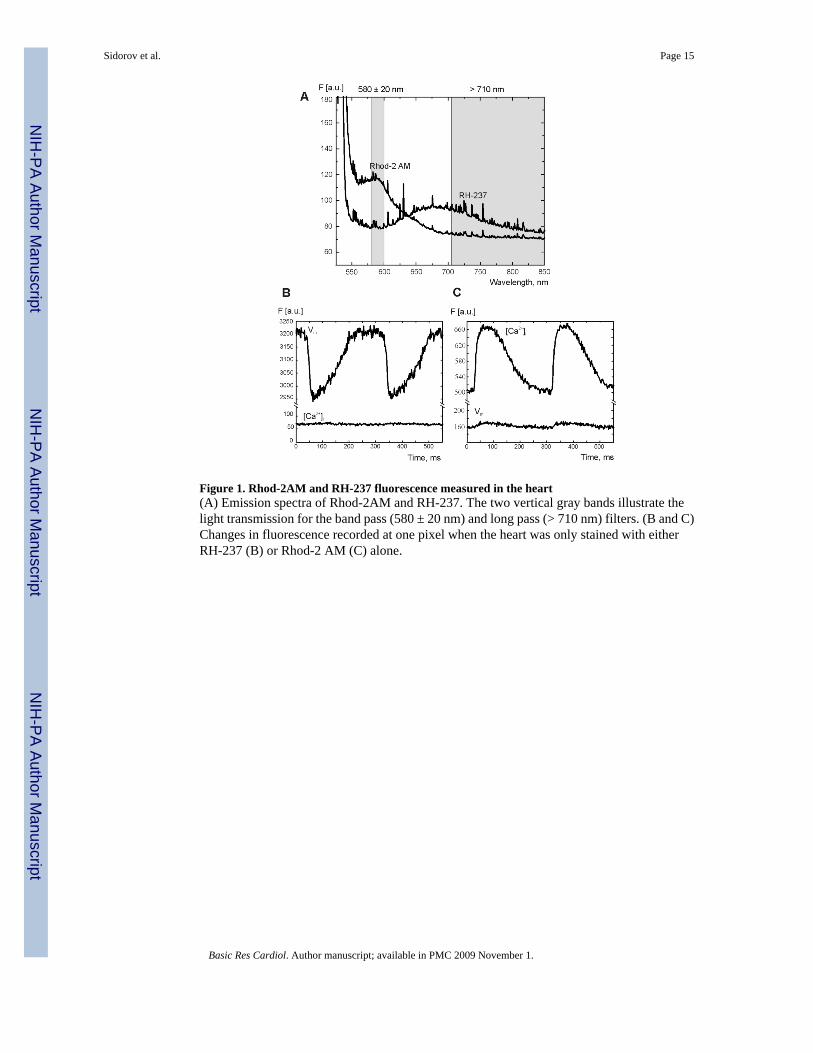
Figure 1. Rhod-2AM and RH-237 fluorescence measured in the heart(A) Emission spectra of Rhod-2AM and RH-237. The two vertical gray bands illustrate thelight transmission for the band pass (580 ± 20 nm) and long pass (> 710 nm) filters. (B and C)Changes in fluorescence recorded at one pixel when the heart was only stained with eitherRH-237 (B) or Rhod-2 AM (C) alone.
Sidorov et al. Page 15
Basic Res Cardiol. Author manuscript; available in PMC 2009 November 1.
NIH
-PA Author Manuscript
NIH
-PA Author Manuscript
NIH
-PA Author Manuscript
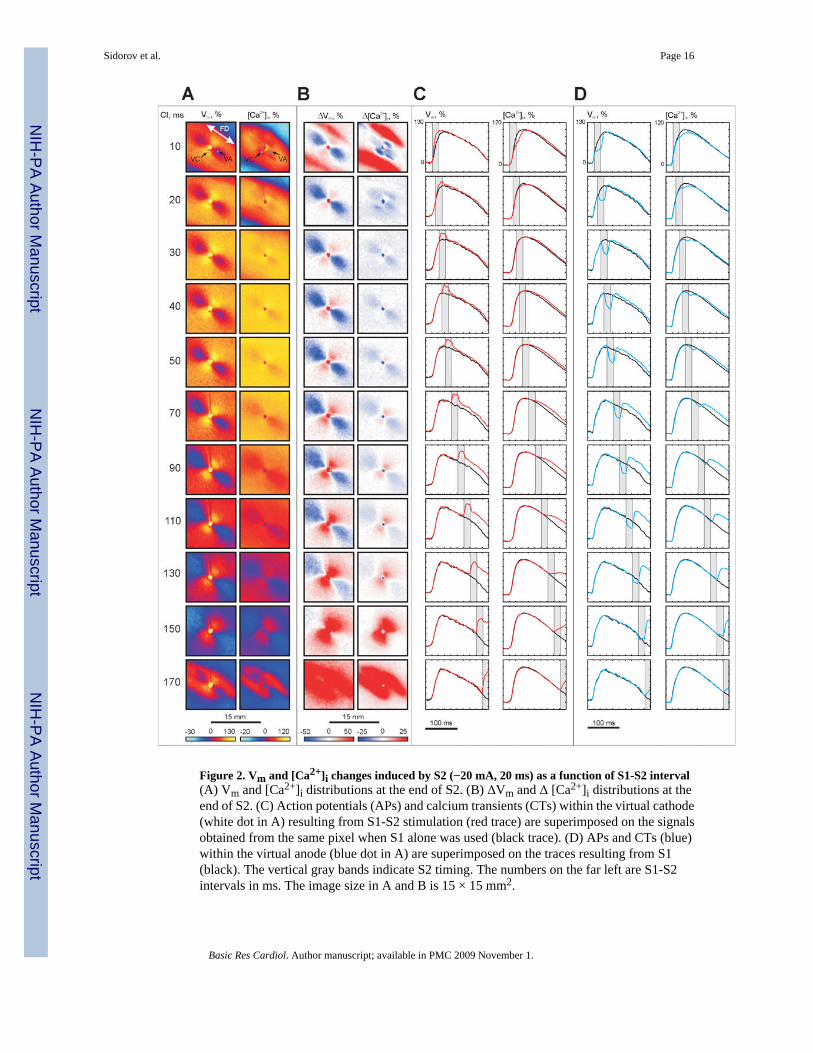
Figure 2. Vm and [Ca2+]i changes induced by S2 (−20 mA, 20 ms) as a function of S1-S2 interval(A) Vm and [Ca2+]i distributions at the end of S2. (B) ΔVm and Δ [Ca2+]i distributions at theend of S2. (C) Action potentials (APs) and calcium transients (CTs) within the virtual cathode(white dot in A) resulting from S1-S2 stimulation (red trace) are superimposed on the signalsobtained from the same pixel when S1 alone was used (black trace). (D) APs and CTs (blue)within the virtual anode (blue dot in A) are superimposed on the traces resulting from S1(black). The vertical gray bands indicate S2 timing. The numbers on the far left are S1-S2intervals in ms. The image size in A and B is 15 × 15 mm2.
Sidorov et al. Page 16
Basic Res Cardiol. Author manuscript; available in PMC 2009 November 1.
NIH
-PA Author Manuscript
NIH
-PA Author Manuscript
NIH
-PA Author Manuscript
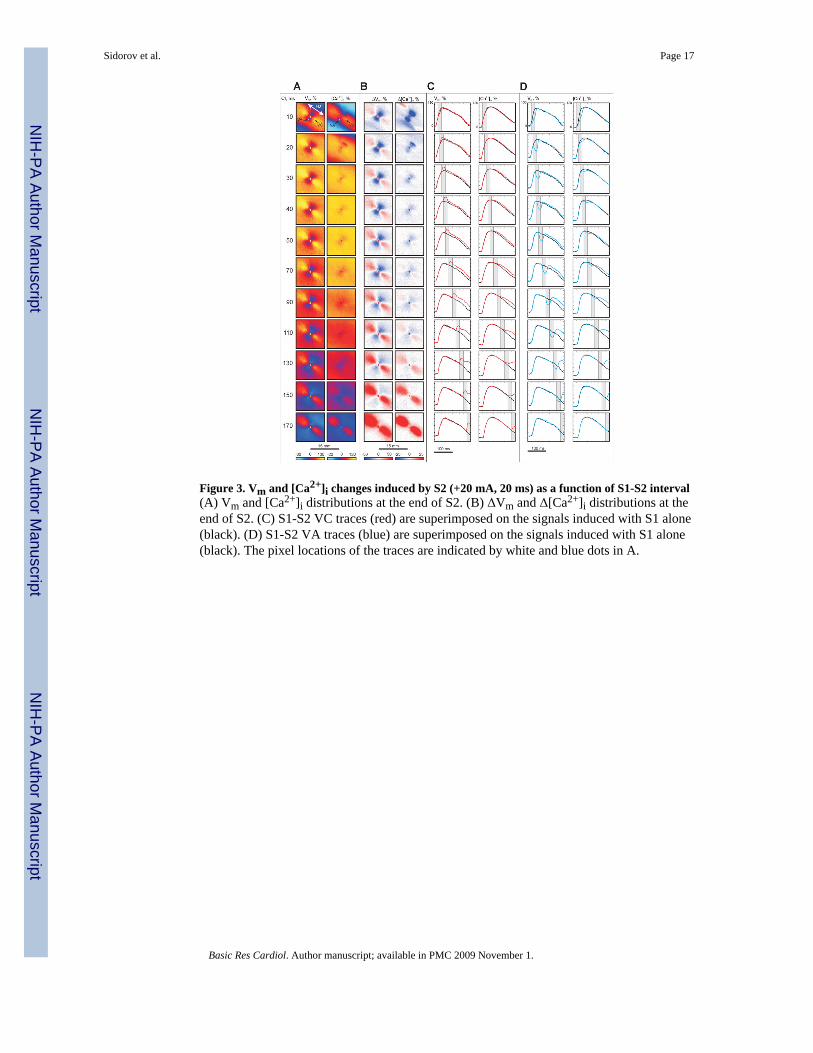
Figure 3. Vm and [Ca2+]i changes induced by S2 (+20 mA, 20 ms) as a function of S1-S2 interval(A) Vm and [Ca2+]i distributions at the end of S2. (B) ΔVm and Δ[Ca2+]i distributions at theend of S2. (C) S1-S2 VC traces (red) are superimposed on the signals induced with S1 alone(black). (D) S1-S2 VA traces (blue) are superimposed on the signals induced with S1 alone(black). The pixel locations of the traces are indicated by white and blue dots in A.
Sidorov et al. Page 17
Basic Res Cardiol. Author manuscript; available in PMC 2009 November 1.
NIH
-PA Author Manuscript
NIH
-PA Author Manuscript
NIH
-PA Author Manuscript
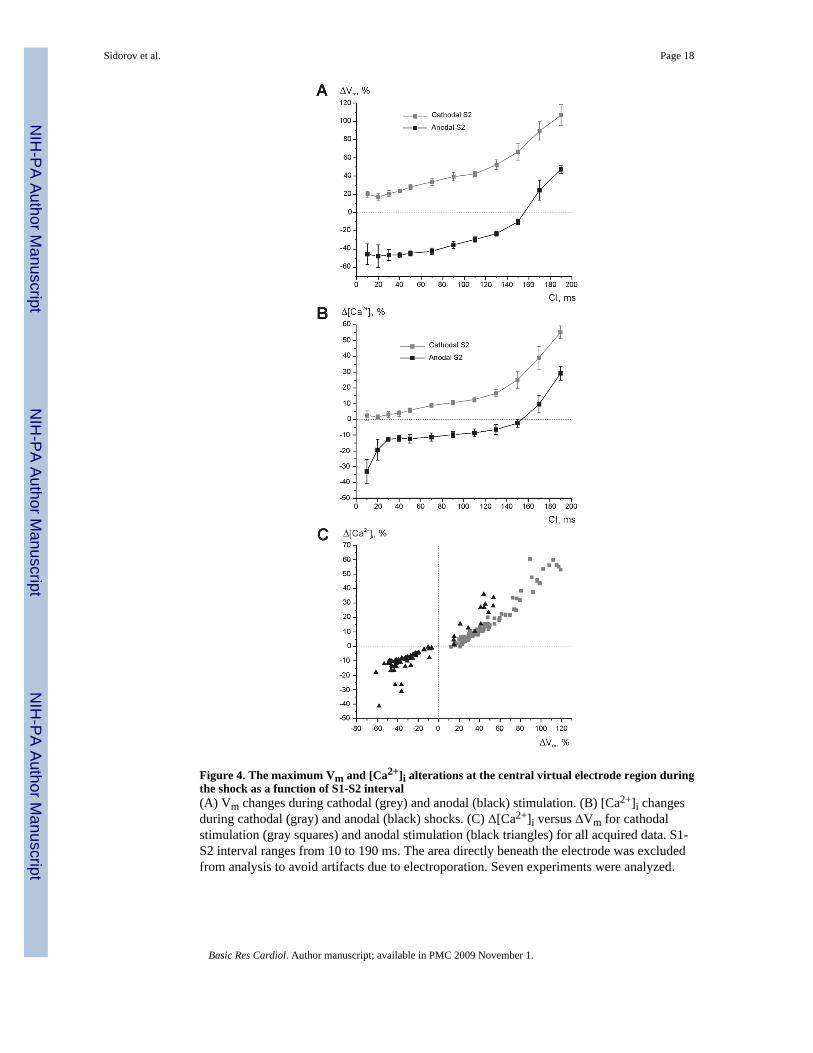
Figure 4. The maximum Vm and [Ca2+]i alterations at the central virtual electrode region duringthe shock as a function of S1-S2 interval(A) Vm changes during cathodal (grey) and anodal (black) stimulation. (B) [Ca2+]i changesduring cathodal (gray) and anodal (black) shocks. (C) Δ[Ca2+]i versus ΔVm for cathodalstimulation (gray squares) and anodal stimulation (black triangles) for all acquired data. S1-S2 interval ranges from 10 to 190 ms. The area directly beneath the electrode was excludedfrom analysis to avoid artifacts due to electroporation. Seven experiments were analyzed.
Sidorov et al. Page 18
Basic Res Cardiol. Author manuscript; available in PMC 2009 November 1.
NIH
-PA Author Manuscript
NIH
-PA Author Manuscript
NIH
-PA Author Manuscript
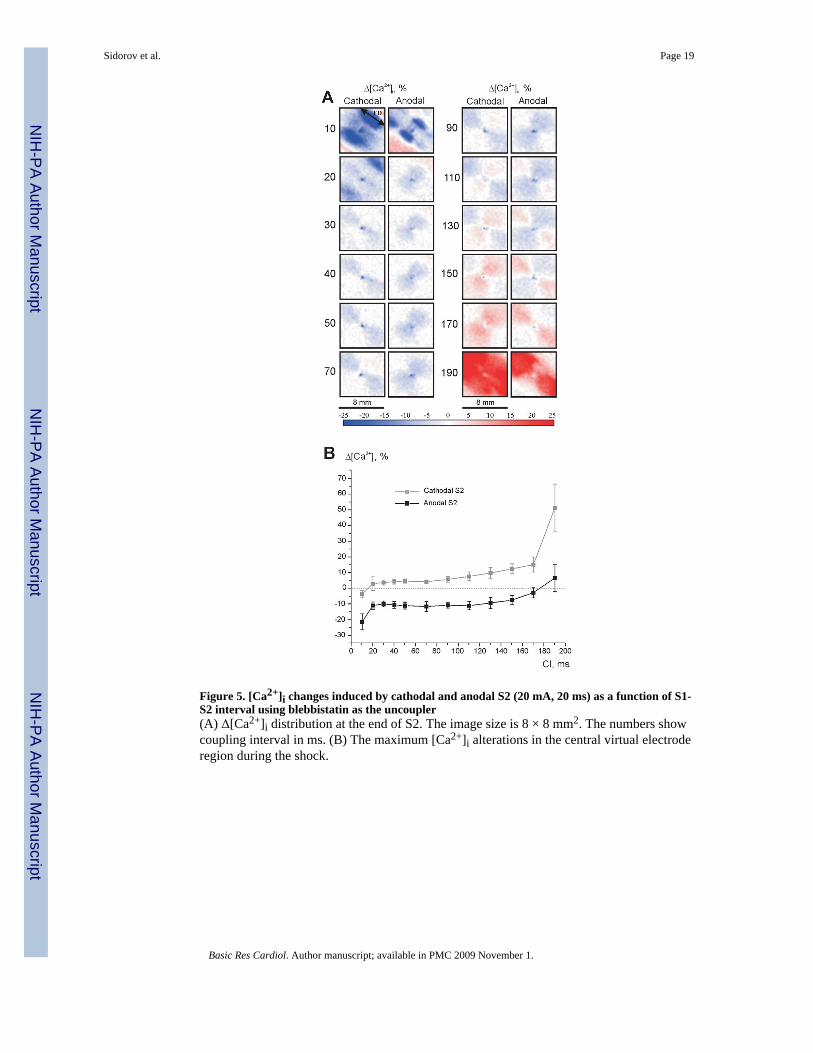
Figure 5. [Ca2+]i changes induced by cathodal and anodal S2 (20 mA, 20 ms) as a function of S1-S2 interval using blebbistatin as the uncoupler(A) Δ[Ca2+]i distribution at the end of S2. The image size is 8 × 8 mm2. The numbers showcoupling interval in ms. (B) The maximum [Ca2+]i alterations in the central virtual electroderegion during the shock.
Sidorov et al. Page 19
Basic Res Cardiol. Author manuscript; available in PMC 2009 November 1.
NIH
-PA Author Manuscript
NIH
-PA Author Manuscript
NIH
-PA Author Manuscript
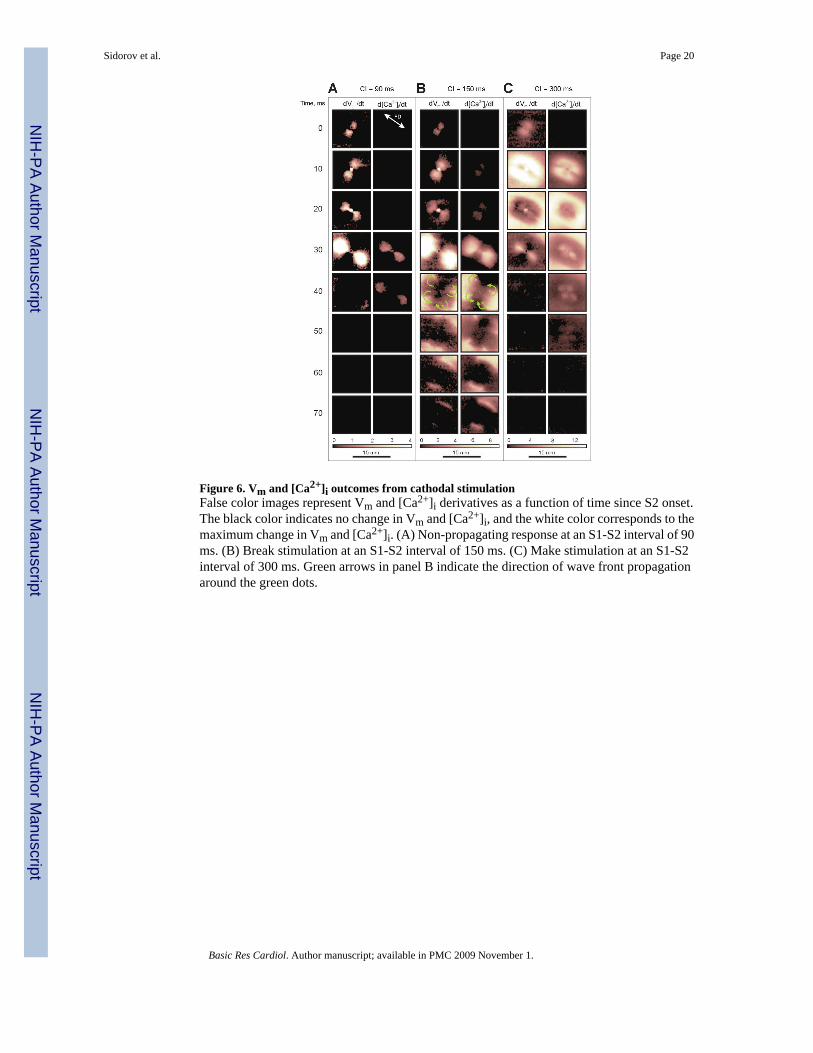
Figure 6. Vm and [Ca2+]i outcomes from cathodal stimulationFalse color images represent Vm and [Ca2+]i derivatives as a function of time since S2 onset.The black color indicates no change in Vm and [Ca2+]i, and the white color corresponds to themaximum change in Vm and [Ca2+]i. (A) Non-propagating response at an S1-S2 interval of 90ms. (B) Break stimulation at an S1-S2 interval of 150 ms. (C) Make stimulation at an S1-S2interval of 300 ms. Green arrows in panel B indicate the direction of wave front propagationaround the green dots.
Sidorov et al. Page 20
Basic Res Cardiol. Author manuscript; available in PMC 2009 November 1.
NIH
-PA Author Manuscript
NIH
-PA Author Manuscript
NIH
-PA Author Manuscript
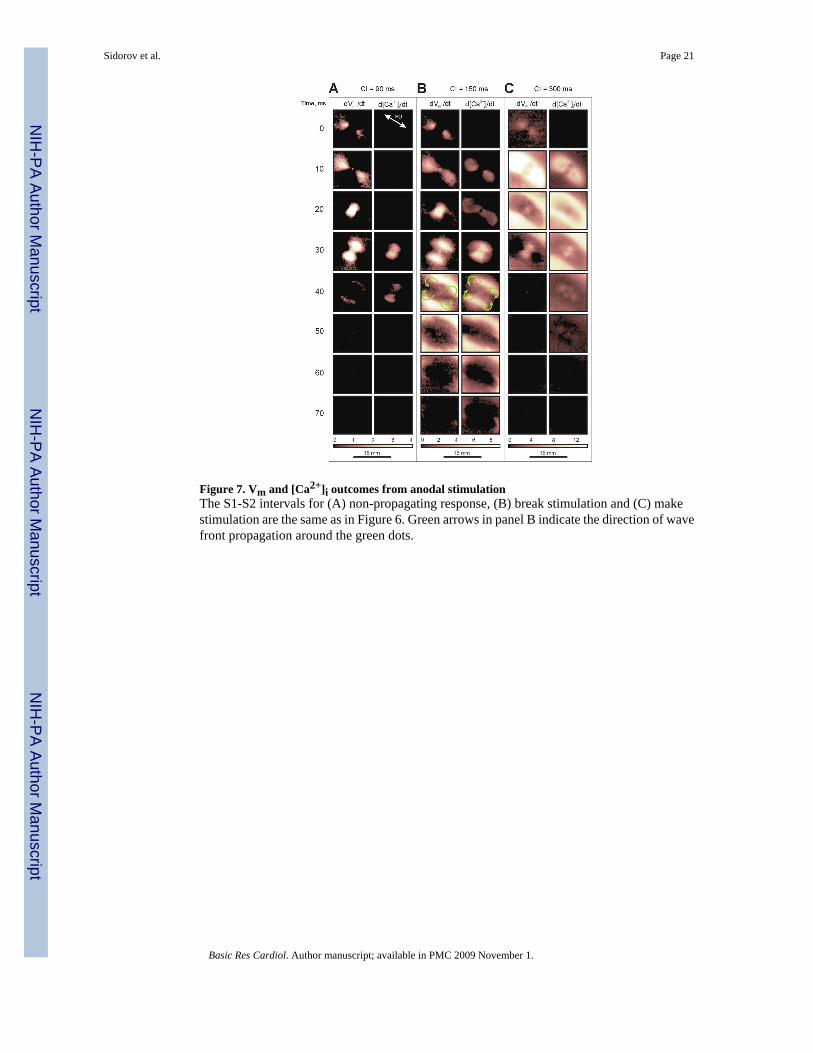
Figure 7. Vm and [Ca2+]i outcomes from anodal stimulationThe S1-S2 intervals for (A) non-propagating response, (B) break stimulation and (C) makestimulation are the same as in Figure 6. Green arrows in panel B indicate the direction of wavefront propagation around the green dots.
Sidorov et al. Page 21
Basic Res Cardiol. Author manuscript; available in PMC 2009 November 1.
NIH
-PA Author Manuscript
NIH
-PA Author Manuscript
NIH
-PA Author Manuscript