Refuge-mediated apparent competition in plantâconsumer interactions
Upload
independentCategory
view
1download
0
Journal of Membrane Science, 56 (1991) 13-28 Elsevier Science Publishers B.V., Amsterdam
13
Effects of protein fouling on the apparent pore size distribution of sieving membranes
Martine Meireles*, Pierre Aimar and Victor Sanchez URA-CNRS de Gtkie Chimique, Laboratoire de GEnie Chimique et Electrochimie, Universitk P. Sabatier, 118 route de Narbonne, 31062 Toulouse (France)
(Received February 23,199O; accepted in revised form August, 7,199O)
Abstract
A characterisation method giving the average radius and the geometric standard deviation is used to study the influence of fouling on the apparent porous structure of ultrafiltration mem- branes. A way of estimating the pore density is proposed. Polysulphone membranes of different molar weight cut-offs and globular proteins of different size are used. It is shown how the effects of fouling on solvent flux and on retention depend on the size of both pores and foulant molecules. The results suggest that fouling involves two mechanisms: internal pore fouling and build-up of a layer depending on both porous structure and solute size.
Keywords: microporous and porous membranes; fouling; ultrafiltration; polysulphone membranes; pore size distribution
Introduction
One of the major problems encountered in ultrafiltration is still membrane fouling, which affects both solute-solvent and solute-solute separations. Al- though the effects are globally reflected by variations in the membrane hy- draulic resistance, more sophisticated approaches are required in order to get a better understanding of the location and the structure of the deposited material.
Recent methods allow the nature and the amount of foulant material to be measured, e.g. use of radio-labelledproteins [ 1,2] or collection of the deposited material and analysis of its chemical composition [ 3-51. Qualitative details on the location and structure of the deposited material are obtained by transmis- sion or scanning electron microscopy (TEM or SEM) [ 4,6] and, recently, by Fourier transformation infrared spectroscopy [ 71. General information con- cerning changes in properties due to fouling is also provided by physical meth- ods such as measurements of streaming potential [ 81, contact angle [ 71 or zeta
*Present address: University of Kentucky, Dept. of Chem. Eng., Anderson Hall, Lexington, KY 40 506-0046 (USA).
0376-7388/91/$03.50 0 1991- Elsevier Science Publishers B.V.

14
potential [9]. Although all these methods individually provide good insight into the knowledge of fouling, none is really suitable for reflecting the changes in sieving characteristics, as up to now no quantitative relationship has been available between sieving properties and the above measurements, although evidence is often given of a link between hydraulic resistance and selectivity.
Measurement of the retention of test solutes before and after fouling can be a suitable alternative, as shown by Hanemaaijer et al. [lo]. In order to avoid the problems arising from concentration polarisation, these authors propose the use of low molar weight test molecules (R < 40% ). Retention data are then extrapolated up to 100% according to the steric hindrance model [ 111, and the membrane characteristic given is the pore size of an imaginary isoporous mem- brane equivalent to the actual one, The variations in this pore size with fouling are analysed assuming that protein deposition occurs inside the porous structure.
A limitation of the conclusions lies in the low physical probability of some of the results. For instance, it remains difficult to explain how the pores of a 6000 molar weight cut-off (MWCO) membrane could be reduced by 20% in diameter by the internal adsorption of a 36,000 g/mol protein. Other fouling mechanisms, such as the build-up of a layer hiding the intrinsic characteristics of the membrane, could have been assumed. In order to avoid speculation as to whether the fouling is pore plugging or layer build-up, a characterisation method providing more than a single equivalent pore radius would probably have been more convenient.
The scope of the present work is to study fouling of different nominal MWCO polysulphone membranes by various albumins using data provided by a char- acterisation method. The characteristics are the average pore radius, the stan- dard deviation and an estimate of the number of pores per unit area. The re- sults show the effects of fouling on the apparent porous structure as a function of the size of the foulant protein and of the MWCO. These effects run parallel with the protein retention coefficient and decline in solvent flux.
A model for the structure of the deposited matter and its location is pro- posed, depending on both foulant molecular size and pore size distribution of the clean membrane.
Materials and methods
Experimental set-up A UF-P2 module and polysulphone IRIS membranes were supplied by Tech-
Sep (Miribel, France). Membranes of nominal MWCO 10, 40 and 100 kDa were studied. Temperature was controlled within 0.5”C, and an electromag- netic Krohne flow meter and pressure transducers were used to monitor ex- perimental parameters. The permeation flow was measured with an electronic

15
TABLE 1
Characteristics of the solutes (from [ 161). cu-Lactalbumin radius is an estimation from radius of lysozyme
Solute Molar weight Stokes (Da) radius (8)
Bovine serum albumin 67,000 36.1 Ovalbumin 45,000 27.6 cY-Lactalbumin 14,000 20.6 (estim)
Mettler balance linked to a PC computer (Epson ). The permeate was period- ically recycled in the feed tank so as to maintain a constant bulk concentration.
Albumin solutions High purity (99.8% ) buffered bovine serum albumin solution (120 g/l, pH
6.8) was purchased from Institut Mkrieux (Marcy-l’etoile, France) and diluted with distilled water. Sodium azide (1 mg/l) was added to prevent bacterial growth. High purity lyophilised ovalbumin and a-la&albumin were purchased from Sigma (La Verpillere, France) and solutions were prepared in distilled water. The pH was adjusted with HCl and NaOH solutions. Some character- istics of these macromolecular solutes are reported in Table 1.
Albumin concentrations were measured by ultraviolet spectroscopy, and their preservation was monitored by size exclusion HPLC (TSK G3000SW column ) for the detection of albumin polymers and by laser light scattering analysis (Coulter N4D) for the detection of protein aggregates. The turbidity of the ultrafiltered solutions was also monitored during experimental runs by a Hach Ratio 2000 turbidimeter so as to detect the presence of suspended species.
Experimental procedures and methods
Membrane characterisation method This method, which was developed in our laboratory, has been discussed in
two previous papers [ 12,131 and is detailed in the Appendix. The membrane skin layer is considered as a set of pores, the sizes of which are distributed according to a log-normal function characterised by an average pore radius r* and a geometric standard deviation (GSD) c.
This model can be applied to solvent transfer. The total solvent flux, J, through a membrane is the sum of fluxes j(r) through each pore of radius r, which gives:
(1)

16
Given the assumed log-normal pore size distribution, the number of pores n(r) per unit area is given by:
n(r) =n,exp[ - (log(r/r*)/log a)‘] (2)
where n, is the number of pores of radius r*. Substituting for n (r ) in eqn. (1) allows an expression for J to be written as
a function of no:
J=no J
exp[ - (log (r/r-*)/log a)2]j(r)dr (3) 0
Since a Poiseuille model for solvent transport through the pores has been chosen, the solvent flux though a pore of radius r is:
j(r) = [ndP/8pZ]r4 (4)
Substituting for j (r) in eqn. (3 ) gives:
J=(F) (%) T exp[ - (log(r/r*)/log a)2r4dr 0
Once the average radius r* and the standard deviation o have been deduced according to the method described in the Appendix, the value of (no/l) can be determined from the measurement of J and the calculation of the integral term by a Runge-Kutta fourth order procedure. The number of pores per unit area and per unit of thickness, rt,/Z, and the pore size distribution n(r)/Z can then be calculated.
Membrane fouling procedure Two procedural variants have been investigated so as to establish to what
extent adsorption can be considered the main cause of fouling. (i) The clean membrane was brought into contact (no pressure) with an
albumin solution (20 g/l) during 15 hr in order to reach adsorption equilib- rium. The value of 20 g/l corresponds to the minimal concentration needed to obtain maximal adsorption [ 21. Such a membrane is called “adsorbed” here- after. After rinsing with pure solvent, the hydraulic resistance was measured and the porous structure was characterised according to the previous method.
(ii) After a cleaning procedure, the membrane was used for albumin ultra- filtration. The increase in hydraulic resistance induced by fouling and the character of the porous structure were analysed as before. In this procedure the solvent flux and albumin retention coefficients were also measured as a function of running time. The conditions were: 5 g/l; 1 m/set; 50 kPa.

17
Experimental results
Results obtained with bovine serum albumin and different MWCO polysul- phone membranes are presented first. The cases of other albumins are reported in a later section.
Bovine serum albumin Results reported in the first part of this section concern an attempt to stan-
dardise the experimental procedures used to promote fouling. Variations in ultrafiltration fluxes and albumin retention coefficients are also considered. In the second part, retention curves for clean and fouled membranes are pre- sented and discussed.
Ultrafiltration Fouling control. In order to estimate the role of adsorption in fouling, perme-
abilities of clean, “adsorbed” and fouled membranes are compared in Table 2. In the absence of albumin denaturation, the permeability of each membrane is reduced to the same level by fouling and by adsorption, whatever the con- ditions of ultrafiltration. Fouling is more severe when the proteins are dena- tured. In the latter case, the permeability is sensitive to operating conditions. These observations suggest that membrane fouling is here due primarily to adsorption of proteins, and possibly to the deposition of denatured molecules if any protein damage occurs. In the case of protein denaturation the presence of several species induces competitive fouling mechanisms, which make the analysis of results more complex. The results reported below have therefore been carried out in conditions where denaturation is avoided (i.e. T< 15 o C ). The hydraulic resistance of a fouled membrane is then almost independent of the operating conditions, and the results with a single set of operating condi- tions (5 g/l, 1 m/set, 50 kPa) are presented.
TABLE 2
Permeabilities of various membranes used in this study before and after either adsorption or ultrafiltration with a bovine serum albumin solution
Molar weight Clean membrane Membrane Membrane Comments CutofF permeability permeability permeability after (Da) (m/set/Pa) after adsorption ultrafiltration
(m/set/Pa) (m/set/Pa)
10,000 40,000
100,000 100,000
“Nominal.
2.3 x10-lo 1.8x10-‘0 1.76~10-‘~ no denaturation 8.0X lo-r0 2.42 x 10-r’ 2.22 x lo-‘0 no denaturation
21.5x 10-r’ 6.6xlo-ro 6.4x10-” no denaturation 21.5x lo-” 6.6x10-‘0 2.9x1o-‘o denaturation
18
TABLE 3
Ultrafiltration fluxes and retention coefficients for bovine serum albumin for various membranes
used in this study
Molar weight
cut-off (Da)
Ultrafiltration flux
after 1 minute
(m”/m’/sec)
Retention
coefficient
after 1 minute
(%)
Ultrafiltration flux
at steady state
(m”/m’/sec)
Retention
coefficient
at steady
state (% )
10,000 1.0x 1o-5 100 0.88X 10-s 100
40,000 1.95x lo-” 85 l.llX10~5 100
100,000 4.1x10⁻⁵ 20 3.2 x lo-” 98
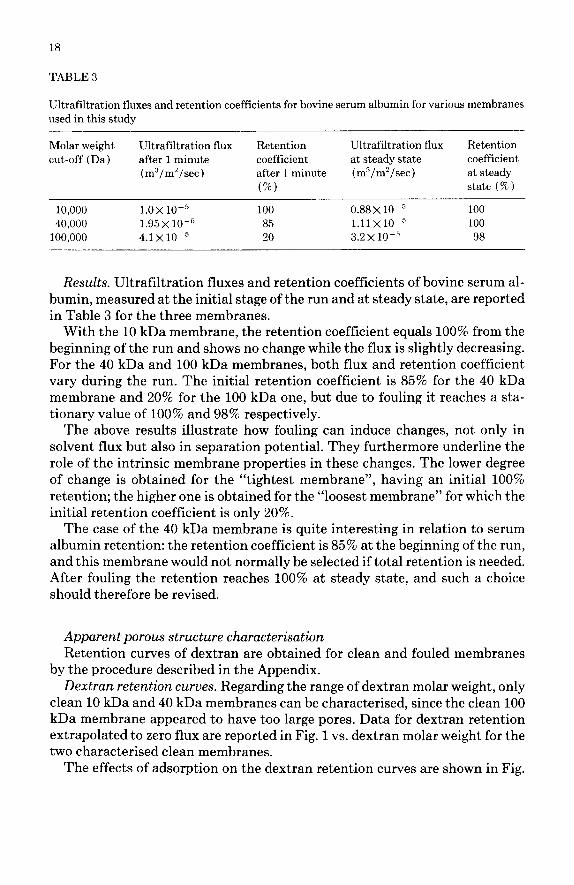
Results. Ultrafiltration fluxes and retention coefficients of bovine serum al- bumin, measured at the initial stage of the run and at steady state, are reported in Table 3 for the three membranes.
With the 10 kDa membrane, the retention coefficient equals 100% from the beginning of the run and shows no change while the flux is slightly decreasing. For the 40 kDa and 100 kDa membranes, both flux and retention coefficient vary during the run. The initial retention coefficient is 85% for the 40 kDa membrane and 20% for the 100 kDa one, but due to fouling it reaches a sta- tionary value of 100% and 98% respectively.
The above results illustrate how fouling can induce changes, not only in solvent flux but also in separation potential. They furthermore underline the role of the intrinsic membrane properties in these changes. The lower degree of change is obtained for the “tightest membrane”, having an initial 100% retention; the higher one is obtained for the “loosest membrane” for which the initial retention coefficient is only 20%.
The case of the 40 kDa membrane is quite interesting in relation to serum albumin retention: the retention coefficient is 85% at the beginning of the run, and this membrane would not normally be selected if total retention is needed. After fouling the retention reaches 100% at steady state, and such a choice should therefore be revised.
Apparent porous structure characterisation Retention curves of dextran are obtained for clean and fouled membranes
by the procedure described in the Appendix. Dextran retention curves. Regarding the range of dextran molar weight, only
clean 10 kDa and 40 kDa membranes can be characterised, since the clean 100 kDa membrane appeared to have too large pores. Data for dextran retention extrapolated to zero flux are reported in Fig. 1 vs. dextran molar weight for the two characterised clean membranes.
The effects of adsorption on the dextran retention curves are shown in Fig.

19
80
-2 6 60 10 kD; clean and fouled .c 2 40 kD; fouled
‘: 100 kD; fouled CL 40 40 kD; clean
20
Molar Mass
0 100000 2ocooo 3coooo
Fig. 1. Experimental retention of dextran vs. molar mass.
1 for the three membranes. The curves corresponding to the clean and fouled 10 kDa membranes show no significant difference. This observation is in agreement with those of Hanemaaijer et al. [lo] for the tightest of their mem- branes. In contrast, the curves corresponding to the clean and fouled 40 kDa membranes show a shift towards the retention of smaller molecules. This is also observed for the fouled 100 kDa membrane, which is now compatible with the size of test solutes used.
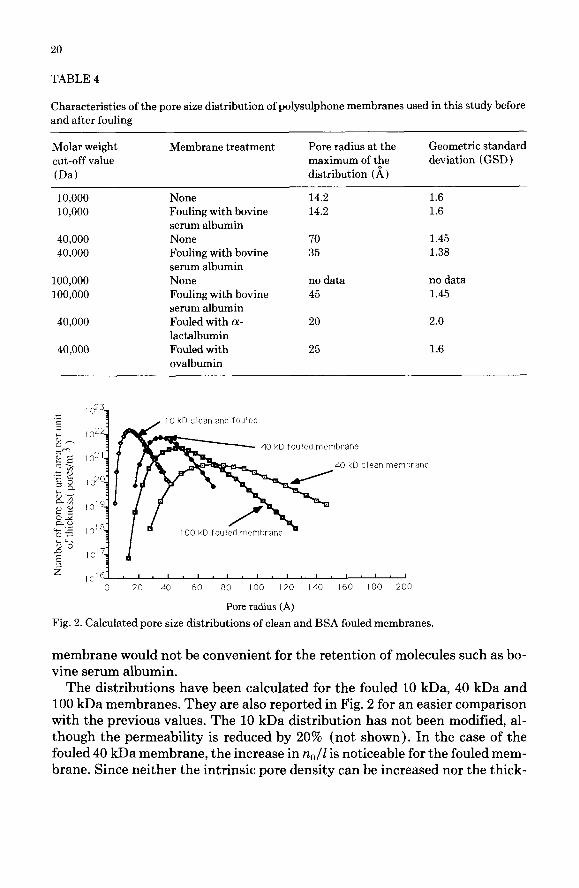
Characteristics of the porous structure. Values of the average radii and geo- metric standard deviation corresponding to the dextran rejection curves men- tioned above are reported in Table 4. The average radius of the 40 kDa mem- brane is decreased from 70 A down to 35 A after fouling, with a geometric standard deviation (GSD ) remaining almost the same. In the same connection the characteristics of the fouled 100 kDa are fairly close to those of the fouled 40 kDa membrane, i.e. an average radius of 45 A with a GSD of 1.45. As noted above, the pore structure of the 10 kDa membrane is hardly affected by fouling, and a radius of 14 A is found with a GSD of 1.6. The trends suggested by the values in Table 4 are in good agreement with the qualitative observations of the previous paragraph. According to these results, the way the fouling mech- anisms affect the apparent porous structure seems to depend on the charac- teristics of the clean membrane.
The distributions obtained for the clean 10 kDa and 40 kDa membranes are shown in Fig. 2. In this figure, the majority of radii are smaller than 40 A and the ratio n,/Z is much larger in the case of the 10 kDa membrane. This can arise from a difference in thickness I between the two skin layers, or from a difference in pore density. In the case of the 40 kDa membrane, the tail towards larger pores cannot be neglected although the geometric standard deviation is smaller than for the previous case. This could explain why a clean 40 kDa
20
TABLE 4
Characteristics of the pore size distribution of polysulphone membranes used in this study before
and after fouling
Molar weight
cut-off value
(Da)
Membrane treatment Pore radius at the
maximum of the
distribution (A)
Geometric standard
deviation (GSD)
10,000
10,000
40,000
40,000
100,000
100.000
40,000
40,000
None Fouling with bovine
serum albumin
None
Fouling with bovine
serum albumin
None
Fouling with bovine
serum albumin
Fouled with (Y-
lactalbumin
Fouled with
ovalbumin
14.2 1.6
14.2 1.6
70 35
no data no data
45 1.45
20
25 1.6
1.45
1.36
2.0
IO kC clean and fouled
40 kD fouled membrane
40 kD clean membrane
Pore radius (A)
Fig. 2. Calculated pore size distributions of clean and BSA fouled membranes.
membrane would not be convenient for the retention of molecules such as bo- vine serum albumin.
The distributions have been calculated for the fouled 10 kDa, 40 kDa and 100 kDa membranes. They are also reported in Fig. 2 for an easier comparison with the previous values. The 10 kDa distribution has not been modified, al- though the permeability is reduced by 20% (not shown). In the case of the fouled 40 kDa membrane, the increase in n,,/Z is noticeable for the fouled mem- brane. Since neither the intrinsic pore density can be increased nor the thick-

21
Q clean membrane + BSA fouled membrane 4 Ovalbumin fouled membrane 4 a -Lactalbumin fouled membrane
0.0 0 20 40 60 80 100 120 140
Pore radius (A)
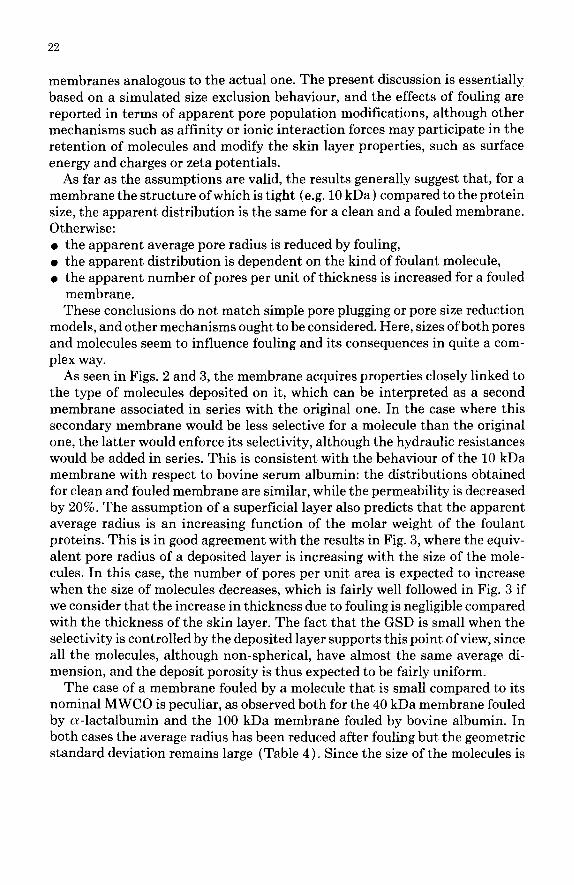
Fig. 3. Calculated distributions of a 40 kDa membrane fouled with the various solutes used in this study compared with the distribution of a 40 kDa clean membrane.
ness of the skin layer can be decreased by fouling, the observed variations in no/Z during fouling probably reflect the effects of the structure of the adsorbed matter on separation, as discussed in the following section. Finally, the 100 kDa membrane has been made close to the 40 kDa, although due to the stan- dard deviation a significant number of pores is larger than 100 A. These results underline the fact that the apparent porous structure of a fouled membrane seems to be influenced by both molecular size and the structure of the clean membrane.
Extension to other albumins An extra set of runs has been carried out with a 40 kDa membrane and
different albumins. At steady state, the retention was 96%, 100% and 100% for a-lactalbumin, ovalbumin and serum albumin respectively. Figure 3 shows the distribution corresponding to the clean membrane and the membrane fouled by the three proteins. As seen before with bovine albumin, the average radius decreases with fouling, but the results now suggest that the average radii of a 40 kDa fouled membrane are ranked in the same way as the foulant protein sizes. The results underline again the importance of the size of the foulant in respect of the retention properties of the fouled membrane, which disagrees with the conclusions of Hanemaaijer et al. [lo] as noted above. The data of Table 4 show that the smaller the protein, the larger is the GSD. As observed before, the ratio n,/Z seems to be increased when fouling occurs.
Discussion
The method used here provides apparent pore size distributions of imaginary
22
membranes analogous to the actual one. The present discussion is essentially based on a simulated size exclusion behaviour, and the effects of fouling are reported in terms of apparent pore population modifications, although other mechanisms such as affinity or ionic interaction forces may participate in the retention of molecules and modify the skin layer properties, such as surface energy and charges or zeta potentials.
As far as the assumptions are valid, the results generally suggest that, for a membrane the structure of which is tight (e.g. 10 kDa) compared to the protein size, the apparent distribution is the same for a clean and a fouled membrane. Otherwise: l the apparent average pore radius is reduced by fouling, l the apparent distribution is dependent on the kind of foulant molecule, l the apparent number of pores per unit of thickness is increased for a fouled
membrane. These conclusions do not match simple pore plugging or pore size reduction
models, and other mechanisms ought to be considered. Here, sizes of both pores and molecules seem to influence fouling and its consequences in quite a com- plex way.
As seen in Figs. 2 and 3, the membrane acquires properties closely linked to the type of molecules deposited on it, which can be interpreted as a second membrane associated in series with the original one. In the case where this secondary membrane would be less selective for a molecule than the original one, the latter would enforce its selectivity, although the hydraulic resistances would be added in series. This is consistent with the behaviour of the 10 kDa membrane with respect to bovine serum albumin: the distributions obtained for clean and fouled membrane are similar, while the permeability is decreased by 20%. The assumption of a superficial layer also predicts that the apparent average radius is an increasing function of the molar weight of the foulant proteins. This is in good agreement with the results in Fig. 3, where the equiv- alent pore radius of a deposited layer is increasing with the size of the mole- cules. In this case, the number of pores per unit area is expected to increase when the size of molecules decreases, which is fairly well followed in Fig. 3 if we consider that the increase in thickness due to fouling is negligible compared with the thickness of the skin layer. The fact that the GSD is small when the selectivity is controlled by the deposited layer supports this point of view, since all the molecules, although non-spherical, have almost the same average di- mension, and the deposit porosity is thus expected to be fairly uniform.
The case of a membrane fouled by a molecule that is small compared to its nominal MWCO is peculiar, as observed both for the 40 kDa membrane fouled by a-lactalbumin and the 100 kDa membrane fouled by bovine albumin. In both cases the average radius has been reduced after fouling but the geometric standard deviation remains large (Table 4), Since the size of the molecules is

23
small compared with the size of the largest pores (initial R < 100% ), the de- posited structure is in this case unable to mask the entire primary structure of the membrane. Since the number of large pores is reduced anyway (Fig. 2)) the possibility of a reduction of the radius by internal fouling must be considered.
Three sketches simulating the fouling of a tight, a medium and a loose mem-
hydraulic resistance due to fouling
v tight strnctnre
intrinsic hydraulic resistance of the membrane
Retention characteristics are enforced by the structure of the fouling ” mask”
Retention characteristics are enforced by the structnre of the membrane
Hydraulic resistances are added
mass transfer is controlled by fouling deposit
mass transfer is controlled by the membrane
loose stIuctnre
(100 kQ
Fig. 4. Sketches simulating the fouling of a tight, a medium and a loose membrane structure with respect to solute size.
24
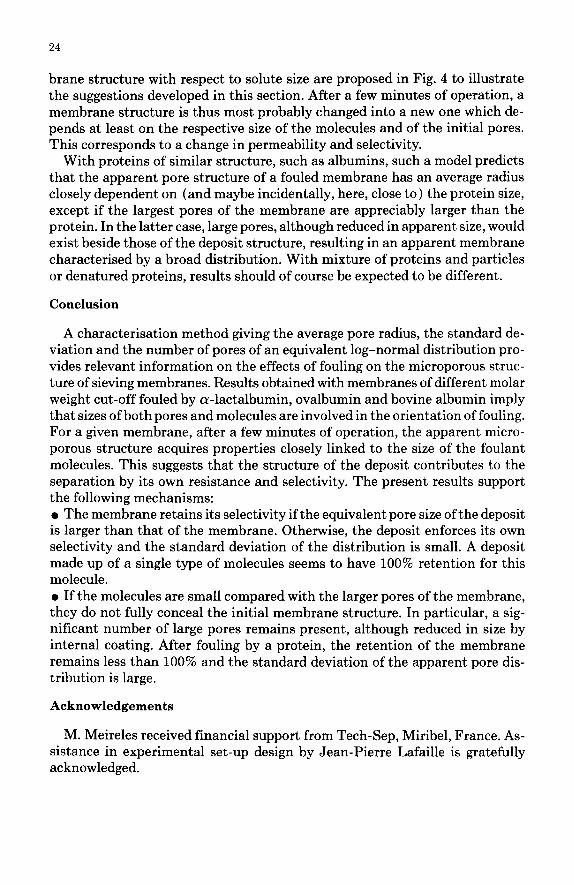
brane structure with respect to solute size are proposed in Fig. 4 to illustrate the suggestions developed in this section. After a few minutes of operation, a membrane structure is thus most probably changed into a new one which de- pends at least on the respective size of the molecules and of the initial pores. This corresponds to a change in permeability and selectivity.
With proteins of similar structure, such as albumins, such a model predicts that the apparent pore structure of a fouled membrane has an average radius closely dependent on (and maybe incidentally, here, close to) the protein size, except if the largest pores of the membrane are appreciably larger than the protein. In the latter case, large pores, although reduced in apparent size, would exist beside those of the deposit structure, resulting in an apparent membrane characterised by a broad distribution. With mixture of proteins and particles or denatured proteins, results should of course be expected to be different.
Conclusion
A characterisation method giving the average pore radius, the standard de- viation and the number of pores of an equivalent log-normal distribution pro- vides relevant information on the effects of fouling on the microporous struc- ture of sieving membranes. Results obtained with membranes of different molar weight cut-off fouled by a-lactalbumin, ovalbumin and bovine albumin imply that sizes of both pores and molecules are involved in the orientation of fouling. For a given membrane, after a few minutes of operation, the apparent micro- porous structure acquires properties closely linked to the size of the foulant molecules. This suggests that the structure of the deposit contributes to the separation by its own resistance and selectivity. The present results support the following mechanisms: l The membrane retains its selectivity if the equivalent pore size of the deposit is larger than that of the membrane. Otherwise, the deposit enforces its own selectivity and the standard deviation of the distribution is small. A deposit made up of a single type of molecules seems to have 100% retention for this molecule. l If the molecules are small compared with the larger pores of the membrane, they do not fully conceal the initial membrane structure. In particular, a sig- nificant number of large pores remains present, although reduced in size by internal coating. After fouling by a protein, the retention of the membrane remains less than 100% and the standard deviation of the apparent pore dis- tribution is large.
Acknowledgements
M. Meireles received financial support from Tech-Sep, Miribel, France. As- sistance in experimental set-up design by Jean-Pierre Lafaille is gratefully acknowledged.

25
List of symbols
a
Gi
cpi
j
J 1
no n(r) Ri R r r*
Molecule radius (m or A) Concentration of fraction i in the bulk ( kg/m3) Concentration of fraction i in the permeate ( kg/m3 ) Flux through a pore ( m3/sec) Solvent flux (m”/m”/sec) Skin layer thickness (m) Number of pores of the average radius per unit area ( pore/m2 ) Number of pores per unit area (pore/m”) Retention coefficient of fraction i (% ) Retention coefficient (% ) Pore radius (m or A) Average radius of the pore size distribution (m or A)
Greek symbol-s A Reduced radius = a/r P Viscosity of the permeate (Pa-set ) 0 Geometric standard deviation of the distribution
References
1 E. Matthiasson, The role of macromolecular adsorption in fouling of ultrafiltration mem- branes, J. Membrane Sci., 16 (1983) 23.
2 P. Aimar, S. Baklouti and V. Sanchez, Membrane-solute interactions: Influence on pure solvent transfer during ultrafiltration, J. Membrane Sci., 29 (1986) 207.
3 A.G. Fane, C.D.J. Fell and A. Suki, The effect of pH and ionic environment on the ultrafil- tration of protein solutions with retentive membranes, J. Membrane Sci., 16 (1983) 195.
4 F.A. Glover and B.E. Brooker, The structure of the deposit formed on the membrane during the concentration of milk by reverse osmosis, J. Dairy Res., 41 (1978) 89.
5 S.I. Nakao, T. Nomura and S. Kimura, Characteristics of macromolecular gel layer formed on ultrafiltration tubular membranes, AIChE J., 25 (1979) 615.
6 M. Oldani and G. Schock, Characterization of ultrafiltration membranes by infrared spec- troscopy, ESCA, and contact angle measurements, J. Membrane Sci., 43 (1989) 243.
7 M. Cheryan and U. Merin, A study of fouling phenomena during ultrafiltration of cottage cheese whey, in: A.R. Cooper (Ed.), Ultrafiltration Membranes and Applications, Plenum Press, New York, NY, 1980.
8 M. Nystrom, Fouling of unmodified and modified polysulfone ultrafiltration membranes by ovalbumin, J. Membrane Sci., 44 (1989) 183.
9 W.R. Bowen, Lecture presented at Universitk Paul Sabatier, Toulouse, February 23,1989.
26
10 J.H. Hanemaaijer, T. Robber&en, Th. Van den Boomgaard, C. Olieman, P. Both and D.G.
Schmidt, Characterisation of clean and fouled ultrafiltration membranes, Desalination, 68
(1988) 93. 11 J.D. Ferry, Ultrafilter membranes and ultrafiltration, Chem. Res., 18 (1936) 373.
12 P. Aimar, M. Meireles and V. Sanchez, J. Membrane Sci., in press.
13 P. Nobrega, H. de Balmann, P. Aimar and V. Sanchez, Transfer of dextran through ultrafil-
tration membranes: A study using retention data analysed by gel permeation chromato-
graphy, J. Membrane Sci., 45 (1989) 17.
14 M. Meireles, Influence de la structure poreuse sur le transfert de solvant et de solute en ultra-
filtration, These de Doctorat No. 526, Universite P. Sabatier, Toulouse, 1989.
15 K. Granath and B. Kvist, Molecular weight distribution analysis by gel chromatography on
sephadex, J. Chromatogr., 28 (1967) 69.
16 C. Tanford, Physical Chemistry of Macromolecules, Wiley, New York, NY, 1961, p. 359.
Appendix: characterisation method
Principle The characterisation method used in this study was defined by Nobrega et
al. [ 131. It is based on retention measurements of polydisperse synthetic poly- mers. With polysulphone membranes it was shown that a dextran mixture showing negligible interaction with clean or fouled membranes can be used [ 141. The analyses of retentate and permeate are performed using size exclu- sion HPLC. A procedure is used to reduce the effects of concentration polar- isation and of bulk concentration on the measurements so as to obtain reten- tion curves depending only on the membrane.
These retention curves are analysed using a model assuming steric hin- drance and Poiseuille flow for solute and solvent transport together with a shape (log-normal) for the pore size distribution.
Characteristic retention curves For each fraction i of a given molar weight, a retention coefficient
(Ri=l-C,i/C,i) is calculated by comparison of the permeate and retentate HPLC spectra. Nobrega et al. [ 131 have shown how the operating conditions (dextran bulk concentration, Reynolds number and transmembrane pressure) influence the shape of curves of retention versus molar weight. As a conse- quence, running conditions have to be chosen so as to minimize the effects of concentration polarisation (low bulk concentration, high Reynolds number and low pressure values ) .
Then, for each fraction, the retention is plotted versus the transmembrane pressure and extrapolated to zero pressure (Fig. Al ). This allows a curve to be obtained which can be considered as characteristic of the membrane porous structure (Fig. A2 ) .
Pore size distribution The mass transfer model combines Ferry’s and Poiseuille’s assumptions,
and a log-normal pore size distribution (r*: average radius; E geometric stan-

27
z 0 I
cz 0.0 0.5 1.0 1.5
Trammembrane pressure @Pa)
Fig. Al. Extrapolation of the retention coefficients for dextrans of different molar mass. From top to bottom: 60,50,40,30,20,10,5 and 2 kg/mol.
1000 10 000
Dcxtran molar weight (daltons)
Fig. A2. Characteristic curve of the membrane.
dard deviation). The retention coefficients are expressed as a function of pore size and molecular radius a (estimated for a given molar weight by using the formula proposed by Granath and Kvist [ 151):
~r4[l-(l--a/r)Z]2exp[-(log(r/r*)/logo)2]dr
R(;lI”
7 r4 exp[ - (log(r/r*)/log a)2dr
(Al)
where L is defined as the ratio between the solute radius a and the pore radius r. After integration of eqn. (Al ), it is shown that it is worth standardising the

28
molecular radius by the molecular radius of a molecule for which the retention is as close as possible to 100% (99% in the present example ). When the reten- tion curves are then plotted versus this reduced radius, one can see that the retention depends only on the geometric standard deviation. In Fig. A3, we have plotted the retention coefficient which should be observed at a reduced radius of 0.40. This figure means that, if a 60% retention is observed for a molecule the radius of which is 0.4 times the radius of a molecule retained at 99%, then the geometric standard deviation of an equivalent log-normal pore size distribution is 1.68. In Fig. A4, we have plotted the retention coefficient of a molecule the radius of which is the average radius of the pore distribution according to the present model. If we consider further the standard deviation of 1.68, Fig. A4 shows that the retention of a molecule, the size of which is the average radius r*, should be ca. 59%. Once the values of r* and GSD have been found according to the previous procedure, the number of pores per unit area can be estimated using eqn. (5 ) .
100
20 1.0 1.5 2.0 2.5
Geomenic standard deviation 0
Fig. A3. Determination of the GSD from the value of R* corresponding to a reduced radius J. (see 1121).
80
60
20
1.0 1.2 1.4 1.6 1.6 2.0 2.2 2.4
Geometric standard deviation CI
Fig. A4. Determination of the retention coefficient corresponding to the central r* according to the GSD determined on Fig. A3.
Copyright © 2022 FDOKUMEN