
Numerical investigation of combustion characteristics in an oxygen transport reactor
Upload
khangminh22Category
view
2download
0
energies
Article
Effects of Oxygen Content of Fuels on Combustionand Emissions of Diesel Engines †
Haiwen Song 1, Kelly Sison Quinton 1, Zhijun Peng 2,3,*, Hua Zhao 4 and Nicos Ladommatos 5
Received: 22 October 2015; Accepted: 28 December 2015; Published: 5 January 2016Academic Editor: Chang Sik Lee
1 Ford Motor Company, Dunton Technical Centre, Basildon SS15 6EE, UK; [email protected] (H.S.);[email protected] (K.S.Q.)
2 Key State Lab of Engines, Tianjin University, Tianjin 300072, China3 School of Engineering and Technology, University of Hertfordshire, Hatfield AL10 9AB, UK4 School of Engineering and Design, Brunel University, Uxbridge UB8 3PH, UK; [email protected] Department of Mechanical Engineering, University College London, London WC1E 6BT, UK;
[email protected]* Correspondence: [email protected]; Tel.: +86-22-2740-4409† This paper is an extended version of our paper published in the 12th International Conference on
Combustion and Energy Utilisation, Lancaster, UK, 29 September–3 October 2014.
Abstract: Effects of oxygen content of fuels on combustion characteristics and emissions wereinvestigated on both an optical single cylinder direct injection (DI) diesel engine and a multi-cylinderengine. Three fuels were derived from conventional diesel fuel (Finnish City diesel summer grade)by blending Rapeseed Methyl Ester (RME) or Diglyme and Butyl-Diglyme of different quantitiesto make their oxygen content 3%, 3% and 9%, respectively. The experimental results with threetested fuels show that the fuel spray development was not affected apparently by the oxygenating.Compared with the base fuel, the ignition delay to pilot injection was shortened by 0%, 11% and19% for three oxygenated fuels, respectively. The ignition delay to main injection was shortened by10%, 19% and 38%, respectively. With regard to emissions, the smoke level was reduced by 24% to90%, depending on fuel properties and engine running conditions. The penalties of increased NOx
emissions and fuel consumption were up to 19% and 24%, respectively.
Keywords: oxygenated fuel; oxygen content; diesel fuel; NOx emissions; smoke
1. Introduction
Adding oxygen-containing chemicals to diesel fuel has been considered to be an effective meansto reduce the particulate emission with small penalties on NOx and fuel consumption. This methodmight be one of the simplest and thus well recognized solutions for improving existing diesel enginesto meet increasingly stringent emission regulations. Tens of oxygen-containing hydrocarbons havebeen evaluated in relation to compression ignition engine applications [1,2]. The additives can bedivided into two types—biomass products and synthetic products.
Initially motivated by the first oil crises in the 1970s, investigations of the biomass fuels wereaimed at replacing conventional petroleum supplies. Later on, more attention has been focused onCO2 and PM (Particulate Matter) emissions using renewable, oxygen-containing biomass fuels fromvegetable oils [3,4].
Pure vegetable oils are not suitable for internal combustion engines directly because of theirhigh viscosity, poor volatility, and low cetane number, which result from the large molecular massand chemical structure and cause incomplete combustion and heavy smoke [5]. Therefore, in currentpractice, methyl ester is commonly made by combining the vegetable oil with methanol and blended
Energies 2016, 9, 28; doi:10.3390/en9010028 www.mdpi.com/journal/energies
Energies 2016, 9, 28 2 of 12
with normal petroleum fuels. In Europe, RME (Rapeseed Methyl Ester) is already commerciallyavailable for use in vehicles [6]. Currently, most engine manufacturers accept up to 5% RME additivein normal fossil fuel, without need of basic modification to the engine design. As a re-generable fuel,RME is more CO2 friendly than conventional diesel fuel [7]. In addition, RME contains no aromatics,which are contributors to engine particulate emission [8,9]. Because of its approximately 10% [10,11]oxygen content, low sulfur content, zero aromatics content, and higher cetane number, RME has beenfound to be able to lower PM (Particulate Matter) emission, although with possible penalty of higherNOx emission [12].
With regard to synthetic additives, one potential candidate is diglyme (C6H14O3), which has35.8% oxygen content by weight, a density of 943 kg/m3, cetane number about 112, and heat valueof 32.17 MJ/kg [13]. Another synthetic product, Butyl-Diglyme (C12H26O3), has higher boiling pointthan diglyme. Similar to RME, when synthetic product is added to normal diesel fuel, the presenceof oxygen in the molecule gives them possible improvement on ignition or reduced ignition delaycompared to normal diesel.
The advantage of oxygenates for reducing engine PM emissions is well known. However,fuel oxygenation could lead to higher NOx emission, as NOx normally increases with oxygenconcentration and combustion temperature in the cylinder [14]. If having adequate optimizationon engine combustion system and on combustion control strategy, blending normal diesel fuel withoxygenates could produce benefit for improving trade-off between NOx and PM [15,16]. Moderndiesel engines equipped with an electronically controlled injection system, especially common railinjection system, and EGR (Exhaust Gas Recirculation) system, can provide great flexibility to theoptimization in order to make full use of the advantage of the oxygenated fuels.
While various bio-fuels and synthetic additives are added and will be added into commercialdiesel fuel, it is necessary to understand their influences on air-fuel mixing, engine combustionprocesses and consequently on exhaust emissions. The objectives of presented research are toinvestigate effects of oxygenated diesel fuel on fuel injection characteristics, engine combustionand emissions, while different additives also provide different changes to fuel properties, such ascetane number, etc. The experimental investigations were carried out on an optical test engine and afour-cylinder production engine, respectively.
2. Experimental Description
2.1. Test Fuels
The reference diesel fuel used in this study was Finnish City diesel (summer grade), named as thebase fuel. Three derivatives that contain different oxygen contents and reached by different mixturecompositions were derived from the base diesel fuel by blending Rapeseed Methyl Ester (RME) orDiglyme and Butyl-Diglyme with different quantities to make their oxygen content to be 3%, 3% and9%, respectively. The properties of the four fuels and two oxygenated additives are shown in Tables 1and 2 respectively.
2.2. Optical Test Apparatus and Conditions
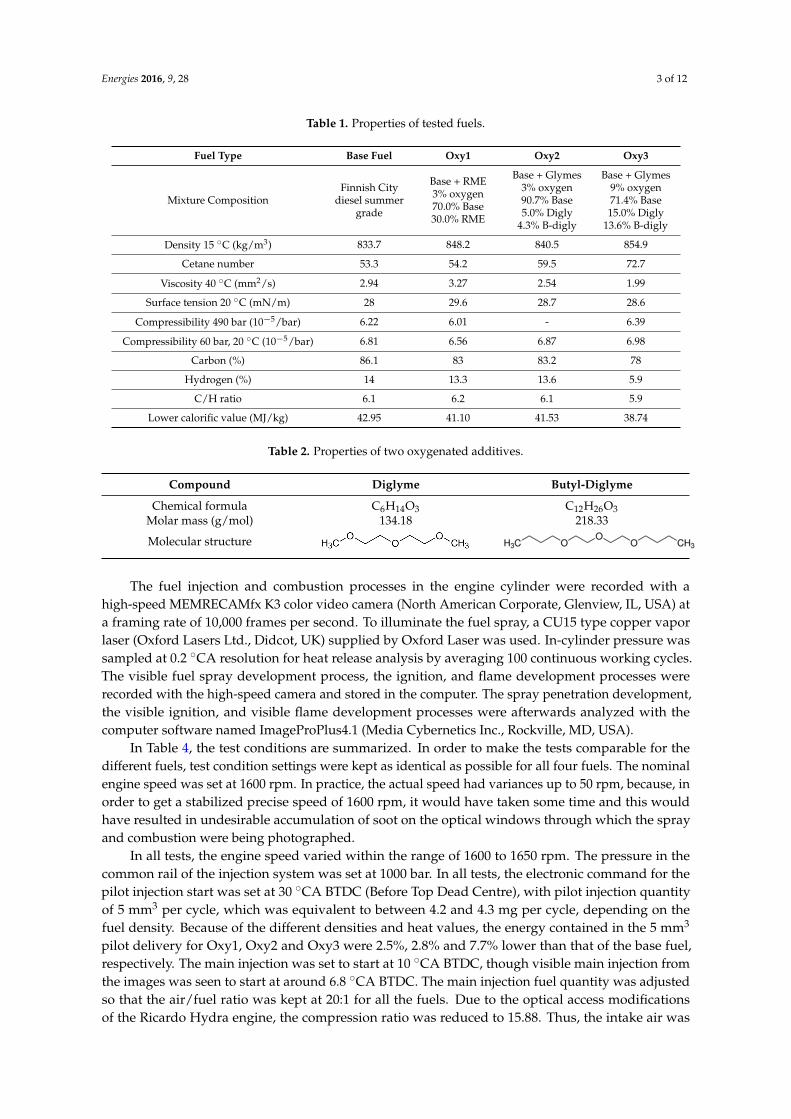
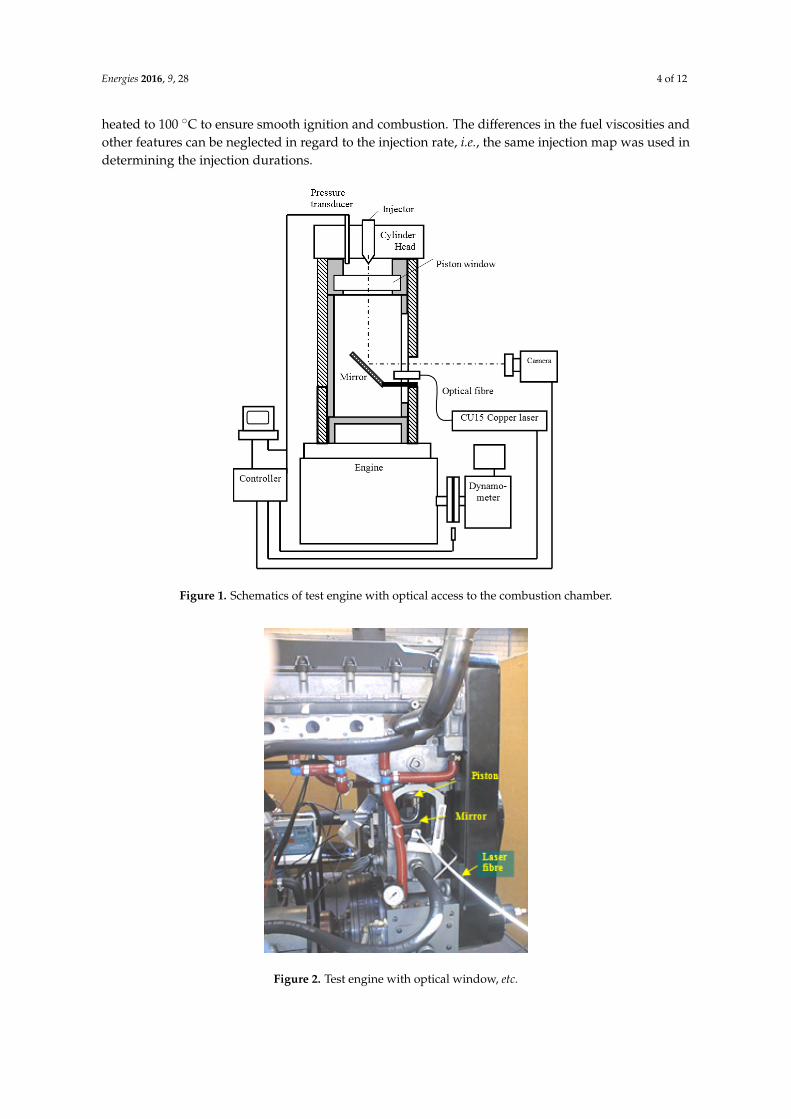
An optical single cylinder test engine equipped with common rail fuel injection system wasemployed for the present investigation. The Schematic of the test rig can be seen in Figure 1. Thespecially made cylinder was installed in a single cylinder 4-stroke naturally aspirated diesel engine,which had an extended barrel and an upper piston arrangement to provide optical access into thepiston bowl. The optical path is via an adjustable mirror positioned under the upper piston and aremovable fused-silica window in the piston crown. The engine used a Bosch common rail injectionsystem, of which the ECU (Engine Control Unit) control program could be accessed via a computer.Figure 2 shows the picture of the engine and Table 3 lists the main specifications of the optical engineand its injection system.
Energies 2016, 9, 28 3 of 12
Table 1. Properties of tested fuels.
Fuel Type Base Fuel Oxy1 Oxy2 Oxy3
Mixture CompositionFinnish City
diesel summergrade
Base + RME3% oxygen70.0% Base30.0% RME
Base + Glymes3% oxygen90.7% Base5.0% Digly
4.3% B-digly
Base + Glymes9% oxygen71.4% Base15.0% Digly
13.6% B-digly
Density 15 ˝C (kg/m3) 833.7 848.2 840.5 854.9
Cetane number 53.3 54.2 59.5 72.7
Viscosity 40 ˝C (mm2/s) 2.94 3.27 2.54 1.99
Surface tension 20 ˝C (mN/m) 28 29.6 28.7 28.6
Compressibility 490 bar (10´5/bar) 6.22 6.01 - 6.39
Compressibility 60 bar, 20 ˝C (10´5/bar) 6.81 6.56 6.87 6.98
Carbon (%) 86.1 83 83.2 78
Hydrogen (%) 14 13.3 13.6 5.9
C/H ratio 6.1 6.2 6.1 5.9
Lower calorific value (MJ/kg) 42.95 41.10 41.53 38.74
Table 2. Properties of two oxygenated additives.
Compound Diglyme Butyl-Diglyme
Chemical formula C6H14O3 C12H26O3Molar mass (g/mol) 134.18 218.33
Molecular structure
Energies 2016, 9, 28
3
Table 1. Properties of tested fuels.
Fuel Type Base Fuel Oxy1 Oxy2 Oxy3
Mixture Composition
Finnish City
diesel summer
grade
Base + RME
3% oxygen
70.0% Base
30.0% RME
Base + Glymes
3% oxygen
90.7% Base
5.0% Digly
4.3% B‐digly
Base + Glymes
9% oxygen
71.4% Base
15.0% Digly
13.6% B‐digly
Density 15 °C (kg/m3) 833.7 848.2 840.5 854.9
Cetane number 53.3 54.2 59.5 72.7
Viscosity 40 °C (mm2/s) 2.94 3.27 2.54 1.99
Surface tension 20 °C (mN/m) 28 29.6 28.7 28.6
Compressibility 490 bar (10−5/bar) 6.22 6.01 ‐ 6.39
Compressibility 60 bar, 20 °C (10−5/bar) 6.81 6.56 6.87 6.98
Carbon (%) 86.1 83 83.2 78
Hydrogen (%) 14 13.3 13.6 5.9
C/H ratio 6.1 6.2 6.1 5.9
Lower calorific value (MJ/kg) 42.95 41.10 41.53 38.74
Table 2. Properties of two oxygenated additives.
Compound Diglyme Butyl‐Diglyme
Chemical formula C6H14O3 C12H26O3
Molar mass (g/mol) 134.18 218.33
Molecular structure
The fuel injection and combustion processes in the engine cylinder were recorded with a high‐speed
MEMRECAMfx K3 color video camera (North American Corporate, Glenview, IL, USA) at a framing
rate of 10,000 frames per second. To illuminate the fuel spray, a CU15 type copper vapor laser (Oxford
Lasers Ltd., Didcot, UK) supplied by Oxford Laser was used. In‐cylinder pressure was sampled at
0.2 °CA resolution for heat release analysis by averaging 100 continuous working cycles. The visible
fuel spray development process, the ignition, and flame development processes were recorded with
the high‐speed camera and stored in the computer. The spray penetration development, the visible
ignition, and visible flame development processes were afterwards analyzed with the computer
software named ImageProPlus4.1 (Media Cybernetics Inc., Rockville, MD, USA).
In Table 4, the test conditions are summarized. In order to make the tests comparable for the
different fuels, test condition settings were kept as identical as possible for all four fuels. The nominal
engine speed was set at 1600 rpm. In practice, the actual speed had variances up to 50 rpm, because,
in order to get a stabilized precise speed of 1600 rpm, it would have taken some time and this would
have resulted in undesirable accumulation of soot on the optical windows through which the spray
and combustion were being photographed.
In all tests, the engine speed varied within the range of 1600 to 1650 rpm. The pressure in the
common rail of the injection system was set at 1000 bar. In all tests, the electronic command for the
pilot injection start was set at 30 °CA BTDC (Before Top Dead Centre), with pilot injection quantity
of 5 mm3 per cycle, which was equivalent to between 4.2 and 4.3 mg per cycle, depending on the fuel
density. Because of the different densities and heat values, the energy contained in the 5 mm3 pilot
delivery for Oxy1, Oxy2 and Oxy3 were 2.5%, 2.8% and 7.7% lower than that of the base fuel,
respectively. The main injection was set to start at 10 °CA BTDC, though visible main injection from
the images was seen to start at around 6.8 °CA BTDC. The main injection fuel quantity was adjusted
so that the air/fuel ratio was kept at 20:1 for all the fuels. Due to the optical access modifications of
the Ricardo Hydra engine, the compression ratio was reduced to 15.88. Thus, the intake air was
heated to 100 °C to ensure smooth ignition and combustion. The differences in the fuel viscosities and
other features can be neglected in regard to the injection rate, i.e., the same injection map was used in
determining the injection durations.
The fuel injection and combustion processes in the engine cylinder were recorded with ahigh-speed MEMRECAMfx K3 color video camera (North American Corporate, Glenview, IL, USA) ata framing rate of 10,000 frames per second. To illuminate the fuel spray, a CU15 type copper vaporlaser (Oxford Lasers Ltd., Didcot, UK) supplied by Oxford Laser was used. In-cylinder pressure wassampled at 0.2 ˝CA resolution for heat release analysis by averaging 100 continuous working cycles.The visible fuel spray development process, the ignition, and flame development processes wererecorded with the high-speed camera and stored in the computer. The spray penetration development,the visible ignition, and visible flame development processes were afterwards analyzed with thecomputer software named ImageProPlus4.1 (Media Cybernetics Inc., Rockville, MD, USA).
In Table 4, the test conditions are summarized. In order to make the tests comparable for thedifferent fuels, test condition settings were kept as identical as possible for all four fuels. The nominalengine speed was set at 1600 rpm. In practice, the actual speed had variances up to 50 rpm, because, inorder to get a stabilized precise speed of 1600 rpm, it would have taken some time and this wouldhave resulted in undesirable accumulation of soot on the optical windows through which the sprayand combustion were being photographed.
In all tests, the engine speed varied within the range of 1600 to 1650 rpm. The pressure in thecommon rail of the injection system was set at 1000 bar. In all tests, the electronic command for thepilot injection start was set at 30 ˝CA BTDC (Before Top Dead Centre), with pilot injection quantityof 5 mm3 per cycle, which was equivalent to between 4.2 and 4.3 mg per cycle, depending on thefuel density. Because of the different densities and heat values, the energy contained in the 5 mm3
pilot delivery for Oxy1, Oxy2 and Oxy3 were 2.5%, 2.8% and 7.7% lower than that of the base fuel,respectively. The main injection was set to start at 10 ˝CA BTDC, though visible main injection fromthe images was seen to start at around 6.8 ˝CA BTDC. The main injection fuel quantity was adjustedso that the air/fuel ratio was kept at 20:1 for all the fuels. Due to the optical access modificationsof the Ricardo Hydra engine, the compression ratio was reduced to 15.88. Thus, the intake air was
Energies 2016, 9, 28 4 of 12
heated to 100 ˝C to ensure smooth ignition and combustion. The differences in the fuel viscosities andother features can be neglected in regard to the injection rate, i.e., the same injection map was used indetermining the injection durations.
Energies 2016, 9, 28
4
Figure 1. Schematics of test engine with optical access to the combustion chamber.
Figure 2. Test engine with optical window, etc.
Figure 1. Schematics of test engine with optical access to the combustion chamber.
Energies 2016, 9, 28
4
Figure 1. Schematics of test engine with optical access to the combustion chamber.
Figure 2. Test engine with optical window, etc.
Figure 2. Test engine with optical window, etc.
Energies 2016, 9, 28 5 of 12
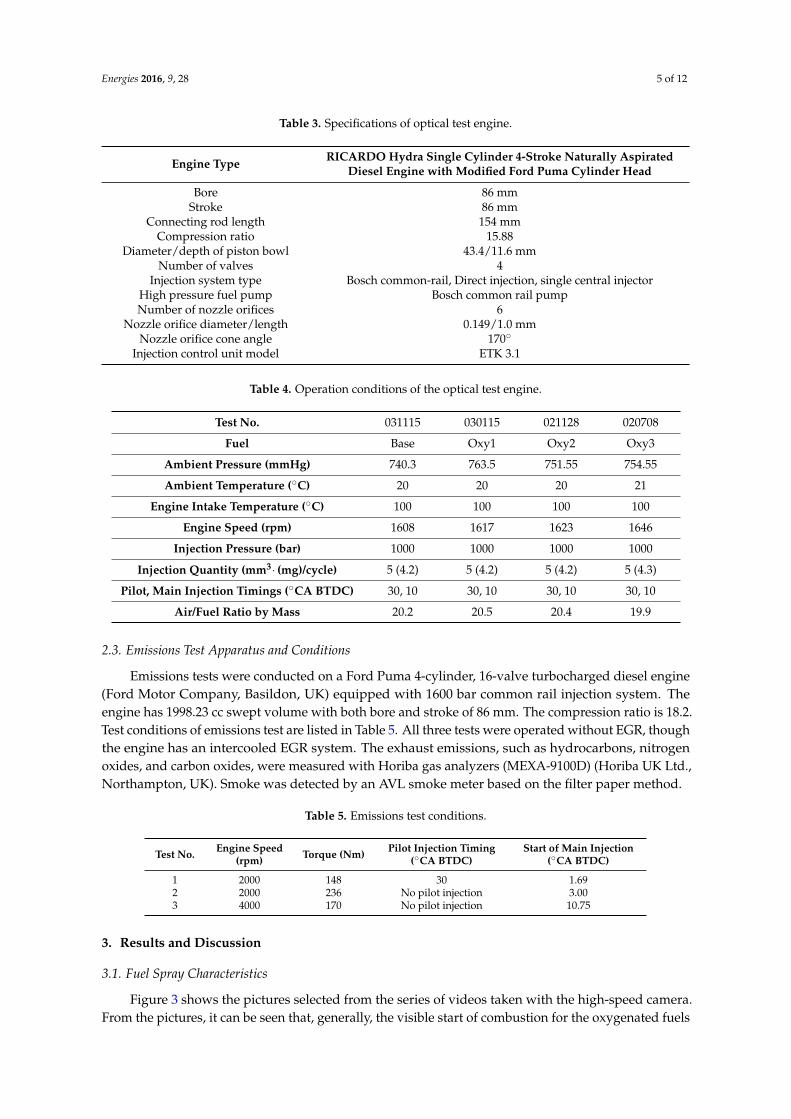
Table 3. Specifications of optical test engine.
Engine Type RICARDO Hydra Single Cylinder 4-Stroke Naturally AspiratedDiesel Engine with Modified Ford Puma Cylinder Head
Bore 86 mmStroke 86 mm
Connecting rod length 154 mmCompression ratio 15.88
Diameter/depth of piston bowl 43.4/11.6 mmNumber of valves 4
Injection system type Bosch common-rail, Direct injection, single central injectorHigh pressure fuel pump Bosch common rail pumpNumber of nozzle orifices 6
Nozzle orifice diameter/length 0.149/1.0 mmNozzle orifice cone angle 170˝
Injection control unit model ETK 3.1
Table 4. Operation conditions of the optical test engine.
Test No. 031115 030115 021128 020708
Fuel Base Oxy1 Oxy2 Oxy3
Ambient Pressure (mmHg) 740.3 763.5 751.55 754.55
Ambient Temperature (˝C) 20 20 20 21
Engine Intake Temperature (˝C) 100 100 100 100
Engine Speed (rpm) 1608 1617 1623 1646
Injection Pressure (bar) 1000 1000 1000 1000
Injection Quantity (mm3¨ (mg)/cycle) 5 (4.2) 5 (4.2) 5 (4.2) 5 (4.3)
Pilot, Main Injection Timings (˝CA BTDC) 30, 10 30, 10 30, 10 30, 10
Air/Fuel Ratio by Mass 20.2 20.5 20.4 19.9
2.3. Emissions Test Apparatus and Conditions
Emissions tests were conducted on a Ford Puma 4-cylinder, 16-valve turbocharged diesel engine(Ford Motor Company, Basildon, UK) equipped with 1600 bar common rail injection system. Theengine has 1998.23 cc swept volume with both bore and stroke of 86 mm. The compression ratio is 18.2.Test conditions of emissions test are listed in Table 5. All three tests were operated without EGR, thoughthe engine has an intercooled EGR system. The exhaust emissions, such as hydrocarbons, nitrogenoxides, and carbon oxides, were measured with Horiba gas analyzers (MEXA-9100D) (Horiba UK Ltd.,Northampton, UK). Smoke was detected by an AVL smoke meter based on the filter paper method.
Table 5. Emissions test conditions.
Test No. Engine Speed(rpm) Torque (Nm) Pilot Injection Timing
(˝CA BTDC)Start of Main Injection
(˝CA BTDC)
1 2000 148 30 1.692 2000 236 No pilot injection 3.003 4000 170 No pilot injection 10.75
3. Results and Discussion
3.1. Fuel Spray Characteristics
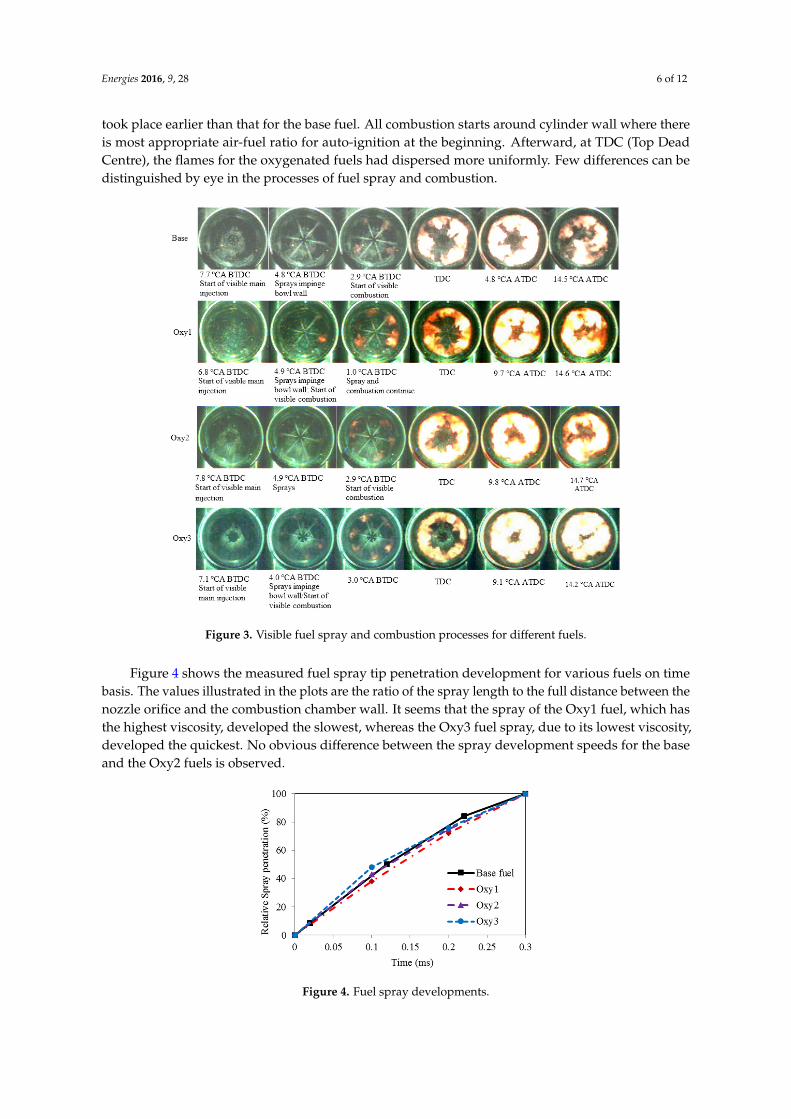
Figure 3 shows the pictures selected from the series of videos taken with the high-speed camera.From the pictures, it can be seen that, generally, the visible start of combustion for the oxygenated fuels
Energies 2016, 9, 28 6 of 12
took place earlier than that for the base fuel. All combustion starts around cylinder wall where thereis most appropriate air-fuel ratio for auto-ignition at the beginning. Afterward, at TDC (Top DeadCentre), the flames for the oxygenated fuels had dispersed more uniformly. Few differences can bedistinguished by eye in the processes of fuel spray and combustion.
Energies 2016, 9, 28
6
Figure 3. Visible fuel spray and combustion processes for different fuels.
Figure 4 shows the measured fuel spray tip penetration development for various fuels on time
basis. The values illustrated in the plots are the ratio of the spray length to the full distance between
the nozzle orifice and the combustion chamber wall. It seems that the spray of the Oxy1 fuel, which
has the highest viscosity, developed the slowest, whereas the Oxy3 fuel spray, due to its lowest
viscosity, developed the quickest. No obvious difference between the spray development speeds for
the base and the Oxy2 fuels is observed.
Figure 4. Fuel spray developments.
Figure 3. Visible fuel spray and combustion processes for different fuels.
Figure 4 shows the measured fuel spray tip penetration development for various fuels on timebasis. The values illustrated in the plots are the ratio of the spray length to the full distance between thenozzle orifice and the combustion chamber wall. It seems that the spray of the Oxy1 fuel, which hasthe highest viscosity, developed the slowest, whereas the Oxy3 fuel spray, due to its lowest viscosity,developed the quickest. No obvious difference between the spray development speeds for the baseand the Oxy2 fuels is observed.
Energies 2016, 9, 28
6
Figure 3. Visible fuel spray and combustion processes for different fuels.
Figure 4 shows the measured fuel spray tip penetration development for various fuels on time
basis. The values illustrated in the plots are the ratio of the spray length to the full distance between
the nozzle orifice and the combustion chamber wall. It seems that the spray of the Oxy1 fuel, which
has the highest viscosity, developed the slowest, whereas the Oxy3 fuel spray, due to its lowest
viscosity, developed the quickest. No obvious difference between the spray development speeds for
the base and the Oxy2 fuels is observed.
Figure 4. Fuel spray developments. Figure 4. Fuel spray developments.
Energies 2016, 9, 28 7 of 12
3.2. Ignition and Flame Development
Due to the low level of incandescence, the flame can hardly be seen on the video pictures beforethe ignition after the main injection, although heat release analysis confirms that combustion did occurbefore the main injection started. From the video pictures in Figure 3, it can be seen that the fuel spraysof the main injection impinged the wall of the combustion chamber, vaporized, and mixed with air.After that, ignition occurred within the mixture near the combustion chamber wall around the fuelspray jet while injection was still continuing. The flame fragments formed at the early combustion stagespread and, simultaneously, forced by the swirl movement of the air charge, moved circumferentiallyalong the combustion chamber wall, encountered the adjacent ones and merged with each other. Inaddition, the flames appeared to spread upstream along the sprays towards the injector. In this manner,the flame increased its occupation volume until reaching maxima in the combustion chamber spacebefore combustion started to deplete.
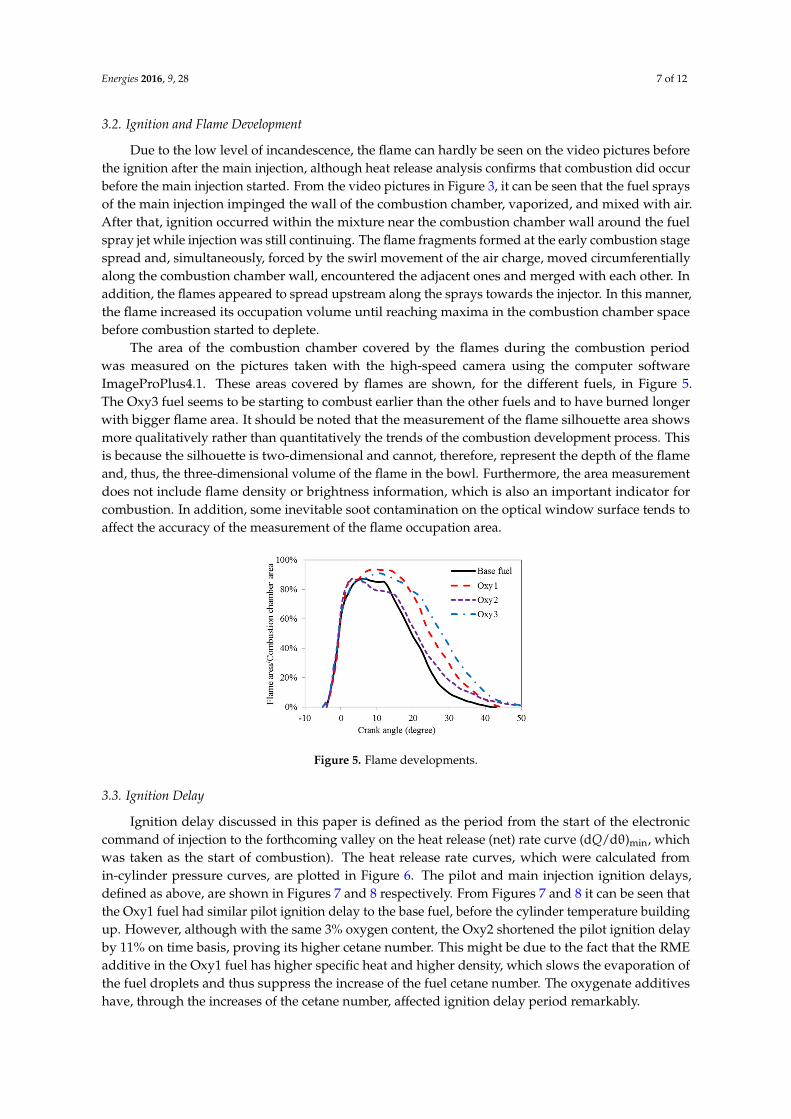
The area of the combustion chamber covered by the flames during the combustion periodwas measured on the pictures taken with the high-speed camera using the computer softwareImageProPlus4.1. These areas covered by flames are shown, for the different fuels, in Figure 5.The Oxy3 fuel seems to be starting to combust earlier than the other fuels and to have burned longerwith bigger flame area. It should be noted that the measurement of the flame silhouette area showsmore qualitatively rather than quantitatively the trends of the combustion development process. Thisis because the silhouette is two-dimensional and cannot, therefore, represent the depth of the flameand, thus, the three-dimensional volume of the flame in the bowl. Furthermore, the area measurementdoes not include flame density or brightness information, which is also an important indicator forcombustion. In addition, some inevitable soot contamination on the optical window surface tends toaffect the accuracy of the measurement of the flame occupation area.
Energies 2016, 9, 28
7
3.2. Ignition and Flame Development
Due to the low level of incandescence, the flame can hardly be seen on the video pictures before
the ignition after the main injection, although heat release analysis confirms that combustion did
occur before the main injection started. From the video pictures in Figure 3, it can be seen that the
fuel sprays of the main injection impinged the wall of the combustion chamber, vaporized, and mixed
with air. After that, ignition occurred within the mixture near the combustion chamber wall around
the fuel spray jet while injection was still continuing. The flame fragments formed at the early
combustion stage spread and, simultaneously, forced by the swirl movement of the air charge, moved
circumferentially along the combustion chamber wall, encountered the adjacent ones and merged
with each other. In addition, the flames appeared to spread upstream along the sprays towards the
injector. In this manner, the flame increased its occupation volume until reaching maxima in the
combustion chamber space before combustion started to deplete.
The area of the combustion chamber covered by the flames during the combustion period was
measured on the pictures taken with the high‐speed camera using the computer software
ImageProPlus4.1. These areas covered by flames are shown, for the different fuels, in Figure 5. The
Oxy3 fuel seems to be starting to combust earlier than the other fuels and to have burned longer with
bigger flame area. It should be noted that the measurement of the flame silhouette area shows more
qualitatively rather than quantitatively the trends of the combustion development process. This is
because the silhouette is two‐dimensional and cannot, therefore, represent the depth of the flame and,
thus, the three‐dimensional volume of the flame in the bowl. Furthermore, the area measurement
does not include flame density or brightness information, which is also an important indicator for
combustion. In addition, some inevitable soot contamination on the optical window surface tends to
affect the accuracy of the measurement of the flame occupation area.
Figure 5. Flame developments.
3.3. Ignition Delay
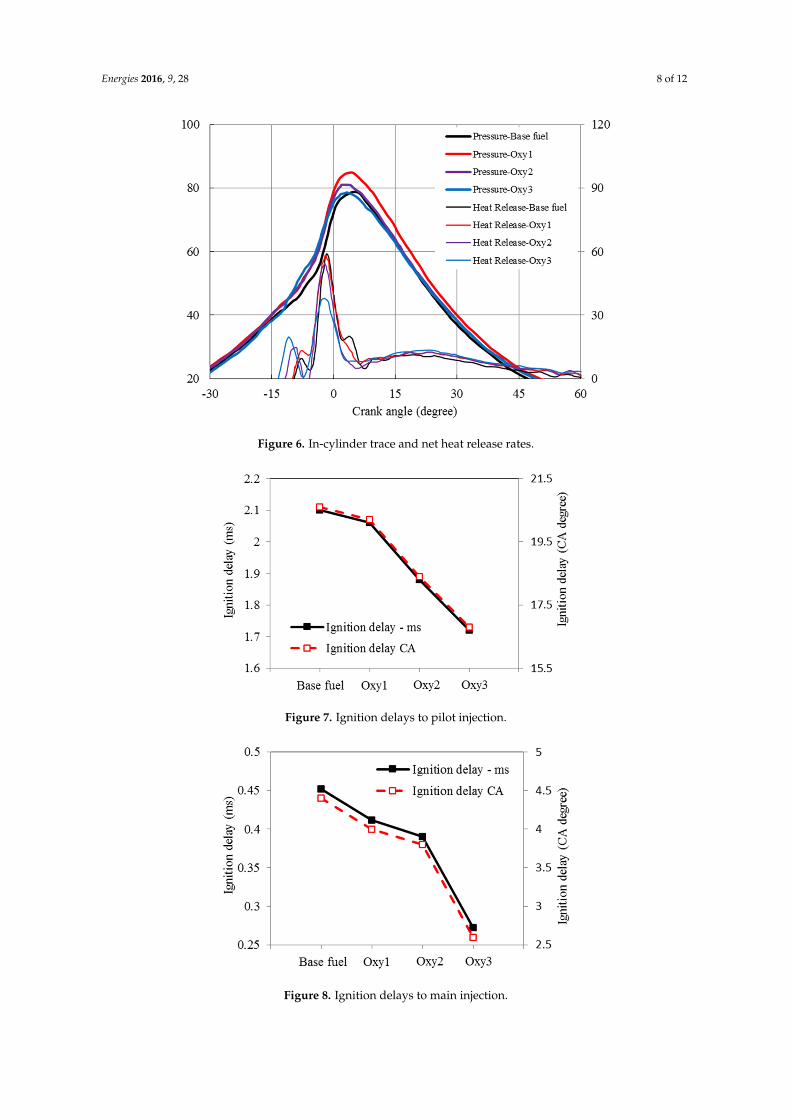
Ignition delay discussed in this paper is defined as the period from the start of the electronic
command of injection to the forthcoming valley on the heat release (net) rate curve (dQ/dθ)min, which
was taken as the start of combustion). The heat release rate curves, which were calculated from
in‐cylinder pressure curves, are plotted in Figure 6. The pilot and main injection ignition delays,
defined as above, are shown in Figures 7 and 8, respectively. From Figures 7 and 8, it can be seen that
the Oxy1 fuel had similar pilot ignition delay to the base fuel, before the cylinder temperature
building up. However, although with the same 3% oxygen content, the Oxy2 shortened the pilot
ignition delay by 11% on time basis, proving its higher cetane number. This might be due to the fact
that the RME additive in the Oxy1 fuel has higher specific heat and higher density, which slows the
evaporation of the fuel droplets and thus suppress the increase of the fuel cetane number.
The oxygenate additives have, through the increases of the cetane number, affected ignition delay
period remarkably.
Figure 5. Flame developments.
3.3. Ignition Delay
Ignition delay discussed in this paper is defined as the period from the start of the electroniccommand of injection to the forthcoming valley on the heat release (net) rate curve (dQ/dθ)min, whichwas taken as the start of combustion). The heat release rate curves, which were calculated fromin-cylinder pressure curves, are plotted in Figure 6. The pilot and main injection ignition delays,defined as above, are shown in Figures 7 and 8 respectively. From Figures 7 and 8 it can be seen thatthe Oxy1 fuel had similar pilot ignition delay to the base fuel, before the cylinder temperature buildingup. However, although with the same 3% oxygen content, the Oxy2 shortened the pilot ignition delayby 11% on time basis, proving its higher cetane number. This might be due to the fact that the RMEadditive in the Oxy1 fuel has higher specific heat and higher density, which slows the evaporation ofthe fuel droplets and thus suppress the increase of the fuel cetane number. The oxygenate additiveshave, through the increases of the cetane number, affected ignition delay period remarkably.
Energies 2016, 9, 28 8 of 12Energies 2016, 9, 28
8
Figure 6. In‐cylinder trace and net heat release rates.
Figure 7. Ignition delays to pilot injection.
Figure 8. Ignition delays to main injection.
Compared with the base fuel, the main injection ignition delay under the test conditions was
shortened by 7%, 14% and 41%, on time basis, for the fuels Oxy1, Oxy2 and Oxy3, respectively.
Although Oxy1 and Oxy2 fuels have the same oxygen content, the latter has higher cetane number
owing to its different mixture composition. In other words, the diglyme and butyl‐diglyme additives
Figure 6. In-cylinder trace and net heat release rates.
Energies 2016, 9, 28
8
Figure 6. In‐cylinder trace and net heat release rates.
Figure 7. Ignition delays to pilot injection.
Figure 8. Ignition delays to main injection.
Compared with the base fuel, the main injection ignition delay under the test conditions was
shortened by 7%, 14% and 41%, on time basis, for the fuels Oxy1, Oxy2 and Oxy3, respectively.
Although Oxy1 and Oxy2 fuels have the same oxygen content, the latter has higher cetane number
owing to its different mixture composition. In other words, the diglyme and butyl‐diglyme additives
Figure 7. Ignition delays to pilot injection.
Energies 2016, 9, 28
8
Figure 6. In‐cylinder trace and net heat release rates.
Figure 7. Ignition delays to pilot injection.
Figure 8. Ignition delays to main injection.
Compared with the base fuel, the main injection ignition delay under the test conditions was
shortened by 7%, 14% and 41%, on time basis, for the fuels Oxy1, Oxy2 and Oxy3, respectively.
Although Oxy1 and Oxy2 fuels have the same oxygen content, the latter has higher cetane number
owing to its different mixture composition. In other words, the diglyme and butyl‐diglyme additives
Figure 8. Ignition delays to main injection.
Energies 2016, 9, 28 9 of 12
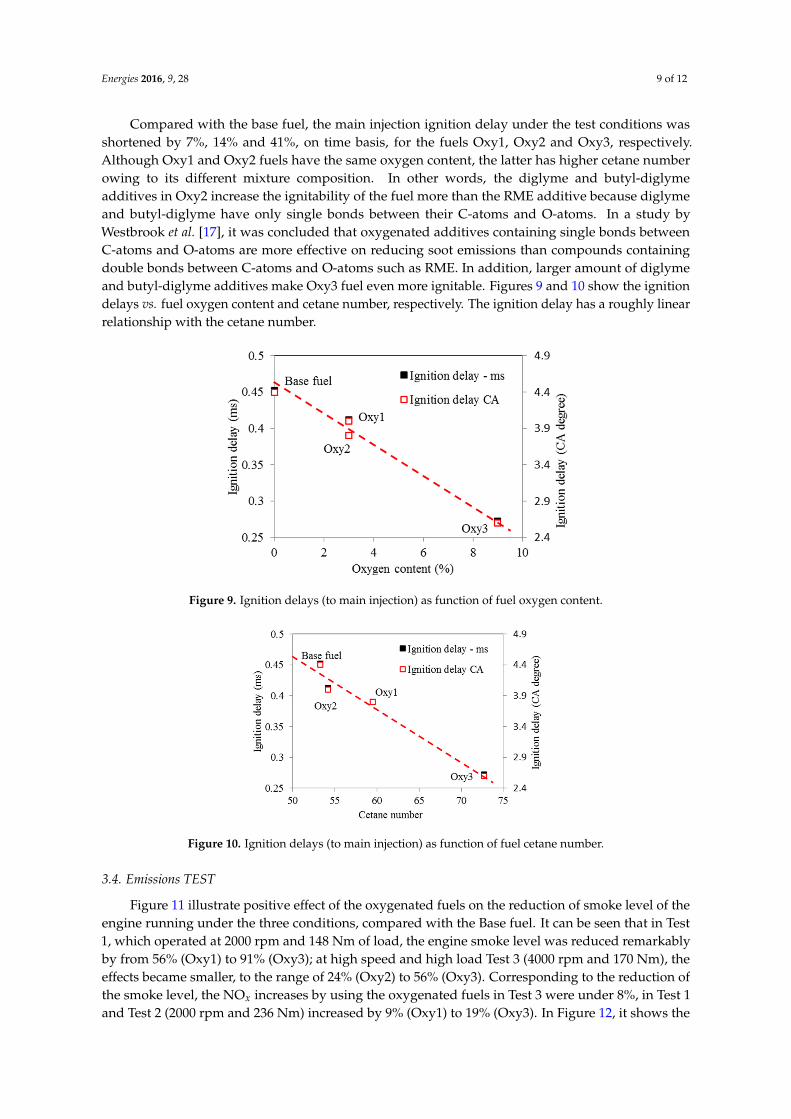
Compared with the base fuel, the main injection ignition delay under the test conditions wasshortened by 7%, 14% and 41%, on time basis, for the fuels Oxy1, Oxy2 and Oxy3, respectively.Although Oxy1 and Oxy2 fuels have the same oxygen content, the latter has higher cetane numberowing to its different mixture composition. In other words, the diglyme and butyl-diglymeadditives in Oxy2 increase the ignitability of the fuel more than the RME additive because diglymeand butyl-diglyme have only single bonds between their C-atoms and O-atoms. In a study byWestbrook et al. [17], it was concluded that oxygenated additives containing single bonds betweenC-atoms and O-atoms are more effective on reducing soot emissions than compounds containingdouble bonds between C-atoms and O-atoms such as RME. In addition, larger amount of diglymeand butyl-diglyme additives make Oxy3 fuel even more ignitable. Figures 9 and 10 show the ignitiondelays vs. fuel oxygen content and cetane number, respectively. The ignition delay has a roughly linearrelationship with the cetane number.
Energies 2016, 9, 28
9
in Oxy2 increase the ignitability of the fuel more than the RME additive because diglyme
and butyl‐diglyme have only single bonds between their C‐atoms and O‐atoms. In a study by
Westbrook et al. [17], it was concluded that oxygenated additives containing single bonds between
C‐atoms and O‐atoms are more effective on reducing soot emissions than compounds containing
double bonds between C‐atoms and O‐atoms such as RME. In addition, larger amount of diglyme
and butyl‐diglyme additives make Oxy3 fuel even more ignitable. Figures 9 and 10 show the ignition
delays vs. fuel oxygen content and cetane number, respectively. The ignition delay has a roughly
linear relationship with the cetane number.
Figure 9. Ignition delays (to main injection) as function of fuel oxygen content.
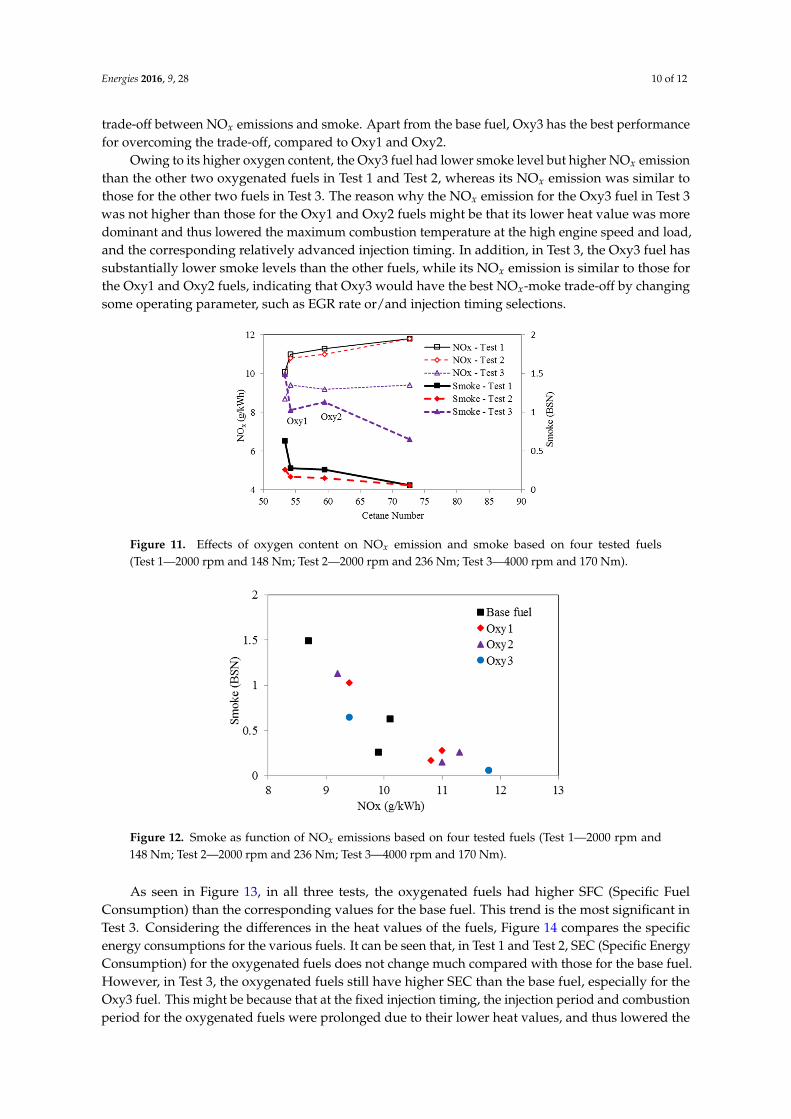
Figure 10. Ignition delays (to main injection) as function of fuel cetane number.
3.4. Emissions TEST
Figure 11 illustrate positive effect of the oxygenated fuels on the reduction of smoke level of the
engine running under the three conditions, compared with the Base fuel. It can be seen that in Test 1,
which operated at 2000 rpm and 148 Nm of load, the engine smoke level was reduced remarkably by
from 56% (Oxy1) to 91% (Oxy3); at high speed and high load Test 3 (4000 rpm and 170 Nm), the
effects became smaller, to the range of 24% (Oxy2) to 56% (Oxy3). Corresponding to the reduction of
the smoke level, the NOx increases by using the oxygenated fuels in Test 3 were under 8%, in Test 1
and Test 2 (2000 rpm and 236 Nm) increased by 9% (Oxy1) to 19% (Oxy3). In Figure 12, it shows the
trade‐off between NOx emissions and smoke. Apart from the base fuel, Oxy3 has the best performance
for overcoming the trade‐off, compared to Oxy1 and Oxy2.
Owing to its higher oxygen content, the Oxy3 fuel had lower smoke level but higher NOx
emission than the other two oxygenated fuels in Test 1 and Test 2, whereas its NOx emission was
similar to those for the other two fuels in Test 3. The reason why the NOx emission for the Oxy3 fuel
Figure 9. Ignition delays (to main injection) as function of fuel oxygen content.
Energies 2016, 9, 28
9
in Oxy2 increase the ignitability of the fuel more than the RME additive because diglyme
and butyl‐diglyme have only single bonds between their C‐atoms and O‐atoms. In a study by
Westbrook et al. [17], it was concluded that oxygenated additives containing single bonds between
C‐atoms and O‐atoms are more effective on reducing soot emissions than compounds containing
double bonds between C‐atoms and O‐atoms such as RME. In addition, larger amount of diglyme
and butyl‐diglyme additives make Oxy3 fuel even more ignitable. Figures 9 and 10 show the ignition
delays vs. fuel oxygen content and cetane number, respectively. The ignition delay has a roughly
linear relationship with the cetane number.
Figure 9. Ignition delays (to main injection) as function of fuel oxygen content.
Figure 10. Ignition delays (to main injection) as function of fuel cetane number.
3.4. Emissions TEST
Figure 11 illustrate positive effect of the oxygenated fuels on the reduction of smoke level of the
engine running under the three conditions, compared with the Base fuel. It can be seen that in Test 1,
which operated at 2000 rpm and 148 Nm of load, the engine smoke level was reduced remarkably by
from 56% (Oxy1) to 91% (Oxy3); at high speed and high load Test 3 (4000 rpm and 170 Nm), the
effects became smaller, to the range of 24% (Oxy2) to 56% (Oxy3). Corresponding to the reduction of
the smoke level, the NOx increases by using the oxygenated fuels in Test 3 were under 8%, in Test 1
and Test 2 (2000 rpm and 236 Nm) increased by 9% (Oxy1) to 19% (Oxy3). In Figure 12, it shows the
trade‐off between NOx emissions and smoke. Apart from the base fuel, Oxy3 has the best performance
for overcoming the trade‐off, compared to Oxy1 and Oxy2.
Owing to its higher oxygen content, the Oxy3 fuel had lower smoke level but higher NOx
emission than the other two oxygenated fuels in Test 1 and Test 2, whereas its NOx emission was
similar to those for the other two fuels in Test 3. The reason why the NOx emission for the Oxy3 fuel
Figure 10. Ignition delays (to main injection) as function of fuel cetane number.
3.4. Emissions TEST
Figure 11 illustrate positive effect of the oxygenated fuels on the reduction of smoke level of theengine running under the three conditions, compared with the Base fuel. It can be seen that in Test1, which operated at 2000 rpm and 148 Nm of load, the engine smoke level was reduced remarkablyby from 56% (Oxy1) to 91% (Oxy3); at high speed and high load Test 3 (4000 rpm and 170 Nm), theeffects became smaller, to the range of 24% (Oxy2) to 56% (Oxy3). Corresponding to the reduction ofthe smoke level, the NOx increases by using the oxygenated fuels in Test 3 were under 8%, in Test 1and Test 2 (2000 rpm and 236 Nm) increased by 9% (Oxy1) to 19% (Oxy3). In Figure 12, it shows the
Energies 2016, 9, 28 10 of 12
trade-off between NOx emissions and smoke. Apart from the base fuel, Oxy3 has the best performancefor overcoming the trade-off, compared to Oxy1 and Oxy2.
Owing to its higher oxygen content, the Oxy3 fuel had lower smoke level but higher NOx emissionthan the other two oxygenated fuels in Test 1 and Test 2, whereas its NOx emission was similar tothose for the other two fuels in Test 3. The reason why the NOx emission for the Oxy3 fuel in Test 3was not higher than those for the Oxy1 and Oxy2 fuels might be that its lower heat value was moredominant and thus lowered the maximum combustion temperature at the high engine speed and load,and the corresponding relatively advanced injection timing. In addition, in Test 3, the Oxy3 fuel hassubstantially lower smoke levels than the other fuels, while its NOx emission is similar to those forthe Oxy1 and Oxy2 fuels, indicating that Oxy3 would have the best NOx-moke trade-off by changingsome operating parameter, such as EGR rate or/and injection timing selections.
Energies 2016, 9, 28
10
in Test 3 was not higher than those for the Oxy1 and Oxy2 fuels might be that its lower heat value
was more dominant and thus lowered the maximum combustion temperature at the high engine
speed and load, and the corresponding relatively advanced injection timing. In addition, in Test 3,
the Oxy3 fuel has substantially lower smoke levels than the other fuels, while its NOx emission is
similar to those for the Oxy1 and Oxy2 fuels, indicating that Oxy3 would have the best NOx‐moke
trade‐off by changing some operating parameter, such as EGR rate or/and injection timing selections.
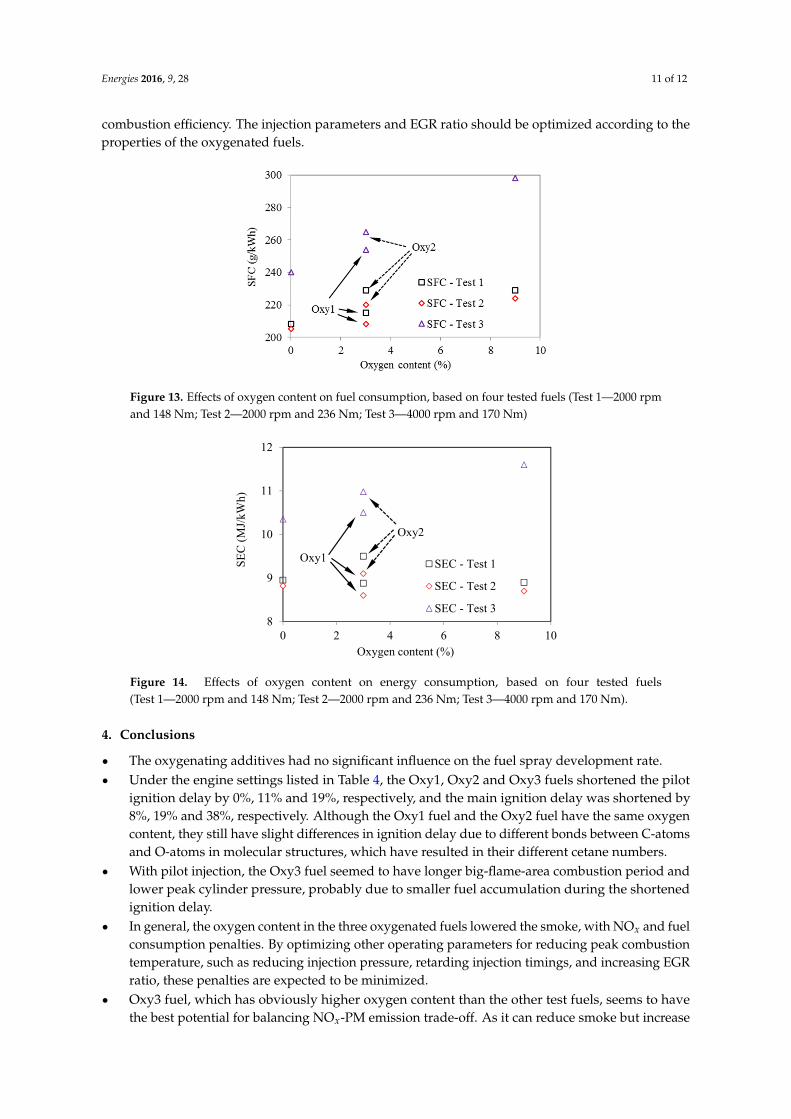
Figure 11. Effects of oxygen content on NOx emission and smoke based on four tested fuels
(Test 1—2000 rpm and 148 Nm; Test 2—2000 rpm and 236 Nm; Test 3—4000 rpm and 170 Nm).
Figure 12. Smoke as function of NOx emissions based on four tested fuels (Test 1—2000 rpm and
148 Nm; Test 2—2000 rpm and 236 Nm; Test 3—4000 rpm and 170 Nm).
As seen in Figure 13, in all three tests, the oxygenated fuels had higher SFC (Specific Fuel
Consumption) than the corresponding values for the base fuel. This trend is the most significant in
Test 3. Considering the differences in the heat values of the fuels, Figure 14 compares the specific
energy consumptions for the various fuels. It can be seen that, in Test 1 and Test 2, SEC (Specific
Energy Consumption) for the oxygenated fuels does not change much compared with those for the
base fuel. However, in Test 3, the oxygenated fuels still have higher SEC than the base fuel, especially
for the Oxy3 fuel. This might be because that at the fixed injection timing, the injection period and
combustion period for the oxygenated fuels were prolonged due to their lower heat values, and thus
lowered the combustion efficiency. The injection parameters and EGR ratio should be optimized
according to the properties of the oxygenated fuels.
Figure 11. Effects of oxygen content on NOx emission and smoke based on four tested fuels(Test 1—2000 rpm and 148 Nm; Test 2—2000 rpm and 236 Nm; Test 3—4000 rpm and 170 Nm).
Energies 2016, 9, 28
10
in Test 3 was not higher than those for the Oxy1 and Oxy2 fuels might be that its lower heat value
was more dominant and thus lowered the maximum combustion temperature at the high engine
speed and load, and the corresponding relatively advanced injection timing. In addition, in Test 3,
the Oxy3 fuel has substantially lower smoke levels than the other fuels, while its NOx emission is
similar to those for the Oxy1 and Oxy2 fuels, indicating that Oxy3 would have the best NOx‐moke
trade‐off by changing some operating parameter, such as EGR rate or/and injection timing selections.
Figure 11. Effects of oxygen content on NOx emission and smoke based on four tested fuels
(Test 1—2000 rpm and 148 Nm; Test 2—2000 rpm and 236 Nm; Test 3—4000 rpm and 170 Nm).
Figure 12. Smoke as function of NOx emissions based on four tested fuels (Test 1—2000 rpm and
148 Nm; Test 2—2000 rpm and 236 Nm; Test 3—4000 rpm and 170 Nm).
As seen in Figure 13, in all three tests, the oxygenated fuels had higher SFC (Specific Fuel
Consumption) than the corresponding values for the base fuel. This trend is the most significant in
Test 3. Considering the differences in the heat values of the fuels, Figure 14 compares the specific
energy consumptions for the various fuels. It can be seen that, in Test 1 and Test 2, SEC (Specific
Energy Consumption) for the oxygenated fuels does not change much compared with those for the
base fuel. However, in Test 3, the oxygenated fuels still have higher SEC than the base fuel, especially
for the Oxy3 fuel. This might be because that at the fixed injection timing, the injection period and
combustion period for the oxygenated fuels were prolonged due to their lower heat values, and thus
lowered the combustion efficiency. The injection parameters and EGR ratio should be optimized
according to the properties of the oxygenated fuels.
Figure 12. Smoke as function of NOx emissions based on four tested fuels (Test 1—2000 rpm and148 Nm; Test 2—2000 rpm and 236 Nm; Test 3—4000 rpm and 170 Nm).
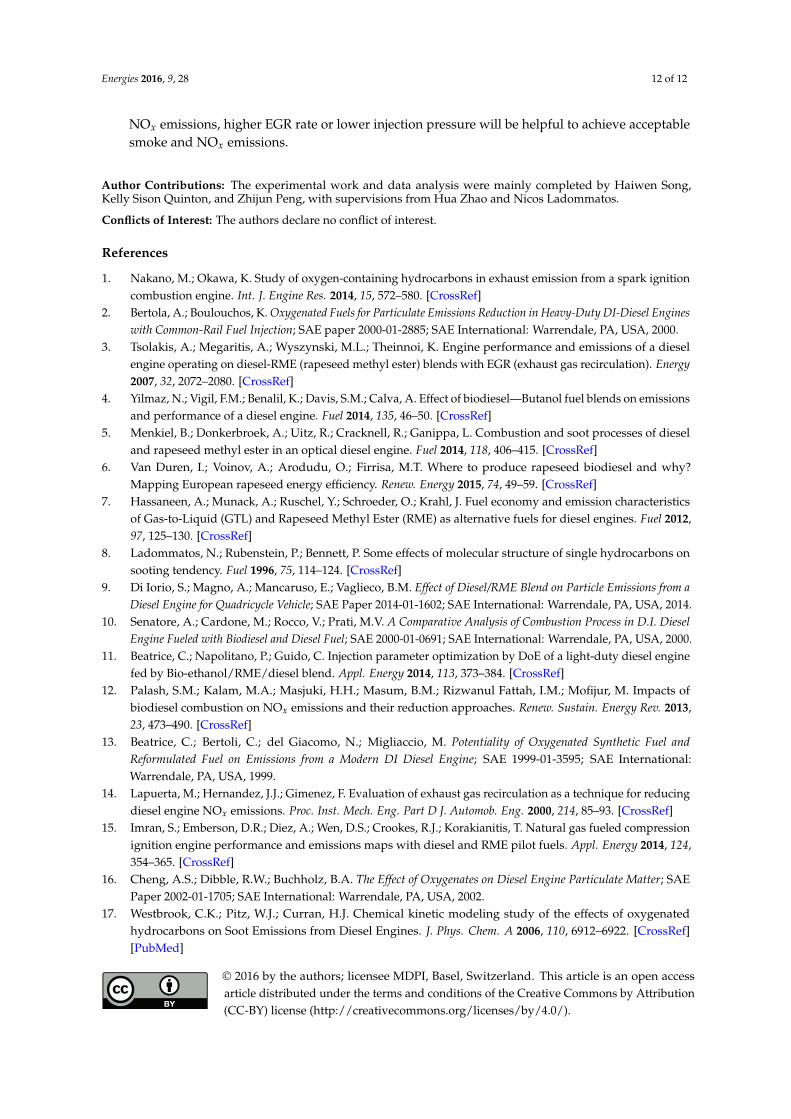
As seen in Figure 13, in all three tests, the oxygenated fuels had higher SFC (Specific FuelConsumption) than the corresponding values for the base fuel. This trend is the most significant inTest 3. Considering the differences in the heat values of the fuels, Figure 14 compares the specificenergy consumptions for the various fuels. It can be seen that, in Test 1 and Test 2, SEC (Specific EnergyConsumption) for the oxygenated fuels does not change much compared with those for the base fuel.However, in Test 3, the oxygenated fuels still have higher SEC than the base fuel, especially for theOxy3 fuel. This might be because that at the fixed injection timing, the injection period and combustionperiod for the oxygenated fuels were prolonged due to their lower heat values, and thus lowered the
Energies 2016, 9, 28 11 of 12
combustion efficiency. The injection parameters and EGR ratio should be optimized according to theproperties of the oxygenated fuels.Energies 2016, 9, 28
11
Figure 13. Effects of oxygen content on fuel consumption, based on four tested fuels (Test 1—2000 rpm
and 148 Nm; Test 2—2000 rpm and 236 Nm; Test 3—4000 rpm and 170 Nm)
Figure 14. Effects of oxygen content on energy consumption, based on four tested fuels (Test 1—2000 rpm
and 148 Nm; Test 2—2000 rpm and 236 Nm; Test 3—4000 rpm and 170 Nm).
4. Conclusions
The oxygenating additives had no significant influence on the fuel spray development rate.
Under the engine settings listed in Table 4, the Oxy1, Oxy2 and Oxy3 fuels shortened the pilot
ignition delay by 0%, 11% and 19%, respectively, and the main ignition delay was shortened by
8%, 19% and 38%, respectively. Although the Oxy1 fuel and the Oxy2 fuel have the same oxygen
content, they still have slight differences in ignition delay due to different bonds between C‐atoms
and O‐atoms in molecular structures, which have resulted in their different cetane numbers.
With pilot injection, the Oxy3 fuel seemed to have longer big‐flame‐area combustion period and
lower peak cylinder pressure, probably due to smaller fuel accumulation during the shortened
ignition delay.
In general, the oxygen content in the three oxygenated fuels lowered the smoke, with NOx and
fuel consumption penalties. By optimizing other operating parameters for reducing peak
combustion temperature, such as reducing injection pressure, retarding injection timings, and
increasing EGR ratio, these penalties are expected to be minimized.
Oxy3 fuel, which has obviously higher oxygen content than the other test fuels, seems to have
the best potential for balancing NOx‐PM emission trade‐off. As it can reduce smoke but increase
NOx emissions, higher EGR rate or lower injection pressure will be helpful to achieve acceptable
smoke and NOx emissions.
8
9
10
11
12
0 2 4 6 8 10
SEC - Test 1
SEC - Test 2
SEC - Test 3
SE
C (
MJ/
kWh)
Oxygen content (%)
Oxy2
Oxy1
Figure 13. Effects of oxygen content on fuel consumption, based on four tested fuels (Test 1—2000 rpmand 148 Nm; Test 2—2000 rpm and 236 Nm; Test 3—4000 rpm and 170 Nm)
Energies 2016, 9, 28
11
Figure 13. Effects of oxygen content on fuel consumption, based on four tested fuels (Test 1—2000 rpm
and 148 Nm; Test 2—2000 rpm and 236 Nm; Test 3—4000 rpm and 170 Nm)
Figure 14. Effects of oxygen content on energy consumption, based on four tested fuels (Test 1—2000 rpm
and 148 Nm; Test 2—2000 rpm and 236 Nm; Test 3—4000 rpm and 170 Nm).
4. Conclusions
The oxygenating additives had no significant influence on the fuel spray development rate.
Under the engine settings listed in Table 4, the Oxy1, Oxy2 and Oxy3 fuels shortened the pilot
ignition delay by 0%, 11% and 19%, respectively, and the main ignition delay was shortened by
8%, 19% and 38%, respectively. Although the Oxy1 fuel and the Oxy2 fuel have the same oxygen
content, they still have slight differences in ignition delay due to different bonds between C‐atoms
and O‐atoms in molecular structures, which have resulted in their different cetane numbers.
With pilot injection, the Oxy3 fuel seemed to have longer big‐flame‐area combustion period and
lower peak cylinder pressure, probably due to smaller fuel accumulation during the shortened
ignition delay.
In general, the oxygen content in the three oxygenated fuels lowered the smoke, with NOx and
fuel consumption penalties. By optimizing other operating parameters for reducing peak
combustion temperature, such as reducing injection pressure, retarding injection timings, and
increasing EGR ratio, these penalties are expected to be minimized.
Oxy3 fuel, which has obviously higher oxygen content than the other test fuels, seems to have
the best potential for balancing NOx‐PM emission trade‐off. As it can reduce smoke but increase
NOx emissions, higher EGR rate or lower injection pressure will be helpful to achieve acceptable
smoke and NOx emissions.
8
9
10
11
12
0 2 4 6 8 10
SEC - Test 1
SEC - Test 2
SEC - Test 3
SE
C (
MJ/
kWh)
Oxygen content (%)
Oxy2
Oxy1
Figure 14. Effects of oxygen content on energy consumption, based on four tested fuels(Test 1—2000 rpm and 148 Nm; Test 2—2000 rpm and 236 Nm; Test 3—4000 rpm and 170 Nm).
4. Conclusions
‚ The oxygenating additives had no significant influence on the fuel spray development rate.‚ Under the engine settings listed in Table 4, the Oxy1, Oxy2 and Oxy3 fuels shortened the pilot
ignition delay by 0%, 11% and 19%, respectively, and the main ignition delay was shortened by8%, 19% and 38%, respectively. Although the Oxy1 fuel and the Oxy2 fuel have the same oxygencontent, they still have slight differences in ignition delay due to different bonds between C-atomsand O-atoms in molecular structures, which have resulted in their different cetane numbers.
‚ With pilot injection, the Oxy3 fuel seemed to have longer big-flame-area combustion period andlower peak cylinder pressure, probably due to smaller fuel accumulation during the shortenedignition delay.
‚ In general, the oxygen content in the three oxygenated fuels lowered the smoke, with NOx and fuelconsumption penalties. By optimizing other operating parameters for reducing peak combustiontemperature, such as reducing injection pressure, retarding injection timings, and increasing EGRratio, these penalties are expected to be minimized.
‚ Oxy3 fuel, which has obviously higher oxygen content than the other test fuels, seems to havethe best potential for balancing NOx-PM emission trade-off. As it can reduce smoke but increase
Energies 2016, 9, 28 12 of 12
NOx emissions, higher EGR rate or lower injection pressure will be helpful to achieve acceptablesmoke and NOx emissions.
Author Contributions: The experimental work and data analysis were mainly completed by Haiwen Song,Kelly Sison Quinton, and Zhijun Peng, with supervisions from Hua Zhao and Nicos Ladommatos.
Conflicts of Interest: The authors declare no conflict of interest.
References
1. Nakano, M.; Okawa, K. Study of oxygen-containing hydrocarbons in exhaust emission from a spark ignitioncombustion engine. Int. J. Engine Res. 2014, 15, 572–580. [CrossRef]
2. Bertola, A.; Boulouchos, K. Oxygenated Fuels for Particulate Emissions Reduction in Heavy-Duty DI-Diesel Engineswith Common-Rail Fuel Injection; SAE paper 2000-01-2885; SAE International: Warrendale, PA, USA, 2000.
3. Tsolakis, A.; Megaritis, A.; Wyszynski, M.L.; Theinnoi, K. Engine performance and emissions of a dieselengine operating on diesel-RME (rapeseed methyl ester) blends with EGR (exhaust gas recirculation). Energy2007, 32, 2072–2080. [CrossRef]
4. Yilmaz, N.; Vigil, F.M.; Benalil, K.; Davis, S.M.; Calva, A. Effect of biodiesel—Butanol fuel blends on emissionsand performance of a diesel engine. Fuel 2014, 135, 46–50. [CrossRef]
5. Menkiel, B.; Donkerbroek, A.; Uitz, R.; Cracknell, R.; Ganippa, L. Combustion and soot processes of dieseland rapeseed methyl ester in an optical diesel engine. Fuel 2014, 118, 406–415. [CrossRef]
6. Van Duren, I.; Voinov, A.; Arodudu, O.; Firrisa, M.T. Where to produce rapeseed biodiesel and why?Mapping European rapeseed energy efficiency. Renew. Energy 2015, 74, 49–59. [CrossRef]
7. Hassaneen, A.; Munack, A.; Ruschel, Y.; Schroeder, O.; Krahl, J. Fuel economy and emission characteristicsof Gas-to-Liquid (GTL) and Rapeseed Methyl Ester (RME) as alternative fuels for diesel engines. Fuel 2012,97, 125–130. [CrossRef]
8. Ladommatos, N.; Rubenstein, P.; Bennett, P. Some effects of molecular structure of single hydrocarbons onsooting tendency. Fuel 1996, 75, 114–124. [CrossRef]
9. Di Iorio, S.; Magno, A.; Mancaruso, E.; Vaglieco, B.M. Effect of Diesel/RME Blend on Particle Emissions from aDiesel Engine for Quadricycle Vehicle; SAE Paper 2014-01-1602; SAE International: Warrendale, PA, USA, 2014.
10. Senatore, A.; Cardone, M.; Rocco, V.; Prati, M.V. A Comparative Analysis of Combustion Process in D.I. DieselEngine Fueled with Biodiesel and Diesel Fuel; SAE 2000-01-0691; SAE International: Warrendale, PA, USA, 2000.
11. Beatrice, C.; Napolitano, P.; Guido, C. Injection parameter optimization by DoE of a light-duty diesel enginefed by Bio-ethanol/RME/diesel blend. Appl. Energy 2014, 113, 373–384. [CrossRef]
12. Palash, S.M.; Kalam, M.A.; Masjuki, H.H.; Masum, B.M.; Rizwanul Fattah, I.M.; Mofijur, M. Impacts ofbiodiesel combustion on NOx emissions and their reduction approaches. Renew. Sustain. Energy Rev. 2013,23, 473–490. [CrossRef]
13. Beatrice, C.; Bertoli, C.; del Giacomo, N.; Migliaccio, M. Potentiality of Oxygenated Synthetic Fuel andReformulated Fuel on Emissions from a Modern DI Diesel Engine; SAE 1999-01-3595; SAE International:Warrendale, PA, USA, 1999.
14. Lapuerta, M.; Hernandez, J.J.; Gimenez, F. Evaluation of exhaust gas recirculation as a technique for reducingdiesel engine NOx emissions. Proc. Inst. Mech. Eng. Part D J. Automob. Eng. 2000, 214, 85–93. [CrossRef]
15. Imran, S.; Emberson, D.R.; Diez, A.; Wen, D.S.; Crookes, R.J.; Korakianitis, T. Natural gas fueled compressionignition engine performance and emissions maps with diesel and RME pilot fuels. Appl. Energy 2014, 124,354–365. [CrossRef]
16. Cheng, A.S.; Dibble, R.W.; Buchholz, B.A. The Effect of Oxygenates on Diesel Engine Particulate Matter; SAEPaper 2002-01-1705; SAE International: Warrendale, PA, USA, 2002.
17. Westbrook, C.K.; Pitz, W.J.; Curran, H.J. Chemical kinetic modeling study of the effects of oxygenatedhydrocarbons on Soot Emissions from Diesel Engines. J. Phys. Chem. A 2006, 110, 6912–6922. [CrossRef][PubMed]
© 2016 by the authors; licensee MDPI, Basel, Switzerland. This article is an open accessarticle distributed under the terms and conditions of the Creative Commons by Attribution(CC-BY) license (http://creativecommons.org/licenses/by/4.0/).
Copyright © 2022 FDOKUMEN