Contrast-enhanced magneto-photo-acoustic imaging in vivo using dual-contrast nanoparticles
Upload
independentCategory
view
2download
0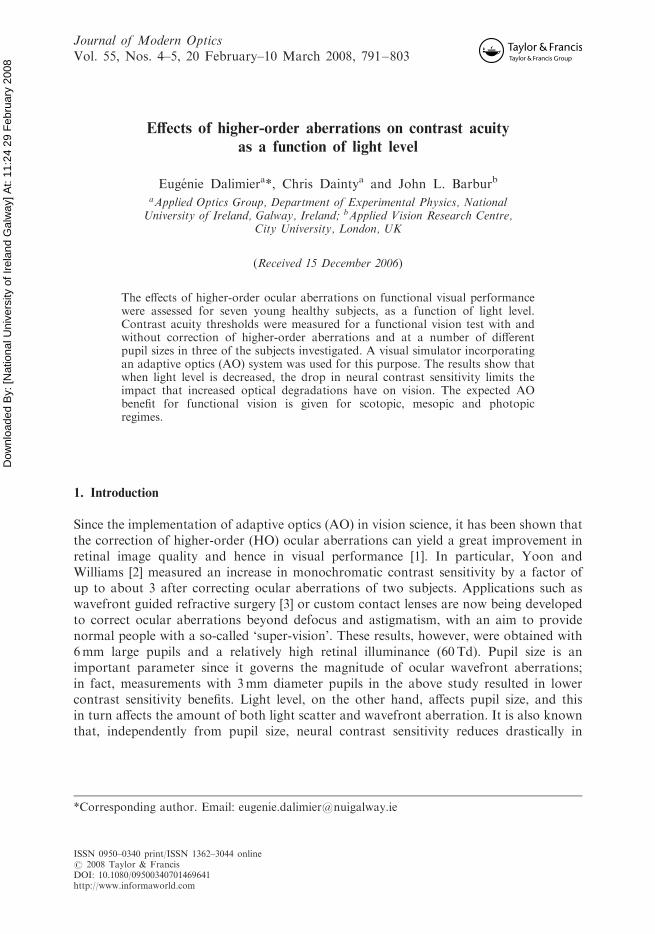
Dow
nloa
ded
By:
[Nat
iona
l Uni
vers
ity o
f Ire
land
Gal
way
] At:
11:2
4 29
Feb
ruar
y 20
08
Effects of higher-order aberrations on contrast acuity
as a function of light level
Eugenie Dalimiera*, Chris Daintya and John L. Barburb
aApplied Optics Group, Department of Experimental Physics, NationalUniversity of Ireland, Galway, Ireland; bApplied Vision Research Centre,
City University, London, UK
(Received 15 December 2006)
The effects of higher-order ocular aberrations on functional visual performancewere assessed for seven young healthy subjects, as a function of light level.Contrast acuity thresholds were measured for a functional vision test with andwithout correction of higher-order aberrations and at a number of differentpupil sizes in three of the subjects investigated. A visual simulator incorporatingan adaptive optics (AO) system was used for this purpose. The results show thatwhen light level is decreased, the drop in neural contrast sensitivity limits theimpact that increased optical degradations have on vision. The expected AObenefit for functional vision is given for scotopic, mesopic and photopicregimes.
1. Introduction
Since the implementation of adaptive optics (AO) in vision science, it has been shown thatthe correction of higher-order (HO) ocular aberrations can yield a great improvement inretinal image quality and hence in visual performance [1]. In particular, Yoon andWilliams [2] measured an increase in monochromatic contrast sensitivity by a factor ofup to about 3 after correcting ocular aberrations of two subjects. Applications such aswavefront guided refractive surgery [3] or custom contact lenses are now being developedto correct ocular aberrations beyond defocus and astigmatism, with an aim to providenormal people with a so-called ‘super-vision’. These results, however, were obtained with6mm large pupils and a relatively high retinal illuminance (60Td). Pupil size is animportant parameter since it governs the magnitude of ocular wavefront aberrations;in fact, measurements with 3mm diameter pupils in the above study resulted in lowercontrast sensitivity benefits. Light level, on the other hand, affects pupil size, and thisin turn affects the amount of both light scatter and wavefront aberration. It is also knownthat, independently from pupil size, neural contrast sensitivity reduces drastically in
*Corresponding author. Email: [email protected]
Journal of Modern OpticsVol. 55, Nos. 4–5, 20 February–10 March 2008, 791–803
ISSN 0950–0340 print/ISSN 1362–3044 online# 2008 Taylor & FrancisDOI: 10.1080/09500340701469641http://www.informaworld.com
Dow
nloa
ded
By:
[Nat
iona
l Uni
vers
ity o
f Ire
land
Gal
way
] At:
11:2
4 29
Feb
ruar
y 20
08
amplitude and bandwidth when retinal illuminance is decreased [4–7]. It is therefore ofinterest to investigate the effect of higher-order aberrations on visual performance inphotopic, mesopic and scotopic light ranges and to relate this to the natural pupil sizeexpected at the corresponding light level.
The purpose of this study was to compare visual performance with and withoutcorrection of higher-order aberrations at different light levels and to use these findings toestimate the visual benefit that could be gained under normal viewing conditions.Measurements were performed with a vision simulator which included an adaptive opticssystem for the correction of ocular aberrations. Seven young healthy subjects were tested;the results are given here and discussed.
2. Methods
2.1 Functional vision test
Visual performance is often assessed by measuring either contrast sensitivity or highcontrast visual acuity. Measurement of contrast acuity thresholds for the smallest objectdetail that can be considered to be functionally relevant in a typical visual task is, however,a more effective way of assessing functional visual performance [8]. This test usuallyinvolves the measurement of the smallest stimulus contrast needed to resolve spatial detailof 30, normally the gap in a Landolt ring stimulus (see Figure 1). Due to its similarity toalphanumeric characters, this stimulus makes an easy target and can provide repeatablecontrast threshold measurements, especially for inexperienced observers. The size waschosen such that the corresponding frequency spectrum is typically within the bandwidthused for functional visual tasks in everyday life. The stimulus was generated in greenlight either with a digital light-processing projector (Mistubishi DLP) or with a CRTmonitor (Sony Trinitron) controlled by a Visual Stimulus Generator from Cambridge
15'
3'
Figure 1. Stimulus used for the contrast acuity assessment.
792 E. Dalimier et al.
Dow
nloa
ded
By:
[Nat
iona
l Uni
vers
ity o
f Ire
land
Gal
way
] At:
11:2
4 29
Feb
ruar
y 20
08
Research Ltd. The projector’s green light had a spectrum that can be approximated toa Gaussian of peak wavelength 550 nm and full width at half maximum 43 nm, while thegreen phosphor of the monitor had a peak emission at 533 nm and a full width at halfmaximum of 75 nm. The resolution of both displays was such that the gap extended overabout 10� 10 pixels.
Two stimulus contrast configurations were used in this study: negative contrast asillustrated by Figure 1, where the target is darker than the background (luminancedecrements), and positive contrast, where the target is brighter than the background(luminance increments). The contrast in both situations was defined as
c ¼�L
Lb, ð1Þ
where Lb is the background luminance and �L is the difference between stimulusluminance and background luminance. This is known as the Weber contrast. For theluminance decrements configuration, contrast ranged from 0 to 100% (assuming negligibleexternal illumination and diffusion of light in the display), while for the luminanceincrements configuration, the background was set to 10% of the maximum luminanceavailable, enabling a maximum of 900% contrast. The stimulus was presented witha 100ms standard deviation Gaussian temporal envelope, and was preceded by theshort flickering of a dot in the centre of the field. The background field subtended 4:5�
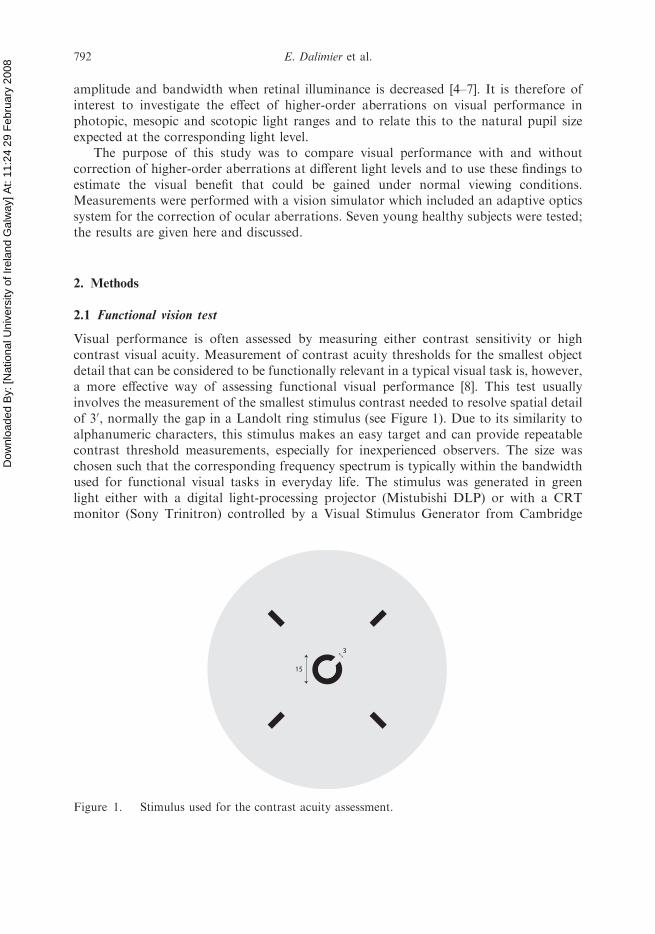
of visual angle (note that the field of view in Figure 1 is intended only for illustrationpurposes and has not been drawn to scale) and the guiding diagonal bars werecontinuously present. A preliminary experiment was performed with one of the authorsas a subject to validate the assumption that the small size of the field of view would notaffect the measured contrast acuity thresholds. As can be seen from Figure 2, contrastthresholds are approximately independent of the size of the uniform background field.
A four-alternative, forced-choice discrimination task was designed: subjects had tochoose between four positions of the gap as indicated by the guide bars on Figure 1.Contrast threshold was measured using an adaptive psychophysical method, the QUESTprocedure [9]. In this procedure, each trial is optimised according to the current most
0
15
30
45
60
75
0.50 1.00 1.50 2.00 2.50 3.00
Log FOV (sq deg)
Con
tras
t thr
esho
ld (
%)
150 Td15Td
Figure 2. Effect of background field size on contrast threshold, at two different light levels.
Journal of Modern Optics 793
Dow
nloa
ded
By:
[Nat
iona
l Uni
vers
ity o
f Ire
land
Gal
way
] At:
11:2
4 29
Feb
ruar
y 20
08
probable Bayesian estimate, such that the test is fast, simple and efficient. The number oftrials was set to 30.
2.2 Adaptive optics correction of higher-order aberrations
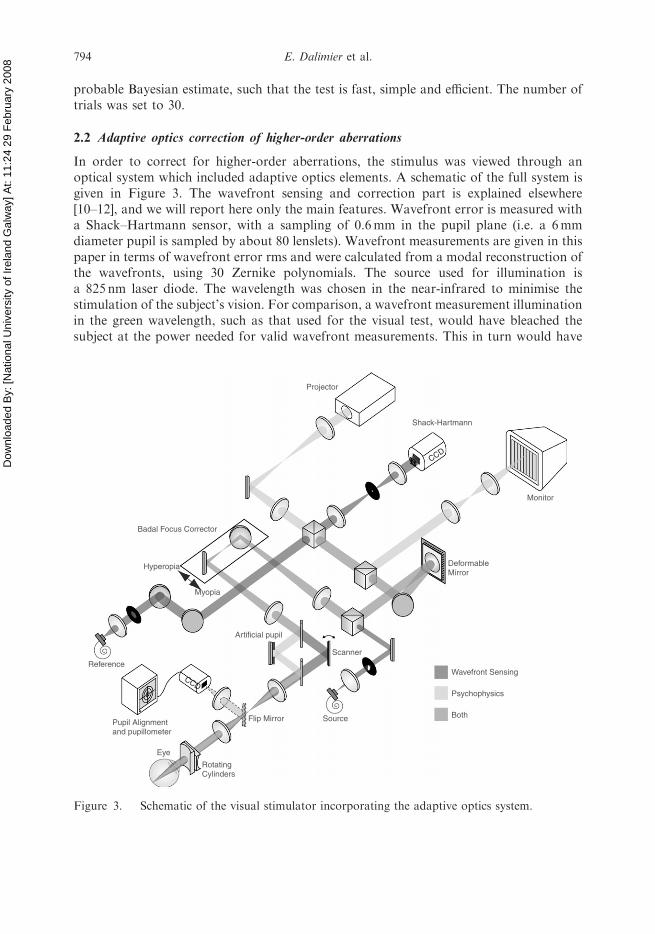
In order to correct for higher-order aberrations, the stimulus was viewed through anoptical system which included adaptive optics elements. A schematic of the full system isgiven in Figure 3. The wavefront sensing and correction part is explained elsewhere[10–12], and we will report here only the main features. Wavefront error is measured witha Shack–Hartmann sensor, with a sampling of 0.6mm in the pupil plane (i.e. a 6mmdiameter pupil is sampled by about 80 lenslets). Wavefront measurements are given in thispaper in terms of wavefront error rms and were calculated from a modal reconstruction ofthe wavefronts, using 30 Zernike polynomials. The source used for illumination isa 825 nm laser diode. The wavelength was chosen in the near-infrared to minimise thestimulation of the subject’s vision. For comparison, a wavefront measurement illuminationin the green wavelength, such as that used for the visual test, would have bleached thesubject at the power needed for valid wavefront measurements. This in turn would have
Source
Reference
Shack-Hartmann
Pupil Alignmentand pupillometer
CCD
CCD
Monitor
Wavefront Sensing
Psychophysics
Both
Badal Focus Corrector
Hyperopia
Rotating Cylinders
Scanner
DeformableMirror
Myopia
Eye
Flip Mirror
Projector
Artificial pupil
Figure 3. Schematic of the visual stimulator incorporating the adaptive optics system.
794 E. Dalimier et al.
Dow
nloa
ded
By:
[Nat
iona
l Uni
vers
ity o
f Ire
land
Gal
way
] At:
11:2
4 29
Feb
ruar
y 20
08
affected the visual test results. Llorente et al. showed that higher-order aberrationsmeasured at 543 and 787 nm are equivalent within the experimental error [13], andFernandez et al. obtained similar results while investigating wavelengths from 700 to900 nm [14]. Thus, it can be inferred that our measurements at 825 nm provide validestimates of the higher-order aberrations in green light. To account for thechromatic focus shift, the system was carefully calibrated so that a zero defocus term onthe Shack–Hartmann for the 825 nm source corresponded to a perfectly collimated greenstimulus as seen by the subject (the adjustment was performed for an experienced subjectafter all his aberrations had been corrected). A pre-correction of sphero-cylindricalrefractive errors can be statically achieved by the Badal corrector and thecylindrical lenses [10], while higher-order aberrations are dynamically compensated bythe deformable mirror. The latest version of the system, used in the present study,incorporates a 35 element bimorph deformable mirror from AOptix Inc. This elementprovides a full stroke of about 16 mm; it has been fully characterised and assessed forthe correction of typical ocular aberrations [15]. It enables correction of higher-orderaberrations (including the remaining defocus and astigmatism) down to a level of 0.1mmrms wavefront error or less, at a frame rate of 10Hz. More details about the level ofcorrection achieved are given in Section 2.4. The visual stimulus path can be seen inFigure 3, coming either from the projector or the monitor. Other elementsinclude a reference arm to calibrate the Shack–Hartmann, and a pupil imaging arm forprecise alignment.
2.3 Light levels
Carefully calibrated neutral density filters were used with the two displays to achieve theappropriate light levels. The dilation of the subject’s pupil enabled measurement andcorrection of ocular aberrations over a full 6mm diameter pupil, while an artificial pupil inthe visible path was conjugated to the pupil of the eye (see Figure 3) and could be set tolimit the effective size of the visible beam entering the eye. This arrangement made itpossible to set and calculate accurately the retinal illuminance Er, i.e.
Er ¼ L� Apupil, ð2Þ
where L is the pupil plane luminance (measured in cdm�2) and Apupil is the effective pupilarea (in mm2). Luminance in the pupil plane was estimated from measurements madewith a photopic illuminance meter (LMT) calibrated to the photopic spectral sensitivityof the eye.
The Stiles–Crawford effect of the first kind was taken into account in the calculationsof the retinal illuminance. As cones are less sensitive to the peripheral rays entering thepupil than to the central rays [16], the integration of the luminance over the pupil area isweighted by an efficiency curve to give the effective retinal illuminance
Er, eff ¼
ð2p0
ðR0
r� L� fðrÞdr d� ð3Þ
with R the radius of the pupil. We used a parametric representation of theluminous efficiency, fðrÞ ¼ 10�0:05r
2
, derived from values given by Applegate and
Journal of Modern Optics 795
Dow
nloa
ded
By:
[Nat
iona
l Uni
vers
ity o
f Ire
land
Gal
way
] At:
11:2
4 29
Feb
ruar
y 20
08
Lakshminarayanan [17]. This weighting was not done below 10Td, since theStiles–Crawford effect essentially arises when cones function normally.
The projector was used for the highest light levels and the monitor was used for thelowest light levels, to avoid stacking too many neutral density filters.
2.4 Experimental procedure
Seven subjects participated in the experiment, aged 22� 3 years old. They had no morethan 1D refractive prescription, and no history of ocular disease. They provided informedconsent after the protocol and possible consequences had been explained to them. Theresearch was approved by the National University of Ireland, Galway, Ethics Committeeand followed the tenets of the Declaration of Helsinki. All the information was coded andstrictly confidential. Measurements were performed on the right eye, after a pupil dilationwith a drop of 1% tropicamide. A dental registration was made and mounted in front ofthe system for precise positioning and a good head stabilisation.
Before starting the measurements, the sphero-cylindrical errors were corrected in thesystem using the features described above. Astigmatism was corrected within 0.1D, asmeasured by the Shack–Hartmann, while defocus was adjusted by the subject for beststimulus contrast, with the same precision. In the presence of other aberrations, non-zerodefocus can often provide improved image quality [2]. Wavefront aberrations in theinfrared path were also corrected, such that the wavefront aberrations seen by the subjectinitially comprised only their own higher-order aberrations and the non-common patherrors. These consisted of the wavefront aberrations resulting from the neutral densityfilters, as well as other elements of the non-common path. These additional aberrationswere characterised carefully and did not exceed 40 nm wavefront error rms over the beam,as defined by a pupil of 6mm diameter.
Two different experimental procedures were used in this paper. The first series ofexperiments were performed using pseudo-dynamic correction. The near infrared wave-front sensing light was visible to the subject and this ruled out the use of the AO systemsimultaneously with the visual test. The wavefront aberration correction was thereforeonly applied in between each trial within a run: the laser was turned on and the mirrordynamically readjusted for 1.5 s to correct for aberrations, the laser was then turned offand the mirror remained frozen for the stimulus to appear. Constant monitoring of theAO correction was maintained to ensure that stability of the correction was reachedfollowing each refresh. When no correction was applied, except that of the aberrations ofthe system, the laser was still turned on and off to simulate the same conditions. Contrastthreshold measurements (using decrements in luminance) were performed with thispseudo-dynamic correction and this set of conditions employed will be described in thispaper as procedure A. The procedure was later modified, and a static correction wasapplied instead. This made it possible to investigate lower light levels without intermit-tently exposing the retina to the infrared light of the AO laser diode beam. The wavefrontaberrations were measured after each test was completed to ensure that the subject had notmoved significantly. When the wavefront error rms measured at the end of the runwas higher than 0.2mm, the measurement was deleted. A comparison was alsoperformed between measurements with a static AO correction and measurements witha pseudo-dynamic correction for one subject at the highest light level. The results showed
796 E. Dalimier et al.
Dow
nloa
ded
By:
[Nat
iona
l Uni
vers
ity o
f Ire
land
Gal
way
] At:
11:2
4 29
Feb
ruar
y 20
08
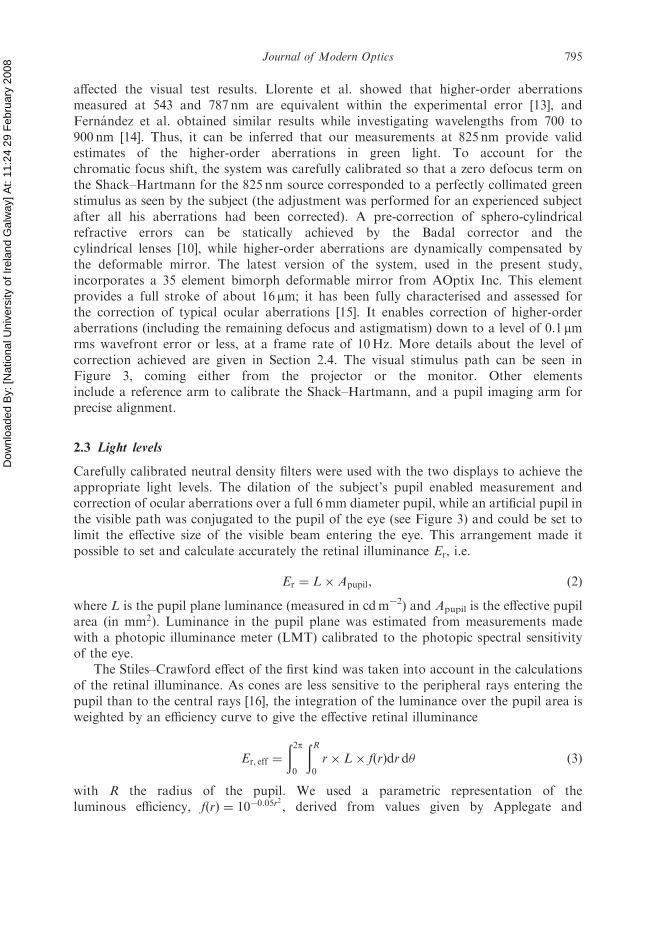
no significant difference. In view of these findings, the static correction was considered tobe acceptable in our experiments, although Figure 4 shows that it was not as good as thedynamic correction. The figure gives the AO dynamic corrections achieved for the sevensubjects, over a 6mm pupil, and the dynamic corrections can be compared to theaverage static corrections for the three subjects who participated in the second series ofexperiments. The second series of measurements was furthermore performed witha modified stimulus, which involved increments of luminance, instead of decrements,to allow for high contrast levels (see Section 2.1). This second set of conditions will bedescribed in the following sections as procedure B.
Contrast threshold measurements were repeated five times for each set of parameters(light level, pupil size, correction/no correction of higher-order aberrations). The full set ofmeasurements for one particular pupil diameter was split over several sessions to avoidfatigue effects. Each session lasted for just over one hour, and this included the time foralignment, refractive pre-correction, testing of the AO system and breaks in betweeneach measurement. Three or four sessions were needed to complete the measurements.The conditions were randomised whenever possible and the measurements with andwithout AO correction were carried out in pairs so as to keep the ratio of the two asa repeated measure.
3. Results
3.1 Influence of light level on AO benefit for a fixed, 6mm pupil
Measurements of visual performance with the pseudo-dynamic correction, as describedabove, were performed with a 6mm artificial pupil and for retinal illuminance values
0
0.1
0.2
0.3
0.4
0.5
0.6
1 2 3 4 5 6 7
Subject
Wav
efro
nt e
rror
rm
s (m
icro
n)Initial aberrations
Aberrations with dynamic correction
Aberrations with static correction
Figure 4. Adaptive optics correction achieved on the ocular aberrations of the subjects.
Journal of Modern Optics 797
Dow
nloa
ded
By:
[Nat
iona
l Uni
vers
ity o
f Ire
land
Gal
way
] At:
11:2
4 29
Feb
ruar
y 20
08
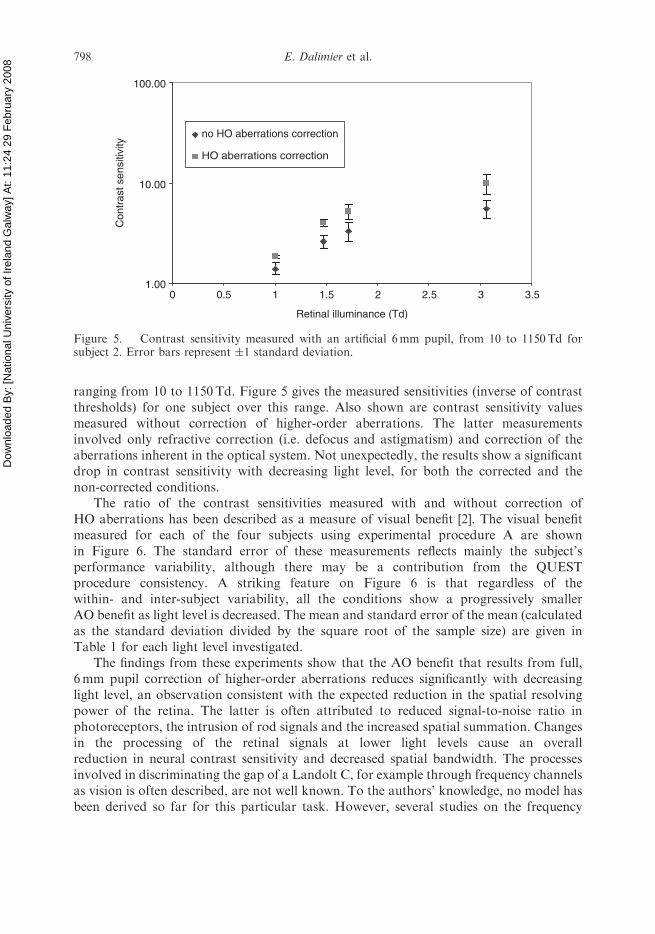
ranging from 10 to 1150Td. Figure 5 gives the measured sensitivities (inverse of contrastthresholds) for one subject over this range. Also shown are contrast sensitivity valuesmeasured without correction of higher-order aberrations. The latter measurementsinvolved only refractive correction (i.e. defocus and astigmatism) and correction of theaberrations inherent in the optical system. Not unexpectedly, the results show a significantdrop in contrast sensitivity with decreasing light level, for both the corrected and thenon-corrected conditions.
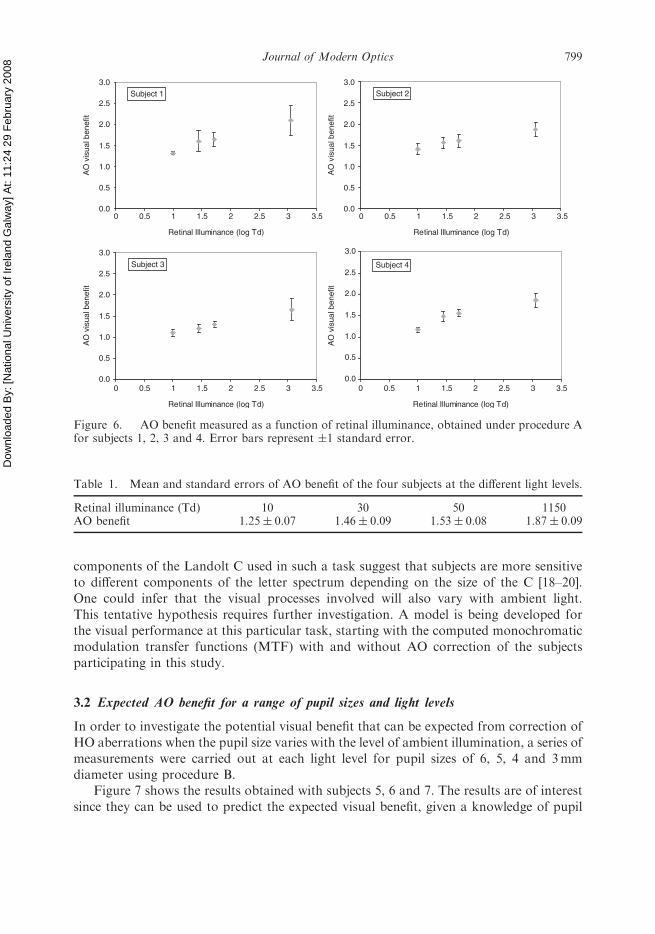
The ratio of the contrast sensitivities measured with and without correction ofHO aberrations has been described as a measure of visual benefit [2]. The visual benefitmeasured for each of the four subjects using experimental procedure A are shownin Figure 6. The standard error of these measurements reflects mainly the subject’sperformance variability, although there may be a contribution from the QUESTprocedure consistency. A striking feature on Figure 6 is that regardless of thewithin- and inter-subject variability, all the conditions show a progressively smallerAO benefit as light level is decreased. The mean and standard error of the mean (calculatedas the standard deviation divided by the square root of the sample size) are given inTable 1 for each light level investigated.
The findings from these experiments show that the AO benefit that results from full,6mm pupil correction of higher-order aberrations reduces significantly with decreasinglight level, an observation consistent with the expected reduction in the spatial resolvingpower of the retina. The latter is often attributed to reduced signal-to-noise ratio inphotoreceptors, the intrusion of rod signals and the increased spatial summation. Changesin the processing of the retinal signals at lower light levels cause an overallreduction in neural contrast sensitivity and decreased spatial bandwidth. The processesinvolved in discriminating the gap of a Landolt C, for example through frequency channelsas vision is often described, are not well known. To the authors’ knowledge, no model hasbeen derived so far for this particular task. However, several studies on the frequency
1.00
10.00
100.00
0 0.5 1 1.5 2 2.5 3 3.5
Retinal illuminance (Td)
Con
tras
t sen
sitiv
ity
no HO aberrations correction
HO aberrations correction
Figure 5. Contrast sensitivity measured with an artificial 6mm pupil, from 10 to 1150Td forsubject 2. Error bars represent �1 standard deviation.
798 E. Dalimier et al.
Dow
nloa
ded
By:
[Nat
iona
l Uni
vers
ity o
f Ire
land
Gal
way
] At:
11:2
4 29
Feb
ruar
y 20
08
components of the Landolt C used in such a task suggest that subjects are more sensitiveto different components of the letter spectrum depending on the size of the C [18–20].One could infer that the visual processes involved will also vary with ambient light.This tentative hypothesis requires further investigation. A model is being developed forthe visual performance at this particular task, starting with the computed monochromaticmodulation transfer functions (MTF) with and without AO correction of the subjectsparticipating in this study.
3.2 Expected AO benefit for a range of pupil sizes and light levels
In order to investigate the potential visual benefit that can be expected from correction ofHO aberrations when the pupil size varies with the level of ambient illumination, a series ofmeasurements were carried out at each light level for pupil sizes of 6, 5, 4 and 3mmdiameter using procedure B.
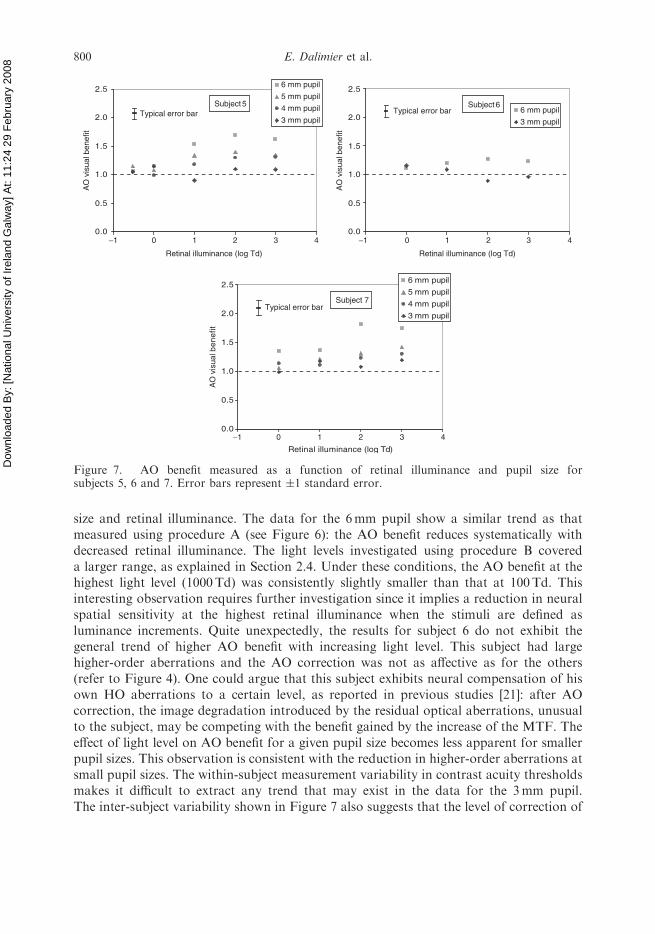
Figure 7 shows the results obtained with subjects 5, 6 and 7. The results are of interestsince they can be used to predict the expected visual benefit, given a knowledge of pupil
0.0
0.5
1.0
1.5
2.0
2.5
3.0
0 0.5 1 1.5 2 2.5 3 3.5
Retinal Illuminance (log Td)
0 0.5 1 1.5 2 2.5 3 3.5
Retinal Illuminance (log Td)
0 0.5 1 1.5 2 2.5 3 3.5
Retinal Illuminance (log Td)
0 0.5 1 1.5 2 2.5 3 3.5
Retinal Illuminance (log Td)
0.0
0.5
1.0
1.5
2.0
2.5
3.0
AO
vis
ual b
enef
it
AO
vis
ual b
enef
it
0.0
0.5
1.0
1.5
2.0
2.5
3.0
AO
vis
ual b
enef
it
0.0
0.5
1.0
1.5
2.0
2.5
3.0
AO
vis
ual b
enef
it
Subject 1 Subject 2
Subject 3 Subject 4
Figure 6. AO benefit measured as a function of retinal illuminance, obtained under procedure Afor subjects 1, 2, 3 and 4. Error bars represent �1 standard error.
Table 1. Mean and standard errors of AO benefit of the four subjects at the different light levels.
Retinal illuminance (Td) 10 30 50 1150AO benefit 1:25� 0:07 1:46� 0:09 1:53� 0:08 1:87� 0:09
Journal of Modern Optics 799
Dow
nloa
ded
By:
[Nat
iona
l Uni
vers
ity o
f Ire
land
Gal
way
] At:
11:2
4 29
Feb
ruar
y 20
08
size and retinal illuminance. The data for the 6mm pupil show a similar trend as thatmeasured using procedure A (see Figure 6): the AO benefit reduces systematically withdecreased retinal illuminance. The light levels investigated using procedure B covereda larger range, as explained in Section 2.4. Under these conditions, the AO benefit at thehighest light level (1000Td) was consistently slightly smaller than that at 100Td. Thisinteresting observation requires further investigation since it implies a reduction in neuralspatial sensitivity at the highest retinal illuminance when the stimuli are defined asluminance increments. Quite unexpectedly, the results for subject 6 do not exhibit thegeneral trend of higher AO benefit with increasing light level. This subject had largehigher-order aberrations and the AO correction was not as affective as for the others(refer to Figure 4). One could argue that this subject exhibits neural compensation of hisown HO aberrations to a certain level, as reported in previous studies [21]: after AOcorrection, the image degradation introduced by the residual optical aberrations, unusualto the subject, may be competing with the benefit gained by the increase of the MTF. Theeffect of light level on AO benefit for a given pupil size becomes less apparent for smallerpupil sizes. This observation is consistent with the reduction in higher-order aberrations atsmall pupil sizes. The within-subject measurement variability in contrast acuity thresholdsmakes it difficult to extract any trend that may exist in the data for the 3mm pupil.The inter-subject variability shown in Figure 7 also suggests that the level of correction of
0.0
0.5
1.0
1.5
2.0
2.5
Retinal illuminance (log Td)
AO
vis
ual b
en
efit
6 mm pupil
5 mm pupil
4 mm pupil
3 mm pupilTypical error bar
Subject 7
0.0
0.5
1.0
1.5
2.0
2.5A
O v
isua
l ben
efit
0.0
0.5
1.0
1.5
2.0
2.5
AO
vis
ual b
enef
it
6 mm pupil
5 mm pupil
4 mm pupil
3 mm pupilTypical error bar
Subject 5
−1 0 1 2 3 4−1 0 1 2 3 4
Retinal illuminance (log Td)
−1 0 1 2 3 4
Retinal illuminance (log Td)
6 mm pupil
3 mm pupilTypical error bar
Subject 6
Figure 7. AO benefit measured as a function of retinal illuminance and pupil size forsubjects 5, 6 and 7. Error bars represent �1 standard error.
800 E. Dalimier et al.
Dow
nloa
ded
By:
[Nat
iona
l Uni
vers
ity o
f Ire
land
Gal
way
] At:
11:2
4 29
Feb
ruar
y 20
08
higher-order aberrations, as described for subject 6, is not the only parameter that affectstheir visual performance. Differences in neural processing, in addition to optical effects,may account for much of the inter-subject variability.
The results presented so far can be related to natural pupil size. This study did notinvolve the use of natural pupils for a number of technical reasons. Firstly, the relativelysmall size of the field of view used for the psychophysical tests would not have producedsteady-state pupil sizes typical of corresponding ambient light. Furthermore, naturalfluctuations in pupil size would have made the AO correction more difficult, as well asthe control on retinal illuminance. The use of fixed pupil sizes produced optically weretherefore preferred, since this made possible the generation of constant retinal illuminancelevels and also facilitated the AO correction. Data on mean pupil size as a function of lightlevel are available from other studies; in particular, de Groot and Gebhard [22] compiledseveral studies and provided a best fit to the whole pupil versus ambient luminance data,represented as
log d ¼ 0:8558� 0:000401� ðlogBþ 8:1Þ3, ð4Þ
where d is the pupil diameter in millimetres and B is the luminance in millilamberts. B canbe related to retinal illuminance Er
B ¼Er
2:5d2: ð5Þ
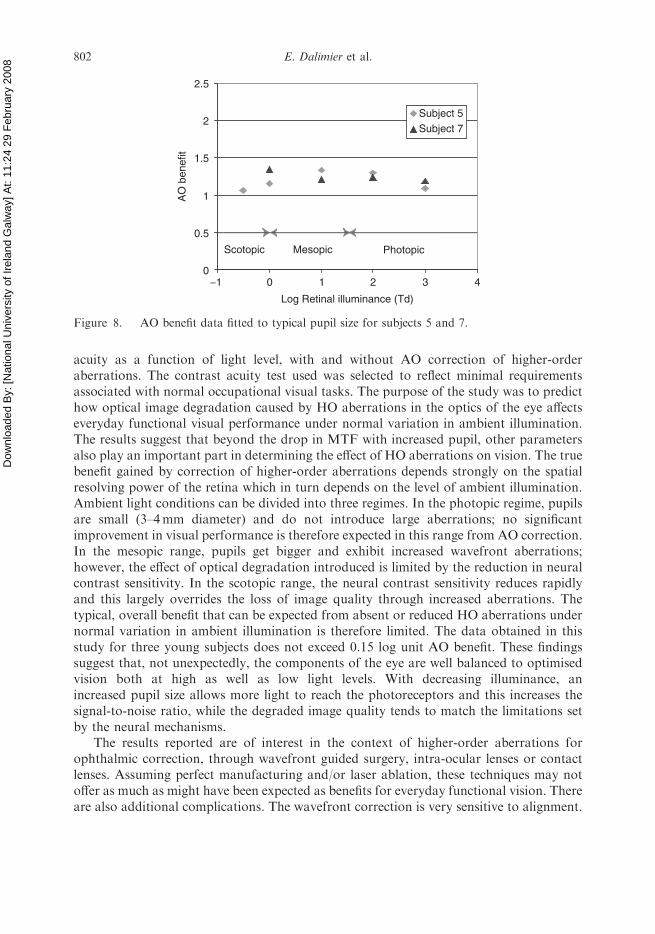
Using these two relations, the expected mean pupil size could be calculated for each of thelight levels employed in procedure B, after taking into account the Stiles–Crawford effectfor the two highest light levels. These calculations are shown in Table 2; for clarity we alsogive the corresponding luminance values and light regimes (the mesopic range extendsbetween 0.034 and 3.4 cdm�2 1). It is important to note that these data reflect only meanpupil diameters and that the effect of light level on pupil size is highly subject dependent.Figure 8 shows the expected AO benefit under natural viewing conditions as a function oflight level, based on the mean natural pupil size at each retinal illuminance. Values forsubject 6 are not shown in the figure since insufficient measurements were obtained.From Figure 7, it can already be seen that the AO benefit for this subject remains limited.For subjects 5 and 7, the AO benefit does not exceed 1.4 over the whole range of ambientillumination investigated.
4. Discussion and conclusion
This study reports new results on the effects higher-order aberrations can have on visualperformance as a function of light level. The study employed measurements of contrast
Table 2. Typical pupil size and luminance at each light level.
Scotopic regime Mesopic regime Photopic regime
Log Retinal illuminance (Td) �0.5 0 1 2 3Pupil diameter (mm) 6.1 5.8 5.0 4.0 3.0Luminance (cdm�2) 0.010 0.038 0.51 8.0 140
Journal of Modern Optics 801
Dow
nloa
ded
By:
[Nat
iona
l Uni
vers
ity o
f Ire
land
Gal
way
] At:
11:2
4 29
Feb
ruar
y 20
08
acuity as a function of light level, with and without AO correction of higher-orderaberrations. The contrast acuity test used was selected to reflect minimal requirementsassociated with normal occupational visual tasks. The purpose of the study was to predicthow optical image degradation caused by HO aberrations in the optics of the eye affectseveryday functional visual performance under normal variation in ambient illumination.The results suggest that beyond the drop in MTF with increased pupil, other parametersalso play an important part in determining the effect of HO aberrations on vision. The truebenefit gained by correction of higher-order aberrations depends strongly on the spatialresolving power of the retina which in turn depends on the level of ambient illumination.Ambient light conditions can be divided into three regimes. In the photopic regime, pupilsare small (3–4mm diameter) and do not introduce large aberrations; no significantimprovement in visual performance is therefore expected in this range from AO correction.In the mesopic range, pupils get bigger and exhibit increased wavefront aberrations;however, the effect of optical degradation introduced is limited by the reduction in neuralcontrast sensitivity. In the scotopic range, the neural contrast sensitivity reduces rapidlyand this largely overrides the loss of image quality through increased aberrations. Thetypical, overall benefit that can be expected from absent or reduced HO aberrations undernormal variation in ambient illumination is therefore limited. The data obtained in thisstudy for three young subjects does not exceed 0.15 log unit AO benefit. These findingssuggest that, not unexpectedly, the components of the eye are well balanced to optimisedvision both at high as well as low light levels. With decreasing illuminance, anincreased pupil size allows more light to reach the photoreceptors and this increases thesignal-to-noise ratio, while the degraded image quality tends to match the limitations setby the neural mechanisms.
The results reported are of interest in the context of higher-order aberrations forophthalmic correction, through wavefront guided surgery, intra-ocular lenses or contactlenses. Assuming perfect manufacturing and/or laser ablation, these techniques may notoffer as much as might have been expected as benefits for everyday functional vision. Thereare also additional complications. The wavefront correction is very sensitive to alignment.
0
0.5
1
1.5
2
2.5
−1 0 1 2 3 4
Log Retinal illuminance (Td)
AO
ben
efit
Subject 5Subject 7
PhotopicMesopicScotopic
Figure 8. AO benefit data fitted to typical pupil size for subjects 5 and 7.
802 E. Dalimier et al.
Dow
nloa
ded
By:
[Nat
iona
l Uni
vers
ity o
f Ire
land
Gal
way
] At:
11:2
4 29
Feb
ruar
y 20
08
The measurements obtained in this study involved the use of a bite bar to fixate the head ofthe subjects. As was described earlier, small movements of the subject’s head were critical,and so would be any unwanted displacement or tilt of a customised contact lens placed onthe cornea. The subjects involved in this study were, however, young and their aberrationsmay not therefore be typical of the larger aberrations expected in older subjects or inunusual patients with much increased higher-order aberrations, such as patients withkeratoconus. The extent to which corrections of larger HO aberrations can improve visionin normal, older subjects, and how increased aberrations may be balanced by the knowndecrease in pupil size with age remain to be investigated.
Note
1. These values are given by the Illumination Engineering Society of North America.
Acknowledgements
This research is funded by Science Foundation Ireland under grant number SFI/01/PI.2/B039C and
by a European Union EU Research Training Network, contract number HPRN-CT-2002-00301‘SHARP-EYE’.
References
[1] Liang, J.; Williams, D.R.; Miller, D.T. J. Opt. Soc. Am. A. 1997, 14, 2884–2892.[2] Yoon, G.Y.; Williams, D.R. J. Opt. Soc. Am. A. 2002, 19, 266–275.[3] Schwiegerling, J. Opt. Photon. News. 2004, 15, 26–29.[4] Patel, A.S. J. Opt. Soc. Am. 1966, 56, 689–694.[5] Van Nes, F.L.; Bouman, M.A. J. Opt. Soc. Am. 1967, 57, 401–406.[6] Van Metteren, A.; Vos, J.J. Vision Res. 1972, 12, 825–833.[7] Coletta, N.J.; Sharma, V. J. Opt. Soc. Am. A. 1995, 12, 2244–2251.[8] Chisholm, C.M.; Evans, A.D.B.; Harlow, J.A.; Barbur, J.L. Aviat. Space Environ. Med. 2003,
74, 551–559.[9] Watson, A.B.; Pelli, D.G. Perc. Psych. 1983, 33, 113–120.[10] Hampson, K.M.; Munro, I.; Paterson, C.; Dainty, J.C. J. Opt. Soc. Am. A. 2005, 22, 1241–1250.[11] Dalimier, E.; Hampson, K.M.; Dainty, J.C. Proc. SPIE. 2005, 5823, 20–28.[12] Hampson,K.M.; Paterson, C.;Dainty, C.;Mallen, E.A.H. J.Opt. Soc. Am.A. 2006, 23, 1082–1088.[13] Llorente, L.; Diaz-Santana, L.; Lara-Saucedo, D.; Marcos, S. Optom. Vis. Sci. 2003, 80, 26–35.[14] Fernandez, E.J.; Unterhuber, A.; Prieto, P.M.; Hermann, B.; Drexler, W.; Artal, P.
Opt. Express. 2005, 13, 400–409.[15] Dalimier, E.; Dainty, C. Opt. Express. 2005, 13, 4275–4285.[16] Stiles, W.S.; Crawford, B.H. Proc. R. Soc. London. 1933, 112, 428–450.[17] Applegate, R.A.; Lakshminarayanan, V.; J. Opt. Soc. Am. A. 1993, 10, 1611–1623.[18] Bondarko, V.M.; Danilova, M.V. Vision Res. 1997, 15, 2153–2156.[19] Hess, R.F.; Williams, C.B.; Chaudhry, A. J. Opt. Soc. Am. A. 2001, 18, 2414–2418.[20] Ehrt, O.; Hess, R.F.; Williams, C.B.; Sher, K. J. Opt. Soc. Am. A. 2003, 20, 11–17.[21] Artal, P.; Chen, L.; Fernandez, E.J.; Singer, B.; Manzanera, S.; Williams, D.R. J. Vis. 2004, 4,
281–287.[22] de Groot, S.G.; Gebhard, J.W. J. Opt. Soc. Am. 1952, 42, 492–495.
Journal of Modern Optics 803
Copyright © 2022 FDOKUMEN