Effects of fishing and predation in a heavily exploited ecosystem: Comparing periods before and...
14
ecological modelling 204 ( 2 0 0 7 ) 115–128 available at www.sciencedirect.com journal homepage: www.elsevier.com/locate/ecolmodel Effects of fishing and predation in a heavily exploited ecosystem: Comparing periods before and after the collapse of groundfish in the southern Gulf of St. Lawrence (Canada) C. Savenkoff a,∗ , D.P. Swain b , J.M. Hanson b , M. Castonguay a , M.O. Hammill a , H. Bourdages a , L. Morissette a,c , D. Chabot a a Pˆ eches et Oc´ eans Canada, Institut Maurice-Lamontagne, 850 Route de la Mer, Mont-Joli, Qu´ ebec G5H 3Z4, Canada b Fisheries and Oceans Canada, Gulf Fisheries Centre, 343 Universit´ e Ave., Moncton, New Brunswick E1C 9B6, Canada c Fisheries Centre, The University of British Columbia Aquatic Ecosystems Research Laboratory (AERL), 2202 Main Mall, Vancouver, British Columbia V6T 1Z4, Canada article info Article history: Received 10 November 2005 Received in revised form 20 December 2006 Accepted 28 December 2006 Published on line 30 January 2007 Keywords: Food webs Inverse methods Trophic fluxes Mass-balance models Cod collapse abstract Mass-balance models, using inverse methodology, were applied to the southern Gulf of St. Lawrence for the mid-1980s and the mid-1990s to describe ecosystem structure, trophic group interactions, and the effects of fishing and predation on the ecosystem for periods preceding and following the collapse of groundfish stocks in this area. These models were used to determine how the ecosystem changed, and whether its structure and functioning were affected by the observed changes in key species between the two time periods. Our analyses indicate that the ecosystem structure shifted dramatically from one previously dominated by piscivorous groundfish and small-bodied forage species (e.g., capelin, herring, and shrimp) in similar proportions to one now dominated by small-bodied forage species. Overfishing removed a functional group, large-bodied demersal predators that has not been replaced 12 years after the cessation of heavy fishing, and left marine mammals such as seals and cetacea as top predators of many species (especially fishes) during the mid-1990s. Predation by marine mammals on fish increased from the mid-1980s to the mid-1990s while predation by large fish on fish decreased. A change in the prey of seals from juvenile cod to capelin occurred between the models for the mid-1980s and the mid-1990s consistent with observed shifts in the abundance of the two prey species between the two time periods. These major changes were accompanied by a decrease in total catches and a transition in landings from long-lived and piscivorous groundfish toward planktivorous pelagic fish and invertebrates. © 2007 Elsevier B.V. All rights reserved. 1. Introduction The past two decades have seen an explosive growth in the number and type of multispecies models directed at fish- eries questions (reviewed in Hollowed et al., 2000; Whipple ∗ Corresponding author. E-mail address: [email protected] (C. Savenkoff). et al., 2000; Fulton et al., 2003; Browman and Stergiou, 2004 and references therein). Mass-balance models using inverse methodology (V´ ezina and Platt, 1988) have been shown to be a promising approach to the problem of modelling the structure of marine ecosystems (Savenkoff et al., 2004a). These models 0304-3800/$ – see front matter © 2007 Elsevier B.V. All rights reserved. doi:10.1016/j.ecolmodel.2006.12.029
-
Upload
dfo-mpo-gc -
Category
Documents
-
view
3 -
download
0
Transcript of Effects of fishing and predation in a heavily exploited ecosystem: Comparing periods before and...
Eeo
CHa
b
c
B
a
A
R
R
2
A
P
K
F
I
T
M
C
1
Tne
0d
e c o l o g i c a l m o d e l l i n g 2 0 4 ( 2 0 0 7 ) 115–128
avai lab le at www.sc iencedi rec t .com
journa l homepage: www.e lsev ier .com/ locate /eco lmodel
ffects of fishing and predation in a heavily exploitedcosystem: Comparing periods before and after the collapsef groundfish in the southern Gulf of St. Lawrence (Canada)
. Savenkoffa,∗, D.P. Swainb, J.M. Hansonb, M. Castonguaya, M.O. Hammill a,. Bourdagesa, L. Morissettea,c, D. Chabota
Peches et Oceans Canada, Institut Maurice-Lamontagne, 850 Route de la Mer, Mont-Joli, Quebec G5H 3Z4, CanadaFisheries and Oceans Canada, Gulf Fisheries Centre, 343 Universite Ave., Moncton, New Brunswick E1C 9B6, CanadaFisheries Centre, The University of British Columbia Aquatic Ecosystems Research Laboratory (AERL), 2202 Main Mall, Vancouver,ritish Columbia V6T 1Z4, Canada
r t i c l e i n f o
rticle history:
eceived 10 November 2005
eceived in revised form
0 December 2006
ccepted 28 December 2006
ublished on line 30 January 2007
eywords:
ood webs
nverse methods
rophic fluxes
ass-balance models
od collapse
a b s t r a c t
Mass-balance models, using inverse methodology, were applied to the southern Gulf of St.
Lawrence for the mid-1980s and the mid-1990s to describe ecosystem structure, trophic
group interactions, and the effects of fishing and predation on the ecosystem for periods
preceding and following the collapse of groundfish stocks in this area. These models were
used to determine how the ecosystem changed, and whether its structure and functioning
were affected by the observed changes in key species between the two time periods. Our
analyses indicate that the ecosystem structure shifted dramatically from one previously
dominated by piscivorous groundfish and small-bodied forage species (e.g., capelin, herring,
and shrimp) in similar proportions to one now dominated by small-bodied forage species.
Overfishing removed a functional group, large-bodied demersal predators that has not been
replaced 12 years after the cessation of heavy fishing, and left marine mammals such as
seals and cetacea as top predators of many species (especially fishes) during the mid-1990s.
Predation by marine mammals on fish increased from the mid-1980s to the mid-1990s while
predation by large fish on fish decreased. A change in the prey of seals from juvenile cod to
capelin occurred between the models for the mid-1980s and the mid-1990s consistent with
observed shifts in the abundance of the two prey species between the two time periods.
These major changes were accompanied by a decrease in total catches and a transition in
landings from long-lived and piscivorous groundfish toward planktivorous pelagic fish and
invertebrates.
and references therein). Mass-balance models using inverse
. Introductionhe past two decades have seen an explosive growth in theumber and type of multispecies models directed at fish-ries questions (reviewed in Hollowed et al., 2000; Whipple
∗ Corresponding author.E-mail address: [email protected] (C. Savenkoff).
304-3800/$ – see front matter © 2007 Elsevier B.V. All rights reserved.oi:10.1016/j.ecolmodel.2006.12.029
© 2007 Elsevier B.V. All rights reserved.
et al., 2000; Fulton et al., 2003; Browman and Stergiou, 2004
methodology (Vezina and Platt, 1988) have been shown to be apromising approach to the problem of modelling the structureof marine ecosystems (Savenkoff et al., 2004a). These models

116 e c o l o g i c a l m o d e l l i n g 2 0 4 ( 2 0 0 7 ) 115–128
Fig. 1 – Study area (solid line) covering the southern Gulf of St. Lawrence (NAFO division 4T) between 15 and 200 m deeptuar
equivalent to a total area of 64,075 km2. The St. Lawrence Escontour, dotted line: 100-m contour.
generate a “snapshot” of trophic interactions between all func-tional groups at one moment in time by using mass-balanceprinciples and an objective least-squares criterion to estimateflows of organic matter or energy between ecosystem compo-nents.
In the early 1990s, abundance of many Northwest Atlanticcod populations (Gadus morhua) declined to low levels resultingin cessation of directed fishing for these stocks, thus endingone of the largest and longest running commercial groundfishfisheries in the world (CAFSAC, 1994; Swain and Castonguay,2000). More than a decade later, in spite of limited fishing,almost all of these stocks show no sign of recovery, and insome cases abundance has continued to decline (Rice andRivard, 2003).
In this study, we developed mass-balance models for thesouthern Gulf of St. Lawrence ecosystem (Northwest AtlanticFisheries Organization [NAFO] division 4T), both before (mid-
1980s) and after (mid-1990s) the collapse of the southern Gulfof St. Lawrence cod stock. These models were used to describeecosystem structure, the trophic interactions among groups,and the effects of fishing and predation on the ecosystemy was not included in the study. Dashed line: 200-m
for each time period. The model results provided valuableinformation on the impact of fishing relative to the effectsof predation and natural mortality other than predation onthe vertebrate and invertebrate communities during each timeperiod. Our goal was to determine how the ecosystem mayhave changed, and whether its structure and functioning atdifferent trophic levels have been affected by the observedchanges in the abundance of some key species between thetwo time periods.
2. Materials and methods
2.1. Study area
The Gulf of St. Lawrence (Gulf) is a stratified semi-enclosedsea connected to the North Atlantic Ocean through the Cabot
Strait to the southeast and through the Strait of Belle-Isle tothe northeast (Fig. 1). The bathymetry of the Gulf is dominatedby the Laurentian Channel, a glacially deepened trough thatdivides the Gulf into two very distinct systems: the deep north-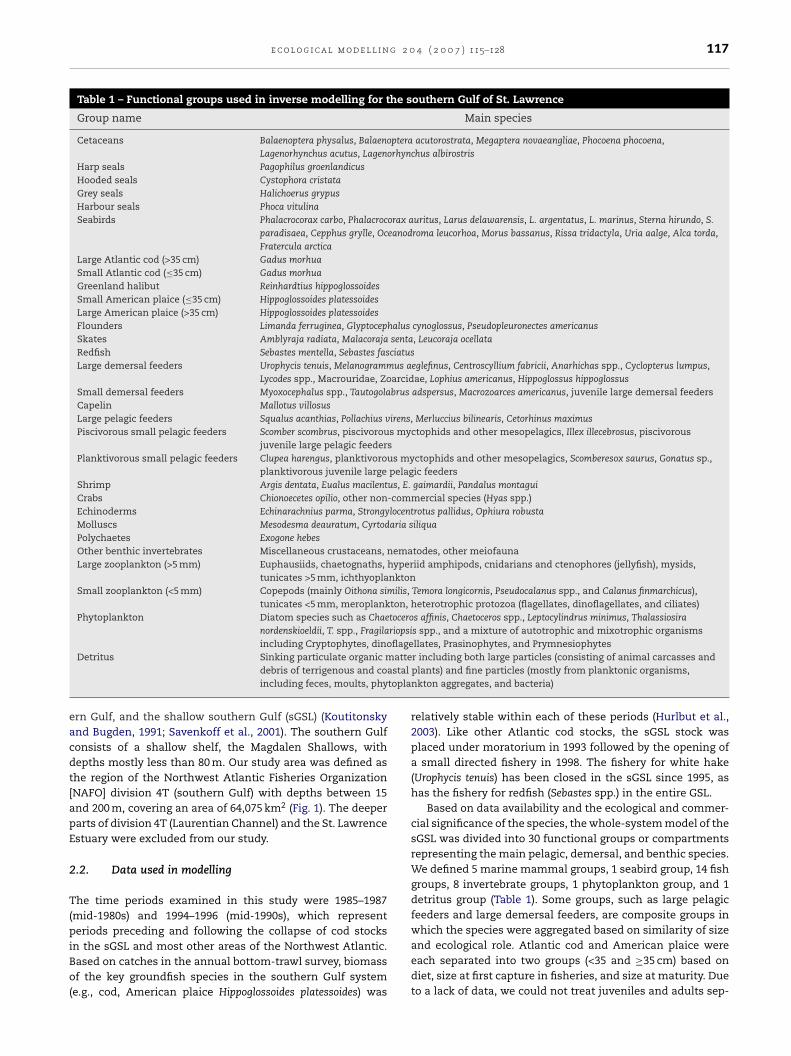
e c o l o g i c a l m o d e l l i n g 2 0 4 ( 2 0 0 7 ) 115–128 117
Table 1 – Functional groups used in inverse modelling for the southern Gulf of St. Lawrence
Group name Main species
Cetaceans Balaenoptera physalus, Balaenoptera acutorostrata, Megaptera novaeangliae, Phocoena phocoena,Lagenorhynchus acutus, Lagenorhynchus albirostris
Harp seals Pagophilus groenlandicusHooded seals Cystophora cristataGrey seals Halichoerus grypusHarbour seals Phoca vitulinaSeabirds Phalacrocorax carbo, Phalacrocorax auritus, Larus delawarensis, L. argentatus, L. marinus, Sterna hirundo, S.
paradisaea, Cepphus grylle, Oceanodroma leucorhoa, Morus bassanus, Rissa tridactyla, Uria aalge, Alca torda,Fratercula arctica
Large Atlantic cod (>35 cm) Gadus morhuaSmall Atlantic cod (≤35 cm) Gadus morhuaGreenland halibut Reinhardtius hippoglossoidesSmall American plaice (≤35 cm) Hippoglossoides platessoidesLarge American plaice (>35 cm) Hippoglossoides platessoidesFlounders Limanda ferruginea, Glyptocephalus cynoglossus, Pseudopleuronectes americanusSkates Amblyraja radiata, Malacoraja senta, Leucoraja ocellataRedfish Sebastes mentella, Sebastes fasciatusLarge demersal feeders Urophycis tenuis, Melanogrammus aeglefinus, Centroscyllium fabricii, Anarhichas spp., Cyclopterus lumpus,
Lycodes spp., Macrouridae, Zoarcidae, Lophius americanus, Hippoglossus hippoglossusSmall demersal feeders Myoxocephalus spp., Tautogolabrus adspersus, Macrozoarces americanus, juvenile large demersal feedersCapelin Mallotus villosusLarge pelagic feeders Squalus acanthias, Pollachius virens, Merluccius bilinearis, Cetorhinus maximusPiscivorous small pelagic feeders Scomber scombrus, piscivorous myctophids and other mesopelagics, Illex illecebrosus, piscivorous
juvenile large pelagic feedersPlanktivorous small pelagic feeders Clupea harengus, planktivorous myctophids and other mesopelagics, Scomberesox saurus, Gonatus sp.,
planktivorous juvenile large pelagic feedersShrimp Argis dentata, Eualus macilentus, E. gaimardii, Pandalus montaguiCrabs Chionoecetes opilio, other non-commercial species (Hyas spp.)Echinoderms Echinarachnius parma, Strongylocentrotus pallidus, Ophiura robustaMolluscs Mesodesma deauratum, Cyrtodaria siliquaPolychaetes Exogone hebesOther benthic invertebrates Miscellaneous crustaceans, nematodes, other meiofaunaLarge zooplankton (>5 mm) Euphausiids, chaetognaths, hyperiid amphipods, cnidarians and ctenophores (jellyfish), mysids,
tunicates >5 mm, ichthyoplanktonSmall zooplankton (<5 mm) Copepods (mainly Oithona similis, Temora longicornis, Pseudocalanus spp., and Calanus finmarchicus),
tunicates <5 mm, meroplankton, heterotrophic protozoa (flagellates, dinoflagellates, and ciliates)Phytoplankton Diatom species such as Chaetoceros affinis, Chaetoceros spp., Leptocylindrus minimus, Thalassiosira
nordenskioeldii, T. spp., Fragilariopsis spp., and a mixture of autotrophic and mixotrophic organismsincluding Cryptophytes, dinoflagellates, Prasinophytes, and Prymnesiophytes
atteastaltopla
eacdt[apE
2
T(piBo(
Detritus Sinking particulate organic mdebris of terrigenous and coincluding feces, moults, phy
rn Gulf, and the shallow southern Gulf (sGSL) (Koutitonskynd Bugden, 1991; Savenkoff et al., 2001). The southern Gulfonsists of a shallow shelf, the Magdalen Shallows, withepths mostly less than 80 m. Our study area was defined ashe region of the Northwest Atlantic Fisheries OrganizationNAFO] division 4T (southern Gulf) with depths between 15nd 200 m, covering an area of 64,075 km2 (Fig. 1). The deeperarts of division 4T (Laurentian Channel) and the St. Lawrencestuary were excluded from our study.
.2. Data used in modelling
he time periods examined in this study were 1985–1987mid-1980s) and 1994–1996 (mid-1990s), which representeriods preceding and following the collapse of cod stocks
n the sGSL and most other areas of the Northwest Atlantic.ased on catches in the annual bottom-trawl survey, biomassf the key groundfish species in the southern Gulf system
e.g., cod, American plaice Hippoglossoides platessoides) was
r including both large particles (consisting of animal carcasses andplants) and fine particles (mostly from planktonic organisms,nkton aggregates, and bacteria)
relatively stable within each of these periods (Hurlbut et al.,2003). Like other Atlantic cod stocks, the sGSL stock wasplaced under moratorium in 1993 followed by the opening ofa small directed fishery in 1998. The fishery for white hake(Urophycis tenuis) has been closed in the sGSL since 1995, ashas the fishery for redfish (Sebastes spp.) in the entire GSL.
Based on data availability and the ecological and commer-cial significance of the species, the whole-system model of thesGSL was divided into 30 functional groups or compartmentsrepresenting the main pelagic, demersal, and benthic species.We defined 5 marine mammal groups, 1 seabird group, 14 fishgroups, 8 invertebrate groups, 1 phytoplankton group, and 1detritus group (Table 1). Some groups, such as large pelagicfeeders and large demersal feeders, are composite groups inwhich the species were aggregated based on similarity of size
and ecological role. Atlantic cod and American plaice wereeach separated into two groups (<35 and ≥35 cm) based ondiet, size at first capture in fisheries, and size at maturity. Dueto a lack of data, we could not treat juveniles and adults sep-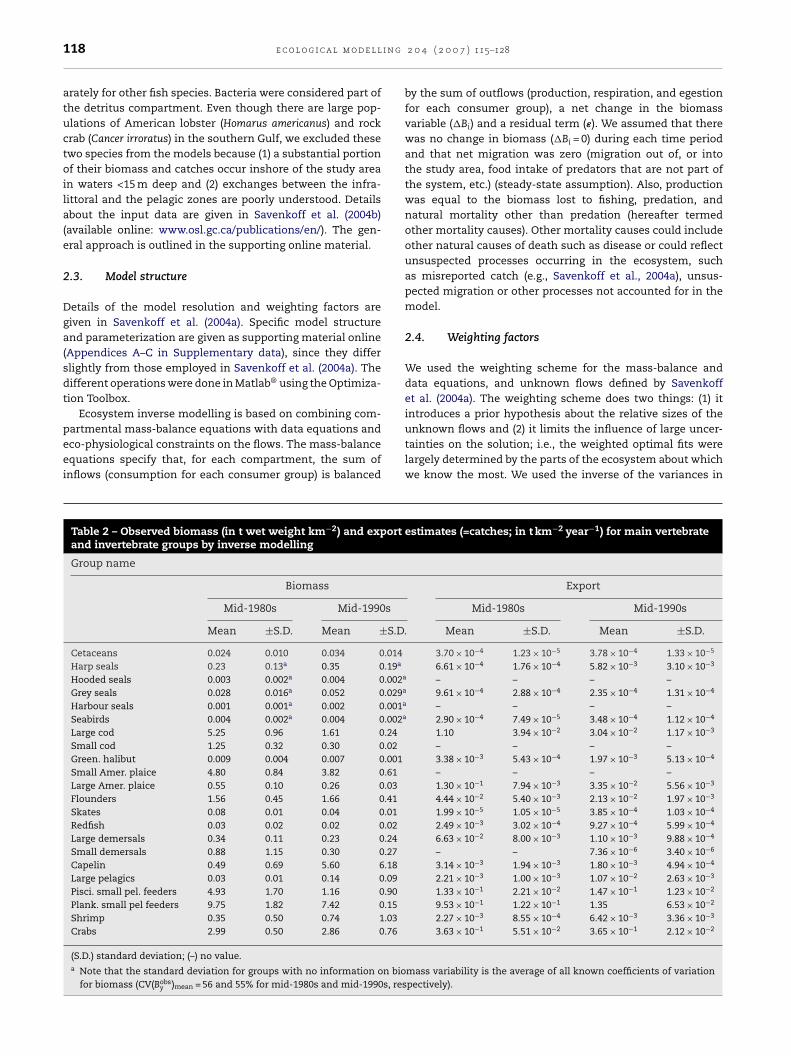
i n g
118 e c o l o g i c a l m o d e l larately for other fish species. Bacteria were considered part ofthe detritus compartment. Even though there are large pop-ulations of American lobster (Homarus americanus) and rockcrab (Cancer irroratus) in the southern Gulf, we excluded thesetwo species from the models because (1) a substantial portionof their biomass and catches occur inshore of the study areain waters <15 m deep and (2) exchanges between the infra-littoral and the pelagic zones are poorly understood. Detailsabout the input data are given in Savenkoff et al. (2004b)(available online: www.osl.gc.ca/publications/en/). The gen-eral approach is outlined in the supporting online material.
2.3. Model structure
Details of the model resolution and weighting factors aregiven in Savenkoff et al. (2004a). Specific model structureand parameterization are given as supporting material online(Appendices A–C in Supplementary data), since they differslightly from those employed in Savenkoff et al. (2004a). Thedifferent operations were done in Matlab® using the Optimiza-tion Toolbox.
Ecosystem inverse modelling is based on combining com-
partmental mass-balance equations with data equations andeco-physiological constraints on the flows. The mass-balanceequations specify that, for each compartment, the sum ofinflows (consumption for each consumer group) is balancedTable 2 – Observed biomass (in t wet weight km−2) and exportand invertebrate groups by inverse modelling
Group name
Biomass
Mid-1980s Mid-1990s
Mean ±S.D. Mean ±S.D.
Cetaceans 0.024 0.010 0.034 0.014Harp seals 0.23 0.13a 0.35 0.19a
Hooded seals 0.003 0.002a 0.004 0.002a
Grey seals 0.028 0.016a 0.052 0.029a
Harbour seals 0.001 0.001a 0.002 0.001a
Seabirds 0.004 0.002a 0.004 0.002a
Large cod 5.25 0.96 1.61 0.24Small cod 1.25 0.32 0.30 0.02Green. halibut 0.009 0.004 0.007 0.001Small Amer. plaice 4.80 0.84 3.82 0.61Large Amer. plaice 0.55 0.10 0.26 0.03Flounders 1.56 0.45 1.66 0.41Skates 0.08 0.01 0.04 0.01Redfish 0.03 0.02 0.02 0.02Large demersals 0.34 0.11 0.23 0.24Small demersals 0.88 1.15 0.30 0.27Capelin 0.49 0.69 5.60 6.18Large pelagics 0.03 0.01 0.14 0.09Pisci. small pel. feeders 4.93 1.70 1.16 0.90Plank. small pel feeders 9.75 1.82 7.42 0.15Shrimp 0.35 0.50 0.74 1.03Crabs 2.99 0.50 2.86 0.76
(S.D.) standard deviation; (–) no value.a Note that the standard deviation for groups with no information on bio
for biomass (CV(Bobsy )mean = 56 and 55% for mid-1980s and mid-1990s, res
2 0 4 ( 2 0 0 7 ) 115–128
by the sum of outflows (production, respiration, and egestionfor each consumer group), a net change in the biomassvariable (�Bi) and a residual term (ε). We assumed that therewas no change in biomass (�Bi = 0) during each time periodand that net migration was zero (migration out of, or intothe study area, food intake of predators that are not part ofthe system, etc.) (steady-state assumption). Also, productionwas equal to the biomass lost to fishing, predation, andnatural mortality other than predation (hereafter termedother mortality causes). Other mortality causes could includeother natural causes of death such as disease or could reflectunsuspected processes occurring in the ecosystem, suchas misreported catch (e.g., Savenkoff et al., 2004a), unsus-pected migration or other processes not accounted for in themodel.
2.4. Weighting factors
We used the weighting scheme for the mass-balance anddata equations, and unknown flows defined by Savenkoffet al. (2004a). The weighting scheme does two things: (1) itintroduces a prior hypothesis about the relative sizes of the
unknown flows and (2) it limits the influence of large uncer-tainties on the solution; i.e., the weighted optimal fits werelargely determined by the parts of the ecosystem about whichwe know the most. We used the inverse of the variances inestimates (=catches; in t km−2 year−1) for main vertebrate
Export
Mid-1980s Mid-1990s
Mean ±S.D. Mean ±S.D.
3.70 × 10⁻⁴ 1.23 × 10⁻⁵ 3.78 × 10⁻⁴ 1.33 × 10⁻⁵
6.61 × 10⁻⁴ 1.76 × 10⁻⁴ 5.82 × 10⁻³ 3.10 × 10⁻³
– – – –9.61 × 10⁻⁴ 2.88 × 10⁻⁴ 2.35 × 10⁻⁴ 1.31 × 10⁻⁴
– – – –2.90 × 10⁻⁴ 7.49 × 10⁻⁵ 3.48 × 10⁻⁴ 1.12 × 10⁻⁴
1.10 3.94 × 10⁻² 3.04 × 10⁻² 1.17 × 10⁻³
– – – –3.38 × 10⁻³ 5.43 × 10⁻⁴ 1.97 × 10⁻³ 5.13 × 10⁻⁴
– – – –1.30 × 10⁻¹ 7.94 × 10⁻³ 3.35 × 10⁻² 5.56 × 10⁻³
4.44 × 10⁻² 5.40 × 10⁻³ 2.13 × 10⁻² 1.97 × 10⁻³
1.99 × 10⁻⁵ 1.05 × 10⁻⁵ 3.85 × 10⁻⁴ 1.03 × 10⁻⁴
2.49 × 10⁻³ 3.02 × 10⁻⁴ 9.27 × 10⁻⁴ 5.99 × 10⁻⁴
6.63 × 10⁻² 8.00 × 10⁻³ 1.10 × 10⁻³ 9.88 × 10⁻⁴
– – 7.36 × 10⁻⁶ 3.40 × 10⁻⁶
3.14 × 10⁻³ 1.94 × 10⁻³ 1.80 × 10⁻³ 4.94 × 10⁻⁴
2.21 × 10⁻³ 1.00 × 10⁻³ 1.07 × 10⁻² 2.63 × 10⁻³
1.33 × 10⁻¹ 2.21 × 10⁻² 1.47 × 10⁻¹ 1.23 × 10⁻²
9.53 × 10⁻¹ 1.22 × 10⁻¹ 1.35 6.53 × 10⁻²
2.27 × 10⁻³ 8.55 × 10⁻⁴ 6.42 × 10⁻³ 3.36 × 10⁻³
3.63 × 10⁻¹ 5.51 × 10⁻² 3.65 × 10⁻¹ 2.12 × 10⁻²
mass variability is the average of all known coefficients of variationpectively).
g 2 0 4 ( 2 0 0 7 ) 115–128 119
tu
2
Trt(atd“lenrwttot
asttrmot(lwestipts
3
3b
BigpecsApF
y
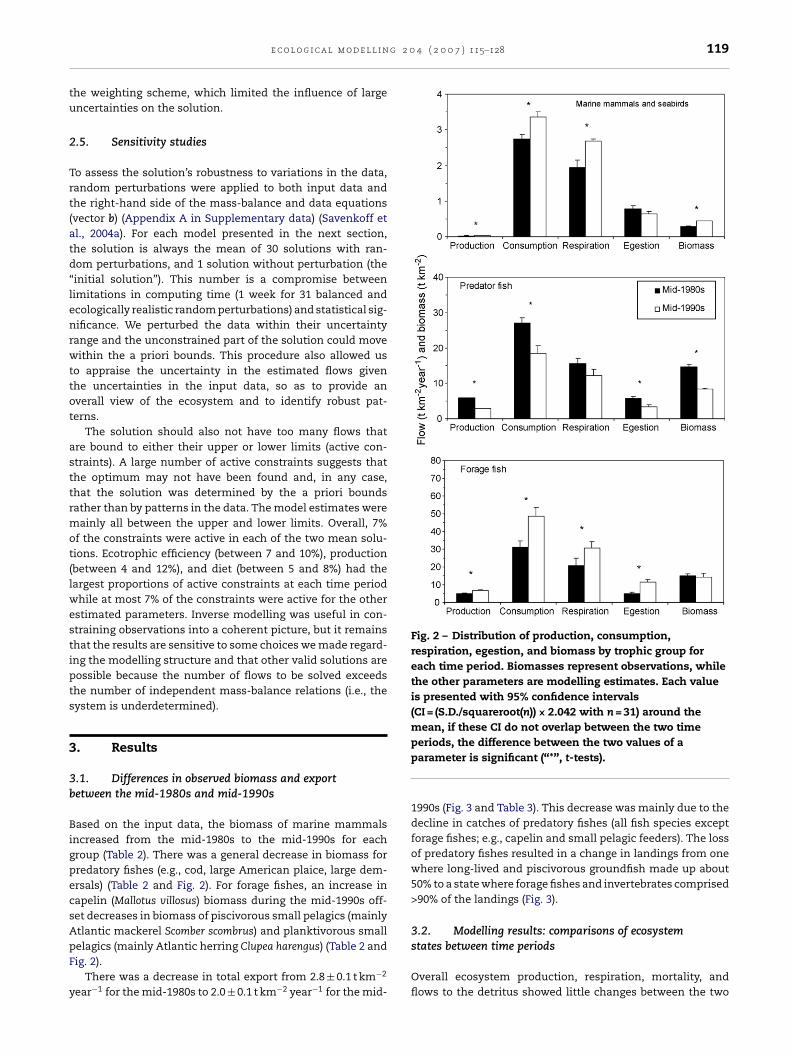
Fig. 2 – Distribution of production, consumption,respiration, egestion, and biomass by trophic group foreach time period. Biomasses represent observations, whilethe other parameters are modelling estimates. Each valueis presented with 95% confidence intervals(CI = (S.D./squareroot(n)) × 2.042 with n = 31) around themean, if these CI do not overlap between the two time
e c o l o g i c a l m o d e l l i n
he weighting scheme, which limited the influence of largencertainties on the solution.
.5. Sensitivity studies
o assess the solution’s robustness to variations in the data,andom perturbations were applied to both input data andhe right-hand side of the mass-balance and data equationsvector b) (Appendix A in Supplementary data) (Savenkoff etl., 2004a). For each model presented in the next section,he solution is always the mean of 30 solutions with ran-om perturbations, and 1 solution without perturbation (theinitial solution”). This number is a compromise betweenimitations in computing time (1 week for 31 balanced andcologically realistic random perturbations) and statistical sig-ificance. We perturbed the data within their uncertaintyange and the unconstrained part of the solution could moveithin the a priori bounds. This procedure also allowed us
o appraise the uncertainty in the estimated flows givenhe uncertainties in the input data, so as to provide anverall view of the ecosystem and to identify robust pat-erns.
The solution should also not have too many flows thatre bound to either their upper or lower limits (active con-traints). A large number of active constraints suggests thathe optimum may not have been found and, in any case,hat the solution was determined by the a priori boundsather than by patterns in the data. The model estimates were
ainly all between the upper and lower limits. Overall, 7%f the constraints were active in each of the two mean solu-ions. Ecotrophic efficiency (between 7 and 10%), productionbetween 4 and 12%), and diet (between 5 and 8%) had theargest proportions of active constraints at each time period
hile at most 7% of the constraints were active for the otherstimated parameters. Inverse modelling was useful in con-training observations into a coherent picture, but it remainshat the results are sensitive to some choices we made regard-ng the modelling structure and that other valid solutions areossible because the number of flows to be solved exceedshe number of independent mass-balance relations (i.e., theystem is underdetermined).
. Results
.1. Differences in observed biomass and exportetween the mid-1980s and mid-1990s
ased on the input data, the biomass of marine mammalsncreased from the mid-1980s to the mid-1990s for eachroup (Table 2). There was a general decrease in biomass forredatory fishes (e.g., cod, large American plaice, large dem-rsals) (Table 2 and Fig. 2). For forage fishes, an increase inapelin (Mallotus villosus) biomass during the mid-1990s off-et decreases in biomass of piscivorous small pelagics (mainlytlantic mackerel Scomber scombrus) and planktivorous small
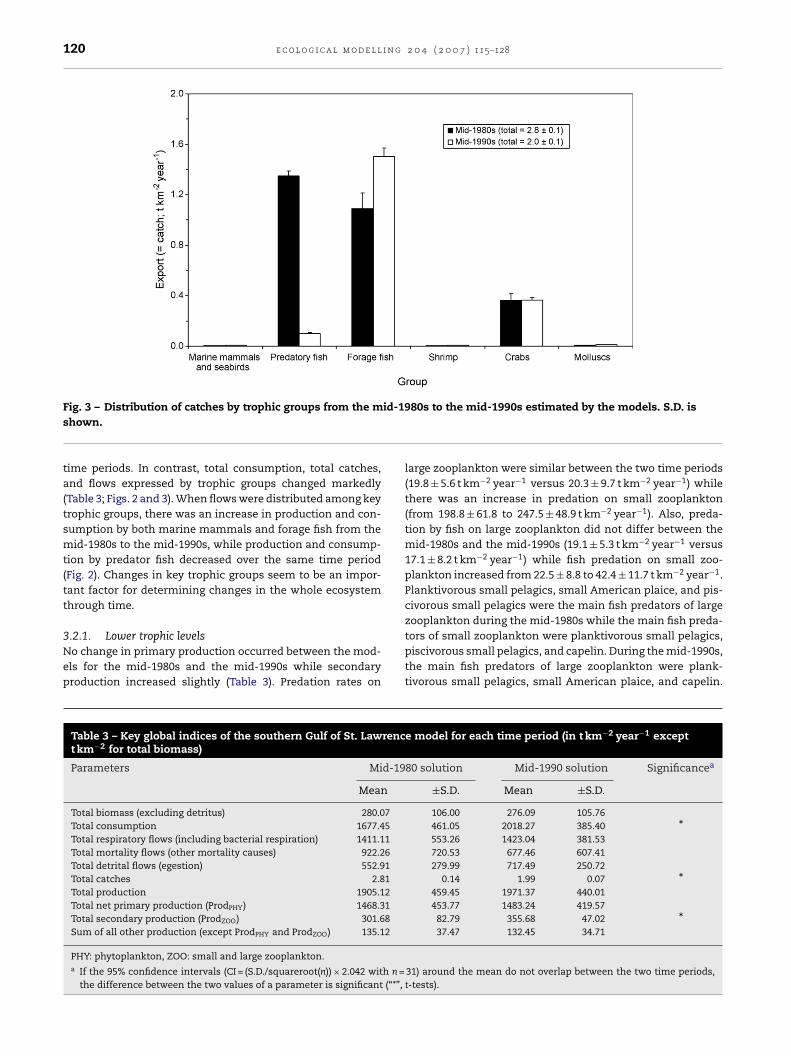
elagics (mainly Atlantic herring Clupea harengus) (Table 2 andig. 2).There was a decrease in total export from 2.8 ± 0.1 t km−2
ear−1 for the mid-1980s to 2.0 ± 0.1 t km−2 year−1 for the mid-
periods, the difference between the two values of aparameter is significant (“*”, t-tests).
1990s (Fig. 3 and Table 3). This decrease was mainly due to thedecline in catches of predatory fishes (all fish species exceptforage fishes; e.g., capelin and small pelagic feeders). The lossof predatory fishes resulted in a change in landings from onewhere long-lived and piscivorous groundfish made up about50% to a state where forage fishes and invertebrates comprised>90% of the landings (Fig. 3).
3.2. Modelling results: comparisons of ecosystem
states between time periodsOverall ecosystem production, respiration, mortality, andflows to the detritus showed little changes between the two
120 e c o l o g i c a l m o d e l l i n g 2 0 4 ( 2 0 0 7 ) 115–128
id-1
Fig. 3 – Distribution of catches by trophic groups from the mshown.time periods. In contrast, total consumption, total catches,and flows expressed by trophic groups changed markedly(Table 3; Figs. 2 and 3). When flows were distributed among keytrophic groups, there was an increase in production and con-sumption by both marine mammals and forage fish from themid-1980s to the mid-1990s, while production and consump-tion by predator fish decreased over the same time period(Fig. 2). Changes in key trophic groups seem to be an impor-tant factor for determining changes in the whole ecosystemthrough time.
3.2.1. Lower trophic levelsNo change in primary production occurred between the mod-els for the mid-1980s and the mid-1990s while secondaryproduction increased slightly (Table 3). Predation rates on
Table 3 – Key global indices of the southern Gulf of St. Lawrenct km−2 for total biomass)
Parameters Mid-19
Mean
Total biomass (excluding detritus) 280.07Total consumption 1677.45Total respiratory flows (including bacterial respiration) 1411.11Total mortality flows (other mortality causes) 922.26Total detrital flows (egestion) 552.91Total catches 2.81Total production 1905.12Total net primary production (ProdPHY) 1468.31Total secondary production (ProdZOO) 301.68Sum of all other production (except ProdPHY and ProdZOO) 135.12
PHY: phytoplankton, ZOO: small and large zooplankton.a If the 95% confidence intervals (CI = (S.D./squareroot(n)) × 2.042 with n =
the difference between the two values of a parameter is significant (“*”,
980s to the mid-1990s estimated by the models. S.D. is
large zooplankton were similar between the two time periods(19.8 ± 5.6 t km−2 year−1 versus 20.3 ± 9.7 t km−2 year−1) whilethere was an increase in predation on small zooplankton(from 198.8 ± 61.8 to 247.5 ± 48.9 t km−2 year−1). Also, preda-tion by fish on large zooplankton did not differ between themid-1980s and the mid-1990s (19.1 ± 5.3 t km−2 year−1 versus17.1 ± 8.2 t km−2 year−1) while fish predation on small zoo-plankton increased from 22.5 ± 8.8 to 42.4 ± 11.7 t km−2 year−1.Planktivorous small pelagics, small American plaice, and pis-civorous small pelagics were the main fish predators of largezooplankton during the mid-1980s while the main fish preda-
tors of small zooplankton were planktivorous small pelagics,piscivorous small pelagics, and capelin. During the mid-1990s,the main fish predators of large zooplankton were plank-tivorous small pelagics, small American plaice, and capelin.e model for each time period (in t km−2 year−1 except
80 solution Mid-1990 solution Significancea
±S.D. Mean ±S.D.
106.00 276.09 105.76461.05 2018.27 385.40 *553.26 1423.04 381.53720.53 677.46 607.41279.99 717.49 250.72
0.14 1.99 0.07 *459.45 1971.37 440.01453.77 1483.24 419.57
82.79 355.68 47.02 *37.47 132.45 34.71
31) around the mean do not overlap between the two time periods,t-tests).
e c o l o g i c a l m o d e l l i n g 2 0 4 ( 2 0 0 7 ) 115–128 121
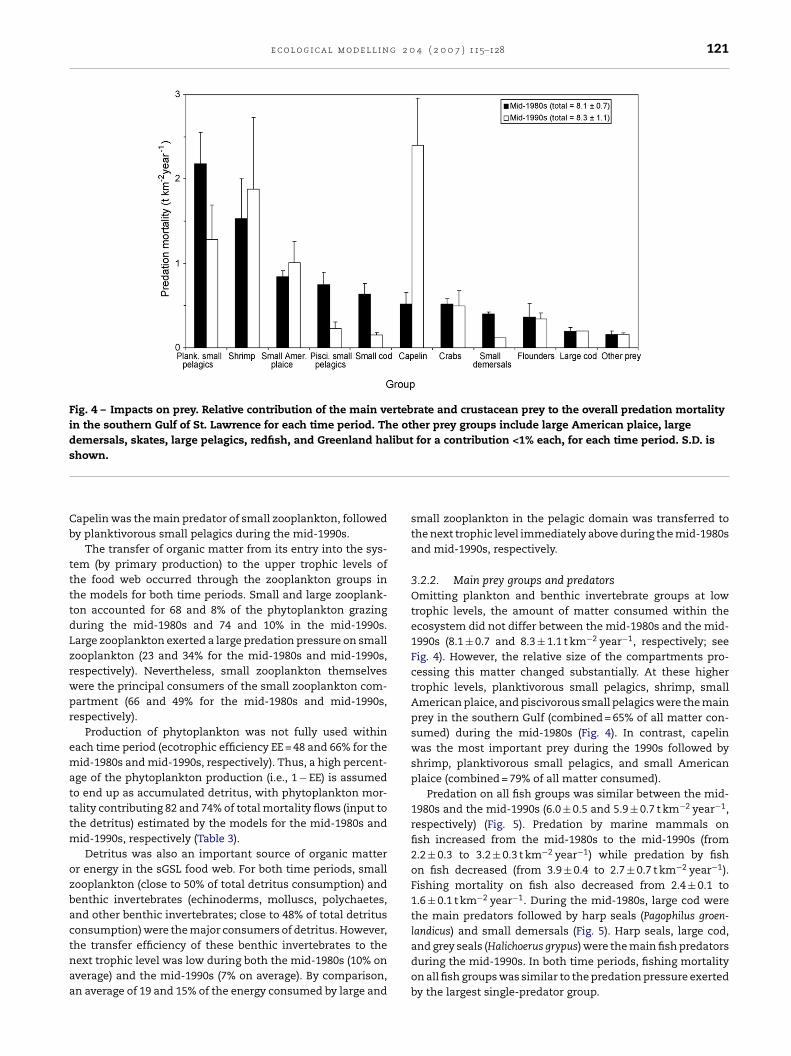
Fig. 4 – Impacts on prey. Relative contribution of the main vertebrate and crustacean prey to the overall predation mortalityin the southern Gulf of St. Lawrence for each time period. The other prey groups include large American plaice, largedemersals, skates, large pelagics, redfish, and Greenland halibut for a contribution <1% each, for each time period. S.D. iss
Cb
ttttdLzrwpr
ematttm
ozbactnaa
hown.
apelin was the main predator of small zooplankton, followedy planktivorous small pelagics during the mid-1990s.
The transfer of organic matter from its entry into the sys-em (by primary production) to the upper trophic levels ofhe food web occurred through the zooplankton groups inhe models for both time periods. Small and large zooplank-on accounted for 68 and 8% of the phytoplankton grazinguring the mid-1980s and 74 and 10% in the mid-1990s.arge zooplankton exerted a large predation pressure on smallooplankton (23 and 34% for the mid-1980s and mid-1990s,espectively). Nevertheless, small zooplankton themselvesere the principal consumers of the small zooplankton com-artment (66 and 49% for the mid-1980s and mid-1990s,espectively).
Production of phytoplankton was not fully used withinach time period (ecotrophic efficiency EE = 48 and 66% for theid-1980s and mid-1990s, respectively). Thus, a high percent-
ge of the phytoplankton production (i.e., 1 − EE) is assumedo end up as accumulated detritus, with phytoplankton mor-ality contributing 82 and 74% of total mortality flows (input tohe detritus) estimated by the models for the mid-1980s and
id-1990s, respectively (Table 3).Detritus was also an important source of organic matter
r energy in the sGSL food web. For both time periods, smallooplankton (close to 50% of total detritus consumption) andenthic invertebrates (echinoderms, molluscs, polychaetes,nd other benthic invertebrates; close to 48% of total detritusonsumption) were the major consumers of detritus. However,
he transfer efficiency of these benthic invertebrates to theext trophic level was low during both the mid-1980s (10% onverage) and the mid-1990s (7% on average). By comparison,n average of 19 and 15% of the energy consumed by large andsmall zooplankton in the pelagic domain was transferred tothe next trophic level immediately above during the mid-1980sand mid-1990s, respectively.
3.2.2. Main prey groups and predatorsOmitting plankton and benthic invertebrate groups at lowtrophic levels, the amount of matter consumed within theecosystem did not differ between the mid-1980s and the mid-1990s (8.1 ± 0.7 and 8.3 ± 1.1 t km−2 year−1, respectively; seeFig. 4). However, the relative size of the compartments pro-cessing this matter changed substantially. At these highertrophic levels, planktivorous small pelagics, shrimp, smallAmerican plaice, and piscivorous small pelagics were the mainprey in the southern Gulf (combined = 65% of all matter con-sumed) during the mid-1980s (Fig. 4). In contrast, capelinwas the most important prey during the 1990s followed byshrimp, planktivorous small pelagics, and small Americanplaice (combined = 79% of all matter consumed).
Predation on all fish groups was similar between the mid-1980s and the mid-1990s (6.0 ± 0.5 and 5.9 ± 0.7 t km−2 year−1,respectively) (Fig. 5). Predation by marine mammals onfish increased from the mid-1980s to the mid-1990s (from2.2 ± 0.3 to 3.2 ± 0.3 t km−2 year−1) while predation by fishon fish decreased (from 3.9 ± 0.4 to 2.7 ± 0.7 t km−2 year−1).Fishing mortality on fish also decreased from 2.4 ± 0.1 to1.6 ± 0.1 t km−2 year−1. During the mid-1980s, large cod werethe main predators followed by harp seals (Pagophilus groen-landicus) and small demersals (Fig. 5). Harp seals, large cod,
and grey seals (Halichoerus grypus) were the main fish predatorsduring the mid-1990s. In both time periods, fishing mortalityon all fish groups was similar to the predation pressure exertedby the largest single-predator group.
122 e c o l o g i c a l m o d e l l i n g 2 0 4 ( 2 0 0 7 ) 115–128
Fig. 5 – Impact of predators and fishing. Relative contribution of the main predators and fishing on overall mortality(excluding natural mortality other than predation) in the ecosystem for each time period. The other predators include skatesfor a 1.1% contribution and the other groups for a contribution <0.6% each for the mid-1980s and small cod for a 2.0%contribution, large pelagic for a 1.8% contribution, seabirds for a 1.6% contribution, and the other groups for a contribution
<0.6% each for the mid-1990s. S.D. is shown.3.2.3. Trophic links related to the main prey speciesPlanktivorous small pelagics (mainly Atlantic herring),shrimp, and capelin were among the main prey groups in
each time period (Fig. 4). During the mid-1980s, predation wasthe main cause of herring mortality (65% of total mortality;Table 4). Large cod was the main predator of planktivoroussmall pelagics, followed by harp seals (22 and 13% of totalTable 4 – Total Mortality (t km−2 year−1) and details of mortality
Group Total mortality P
Cetacea (%) Seals (%) L
Large cod 2.43 0 8Small cod 0.72 0 41Green. halibut 0.01 0 19Small Amer. plaice 1.40 0 11Large Amer. plaice 0.24 0 34Flounders 0.46 0 25Skates 0.02 0 48Redfish 0.01 22 19Large demersals 0.12 0 39Small demersals 0.42 0 10Capelin 0.55 7 49Large pelagics 0.01 41 27Pisci. small pelagics 1.14 8 11Plank. small pelagics 3.38 2 13Shrimp 1.69 0 6Crabs 0.93 0 0
Mean 5 23
mortality, respectively; Fig. 6 and Table 4). Two other preda-tors, large demersals and piscivorous small pelagic feeders,each accounted for 9% of the predation mortality of planktiv-
orous small pelagic feeders during the mid-1980s. From themid-1980s to mid-1990s, predation decreased from 2.2 ± 0.4 to1.3 ± 0.4 t km−2 year−1. Predation and fishing mortality were ofsimilar importance (each nearly 43% of total mortality) while(%) estimated for the mid-1980s
redation Fishing (%) Othercauses (%)
arge cod (%) Other predators (%)
0 0 45 4735 12 0 12
0 36 38 717 33 0 40
0 0 55 119 46 10 110 35 0 160 25 29 50 0 55 6
38 47 0 518 19 1 6
0 1 23 939 7 12 2322 28 28 734 51 0 928 28 39 5
15 23 21 14

e c o l o g i c a l m o d e l l i n g 2 0 4 ( 2 0 0 7 ) 115–128 123
Fig. 6 – Predation flows (t km−2 year−1) on main prey, capelin, planktivorous small pelagic feeders (mainly Atlantic herring),and shrimp, estimated for each time period. Size of arrows indicates flow strength. Several other predators were omittedhere. During the mid-1980s, seabirds accounted for 11% of the predation mortality of capelin while large demersals andpiscivorous small pelagic feeders accounted for 9% each of the predation mortality of planktivorous small pelagic feeders.During the mid-1990s, piscivorous small pelagic feeders accounted for 14% of the predation mortality of capelin while largedemersals accounted for 7% of the predation mortality of planktivorous small pelagic feeders. Piscivorous small pelagicfeeders also accounted for 10% of the predation mortality of shrimp during the mid-1990s.
Table 5 – Total Mortality (t km−2 year−1) and details of mortality (%) estimated for the mid-1990s
Group Totalmortality
Predation Fishing (%) Othercauses (%)
Cetacea (%) Seals (%) Large cod (%) Other predators (%)
Large cod 0.43 0 47 0 0 7 46Small cod 0.17 2 40 36 12 0 11Green. halibut 0.01 0 37 0 31 26 6Small Amer. plaice 1.44 0 11 48 11 0 30Large Amer. plaice 0.10 0 55 0 0 35 9Flounders 0.43 0 49 9 22 5 15Skates 0.01 0 66 0 11 4 19Redfish 0.01 43 34 0 5 13 5Large demersals 0.07 0 94 0 0 1 5Small demersals 0.12 0 53 0 42 0 5Capelin 3.25 4 48 5 16 0 26Large pelagics 0.04 12 43 0 0 30 14Pisci. small pelagics 0.44 18 19 7 7 33 15Plank. small pelagics 3.06 4 7 8 22 44 14Shrimp 2.82 0 1 9 56 0 33Crabs 0.97 0 1 3 47 37 12
Mean 5 38 8 18 15 17
i n g
124 e c o l o g i c a l m o d e l lother mortality causes accounted for 14%. Planktivorous smallpelagics were mainly consumed by large cod and large dem-ersals (8 and 7% of total mortality, respectively; Fig. 6 andTable 5). Other predators (piscivorous small pelagic feeders,cetacea, grey seals, and large pelagic feeders) accounted for 4%each of the predation mortality of planktivorous small pelagicfeeders during the mid-1990s.
Predation was also the main cause of total capelin mortal-ity during the mid-1980s (94.3% of total mortality; Table 4).Harp seals (43% of total mortality) were the main preda-tors followed by large cod and seabirds (18 and 11% oftotal mortality, respectively) (Fig. 6). Predation mortalityincreased from 0.5 ± 0.1 t km−2 year−1 during the mid-1980s to2.9 ± 0.6 t km−2 year−1 during the mid-1990s. Predation dom-inated total mortality (73.0% of total mortality) during themid-1990s. Harp seals (43% of total mortality) were the mainpredators followed by piscivorous small pelagics, grey seals,and large cod (14, 5, and 5% of total mortality, respectively)(Fig. 6).
During the mid-1980s, predation was the main cause ofshrimp mortality (91% of total mortality; Table 4). Large cod(34% of total mortality) was the main shrimp predator dur-ing the mid-1980s, followed by small cod and small Americanplaice (14 and 10% of total mortality, respectively) (Fig. 6).During the mid-1990s, predation dominated total mortality(67% of total mortality) (Table 5). Small American plaice, pis-civorous small pelagic feeders, and large cod were the mainshrimp predators (20, 10, and 9% of total mortality, respec-tively) (Fig. 6).
Large cod were the main predators of small cod followedby harp and grey seals for both periods (Tables 4 and 5). Thesethree predators accounted for 75 and 71%, respectively, of totalmortality on small cod during the mid-1980s and mid-1990s.The main predators of large cod were grey and harp seals inboth time periods (Fig. 6 and Tables 4 and 5). However, whenall mortality causes were considered, predation accounted forat most 47% of the total mortality on large cod (Tables 4 and 5).
3.2.4. Sources of mortality (fishing, predation, and othermortality) on fish, shrimp, and crabsPredation mortality dominated (close to 65%) total mortalityprocesses for most fishes and shrimp during the mid-1980s,excluding large cod, large American plaice, and large dem-ersals (Table 4). For large cod, fishing and other mortalitycauses each accounted for about 46% of the total mortalitywhile predation accounted for 8% of the total mortality. Forlarge American plaice and large demersals, fishing was themost important source of mortality during the mid-1980s. Inthe case of small American plaice, however, other mortalitycauses represented 40% of total mortality. A large part of thisother mortality could be related to unreported catches. Indeed,the American plaice fishery in the southern Gulf involvesa considerable discarding of fish below market size duringsome periods such as the 1980s (Tallman, 1991 and referencestherein).
For all groups, predation by fish in the mid-1980s repre-
sented on average 38% of the total mortality (predation by largecod: 15%) while predation by marine mammals accounted for28% (5 and 23% for cetacea and seals, respectively) (Table 4).Predation by large cod was an important source of mortal-2 0 4 ( 2 0 0 7 ) 115–128
ity for small cod, small American plaice, small demersals,capelin, small pelagics, shrimp and crabs. Seals were the mainpredators of large American plaice (harp seals: 27% of totalmortality), skates (grey seals: 48% of total mortality), largedemersals (harp and grey seals: 15 and 24% of total mortality),and capelin (harp seals: 43% of total mortality). Moreover, sealswere important predators of cod, Greenland halibut (Rein-hardtius hippoglossoides), flounders, redfish, and large pelagics(Table 4). Cetacea were important predators of redfish andlarge pelagics. Fishing was an important source of mortal-ity for large cod, Greenland halibut, large American plaice,flounders, redfish, large demersals, large pelagic feeders, smallpelagics, and crabs (>10% of total mortality). When calculatedacross all groups, fishing and other mortality causes repre-sented on average 21 and 14% of total mortality, respectively.
During the mid-1990s, predation was the dominant sourceof mortality on all fishes except for planktivorous small pelag-ics (Table 5). For planktivorous small pelagics, fishing andpredation mortality accounted for similar proportions of totalmortality (each close to 43%), while other mortality accountedfor 14%. For large cod, predation accounted for 47% of the totalmortality during the mid-1990s, but a similar portion of totalmortality (46%) was from other mortality causes. On average,predation by marine mammals represented 43% of total mor-tality (5 and 38% for cetacea and seals, respectively) whilepredation by fish accounted for 26% (predation by large cod:8%). Cetacea continued to be important predators of redfishand large pelagics. Predation by seals was the main identifi-able source of mortality for large cod, large American plaice,skates, large demersals, and capelin, and a major componentof the total mortality of Greenland halibut, flounders, redfish,small demersals, and large pelagics. Seals were also significantpredators of small cod, small American plaice and small pelag-ics. Predation by large cod was the largest source of mortalityfor small cod, small American plaice, and an important mor-tality source for flounders, small pelagics, and shrimp. Fishingand other mortality causes represented on average 16% eachof total mortality. Fishing continued to be an important sourceof mortality for Greenland halibut, large American plaice, red-fish, large and small pelagics, and crabs.
4. Discussion
4.1. Main changes in the ecosystem structure from themid-1980s to the mid-1990s
In the northern Gulf, dramatic declines in the biomass oflarge-bodied demersal predators occurred between the mid-1980s and the mid-1990s. For example, Atlantic cod declined15-fold, redfish 8-fold, and large demersals 4-fold (Morissetteet al., 2003; Savenkoff et al., 2004c). These declines were lessdramatic in the southern Gulf, where large cod declined three-fold and large American plaice declined two-fold. Over thesame time period, the biomass of marine mammals increasedsignificantly (nearly two-fold) while biomass of forage fishes
changed little in the two ecosystems. These changes in thesouthern Gulf ecosystem were accompanied by a decreasein total catches of about 30% and a transition in landingsfrom long-lived piscivorous groundfish toward planktivorous
g 2 0
pGSG1Riafi1fTw
m1fi1Timt
otfisasbsttsemmsp21lcm(ctsct
4l
Odpttw
e c o l o g i c a l m o d e l l i n
elagic fish. A similar trend was observed in the northernulf over the same period of time (Morissette et al., 2003;avenkoff et al., 2004c). However, total exports in the northernulf decreased much more (by a factor of 4) from the mid-980s (1.83 t km−2 year−1) to mid-1990s (0.48 t km−2 year−1).eported cod landings accounted for 61% of the total fishery
n the northern Gulf during the mid-1980s while forage fishnd invertebrates represented only 21% of total exports. Theshery in the southern Gulf was more diverse during the mid-980s, with only 39% of total exports represented by cod whileorage fish and invertebrates represented 52% of total exports.hus, the decline in total exports when cod stocks collapsedas lower in the southern Gulf than in the northern Gulf.
Piscivory is the largest source of fish removals in mostarine ecosystems, usually larger than fishing mortality (Bax,
998; Link and Garrison, 2002). Predation mortality exceededshing mortality for most groups in the sGSL during the mid-980s except for large cod, large plaice, and large demersals.he relative importance of fishing mortality was much dimin-
shed in the mid-1990s: predation mortality exceeded fishingortality for all fish compartments of the model except plank-
ivorous small pelagics (herring).Overfishing in the late 1980s greatly reduced the abundance
f a functional group, large piscivorous fish, in the sGSL andhey have not recovered 12 years after the cessation of heavyshing. Our analyses indicate that the ecosystem structurehifted dramatically from one where piscivorous groundfishnd small-bodied forage species (e.g., capelin, herring, andhrimp) occurred in similar proportions to one now dominatedy small-bodied forage species. The predator structure of theouthern Gulf ecosystem has also changed markedly. Duringhe mid-1980s, large cod, harp seals, and small demersals werehe main predators of fish while harp seals, large cod, and greyeals were the main predators during the mid-1990s. The mod-ls indicate that predation by fish on fish decreased from theid-1980s to the mid-1990s while predation by marine mam-als on fish increased. A similar change in the ecosystem
tructure of the adjacent northern Gulf was observed. There,redation by marine mammals increased from 1.5 ± 0.2 to.1 ± 0.3 t km−2 year−1 while predation by fish decreased from5.9 ± 2.9 to 1.9 ± 0.4 t km−2 year−1 (Savenkoff et al., unpub-ished data). Due to the drastic decline in the biomass of largeod (from 3.9 to 0.3 t km−2), seals replaced large cod as theain predators in the northern Gulf during the mid-1990s
Savenkoff et al., unpublished data). In contrast, although preyonsumption by seals increased between the mid-1980s andhe mid-1990s, large cod remained one of the most importantingle predators on fish in the southern Gulf, although theombined prey consumption of harp and grey seals did exceedhat of large cod.
.2. Effects of ecosystem changes in the lower trophicevels
ur models did not detect any change in the primary pro-uction between the two time periods and estimated a high
ercentage of the phytoplankton production entered the detri-al pool. This partial use of phytoplankton production andhe high proportion of small zooplankton cannibalism agreeith the generally accepted view that the lower trophic web is4 ( 2 0 0 7 ) 115–128 125
largely a recycling loop (Moloney et al., 1991; Legendre and LeFevre, 1995). Secondary production increased from the mid-1980s to the mid-1990s mainly due to an increase in thepredation by capelin on small zooplankton. This is consistentwith a similar increase in biomass of capelin in the two timeperiods.
Even though echinoderms, molluscs, polychaetes, andother benthic invertebrates dominated the biomass densityin the southern Gulf (173 t km−2; Savenkoff et al., 2004b), theseanimals acted as a large energy sink that is only partly linkedto the demersal fish and crab groups. However, our results mayunderestimate the size and importance of the detrital/infaunafood web and the transfer of matter from benthic invertebratesto the next trophic levels because the shallow water zoneswere excluded from the models and the biomass of infaunahas never been quantified in the sGSL (values used in ourmodels were derived from other ecosystems). In similar bot-tom habitat of the adjacent eastern Scotian Shelf ecosystem,the average biomass of large bivalves (mainly northern propel-lor clam Cyrtodaria siliqua) exceeds 2100 g m−2 (or 2100 t km−2)while the biomass of other infauna (mainly amphipods, poly-chaetes, sea cucumbers, and brittle stars) ranged between 234and 554 g m−2 (Gilkinson et al., 2005). There is no reason toassume that the biomass of large bivalves and infauna in thesGSL (where there is no offshore clam fishery) would be ordersof magnitude less than that on the eastern Scotian Shelf. Incontrast, the total biomass in the upper trophic level groupsfor the sGSL was only 27–34 g m−2 (Table 2), illustrating therelative size of the two biomass pools. A lack of informa-tion on the size of the infauna community is a weakness ofnearly all ecosystem mass-balance models and undoubtedlycontributes to some of the uncertainty in the model outputs.
4.3. Effects of ecosystem changes on forage species
The shift from an ecosystem dominated by large piscivorousfish to one dominated by relatively short-lived pelagic speciesdocumented in the sGSL (this study) has also been reportedfrom other Atlantic, Baltic, and coastal ecosystems (Jacksonet al., 2001; Link and Garrison, 2002; Worm and Myers, 2003;Frank et al., 2005). In these systems, declines in cod stockswere accompanied by increases in catches and abundance ofbenthic crustaceans such as northern shrimp (Pandalus bore-alis) and snow crabs (Chionocetes opilio). Various hypotheseshave been proposed to explain the increase in abundance ofbenthic prey species, including: changes in ocean temperature(which might affect cod and crustaceans differently); releasefrom cod predation (and possibly other large demersal fishes);or both (Anderson, 2000; Berenboim et al., 2000; Koeller, 2000;Lilly et al., 2000). Elsewhere, when the abundance of large pis-civores decreased dramatically, the populations of their prey(e.g., capelin, herring, and sprat Sprattus sprattus) increasedexplosively (Lilly, 1991; Garrison and Link, 2000; Koster et al.,2001). These changes may trigger feedback effects such asincreased predation on cod eggs and larvae that could inhibitrecovery of cod, resulting in a permanently changed food web
(Koster and Mollmann, 2000; Swain and Sinclair, 2000; Waltersand Kitchell, 2001).Biomass of both piscivorous (mainly Atlantic mackerel)and planktivorous (mainly Atlantic herring) small pelagics
i n g
126 e c o l o g i c a l m o d e l ldecreased from the mid-1980s to mid-1990s in the sGSL(Table 2). In contrast, the capelin population increased and hasshown a significant expansion in geographical distribution inthe entire Gulf of St. Lawrence during the same time period(DFO, 2001; Savenkoff et al., 2004d). Increased capelin abun-dance is typically associated with lower than normal oceantemperatures but not with warmer than normal conditions(Frank et al., 1996). Consistent with this hypothesis, the Gulfof St. Lawrence has experienced abnormally low water tem-perature conditions, particularly between 1990 and 1995 in thesGSL (Drinkwater et al., 1995). Consistent with the observedincrease in capelin abundance, its contribution to the diets ofsmall cod, large cod, and mackerel also increased (Savenkoffet al., 2004b).
In the sGSL, the models estimated a substantial changein the diets of seals between the mid-1980s and the mid-1990s. The proportion of small cod in the diet compositionsof harp and grey seals decreased from 10 to 1% and from 21to 4%, respectively, while the proportions of capelin increasedsharply in the diet of harp (from 13 to 76%) and grey (from 6 to18%) seals (Savenkoff et al., 2004b). This diet shift is consistentwith observed changes in the relative abundance of the twoprey species from the mid-1980s to the mid-1990s (decrease incod biomass and increase in capelin biomass). However, theswitch cannot be confirmed by observations of seal diets dueto a lack of diet data in the 1980s. A similar change in preyfrom juvenile cod to capelin was also estimated in the dietcompositions of seals in the northern Gulf models (Savenkoffet al., 2004c).
Fishing mortality on herring and mackerel increased withtime in the sGSL. Fishing was the main mortality source forherring in each time period and for mackerel for the mid-1990s. Increases in fishing mortality on forage fishes in thesGSL seems to have countered the expected increases inbiomass of these species following the net decrease in pre-dation by piscivorous fishes. In contrast, at only 1% of totalmortality, fishing has a trivial effect on the mid-1990s capelinpopulation (Savenkoff et al., 2004d).
4.4. Why have cod populations failed to recoverfollowing the cessation of directed fishing?
Cod populations collapsed in most areas of the NorthwestAtlantic in the early 1990s largely as a result of overfishing(Sinclair and Murawski, 1997). Most of these populations havefailed to recover despite moratoria on directed fishing. Thisfailure to recover reflects a disturbing decline in the produc-tive capacity of these populations (Shelton et al., 2006). Animportant component of this decline in productive capacityis an increase in the natural mortality of adult cod (Shelton etal., 2006). Ecosystem change, partly caused by overfishing, likethat reported here and in neighbouring ecosystems (Savenkoffet al., 2004a; Frank et al., 2005), may be a cause of this changein natural mortality.
Increased predation by grey seals may contribute to theincrease in natural mortality adult cod in the sGSL (Chouinard
et al., 2005). In our models, increased seal biomass did notresult in an elevated mortality rate of juvenile cod because of achange in prey from high consumption of juvenile cod to highconsumption of capelin, consistent with observed changes in2 0 4 ( 2 0 0 7 ) 115–128
the abundance of the two prey species. However, predation byseals increased from 8 to 47% of the total mortality of large codaccording to the models, although absolute values were sim-ilar (0.20 t km−2 year−1). Predation by seals and fishing werethe main sources of mortality on large cod identified in ourmodels. Fishing dominated the mortality sources in the 1980smodel while predation by seals dominated in the 1990s model.In models for both time periods, however, a high proportion(47%) of the total mortality of large cod could not be explainedby either fishing or predation. Savenkoff et al. (2004a) obtaineda similar result in the mid-1980s model of the northern Gulfand attributed much of this unexplained mortality to unre-ported catch. Unreported catch may have been an importantcomponent of cod mortality in the sGSL in the mid-1980s, butis unlikely to have been substantial in the mid-1990s whenfishing activity was very low.
It also seems unlikely that our models underestimate pre-dation on cod by seals, their main predators in our models. Theseal diets in our model solutions contained high proportionsof cod compared to findings in other areas (Benoit and Bowen,1990a,b; Mohn and Bowen, 1996; Hammill and Stenson, 2002).The high other mortality of large cod may be partly attributableto underestimated predation by cetaceans (Folkow et al., 2000)or other potential predators such as large sharks. Unfortu-nately, information on abundance and diets for both groupsis lacking. To account for the other mortality, however, largecod would have to represent >50% of the biomass eaten by allcetaceans combined—an unlikely occurrence.
Other potential sources of mortality include starvation, dis-ease, parasites, and toxic contaminants. Recent work suggeststhat a decline in condition and energy reserves may haveresulted in increased natural mortality of cod in the northernGulf of St. Lawrence stock in response to oceanic cooling inthe late 1980s and early 1990s (Lambert and Dutil, 1997; Dutiland Lambert, 2000). However, despite this oceanic cooling, theambient temperature of cod during the feeding season wasrelatively warm in the sGSL in the early to mid-1990s (Swain,1999). On the other hand, the fall migration of southern Gulfcod from their feeding to their overwintering grounds occurredearlier in the 1990s than in the 1980s (Comeau et al., 2002),whereas their return migration in spring was delayed by lateice melt in the early to mid 1990s (Sinclair and Currie, 1994).These changes in migration timing resulted in a longer winter-fast period in the early to mid 1990s (Castonguay et al., 1999)and may have led to unusually low energy reserves during thespring migration and subsequent spawning period.
In summary, overfishing in the late 1980s appeared to havebeen sufficient to explain the impending decline of demer-sal stocks, but seals, as significant predators of both adultand juvenile cod (as well as other large piscivorous species)during the mid-1990s, could play a role in the non-recoveryof cod. However, much of the mortality of large cod couldnot be attributed to fishing or predation in our models. Muchof the mortality of large cod appears to be due to processesnot accounted for in our models. Nevertheless, the changesin top-predator abundance driven by human exploitation of
selected species resulted in a major perturbation of the struc-ture and functioning in the southern Gulf ecosystem thathas had profound effects on the fishery and the livelihood ofharvesters.
g 2 0
A
T(wamacW(itc
A
Si
r
A
B
B
B
B
B
C
C
C
C
D
e c o l o g i c a l m o d e l l i n
cknowledgements
his study was carried out as a contribution of CDEENAComparative Dynamics of Exploited Ecosystems in the North-est Atlantic, see web site at http://www.osl.gc.ca/cdeena/en/ccueil.shtml.), a program supported by the Canadian Depart-ent of Fisheries and Oceans (Science Strategic Fund). We
re grateful to Simon-Pierre Despatie, Hugues Benoıt, andolleagues who made data available for this manuscript.e thank Andre Gosselin for access to computing resources
Unix server). CS particularly thanks Alain Vezina for hisnverse method expertise during the past 10 years. We wisho acknowledge two anonymous referees for their thoughtfulomments on the manuscript.
ppendix A. Supplementary data
upplementary data associated with this article can be found,n the online version, at doi:10.1016/j.ecolmodel.2006.12.029.
e f e r e n c e s
nderson, J., 2000. Pandalid shrimp as indicators of ecosystemregime shift. J. Northwest Atl. Fish. Sci. 27, 1–10.
ax, N.J., 1998. The significance and prediction of predation inmarine fisheries. ICES J. Mar. Sci. 55, 997–1030.
enoit, D., Bowen, W.D., 1990a. Seasonal and geographic variationin the diet of grey seals (Halichoerus grypus) in eastern Canada.In: Bowen, W.D. (Ed.), Population biology of the sealworm(Pseudoterranova decipiens) in relation to its intermediate andseal hosts. Can. Bull. Fish. Aquat. Sci. 222, 25–226.
enoit, D., Bowen, W.D., 1990b. Summer diet of grey seals(Halichoerus grypus) at Anticosti Island, Gulf of St. Lawrence,Canada. In: Bowen, W.D. (Ed.), Population biology of thesealworm (Pseudoterranova decipiens) in relation to itsintermediate and seal hosts. Can. Bull. Fish. Aquat. Sci. 222,227–242.
erenboim, B.I., Dolgov, A.V., Korzhev, V.A., Yaragina, N.A., 2000.The impact of cod on the dynamics of Barents Sea shrimp(Pandalus borealis) as determined by multispecies models. J.Northwest Atl. Fish. Sci. 27, 69–75.
rowman, H.I., Stergiou, K.I., 2004. Perspectives onecosystem-based approaches to the management of marineresources. Mar. Ecol. Prog. Ser. 274, 269–303.
AFSAC, 1994. Report on the status of groundfish stocks in theCanadian Northwest Atlantic. DFO Atl. Fish. Stock Status Rep.,94/4.
astonguay, M., Rollet, C., Frechet, A., Gagnon, P., Gilbert, D.,Brethes, J.-C., 1999. Distribution changes of Atlantic cod(Gadus morhua L.) in the northern Gulf of St. Lawrence inrelation to an oceanic cooling. ICES J. Mar. Sci. 56, 333–344.
houinard, G.A., Swain, D.P., Hammill, M.O., Poirier, G.A., 2005.Covariation between grey seal (Halichoerus grypus) abundanceand natural mortality of cod (Gadus morhua) in the southernGulf of St. Lawrence. Can. J. Fish. Aquat. Sci. 62, 1991–2000.
omeau, L.A., Campana, S.E., Chouinard, G.A., 2002. Timing of
Atlantic cod (Gadus morhua L.) seasonal migrations in thesouthern Gulf of St Lawrence: interannual variability andproximate control. ICES J. Mar. Sci. 59, 333–351.FO, 2001. Capelin of the Estuary and Gulf of St. Lawrence.DFO-Science, Stock Status Rep., B4-03.
4 ( 2 0 0 7 ) 115–128 127
Drinkwater, K.F., Colbourne, E., Gilbert, D., 1995. Overview ofenvironmental conditions in the northwest Atlantic in 1994.NAFO SCR Doc., No. 95/43. North Atlantic FisheriesOrganization, Dartmouth, NS.
Dutil, J.-D., Lambert, Y., 2000. Natural mortality from poorcondition in Atlantic cod (Gadus morhua). Can. J. Fish. Aquat.Sci. 57, 826–836.
Folkow, L.P., Haug, T., Nilssen, K.T., Nordoey, E.S., 2000. Estimatedfood consumption of minke whales Balaenoptera acutorostratain Northeast Atlantic waters in 1992–1995. In: Vikingsson,G.A., Kapel, F.O. (Eds.), Minke Whales, Harp and Hooded Seals:Major Predators in the North Atlantic Ecosystem, vol. 2.Nammco Sci. Pub., pp. 65–80.
Frank, K.T., Petrie, B., Choi, J.S., Leggett, W.C., 2005. Trophiccascades in a formerly cod-dominated ecosystem. Science308, 1621–1623.
Frank, K.T., Carscadden, J.E., Simon, J.E., 1996. Recent excursionsof capelin (Mallotus villosus) to the Scotian Shelf and FlemishCap during anomalous hydrographic conditions. Can. J. Fish.Aquat. Sci. 53, 1473–1486.
Fulton, E.A., Smith, A.D.M., Johnson, C.R., 2003. Effect ofcomplexity on marine ecosystem models. Mar. Ecol. Prog. Ser.253, 1–16.
Garrison, L.P., Link, J., 2000. Fishing effects on spatial distributionand trophic guild structure in the Georges Bank fishcommunity. ICES J. Mar. Sci. 57, 723–730.
Gilkinson, K.D., Gordon jr, D.C., MacIsaac, K.G., McKeown, D.L.,Kenchington, E.L.R., Bourbonnais, C., Vass, W.P., 2005.Immediate impacts and recovery trajectories of macrofaunalcommunities following hydraulic clam dredging onBanquereau, eastern Canada. ICES J. Mar. Sci. 62, 925–947.
Hammill, M.O., Stenson, G.B., 2002. Estimated consumption ofAtlantic cod (Gadus morhua) and some other prey by grey seals(Halichoerus grypus) and harp seals (Phoca groenlandica) in thesouthern Gulf of St. Lawrence (NAFO Division 4T). DFO Can.Sci. Advis. Sec. Res. Doc., 2002/054.
Hollowed, A.B., Bax, N., Beamish, R., Collie, J., Fogarty, M.,Livingston, P., Pope, J., Rice, J.C., 2000. Are multispecies modelsan improvement on single-species models for measuringfishing impacts on marine ecosystems? ICES J. Mar. Sci. 57,707–719.
Hurlbut, T., Poirier, G.A., Swain, D.P., Benoıt, H.P., Chouinard, G.A.,LeBlanc, C., 2003. Preliminary results from the 2002bottom-trawl survey of the southern Gulf of St. Lawrence. DFOCan. Sci. Advis. Sec. Res. Doc., 2003/006.
Jackson, J.B.C., Kirby, M.X., Berger, W.H., Bjorndal, K.A., Botsford,L.W., Bourque, B.J., Bradbury, R.H., Cooke, R., Erlandson, J.,Estes, J.A., Hughes, T.P., Kidwell, S., Lange, C.B., Lenihan, H.S.,Pandolfi, J.M., Peterson, C.H., Steneck, R.S., Tegner, M.J.,Warner, R.R., 2001. Historical overfishing and the recentcollapse of coastal ecosystems. Science 293, 629–638.
Koeller, P., 2000. Relative importance of abiotic and biotic factorsto the management of the Northern shrimp (Pandalus borealis)fishery on the Scotian Shelf. J. Northwest Atl. Fish. Sci. 27,37–50.
Koster, F.W., Hinrichsen, H.-H., St.John, M.A., Schnack, D.,MacKenzie, B.R., Tomkiewicz, J., Plikshs, M., 2001. DevelopingBaltic cod recruitment models. I. Incorporation ofenvironmental variability and species interactions. Can. J.Fish. Aquat. Sci. 58, 1534–1556.
Koster, F.W., Mollmann, C., 2000. Trophodynamic control byclupeid predators on recruitment success in Baltic cod? ICES J.Mar. Sci. 57, 310–323.
Koutitonsky, V.G., Bugden, G.L., 1991. The physical oceanography
of the Gulf of St. Lawrence: a review with emphasis on thesynoptic variability of the motion. In: Therriault, J.-C. (Ed.),The Gulf of St. Lawrence: small ocean or big estuary? Can.Spec. Publ. Fish. Aquat. Sci. 113, 57–90.
i n g
128 e c o l o g i c a l m o d e l lLambert, Y., Dutil, J.-D., 1997. Condition and energy reserves ofAtlantic cod (Gadus morhua) during the collapse of thenorthern Gulf of St. Lawrence stock. Can. J. Fish. Aquat. Sci.54, 2388–2400.
Legendre, L., Le Fevre, J., 1995. Microbial food webs and the exportof biogenic carbon in oceans. Aquat. Microb. Ecol. 9, 69–77.
Lilly, G.R., 1991. Interannual variability in predation by cod (Gadusmorhua) on capelin (Mallotus villosus) and other prey offsouthern Labrador and northeastern Newfoundland. ICESMar. Sci. Symp. 193, 133–146.
Lilly, G.R., Parsons, D.G., Kulka, D.W., 2000. Was the increase inshrimp biomass on the Northeast Newfoundland Shelf aconsequence of a release in predation pressure from cod? J.Northwest Atl. Fish. Sci. 27, 45–61.
Link, J.S., Garrison, L.P., 2002. Changes in piscivory associatedwith fishing induced changes to the finfish community onGeorges Bank. Fish. Res. 55, 71–86.
Mohn, R., Bowen, W.D., 1996. Grey seal predation on the easternScotian Shelf: modelling the impact on Atlantic cod. Can. J.Fish. Aquat. Sci. 53, 2722–2738.
Moloney, C.L., Field, J.G., Lucas, M.I., 1991. The size-baseddynamics of plankton food webs. II. Simulations of threecontrasting southern Benguela food webs. J. Plankton Res. 13,1039–1092.
Morissette, L., Despatie, S.-P., Savenkoff, C., Hammill, M.O.,Bourdages, H., Chabot, D., 2003. Data gathering and inputparameters to construct ecosystem models for the northernGulf of St. Lawrence (mid-1980s). Can. Tech. Rep. Fish. Aquat.Sci., no. 2497.
Rice, J., Rivard, D., 2003. Proceedings of the zonal assessmentmeeting—Atlantic cod. Can. Stock Assess. Sec. Proc. Ser.,2003/021.
Savenkoff, C., Vezina, A.F., Smith, P.C., Han, G., 2001. Summertransports of nutrients in the Gulf of St. Lawrence estimatedby inverse modelling. Estuar. Coast. Shelf Sci. 52, 565–587.
Savenkoff, C., Castonguay, M., Vezina, A.F., Despatie, S.-P.,Chabot, D., Morissette, L., Hammill, M.O., 2004a. Inversemodelling of trophic flows through an entire ecosystem: thenorthern Gulf of St. Lawrence in the mid-1980s. Can. J. Fish.Aquat. Sci. 61, 2194–2214.
Savenkoff, C., Bourdages, H., Swain, D.P., Despatie, S.-P., Hanson,J.M., Methot, R., Morissette, L., Hammill, M.O., 2004b. Input
data and parameter estimates for ecosystem models of thesouthern Gulf of St. Lawrence (mid-1980s and mid-1990s).Can. Tech. Rep. Fish. Aquat. Sci., no. 2529.Savenkoff, C., Bourdages, H., Castonguay, M., Morissette, L.,Chabot, D., Hammill, M.O., 2004c. Input data and parameter
2 0 4 ( 2 0 0 7 ) 115–128
estimates for ecosystem models of the northern Gulf of St.Lawrence (mid-1990s). Can. Tech. Rep. Fish. Aquat. Sci., no.2531.
Savenkoff, C., Gregoire, F., Chabot, D., 2004d. Main prey andpredators of capelin (Mallotus villosus) in the northern andsouthern Gulf of St. Lawrence during the mid-1980s andmid-1990s. Can. Tech. Rep. Fish. Aquat. Sci., no. 2551.
Shelton, P.A., Sinclair, A.F., Chouinard, G.A., Mohn, R., Duplisea,D.E., 2006. Fishing under low productivity conditions is furtherdelaying recovery of Northwest Atlantic cod (Gadus morhua).Can. J. Fish. Aquat. Sci. 63, 235–238.
Sinclair, A.F., Currie, L., 1994. Timing of cod migrations into andout of the Gulf of St. Lawrence based on commercial fisheries,1986–1993. DFO Atl. Fish. Res. Doc., 94/47.
Sinclair, A.F., Murawski, S.A., 1997. Why have groundfish stocksdeclined? In: Boreman, J., Nakashima, B.S., Wilson, J.A.,Kendall, R.L. (Eds.), Northwest Atlantic Groundfish:Perspectives on a Fishery Collapse. American FisheriesSociety, Bethesda, MD, pp. 71–93.
Swain, D.P., 1999. Changes in the distribution of Atlantic cod(Gadus morhua) in the southern Gulf of St. Lawrence—effectsof environmental change or change in environmentalpreferences? Fish. Oceanogr. 8, 1–17.
Swain, D.P., Castonguay, M., 2000. Final report of the 2000 annualmeeting of the Fisheries Oceanography Committee includingthe report of the workshop on the cod recruitment dilemma.DFO Can. Stock Assess. Sec. Proc. Ser., 2000/17.
Swain, D.P., Sinclair, A.F., 2000. Pelagic fishes and the codrecruitment dilemma in the Northwest Atlantic. Can. J. Fish.Aquat. Sci. 57, 1321–1325.
Tallman, R.F., 1991. Causes of within-season decline in the size atage of American plaice, Hippoglossoides platessoides. In:Therriault, J.-C. (Ed.), The Gulf of St. Lawrence: small ocean orbig estuary? Can. Spec. Publ. Fish. Aquat. Sci. 113, 269–275.
Vezina, A.F., Platt, T., 1988. Food web dynamics in the ocean. I.Best-estimates of flow networks using inverse methods. Mar.Ecol. Prog. Ser. 42, 269–287.
Walters, C.J., Kitchell, J.F., 2001. Cultivation/depensation effectson juvenile survival and recruitment: a serious flaw in thetheory of fishing? Can. J. Fish. Aquat. Sci. 58, 39–50.
Whipple, S.J., Link, J.S., Garrison, L.P., Fogarty, M.J., 2000. Models of
predation and fishing mortality in aquatic ecosystems. FishFish. 1, 22–40.Worm, B., Myers, R.A., 2003. Meta-analysis of cod-shrimpinteractions reveals top–down control in oceanic food webs.Ecology 84, 162–173.