Sustainable forest use in Brazilian extractive reserves: Natural regeneration of Brazil nut in...
15
Sustainable forest use in Brazilian extractive reserves: Natural regeneration of Brazil nut in exploited populations L.H.O. Wadt a , K.A. Kainer b,c, *, C.L. Staudhammer b , R.O.P. Serrano d a Centro de Pesquisa Agroflorestal do Acre (Embrapa Acre), BR-364, Km 14, Rio Branco, Acre 69901-108, Brazil b School of Forest Resources and Conservation, P.O. Box 110410, University of Florida, Gainesville, FL 32611, USA c Center for Latin American Studies, Tropical Conservation and Development Program, University of Florida, Gainesville, FL 32611, USA d Universidade Federal do Acre (UFAC), Rodovia BR-364, Km 04, Rio Branco, Acre 69915-900, Brazil ARTICLE INFO Article history: Received 16 March 2007 Received in revised form 10 October 2007 Accepted 16 October 2007 Keywords: Amazon Bertholletia excelsa Demography Fruit fate Managed resource protected area Non-timber forest product Seed harvest ABSTRACT The emergence of Brazilian extractive reserves reinforced the notion that sustainable forest use could play a central role in conservation. Brazil nut is considered a model non-timber product for promoting conservation through use. Demographic studies, however, have demonstrated differential impacts of nut harvest on Brazil nut population structure. Com- paring three populations with different forest use histories, degrees of road access, and recent levels of nut harvest, we asked: (1) Are they exhibiting regeneration failure? and (2) Are seedling/sapling densities explained by adult Brazil nut structure, fruit fate and/or overall forest structure? We installed four 9-ha plots in each site to census Brazil nut trees P10 cm dbh, and within each plot, 36 subplots (25 · 25 m each) to quantify regeneration, overall forest structure, and open and closed fruit counts. Approximately 29–55% of fruits was unharvested, and more than 90% of these was opened by scatterhoarding dispersers. Population structure approximated a reverse-J size class distribution, with seedling densi- ties varying from 3.2 to 5.8 individuals ha 1 . We conclude that within the current harvest context, regeneration is sufficient for population persistence in our sites, at least over the medium term. The socioeconomics of sustainably managing Brazil nut is the greater challenge, involving interlinked competitive land uses, nut quality, and substantial increases in local income from harvest. Some of these challenges are being addressed in Brazil, Bolivia and Peru, providing hope that this cornerstone extractive species will con- tinue to play a prominent role in the ecological and economic landscape of Amazonia. Ó 2007 Elsevier Ltd. All rights reserved. 1. Introduction The expansion of the IUCN (World Conservation Union) pro- tected area classification system to include Category VI (man- aged resource protected areas) in 1994, underscored the limitations of relying solely on strict protected areas for global nature conservation. Category VI was created, in large part, to accommodate and recognize the emergence of Extractive Re- serves (RESEX) in the Brazilian Amazon, reinforcing the grow- ing notion that local communities could play a central role in conservation strategies through promotion of sustainable for- est use (Maretti, 2005). Originating from the rubber tapper so- cial movement in Acre, Brazil, Extractive Reserves are government-owned protected areas designated for sustain- 0006-3207/$ - see front matter Ó 2007 Elsevier Ltd. All rights reserved. doi:10.1016/j.biocon.2007.10.007 * Corresponding author: Address: School of Forest Resources and Conservation, 210 Newins-Ziegler Hall, P.O. Box 110410, University of Florida, Gainesville, FL 32611, USA. Tel.: +1 352 846 0833. E-mail addresses: [email protected] (L.H.O. Wadt), kkainer@ufl.edu (K.A. Kainer), [email protected]fl.edu (C.L. Staudhammer), [email protected] (R.O.P. Serrano). BIOLOGICAL CONSERVATION 141 (2008) 332 – 346 available at www.sciencedirect.com journal homepage: www.elsevier.com/locate/biocon
-
Upload
independent -
Category
Documents
-
view
0 -
download
0
Transcript of Sustainable forest use in Brazilian extractive reserves: Natural regeneration of Brazil nut in...
B I O L O G I C A L C O N S E R V A T I O N 1 4 1 ( 2 0 0 8 ) 3 3 2 – 3 4 6
. sc iencedi rec t .com
ava i lab le at wwwjournal homepage: www.elsevier .com/ locate /b iocon
Sustainable forest use in Brazilian extractive reserves: Naturalregeneration of Brazil nut in exploited populations
L.H.O. Wadta, K.A. Kainerb,c,*, C.L. Staudhammerb, R.O.P. Serranod
aCentro de Pesquisa Agroflorestal do Acre (Embrapa Acre), BR-364, Km 14, Rio Branco, Acre 69901-108, BrazilbSchool of Forest Resources and Conservation, P.O. Box 110410, University of Florida, Gainesville, FL 32611, USAcCenter for Latin American Studies, Tropical Conservation and Development Program, University of Florida, Gainesville, FL 32611, USAdUniversidade Federal do Acre (UFAC), Rodovia BR-364, Km 04, Rio Branco, Acre 69915-900, Brazil
A R T I C L E I N F O
Article history:
Received 16 March 2007
Received in revised form
10 October 2007
Accepted 16 October 2007
Keywords:
Amazon
Bertholletia excelsa
Demography
Fruit fate
Managed resource protected area
Non-timber forest product
Seed harvest
0006-3207/$ - see front matter � 2007 Elsevidoi:10.1016/j.biocon.2007.10.007
* Corresponding author: Address: School of FFlorida, Gainesville, FL 32611, USA. Tel.: +1 3
E-mail addresses: [email protected]@gmail.com (R.O.P. Serrano).
A B S T R A C T
The emergence of Brazilian extractive reserves reinforced the notion that sustainable forest
use could play a central role in conservation. Brazil nut is considered a model non-timber
product for promoting conservation through use. Demographic studies, however, have
demonstrated differential impacts of nut harvest on Brazil nut population structure. Com-
paring three populations with different forest use histories, degrees of road access, and
recent levels of nut harvest, we asked: (1) Are they exhibiting regeneration failure? and
(2) Are seedling/sapling densities explained by adult Brazil nut structure, fruit fate and/or
overall forest structure? We installed four 9-ha plots in each site to census Brazil nut trees
P10 cm dbh, and within each plot, 36 subplots (25 · 25 m each) to quantify regeneration,
overall forest structure, and open and closed fruit counts. Approximately 29–55% of fruits
was unharvested, and more than 90% of these was opened by scatterhoarding dispersers.
Population structure approximated a reverse-J size class distribution, with seedling densi-
ties varying from 3.2 to 5.8 individuals ha�1. We conclude that within the current harvest
context, regeneration is sufficient for population persistence in our sites, at least over
the medium term. The socioeconomics of sustainably managing Brazil nut is the greater
challenge, involving interlinked competitive land uses, nut quality, and substantial
increases in local income from harvest. Some of these challenges are being addressed in
Brazil, Bolivia and Peru, providing hope that this cornerstone extractive species will con-
tinue to play a prominent role in the ecological and economic landscape of Amazonia.
� 2007 Elsevier Ltd. All rights reserved.
1. Introduction
The expansion of the IUCN (World Conservation Union) pro-
tected area classification system to include Category VI (man-
aged resource protected areas) in 1994, underscored the
limitations of relying solely on strict protected areas for global
nature conservation. Category VI was created, in large part, to
er Ltd. All rights reserved
orest Resources and Con52 846 0833.br (L.H.O. Wadt), kkainer@
accommodate and recognize the emergence of Extractive Re-
serves (RESEX) in the Brazilian Amazon, reinforcing the grow-
ing notion that local communities could play a central role in
conservation strategies through promotion of sustainable for-
est use (Maretti, 2005). Originating from the rubber tapper so-
cial movement in Acre, Brazil, Extractive Reserves are
government-owned protected areas designated for sustain-
.
servation, 210 Newins-Ziegler Hall, P.O. Box 110410, University of
ufl.edu (K.A. Kainer), [email protected] (C.L. Staudhammer),
B I O L O G I C A L C O N S E R V A T I O N 1 4 1 ( 2 0 0 8 ) 3 3 2 – 3 4 6 333
able extraction and conservation of renewable natural re-
sources by resident populations with a tradition of non-tim-
ber extraction (Allegretti, 1994). The requirement of
management plans within these reserves has triggered a
transition from a traditional pattern of general forest exploi-
tation to more conscious management of the ecosystem
and its resources.
In the Amazon, this includes managing Brazil nut (Bert-
holletia excelsa) populations. This species has gradually
replaced rubber as the most important commercial non-
timber forest product for local populations living in RESEX
Chico Mendes (Wallace, 2004; Ehringhaus, 2006), an almost
one million ha reserve in the state of Acre, and other similar
multiple-use reserves in the Brazilian, Bolivian and Peruvian
Amazon. Brazil nut is widely recognized as a model non-tim-
ber forest product for promoting tropical forest conservation.
It is solely harvested in the wild from mature forests and has
enjoyed widespread and longstanding economic success in
the international market. Indeed, this single species has been
credited with the protection of millions of hectares of intact
forest in Brazil, Bolivia and Peru (Ortiz, 2002) where its com-
mercial harvest and marketing represents a major income
source for rural and peri-urban collectors and processors (Sto-
ian, 2005). Consequently, Brazil nut productivity has become
increasingly linked with long-term reserve viability, particu-
larly given the economic attractiveness of alternative land
uses that lead to forest conversion, such as cattle production.
Long-term success of an extractive product depends not
only on its economic viability, but also on the ecological resil-
ience of the target species to exploitation. Brazil nut also en-
joys some advantages in this dimension of sustainability.
Seeds are the part of the plant that is harvested, and in some
trees, very high levels of fruit and seed collection may permit
population persistence over decades (Ticktin, 2004). As larger
seed quantities are collected, however, the number of remain-
ing seeds may not be adequate to ensure sufficient recruit-
ment, potentially resulting in reduced seedling numbers
(Peters, 1996). In addition to these human interventions, B. ex-
celsa recruitment is intimately linked to the forest rodent Das-
yprocta spp., or agoutis. Humans and agoutis are practically
the only two species capable of opening the hard B. excelsa
fruits, and are therefore key determinants of Brazil nut fruit
fate, and ultimately natural regeneration. Still, the long-lived
nature of B. excelsa, with seed production occurring over most
of its multi-century lifespan, is considered to provide med-
ium-term demographic insurance against nut overexploita-
tion (Zuidema, 2003). Recent empirical studies have
demonstrated differential impacts of nut harvest on B. excelsa
population structure. In Bolivia, 93% collection rates appeared
to have minimal effect on regeneration, with populations
retaining a healthy demographic structure (Zuidema and Boot,
2002). While a study across the entire Amazon basin reported
that more intensively collected populations over longer peri-
ods of time (decades), generally in Eastern Amazonia, showed
clear signs of regeneration failure (Peres et al., 2003). In the lat-
ter study, small Brazil nut trees (10–60 cm in diameter at breast
height – dbh) were uncommon to rare in five of 22 populations
surveyed, and virtually absent in another three, corresponding
to stands in which seeds had been moderately to persistently
harvested, respectively. This basin-wide study demonstrated
that interlinked variables such as differences in site accessibil-
ity, Brazil nut commercialization efforts, and harvest intensity
could influence B. excelsa regeneration success. This study also
attained widespread dissemination in scientific and popular
media, raising the possibility that an imminent demographic
collapse may be threatening this cornerstone of the Amazo-
nian extractive economy.
Contributing to this debate, we sought to examine demo-
graphic structures of three western Amazonian B. excelsa pop-
ulations in Category VI protected areas with different forest
use histories, degrees of road access, and recent levels of nut
harvest. These three Brazil nut populations form part of the
same regional metapopulation. Our research questions were
twofold: (1) Are exploited populations in these sites exhibiting
regeneration failure? and (2) To what extent are B. excelsa seed-
ling/sapling densities explained by factors such as adult B. ex-
celsa structure, fruit fate and/or overall forest structure?
We expected comparatively greater seedling and sapling
densities in sites characterized by greater numbers of repro-
ductive adults and lower levels of nut harvest. Conversely,
we anticipated that sites with greater road access and other
heightened forest development activities, especially when re-
lated to intensified Brazil nut harvesting and processing,
would have reduced seedling and sapling densities.
1.1. Study species
Bertholletia excelsa occurs throughout much of the terra firme
forests in the Amazon basin. Within our study region, individ-
uals are distributed rather randomly (Wadt et al., 2005a),
though others have widely reported that adults are concen-
trated in groves (Muller et al., 1980; Mori and Prance, 1990;
Peres and Baider, 1997). At maturity, B. excelsa is a very large
emergent tree, and can be long-lived, with three individuals
>45 cm dbh radiocarbon-dated as older than 650 years (Vieira
et al., 2005). Seed development only occurs through obligatory
out-crossing (O’Malley et al., 1988), pollinated principally by
large-bodied bees, especially Euglossinae (Prance, 1976; Nel-
son et al., 1985). Fruit maturation takes 14 months, resulting
in a hard, large round fruit (10–16 cm) that falls during the
rainy season (December through February in our study re-
gion). Complete decomposition of the woody fruits takes
approximately three years (Zuidema, 2003; personal observa-
tions). Individual trees show considerable year-to-year varia-
tion in fruit production, though production of entire
populations seems fairly constant between years (Zuidema,
2003; Kainer et al., 2007). The 8–26 large (�3.5–5 · 2 cm) seeds
(or nuts) remain inside the fallen fruits until extraction by hu-
mans or other animals, with the scatterhoarding rodent,
agouti, playing an additional, instrumental role in seed dis-
persal and burial. Another rodent, Myprocta sp. (acouchy),
can also open B. excelsa fruits, but is a negligible contributor
to seed predation and dispersal. Controlled seed storage
experiments have demonstrated that B. excelsa seeds exhibit
dormancy, likely due to combined seed coat dormancy and
a second endogenous mechanism (Kainer et al., 1999). Muller
(1981) reported that untreated seeds initiate germination be-
tween 12 and 18 months. While B. excelsa seeds do not require
light to germinate, the species is considered gap-opportunis-
tic (Mori and Prance, 1990). Specifically, Myers et al. (2000)
334 B I O L O G I C A L C O N S E R V A T I O N 1 4 1 ( 2 0 0 8 ) 3 3 2 – 3 4 6
reported that while seedlings (individuals <1.3 m ht) occurred
in a range of gaps sizes and in the forest understory, saplings
(individuals >1.3 m ht and <10 cm dbh) only occurred in gaps
>95 m2, suggesting a relationship between species persis-
tence and light availability. Finally, planted seedlings in small
forest gaps near our study sites exhibited average height
growth rates of approximately 20 cm yr�1 (Kainer et al., 1998).
1.2. Brazil nut exploitation history
Since 1633 when Brazil nuts were first exported to Europe,
commercial exploitation of B. excelsa seeds centered histori-
cally in Eastern Amazonia, attaining broad economic signifi-
cance in this region in the mid-1800s (de Souza, 1963). Once
ports opened in Manaus in 1866, exploitation and commer-
cialization of Brazil nut expanded dramatically throughout
Amazonia (de Souza, 1963), and for the next century, most
Amazonian forest residents relied primarily on rubber and
Brazil nuts for their economic needs (Clay, 1997). Commercial-
ization quickly became dominated by a few trading compa-
nies located in Belem at the mouth of the Amazon River,
with almost all Brazil nut production exported to the interna-
tional nut market (Clay, 1997).
In our study region in western Amazonia, commercial Brazil
nut exploitation has historically been less intensive than in
Eastern Amazonia, but similarly intertwined with commercial
rubber extraction. Beginning with the first rubber boom in the
late 1800s, rubber tappers were recruited to our study region
from Northeastern Brazil to focus almost exclusively on rubber
production. Exceptions to this rubber focus, however, did occur
when Asian plantation-based rubber hit the export markets,
beginning in approximately 1911 (Bakx, 1988). Tappers diversi-
fied production and developed autonomous market links, such
that Brazil nut and other forest products became increasingly
important economically (Bakx, 1988; de Almeida, 2002). Indeed,
in the town of Xapurı located within our study region, a small
Brazil nut processing plant was inaugurated in 1933. Packaged
in cans and shipped in wooden crates, whole dried nuts were
exported to the United States until the advent of World War II
when buying was halted. Shortly afterward, the plant was de-
stroyed in a windstorm, coinciding with a second rubber boom
when tappers were again recruited to focus on rubber produc-
tion – this time to support the war effort (Bakx, 1988). With the
end of World War II, rubber production again relaxed and tap-
pers pursued more diversified production. In the 1970s, with
the arrival of Amazonian ‘‘development’’ in the Brazilian state
of Acre, these same tappers organized themselves into a strong
social movement, fighting for legal rights to the forested land
they traditionally inhabited (de Almeida, 2002). As part of this
struggle for legal and subsequently economic independence,
a local agroextractive cooperative and Brazil nut processing
plant were inaugurated in Acre in the 1990s, creating a Brazil
nut commercialization alternative to a constrictive Belem
monopoly (Michelotti, 2001). Several Brazil nut processing
plants were also established in neighboring Bolivia, increasing
collection pressure across the region, principally because re-
duced transportation prices facilitated marketing nuts from re-
mote collection areas (Clay, 1997).
Today, harvesters in our Brazilian study region continue to
reside in the forest, and nut collection is a key subsistence
and market-oriented livelihood activity. Families collect after
the majority of B. excelsa fruits have fallen in February or
March, following rubber and/or Brazil nut trails that wind
throughout their landholding. They typically work sections
of their landholding, visiting and harvesting from each tree
only once. Given individual phenological variation in fruit
maturation, fruits can lie on the forest floor for several weeks,
or even months, prior to collection.
2. Materials and methods
2.1. Site and forest use histories
The three sites studied, Cachoeira, Pindamonhangaba, and
Filipinas, are located in the Acre River Valley of the western
Brazilian Amazon in former rubber estates or seringais in Acre,
Brazil. According to CNPT-IBAMA (National Center of Sustain-
able Development of Traditional Populations-Brazilian
Institute of Renewable Natural Resources) appropriation doc-
uments, Cachoeira, Pindamonhangaba, and Filipinas encom-
pass 24,898, 14,236, and 30,000 ha, respectively. Human
population densities range from approximately 1 to 1.5 peo-
ple km�2. Field sites within these seringais form a relatively
straight line geographically, with Filipinas in the middle, lo-
cated approximately 30 km from Cachoeira and approxi-
mately 35–40 km from Pindamonhangaba (Fig. 1). Each site
has a distinct legal jurisdiction and history in terms of forest
use, intensity of Brazil nut commercialization efforts, and
accessibility.
Politically, Filipinas and Pindamonhangaba constitute part
of Extractive Reserve (RESEX) Chico Mendes, an almost 1 mil-
lion ha federal conservation unit under the legal jurisdiction
of IBAMA. Despite similar forest extraction histories and res-
ident cultures, Cachoeira is an ‘‘agroextractive settlement
project’’ or PAE, under the jurisdiction of the National Insti-
tute of Colonization and Agrarian Reform (INCRA), and is leg-
ally known as PAE Chico Mendes. In all three cases, tenure is
secure with little internal conflict over natural resources
including Brazil nut.
The strong rubber tapper social movement of the 1970s led
directly to establishment of both RESEX Chico Mendes and
PAE Chico Mendes in the early 1990s. Cachoeira residents,
many of them relatives of the movement leader Chico Men-
des, played a prominent role in the rubber tapper struggle.
Cachoeira continues to be well-known for having the stron-
gest and most politically active associations in the region,
perhaps a legacy of their strong collective mobilization (Stone,
2003). Most residents in the other two research sites only par-
ticipated peripherally in the tapper movement.
Partially due to this history and high level of social organi-
zation, Cachoeira became the recipient of multiple develop-
ment projects designed to improve resident quality of life
and add value to extracted forest products (Michelotti, 2001).
One such project designed to decentralize Brazil nut process-
ing piloted a small plant in Cachoeira in 1991. From 1993 to
2002, Brazil nuts collected in Cachoeira were no longer taken
out of the forest for processing elsewhere as was the conven-
tion, but were dehusked, dried and classified in this plant or
two smaller plants that functioned at household levels
(Michelotti, 2001). Another income-generating project,
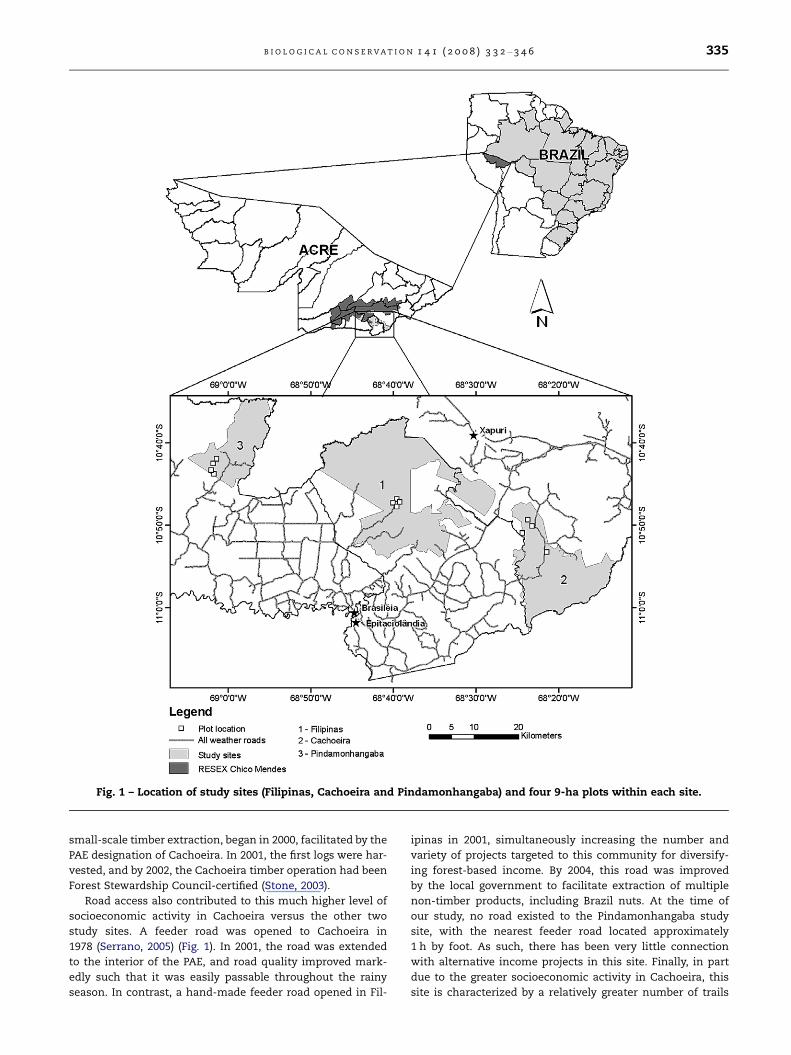
Fig. 1 – Location of study sites (Filipinas, Cachoeira and Pindamonhangaba) and four 9-ha plots within each site.
B I O L O G I C A L C O N S E R V A T I O N 1 4 1 ( 2 0 0 8 ) 3 3 2 – 3 4 6 335
small-scale timber extraction, began in 2000, facilitated by the
PAE designation of Cachoeira. In 2001, the first logs were har-
vested, and by 2002, the Cachoeira timber operation had been
Forest Stewardship Council-certified (Stone, 2003).
Road access also contributed to this much higher level of
socioeconomic activity in Cachoeira versus the other two
study sites. A feeder road was opened to Cachoeira in
1978 (Serrano, 2005) (Fig. 1). In 2001, the road was extended
to the interior of the PAE, and road quality improved mark-
edly such that it was easily passable throughout the rainy
season. In contrast, a hand-made feeder road opened in Fil-
ipinas in 2001, simultaneously increasing the number and
variety of projects targeted to this community for diversify-
ing forest-based income. By 2004, this road was improved
by the local government to facilitate extraction of multiple
non-timber products, including Brazil nuts. At the time of
our study, no road existed to the Pindamonhangaba study
site, with the nearest feeder road located approximately
1 h by foot. As such, there has been very little connection
with alternative income projects in this site. Finally, in part
due to the greater socioeconomic activity in Cachoeira, this
site is characterized by a relatively greater number of trails
336 B I O L O G I C A L C O N S E R V A T I O N 1 4 1 ( 2 0 0 8 ) 3 3 2 – 3 4 6
suitable for pack animal travel (� 1 12 m in width) compared
to the other two sites.
2.2. Field measurements
At each site, four 9-ha (300 · 300 m) plots were installed over
an approximately 450 ha swath of mature forest, representing
the forested landscape under the management regime of typ-
ically one rubber tapper family. Spatial independence of plots
and fairly representative plot distribution across the forested
landscape were criteria for plot site selection. Plots were cens-
used for all B. excelsa trees P10 cm dbh in 2003, collecting the
following data for each tree: x–y coordinates; dbh; presence or
absence of lianas; reproductive status (0,1); and crown form:
(1) complete or irregular circle (perfect or good), (2) half-crown
(tolerable), (3) less than half-crown (poor), or (4) one or a few
branches (very poor).
Each of the 9-ha plots were subdivided into 144 (25 · 25 m)
subplots for more intensive sampling in the last quarter of
2004. Randomization was restricted such that four subplots
were randomly assigned to each one of the 9 ha, resulting in
36 sampled subplots per plot. Within each subplot, all Brazil
nut seedlings and saplings (<10 cm dbh) were mapped and as-
signed x–y coordinates. For saplings (>1.5 m ht), dbh was mea-
sured; for seedlings (61.5 m ht), diameter at the base of the
plant and height were measured. The following subplot-level
data was also collected: number and dbh of all tree species
P10 cm dbh; number of intact (unopened) Brazil nut fruits
on the ground; and number on the ground opened by rodents.
Given known rates of B. excelsa fruit decomposition, we esti-
mate that these intact fruit counts reflect unharvested fruits
produced and predated in the 2003 and 2004 fruit falls. B. ex-
celsa trees produce a more or less continuous pattern of fruit
production at the population level – a phenomenon which has
contributed to the high commercial success of Brazil nut over
the last half century; the 2003 and 2004 harvest seasons were
no different (Kainer et al., 2007). Further, assuming growth
rates of 20 cm yr�1 for young B. excelsa seedlings in forest
(Kainer et al., 1998), we assume that only seedlings 640 cm
ht can be attributed to these 2003 and 2004 fruits falls.
To predict the number of fruits produced by each repro-
ductively mature B. excelsa tree, we applied an equation devel-
oped from a previous B. excelsa fruit production study in one
of the three study sites (Kainer et al., 2007). These production
calculations incorporated reproductive status, dbh, liana load,
and crown form. Although the model developed also used
measured tree-level values of soil phosphorous (P) and cation
exchange capacity (CEC), these individual tree data were not
available in our current study. We considered these soil vari-
ables to be relatively similar between sites, and therefore,
used average values for P and CEC from the previous fruit pro-
duction study.
The number of closed plus opened fruits per reproduc-
tively mature tree per ha was calculated as an indicator of col-
lection intensity, since this total represented uncollected
fruits remaining in the forest after harvest by humans. Using
similar logic, the percent fruits remaining in the forest and
opened by rodents (number of opened fruits per reproduc-
tively mature tree divided by number of opened plus closed
fruits per reproductively mature tree) was considered an indi-
cator of predator/disperser activity.
2.3. Data analyses
We used various models to test whether the multiple mea-
sured and calculated variables differed by site, using SAS for
all data analysis (Version 9.1, SAS Institute, 2004). Linear
mixed models (estimated with PROC MIXED) were appropriate
for normally distributed variables; however, many of the tree
and stand attributes measured and calculated were based on
count data, making them more appropriately described by
generalized linear mixed models (GLMM, estimated with
PROC GLIMMIX). For count data, GLMMs using Poisson-dis-
tributed response variables were investigated; for measures
derived from counts (e.g., number of closed plus opened fruits
per reproductively mature tree per ha), GLMMs using the con-
tinuous counterpart of the Poisson, the gamma distribution,
were investigated. All model results were compared using
Akaike’s Information Criteria (AIC; Quinn and Keough, 2002),
and by visual examination to test normality and homoscedas-
tic model residuals. Various iterations of interactions and
covariates were tested to improve (lower) the AIC value as rec-
ommended by Burnham and Anderson (2002). Model building
also was explored using conventional methods whereby all
appropriate covariates were tested and non-significant ones
were dropped sequentially until only those which were signif-
icant remained. Results of these two model building methods
were almost identical, and we only report results obtained
through the conventional method. Because some data were
collected on a plot-level (9 ha area) basis, many statistical
tests could only be performed with twelve observations,
which led to relatively low statistical power.
For seedling and sapling densities, two GLMMs, one with
plot-level data and a second with subplot-level data, were
both tested. Despite the coarse nature of the first plot-level
GLMM model, normality was attained and model residuals
were homoscedastic. Because model residuals were over-dis-
persed at zero density with the second GLMM model, we fur-
ther tested the applicability of a zero-inflated Poisson model
(ZIP, Hall, 2000). This ZIP model produced identical results to
the more coarse-scale GLMM model, and thus we report only
the latter results.
Differences in B. excelsa distributions were also examined
using non-parametric tests and spatial statistics. Using the
SAS procedure PROC LIFETEST, Wilcoxon and Log-Rank statis-
tics were computed to compare dbh and height distributions
and to evaluate significant forest-level covariates with respect
to these distributions. Because the log-rank test places more
weight on larger values in the distributions, whereas the Wilco-
xon test places more weight on smaller values (Peto and Peto,
1972), differences in the results of these tests can suggest that
the effects of these covariates vary over tree size. Since a previ-
ous study had demonstrated that trees in the 100–150 cm dbh
size class range were consistently the best producers (Kainer
et al., 2007), we used GLMMs to test for site differences in num-
ber of reproductive adults in four different sub-adult/adult size
classes (<50 cm, 50–100 cm, 100–150 cm, and >150 cm).
Spatial dispersion of seedlings and opened fruits relative
to reproductively mature trees was tested using the method
B I O L O G I C A L C O N S E R V A T I O N 1 4 1 ( 2 0 0 8 ) 3 3 2 – 3 4 6 337
described by Hamill and Wright (1986). In each of the three
sites, this analysis was applied independently to each of the
four 9-ha plots, without consideration to reproductively ma-
ture trees outside plot borders. The analysis tested the null
hypothesis that the locations of seedlings and opened fruits
were distributed randomly compared to those of adult trees.
3. Results
Summary results based on all 9-ha plots in the three sites re-
vealed general patterns in the structure of the studied B. excel-
sa metapopulation. Densities of all Brazil nut trees P10 cm
dbh varied between 0.7 and 2.7 individuals ha�1. The percent-
age of these individuals that was reproductively mature was
approximately 65%, with densities of this subset declining
to 0.6–1.9 individuals ha�1. Of the predicted fruits per site,
approximately 29–55% were left unharvested. Of these, more
than 90% was opened by rodents in all sites. Finally, densities
of seedlings (<1.5 m ht) varied between 1.3 and 12.4 individu-
als ha�1; and of saplings, between 0 and 3.2 individuals ha�1.
More detailed comparative results between sites follow.
3.1. Forest structure
Forest structure differences were detected by site (Table 1).
Basal area of all tree species >10 cm dbh was different
(P = 0.0028), with Cachoeira having higher forest basal areas
than both Filipinas (P = 0.0029) and Pindamonhangaba
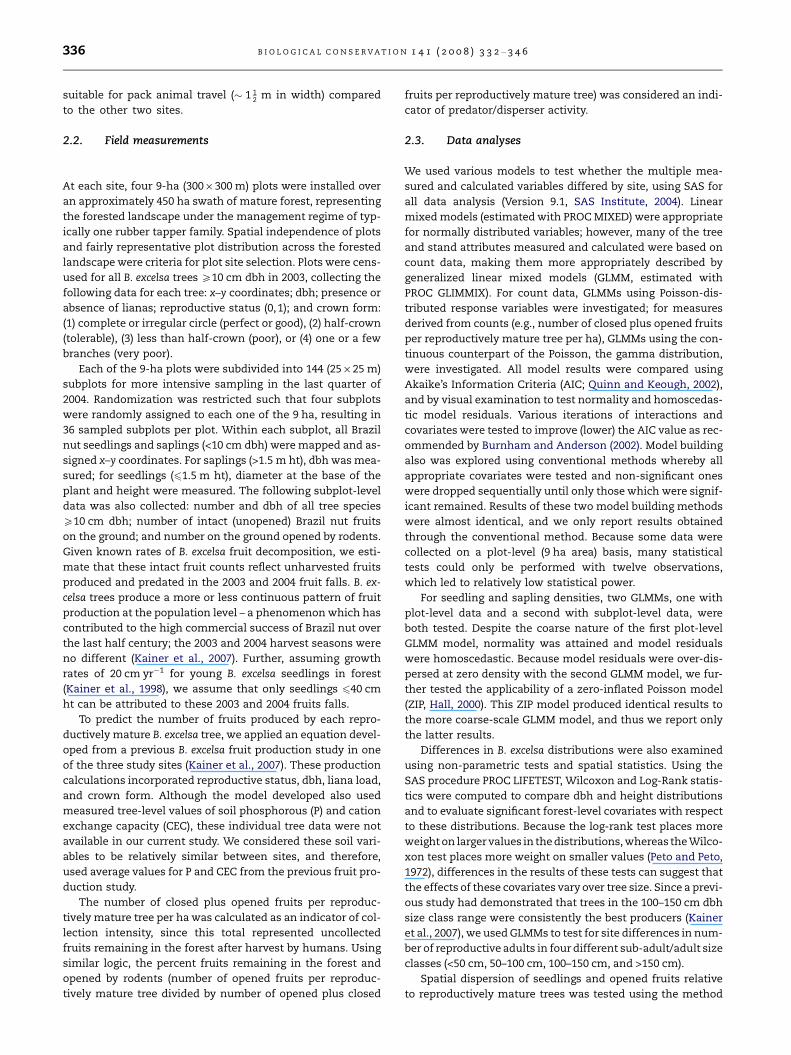
Table 1 – Means and standard errors of forest structurevalues
Site Basal area (ha�1) Trees (ha�1)
Filipinas 20.5 ± 1.0b 399.9 ± 25.4
Cachoeira 27.4 ± 1.0a 366.8 ± 25.4
Pindamonhangaba 23.2 ± 1.0b 450.8 ± 25.4
See text to exact levels of significance for each variable.
Table 2 – Descriptive statistics of adult B. excelsa trees (dbh P
Site N Treesha�1 (�x� se)
dbh(�x� se)
Proportio
1 (%)
Filipinas 54 1.5 ± 0.2b 70.9 ± 6.7 80
Cachoeira 89 2.5 ± 0.3a 93.0 ± 5.2 85
Pindamonhangaba 78 2.2 ± 0.3ab 71.6 ± 5.6 85
The only variable statistically different between sites was adult densities
Table 3 – Mean numbers and standard errors of reproductive t
Site
<50 50–100
Filipinas 0.06 ± 0.04 0.56 ± 0.10
Cachoeira 0.06 ± 0.04 0.61 ± 0.10
Pindamonhangaba 0.17 ± 0.04 0.75 ± 0.10
See text to exact levels of significance for each variable.
(P = 0.0460). Site differences in number of trees ha�1 were less
clear (P = 0.1082).
3.2. Comparative Bertholletia excelsa structure
The dbh structure and tree characteristics of Bertholletia excel-
sa individuals P10 cm dbh tended to differ slightly between
sites (Table 2). Trees in Cachoeira tended to be much larger
than those in Filipinas and Pindamonhangaba; however, tree
sizes in all sites were highly variable, with coefficients of var-
iation in excess of 55%. Although the proportion of reproduc-
tively mature individuals, distribution of individuals by crown
form class, and the proportion with lianas varied somewhat
by site, differences were not statistically significant for any
of these attributes (Table 2). Brazil nut tree densities, however,
did vary by site (P = 0.0486), with Cachoeira having more B. ex-
celsa trees ha�1 than Filipinas at P = 0.0567 (Table 2). While
there were no site differences when comparing reproductive
adult densities, site differences were detected when repro-
ductive adults were separated into four size classes, with sta-
tistical significance only in the 100–150 cm dbh size class
range (P = 0.0336) (Table 3). For this size class, Cachoeira had
greater reproductive adult densities than Filipinas
(P = 0.0346). Plot level measurements of basal area per ha
and density for all tree species were also investigated as
covariates in predicting reproductively mature adult densities
by size class; however, neither of these variables contributed
significantly and were dropped from the model.
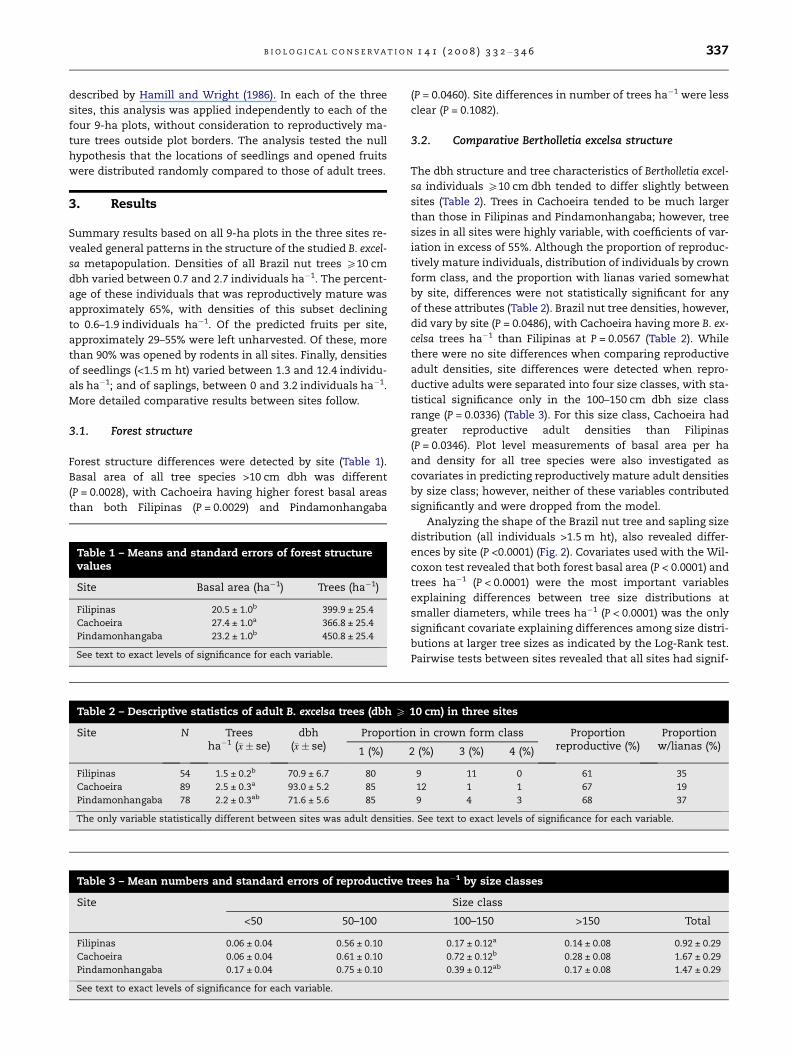
Analyzing the shape of the Brazil nut tree and sapling size
distribution (all individuals >1.5 m ht), also revealed differ-
ences by site (P <0.0001) (Fig. 2). Covariates used with the Wil-
coxon test revealed that both forest basal area (P < 0.0001) and
trees ha�1 (P < 0.0001) were the most important variables
explaining differences between tree size distributions at
smaller diameters, while trees ha�1 (P < 0.0001) was the only
significant covariate explaining differences among size distri-
butions at larger tree sizes as indicated by the Log-Rank test.
Pairwise tests between sites revealed that all sites had signif-
10 cm) in three sites
n in crown form class Proportionreproductive (%)
Proportionw/lianas (%)2 (%) 3 (%) 4 (%)
9 11 0 61 35
12 1 1 67 19
9 4 3 68 37
. See text to exact levels of significance for each variable.
rees ha�1 by size classes
Size class
100–150 >150 Total
0.17 ± 0.12a 0.14 ± 0.08 0.92 ± 0.29
0.72 ± 0.12b 0.28 ± 0.08 1.67 ± 0.29
0.39 ± 0.12ab 0.17 ± 0.08 1.47 ± 0.29
Den
sity
(In
divi
dual
ha-1
)
Size class (cm)
1.5
2.0
a) Filipinas
b) Cachoeira
See
dlin
gS
aplin
g10
-20
20 -
3030
-40
40 -
5050
-60
60 -
7070
-80
80 -
9090
-10
010
0 - 1
1011
0 - 1
2012
0 - 1
3013
0 - 1
40
1.0
4.0
5.0
6.0
0.0
0.5
0.0
0.5
1.0
1.5
2.0
3.0
4.0
0.0
0.5
1.0
1.5
2.0
140
- 150
150
- 160
160
- 170
170
- 180
180
- 190
190
- 200
200
- 210
210
- 220
220
- 230
4.0
5.0
c) Pindamonhangaba
Fig. 2 – Population structure of Bertholletia excelsa for each of three sites. Seedlings are individuals <1.5 m ht, saplings are
individuals between 1.5 m ht and <10 cm dbh, and numeric intervals indicate dbh classes.
338 B I O L O G I C A L C O N S E R V A T I O N 1 4 1 ( 2 0 0 8 ) 3 3 2 – 3 4 6
icantly different diameter distributions (P < 0.0001), with trees
ha�1 an important overall explanatory variable. Forest basal
area was also significant in explaining site-to-site differences
specifically for Filipinas and Pindamonhangaba, and when
comparing Filipinas and Cachoeira, forest basal area was only
important in discriminating size distributions at smaller
diameters. For Cachoeira versus Pindamonhangaba, forest
basal area was not important.
Cachoeira tended to have the fewest number of seedlings
(61.5 m ht) and saplings (>1.5 m ht and <10 cm dbh), although
B I O L O G I C A L C O N S E R V A T I O N 1 4 1 ( 2 0 0 8 ) 3 3 2 – 3 4 6 339
neither absolute seedling nor sapling densities were statisti-
cally different by site (Table 4). Differences were detected,
however, when considering seedling and sapling relation-
ships to reproductive adults present. Seedlings plus saplings
per reproductive adult were statistically different by site
(P = 0.0461) (Table 4) with Filipinas having a greater number
Heigh
Num
ber
of in
divi
dual
s
a) Filipinas
0
2
4
6
8
10
12
14
b) Cachoeira
0
2
4
6
8
10
12
14
c) Pindamonhangaba
0
2
4
6
8
10
12
14
< 0.1 0.2 0.3 0.4 0.5 0.6 0.7
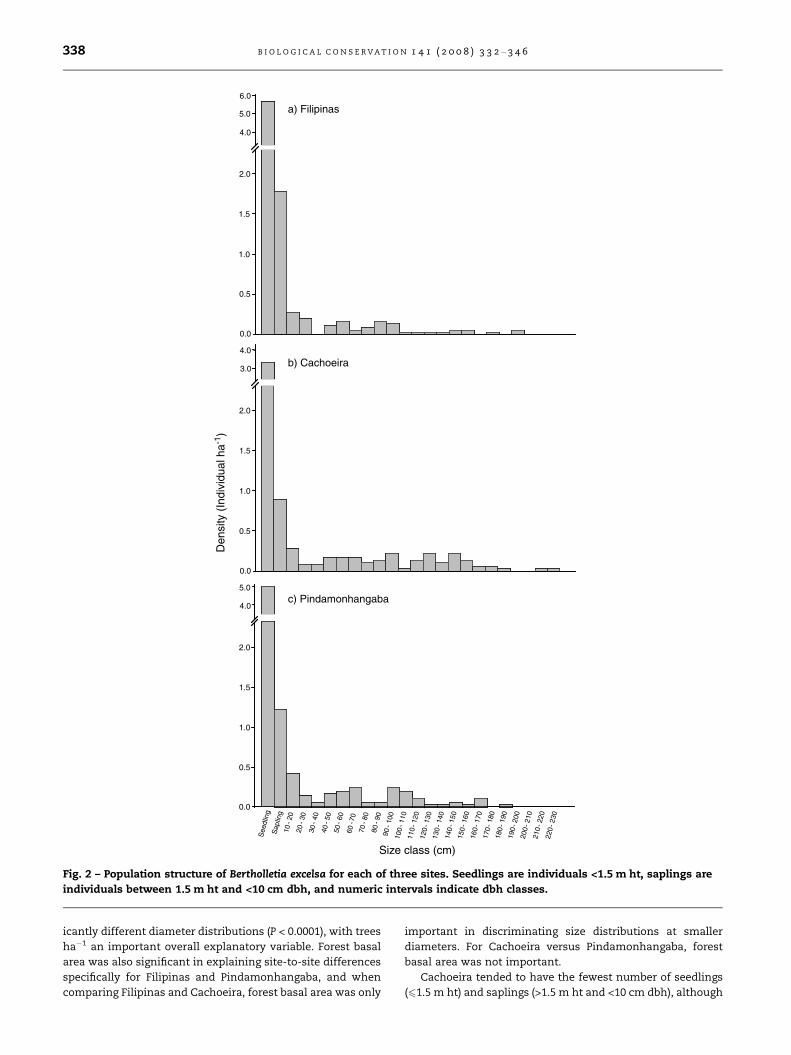
Fig. 3 – Height class distributions of seedlings (i
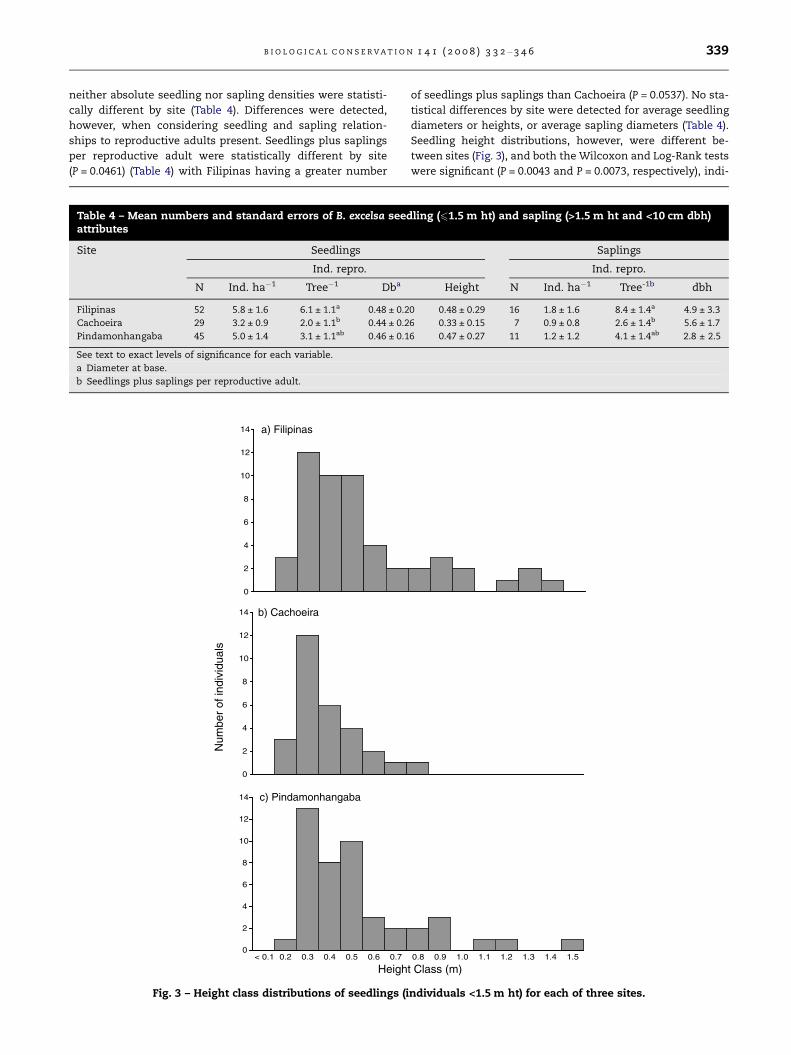
Table 4 – Mean numbers and standard errors of B. excelsa seedattributes
Site Seedlings
Ind. repro.
N Ind. ha�1 Tree�1 Dba
Filipinas 52 5.8 ± 1.6 6.1 ± 1.1a 0.48 ± 0.2
Cachoeira 29 3.2 ± 0.9 2.0 ± 1.1b 0.44 ± 0.2
Pindamonhangaba 45 5.0 ± 1.4 3.1 ± 1.1ab 0.46 ± 0.1
See text to exact levels of significance for each variable.
a Diameter at base.
b Seedlings plus saplings per reproductive adult.
of seedlings plus saplings than Cachoeira (P = 0.0537). No sta-
tistical differences by site were detected for average seedling
diameters or heights, or average sapling diameters (Table 4).
Seedling height distributions, however, were different be-
tween sites (Fig. 3), and both the Wilcoxon and Log-Rank tests
were significant (P = 0.0043 and P = 0.0073, respectively), indi-
t Class (m)0.8 0.9 1.0 1.1 1.2 1.3 1.4 1.5
ndividuals <1.5 m ht) for each of three sites.
ling (61.5 m ht) and sapling (>1.5 m ht and <10 cm dbh)
Saplings
Ind. repro.
Height N Ind. ha�1 Tree-1b dbh
0 0.48 ± 0.29 16 1.8 ± 1.6 8.4 ± 1.4a 4.9 ± 3.3
6 0.33 ± 0.15 7 0.9 ± 0.8 2.6 ± 1.4b 5.6 ± 1.7
6 0.47 ± 0.27 11 1.2 ± 1.2 4.1 ± 1.4ab 2.8 ± 2.5
340 B I O L O G I C A L C O N S E R V A T I O N 1 4 1 ( 2 0 0 8 ) 3 3 2 – 3 4 6
cating different distributions for both shorter and taller seed-
lings, respectively. Trees ha�1 of the surrounding forest was
only important in explaining site-to-site differences in height
distribution for shorter seedlings, but not for taller ones. Pair-
wise tests revealed that these results held when Cachoeira
was compared to both other sites (P = 0.0017 and P = 0.0010
for the Wilcoxon and Log-Rank tests, respectively), while Fil-
ipinas and Pindamonhangaba were not significantly different
in terms of seedling height distributions.
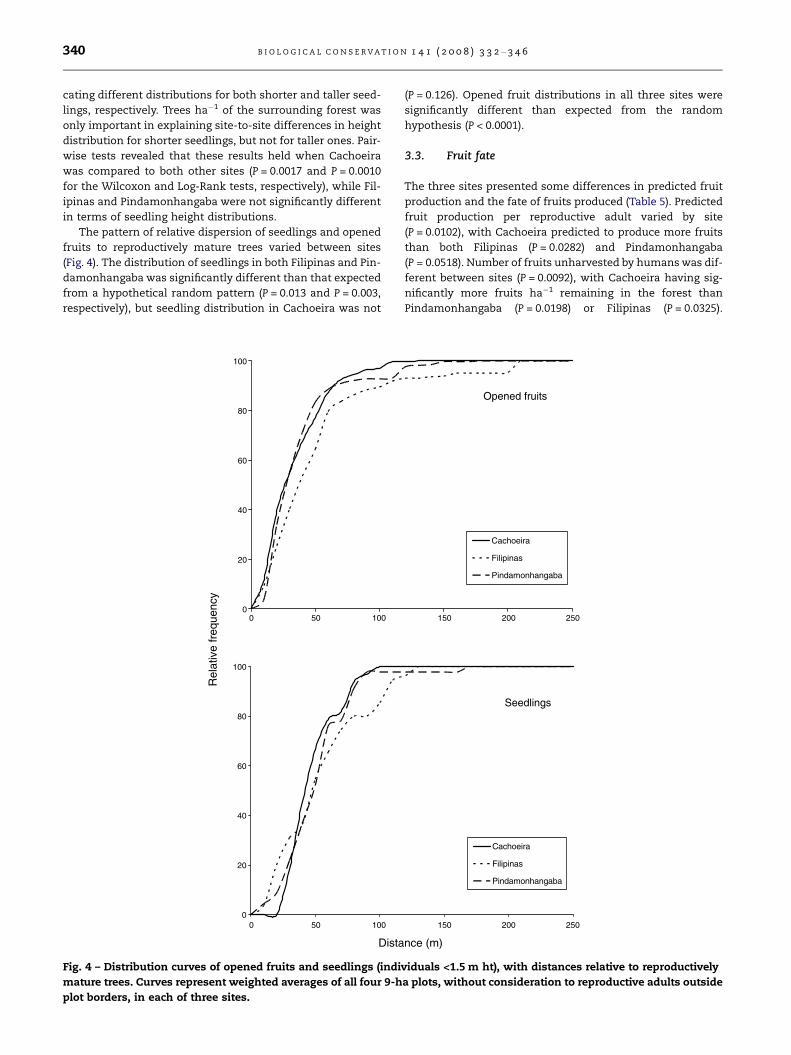
The pattern of relative dispersion of seedlings and opened
fruits to reproductively mature trees varied between sites
(Fig. 4). The distribution of seedlings in both Filipinas and Pin-
damonhangaba was significantly different than that expected
from a hypothetical random pattern (P = 0.013 and P = 0.003,
respectively), but seedling distribution in Cachoeira was not
0
20
40
60
80
100
Rel
ativ
e fr
eque
ncy
Dista
0
20
40
60
80
100
0 50 100
0 50 100
Fig. 4 – Distribution curves of opened fruits and seedlings (indi
mature trees. Curves represent weighted averages of all four 9-h
plot borders, in each of three sites.
(P = 0.126). Opened fruit distributions in all three sites were
significantly different than expected from the random
hypothesis (P < 0.0001).
3.3. Fruit fate
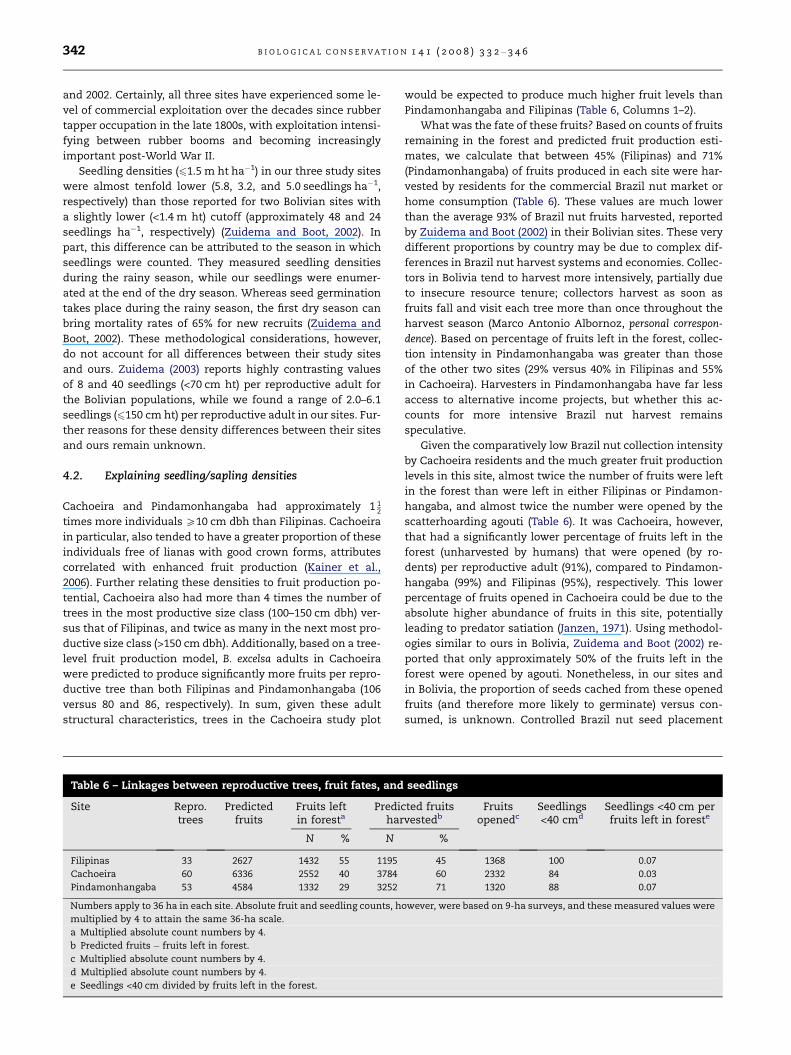
The three sites presented some differences in predicted fruit
production and the fate of fruits produced (Table 5). Predicted
fruit production per reproductive adult varied by site
(P = 0.0102), with Cachoeira predicted to produce more fruits
than both Filipinas (P = 0.0282) and Pindamonhangaba
(P = 0.0518). Number of fruits unharvested by humans was dif-
ferent between sites (P = 0.0092), with Cachoeira having sig-
nificantly more fruits ha�1 remaining in the forest than
Pindamonhangaba (P = 0.0198) or Filipinas (P = 0.0325).
Cachoeira
Filipinas
Pindamonhangaba
nce (m)
Seedlings
Opened fruits
150 200 250
150 200 250
Cachoeira
Filipinas
Pindamonhangaba
viduals <1.5 m ht), with distances relative to reproductively
a plots, without consideration to reproductive adults outside
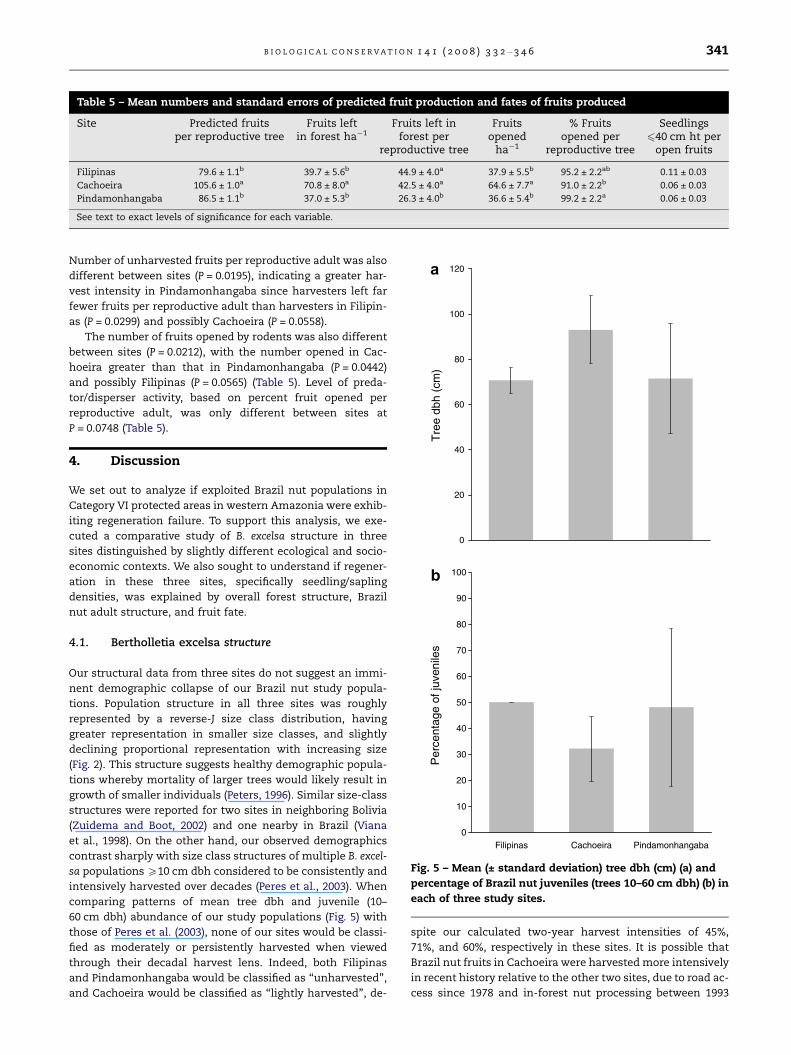
Table 5 – Mean numbers and standard errors of predicted fruit production and fates of fruits produced
Site Predicted fruitsper reproductive tree
Fruits leftin forest ha�1
Fruits left inforest per
reproductive tree
Fruitsopened
ha�1
% Fruitsopened per
reproductive tree
Seedlings640 cm ht per
open fruits
Filipinas 79.6 ± 1.1b 39.7 ± 5.6b 44.9 ± 4.0a 37.9 ± 5.5b 95.2 ± 2.2ab 0.11 ± 0.03
Cachoeira 105.6 ± 1.0a 70.8 ± 8.0a 42.5 ± 4.0a 64.6 ± 7.7a 91.0 ± 2.2b 0.06 ± 0.03
Pindamonhangaba 86.5 ± 1.1b 37.0 ± 5.3b 26.3 ± 4.0b 36.6 ± 5.4b 99.2 ± 2.2a 0.06 ± 0.03
See text to exact levels of significance for each variable.
0
20
40
60
80
100
120
Tre
e db
h (c
m)
Per
cent
age
of ju
veni
les
0
10
20
30
40
50
60
70
80
90
100
Filipinas Cachoeira Pindamonhangaba
a
b
Fig. 5 – Mean (± standard deviation) tree dbh (cm) (a) and
percentage of Brazil nut juveniles (trees 10–60 cm dbh) (b) in
each of three study sites.
B I O L O G I C A L C O N S E R V A T I O N 1 4 1 ( 2 0 0 8 ) 3 3 2 – 3 4 6 341
Number of unharvested fruits per reproductive adult was also
different between sites (P = 0.0195), indicating a greater har-
vest intensity in Pindamonhangaba since harvesters left far
fewer fruits per reproductive adult than harvesters in Filipin-
as (P = 0.0299) and possibly Cachoeira (P = 0.0558).
The number of fruits opened by rodents was also different
between sites (P = 0.0212), with the number opened in Cac-
hoeira greater than that in Pindamonhangaba (P = 0.0442)
and possibly Filipinas (P = 0.0565) (Table 5). Level of preda-
tor/disperser activity, based on percent fruit opened per
reproductive adult, was only different between sites at
P = 0.0748 (Table 5).
4. Discussion
We set out to analyze if exploited Brazil nut populations in
Category VI protected areas in western Amazonia were exhib-
iting regeneration failure. To support this analysis, we exe-
cuted a comparative study of B. excelsa structure in three
sites distinguished by slightly different ecological and socio-
economic contexts. We also sought to understand if regener-
ation in these three sites, specifically seedling/sapling
densities, was explained by overall forest structure, Brazil
nut adult structure, and fruit fate.
4.1. Bertholletia excelsa structure
Our structural data from three sites do not suggest an immi-
nent demographic collapse of our Brazil nut study popula-
tions. Population structure in all three sites was roughly
represented by a reverse-J size class distribution, having
greater representation in smaller size classes, and slightly
declining proportional representation with increasing size
(Fig. 2). This structure suggests healthy demographic popula-
tions whereby mortality of larger trees would likely result in
growth of smaller individuals (Peters, 1996). Similar size-class
structures were reported for two sites in neighboring Bolivia
(Zuidema and Boot, 2002) and one nearby in Brazil (Viana
et al., 1998). On the other hand, our observed demographics
contrast sharply with size class structures of multiple B. excel-
sa populations P10 cm dbh considered to be consistently and
intensively harvested over decades (Peres et al., 2003). When
comparing patterns of mean tree dbh and juvenile (10–
60 cm dbh) abundance of our study populations (Fig. 5) with
those of Peres et al. (2003), none of our sites would be classi-
fied as moderately or persistently harvested when viewed
through their decadal harvest lens. Indeed, both Filipinas
and Pindamonhangaba would be classified as ‘‘unharvested’’,
and Cachoeira would be classified as ‘‘lightly harvested’’, de-
spite our calculated two-year harvest intensities of 45%,
71%, and 60%, respectively in these sites. It is possible that
Brazil nut fruits in Cachoeira were harvested more intensively
in recent history relative to the other two sites, due to road ac-
cess since 1978 and in-forest nut processing between 1993
342 B I O L O G I C A L C O N S E R V A T I O N 1 4 1 ( 2 0 0 8 ) 3 3 2 – 3 4 6
and 2002. Certainly, all three sites have experienced some le-
vel of commercial exploitation over the decades since rubber
tapper occupation in the late 1800s, with exploitation intensi-
fying between rubber booms and becoming increasingly
important post-World War II.
Seedling densities (61.5 m ht ha�1) in our three study sites
were almost tenfold lower (5.8, 3.2, and 5.0 seedlings ha�1,
respectively) than those reported for two Bolivian sites with
a slightly lower (<1.4 m ht) cutoff (approximately 48 and 24
seedlings ha�1, respectively) (Zuidema and Boot, 2002). In
part, this difference can be attributed to the season in which
seedlings were counted. They measured seedling densities
during the rainy season, while our seedlings were enumer-
ated at the end of the dry season. Whereas seed germination
takes place during the rainy season, the first dry season can
bring mortality rates of 65% for new recruits (Zuidema and
Boot, 2002). These methodological considerations, however,
do not account for all differences between their study sites
and ours. Zuidema (2003) reports highly contrasting values
of 8 and 40 seedlings (<70 cm ht) per reproductive adult for
the Bolivian populations, while we found a range of 2.0–6.1
seedlings (6150 cm ht) per reproductive adult in our sites. Fur-
ther reasons for these density differences between their sites
and ours remain unknown.
4.2. Explaining seedling/sapling densities
Cachoeira and Pindamonhangaba had approximately 1 12
times more individuals P10 cm dbh than Filipinas. Cachoeira
in particular, also tended to have a greater proportion of these
individuals free of lianas with good crown forms, attributes
correlated with enhanced fruit production (Kainer et al.,
2006). Further relating these densities to fruit production po-
tential, Cachoeira also had more than 4 times the number of
trees in the most productive size class (100–150 cm dbh) ver-
sus that of Filipinas, and twice as many in the next most pro-
ductive size class (>150 cm dbh). Additionally, based on a tree-
level fruit production model, B. excelsa adults in Cachoeira
were predicted to produce significantly more fruits per repro-
ductive tree than both Filipinas and Pindamonhangaba (106
versus 80 and 86, respectively). In sum, given these adult
structural characteristics, trees in the Cachoeira study plot
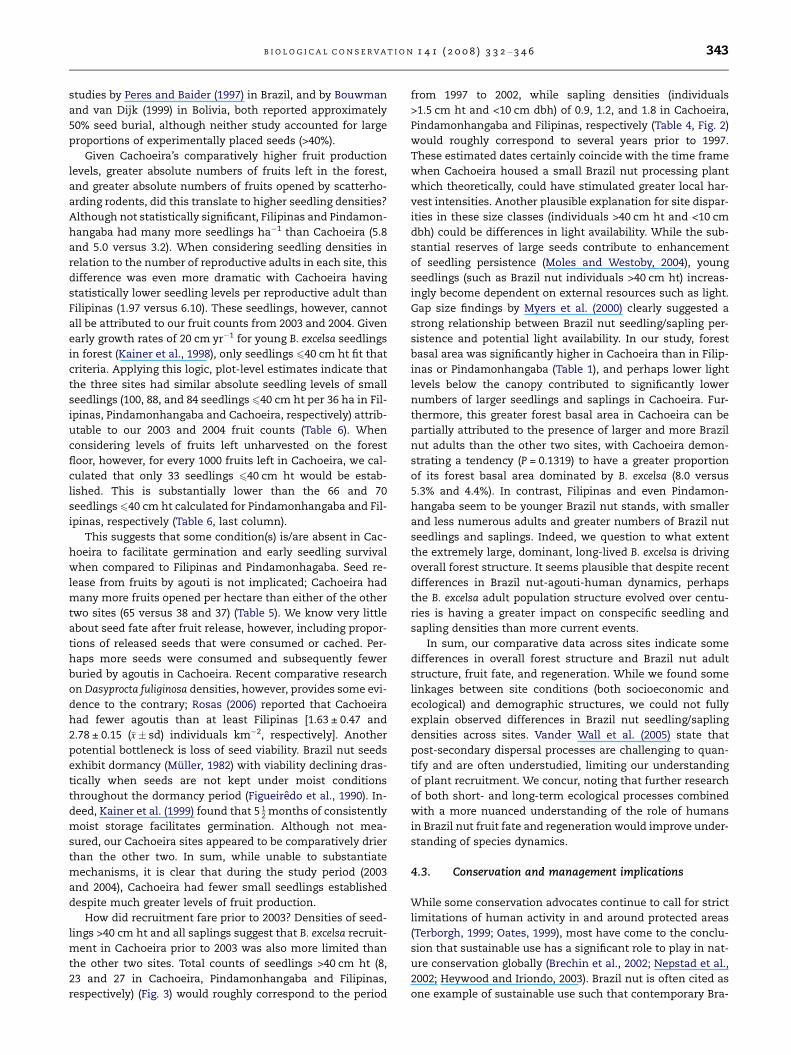
Table 6 – Linkages between reproductive trees, fruit fates, and
Site Repro.trees
Predictedfruits
Fruits leftin foresta
Predihar
N % N
Filipinas 33 2627 1432 55 1195
Cachoeira 60 6336 2552 40 3784
Pindamonhangaba 53 4584 1332 29 3252
Numbers apply to 36 ha in each site. Absolute fruit and seedling counts, h
multiplied by 4 to attain the same 36-ha scale.
a Multiplied absolute count numbers by 4.
b Predicted fruits � fruits left in forest.
c Multiplied absolute count numbers by 4.
d Multiplied absolute count numbers by 4.
e Seedlings <40 cm divided by fruits left in the forest.
would be expected to produce much higher fruit levels than
Pindamonhangaba and Filipinas (Table 6, Columns 1–2).
What was the fate of these fruits? Based on counts of fruits
remaining in the forest and predicted fruit production esti-
mates, we calculate that between 45% (Filipinas) and 71%
(Pindamonhangaba) of fruits produced in each site were har-
vested by residents for the commercial Brazil nut market or
home consumption (Table 6). These values are much lower
than the average 93% of Brazil nut fruits harvested, reported
by Zuidema and Boot (2002) in their Bolivian sites. These very
different proportions by country may be due to complex dif-
ferences in Brazil nut harvest systems and economies. Collec-
tors in Bolivia tend to harvest more intensively, partially due
to insecure resource tenure; collectors harvest as soon as
fruits fall and visit each tree more than once throughout the
harvest season (Marco Antonio Albornoz, personal correspon-
dence). Based on percentage of fruits left in the forest, collec-
tion intensity in Pindamonhangaba was greater than those
of the other two sites (29% versus 40% in Filipinas and 55%
in Cachoeira). Harvesters in Pindamonhangaba have far less
access to alternative income projects, but whether this ac-
counts for more intensive Brazil nut harvest remains
speculative.
Given the comparatively low Brazil nut collection intensity
by Cachoeira residents and the much greater fruit production
levels in this site, almost twice the number of fruits were left
in the forest than were left in either Filipinas or Pindamon-
hangaba, and almost twice the number were opened by the
scatterhoarding agouti (Table 6). It was Cachoeira, however,
that had a significantly lower percentage of fruits left in the
forest (unharvested by humans) that were opened (by ro-
dents) per reproductive adult (91%), compared to Pindamon-
hangaba (99%) and Filipinas (95%), respectively. This lower
percentage of fruits opened in Cachoeira could be due to the
absolute higher abundance of fruits in this site, potentially
leading to predator satiation (Janzen, 1971). Using methodol-
ogies similar to ours in Bolivia, Zuidema and Boot (2002) re-
ported that only approximately 50% of the fruits left in the
forest were opened by agouti. Nonetheless, in our sites and
in Bolivia, the proportion of seeds cached from these opened
fruits (and therefore more likely to germinate) versus con-
sumed, is unknown. Controlled Brazil nut seed placement
seedlings
cted fruitsvestedb
Fruitsopenedc
Seedlings<40 cmd
Seedlings <40 cm perfruits left in foreste
%
45 1368 100 0.07
60 2332 84 0.03
71 1320 88 0.07
owever, were based on 9-ha surveys, and these measured values were
B I O L O G I C A L C O N S E R V A T I O N 1 4 1 ( 2 0 0 8 ) 3 3 2 – 3 4 6 343
studies by Peres and Baider (1997) in Brazil, and by Bouwman
and van Dijk (1999) in Bolivia, both reported approximately
50% seed burial, although neither study accounted for large
proportions of experimentally placed seeds (>40%).
Given Cachoeira’s comparatively higher fruit production
levels, greater absolute numbers of fruits left in the forest,
and greater absolute numbers of fruits opened by scatterho-
arding rodents, did this translate to higher seedling densities?
Although not statistically significant, Filipinas and Pindamon-
hangaba had many more seedlings ha�1 than Cachoeira (5.8
and 5.0 versus 3.2). When considering seedling densities in
relation to the number of reproductive adults in each site, this
difference was even more dramatic with Cachoeira having
statistically lower seedling levels per reproductive adult than
Filipinas (1.97 versus 6.10). These seedlings, however, cannot
all be attributed to our fruit counts from 2003 and 2004. Given
early growth rates of 20 cm yr�1 for young B. excelsa seedlings
in forest (Kainer et al., 1998), only seedlings 640 cm ht fit that
criteria. Applying this logic, plot-level estimates indicate that
the three sites had similar absolute seedling levels of small
seedlings (100, 88, and 84 seedlings 640 cm ht per 36 ha in Fil-
ipinas, Pindamonhangaba and Cachoeira, respectively) attrib-
utable to our 2003 and 2004 fruit counts (Table 6). When
considering levels of fruits left unharvested on the forest
floor, however, for every 1000 fruits left in Cachoeira, we cal-
culated that only 33 seedlings 640 cm ht would be estab-
lished. This is substantially lower than the 66 and 70
seedlings 640 cm ht calculated for Pindamonhangaba and Fil-
ipinas, respectively (Table 6, last column).
This suggests that some condition(s) is/are absent in Cac-
hoeira to facilitate germination and early seedling survival
when compared to Filipinas and Pindamonhagaba. Seed re-
lease from fruits by agouti is not implicated; Cachoeira had
many more fruits opened per hectare than either of the other
two sites (65 versus 38 and 37) (Table 5). We know very little
about seed fate after fruit release, however, including propor-
tions of released seeds that were consumed or cached. Per-
haps more seeds were consumed and subsequently fewer
buried by agoutis in Cachoeira. Recent comparative research
on Dasyprocta fuliginosa densities, however, provides some evi-
dence to the contrary; Rosas (2006) reported that Cachoeira
had fewer agoutis than at least Filipinas [1.63 ± 0.47 and
2.78 ± 0.15 (�x� sd) individuals km�2, respectively]. Another
potential bottleneck is loss of seed viability. Brazil nut seeds
exhibit dormancy (Muller, 1982) with viability declining dras-
tically when seeds are not kept under moist conditions
throughout the dormancy period (Figueiredo et al., 1990). In-
deed, Kainer et al. (1999) found that 5 12 months of consistently
moist storage facilitates germination. Although not mea-
sured, our Cachoeira sites appeared to be comparatively drier
than the other two. In sum, while unable to substantiate
mechanisms, it is clear that during the study period (2003
and 2004), Cachoeira had fewer small seedlings established
despite much greater levels of fruit production.
How did recruitment fare prior to 2003? Densities of seed-
lings >40 cm ht and all saplings suggest that B. excelsa recruit-
ment in Cachoeira prior to 2003 was also more limited than
the other two sites. Total counts of seedlings >40 cm ht (8,
23 and 27 in Cachoeira, Pindamonhangaba and Filipinas,
respectively) (Fig. 3) would roughly correspond to the period
from 1997 to 2002, while sapling densities (individuals
>1.5 cm ht and <10 cm dbh) of 0.9, 1.2, and 1.8 in Cachoeira,
Pindamonhangaba and Filipinas, respectively (Table 4, Fig. 2)
would roughly correspond to several years prior to 1997.
These estimated dates certainly coincide with the time frame
when Cachoeira housed a small Brazil nut processing plant
which theoretically, could have stimulated greater local har-
vest intensities. Another plausible explanation for site dispar-
ities in these size classes (individuals >40 cm ht and <10 cm
dbh) could be differences in light availability. While the sub-
stantial reserves of large seeds contribute to enhancement
of seedling persistence (Moles and Westoby, 2004), young
seedlings (such as Brazil nut individuals >40 cm ht) increas-
ingly become dependent on external resources such as light.
Gap size findings by Myers et al. (2000) clearly suggested a
strong relationship between Brazil nut seedling/sapling per-
sistence and potential light availability. In our study, forest
basal area was significantly higher in Cachoeira than in Filip-
inas or Pindamonhangaba (Table 1), and perhaps lower light
levels below the canopy contributed to significantly lower
numbers of larger seedlings and saplings in Cachoeira. Fur-
thermore, this greater forest basal area in Cachoeira can be
partially attributed to the presence of larger and more Brazil
nut adults than the other two sites, with Cachoeira demon-
strating a tendency (P = 0.1319) to have a greater proportion
of its forest basal area dominated by B. excelsa (8.0 versus
5.3% and 4.4%). In contrast, Filipinas and even Pindamon-
hangaba seem to be younger Brazil nut stands, with smaller
and less numerous adults and greater numbers of Brazil nut
seedlings and saplings. Indeed, we question to what extent
the extremely large, dominant, long-lived B. excelsa is driving
overall forest structure. It seems plausible that despite recent
differences in Brazil nut-agouti-human dynamics, perhaps
the B. excelsa adult population structure evolved over centu-
ries is having a greater impact on conspecific seedling and
sapling densities than more current events.
In sum, our comparative data across sites indicate some
differences in overall forest structure and Brazil nut adult
structure, fruit fate, and regeneration. While we found some
linkages between site conditions (both socioeconomic and
ecological) and demographic structures, we could not fully
explain observed differences in Brazil nut seedling/sapling
densities across sites. Vander Wall et al. (2005) state that
post-secondary dispersal processes are challenging to quan-
tify and are often understudied, limiting our understanding
of plant recruitment. We concur, noting that further research
of both short- and long-term ecological processes combined
with a more nuanced understanding of the role of humans
in Brazil nut fruit fate and regeneration would improve under-
standing of species dynamics.
4.3. Conservation and management implications
While some conservation advocates continue to call for strict
limitations of human activity in and around protected areas
(Terborgh, 1999; Oates, 1999), most have come to the conclu-
sion that sustainable use has a significant role to play in nat-
ure conservation globally (Brechin et al., 2002; Nepstad et al.,
2002; Heywood and Iriondo, 2003). Brazil nut is often cited as
one example of sustainable use such that contemporary Bra-
344 B I O L O G I C A L C O N S E R V A T I O N 1 4 1 ( 2 0 0 8 ) 3 3 2 – 3 4 6
zil nut collection and marketing is credited with protection of
millions of hectares of intact forest in Brazil, Bolivia and Peru
(Ortiz, 2002), and represents a major income source for rural
and peri-urban collectors and processors in these countries
(Stoian, 2005). Effects of direct seed harvest on species sus-
tainability, however, have been questioned. Recommenda-
tions for more relaxed harvest levels, enrichment plantings
for population maintenance and no-take areas have been
suggested for Brazil nut populations with recent histories of
more intensive exploitation (Peres et al., 2003). Our results,
and those of Zuidema and Boot (2002), suggest that these
measures are not necessary to sustain Brazil nut populations
in our shared study region given the current harvest context.
Applying matrix population models to their data, Zuidema
and Boot (2002) concluded that seed removal and seedling
abundance alone were not reliable indicators of overall Brazil
nut population stability. Size class structures across their
sites and ours suggest no immediate demographic threats
currently exist to this cornerstone extractive species in our
study regions. While we did detect some differences in demo-
graphic structures across our study sites, particularly in Cac-
hoeira, we could not clearly attribute these differences to
either socioeconomic or ecological factors, with causality
remaining speculative.
The larger threat to B. excelsa sustainability is much more
complex. We agree with Silvertown (2004) that the socioeco-
nomics of sustainably managing Brazil nut is the greater chal-
lenge, involving interlinked competitive land uses, nut quality
for a demanding global market, and substantial increases in
local income from nut harvest and processing. In many
senses, this challenge is being addressed in the tri-country
border region where Brazil, Bolivia and Peru intersect – the
western Amazonian region to which large-scale Brazil nut
harvest has shifted from its historic hub in Para, Brazil (Peres
et al., 2003). This shift has been accompanied by a relaxation
of a well-established monopoly of Brazil nut trade centered in
Belem, Para (Clay, 1997), such that Bolivia is now the largest
Brazil nut exporter (Zuidema, 2003) and increasing numbers
of smaller cooperatives and supportive governmental and
non-governmental initiatives in this tri-country region have
emerged. Best Brazil nut management practices are high-
lighted in extension books and pamphlets produced indepen-
dently in Peru (Cardo, 2000) and western Brazil (Wadt et al.,
2005b). Cross-country communications, sharing Brazil nut
harvest information and marketing strategies, have also been
fortified through a tri-country regional planning initiative
called MAP (Madre de Dios, Peru; Acre, Brazil; and Pando, Bo-
livia), which has included at least four mini-MAP Brazil nut
workshops over the last four years. Green, fair-trade and or-
ganic certification have also emerged (Ortiz, 2002), with Forest
Stewardship Council standards published for Brazil (CBMF,
2003), Peru (CP-CFV, 2005) and Bolivia (CFV, 2006). Participa-
tory mapping, silvicultural techniques, and other Brazil nut
monitoring programs for more efficient collection and im-
proved and sustained production have made headway in all
three countries. These practical initiatives have resulted in
many locally-developed management plans and have been
accompanied by real gains in local Brazil nut prices. For
example, Brazil nut collectors in Acre who followed these
management techniques received twice the price per kilo-
gram for their nuts by (Cooperativa dos Agricultores e Produt-
ores de Epitaciolandia e Brasileia) CAPEB in 2006 than those
collectors who extracted Brazil nuts traditionally, without
these practices. These socioeconomic advances provide hope
that this cornerstone extractive species will continue to play a
prominent role in the ecological and economic landscape of
Amazonia. Similarly, these types of initiatives that link eco-
logically sound management with economic gains at the local
level may serve as an example for other Category VI protected
areas in which local communities are key actors in conserv-
ing and/or converting tropical forests.
Acknowledgements
This research was supported by grants from FINEP/MCT/CNPq
in Brazil, The William and Flora Hewlett Foundation in the
U.S., and the International Science Foundation, Sweden
through a grant to Dr. Wadt. CNPT/IBAMA in Brazil gave per-
mission to conduct the research in RESEX Chico Mendes.
We also thank Paulo Rodrigues de Carvalho for his superior
field assistance and Pieter Zuidema and anonymous review-
ers for insightful comments on earlier manuscript drafts. Fi-
nally, we are most grateful to Valderi and Maria Alzenira
who graciously shared their forest home.
R E F E R E N C E S
Allegretti, M.H., 1994. Reservas extrativistas: parametros parauma polıtica de desenvolvimento sustentavel na Amazonia.In: Arnt, R. (Ed.), O Destino da Floresta: Reservas Extrativistas eDesenvolvimento Sustentavel na Amazonia. Relume-Dumara,Rio de Janeiro, Brazil, pp. 17–47.
Bakx, K., 1988. From proletarian to peasant: rural transformationin the state of Acre, 1870-1986. Journal of Development Studies24, 141–160.
Brechin, S.R., Wilshusen, P.R., Fortwangler, C.L., West, P.C., 2002.Beyond the square wheel: toward a more comprehensiveunderstanding of biodiversity conservation as social andpolitical process. Society and Natural Resources 15, 41–64.
Bouwman, M., van Dijk, S., 1999. Removal and fate of Brazil nutseeds (Bertholletia excelsa) exposed in two contrasting seeddensities in a Bolivian moist forest. M.Sc. Thesis, UtrechtUniversity, Utrecht, Netherlands.
Burnham, K.P., Anderson, D.R., 2002. Model Selection and Multi-model Inference: A Practical Information-theoretic Approach,second ed. Springer-Verlag, New York, USA.
Cardo, A.A., 2000. Manejando bien tu Castanal. Asociacion para laConservacion de la Cuenca Amazonica (AACA), PuertoMaldonado, Peru.
CBMF (Conselho Brasileiro de Manejo Florestal), 2003. Padroes decertificacao do FSC-Forest Stewardship Council (Conselho deManejo Florestal) para o manejo e exploracao de populacoesnaturais de castanha (Bertholletia excelsa), Documento Versao4.0. IMAFLORA (Instituto de Manejo e Certificacao Florestal eAgrıcola), Piracicaba, SP, Brazil.
CFV (Consejo Boliviano para la Certificacion Forestal Voluntaria),2006. Estandares bolivianos para la certificacion forestal de lacastana (Bertholletia excelsa). Santa Cruz, Bolivia.
CP-CFV (Consejo Peruano para la Certificacion ForestalVoluntaria), 2005. Estandar para la certificacion del manejoforestal com fines de produccion de castana (Bertholletiaexcelsa) en Peru. WWF-Peru, Puerto Maldonado, Peru.
B I O L O G I C A L C O N S E R V A T I O N 1 4 1 ( 2 0 0 8 ) 3 3 2 – 3 4 6 345
Clay, J.W., 1997. Brazil nuts: The use of a keystone species forconservation and development. In: Freese, C.H. (Ed.),Harvesting Wild Species: Implications for BiodiversityConservation. The Johns Hopkins University Press, Baltimore,Maryland, USA, pp. 246–282.
de Almeida, M.B., 2002. The politics of Amazonian conservation:the struggles of rubber tappers. Journal of Latin AmericanAnthropology 7, 170–219.
de Souza, A.H., 1963. Castanha do Para: Estudo botanico, quımicoe tecnologico. Ministerio da Agricultura-Servico de InformacaoAgrıcola, Estudos Tecnicos, 23. Rio de Janeiro, Brazil.
Ehringhaus, C., 2006. Post-victory dilemmas: Land use,development, and social movement in Amazonian ExtractiveReserves. Ph.D. Dissertation, Yale University, New Haven, CT,USA.
Figueiredo, F.J.C., Duarte, M.L.R., Frazao, D.A.C., Carvalho, J.E.U.,1990. Conservacao de sementes de castanha-do-Brasil sobcondicoes controladas. Embrapa, Centro de PesquisaAgropecuaria do Tropico Umido. Numero 116, Belem, Para,Brazil.
Hall, D.B., 2000. Zero-inflated Poisson and binomial regressionwith random effects: a case study. Biometrics 56, 1030–1039.
Hamill, D.N., Wright, S.J., 1986. Testing the dispersion of juvenilesrelative to adults: a new analytic method. Ecology 67 (4), 952–957.
Heywood, V.H., Iriondo, J.M., 2003. Plant conservation: oldproblems, new perspectives. Biological Conservation 113, 321–335.
Janzen, D.H., 1971. Seed predation by animals. Annual Review ofEcology and Systematics 2, 465–492.
Kainer, K.A., Duryea, M.L., de Macedo, N.C., Williams, K., 1998.Brazil nut seedling establishment and autecology in extractivereserves of Acre, Brazil. Ecological Applications 8, 397–410.
Kainer, K.A., Duryea, M.L., Malavasi, M.M., Silva, E.R., Harrison, J.,1999. Moist storage of Brazil nut seeds for improvedgermination and nursery management. Forest Ecology andManagement 116, 207–217.
Kainer, K.A., Wadt, L.H.O., Gomes-Silva, D.A.P., Capanu, M., 2006.Liana loads and their association with Bertholletia excelsa fruitand nut production, diameter growth and crown attributes.Journal of Tropical Ecology 22, 147–154.
Kainer, K.A., Wadt, L.H.O., Staudhammer, C.L., 2007. Explainingvariation in Brazil nut fruit production. Forest Ecology andManagement 250, 244–255.
Maretti, C.C., in collaboration with Wadt, L.H.O., Gomes-Silva,D.A.P., Maldonado W.T.P. de V., Sanches, R.A., Coutinho, F.,Brito, S. da S., 2005. From pre-assumptions to a ‘just worldconserving nature’: the role of category VI in protectinglandscapes, in Brown, J., Mitchell, N., Beresford, M. (Eds.), TheProtected Landscape Approach: Linking Nature, Culture andCommunity. IUCN, Gland, Switzerland and Cambridge, UK, pp.47–64.
Michelotti, F.A., 2001. Cooperativa Extrativista de Xapuri:Trajetoria de Organizacao e Gestao. M.Sc. Thesis, Nucleo deAltos Estudos Amazonicos – NAEA, Universidade Federal doPara, Brazil.
Moles, A.T., Westoby, M., 2004. Seedling survival and seed size: asynthesis of the literature. Journal of Ecology 93, 372–383.
Mori, S.A., Prance, G.T., 1990. Taxonomy, ecology, and economicbotany of the Brazil nut (Bertholletia excelsa Humb. and Bonpl.:Lecythidaceae). Advances of Economic Botany 8, 130–150.
Muller, C.H., 1982. Quebra da dormencia da semente e enxertiaem castanha-do-brasil. Embrapa, Centro de PesquisaAgropecuaria do Tropico Umido. Documentos 16, Belem, Para,Brazil.
Muller, C.H., 1981. Castanha-do-brasil: estudos agronomicos.Embrapa, Centro de Pesquisa Agropecuaria do Tropico Umido.Documentos 1, Belem, Para, Brazil.
Muller, C.H., Rodrigues, I.A., Muller, A.A., Muller, N.R.M., 1980.Castanha-do-Brasil: resultados de pesquisa. Embrapa, Centrode Pesquisa Agropecuaria do Tropico Umido. Miscelanea 2,1–25.
Myers, G.P., Newton, A.C., Melgarejo, O., 2000. The influence ofcanopy gap size on natural regeneration of Brazil nut(Bertholletia excelsa) in Bolivia. Forest Ecology and Management127, 119–128.
Nelson, B.W., Absy, M.L., Barbosa, E.M., Prance, G.T., 1985.Observations on flower visitors to Bertholletia excelsa H.B.K. andCouratari tenuicarpa A.C. Sm. (Lecythidaceae). Acta Amazonica15, 225–234.
Nepstad, D., McGrath, D., Alencar, A., Barros, A.C., Carvalho, G.,Santilli, M., Vera Diaz Mdel, C., 2002. Frontier governance inAmazonia. Science 295, 629–631.
Oates, J.F., 1999. Myth and reality in the rain forest: howconservation strategies are failing in West Africa. University ofCalifornia Press, Berkeley, CA, USA.
O’Malley, D.M., Buckley, D.P., Prance, G.T., Bawa, K.S., 1988.Genetics of Brazil nut (Bertholletia excelsa Humb & Bonpl.:Lecythidaceae). Theoretical and Applied Genetics 76, 929–932.
Ortiz, E.G., 2002. Brazil nut (Bertholletia excelsa). In: Shanley, P.,Pierce, A.R., Laird, S.A., Guillen, A. (Eds.), Tapping theGreen Market: Certification & Management of Non-timberForest Products. Earthscan Publications Ltd., London, UK,pp. 61–74.
Peres, C.A., Baider, C., 1997. Seed dispersal, spatial distributionand population structure of Brazilnut trees (Bertholletia excelsa)in southeastern Amazonia. Journal of Tropical Ecology 13, 595–616.
Peres, C.A., Baider, C., Zuidema, P.A., Wadt, L.H.O., Kainer, K.A.,Gomes-Silva, D.A.P., Salomao, R.P., Simoes, L.L., Francisiosi,E.R.N., Valverde, F.C., Gribel, R., Shepard Jr., G.H., Kanashiro,M., Coventry, P., Yu, D.W., Watkinson, A.R., Freckleton, R.P.,2003. Demographic threats to the sustainability of Brazil nutexploitation. Science 302, 2112–2114.
Peters, C.M., 1996. The ecology and management of non-timberforest resources World Bank Technical Paper 322, The WorldBank, Washington, D.C., USA.
Peto, R., Peto, J., 1972. Asymptotically efficient rank invariantprocedures. Journal of the Royal Statistical Society A135, 185–207.
Prance, G.T., 1976. The pollination and androphore structure ofsome Amazonian Lecythidaceae. Biotropica 8, 235–241.
Quinn, G.P., Keough, M.J., 2002. Experimental Design and DataAnalysis for Biologists. Cambridge University Press,Cambridge, UK.
Rosas, G.K.C., 2006. Pressao de caca, abundancia, densidade eriqueza de mamıferos em duas areas de coleta de castanha-do-brasil situadas no sudoeste do Estado do Acre, Brasil. M.Sc.Thesis, Universidade Federal do Acre, Acre, Brazil.
SAS Institute, Inc., 2004. SAS, Version 9.1. Cary, NC, USA.Serrano, R.O.P., 2005. Regeneracao e estrutura populacional de
Bertholletia excelsa H. B. K. em areas com diferentes historicosde ocupacao, no Vale do Rio Acre (Brasil). M.Sc. Thesis,Universidade Federal do Acre, Acre, Brazil.
Silvertown, J., 2004. Sustainability in a nutshell. Trends in Ecologyand Evolution 10, 276–278.
Stoian, D., 2005. Making the best of two worlds: rural and peri-urban livelihood options sustained by nontimber forestproducts from the Bolivian Amazon. World Development 33,1473–1490.
Stone, S.S., 2003. From tapping to cutting trees: participation andagency in two community-based timber management projectsin Acre, Brazil. Ph.D. Dissertation, University of Florida,Gainesville, Florida, USA.
Terborgh, J., 1999. Requiem for Nature. Island Press, Washington,DC, USA.
346 B I O L O G I C A L C O N S E R V A T I O N 1 4 1 ( 2 0 0 8 ) 3 3 2 – 3 4 6
Ticktin, T., 2004. The ecological implications of harvesting non-timber forest products: a review. Journal of Applied Ecology 41,11–21.
Vander Wall, S.B., Kuhn, K.M., Beck, M.J., 2005. Seed removal, seedpredation, and secondary dispersal. Ecology 86 (3), 801–806.
Viana, V.M., Mello, R.A., Moraes, L.M., Mendes, N.T., 1998. Ecologiae manejo da castanha do Para em reservas extrativistas deXapurı, Acre. In: Gascon, C., Moutinho, P. (Eds.), FlorestaAmazonica: Dinamica, regeneracao e manejo. Ministerio daCiencia e Tecnologia. Instituto Nacional de Pesquisa daAmazonia, Manaus, Amazonas, Brazil, pp. 277–292.
Vieira, S., Trumbore, S., Camargo, P.B., Selhorst, D., Chambers, J.Q.,Higuchi, N., 2005. Slow growth rates of Amazonian trees:consequences for carbon cycling. Proceedings of the NationalAcademy of Sciences 102, 18502–18507.
Wadt, L.H.O., Kainer, K.A., Cartaxo, C.B. da C., Nunes, G.M., Leite,F.M.N., Gomes-Silva, D.A.P., Sousa, M. de M.M., 2005b. Manejoda castanheira (Bertholletia excelsa) para producao de castanha-
do-brasil. Secretaria de Extrativismo e Producao Familiar,Documento Tecnico, 3, Acre, Brazil.
Wadt, L.H.O., Kainer, K.A., Gomes-Silva, D.A.P., 2005a. Populationstructure and nut yield of a Bertholletia excelsa stand inSouthwestern Amazonia. Forest Ecology and Management211, 371–384.
Wallace, R.H., 2004. The effects of wealth and markets on rubbertapper use and knowledge of forest resources in Acre, Brazil.Ph.D. Dissertation, University of Florida, Gainesville, Florida,USA.
Zuidema, P.A., Boot, R.G.A., 2002. Demography of the Brazil nuttree (Bertholletia excelsa) in the Bolivian Amazon: impact ofseed extraction on recruitment and population dynamics.Journal of Tropical Ecology 18, 1–31.
Zuidema, P.A., 2003. Demography and management of the nuttree (Bertholletia excelsa). PROMAB (Programa Manejo deBosques de la Amazonıa Boliviana), Scientific Series 6,Riberalta, Bolivia.