Effect of defects on the intrinsic strength and stiffness of graphene
Upload
khangminh22Category
view
1download
0
N A T I O N A L C O O P E R A T I V E H I G H W A Y R E S E A R C H P R O G R A M R E P O R T
EFFECT OF WELDMENTS ON THE FATIGUE STRENGTH OF STEEL BEAMS
H I G H W A Y R E S E A R C H B O A R D N A T I O N A L R E S E A R C H C O U N C I L
N A T I O N A L A C A D E M Y O F S C I E N C E S - N A T I O N A L A C A D E M Y O F E N G I N E E R I N G
HIGHWAY RESEARCH BOARD 1970
Officers D. G R A N T M I C K L E , Chairman C H A R L E S E . S H U M A T E , First Vice Chairman A L A N M. V O O R H E E S , Second Vice Chairman W. N. C A R E Y , JR., Executive Director
Executive Committee F . C . T U R N E R , Federal Highway Administrator, U. S. Department of Transportation (ex officio) A. E . JOHNSON, Executive Director, American Association of State Highway Officials (ex officio) E R N S T W E B E R , Chairman, Division of Engineering, National Research Council (ex officio) D A V I D H. S T E V E N S , Chairman, Maine State Highway Commission (ex officio. Past Chairman, 1968) OSCAR T. M A R Z K E , Vice President. Fundamental Research, U. S. Steel Corporation (ex officio, Past Chairman, 1969) D O N A L D S. B E R R Y , Department of Civil Engineering, Northwestern University C H A R L E S A. B L E S S I N G , Director, Detroit City Planning Commission J A Y W. BROWN, Director of Road Operations, Florida Department oj Transportation J. D O U G L A S C A R R O L L , JR., Executive Director, Tri-State Transportation Commission, New York H O W A R D A. C O L E M A N , Consultant, Missouri Portland Cement Company H A R M E R E . DAVIS , Director, Institute of Transportation and Traffic Engineering, University of California W I L L I A M L . G A R R I S O N , School of Engineering, University of Pittsburgh S I D N E Y G O L D I N , Consultant, Witco Chemical Company W I L L I A M J . H E D L E Y , Consultant, Program and Policy, Federal Highway Administration G E O R G E E . H O L B R O O K , E. I. du Pont de Nemours and Company E U G E N E M. JOHNSON, President, The Asphalt Institute JOHN A. L E G A R R A , State Highway Engineer and Chief of Division, California Division of Highways W I L L I A M A. M c C O N N E L L , Director, Operations Office, Engineering Staff, Ford Motor Company JOHN J . M c K E T T A , Executive Vice Chancellor for Academic Affairs, University of Texas J. B. M c M O R R A N , Considlant D. G R A N T M I C K L E , President, Highway Users Federation for Safety and Mobility R. L . P E Y T O N , Assistant State Highway Director, State Highway Commission of Kansas C H A R L E S E . S H U M A T E , Executive Director-Chief Engineer, Colorado Department of Highways R. G . STAPP, Superintendent, Wyoming Slate Highway Commission A L A N M. V O O R H E E S , Alan M. Voorhees and Associates
NATIONAL COOPERATIVE HIGHWAY RESEARCH PROGRAM
Advisory Committee D. G R A N T M I C K L E , Highway Users Federation for Safety and Mobility (Chairman) C H A R L E S E . S H U M A T E , Colorado Department of Highways A L A N M. V O O R H E E S , Alan M. Voorhees and Associates F . C . T U R N E R , U. S. Department of Transportation A. E . JOHNSON, American Association of State Highway Officials E R N S T W E B E R , National Research Council D A V I D H. S T E V E N S , Maine Slate Highway Commission O S C A R T. M A R Z K E , United Stales Steel Corporation W. N. C A R E Y , JR., Highway Research Board
General Field of Design Area of Bridges Advisory Panel C 12-7 H. T . D A V I D S O N , Connecticut Department of Transportation (Chairman) }. N. C L A R Y , Virginia Department of Highways A. L . E L L I O T T , California Department of Public Works T. R. H I G G I N S , American Institute of Steel Construction C. L . HULSBOS, University of New Mexico W. H. M U N S E , University of Illinois F . A. R E I C K E R T , Consultant I . M. V I E S T , Bethlehem Steel Corporation C. F . S C H E F F E Y , Federal Highway Administration L . F . SPAINE, Highway Research Board
Program Staff K . W . H E N D E R S O N , J R . , Program Director W . C . G R A E U B , Projects Engineer J . R . N O V A K , Projects Engineer H. A . S M I T H , Projects Engineer W . L . W I L L I A M S , Projects Engineer
H E R B E R T P . O R L A N D , Editor
R O S E M A R Y S . M A P E S , Editor
C A T H E R I N E B . C A R L S T O N , Editorial Assistant L . M . M A C G R E G O R , Administrative Engineer

N A T I O N A L C O O P E R A T I V E H I G H W A Y R E S E A R C H P R O G R A M R E P O R T
EFFECT OF WELDMENTS ON THE FATIGUE STRENGTH OF STEEL BEAMS
J O H N W . F I S H E R , K A R L H . F R A N K , M A N F R E D A . H I R T ,
A N D B E R N A R D M . M c N A M E E
L E H I G H U N I V E R S I T Y
B E T H L E H E M , P E N N S Y L V A N I A
R E S E A R C H S P O N S O R E D BY THE A M E R I C A N A S S O C I A T I O N
O F STATE H I G H W A Y O F F I C I A L S IN C O O P E R A T I O N
WITH THE B U R E A U O F P U B L I C R O A D S
NAS-NAE S U B J E C T C L A S S I F I C A T I O N S NOV 1 2 1970
BRIDGE D E S I G N
G E N E R A L M A T E R I A L S . ^ - ^ . ,
L m R Y
H I G H W A Y R E S E A R C H B O A R D D I V I S I O N O F E N G I N E E R I N G N A T I O N A L R E S E A R C H C O U N C I L
N A T I O N A L A C A D E M Y O F S C I E N C E S — N A T I O N A L A C A D E M Y O F E N G I N E E R I N G 1 9 7 0
NATIONAL COOPERATIVE HIGHWAY R E S E A R C H PROGRAM
Systematic, well-designed research provides the most effective approach to the solution of many problems facing highway administrators and engineers. Often, highway problems are of local interest and can best be studied by highway departments individually or in cooperation wi th their state universities and others. However, the accelerating growth of highway transportation develops increasingly complex problems of wide interest to highway authorities. These problems are best studied through a coordinated program of cooperative research.
In recognition of these needs, the highway administrators of the American Association of State Highway Officials initiated in 1962 an objective national highway research program employing modern scientific techniques. This program is supported on a continuing basis by funds f r o m participating member states of the Association and i t receives the f u l l cooperation and support of the Bureau of Public Roads, United States Department of Transportation.
The Highway Research Board of the National Academy of Sciences-National Research Council was requested by the Association to administer the research program because of the Board's recognized objectivity and understanding of modern research practices. The Board is uniquely suited fo r this purpose as: i t maintains an extensive committee structure f r o m which authorities on any highway transportation subject may be drawn; it possesses avenues of communications and cooperation wi th federal, state, and local governmental agencies, universities, and industry; its relationship to Its parent organization, the National Academy of Sciences, a private, nonprofit institution, is an insurance of objectivity; i t maintains a full- t ime research correlation staff of specialists in highway transportation matters to bring the findings of research directly to those who are in a position to use them.
The program is developed on the basis of research needs identified by chief administrators of the highway departments and by committees of A A S H O . Each year, specific areas of research needs to be included in the program are proposed to the Academy and,the Board by the American Association o f State Highway Officials. Research projects to f u l f i l l these needs are defined by the Board, and qualified research agencies are selected f r o m those that have submitted proposals. Administration and surveillance of research contracts are responsibilities of the Academy and its Highway Research Board.
The needs fo r highway research are many, and the National Cooperative Highway Research Program can make significant contributions to the solution of highway transportation problems of mutual concern to many responsible groups. The program, however, is intended to complement rather than to substitute f o r or duplicate other highway research programs.
NCHRP Report 102
Project 12-7 FY "67 ISBN 0-309-01890-0 L C. Card No 73-607815
Price: $5.40
This report is one of a series of reports issued from a continuing research program conducted under a three-way agreement entered into m June 1962 by and among the National Academy of Sciences-NaUonal Research Council, the American Association of State Highway Officials, and the U. S. Bureau of Pubhc Roads. Individual fiscal agreements are executed annually by the Academy-Research Councd, the Bureau of Pubhc Roads, and participating state highway departments, members of the American Association of State Highway Officials. This report was prepared by the contractmg research agency. It has been reviewed by the appropriate Advisory Panel for clarity, documentation, and fulfillment of the contract. It has been accepted by the Highway Research Board and published in the interest of effective dissemination of findings and their application in the formulation of policies, procedures, and pracUces in the subject problem area.
The opinions and conclusions expressed or implied m these reports are those of the research agencies that performed the research. They are not necessarily those of the Highway Research Board, the National Academy of Sciences, the Bureau of Pubhc Roads, the American Association of State Highway Officials, nor of the individual states participating in the Program
Published reports of the
NATIONAL COOPERATIVE HIGHWAY R E S E A R C H PROGRAM
are available f r o m .
Highway Research Board National Academy of Sciences 2101 Constitution Avenue Washington, D.C 20418
(See last pages for list of published titles and prices)
FOREWORD By Staff
Highway Research Board
This report contains suggestions for revisions to those sections of the AASHO Standard Specifications for Highway Bridges dealing with allowable fatigue stresses. The suggested revisions are, of course, also applicable to other specifications, such as those of the American Welding Society and the American Railway Engineering Association The report is recommended to engineers, researchers, and members of specification-writing bodies concerned with the use of welded steel beams. Although the most immediate importance of the report is to specifications, the wealth of information presented should be valuable to all structural engineers designing welded steel beams.
Fatigue fractures observed in the cover-plated steel beam bridges included in the AASHO Road Test, as well as those obtained in other similar structures, emphasize the important effect of welding and welded details on the life expectancy of welded highway beam or girder bridges. Also of great significance are such factors as the loading history to which the structures are subjected, the types of materials used, the design details, and the quality of fabrication. Among the more important design details are cover plates, stiffeners, attachments, and splices. In the past only approximate general mathematical design relationships have been possible on the basis of limited experimental data. However, with the conduct of additional research, including analysis and evaluation of the many interrelated fatigue parameters, suitable basic relationships can be developed to properly design welded bridges for a desired life expectancy.
Lehigh University and its subcontractor, Drexel University, conducted the first major step in the additional research referred to above by a statistically designed experimental program that included 374 specimens tested under controlled conditions so that analysis of the resulting data revealed the significance of several parameters believed to be important in fatigue behavior The experimental design also permitted the determination of experimental variation.
This meticulous approach provided a solid base on which to incorporate and compare the results of previous related research. The total compilation of the results from this study and previous research forms the basis for a clearer understanding of fatigue behavior of welded beams; hence, recommendations for more realistic specifications.
Much more work remains to be done to define the fatigue effects of stiffeners, attachments, lateral bracing details, and, most challenging, variable-cycle loading.

As a continuation of the work reported here, Lehigh University will conduct additional research on the fatigue effects of the first three of these items. A report is expected to be issued on this work in late 1973.
N C H R P Project 12-12, "Welded Steel Bridge Members Under Variable-Cycle Fatigue Loadings," is anticipated to begin in late 1970, and a report is expected sometime in 1975.
1
f
CONTENTS
1 S U M M A R Y
PART I
2 C H A P T E R O N E Introduction and Research Approach
Description of the Problem
Objectives and Scope
Design Variables
Experiment Design
Fabrication
Experimental Procedures
Nomenclature and Symbols
10 C H A P T E R T W O Findings
Literature Review
Study Results
Design
13 C H A P T E R T H R E E Results and Appraisal of Fatigue Strength
Fatigue Strength of Cover-Plated Beams
Fatigue Strength of Welded Beams
Fatigue Strength of Beams wi th Tapered or Curved Flange Splices
Fatigue Strength of Rolled Beams
Stress Analysis of Crack Propagation
Constant and Variable Amplitude Loading of Notched Groove Welds
44 C H A P T E R F O U R Rccommendations and Application
46 C H A P T E R F I V E Conclusions
Cover-Plated Beams
Plain Welded Beams
Groove Welds at Flange-Width Transitions
Rolled Beams
Variable Loading
48 C H A P T E R S I X Recommendations for Further Work
Suggested Studies
49 R E F E R E N C E S
PART II
51 A P P E N D I X A History and Summary of Previous Work
53 A P P E N D I X B Experiment Design
57 A P P E N D I X c Fabrication Details
61 A P P E N D I X D Material Properties and Beam Characteristics
68 A P P E N D I X E Experimental and Analytical Techniques
73 A P P E N D I X F Beams wi th Welded Cover Plates
87 A P P E N D I X G Welded Beams
97 A P P E N D I X H Groove-Welded Splices
106 A P P E N D I X I Rolled Beams
111 A P P E N D I X J A Pilot Study on Variable-Amplitude Loading
113 A P P E N D I X K Nomenclature
ACKNOWLEDGMENTS
The research reported herein was performed under NCHRP Project 12-7 by the Fritz Engineering Laboratory, Department of Civil Engineermg, Lehigh University, and the Department of Civil Engineering, Drexel .Institute of Technology. Lehigh University was the contractor for this study. A subcontract was entered into with Drexel Institute of Technology by Lehigh University
John W Fisher, Professor of Civil Engineering, Lehigh University, was principal investigator. The other authors of this report are, respectively, Karl H . Frank and Manfred A. Hirt , Research Assistants, Fritz Engineering Laboratory, Lehigh University, and Bernard M McNamee, Professor of Civil Engineering, Drexel University.
The work was done under the general supervision of Professor Fisher, the principal investigator. The work at Drexel was done under the supervision of Professor NcNamee with the assistance of Fred Schmitt, Research Assistant, and Allen Yerger, Technician The work at Lehigh was under the supervision of Professor Fisher and Ben T. Yen, Associate Professor of Civil Engineering, with the assistance of Research Assistants Karl H . Frank, Manfred A. Hirt, Thomas Gallagher, and Minuro Ohta, and Technician Paul Nowaczek
Appendix F was prepared by Mr Frank and Professor Fisher, Appendices G and I were prepared by Mr. Hir t and Professor Fisher, Appendix H was prepared by Professor McNamee and Mr. Schmitt; and Appendix J was prepared by Messrs. Yen and Gallagher.
Both Lehigh University and Drexel University financially supported a portion of this work as a public service by permitting the project to be undertaken at a less-than-audited rate
In addition, the authors are grateful to the Bethlehem Steel Corporation for providing the specimens at a reduced cost.
Sincere thanks are due Fritz Laboratory staif members Charlotte Yost, Shirley Labert, Joanne Mies, and Karen Philbin, who typed the manuscript; Richard Sopko for outstanding photographic work; and John M . Gera and Sharon Balogh for their expertise with the line drawmgs Kenneth Harpel, Laboratory Superintendent, and his staff were invaluable in their assistance during the performance of the testing
Professor Lynn S. Beedle, Director of Fritz Engineering Laboratory, Professor David A VanHom, Chairman of the Department of Civil Engineering, Lehigh University, and Professor John L . Rumpf, former Chairman of the Department of Civil Engineering, Drexel University, are thanked for their encouragement and support
EFFECT OF WELDMENTS ON THE FATIGUE STRENGTH OF STEEL BEAMS
SUMMARY Stress range was observed to account for nearly all the variation in cycle life of the test beams and details examined in this study. Use of this fact should be made in the provisions of the AASHO Standard Specifications for Highway Bridges.
For purposes of design, this study has shown that the fatigue strength of a given welded detail is independent of the strength of steel. Tests of rolled A3 6 and A441 steel beams also yielded about the same fatigue strength. The AASHO Specifications should reflect this finding for rolled beams, welded beams, flange splices, and cover-plated beams.
Failure to properly control and measure the variables influencing the fatigue strength during previous studies was the major reason for the apparently conflicting and contradictory claims on the stress variables and material characteristics.
The study has confirmed that large gaps exist in the state of knowledge of the fatigue behavior of other details and in regions not covered by this study. Additional research is needed at higher and lower levels of stress range and at other levels of minimum stress to aid in defining completely the upper and lower boundaries of fatigue strength. In addition, other details and notch conditions require examination. This will permit the development of comprehensive design criteria for highway bridges.
Variations in cover-plate geometry for each end detail had no significant effect on the fatigue strength except for beams with cover plates wider than the beam flange at the end without transverse fillet weld. Existing specification provisions that limit the thickness of the cover plate (or total thickness of multiple cover plates) on a flange to 1V2 times the flange thickness can be hberalized. Cover plates may also be attached singly or in multiples without any difference in strength resulting.
When cover plates are wider than the flange to which they are attached a decrease in fatigue strength will result unless transverse end welds are used. Hence, transverse end welds should be required on wide cover plates. The end weld may be returned around the beam flange or stopped short of the flange toes. Cover plates narrower than the flange to which they are attached may have the end weld omitted if desired.
Plain welded beams do not exhibit the same fatigue strength as base metal, as currently assumed in the AASHO provisions. A separate provision should be added that reflects the decreased strength of plain welded beams. Care should also be taken to control the smoothness of the flange tips. Obvious notches in the flange tips should be removed by grinding, as the growth of cracks is more severe when initiated from the tip.
The 2-ft-radius transition at flange groove welds in all steels and the tapered transition at groove welds in A36 and A441 steels were not significantly different. They yielded the same fatigue strength as was provided by plain welded beams without the transition and groove welds. Groove-welded splices with the reinforcement
removed should be designed for fatigue using the same design stresses that are suggested for plain welded beams.
Because the straight transition in A36 and A441 steel with a 1 to 2Vi taper yielded the same fatigue strength as the 2-ft-radius transition, the tapered transition should be used in place of the currently required 2-ft radius as it is more economical to use.
The 2-ft-radius transition should be used for A514 steel until further research is available.
The results of the studies on plain rolled beams did not correlate with existing studies on plate specimens. This appears to be caused by the greater probability of a defect occurring in the beam and the stress concentration at the web-flange junction.
The empirical exponential model relating stress range to cycle life was observed to provide the best fit to the test data for all beam series. Suitable mathematical design relationships can be developed from the S-N functions.
A theoretical stress analysis based on the fracture mechanics of crack growth substantiated the empirical exponential model that provided the best fit to the test data. In addition, the theoretical analysis provided a means of rationally explaining the observed behavior of the experimental results.
The pilot study on variable-amplitude loading indicated that most of the fatigue damage was caused by the higher amplitudes of loading. The RMS (root mean square) stress range of the larger stress blocks correlated with the constant-cycle tests of similar specimens. In actual bridges, the assiuned design stress can be considered an estimate of the RMS stress range. Hence, the use of constant-amplitude fatigue data for design provisions is reasonable.
C H A P T E R O N E
INTRODUCTION AND RESEARCH APPROACH
The fatigue strength of welded steel beams is the significant design criterion for many steel highway bridges. Recognition of this fact led to the bridge studies of the American Association of State Highway Officials ( A A S H O ) Road Test and the formulation of the problem statement on which this research study was based.
DESCRIPTION O F T H E P R O B L E M
Fatigue may be defined as the initiation and propagation of microscopic cracks into macroscopic cracks by the repeated application o f stresses These stresses individually are not large enough to cause static failure, but, i f the macroscopic cracks are allowed to increase in size, structural failure of the member wil l result f r o m the reduction m the effective load-carrying area of the cross section.
Fatigue cracking has been observed in a variety of welded engineering structures and components, including the cover-plated steel beam bridges o f the A A S H O Road
Test (72 ) . The history of welded highway bridges has been satisfactory. Most failures have been due to mistakes in either design or fabrication. Tests such as the A A S H O Road Test bridges show that fatigue must be a consideration in bridge design. Equally important to the fatigue life of highway bridges is the significance of such factors as the loading to which the structures are subjected, the type of materials used, the design details, and the quality of fabrication. Proper design and fabrication wi l l ensure that fatigue failures w i l l not occur. There is a need fo r additional knowledge in this area so that highway bridges remain functional for their intended Lfe.
Previous experimental work (77, 22, 40) indicated that three major factors affect the fatigue strength and l i f e :
1 Type of weld detail. 2. Stress conditions. 3. Type of steel.
Rate of loading, rest periods, temperature, surface finish, corrosion, and other miscellaneous factors w i l l also affect the fatigue strength and l i fe . However, their influence in practical situations is not considered to be as great. Suitable control of some of these factors through proper weld fabrication procedure and inspection, adequate bridge in spection, and bridge loading regulations further lessen their influence.
A brief summary of previous work is given in Appendix A . This examination indicated that substantial variations have existed in the data obtained f r o m several sources Because these studies did not provide statistical control o f the design factors that influence the fatigue strength, it was not possible to determine the significance of the variations that were observed. Also, the experimental studies did not provide enough replication to adequately define the experimental error.
I t was noted i n a previous evaluation o f existing data on cover-plated beams that (77) "the major need was for experiment designs which provide data that enables a rational evaluation of the significance and importance of the major variables that affect the fatigue-life of cover-plated beams." This same need was observed to exist fo r other welded details.
In the present design of steel bridges for fatigue, approximate mathematical design relationships have been specified on the basis of the limited available test data. The additional research in this project provides an analysis and evaluation o f the present design factors and proposes modifications, where required, so that improved criteria can be used fo r the design of welded highway bridges.
O B J E C T I V E S AND S C O P E
The principal objective of this project was to develop mathematical design relationships that would define in general terms the fatigue strength of rolled and welded beams, rolled and welded beams with cover plates, and welded beams wi th flange splices under cyclic loading.
This was to be accomplished by:
1. Review of existing fatigue data fo r beams with these welded details and any existing mathematical relationships that define their behavior.
2. Development and performance of statistically controlled experiments that would permit formulation of suitable mathematical relationships relating the fatigue behavior of the beams to design details, applied stresses, and type o f steels.
To accomplish these project objectives, 374 steel beams were fabricated and tested during the research program. Of this total, 204 were fabricated wi th cover plates. Each cover plate had two weld details. Each cover plate was welded to the flange wi th longitudinal fillet welds and wi th a transverse fillet weld at one end and without the transverse weld at the other end.
There were 86 plain rolled and plain welded beams tested to determine the fatigue strength o f the basic structural members without the cover-plate and flange splice details. Besides serving as a basis of comparison, these
tests expanded the existing test data for the plain rolled and plain welded beams.
Eighty-four beams were fabricated for the series of tests on welded beams wi th flange splices. Each beam had two types of splices to provide fo r the transition in flange width. Both splices employed butt welds wi th ground reinforcement. There were no tests of flange splices wi th the butt-weld reinforcement left in place.
The testing o f beams i n this project was limited to constant magnitude cyclic loading. Previous experimental work has been with this type of loading and specification provisions have relied heavily on this basic loading condition. I n addition, existing studies of structures in service and the A A S H O Road Test have indicated that the maximum stress cycles cause most of the fatigue damage (7, 2, 72, 22, 40,61,63).
I n addition to these studies, pilot fatigue studies on random loading, which was designed to simulate service load conditions for steel highway bridges, were undertaken. The specimens for these studies were notched bars.
DESIGN VARIABLES
The principal design variables fo r this study were those associated with three major categories—type of detail, stress condition, and type of steel.
Because an evaluation o f cover-plated beams was of major importance, particular emphasis was placed on this type of detail. A n examination o f previous studies and review of existing specification provisions indicated that two basic types of details were o f interest—square-ended cover plates with or without a transverse end weld.
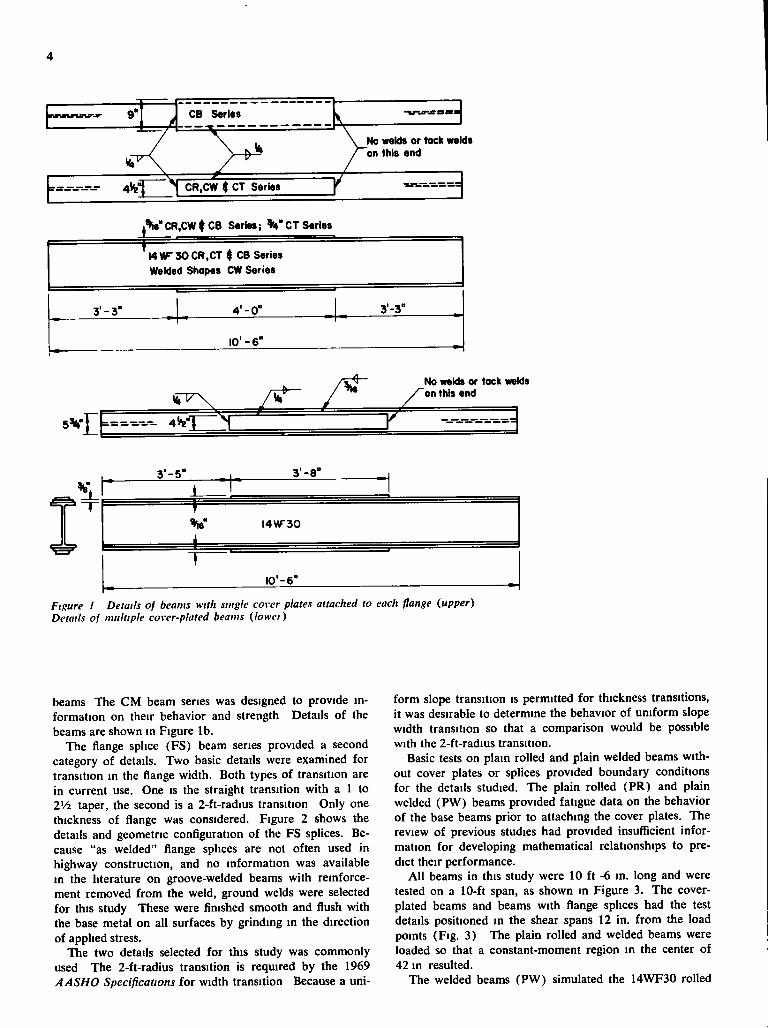
Further variations of these two basic end conditions were examined. This included variation in the thickness of the cover plate, variation in the width of the cover plate, and the use o f more than one cover plate on each flange. Figure 1 shows the basic details considered in the cover-plate study. Cover plates were attached to both rolled ( C R ) and welded ( C W ) beams to provide information on whether the behavior of the cover-plate detail was influenced by the base beam. Although there were indications that the i n fluence was negligible, ( 7 7 ) , i t was desirable to substantiate this over a wide variation of stress and types of steel. For this test series the cover plates were proportioned so that their thickness was I V i times the flange thickness. This IS the l imi t of thickness that is permitted in the 1969 AASHO Standard Specifications for Highway Bridges.
The C T beams had cover plates wi th thicknesses equal to twice the flange thickness. This permitted an evaluation of the significance of geometric proportions of the flange and cover plate on faUgue behavior, and also provided information outside the current specification limitation.
The CB test series was designed to evaluate the effect that cover plates wider than the beam flange would have on fatigue strength Although not often used, this may be a desirable detail because higher-strength steels have allowable stresses that decrease wi th increased plate thickness. A wider cover plate of smaller thickness may prove to be more economical.
No information was available on multiple cover-plated
CB S«rles
No welds or tack welds on this end
4lfe' ^ [ T r . C W < CT S e r ^
i V C R . C W ^ C B Series; V C T Series
' |4VF30CR,CT $ CB Series Welded Shapes CW Series
3' -3" 4"-0" 1 3'-3"
10"-6"
No welds or tack welds "on this end
r
— 3 - 3 _ 1 ,
•
V i
I4W30
10'-6"
Fmure I Details of beams with single cover plates attached to each flange (upper) Details of multiple cover-plated beams (lowei)
beams The C M beam series was designed to provide information on their behavior and strength Details of the beams are shown m Figure l b .
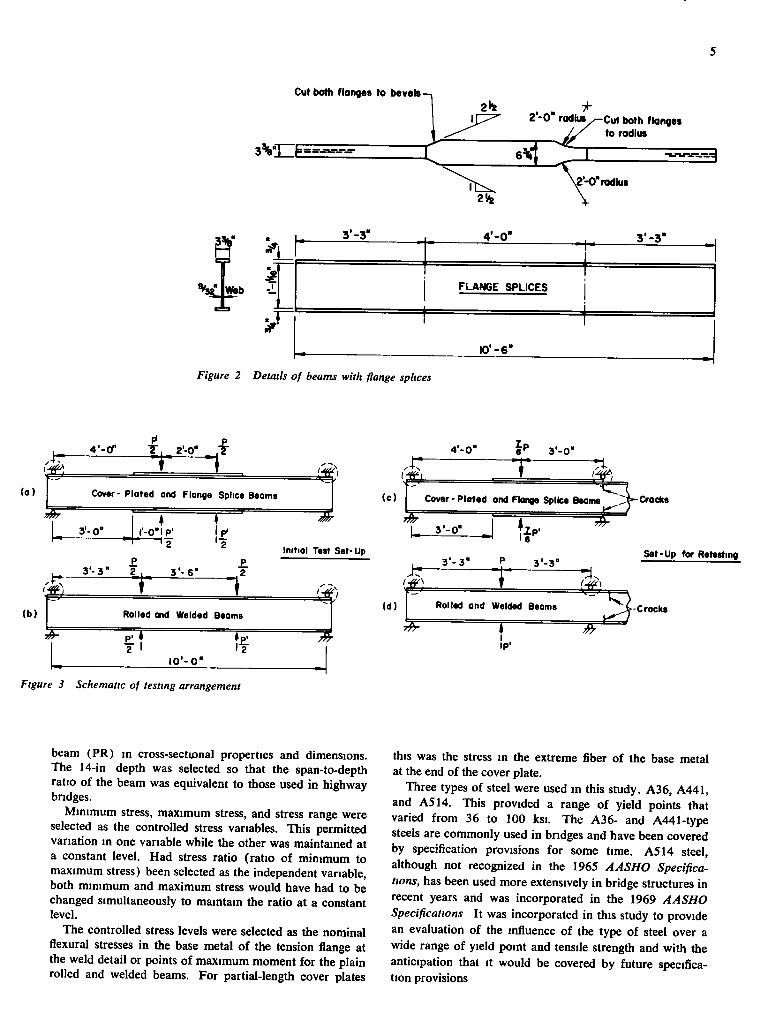
The flange splice (FS) beam series provided a second category of details. Two basic details were examined for transition in the flange width. Both types of transition are in current use. One is the straight transition with a 1 to 2'/2 taper, the second is a 2-ft-radius transition Only one thickness of flange was considered. Figure 2 shows the details and geometric configuration of the FS splices. Because "as welded" flange splices are not often used in highway construction, and no information was available in the literature on groove-welded beams with reinforcement removed f r o m the weld, ground welds were selected fo r this study These were finished smooth and flush with the base metal on all surfaces by grinding in the direction of applied stress.
The two details selected for this study was commonly used The 2-ft-radius transition is required by the 1969 AASHO Specifications fo r width transition Because a uni
f o r m slope transition is permitted for thickness transitions, i t was desirable to determine the behavior o f uni form slope width transition so that a comparison would be possible with the 2-ft-radius transition.
Basic tests on plain rolled and plain welded beams without cover plates or splices provided boundary conditions for the details studied. The plain rolled (PR) and plain welded (PW) beams provided fatigue data on the behavior of the base beams prior to attaching the cover plates. The review of previous studies had provided insuflicient information for developing mathematical relationships to predict their performance.
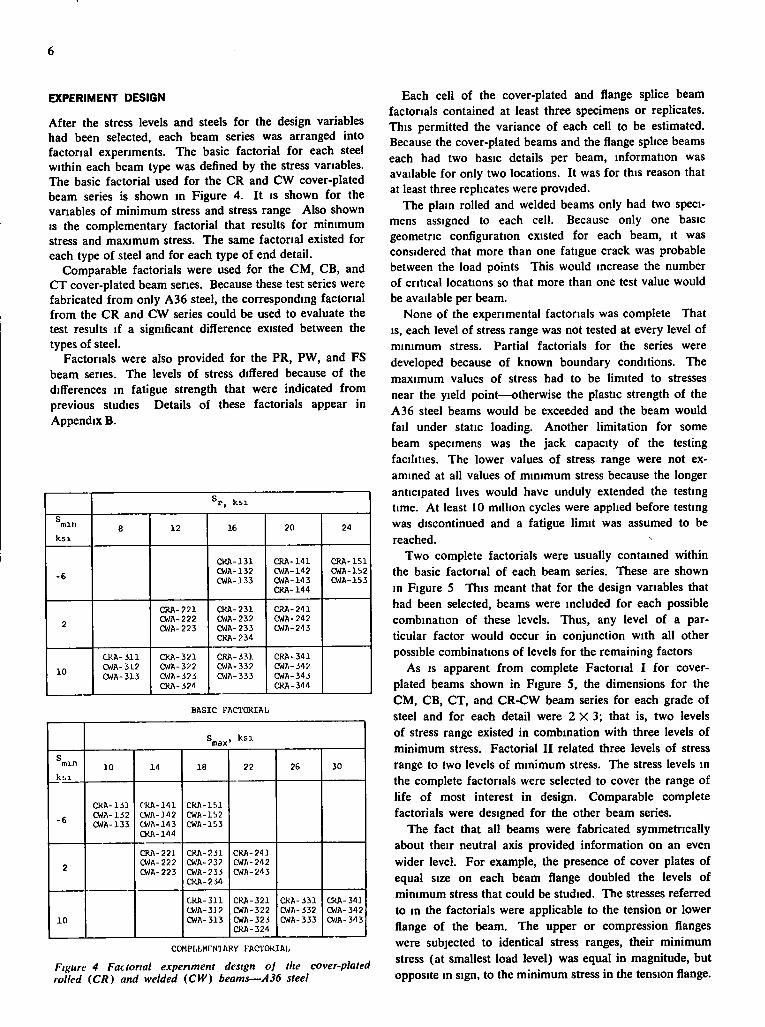
A l l beams in this study were 10 f t -6 in . long and were tested on a 10-ft span, as shown in Figure 3. The cover-plated beams and beams with flange splices had the test details positioned in the shear spans 12 in . f r o m the load points (Fig. 3) The plain rolled and welded beams were loaded so that a constant-moment region in the center of 42 in resulted.
The welded beams (PW) simulated the 14WF30 rolled
Cut both flange* to bevels 2>4 . . Tt-
2 -0 radiu»/-Cut both flanges I radius
Z'-O'radlus
j FLANGE SPLICES
1-1 H
ID'-6"
Figure 2 Details of beams with flange splices
(o) Cover- Plated and Flange Splice Beams
k •
1 — 3'-0" l'-0"lp' -1 o
£ P 3 ' - 3 ' 2 , 3 ' - 6 " T
(b)
Initial Test Set-Up
Rolled and Welded Beams
£ 1 * 2 I
l O ' - O -
Figure i Schematic of testing arrangement
4'-0" 3'-0"
T (c) Cover-Plated and Flange Splice Beams ";t-Croclie
3 ' - 3 " Set-Up for Retesting
(d) Rolled and Welded Beams
I IP'
Crocks
beam (PR) in cross-sectional properties and dimensions. The 14-in depth was selected so that the span-to-depth ratio of the beam was equivalent to those used in highway bridges.
Min imum stress, maximum stress, and stress range were selected as the controlled stress variables. This permitted variation in one variable while the other was maintained at a constant level. Had stress ratio (ratio of minimum to maximum stress) been selected as the independent variable, both minimum and maximum stress would have had to be changed simultaneously to maintain the ratio at a constant level.
The controlled stress levels were selected as the nominal flexural stresses in the base metal o f the tension flange at the weld detail or points of maximum moment f o r the plain rolled and welded beams. For partial-length cover plates
this was the stress in the extreme fiber of the base metal at the end of the cover plate.
Three types of steel were used in this study. A36 , A 4 4 1 , and A S M . This provided a range of yield points that varied f r o m 36 to 100 ksi. The A36- and A441-type steels are commonly used in bridges and have been covered by specification provisions fo r some time. A S H steel, although not recognized in the 196S AASHO Specifications, has been used more extensively in bridge structures in recent years and was incorporated in the 1969 AASHO Specifications I t was incorporated in this study to provide an evaluation of the influence of the type of steel over a wide range of yield point and tensile strength and wi th the anticipation that i t would be covered by future specification provisions
EXPERIMENT DESIGN
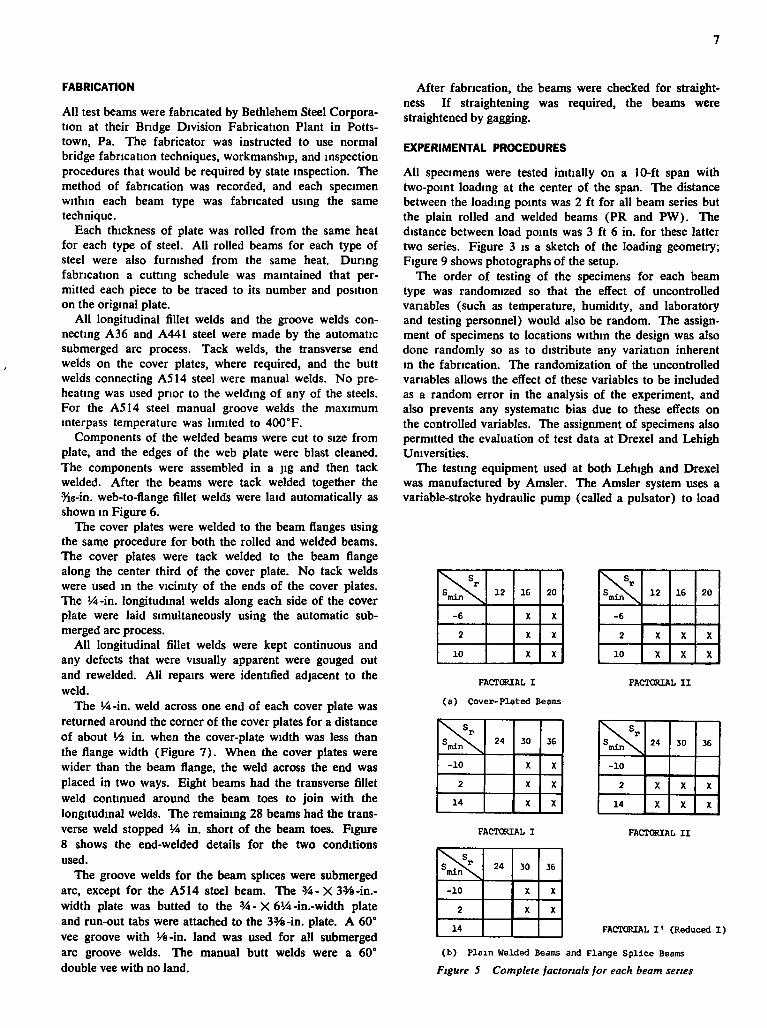
After the stress levels and steels for the design variables had been selected, each beam series was arranged into factorial experiments. The basic factorial for each steel within each beam type was defined by the stress variables. The basic factorial used for the CR and CW cover-plated beam series is shown in Figure 4. I t is shown for the variables o f minimum stress and stress range Also shown is the complementary factorial that results fo r minimum stress and maximum stress. The same factorial existed for each type of steel and for each type of end detail.
Comparable factorials were used fo r the C M , CB, and C T cover-plated beam series. Because these test series were fabricated f r o m only A36 steel, the corresponding factorial f r o m the CR and C W series could be used to evaluate the test results i f a significant difference existed between the types of steel.
Factorials were also provided fo r the PR, PW, and FS beam series. The levels of stress differed because of the differences in fatigue strength that were indicated f r o m previous studies Details of these factorials appear in Appendix B.
s
min
k s i
8 12 16 20 24
-6
C R A - 1 3 1 CWA-132 CWA-133
C R A - 1 4 1 CWA-142 CWA-143 CRA - 1 4 4
C R A - 1 5 1 CWA-152 CV;A-153
2
C R A - 2 2 1 CWA-222 CWA -223
C K A - 2 3 1 CWA-232 CWA-233 CRA - 2 3 4
C R A - 2 4 1 CWA-242 CWA -243
10
C R A - 3 1 1 CWA-312 CWA -313
C R A - 3 2 1 CWA-322 CWA-323 CRA - 3 2 4
C R A - 3 J 1 CWA-332 CWA-333
C R A - 3 4 1 CWA-342 CWA-343 CKA - 3 4 4
BASIC FACTORIAL
S max
k s i
s min 10 14 18 22 26 30
-6
C R A - l i J CWA-132 CWA-133
C'RA-141 CWA-3 42 CV;A-14 3 CRA-144
CRA-151 CWA-152 CWA-153
2
CRA-22: CWA-222 CWA-223
CRA-231 CWA-23? CWA-233 CRA-234
CRA-24: CWA-242 CWA-243
10
CRA-311 CWA-3J2 CWA-313
CRA-321 CWA-322 CWA-323 CRA-324
CRA-331 CWA-332 CWA-333
CRA-34J CWA-342 CVJA-343
COMPl.l.MrNlARY KACTORIAL
Figure 4 Factorial experiment design of the cover-plated rolled {CR) and welded (CW) beams—A36 steel
Each cell of the cover-plated and flange splice beam factorials contained at least three specimens or replicates. This permitted the variance of each cell to be estimated. Because the cover-plated beams and the flange splice beams each had two basic details per beam, information was available for only two locations. I t was for this reason that at least three replicates were provided.
The plain rolled and welded beams only had two specimens assigned to each cell. Because only one basic geometric configuration existed for each beam, it was considered that more than one fatigue crack was probable between the load points This would increase the number of critical locations so that more than one test value would be available per beam.
None of the experimental factorials was complete That IS, each level of stress range was not tested at every level of minimum stress. Partial factorials for the series were developed because of known boundary conditions. The maximum values of stress had to be limited to stresses near the yield point—otherwise the plastic strength of the A36 steel beams would be exceeded and the beam would fa i l under static loading. Another limitation for some beam specimens was the jack capacity of the testing facilities. The lower values of stress range were not examined at all values of minimum stress because the longer anticipated lives would have unduly extended the testing time. A t least 10 mill ion cycles were applied before testing was discontinued and a fatigue l imi t was assumed to be reached.
Two complete factorials were usually contained within the basic factorial of each beam series. These are shown in Figure 5 This meant that fo r the design variables that had been selected, beams were included for each possible combination of these levels. Thus, any level of a particular factor would occur in conjunction wi th all other possible combinations of levels for the remaining factors
As IS apparent f r o m complete Factorial I fo r cover-plated beams shown in Figure 5, the dimensions for the C M , CB, CT, and CR-CW beam series for each grade of steel and for each detail were 2 X 3 ; that is, two levels of stress range existed in combination wi th three levels of minimum stress. Factorial I I related three levels of stress range to two levels of minimum stress. The stress levels in the complete factorials were selected to cover the range of l ife of most interest i n design. Comparable complete factorials were designed for the other beam series.
The fact that all beams were fabricated symmetrically about their neutral axis provided information on an even wider level. For example, the presence of cover plates of equal size on each beam flange doubled the levels of minimum stress that could be studied. The stresses referred to in the factorials were applicable to the tension or lower flange of the beam. The upper or compression flanges were subjected to identical stress ranges, their minimum stress (at smallest load level) was equal in magnitude, but opposite in sign, to the minimum stress in the tension flange.
FABRICATION
A l l test beams were fabricated by Bethlehem Steel Corporation at their Bridge Division Fabrication Plant in Potts-town, Pa. The fabricator was instructed to use normal bridge fabrication techniques, workmanship, and inspection procedures that would be required by state inspection. The method of fabrication was recorded, and each specimen within each beam type was fabricated using the same technique.
Each thickness of plate was rolled f r o m the same heat for each type of steel. A l l rolled beams for each type of steel were also furnished f r o m the same heat. During fabrication a cutting schedule was maintained that permitted each piece to be traced to its number and position on the original plate.
A l l longitudinal fillet welds and the groove welds connecting A36 and A441 steel were made by the automatic submerged arc process. Tack welds, the transverse end welds on the cover plates, where required, and the butt welds connecting A514 steel were manual welds. N o preheating was used prior to the welding of any of the steels. For the A514 steel manual groove welds the maximum interpass temperature was limited to 400° F.
Components of the welded beams were cut to size f r o m plate, and the edges o f the web plate were blast cleaned. The components were assembled in a j ig and then tack welded. Af t e r the beams were tack welded together the %0 - i n . web-to-flange fillet welds were laid automatically as shown in Figure 6.
The cover plates were welded to the beam flanges using the same procedure for both the rolled and welded beams. The cover plates were tack welded to the beam flange along the center third of the cover plate. N o tack welds were used in the vicinity o f the ends o f the cover plates. The V4-in. longitudinal welds along each side of the cover plate were laid simuhaneously using the automatic submerged arc process.
A l l longitudinal fillet welds were kept continuous and any defects that were visually apparent were gouged out and rewelded. A l l repairs were identified adjacent to the weld.
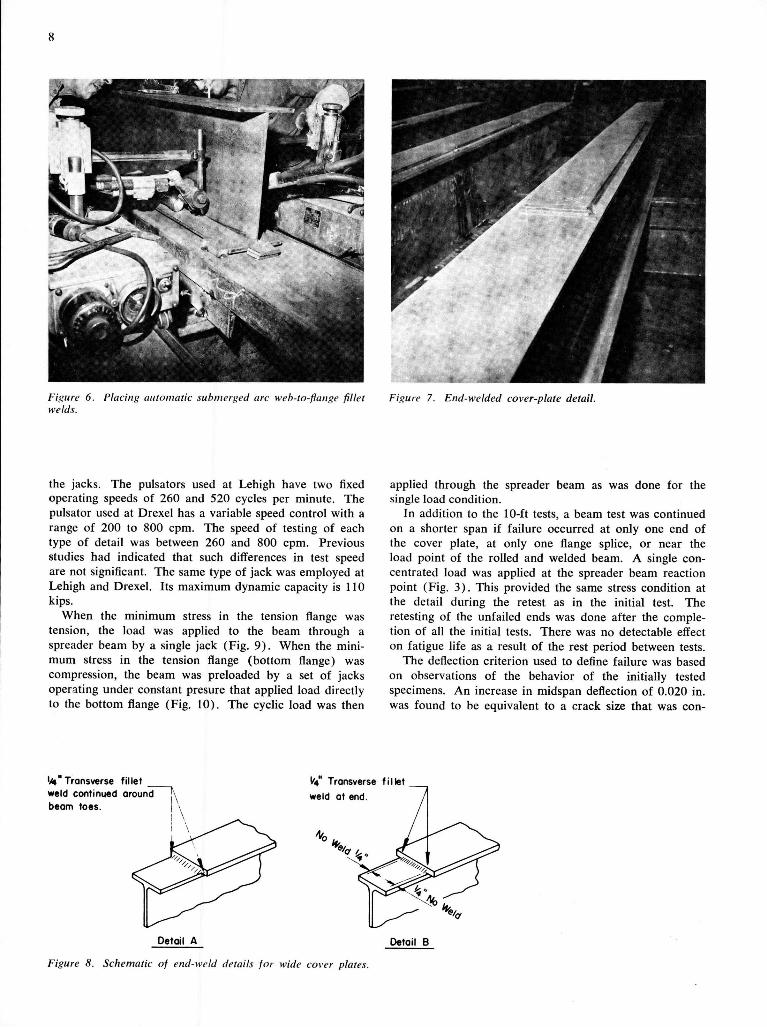
The V4-'m. weld across one end of each cover plate was returned around the corner of the cover plates fo r a distance of about Vi in . when the cover-plate width was less than the flange width (Figure 7 ) . When the cover plates were wider than the beam flange, the weld across the end was placed in two ways. Eight beams had the transverse fillet weld continued around the beam toes to jo in wi th the longitudinal welds. The remaining 28 beams had the transverse weld stopped VA i n . short of the beam toes. Figure 8 shows the end-welded details for the two conditions used.
The groove welds fo r the beam splices were submerged arc, except for the A514 steel beam. The % - X 3%-in.-width plate was butted to the ^ 4 - X 6V4-in.-width plate and run-out tabs were attached to the 3%- in . plate. A 60° vee groove with Va-in. land was used f o r all submerged arc groove welds. The manual butt welds were a 60° double vee wi th no land.
Af t e r fabrication, the beams were checked for straight-ness I f straightening was required, the beams were straightened by gagging.
EXPERIMENTAL P R O C E D U R E S
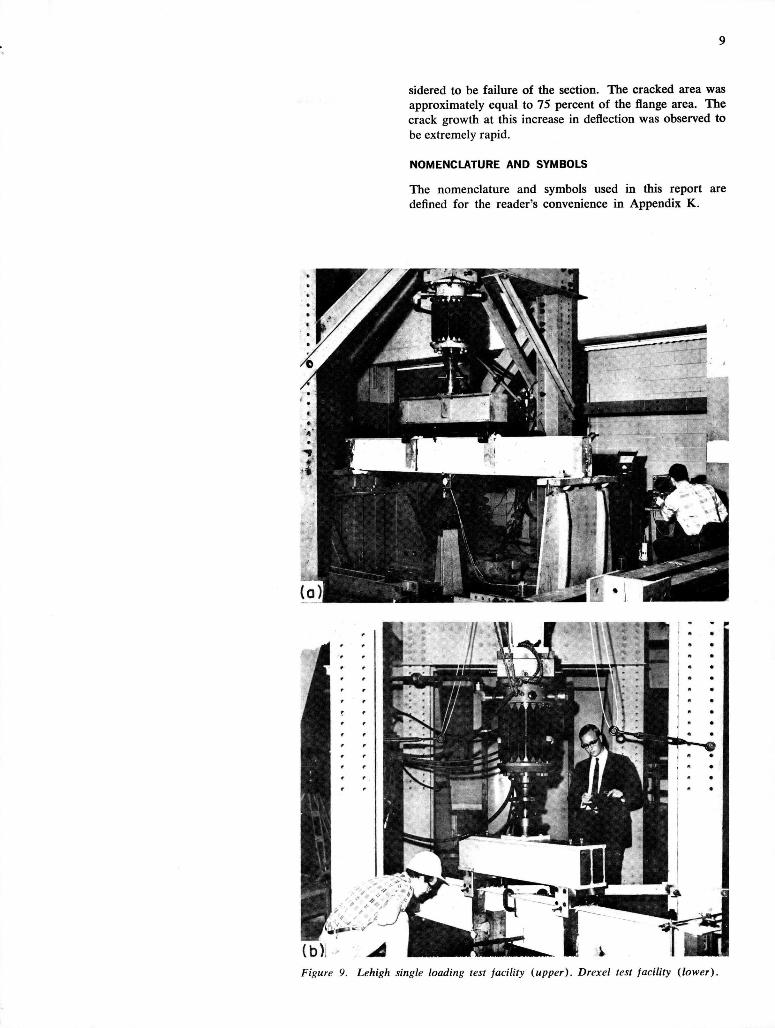
A l l specimens were tested initially on a 10-ft span with two-point loading at the center of the span. The distance between the loading points was 2 f t for all beam series but the plain rolled and welded beams (PR and P W ) . The distance between load points was 3 f t 6 in . fo r these latter two series. Figure 3 is a sketch of the loading geometry; Figure 9 shows photographs of the setup.
The order of testing of the specimens fo r each beam type was randomized so that the effect of uncontrolled variables (such as temperature, humidity, and laboratory and testing personnel) would also be random. The assignment of specimens to locations within the design was also done randomly so as to distribute any variation inherent in the fabrication. The randomization of the uncontrolled variables allows the effect of these variables to be included as a random error in the analysis of the experiment, and also prevents any systematic bias due to these effects on the controlled variables. The assignment of specimens also permitted the evaluation of test data at Drexel and Lehigh Universities.
The testing equipment used at both Lehigh and Drexel was manufactured by Amsler. The Amsler system uses a variable-stroke hydraulic pump (called a pulsator) to load
\ s r 12 l e 20
-6 X X
2 X X
10 X X
s . \ min 12 16 20
-6
2 X X X
10 X X X
FACTORIAL I (a) Cover-Plated Beams
FACTORIAL I I
24 30 36
-10 X X
2 X X
14 X X
24 30 36
-10
2 X X X
14 X X X
FACTORIAL I FACTORIAL I I
X. s s ' ' i i i i n \
24 30 36
-10 X X
2 X X
14 FACTORIAL I ' (Reduced I )
(b) Plain Welded Beams and Flange Splice Beams Figure 5 Complete factorials for each beam series
Fif^'ure 6. Placing; aiiloinatic submer!>ed arc web-to-flange fillet welds.
Figure 7. End-welded cover-plate detail.
the jacks. The pulsators used at Lehigh have two fixed operating speeds of 260 and 520 cycles per minute. The pulsator used at Drexel has a variable speed control with a range of 200 to 800 cpm. The speed of testing of each type of detail was between 260 and 800 cpm. Previous studies had indicated that such differences in test speed are not significant. The same type of jack was employed at Lehigh and Drexel. Its maximum dynamic capacity is 110 kips.
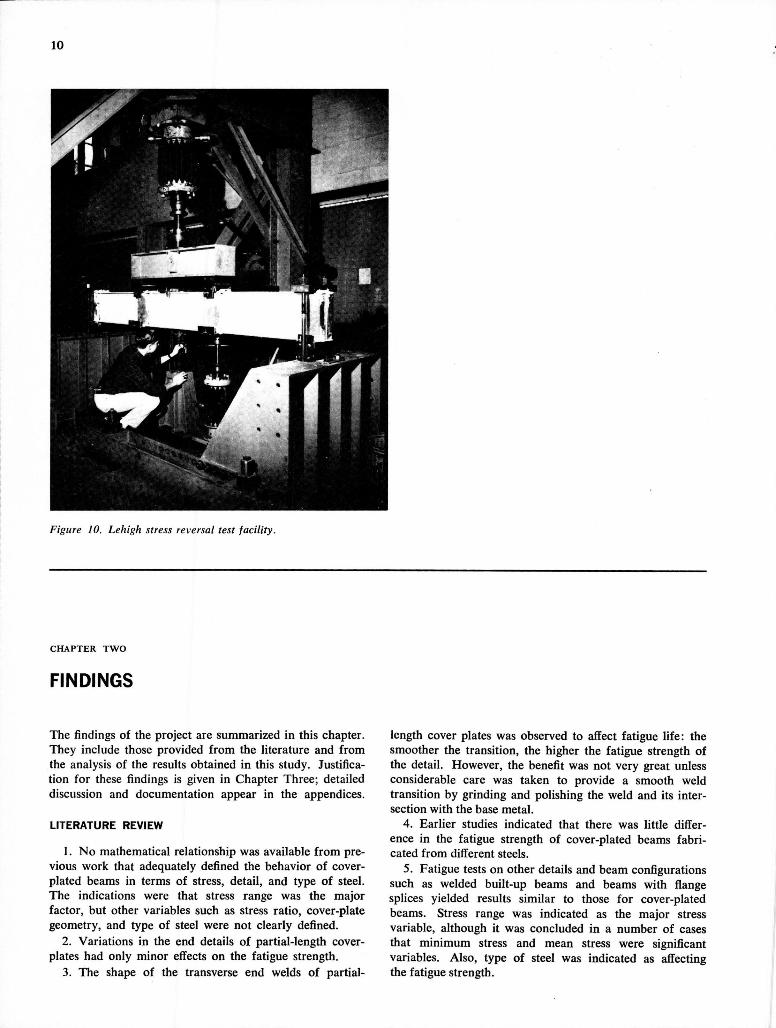
When the minimum stress in the tension flange was tension, the load was applied to the beam through a spreader beam by a single jack (Fig. 9 ) . When the minimum stress in the tension flange (bottom flange) was compression, the beam was preloaded by a set of jacks operating under constant presure that applied load directly to the bottom flange (Fig. 10). The cyclic load was then
applied through the spreader beam as was done for the single load condition.
In addition to the 10-ft tests, a beam test was continued on a shorter span if failure occurred at only one end of the cover plate, at only one flange splice, or near the load point of the rolled and welded beam. A single concentrated load was applied at the spreader beam reaction point (Fig. 3) . This provided the same stress condition at the detail during the retest as in the initial test. The retesting of the unfailed ends was done after the completion of all the initial tests. There was no detectable effect on fatigue life as a result of the rest period between tests.
The deflection criterion used to define failure was based on observations of the behavior of the initially tested specimens. An increase in midspan deflection of 0.020 in. was found to be equivalent to a crack size that was con-
'm" Transverse fillet weld continued around beam toes.
Tronsverse fillet weld at end.
Detail A Detail B
Figure 8. Schematic of end-weld details for wide cover plates.
sidered to be failure of the section. The cracked area was approximately equal to 75 percent of the flange area. The crack growth at this increase in deflection was observed to be extremely rapid.
NOMENCLATURE AND SYMBOLS
The nomenclature and symbols used in this report are defined for the reader's convenience in Appendix K.
(b) ^ • • • • r a M I B h k ^ • 1 Figure 9. Lehigh single loading lest facility (.upper). Drexel test facility (lower).
10
Figure 10. Lehigh stress reversal test facility.
CHAPTER TWO
FINDINGS
The findings of the project are summarized in this chapter. They include those provided from the literature and from the analysis of the results obtained in this study. Justification for these findings is given in Chapter Three; detailed discussion and documentation appear in the appendices.
LriERATURE REVIEW
1. No mathematical relationship was available from previous work that adequately defined the behavior of cover-plated beams in terms of stress, detail, and type of steel. The indications were that stress range was the major factor, but other variables such as stress ratio, cover-plate geometry, and type of steel were not clearly defined.
2. Variations in the end details of partial-length cover-plates had only minor effects on the fatigue strength.
3. The shape of the transverse end welds of partial-
length cover plates was observed to affect fatigue life: the smoother the transition, the higher the fatigue strength of the detail. However, the benefit was not very great unless considerable care was taken to provide a smooth weld transition by grinding and polishing the weld and its intersection with the base metal.
4. Earlier studies indicated that there was little difference in the fatigue strength of cover-plated beams fabricated from different steels.
5. Fatigue tests on other details and beam configurations such as welded built-up beams and beams with flange splices yielded results similar to those for cover-plated beams. Stress range was indicated as the major stress variable, although it was concluded in a number of cases that minimum stress and mean stress were significant variables. Also, type of steel was indicated as affecting the fatigue strength.
11
6. The only mathematical relationships available that related stress to life were empirical curves constructed through experimental test data. Generally, different curves resulted from each investigation.
7. The need for constant-cycle test data acquired under controlled conditions and within the framework of a rational experiment design was observed. Past studies had not provided control of the design factors that affected the fatigue behavior and it was not possible to determine the significance of each design variable. This often led to conflicting conclusions on the significance of design variables.
STUDY RESULTS
1. The experiment design used in this study permitted for the first time the evaluation of the design variables and the determination of their interaction.
2. Stress range was the dominant stress variable for all steels, beam types, and weld details.
3. Usually, for a specified welded detail, the type of steel was not a significant design factor.
4. Each type of beam (cover plated, plain welded, spliced, and plain rolled) exhibited significantly different fatigue strength The plain welded beams and beams with splices were not sufficiently different to justify separation for design purposes.
5. There was no apparent difference in the results of beams tested at the two laboratories.
6. There was no observable differences in fatigue hfe that could be attributed to uncontrolled variables such as rest periods, interruptions of the tests for up to one year, rate of loading, and environmental effects.
7. The log transformation of cycle life resulted in a normal distribution of the test data at nearly every level of stress range.
8. The empirical exponential model relating stress range to cycle life was observed to provide the best fit to the test data for all beam series.
9. Suitable mathematical design relationships can be developed for any desired hfe from the mathematical models relating stress range to cycle life.
10. The behavior of all details with respect to stress range was the same. In each, the life was observed to be inversely proportional to the applied nominal stress range. A good fit to the data of each end detail was provided by expressing the life as inversely proportional to the third power of the stress range.
11. This study determined the fatigue behavior between 50,000 and 10 million cycles of loading.
12. A theoretical stress analysis based on the fracture mechanics of crack growth substantiated the empirical model that provided the best fit to the test data. In addition, it provided a means of assessing the significance of the results obtained from the experimental work. For example, the earlier failure of wide cover plates was rationally explained.
13. The number of cycles for a visible crack to form was usually 75 percent or more of the life of the specimen for all details tested. Consideration of this fact
should be given in estimating the remaining life of structures that have fatigue cracks.
14. Cracks formed in the compression flange of many cover-plated, plain welded, and flange splice beams in regions of residual tension stress. These cracks usually grew more slowly after they had grown out of the residual tension area. If the compression flange was subjected to tension (i.e., during partial reversal) a number of beams failed by fracture of the compression flange.
CoverPlated Beams
1. The failure lives of the two end details of the cover-plated beams differed, with the unwelded end usually exhibiting a longer fatigue life. However, cracks were observed to form at both end details. Only the beams with a cover plate wider than the flange exhibited a different pattern of behavior. The unwelded end yielded a shorter life than all other welded end details.
2. Variations in cover-plate geometry for each end detail had no significant effect on the fatigue strength except for beams with cover plates wider than the flange. At the transversely welded end, all beam series provided the same fatigue strength. The same was true at the unwelded end except for the wider cover plates.
3. For a specified cover-plate detail the type of steel was not a significant design factor.
4. The crack causing failure of all the cover-plated beams initiated in the beam flange at the toe of the longitudinal or transverse fillet weld connecting the cover plate to the flange. At transversely welded cover-plate ends, the crack initiated near the center of the transverse fillet welds. At cover-plate ends without end welds, the cracks initiated at the toes of the longitudinal fillet welds.
5. Except for the unwelded end of the beams with cover plates wider than the beam flange, all cracks at the cover-plate ends grew through the beam's flange for most of the fatigue life. At the unwelded end of wide cover plates the crack started at the flange tip and grew m a single front toward the center of the beam flange.
6. Failures occurred mainly in the tension flange of all cover-plated beams. However, many cover-plate specimens were observed to have cracks in the compression flanges. Often this resulted in failures of the compression flange within the life observed for the tension flange when stress reversal occurred.
7. Minimum stress was significant only for the unwelded end of cover plates narrower than the beam flange. This was primarily due to the influence of minimum stress on the crack growth rate when the crack had grown outside the zones of tensile residual stress in the beam flange. Cracks were observed at the toes of the fillet welds of both details, even when the applied stress was compressive.
8. No fatigue limit was reached within the limits of stress range that was examined for cover-plated beams (6 to 24 ksi). The maximum life was 7 million cycles at 6 ksi stress range.
Plain Welded Beams
1. All plain welded beams yielded about the same fatigue strength for the three types of steel examined.
12
2. At the lowest level of stress range the plain welded A36 steel beams exhibited longer lives. The higher-strength steels were observed to have greater numbers of initial cracks or flaws that were more sensitive to crack growth at the lower level of stress range.
3. The crack causing failure of plain welded beams initiated in most instances from a gas pocket or wormhole in the continuous fillet-welded flange-web connection. In four beams a crack started from a notch in the flame-cut edge of the flange tip. The flange tip notches were visually apparent and more severe than the normal roughness from the flame-cutting operation.
4. Failures occurred mainly in the tension flange of all beams, but many compression flanges of plain welded beams were observed to have cracks formed. Often this resulted in failures of the compression flange within the life observed for the tension flange when stress reversal occurred.
5. No fatigue limit was reached within the limits examined for plain welded beams (18 to 42 ksi). However, at the lowest stress range one A36 steel welded beam sustained 10 million cycles without visible sign of cracking.
Hange Splice Beams
1. The 2-ft-radius transition in A36, A441, and A514 steels and the tapered transition in A36 and A441 steels were not significantly different and exhibited the same fatigue strength as was provided by plain welded beams without any transition. When failures initiated in the flange-web fillet-weld connection they resulted in fatigue strengths that were directly comparable to the plain welded beams.
2. The crack at the straight tapered transition initiated in most instances from the flange tip in the groove weld. In several instances, the crack initiated at a gas pocket or wormhole in the continuous fillet-welded flange-web connection.
3. At the 2-ft-radius transition most of the cracks initiated at a flaw in the flange-to-web fillet-welded connection. In about 30 percent of the details the crack was initiated at the flange tip in the transverse groove weld. A number of cracks initiated within the 2-ft radius about 2 in. from the groove weld at a more highly stressed section.
4 The fatigue strength of the manual groove welds in ASM steel was less than the fatigue strength of the semi-automatically placed groove welds in A36 and A441 steel at the straight tapered transition. It was not ascertained whether the decrease was caused by the type of steel or by the method of welding or their interaction.
Rolled Beams
1 The greater variability in life of the rolled beams reflects the fact that the stress concentration is small and the initial flaw is not well defined. Because substantial variation can occur in the flaw from which the crack originates, considerable variation and scatter in the test data resulted.
Variable Loading
1. The pilot study on variable-amplitude loading indicated that most of the fatigue damage was caused by the higher amplitudes of loading. The RMS (root mean square) stress range of the highest four blocks of loading which accounted for 6 percent of the applied cycles correlated with constant-cycle tests of similar specimens.
DESIGN
1. Stress range should be used for the design of the beams and details evaluated in this study. The coefficient ki in the specification provisions should be set equal to unity for rolled beams (designated as base metal in specification provisions), plain welded beams, flange splices, and cover-plated beams.
2. For purposes of design this study has shown that the fatigue strength of the welded details that were examined is the same for all strengths of steel. The tests of A36 and A441 rolled steel beams also yielded about the same fatigue strength. Hence, the coefficient a in the specification provisions should be set equal to zero for rolled beams, plain welded beams, flange splices, and cover-plated beams.
Cover-Plated Beams
1. Existing specification provisions that limit the thickness of the cover plate (or total thickness of all cover plates) on a flange to IV2 times the flange thickness can be liberalized. Single cover plate with a thickness twice the flange thickness and multiple cover plates with total thickness equal to IVz times the flange thickness yielded the same fatigue strength as cover plates IVz times as thick as the beam flange.
2. Cover plates wider than the flange to which they are attached should be provided with transverse end welds. The end weld may be returned around the beam flange or stopped short of the flange toes.
3. Cover plates narrower than the flange to which they are attached may have the end weld omitted, if desired.
4. This study has confirmed the current practice of permitting cover plates on either rolled or welded beams.
5. Cover plates may be attached singly or in multiples to the beam flange.
6. For cover-plated beams, / „ values of 8 ksi for 2 million cycles, 12 5 ksi for 500,000 cycles, and 21 ksi for 100,000 cycles are suggested.
Plain Welded Beams
1. Provisions should be added to the specification for plain welded beams. The current (1969) provisions specifying that they be governed by base metal criteria is not in agreement with the results of this study.
2. Care should be taken to control the smoothness of the flange tips. Obvious notches in the flange tips should be removed by grinding.
3. For plain welded beams, values of 18 ksi for 2 million cycles, 27.5 ksi for 500,000 cycles, and 45 ksi for 100,000 cycles are suggested
13
Flange Splice Beams
1. The straight transition with a 1 to 2'/6 taper yielded adequate fatigue strength for groove welds in A36 and A441 steel with the reinforcement removeid. It should be used in place of the currently required 2-ft-radius transition as it is more economical to use.
2. The 2-ft-radius transition should be used for ASM steel.
3. Groove-welded splices with the reinforcement removed should be designed for fatigue using the stress
values for welded beams. This corresponds to values of fro equal to 18 ksi for 2 million cycles, 27.5 ksi for 500,000 cycles, and 45 ksi for 100,000 cycles.
Plain Rolled Beams
1. The results of the studies on plain rolled beams did not correlate with existing studies on plate specimens.
2. For rolled beams (base metal), / „ values of 24 ksi for 2 million cycles, 36 ksi for 500,000 cycles, and 60 ksi for 100,000 cycles are suggested.
CHAPTER THREE
RESULTS AND APPRAISAL OF FATIGUE STRENGTH
The results and evaluation of the experimental and theoretical work undertaken on this project are summarized in this chapter for each of the major beam types. This includes a discussion of crack initiation and growth, an evaluation of the design variables, and where possible a comparison of the results with previous studies. Details of the analysis and complete documentation of the test data are given in the appendices.
FATIGUE STRENGTH OF COVER-PLATED BEAMS
Crack Initiation and Growth
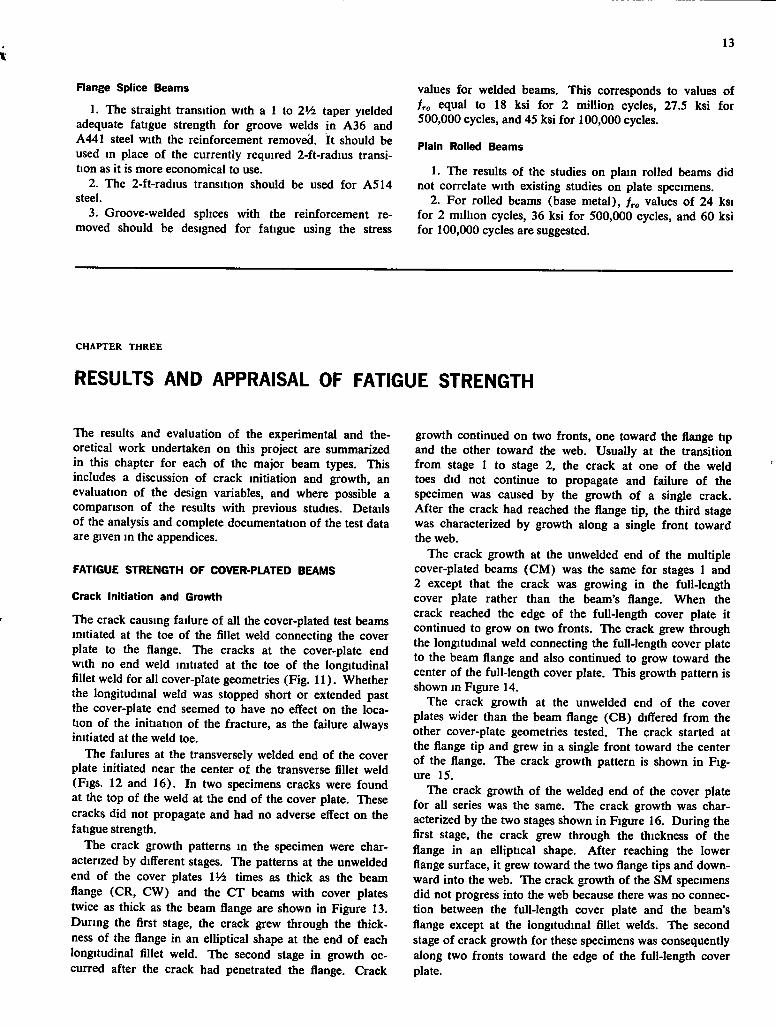
The crack causing failure of all the cover-plated test beams initiated at the toe of the fillet weld connecting the cover plate to the flange. The cracks at the cover-plate end with no end weld initiated at the toe of the longitudinal fillet weld for all cover-plate geometries (Fig. 11). Whether the longitudinal weld was stopped short or extended past the cover-plate end seemed to have no effect on the location of the initiation of the fracture, as the failure always initiated at the weld toe.
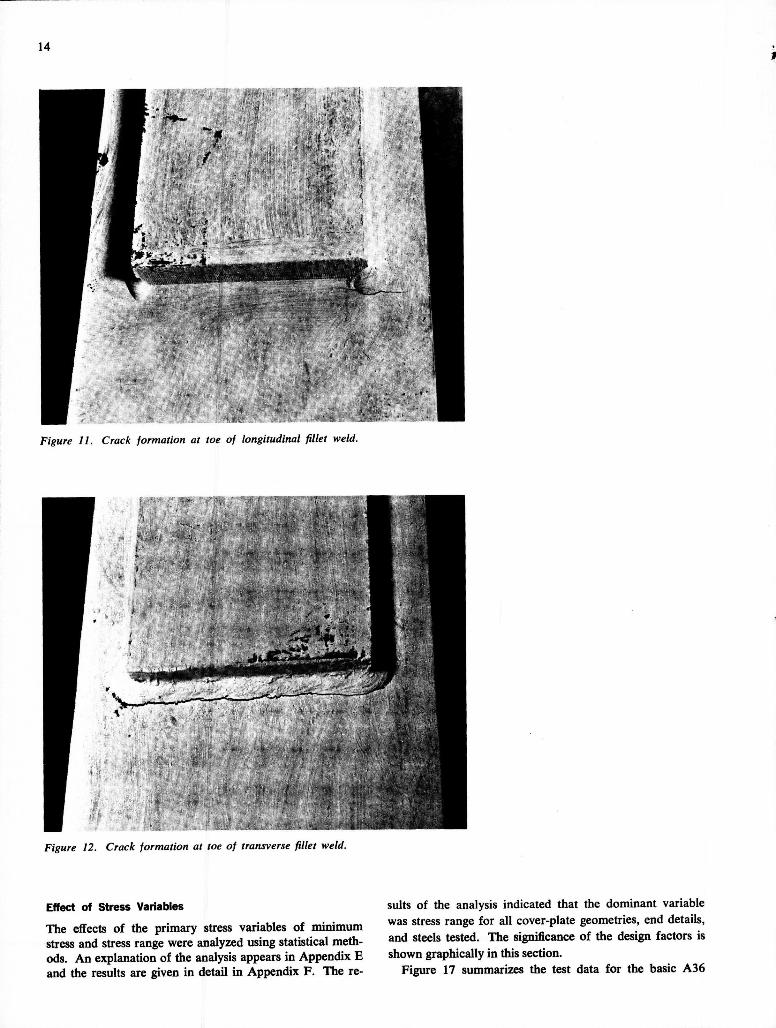
The failures at the transversely welded end of the cover plate initiated near the center of the transverse fillet weld (Figs. 12 and 16). In two specimens cracks were found at the top of the weld at the end of the cover plate. These cracks did not propagate and had no adverse effect on the fatigue strength.
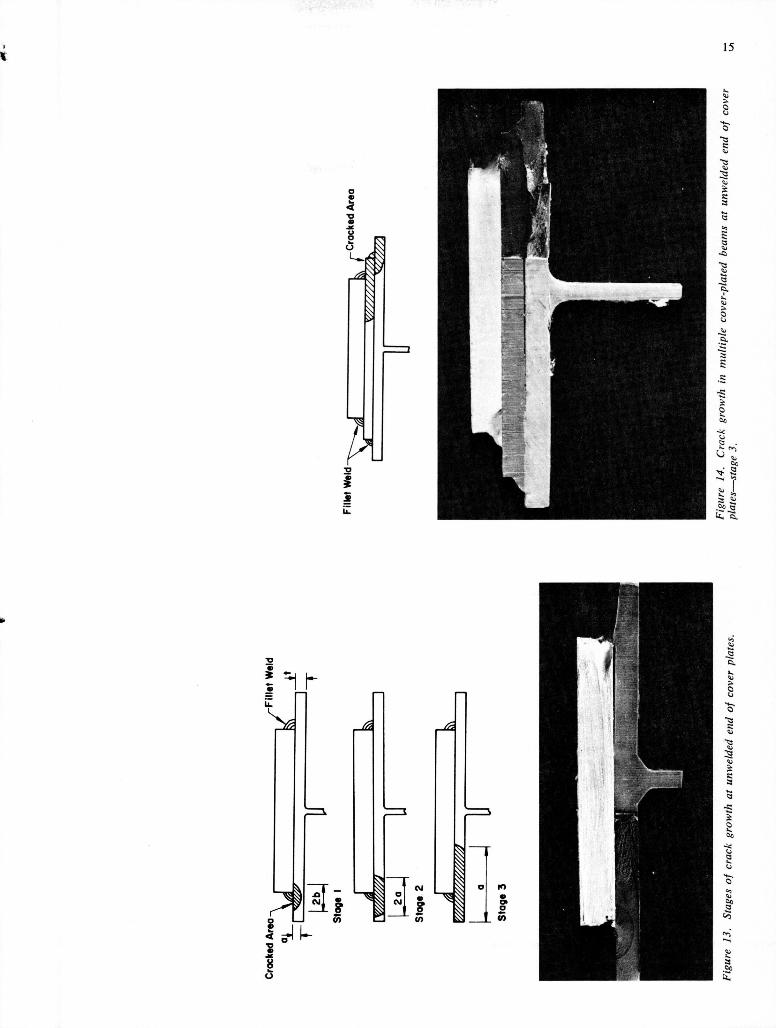
The crack growth patterns in the specimen were characterized by different stages. The patterns at the unwelded end of the cover plates I' / i times as thick as the beam flange (CR, CW) and the C T beams with cover plates twice as thick as the beam flange are shown in Figure 13. During the first stage, the crack grew through the thickness of the flange in an elliptical shape at the end of each longitudinal fillet weld. The second stage in growth occurred after the crack had penetrated the flange. Crack
growth continued on two fronts, one toward the flange tip and the other toward the web. Usually at the transition from stage 1 to stage 2, the crack at one of the weld toes did not continue to propagate and failure of the specimen was caused by the growth of a single crack. After the crack had reached the flange tip, the third stage was characterized by growth along a single front toward the web.
The crack growth at the unwelded end of the multiple cover-plated beams (CM) was the same for stages 1 and 2 except that the crack was growing in the full-length cover plate rather than the beam's flange. When the crack reached the edge of the full-length cover plate it continued to grow on two fronts. The crack grew through the longitudinal weld connecting the full-length cover plate to the beam flange and also continued to grow toward the center of the full-length cover plate. This growth pattern is shown in Figure 14.
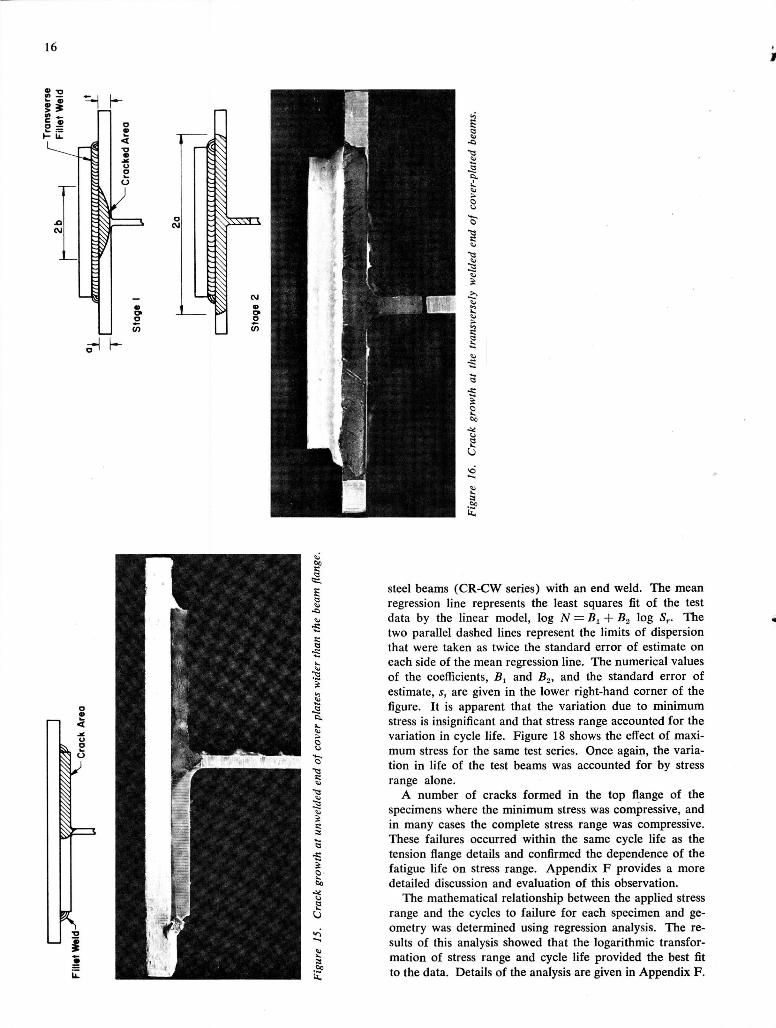
The crack growth at the unwelded end of the cover plates wider than the beam flange (CB) differed from the other cover-plate geometries tested. The crack started at the flange tip and grew in a single front toward the center of the flange. The crack growth pattern is shown in Figure 15.
The crack growth of the welded end of the cover plate for all series was the same. The crack growth was characterized by the two stages shown in Figure 16. During the first stage, the crack grew through the thickness of the flange in an elliptical shape. After reaching the lower flange surface, it grew toward the two flange tips and downward into the web. The crack growth of the SM specimens did not progress into the web because there was no connection between the full-length cover plate and the beam's flange except at the longitudinal fillet welds. The second stage of crack growth for these specimens was consequently along two fronts toward the edge of the full-length cover plate.
14
Figure 11. Crack formation at toe of longitudinal fillet weld.
Figure 12. Crack formation at toe of transverse fillet weld.
Effect of Stress Variables
The effects of the primary stress variables of minimum stress and stress range were analyzed using statistical methods. An explanation of the analysis appears in Appendix E and the results are given in detail in Appendix F . The re
sults of the analysis indicated that the dominant variable was stress range for all cover-plate geometries, end details, and steels tested. The significance of the design factors is shown graphically in this section.
Figure 17 summarizes the test data for the basic A36
15
<
3 Si CIO ?3
2
3 1 o
•a
a .00
16
i t J f
<r>
a.
L
iZ
S
.a
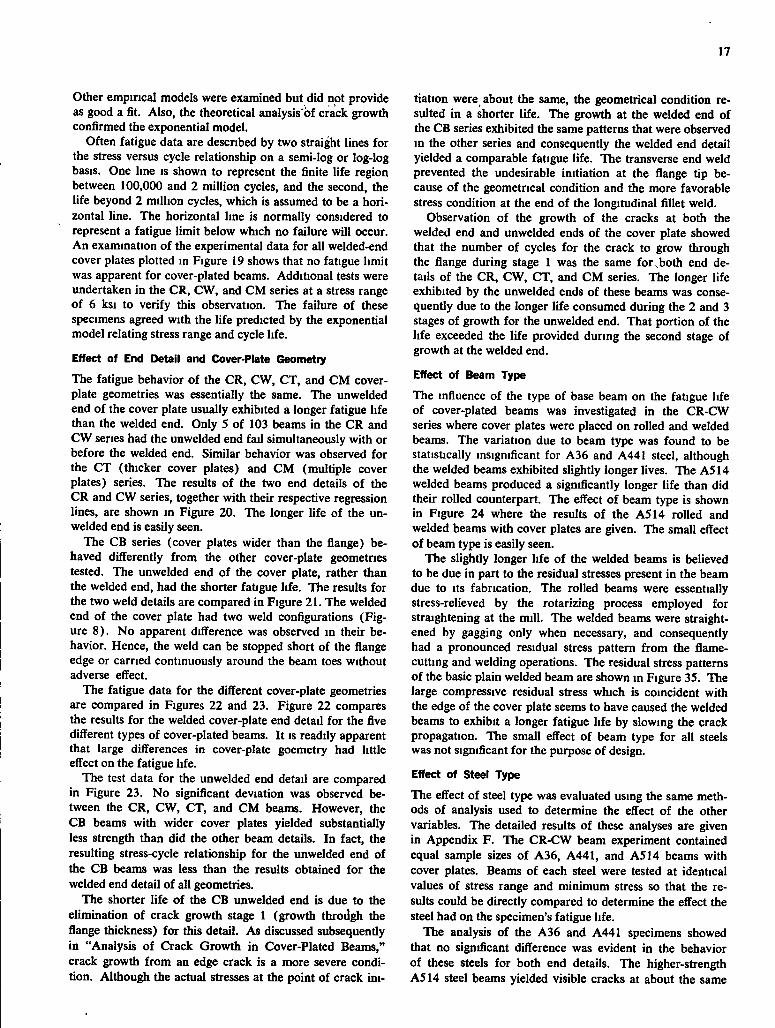
steel beams (CR-CW series) with an end weld. The mean regression line represents the least squares fit of the test data by the linear model, log N = 8^ + log Sr. The two parallel dashed lines represent the limits of dispersion that were taken as twice the standard error of estimate on each side of the mean regression line. The numerical values of the coefficients, and B2, and the standard error of estimate, s, are given in the lower right-hand corner of the figure. It is apparent that the variation due to minimum stress is insignificant and that stress range accounted for the variation in cycle life. Figure 18 shows the effect of maximum stress for the same test series. Once again, the variation in life of the test beams was accounted for by stress range alone.
A number of cracks formed in the top flange of the specimens where the minimum stress was compressive, and in many cases the complete stress range was compressive. These failures occurred within the same cycle life as the tension flange details and confirmed the dependence of the fatigue life on stress range. Appendix F provides a more detailed discussion and evaluation of this observation.
The mathematical relationship between the applied stress range and the cycles to failure for each specimen and geometry was determined using regression analysis. The results of this analysis showed that the logarithmic transformation of stress range and cycle life provided the best fit to the data. Details of the analysis are given in Appendix F .
17
Other empirical models were examined but did not provide as good a fit. Also, the theoretical analysis of crack growth confirmed the exponential model.
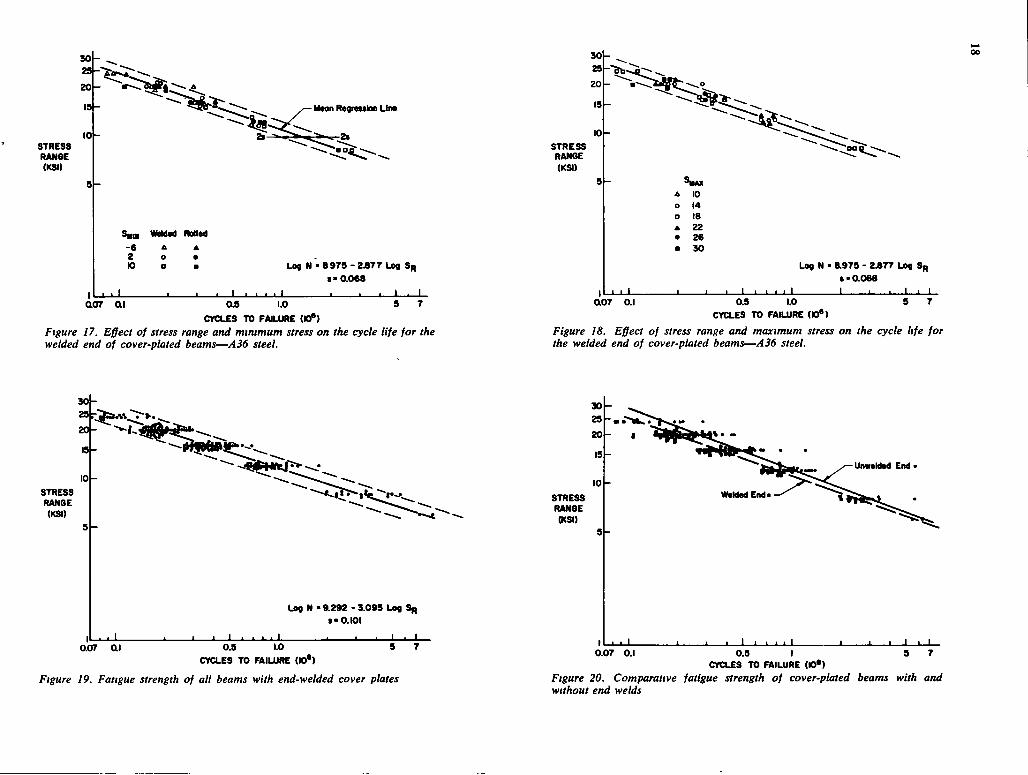
Often fatigue data are descnbed by two straight lines for the stress versus cycle relationship on a semi-log or log-log basis. One line is shown to represent the finite life region between 100,000 and 2 million cycles, and the second, the life beyond 2 million cycles, which is assumed to be a horizontal line. The horizontal line is normally considered to represent a fatigue limit below which no failure will occur. An examination of the experimental data for all welded-end cover plates plotted in Figure 19 shows that no fatigue limit was apparent for cover-plated beams. Additional tests were undertaken in the CR, CW, and CM series at a stress range of 6 ksi to verify this observation. The failure of these specimens agreed with the life predicted by the exponential model relating stress range and cycle life.
Effect of End Detail and Cover-Plate Geometry
The fatigue behavior of the CR, CW, CT, and CM cover-plate geometries was essentially the same. The unwelded end of the cover plate usually exhibited a longer fatigue life than the welded end. Only 5 of 103 beams in the CR and CW series had the unwelded end fail simultaneously with or before the welded end. Similar behavior was observed for the CT (thicker cover plates) and CM (multiple cover plates) series. The results of the two end details of the CR and CW series, together with their respective regression lines, are shown in Figure 20. The longer life of the unwelded end is easily seen.
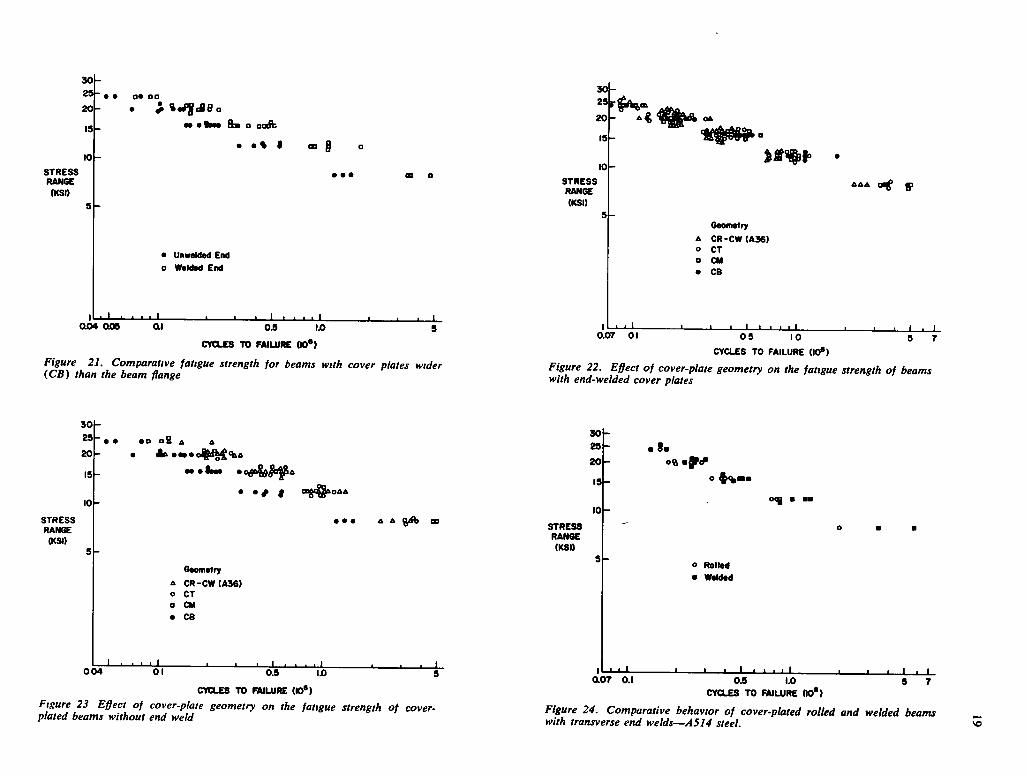
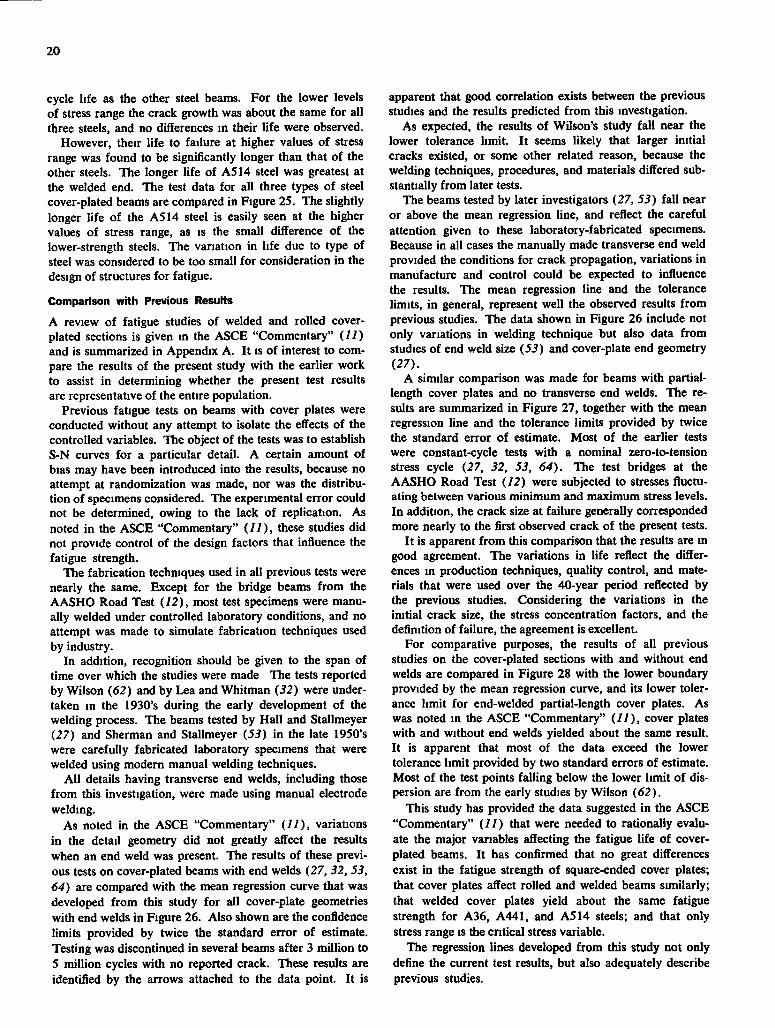
The CB series (cover plates wider than the flange) behaved differently from the other cover-plate geometries tested. The unwelded end of the cover plate, rather than the welded end, had the shorter fatigue life. The results for the two weld details are compared in Figure 21. The welded end of the cover plate had two weld configurations (Figure 8). No apparent difference was observed in their behavior. Hence, the weld can be stopped short of the flange edge or carried continuously around the beam toes without adverse effect.
The fatigue data for the different cover-plate geometries are compared in Figures 22 and 23. Figure 22 compares the results for the welded cover-plate end detail for the five different types of cover-plated beams. It is readily apparent that large differences in cover-plate goemetry had little effect on the fatigue life.
The test data for the unwelded end detail are compared in Figure 23. No significant deviation was observed between the CR, CW, CT, and CM beams. However, the CB beams with wider cover plates yielded substantially less strength than did the other beam details. In fact, the resulting stress-cycle relationship for the unwelded end of the CB beams was less than the results obtained for the welded end detail of all geometries.
The shorter life of the CB unwelded end is due to the elimination of crack growth stage 1 (growth throiigh the flange thickness) for this detail. As discussed subsequently in "Analysis of Crack Growth in Cover-Plated Beams," crack growth from an edge crack is a more severe condition. Although the actual stresses at the point of crack ini
tiation were about the same, the geometrical condition resulted in a shorter life. The growth at the welded end of the CB series exhibited the same patterns that were observed in the other series and consequently the welded end detail yielded a comparable fatigue life. The transverse end weld prevented the undesirable initiation at the flange tip because of the geometrical condition and the more favorable stress condition at the end of the longitudinal fillet weld.
Observation of the growth of the cracks at both the welded end and unwelded ends of the cover plate showed that the number of cycles for the crack to grow through the flange during stage 1 was the same for.both end details of the CR, CW, CT, and C M series. The longer life exhibited by the unwelded ends of these beams was consequently due to the longer life consumed during the 2 and 3 stages of growth for the unwelded end. That portion of the life exceeded the life provided during the second stage of growth at the welded end.
Effect of Beam Type
The influence of the type of base beam on the fatigue life of cover-plated beams was investigated in the CR-CW series where cover plates were placed on rolled and welded beams. The variation due to beam type was found to be statistically insignificant for A36 and A441 steel, although the welded beams exhibited slightly longer lives. The A514 welded beams produced a significantly longer life than did their rolled counterpart. The effect of beam type is shown in Figure 24 where the results of the A514 rolled and welded beams with cover plates are given. The small effect of beam type is easily seen.
The slightly longer life of the welded beams is believed to be due in part to the residual stresses present in the beam due to its fabrication. The rolled beams were essentially stress-relieved by the rotarizing process employed for straightening at the mill. The welded beams were straightened by gagging only when necessary, and consequently had a pronounced residual stress pattern from the flame-cutting and welding operations. The residual stress patterns of the basic plain welded beam are shown in Figure 35. The large compressive residual stress which is coincident with the edge of the cover plate seems to have caused the welded beams to exhibit a longer fatigue life by slowing the crack propagation. The small effect of beam type for all steels was not significant for the purpose of design.
Effect of Steel Type
The effect of steel type was evaluated using the same methods of analysis used to determine the effect of the other variables. The detailed results of these analyses are given in Appendix F . The CR-CW beam experiment contained equal sample sizes of A36, A441, and A514 beams with cover plates. Beams of each steel were tested at identical values of stress range and minimum stress so that the results could be directly compared to determine the effect the steel had on the specimen's fatigue life.
The analysis of the A36 and A441 specimens showed that no significant difference was evident in the behavior of these steels for both end details. The higher-strength ASM steel beams yielded visible cracks at about the same
30
20 19
1 0 S T R E S S RANOE (KSI)
Mean Re«re*«ion L i M
Swa WiMad Rolled
- 6 & A 2 o • K) a • Log N • 8 9 7 9 - 2377 Lag Sp
e - 0 . 0 6 8
I • • • • I . • , I , I I aor ai 0 . 9 1.0 9 7
C Y C L E S TO FAILURE (10*)
Figure 17. Effect of stress range and minimum stress on the cycle life for the welded end of cover-plated beams—A36 steel.
30 29
STRESS RANOE
(KSI)
2 0 -
19-
1 0 -
9 -
0.07 ai
Log N ' 9 . 2 9 2 - 3.099 Log (•0.101
_ i L • • I 0.9 1.0
CYCLES TO FAILURE (10*)
Figure 19. Fatigue strength of all beams with end-welded cover plates
S T R E S S RANGE (KSI)
Log N • a 9 7 9 - 2.877 Log S^ ( • 0 . 0 6 8 I 1 I I • I
0.9 1.0 9 7
CYCLES TO FAILURE ( O * )
Figure 18. Effect of stress range and maximum stress on the cycle life for the welded end of cover-plated beams—A36 steel.
30 29
201
10 h
S T R E S S RANOE
(KSI) 9 h
_ L I 0.07 0.1
UnweMed End •
I - L _ L . 0.9 I 9 7
CYCLES TO FAILURE ( » * ) Figure 20. Comparative fatigue strength of cover-plated beams with and without end welds
3 0 -
2 9 - ,
20
15
10
S T R E S S RANGE
(KSO
3 0 h
m m%tm b • oak
• •% I
29 r ^ , 20
15
10
S T R E S S RANGE (KSI)
• UnwaldaO End a Waldad End
' 0 0 4 C M a i O S IX> 5
CYCLES TO FAILURE ( » * )
Figure 21. Comparative fatigue strength for beams with cover plates wider (CB) than the beam flange
_ i _ L 0.07 01
A A A p
Geometry
A C R - C W ( A 3 6 ) o CT a CM • CB
I I I I O S 10
CYCLES TO FAILURE (I0»)
- I 1 • I
Figure 22. Effect of cover-plate geometry on the fatigue strength of beams with end-welded cover plates
3 0
25
20
15
10 S T R E S S RANGE
(KSI)
e e ea • & A A
• A ^ . — 0 ^ % A
ee mtmrn •
• • • A A ^
30
2S|
2 0
15
10 S T R E S S RANGE
(KSI)
Geometry
A C R - C W ( A 3 6 ) o CT • CM • CB
- L L J . 0 0 4 01 O J IJO
C Y C L E S TO F A I L U R E ( » • )
Figure 23 Effect of cover-plate geometry on the fatigue strength of cover-
' • I OLOr 0.1
o ^mm
o Rolled • welded
03 1.0 CYCLES TO FAILURE (K)*)
plated beams without end weld Figure 24. Comparative behavior of cover-plated rolled and welded beams with transverse end welds—AS14 steel.
20
cycle life as the other steel beams. For the lower levels of stress range the crack growth was about the same for all three steels, and no differences in their life were observed.
However, their life to failure at higher values of stress range was found to be significantly longer than that of the other steels. The longer life of A514 steel was greatest at the welded end. The test data for all three types of steel cover-plated beams are compared in Figure 25. The slightly longer life of the A S H steel is easily seen at the higher values of stress range, as is the small difference of the lower-strength steels. The variation in life due to type of steel was considered to be too small for consideration in the design of structures for fatigue.
Comparison with Previous Results
A review of fatigue studies of welded and rolled cover-plated sections is given in the ASCE "Commentary" ( / / ) and is summarized in Appendix A. It is of interest to compare the results of the present study with the earlier work to assist in determining whether the present test results are representative of the entire population.
Previous fatigue tests on beams with cover plates were conducted without any attempt to isolate the effects of the controlled variables. The object of the tests was to establish S-N curves for a particular detail. A certain amount of bias may have been introduced into the results, because no attempt at randomization was made, nor was the distribution of specimens considered. The experimental error could not be determined, owing to the lack of replication. As noted in the ASCE "Commentary" ( / / ) , these studies did not provide control of the design factors that influence the fatigue strength.
The fabrication techniques used in all previous tests were nearly the same. Except for the bridge beams from the AASHO Road Test (72), most test specimens were manually welded under controlled laboratory conditions, and no attempt was made to simulate fabrication techniques used by industry.
In addition, recognition should be given to the span of time over which the studies were made The tests reported by Wilson (62) and by Lea and Whitman (52) were undertaken in the 1930's during the early development of the welding process. The beams tested by Hall and Stallmeyer (27) and Sherman and Stallmeyer (5i) in the late 1950's were carefully fabricated laboratory specimens that were welded using modem manual welding techniques.
All details having transverse end welds, including those from this investigation, were made using manual electrode welding.
As noted in the ASCE "Commentary" (11), variations in the detail geometry did not greatly affect the results when an end weld was present. The results of these previous tests on cover-plated beams with end welds (27, 32, 53, 64) are compared with the mean regression curve that was developed from this study for all cover-plate geometries with end welds in Figure 26. Also shown are the confidence limits provided by twice the standard error of estimate. Testing was discontinued in several beams after 3 million to 5 million cycles with no reported crack. These results are identified by the arrows attached to the data point. It is
apparent that good correlation exists between the previous studies and the results predicted from this investigation.
As expected, the results of WUson's study fall near the lower tolerance limit. It seems likely that larger initial cracks existed, or some other related reason, because the welding techniques, procedures, and materials differed substantially from later tests.
The beams tested by later investigators (27, 55) fall near or above the mean regression line, and reflect the careful attention given to these laboratory-fabricated specimens. Because in all cases the manually made transverse end weld provided the conditions for crack propagation, variations in manufacture and control could be expected to influence the results. The mean regression line and the tolerance limits, in general, represent well the observed results from previous studies. The data shown in Figure 26 include not only variations in welding technique but also data from studies of end weld size (55) and cover-plate end geometry (27).
A similar comparison was made for beams with partial-length cover plates and no transverse end welds. The results are summarized in Figure 27, together with the mean regression line and the tolerance limits provided by twice the standard error of estimate. Most of the earlier tests were constant-cycle tests with a nominal zero-to-tension stress cycle (27, 52, 55, 64). The test bridges at the AASHO Road Test {12) were subjected to stresses fluctuating between various minimum and maximum stress levels. In addition, the crack size at failure generally corresponded more nearly to the first observed crack of the present tests.
It is apparent from this comparison that the results are in good agreement. The variations in life reflect the differences in production techniques, quality control, and materials that were used over the 40-year period reflected by the previous studies. Considering the variations in the initial crack size, the stress concentration factors, and the definition of failure, the agreement is excellent.
For comparative purposes, the results of all previous studies on the cover-plated sections with and without end welds are compared in Figure 28 with the lower boundary provided by the mean regression curve, and its lower tolerance limit for end-welded partial-length cover plates. As was noted in the ASCE "Commentary" {11), cover plates with and without end welds yielded about the same result. It is apparent that most of the data exceed the lower tolerance limit provided by two standard errors of estimate. Most of the test points falling below the lower limit of dispersion are from the early studies by Wilson {62).
This study has provided the data suggested in the ASCE "Commentary" (77) that were needed to rationally evaluate the major vanables affecting the fatigue life of cover-plated beams. It has confirmed that no great differences exist in the fatigue strength of square-ended cover plates; that cover plates affect rolled and welded beams sunilarly; that welded cover plates yield about the same fatigue strength for A36, A441, and A S H steels; and that only stress range is the cntical stress variable.
The regression lines developed from this study not only define the current test results, but also adequately describe previous studies.
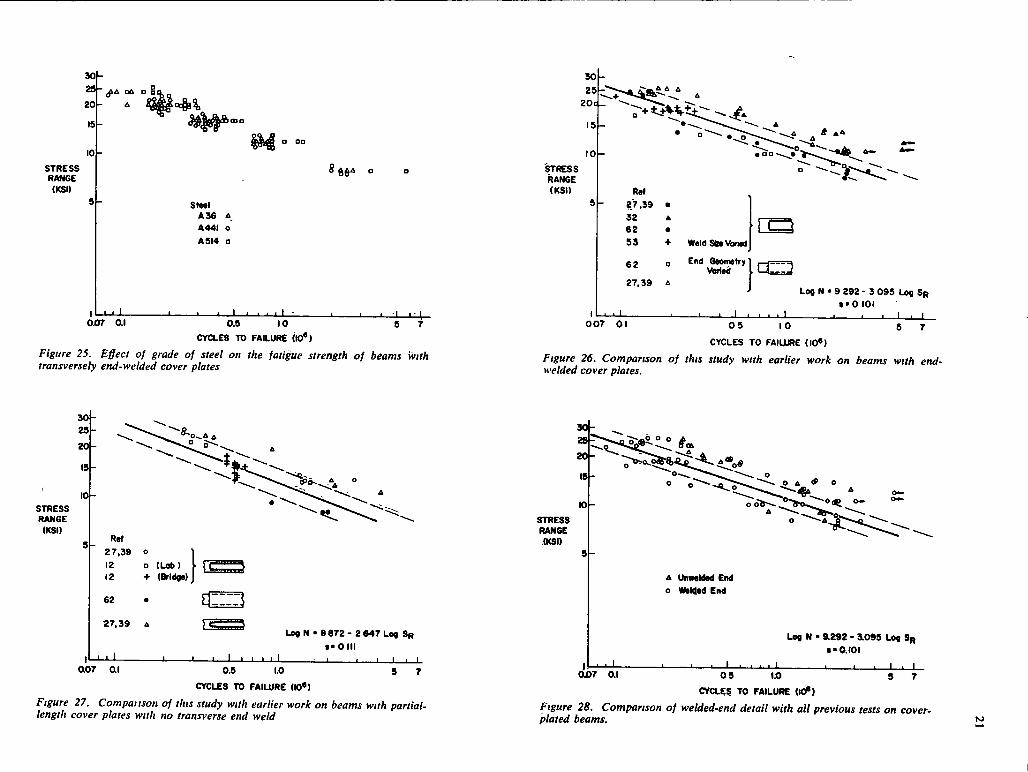
30
2 9 -
20
15
10
S T R E S S RANGE
(KSI)
9 h
OJOT 0.1
o
StMl A 3 6 A
A44I o A 514 a
0.5 10
CYCLES TO FAILURE (10*)
Figure 25. Effect of grade of steel on the fatigue strength of beams with transversely end-welded cover plates
30 29
2 0 -
19-
S T R E S S RANGE
(KSI)
10
Ref 2 7 , 3 9 12 12
62
2 7 , 3 9
J - j J
• ( L a b ) + (Bridge)
ao7 ai _1 l _ _ L
Log N • 8 872 - 2 6 4 7 Log S R
f O I I I
I I I I ; — I 1 I I i _ L 0.9 1.0 9 7
CYCLES TO FAILURE (lO*)
Figure 27. Compaiison of this study with earlier work on beams with partial-length cover plates with no transverse end weld
30
29
2 0
19
to S T R E S S RANGE (KSI) R«f
2 7 . 5 9 • 32 A 6 2 • 9 3 +
6 2 D
27,39 A
WeldStoNAmed
End Geometry 1 Varied I
L J . 0 0 7 01
J Log N • 9 292 - 3 0 9 5 Log S R
f O I O I I I I I I I 1 1 I I . I
0 5 1 0
C Y C L E S TO FAILURE ( I 0 « )
Figure 26. Comparison of this study with earlier work on beams with end-welded cover plates.
30 29
20
19
10
STRESS RANGE
(KSI)
A UnMMed End o Wel4«d End
Log N • 9L292 - 3^099 Log Sp • •0.101
1 1 r 1 • I 0 0 7 0.1 0 9 1.0 . .
CYCLES TO FAILURE (lO»)
Figure 28. Comparison of welded-end detail with all previous tests on cover-plated beams.
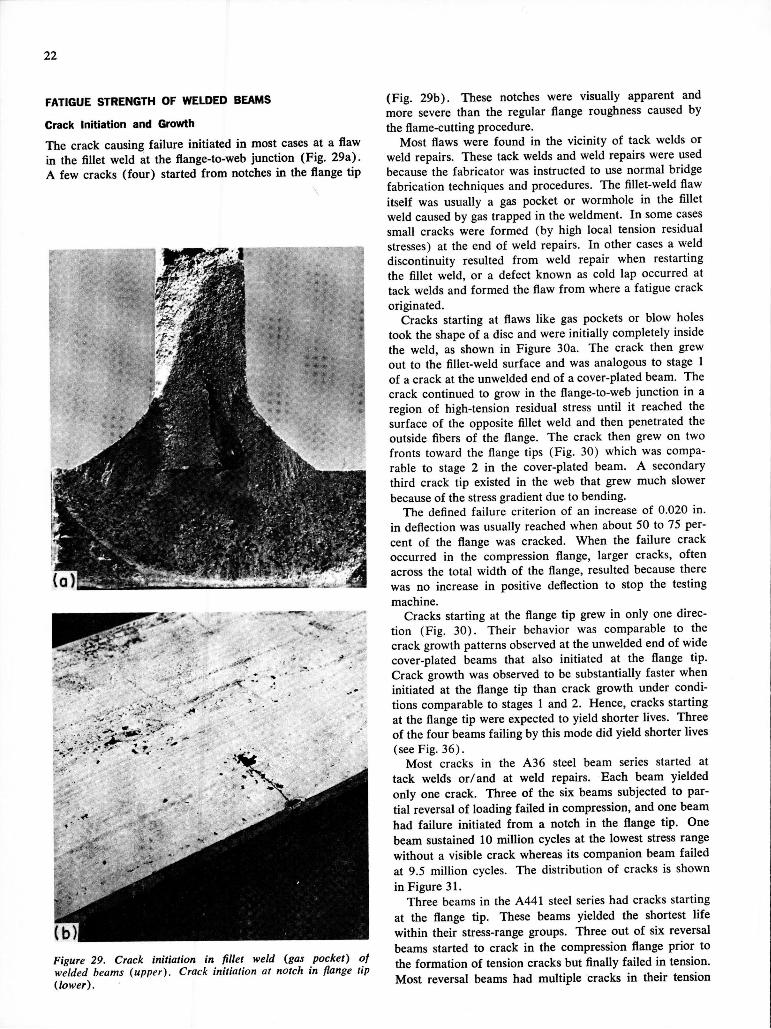
22
FATIGUE STRENGTH OF WELDED BEAMS
Crack Initiation and Growth
The crack causing failure initiated in most cases at a flaw in the fillet weld at the flange-to-web junction (Fig. 29a). A few cracks (four) started from notches in the flange tip
Figure 29. Crack initiation in fillet weld (gas pocket) of welded beams (upper). Crack initiation at notch in flange tip (lower).
(Fig. 29b). These notches were visually apparent and more severe than the regular flange roughness caused by the flame-cutting procedure.
Most flaws were found in the vicinity of tack welds or weld repairs. These tack welds and weld repairs were used because the fabricator was instructed to use normal bridge fabrication techniques and procedures. The fillet-weld flaw itself was usually a gas pocket or wormhole in the fillet weld caused by gas trapped in the weldment. In some cases small cracks were formed (by high local tension residual stresses) at the end of weld repairs. In other cases a weld discontinuity resulted from weld repair when restarting the fillet weld, or a defect known as cold lap occurred at tack welds and formed the flaw from where a fatigue crack originated.
Cracks starting at flaws like gas pockets or blow holes took the shape of a disc and were initially completely inside the weld, as shown in Figure 30a. The crack then grew out to the fillet-weld surface and was analogous to stage 1 of a crack at the unwelded end of a cover-plated beam. The crack continued to grow in the flange-to-web junction in a region of high-tension residual stress until it reached the surface of the opposite fillet weld and then penetrated the outside fibers of the flange. The crack then grew on two fronts toward the flange tips (Fig. 30) which was comparable to stage 2 in the cover-plated beam. A secondary third crack tip existed in the web that grew much slower because of the stress gradient due to bending.
The defined failure criterion of an increase of 0.020 in. in deflection was usually reached when about 50 to 75 percent of the flange was cracked. When the failure crack occurred in the compression flange, larger cracks, often across the total width of the flange, resulted because there was no increase in positive deflection to stop the testing machine.
Cracks starting at the flange tip grew in only one direction (Fig. 30). Their behavior was comparable to the crack growth patterns observed at the unwelded end of wide cover-plated beams that also initiated at the flange tip. Crack growth was observed to be substantially faster when initiated at the flange tip than crack growth under conditions comparable to stages 1 and 2. Hence, cracks starting at the flange tip were expected to yield shorter lives. Three of the four beams failing by this mode did yield shorter lives (see Fig. 36).
Most cracks in the A36 steel beam series started at tack welds or/and at weld repairs. Each beam yielded only one crack. Three of the six beams subjected to partial reversal of loading failed in compression, and one beam had failure initiated from a notch in the flange tip. One beam sustained 10 million cycles at the lowest stress range without a visible crack whereas its companion beam failed at 9.5 million cycles. The distribution of cracks is shown in Figure 31.
Three beams in the A441 steel series had cracks starting at the flange tip. These beams yielded the shortest life within their stress-range groups. Three out of six reversal beams started to crack in the compression flange prior to the formation of tension cracks but finally failed in tension. Most reversal beams had multiple cracks in their tension
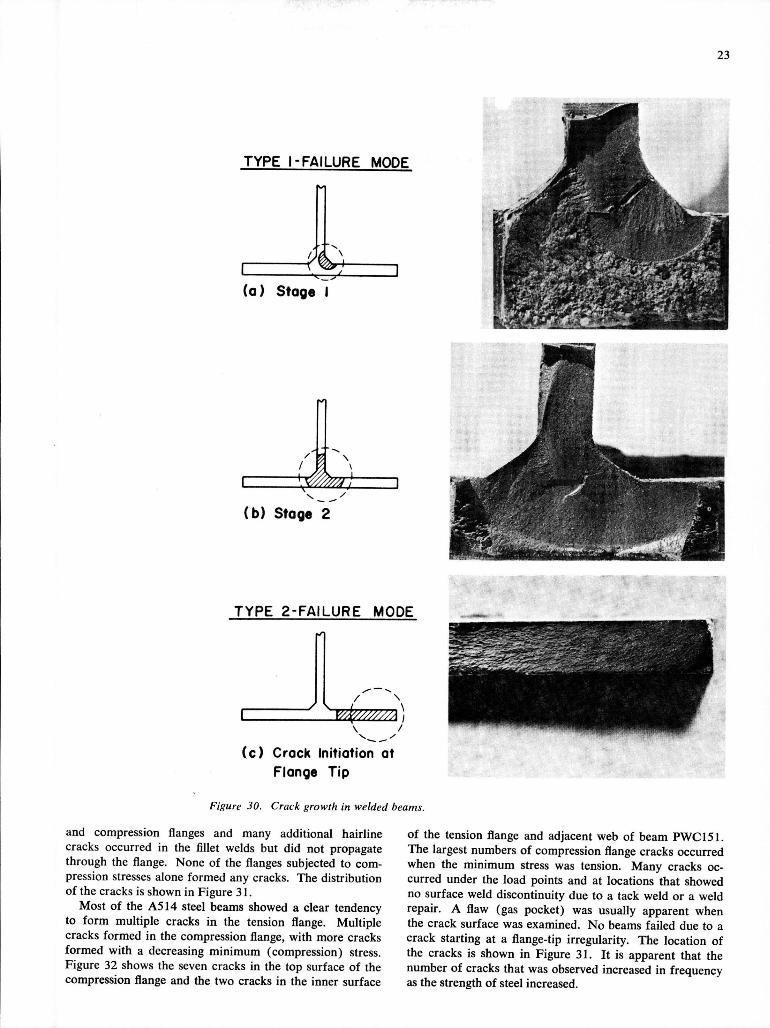
23
TYPE I-FAILURE MODE
(a) Stage I
' J
(b) Stage 2
T Y P E 2 -FAILURE MODE
( c ) Crack Initiation at Flange Tip
Figure 30. Crack growth in welded beams.
and compression flanges and many additional hairline cracks occurred in the fillet welds but did not propagate through the flange. None of the flanges subjected to compression stresses alone formed any cracks. The distribution of the cracks is shown in Figure 31.
Most of the ASM steel beams showed a clear tendency to form multiple cracks in the tension flange. Multiple cracks formed in the compression flange, with more cracks formed with a decreasing minimum (compression) stress. Figure 32 shows the seven cracks in the top surface of the compression flange and the two cracks in the inner surface
of the tension flange and adjacent web of beam PWC151. The largest numbers of compression flange cracks occurred when the minimum stress was tension. Many cracks occurred under the load points and at locations that showed no surface weld discontinuity due to a tack weld or a weld repair. A flaw (gas pocket) was usually apparent when the crack surface was examined. No beams failed due to a crack starting at a flange-tip irregularity. The location of the cracks is shown in Figure 31. It is apparent that the number of cracks that was observed increased in frequency as the strength of steel increased.
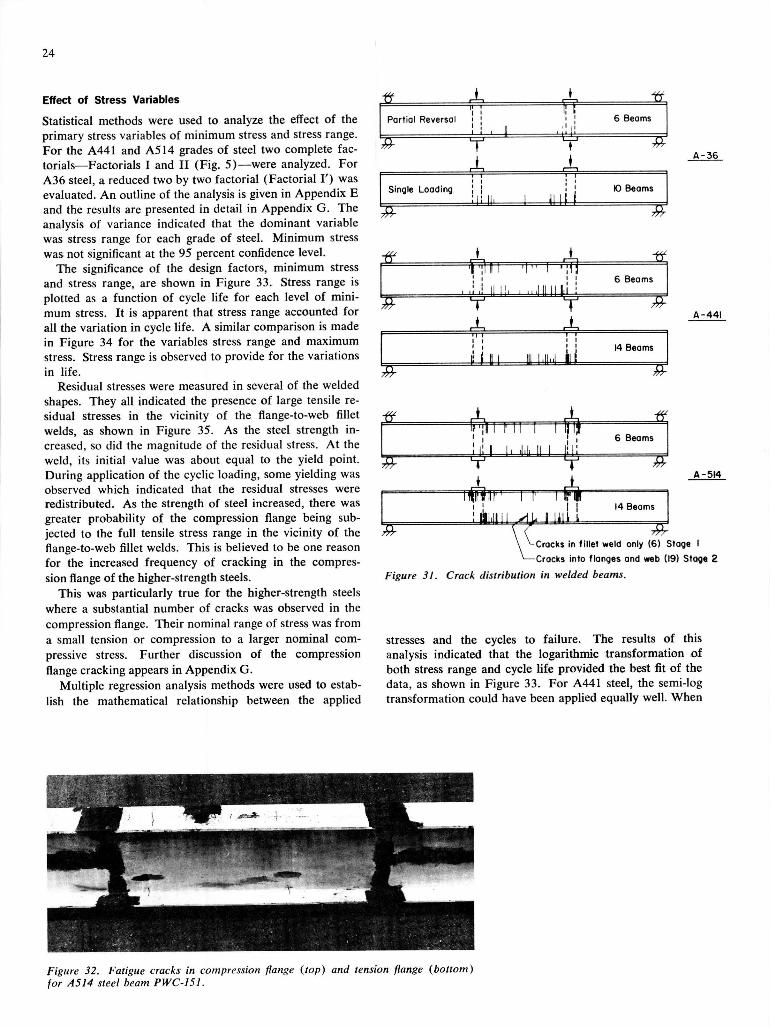
24
Effect of Stress Variables
Statistical methods were used to analyze the effect of the primary stress variables of minimum stress and stress range. For the A441 and ASM grades of steel two complete factorials—Factorials I and II (Fig. S)—were analyzed. For A36 steel, a reduced two by two factorial (Factorial I') was evaluated. An outline of the analysis is given in Appendix E and the results are presented in detail in Appendix G. The analysis of variance indicated that the dominant variable was stress range for each grade of steel. Minimum stress was not significant at the 95 percent confidence level.
The significance of the design factors, minimum stress and stress range, are shown in Figure 33. Stress range is plotted as a function of cycle life for each level of minimum stress. It is apparent that stress range accounted for all the variation in cycle life. A similar comparison is made in Figure 34 for the variables stress range and maximum stress. Stress range is observed to provide for the variations in life.
Residual stresses were measured in several of the welded shapes. They all indicated the presence of large tensile residual stresses in the vicinity of the flange-to-web fillet welds, as shown in Figure 35. As the steel strength increased, so did the magnitude of the residual stress. At the weld, its initial value was about equal to the yield point. During application of the cyclic loading, some yielding was observed which indicated that the residual stresses were redistributed. As the strength of steel increased, there was greater probability of the compression flange being subjected to the full tensile stress range in the vicinity of the flange-to-web fillet welds. This is believed to be one reason for the increased frequency of cracking in the compression flange of the higher-strength steels.
This was particularly true for the higher-strength steels where a substantial number of cracks was observed in the compression flange. Their nominal range of stress was from a small tension or compression to a larger nominal compressive stress. Further discussion of the compression flange cracking appears in Appendix G.
Multiple regression analysis methods were used to establish the mathematical relationship between the applied
f f n—n
P a r t i a l R e v e r s a l 1 1 l! 1 II i i l i !
6 B e a m s
X
— " t i j •
• 1 1
Sing le L o a d i n g 1 I
1 \ \ \ \ \ 10 B e a m s
s i f
, ; i 11
1 ' 1 " 1 ' i n 1! 111111,1 !
6 B e a m s
y • JL
I I 1 1 1
ii i 1
( 1 1 1
1 111 i,ii„i k\{ 14 B e a m s
X f f IplI I
i i i l
f i l l 1 111)
1, J,l, I I 1 [Ml 6 B e a m s
• • . - . . . . — 1 —
lltlf^ilf
- i i u ' M ' 1 Pi
1 lill 1 14 B e a m s
A - 3 6
A - 4 4 1
A - 5 1 4
\ ^ C r a c k s in f i l let we ld only ( 6 ) S t a g e 1
^ — C r a c k s info f l a n g e s a n d vneb (19) S t a g e 2
Figure 31. Crack distribution in welded beams.
Stresses and the cycles to failure. The results of this analysis indicated that the logarithmic transformation of both stress range and cycle life provided the best fit of the data, as shown in Figure 33. For A44I steel, the semi-log transformation could have been applied equally well. When
Figure 32. Fatigue cracks in compression flange (top) and tension flange (bottom) for ASM steel beam PWC-151.
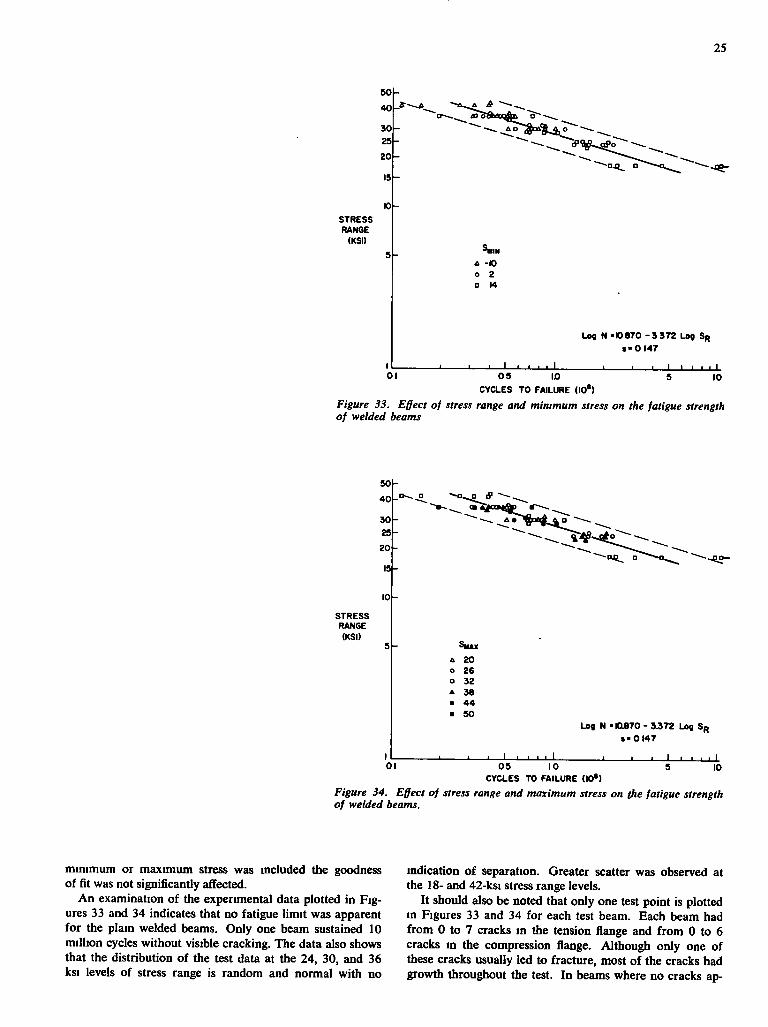
25
5 0
4 0
3 0
25
2 0
STRESS RANGE (KSI) » -O > 2 I 14
Log N '0870 - 3372 Log SR $•0 147 J L - U .
01 0 5 IJO 5 10 CYCLES TO FAILURE (10*) Figure 33. Effect of stress range and minimum stress on the fatigue strength of welded beams
50 401 30
10 STRESS RANGE (KSI) a 20 o 26 • 32 A 38 • 44 • 50 Log N.I0B70-3372 Log SR
8 • 0147
01 _ L - 1 L • • • I 10 05 10 CYCLES TO FAILURE (»•)
Figure 34. Effect of stress range and maximum stress on the fatigue strength of welded beams.
minimum or maximum stress was mcluded the goodness of fit was not significantly affected.
A n examination of the experimental data plotted in Figures 33 and 34 indicates that no fatigue l imi t was apparent fo r the plain welded beams. Only one beam sustained 10 mil l ion cycles without visible cracking. The data also shows that the distribution of the test data at the 24, 30, and 36 ksi levels of stress range is random and normal with no
indication o f separation. Greater scatter was observed at the 18- and 42-ksi stress range levels.
I t should also be noted that only one test point is plotted in Figures 33 and 34 for each test beam. Each beam had f r o m 0 to 7 cracks in the tension flange and f r o m 0 to 6 cracks m the compression flange. Although only one of these cracks usually led to fracture, most o f the cracks had growth throughout the test. I n beams where no cracks ap-
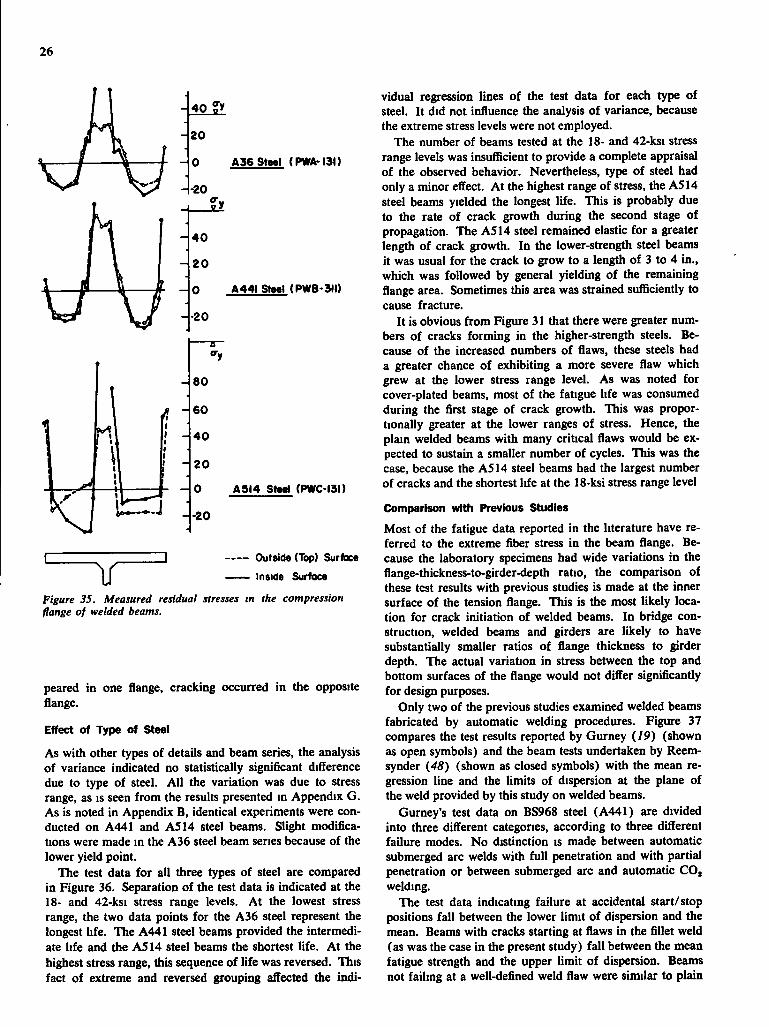
26
H - 2 0
A 3 6 Steel (PWA-I3I)
0 A 4 4 I Steel (PWB-3I I )
- 20
A S K Steel (PWC-I3I)
Y "
Outside (Top) Surftice
Inside Surface
Figure 35. Measured residual stresses in the compression flange of welded beams.
peared in one flange, cracking occurred in the opposite flange.
Effect of Type of Steel
As wi th other types of details and beam series, the analysis of variance indicated no statistically significant difference due to type of steel. A l l the variation was due to stress range, as is seen f r o m the results presented in Appendix G . As is noted in Appendix B, identical experiments were conducted on A441 and A S M steel beams. Slight modifications were made in the A36 steel beam series because of the lower yield point.
The test data f o r all three types of steel are compared in Figure 36. Separation of the test data is indicated at the 18- and 42-ksi stress range levels. A t the lowest stress range, the two data points for the A36 steel represent the longest l i fe . The A441 steel beams provided the intermediate l i fe and the A S H steel beams the shortest l i fe . A t the highest stress range, this sequence of l i fe was reversed. This fact of extreme and reversed grouping affected the indi
vidual regression lines of the test data fo r each type of steel. I t did not influence the analysis o f variance, because the extreme stress levels were not employed.
The number of beams tested at the 18- and 42-ksi stress range levels was insufiicient to provide a complete appraisal of the observed behavior. Nevertheless, type o f steel had only a minor effect. A t the highest range o f stress, the A S M steel beams yielded the longest l i fe . This is probably due to the rate of crack growth during the second stage of propagation. The A S M steel remained elastic for a greater length of crack growth. I n the lower-strength steel beams it was usual for the crack to grow to a length of 3 to 4 in . , which was followed by general yielding of the remaining flange area. Sometimes this area was strained sufficiently to cause fracture.
I t is obvious f r o m Figure 31 that there were greater numbers of cracks forming in the higher-strength steels. Because of the increased numbers of flaws, these steels had a greater chance of exhibiting a more severe flaw which grew at the lower stress range level. As was noted fo r cover-plated beams, most of the fatigue l i fe was consumed during the first stage of crack growth. This was proportionally greater at the lower ranges of stress. Hence, the plain welded beams wi th many critical flaws would be expected to sustain a smaller number of cycles. This was the case, because the A S M steel beams had the largest number of cracks and the shortest l ife at the 18-ksi stress range level
Comparison with Previous Studies
Most of the fatigue data reported in the literature have referred to the extreme fiber stress in the beam flange. Because the laboratory specimens had wide variations in the flange-thickness-to-girder-depth ratio, the comparison of these test results with previous studies is made at the inner surface of the tension flange. This is the most likely location fo r crack initiation of welded beams. I n bridge construction, welded beams and girders are likely to have substantially smaller ratios of flange thickness to girder depth. The actual variation in stress between the top and bottom surfaces of the flange would not differ significantly fo r design purposes.
Only two of the previous studies examined welded beams fabricated by automatic welding procedures. Figure 37 compares the test results reported by Gurney (19) (shown as open symbols) and the beam tests undertaken by Reem-synder (.48) (shown as closed symbols) wi th the mean regression line and the limits of dispersion at the plane of the weld provided by this study on welded beams.
Gurney's test data on BS968 steel (A441) are divided into three different categories, according to three different failure modes. N o distinction is made between automatic submerged arc welds wi th f u l l penetration and wi th partial penetration or between submerged arc and automatic C O j welding.
The test data indicating failure at accidental start/stop positions fa l l between the lower l imi t of dispersion and the mean. Beams wi th cracks starting at flaws in the fillet weld (as was the case i n the present study) f a l l between the mean fatigue strength and the upper l imi t of dispersion. Beams not fail ing at a well-defined weld flaw were sinular to plain
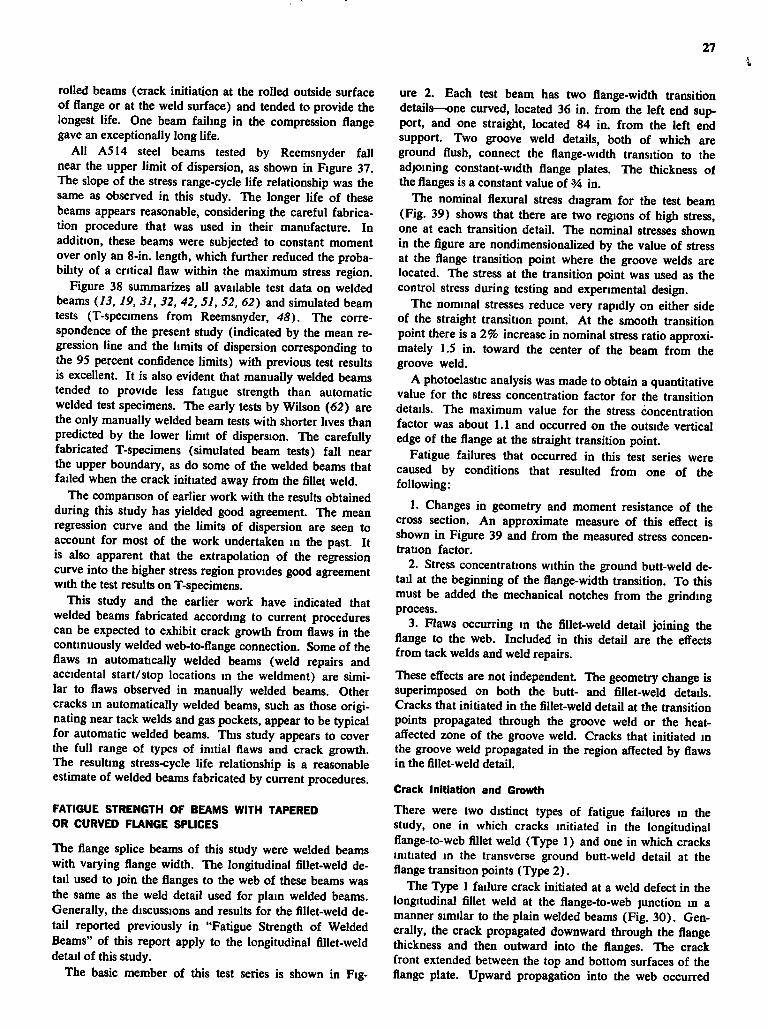
27
rolled beams (crack initiation at the rolled outside surface of flange or at the weld surface) and tended to provide the longest l i fe . One beam fai l ing in the compression flange gave an exceptionally long l i f e .
A l l A S M steel beams tested by Reemsnyder fa l l near the upper l imi t of dispersion, as shown in Figure 37. The slope of the stress range-cycle l i fe relationship was the same as observed in this study. The longer l i fe o f these beams appears reasonable, considering the careful fabrication procedure that was used in their manufacture. I n addition, these beams were subjected to constant moment over only an 8-in. length, which further reduced the probabili ty of a critical flaw within the maximum stress region.
Figure 38 summarizes all available test data on welded beams (13, 19, 31, 32, 42, 51, 52, 62) and simulated beam tests (T-specimens f r o m Reemsnyder, 48). The correspondence of the present study (indicated by the mean regression line and the limits o f dispersion corresponding to the 95 percent confidence limits) with previous test results is excellent. I t is also evident that manually welded beams tended to provide less fatigue strength than automatic welded test specimens. The early tests by Wilson (62) are the only manually welded beam tests wi th shorter lives than predicted by the lower l imi t of dispersion. The carefully fabricated T-specimens (simulated beam tests) f a l l near the upper boundary, as do some of the welded beams that failed when the crack initiated away f r o m the fillet weld.
The companson of earlier work w i th the results obtained during this study has yielded good agreement. Vae mean regression curve and the limits of dispersion are seen to account fo r most o f the work undertaken in the past. I t is also apparent that the extrapolation o f the regression curve into the higher stress region provides good agreement with the test results on T-specimens.
This study and the earlier work have indicated that welded beams fabricated according to current procedures can be expected to exhibit crack growth f r o m flaws in the continuously welded web-to-flange connection. Some of the flaws in automatically welded beams (weld repairs and accidental start/stop locations i n the weldment) are similar to flaws observed in manually welded beams. Other cracks in automatically welded beams, such as those originating near tack welds and gas pockets, appear to be typical fo r automatic welded beams. This study appears to cover the f u l l range of types of init ial flaws and crack growth. The resulting stress-cycle l i fe relationship is a reasonable estimate of welded beams fabricated by current procedures.
FATIGUE S T R E N G T H O F BEAMS WITH T A P E R E D OR C U R V E D F U N G E S P L I C E S
The flange splice beams of this study were welded beams wi th varying flange width. The longitudinal fillet-weld detail used to jo in the flanges to the web of these beams was the same as the weld detail used fo r plain welded beams. Generally, the discussions and results for the fillet-weld detail reported previously i n "Fatigue Strength of Welded Beams" of this report apply to the longitudinal fillet-weld detail o f this study.
The basic member of this test series is shown in Fig
ure 2. Each test beam has two flange-width transition details—one curved, located 36 in . f r o m the lef t end support, and one straight, located 84 in . f r o m the lef t end support. Two groove weld details, both of which are ground flush, connect the flange-width transition to the adjoining constant-width flange plates. The thickness of the flanges is a constant value of V* i n .
The nominal flexural stress diagram fo r the test beam (Fig . 39) shows that there are two regions of high stress, one at each transition detail. The nominal stresses shown in the figure are nondimensionalized by the value o f stress at the flange transition point where the groove welds are located. The stress at the transition point was used as the control stress during testing and experimental design.
The nominal stresses reduce very rapidly on either side of the straight transition point. A t the smooth transition point there is a 2 % increase i n nominal stress ratio approximately 1.5 in. toward the center o f the beam f r o m the groove weld.
A photoelastic analysis was made to obtain a quantitative value fo r the stress concentration factor fo r the transition details. The maximum value for the stress concentration factor was about 1.1 and occurred on the outside vertical edge o f the flange at the straight transition point.
Fatigue failures that occurred in this test series were caused by conditions that resulted f r o m one o f the fol lowing:
1. Changes in geometry and moment resistance of the cross section. A n approximate measure o f this effect is shown i n Figure 39 and f r o m the measured stress concentration factor.
2. Stress concentrations wi th in the ground butt-weld detail at the beginning of the flange-width transition. To this must be added the mechanical notches f r o m the grindmg process.
3. Flaws occurring in the fillet-weld detail joining the flange to the web. Included in this detail are the effects f r o m tack welds and weld repairs.
These effects are not independent. The geometry change is superimposed on both the butt- and fillet-weld details. Cracks that initiated i n the fillet-weld detail at the transition points propagated through the groove weld or the heat-affected zone of the groove weld. Cracks that initiated in the groove weld propagated in the region affected by flaws i n the fillet-weld detail.
Crack Initiation and Growth
There were two distinct types of fatigue failures in the study, one in which cracks initiated in the longitudinal flange-to-web fillet weld (Type 1) and one in which cracks initiated in the transverse ground butt-weld detail at the flange transition points (Type 2 ) .
The Type 1 failure crack initiated at a weld defect in the longitudinal fillet weld at the flange-to-web junction i n a manner similar to the plain welded beams (Fig. 3 0 ) . Generally, the crack propagated downward through the flange thickness and then outward into the flanges. The crack f ront extended between the top and bottom surfaces of the flange plate. Upward propagation into the web occurred
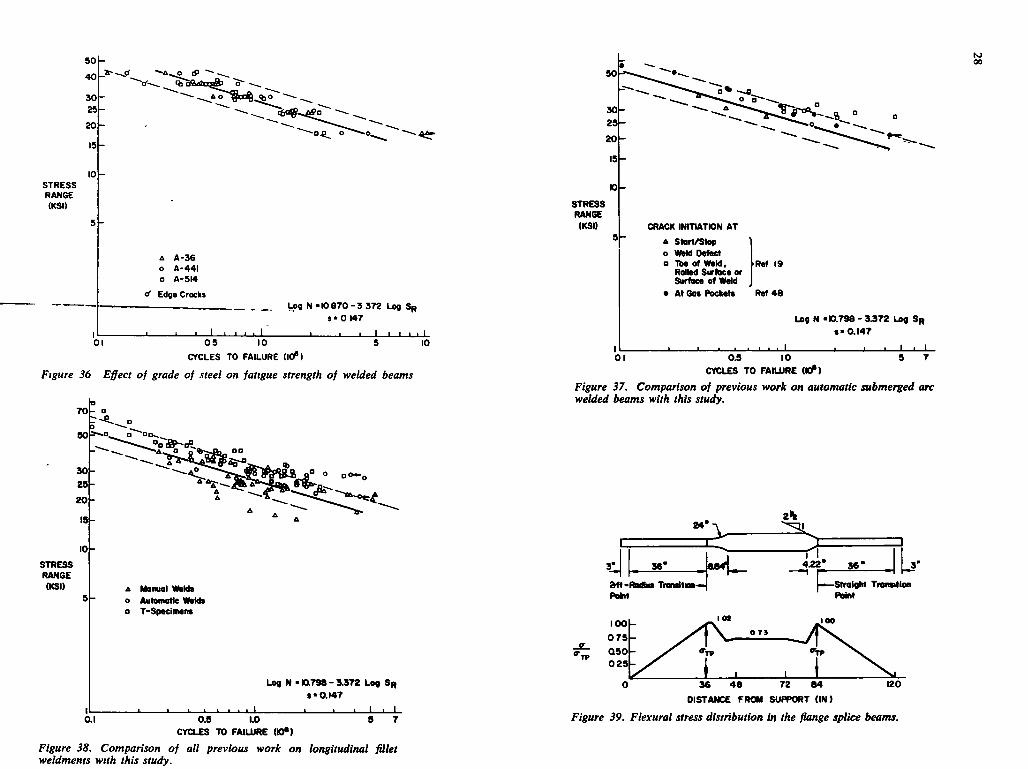
50
40
30 25
20
isj
10 STRESS RANGE (KSI)
5H
A A-36 o A-441 • A-SM
O' Edge Crock! Log N-10 870 - 3 372 Log SR
$ • 0 147
_ L 1 1 1 I I I . .
01 0 5 10 5 10 CYCLES TO FAILURE (10^)
Figure 36 Effect of grade of steel on fatigue strength of welded beams
70
SO
30 29
20
19-
10-STRESS RANGE (KSI)
0.1
A Manual tWtMt o Autoinatle W(Mi • T-Spaclimn*
, — , . , , , I 0.9 LO
CYCLES TO FAILURE 00*)
Log N - 0 7 9 8 - 3 3 7 2 Log SR f 0.147
1 1 1 I I I
Figure 38. Comparison of all previous work on longitudiruil fillet weldments with this study.
STRESS RANGE (KSI)
0 0
CRACK INITIATK)N AT 4 Start/Stop o Wtid 0«faet o Tb« of WtM, VRef 19
R d M Surface or Surface ol Weld
o At Gas Pockets Ref 48
Log N -0.798 - 3372 Log SR s-0.147
J I I I I I I 01 0.5 10 9 7
CYCLES TO FAIUURE ( K f )
Figure 37. Comparison of previous work on automatic submerged arc welded beams with this study.
24*
31 36'
»f t -Ra«us Tronsitianoj Pokil
422; 3 6 ' 3 '
Straight Tronsilion
' T O
o 73 0 7 5 ^ Q90H 0 25k
36 4 8 72 DISTANCE FROM SUPPORT (IN)
Figure 39. Flexural stress distribution in the flange splice beams.
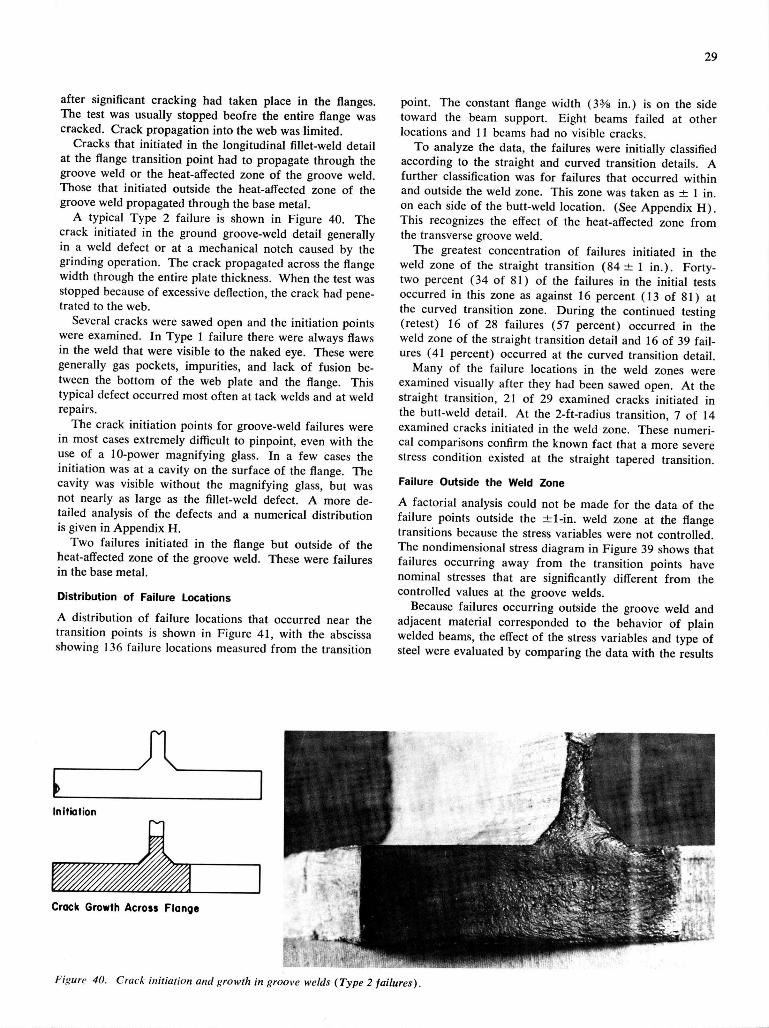
29
after significant cracking had taken place in the flanges. The test was usually stopped beofre the entire flange was cracked. Crack propagation into the web was limited.
Cracks that initiated in the longitudinal fillet-weld detail at the flange transition point had to propagate through the groove weld or the heat-affected zone of the groove weld. Those that initiated outside the heat-affected zone of the groove weld propagated through the base metal.
A typical Type 2 failure is shown in Figure 40. The crack initiated in the ground groove-weld detail generally in a weld defect or at a mechanical notch caused by the grinding operation. The crack propagated across the flange width through the entire plate thickness. When the test was stopped because of excessive deflection, the crack had penetrated to the web.
Several cracks were sawed open and the initiation points were examined. In Type 1 failure there were always flaws in the weld that were visible to the naked eye. These were generally gas pockets, impurities, and lack of fusion between the bottom of the web plate and the flange. This typical defect occurred most often at tack welds and at weld repairs.
The crack initiation points for groove-weld failures were in most cases extremely difficult to pinpoint, even with the use of a 10-power magnifying glass. In a few cases the initiation was at a cavity on the surface of the flange. The cavity was visible without the magnifying glass, but was not nearly as large as the fillet-weld defect. A more detailed analysis of the defects and a numerical distribution is given in Appendix H .
Two failures initiated in the flange but outside of the heat-affected zone of the groove weld. These were failures in the base metal.
Distribution of Failure Locations
A distribution of failure locations that occurred near the transition points is shown in Figure 41, with the abscissa showing 136 failure locations measured from the transition
point. The constant flange width (3% in.) is on the side toward the beam support. Eight beams failed at other locations and 11 beams had no visible cracks.
To analyze the data, the failures were initially classified according to the straight and curved transition details. A further classification was for failures that occurred within and outside the weld zone. This zone was taken as ± 1 in. on each side of the butt-weld location. (See Appendix H ) . This recognizes the effect of the heat-affected zone from the transverse groove weld.
The greatest concentration of failures initiated in the weld zone of the straight transition (84 ± 1 in.). Forty-two percent (34 of 81) of the failures in the initial tests occurred in this zone as against 16 percent (13 of 81) at the curved transition zone. During the continued testing (retest) 16 of 28 failures (57 percent) occurred in the weld zone of the straight transition detail and 16 of 39 failures (41 percent) occurred at the curved transition detail.
Many of the failure locations in the weld zones were examined visually after they had been sawed open. At the straight transition, 21 of 29 examined cracks initiated in the butt-weld detail. At the 2-ft-radius transition, 7 of 14 examined cracks initiated in the weld zone. These numerical comparisons confirm the known fact that a more severe stress condition existed at the straight tapered transition.
Failure Outside the Weld Zone
A factorial analysis could not be made for the data of the failure points outside the ± l - i n . weld zone at the flange transitions because the stress variables were not controlled. The nondimensional stress diagram in Figure 39 shows that failures occurring away from the transition points have nominal stresses that are significantly different from the controlled values at the groove welds.
Because failures occurring outside the groove weld and adjacent material corresponded to the behavior of plain welded beams, the effect of the stress variables and type of steel were evaluated by comparing the data with the results
J V .
Initiation
Crack Growth Across Flange
Fiiiure 40. Crack initiation and i>rowth in groove welds (Type 2 failures).
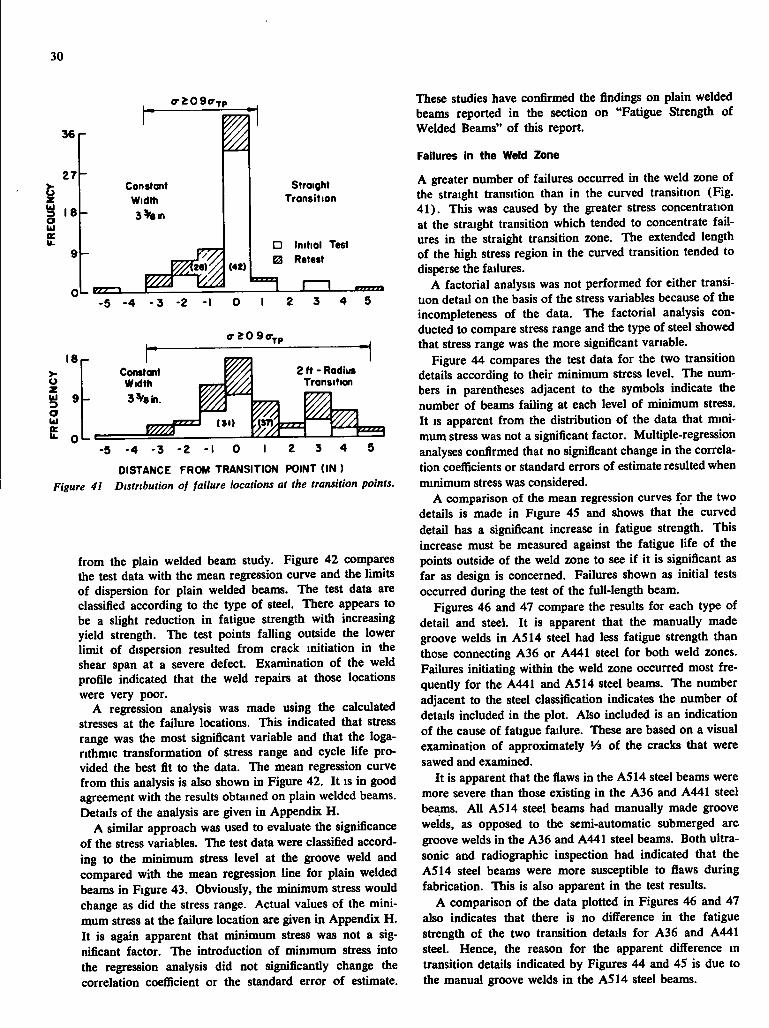
30
3 6 r
2 7 h Constant Width 3>8in
(42)
Straight Transition
• Initial Test 0 Retest
- 5 - 4 - 3 -2 -I 0 2 3 4 5
o - 2 0 9cr, TP
I 8 r -
u z
o
Constant Width 3 V e n
2 n - Radius Transition
V7,
- 5 - 4 - 3 - 2 - 1 0 I 2 3 4 5
DISTANCE FROM TRANSITION POINT (IN ) Figure 41 Distribution of failure locations at the transition points.
f r o m the plain welded beam study. Figure 42 compares the test data wi th the mean regression curve and the limits of dispersion fo r plain welded beams. The test data are classified according to the type o f steel. There appears to be a slight reduction in fatigue strength wi th increasing yield strength. The test points fal l ing outside the lower l imit of dispersion resulted f r o m crack mitiation i n the shear span at a severe defect. Examination of the weld profile indicated that the weld repairs at those locations were very poor.
A regression analysis was made using the calculated stresses at the failure locations. This indicated that stress range was the most significant variable and that the logarithmic transformation o f stress range and cycle l i fe provided the best fit to the data. The mean regression curve f r o m this analysis is also shown in Figure 42. I t is i n good agreement with the results obtained on plain welded beams. Details of the analysis are given in Appendix H .
A similar approach was used to evaluate the significance of the stress variables. The test data were classified according to the min imum stress level at the groove weld and compared with the mean regression line fo r plain welded beams in Figure 43. Obviously, the minimum stress would change as did the stress range. Actual values of the mini mum stress at the failure location are given in Appendix H . I t is again apparent that minimum stress was not a significant factor. The introduction of minmium stress into the regression analysis did not significantly change the correlation coefficient or the standard error o f estimate.
These studies have confirmed the findings on plain welded beams reported in the section on "Fatigue Strength of Welded Beams" o f this report.
Failures in the Weld Zone
A greater number of failures occurred in the weld zone of the straight transition than in the curved transition (Fig. 4 1 ) . This was caused by the greater stress concentration at the straight transition which tended to concentrate fa i l ures in the straight transition zone. The extended length of the high stress region in the curved transition tended to disperse the failures.
A factorial analysis was not performed f o r either transi-uon detail on the basis of the stress variables because o f the incompleteness of the data. The factorial analysis conducted to compare stress range and the type o f steel showed that stress range was the more significant variable.
Figure 44 compares the test data fo r the two transition details according to their minimum stress level. The numbers in parentheses adjacent to the symbols indicate the number of beams fai l ing at each level of minimum stress. I t IS apparent f r o m the distribution o f the data that minimum stress was not a significant factor. Multiple-regression analyses confirmed that no significant change in the correlation coefficients or standard errors of estimate resulted when minimum stress was considered.
A comparison o f the mean regression curves f o r the two details is made in Figure 45 and shows that the curved detail has a significant increase in fatigue strength. This increase must be measured against the fatigue l i fe of the points outside of the weld zone to see i f i t is significant as far as design is concerned. Failures shown as init ial tests occurred during the test o f the full-length beam.
Figures 46 and 47 compare the results for each type of detail and steel. I t is apparent that the manually made groove welds in A S M steel had less fatigue strength than those connecting A36 or A441 steel fo r both weld zones. Failures initiating within the weld zone occurred most f re quently fo r the A441 and A S M steel beams. The number adjacent to the steel classification indicates the number of details included in the plot. Also included is an indication of the cause o f fatigue failure. These are based on a visual examination o f approximately o f the cracks that were sawed and examined.
I t is apparent that the flaws in the A S M steel beams were more severe than those existing i n the A 3 6 and A 4 4 I steel beams. AU A S M steel beams had manually made groove welds, as opposed to the semi-automatic submerged arc groove welds in the A36 and A441 steel beams. Both ultrasonic and radiographic inspection had indicated that the A S M steel beams were more susceptible to flaws during fabrication. This is also apparent in the test results.
A comparison of the data plotted in Figures 46 and 47 also indicates that there is no difference in the fatigue strength of the two transition details fo r A36 and A441 steel. Hence, the reason f o r the apparent difference in transition details indicated by Figures 44 and 4S is due to the manual groove welds in the A S M steel beams.
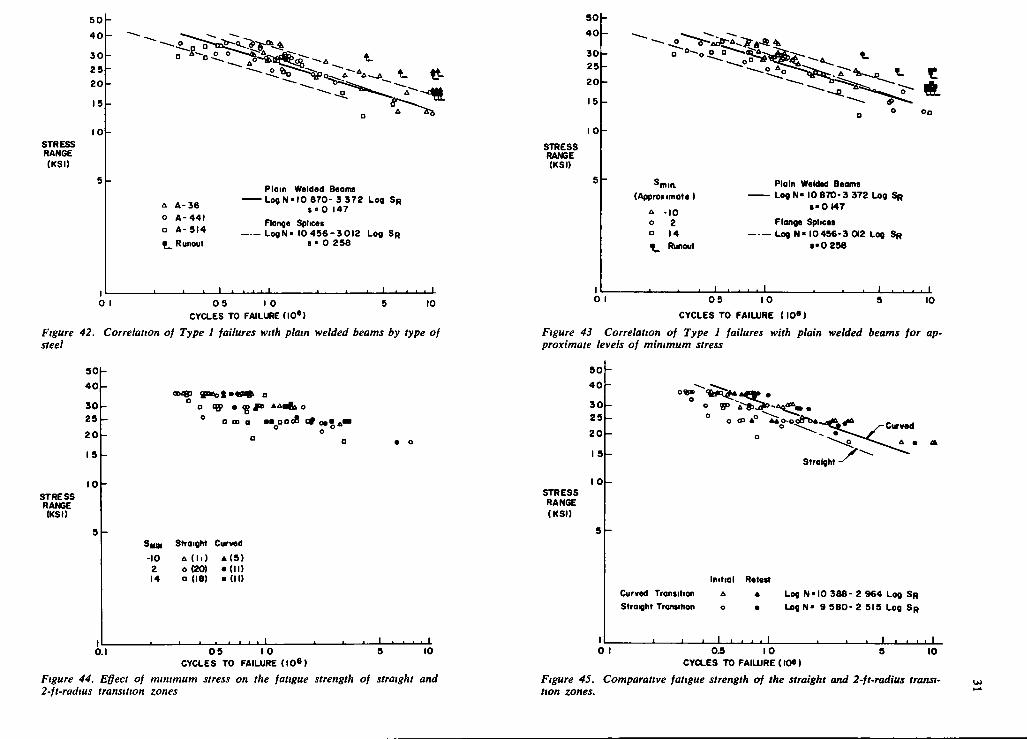
STRESS RANGE (KSI)
5 0
4 0
3 0
20
IS
10
a A-36 o A-441 • A-514 f _ Runout
Ploin Welded Beams • L o « N * l 0 870- 3 372 Log SR
$ • 0 147 Flonge Splices LogN* 10 456 -3012 Log SR
s • 0 258
0 5 10 CYCLES TO FAILURE (I0«)
10
Figure 42. Correlation of Type 1 failures with plain welded beams by type of steel
5 0 -4 0
30 25
2 0
10 STRESS RANGE (KSI)
0.1
QMS) g p M o l a W * o
o o m a •
S I M StrdigM Curved -10 A ( I . ) « ( 5 ) 2 0 (20) • ( ( ! ) 14 0 ( 1 8 ) • ( ! ! )
0 5 10 CYCLES TO FAILURE (10*)
10
Figure 44. Effect of minimum stress on the fatigue strength of straight and 2-ft-radius transition zones
SO
4 0
30 25 20
15 -
I 0 -STRESS RANGE (KSI)
5 h
(Appro* imole)
a -10 o 2 • 14 • Runout
Plain Weldad Beams Log N ' 10 870- 3 372 Log SR
s-0147
Flonge Splices Log N ' 10456-3 012 Log SR
S'0 258
0 5 10
CYCLES TO FAILURE (10") 10
Figure 43 Correlation of Type 1 failures with plain welded beams for approximate levels of minimum stress
SO 4 0
3 0 25
2 0
I 5
I 0 STRESS RANGE (KSI)
Curved
Straight
Curved Tronsition Straight Tronsihon
Initial Retest A A Log N« 10 3 8 8 - 2 964 Log SR o • Log N« 9 5 8 0 - 2 515 Log SR
0 I _ L - L
10 0.5 10 5 CYCLES TO FAILURE (I0«)
Figure 45. Comparative fatigue strength of the straight and 2-ft-radius transi lion zones.
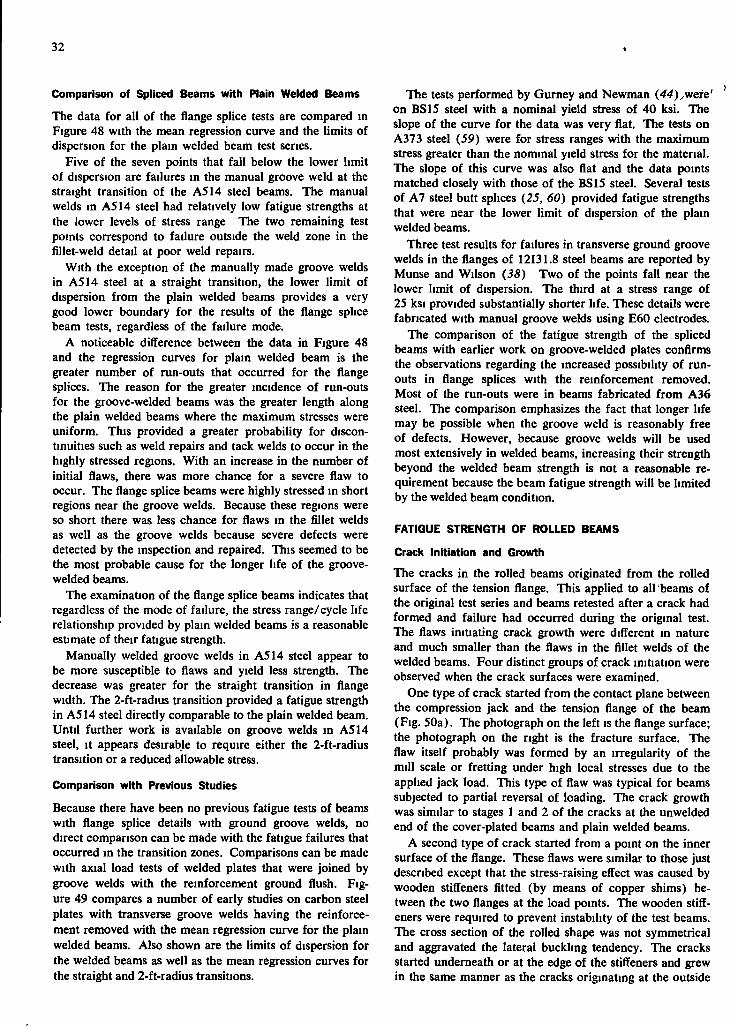
32
Comparison of Spliced Beams with Plain Welded Beams
The data for all of the flange splice tests are compared in Figure 48 with the mean regression curve and the limits of dispersion for the plain welded beam test series.
Five of the seven points that f a l l below the lower l imi t of dispersion are failures in the manual groove weld at the straight transition of the A S H steel beams. The manual welds in A S M steel had relatively low fatigue strengths at the lower levels of stress range The two remaining test points correspond to failure outside the weld zone in the fillet-weld detail at poor weld repairs.
Wi th the exception of the manually made groove welds in A S M steel at a straight transition, the lower l imi t of dispersion f r o m the plain welded beams provides a very good lower boundary fo r the results of the flange splice beam tests, regardless of the failure mode.
A noticeable difference between the data in Figure 48 and the regression curves for plain welded beam is the greater number of run-outs that occurred f o r the flange splices. The reason fo r the greater incidence of run-outs for the groove-welded beams was the greater length along the plain welded beams where the maximum stresses were uniform. This provided a greater probability fo r discontinuities such as weld repairs and tack welds to occur in the highly stressed regions. Wi th an increase in the number of initial flaws, there was more chance for a severe flaw to occur. The flange splice beams were highly stressed in short regions near the groove welds. Because these regions were so short there was less chance for flaws in the fillet welds as well as the groove welds because severe defects were detected by the inspection and repaired. This seemed to be the most probable cause for the longer l ife of the groove-welded beams.
The examination of the flange splice beams indicates that regardless of the mode of failure, the stress range/cycle l i fe relationship provided by plain welded beams is a reasonable estimate of their fatigue strength.
Manually welded groove welds in A S M steel appear to be more susceptible to flaws and yield less strength. The decrease was greater fo r the straight transition in flange width. The 2-ft-radius transition provided a fatigue strength in A S M steel directly comparable to the plain welded beam. Unt i l further work is available on groove welds in A S M steel. It appears desirable to require either the 2-ft-radius transition or a reduced allowable stress.
Comparison with Previous Studies
Because there have been no previous fatigue tests of beams with flange splice details with ground groove welds, no direct comparison can be made with the fatigue failures that occurred in the transition zones. Comparisons can be made with axial load tests of welded plates that were joined by groove welds wi th the reinforcement ground flush. Figure 49 compares a number of early studies on carbon steel plates with transverse groove welds having the reinforcement removed with the mean regression curve f o r the plain welded beams. Also shown are the limits of dispersion for the welded beams as well as the mean regression curves for the straight and 2-ft-radius transitions.
The tests performed by Gurney and Newman {44)^vieie' on BSIS steel wi th a nominal yield stress of 40 ksi. The slope of the curve fo r the data was very flat. The tests on A373 steel (59) were for stress ranges with the maximum stress greater than the nominal yield stress fo r the material. The slope o f this curve was also flat and the data points matched closely with those of the BS15 steel. Several tests of A 7 steel butt splices (25, 60) provided fatigue strengths that were near the lower l imi t of dispersion of the plain welded beams.
Three test results for failures in transverse ground groove welds in the flanges of 12131.8 steel beams are reported by Munse and Wilson (38) Two of the points fa l l near the lower l imi t of dispersion. The third at a stress range of 25 ksi provided substantially shorter l i fe . These details were fabricated with manual groove welds using E60 electrodes.
The comparison of the fatigue strength of the spliced beams with earlier work on groove-welded plates confirms the observations regarding the increased possibility o f runouts in flange splices with the reinforcement removed. Most of the run-outs were in beams fabricated f r o m A 3 6 steel. The comparison emphasizes the fact that longer l i fe may be possible when the groove weld is reasonably free of defects. However, because groove welds wi l l be used most extensively in welded beams, increasing their strength beyond the welded beam strength is not a reasonable requirement because the beam fatigue strength wi l l be limited by the welded beam condition.
FATIGUE STRENGTH OF ROLLED BEAMS
Crack Initiation and Growth
The cracks in the rolled beams originated f r o m the rolled surface of the tension flange. This applied to all beams of the original test series and beams retested after a crack had formed and failure had occurred during the original test. The flaws initiating crack growth were different in nature and much smaller than the flaws in the fillet welds of the welded beams. Four distinct groups of crack initiation were observed when the crack surfaces were examined.
One type of crack started f r o m the contact plane between the compression jack and the tension flange of the beam (Fig. 50a). The photograph on the left is the flange surface; the photograph on the right is the fracture surface. The flaw itself probably was formed by an irregularity of the m i l l scale or frett ing under high local stresses due to the applied jack load. This type of flaw was typical fo r beams subjected to partial reversal of loading. The crack growth was similar to stages 1 and 2 of the cracks at the unwelded end of the cover-plated beams and plain welded beams.
A second type of crack started f r o m a point on the inner surface of the flange. These flaws were similar to those just described except that the stress-raising effect was caused by wooden stiffeners fitted (by means of copper shims) between the two flanges at the load points. The wooden stiffeners were required to prevent instability of the test beams. The cross section of the rolled shape was not symmetrical and aggravated the lateral buckling tendency. The cracks started underneath or at the edge of the stiffeners and grew in the same manner as the cracks originating at the outside
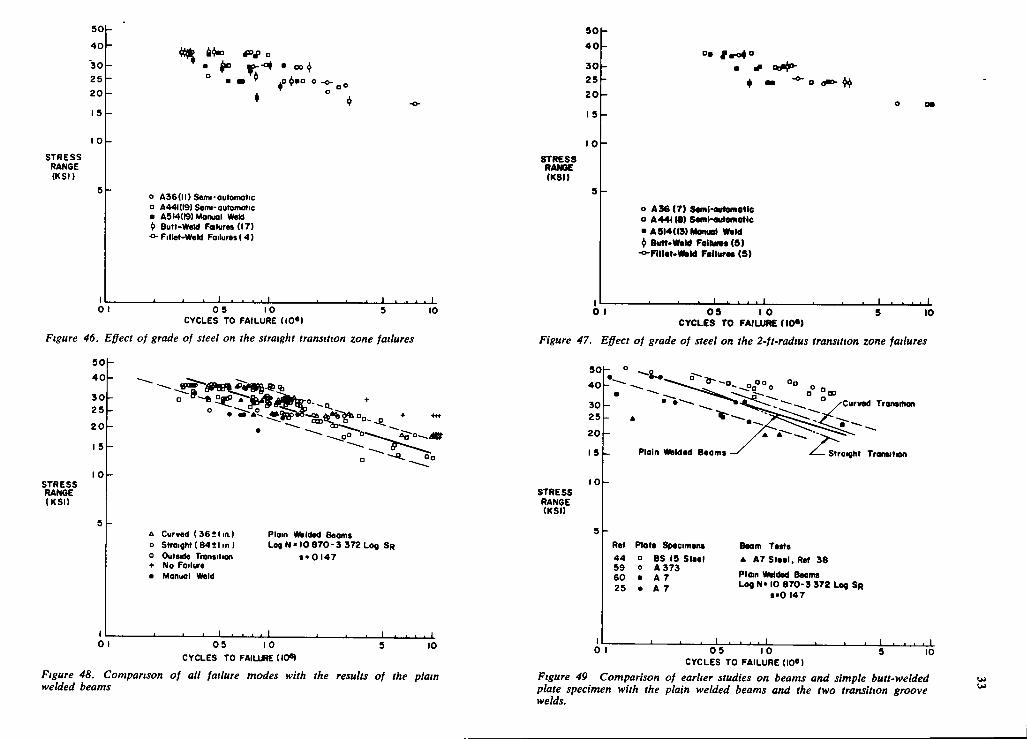
50
40
'30
25
20 15
STRESS RANGE (KSI)
G O i)
50
4 0
30 25 2 0
STRESS RANGE (KSI)
o A36(ll) Semi-outomatic a A44l(l9)Seini-outomatic • AS 14(19) Monuoi Weld 41 Butt-Weld Fdlures (17) -o- Fillet-Weld Failures(4)
0 5 10 CYCLES TO FAILURE {I0«)
10
4 .
o A36 (7) Seml-ouMmotlc a A 441 (8) SMii-automotlc •A514(13)Monuoi Weld ^ Butt<WkM Failims(S)
-o-FIII«t.Wlild Failures (9)
I • . • • I
Figure 46. Effect of grade of steel on the straight transition zone failures
50 4 0
3 0 25
2 0
I 5
STRESS RANGE (KSI)
0 1 0 9 1 0 9 10 CYCLES TO FAILURE (iO*)
Figure 47. Effect of grade of steel on the 2-ft-radius transition zone failures
501
40
30
25
20
I 5
10 STRESS RANGE (KSI)
Curved (36*1 in) Straight (84*1 in) Outside Tronsition No Foilure Monuoi Weld
Ploin Welded Beoms Log N • 10 870- 3 372 Log SR
S'0I47
0 I 0 5 10 CYCLES TO FAILURE (10")
10
Curved Transition
Plain Welded Beoms Stroighl Transition
Ref Plate Specimens 44 o BS 15 Steel
A 373 A 7 A 7
59 60 25
0 I
Beam Tests 4 A7 Steel. Ref 38 Plain Welded Beoms Log N . 10 870-3 372 Log SR
s-0 147
_1_ - L
Figure 48. Comparison of all failure modes with the results of the plain welded beams
0 5 10 CYCLES TO FAILURE (I0«)
Figure 49 Comparison of earlier studies on beams and simple butt-welded plate specimen with the plain welded beams and the two transition groove welds.
J .
10
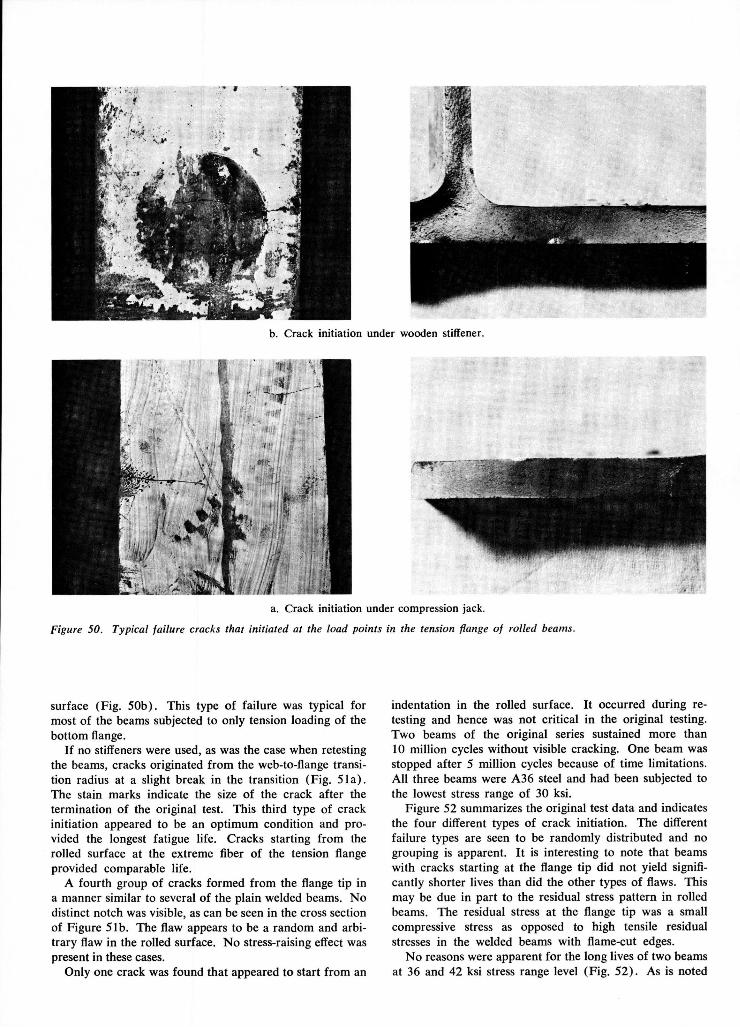
b. Crack initiation under wooden stiffener.
a. Crack initiation under compression jack.
Figure 50. Typical failure cracks that initiated at the load points in the tension flange of rolled beams.
surface (Fig. 50b). This type of failure was typical for most of the beams subjected to only tension loading of the bottom flange.
If no stiffeners were used, as was the case when retesting the beams, cracks originated from the web-to-flange transition radius at a slight break in the transition (Fig. 51a). The stain marks indicate the size of the crack after the termination of the original test. This third type of crack initiation appeared to be an optimum condition and provided the longest fatigue life. Cracks starting from the rolled surface at the extreme fiber of the tension flange provided comparable life.
A fourth group of cracks formed from the flange tip in a manner similar to several of the plain welded beams. No distinct notch was visible, as can be seen in the cross section of Figure 5lb. The flaw appears to be a random and arbitrary flaw in the rolled surface. No stress-raising effect was present in these cases.
Only one crack was found that appeared to start from an
indentation in the rolled surface. It occurred during re-testing and hence was not critical in the original testing. Two beams of the original series sustained more than 10 million cycles without visible cracking. One beam was stopped after 5 million cycles because of time limitations. All three beams were A36 steel and had been subjected to the lowest stress range of 30 ksi.
Figure 52 summarizes the original test data and indicates the four different types of crack initiation. The different failure types are seen to be randomly distributed and no grouping is apparent. It is interesting to note that beams with cracks starting at the flange tip did not yield significantly shorter lives than did the other types of flaws. This may be due in part to the residual stress pattern in rolled beams. The residual stress at the flange tip was a small compressive stress as opposed to high tensile residual stresses in the welded beams with flame-cut edges.
No reasons were apparent for the long lives of two beams at 36 and 42 ksi stress range level (Fig. 52). As is noted
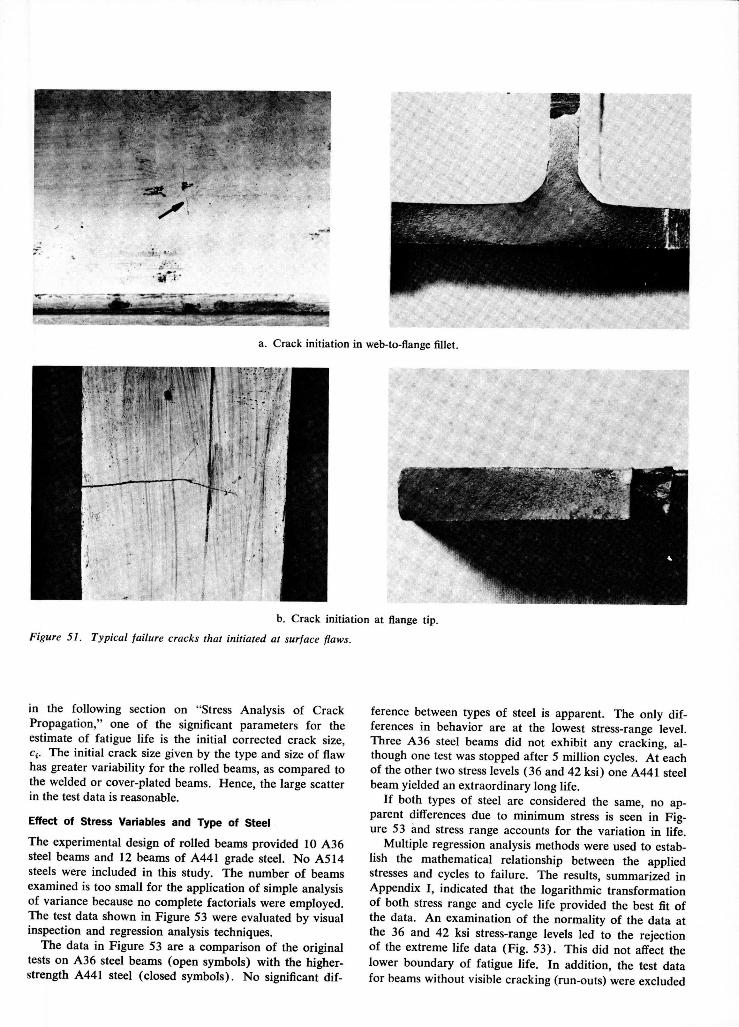
a. Crack initiation in web-to-flange iillet.
b. Crack initiation at flange tip.
Figure 51. Typical failure cracks thai initiated at surface flaws.
in the following section on "Stress Analysis of Crack Propagation," one of the significant parameters for the estimate of fatigue life is the initial corrected crack size, Q. The initial crack size given by the type and size of flaw has greater variability for the rolled beams, as compared to the welded or cover-plated beams. Hence, the large scatter in the test data is reasonable.
Effect of Stress Variables and Type of Steel
The experimental design of rolled beams provided 10 A36 steel beams and 12 beams of A441 grade steel. No A514 steels were included in this study. The number of beams examined is too small for the application of simple analysis of variance because no complete factorials were employed. The test data shown in Figure 53 were evaluated by visual inspection and regression analysis techniques.
The data in Figure 53 are a comparison of the original tests on A36 steel beams (open symbols) with the higher-strength A441 steel (closed symbols). No significant dif
ference between types of steel is apparent. The only differences in behavior are at the lowest stress-range level. Three A36 steel beams did not exhibit any cracking, although one test was stopped after 5 million cycles. At each of the other two stress levels (36 and 42 ksi) one A441 steel beam yielded an extraordinary long life.
If both types of steel are considered the same, no apparent differences due to minimum stress is seen in Figure 53 and stress range accounts for the variation in life.
Multiple regression analysis methods were used to establish the mathematical relationship between the applied stresses and cycles to failure. The results, summarized in Appendix I , indicated that the logarithmic transformation of both stress range and cycle life provided the best fit of the data. An examination of the normality of the data at the 36 and 42 ksi stress-range levels led to the rejection of the extreme life data (Fig. 53). This did not affect the lower boundary of fatigue life. In addition, the test data for beams without visible cracking (run-outs) were excluded
36
f r o m the analysis. The fit of the data improved considerably. The analysis continued to confirm the tendency that the goodness of fit was reduced when minimum or maximum stress was included as a design factor. Figure S3 shows the mean regression line for the original test and also the limits of dispersion. A l l the data points included in the analysis fa l l within these limits. The slope of the regression line IS in good agreement with the slope obtained for welded and cover-plated beams.
I n Figure S4, the data of the retested beams are compared to the original data. The regression lines for the initial tests and retests are also shown. Only three beams sustained a significant increase in cycle l ife during retestmg A l l other retests fe l l within the limits of dispersion of the initial test series.
The large differences in initial flaw size and type o f flaw account for the variation in the test data. Mult iple cracking was never observed in the tests of rolled beams. This also confirmed the random nature of the flaw causing failure.
Comparison with Previous Studies
A l l initial and retest data are shown in Figure SS and are compared with other experimental work. The mean regression curve for this study is shown, together with the 95 percent confidence l imit for 95 percent survival. These curves are based on 28 test points and exclude the extreme values and run-out beams without cracking.
The earlier tests of rolled mild steel beams ( A 7 steel or equivalent) are shown as open circles and were taken f r o m Dubuc et al. ( 9 ) , Lea and Whitman (32), and Wilson (62) Tests of A S M steel rolled beams are indicated by open squares and were reported by Nee (42) and Sherman and Stallmeyer ( 5 2 ) . The correlation within the range of the current study is good. The lower confidence l imi t predicts all the data somewhat conservatively in that range. When the mean fatigue strength and confidence l imit are extrapolated into the higher stress range region (shorter l i f e ) , the agreement with the A S M steel beams is satisfactory.
The four A 7 steel beams that fa l l near or outside the confidence l imit were reported by Dubuc et al. ( 9 ) . They were tested in complete reversal. A l l beams had stiffeners welded to the web, which may have affected the fatigue strength The description of crack formation and growth is too vague to ascertain the reasons for the shorter l i fe . I t should also be noted that several welded beams with the same basic cross section were tested and these yielded longer lives than the rolled beams. The welded beam data were compared wi th the results reported herein in "Fatigue Strength of Welded Beams," and were found to be in good agreement.
Surface notches or stress raisers f r o m the loading beam may have caused the early failure of the rolled beams subjected to reversed loading.
The previous tests also reflect the sensitivity of the fatigue of rolled beams to the initial flaw condition. A t every stress level one or more beams exhibited long l i fe , indicating that few, i f any, flaws were present. I n those cases, the l i fe approached the values often reported fo r plain rolled plates.
This pilot study on rolled beams has indicated that stress range is the dominant stress variable and that the type o f steel has only a minor, i f any, effect on l i fe .
S T R E S S ANALYSIS O F C R A C K PROPAGATION
General Analysis of Crack Growth
Fatigue has been basically an empirical problem f r o m a design point o f view (33). A number of theories and explanations have been advanced based on phenomenologi-cal occurrences, deviations o f stresses on the slip planes of the molecular structure, unbonding, etc. (22, 40). A t tempts have been made to find general mathematical laws for the relationship between load and l i fe with little or no success (34).
I n more recent years the concept of fatigue damage as being the growth of cracks f r o m preexisting flaws has shown considerable promise (3). The application of continuum mechanics aims at the quantitative prediction of fatigue l i fe and crack propagation rates.
For the prediction o f macro-crack propagation the relationship given by Eq. 1 was proposed by Paris (46).
CA*« = da/dN (1)
Eq. 1 relates the change in K (the elastic stress intensity factor for the leading edge of a crack) to crack growth and provides a rational approach for estimating crack growth. This relationship has been shown to be applicable to many types of materials and geometric configurations (6, 24, 30, 46). The stress intensity factor, K, developed by I r w i n ( 2 5 ) , describes in a single parameter the elastic stress field in the vicinity of the crack tip. Because K is determined both by crack geometry and the nominal stress and can be derived analytically, it provides a means of determining the influence of geometry and nominal stress on the stresses at the crack tip
A n examination of fillet welds by Signes et al. (54) i n dicated that fatigue cracks at the toe of fillet welds start f r o m small cracks at the weld toe These cracks exist before cyclic loading is applied to a joint. The examination of the fracture surfaces i n this study has shown that cracks originated at flaws caused by the fabrication and manufacturing process in the rolled beams, welded beams, cover-plated beams, and spliced beams. Several of these flaws were visible, as shown in Figures 29 and 40. Hence, the l i fe of a specimen is determined by the cycles required to propagate these initial flaws or cracks to a crack size causing failure of the specimen.
Eq. 1 expresses the change in crack length (a) fo r a sinusoidal stress cycle (N) as a function of the change in K (aK) during that cycle and a constant of proportionality, C. The relationship assumes that the growth of the crack depends on the change in the local stress and strain at the tip as described by the parameter ^K.
The stress intensity parameter, K, is a linear function of the nominal stress (IT) and may be written in general f o r m as:
K = ,rf(a) (2)
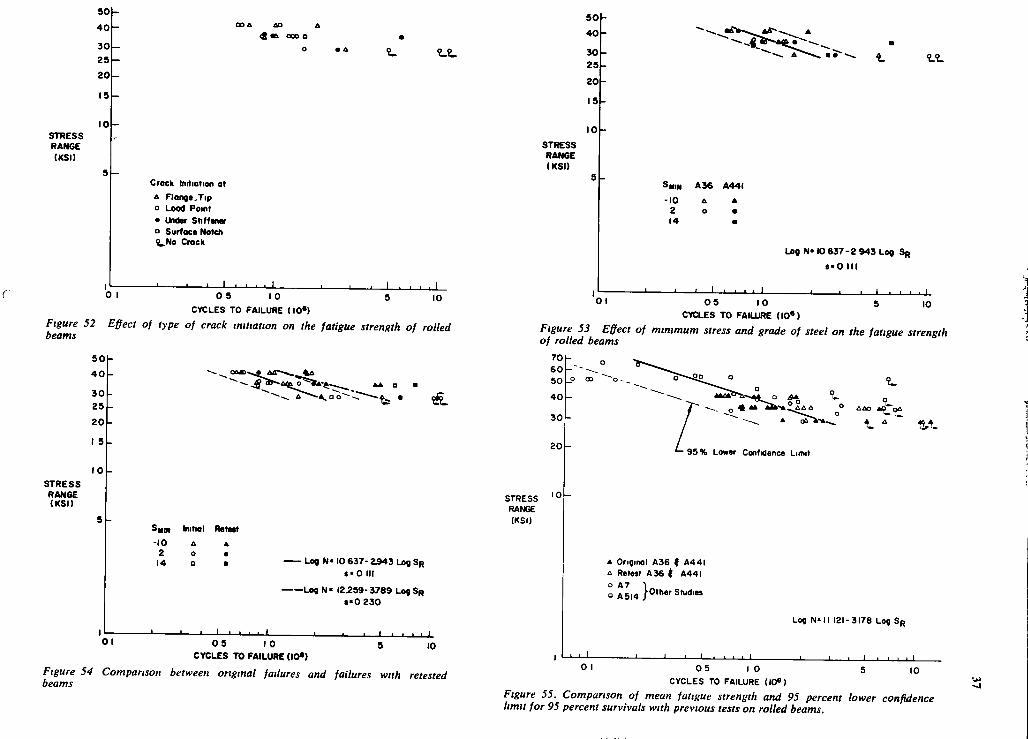
5 0
4 0
3 0
2 5
2 0
15
10 STRESS RANGE (KSI)
OD A to 4 «& OOO O
Crock Initiation ot A Flange.Tip o Load Point • Under Stiffener a Surface Notch %.No Crack
_ L _ L 0 1 0 5 10 5 10
CYCLES TO FAILURE (10")
Figure 52 Effect of type of crack initiation on the fatigue strength of rolled beams
5 0
4 0
3 0
2 5
2 0
I 5
1 0 STRESS RANGE (KSI)
A a ~ ^ , * A
Sum Initnl Reteet -10
2 14
Log N« 10 6 3 7 - 2 9 4 3 Log SR
s - 0 III
Log N • 12^59- 3 7 8 9 Log SR $ • 0 2 3 0
0 1 _ i _ L
OS 1 0
CYCLES TO FAILURE ( I 0 » ) 10
Figure 54 Comparison between original failures and failures with retested beams
5 0
4 0
3 0
2 5
2 0 I
1 5
1 0 STRESS RANGE (KSI)
SHIN A 3 6 A 4 4 I
-10 A A 2 o • 14 •
- 1 I L 0 1
Log N- 10 6 3 7 - 2 9 4 3 Log SR
S'O Ml
1 1 1 1 I J I
0 5 1 0
CYCLES TO FAILURE (lO") 10
Figure 53 Effect of minimum stress and grade of steel on the fatigue strength of rolled beams
7 0 -6 0 - - - -5 0 p 00 o ,
STRESS RANGE (KSI)
40 -30
20
10
% A b > A A A A
95% Lower Confidence Limit
A A O tf^OA
A Original A36 ( A44I A Retest A36 ( A44I •AD *"" Studies
Log NO I 121-3178 Log SR
0 I J
10 0 5 10 5 CYCLES TO FAILURE (I0«)
Figure 55. Comparison of mean fatigue strength and 95 percent lower confidence limit for 95 percent survivals with previous tests on rolled beams.
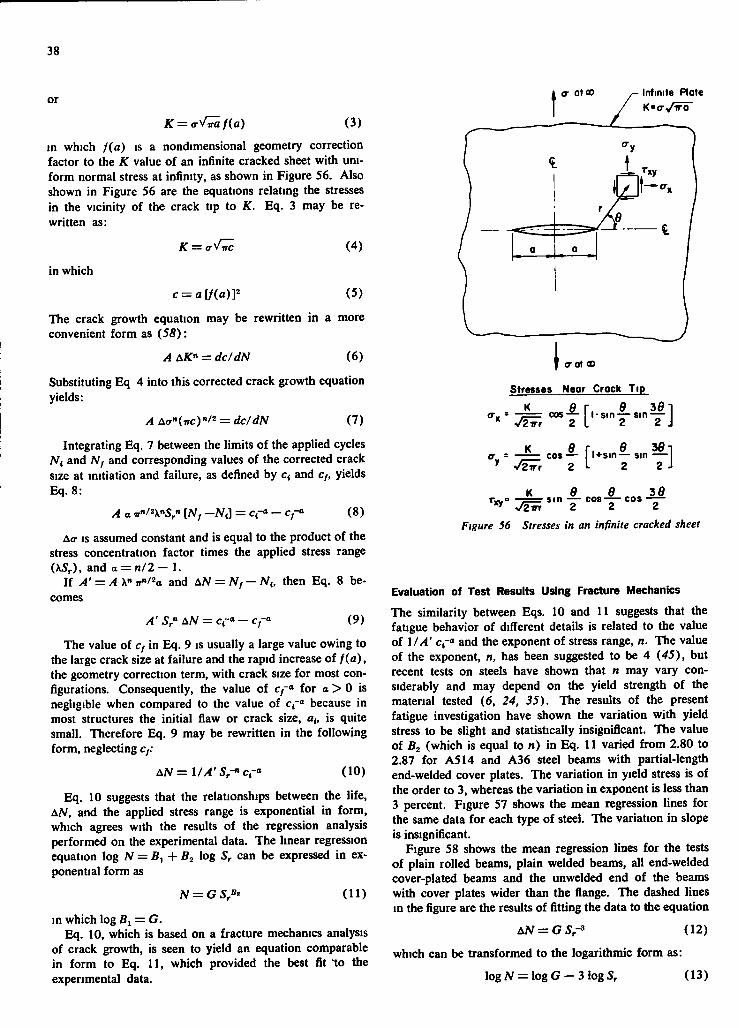
38
or o- atoo
K = < T ^ f ( a ) (3)
in which / ( a ) is a nondimensional geometry correction factor to the K value o f an infinite cracked sheet wi th unif o r m normal stress at infinity, as shown in Figure S6. Also shown in Figure S6 are the equations relating the stresses in the vicinity of the crack tip to K. Eq . 3 may be rewritten as:
in which
K = < T ^
c = a [ / ( f l ) P
(4)
(5 )
The crack growth equation may be rewritten in a more convenient f o r m as ( 5 5 ) :
A A K " = dc/dN (6 )
Substituting Eq 4 into this corrected crack growth equation yields:
^ Ao-»(^c)''/2 = rfc/dN (7)
Integrating Eq. 7 between the limits of the applied cycles Ni and Nf and corresponding values of the corrected crack size at initiation and failure, as defined by c< and Cf, yields Eq. 8:
A a irn/^Xni,." [N, - N J - Cf^ - Cf (8 )
Ao- IS assumed constant and is equal to the product of the stress concentration factor times the applied stress range OSr), and a = n/2 — 1.
I f /4' = /4 X''ir»/='o and A N = N ; - N < , then Eq. 8 becomes
(9)
The value of Cf in Eq. 9 is usually a large value owing to the large crack size at failure and the rapid increase of / ( a ) , the geometry correction term, with crack size f o r most configurations. Consequently, the value of C;-« for a > 0 is negligible when compared to the value of c,-" because in most structures the initial flaw or crack size, a,, is quite small. Therefore Eq. 9 may be rewritten in the fol lowing fo rm, neglecting c ;
A N = i / / i ' S , - " c r « (10)
Eq. 10 suggests that the relationships between the l i fe , A N , and the applied stress range is exponential in f o r m , which agrees with the results of the regression analysis performed on the experimental data. The linear regression equation log N — B^ + Bi log 5, can be expressed in exponential f o r m as
N = G Sr"' (11)
in which log Bi = G. Eq. 10, which is based on a fracture mechanics analysis
of crack growth, is seen to yield an equation comparable in f o r m to Eq. 11, which provided the best fit to the experimental data.
Infinite Plate K'aV^ro'
/ I -
<ra1 <D
Stresses Neor Crock Tip
: = cos- ' ' - l - s i n — s i n - — Zirr 2 L 2 2 J
Br, 0 361 I • s i n — s i n — 2 L 2 2 J
K 9 6 s in — c o s - — cos
2
31
Figure 56 Stresses in an infinite cracked sheet
Evaluation of Test Results Using Fracture Mechanics
The similarity between Eqs. 10 and 11 suggests that the fatigue behavior of different details is related to the value of 1/A' c,-" and the exponent of stress range, n. The value of the exponent, n, has been suggested to be 4 {45), but recent tests on steels have shown that n may vary considerably and may depend on the yield strength of the material tested (6, 24, 35). The results o f the present fatigue investigation have shown the variation wi th yield stress to be slight and statistically insignificant. The value of B2 (which is equal to n ) in Eq. 11 varied f r o m 2.80 to 2.87 for A S M and A36 steel beams wi th partial-length end-welded cover plates. The variation in yield stress is of the order to 3, whereas the variation in exponent is less than 3 percent. Figure 57 shows the mean regression lines f o r the same data fo r each type of steel. The variation in slope is insignificant.
Figure 58 shows the mean regression lines f o r the tests of plain rolled beams, plain welded beams, all end-welded cover-plated beams and the unwelded end o f the beams wi th cover plates wider than the flange. The dashed lines in the figure are the results of fitting the data to the equation
AJV = G 5,-3 (12)
which can be transformed to the logarithmic f o r m as:
log N = log G - 3 log S,. (13)
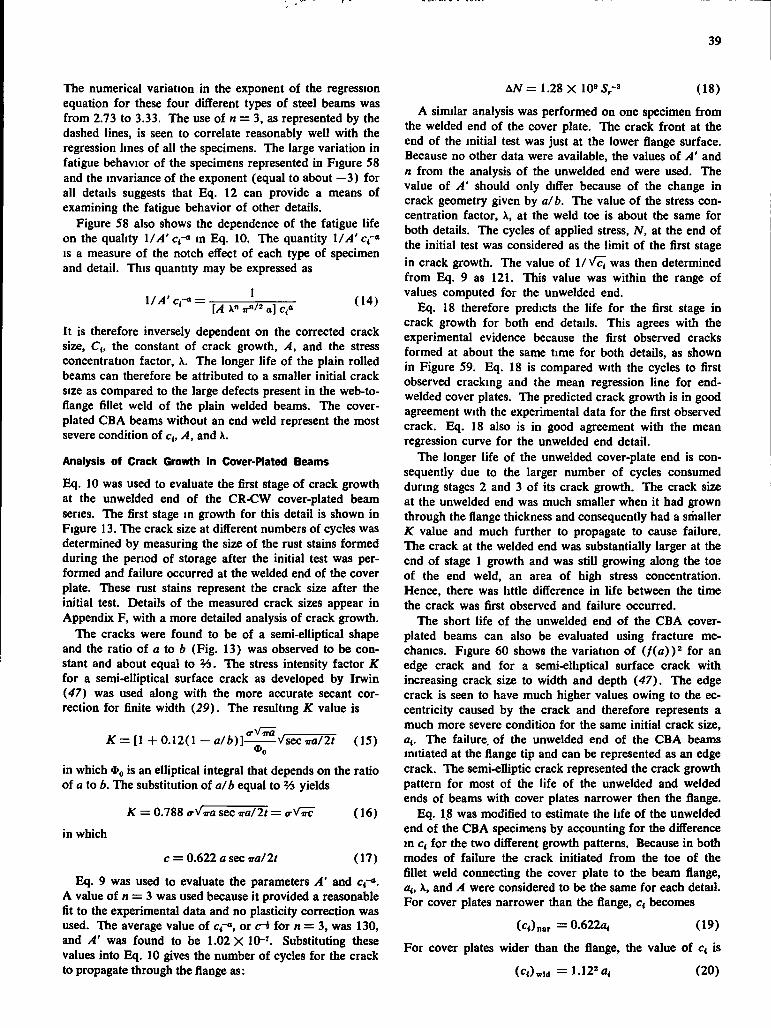
39
The numerical variation in the exponent of the regression equation fo r these four different types of steel beams was f rom 2.73 to 3.33. The use of n = 3, as represented by the dashed lines, is seen to correlate reasonably well wi th the regression lines of all the specimens. The large variation in fatigue behavior of the specimens represented in Figure 58 and the invariance of the exponent (equal to about —3) for all details suggests that Eq. 12 can provide a means of examining the fatigue behavior of other details.
Figure 58 also shows the dependence of the fatigue l i fe on the quahty l/A' cc^ in Eq. 10. The quantity 1/^4'c,-« IS a measure of the notch effect of each type of specimen and detail. This quantity may be expressed as
A N = 1.28 X 10»5,-^ (18)
l /^ 'c , -<« = 1 [ A X" T T " / ! ' O ] C(»
(14)
I t is therefore inversely dependent on the corrected crack size, Cf, the constant of crack growth, A, and the stress concentration factor, X. The longer l i fe of the plain rolled beams can therefore be attributed to a smaller initial crack size as compared to the large defects present in the web-to-flange fillet weld of the plain welded beams. The cover-plated CBA beams without an end weld represent the most severe condition of c , A, and X.
Analysis of Crack Growth in Cover-Plated Beams
Eq. 10 was used to evaluate the first stage of crack growth at the unwelded end of the CR-CW cover-plated beam series. The first stage in growth for this detail is shown in Figure 13. The crack size at different numbers of cycles was determined by measuring the size of the rust stains formed during the period of storage after the init ial test was performed and failure occurred at the welded end of the cover plate. These rust stains represent the crack size after the init ial test. Details of the measured crack sizes appear in Appendix F, with a more detailed analysis of crack growth.
The cracks were found to be of a semi-elliptical shape and the ratio of a to 6 (Fig. 13) was observed to be constant and about equal to % . The stress intensity factor K fo r a semi-elliptical surface crack as developed by I r w i n (47) was used along wi th the more accurate secant correction for finite width ( 2 9 ) . The resulting K value is
= [ H - 0 . 1 2 ( 1 - a / A ) ] - ^ ^ V s e c W 2 / (15) * 0
in which % is an elliptical integral that depends on the ratio of a to b. The substitution of a/b equal to % yields
in which
K = 0.788 o-Virflsec W 2 r =
c = 0.622asec W 2 <
(16)
(17)
Eq. 9 was used to evaluate the parameters A' and c,-". A value of n = 3 was used because i t provided a reasonable fit to the experimental data and no plasticity correction was used. The average value of or c-1 for w = 3, was 130, and A' was found to be 1.02 X 10-^ Substituting these values into Eq. 10 gives the number of cycles fo r the crack to propagate through the flange as:
A similar analysis was performed on one specimen f r o m the welded end of the cover plate. The crack f ront at the end of the init ial test was just at the lower flange surface. Because no other data were available, the values o f A' and n f r o m the analysis of the unwelded end were used. The value of A' should only differ because of the change in crack geometry given by a/b. The value of the stress concentration factor, X, at the weld toe is about the same fo r both details. The cycles of applied stress, N, at the end of the initial test was considered as the l imi t of the first stage in crack growth. The value of l / \ / c i was then determined f r o m Eq. 9 as 121. This value was within the range of values computed fo r the unwelded end.
Eq. 18 therefore predicts the l i fe for the first stage in crack growth for both end details. This agrees wi th the experimental evidence because the first observed cracks formed at about the same time for both details, as shown in Figure 59. Eq. 18 is compared with the cycles to first observed cracking and the mean regression line for end-welded cover plates. The predicted crack growth is in good agreement with the experimental data for the first observed crack. Eq. 18 also is in good agreement wi th the mean regression curve for the unwelded end detail.
The longer l i fe of the unwelded cover-plate end is consequently due to the larger number of cycles consumed during stages 2 and 3 of its crack growth. The crack size at the unwelded end was much smaller when i t had grown through the flange thickness and consequently had a smaller K value and much further to propagate to cause failure. The crack at the welded end was substantially larger at the end of stage 1 growth and was still growing along the toe of the end weld, an area o f high stress concentration. Hence, there was little difference in l i fe between the time the crack was first observed and failure occurred.
The short l i fe of the unwelded end of the C B A cover-plated beams can also be evaluated using fracture mechanics. Figure 60 shows the variation o f ( / ( a ) ) ^ for an edge crack and fo r a semi-elliptical surface crack wi th increasing crack size to width and depth (47). The edge crack is seen to have much higher values owing to the eccentricity caused by the crack and therefore represents a much more severe condition for the same initial crack size, a(. The failure, of the unwelded end of the C B A beams initiated at the flange tip and can be represented as an edge crack. The semi-elliptic crack represented the crack growth pattern fo r most of the l i fe of the unwelded and welded ends of beams wi th cover plates narrower then the flange.
Eq. 18 was modified to estimate the l ife of the unwelded end of the CBA specimens by accounting f o r the difference m c« fo r the two different growth patterns. Because in both modes of failure the crack initiated f r o m the toe of the fillet weld connecting the cover plate to the beam flange, Of, X, and A were considered to be the same fo r each detail. For cover plates narrower than the flange, becomes
( c , ) „ „ = 0 . 6 2 2 « , (19)
For cover plates wider than the flange, the value o f is
(c,)w,d =1.12='a , (20)
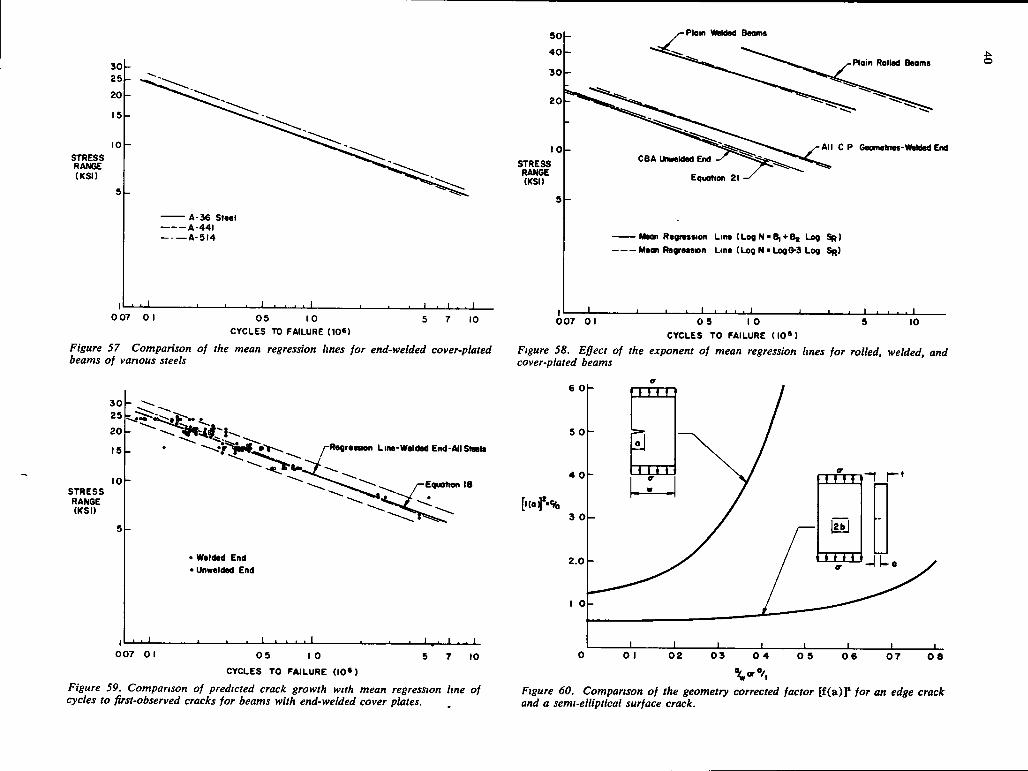
30 25
20
15
10 STRESS RANGE (KSI)
A-36 Steel A-441 A-514
_ L 0 07 0 1 0 5 I 0
CYCLES TO FAILURE (10«) 10
Figure 57 Comparison of the mean regression lines for end-welded cover-plated beams of various steels
30 25
20
15
STRESS RANGE (KSI)
yrRegr«e«on Line-Welded End-AllStMU
^Equation IB
' Welded End • Unwelded End
007 01 0 5 10
CYCLES TO FAILURE {I0») 10
Figure 59. Comparison of predicted crack growth with mean regression line of cycles to first-observed cracks for beams with end-welded cover plates.
50
40
30
20
10 STRESS RANGE (KSI)
-Plain Welded Beams
All C P Geometnes
I 007 01
CBA UnweMed End
Equation 2
•Meat Regression Line (LogN'Bc^Bt Log SR) - Meoi Regression Line (Log N • Log 6-3 Log SR)
I I I I I I 0 5 10 CYCLES TO FAILURE ( I 0 » )
Figure 58. Effect of the exponent of mean regression lines for rolled, welded, and cover-plated beams
6 0
4 O h r m
0 I 0 2 O 5 0 6 0 7 OB 0 3 0 4
Figure 60. Comparison of the geometry corrected factor [£(a)]" for an edge crack and a semi-elliptical surface crack.
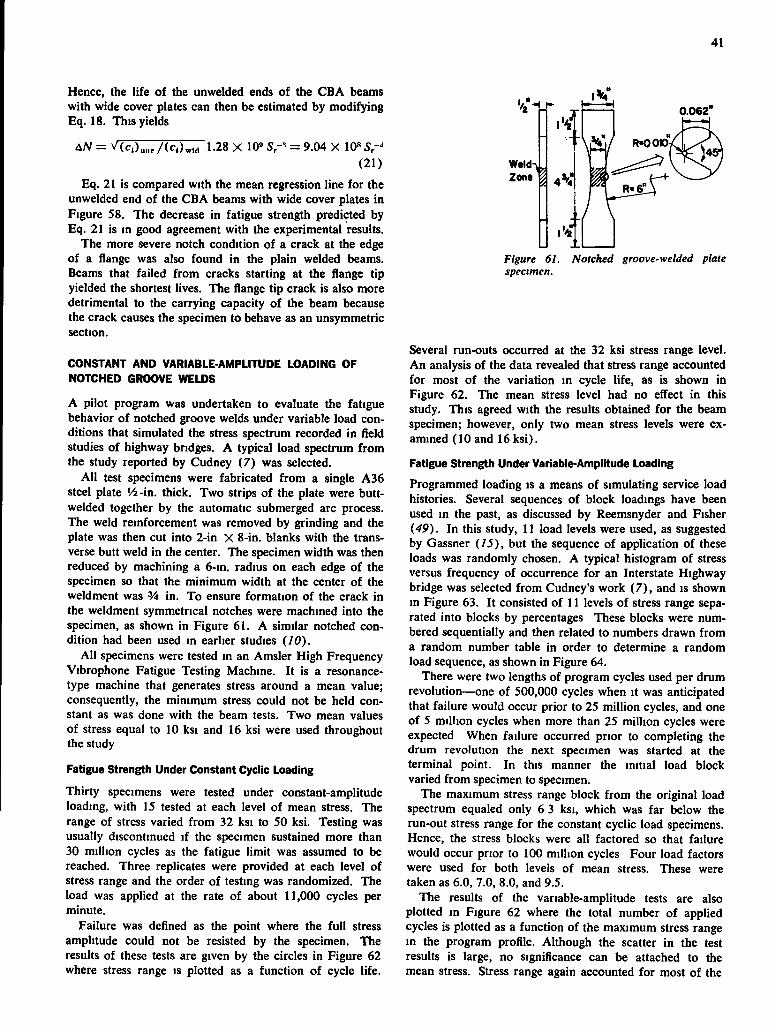
41
Hence, the life of the unwelded ends of the CBA beams with wide cover plates can then be estimated by modifying Eq. 18. This yields
0.062"
A/V = V(c,),„.,/(c,)„,„ 1.28 X 10" Sr' = 9.04 X 10«5,- ' (21)
Eq. 21 is compared with the mean regression line for the unwelded end of the CBA beams with wide cover plates in Figure 58. The decrease in fatigue strength predicted by Eq. 21 is in good agreement with the experimental results.
The more severe notch condition of a crack at the edge of a flange was also found in the plain welded beams. Beams that failed from cracks starting at the flange tip yielded the shortest lives. The flange tip crack is also more detrimental to the carrying capacity of the beam because the crack causes the specimen to behave as an unsymmetric section.
CONSTANT AND VARIABLE-AMPLITUDE LOADING OF NOTCHED GROOVE WELDS
A pilot program was undertaken to evaluate the fatigue behavior of notched groove welds under variable load conditions that simulated the stress spectrum recorded in field studies of highway bridges. A typical load spectrum from the study reported by Cudney (7) was selected.
Al l test specimens were fabricated from a single A36 steel plate ' / i - in . thick. Two strips of the plate were butt-welded together by the automatic submerged arc process. The weld reinforcement was removed by grinding and the plate was then cut into 2-in X 8-in. blanks with the transverse butt weld in the center. The specimen width was then reduced by machining a 6-in. radius on each edge of the specimen so that the minimum width at the center of the weldment was % in. To ensure formation of the crack in the weldment symmetrical notches were machined into the specimen, as shown in Figure 61. A similar notched condition had been used in earlier studies (10).
All specimens were tested in an Amsler High Frequency Vibrophone Fatigue Testing Machine. It is a resonance-type machine that generates stress around a mean value; consequently, the minimum stress could not be held constant as was done with the beam tests. Two mean values of stress equal to 10 ksi and 16 ksi were used throughout the study
Fatigue Strength Under Constant Cyclic Loading
Thirty specimens were tested under constant-amplitude loading, with 15 tested at each level of mean stress. The range of stress varied from 32 ksi to 50 ksi. Testing was usually discontinued if the specimen sustained more than 30 million cycles as the fatigue limit was assumed to be reached. Three replicates were provided at each level of stress range and the order of testing was randomized. The load was applied at the rate of about 11,000 cycles per minute.
Failure was defined as the point where the full stress amplitude could not be resisted by the specimen. The results of these tests are given by the circles in Figure 62 where stress range is plotted as a function of cycle life.
R-OOO
Figure 61. Notched groove-welded plate specimen.
Several run-outs occurred at the 32 ksi stress range level. An analysis of the data revealed that stress range accounted for most of the variation in cycle life, as is shown in Figure 62. The mean stress level had no effect in this study. This agreed with the results obtained for the beam specimen; however, only two mean stress levels were examined (10 and 16 ksi).
Fatigue Strength Under Variable-Amplitude Loading
Programmed loading is a means of simulating service load histories. Several sequences of block loadings have been used in the past, as discussed by Reemsnyder and Fisher {49). In this study, 11 load levels were used, as suggested by Gassner (75), but the sequence of application of these loads was randomly chosen. A typical histogram of stress versus frequency of occurrence for an Interstate Highway bridge was selected from Cudney's work (7) , and is shown in Figure 63. It consisted of 11 levels of stress range separated into blocks by percentages These blocks were numbered sequentially and then related to numbers drawn from a random number table in order to determine a random load sequence, as shown in Figure 64.
There were two lengths of program cycles used per drum revolution—one of 500,000 cycles when it was anticipated that failure would occur prior to 25 million cycles, and one of 5 million cycles when more than 25 million cycles were expected When failure occurred prior to completing the drum revolution the next specimen was started at the terminal point. In this manner the initial load block varied from specimen to specimen.
The maximum stress range block from the original load spectrum equaled only 6 3 ksi, which was far below the run-out stress range for the constant cyclic load specimens. Hence, the stress blocks were all factored so that failure would occur prior to 100 million cycles Four load factors were used for both levels of mean stress. These were taken as 6.0, 7.0, 8.0, and 9.5.
The results of the variable-amplitude tests are also plotted in Figure 62 where the total number of applied cycles is plotted as a function of the maximum stress range in the program profile. Although the scatter in the test results is large, no significance can be attached to the mean stress. Stress range again accounted for most of the
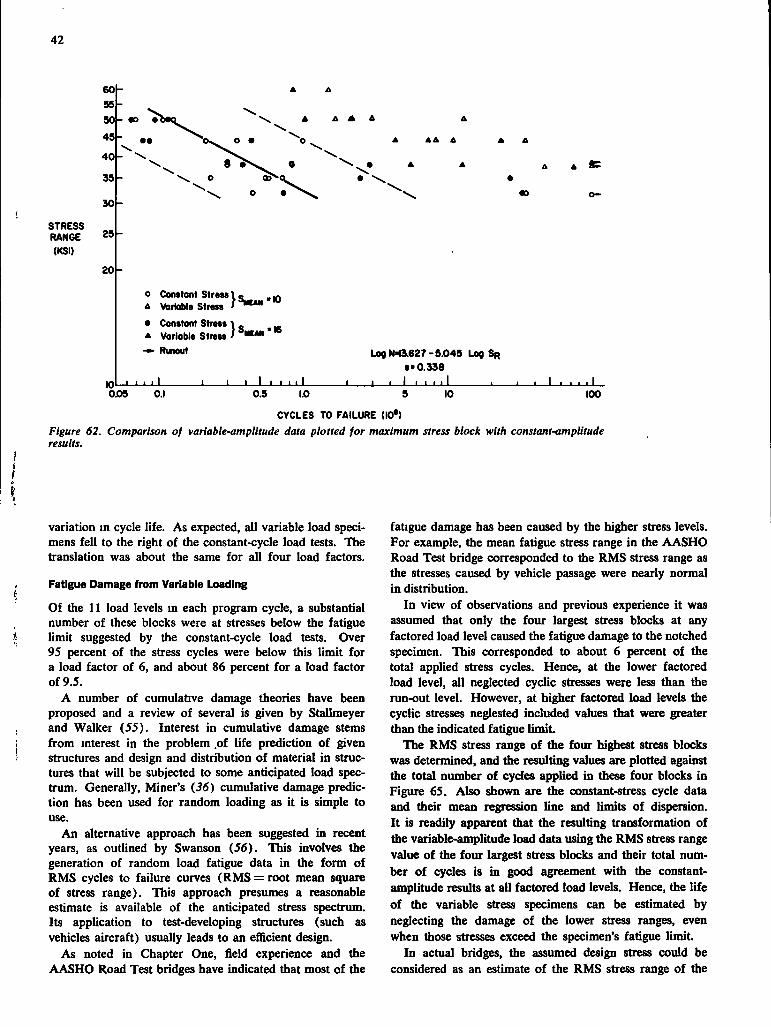
42
STRESS RANGE (KSI)
601
55
SO
4 5
4 0
39
3 0
2 5
2 0
lOl
o ConstontStrewlc „ A Variable Stress J^**" • Constant Stress A Voriable Stress —- Runout
} S ^ « . | 6
I . • i l ' • I • • . . I
Log N'13.627-9.045 Log SR s> 0 .338
• • I • • • • ! ^ L L 0.05 0.1 10 100 0.5 1.0 5
CYCLES TO FAILURE (I0«) Figure 62. Comparison of variable-amplitude data plotted for maximum stress block with constant-amplitude results.
variation in cycle life. As expected, all variable load specimens fell to the right of the constant-cycle load tests. The translation was about the same for all four load factors.
Fatigue Damage from Variable Loading
Of the 11 load levels m each program cycle, a substantial number of these blocks were at stresses below the fatigue limit suggested by the constant-cycle load tests. Over 95 percent of the stress cycles were below this limit for a load factor of 6, and about 86 percent for a load factor of 9.5.
A number of cumulative damage theories have been proposed and a review of several is given by Stallmeyer and Walker (55). Interest in cumulative damage stems from mterest in the problem .of life prediction of given structures and design and distribution of material in structures that will be subjected to some anticipated load spectrum. Generally, Miner's (36) cumulative damage prediction has been used for random loading as it is simple to use.
An alternative approach has been suggested in recent years, as outlined by Swanson (56). This involves the generation of random load fatigue data in the form of RMS cycles to failure curves (RMS = root mean square of stress range). This approach presumes a reasonable estimate is available of the anticipated stress spectrum. Its application to test-developing structures (such as vehicles aircraft) usually leads to an efficient design.
As noted in Chapter One, field experience and the AASHO Road Test bridges have indicated that most of the
fatigue damage has been caused by the higher stress levels. For example, the mean fatigue stress range in the AASHO Road Test bridge corresponded to the RMS stress range as the stresses caused by vehicle passage were nearly normal in distribution.
In view of observations and previous experience it was assumed that only the four largest stress blocks at any factored load level caused the fatigue damage to the notched specimen. This corresponded to about 6 percent of the total applied stress cycles. Hence, at the lower factored load level, all neglected cyclic stresses were less than the run-out level. However, at higher factored load levels the cyclic stresses neglested included values that were greater than the indicated fatigue limit.
The RMS stress range of the four highest stress blocks was determined, and the resulting values are plotted against the total number of cycles applied in these four blocks in Figure 65. Also shown are the constant-stress cycle data and their mean regression line and limits of dispersion. I t is readily apparent that the resulting transformation of the variable-amplitude load data using the RMS stress range value of the four largest stress blocks and their total number of cycles is in good agreement with the constant-amplitude results at all factored load levels. Hence, the life of the variable stress specimens can be estimated by neglecting the damage of the lower stress ranges, even when those stresses exceed the specimen's fatigue limit.
In actual bridges, the assumed design stress could be considered as an estimate of the RMS stress range of the

43
% FREQUENCY
1500 2700 3900 5100
STRESS RANGE (PSD Figure 63. Basic histogram for variable load studies.
6300
STRESS RANGE (PSD
L F « I 0 0
6300lr
5IOOrt-
3900H-
2700
1500}-
_ L J l L . II
. I! I 10 20 30 40 50 60 70
FREQUENCY.% 80 90 100
Figure 64. Random load profile developed from basic histogram {one revolution of drum IS 500,000 or 5 million cycles).
STRESS RANGE (KSI)
95
5 0 >-
4 5
4 0
35
3 0 -
2 5 -
20h
lOl
A RMS Stress / ^ « * " • Constant Stress A RMS Sress -— Runout
•16
J . ±
Log N-I3J627-5.045 Log SR
S ' 0 . 3 3 8
• • I • • • - I 0 0 5 0.1 10 0.5 1.0 5
CYCLES TO FAILURE (id')
Figure 65. Transformation of four largest variable-amplitude blocks to RMS stress.
100
44
largest stress blocks to which the structure is subjected. The pilot study has indicated that it may be possible to estimate the life of a structure directly from constant-cycle fatigue data using the assumed design stress as an estimate
of the RMS stress range. Obviously, further work is needed to ascertain whether this is a reasonable approximation. Additional variable-load fatigue studies are also needed using more realistic stress levels and welded details.
CHAPTER FOUR
RECOMMENDATIONS AND APPLICATION
1. The current (1969) specifications of the American Association of State Highway Officials (AASHO), the American Welding Society (AWS), and the American Railway Engineering Association (AREA) limit the maximum applied stress by providing a fatigue stress that is a function of type of steel, the relative proportions of minimum and maximum stress, and the slope of the fatigue equation (14). These provisions have indicated substantial differences attributed to the type of steel and to the proportions of minimum and maximum stress. In addition, the slope of the fatigue equation was often taken as less than one, indicating that interaction existed between the range of stress and minimum stress.
This study has shown that the currently used fatigue provisions are not satisfactory for A36 and A441 steel rolled beams and for plain welded beams, cover-plated beams, and flange splices of A36, A441, and A S H steel. Stress range alone accounts for the variation in cycle life Specification provisions should reflect this fact.
The use of stress range was confirmed by a minimum notch-producing detail—the plain rolled beam—which provided an upper boundary for fatigue strength. Similar behavior was observed for a severe notch-producing detail— the cover-plated beam—which provided a lower boundary for the fatigue strength. Figure 66 compares the stress cycle relationship for the upper and lower boundary behavior. The mean fatigue strengths and 95 percent confidence limits for survival are shown for the cover-plated, welded, and rolled beams Al l test data are also plotted.
2 Values of stress range for specification provisions should be based on confidence limits. This provides a rational means of accounting for the sample size on which the value is based, the desired percentage survival, the confidence level, and the degree of variation in the test observations.
I t IS recommended that allowable fatigue stress range values be selected from the 95 percent confidence limits for 95 percent survivals as provided by the lower limits of dispersion for the various beam types and details. This provides a rational means of accounting for variation in the test data and permits uniformity in the selection of allowable stresses.
For most of the beam series in this study, the sample
size was large enough to ensure that twice the standard error of estimate was approximately equal to the 95 percent confidence limit for 95 percent survivals. Because the lower limits of dispersion are straight lines parallel to the regression lines, they provide a prediction of the expected life for the selected level of survival (50).
Past practice was to provide a factor of safety against the mean life (14). The mean life was the best estimate of the life that will be achieved by 50 percent of the specimens. However, 50 percent will fail prior to the mean life. The application of a factor of safety to the mean life of about 1.9 for 100,000 cycles and 1 4 for 2 million cycles of load yielded allowable stresses that corresponded to large variations in tolerance limits, because the variability in the test data was not accounted for. In effect, a variable factor of safety was used against the possibility of a failure. The use of a uniform lower tolerance limit will circumscribe this weakness and provide the uniformity that is needed.
3. For purposes of design this study has shown that the fatigue strength of plain welded beams, flange splice beams, and cover-plated beams is the same for each type of detail, independent of the type of steel. In addition, the tests of A36 and A441 rolled steel beams yielded the same fatigue strength.
The coefficient a used in the existing (1969) AASHO Specifications to extend the general equation to steels of varying tensile strength should be set equal to zero for these welded details to reflect this finding.
Although this study was directed primarily toward the effect of weldments, the pilot study on plain rolled beams of A36 and A441 steel yielded the same result No difference existed in their fatigue strength. Tests were not undertaken on A514 steel rolled beams in this study. A comparison with previous work has indicated that when the mean fatigue strength and confidence limits were extrapolated into the higher stress region, the agreement with existing studies on A514 steel beams was good. In any event, the base metal criteria for A36 and A441 steel should be the same.
4. Current (1969) AASHO Specifications indicate that web-to-flange fillet welds can be neglected and the beam considered as base metal for purposes of fatigue design. This assumption is incorrect and grossly overstates the
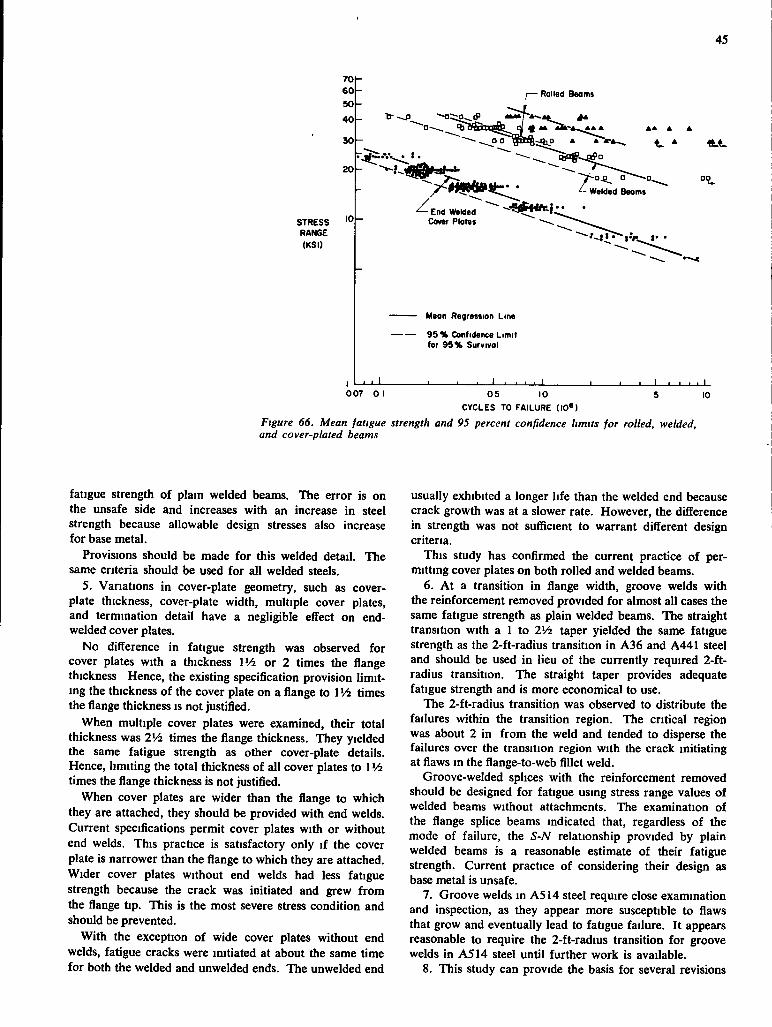
45
70 60 50 40
30
20
STRESS '01 RANGE (KSI)
Rolled Beams
Welded Beams
End Welded Cover Plates
- L
Mean Regression Line
95 % Confidence Limit for 95% Survival
- L J I I I I I I 007 0 1 05 10 5
CYCLES TO FAILURE (I0») Figure 66. Mean fatigue strength and 95 percent confidence limits for rolled, welded, and cover-plated beams
10
fatigue strength of plain welded beams. The error is on the unsafe side and increases with an increase in steel strength because allowable design stresses also increase for base metal.
Provisions should be made for this welded detail. The same criteria should be used for all welded steels.
5. Variations in cover-plate geometry, such as cover-plate thickness, cover-plate width, multiple cover plates, and termination detail have a negligible effect on end-welded cover plates.
No difference in fatigue strength was observed for cover plates with a thickness 1V4 or 2 times the flange thickness Hence, the existing specification provision limiting the thickness of the cover plate on a flange to Wi times the flange thickness is not justified.
When multiple cover plates were examined, their total thickness was IVi times the flange thickness. They yielded the same fatigue strength as other cover-plate details. Hence, limiting the total thickness of all cover plates to 1 times the flange thickness is not justified.
When cover plates are wider than the flange to which they are attached, they should be provided with end welds. Current specifications permit cover plates with or without end welds. This practice is satisfactory only if the cover plate is narrower than the flange to which they are attached. Wider cover plates without end welds had less fatigue strength because the crack was initiated and grew from the flange tip. This is the most severe stress condition and should be prevented.
With the exception of wide cover plates without end welds, fatigue cracks were initiated at about the same time for both the welded and unwelded ends. The unwelded end
usually exhibited a longer life than the welded end because crack growth was at a slower rate. However, the difference in strength was not sufficient to warrant different design criteria.
This study has confirmed the current practice of permitting cover plates on both rolled and welded beams.
6. At a transition in flange width, groove welds with the reinforcement removed provided for almost all cases the same fatigue strength as plain welded beams. The straight transition with a 1 to 2V2 taper yielded the same fatigue strength as the 2-ft-radius transition in A36 and A441 steel and should be used in lieu of the currently required 2-ft-radius transition. The straight taper provides adequate fatigue strength and is more economical to use.
The 2-ft-radius transition was observed to distribute the failures within the transition region. The critical region was about 2 in from the weld and tended to disperse the failures over the transition region with the crack initiating at flaws in the flange-to-web fillet weld.
Groove-welded splices with the reinforcement removed should be designed for fatigue using stress range values of welded beams without attachments. The examination of the flange splice beams indicated that, regardless of the mode of failure, the S-N relationship provided by plain welded beams is a reasonable estimate of their fatigue strength. Current practice of considering their design as base metal is unsafe.
7. Groove welds in ASM steel require close examination and inspection, as they appear more susceptible to flaws that grow and eventually lead to fatigue failure. I t appears reasonable to require the 2-ft-radius transition for groove welds in ASM steel until further work is available.
8. This study can provide the basis for several revisions
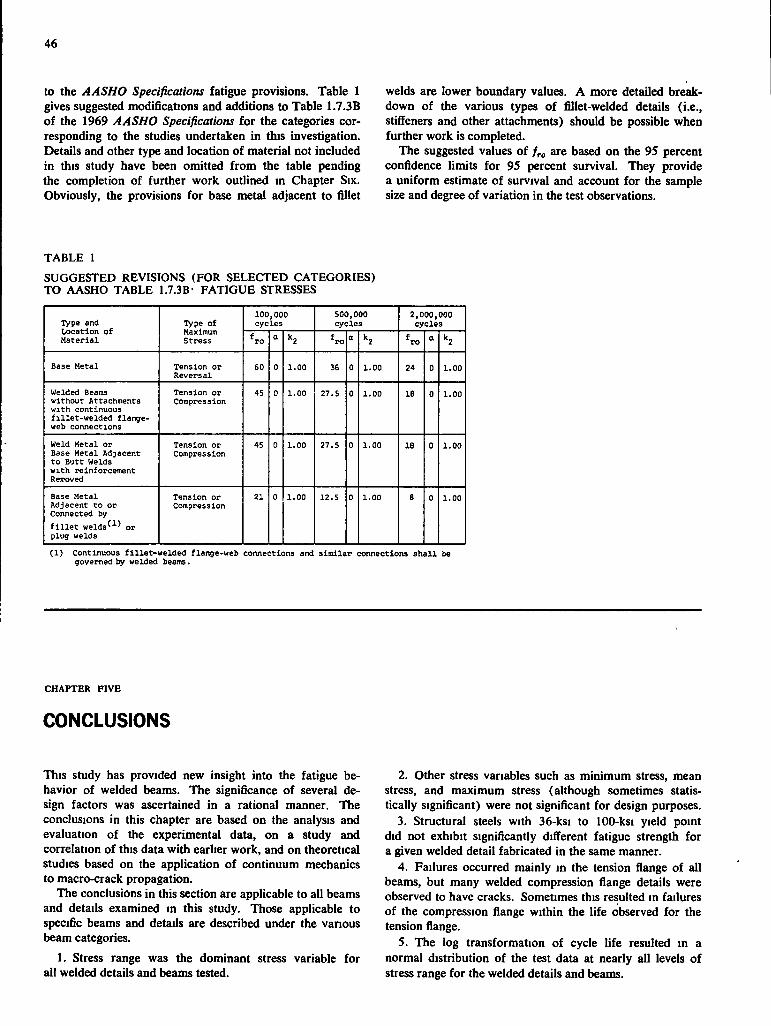
46
to the AASHO Specifications fatigue provisions. Table 1 gives suggested modifications and additions to Table 1.7.3B of the 1969 AASHO Specifications for the categories corresponding to the studies undertaken in this investigation. Details and other type and location of material not included in this study have been omitted from the table pending the completion of further work outlined in Chapter Six. Obviously, the provisions for base metal adjacent to fillet
welds are lower boundary values. A more detailed breakdown of the various types of fillet-welded details (i.e., stiffeners and other attachments) should be possible when further work is completed.
The suggested values of / „ are based on the 95 percent confidence limits for 95 percent survival. They provide a uniform estimate of survival and account for the sample size and degree of variation in the test observations.
TABLE 1 SUGGESTED REVISIONS (FOR SELECTED CATEGORIES) TO AASHO TABLE 1.7.3B- FATIGUE STRESSES
Type and Location of Material
Type of Maximum Stress
100,000 cycles
500,000 cycles
2,000,000 cycles Type and
Location of Material
Type of Maximum Stress *ro a *ro a " 2 *ro a "2
Base Metal Tension or Reversal
60 0 1.00 36 0 1.00 24 0 1.00
Welded Beams without Attachments with continuous f i l l e t - w e l d e d flange-web connections
Tension or Compression
45 0 1.00 27.5 0 1.00 I S 0 1.00
Weld Metal or Base Metal Adjacent to B'itt Welds with reinforcement Reroved
Tension or Compression
45 0 1.00 27.5 0 1.00 IB 0 1.00
Base Metal Adjacent to or Connected by
f i l l e t welds^^^ or plug welds
Tension or Compression
21 0 1.00 12.5 0 1.00 S 0 1.00
(1) Continuous f i l l e t -we lded flange-web governed by welded beams.
connections and s i m i l a r connections s h a l l be
CHAPTER FIVE
CONCLUSIONS
This study has provided new insight into the fatigue behavior of welded beams. The significance of several design factors was ascertained in a rational manner. The conclusions in this chapter are based on the analysis and evaluation of the experimental data, on a study and correlation of this data with earlier work, and on theoretical studies based on the application of continuum mechanics to macro-crack propagation.
The conclusions in this section are applicable to all beams and details examined in this study. Those applicable to specific beams and details are described under the various beam categories.
1. Stress range was the dominant stress variable for all welded details and beams tested.
2. Other stress variables such as minimum stress, mean stress, and maximum stress (although sometimes statistically significant) were not significant for design purposes.
3. Structural steels with 36-ksi to 100-ksi yield point did not exhibit significantly different fatigue strength for a given welded detail fabricated in the same manner.
4. Failures occurred mainly in the tension flange of all beams, but many welded compression flange details were observed to have cracks. Sometimes this resulted in failures of the compression flange within the life observed for the tension flange.
5. The log transformation of cycle life resulted in a normal distribution of the test data at nearly all levels of stress range for the welded details and beams.
47
6. A theoretical stress analysis based on fracture mechanics of macro-crack propagation substantiated the experimental model that provided the best fit to the test data.
7. The determination of stress range as the major design factor at both upper and lower boundaries of fatigue strength affirms the need for further work on other welded details so that a comprehensive design criteria can be developed.
8 There were no observable differences in fatigue life of a detail due to rest periods or interruptions of the test for periods of time up to one year in duration. Also, other uncontrolled variables, such as test frequency, laboratory temperature, and humidity, did not appear to have any influence.
9. The results obtained at the two laboratories conducting the study were the same.
10. This study can be used as a basis for several modifications to the fatigue provisions of the AASHO Specifications.
COVER-PLATED BEAMS
1. Cracks were observed at the ends of cover plates at about the same life for all types of cover-plated beams for a given stress range.
2. Beams with cover plates wider than the flange yielded the shortest life. At the end of cover plate with no end weld, the crack initiated at the toe of the longitudinal fillet welds connecting the cover plate to the beam flange. At end-welded cover plates the crack initiated at the toe of the transverse end weld near the center of the cover plate. The fatigue strength at the unwelded end of cover-plated beams was usually longer than that observed at the welded end.
3. The fatigue strength of end-welded partial-length cover plates was not affected by variations in cover-plate geometry. Wide cover plates, cover plates IVi to 2 times the flange thickness, and multiple cover-plated beams all yielded the same strength.
4. The shorter fatigue life of wide cover-plated beams without transverse end weld was due to the more severe crack growth condition that exists for edge cracks. Fracture mechanics concepts were in agreement with the observed behavior.
5. The fatigue strengths of rolled and welded beams with partial-length cover plates attached to the flanges by fillet welds were the same.
6. Within the limits of stress range that was examined for cover-plated beams (6 to 24 ksi) no fatigue limit was reached.
PLAIN WELDED BEAMS
1. Cracks usually initiated from a flaw in the fillet weld at the flange-to-web connection. Most flaws were observed in the vicinity of tack welds or weld repairs.
2. The possibility of crack initiation sites in the flange-to-web weld increased with increasing strength of steel.
as evidenced by the increase in frequency of crack formation.
3. Crack initiation at the flange tip occurred in only four cases and usually led to shorter life, as it represents a more critical crack growth condition.
4 Crack formation in the compression flange is attributed to the high tensile residual stresses that exist in the flange-to-web connection.
5. No fatigue limit was reached within the limits of stress range (18 to 42 ksi) examined for plain welded beams.
6. Current (1969) AASHO Specifications that indicate that web-to-flange connections can be treated as base metal are not satisfactory, as they grossly overstate their fatigue strength.
GROOVE WELDS AT FLANGE-WIDTH TRANSITIONS
1. Two distinct types of fatigue failures were observed. In the first, the crack initiated in the web-to-flange fillet weld in the same manner as in plain welded beams. The second type of failure initiated within the ground groove weld at a weld defect or at a surface notch.
2. Failures in the flange splice test beams resulted in fatigue strengths directly comparable to those of the plain welded beams.
3. The 2-ft-radius transition provided the best fatigue strength for all steels. However, the difference between transition details was not greatly different when A514 steel beams were not considered. The latter were manual groove welds.
4. The tapered transition in A36 and A441 steel and 2-ft-radius transition in A36, A441 and A514 steel provided the same fatigue strength as plain welded beams.
5. The use of a 2-ft radius transition does not appear to be justified in A36 and A441 steels as the straight tapered transition provided satisfactory fatigue strength.
6. The 2-ft-radius transition should be required for groove welds in A514 steel if the same allowable stresses are used for all steels. The alternate is a reduction in allowable stress range.
7. The sensitivity of the groove weld to initial flaws and type of steel needs further examination. Particular attention should be given to A514 steel.
ROLLED BEAMS
1. Several rolled beams exhibited extraordinarily long life, which emphasized the greater variability of the initial flaw size in the base metal and subsequent crack growth.
2. The different failure modes were randomly distributed at all levels of stress range and no grouping was apparent.
3. Extrapolation of the test results into higher levels of stress range provided reasonable agreement with tests of ASM steel beams. Additional tests are required to ascertain the effect that the type of steel has on the fatigue strength of base metal.
4. Further testing should be undertaken to examine the effect of minimum stress on the fatigue strength of base metal.
48
VARIABLE LOADING
1. The transformation of the variable-amplitude loading to the RMS (root mean square) stress range of the highest four blocks of loading provided a direct correlation with results from constant-cycle tests of similar specimens.
2. This study tended to confirm the assumption that most of the damage was caused by the larger stress blocks. Further work is needed on beam details to ascertain whether this finding is equally applicable to the crack growth in beams.
CHAPTER SIX
RECOMMENDATIONS FOR FURTHER WORK
The recommendations for further work presented in this chapter are based on the results obtained during this investigation and on an examination of earlier test data and studies.
The plain welded beam tests of this study yielded the best fatigue behavior that can be expected of welded built-up beams with existing welding practice These tests gave detailed information on the "minimum notch" condition of welded built-up beams and hence provided an upper boundary to the fatigue strength A "maximum notch" condition was provided by the beams with partial-length cover plates. The cover-plated beam represents one of the most severe conditions that can be expected and hence yielded a lower boundary condition.
In the study reported herein provisions were made to isolate the various design factors that had been shown in the past to influence the fatigue life. An examination of the literature had indicated that design factors expected to influence the fatigue strength were type of steel, type of detail, minimum stress, maximum stress, and stress range. However, the studies of the past did not permit an unbiased evaluation of the individual significance of these design factors. As a result, certain of these variables were considered to influence the behavior for some details and not for others Most of the difficulty was in the inability of the particular experiments to adequately assess variation, because no measure of the experimental error was available.
The analysis of the studies on the cover-plates beams, plain welded beams, and flange splices has shown clearly that, within the range of the experiment design, the only significant variables are the range of stress and the type of detail. For both the upper boundary (the plain welded beam tests) and the lower boundary (beams with partial-length cover plates), minimum stress, maximum stress, and type of steel do not account for a significant amount of variation in the cycle life. Stress range alone accounted for nearly all of the variation m life for these two basic details.
The study has confirmed that large gaps exist in the state of knowledge of the behavior of welded beams under cyclic application of load. Previous studies were not statis
tically designed and have led to misinterpretation of the significance of design variables. As a result, current (1969) specifications do not adequately reflect the influence of the variables on the fatigue strength. For example, the 1969 AASHO Specifications indicate that plain welded beams can be treated in the same way as rolled beams or plain plate. However, the facts do not bear this out and therefore the present specification provisions are not satisfactory. Misleading conclusions have also been reached with regard to high-strength steels and the influence of the minimum stress.
The study has indicated that in all probability similar conclusions can be expected for notch effects between the upper and lower conditions. However, additional research IS needed to verify this as well as to extend the applicability of the findings into regions not adequately covered by the results reported herein.
The pilot study on random variable loading of notched groove welds with the reinforcement removed confirmed observations on existing structures m service and the AASHO Road Test bridges that the maximum stress range cycles cause most of the fatigue damage. The RMS stress range of the highest four variable load stress blocks correlated with the constant-cycle tests of the same type of specimens. These stress blocks accounted for only 6 percent of the applied random cyclic loads. This provides further justification for the emphasis at this time on constant-cycle loading.
SUGGESTED STUDIES
It is recommended that consideration be given to the following further studies so that appropriate design criteria can be developed for conditions between the upper and lower boundaries for welded beams and to supplement the data from the present study.
1 Further studies should be made of rolled beams. The current pilot study indicates little differences in the behavior of A36 and A441 rolled beams. Additional data are needed for A36 and A441 steel beams, as well as an extension to ASM steel, so that the ful l range of structural steel
49
can be evaluated for "base" metal conditions. Simple tension plate specimens are not indicative of the behavior observed for beams and should not be used to amplify the beam test data
2. Further studies should be made of plain welded A441 and A514 steel beams, with particular emphasis on increased levels of minimum stress so the applicability of current findings can be extended. The existing experiment designs should be expanded where appropriate for this study. Particular emphasis should be given to the highest and lowest stress ranges.
3. Substantial studies are needel on the behavior of beams with stiffeners and other attachments Current AASHO Specifications ignore the fact that stiffeners may influence the fatigue strength. An exammation of the literature and existing data is inconclusive and no rational design criteria can be formulated from it. Attachments are claimed to have a variety of fatigue strengths and behavior. This resulted from the inadequacy of the scope of these existing studies.
4. Studies are needed of butt splices with the weld reinforcement in place The current studies on beam splices with the reinforcement removed needs supplementing The study has indicated that the beam splice with reinforcement removed will approach the upper boundary provided by the plain welded beam. Earlier studies on simple butt-welded plates have indicated substantially different strengths for welds with reinforcement in place compared to those with the remforcement removed. Because the plain welded beam provides an upper boundary to the fatigue strength, it IS desirable to ascertain whether butt welds with the reinforcement in place cause a substantial reduction in fatigue strength from the upper boundary. This will assist in determining whether excessive effort is being made to condition the splice even though it cannot exceed the upper boundary behavior. Particular attention should be given to splices in A514 steel
5. Butt splices with a transition in thickness should also be evaluated. Other detail variations such as coping the web and removing the reinforcement should be studied.
6. Pilot studies are needed on bolted beam splices. Existing studies have only involved tests on simple butt splices. As with welded details, the experiment designs have not permitted a rational evaluation of the design factors. Recent studies have indicated that type of steel may have only a minor influence, as is the case for welded beams. Because this class of joints forms an important segment of practical fastening methods it is desirable to extend the studies into this region
7. An evaluation of hybrid splices also should be undertaken. This would involve the evaluation of welded details connecting two different grades of steel together. The influence of dilution of the weldment and whether it influenced the fatigue behavior could be determined. In addition, other miscellaneous details should be studied, including the basic behavior of the weldment.
8. Further work should be undertaken on the effect of variable loading. It is recommended that cover-plated beams be examined under variable load to ascertain whether higher stress cycles cause most of the damage, as indicated by the pilot study.
The studies outlined in items 1 and 2 would aid in defining completely the upper and lower boundaries by providing additional information at the higher and lower levels of stress range and at other levels of minimum stress They would also provide the needed data for A514 steel. The suggested studies outlined in items 3 to 8 would provide information to extend the applicability of the present findings, and would also determine whether the design for intermediate "notch" conditions can be predicted on the basis of the upper and lower boundaries that have been established. These gaps in basic constant cycle fatigue knowledge need attention before emphasis is placed on random loading and cumulative damage studies.
The studies suggested for further work should also determine over the ful l range of details whether the findings at the upper and lower boundaries are applicable. This in turn will permit the development of a comprehensive design criteria for highway bridges.
REFERENCES
AMERICAN RAILWAY ENGINEERING ASSOCIATION, "Stress Distribution in Bridge Frames—Floorbeam Hangers," Proc. AREA, Vol. 51, pp. 470-503 (1950). AMERICAN RAILWAY ENGINEERING ASSOCIATION, "Fatigue Failures in Railway Bridges " Proc. AREA, Vol. 54, pp. 916-917 (1953). AMERICAN SOCIETY-FOR TESTING AND MATERIALS, "Fatigue Crack Propagation." ASTM STP 415 (1967).
6.
BASQUIN, O . H . , The Exponential Law of Endurance Tests." Proc. ASTM, Vol. X (1910) BRAITHWAITE, M . A , and GURNEY, T . R., "Fatigue Tests on Cross Girder Connections." Brit. Welding J , Vol. 14 (Feb. 1967). BROTHER, A. J., and YUKAWA, S. H . , "Fatigue Crack Propagation in Low Alloy Heat-Treated Steels." / Basic Eng., Trans ASME, Series D, Vol. 89 (1967).

50
7. CuDNEY, G. R., "Stress Histories of Highway Bridges." J. Struct. Div . ASCE, Vol 94, ST12 (Dec. 1968).
8. D A VIES, O. L., Design and Analysis of Industrial Experiments Oliver and Boyd, London (1954).
9. DuBuc, J., MONTI , T A , and WELTER, G. , "Fatigue Life of Steel I-Beams at Normal and Subzero Temperatures." / . Eng. Inst, of Canada, Vol. 48, Montreal (1955).
10. FAYVAR, K , and VASARHELYI, D . D . , Fatigue Behavior of Structural Steels and Their Weldments. Dept. of Civil Eng , Univ. of Wash. (Jan 1965).
11. AMERICAN SOCIETY OF C I V I L ENGINEERS, Subcommittee on Cover Plates, "Commentary on Welded Cover-Plated Beams." / . Struct. Div., ASCE, Vol. 93, No ST4, Proc Paper 5383, pp. 95-122 (Aug. 1967)
12. FISHER, J. W., and VIEST, I . M , "Fatigue Life of Bridge Beams Subjected to Controlled Truck Traffic." Prelim. Publ., 7th Cong., lABSE, pp 497-510 (1964)
13. FISHER, W E., and STALLMEYER, J. E., "The Fatigue Strength of Flexural Members." SRS No. 147, Dept of Civil Eng., Univ. of III (1958).
14. FOUNTAIN, R. S , MUNSE, W H . , and SUNBURY, R . D . , "Specifications and Design Relations " J Struct. Div., ASCE, Vol. 94, No. ST2 (Dec. 1968)
15 GASSNER, E., "Effect of Variable Load and Cumulative Damage on Fatigue m Vehicle and Aircraft Structures." Proc. Internat Conf. on Fatigue of Metals, Inst, of Mech Eng , London (1956).
16. GRAF, O , "Versuche uber das Verhalten von Genie-teten und Geschweissten Stossen in Tragern 130 aus ST37 bei Oftmals Wiederholter Belastung." Der Stahl-bau (supplement to Die Bautechnik), Beriin-Wilmers-dorf, Ger., pp. 9-16 (Jan. 15, 1937).
17. GRAF, O., "Tests of Welded Bridge Girders " Welding y , Vol. 20, pp. 138s-148s (1941).
18. GURNEY, T . R., "Influence of Residual Stresses on Fatigue Strength of Plates with Fillet Welded Attachments." Brit. Welding J., \ol 7 (Jan 1961).
19. GURNEY, T . R., "Investigation into the Fatigue Strength of Welded Beams, Part I I . High Tensile Steel Beams Without Stiffeners." Brit. Welding J., Vol 7 (1962)
20. GURNEY, T . R. , "Influence of Artificially Induced Residual Stresses on Fatigue Strength of Load-Carrying Fillet Welded Joints in Mild Steel." Brit. Welding J., Vol.9 (Mar. 1962)
21 GURNEY, T . R . , "Some Fatigue Tests on Fillet Welded Mild and High Tensile Steel Specimens in the As-Welded and Normalized Conditions." Brit Welding y , Vol. 13 (Nov 1966).
22. GURNEY, T . R., Fatigue of Welded Structures Cambridge Univ Press (1968).
23. GURNEY, T . R., "Effect of Peening and Grinding on the Fatigue Strength of Fillet Welded Joints." Brit Welding J., Vol 15, No. 12, pp. 601-609 (Dec. 1968)
24. GURNEY, T . R., "The Effect of Mean Stress and Material Yield Stress on Fatigue Crack Propagation in Steels." Metal Const, and Brit. Welding / . , Vol. 1. No. 2 (Feb. 1969).
25. HARRIS, L . A., NORDMARK. G . E., and NEWMARK,
N . M. , "Fatigue Strength of Butt Welds in Structural Steels." Welding J , Vol. 34, pp. 83-5 to 96-5 (Feb 1955)
26. HARRISON, J. D., "Exploratory Fatigue Tests on Local Heating as a Repair Technique." Brit Welding J., Vol. 12 (May 1955).
27 H A L L , L R., and STALLMEYER, J. E., The Fatigue Strength of Flexural Members. Prelim Report, Dept of Civil Eng., Univ of III . (1959).
28. IRWIN, G . R. , "Analysis of Stresses and Strains Near the End of a Crack Traversing a Plate." J. of Applied Mechanics, Vol. 24, Trans. ASME Series E, Vol. 79 (1957)
29. IRWIN, G . R , LIEBOWITZ, H . , and PARIS, P. C , "A Mystery of Fracture Mechanics" Eng. Fracture Mechanics, Vol. 1, No. 1 (June 1968).
30 JOHNSON, H H . , and PARIS, P C , "Subcritical Flaw Growth." Eng Fracture Mechanics, Vol. 1, No. 1 (June 1968).
31. KouBA, N . G., and STALLMEYER, J. E , "The Behavior of Stiffened Beams Under Repeated Loads." SRS No. 173, Dept. of Civil Eng , Univ. of III . (1959).
32. LEA, F . C , and W H I T M A N , J. G , "The Failure of Girders Under Repeated Stresses." Welding J., Vol. 18, p 28s(Jan 1939).
33 LENZEN, K . H . , Y E N , B T , NORDMARK, G . E., YAO, J. P., and MuNSE, W. H. , "Analysis and Interpretation of Fatigue Data " J. Struct. Div., ASCE, Vol. 94, No ST12 (Dec. 1968).
34 MADAYAG, A F., Metal Fatigue. Theory and Design, Wiley (1969).
35 MILLER, G . A , "The Dependence of Fatigue-Crack Growth Rate on the Stress Intensity Factor and Mechanical Properties of Some High Strength Materials " Trans ASTM, Vol. 61 (1968).
36 MINER, M . A , "Cumulative Damage in Fatigue." / . Applied Mechanics, \o\. 12, No 1 (Sept 1945).
37. MUELLER, J. A., and Y E N , B . T . , "Girder Web Boundary Stresses and Fatigue." Bull. No. 127, Welding Research Council (Jan. 1968).
38. MuNSE, W. H. , and WILSON, W . M . , "Fatigue Strength of Various Details Used for the Repair of Bridge Members." Bull. No. 382, Univ. of III . (Dec. 1949).
39. MUNSE, W . H . , and STALLMEYER, J. E., "Fatigue in Welded Beams and Girders " HRB Bull. 315 (1962) pp. 45-62.
40. MUNSE, W . H , and GROVER, L M . , Fatigue of Welded Steel Structures. Welding Research Council, New York (1964).
41. NATRELLA, M . G. , "Experimental Statistics." National Bureau of Standards Handbook 91 (Aug. 1963).
42. NEE, J. D., "Fatigue Strength of USS T-1, Constructional Alloy Steel Beams With and Without Stiffeners." Project No. 57.019-903(9), U.S. Steel Corp. (Feb. 9, 1966).
43. N E W M A N , R . P., "Fatigue Strength of Butt Welds in Mild Steel" Brit. Welding J., Vol. 7, No. 3 (Mar. 1960).
44 N E W M A N , R . P., and GURNEY, T . R. , "Fatigue Tests of Plain Plate Specimens and Transverse Butt Welds in
51
Mild Steel." Brit Welding J., Vol. 6, No. 12 (Dec 1959). PARIS, P. C , and ERDOGAN, F. , "A Critical Analysis 55 of Crack Propagation Laws " / . Basic Eng., Trans ASME, Series D , Vol. 85, pp. 528-534 (1963). PARIS, P. C , "The Fracture Mechanics Approach to 56. Fatigue." Proc. 10th Sagamore Conf, Syracuse Univ. Press, p. 107 (1965). PARIS, P. C , and SiH, G . C , "Stress Analysis of 57. Cracks." ASTM STP No 381 (1965). REEMSNYDER, H . S., "Fatigue Strength of Longitu- 58. dmal Fillet Weldments in Constructional Alloy Steel " Welding]., Vol. 44 (Oct. 1965). REEMSNYDER, H . S., and FISHER, J. W , "Service 59. Histories and Laboratory Testing." / . Struct. Div, ASCE, Vol. 94, ST12 (Dec. 1968). REEMSNYDER, H . S., "Procurement and Analysis of 60. Structural Fatigue Data." / . Struct. Div., ASCE, Vol. 95, No. ST7 (July 1969). SHERMAN, D R , H A L L , L . R. , and STALLMEYER, J. E., Flexural Fatigue Test of Welded A441 Steel Beams. 61 Dept of Civil Eng., Univ. of I f l . (1962)
52. SHERMAN, D . R. , and STALLMEYER, J. E , Fatigue Life of T-1 Beams. Dept. of Civil Eng., Univ. of III . 62. (1963). SHERMAN, D . R , and STALLMEYER, J. E , "Cover Plate End Welding and Fatigue." Document No. XlII-340- 63. 64, Internat Inst, of Welding (1964). SiGNES, E. G. , BAKER, R . G. , HARRISON, J. D., and BuRDEKiN, F. M. , "Factors Affecting the" Fatigue
45
46.
47
48
49
50
51
53
54
Strength of Welded High Strength Steels." Brit. Welding J.. Vol. 14 (Mar. 1967). STALLMEYER, J. E., and WALKER, W . H . , "Cumulative Damage Theories and Applications." J. Struct. Div., ASCE, Vol. 94, ST12 (Dec. 1968). SwANSON, S. R. , "Random Load Fatigue Testing: A State of the Art Survey." Materials Research and Standards, Vol. 8, No 4 (Apr. 1968). TOPRAC, A . A , "Fatigue Strength of Hybrid Plate Girders." Welding J., Vol. 43, No. 5 (May 1969). W E I , R. P., TALDA, P. M . , and L i , C . V., "Fatigue-Crack Propagation in Some Ultrahigh-Strength Steels." ASTM STP 415, p. 460 (1967). WELTER, G. , and CHOQUET, J A., "Variable Stress Cycle Fatigue of Large Butt-Welded Specimens." Welding J., Vol. 46, pp. 39-5 to 48-5 (Jan. 1967). WILSON, W . M . , BRUCKNER, W . H . , COOMBE, J. V., and WILDE, R . A., "Fatigue Tests of Welded Joints in Structural Steel Plates." Bull. No. 327, Univ. of III . (Feb. 1941). WILSON, W . M . , "Fatigue—A Factor in Structural Design." / . Western Soc of Eng, Vol. 49, 2, Part 1, pp. 51-60 (1944). WILSON, W . M , "Flexural Fatigue Strength of Steel Beams." Bull. No. 377, Univ. of I I I . Eng. Experiment Station (1943). W Y L Y , L . T . and SCOTT, M . B , "An Investigation of Fatigue Failures in Structural Members of Ore Bridges Under Service Loadings." Proc. AREA, Vol. 57, pp. 175-206 (1956).
APPENDIX A
HISTORY AND SUMMARY OF PREVIOUS WORK
The investigations of Lea and Whitman (52), Graf {16, 17), and Wilson (62) in the 1930's provided an indication of the importance of various welded details on the fatigue strength of steel beams. Large reductions in fatigue strength were observed for beams with partial length cover plates, stiffeners, and other welded details.
After 1930 and during the intervenmg 30 years up to the AASHO Road Test, tests were undertaken on plain rolled beams; rolled beams with splices, stiffeners, and partial-length cover plates; plain welded beams; welded beams with splices, stiffeners, and partial-length cover plates; and thm web girders. Most of these tests were conducted on mild steel beams (about 300 tests). About 100 tests of a variety of details were conducted with higher-strength steels
Munse and Grover {40) have summarized the fatigue behavior of beams and other types of specimens "Average" fatigue strengths are reported for selected cycle lives.
With the exception of the AASHO Road Test bridges, all of the beam tests were conducted under constant cyclic load conditions. The test bridges at the AASHO Road Test {12) were subjected to stress fluctuating between various minimum and maximum levels so that neither the minimum stress nor the maximum stress remained constant through the duration of the test. The results of the bridge tests were found to be in a reasonable agreement with laboratory data for the same welded cover-plate details when subjected to constant cyclic loading
52
COVER-PLATED BEAMS
A detailed evaluation of the previous work on welded cover-plated beams was recently completed ( / / ) . Both static and fatigue behavior were reviewed and summarized. Because one of the principal objectives of this research program is concerned with the behavior of cover-plated beams, the ASCE "Commentary" ( / / ) is of particular interest, and the major findings on fatigue behavior of that study are summarized hereinafter
Observations on cover-plated members showed that the mode of failure is crack initiation in the base metal at the toe of the cover-plate weld and propagation across and down into the flange of the mam member The fatigue strength of the weldments has always been sufficiently greater than that of the area adjacent to the weld when proportioned according to current (1969) practice.
Variations in the end details of partial-length cover plates had only minor effects on the fatigue strength. Normally the variation for the same type of detail is far greater than the variation between details. Also, cover plates with and without end welds yielded about the same fatigue strength, especially in the higher cycle range.
The effect of size of transverse end weld has not been established, particularly in the longer-life regions. At shorter life a slight trend of decreasing fatigue life with increasing end weld size was noted. However, there was insufficient replication to provide an adequate assessment of the experimental error.
The shape of the transverse end welds of partial-length cover plates was observed to affect fatigue life. The smoother the transition, the higher the detail's fatigue strength However, the benefit is not very great unless considerable care is taken to provide a smooth weld transition by grinding and polishing the weld and its intersection with the base metal (23). It was concluded by the ASCE (11) that, from an economic and control standpoint, end-weld shape cannot be sufficiently improved to warrant changing it from the as-welded condition
Past studies have indicated that there is little difference in the fatigue strength of cover-plated beams made of high-strength steels and beams made of lower-strength steels
Previous studies have also indicated that the fatigue strength of beams wtih partial-length cover plates was primarily dependent on the stress range alone. The level of minimum or mean stress was observed to have a negligible effect Because most of the tests were for zero-to-tension loading, and no partial reversal data were available, this finding was not conclusive.
Recommendations for design and further studies were given in the ASCE "Commentary" (11). Those relevant to this study follow
1. Square-ended cover plates provide adequate fatigue strength and should be used. Other geometric modifications of plate terminus do not provide sufficient increases in fatigue strength to justify their added cost
2 Cover plates may be either narrower or wider than the beam flange to which they are attached, and can be made with or without end welds. End welds may be made continuous around comers for cover plates wider or narrower than the flange.
3. Cover plates can be used on either rolled or welded beams
4. Indications are that the fatigue design of cover-plated beams can be based on the stress range alone. For the base metal adjacent to the weldment, it is suggested that the allowable range of stress be 9 ksi for 2,000,000 cycles, 12 ksi for 500,000 cycles and 18 ksi for 100,000 cycles. These values should not be exceeded at the cover-plate termini If they are exceeded, the cover plates should be extended until the stress range is satisfactory.
5 Studies are needed on multicover-plated beams. Particular attention should be given to their fatigue strength.
6. Studies are needed on cover-plate geometry insofar as thickness and width are concerned. Additional data are needed to establish the limit of cover-plate thickness relative to the beam flange thickness Data are also needed on cover-plate width, to establish limiting widths.
7 Studies are needed on the termination of cover plates wider than beam flanges.
8 New studies are needed on mild and high strength steel cover-plated beams to ascertain the effect of minimum stress and material strength on the fatigue strength under controlled conditions.
ROLLED BEAMS
Except for the brief summary provided by Munse and Grover (40), detailed evaluations of other work on steel beams are not available. Only about 10 rolled-beam test results are published; a few unpublished results also are available. Lea and Whitman (32) reported the results of four tests of 5-in. X 3-in. X 11-lb RSJ; Wilson (62) reported on three tests on 12131.8 beams; and Dubuc et al. (9) reported on four tests on 10WF21 beams. The results of these studies were compared with the results of cover-plated beams in the ASCE "Commentary" (11). Sherman and Stallmeyer (52) tested two 12135 beams of A S H steel. A number of tests were undertaken by U S. Steel on A S H steel rolled beams ( T l ) (43) Al l other beams were structural carbon steel.
Dubuc et al. (9) tested all beams at a constant stress amplitude in reverse bending of ± 26 ksi Al l other tests were performed mainly on a zero-to-tension stress cycle in the extreme fibers of the tension flange.
Considerable scatter is apparent in the data. Also, the A S H high-strength steel beams tend to indicate an increase in fatigue life over the structural carbon steel beams.
PLAIN WELDED BEAMS
Less than 70 plain welded beams were tested in earlier studies. Most of the beams were about 10 in. deep. The yield strength of the plate elements varied from 33.4 to 130 ksi
Major test variables considered by previous investigators were geometry of beam, edge preparation of the plate, and type of weld manual or automatic submerged arc. Al l beams were tested on a zero-to-tension stress cycle in the bottom flange fibers
Tests on beams fabricataed with manual welds date back to Lea and Whitman (32) and Wilson (62) in the 1930's. These were followed by a series of tests undertaken at the University of Illinois in the 19S0's (13, 31, 51, 52) Gurney
53
(19) examined automatically welded beams at about the same time.
Substantial variation in the test data is apparent. The manually welded beams reported by Wilson fall at lower fatigue lives However, these beams also had stiffeners welded to the web, and the welding performed at that time was not as good as present-day manual welding. More frequent start-stop positions were present which provided greater possibility of initial flaws.
The automatically welded beams tested by Gurney were fabricated with extreme care. Without exception the results tended to show greater fatigue strengths than were provided by the manual welding process. The automatically welded beams were fabricated from high-tensile-strength steel Hence, the results were influenced by more than one variable and it is difficult to evaluate the significance of the test variables Also, as was the case for all beam tests, little or no replication was provided and it was not possible to determine the error variation.
Studies were made by Reemsnyder (48) on A514 T-specimens that were intended to simulatae the longitudinal fillet weldments of welded beams. These results also indicated slightly higher fatigue strength than the manually welded beams.
A number of recent tests have dealt with the behavior of thin web girders (37, 57). It was noted that when the girders were subjected to repeated loading, a pumping of the web resulted, which produced cracking in the web at the boundary of the stiffeners or flanges. This plate bending failure at the toe of the- stiffener or flange-to-web welds differs from the mode observed when the crack propagates through the flange.
No clear evaluation of the significance of stress, type of steel, or method of fabrication is possible from past studies. Only general trends were observed and these often were obscured by other design factors.
BEAMS WITH SPLICES
About 100 butt-welded beams have been tested at Illinois (13, 51) since Lea and Whitman (32) reported on six tests in the 1930's. Slight variations in the detail were examined that included placing the web and flange welds in a single plane or staggering them. In addition, the presence or absence of cope holes was studied. Although most of the tests were conducted on a zero-to-tension stress cycle, a few beams were tested in reversal and a partial tension-to-tension stress cycle.
Nearly all flange splices connected plates of equal width and thickness. However, a few tests were undertaken on splices having a straight tapered transition in width or thickness (39, 40).
Pilot tests were also made on high-strength steels. In general, the splice was placed in a welded built-up beam, although a few tests were carried out on rolled beams with the splice in place.
Most beam tests had the reinforcement left in place. Only flat plate specimens have had the reinforcement removed. Munse (40) has indicated that the reinforcement was removed from a few beam splices.
The beam test results did not yield significant diverences in fatigue strength, regardless of the variation in the detail Neither was the type of steel determined to be a very critical parameter
Cope holes were noted to'have some effect, but the number of specimens tested is too few to attach significance to the difference
Tests of flat plate specimens with the reinforcement in place have yielded comparable results (40). I t has also been'observed that when, butt welds in flat plates have been ground smooth and flush, the fatigue strength has increased to the strength of plain plate. Munse (40) has noted that some data were available for the transition in thickness. However, no mformation was available for the width transition when the reinforcement was removed
APPENDIX B
EXPERIMENT DESIGN
The review of earlier fatigue studies had indicated that litde if any effort was made to integrate and coordinate the experimental efforts into experiment designs that would enable an evaluation of the various design factors. In addition, no attempt was made to determine the experimental error variation.
The objective of the series of beam tests reported in this experiment was to determine the significance of several groups of controlled variables on the specimen's fatigue life for each series.
The controlled variables selected for this study can be placed into the following general categories:
1. Type of beam. 2 Type of steel. 3 Type of detail. 4. Nominal stress in outer beam fibers at detail or point
of maximum moment.
The basic experimental unit for all beam series but the flange splice beams was a 14WF30 and its welded equiva-
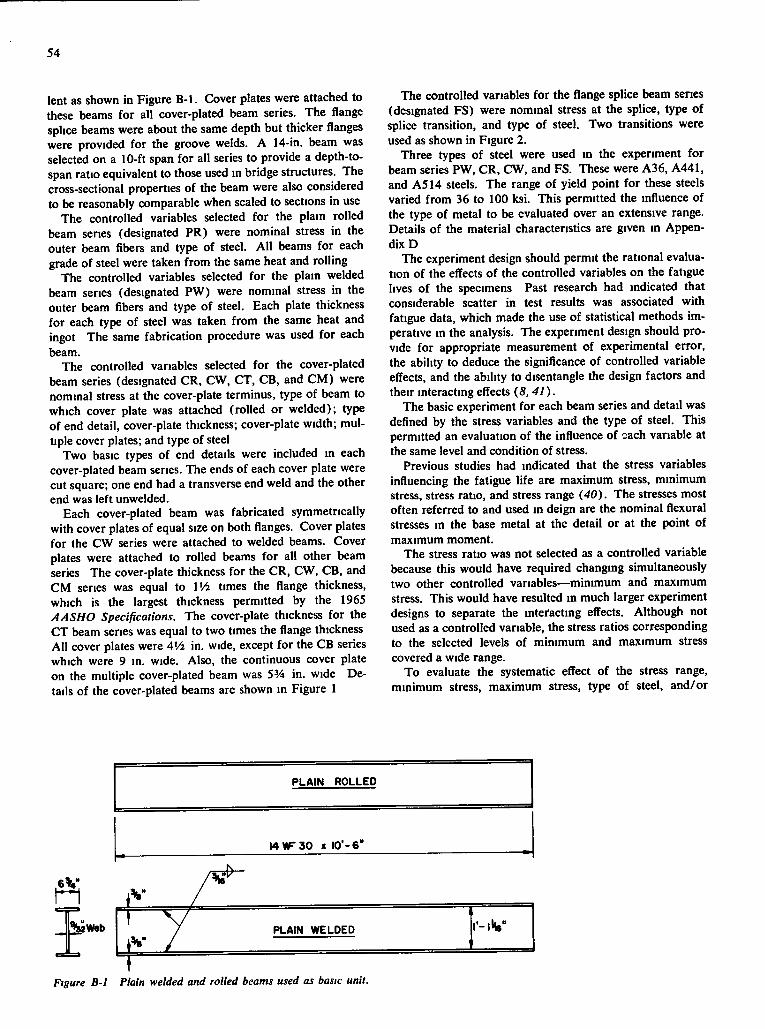
54
lent as shown in Figure B-1. Cover plates were attached to these beams for all cover-plated beam series. The flange splice beams were about the same depth but thicker flanges were provided for the groove welds. A 14-in. beam was selected on a 10-ft span for all series to provide a depth-to-span ratio equivalent to those used in bridge structures. The cross-sectional properties of the beam were also considered to be reasonably comparable when scaled to sections in use
The controlled variables selected for the plain rolled beam series (designated PR) were nominal stress in the outer beam fibers and type of steel. Al l beams for each grade of steel were taken from the same heat and rolling
The controlled variables selected for the plain welded beam series (designated PW) were nominal stress in the outer beam fibers and type of steel. Each plate thickness for each type of steel was taken from the same heat and ingot The same fabrication procedure was used for each beam.
The controlled variables selected for the cover-plated beam series (designated CR, CW, CT, CB, and CM) were nominal stress at the cover-plate terminus, type of beam to which cover plate was attached (rolled or welded); type of end detail, cover-plate thickness; cover-plate width; multiple cover plates; and type of steel
Two basic types of end details were included in each cover-plated beam series. The ends of each cover plate were cut square; one end had a transverse end weld and the other end was left unwelded.
Each cover-plated beam was fabricated symmetrically with cover plates of equal size on both flanges. Cover plates for the CW series were attached to welded beams. Cover plates were attached to rolled beams for all other beam series The cover-plate thickness for the CR, CW, CB, and CM series was equal to IVi times the flange thickness, which is the largest thickness permitted by the 1965 AASHO Specifications. The cover-plate thickness for the CT beam series was equal to two times the flange thickness Al l cover plates were AVi in. wide, except for the CB series which were 9 in. wide. Also, the continuous cover plate on the multiple cover-plated beam was 5% in. wide Details of the cover-plated beams are shown in Figure 1
The controlled variables for the flange splice beam series (designated FS) were nominal stress at the splice, type of splice transition, and type of steel. Two transitions were used as shown in Figure 2.
Three types of steel were used in the experiment for beam series PW, CR, CW, and FS. These were A36, A441, and A514 steels. The range of yield point for these steels varied from 36 to 100 ksi. This permitted the influence of the type of metal to be evaluated over an extensive range. Details of the material characteristics are given in Appendix D
The experiment design should permit the rational evaluation of the effects of the controlled variables on the fatigue lives of the specimens Past research had indicated that considerable scatter in test results was associated with fatigue data, which made the use of statistical methods imperative in the analysis. The experiment design should provide for appropriate measurement of experimental error, the ability to deduce the significance of controlled variable effects, and the ability to disentangle the design factors and their interacting effects (8,41).
The basic experiment for each beam series and detail was defined by the stress variables and the type of steel. This permitted an evaluation of the influence of each variable at the same level and condition of stress.
Previous studies had indicated that the stress variables influencing the fatigue life are maximum stress, minimum stress, stress ratio, and stress range (40). The stresses most often referred to and used in deign are the nominal flexural stresses in the base metal at the detail or at the point of maximum moment.
The stress ratio was not selected as a controlled variable because this would have required changing simultaneously two other controlled variables—minimum and maximum stress. This would have resulted in much larger experiment designs to separate the interacting effects. Although not used as a controlled variable, the stress ratios corresponding to the selected levels of minimum and maximum stress covered a wide range.
To evaluate the systematic effect of the stress range, minimum stress, maximum stress, type of steel, and/or
PLAIN ROLLED
l4Vir30 X 10'-6"
PLAIN WELDED r- iHs" i V /
T Figure B-1 Plain welded and rolled beams used as basic unit.
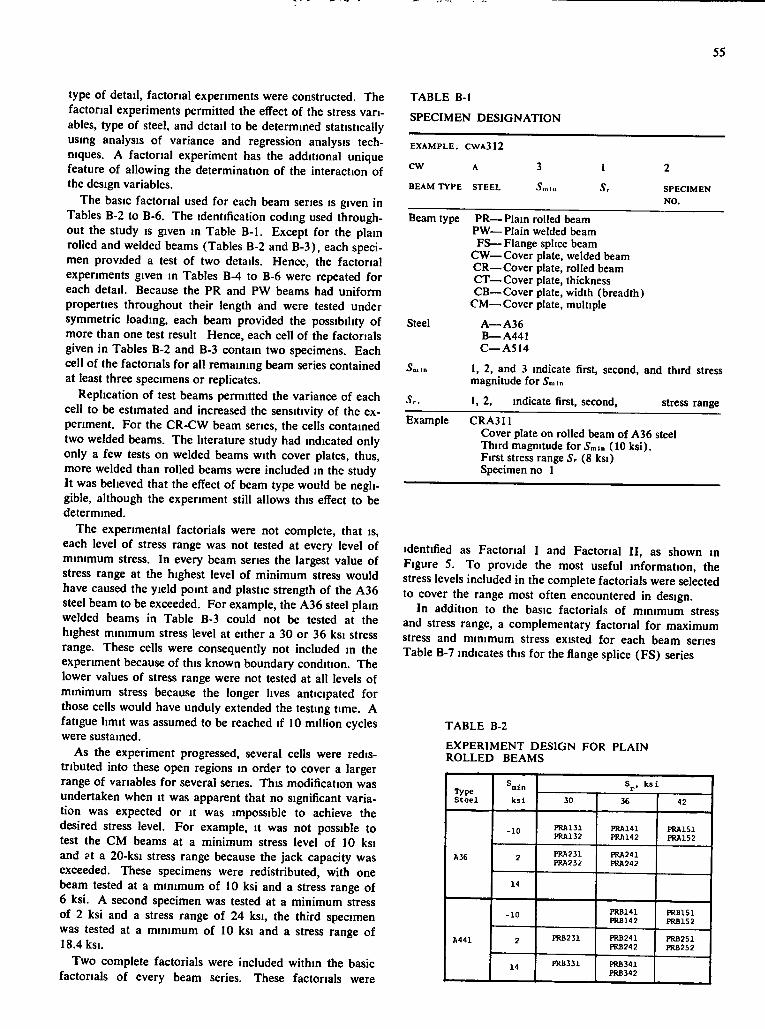
55
type of detail, factorial experiments were constructed. The factorial experiments permitted the effect of the stress variables, type of steel, and detail to be determined statistically using analysis of variance and regression analysis techniques. A factorial experiment has the additional unique feature of allowing the determination of the interaction of the design variables.
The basic factorial used for each beam series is given in Tables B-2 to B-6. The identification coding used throughout the study is given in Table B-1. Except for the plain rolled and welded beams (Tables B-2 and B-3), each specimen provided a test of two details. Hence, the factorial experiments given in Tables B-4 to B-6 were repeated for each detail. Because the PR and PW beams had uniform properties throughout their length and were tested under symmetric loading, each beam provided the possibility of more than one test result Hence, each cell of the factorials given in Tables B-2 and B-3 contain two specimens. Each cell of the factorials for all remaining beam series contained at least three specimens or replicates.
Replication of test beams permitted the variance of each cell to be estimated and increased the sensitivity of the experiment. For the CR-CW beam series, the cells contained two welded beams. The literature study had indicated only only a few tests on welded beams with cover plates, thus, more welded than rolled beams were included m the study It was believed that the effect of beam type would be negligible, although the experiment still allows this effect to be determined.
The experimental factorials were not complete, that is, each level of stress range was not tested at every level of minimum stress. In every beam series the largest value of stress range at the highest level of minimum stress would have caused the yield point and plastic strength of the A36 steel beam to be exceeded. For example, the A36 steel plain welded beams in Table B-3 could not be tested at the highest minimum stress level at either a 30 or 36 ksi stress range. These cells were consequently not included in the experiment because of this known boundary condition. The lower values of stress range were not tested at all levels of minimum stress because the longer lives anticipated for those cells would have unduly extended the testing time. A fatigue limit was assumed to be reached if 10 million cycles were sustained.
As the experiment progressed, several cells were redistributed into these open regions in order to cover a larger range of variables for several series. This modification was undertaken when it was apparent that no significant variation was expected or it was impossible to achieve the desired stress level. For example, it was not possible to test the CM beams at a minimum stress level of 10 ksi and at a 20-ksi stress range because the jack capacity was exceeded. These specimens were redistributed, with one beam tested at a minimum of 10 ksi and a stress range of 6 ksi. A second specimen was tested at a minimum stress of 2 ksi and a stress range of 24 ksi, the third specimen was tested at a minimum of 10 ksi and a stress range of 18.4 ksi.
Two complete factorials were included within the basic factorials of every beam series. These factorials were
TABLE B-1
SPECIMEN DESIGNATION
E X A M P L E . C W A 3 1 2
BEAM T Y P E S T E E L
3 5nilii S P E C I M E N
NO.
Beam type PR—Plain rolled beam PW—Plain welded beam FS—Flange splice beam
CW—Cover plate, welded beam CR—Cover plate, rolled beam CT—Cover plate, thickness CB—Cover plate, width (breadth)
CM—Cover plate, multiple
Steel A—A36 B—A441 C—ASH
1, 2, and 3 indicate first, second, and third stress magnitude for J„,i„
Sr. 1, 2, indicate first, second, stress range Example CRA311
Cover plate on rolled beam of A36 steel Third magnitude for 5„i„ (10 ksi). First Stress range Sr (8 ksi) Specimen no 1
identified as Factorial I and Factorial I I , as shown in Figure 5. To provide the most useful information, the stress levels included in the complete factorials were selected to cover the range most often encountered in design.
In addition to the basic factorials of minimum stress and stress range, a complementary factorial for maximum stress and minimum stress existed for each beam series Table B-7 indicates this for the flange splice (FS) series
TABLE B-2
EXPERIMENT DESIGN FOR PLAIN ROLLED BEAMS
Type S tee l
S . min Type S tee l k s i 30 36 42
-10 PRA131 mi32
PRA141 PIU1142
PRA151 PM152
A3E 2 PRfl231 PRA232
PRA241 PRA242
14
-10 PRB141 PRB142
PRB151 PRB152
A441 2 PRB231 PRB241 FRB242
PRfl251 PRB252
14 PRB331 PRB341 PRB342
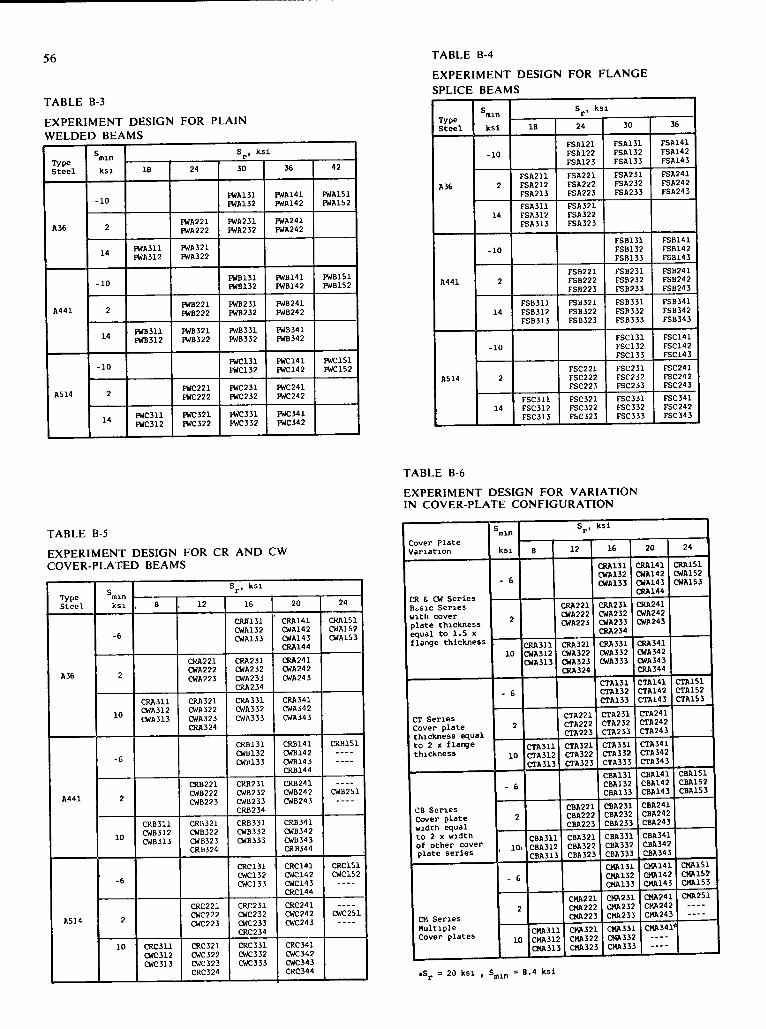
56
T A B L E B-3
E X P E R I M E N T D E S I G N F O R P L A I N W E L D E D B E A M S
T A B L E B-4
E X P E R I M E N T D E S I G N F O R F L A N G E
S P L I C E B E A M S
Type S tee l
^min k s i
S^, k s i Type S tee l
^min k s i le 24 30 36 42
A 36
-10 PWA131 PWA132
IWA141 fWA142
FWAISI FWA1S2
A 36 2 PWA221 PWA222
EWA231 PWA232
FWA241 PWA242 A 36
14 FWA311 FWA312
PWA321 PWA322
A441
-10 FWB131 FWB132
FWB141 PWB142
PWB151 PWB152
A441 2 PWB221 PWB222
PWB231 PWB232
PWB241 FWB242 A441
14 FWB311 IV/B312
PWB321 PWB322
PWB331 mB332
PWB341 PWB342
A514
-10 PWC131 PWC132
PWC141 PWC142
PWCISI PWC152
A514 2 PWC221 fWC222
FWC231 PWC232
PWC241 PWC242 A514
14 FWC311 FWC312
IWC321 PWC322
FWC331 PWC332
PWC341 PWC342
Type Stee l
^min S , k s i r
Type Stee l k s i IB 24 30 36
-10 FSR121 FSA122 FSA123
FSA131 FSA132 FSA133
FSA141 FSA142 FSA143
A 36 2 FSA211 FSA212 FSA213
FSA221 FSA222 FSA223
FSA231 FSA232 FSA233
FSA241 FSA242 FSA243
14 FSA311 FSA312 FSA313
FSA321 FSA322 FSA323
-10 FSB131 FSB132 FSB133
FSB141 FSB142 FSB143
A441 2 FSB221 FSB222 FSB223
rSB231 FSB232 FSB233
FSB241 FSB242 FSB24 3
14 FSB311 FSB312 FSB313
FSB321 FSB322 FSB323
FSB331 FSB332 FSB333
FSB341 FSB342 FSB343
-10 FSC131 FSC132 FSC133
FSC141 FSC142 FSC14 3
A514 2 FSC221 FSC222 FSC223
FSC231 FSC2J2 FSC233
FSC241 FSC242 FSC243
14 FSC311 FSC312 FSC313
FSC321 FSC322 FSC323
rSC331 FSC332 FSC333
FSC341 FSC242 FSC343
T A B L E B-5
E X P E R I M E N T D E S I G N F O R C R A N D C W C O V E R - P L A T E D B E A M S
Type Stee l
^min S , k s i
Type Stee l k s i 8 12 16 20 24
-6
CRfil31 CWA132 CWA133
CRA141 CWA142 CWA143 CRA144
C K A l i l CWA1S2 CWA153
A 36 2
CRA221 CWA222 CWA223
CRA231 CWA232 CWA233 CRA234
CRA241 CWA242 CWA24 3
10
CRA311 CWA312 CWA313
CRA321 CWA322 CWA323 CRA324
CRA331 CWA332 CWA333
CRA341 CWA342 CWA34 3
-6
CRB131 CWB132 CWB133
CRB141 CWB142 CWB143 CRB144
CRB151
A441 2
I CRB221 ' CWB222
CWB223
CRB231 CWB232 CWB233 CRB234
CRB241 CWB242 CWB243
CWB251
10
CRB311 CWB312 CWB313
CRH321 CWB322 CWB323 CRB324
CRB331 CWB332 CWB333
CRB341 CWB342 CWB343 CRB3'14
-6
CRC131 CWC132 CWC133
CRC141 CWC142 CWC143 CRC144
CRC151 CWC152
A514 2
CRC221 CWC222 CWC223
CRC231 CWC232 CWC233 CRC234
CRC241 CWC242 CWC243
CWC251
10 CRC311 CWC312 CWC313
CRC321 CWC322 CWC323 CRC324
CRC331 CWC332 CWC333
CRC341 CWC342 CWC343 CRC344
T A B L E B-6
E X P E R I M E N T D E S I G N F O R V A R I A T I O N IN C O V E R - P L A T E C O N F I G U R A T I O N
Cover Plate Variat ion
^min S^, k s i
Cover Plate Variat ion k s i 8 12 16 20 24
- 6
CRA131 CWA132 CWA133
CRA141 CWA142 CMA143 CRA144
CRA151 ailA152 CWA153
CR & CW Ser ies B o S i c Ser ies with cover plate thickness equal to 1.5 x
2
CRA221 CWA222 CWA223
CRA231 CWA232 CWA233 CRS234
CRA241 CWA242 CWA243
flange thickness 10
CRA3U CWA312 CWA313
CRA321 CWA322 CWA323 CRA324
CRA331 CWA332 CWA333
CRA341 CWA342 CMA343 CRA344
CT Series Cover plate thickness equal to 2 X f lange thickness
- 6 CTA131 CTA132 CTA133
CTA141 CTA142 CTA143
CTA151 CTA152 CTA153
CT Series Cover plate thickness equal to 2 X f lange thickness
2 CTA221 CTA222 CTA223
CTA231 CTA232 CTA233
CTA241 CTA242 CTA243
CT Series Cover plate thickness equal to 2 X f lange thickness 10
CTA311 CTA312 CTA313
CTA321 CTA322 CTA323
CTA331 CTA332 CTA333
CTA341 CTA342 CTA343
CB Ser ies Cover plate width equal to 2 X width of other cover plate ser ies
- 6 CBA131 CBA132 CBA133
CBA141 CBA142 CBA14 3
CBA151 CBA152 CBA153
CB Ser ies Cover plate width equal to 2 X width of other cover plate ser ies
2 CBA221 CBA222 CBA223
CBA231 CBA232 CBA233
CBA241 CBA242 CBA243
CB Ser ies Cover plate width equal to 2 X width of other cover plate ser ies
, 10. CBA311 CBA312 CBA313
CBA321 CBA322 CBA323
CBA331 CBA332 CBA333
CBA341 CBA342 CBA343
CM Series Multiple Cover plates
- 6 CMA131 CMA132 CMA133
CMA141 CMA142 CMA143
CMA151 CMA1S2 CMA153
CM Series Multiple Cover plates
2 CMA221 CMA222 CMA223
CMA231 CMA232 CMA233
CMA241 CMA242 CMA243
CMA251
CM Series Multiple Cover plates 10
CMA31] CHA3i: CMA31
CMA321 CMA322
1 CMA322
CMA331 CMA332 CMA333
CMA341
. S ^ = 20 k s i , S_, 8.4 k s i
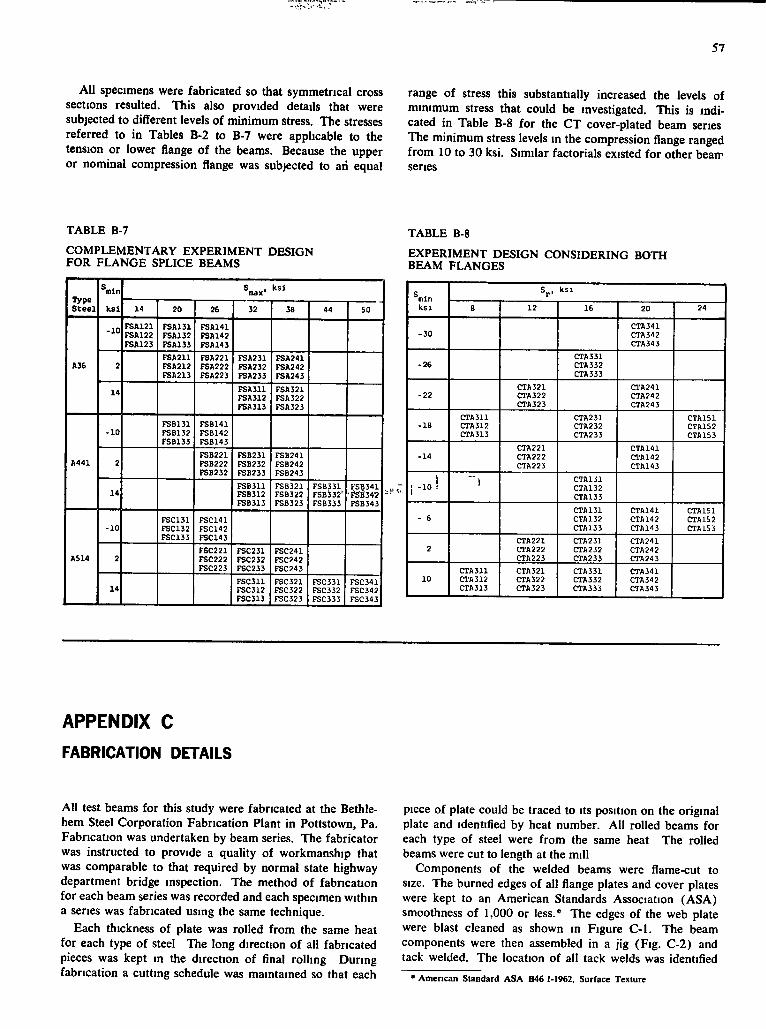
57
All specimens were fabricated so that symmetrical cross sections resulted. This also provided details that were subjected to different levels of minimum stress. The stresses referred to in Tables B-2 to B-7 were applicable to the tension or lower flange of the beams. Because the upper or nominal compression flange was subjected to an equal
range of stress this substantially increased the levels of minimum stress that could be investigated. This is indicated in Table B-8 for the C T cover-plated beam series The minimum stress levels in the compression flange ranged from 10 to 30 ksi. Similar factorials existed for other bean-series
T A B L E B-7
C O M P L E M E N T A R Y E X P E R I M E N T DESIGN FOR F L A N G E S P L I C E BEAMS
T A B L E B-8
E X P E R I M E N T DESIGN CONSIDERING BOTH BEAM F L A N G E S
Type S t e e l
®inin S , max' k s i Type S t e e l k s i 14 20 26 32 38 44 SO
-10 FSA121 FSA122 FSA123
FSA131 FSA132 FSA133
FSA141 FSA142 FSA143
A36 2 PSA211 FSA212 FSA213
FSA221 FSA222 FSA223
FSA231 FSA232 FSA233
FSA241 FSA242 FSA243
14 FSA311 FSA312 FSA313
FSA321 FSA322 FSA323
-10 FSB131 FSB132 FSB133
FSB141 FSB142 FSB 14 3
A441 2 FSB221 FSB222 FSB232
FSB231 FSB232 FSB233
FSB241 FSB242 FSB243
14 FSB311 FSB312 FSB313
FSB321 FSB322 FSB323
FSB331 FSBi32' FSB333
KSB341 -1*61342 FSB343
-10 FSC131 FSC132 FSC133
FSC141 FSC142 FSC143
AS14 2 FSC221 FSC222 FSC223
FSC231 FSC232 FSC233
FSC241 FSC242 FSC243
14 FSC311 FSC312 FSC313
rSC321 FSC322 FSC323
FSC331 FSC332 FSC3331
FSC341 FSC342 FSC343
k s i
S . , k s i r
k s i e 12 16 20 24
-30 CTA341 CTA342 CTA343
-26 CTA331 CTA332 CTA333
-22 CTA321 CTA322 CTA323
CTA241 CTA242 CTA243
- I B CTA311 CTA312 CTA313
CTA231 CTA232 CTA233
CTA151 CTA152 CTA153
-14 CTA221 CTA222 CTA223
CTA141 OTA142 CTA143
,...! '•"1 CTA131 CTA132 CTA133
- 6 CTA131 CTA132 CTA133
CTA141 CTAl'12 CTA113
CTA151 CTA152 CTA153
2 CTA221 CTA222 CTA223
CTA231 CTA232 CTA233
CTA241 CTA242 CTA243
10 CTA311 CTA312 CTA313
CTA321 CTA322 CTA323
CTA331 CTA332 CTA333
CTA341 CTA3'12 CTA343
APPENDIX C FABRICATION DETAILS
All test beams for this study were fabricated at the Bethlehem Steel Corporation Fabrication Plant in Pottstown, Pa. Fabrication was undertaken by beam series. The fabricator was instructed to provide a quality of workmanship that was comparable to that required by normal state highway department bridge inspection. The method of fabrication for each beam series was recorded and each specimen within a series was fabricated using the same technique.
Each thickness of plate was rolled from the same heat for each type of steel The long direction of all fabricated pieces was kept in the direction of Anal rolling During fabrication a cutting schedule was maintained so that each
piece of plate could be traced to its position on the original plate and identified by heat number. All rolled beams for each type of steel were from the same heat The rolled beams were cut to length at the mill
Components of the welded beams were flame-cut to size. The burned edges of all flange plates and cover plates were kept to an American Standards Association ( A S A ) smoothness of 1,000 or less.* The edges of the web plate were blast cleaned as shown in Figure C-1. The beam components were then assembled in a jig (Fig. C-2) and tack welded. The location of all tack welds was identified
• American SUndard ASA B46 1-1962, Surface Texture
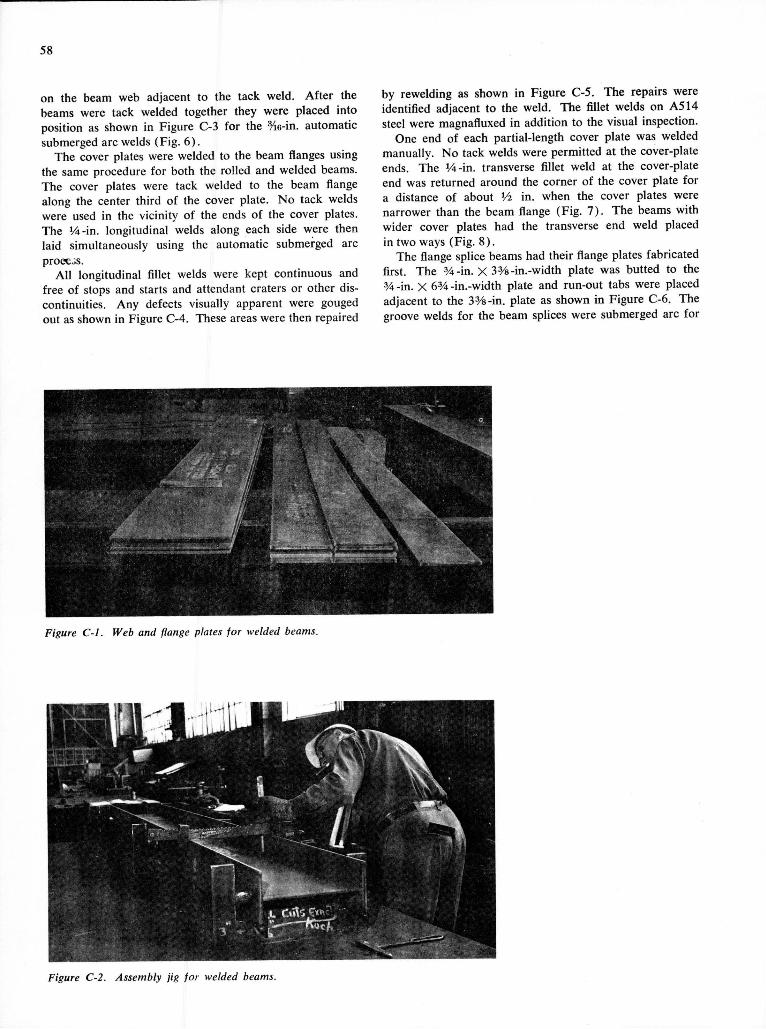
58
on the beam web adjacent to the tack weld. Af te r the beams were tack welded together they were placed into position as shown in Figure C-3 for the Yio-in. automatic submerged arc welds (Fig. 6 ) .
The cover plates were welded to the beam flanges using the same procedure for both the rolled and welded beams. The cover plates were tack welded to the beam flange along the center third of the cover plate. No tack welds were used in the vicinity of the ends of the cover plates. The V4-in. longitudinal welds along each side were then laid simultaneously using the automatic submerged arc process.
A l l longitudinal fillet welds were kept continuous and free of stops and starts and attendant craters or other discontinuities. Any defects visually apparent were gouged out as shown in Figure C-4. These areas were then repaired
by rewelding as shown in Figure C-5. The repairs were identified adjacent to the weld. The fillet welds on A S M steel were magnafluxed in addition to the visual inspection.
One end of each partial-length cover plate was welded manually. No tack welds were permitted at the cover-plate ends. The '4 - in . transverse fillet weld at the cover-plate end was returned around the corner of the cover plate for a distance of about V2 in . when the cover plates were narrower than the beam flange (Fig. 7 ) . The beams with wider cover plates had the transverse end weld placed in two ways (Fig. 8 ) .
The flange splice beams had their flange plates fabricated first. The % - i n . X 3%-in.-width plate was butted to the % - i n . X 6%-in.-width plate and run-out tabs were placed adjacent to the 3%-in . plate as shown in Figure C-6. The groove welds f o r the beam splices were submerged arc for
1
Figure C-I. Web and flange plates for welded beams.
Figure C-2. Assembly jig for welded beams.
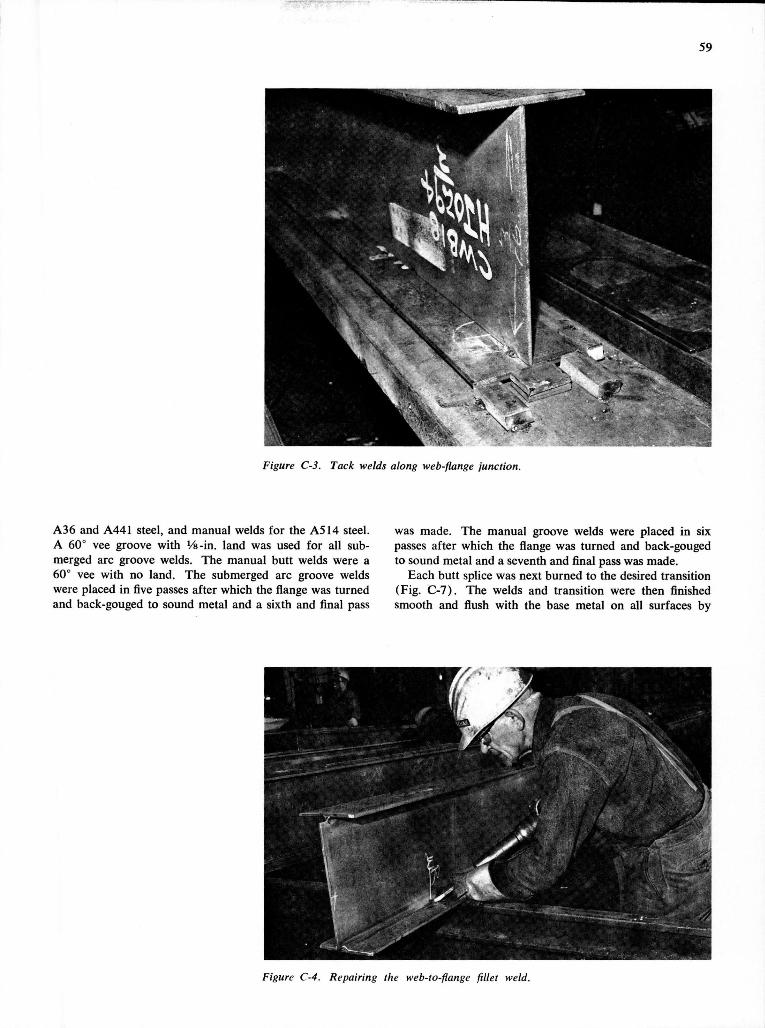
59
Figure C-3. Tack welds along web-flange junction.
A36 and A441 steel, and manual welds for the A S H steel. A 60° vee groove with Vs-'m. land was used for all submerged arc groove welds. The manual butt welds were a 60° vee with no land. The submerged arc groove welds were placed in five passes after which the flange was turned and back-gouged to sound metal and a sixth and final pass
was made. The manual groove welds were placed in six passes after which the flange was turned and back-gouged to sound metal and a seventh and final pass was made.
Each butt splice was next burned to the desired transition (Fig. C-7). The welds and transition were then finished smooth and flush with the base metal on all surfaces by
Figure C-4. Repairing the web-to-flange flllet weld.
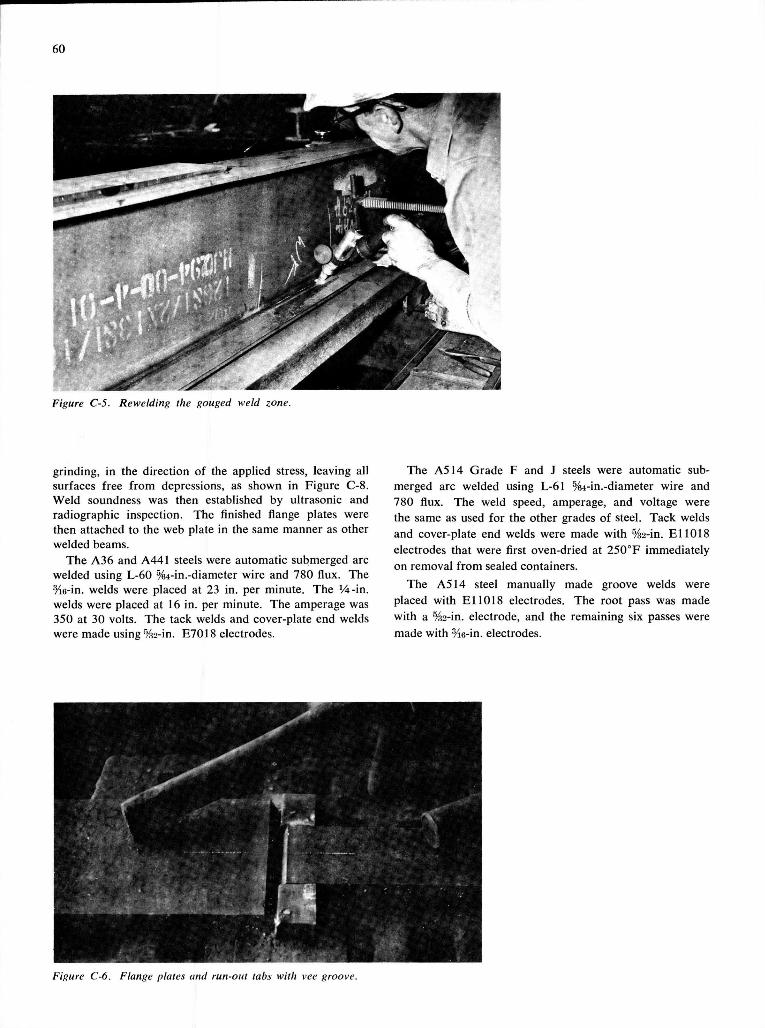
60
Figure C-5. Rewelding the gouged weld zone.
grinding, in the direction of the applied stress, leaving all surfaces free f r o m depressions, as shown in Figure C-8. Weld soundness was then established by ultrasonic and radiographic inspection. The finished flange plates were then attached to the web plate in the same manner as other welded beams.
The A36 and A441 steels were automatic submerged arc welded using L-60 %4-in.-diameter wire and 780 flux. The yi6 - in . welds were placed at 23 in. per minute. The V4-\n. welds were placed at 16 in. per minute. The amperage was 350 at 30 volts. The tack welds and cover-plate end welds were made using •%2-in. E7018 electrodes.
The A514 Grade F and J steels were automatic submerged arc welded using L-61 %4-in.-diameter wire and 780 flux. The weld speed, amperage, and voltage were the same as used for the other grades of steel. Tack welds and cover-plate end welds were made with %2-in. E l 1018 electrodes that were first oven-dried at 2 5 0 ° F immediately on removal f r o m sealed containers.
The A S M steel manually made groove welds were placed with E l 1018 electrodes. The root pass was made with a %2-in. electrode, and the remaining six passes were made with yi6-in. electrodes.
Figure C-6. Flange plates and run-out tabs with vee groove.
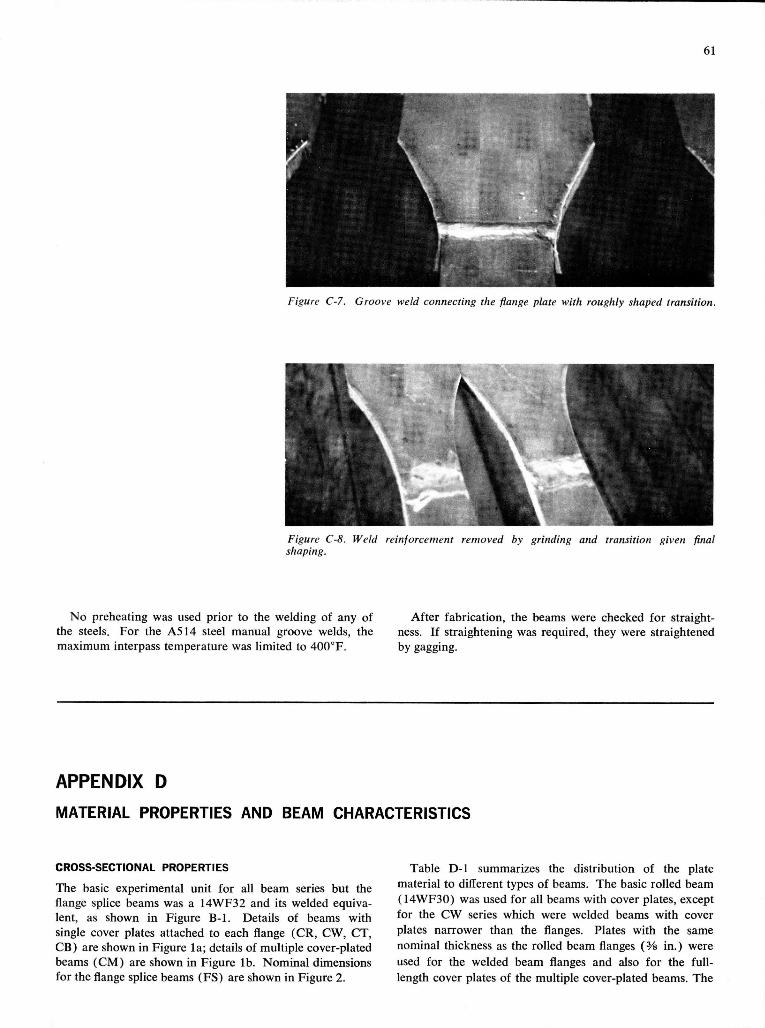
61
f . \M r I H I K f \
1 i
Figure C-7. Groove weld connecting the flange plate with roughly shaped transition.
Figure C-8. Weld reinforcement removed by grinding and transition given final shaping.
No preheating was used prior to the welding of any of the steels. For the A S M steel manual groove welds, the maximum interpass temperature was limited to 400°F .
Af t e r fabrication, the beams were checked fo r straight-ness. I f straightening was required, they were straightened by gagging.
APPENDIX D
MATERIAL PROPERTIES AND BEAM CHARACTERISTICS
CROSS-SECTIONAL PROPERTIES
The basic experimental unit for all beam series but the flange splice beams was a 14WF32 and its welded equivalent, as shown in Figure B-1 . Details of beams with single cover plates attached to each flange (CR, CW, CT, CB) are shown in Figure l a ; details of multiple cover-plated beams ( C M ) are shown in Figure l b . Nominal dimensions for the flange splice beams (PS) are shown in Figure 2.
Table D-1 summarizes the distribution of the plate material to different types of beams. The basic rolled beam (14WF30) was used fo r all beams with cover plates, except for the CW series which were welded beams wi th cover plates narrower than the flanges. Plates with the same nominal thickness as the rolled beam flanges ( % in.) were used for the welded beam flanges and also for the f u l l -length cover plates of the multiple cover-plated beams. The
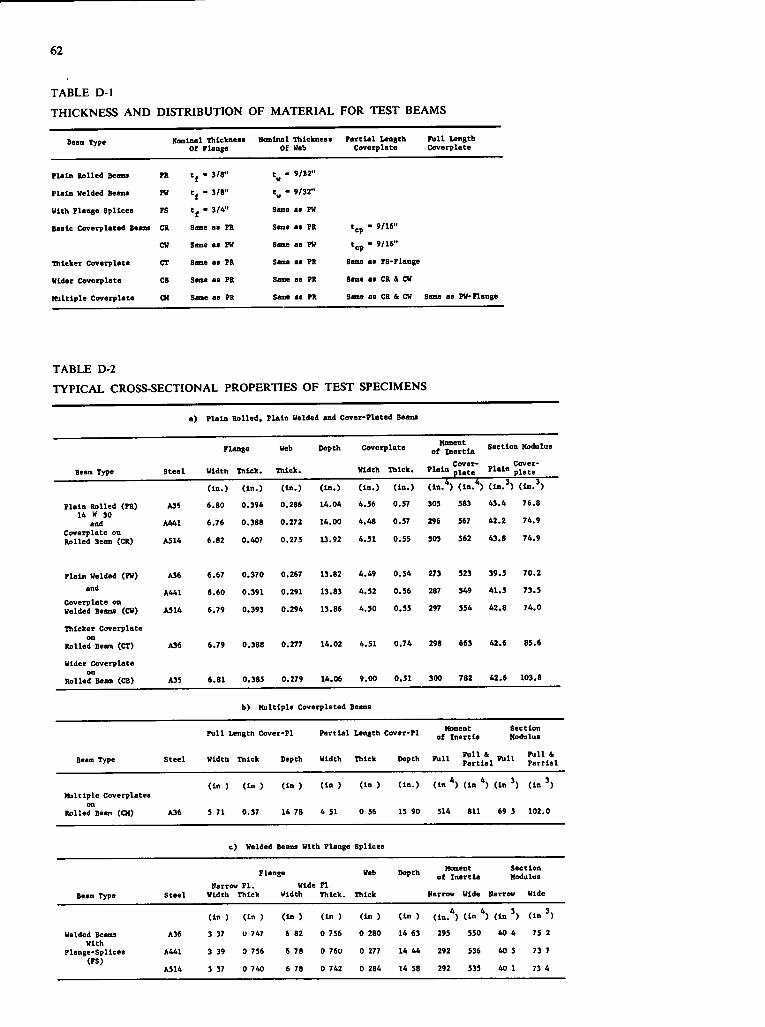
62
T A B L E D-1
THICKNESS AND DISTRIBUTION OF M A T E R I A L FOR T E S T BEAMS
Beam Type Rcmtnal Thlckneaa Hcmlnal Thlckaess Part ial Length F u l l Length Beam Type Of Flange Of Web Coverplate Coverplate
Plain Rolled Beama ?a t j - 3/8" t -w 9/12"
Plain Welded Beama FW t j - 3/8" '» - 9/32"
With Flange Splices FS t j - 3/4" same as FW
Baalc Coverplated Bean a CR Same aa PR Same ae ?R 'cp - 9/16"
CW Same aa FW Same aa PW 'cp - 9/16"
Thicker Coverplate CT Same as PR Same as PR Same as FS-Flange
Wider Coverplate CB Same as PR Same ae PR Same as CR & CW
Multiple Coverplate CM Same aa PR Same as PR Same as CR & CW Same as FW-Flange
T A B L E D-2
T Y P I C A L CROSS-SECTIONAL PROPERTIES OF T E S T SPECIMENS
a) Plain Rolled, Plain Welded and Cover-Flated Beams
Flange Web Depth Coverplate Moment of Inertia Section Modulus
Beam Type Steel Wldtn Thick. Thick. Width Thick. , Cover-
'1"^" plate Plain Coverplate
( I n . ) ( l o . ) ( in . ) ( I n . ) ( i n . ) ( in . ) ( in . *) ( in .* ) ( i n . ' ) ( i n . ' )
Plain Rolled (PB> A36 6.80 0.394 0.286 14.04 4.36 0.57 305 583 43.4 76.8 14 V 30
and A441 6.76 0.388 0.272 14.00 4.48 0.57 296 567 42.2 74.9 Coverplate on Rolled Beam (CR) AS 14 6.82 0.407 0.27S 13.92 4.S1 0.55 305 562 43.8 74.9
Plain Welded (FW) A36 6.67 0.370 0.267 13.82 4.49 0.54 273 523 39.5 70.2
and A441 6.60 0.391 0.291 13.83 4.32 0.56 287 549 41.5 73.5 Coverplate on Welded Beams (CW) A514 6.79 0.393 0.294 13.86 4.30 O.SS 297 554 42.8 74.0
Thicker Coverplate on
Rolled Beam (CT) A36 6.79 0.388 0.277 14.02 4.51 0.74 298 663 42.6 85.6
Wider Coverplate on
Rolled Beam (CB) A3S 6.81 0.383 0.279 14.06 9.00 0.51 300 782 42.6 103.8
b) Multiple Coverplated Beams
F u l l length Cover-Pl Partial length Cover-Pl ^ j ^ l u H
Beam Type Steel
Multiple Coverplates on
Rolled Bean (CM) A36
Width Tnlck Depth Width Thick Depth F u l l f ^ H p^it ial
(in ) (in ) ( in ) ( in ) (In ) ( I n . ) ( in *) ( in *) ( in ' ) ( in ' )
5 71 0.37 14 78 4 51 0 56 15 90 514 811 69 5 102.0
c) Welded Beama With Flange Spllcea
Flange Depth Moment of Inertia
Section Modulus
Beam Type Steel Width Thick Width Thick. Thick Rarrov Wide Narrow Wide
(in ) ( in ) (in ) ( in ) (In ) ( In ) 4
( in . ) ( i n * ) ( in ' ) ( in ' )
Welded Beams A36 3 37 0 747 6 82 0 756 0 280 14 63 295 550 40 4 75 2 With
Flange-Splices A441 3 39 0 756 6 78 0 76U 0 277 14 44 292 536 40 5 73 7 (FS)
A514 3 37 0 740 6 78 0 742 0 284 14 58 292 535 40 1 73 4
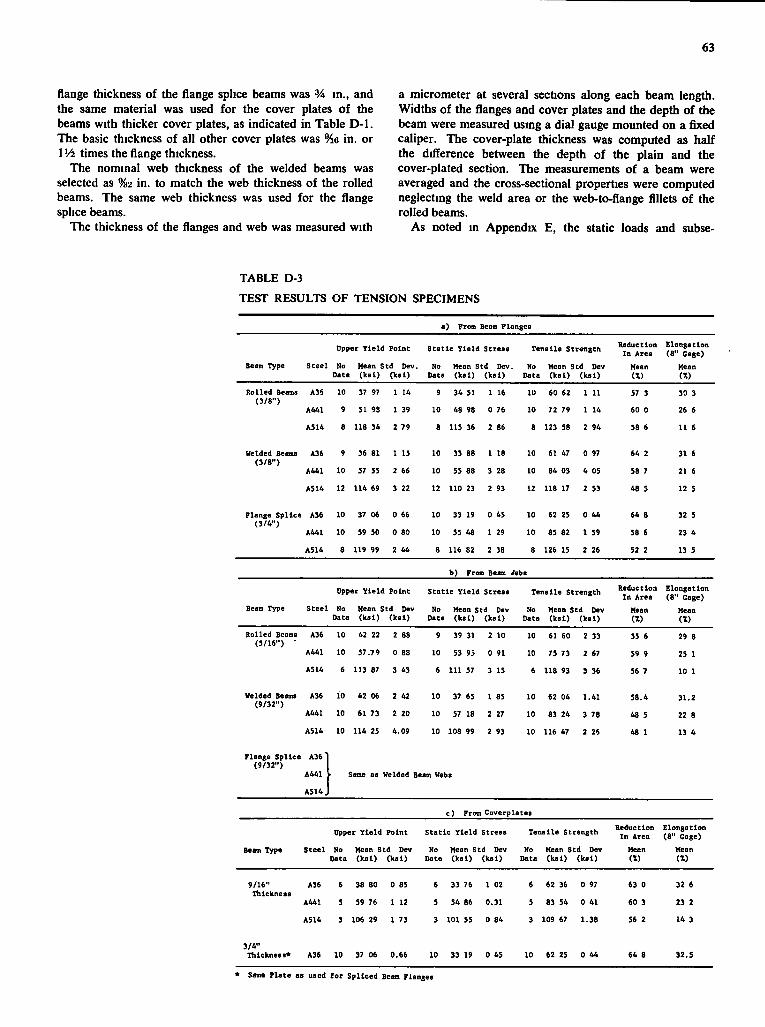
63
flange thickness of the flange splice beams was Va in., and the same material was used for the cover plates of the beams with thicker cover plates, as indicated in Table D-1. The basic thickness of all other cover plates was %6 in. or 1V2 times the flange thickness.
The nominal web thickness of the welded beams was selected as %2 in. to match the web thickness of the rolled beams. The same web thickness was used for the flange splice beams.
The thickness of the flanges and web was measured with
a micrometer at several sections along each beam length. Widths of the flanges and cover plates and the depth of the beam were measured usmg a dial gauge mounted on a fixed caliper. The cover-plate thickness was computed as half the difference between the depth of the plain and the cover-plated section. The measurements of a beam were averaged and the cross-sectional properties were computed neglecting the weld area or the web-to-flange fillets of the rolled beams.
As noted in Appendix E , the static loads and subse-
T A B L E D-3
T E S T RESULTS OF TENSION SPECIMENS
a) From Beam Flanges
Uppe r Yield Point Static Yield Stress Tensile Strength Reduction In Area
Elongation (8" Cage)
Beam Type Steel No Mean Std Dev, No Mean Std Dev, No Mean Std Dev Mean Mean Data (ksl) ( k . l ) Data (kal) (ks l ) Data (k»l ) (ks l ) m m
Rolled Beams A3i 10 37 97 1 U 9 34 51 1 16 lu 60 62 1 11 57 3 30 3 (3/8")
A441
A514
51 93 1 39
118 34 2 79
10 43 98 0 76
8 lis 36 2 86
10 72 79 1 14
8 123 58 2 94
60 0
58 6
26 6
11 6
Welded Beams (3/8")
A36
A441
9
10
36 81
57 55
1 15
2 66
10
10
33 88
55 88
I 18
3 28
10
10
61 47
84 03
0 97
4 05
64 2
58 7
31 6
21 6
A514 12 114 69 3 22 12 110 23 2 93 12 118 17 2 53 48 S 12 5
Flange Splice (3/4")
A36
A441
10
10
37 06
59 50
0 66
0 80
10
10
33 19
35 48
0 45
1 29
10
10
62 25
85 82
0 44
1 59
64 8
58 6
32 5
23 4
A514 8 119 99 2 44 8 116 82 2 38 8 126 IS 2 26 52 2 13 S
b) From Beam ^ebs
tipper Yield Point Static Yield Streaa Tensile Strength Reduction In Area
Elongation (8" Gage)
Beam Type Steel No Data
Mean (ks l )
Std Dev (ks l )
No Data
Mean std Dev (kal) (kal)
No Data
Mean Std Dev (ksl) (ks l )
Mean (X)
Mean (X)
Rolled Beama (5/16") -
A36
A441
10
10
42 22
57,79
2 88
0 88
9
10
39 31
53 95
2 10
0 91
10
10
61 60
75 73
2 33
2 67
55 6
59 9
29 8
25 I
AS 14 6 113 87 3 43 6 111 57 3 IS 6 118 93 3 36 56 7 10 I
Uelded Beama (9/32")
A36
A441
10
10
42 06
61 73
2 42
2 20
10
10
37 65
57 18
1 85
2 27
10
10
62 04
83 24
1,41
3 78
58.4
48 S
31.2
22 8
AS14 10 114 25 4,09 10 108 99 2 93 10 116 47 2 26 48 I 13 4
Flange Splice (9/32")
A36'
A441 • Same as Welded Beam Webs
A514,
c ) From Coverplates
Upper Yield Point Static Yield Stress Tensile Strength Reduction In Area
Elongation (8" Gage)
Beam Type Steel No Data
Mean Std Dev (ks l ) (ksl )
No Date
Mean Std Dev (ks l ) (kal)
No Data
Mean Std Dev (kal) (kal)
Mean (X)
Mean (X)
9/16" Thlckneaa
A36
A441
6
5
38 80
59 76
0 85
1 12
6
5
33 76
54 86
I 02
0.31
6
5
62 36
83 54
0 97
0 41
63 0
60 3
32 6
23 2
AS14 3 106 29 1 73 3 lOl 55 0 84 3 109 67 1,38 S6 2 14 3
3/4" Thickness* A36 10 37 06 0.66 10 33 19 0 45 10 62 25 0 44 64 8 32.5
* Same Flate as used for Spliced Beam Flanges
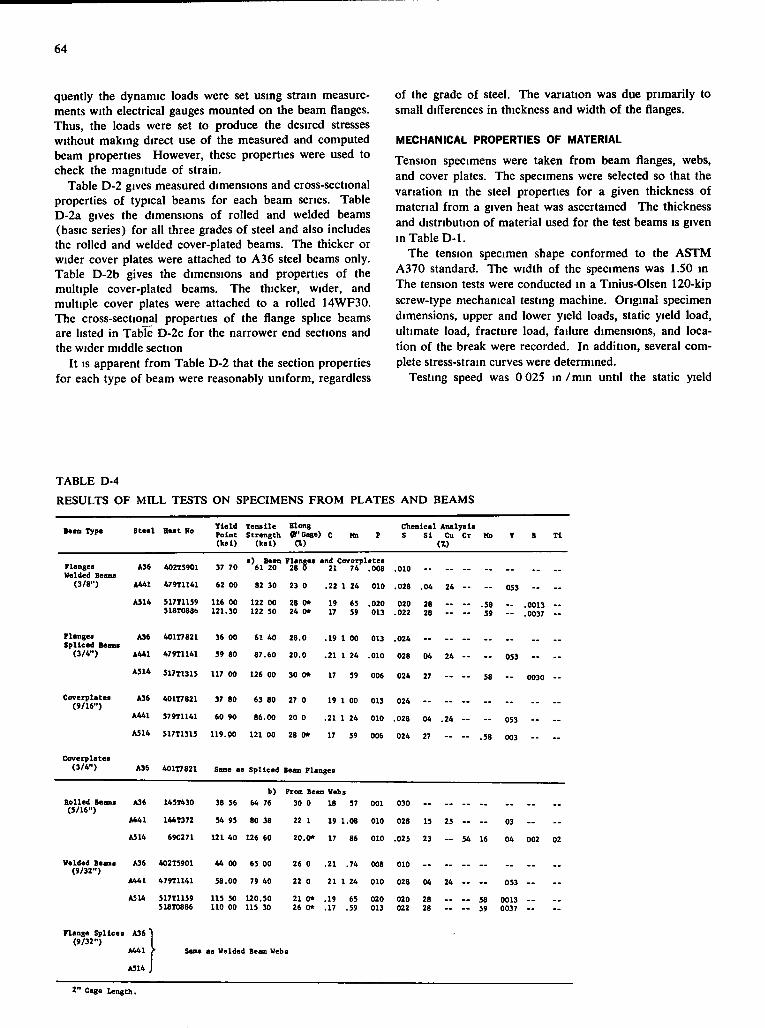
64
quently the dynamic loads were set using strain measurements with electrical gauges mounted on the beam flanges. Thus, the loads were set to produce the desired stresses without making direct use of the measured and computed beam properties However, these properties were used to check the magnitude of strain.
Table D-2 gives measured dimensions and cross-sectional properties of typical beams for each beam series. Table D-2a gives the dimensions of rolled and welded beams (basic series) for all three grades of steel and also includes the rolled and welded cover-plated beams. The thicker or wider cover plates were attached to A36 steel beams only. Table D-2b gives the dimensions and properties of the multiple cover-plated beams. The thicker, wider, and multiple cover plates were attached to a rolled 14WF30. The cross-sectional properties of the flange splice beams are listed in Table D-2c for the narrower end sections and the wider middle section
It IS apparent from Table D-2 that the section properties for each type of beam were reasonably uniform, regardless
of the grade of steel. The variation was due primarily to small differences in thickness and width of the flanges.
MECHANICAL PROPERTIES OF MATERIAL
Tension specimens were taken from beam flanges, webs, and cover plates. The specimens were selected so that the variation in the steel properties for a given thickness of material from a given heat was ascertained The thickness and distribution of material used for the test beams is given in Table D-1.
The tension specimen shape conformed to the A S T M A370 standard. The width of the specimens was 1.50 in The tension tests were conducted in a Tinius-Olsen 120-kip screw-type mechanical testing machine. Original specimen dimensions, upper and lower yield loads, static yield load, ultimate load, fracture load, failure dimensions, and location of the break were recorded. In addition, several complete stress-strain curves were determined.
Testing speed was 0 025 i n / m m until the static yield
T A B L E D-4
RESULTS OF M I L L TESTS ON SPECIMENS FROM PLATES AND BEAMS
Beam Type Sceel Heat No Tleld Tensile Hong Point Strength (P'Gage) c
Chemical Analysis S S i Cu Cr
(kal) (ks i ) (X)
Flanges Welded Beama
(3/8")
A36
A441
402TS901
479T1141
37 70
62 00
a) Beam 61 20
32 30
Flanges 28 5
23 0
and Coverplates 21 74 .008
.22 1 24 010
.010
.028 .04 24 — 053
A514 51711159 5l8T038t>
116 00 121.30
122 00 122 50
28 0* 24 0*
19 17
65 59
.020 013
020 .022
28 28
.58 59 --
.0013 "
.0037 "
Flanges Spliced Beams
(3/4")
A36
A441
401T7821
479T1141
36 00
59 80
61 40
87.60
28.0
20.0
.19
.21
1 00
1 24
013
.010
.024
028 04 24 053
A314 51711315 117 00 126 00 30 0* 17 59 006 024 27 " " 58 - 0030 —
Coverplates (»/16")
A36
A441
401T7821
S79T1141
37 80
60 90
63 80
86.00
27 0
20 0
19
.21
1 00
1 24
013
010
024
.028 04 .24 — 053 A514 517T1315 119.00 121 00 28 0* 17 59 006 024 27 " - .58 003 " -
Coverplates (3/4") A3i 401T7821 Same as Spliced Beam Flanges
Rolled Beans (5/16")
A36
A441
145T430
144T372
38 56
54 95
b) 64 76
80 38
Frcn Beam Vebs 30 0 18 57
22 1 19 1.08
001
010
030
028 IS 25 — 03
A514 69C271 121 40 126 60 20.0* 17 86 010 .025 23 — 54 16 04 002 02
Welded Besms (9/32")
A36
A441
402TS901
479T1141
44 00
58.00
65 00
79 40
26 0
22 0
.21
21
.74
1 24
008
010
010
028 04 24 — 053
A : U S17T11S9 518T0886
lis 50 110 00
U0.50 lis 30
21 0* 26 0*
.19
.17 65
.59 020 013
020 022
28 28
" - 58 59
0013 0037
Flange Splices A36 (9/32")
A441
A514 ,
Same as Welded Beam Webs
2" Gaga Length.
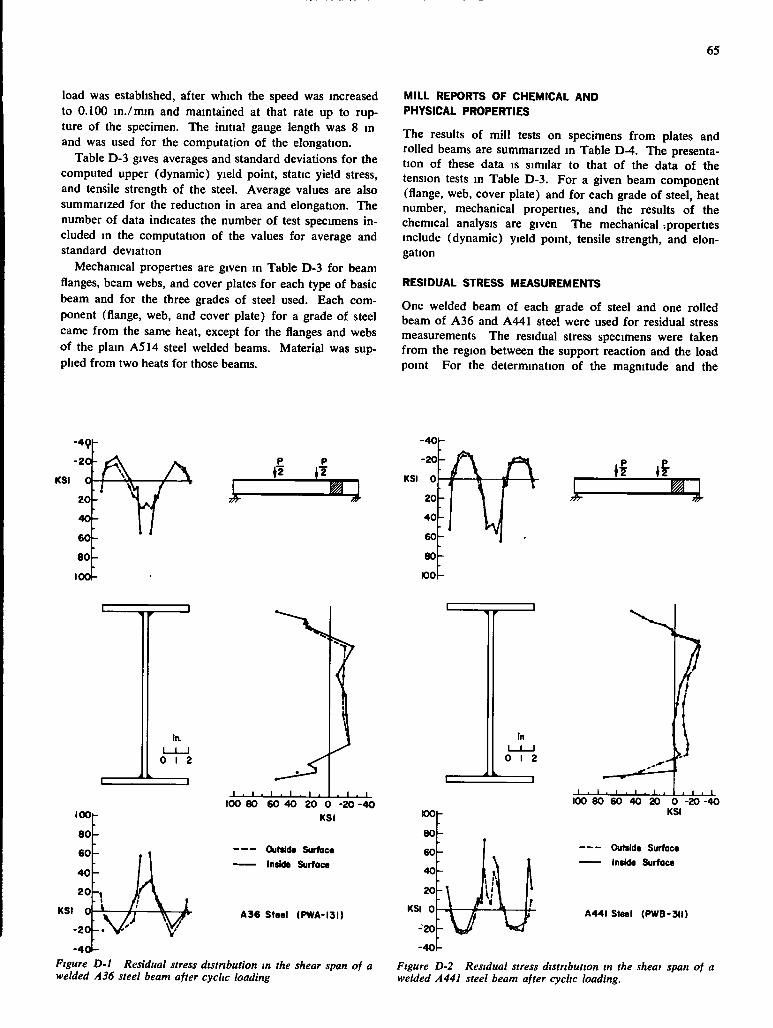
65
load was estabhshed, after which the speed was increased to 0.100 in./mm and mamtained at that rate up to rupture of the specimen. The initial gauge length was 8 in and was used for the computation of the elongation.
Table D-3 gives averages and standard deviations for the computed upper (dynamic) yield point, static yield stress, and tensile strength of the steel. Average values are also summarized for the reduction in area and elongation. The number of data indicates the number of test specimens included in the computation of the values for average and standard deviation
Mechanical properties are given in Table D-3 for beam flanges, beam webs, and cover plates for each type of basic beam and for the three grades of steel used. Each component (flange, web, and cover plate) for a grade of steel came from the same heat, except for the flanges and webs of the plain A S H steel welded beams. Material was supplied from two heats for those beams.
MILL REPORTS OF CHEMICAL AND PHYSICAL PROPERTIES
The results of mill tests on specimens from plates and rolled beams are summarized in Table D-4. The presentation of these data is similar to that of the data of the tension tests in Table D-3. For a given beam component (flange, web, cover plate) and for each grade of steel, heat number, mechanical properties, and the results of the chemical analysis are given The mechanical .properties include (dynamic) yield point, tensile strength, and elongation
RESIDUAL STRESS MEASUREMENTS
One welded beam of each grade of steel and one rolled beam of A36 and A441 steel were used for residual stress measurements The residual stress specimens were taken from the region between the support reaction and the load point For the determination of the magnitude and the
p p A tf if 2
In. I I I 0 I 2
3
100 80 60 40 20 0 -20 -40 KSI
Outside Surtaca Inside Surface
A36 Steel (PWA-I3I)
-40(-Figure D-1 Residual stress distribution in the shear span of a welded A36 steel beam after cyclic loading
0 I 2
KSI 0
100 80 60 40 20 0 -20-40 KSI
Outside Surface Inside Surface
A44I Steel (PWB-3II)
-401-
Figure D-2 Residual stress distribution in the sheai span of a welded A441 steel beam after cyclic loading.
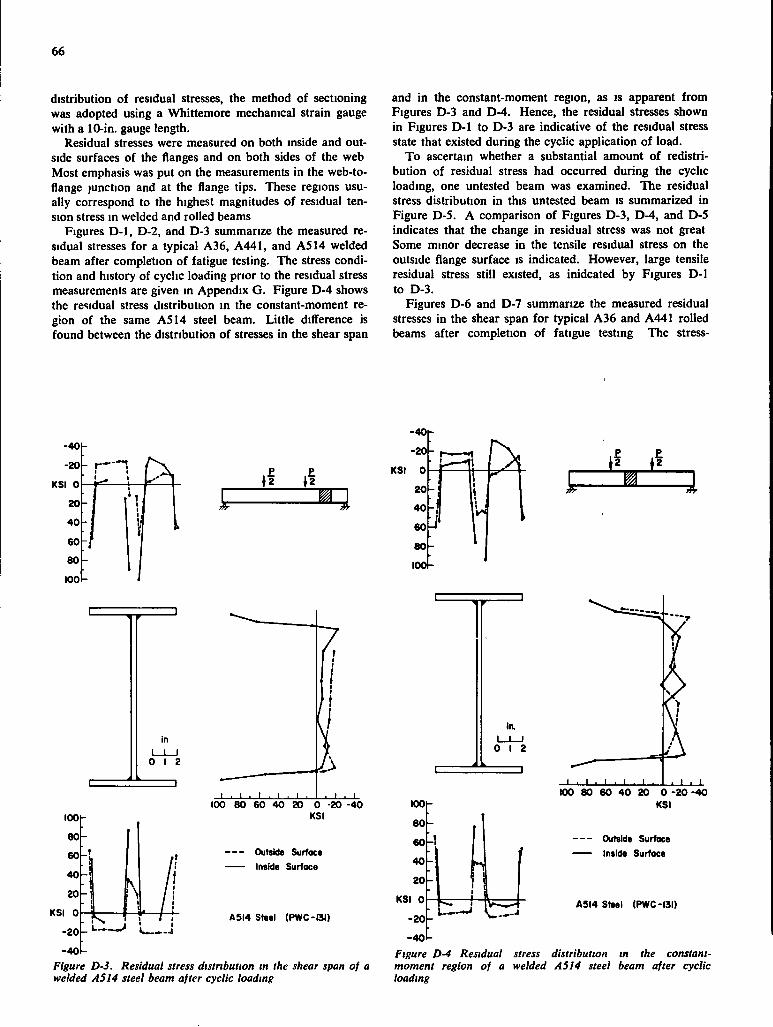
66
distribution of residual stresses, the method of sectioning was adopted using a Whittemore mechanical strain gauge with a 10-in. gauge length.
Residual stresses were measured on both inside and outside surfaces of the flanges and on both sides of the web Most emphasis was put on the measurements in the web-to-flange junction and at the flange tips. These regions usually correspond to the highest magnitudes of residual tension stress in welded and rolled beams
Figures D-1, D-2, and D-3 summarize the measured residual stresses for a typical A36, A441, and A S M welded beam after completion of fatigue testing. The stress condition and history of cyclic loading prior to the residual stress measurements are given in Appendix G . Figure D-4 shows the residual stress distribution in the constant-moment region of the same A S M steel beam. Little difference is found between the distribution of stresses in the shear span
and in the constant-moment region, as is apparent from Figures D-3 and D-4. Hence, the residual stresses shown in Figures D-1 to D-3 are indicative of the residual stress state that existed during the cyclic application of load.
To ascertain whether a substantial amount of redistribution of residual stress had occurred during the cyclic loading, one untested beam was examined. The residual stress distribution in this untested beam is summarized in Figure D-S. A comparison of Figures D-3, D-4, and D-S indicates that the change in residual stress was not great Some minor decrease in the tensile residual stress on the outside flange surface is indicated. However, large tensile residual stress still existed, as inidcated by Figures D-1 to D-3.
Figures D-6 and D-7 summarize the measured residual stresses in the shear span for typical A36 and A441 rolled beams after completion of fatigue testing The stress-
KSI 0
I I I
0 I 2
.1
100 80 60 40 20 0 -20 -40 KSI I00[-
8 0 -
60
40
20
KSI 0
-20
-40 Figure D-3. Residual stress dislnbulion m the shear span of a welded ASM steel beam after cyclic loading
u - J
Outside Surface Inside Surfoce
A5I4 Steel (PWC-OI)
-40
-20
KSI 0 KSI 0
20
40 l i 1
60 • 1
J
80
100
100-
8 0 -
60I-J
40l-
2 0 -
KSI 0
-201
in. I I I
0 I 2
I.
K)0 80 60 40 20 0 -20-40 KSI
Outside Surface Inside Surface
A5I4 Steel (PWC-I3I)
-401-Figure D-4 Residual stress distribution in the constant-moment region of a welded A514 steel beam after cyclic loading
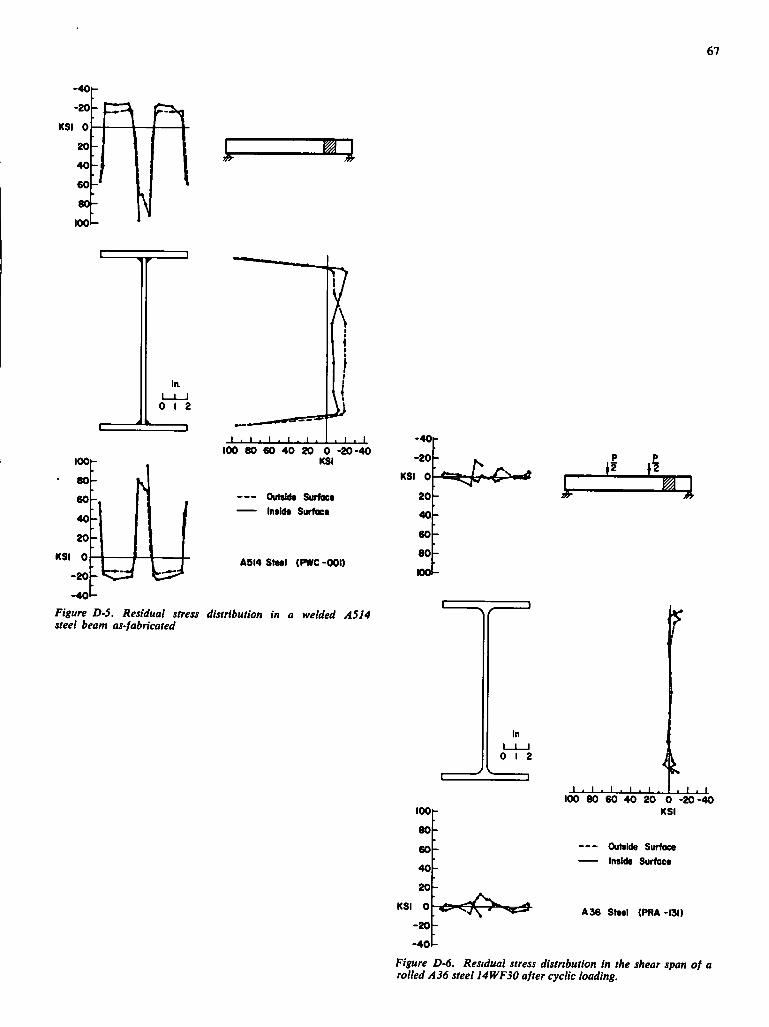
67
KSI 0
la I I I
0 I 2
100 80 60 40 20 0 -20-40 KSI 100
80
60
40
20
KSI 0
-20
- 4 0 -
Figitre D-S. Residual stress distribution in a welded A514 steel beam as-fabricated
Outtfato Surface Inside Surface
ASM Steel (PWC -001)
-40|
-20
KSI 0
20
40
60
80
DO
1 p
In I I I
0 I 2 4 1 . 1 I I I I ' • I
100 80 60 40 20 0 -20-40 KSI 100
80
60
40
20
KSI 0
-20
- 4 0 -
Figure D-6. Residual stress distribution in the shear span of a rolled A36 steel 14WF30 after cyclic loading.
Outilde Surface Inside Surface
A 36 Steel (PRA -131)
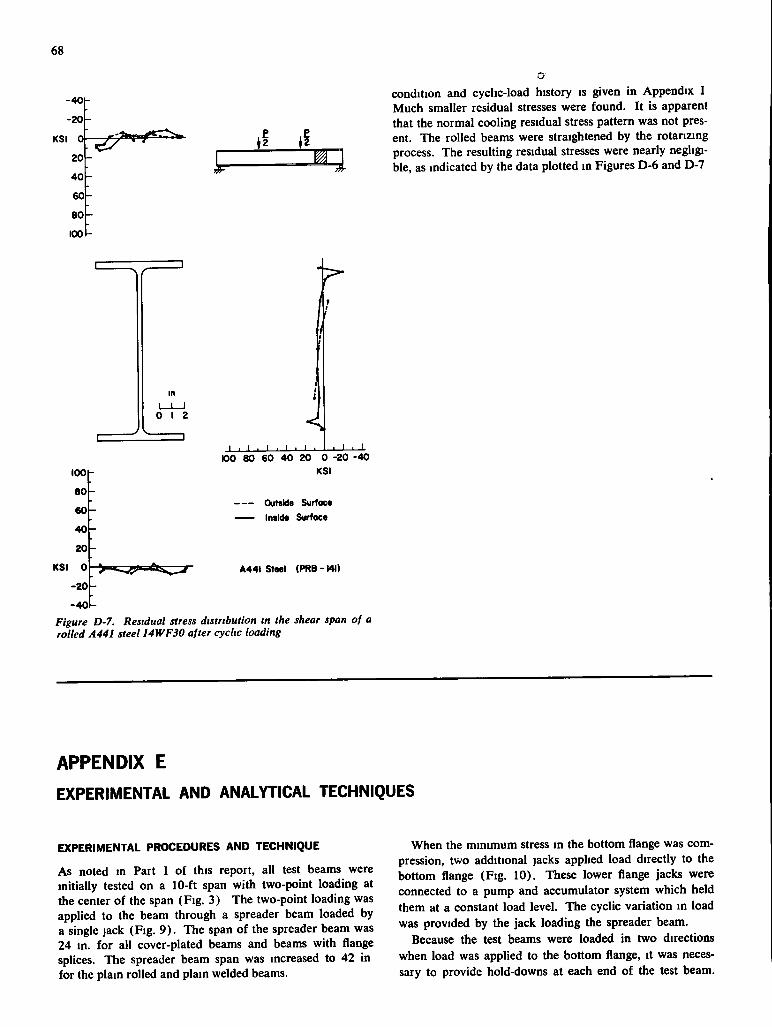
68
-40
-20
KSI 0
20
40
60
80
100
1-
condition and cyclic-load history is given in Appendix I Much smaller residual stresses were found. It is apparent that the normal cooling residual stress pattern was not present. The rolled beams were straightened by the rotanzing process. The resulting residual stresses were nearly negligible, as indicated by the data plotted in Figures D-6 and D-7
i n
I I I 0 I 2
I
CO 80 60 40 20 0 -20 -40 lOOh KSI
8 0 -Outside Surface Inside Surfoce
4 0 -
2oF-
KSI Oh
-20[-
-40[-Figure D-7. Residual stress distribution in the shear span of a rolled A441 steel 14WF30 after cyclic loading
A44I Steel (PRB-I4I)
APPENDIX E EXPERIMENTAL AND ANALYTICAL TECHNIQUES
EXPERIMENTAL PROCEDURES AND TECHNIQUE
As noted m Part I of this report, all test beams were initially tested on a 10-ft span with two-point loading at the center of the span (Fig. 3) The two-point loading was applied to the beam through a spreader beam loaded by a single jack (Fig. 9 ) . The span of the spreader beam was 24 in. for all cover-plated beams and beams with flange splices. The spreader beam span was increased to 42 in for the plain rolled and plain welded beams.
When the minimum stress in the bottom flange was compression, two additional jacks applied load directly to the bottom flange (Fig. 10). These lower flange jacks were connected to a pump and accumulator system which held them at a constant load level. The cyclic variation in load was provided by the jack loading the spreader beam.
Because the test beams were loaded in two directions when load was applied to the bottom flange, it was necessary to provide hold-downs at each end of the test beam.
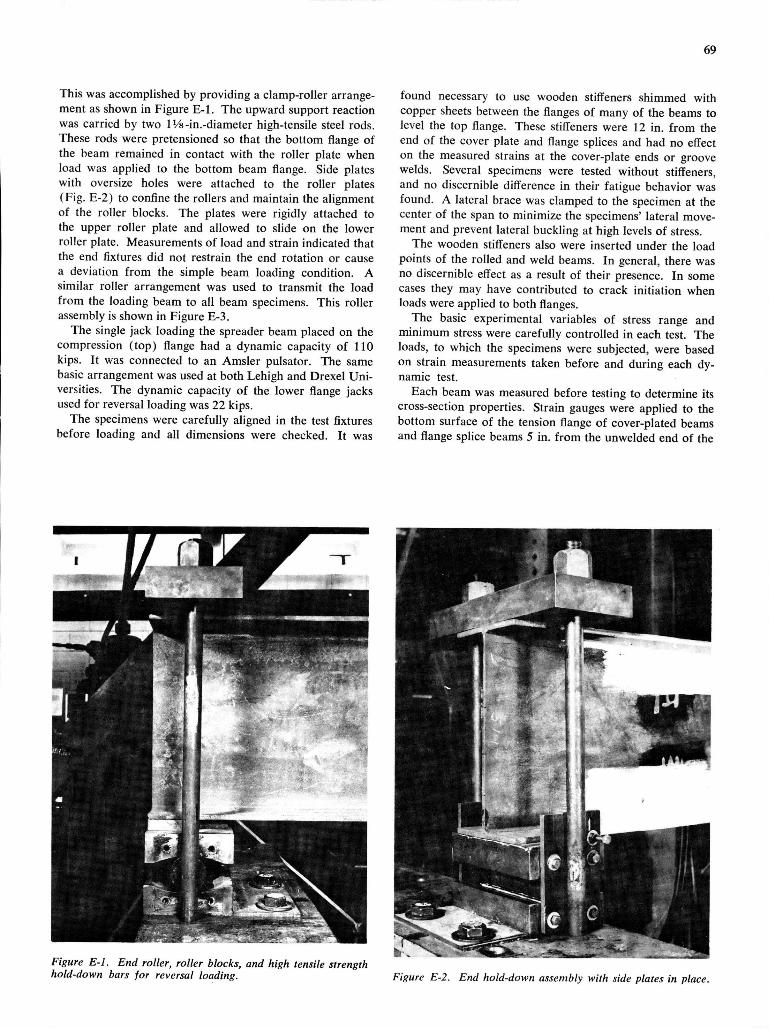
69
This was accomplished by providing a clamp-roller arrangement as shown in Figure E-1. The upward support reaction was carried by two I V&-in.-diameter high-tensile steel rods. These rods were pretensioned so that the bottom flange of the beam remained in contact with the roller plate when load was applied to the bottom beam flange. Side plates with oversize holes were attached to the roller plates (Fig. E-2) to confine the rollers and maintain the alignment of the roller blocks. The plates were rigidly attached to the upper roller plate and allowed to slide on the lower roller plate. Measurements of load and strain indicated that the end fixtures did not restrain the end rotation or cause a deviation f rom the simple beam loading condition, A similar roller arrangement was used to transmit the load f r o m the loading beam to all beam specimens. This roller assembly is shown in Figure E-3.
The single jack loading the spreader beam placed on the compression (top) flange had a dynamic capacity of 110 kips. I t was connected to an Amsler pulsator. The same basic arrangement was used at both Lehigh and Drexel U n i versities. The dynamic capacity of the lower flange jacks used for reversal loading was 22 kips.
The specimens were carefully aligned in the test fixtures before loading and all dimensions were checked. I t was
found necessary to use wooden stifFeners shimmed with copper sheets between the flanges of many of the beams to level the top flange. These stiffeners were 12 in. f r o m the end of the cover plate and flange splices and had no effect on the measured strains at the cover-plate ends or groove welds. Several specimens were tested without stiff'eners, and no discernible diff'erence in their fatigue behavior was found. A lateral brace was clamped to the specimen at the center of the span to minimize the specimens' lateral movement and prevent lateral buckling at high levels of stress.
The wooden stiffeners also were inserted under the load points of the rolled and weld beams. In general, there was no discernible effect as a result of their presence. I n some cases they may have contributed to crack initiation when loads were applied to both flanges.
The basic experimental variables of stress range and minimum stress were carefully controlled in each test. The loads, to which the specimens were subjected, were based on strain measurements taken before and during each dynamic test.
Each beam was measured before testing to determine its cross-section properties. Strain gauges were applied to the bottom surface of the tension flange of cover-plated beams and flange splice beams 5 in . f r o m the unwelded end of the
Figure E-1. End roller, roller blocks, and high tensile strength hold-down bars for reversal loading. Figure E-2. End hold-down assembly with side plates in place.
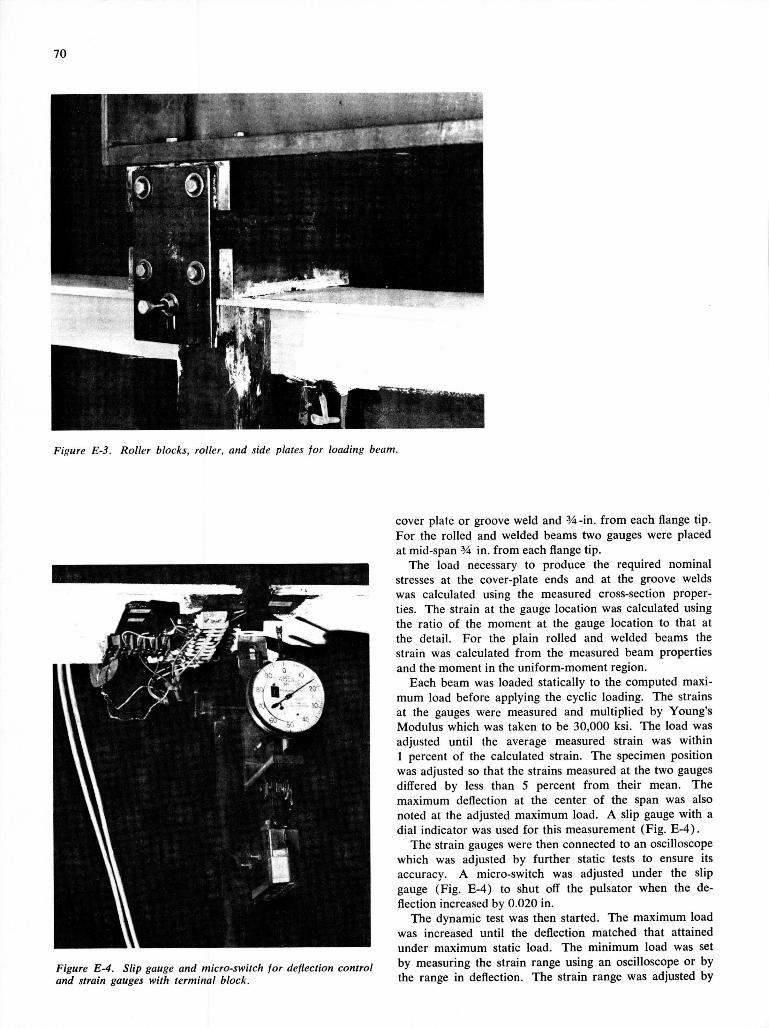
70
Figure E-3. Roller blocks, roller, and side plates for loading beam.
Figure E-4. Slip gauge and micro-switch for deflection control and strain gauges with terminal block.
cover plate or groove weld and % -in. f r o m each flange tip. For the rolled and welded beams two gauges were placed at mid-span % in. f r o m each flange tip.
The load necessary to produce the required nominal stresses at the cover-plate ends and at the groove welds was calculated using the measured cross-section properties. The strain at the gauge location was calculated using the ratio of the moment at the gauge location to that at the detail. For the plain rolled and welded beams the strain was calculated f r o m the measured beam properties and the moment in the uniform-moment region.
Each beam was loaded statically to the computed maximum load before applying the cyclic loading. The strains at the gauges were measured and multiplied by Young's Modulus which was taken to be 30,000 ksi. The load was adjusted until the average measured strain was within 1 percent of the calculated strain. The specimen position was adjusted so that the strains measured at the two gauges differed by less than 5 percent f r o m their mean. The maximum deflection at the center of the span was also noted at the adjusted maximum load. A slip gauge with a dial indicator was used for this measurement (Fig. E-4) .
The strain gauges were then connected to an oscilloscope which was adjusted by further static tests to ensure its accuracy. A micro-switch was adjusted under the slip gauge (Fig. E-4) to shut off the pulsator when the deflection increased by 0.020 in .
The dynamic test was then started. The maximum load was increased until the deflection matched that attained under maximum static load. The minimum load was set by measuring the strain range using an oscilloscope or by the range in deflection. The strain range was adjusted by
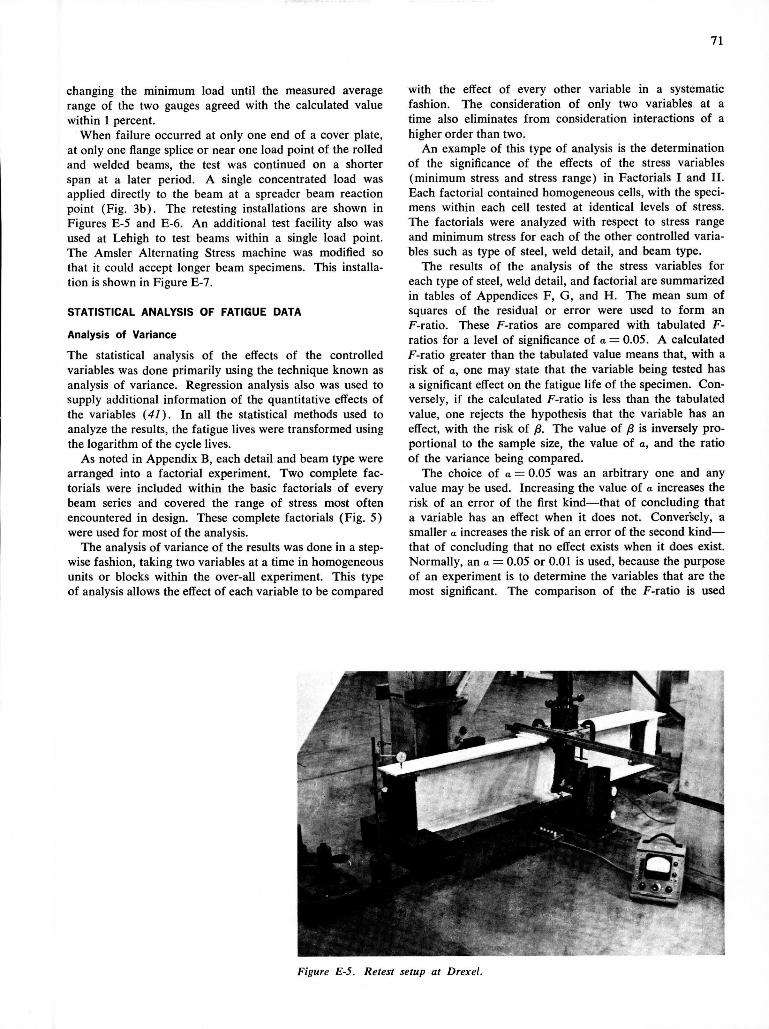
71
changing the minimum load unti l the measured average range of the two gauges agreed with the calculated value within 1 percent.
When failure occurred at only one end of a cover plate, at only one flange splice or near one load point of the rolled and welded beams, the test was continued on a shorter span at a later period. A single concentrated load was applied directly to the beam at a spreader beam reaction point (Fig. 3b) . The retesting installations are shown in Figures E-5 and E-6. A n additional test facili ty also was used at Lehigh to test beams within a single load point. The Amsler Alternating Stress machine was modified so that it could accept longer beam specimens. This installation is shown in Figure E-7.
STATISTICAL ANALYSIS OF FATIGUE DATA
Analysis of Variance
The statistical analysis of the effects of the controlled variables was done primarily using the technique known as analysis of variance. Regression analysis also was used to supply additional information of the quantitative effects of the variables (41). I n all the statistical methods used to analyze the results, the fatigue lives were transformed using the logarithm of the cycle lives.
As noted in Appendix B, each detail and beam type were arranged into a factorial experiment. Two complete factorials were included within the basic factorials of every beam series and covered the range of stress most often encountered in design. These complete factorials (F ig . 5) were used fo r most of the analysis.
The analysis of variance of the results was done in a stepwise fashion, taking two variables at a time in homogeneous units or blocks within the over-all experiment. This type of analysis allows the effect of each variable to be compared
with the effect of every other variable in a systematic fashion. The consideration of only two variables at a time also eliminates f r o m consideration interactions of a higher order than two.
A n example of this type of analysis is the determination of the significance of the effects of the stress variables (minimum stress and stress range) in Factorials I and I I . Each factorial contained homogeneous cells, with the specimens within each cell tested at identical levels of stress. The factorials were analyzed with respect to stress range and minimum stress for each of the other controlled variables such as type of steel, weld detail, and beam type.
The results of the analysis of the stress variables for each type of steel, weld detail, and factorial are summarized in tables of Appendices F, G , and H . The mean sum of squares of the residual or error were used to f o r m an F-ratio. These F-ratios are compared with tabulated F-ratios for a level of significance of a = 0.05. A calculated F-ratio greater than the tabulated value means that, with a risk of a, one may state that the variable being tested has a significant effect on the fatigue l i fe of the specimen. Conversely, i f the calculated F-ratio is less than the tabulated value, one rejects the hypothesis that the variable has an effect, wi th the risk of ft. The value of j8 is inversely proportional to the sample size, the value of a, and the ratio of the variance being compared.
The choice of a = 0.05 was an arbitrary one and any value may be used. Increasing the value of a increases the risk of an error of the first kind—that of concluding that a variable has an effect when i t does not. Conversely, a smaller a increases the risk of an error of the second k i n d — that of concluding that no effect exists when i t does exist. Normally, an a = 0.05 or 0.01 is used, because the purpose of an experiment is to determine the variables that are the most significant. The comparison of the F-ratio is used
Figure E-5. Retest setup at Drexel.
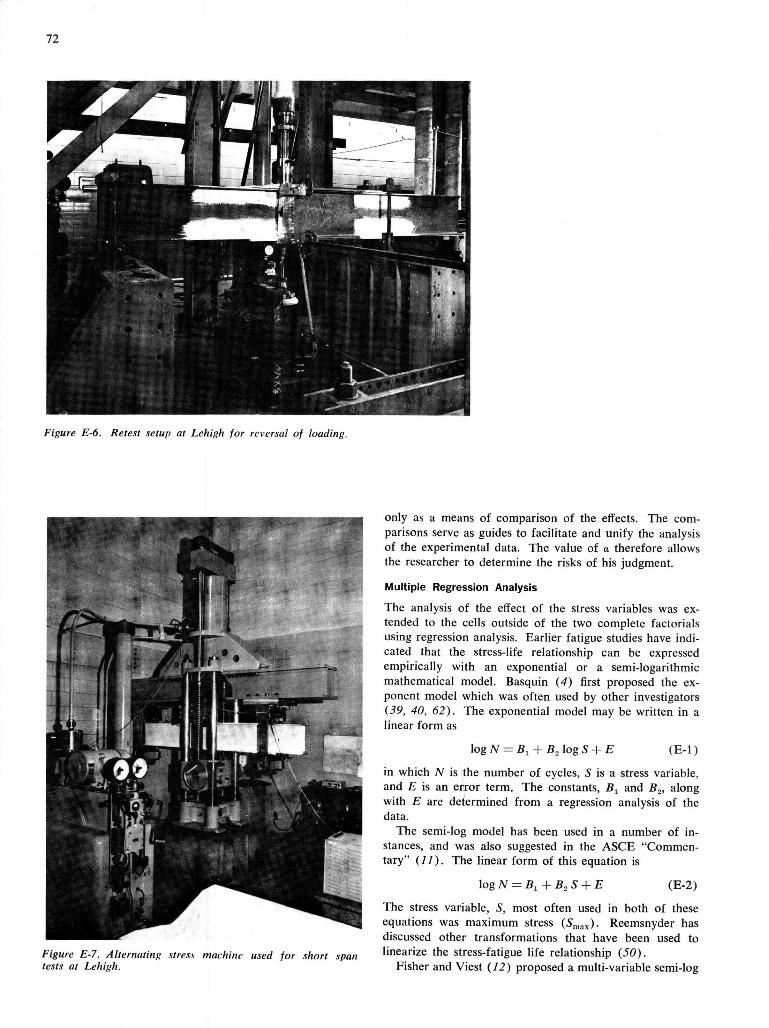
72
Figure E-6. Retest setup at Lehigh for reversal of loading.
only as a means of comparison of the effects. The comparisons serve as guides to facilitate and uni fy the analysis of the experimental data. The value of a therefore allows the researcher to determine the risks of his judgment.
Multiple Regression Analysis
The analysis of the effect of the stress variables was extended to the cells outside of the two complete factorials using regression analysis. Earlier fatigue studies have indicated that the stress-life relationship can be expressed empirically with an exponential or a semi-logarithmic mathematical model. Basquin (4) first proposed the exponent model which was often used by other investigators (59, 40, 62). The exponential model may be written in a linear fo rm as
log N — B^-\- B.JogS + E (E-1)
in which N is the number of cycles, 5 is a stress variable, and E is an error term. The constants, and B^, along with E are determined f rom a regression analysis of the data.
The semi-log model has been used in a number of instances, and was also suggested in the ASCE "Commentary" ( / / ) . The linear f o r m of this equation is
log N = + 5 • (E-2)
Figure E-7. Alternating stress machine used for short span tests at Lehigh.
The stress variable, S, most often used in both of these equations was maximum stress (5„, ,x). Reemsnyder has discussed other transformations that have been used to linearize the stress-fatigue l ife relationship (50 ) .
Fisher and Viest (12) proposed a multi-variable semi-log
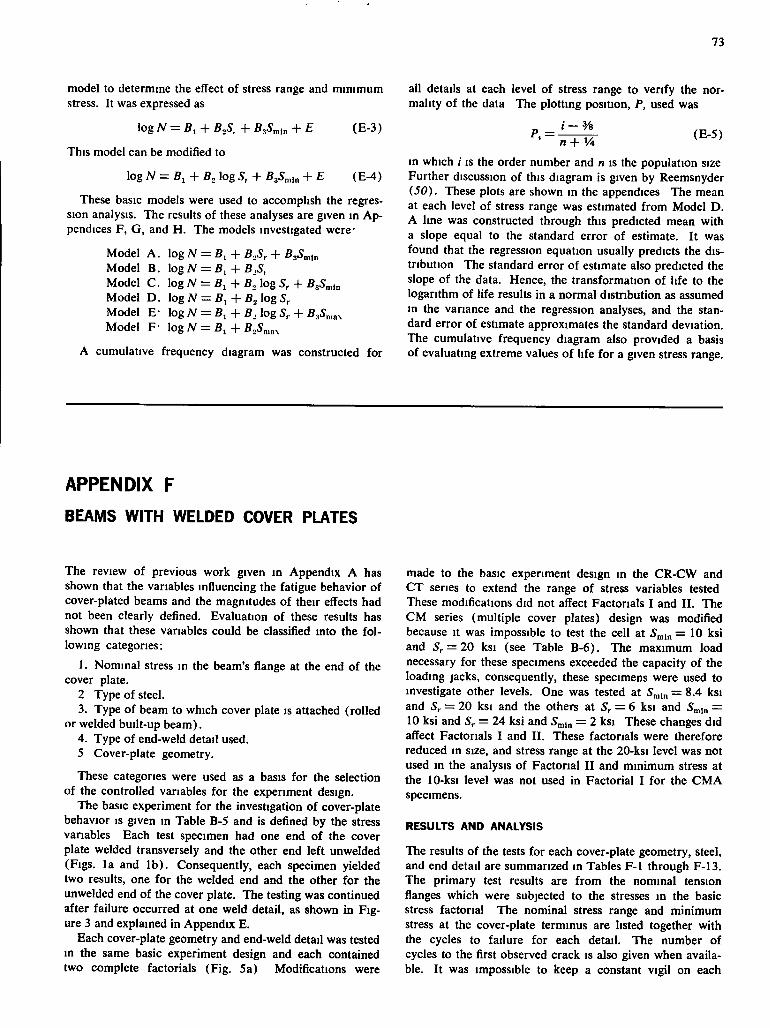
73
model to determine the effect of stress range and mmimum stress. It was expressed as
logN = Bi + B„S,+B,S„,in + £ (E-3)
This model can be modified to
log N = B, + B, log S, + B3S„„„ + E (E-4)
These basic models were used to accomplish the regression analysis. The results of these analyses are given in Appendices F, G, and H. The models investigated were-
Model A . log N = B, + B.S, + BaS^m Model B. logN = B , + B,5, Model C. log yV = Bj + B, log + B^S„,u, Model D . log N = B i - f B . log 5r Model E- logN = Bi + B,logSr + B3S„,„, Model F- logN = B , + BA,«x
A cumulative frequency diagram was constructed for
ail details at each level of stress range to verify the normality of the data The plotting position, P, used was
P.= (E-5)
in which /• IS the order number and n is the population size Further discussion of this diagram is given by Reemsnyder (50). These plots are shown in the appendices The mean at each level of stress range was estimated from Model D. A line was constructed through this predicted mean with a slope equal to the standard error of estimate. It was found that the regression equation usually predicts the distribution The standard error of estimate also predicted the slope of the data. Hence, the transformation of life to the logarithm of life results in a normal distribution as assumed in the variance and the regression analyses, and the standard error of estimate approximates the standard deviation. The cumulative frequency diagram also provided a basis of evaluating extreme values of life for a given stress range.
APPENDIX F
BEAMS WITH WELDED COVER PLATES
The review of previous work given in Appendix A has shown that the variables influencing the fatigue behavior of cover-plated beams and the magnitudes of their effects had not been clearly defined. Evaluation of these results has shown that these variables could be classified into the following categories:
1. Nominal stress in the beam's flange at the end of the cover plate.
2 Type of steel. 3. Type of beam to which cover plate is attached (rolled
or welded built-up beam). 4. Type of end-weld detail used. 5 Cover-plate geometry.
These categories were used as a basis for the selection of the controlled variables for the experiment design.
The basic experiment for the investigation of cover-plate behavior is given in Table B-5 and is defined by the stress variables Each test specimen had one end of the cover plate welded transversely and the other end left unwelded (Figs, la and l b ) . Consequently, each specimen yielded two results, one for the welded end and the other for the unwelded end of the cover plate. The testing was continued after failure occurred at one weld detail, as shown in Figure 3 and explained in Appendix E.
Each cover-plate geometry and end-weld detail was tested in the same basic experiment design and each contained two complete factorials (Fig. 5a) Modifications were
made to the basic experiment design in the CR-CW and CT series to extend the range of stress variables tested These modifications did not affect Factorials I and I I . The CM series (multiple cover plates) design was modified because it was impossible to test the cell at 5n„„ = 10 ksi and 5r = 20 ksi (see Table B-6). The maximum load necessary for these specimens exceeded the capacity of the loading jacks, consequently, these specimens were used to investigate other levels. One was tested at 5n„„ = 8.4 ksi and Sr = 20 ksi and the others at Sr — 6 ksi and S^i„ — 10 ksi and = 24 ksi and ^min = 2 ksi These changes did affect Factorials I and I I . These factorials were therefore reduced in size, and stress range at the 20-ksi level was not used in the analysis of Factorial I I and minimum stress at the 10-ksi level was not used in Factorial I for the CM A specimens.
RESULTS AND ANALYSIS
The results of the tests for each cover-plate geometry, steel, and end detail are summarized in Tables F-1 through F-13. The primary test results are from the nominal tension flanges which were subjected to the stresses in the basic stress factorial The nominal stress range and minimum stress at the cover-plate terminus are listed together with the cycles to failure for each detail. The number of cycles to the first observed crack is also given when available. It was impossible to keep a constant vigil on each
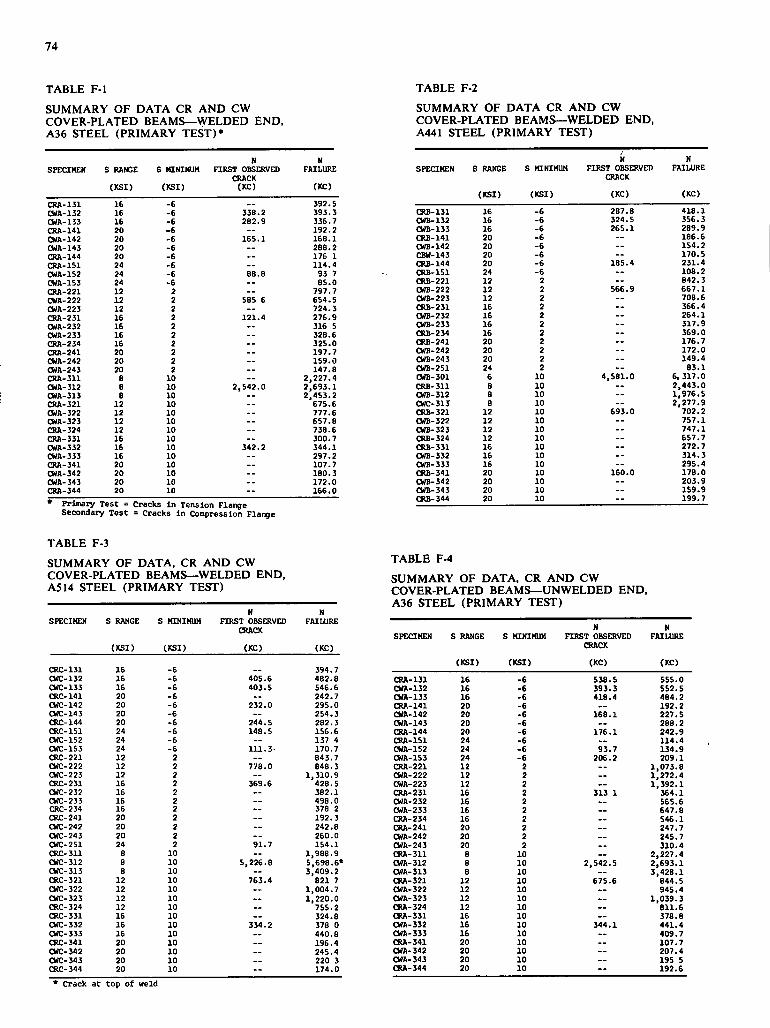
74
TABLE F-1 SUMMARY OF DATA CR AND CW COVER-PLATED BEAMS—WELDED END. A36 STEEL (PRIMARY TEST)*
N N SPEaMEN S RANGE S >aNIMUH FIRST OBSERVED
CRACK FAILURE
(KSI) (KSI) (KC) (KC)
CRA-131 16 -6 392.5 CWA-132 16 -6 338.2 393.3 CWA-133 16 -6 282.9 336.7 CRA-141 20 -6 — 192.2 CWA-142 20 -6 165.1 168.1 CWA-143 20 -6 — 288.2 CRA-144 20 -6 — 176 1 CRA-151 24 -6 — 114.4 CMA-1S2 24 -6 88.8 93 7 CWA-153 24 -6 — 85.0 CRA-221 12 2 — 797.7 CNA-222 12 2 S8S 6 654.5 CWA-223 12 2 — 724.3 CRA-231 16 2 121.4 276.9 CWA-232 16 2 — 316 5 CWA-233 16 2 328.6 CRA-234 16 2 325.0 CRA-241 20 2 - - 197.7 CWA-242 20 2 — 159.0 CWA-243 20 2 — 147.8 CRA-311 8 10 — 2,227.4 CWA-312 8 10 2,542.0 2,693.1 CWA-313 8 10 — 2,453.2 CRA-321 12 10 - - 675.6 CWA-322 12 10 777.6 CWA-323 12 10 657.8 CRA-324 12 10 — 738.6 CM-331 16 10 300.7 CWA-332 16 10 342.2 344.1 CNA-333 16 10 - - 297.2 CRA-341 20 10 — 107.7 CMA-342 20 10 - - 180.3 CWA-343 20 10 172.0 CRA-344 20 10 166.0
TABLE F-2 SUMMARY OF DATA CR AND CW COVER-PLATED BEAMS—WELDED END, A441 STEEL (PRIMARY TEST)
SPECIMEN S RANGE S hQNIMUH FIRST OBSERVED CRACK
N FAILURE
Primary Test = Cracks In Tension Flange Secondary Test = Cracks i n Compression Flange
(KSI) (KSI) (KC) (KC)
CRB-131 16 -6 287.8 418.1 CMB-132 16 -6 324.5 356.3 CWB-133 16 -6 265.1 289.9 CRB-141 20 -6 — 186.6 CWB-142 20 -6 -- 154.2 CBW-143 20 -6 -- 170.5 CRB-144 20 -6 185.4 231.4 CRB-151 24 -6 -- 108.2 CRB-221 12 2 -- 842.3 CWB-222 12 2 566.9 667.1 CWB-223 12 2 -- 708.6 CRB-231 16 2 — 366.4 CNB-232 16 2 — 264.1 CUB-233 16 2 — 317.9 CRB-234 16 2 — 369.0 CRB-241 20 2 — 176.7 CWB-242 20 2 172.0 CMB-243 20 2 — 149.4 CWB-251 24 2 — 83.1 CWB-301 6 10 4,581.0 6, 317.0 CRB-311 8 10 — 2,443.0 CNB-312 8 10 — 1,976.5 CWC-313 8 10 — 2,277.9 CRB-321 12 10 693.0 702.2 CWB-322 12 10 — 757.1 CWB-323 12 10 -- 747.1 CRB-324 12 10 — 657.7 CRB-331 16 10 — 272.7 CWB-332 16 10 314.3 CWB-333 16 10 — 295.4 CRB-341 20 10 160.0 178.0 CHB-342 20 10 — 203.9 CMB-343 20 10 — 159.9 CRB-344 20 10 -- 199.7
TABLE F-3 SUMMARY OF DATA, CR AND CW COVER-PLATED BEAMS—WELDED END, ASH STEEL (PRIMARY TEST)
TABLE F-4 SUMMARY OF DATA, CR AND CW COVER-PLATED BEAMS—UNWELDED END, A36 STEEL (PRIMARY TEST)
SPECIMEN S RANGE S MINIMUM N N
A36 STEEL (PRIMARY TEST) SPECIMEN S RANGE S MINIMUM FIRST OBSERVED FAILURE N QUCK N N QUCK SPECIMEN S RANGE S HINIHUH FIRST OBSERVED FAILURE
(KSI) (KSI) (KC) (KC) CRACK
(KSI) (KSI) (KC) (KC) CRC-131 CWC-132
16 16
-6 394.7 482.8
(KC) (KC) CRC-131 CWC-132
16 16 -6 405.6
394.7 482.8 CRA-131 16 -6 538.5 555.0
CWC-133 16 -6 403.5 546.6 CWA-132 16 -6 393.3 552.5 CRC-141 20 -6 — 242.7 CWA-133 16 -6 418.4 484.2 CWC-142 20 -6 232.0 295.0 CRA-141 20 -6 — 192.2 CWC-143 20 -6 — 254.3 CWA-142 20 -6 168.1 227.5 CRC-144 20 -6 244.5 282.3 CWA-143 20 -6 — 288.2 CRC-151 24 -6 148.5 156.6 aU-144 20 -6 176.1 242.9 CWC-152 24 -6 — 137 4 CRA-151 24 -6 — 114.4 CWC-153 24 -6 111.3- 170.7 CWA-1S2 24 -6 93.7 134.9 CRC-221 12 2 — 843.7 CWA-153 24 -6 206.2 209.1 CWC-222 12 2 778.0 848.3 CRA-221 12 2 1,073.8 CWC-223 12 2 — 1,310.9 CWA-222 12 2 — 1,272.4 CRC-231 16 2 369.6 428.5 CMA-223 12 2 — 1,392.1 CWC-232 16 2 — 382.1 CRA-231 16 2 313 1 364.1 CWC-233 16 2 — 498.0 CWA-232 16 2 565.6 CRC-234 16 2 — 378 2 CWA-233 16 2 647.8 CRC-241 20 2 — 192.3 CRA-234 16 2 _ 546.1 CWC-242 20 2 — 242.8 CRA-241 20 2 -_ 247.7 CWC-243 20 2 260.0 CWA-242 20 2 __ 245.7 CWC-251 24 2 91.7 154.1 CWA-243 20 2 310.4 CRC-311 8 10 — 1,988.9 CRA-311 8 10 2,227.4 CMC-312 8 10 5,226 .8 5,698.6* CWA-312 8 10 2,542.5 2,693.1 CWC-313 8 10 — 3,409.2 CWA-313 8 10 — 3,428.1 C»C-321 12 10 763.4 821 7 CRA-321 12 10 675.6 844.5 CWC-322 12 10 — 1,004.7 CWA-322 12 10 — 945.4 CWC-323 12 10 1,220.0 CWA-323 12 10 — 1,039.3 CRC-324 12 10 — 755.2 CRA-324 12 10 — 811.6 CRC-331 16 10 — 324.8 CRA-331 16 10 — 378.8 CWC-332 16 10 334.2 378 0 CWA-332 16 10 344.1 441.4 CWC-333 16 10 — 440.8 CWA-333 16 10 — 409.7 CRC-341 20 10 — 196.4 CRA-341 20 10 — 107.7 CWC-342 20 10 — 245.4 CWA-342 20 10 — 207.4 CWC-343 20 10 220 3 CWA-343 20 10 — 195 5 CRC- 344 20 10 — 174.0 CRA-344 20 10 -- 192.6 * Crack at top of weld
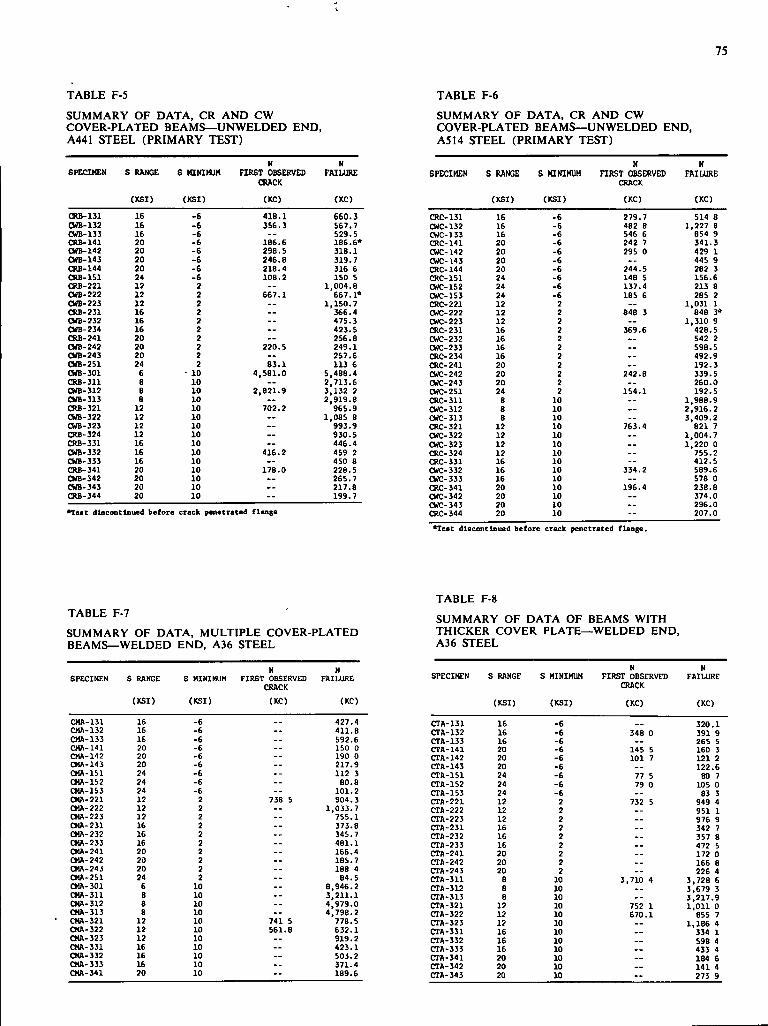
75
TABLE F-5
SUMMARY OF DATA, CR AND CW COVER-PLATED BEAMS—UNWELDED END, A441 STEEL (PRIMARY TEST)
N N SPECIHEN S RANGE S KENIMUH FIRST OBSERVED FAILURE
CRACK (KSI) (KSI) (KC) (KC)
CKB-131 16 -6 418.1 660.3 CWB-132 16 -6 3S6.3 567.7 CWB-133 16 -6 S29.S CRB-ltl 20 -6 186.6 186.6* CWB-142 20 -6 298. S 318.1 CWB-143 20 -6 246.8 319.7 CRB-144 20 -6 218.4 316 6 CRB-lSl 24 -6 10B.2 ISO 5 CRB-221 12 2 — 1,004.8 CWB-222 12 2 667.1 667.1* CWB-223 12 2 — 1,150.7 CKB-231 16 2 — 366.4 CWB-232 16 2 475.3 CWB-234 16 2 423.5 CRB-241 20 2 — 256.8 CWB-242 20 2 220. S 249.1 CWB-243 20 2 257.6 CWB-2S1 24 2 63.1 113 6 CWB-301 6 - 10 4,S81.0 5,488.4 CRB-311 8 10 — 2,713.6 CWB-312 B 10 2,821.9 3,132 2 CWB-313 B 10 2,919.8 atB-321 12 10 702.2 965.9 CWB-322 12 10 1,085 8 CWB-323 12 10 993.9 CRB- 324 12 10 -- 930.5 CRB-331 16 10 — 446.4 CWB-332 16 10 416.2 459 2 CWB-333 16 10 450 8 C31B-341 20 10 178.0 228.5 CWB-342 20 10 — 265.7 CWB-343 20 10 217.8 CRB-344 20 10 199.7
TABLE F-6
SUMMARY OF DATA, CR AND CW COVER-PLATED BEAMS—UNWELDED END, A514 STEEL (PRIMARY TEST)
*Test discontinued before crack penetrated flange
N N SPEaMEN S RANGE S HINIHUM nRST OBSERVED FAILURE
CRACK (KSI) (KSI) (KC) (KC)
CRC-131 16 -6 279.7 514 8 CWC-132 16 -6 482 B 1,227 B CWC-133 16 -6 S46 e 854 9 CRC-141 20 -6 242 7 341.3 CWC-142 20 -6 295 0 429 1 CWC-143 20 -6 445 9 CRC-144 20 -6 201.5 282 3 CRC-151 24 -6 148 5 156.6 CWC-152 24 -6 137.4 213 8 owe-153 24 -6 IBS 6 285 2 CRC-221 12 2 1,031 1 CHC-222 12 2 848 3 B4B 3* CWC-223 12 2 — 1,310 9 CRC-231 16 2 369.6 428.5 CWC-232 16 2 — S42 2 CWC-233 16 2 — 598.5 CRC-234 16 2 492.9 CRC-241 20 2 192.3 CWC-242 20 2 242.8 339.5 CWC-243 20 2 - 260.0 CWC-251 24 2 154.1 192. S CRC-311 8 10 1,988.9 CWC-312 8 10 — 2,916.2 CWC-313 8 10 3,409.2 CRC-321 12 10 763.4 821 7 CWC-322 12 10 1,004.7 CWC-323 12 10 1,220 0 CRC-324 12 10 755.2 CRC-331 16 10 - 412.5 CWC-332 16 10 334.2 589.6 CWC-333 16 10 — 578 0 CRC-341 20 10 196.4 238.8 CWC-342 20 10 — 374.0 CWC-343 20 10 296.0 CRC-344 20 10 -- 207.0 *Test discontinued before crack penetrated f lange.
TABLE F-7 SUMMARY OF DATA, MULTIPLE COVER-PLATED BEAMS—WELDED END, A36 STEEL
N N SPECIMEN S RANGE S MINIMUM FIRST OBSERVED FAILURE
CRACK (KSI) (KSI) (KC) (KC)
CMA-131 16 -6 __ 427.4 CMA-132 16 -6 411.8 CMA-133 16 -6 592.6 CMA-141 20 -6 — 150 0 CMA-142 20 -6 -- 190 0 CMA-143 20 -6 -- 217.9 CMA-151 24 -6 - 112 3 CMA-1S2 24 -6 — 80.8 CMA-153 24 -6 101.2 CMA-221 12 2 738 S 904.3 CMA-222 12 2 1,033.7 CMA-223 12 2 - 755.1 CMA-231 16 2 373.8 CMA-232 16 2 345.7 CMA-233 16 2 -- 4B1.1 CMA-241 20 2 — 166.4 CMA-242 20 2 -- 185.7 CMA-24J 20 2 -- 188 4 CMA-251 24 2 84.5 CMA-301 6 10 8,946.2 CMA-311 8 10 3,211.1 CMA-312 B 10 4,979.0 CMA-313 8 10 .- 4,798.2 a«-321 12 10 741 S 77B.5 CMA-322 12 10 561.8 632.1 CMA-323 12 10 -- 919.2 CMA-331 16 10 -- 423.1 CMA-332 16 10 — 503.2 CMA-333 16 10 371.4 CMA-341 20 10 -- 189.6
TABLE F-8 SUMMARY OF DATA OF BEAMS WITH THICKER COVER PLATE—WELDED END, A36 STEEL
N N SPECIMEN S RANGE S MINIMUM FIRST OBSERVED FAILURE
CRACK
(KSI) (KSI) (KC) (KC)
CrA-131 16 -6 320.1 CTA-132 16 -6 348 0 391 9 CTA-133 16 -6 — 2ES S CTA-141 20 -6 145 5 160 3 CTA-142 20 -6 101 7 121 2 CTA-143 20 -6 - - 122.6 CTA-151 24 -6 77 5 80 7 CrA-lS2 24 -6 79 0 105 0 CTA-153 24 -6 . - 83 3 CTA-221 12 2 732 5 949 4 CrA-222 12 2 951 1 CrA-223 12 2 976 9 CTA-231 16 2 342 7 CTA-232 16 2 - 357 8 CrA-233 16 2 — 472 5 CTA-241 20 2 - 172 0 CTA-242 20 2 — 166 8 CTA-243 20 2 - - 226 4 CTA-311 B 10 3,710 4 3,728 6 CTA-312 8 10 — 3,679 3 CTA-313 8 10 3,217.9 CTA-321 12 10 752 1 1.011 0 CTA-322 12 10 670.1 855 7 CTA-323 12 10 — 1,186 4 CTA-331 16 10 — 334 1 CTA-332 16 10 — 598 4 CTA-333 16 10 — 433 4 CTA-341 20 10 — 184 6 CrA-342 20 10 - - 141 4 CTA-343 20 10 — 273 9
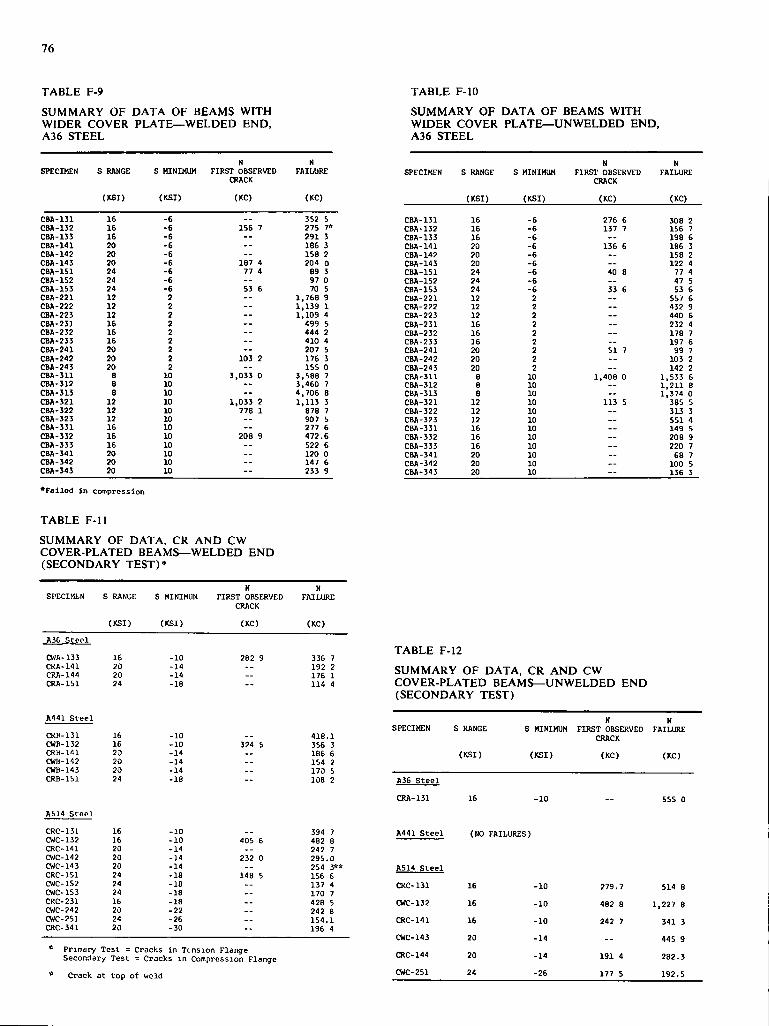
76
TABLE F-9 SUMMARY OF DATA OF BEAMS WITH WIDER COVER PLATE—WELDED END, A36 STEEL
TABLE F-10 SUMMARY OF DATA OF BEAMS WITH WIDER COVER PLATE—UNWELDED END, A36 STEEL
N N N N SPECIMEN S RANGE S MINIMUM FIRST OBSERVED FAILURE SPECIMEN S RANGE S MINIMUM FIRST OBSERVED FAILURE
CRACK CRACK
(XSI) (KC) (KC) (KSI) (KSI) (KC) (KC)
CBA-131 16 -6 352 5 CBA-131 16 -6 276 6 308 2 CBA-132 16 -6 156 7 275 7* CBA-132 16 -6 137 7 156 7 CBA-133 16 -6 - - 291 3 CBA-133 16 -6 • 198 6 CBA-111 20 -6 - - 186 3 CBA-141 20 -6 136 6 186 3 CBA-1'12 20 -6 158 2 CBA-142 20 -6 - 158 2 CBA-143 20 -6 1B7 4 204 0 CBA-143 20 -6 — 122 4 CBA-lSl 24 -6 77 4 89 3 CBA-lSl 24 -6 40 8 77 4 CBA-152 24 -6 - - 97 0 CBA-152 24 -6 — 47 5 CBA-153 24 -6 53 6 70 5 CBA-153 24 -6 33 6 53 6 CBA-221 12 2 1,768 9 CBA-221 12 2 - - 557 6 CBA-222 12 2 - - 1,139 1 CBA-222 12 2 — 432 9 CBA-223 12 2 1,109 4 CBA-223 12 2 — 440 6 CBA-231 16 2 499 5 CBA-231 16 2 — 232 4 CBA-232 16 2 - 444 2 CBA-232 16 2 — 178 7 CBA-233 16 2 • 410 4 CBA-233 16 2 197 6 CBA-211 20 2 - - 207 5 CBA-241 20 2 51 7 99 7 CBA-242 20 2 103 2 176 3 CBA-242 20 2 103 2 CBA-243 20 2 - - 155 0 CBA-243 20 2 142 2 CBA-311 8 10 3,033 0 3,588 7 CBA-311 8 10 1,108 0 1,533 6 CBA-312 8 10 - - 3,460 7 CBA-312 8 10 1,211 8 CBA-313 8 10 4,706 8 CBA-313 8 10 1,374 0 CBA-321 12 10 1 , tj; i 2 1,113 3 CBA-321 12 10 113 5 385 5 CBA-322 12 10 778 1 878 7 CBA-322 12 10 313 3 CBA-323 12 10 - - 907 5 CBA-323 12 10 — 551 4 CBA-331 16 10 — 277 6 CBA-331 16 10 — 149 S CBA-332 16 10 208 9 472 6 CBA-332 16 10 — 208 9 CBA-333 16 10 - - 522 6 CBA-333 16 10 220 7 CBA-3'H 20 10 - 120 0 CBA-341 20 10 68 7 CBA-342 20 10 - - 147 6 CBA-342 20 10 100 5 CBA-343 20 10 - - 233 9 CBA-343 20 10 - - 136 3
•Failed in compression
TABLE F-U
SUMMARY OF DATA, CR AND CW COVER-PLATED BEAMS—WELDED END (SECONDARY TEST)*
S RANGE S MINIMUM FIRST OBSERVED CRACK
N FAILURE
(KSI) (KSI) (KC) (KC) A36 Stool
CWA-133 16 -10 282 9 336 7 CRA-141 20 -14 -- 192 2 CRA-144 20 -14 -- 176 1 CRA-151 24 -18 114 4
A441 Sceol
CRF-131 16 -10 418.1 CWB-132 16 -10 324 5 356 3 CRB-IH 20 -14 186 6 CWB-142 20 -14 154 2 CWH-143 20 -14 170 5 CRB-151 24 -18 108 2
A514 Stool
CRC-131 16 -10 394 7 CWC-132 16 -10 50S 6 482 8 CRC-141 20 -14 242 7 CWC-142 20 -14 23? 0 295.0 CWC-143 20 -14 - 254 3** CRC-151 24 -18 148 5 156 6 CWC-152 24 -18 137 4 CWC-153 24 -18 _- 170 7 CRC-231 16 -18 - . 428 5 CWC-242 20 -22 -- 242 8 CWC-251 24 -26 -- 154.1 CRC-341 20 -30 -- 196 4
Primary Tost = Cracks in Tension Flange Secondary Test = Crocks in Compression Flange
TABLE F-12 SUMMARY OF DATA, CR AND CW COVER-PLATED BEAMS—UNWELDED END (SECONDARY TEST)
Crack at top of wold
SPECIMEN S RANGE
(KSI)
S MINIMUM
(KSI)
N FIRST OBSERVED
CRACK
(KC)
N
FAILURE
(KC) A36 Steel
CRA-131 16 -10 - 555 0
A441 Steel (NO FAILURES)
A514 Steel
CRC-131 16 -10 279.7 514 8 CWC-132 16 -10 482 8 1,227 8 CRC-141 16 -10 242 7 341 3 CWC-143 20 -14 -- 445 9 CRC-144 20 -14 191 4 282.3 CWC-251 24 -26 177 5 192.5
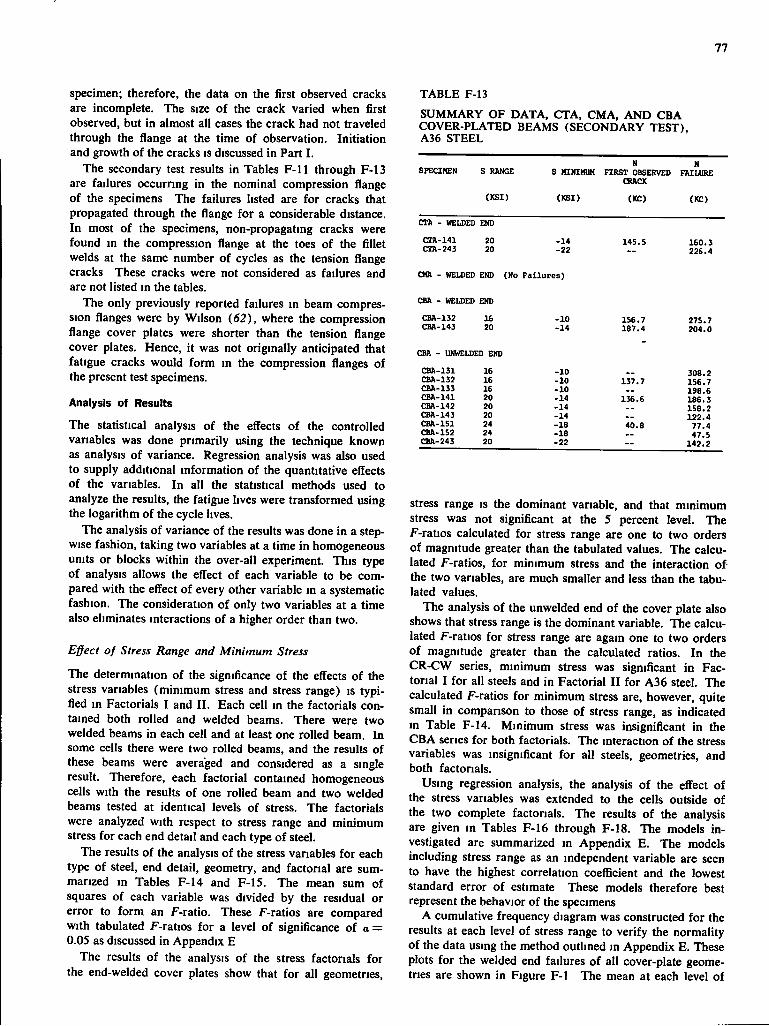
77
specimen; therefore, the data on the first observed cracks are incomplete. The size of the crack varied when first observed, but in almost all cases the crack had not traveled through the flange at the time of observation. Initiation and growth of the cracks is discussed in Part I .
The secondary test results in Tables F-11 through F-13 are failures occurring in the nominal compression flange of the specimens The failures listed are for cracks that propagated through the flange for a considerable distance. In most of the specimens, non-propagating cracks were found in the compression flange at the toes of the fillet welds at the same number of cycles as the tension flange cracks These cracks were not considered as failures and are not listed in the tables.
The only previously reported failures in beam compression flanges were by Wilson (62), where the compression flange cover plates were shorter than the tension flange cover plates. Hence, it was not originally anticipated that fatigue cracks would form in the compression flanges of the present test specimens.
Analysis of Results
The statistical analysis of the effects of the controlled variables was done primarily using the technique known as analysis of variance. Regression analysis was also used to supply additional information of the quantitative effects of the variables. In all the statistical methods used to analyze the results, the fatigue lives were transformed using the logarithm of the cycle lives.
The analysis of variance of the results was done in a stepwise fashion, taking two variables at a time in homogeneous units or blocks within the over-all experiment. This type of analysis allows the effect of each variable to be compared with the effect of every other variable in a systematic fashion. The consideration of only two variables at a time also eliminates interactions of a higher order than two.
Effect of Stress Range and Minimum Stress
The determination of the significance of the effects of the stress variables (minimum stress and stress range) is typified in Factorials I and I I . Each cell in the factorials contained both rolled and welded beams. There were two welded beams in each cell and at least one rolled beam. In some cells there were two rolled beams, and the results of these beams were averaged and considered as a single result. Therefore, each factorial contained homogeneous cells with the results of one rolled beam and two welded beams tested at identical levels of stress. The factorials were analyzed with respect to stress range and minimum stress for each end detail and each type of steel.
The results of the analysis of the stress variables for each type of steel, end detail, geometry, and factorial are summarized in Tables F-14 and F-15. The mean sum of squares of each variable was divided by the residual or error to form an F-ratio. These F-ratios are compared with tabulated F-ratios for a level of significance of a = 0.05 as discussed in Appendix E
The results of the analysis of the stress factorials for the end-welded cover plates show that for all geometries,
TABLE F-13
SUMMARY OF DATA, CTA, CMA, AND CBA COVER-PLATED BEAMS (SECONDARY TEST), A36 STEEL
SPECIMEN S RANGE N N
SPECIMEN S RANGE S MINIMUM FIRST OBSERVED FAILURE OWCK
(KSI) (KSI) (KC) (KC)
CTA - WELDED END
CTA-141 20 -14 145.5 160.3 CTA-243 20 -22 — 226.4
CMA - WELDED END (No Fa i l u r e s )
CBA - WELDED END
CBA-132 16 -10 156.7 275.7 CBA-143 20 -14 187.4 204.0
CBA - UNWELDED END
CBA-131 16 -10 308.2 CBA-132 16 -10 137.7 156.7 CBA-133 16 -10 198.6 CBA-141 20 -14 136.6 186.3 CBA-142 20 -14 158.2 CBA-143 20 -14 122.4 CBA-151 24 -18 40.8 77.4 CBA-1S2 24 -18 47.5 CBA-243 20 -22 — 142.2
Stress range is the dominant variable, and that minimum stress was not significant at the 5 percent level. The F-ratios calculated for stress range are one to two orders of magnitude greater than the tabulated values. The calculated F-ratios, for minimum stress and the interaction of the two variables, are much smaller and less than the tabulated values.
The analysis of the unwelded end of the cover plate also shows that stress range is the dominant variable. The calculated F-ratios for stress range are again one to two orders of magnitude greater than the calculated ratios. In the CR-CW series, minimum stress was significant in Factorial I for all steels and in Factorial I I for A36 steel. The calculated F-ratios for minimum stress are, however, quite small in comparison to those of stress range, as indicated in Table F-14. Minimum stress was insignificant in the CBA series for both factorials. The interaction of the stress variables was insignificant for all steels, geometries, and both factorials.
Using regression analysis, the analysis of the effect of the stress variables was extended to the cells outside of the two complete factorials. The results of the analysis are given in Tables F-16 through F-18. The models investigated are summarized in Appendix E. The models including stress range as an independent variable are seen to have the highest correlation coefficient and the lowest standard error of estimate These models therefore best represent the behavior of the specimens
A cumulative frequency diagram was constructed for the results at each level of stress range to verify the normality of the data using the method outlined in Appendix E. These plots for the welded end failures of all cover-plate geometries are shown in Figure F-1 The mean at each level of
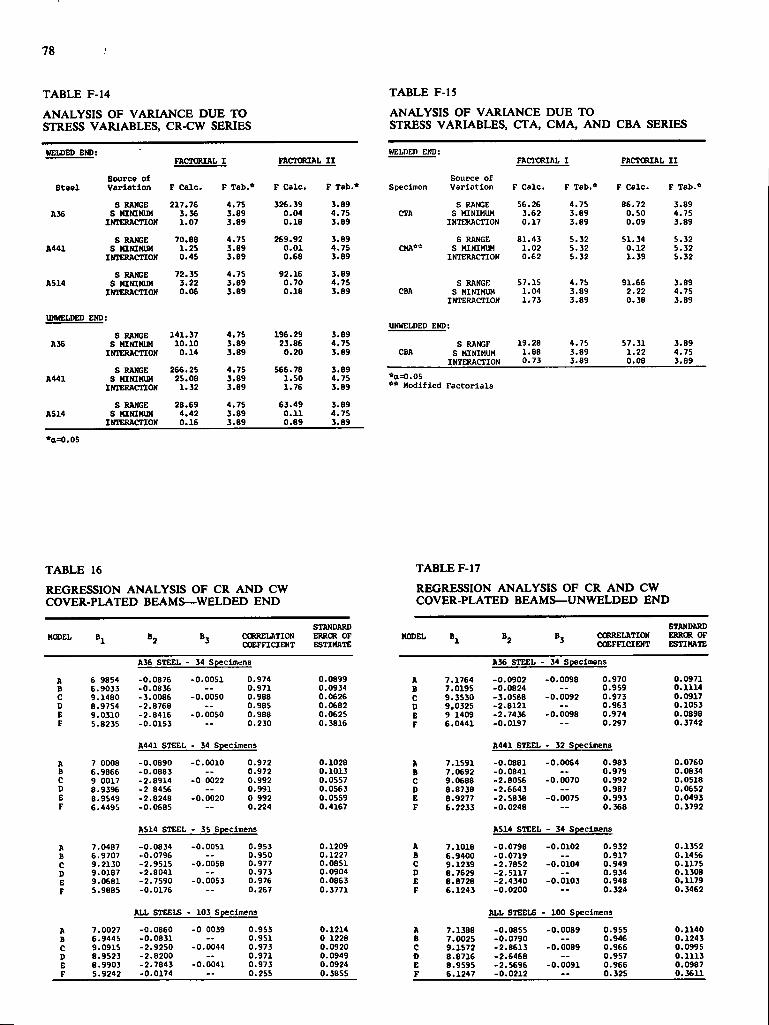
78
TABLE F-14
ANALYSIS OF VARL\NCE DUE TO STRESS VARIABLES, CR-CW SERIES
TABLE F-15
ANALYSIS OF VARL\NCE DUE TO STRESS VARL\BLES, CTA, CMA, AND CBA SERIES
WELDED END: FACTORIAL I FACTORIAL I I
WELDED END: FACTORIAL 1 FACTORIAL I I
S t e e l Source of Variation F Calc. F Tab.* F Calc. F Tab.* Specimen
Source of Variation F Calc. F Tab.* F Calc. F Tab.*
A36 S RANGE 8 HINIMUM
INTERACTION
217.76 3.36 1.07
4.75 3.89 3.89
326.39 0.04 0.18
3.89 4.75 3.89
CTA S RANGE S HINIHUM
INTERACTION
56.26 3.62 0.17
4.75 3.89 3.89
86.72 0.50 0.09
3.89 4.75 3.89
11441 S RANGE 8 MINIMUH INTERACTION
70.88 1.25 0.4S
4.75 3.89 3.89
269.92 0.01 0.68
3.89 4.75 3.89
CMA** S RANGE
S MINIMUM INl'ERACnON
81.43 1.02 0.62
5.32 5.32 5.32
51.34 0.12 1.39
5.32 5.32 5.32
AS14 8 RANGE S HINIHUM
INTERACTION
72.35 3.22 0.06
4.75 3.69 3.89
92.16 0.70 0.18
3.89 4.7S 3.89 CBA
S RANGE S MINIMUM
INTERACTION
57.15 1.04 1.73
4.75 3.89 3.89
91.66 2.22 0.38
3.89 4.75 3.89
UNWELDED END:
S RANGE A36 S HINIHUM
INTERACTION
141.37 10.10 0.14
4.75 3.89 3.89
196.29 23.86 0.20
3.89 4.75 3.89
UNWELDED END:
S RANGF CBA s MINIMUM
INTERACTION
19.28 1.88 0.73
4.75 3.89 3.89
57.31 1.22 0.08
3.89 4.75 3.89
A441 8 RANGE 8 HINIHUM
INTERACTION
266.25 25.08 1.32
4.75 3.89 3.89
566.78 l.SO 1.76
3.89 4.75 3.89
*O=0.05 ** Hodified Fa c t o r i a l s
ASM 8 RANGE 8 HINIHUM
INTERACTION
28.69 4.42 0.16
4.75 3.89 3.89
63.49 0.11 0.89
3.89 4.75 3.89
•o=0.05
TABLE 16 REGRESSION ANALYSIS OF CR AND CW COVER-PLATED BEAMS—WELDED END
TABLE F-17 REGRESSION ANALYSIS OF CR AND CW COVER-PLATED BEAMS—UNWELDED END
MODEL CORRELATION COEFFICIENT
A36 STEEL - 34 Specimens
STANDARD ERROR OF ESTIMATE
STANDARD CORRELATION ERROR OF COEFFICIENT ESTIMATE
A36 STEEL - 34 Specimens
A 6 9854 -0.0876 -0.0051 0.974 0.0899 A 7.1764 -0.0902 -0.0098 0.970 0.0971 B 6.9033 -0.0836 0.971 0.0934 B 7.0195 -0.0824 — 0.959 0.1114 C 9.1480 -3.0086 -0.0050 0.988 0.0626 C 9.3530 -3.0568 -0.0092 0.973 0.0917 D 8.9754 -2.8768 0.985 0.0682 D 9.0325 -2.8121 0.963 0.10S3 E 9.0310 -2.8416 -0.0050 0.988 0.0625 E 9 1409 -2.7436 -0.0OS8 0.974 0.0898 F 5.8235 -0.0153 -- 0.230 0.3816 F 6.0441 -0.0197 — 0.297 0.3742
A441 STEEL - 34 Specimens A441 STEEL - 32 Spe d mens
A 7 0008 -0.0890 -C.OOlO 0.972 0.1028 A 7.1591 -0.0881 -0.0064 0.983 0.0760 B 6.9866 -0.0883 -- 0.972 0.1013 B 7.0692 -0.0841 0.979 0.0834 C 9 0017 -2.8914 -0 0022 0.992 0.0557 C 9.0688 -2.8056 -0.0070 0.992 0.0518 D 8.9396 -2 8456 — 0.991 0.0S63 D 8.8738 -2.6643 0.987 0.0652 E 8.9549 -2.8248 -0.0020 0 992 0.0559 E B.9277 -2.5838 -0.0075 0.993 0.0493 F 6.4495 -0.0685 — 0.224 0.4167 F 6.2233 -0.0248 — 0.368 0.3792
A514 STEEL - 35 Specimens ASM STEEL - 34 Specimens
A 7.0487 -0.0834 -0.0051 0.953 0.1209 A 7.1018 -0.0798 -0.0102 0.932 0.1352 B 6.9707 -0.0796 — 0.950 0.1227 B 6.9400 -0.0719 — 0.917 0.1456 C 9.2130 -2.9515 -0.0058 0.977 0.0851 C 9.1239 -2.7852 -0.0104 0.949 0.1175 D 9.0187 -2.8041 0.973 0.0904 D e.7629 -2.5117 — 0.934 0.1308 E 9.0681 -2.7590 -0.0053 0.976 0.0863 E e.8728 -2.4340 -0.0103 0.948 0.1179 F 5.9885 -0.0176 -- 0.267 0.3771 F 6.1243 -0.0200 — 0.324 0.3462
ALL STEELS - 103 Specimens ALL STEELS - 100 Specimens
A 7.0027 -0.0860 -0 0039 0.9S3 0.1214 A 7.1388 -0.0855 -0.0089 0.955 0.1140 B 6.9445 -0.0831 0.951 0 1228 B 7.0025 -0.0790 — 0.946 0.1243 C 9.0915 -2.9250 -0.0044 0.973 0.0920 C 9.1572 -2.8613 -0.0089 0.966 0.0995 D 8.9523 -2.8200 0.971 0.0949 0 8.8716 -2.6468 — 0.9S7 0.1113 E 8.9903 -2.7843 -0.0041 0.973 0.0924 E 8.9595 -2.5696 -0.0091 0.966 0.0987 F 5.9242 -0.0174 — 0.255 0.3855 F 6.1247 -0.0212 -- 0.325 0.3611

79
stress range was estimated from regression Model D A hne was constructed through this predicted mean with a slope equal to the standard error of estimate. I t can be seen that the regression equation predicts the distribution. The standard error of estimate also predicts the slope of the data. Hence, the transformation of life to the logarithm of life results in a normal distribution as assumed in the variance and the regression analyses, and the standard error of estimate approximates the standard deviation.
The regression analysis also confirmed that minimum stress is a minor variable. The difference in the correlation coefficient and standard error of estimate of the models including only stress range and minimum stress or maximum stress is negligible. The coefficient of minimum stress IS also very small compared to the coefficient for stress range, as illustrated by comparing these coefficients in Tables F-16, F-17, and F-18. Figures 17 and 18 also show the small etiect of minimum and maximum stress. It is apparent that the variation due to minimum stress is not significant.
Effect of Beam Type
The effect of beam was determined in the CR-CW series. The variance due to beam type was determined by blocking each factorial with respect to stress range. The cells within the factorial consisted of either rolled or welded beams subjected to the same stress range. The results of replicated specimens were averaged and treated as a single result.
The analysis of the data is summarized in Table F-19. The results show that beam type was significant for ASM steel. However, stress range was the dominant variable, as
TABLE F-18
REGRESSION ANALYSIS OF CTA, CMA, AND CBA COVER-PLATED BEAMS
A B C D E F
MODEL STANDARD MODEL 83 CORRELATION ERROR OF COEFFICIENT ESTIMATE
CTA - WELDED END - 30 Specimens A 7.0896 -0.0927 0.0076 0.987 0.1013 B 7.2091 -0.09B7 0.974 0.1087 C 9.3496 -3.1621 0-0078 0.987 0.07B4 0 9.6182 -3.3684 0.982 0.0895 E 9.5J64 -3.4213 0.0076 0.987 0.079S F 5.7037 -0.0059 -- 0.073 0.4754
CMA - WELDED END - 30 Specimens 7.3035 -0.1020 -0.0025 0.970 0.1315 7.2634 -0.099B — 0.970 0.129B 9.6433 -3.3677 -0.0028 0.988 0.0841 9.5468 -3.2920 — 0.988 0.0839 9.S858 -3.2763 -0.0031 0.988 0.0839 6.0150 -0.0192 — 0.185 0.5255
CBA - WEU)ED END - 30 Specimens 7^2937 7.2971 9.7B20 9.8043 9.8024 5.8700
-0.1028 -0.1030 -3.4920 -3.5091 -3.5103 -0.0136
-0.0002
-0.0006
0.0002
0.974 0.974 0.981 0.981 0.981 0.161
CBA - UNWELDED END - 30 Specimens
ALL WELDED END COVER PLATES - 193 Specimens 7.1150 -0.0925 -0.0012 0.958 7.0970 -0.0916 — 0.958 9.3362 -3.1286 -0.0014 0.974 9.2916 -3.0946 — 0.974 9.3059 -3.0841 -0.0014 0.974 5.8981 -0.0155 -- 0.198
0.1151 0.1130 0.0984 0.0967 0.0984 0.4908
6.7359 -0.0846 -0.005B 0.958 0.1154 6.6440 -0.0780 — 0.954 0.1183 8.7938 -2.8816 -0.0056 0.968 0.1008 8.6030 -2.7350 0.964 0.1041 8.6659 -2.6942 -0.0058 0.968 0.1004 5.6477 -0.0164 — 0.244 0.3822
0.1267 0.1265 0.1006 0.1006 0.1006 0.4343
Strau
PERCCNT SURVIVAL 60 FAILURE
OS I 9 6
CYCLES TO FAILURE ( I0«)
Figure F-I. Cumulative frequency diagram—all beams with end-welded cover plates.
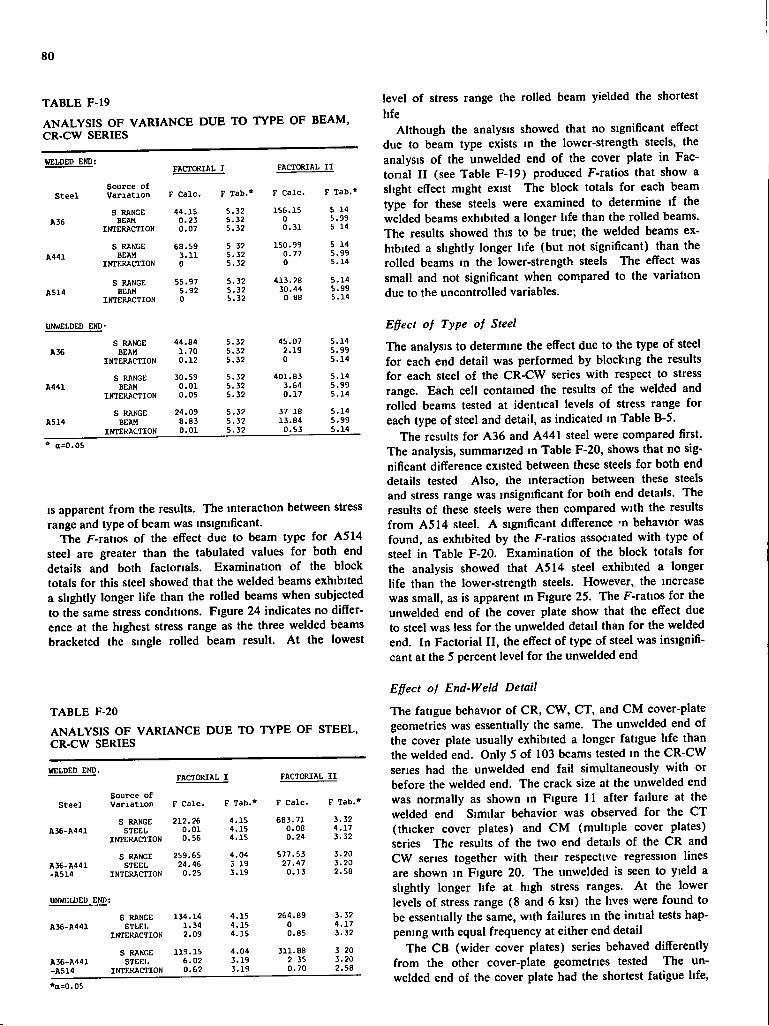
80
TABLE F-19 ANALYSIS OF VARIANCE DUE TO TYPE OF BEAM, CR-CW SERIES
WELDED END:
Ste e l
A 36
A441
A514
UNWELDED END-
A 36
A441
A514
FACTORIAL I FACTORIAL I I
Source of Variation F Calc. F Tab.* F Calc. F Tab.*
S RANGE 44.15 5.32 156.15 5 14 BEAM 0.23 5.32 0 5.99
INTERACTION 0.07 5.32 0.31 5 14
S RANGE 68.59 5 32 150.99 5 14 BEAM 3.11 5.32 0.77 5.99
INTERACTION 0 5.32 0 5.14
S RANGE 55.97 5.32 413.28 5.14 BEAM 5.92 5.32 30.44 5.99
INTERACTION 0 5.32 0 88 5.14
)•
S RANGE 44.84 5.32 45.07 5.14 BEAM 1.70 5.32 2.19 5.99
INTERACTION 0.12 5.32 0 5.14
S RANGE 30.59 5.32 401.83 5.14 BEAM 0.01 5.32 3.64 5.99
INTERACTION 0.05 5.32 0.17 5.14
S RANGE 24.09 5.32 37 18 5.14 BEAM 8.83 5.32 13.84 5.99
INTERACTION 0.01 5.32 0.53 5.14 * a=0.05
IS apparent from the results. The interaction between stress range and type of beam was insignificant.
The F-ratios of the effect due to beam type for ASM steel are greater than the tabulated values for both end details and both factorials. Examination of the block totals for this steel showed that the welded beams exhibited a slightly longer life than the rolled beams when subjected to the same stress conditions. Figure 24 indicates no difference at the highest stress range as the three welded beams bracketed the single rolled beam result. At the lowest
level of stress range the rolled beam yielded the shortest life
Although the analysis showed that no significant effect due to beam type exists in the lower-strength steels, the analysis of the unwelded end of the cover plate in Factorial I I (see Table F-19) produced F-ratios that show a slight effect might exist The block totals for each beam type for these steels were examined to determine if the welded beams exhibited a longer life than the rolled beams. The results showed this to be true; the welded beams exhibited a slightly longer life (but not significant) than the rolled beams in the lower-strength steels The effect was small and not significant when compared to the variation due to the uncontrolled variables.
Effect of Type of Steel
The analysis to determine the effect due to the type of steel for each end detail was performed by blocking the results for each steel of the CR-CW series with respect to stress range. Each cell contained the results of the welded and rolled beams tested at identical levels of stress range for each type of steel and detail, as indicated in Table B-5.
The results for A36 and A441 steel were compared first. The analysis, summarized in Table F-20, shows that no significant difference existed between these steels for both end details tested Also, the interaction between these steels and stress range was insignificant for both end details. The results of these steels were then compared with the results from ASM steel. A significant difference -n behavior was found, as exhibited by the F-ratios associated with type of steel in Table F-20. Examination of the block totals for the analysis showed that ASM steel exhibited a longer life than the lower-strength steels. However, the increase was small, as is apparent in Figure 2S. The F-ratios for the unwelded end of the cover plate show that the eflfect due to steel was less for the unwelded detail than for the welded end. In Factorial I I , the effect of type of steel was insignificant at the S percent level for the unwelded end
TABLE F-20 ANALYSIS OF VARIANCE DUE TO TYPE OF STEEL, CR-CW SERIES
WELDED END. FACTORIAL I FACTORIAL I I
S teel Source of Variation F Calc. F Tab.* F Calc. F Tab.*
A36-A441 S RANGE STEEL
INTERACTION
212.26 0.01 0.56
4.15 4.15 4.15
683.71 0.08 0.24
3.32 4.17 3.32
A36-A441 -A514
S RANGE STEEL
INTERACTION
259.65 24.46 0.25
4.04 3 19 3.19
577.53 27.47 0.13
3.20 3.20 2.58
UNWELDED END
A36-A441 S RANGE STLEL
INTERACTION
134.14 1.34 2.09
4.15 4.15 4.15
264.89 0 0.85
3.32 4.17 3.32
A36-A441 -A 514
S RANGE STEEL
INTERACTION
119.15 6.02 0.62
4.04 3.19 3.19
311.88 2 35 0.70
3 20 3.20 2.58
•a=0.05
Effect of End-Weld Detail
The fatigue behavior of CR, CW, CT, and CM cover-plate geometries was essentially the same. The unwelded end of the cover plate usually exhibited a longer fatigue life than the welded end. Only S of 103 beams tested in the CR-CW series had the unwelded end fail simultaneously with or before the welded end. The crack size at the unwelded end was normally as shown in Figure 11 after failure at the welded end Similar behavior was observed for the CT (thicker cover plates) and CM (multiple cover plates) series The results of the two end details of the CR and CW series together with their respective regression lines are shown in Figure 20. The unwelded is seen to yield a slightly longer life at high stress ranges. At the lower levels of stress range (8 and 6 ksi) the lives were found to be essentially the same, with failures in the initial tests happening with equal frequency at either end detail
The CB (wider cover plates) series behaved differently from the other cover-plate geometries tested The unwelded end of the cover plate had the shortest fatigue life,
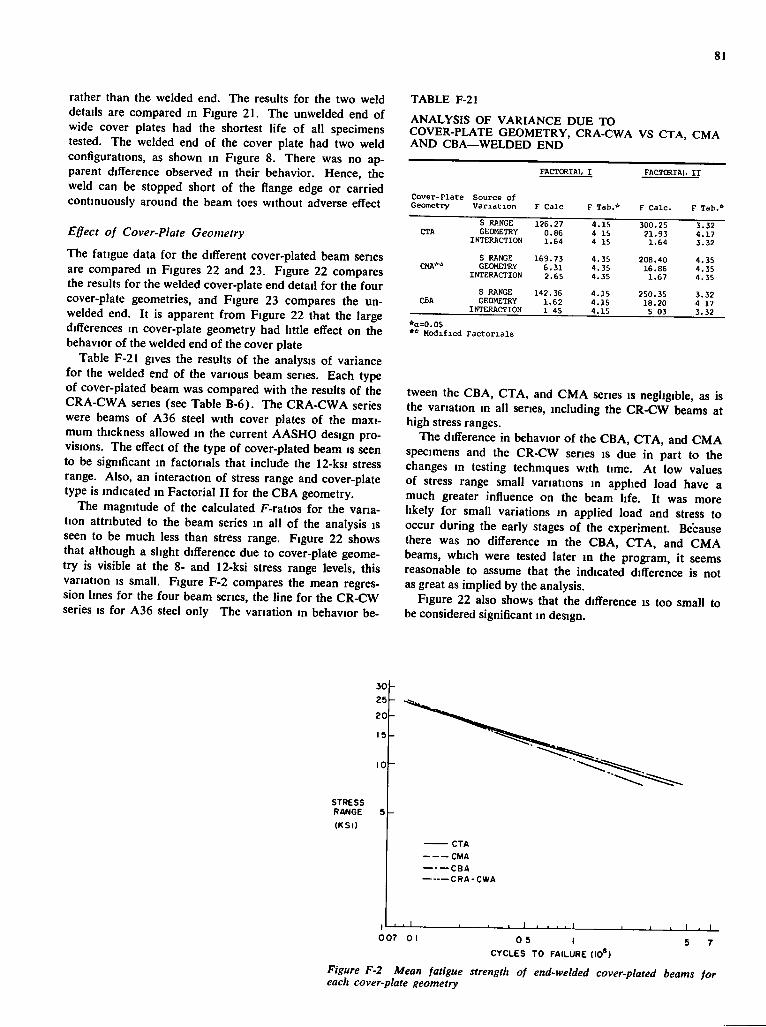
81
rather than the welded end. The results for the two weld details are compared in Figure 21. The unwelded end of wide cover plates had the shortest life of all specimens tested. The welded end of the cover plate had two weld configurations, as shown in Figure 8. There was no apparent difference observed in their behavior. Hence, the weld can be stopped short of the flange edge or carried continuously around the beam toes without adverse effect
Effect of Cover-Plate Geometry
The fatigue data for the different cover-plated beam series are compared in Figures 22 and 23. Figure 22 compares the results for the welded cover-plate end detail for the four cover-plate geometries, and Figure 23 compares the unwelded end. It is apparent from Figure 22 that the large differences in cover-plate geometry had little effect on the behavior of the welded end of the cover plate
Table F-21 gives the results of the analysis of variance for the welded end of the various beam series. Each type of cover-plated beam was compared with the results of the CRA-CWA series (see Table B-6). The CRA-CWA series were beams of A36 steel with cover plates of the maximum thickness allowed in the current AASHO design provisions. The effect of the type of cover-plated beam is seen to be significant in factorials that include the 12-ksi stress range. Also, an interaction of stress range and cover-plate type is indicated in Factorial I I for the CBA geometry.
The magnitude of the calculated F-ratios for the variation attributed to the beam series in all of the analysis is seen to be much less than stress range. Figure 22 shows that although a slight difference due to cover-plate geometry is visible at the 8- and 12-ksi stress range levels, this variation is small. Figure F-2 compares the mean regression lines for the four beam series, the line for the CR-CW series is for A36 steel only The variation in behavior be-
TABLE F-21
ANALYSIS OF VARIANCE DUE TO COVER-PLATE GEOMETRY, CRA-CWA VS CTA, CMA AND CBA—WELDED END
FACTORIAL I FACTORIAL I I
Cover-Plate Geometry
Source of Variation F Calc F Tab.* F c a l c . F Tab.*
CTA S RANGE GEOMETRY
INTERACTION 126.27
0.86 1.64
4.15 4 15 4 15
300.25 21.93 1.64
3.32 4.17 3.32
CMA> * S RANGE GEOMETRY
INTERACTION 169.73
6.31 2.65
4.35 4.35 4.35
208.40 16.86 1.67
4.35 4.35 4.35
CBA S RANGE GEOMETRY
INTERACTION 142.36
1.62 1 45
4.15 4.15 4.15
250.35 18.20 5 03
3.32 4 17 3.32
*a=0.05 ** Modified Fac t o r i a l s
tween the CBA, CTA, and CMA series is negligible, as is the variation in all series, including the CR-CW beams at high stress ranges.
The difference in behavior of the CBA, CTA, and CMA specimens and the CR-CW series is due in part to the changes in testing techniques with time. At low values of stress range small variations in applied load have a much greater influence on the beam life. It was more likely for small variations in applied load and stress to occur during the early stages of the experiment. Because there was no difference in the CBA, CTA, and CMA beams, which were tested later in the program, it seems reasonable to assume that the indicated difference is not as great as implied by the analysis.
Figure 22 also shows that the difference is too small to be considered significant in design.
3 0
25
201
IS
10
STRESS RANGE (KSI)
CTA CMA CBA CRA-CWA
_L 0 0 7 0 ! 0 5 I 5 7
CYCLES TO FAILURE (10*)
Figure F-2 Mean fatigue strength of end-welded cover-plated beams for each cover-plate geometry
82
No statistical analysis of the unwelded end geometry was done because many unwelded ends of the CT and CM were not retested to failure. The test data shown in Figure 23 compare the results of the failures that were available for these specimens These failures are seen to conform with the results of the CR-CW series. The beams that were not tested to failure had cracks of about the same size as those found In the CR-CW series after the initial tests. Hence, it was concluded that further testing of these beams would yield results directly comparable to the CR-CW series. The results of the unwelded end were of secondary importance because the lower boundary of cover-plate behavior was provided by the transversely welded end of the cover plate
The unwelded end of the CBA beams yielded substantially shorter lives than did any of the other cover plates tested The lives of these specimens were also shorter than the welded end results of all geometries tested. Figure 23 shows that the unwelded end of the wide cover plates yielded a life that differed significantly from those of the other beam series.
The shorter life of the unwelded end of the CB beams was due to the elimination of stage 1 crack growth (growth through the flange thickness) for this detail. Visual observations and a stress analysis of crack growth has shown that the first stage of growth is much slower than subsequent stages of growth and consequently accounts for most of the specimens' life. Elimination of the slow-growth stage 1 in the CB unwelded end caused this specimen to yield a shorter fatigue life The growth at the welded end of the CB series exhibited the same patterns that were observed in the other series and consequently they yielded a comparable fatigue life.
Interpretation of the Results
Crack Growth In all of the end-weld details tested, it was observed that most of the fatigue life of specimens with cover plates narrower than the flange was consumed in initiating and propagating the crack through the thickness of the flange. The number of cycles corresponding to the first stage of crack growth (see Figs. 13 and 16) was observed to be nearly equal for both end details This was also apparent in Figure 59 where the number of cycles to the first observed crack are compared for the two end details. The large amount of the total life consumed in the initial stage of crack growth has been reported by Harrison (26) for small fillet-welded specimens, and by Fisher and Viest (12) for full-size beams with welded cover plates. Because the number of cycles sustained during the first stage of crack growth for the two end details was the same, the difference in the life of the details must be due to differences in the later stages of crack growth.
It IS apparent from Figures 13 and 16 that a greater part of the flange area was cracked at the welded end than at the unwelded end of the cover plate when the transition from the first stage to the second stage of crack growth occurred. Hence, it is logical for the remaining life of the welded end to be less than the unwelded end. The crack at the welded end not only must grow through less flange area to cause failure, but it is also still growing in the area
adjacent to the weld, an area of high stress concentration and residual tensile stress. The crack at the unwelded end grows away from the stress concentration, and also has a longer distance to propagate before failure
Influence of Residual Stress
The major part of life for both of the end details takes place with the crack located adjacent to the weld in an area of high stress concentration and local residual tensile stress due to the heat input during the welding of the cover plate. Examination of the tested beams showed that most of the beams had observable cracks in the compression flange at the toe of the fillet weld. I t appears that crack propagation in this area was not affected by the nominal minimum stress to which the beam was subjected, even when this stress was compression I t is probable that the residual stresses elevate the actual minimum stress in this area so that the resulting stress range is still tension in the vicinity of the cover-plate welds.
The effect of residual stresses on the fatigue behavior of welded structures has been noted by other investigators. Braithwaite and Gurney (5) have found that compression residual stresses in welded cross-girder connections were able to effectively stop the propagation of large cracks. Gurney has also shown that artificially inducing local compressive residual stresses greatly extends the life of a fillet-welded specimen (18, 20). However, stress relieving a fillet-welded specimen produced almost negligible increases in fatigue lives when the specimens were subjected to an alternating tensile stress. An increase in life was noted when the nominal stress was compressive (18, 21)
Residual stresses seem to be beneficial when they produce stresses that prevent or decrease the tensile stress range They are less important when they only transform the level of minimum tensile stress. The relationship between the applied nominal stress range and the growth of the crack seems to be unaffected by the value of the minimum stress if tension residual stresses are present. This result seems reasonable, if the tension residual stresses are conidered to hold the crack open when the applied nominal stress IS zero
Minimum stress would have an effect only when it caused the crack to close. Values of minimum stress that permitted the crack to close would decrease the effective stress range that contributes to the crack growth. Conversely, minimum stresses that do not close the crack would have no effect, and the effective stress range would equal the ful l nominal applied stress range.
The values of applied stress were not large enough to close the crack, because minimum stress was not a significant parameter in the lives of the welded end of the cover plate. This was also confirmed by the formation of visible cracks in the compression flange at both end details.
Because it was observed that most of the life of the unwelded end of the cover plate took place adjacent to the weld, the effect of minimum stress would be significant only during the later stages of growth. This was only a small portion of the specimen's total life. The analysis of the results verified this, for although minimum stress was found to be significant in the behavior of the unwelded
83
end of the cover plate, stress range was the dominant parameter.
The analysis of the results of the unwelded end of the cover plate showed that the welded beams exhibited a longer life than the rolled beams. Measurements of the residual stresses in the flanges of beams without cover plates were made using the method of sectioning. The resulting residual stress patterns are shown in Figures D-1 through D-7. The rolled beam was essentially stress relieved, as shown in Figures D-6 and D-7, because it was straightened by rotarizing at the mill. The welded beam was not straightened and exhibited the expected pronounced residual stress pattern
The location of maximum compressive residual stress was found to coincide with the longitudinal cover-plate weld. It IS believed that the local residual stress caused-by the longitudinal cover-plate fillet weld was confined to a small area Once the crack growth during stage 1 was completed, the crack at the unwelded end of the cover plate existed in a region of nominal compressive residual stress in the welded beam. This may have decreased the effective stress range, and consequently reduced the crack growth rate which extended the life of the welded beam.
The magnitude of residual stresses is also important when evaluating the behavior of both end details. More compression flange failures were found in the ASM steel beams than in the other steels. Also, failures occurred at lower values of minimum stress in this steel than in the lower-strength A36 and A441 steels. It appears logical for this to occur, because the residual tensile stresses present in this steel were larger, due to its higher yield strength. This would permit a tensile stress range even at high levels of nominal compressive stress
The differences in the behavior of the two end details with respect to the applied stresses can be logically thought of as due to differences in the crack growth geometry with respect to the weld during the different stages of crack growth. The crack at the welded end of the cover plate grows in a region of high-tension residual stress for almost all its life. The effect of minimum stress would therefore be negligible. The crack at the unwelded end of the cover plate, although growing for the major part of its life in an area of high residual stress, spends a longer portion of its life in an area nearly free of residual tensile stresses, or in an area of compressive residual stress. This decreases the effective stress range and increases the life. Minimum stress would therefore have an effect in this portion of life. However, because this is only a small portion of the total life, minimum stress would not be a highly significant variable, as was observed in this study.
Compression Flange Cracks
Cover-plated beams that failed with compression cracks equal to or larger in length than the tension flange cracks are plotted in Figure F-3. They are compared with the mean regression line and the limits of dispersion for the tension flange failures. It is apparent that the crack growth rates were the same
An examination of the data also indicates that most of these failures occurred when the compression flange was
subjected to tension during part of the stress cycle; that is, when the beam was subjected to partial reversal of loading.
As was noted earlier, cracks occurred almost simultaneously at the ends of all cover plates. However, when these cracks grew out of the residual tension area they usually grew at a slower rate and failure normally occurred in the tension flange. When the stress cycle was partial reversal, crack growth continued as shown m Figure F-3.
A few of the details subjected only to compression stresses had extensive crack growth. Sometimes a large portion of the compression flange could be cracked and the beam would still sustain load until the tension flange failed. I t IS apparent that crack growth was usually not as critical for the compression flange unless part of the stress cycle was tension. Stability of the compression flange should also be considered, as out-of-plane deformation could accelerate crack growth.
STRESS ANALYSIS OF CRACK PROPAGATION
Analysis of First Stage of Crack Growth—Cover Plates Narrower than Flange
The first stage of initiation and growth of the crack required the largest number of cycles, and dominated the total cycle life.
An examination of fillet welds by Signes et al. (5'^) indicated that fatigue cracks at the toe of fillet welds start from small cracks at the weld toe. These macro-cracks existed before load was applied to the joint. Hence, the life of a fillet-welded cover-plated beam is determined by the propagation of these cracks to a crack size that causes failure of the specimen, as noted in the section on "Stress Analysis of Crack Propagation" in Part I .
To evaluate the first stage of the crack growth pattern using fracture mechanics concepts, the crack size at different numbers of cycles was determined by measuring the rust stains on the fatigue fracture surface. These rust stains represented the crack size in the specimen when failure had occurred at one end. The measured crack sizes and other properties of the fractures are summarized in Table F-22. Al l data used in the analysis were from the CR-CW series of specimens.
Little information was available on the crack growth of the welded end because most of the initial failures occurred at that end. The first stage of the crack growth pattern was determined at the unwelded end where more information was available.
The ratio of o to 6 in Table F-22 is nearly constant and about equal to % for all the unwelded specimens measured. It appears that this may be characteristic of cracks initiating from the ends of fillet welds, although the data are insufficient to draw a general conclusion.
Crack growth was evaluated by using the equations developed in Part I . Eq. 10, which expresses the relationship between the number of cycles, AN, for a crack to grow from size C{ to failure, is
(10)
in which a = /j/2-1
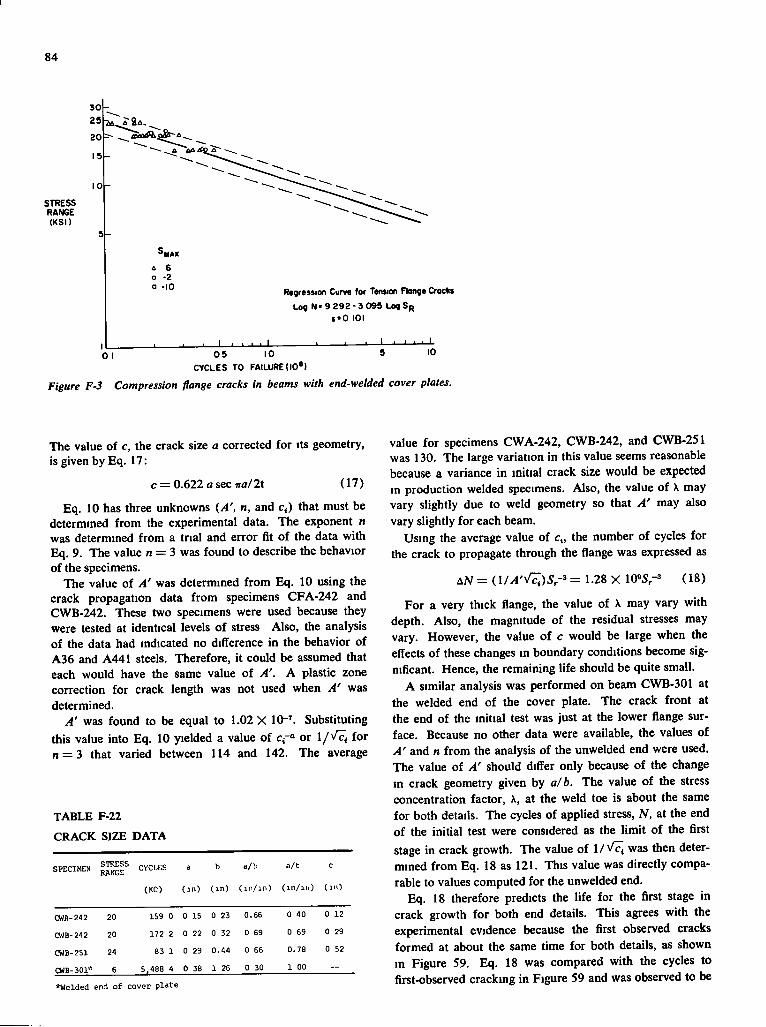
84
30 29 20
10
STRESS RANGE (KSI)
Si-
& 6 o -2 o -10 Regression Curve for Tension Flange Crocks
Log N - 9 2 9 2 - 3 0 9 5 LogSp S'O 101
0 I 0 5 10 CYCLES TO FAILURE (I0»)
I I I • • I 9 10
Figure F-3 Compression flange cracks in beams with end-welded cover plates.
The value of c, the crack size a corrected for its geometry, is given by Eq. 17:
c=0.622asecira/2t (17)
Eq. 10 has three unknowns {A', n, and c<) that must be determined from the experimental data. The exponent n was determined from a trial and error fit of the data with Eq. 9. The value n = 3 was found to describe the behavior of the specimens.
The value of A' was determined from Eq. 10 using the crack propagation data from specimens CFA-242 and CWB-242. These two specimens were used because they were tested at identical levels of stress Also, the analysis of the data had indicated no difference in the behavior of A36 and A441 steels. Therefore, it could be assumed that each would have the same value of A'. A plastic zone correction for crack length was not used when A' was determined.
A' was found to be equal to 1.02 X 10"'. Substituting this value into Eq. 10 yielded a value of c -" or l / V q for n = 3 that varied between 114 and 142. The average
TABLE F-22
CRACK SIZE DATA
SPECIMEN STRESS RANGE CYCLES
(KC)
a
( i n )
b
( i n )
a/b
(iM/in)
a/C
( i n / i i . )
c
(iri)
CWA-242 20 159 0 0 15 0 23 0.66 0 40 0 12
CWB-2'12 20 172 2 0 22 0 32 0 69 0 69 0 29
CWB-251 24 83 1 0 29 0.44 0 66 0.78 0 52
CWB-301* 6 5,488 4 0 38 1 26 0 30 1 00 -*Welded end of cover plate
value for specimens CWA-242, CWB-242, and CWB-251 was 130. The large variation in this value seems reasonable because a variance in initial crack size would be expected in production welded specimens. Also, the value of X may vary slightly due to weld geometry so that A' may also vary slightly for each beam.
Using the average value of c„ the number of cycles for the crack to propagate through the flange was expressed as
AN = (,l/A'V7i)Sr-^ = 1.28 X 10»S,-3 (18)
For a very thick flange, the value of X may vary with depth. Also, the magnitude of the residual stresses may vary. However, the value of c would be large when the effects of these changes in boundary conditions become significant. Hence, the remaining life should be quite small.
A similar analysis was performed on beam CWB-301 at the welded end of the cover plate. The crack front at the end of the initial test was just at the lower flange surface. Because no other data were available, the values of A' and n from the analysis of the unwelded end were used. The value of A' should differ only because of the change in crack geometry given by a/b. The value of the stress concentration factor, X, at the weld toe is about the same for both details. The cycles of applied stress, N, at the end of the initial test were considered as the limit of the first stage in crack growth. The value of l / \ ^ was then determined from Eq. 18 as 121. This value was directly comparable to values computed for the unwelded end.
Eq. 18 therefore predicts the life for the first stage in crack growth for both end details. This agrees with the experimental evidence because the first observed cracks formed at about the same time for both details, as shown m Figure 59. Eq. 18 was compared with the cycles to first-observed cracking in Figure 59 and was observed to be
85
m good agreement. I t is apparent that this analysis also confirms the regression analysis and the empirical log-log model that provided the best fit to the test data.
Analysis of Second and Third Stages of Oracle Growth—Cover Plates Narrower than Flange
The interpretation of the other stages of crack propagation was done qualitatively using the principles of fracture mechanics. No source of growth rates was available, but the following observations can be made concerning these stages.
Almost all the growth of the crack at the welded end of the cover plate was i n a region adjacent to the weld. Hence, the value of X would remain unchanged. In addition, the high residual tensile stresses present would make the ful l stress range effective. The crack size at the transition from stage 1 to 2 would change, as shown i n Figure 11. The crack size a at the onset of stage 2 would equal b from stage 1. This is a much larger value than the initial crack size for stage 1. The increment of life for stage 2 would consequently be small because the relationship defining its life would be in the form of Eq. 11 where the remaining life i s inversely proportional to the initial crack size. It should also be noted that when the crack penetrated the flange, the beam stiffness was decreased nearly enough to terminate the test.
At the unwelded end of the cover plate, the crack grows out of the area of high tensile residual stress during the second stage of crack growth. A compressive minimum stress would therefore have an effect because the effective stress range is decreased with a corresponding decrease i n the crack growth rate In addition, the stress concentration due to the longitudinal fillet weld decreases as the crack propagates away from the weld toe. Although the additional life consumed during the second and third stages is small, it was greater than the life at the welded end because the initial crack size was much smaller and the growth rate was less. As the crack reaches the third stage of growth, Its length doubles. Consequently, the third stage of growth is rapid, and accounts for very little of the total life a t the unwelded end of the beam. Visual observations confirmed this fact.
Analysis of First Stage of Cracic Growth—Unwelded End of Cover Plates Wider than Flange
The short life exhibited by the unwelded end of the CBA series (cover plate wider than the flange) was evaluated using fracture mechanics concepts. The unwelded end of the CBA series exhibited a crack growth pattern that was different from the other cover-plated beams tested. The crack grew from the toe of the longitudinal weld connecting the cover plate to the beam's flange along a single crack front, as shown i n Figure 15. The crack i n a l l the other cover-plated beams initially grew through the flange thickness (Figs. 13 and 16). This first stage was observed to consume most of these specimens' lives. The life of the unwelded end of the wide cover-plated beams was estimated by correcting Eq 18 for the differences in growth patterns of the specimens.
Figure 55 shows the variation of the geometric correc
tion factor (f{a)y for an edge crack and a semi-elliptic (a/6 = % ) surface crack in a uniform sheet with a stress (T applied normal to the crack plane. The change in the geometric correction factor Uio)V with crack growth is much more rapid with the edge crack than with the semi-elliptical surface crack. Its initial value is also about twice as large. The edge crack is therefore a much more severe condition than the semi-elliptical surface crack, and consequently the life of the specimen suggested by Eq. 10 would be less.
The higher value of the geometric correction factor {f{a)y for the edge crack is due to eccentricity caused by the crack. The crack growth at the unwelded end of the CBA beam series was similar to the edge crack. The value of C( for an edge crack provides a means for estimating the life of the wide cover-plated beams without end welds. When Eq. 18 is modified to account for this behavior I t yields
-X 1.28 X 1085,-3 = 9.04 X If^Sr'^
(21)
Eq. 21 was compared wtih the mean regression line for the unwelded end of the CBA beams with wide cover plates in Figure 58. The decrease in fatigue strength predicted by Eq. 21 is in good agreement with the experimental results.
The more severe notch condition of a crack at the edge of a flange was also observed in the plain welded beams. Beams that failed from cracks starting at the flange tip yielded the shortest lives.
The transverse end weld relieved the load carried by the longitudinal weld and failure occurred at toe of the end weld. Small cracks that did not propagate were observed at the toe of the longitudinal weld at the welded end. This small growth probably occurred after the crack at the transverse weld was large, causing the load carried by the longitudinal weld to increase.
Evaluation of Crack Growth Equations
Eq. 18 was developed from observations of the crack profiles at the unwelded end of the cover plate. I t was also a reasonable approximation of the total life of the welded end during its first stage of growth, as shown in Figure 59. Because the total life of the welded end of the cover plate was almost totally consumed by the first stage of crack growth, the regression equations for this detail should be similar to Eq. 10.
The regression equation log A/ = Bj + B j log can be expressed in exponential form as
N=GSB^ (11)
The values of G are compared with Eq. 18 in Table F-23. The comparison shows that the value of the exponent of stress range, n, varied from 2.8768 to 2.8041, and the value of G varied from 8.702 X 10^ to 9.019 X 10'. The value of n IS seen to decrease with increasing yield stress, as was reported by Brother and Yukawa (6) and Gumey {24). However, the magnitude of the decrease is much smaller
86
TABLE F-23 COMPARISON OF REGRESSION EQUATIONS WITH EQUATION 18
COMPARISON I T E M
LOG EQUATION EQUATION
A36 steel A441 steel A514 steel All steels Eq 18
log N=8 9754 log N=8 9396 logN=9.0187 log N=8.9523
- 2 8768 log Sr - 2 8456 log 5, - 2 8041 logs, -2.8200 Sr
N=9.449xl0 'xSr-»"" JV=8.702 X 10'xSr"^"" N = 10.44 X 10" xSr-""" N=8 960xlO»Sr-'"' W= l / / i ' V ^ . XSr-'=12.75 X lO'xSr-"
than reported, and no statistical difference existed between the exponents.
Figure 59 compares the mean regression line for failures at the welded end of the cover plate with Eq 18. The small differences in the slopes of these lines, due to the exponent of stress range, is easily seen in this figure. Eq. 18, which is based on a fracture mechanics analysis of the crack growth, confirms the exponential model that was used for the regression analysis.
The G term m Eq. 11 can be given physical significance by considering the analogy between Eqs. 10 and 11 The value of G for any exponent, n, greater than 2 would be'
in which a = (n/2) — 1. When n = 3, G becomes
The value of G depends on the value of the exponent n, the magnitude of the stress concentration factor, X, and the initial crack size, q. The initial crack size variation can be assumed to be the same for each steel beam because their fabrication was the same. I f the differences in the exponent, n, for each steel are neglected, the value of G becomes dependent on A, the constant relating the crack growth rate, da/dN, with AK. The changes of G with steel are of the same order of magnitude as the changes of n, and consequently no conclusion can be reached about the values of A for each steel.
The quantity A is often considered to be a material property. The exponent, n, has also been suggested to be a material property, although its variation for different materials seems to be small. The stress analysis performed on the crack data was done without a correction for plasticity which may have influenced the significance of the steel's material properties. The inclusion of a plasticity correction factor would suggest that the crack growth behavior depends on the yield strength of the steels, a fact which does not agree with the experimental evidence.
Figure 58 shows the mean regression lines for the tests of plain rolled beams, plain welded beams, all end-welded cover-plated beams, and the unwelded end of the beams with cover plates wider than the flange. The dashed lines in the figure are the results of fitting the data to the equation
AN=:G5r-^ (12)
which was transformed to the logarithmic form:
logAf = logG-31og5 , . (13)
The numerical variation in the exponent of the regression equations for these four different types of steel beams was from 2.73 to 3.33. The use of n = 3, as represented by the dashed lines, is seen to correlate well with the mean regression lines of all the specimens. The large variation in fatigue behavior of the specimens represented in Figure 58 and the invariance of the exponent (equal to about —3) for all details suggest that Eq. 12 can provide a means of examining the fatigue behavior of other details.
Figure 58 also shows the dependence of the fatigue life on the quantity l / (y4 'cr«) in Eq. 10. The quantity l/iA'Ci'') IS a measure of the notch effect of each type of specimen and detail. It is apparent from Eq. 14 that a specimen's fatigue life depends on the corrected crack size, C(, the constant of crack growth, A, and the stress concentration factor, X. The longer life of the plain rolled beams can therefore be attributed to a smaller initial crack size as compared to the large defects present in the web-to-flange fillet weld of the plain welded beams if one assumes that the constant, A, and the stress concentration factor, X, are the same for both types of beam. The cover-plated CBA beams without an end weld represent the most severe condition of c . A, and X.
Summary of the Analysis
I t is evident from this discussion that the designer should consider the stress range at the weld as the major design criterion. Although micro-cracks exist at the toe of the fillet weld (54), the analysis and interpretation of the experimental results show that stress range controls the growth of these micro-cracks adjacent to the weld. The percentage of the total life consumed during propagation of the crack outside this region has been shown to be small. Therefore, a design based on stress range, although no doubt conservative for the case of a compressive minimum stress with no residual tensile stresses, best represents the physical behavior of welded structure under cyclic loading. This latter case does not appear to be critical, as It is doubtful that residual tensile stresses adjacent to the weld can be eliminated in welded structures.
An examination of Eq 10 indicates that the initial crack
87
size, c,, is an important variable. The values of A' and n for a particular specimen configuration appear to be constants. The initial crack, c<, is a random variable that depends on the welding technique used, the proficiency of the welder, and other variables associated with the welding process. The life of a specimen at a given stress range is consequently dependent on c .
Suitable replication is needed to determine the average value of C( and its variation for each type of specimen and fabrication process employed. The randomization of the specimens, with respect to fabrication sequence, is clearly needed to ensure that the value of c^ is a random variable with respect to applied stresses.
APPENDIX G
WELDED BEAMS
A summary of previous tests on plain welded beams is presented in Appendix A. It was found that the major test variables considered by previous investigators were geometry of beam, edge preparation of the plate, and type of welding procedure (manual or automatic submerged arc welding). Al l previous beam tests were conducted so that the bottom flange was subjected to a zero-to-tension stress cycle. As was the case for other types of beam tests, little or no replication was provided and i t was not possible to determine the error variation.
The controlled variables selected for the plain welded beam series were nominal stress in the extreme fiber of the tension flange and grade of steel. The basic factorials used for the three grades of steel are given in Table B-3. As noted in Appendix B, the factorials were not complete because the beam capacity would be exceeded in several cases or else the expected life would be excessive. The experiment designs for A441 and ASM steel beams were identical. The factorial for the A36 steel beams considered only two stress ranges (18 and 24 ksi) at the highest minimum stress level of 14 ksi because of the yield strength limitation.
The dimensions of the plain welded beams were selected to match the nominal dimensions of the 14WF30 rolled beam that was used as the basic unit for the cover-plated beams. The nominal dimensions of the welded beams are given in Figure B-1; measured dimensions and computed cross-sectional properties are summarized in Table D-2.
Details of the fabrication procedure are summarized in Appendix C. The plain welded beams were fabricated in groups corresponding to the various grades of steel. The same procedure was used for each beam. The flame-cut edges of the flange tips were kept to an equivalent ASA smoothness of 1,000 or less. The fillet welds were kept continuous and defects were repaired by rewelding (Figs. C-4 and C-5). The location of tack welds and weld repairs was noted on the web adjacent to the tack or repair.
Characteristics of the automatic submerged arc welding are discussed in Appendix C. Mechanical properties of the plate material were determined from tension tests; the
results are summarized in Table D-3. The results of the chemical analysis and physical properties reported by the mill are given in Table D-4. Each of the beam series was fabricated from plate material furnished from the same heat, except for the ASM steel beams where material was provided from two different heats.
Al l beams were tested on a 10-ft span with two-point loading (Fig. 3). The two-point loading was applied by a spreader beam on a 42-in. span, as shown in Figures 9 and 10 and discussed in Appendix E. Strains were measured at the center line of the beam tension flange. The stresses produced by the applied dynamic loads were maintained within 1 percent of the desired nominal values.
Test Results
Table G-1 summarizes the notation used to present the test data in Tables G-2 through G-4. Each beam is listed in ascending order of minimum stress level and stress range for each grade of steel in Tables G-2 through G-4.
The crack location given in column 4 is the measured distance in inches from the support reaction. I t is further identified with T when the crack formed in the tension flange and with C when it formed in the compression flange. When a beam failed in compression the beam was identified with an asterisk, as shown by beam PWA-131 in Table G-2. Failure in compression means that the crack causing failure was in the top flange. In such a case, the micro-switch did not detect an increase in positive deflection and the crack became quite large (Fig. G-1). The load controls on the pulsator terminated testing only when the load-carrying capacity of the beam was almost exhausted.
Al l the cracks found in a beam are listed together with their respective number of cycles to first observation, if it did not coincide with the cycle number for failure. Sometimes a crack formed in the compression flange before an indication of a crack in the tension flange could be detected, as shown by beam PW6-132 in Table G-3.
I t was not always possible to detect cracks in their first stage of growth. Hence, the crack size when first observed
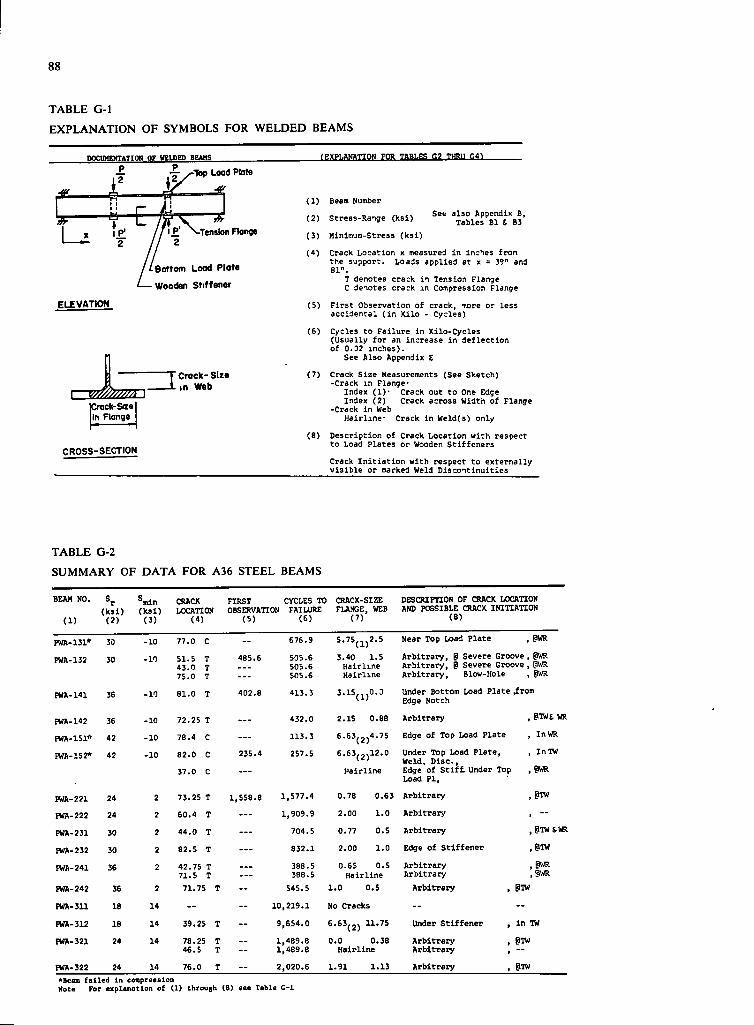
88
TABLE G-1 EXPLANATION OF SYMBOLS FOR WELDED BEAMS
DOCUMENTATION OF WBLDED BEAMS rEXPLANATION FOR TABLES G2 THRU G4^
Y ^Tbp Load Plate
P ^Tension Flange 2
Bottom Lood Plate
Wooden Stiffener
ELEVATION
I v^,^m^ |Oack-Sae In Flange
CROSS-SECTION
Crock- Sire in Web
(1) Beam Number
(2) Stress-Raige (ksl)
(3) Minimum-Stress ( k s l )
(4)
See also Appendix B, Tables Bl i B3
(5)
Crack Location x measured in inches from the support. Loads applied at x = 39" and 81".
T denotes crack i i Tension Flange C denotes crack in Compression Flange
F i r s t Observation of crack, nore or less accidental ( i n Kilo - Cycles)
(6) Cycles to Failure in Kilo-Cycles (Usually for an increase i n deflection of 0.32 inches).
See Also Appendix E
(7) Crack Size Measurements (See Sketch) -Crack in Flange-
Index (!)• Crack out to One Edge Index (2) Crack across Width of Flange
-Crack in Web Hairline- Crack in Weld(s) only
(8) Description of Crack Location with respect to Load Plates or Wooden Stiffeners
Crack I n i t i a t i o n with respect to externally v i s i b l e or marked Weld Discontinuities
TABLE G-2 SUMMARY OF DATA FOR A36 STEEL BEAMS
BEAM NO.
(1)
Sr ( k s l ) (2)
^mln ( k s l ) (3)
CRACK LOCATION
(4)
FIRST CYCLES TO OBSERVATION FAILURE
(5) (6)
CRACK-SIZE FLANGE, WEB
(7)
DESCRIPTION OF CRACK LOCATION AND POSSIBLE CRACK INITIATION
(8)
PWA-131* 30 -10 77.0 C - 676.9 5.75(^,2.5 Near Top Load Plate , @WR
PWA-132 30 -10 51.5 T 43.0 T 75.0 T
485.6 505.6 505.6 505.6
3.40 1.5 Hairline Hairline
Arbitrary, S Severe Groove , gWR Arbitrary, @ Severe Groove , |3WR Arbitrary, Blow-Hole , gWR
FWA-141 36 -10 81.0 T 402.8 413.3 3.15(,,0.3 Under Bottom Load Plate ,from Edge Notch
WA-142 36 -10 72.25 T . . . 432.0 2.IS 0.88 Arbitrary , PTOt WR
FWA-151* 42 -10 78.4 C . . . 113.3 6.63(2)4.75 Edge of Top Load Plate , InWR
PWA-152* 42 -10 82.0 C
37.0 C
235.4 257.5 6.63(2)12.0
Hairline
Under Top Load Plate, Weld. D i s c , Edge of s t i f f . Under Top Load PI,
, InTW
, §IWR
PWA-221 24 2 73.25 T 1,558.8 1,577.4 0.78 0.63 Arbitrary , §TW
FWA-222 24 2 60.4 T . . . 1,909.9 2.00 1.0 Arbitrary . -PWA-231 30 2 44.0 T . . . 704.5 0.77 0.5 Arbitrary , @TW tWR
IWA-232 30 2 82.5 T — 832.1 2.00 1.0 Edge of Stif f e n e r , eiw
EVA-241 36 2 42.75 T 71.5 T
388.5 388.5
0.65 0.5 Hairline
Arbitrary Arbitrary
, @WR , PWR
FWA-242 36 2 71.75 T " 545.5 1.0 0.5 Arbitrary , EIIW
FWA-311 18 14 - - 10,219.1 No Cracks - -FWA-312 18 14 39.25 T - 9,654.0 6.63(2) Under Sti f f e n e r , i n TW
PWA-321 24 14 78.25 46.5
T T
— 1,489.8 1,489.8
0.0 0.38 Hairline
Arbitrary , Arbitrary ,
CWA-322 24 14 76.0 T ~ 2,020.6 1.91 1.13 Arbitrary , EIIW *Beam failed in compression Note For explanation of (1) through (8) see Table G-1
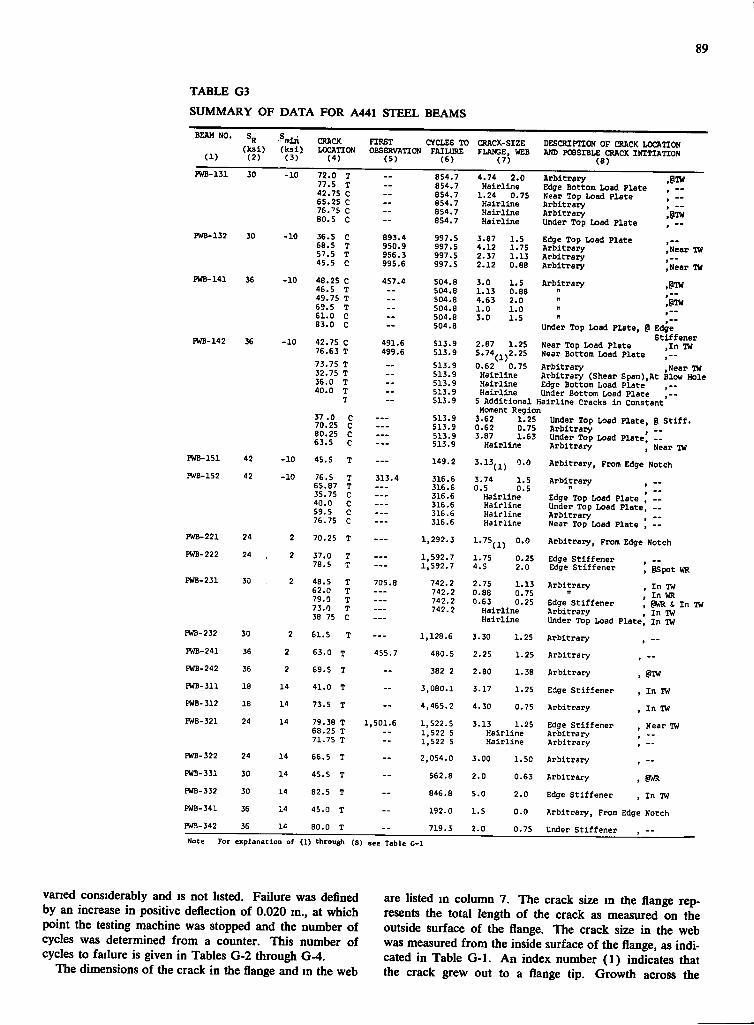
TABLE G3
SUMMARY OF DATA FOR A441 STEEL BEAMS
89
(ksl) (ksi) LOCATION (1) (2) (3) C4)
rWB-131
IWB-132
PWB-142
PWB-151 JWB-152
PWB-221 PWB-222
FWB-231
30
36
36
42 42
24 24
30
FIRST CYCLES TO OBSERVftTION FAILURE
(5) (6) CRACK-SIZE DESCRIPTION OF CRACK LOCATION FLANGE, WEB AND POSSIBLE CRACX INITIATION
(') (8) -10 72.0
77.5 42.75 65.25 76. •'5 80.5
854. 854. 854. 854. 854. 854.
4.74 2.0 Hairline 1.24 0.75 Hairline Hairline Hairline
36.5 C 68.5 T 57.5 T 45.5 C
893, 950, 956. 995.
-10 48.25 46.5 49.75 69.5 61.0 83.0 42.75 76.63 73.75 32.75 36.0 40.0
997.5 997.5 997.5 997.5 504.8 504.8 504.8 504.8 504.8 504.8
491.6 499.6
-10 -10
37 .0 70.25 80.25 63.5 45.5 76.5 65.87 35.75 40.0 59.5 76.75
313.4
513. 513. 513. 513. 513. 513. 513.9 513.9 513.9 513.9 513.9 149.2 316.6 316.6 316.6 316.6 316.6 316.6
3.87 4.12 2.37 2.12 3.0 1.13 4.63 1.0 3.0
2.87 5.74,
1.5 1.75 1.13 0.88 1.5 0.88 2.0 1.0 1.5
1.25 2.25
Arbitrary Edge Bottom Load Plate Near Top Load Plate Arbitrary Arbitrary Under Top Load Plate Edge Top Load Plate Arbitrary Arbitrary Arbitrary Arbitrary
INear TW I Near TO ,EIIW I@TO
(1) 0.62 0.75 Hairline Hairline Hairline
Under Top Load Plate, @ Edge Stiffener
Near Top Load Plate ,In TW Near Bottom Load Plate Arbitrary ,Near TW Arbitrary (Shear Span),At Blow Hole Edge Bottom Load Plate ,— Under Bottom Load Plate ,—
5 Additional Hairline Cracks i n Constant Moment Region
Under Top Load Plate, 0 S t i f f . Arbitrary , — Under Top Load Plate, — Arbitrary , Near TO
3.62 1.25 0.62 0.75 3.87 1.63
Hairline 3.13 (1) 0.0
70.25 T
Arbitrary, From Edge Notch Arbitrary , — Edge Top Load Plate , — Under Top Load Plate, — Arbitrary ^ — Near Top Load Plate , ~
1,292.3 ••'5„x 0.0 Arbitrary, From Edge Notch
3.74 l . s 0.5 0.5
Hairline Hairline Hairline Hairline
37.0 78.5 48.5 62.0 79.0 73.0 38 75
705.8
1,592.7 1,592.7 742.2 742.2 742.2 742.2
1.75 4.5
0.25 2.0
2.75 0.88 0.63
Hairline Hairline
1.13 0.75 0.25
Edge Stiffener Edge Stiffener Arbitrary
n Edge Stiffener Arbitrary
PSpot WR In TO In WR @WR t In TO In TO Under Top Load Plate, In TO
PWB-232 30 2 61.5 T — 1 128.6 3.30 1.25 Arbitrary 1 - -PWB-241 36 2 63.0 T 455.7 480.5 2.25 1.25 Arbitrary , --PWB-242 36 2 69.5 T -- 382 2 2.80 1.38 Arbitrary , eTO PWB-311 18 14 41.0 T -- 3 080.1 3.17 1.25 Edge Stiffener , In TO EWB-312 18 14 73.5 T -- 4 465.2 4.30 0.75 Arbitrary , In TO PWB-321 24 14 79.38
68.25 71.75
T T T
1,501.6 1 1 1 522.5 522 5 522 5
3.13 1.25 Hairline Hairline
Edge Stiffener Arbitrary Arbitrary
, Near TO
FWB-322 24 14 66.5 T -- 2 054.0 3.00 1.50 Arbitrary FWB-331 30 14 45.5 T -- 562.8 2.0 0.63 Arbitrary , gWR [WB-332 30 14 82.5 T -- 846.8 5.0 2.0 Edge Stiffener , In TO FWB-341 36 14 45.0 T - 192.0 1.5 0.0 Arbitrary, From Edge Notch PW3-342 36 14 80.0 T -- 719.3 2.0 0.75 Under Stiffener , --Note For explanation of (1) through (8) see Table C-1
varied considerably and is not listed. Failure was defined by an increase in positive deflection of 0.020 in., at which point the testing machine was stopped and the number of cycles was determined from a counter. This number of cycles to failure is given in Tables G-2 through G-4.
The dimensions of the crack in the flange and in the web
are listed in column 7. The crack size in the flange represents the total length of the crack as measured on the outside surface of the flange. The crack size in the web was measured from the inside surface of the flange, as indicated in Table G-1. An index number (1) indicates that the crack grew out to a flange tip. Growth across the
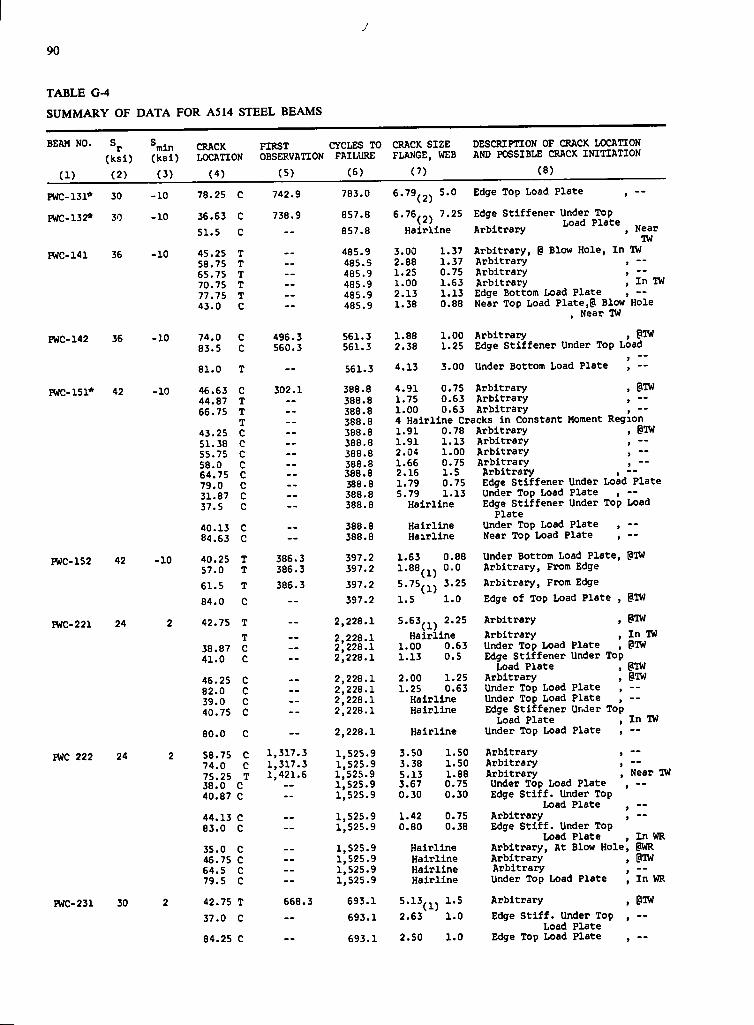
90
TABLE G-4 SUMMARY OF DATA FOR ASM STEEL BEAMS
BEAM NO. ( k s i ) ( k s i )
CRACK LOCATION
FIRST CYCLES TO OBSERVATION FAILURE
(1) (2) (3) (4) (5) (6)
-10 78.25 C 742.9 783.0
-10 36.63 C 738.9 857.8 51.5 C — 857.8
-10 45.25 T 485.9 58.75 T -- 485. S 65.75 T -- 485.9 70.75 T — 485.9 77.75 T — 485.9 43.0 C — 485.9
-10 74.0 C 496.3 561.3 83.5 C 560.3 561.3
81.0 T — 561.3
-10 46.63 C 302.1 388.8 44.87 T — 388.8 66.75 T -- 388.8
T -- 388.8 43.25 C — 388.8 51.38 C — 388.8 55.75 C — 388.8 58.0 C -- 388.8 64.75 C — 388.8 79.0 C — 388 .8 31.87 C — 388.8 37.5 C -- 388.8
40.13 C 388.8 84.63 C -- 388.8
-10 40.25 T 386.3 397.2 57.0 T 386.3 397.2 61.5 T 386.3 397.2 84.0 C — 397.2
2 42.75 T -- 2,228.1 T 2,228.1
38.87 C — 2,228.1 41.0 C -- 2,228.1
46.25 C 2,228.1 82.0 C — 2,228.1 39.0 C 2,228.1 40.75 C -- 2,228.1
80.0 C — 2,228.1
2 58.75 C 1,317.3 1,525.9 74.0 C 1,317.3 1,525.9 75.25 T 1,421.6 1,525.9 38.0 C — 1,525.9 40.87 C — 1,525.9
44.13 c 1,525.9 83.0 c -- 1,525.9
35.0 c 1,525.9 46.75 c 1,525.9 64.5 c — 1,525.9 79.5 c -- 1,525.9
2 42.75 T 668.3 693.1 37.0 C — 693.1
84.25 C 693.1
CRACK SIZE DESCRIPTION OF CRACK LOCATION FLANGE, WEB AND POSSIBLE CRACK INITIATION
(7) (8)
PWC-131* 30
FWC-132* 30
PWC-141 36
PWC-142 36
FWC-151* 42
FWC-152 42
FWC-221 24
FWC 222 24
FWC-231 30
6.79(2) 5.0
6.76(2) '-25 H a i r l i n e
3.00 2.88 1.25 1.00 2.13 1.38
1.88 2.38
4.13
4.91 1.75 1.00
,37 .37 ,75 ,63 .13 .88
1.00 1.25
Edge Top Load Plate , --
Edge S t i f f e n e r Under Top Arbitrary ^^^^^ , Near
TW Arbitrary, | l Blow Hole, I n TW Arbitrary , — Arbitr a r y , — Arbitrary , I n TO Edge Bottom Load Plate , — Near Top Load Plate,@ Blow Hole
, Near TO
Arb i t r a r y , @TO Edge S t i f f e n e r Under Top Load
3.00 Under Bottom Load Plate
0.75 0.63 0.63
Arbitrary Arbitrary A r b i t r a r y
@TO
4 H a i r l i n e Cracks i n Constant Moment Region 1.91 0.78 Arbitrary , glTO 1.91 1.13 Arbitrary , — 2.04 1.00 Arbit r a r y , — 1.66 0.75 Ar b i t r a r y , — 2.16 1.5 Arbit r a r y , — 1.79 0.75 Edge S t i f f e n e r Under Load Plate 5.79 1.13 Under Top Load Plate , —
H a i r l i n e Edge S t i f f e n e r Under Top Load Plate
H a i r l i n e Under Top Load Plate , — H a i r l i n e Near Top Load Plate , —
0.88 Under Bottom Load Plate, @TO 0.0 Arbitrary, From Edge 3.25 Arbitrary, From Edge 1.0 Edge of Top Load Plate , gTO
S.63(j^) 2.25 Arbit r a r y , PTO Ha i r l i n e Arbitrary , I n TO
1.00 0.63 Under Top Load Plate , PTO 1.13 0.5 Edge S t i f f e n e r Under Top
Load Plate , PTO 2.00 1.25 Arbit r a r y , gTO 1.25 0.63 Under Top Load Plate , —
Ha i r l i n e Under Top Load Plate , --H a i r l i n e Edge S t i f f e n e r Under Top
Load Plate , I n TO H a i r l i n e Under Top Load Plate , —
1.63 1.88 5.75 1.5
(1) (1)
3.50 1.50 Arbit r a r y , 3.38 1.50 Arbit r a r y , 5.13 l.BB Ar b i t r a r y 3.67 0.75 Under Top Load Plate 0.30 0.30 Edge S t i f f . Under Top
Load Plate 1.42 0.75 Arbitrary 0.80 0.38 Edge S t i f f . Under Top
Load Plate H a i r l i n e A r b i t r a r y , At Blow Hole H a i r l i n e Arbitrary H a i r l i n e Arbitrary H a i r l i n e Under Top Load Plate
5.13(j^j 1.5 Ar b i t r a r y 2.63 1.0 Edge S t i f f . Under Top
Load Plate 2.50 1.0 Edge Top Load Plate
Near TO
I n WR PWR @TO I n WR
PTO
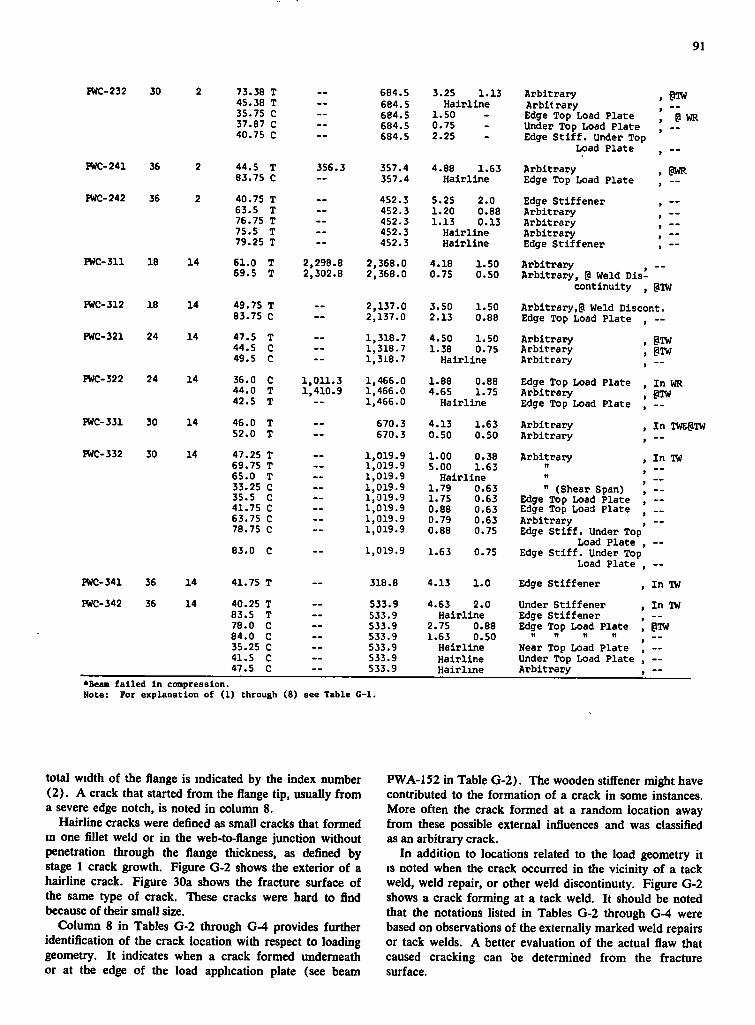
FWC-232 30 73.38 T 45.38 T 35.75 C 37.87 C 40.75 C
FWC-241 36 2
PWC-242 36 2
44.5 83.75
40.75 63.5 76.75 75.5 79.25
356.3
684.5 684.5 684.5 684.5 684.5
357.4 357.4
452.3 452.3 452.3 452.3 452.3
3.25 1.13 Ha i r l i n e
1.50 0.75 2.25
4.88 1.63 Ha i r l i n e
5.25 2.0 1.20 0.88 1.13 0.13
Ha i r l i n e H a i r l i n e
FWC-311 18 14 61.0 T 2,298.8 2,368.0 4.18 1.50 69.5 T 2,302.8 2,368.0 0.75 0.50
PWC-312 18 14 49.75 T _ _ 2,137.0 3.50 1.50 83.75 C — 2,137.0 2.13 0.88
PWC-321 24 14 47.5 T 1,318.7 4.50 1.50 44.5 C — 1,318.7 1.38 0.75 49.5 c — 1,318.7 H a i r l i n e
PWC-322 24 14 36.0 c 1,011.3 1,466.0 1.88 0.88 44.0 T 1,410.9 1,466.0 4.65 1.75 42.5 T — 1,466.0 H a i r l i n e
PWC-331 30 14 46.0 T 670.3 4.13 1.63 52.0 T -- 670.3 0.50 0.50
roc-332 30 14 47.25 T 1,019.9 1.00 0.38 69.75 T — 1,019.9 5.00 1.63 65.0 T — 1,019.9 H a i r l i n e 33.25 c — 1,019.9 1.79 0.63 35.5 C — 1,019.9 1.75 0.63 41.75 C — 1,019.9 0.88 0.63 63.75 C — 1,019.9 0.79 0.63 78.75 C -- 1,019.9 0.88 0.75 83.0 C — 1,019.9 1.63 0.75
PWC-341 36 14 41.75 T — 318.8 4.13 1.0
roc-342 36 14 40.25 T 533.9 4.63 2.0 83.5 T — 533.9 H a i r l i n e 78.0 C — 533.9 2.75 0.88 84.0 C — 533.9 1.63 0.50 35.25 C — 533.9 H a i r l i n e 41.5 C — 533.9 H a i r l i n e 47.5 C — 533.9 H a i r l i n e
A r b i t r a r y A r b i t r a r y Edge Top Load Plate Under Top Load Plate Edge S t i f f . Under Top
Load Plate
A r b i t r a r y Edge Top Load Plate
Edge S t i f f e n e r A r b i t r a r y A r b i t r a r y A r b i t r a r y Edge S t i f f e n e r
A r b i t r a r y , Ar b i t r a r y , §1 Weld Di s
continuity ,
91
0TW P WR
PTW
Arbitrary,0 Weld Dlscont. Edge Top Load Plate , —
Arbitra r y , @TW Arbitra r y , PTW Arbitrary , —
Edge Top Load Plate , I n WR Arbitra r y , glW Edge Top Load Plate , —
Arbitra r y , I n 1W&@IW Arbitra r y , —
Arbitra r y , I n TW
" (Shear Span) , — Edge Top Load Plate , — Edge Top Load Plate , — Arbitra r y , — Edge S t i f f . Under Top
Load Plate , — Edge S t i f f . Under Top
Load Plate , —
Edge S t i f f e n e r , I n IW
Under S t i f f e n e r , I n IW Edge S t i f f e n e r , — Edge Top Load Plate , gTW
rt n n n — Near Top Load Plate , — Under Top Load Plate , — Arbitra r y , —
•Bean f a i l e d I n compression. Note: Foi explanation of (1) through (8) see Table G-1.
total width of the flange is indicated by the index number (2) . A crack that started from the flange tip, usually from a severe edge notch, is noted in column 8.
Hairline cracks were defined as small cracks that formed in one fillet weld or in the web-to-flange junction without penetration through the flange thickness, as defined by stage 1 crack growth. Figure G-2 shows the exterior of a hairline crack. Figure 30a shows the fracture surface of the same type of crack. These cracks were hard to find because of their small size.
Column 8 in Tables G-2 through G-4 provides further identification of the crack location with respect to loading geometry. I t indicates when a crack formed underneath or at the edge of the load application plate (see beam
PWA-152 in Table G-2). The wooden stiffener might have contributed to the formation of a crack in some instances. More often the crack formed at a random location away from these possible external influences and was classified as an arbitrary crack.
In addition to locations related to the load geometry it I S noted when the crack occurred in the vicinity of a tack weld, weld repair, or other weld discontinuity. Figure G-2 shows a crack forming at a tack weld. I t should be noted that the notations listed in Tables G-2 through G-4 were based on observations of the externally marked weld repairs or tack welds. A better evaluation of the actual flaw that caused cracking can be determined from the fracture surface.
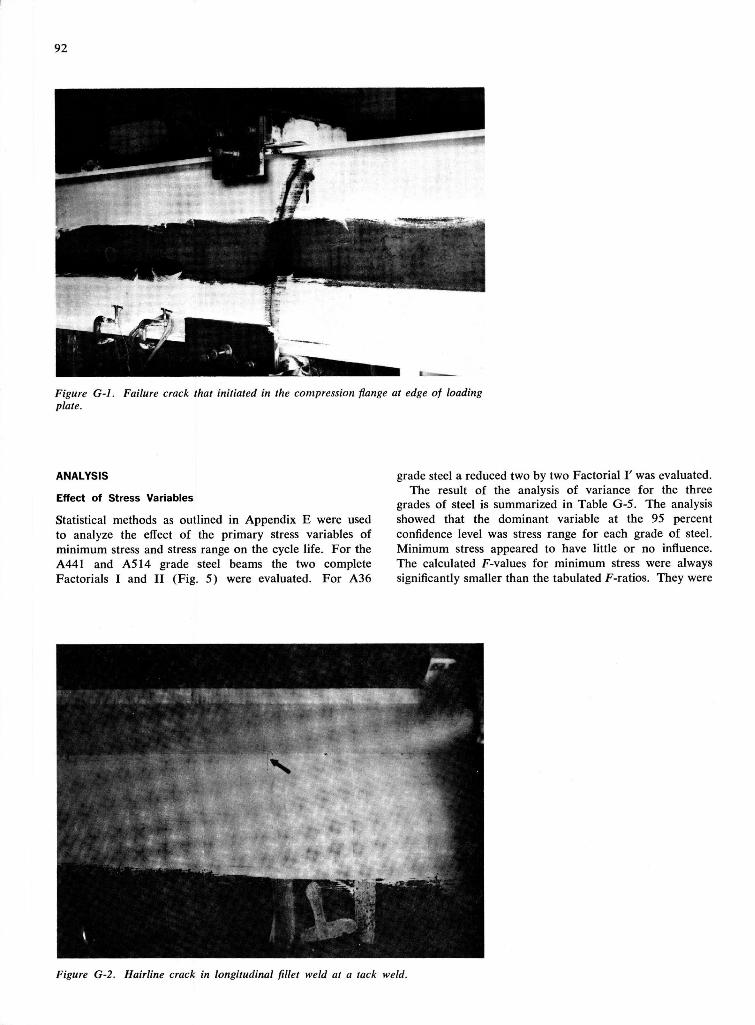
92
Figure G-1. Failure crack that initiated in the compression flange at edge of loading plate.
ANALYSIS
Effect of Stress Variables
Statistical methods as outlined in Appendix E were used to analyze the effect of the primary stress variables of minimum stress and stress range on the cycle life. For the A441 and ASM grade steel beams the two complete Factorials I and I I (Fig. 5) were evaluated. For A36
grade steel a reduced two by two Factorial I ' was evaluated. The result of the analysis of variance for the three
grades of steel is summarized in Table G-5. The analysis showed that the dominant variable at the 95 percent confidence level was stress range for each grade of steel. Minimum stress appeared to have little or no influence. The calculated F-values for minimum stress were always significantly smaller than the tabulated F-ratios. They were
Figure G-2. Hairline crack in longitudinal fillet weld at a tack weld.

93
also an order of magnitude smaller than the F-values for stress range
Multiple regression analyses for the individual grades of steel were also performed using all data, including the test data outside of the complete factorials. It should be noted that only one test result per beam was used for the regression analysis, although many beams had multiple cracks. The results of the multiple regression analyses are given in Table G-7.
It was found that regardless of grade of steel, no improvement in the goodness of fit was achieved when minimum or maximum stress was included in the analysis. Model F, using maximum stress alone, did not show any correlation with the data. For the A36 steel beams the fit of the model improved when a logarithmic transformation of the stress range was used. For the two other grades of steel all models except Model F yielded about the same result.
The data using the logarithmic transformation of both cycle life and stress range are shown in Figures G-3, G-4, and G-5 for A36, A441, and A514 steel beams, respectively. The regression curves given by Model D are included together with the limits of dispersion. Model D was chosen because of its theoretical justification based on fracture mechanics, as discussed in Chapter Three. I t also represented best the data for the A36 steel beams, and the same tendency was found for the higher-grade steels.
TABLE G-5
ANALYSIS OF VARIANCE FOR WELDED BEAMS-COMPARISON BETWEEN STRESS RANGE AND MINIMUM STRESS
FACTORIAL I FACTORIAL I I
steel Source of Variation F Calc. F Tab.* F Calc F Tab.*
A36** stress Range Hin stress Interaction
12.089 2 189 O.SBS
7.71 7.71 7.71
MAI stress Range Min Stress Interaction
7.197 0.537 0.043
5.99 5.14 5.14
10.098 0.871 0 034
5.14 5.99 5.14
A514 Stress Range Min. Stress Interaction
16.960 0.204 0 102
5.99 5.14 5.14
36 389 1.179 0.204
5.14 5.99 5.14
a = 0.05 Reduced Factorial I '
Effect of Type of Steel
From the results of the analysis of variance for the major stress variables it was concluded that stress range was the dominant variable for each grade of steel. I t was also found that the test data could be represented by the loga-
TABLE G-6 ANALYSIS OF VARIANCE DUE TO TYPE OF STEEL FOR WELDED BEAMS
TABLE G-7
REGRESSION ANALYSIS OF WELDED BEAMS
MODEL B, CORRELATION COEFFICIENT
STSNDARD ERROR OF ESTIMATE
Source of Variation FACTORIAL I ' F calc. F Tab.'
FACTORIAL I I F Calc. F Tab •
A36 steel - 16 Specimens
A36 vs A441 Type of steel Stress Range Interaction
A36 vs A514 Type of steel stress Range Interaction
A441 vs A514 Type of steel stress Range Interaction
A36** vs A441 Type of Steel Min. stress Interaction
A36** vs. A514 Type of Steel Min Stress Interaction
A441 vs. A514 Type of Steel Min. Stress Interaction
0 047 28.921 0.997
4 811 40.934 2.309
3.372 49 895 0.147
0.279 0.212 0 502
0 033 0 050 0.286
0 108 0.211 0 284
4 75 4.75 4.75
4.75 4 75 4.75
4 75 4 75 4.75
FACTORIAL I
4.41 3 55 3 55
4.41 3.55 3.55
4.41 3 55 3.55
0 007 39.879 0 029
4.41 3.55 3.55
FACTORIAL I I
Test Data for A36 Grade Steel Beams simulated from Regression Curve at 14 ksi Minimum Stress level for Factorial 1.
I = 0 05
A 7.639 -0.056 0.009 .957 .163 B 7.920 -0.065 — .951 .167 c 11.847 -4.028 0.005 .974 .128 D 12.379 -4.390 — .972 .128 E 12.165 -4.379 0.007 .975 .126 F 5 .675
A441 0.009
Steel- 20 Specimens .106 .538
A 7 .522 -0.053 -0.004 .938 .137 B 7 .426 -4.990 -- .934 .137 c 10 .950 -3.420 -0.003 .934 .141 D 10 .705 -3.261 -- .931 .140 E 10 .753 -3.212 -0.004 .935 .140 F 6 .241
A514 -0.010
Steel - 20 Specimens .236 .373
A 7 .136 -0.041 -0.003 .935 .108 B 7 .061 -0.038 — .932 .108 c 9 .804 -2.652 -0.003 .937 .107 D 9 .603 -2.522 — .934 .106 E 9 .641 -2.484 -0.003 .937 .106 F 6 .151 -0.008 - .237 .288
A l l Steels - 56 Specimens A 7.482 -0.052 -0.001 .920 .155 B 7.463 -0.051 — .920 .154 c 10.944 -3.421 -0.001 .928 .148 D 10.870 -3.372 — .928 .147 E 10.887 -3.363 -0.001 .928 .148 F 6.126 -0.007 - .135 .390
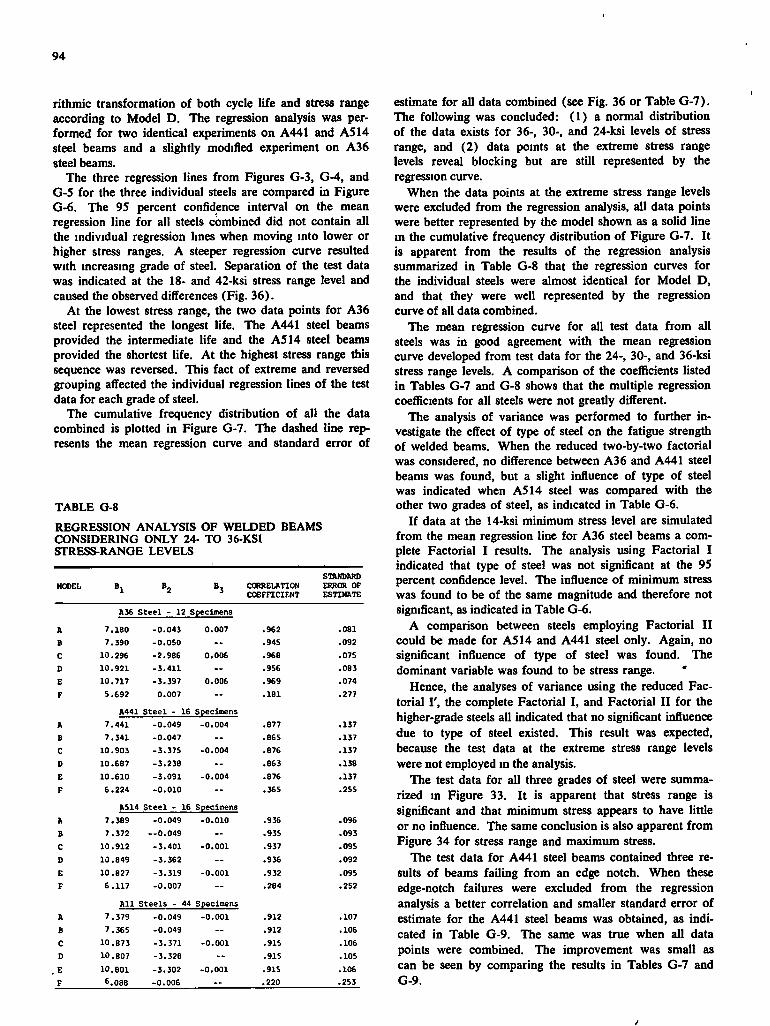
94
rithmic transformation of both cycle life and stress range according to Model D. The regression analysis was performed for two identical experiments on A441 and A S H steel beams and a slightly modified experiment on A36 steel beams.
The three regression lines from Figures G-3, G-4, and G-S for the three individual steels are compared in Figure G-6. The 95 percent confidence interval on the mean regression line for all steels combined did not contain all the mdividual regression hnes when moving mto lower or higher stress ranges. A steeper regression curve resulted with mcreasmg grade of steel. Separation of the test data was indicated at the 18- and 42-ksi stress range level and caused the observed differences (Fig. 36).
At the lowest stress range, the two data points for A36 steel represented the longest life. The A441 steel beams provided the intermediate life and the A514 steel beams provided the shortest life. At the highest stress range this sequence was reversed. This fact of extreme and reversed grouping affected the individual regression lines of the test data for each grade of steel.
The cumulative frequency distribution of all the data combined is plotted in Figure G-7. The dashed line represents the mean regression curve and standard error of
TABLE G-8 REGRESSION ANALYSIS OF WELDED BEAMS CONSIDERING ONLY 24- TO 36-KSI STRESS-RANGE LEVELS
MODEL "2 "3 CORRELATION COEFFICIENT
STANDARD ERROR OF ESTIMATE
A36 Steel - 12 Specimens A 7.180 -0.043 0.007 .962 .081 B 7.390 -0.050 — .945 .092 C 10.296 -2.986 0.006 .968 .075 D 10.921 -3.411 — .956 .083 E 10.717 -3.397 0.006 .969 .074 F 5.692 0.007 - .181 .277
A441 steel - 16 Specimens A 7.441 -0.049 -0.004 .877 .137 B 7.341 -0.047 — .865 .137 C 10.903 -3.375 -0.004 .876 .137 D 10.687 -3.238 — .863 .138 E 10.610 -3.091 -0.004 .876 .137 F 6.224 -0.010 " .365 .255
AS14 Steel - 16 Specimens A 7.389 -0.049 -0.010 .936 .096 B 7.372 --0.049 — .935 .093 C 10.912 -3.401 -0.001 .937 .095 D 10.849 -3.362 — .936 .092 E 10.827 -3.319 -0.001 .932 .095 F 6.117 -0.007 ~ .284 .252
A l l Steels - 44 Specimens A 7.379 -0.049 -0.001 .912 .107 B 7.365 -0.049 -- .912 .106 C 10.873 -3.371 -0.001 .915 .106 D 10.807 -3.328 - .915 .105 E 10.801 -3.302 -0.001 .915 .106 F 6.088 -0.006 — .220 .253
estimate for all data combined (see Fig. 36 or Table G-7). The following was concluded: (1) a normal distribution of the data exists for 36-, 30-, and 24-ksi levels of stress range, and (2) data points at the extreme stress range levels reveal blocking but are still represented by the regression curve.
When the data points at the extreme stress range levels were excluded from the regression analysis, all data points were better represented by the model shown as a solid line in the cumulative frequency distribution of Figure G-7. I t is apparent from the results of the regression analysis summarized in Table G-8 that the regression curves for the individual steels were almost identical for Model D, and that they were well represented by the regression curve of all data combined.
The mean regression curve for all test data from all steels was in good agreement with the mean regression curve developed from test data for the 24-, 30-, and 36-ksi stress range levels. A comparison of the coefficients listed in Tables G-7 and G-8 shows that the multiple regression coefficients for all steels were not greatly different.
The analysis of variance was performed to further investigate the effect of type of steel on the fatigue strength of welded beams. When the reduced two-by-two factorial was considered, no difference between A36 and A441 steel beams was found, but a slight influence of type of steel was indicated when A S H steel was compared with the other two grades of steel, as indicated in Table G-6.
If data at the 14-ksi minimum stress level are simulated from the mean regression line for A36 steel beams a complete Factorial I results. The analysis using Factorial I indicated that type of steel was not significant at the 9S percent confidence level. The influence of minimum stress was found to be of the same magnitude and therefore not significant, as indicated in Table G-6.
A comparison between steels employing Factorial I I could be made for A S H and A441 steel only. Again, no significant influence of type of steel was found. The dominant variable was found to be stress range. *
Hence, the analyses of variance using the reduced Factorial r , the complete Factorial I , and Factorial I I for the higher-grade steels all indicated that no significant influence due to type of steel existed. This result was expected, because the test data at the extreme stress range levels were not employed in the analysis.
The test data for all three grades of steel were summarized in Figure 33. I t is apparent that stress range is significant and that minimum stress appears to have little or no influence. The same conclusion is also apparent from Figure 34 for stress range and maximum stress.
The test data for A441 steel beams contained three results of beams failing from an edge notch. When these edge-notch failures were excluded from the regression analysis a better correlation and smaller standard error of estimate for the A441 steel beams was obtained, as indicated in Table G-9. The same was true when all data points were combined. The improvement was small as can be seen by comparing the results in Tables G-7 and G-9.
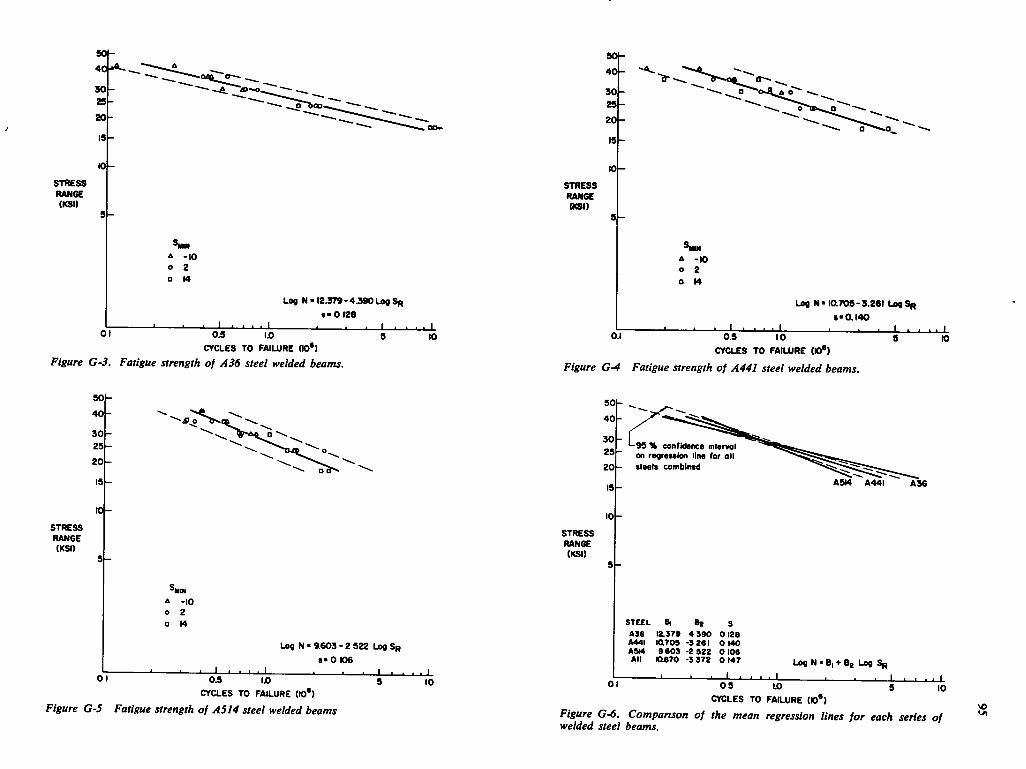
so-
3 0 2 9
2 0
STRESS RANGE (KSI)
A -10 o 2 • 14
J .
Log N • 1 2 . 3 7 9 - 4 3 9 0 Log S R
• • 0 1 2 8
__, , , 1 , . 9 01 0.S 1:0
CYCLES TO FAILURE ttO*) Figure G-3. Fatigue strength of A36 steel welded beams.
10
50
40
30 25
20
IS
lOh STRESS RANGE (KSI)
01
p ' o ^ ^ ^ i
A -10 o 2 a M
Log N * 9603-2 522 Log S R • • 0 106
0 3 IJO
CYCLES T O FAILURE (10*) 10
Figure G-5 Fatigue strength of ASM steel welded beams
5 0 -
4 0 -
30 29 20
19
10
STRESS RANGE (KSI)
_L
Log N-10709-3.261 LagSp s«O.I40
0.1 0.9 10 CYCLES TO FAILURE (O*)
Figure G-4 Fatigue strength of A441 steel welded beams.
K>
5 0 -
4 0 -
3 0 -2 5 -2 0 -
15
-95 % confidence intervol on regreseion line for oil steels combined
10
STRESS RANGE (KSI)
STEEL B| B2 A36 I2.S79 4 390 A44I IttTOS -3 261 ASM 9603 -2 922 All IOLSTO -3 372
S 0128 0 140 0106 0 147
I •
ASM A44I A36
Log N • B, •)• Bj Log S R
_L 10 01 0 5 1.0
CYCLES TO FAILURE ( o ' )
Figure G-6. Comparison of the mean regression lines for each series of welded steel beams.
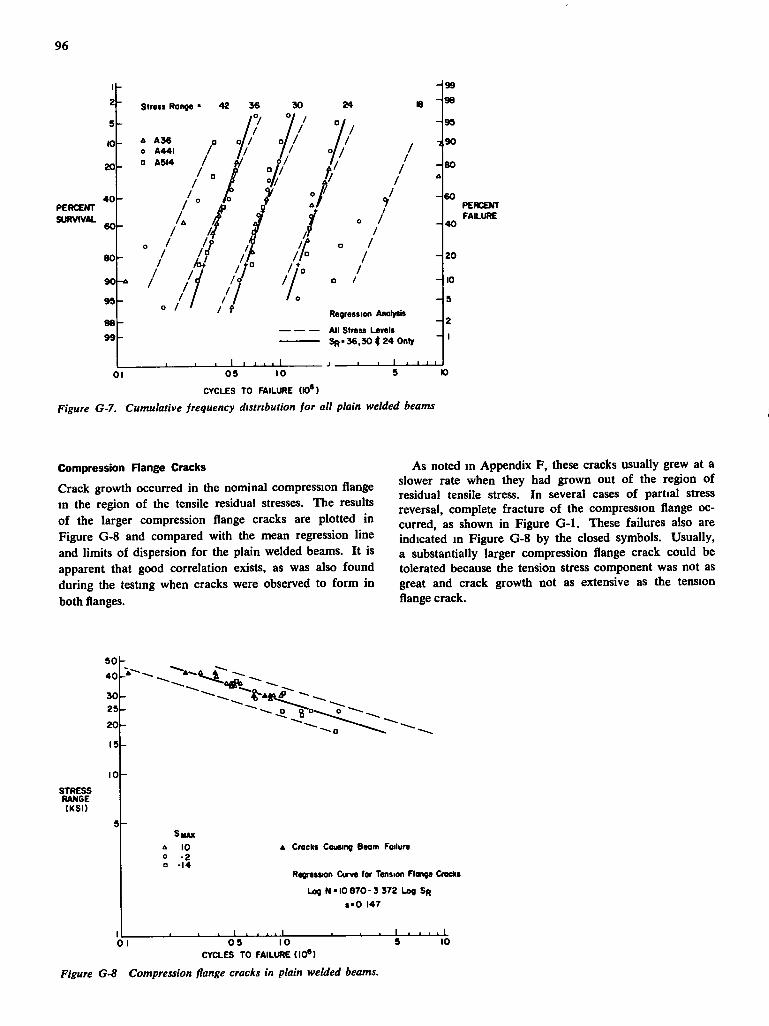
96
2 -
5
10
2 0
P E R C E N T
S U R V I V A L
4 0
6 0
8 0
9 0
9 9
9 8
9 9
Streis Range • 42 3 6
A A 3 6 o A 4 4 I • A S M
/ / o / / /
/ /
Regression Analysis
All Stress Levels S R « 3 6 , 3 0 • 2 4 Onhf
_L
9 9
9 8
9 9
^ 9 0
8 0
6 0
4 0
2 0
10
9
2
- 1 1 1—I I I
PERCENT FAILURE
0 1 0 9 1 0 9
CYCLES TO FAILURE (»*)
Figure G-7. Cumulative frequency distribution for all plain welded beams
Compression Flange Cracks
Crack growth occurred in the nominal compression flange in the region of the tensile residual stresses. The results of the larger compression flange cracks are plotted in Figure G-8 and compared with the mean regression line and limits of dispersion for the plain welded beams. I t is apparent that good correlation exists, as was also found during the testing when cracks were observed to form in both flanges.
As noted in Appendix F, these cracks usually grew at a slower rate when they had grown out of the region of residual tensile stress. In several cases of partial stress reversal, complete fracture of the compression flange occurred, as shown in Figure G-1. These failures also are indicated in Figure G-8 by the closed symbols. Usually, a substantially larger compression flange crack could be tolerated because the tension stress component was not as great and crack growth not as extensive as the tension flange crack.
STRESS RANGE (KSI)
9 0 -4 0 - *
30 29
20
0 1
SMAX
10 -2
-14
* Crocks Causing Beam Foilure
Regression Curve for Tension Flange Crocks Log N * 10 870-3 372 Log S R
s « 0 147
0 9 10 CYCLES TO FAILURE (I0»)
10
Figure G-8 Compression flange cracks in plain welded beams.
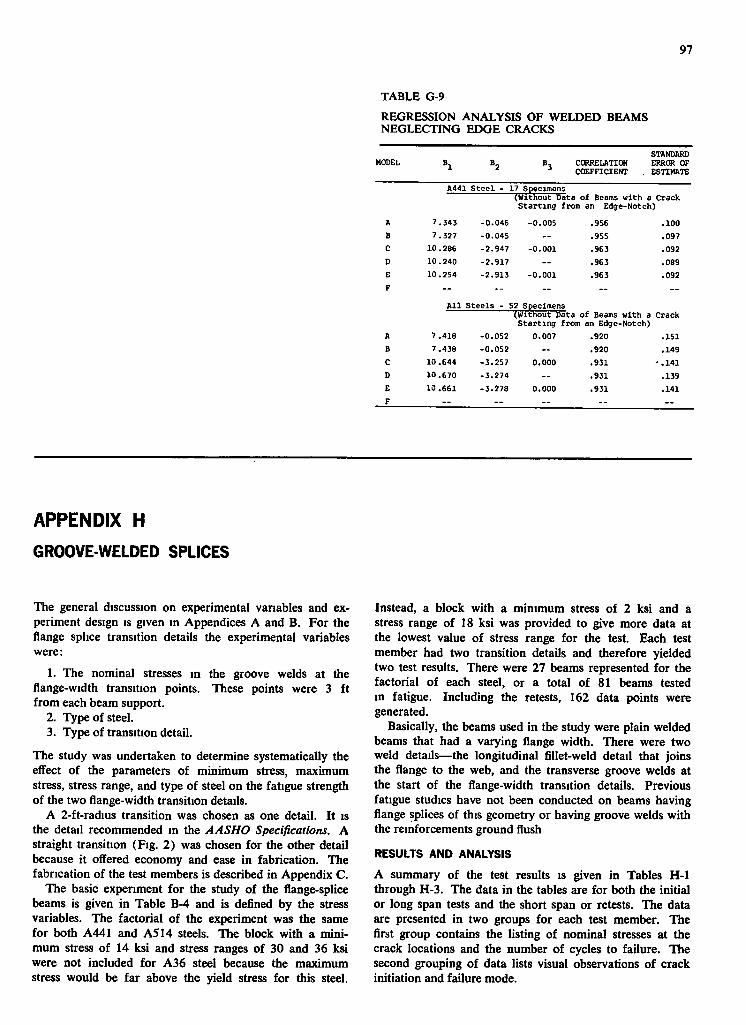
97
TABLE G-9
REGRESSION ANALYSIS OF WELDED BEAMS NEGLECTING EDGE CRACKS
HODEL "2 CCRRELATION COEFFICIENT
STANDARD ERROR OF ESTIMATE
A441 Steel - 17 Specimens (Without Data of Beams with a Crack Starting from an Edge-Notch)
A 7.343 -0.046 -0.005 .956 .100 B 7 .327 -0.045 — .955 .097 C 10.286 -2.947 -0.001 .963 .092 D 10.240 -2.917 -- .963 .089 E F
10.254 -2.913 -0.001 .963 .092
A l l Steels - 52 Specimens (Without Data of Beams with a Crack Starting from an Edge-Notch)
A 7 .418 -0.052 0.007 .920 .151 B 7.438 -0.052 — .920 .149 C 10.644 -3.257 0.000 .931 - .141 D 10.670 -3.274 -- .931 .139 E 10.661 -3.278 0.000 .931 .141 F — — — — —
APPENDIX H
GROOVE-WELDED SPLICES
The general discussion on experimental variables and experiment design I S given in Appendices A and B. For the flange splice transition details the experimental variables were:
1. The nominal stresses in the groove welds at the flange-width transition points. These points were 3 f t from each beam support.
2. Type of steel. 3. Type of transition detail.
The study was undertaken to determine systematically the effect of the parameters of minimum stress, maximum stress, stress range, and type of steel on the fatigue strength of the two flange-width transition details.
A 2-ft-radius transition was chosen as one detail. I t is the detail recommended in the AASHO Specifications. A straight transition (Fig. 2) was chosen for the other detail because it offered economy and ease in fabrication. The fabrication of the test members is described in Appendix C.
The basic experiment for the study of the flange-splice beams is given in Table B-4 and is defined by the stress variables. The factorial of the experiment was the same for both A441 and A S H steels. The block with a minimum stress of 14 ksi and stress ranges of 30 and 36 ksi were not included for A36 steel because the maximum stress would be far above the yield stress for this steel.
Instead, a block with a minimum stress of 2 ksi and a stress range of 18 ksi was provided to give more data at the lowest value of stress range for the test. Each test member had two transition details and therefore yielded two test results. There were 27 beams represented for the factorial of each steel, or a total of 81 beams tested in fatigue. Including the retests, 162 data points were generated.
Basically, the beams used in the study were plain welded beams that had a varying flange width. There were two weld details—the longitudinal fillet-weld detail that joins the flange to the web, and the transverse groove welds at the start of the flange-width transition details. Previous fatigue studies have not been conducted on beams having flange splices of this geometry or having groove welds with the reinforcements ground flush
RESULTS AND ANALYSIS
A summary of the test results is given in Tables H-1 through H-3. The data in the tables are for both the initial or long span tests and the short span or retests. The data are presented in two groups for each test member. The first group contains the listing of nominal stresses at the crack locations and the number of cycles to failure. The second grouping of data lists visual observations of crack initiation and failure mode.
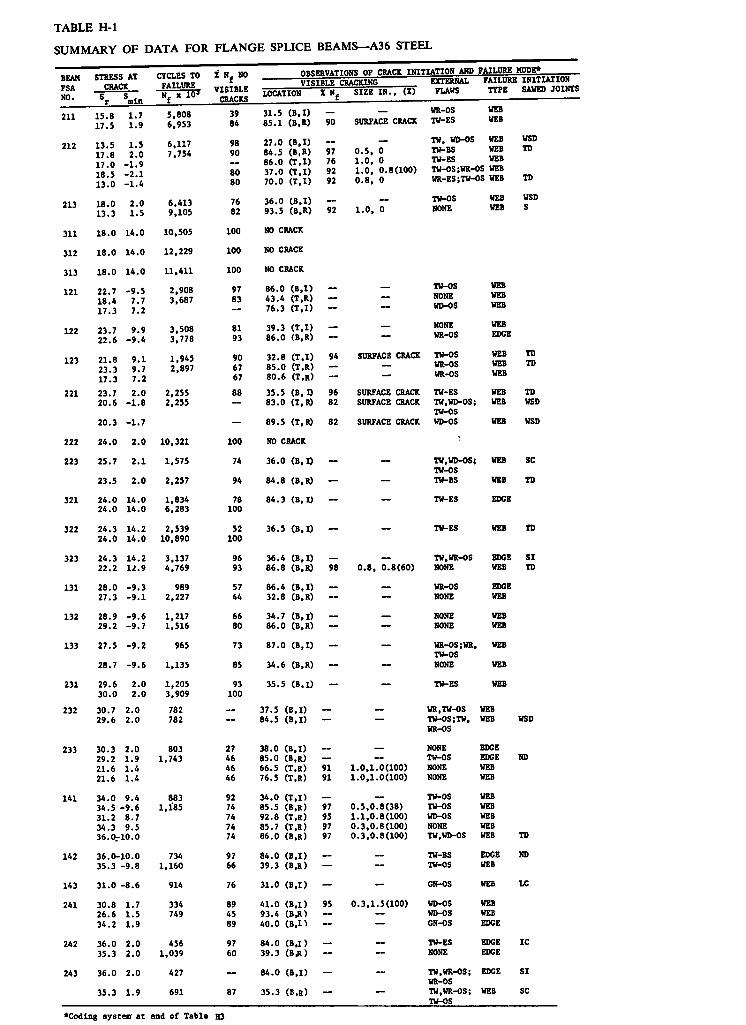
TABLE H-1
SUMMARY OF DATA FOR FLANGE SPLICE BEAMS—A36 STEEL
BEAM FSA NO.
STRESS AT CRACK
CYCLES TO FAILURE N, X 10'
X Hj NO VISIBLE CRACKS
OBSERVATIOMS OF CRACK INITIATION AMD FAILURE MODE* VISIBLE CRACKING
LOCATION X N, SIZE IN.. (X) EXTERNAL FLAWS
FAILURE INITIATION ITPE SAWED JOINTS
211
212
15.8 17.5
13.5 17.8 17.0 18.5 13.0
1.7 1.9 1.5 2.0
-1.9 -2.1 -1.4
5.808 6.953
6.117 7.754
39 84
98 90
80 80
31.5 (B.I) ~ 85.1 (B.R) 90
— WR-OS SURFACE CRACK IW-ES
WEB WEB
27.0 (B.I) 84.5 (B.R) 86.0 (T.I) 37.0 (T.I) 70.0 (T.I)
97 76 92 92
0.5. 0 1.0. 0 1.0. 0.8(100) 0.8. 0
TW. WD-OS WEB TW-BS WEB TW-ES WEB TW-OS (WR-OS WEB WR-ES;TW-OS WEB
WSD TD
TD
213 18.0 13.3
2.0 1.5
6.413 9.105
76 82
36.0 (B.I) 93.5 (B.R) 92 1.0. 0
TW-OS NONE
WEB WEB
WSD S
311 18.0 14.0 10.505 100 NO CRACK
312 18.0 14.0 12.229 100 NO CRACK
313 18.0 14.0 11.411 100 NO CRACK
121 22.7 18.4 17.3
-9.5 7.7 7.2
2.908 3.687
97 83
86.0 (B,I) 43.4 (T.R) 76.3 (T.I)
"— —
TW-OS NONE WD-OS
WEB WEB WEB
122 23.7 22.6
9.9 -9.4
3,508 3.778
81 93
39.3 (T,I) 86.0 (B,R)
— —
HONE WR-OS
WEB EDGE
123 21.8 23.3 17.3
9.1 9.7 7.2
1.945 2.897
90 67 67
32.8 (T.I) 85.0 (T.R) 80.6 (T.R)
94 SURFACE CRACK TW-OS WR-OS WR-OS
WEB WEB WEB
TD TD
221 23.7 20.6
20.3
2.0 -1.8
-1.7
2.255 2.255
88 35.5 (B.O 83.0 (T.R)
89.5 (T.R)
96 82
82
SURFACE CRACK SURFACE CRACK
SURFACE CRACK
TW-ES TW.WD-OS; TW-OS WD-OS
WEB WEB
WEB
TD WSD
WSD
222 24.0 2.0 10,321 100 NO CRACK
223 25.7
23.5
2.1
2.0
1,575
2,257
74
94
36.0 (B.O
84.8 (B.R) _ _
— TW.WD-OS: TW-OS TW-BS
WEB
WEB
SC TD
321 24.0 24.0
14.0 14.0
1,834 6,283
78 100
84.3 (B.I) — — TW-ES EDGE
322 24.3 24.0
14.2 14.0
2,539 10.890
52 100
36.5 (B.I) — — TW-ES WEB ID
323 24.3 22.2
14.2 li.9
3.137 4.769
96 93
36.4 (B.I) 86.8 (B.R) 98 0.8. 0.8(60)
TW.WR-OS NONE
EDGE WEB
SI TD
131 28.0 27.3
-9.3 -9.1
989 2.227
57 44
86.4 (B.I) 32.8 (B.R)
— —
WR-OS NONE
EDGE WEB
132 28.9 29.2
-9.6 -9.7
1.217 1.516
66 80
34.7 (B.I) 86.0 (B.R)
— —
NONE NONE
WEB WEB
133 27.5
28.7
-9.2
-9.6
965
1.135
73
85
87.0 (B.I)
34.6 (B.R)
WR-OS ;WR, TW-OS NONE
WEB
WEB
231 29.6 30.0
2.0 2.0
1.205 3.909
93 100
35.5 (B.I) — — TW-ES WEB
232 30.7 29.6
2.0 2.0
782 782 ~
37.5 (B.I) 84.5 (B.I)
WR.TW-OS TW-OS;TW. WR-OS
WEB WEB WSD
233 30.3 29.2 21.6 21.6
2.0 1.9 1.4 1.4
803 1.743
27 46 46 46
38.0 (B.I) 85.0 (B.R) 66.5 (T.R) 76.5 (T.R)
91 91
1.0.1.0(100) 1.0.1.0(100)
NONE TW-OS NONE NONE
EDGE EDGE WEB WEB
ND
141 34.0 9.4 34.5 -9.6 31.2 8.7 34.3 9.5 36.Orl0.0
883 1.185
92 74 74 74 74
34.0 (T.I) 85.5 (B.R) 92.8 (T.R) 85.7 (T.R) 86.0 (B.R)
97 95 97 97
0.5.0.8(38) 1.1.0.8(100) 0.3.0.8(100) 0.3.0.8(100)
TW-OS TW-OS WD-OS NONE TW.WD-OS
WEB WEB WEB WEB WEB TD
142 36.0-10.0 35.3 -9.8
734 1.160
97 66
84.0 (B.I) 39.3 (B.R) — —
TW-BS TW-OS
EDGE WEB
ND
143 31.0 -8.6 914 76 31.0 (B.I) — - CN-OS WEB LC
241 30.8 26.6 34.2
1.7 1.5 1.9
334 749
89 45 89
41.0 (B.I) 93.4 (B,R) 40.0 (B.I)
95 0.3.1.5(100) WD-OS WD-OS GN-OS
WEB WEB EDGE
242 36.0 35.3
2.0 2.0
456 1.039
97 60
84.0 (B.I) 39.3 (B*) —
— TW-ES NONE
EDGE EDGE
IC
243 36.0
35.3
2.0
1.9
427
691 87
84.0 (B.I)
35.3 (B.R) — —
TW.WR-OS; WR-OS TW.WR-OS; TW-OS
EDGE
WEB
SI SC
'Coding systen at end of Table B3

TABLE H-2 SUMMARY OF DATA FOR FLANGE SPLICE BEAMS-A441 STEEL
BEAM FS8 NO.
STRESS AT CYCLES TO CRACK FAILURE
~ S TT^ X 10' min
Z Nj NO VISIBLE CRACKS LOCATION
nMPRVATTON'S OF CRACK INITIATION ASP FAILURE MODE* GT^m r. CRACKINr. ^ '""' INITlATiO.M
i Nj SIZE IN.. (Z) TYPE SAWED JOINTS
311 17.8 13.8 17.9 -13.9
9.641 47 47
35.5 (B.I) 48 38.6 (T.I) ~
0.8, 0 WR-OS;TW-OS NONE
WEB WEB TD
312 13.0 10 .2 10.554 94 62.0 (B.I) ~ NONE WEB TD
313 18.0 14.0 18.0 14.0
3,068 14,942
85 100
84.0 (B.I) — TW-OS EDGE GD
221 22.6 1.9 22.3 1.8 17.4 1.4
1,859 2,627
66 71
35 0 (B.l) 83.6 (B.R) 74.8 (T.I)
~ NONE TW-OS TW.WR-OS
WEB EDGE WEB
CD LLF
222 24.0 2.0 24.0 2.0
1,592 1,917
57 89
84.0 (B.I) 36.0 (B.R) 93 SURFACE CRACK
TW-OS TW-OS
EDGE WEB
223 24.0 2.0 24.1 2.0
828 1,035 80
84.0 (B.I) 39.5 (B.R) 90 0.6. 0
TW-OS.CD TW, WR-OS
EDGE WEB
GD
321 24.0 14.0 22.3 13.1
1.239 2.289
89 89
84.0 (B.I) 40.3 (B.R) —
TW-OS WR-OS
EDGE WEB
322 20.3 11.8 24.0 14.0
2.520 10.499 100
'30.4 (B.I) — — WR-OS WEB TD
323 24.0 14.0 24.3 14.2
1,366 3.056 96
84.0 (B.I) 36.4 (B.R)
— — TW-OS TW-OS
EDGE EDGE
GD GD
131 29.8 -9.9 28.0 -9.3 25.7 8.6
1.147 1,288
90 89 90
35.8 (B.I) 86.4 (B.R) 41.0 ( T . l l
95 SURFACE CRACK TW-OS EDGE TW-OS ; W R - O S EDGE WR-OS WEB
IC, TD
132 29.6 -9 . 9 29.2 9.8
1,321 1.491
49 89
39.3 (B.I) 85.0 (T.R) 97 0.8. 0
NONE TW-OS
EDGE WEB LGP
133 24.5 8.2 27.9 -9.3 29.6 -9.9 21.7 -7.2
1.201 1,523
93 79
42.8 (T,I) 85.6 (B.R) 39.0 (B.I) 72.7 (T.I)
~ —
NONE TW-OS NONE WR-OS
WEB WEB WEB WEB
231 25.8 1.7 29.0 1.9 30.3- 2.0
422 970 43
84.0 (B,I) 34.8 (B.R) 36.8 (T.R)
TW-OS EDGE WR-OS ;TW-OS WEB WR-OS WEB
ND
S
232 30.0 2.0 27.5 1.8
949 1,498
89 79
84.0 (B.I) 33.0 (B.R) 90 SURFACE CRACK
TW-BS WEB TW-OS J WR-OS WEB
TD TD
233 27.9 1.9 28.6 1.9
1,091 1.375
77 80
86.5 (B.I) 34.3 (B.R)
88 SURFACE CRACK NONE WD-OS
WEB WEB
331 30.0 14.0 30.6 14.3
514 560
74 92
84.0 (B.I) 37.5 (B.R) — —
TW-OS WR-OS
EDGE WEB
332 28.1 13.1 30.8 14.4
818 1.414 82
86.4 (B.I) 37.0 (B.R)
97 0.4. 0.4(27) WR-OS ;TW-OS WEB NONE WEB
S TD
333 30.0 14.4 30.0 14.4
521 1,354 39
84.0 (B,I) 36.0 (B.R)
— —
TW-BS TW-BS
EDGE EDGE
IC SI
141 36.0 10.0 36.0 -10.0
425 839 51
36.0 (T.I) 84.0 (B.R)
~ —
TW-OS;WR-OS WEB TW-OS EDGE
POOR GD
142 36.0 -10.0 34.2 -9.5
733 776 95
84.0 (B.I) 40.0 (B.R) 96 SURFACE CRACK
TW-OS HONE
EDGE WEB
IC
143 35.5 9.9 33.2 -9.2
636 961
36 66
39.3 (T.I) 86.8 (B.R)
95 1.3. 1.5(37) WR-OS TW.WS-OS
WEB WEB
241 35.7 2.0 36.4 2.0 29.2 -1.6 27.0 1.5
505 821
78 62
84.6 (B.I) 37.0 (B.R) 42.5 (T.R) 44.0 (B.R)
— —
TW-OS TW-OS WR-OS WR-OS
EDGE WEB WEB WEB
ND
LP. S
242 35. 1.9 36.0 2.0
288 288
39.0 (B.I) 84.0 (B.R) — —
WR-OS NONE
WEB EDGE ND
243 36.0 2.0 35.4 2.0
299 775 56
84.0 (B.I) 39.0 (B.R) — —
TW-OS ;WIl-OS EDGE HD TW-OS WEB TD
341 35.8 14.0 35.0 13.6
543 989
63 67
38.8 (B.I) 85.0 (BJl) 9 7 0.8. 0
WR-OS TW-OS
WEB WEB
342 36.0 14.0 30.8 12.0
333 471
73 71
84.0 (B,I) 40.9 (B,R) —
— NONE WD-OS
EDGE WEB
343 36.0 14.0 34.3 7.9
325 511 64
84.0 (B,I) 34.5 (B«)
— TH-BS WD-OS, •RJ-OC
EDGE WEB
ND
*Codlng system at end of Table H 3
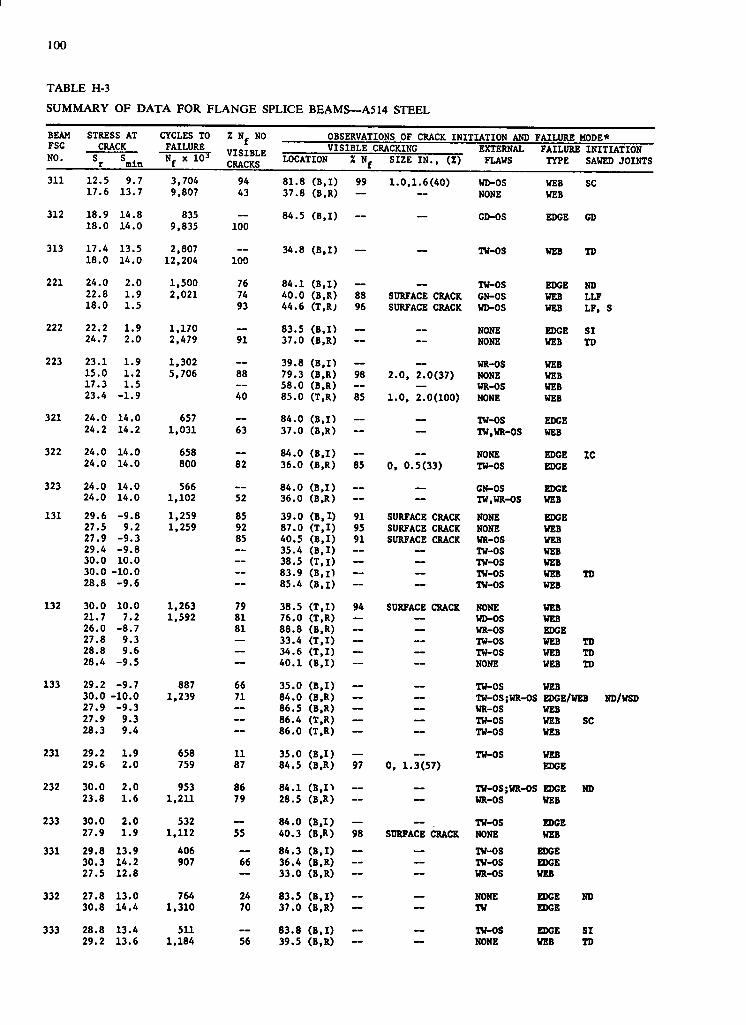
100
TABLE H-3 SUMMARY OF DATA FOR FLANGE SPLICE BEAMS—ASM STEEL
BEAM FSC N O .
STRESS AT CRACK
CYCLES TO FAILURE
% NO VISIBLE CRACKS
OBSERVATIONS OF CRACK INITIATION AND FAILURE MODE* BEAM FSC N O .
STRESS AT CRACK
CYCLES TO FAILURE
% NO VISIBLE CRACKS
VISIBLE CRACKING EXTERNAL FLAWS
FAILURE TYPE
INITIATION SAWED JOINTS
BEAM FSC N O . S
r X 10^
% NO VISIBLE CRACKS LOCATION X Nj SIZE IN.. (Z)
EXTERNAL FLAWS
FAILURE TYPE
INITIATION SAWED JOINTS
311 12.5 9.7 3,704 94 81.8 (B.I) 99 1.0.1.6(40) WD-OS WEB SC 17.6 13.7 9,807 43 37.8 (B.R) — ~ NONE WEB
312 18.9 14.8 835 84.5 (B.I) GD-OS EDGE CD 18.0 14.0 9,835 100
313 17.4 13.5 2,807 34.8 (B.I) TW-OS WEB TD 18.0 14.0 12,204 100
221 24.0 2.0 1,500 76 84.1 (B,I) TW-OS EDGE ND 22.8 1.9 2,021 74 40.0 (B.R) 88 SintFACE CRACK GN-OS WEB LLF 18.0 1.5 93 44.6 (T.R; 96 SURFACE CRACK WD-OS WEB LF. S
222 22.2 1.9 1,170 83.5 (B.I) _ NONE EDGE SI 24.7 2.0 2,479 91 37.0 (B.R) — NONE WEB TD
223 23.1 1.9 1,302 — 39.8 (B.I) WR-OS WEB 15.0 1.2 5,706 88 79.3 (B.R) 98 2.0. 2.0(37) NONE WEB 17.3 1.5 — 58.0 (B.R) — — WR-OS WEB 23.4 -1.9 40 85.0 (T.R) 85 1.0. 2.0(100) NONE WEB
321 24.0 14.0 657 — 84.0 (B.I) TW-OS EDGE 24.2 14.2 1,031 63 37.0 (B.R) — — TW,WR-OS WEB
322 24.0 14.0 658 — 84.0 (B.I) NONE EDGE IC 24.0 14.0 800 82 36.0 (B.R) 85 0, 0.5(33) TW-OS EDGE
323 24.0 14.0 566 84.0 (B.I) GN-OS EDGE 24.0 14.0 1,102 52 36.0 (B.R) — — TW,WR-OS WEB
131 29.6 -9.8 1,259 85 39.0 (B.I) 91 SURFACE CRACK NONE EDGE 27.5 9.2 1,259 92 87.0 ( T . I ) 95 SURFACE CRACK NONE WEB 27.9 -9.3 85 40.5 (B.I) 91 SURFACE CRACK WR-OS WEB 29.4 -9.8 — 35.4 (B.I) — — TW-OS WEB 30.0 10.0 — 38.5 ( T . I ) — — TW-OS WEB 30.0 -10.0 — 83.9 (B.i) — — TW-OS WEB TD 28.8 -9.6 — 85.4 (B.I) — — TW-OS WEB
132 30.0 10.0 1.263 79 38.5 ( T . I ) 94 SURFACE CRACK NONE WEB 21.7 7.2 1,592 81 76.0 (T.R) — — WD-OS WEB 26.0 -8.7 81 88.8 (B.R) — — WR-OS EDGE 27.8 9.3 — 33.4 ( T . I ) — — TW-OS WEB TD 28.8 9.6 — 34.6 ( T . I ) — — TW-OS WEB TD 28.4 -9.5 — 40.1 (B.I) — — NONE WEB TD
133 29.2 -9.7 887 66 35.0 (B.I) TW-OS WEB 30.0 -10.0 1,239 71 84.0 (B.R) — — TW-OS;WR-OS EDGE/WEB ND/WSD 27.9 -9.3 — 86.5 (B.R) — — WR-OS WEB 27.9 9.3 — 86.4 (T.R) — — TW-OS WEB SC 28.3 9.4 — 86.0 (T.R) — — TW-OS WEB
231 29.2 1.9 658 11 35.0 (B.I) TW-OS WEB 29.6 2.0 759 87 84.5 (B.R) 97 0. 1.3(57) EDGE
232 30.0 2.0 953 86 84.1 ( B . l t TW-OS:WR-OS EDGE ND 23.8 1.6 1.211 79 28.5 (B.R) — — WR-OS WEB
233 30.0 2.0 532 84.0 (B.I) TW-OS EDGE 27.9 1.9 1,112 55 40.3 (B.R) 98 SURFACE CRACK NONE WEB
331 29.8 13.9 406 — 84.3 (B.I) — — TW-OS EDGE 30.3 14.2 907 66 36.4 (B.R) — — TW-OS EDGE 27.5 12.8 — 33.0 (B.R) — — WR-OS WEB
332 27.8 13.0 764 24 83.5 (B,I) NONE EDGE ND 30.8 14.4 1,310 70 37.0 (B.R) — — TW EDGE
333 28.8 13.4 511 83.8 (B.I) TW-OS EDGE SI 29.2 13.6 1.184 56 39.5 (B.R) — — NONE WEB TD
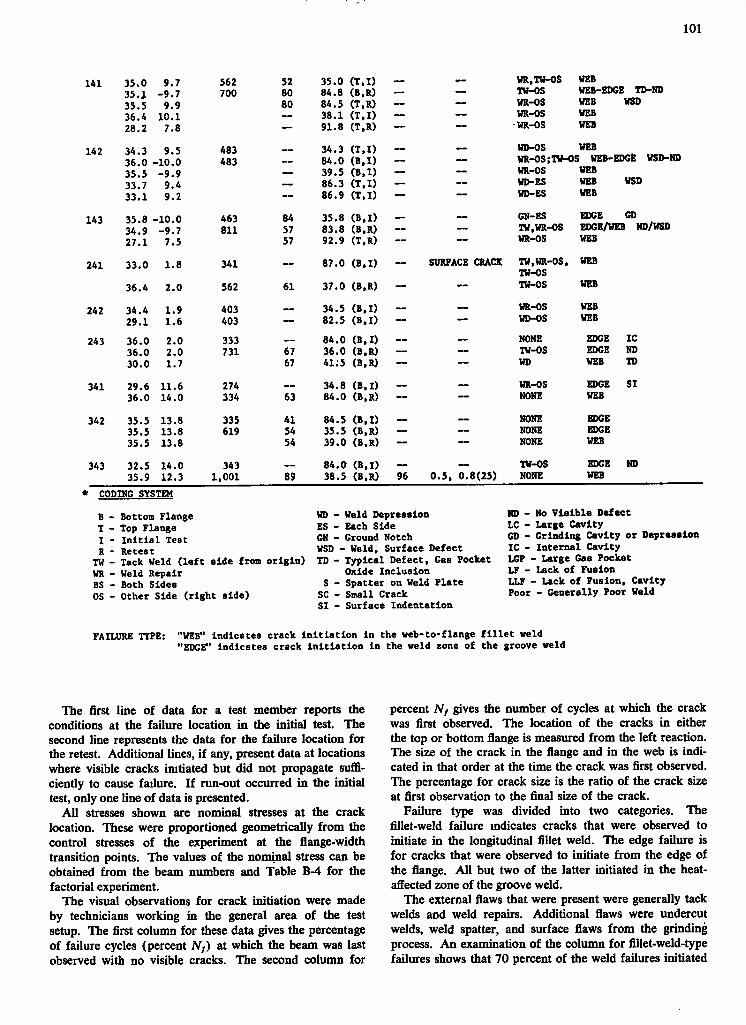
101
141
142
143
241
242
243
341
342
343
35.0 9.7 562 52 35.0 ( T . I ) — — WR, TV-OS WEB 35.J. -9.7 700 80 84.8 (B.R) — — TU-OS WEB-EDGE TD-HD 35.5 9.9 80 84.5 (T.R) — — WR-OS WEB WSD 36.4 10.1 — 38.1 ( T , I ) — — WR-OS WEB 28.2 7.8 — 91.8 (T.R) — — -WR-OS WEB
34.3 9.5 483 34.3 ( T . I ) WD-OS WEB 36.0 -10.0 483 — 84.0 (B . I ) — — WR-OS;TW-0S WEB-EDGE WSD-ND 35.5 -9.9 — 39.5 (B . I ) — — WR-OS WEB
WSD 33.7 9.4 — 86.3 (T . I ) — — WD-ES WEB WSD 33.1 9.2 ~ 86.9 ( T . l ) — — WD-ES WEB
35.8 -10.0 463 84 35.8 (B . I ) GN-ES EDGE CD 34.9 -9.7 811 57 83.8 (B.R) — — TW,WR-OS EDGE/WEB ND/WSD 27.1 7.5 57 92.9 (T.R) — — WR-OS WEB
33.0 1.8 341 87.0 (B.I) SU8PACE CRACK TW,WR-OS, WEB 33.0 1.8 TW-OS 36.4 2.0 562 61 37.0 (B.R) — — TW-OS WEB
34.4 1.9 403 34.5 (B.I) — WR-OS WEB 29.1 1.6 403 — 82.5 (B.I) — — WI>-OS WEB
36.0 2.0 333 — 84.0 (B.I) — — NONE EDGE IC 36.0 2.0 731 67 36.0 (B.R) — TW-OS EDGE ND 30.0 1.7 67 41;5 (B.R) — — WD WEB ID
29.6 11.6 274 34.8 (B . I ) WR-OS EDGE SI 36.0 14.0 334 63 84.0 (B.R) — — NOME WEB
35.5 13.8 335 41 84.5 (B.I) NONE EDGE 35.5 13.8 619 54 35.5 (B.R) — — NONE EDGE 35.5 13.8 54 39.0 (B.R) — — NONE WEB
32.5 14.0 343 84.0 (B.I) — TW-OS EDGE ND 35.9 12.3 1,001 89 38.5 (B.R) 96 0.5, 0.8(25) NONE WEB
* CODING SYSTEM
B - Bottom Flange WD - Weld Depression T - Top Flange ES - Each Side I - I n i t i a l Test GN - Ground Notch R - Retes t WSD • - Weld. Surface Defect TW - Tack Weld ( l e f t side from origin) TD - Typical Defect. Gas Pocket WR - Weld Repair Oxide Inclusion BS - Both Sides s - Spatter on Weld Plate OS - Other Side (right side) sc - Small Crack Other Side (right side)
SI - Surface Indentation
ND - No V i s i b l e Defect I C - Large Cavity CD - Grinding Cavity or Depression IC - Int e r n a l Cavity LGP - Large Gas Pocket LF - Lack of Fusion LLF - Lack of Fusion. Cavity Poor - Generally Poor Weld
FAILURE TYPE: "WEB" Indicates crack i n i t i a t i o n i n the web-to-flange f i l l e t weld "EDGE" indicates crack I n i t i a t i o n i n the weld lone of the groove weld
The first line of data for a test member reports the conditions at the failure location in the initial test. The second line represents the data for the failure location for the retest. Additional lines, if any, present data at locations where visible cracks imtiated but did not propagate sufficiently to cause failure. I f run-out occurred in the initial test, only one line of data is presented.
A l l stresses shown are nominal stresses at the crack location. These were proportioned geometrically from the control stresses of the experiment at the flange-width transition points. The values of the nominal stress can be obtained from the beam numbers and Table B-4 for the factorial experiment.
The visual observations for crack initiation were made by technicians working in the general area of the test setup. The first column for these data gives the percentage of failure cycles (percent N,) at which the beam was last observed with no visible cracks. The second column for
percent Nf gives the number of cycles at which the crack was first observed. The location of the cracks in either the top or bottom flange is measured from the left reaction. The size of the crack in the flange and in the web is indicated in that order at the time the crack was first observed. The percentage for crack size is the ratio of the crack size at first observation to the final size of the crack.
Failure type was divided into two categories. The fillet-weld failure mdicates cracks that were observed to initiate in the longitudinal fillet weld. The edge failure is for cracks that were observed to initiate from the edge of the flange. A l l but two of the latter initiated in the heat-affected zone of the groove weld.
The external flaws that were present were generally tack welds and weld repairs. Additional flaws were undercut welds, weld spatter, and surface flaws from the grinding process. An examination of the column for fillet-weld-type failures shows that 70 percent of the weld failures initiated
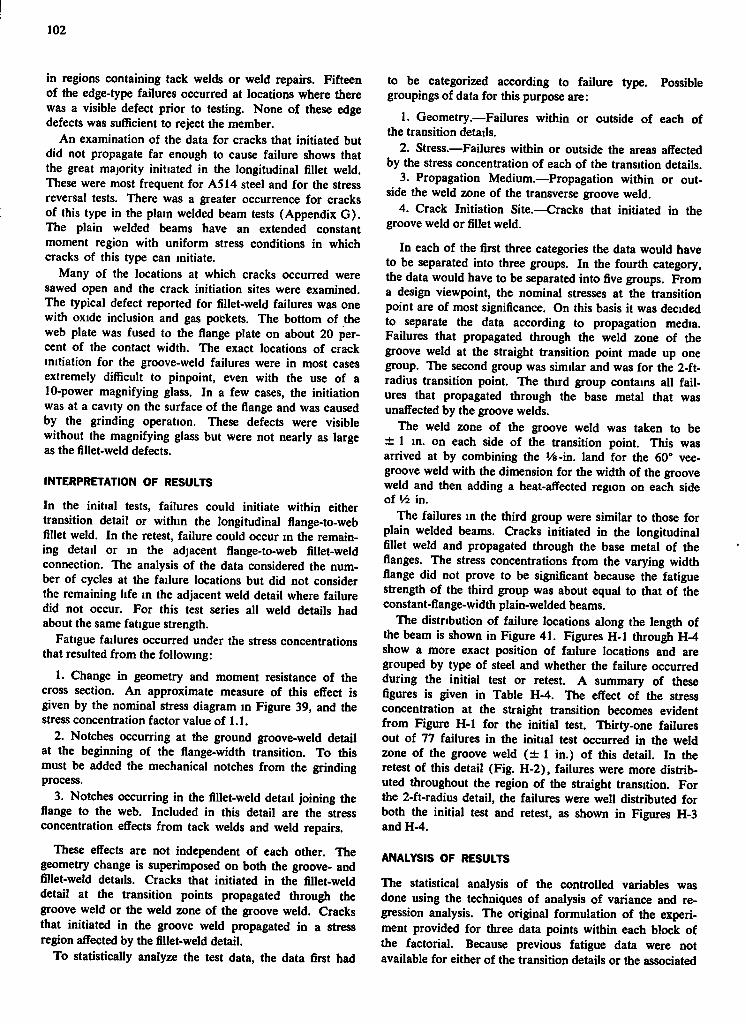
102
in regions containing tack welds or weld repairs. Fifteen of the edge-type failures occurred at locations where there was a visible defect prior to testing. None of these edge defects was sufficient to reject the member.
An examination of the data for cracks that initiated but did not propagate far enough to cause failure shows that the great majority initiated in the longitudinal fillet weld. These were most frequent for ASM steel and for the stress reversal tests. There was a greater occurrence for cracks of this type in the plain welded beam tests (Appendix G) . The plain welded beams have an extended constant moment region with uniform stress conditions in which cracks of this type can initiate.
Many of the locations at which cracks occurred were sawed open and the crack initiation sites were examined. The typical defect reported for fillet-weld failures was one with oxide inclusion and gas pockets. The bottom of the web plate was fused to the flange plate on about 20 percent of the contact width. The exact locations of crack initiation for the groove-weld failures were in most cases extremely difficult to pinpoint, even with the use of a 10-power magnifying glass. In a few cases, the initiation was at a cavity on the surface of the flange and was caused by the grinding operation. These defects were visible without the magnifying glass but were not nearly as large as the fillet-weld defects.
INTERPRETATION OF RESULTS
In the initial tests, failures could initiate within either transition detail or within the longitudinal flange-to-web fillet weld. In the retest, failure could occur in the remaining detail or in the adjacent flange-to-web fillet-weld connection. The analysis of the data considered the number of cycles at the failure locations but did not consider the remaining life in the adjacent weld detail where failure did not occur. For this test series all weld details had about the same fatigue strength.
Fatigue failures occurred under the stress concentrations that resulted from the following:
1. Change in geometry and moment resistance of the cross section. An approximate measure of this effect is given by the nominal stress diagram in Figure 39, and the stress concentration factor value of 1.1.
2. Notches occurring at the ground groove-weld detail at the beginning of the flange-width transition. To this must be added the mechanical notches from the grinding process.
3. Notches occurring in the fillet-weld detail joining the flange to the web. Included in this detail are the stress concentration effects from tack welds and weld repairs.
These effects are not independent of each other. The geometry change is superimposed on both the groove- and fillet-weld details. Cracks that initiated in the fillet-weld detail at the transition points propagated through the groove weld or the weld zone of the groove weld. Cracks that initiated in the groove weld propagated in a stress region affected by the fillet-weld detail.
To statistically analyze the test data, the data first had
to be categorized according to failure type. Possible groupings of data for this purpose are:
1. Geometry.—Failures within or outside of each of the transition details.
2. Stress.—Failures within or outside the areas affected by the stress concentration of each of the transition details.
3. Propagation Medium.—Propagation within or outside the weld zone of the transverse groove weld.
4. Crack Initiation Site.—Cracks that initiated in the groove weld or fillet weld.
In each of the first three categories the data would have to be separated into three groups. In the fourth category, the data would have to be separated into five groups. From a design viewpoint, the nominal stresses at the transition point are of most significance. On this basis it was decided to separate the data according to propagation media. Failures that propagated through the weld zone of the groove weld at the straight transition point made up one group. The second group was similar and was for the 2-ft-radius transition point. The third group contains all failures that propagated through the base metal that was unaffected by the groove welds.
The weld zone of the groove weld was taken to be ± 1 in. on each side of the transition point. This was arrived at by combining the Vs-in. land for the 60° vee-groove weld with the dimension for the width of the groove weld and then adding a heat-affected region on each side of V4 in.
The failures in the third group were similar to those for plain welded beams. Cracks initiated in the longitudinal fillet weld and propagated through the base metal of the flanges. The stress concentrations from the varying width flange did not prove to be significant because the fatigue strength of the third group was about equal to that of the constant-flange-width plain-welded beams.
The distribution of failure locations along the length of the beam is shown in Figure 41. Figures H-1 through H-4 show a more exact position of failure locations and are grouped by type of steel and whether the failure occurred during the initial test or retest. A summary of these figures is given in Table H-4. The effect of the stress concentration at the straight transition becomes evident from Figure H-1 for the initial test. Thirty-one failures out of 77 failures in the initial test occurred in the weld zone of the groove weld ( ± 1 in.) of this detail. In the retest of this detail (Fig. H-2), failures were more distributed throughout the region of the straight transition. For the 2-ft-radius detail, the failures were well distributed for both the initial test and retest, as shown in Figures H-3 and H-4.
ANALYSIS OF RESULTS
The statistical analysis of the controlled variables was done using the techniques of analysis of variance and regression analysis. The original formulation of the experiment provided for three data points within each block of the factorial. Because previous fatigue data were not available for either of the transition details or the associated
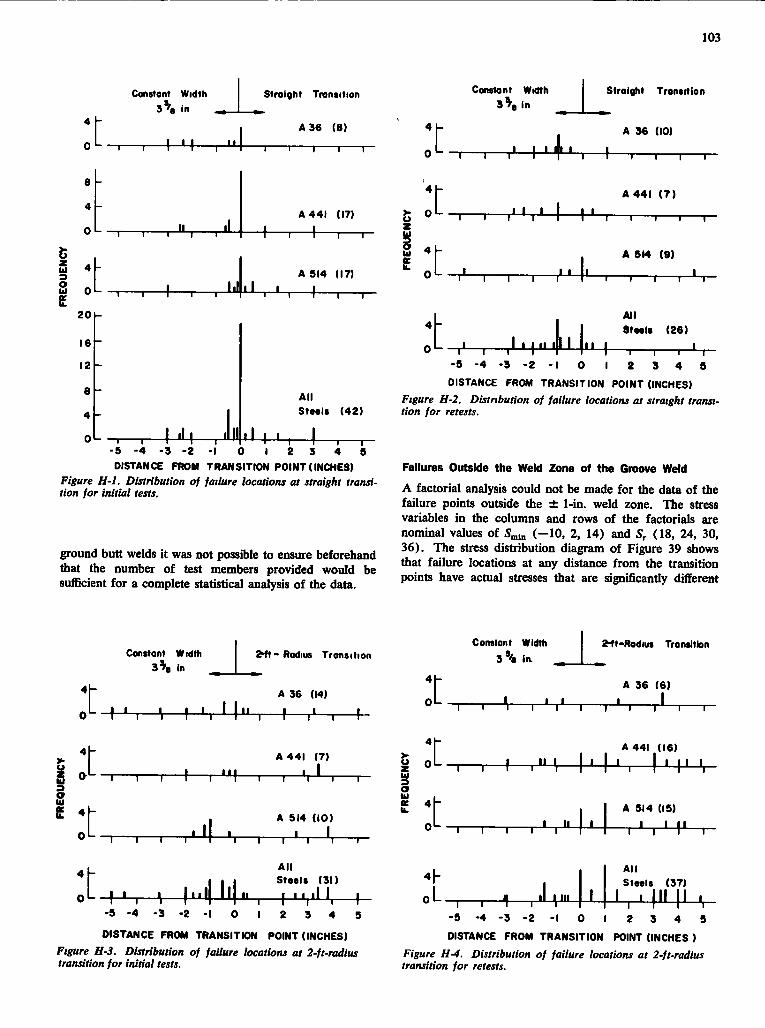
103
4 -
0 -
8 -
4 -
0 -
3 O 111 s.
Constant Width 3% in ^
I I I I I
Straight Transition
A 36 (8)
1 1 1 I 1
i l
1 1 1 1 1 1
A 441 (17) 1 1
1 1 1 1 1
^ h—^
1 1 1 1 1
A 514 (17)
^ J - r - L - , 1 1 1 -
20
16
12
8
4 h
0
All
1 Staei* (42)
• , I ' l l • i l l . - 5 - 4 - 3 - 2 - 1 0 I 2 3 4 5 DISTANCE FROM TRANSITION POINT (INCHES)
Figure H-1. Distribution of failure locations at straight transition for initial tests.
ground butt welds it was not possible to ensure beforehand that the number of test members provided would be sufficient for a complete statistical analysis of the data.
Constant Wi«h 3% in
T r . " • • I I
Straight Transition
A 36 (10)
o*- , , ,» I " I " • I , , , ,
4 -
z
S 41
A 441 (7)
T 1 1 1 r
r — I — r
A 514 (9)
" »• , , ^ ^
4 -
ft' i J -
All
StMis (26)
l ' M"'! ' ' I" I ^ L 1 1—^T— - 5 - 4 - 3 - 2 - 1 0 I 2 3 4 5 DISTANCE FROM TRANSITION POINT (INCHES)
Figure H-2. Distribution of failure locations at straight transition for retests.
Failures Outside the Weid Zone of the Groove Weld
A factorial analysis could not be made for the data of the failure points outside the ± 1-in. weld zone. The stress variables in the columns and rows of the factorials are nominal values of 5„in (—10, 2, 14) and (18, 24, 30, 36). The stress distribution diagram of Figure 39 shows that failure locations at any distance from the transition points have actual stresses that are significantly differeot
Constant Width 3% in
2^-Radius Transition
4 -
4 -
\ -
»-
A 36 (14)
M l \ I ' i M " I I •• r — r
A 441 (7)
S O " - - ! \ \ 1 I " I I T
s e 4
1 \ 1 ^ r—T . r
A 514 (10) I • I.
M i l
^ ~ I I I Steals (31)
- 5 - 4 - 3 - 2 - 1 0 I 2 3 4 5
DISTANCE FROM TRANSITION POINT (INCHES) Figure H-3. Distribution of failure locations at 2-ft-radius transition for initial tests.
Constant Width 3% ia
2^t-Radius Transition
z °
ui
4 -
0 -
4 -
0 -
4 -
ftL
A 36 (6)
' • , \ I • ' • • • •
A 441 (16)
• • I I 'M I • I • , I ' M '
A 514 (15) , I , II - I . I . I I I o " - - ! r
4|-
I • I
All Staals (37)
I , I |ll |l I, -5 -4 -3 -2 - 1 0 1 2 3 4 5 DISTANCE FROM TRANSITION POINT (INCHES )
Figure H-4. Distribution of failure locations at 2-ft-radius transition for retests.
I
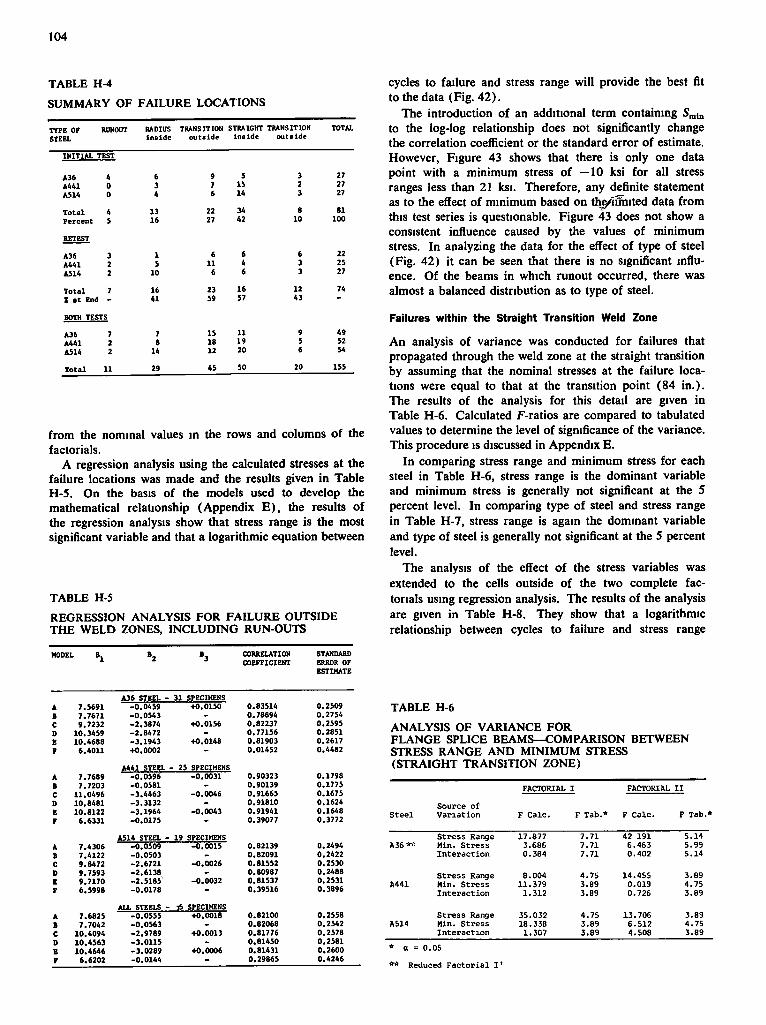
104
TABLE H-4 SUMMARY OF FAILURE LOCATIONS
TYPE OF RUNOUT RADIUS TRANSITION STRAIGHT TRANSITION TOTAL STEEL inside outside insIde outside
INITIAL TEST
A36 4 6 9 5 3 27 A441 0 3 7 IS 2 27 ASIA 0 4 6 14 3 27 Total 4 13 22 34 8 81 Percent i 16 27 42 10 100 RETEST A36 3 1 6 6 6 22 A441 2 S 11 4 3 2S A314 2 10 6 « 3 27 Total 7 16 23 16 12 74 X at End - 41 59 S7 43 -BOTH TESTS A36 7 7 IS 11 9 49 A441 2 8 18 19 S 52 AS14 2 14 12 20 t S4 Total 11 29 4S SO 20 ISS
from the nominal values in the rows and columns of the factorials.
A regression analysis using the calculated stresses at the failure locations was made and the results given in Table H-5. On the basis of the models used to develop the mathematical relationship (Appendix E) , the results of the regression analysis show that stress range is the most significant variable and that a logarithmic equation between
TABLE H-5 REGRESSION ANALYSIS FOR FAILURE OUTSIDE THE WELD ZONES, INCLUDING RUN-OUTS
cycles to failure and stress range will provide the best fit to the data (Fig. 42).
The introduction of an additional term containing S„,n to the log-log relationship does not significantly change the correlation coefficient or the standard error of estimate. However, Figure 43 shows that there is only one data point with a minimum stress of —10 ksi for all stress ranges less than 21 ksi. Therefore, any definite statement as to the effect of minimum based on thg^iimited data from this test series is questionable. Figure 43 does not show a consistent influence caused by the values of minimum stress. In analyzing the data for the effect of type of steel (Fig. 42) it can be seen that there is no significant influence. Of the beams in which runout occurred, there was almost a balanced distribution as to type of steel.
Failures within the Straight Transition Weld Zone
An analysis of variance was conducted for failures that propagated through the weld zone at the straight transition by assuming that the nominal stresses at the failure locations were equal to that at the transition point (84 in.). The results of the analysis for this detail are given in Table H-6. Calculated F-ratios are compared to tabulated values to determine the level of significance of the variance. This procedure is discussed in Appendix E.
In comparing stress range and minimum stress for each steel in Table H-6, stress range is the dominant variable and minimum stress is generally not significant at the S percent level. In comparing type of steel and stress range in Table H-7, stress range is again the dominant variable and type of steel is generally not significant at the S percent level.
The analysis of the effect of the stress variables was extended to the cells outside of the two complete factorials using regression analysis. The results of the analysis are given in Table H-8. They show that a logarithmic relationship between cycles to failure and stress range
CORRELATION COEFFICIENT
STANDARD ERROR OF ESTIMATE
A36 STEEL - 31 SPECIMENS A 7.5691 -0.04S9 -fO.OlSO 0.83514 B 7.7671 -O.0S43 - 0.78894 C 9.7232 -2.3874 40.0156 0.82237 D 10.34S9 -2.8472 - 0.771S6 E 10.4688 -3.1943 40.0148 0.81903 F 6.4011 40.0002 - 0,01452
A441 STEEL - 25 SPECIMENS A 7.7689 -0.0596 -0.0031 0.90323 B 7.7203 -O.OSSl - 0.90139 C 11.0496 -3.4463 -0.0046 0.9166S D 10.8481 -3.3132 - 0.91810 E 10.8122 -3.1964 -0.0043 0.91941 F 6.6331 -0.0175 - 0.39077
A514 STEEL - 19 SPECIMENS A 7.4306 -0.0S09 -0.0015 0.82139 B 7.4122 -0.0503 - 0.82091 C 9.8472 -2.6721 -0.0026 0.81SS2 D 9.7S93 -2.6138 - 0.80987 E 9.7170 -2.S18S -0.0032 0.81S37 r 6.S998 -0.0178 - 0.39516
ALL STEELS - TS SPECIMENS A 7.6825 -0.0555 40.0018 0.82100 B 7.7042 -0.0563 - 0.82068 C 10.4094 -2.9789 40.0013 0.81776 D 10.4563 -3.0115 - 0.81450 E 10.4646 -3.0289 40.0006 0.81431 r 6.6202 -0.0144 - 0.29865
0.2509 0.2754 0.2595 0.2851 0.2617 0.4482
0.1798 0.1775 0.1675 0.1624 0.1648 0.3772
0.2494 0.2422 0.2530 0.2488 0.2531 0.3896
0.2SS8 0.2542 0.2578 0.2581 0.2600 0.4246
TABLE H-6 ANALYSIS OF VARIANCE FOR FLANGE SPLICE BEAMS—COMPARISON BETWEEN STRESS RANGE AND MINIMUM STRESS (STRAIGHT TRANSITION ZONE)
FACTORIAL I FACTORIAL I I
steel Source of Variation F Calc. F Tab.* F Calc. F Tab.*
A36** stress Range Mln. Stress Interaction
17.877 3.686 0.384
7.71 7.71 7.71
42 191 6.463 0.402
5.14 5.99 5.14
ft441 Stress Range Min. stress Interaction
8.004 11.379 1.312
4.75 3.89 3.89
14.455 0.019 0.726
3.89 4.75 3.89
A 514 Stress Range Min. Stress Interaction
35.032 18.338 1.307
4.75 3.89 3.89
13.706 6.512 4.508
3.89 4.75 3.89
* a = 0.05 ** Reduced Factorial I *
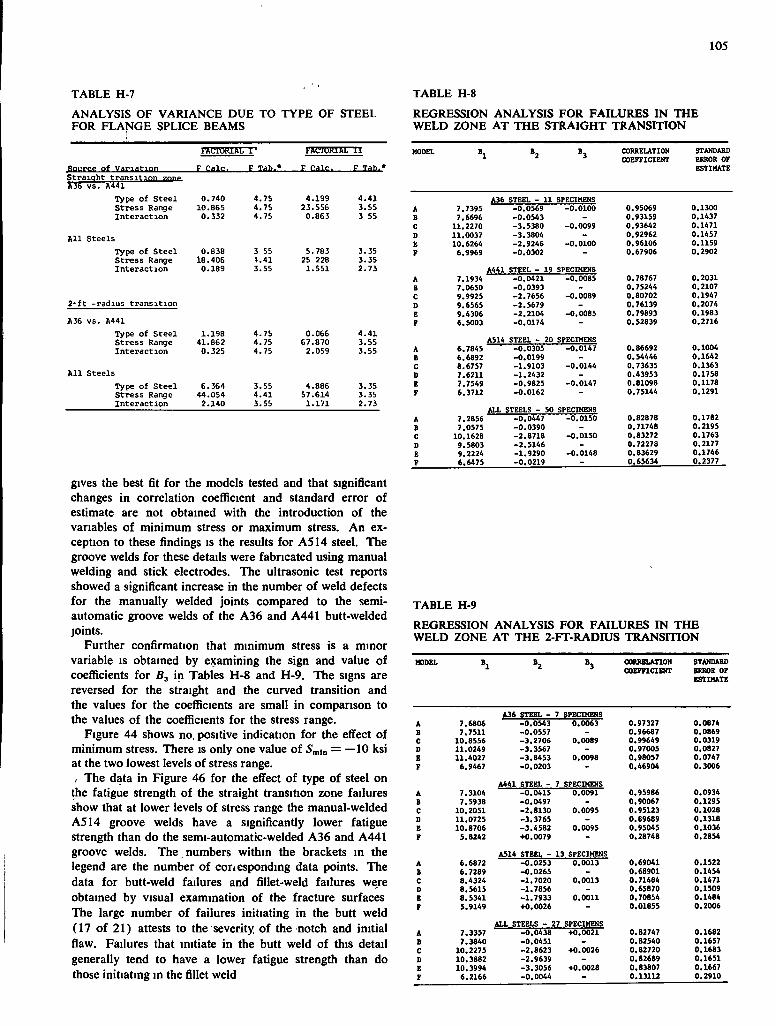
105
TABLE H-7 ANALYSIS OF VARIANCE DUE TO TYPE OF STEEL FOR FLANGE SPLICE BEAMS
TABLE H-8 REGRESSION ANALYSIS FOR FAILURES IN THE WELD ZONE AT THE STRAIGHT TRANSITION
FACTORIftL I ' FACTORIAL I I
Soiirce of Varifltj.on straight t r a n s i t i o n znng A3E vs. A441
F CfllC. F Tab. F f^alc. F Tab.* CORRELATION OOEFFICIEOT
STANDARD ERROR OF ESTIMATE
Type of St e e l 0.740 4.75 4.199 4.41 A36 STEEL - 11 SPECIMENS Stress Range 10.865 4.75 23.556 3.55 A 7.7395 -0.0569 -0.0100 0.9S069 0.1300 Interaction 0.332 4.75 0.863 3 55 B 7.6696 -0.0543 - 0.93159 0.1437
C 11.2270 -3.5380 -0.0099 0.93642 0.1471 D 11.0037 -3.3804 - 0.92962 0.1457
e E 10.6264 -2.9246 -0.0100 0.96106 0.1159 Type of Steel 0.B38 3 55 5.783 3.35 F 6.9969 -0.0302 - 0.67906 0.2902 Stress Range Interaction
2-ft -radius t r a n s i t i o n
A36 vs. A441 Type of St e e l Stress Range Interaction
A l l Steels Type of St e e l Stress Range Interaction
18.406 0.189
1.198 41.862 0.325
6.364 44.054 2.140
4.41 3.55
4.75 4.75 4.75
3.55 4.41 3.55
25 228 1.551
0.066 67.870 2.059
4.886 57.614 1.171
3.35 2.73
4.41 3.55 3.55
3.35 3.35 2.73
gives the best fit for the models tested and that significant changes in correlation coefficient and standard error of estimate are not obtained with the introduction of the variables of minimum stress or maximum stress. An exception to these findings is the results for A S H steel. The groove welds for these details were fabricated using manual welding and stick electrodes. The ultrasonic test reports showed a significant increase in the number of weld defects for the manually welded joints compared to the semiautomatic groove welds of the A36 and A441 butt-welded joints.
Further confirmation that minimum stress is a minor variable is obtained by examining the sign and value of coefficients for B3 in Tables H-8 and H-9. The signs are reversed for the straight and the curved transition and the values for the coefficients are small in comparison to the values of the coefficients for the stress range.
Figure 44 shows no, positive indication for the effect of minimum stress. There is only one value of 5min = —10 ksi at the two lowest levels of stress range. , The data in Figure 46 for the effect of type of steel on
the fatigue strength of the straight transition zone failures show that at lower levels of stress range the manual-welded ASM groove welds have a significantly lower fatigue strength than do the semi-automatic-welded A36 and A441 groove welds. The . numbers within the brackets in the legend are the number of coriesponding data points. The data for butt-weld failures and fillet-weld failures were obtained by visual examination of the fracture surfaces The large number of failures initiating in the butt weld (17 of 21) attests to the severity of the notch and initial flaw. Failures that initiate in the butt weld of this detail generally tend to have a lower fatigue strength than do those initiating in the fillet weld
A441 STEEL - 19 SPECIMEMS A 7.1934 -0.0421 -0.0085 0.78767 0.2031 B 7.0650 -0.0393 - 0.7S244 0.2107 C 9.9925 -2.7656 -0.0089 0.80702 0.1947 D 9.6565 -2.S679 - 0.76139 0.2074 E 9.4306 -2.2104 -0.0085 0.79893 0.1983 F 6.5003 -0.0174 - 0.52839 0.2716
A514 STEEL - 20 SPECIMENS A 6.7845 -0.0305 -0.0147 0.86692 0.1004 B 6.6892 -0.0199 - 0.54446 0.1642 C 8.6757 -1.9103 -0.0144 0.73635 0.1363 D 7.6211 -1.2432 - 0.43953 0.1758 E 7.7549 -0.9825 -0.0147 0.81098 0.1178 F 6.3712 -0.0162 - 0.75144 0.1291
ALL STEELS - 50 SPECIMENS A 7.2856 -0.0447 -0.0150 0.82878 0.1782 B 7.0575 -0.0390 - 0.71748 0.2195 C 10.1628 -2.8718 -0.0150 0.83272 0.1763 D 9.5803 -2.5146 - 0.72278 0.2177 E 9.2224 -1.9290 -0.0148 0.83629 0.1746 F 6.6475 -0.0219 - 0.65634 0.2377
TABLE H-9 REGRESSION ANALYSIS FOR FAILURES IN THE WELD ZONE AT THE 2-FT-RADIUS TRANSITION
CORRELATION STANDARD COEFFICTENT ERROR OF
ESTIMATE
A36 STEEL - 7 SPECIMENS A 7.6806 -0.0543 0.0063 0.97327 0.0874 B 7.7511 -0.0557 - 0.96687 0.0869 C 10.8536 -3.2706 0.0089 0.99649 0.0319 D 11.0249 -3.3567 - 0.9700S 0.0827 E 11.4027 -3.8453 0.0098 0.98057 0.0747 F 6.9467 -0.0203 - 0.46904 0.3006
A441 STEEL - 7 SPECIMENS A 7.3104 -0.0415 0.0091 0.95986 0.0934 B 7.5938 -0.0497 - 0.90067 0.1295 C 10.2051 -2.8130 0.0095 0.95123 0.1028 D 11.0725 -3.3765 - 0.89689 0.1318 E 10.8706 -3.4582 0.0095 0.95045 0.1036 F 5.8242 +0.0079 - 0.28748 0.2854
A514 STEEL - 13 SPECIMENS A 6.6872 -0.0253 0.0013 0.69041 0.1522 B 6.7289 -0.0265 - 0.68901 0.1454 C 8.4324 -1.7020 0.0013 0.71484 0.1471 D 8.5615 -1.7856 - 0.65870 0.1509 E 8.5341 -1.7933 0.0011 0.70854 0.1484 F 5.9149 +0.0026 - 0.01855 0.2006
ALL STEELS - 27 SPECIMENS A 7.3357 -0,0438 +0.0021 0.82747 0.1682 B 7.3840 -0.0451 - 0.82540 0.1657 C 10.2275 -2.8623 +0.0026 0.82720 0.1683 D 10.3882 -2.9639 - 0.82689 0.1651 E 10.3994 -3.3056 +0.0028 0.83807 0.1667 F 6.2166 -0.0044 - 0.13112 0.2910
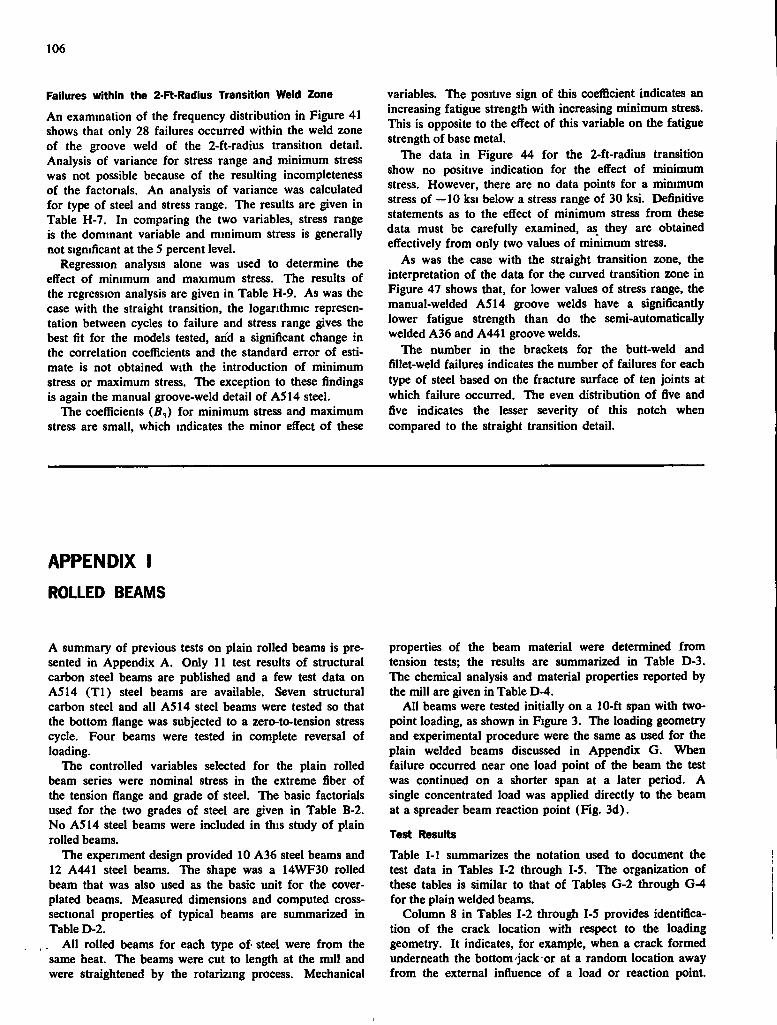
106
Failures wKhln the 2-Ft-Radlus Transition Weld Zone
An examination of the frequency distribution in Figure 41 shows that only 28 failures occurred within the weld zone of the groove weld of the 2-ft-radius transition detail. Analysis of variance for stress range and minimum stress was not possible because of the resulting incompleteness of the factorials. An analysis of variance was calculated for type of steel and stress range. The results are given in Table H-7. In comparing the two variables, stress range is the dominant variable and minimum stress is generally not significant at the S percent level.
Regression analysis alone was used to determine the effect of minimum and maximum stress. The results of the regression analysis are given in Table H-9. As was the case with the straight transition, the logarithmic representation between cycles to failure and stress range gives the best fit for the models tested, and a significant change in the correlation coefficients and the standard error of estimate is not obtained with the introduction of minimum stress or maximum stress. The exception to these findings is again the manual groove-weld detail of ASM steel.
The coefficients (B^) for minimum stress and maximum stress are small, which indicates the minor effect of these
variables. The positive sign of this coefficient indicates an increasing fatigue strength with increasing minimum stress. This is opposite to the effect of this variable on the fatigue strength of base metal.
The data in Figure 44 for the 2-ft-radius transition show no positive indication for the effect of minimum stress. However, there are no data points for a minimum stress of —10 ksi below a stress range of 30 ksi. Definitive statements as to the effect of minimum stress from these data must be carefully examined, as they are obtained effectively from only two values of minimum stress.
As was the case with the straight transition zone, the interpretation of the data for the curved transition zone in Figure 47 shows that, for lower values of stress range, the manual-welded ASM groove welds have a significantly lower fatigue strength than do the semi-automatically welded A36 and A441 groove welds.
The number in the brackets for the butt-weld and fillet-weld failures indicates the number of failures for each type of steel based on the fracture surface of ten joints at which failure occurred. The even distribution of five and five indicates the lesser severity of this notch when compared to the straight transition detail.
APPENDIX I ROLLED BEAMS
A summary of previous tests on plain rolled beams is presented in Appendix A. Only 11 test results of structural carbon steel beams are published and a few test data on ASM ( T l ) steel beams are available. Seven structural carbon steel and all ASM steel beams were tested so that the bottom flange was subjected to a zero-to-tension stress cycle. Four beams were tested in complete reversal of loading.
The controlled variables selected for the plain rolled beam series were nominal stress in the extreme fiber of the tension flange and grade of steel. The basic factorials used for the two grades of steel are given in Table B-2. No ASM steel beams were included in this study of plain rolled beams.
The experiment design provided 10 A36 steel beams and 12 A441 steel beams. The shape was a 14WF30 rolled beam that was also used as the basic unit for the cover-plated beams. Measured dimensions and computed cross-sectional properties of typical beams are summarized in Table D-2.
Al l rolled beams for each type of- steel were from the same heat. The beams were cut to length at the mill and were straightened by the rotarizing process. Mechanical
properties of the beam material were determined from tension tests; the results are summarized in Table D-3. The chemical analysis and material properties reported by the mill are given in Table D-4.
Al l beams were tested initially on a 10-ft span with two-point loading, as shown in Figure 3. The loading geometry and experimental procedure were the same as used for the plain welded beams discussed in Appendix G. When failure occurred near one load point of the beam the test was continued on a shorter span at a later period. A single concentrated load was applied directly to the beam at a spreader beam reaction point (Fig. 3d).
Test Results
Table I - l summarizes the notation used to document the test data in Tables 1-2 through I-S. The organization of these tables is similar to that of Tables G-2 through G-4 for the plain welded beams.
Column 8 in Tables 1-2 through I-S provides identification of the crack location with respect to the loading geometry. It indicates, for example, when a crack formed underneath the bottom'jack or at a random location away from the external influence of a load or reaction point.
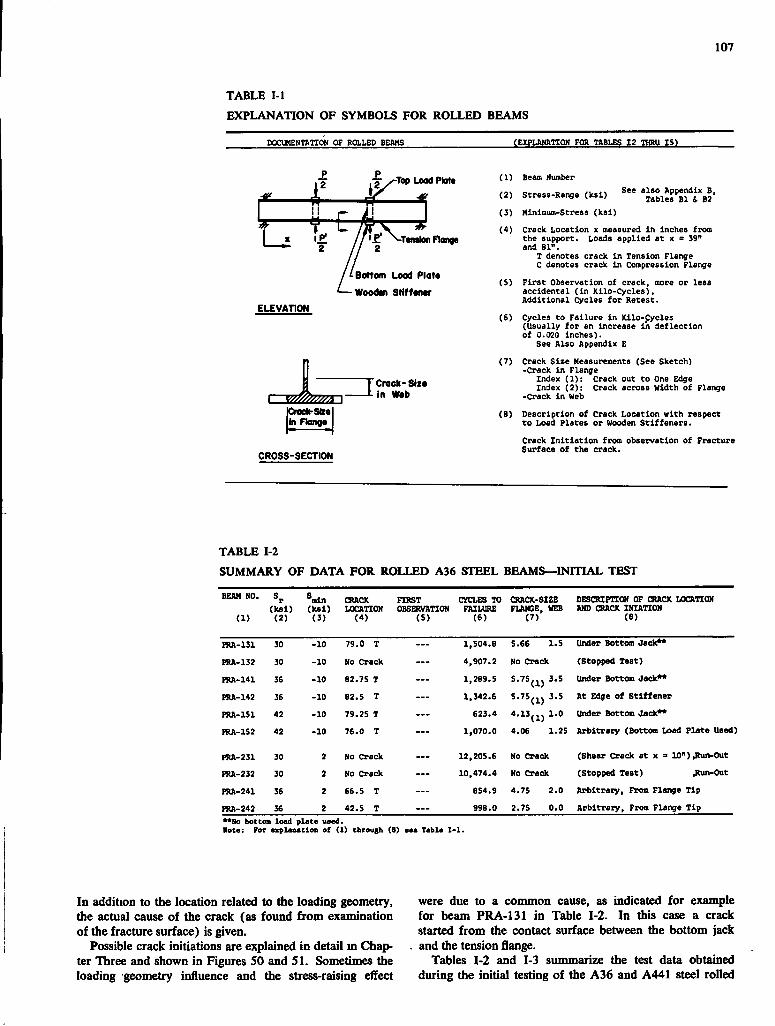
107
TABLE I - l EXPLANATION OF SYMBOLS FOR ROLLED BEAMS
DOCUMENranON OF ROLLED BEBMS (EXPLANftTION FOR TABLES 12 THRU IS)
i ^2^Top Lead Plote
*
ELEVATION
|Craek-Sbe in Flange
CROSS-SECTION
•Tantien riange
^Bortom Load Plate Wooden StiffenM'
T C n - l i n
Crack-Slie Web
(1) Beam Number
(2) Stress-Range ( k s l )
(3) Minimum-Stress ( k s i )
(4)
See also Appendix B, Tables B l & B2
Crack Location x measured i n inches from the support. Loads applied at x = 39" and B l " .
T denotes crack i n Tension Flange C denotes crack i n Compression Flange
(5) F i r s t Observation of crack, more or less accidental ( i n Kilo-Cycles), Additional Cycles for Retest.
(6) Cycles to Failure i n Kilo-Cycles (Usually for an increase i n deflection of 0.020 inches).
See Also Appendix E
(7) Crack Size Measurements (See Sketch) -Crack i n Flange
Index ( 1 ) : Crack out to One Edge Index ( 2 ) : Crack across Width of Flange
-Crack i n Web
(8) Description of Crack Location with respect to Load Plates or Wooden S t i f f e n e r s .
Crack I n i t i a t i o n from observation of Fracture Surface of the crack.
TABLE 1-2 SUMMARY OF DATA FOR ROLLED A36 STEEL BEAMS—INITIAL TEST
BEAM NO.
(1)
Sr ( k s l ) (2)
( k s l ) (3)
CRACK LOCATION
(4)
FIRST OBSERVATION
(5)
CYCLES TO FAILURE
(6)
CRACK-SIZE FLAHSE, WEB
(7)
DESCXimON OF CRACK LOCATION AMD CRACK IMIATION
(6)
FRA-131 30 -10 79.0 T — 1,504.8 S.66 l . S Under Bottom Jack**
EKA-132 30 -10 No Crack 4,907.2 No Crack (Stopped Test)
FBA-141 36 -10 82.75 T — 1,289.5 S.75(,j 3.5 Under Bottom Jack**
PRA-142 36 -10 82.S T — 1,342.6 S - " ( l ) At Edge of S t i f f e n e r
FRA-151 42 -10 79.25 T 623.4 " • " ( 1 ) Under Bottom Jack**
FRA-152 42 -10 76.0 T — 1,070.0 4.06 1.25 Arbitrary (Bottom Load Plate Used)
ntA-231 30 2 No Crack — 12,205.6 No Crack (Shear Crack at x => 10"),Run-Out
FRA-232 30 2 No Crack 10,474.4 No Crack (Stopped Test) ,Run-Out
FRA-241 36 2 66.5 T — 854.9 4.75 2.0 Arbitrary, From Flange Tip
FltA-242 36 2 42.5 T — 998.0 2.75 0.0 Arbitrary, Froo Flange Tip **Ilo botcom load plate used. Note; For explanation of (1) through (B) oee Table 1-1.
In addition to the location related to the loading geometry, the actual cause of the crack (as found from examination of the fracture surface) is given.
Possible crack initiations are explained in detail m Chapter Three and shown in Figures SO and 51. Sometimes the loading geometry influence and the stress-raising effect
were due to a common cause, as indicated for example for beam PRA-131 in Table 1-2. In this case a crack started from the contact surface between the bottom jack and the tension flange.
Tables 1-2 and 1-3 sununarize the test data obtained during the initial testing of the A36 and A441 steel rolled
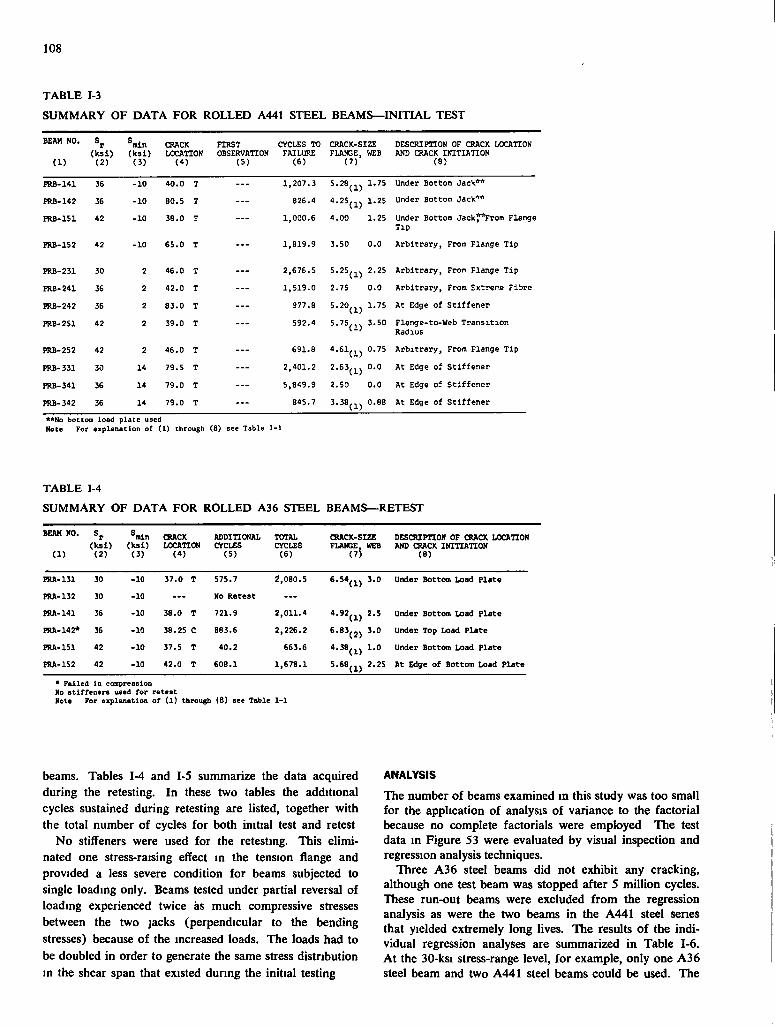
108
TABLE 1-3 SUMMARY OF DATA FOR ROLLED A441 STEEL BEAMS—INITL\L TEST
BEAM NO.
(1) ( k s i ) (2)
( k s i ) (3)
CRACK LOCATION
(4)
FIRST OBSERVATION
(5)
CYCLES TO FAILURE
(6)
CRACK-SIZE FLANGE, WEB
(7)
DESCRIPTION OF CRACK LOCATION AND CRACK INITIATION
(8)
PRB-141 36 -10 40.0 T — 1,207.3 5.28^,, 1.75 Under Bottom Jack**
PRB-142 36 -10 80.S T — 826.4 ^ • " ( 1 ) 1.25 Under Botton Jack'**
PRB-151 42 -10 38.0 T 1,000.6 4.00 1.25 Under Bottom Jackf*From Flange Tip
PRB-152 42 -10 65.0 T — 1,819.9 3.50 0.0 Arbitrary, From Flange Tip
PRB-231 30 2 46.0 T . . . 2,676.5 5.25(,) 2.25 Arbitrary, Fron Flange Tip
PRB-241 36 2 42.0 T . . . 1,519.0 2.75 0.0 Arbitrary, From Extrene Fibre
FRB-242 36 2 83.0 T . . . 977.8 5.20^,, 1.75 At Edge of St i f f e n c r
PRB-251 42 2 39.0 T . . . 592.4 3.50 Flange.to.Web Transition Radius
FRB-252 42 2 46.0 T . . . 691.8 * - " ( l ) 0.75 Arbitrary, From Flange Tip
PRB-331 30 14 79.5 T . . . 2,401.2 ^ • " ( 1 ) 0.0 At Edge of Stif f e n e r
PRB-341 36 14 79.0 T . . . 5,849.9 2.50 0.0 At Edge of Stif f e n e r
PRB-342 36 14 79.0 T . . . 845.7 3.38^,, 0.88 At Edge of Stif f e n e r
**No bottom load plate uaed Note For explanation of (1) through (8) sec Table I - l
TABLE 1-4 SUMMARY OF DATA FOR ROLLED A36 STEEL BEAMS—RETEST
BEAM NO.
(1)
Sp ( k s i ) (2)
®mln ( k s i ) (3)
CRACK LOCATION
(4)
ADDITIONAL CYCLES
(5) TOTAL CYCLES (6)
CSACK-SIZE FLANGE, WEB
(75
DESOUmON OF CRACK LOCATION AND OtACK INITIATION
(8)
FRA-131 30 -10 37.0 T 575.7 2,080.5 6.54^„ 3.0 Under Bottom Load Plate
PRA-132 30 -10 — No Retest — FRA-141 36 -10 38.0 T 721.9 2,011.4 *•«(!) 2.5 Under Bottom Load Plate IRA-142* 36 -10 38.25 C 883.6 2,226.2 ^ • " ( 2 ) 3.0 Under Top Load Plate
FRA-151 42 -10 37.5 T 40.2 663.6 4.38(„ 1.0 Under Bottom Load Plate
(M-152 42 -10 42.0 T 608.1 1,678.1 5.68(,, 2.25 At Edge of Bottom Load Plate
• Failed in compreeslon No Btiffeners used for retest Note For explanation of (1) through (8) see Table I - l
beams. Tables 1-4 and I-S summarize the data acquired during the retesting. In these two tables the additional cycles sustained during retesting are listed, together with the total number of cycles for both initial test and retest
No stiffeners were used for the retesting. This eliminated one stress-raising effect in the tension flange and provided a less severe condition for beams subjected to single loading only. Beams tested under partial reversal of loading experienced twice as much compressive stresses between the two jacks (perpendicular to the bending stresses) because of the increased loads. The loads had to be doubled in order to generate the same stress distribution m the shear span that existed during the initial testing
ANALYSIS
The number of beams examined in this study was too small for the application of analysis of variance to the factorial because no complete factorials were employed The test data in Figure 53 were evaluated by visual inspection and regression analysis techniques.
Three A36 steel beams did not exhibit any cracking, although one test beam was stopped after 5 million cycles. These run-out beams were excluded from the regression analysis as were the two beams in the A441 steel senes that yielded extremely long lives. The results of the individual regression analyses are summarized in Table 1-6. At the 30-ksi stress-range level, for example, only one A36 steel beam and two A441 steel beams could be used. The
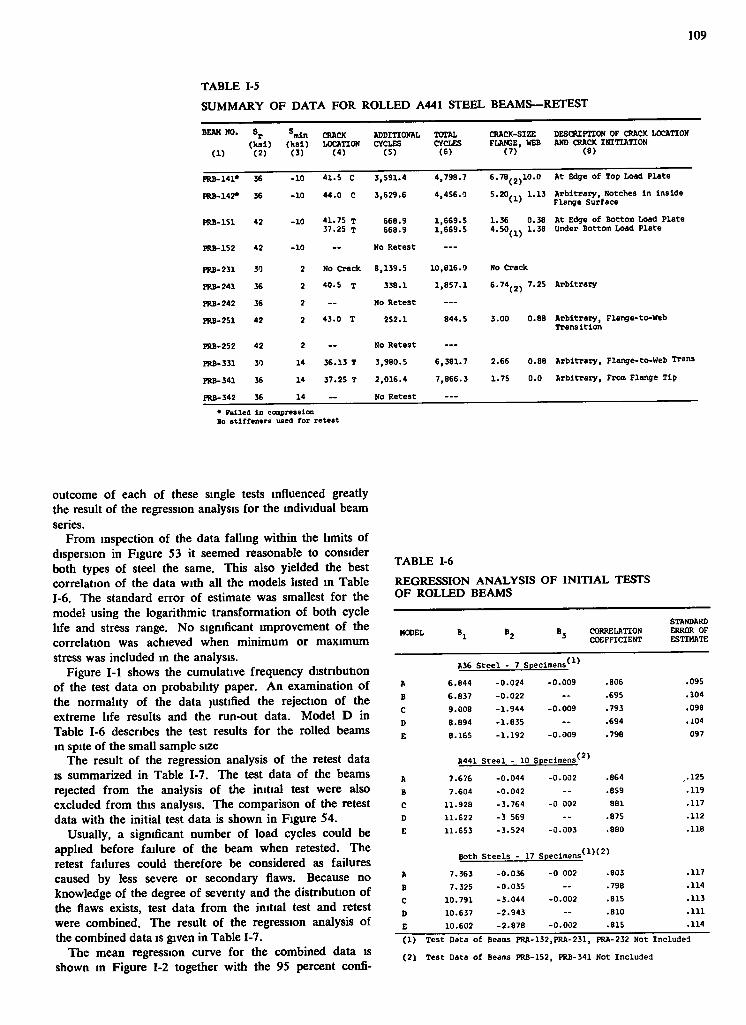
109
TABLE 1-5 SUMMARY OF DATA FOR ROLLED A441 STEEL BEAMS—RETEST
BEAM NO.
(1)
Sr ( k s i ) (2)
'min ( k s i ) (3)
CRACK LOCATION
(4)
ADDITIONAL CYCLES
(5)
TOTAL CYCLES (6)
CRACK-SIZE PLAICE, WEB
(7)
DESCRIPTION OF CRACK LOCATION AND CRACK INITIATION
(8)
PRB-141* 36 -10 41.5 C 3,591.4 4,798.7 6.78jjjl0.0 At Edge of Top Load Plate
PRB-142* 36 -10 44.0 C 3,629.6 4,456.0 5.20^,, 1.13 Arbitrary, Notches in inside Flange Surface
PRB-lSl 42 -10 41.75 T 37.25 T
668.9 668.9
1,669.5 1,669.5
1.36 0.38 4.50^j^j 1.38
At Edge of Bottom Load Plate Under Bottom Load Plate
FRB-152 42 -10 - No Retest — PRB-231 3Q 2 No Crack 8,139.5 10,816.0 No Crack
PRB-241 36 2 40.5 T 338.1 1,857.1 6.74j2j 7.25 Arbitrary
FRB-242 36 2 — No Retest — PRB-251 42 2 43.0 T 252.1 844.5 3.00 0.88 Arbitrary, Flange-to-Web
Transition
IM-252 42 2 ~ No Retest — KB-331 30 14 36.13 T 3,980.5 6,381.7 2.66 0.88 Arbitrary, Flange-to-Web Trans
PRB-341 36 14 37.25 T 2,016.4 7,866.3 1.75 0.0 Arbitrary, From Flange Tip
PRB-342 36 14 No Retest — * Failed In compresBion Bo stiffeners used for retest
outcome of each of these single tests influenced greatly the result of the regression analysis for the individual beam series.
From inspection of the data falling within the limits of dispersion in Figure S3 it seemed reasonable to consider both types of steel the same. This also yielded the best correlation of the data with all the models listed in Table 1-6. The standard error of estimate was smallest for the mode] using the logarithmic transformation of both cycle life and stress range. No signiflcant improvement of the correlation was achieved when minimum or maximum stress was included in the analysis.
Figure I - l shows the cumulative frequency distribution of the test data on probability paper. An examination of the normality of the data justified the rejection of the extreme life results and the run-out data. Model D in Table 1-6 describes the test results for the rolled beams in spite of the small sample size
The result of the regression analysis of the retest data IS summarized in Table 1-7. The test data of the beams rejected from the analysis of the initial test were also excluded from this analysis. The comparison of the retest data with the initial test data is shown in Figure 54.
Usually, a significant number of load cycles could be applied before failure of the beam when retested. The retest failures could therefore be considered as failures caused by less severe or secondary flaws. Because no knowledge of the degree of severity and the distribution of the flaws exists, test data from the initial test and retest were combined. The result of the regression analysis of the combined data is given in Table 1-7.
The mean regression curve for the combined data is shown m Figure 1-2 together with the 9S percent confi-
TABLE 1-6 REGRESSION ANALYSIS OF INITIAL TESTS OF ROLLED BEAMS
MODEL Bl "3 CORRELATION COEFFICIENT
STANDARD ERROR OF ESTIMATE
A35 Steel - 7 Specimens^
A 6.844 -0.024 -0.009 .806 .095 B 6.837 -0.022 — .695 .104 C 9.008 -1.944 -0.009 .793 .098 D 8.894 -1.835 — .694 .104 E 8.165 -1.192 -0.009 .798 097
A441 Steel - 10 Specimens^
A 7.676 -0.044 -0.002 .864 .125 B 7.604 -0.042 -- .859 .119 C 11.928 -3.764 -0 002 881 .117 D 11.622 -3 569 — .875 .112 E 11.653 -3.524 -0.003 .880 .118
Both Steels - : L7 Specimens (1)(2)
A 7.363 -0.036 -0 002 .803 .117 B 7.325 -0.035 — .798 .114 C 10.791 -3.044 -0.002 .815 .113 D 10.637 -2.943 — .810 .111 E 10.602 -2.878 -0.002 .815 .114 (1) Test Data of Beams PRA-132,PRA-231, PRA-232 Not Included
(2) Test Data of Beams PRB-152, FRB-341 Not Included
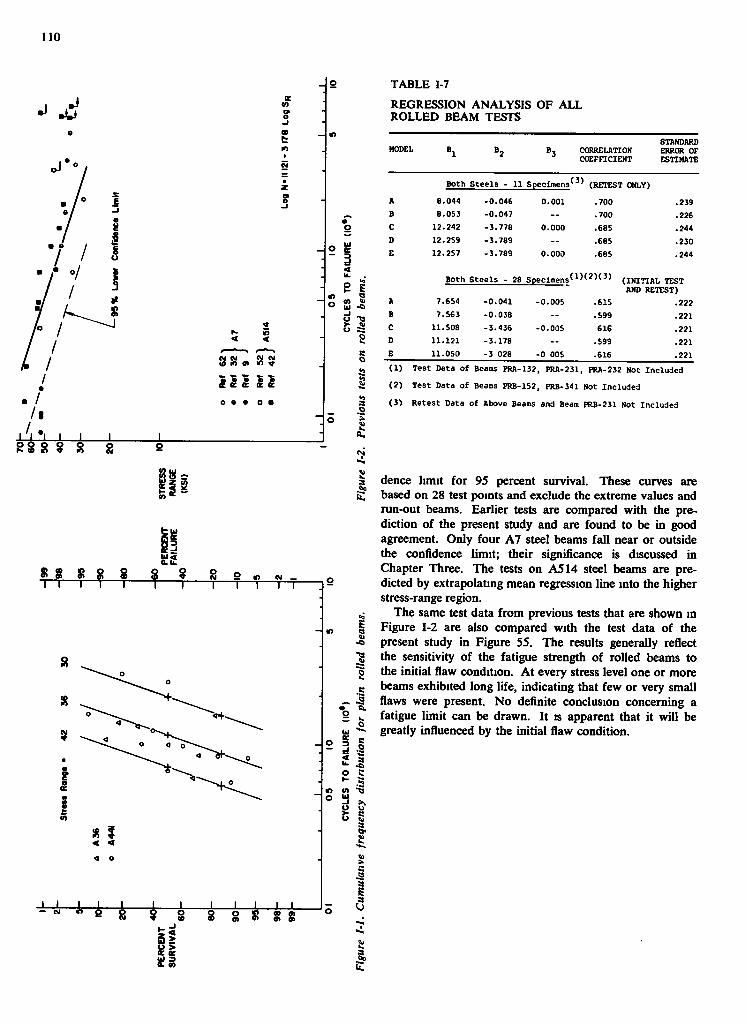
110
-I CB
9
o • • • •
e I
s e o
a.
TABLE 1-7
REGRESSION ANALYSIS OF ALL ROLLED BEAM TESTS
MODEL " l "2 "3 CORRELATION COEFFICIENT
STANDARD ERROR OF ESTIMATE
Both Steels - 11 Specimens f (RETEST ONLY) A 8.044 -0.046 0.001 .700 .239 B 8.0S3 -0.047 -- .700 .226 c 12.242 -3.778 0.000 .685 .244 D 12.2S9 -3.789 — .685 .230 E 12.257 -3.789 0.000 .685 .244
Both Steels - 28 Specimens ( 1 ) ( 2 ) ( 3 ) ( j ^ j j j L TEST AND RETEST)
A 7.654 -0.041 -0.005 .615 .222 B 7.563 -0.038 -- .599 .221 C 11.508 -3.436 -0.005 616 .221 D 11.121 -3.178 -- .599 .221 E 11.050 -3 028 -0 005 .616 .221 (1) Test Data of Beams PRA-132, PRA-231, PRA-232 Not Included
(2) Test Data of Beams PRB-152, PRB-341 Not Included
(3) Retest Data of Above Beams and Beam FRB-231 Not Included
8 8 8 T l — r
i8
i i
8 8 g "I—r T - r
I I I I 8 ^ I ^ i
a* ^ A 8!
•5
2 3 . 1
o c
I
dence limit for 9S percent survival. These curves are based on 28 test points and exclude the extreme values and run-out beams. Earlier tests are compared with the prediction of the present study and are found to be in good agreement. Only four A7 steel beams fall near or outside the confidence limit; their significance is discussed in Chapter Three. The tests on ASM steel beams are predicted by extrapolating mean regression line into the higher stress-range region.
The same test data from previous tests that are shown in Figure 1-2 are also compared with the test data of the present study in Figure 5S. The results generally reflect the sensitivity of the fatigue strength of rolled beams to the initial flaw condition. At every stress level one or more beams exhibited long life, indicating that few or very small flaws were present. No definite conclusion concerning a fatigue limit can be drawn. I t is apparent that it will be greatly influenced by the initial flaw condition.
1^ 1
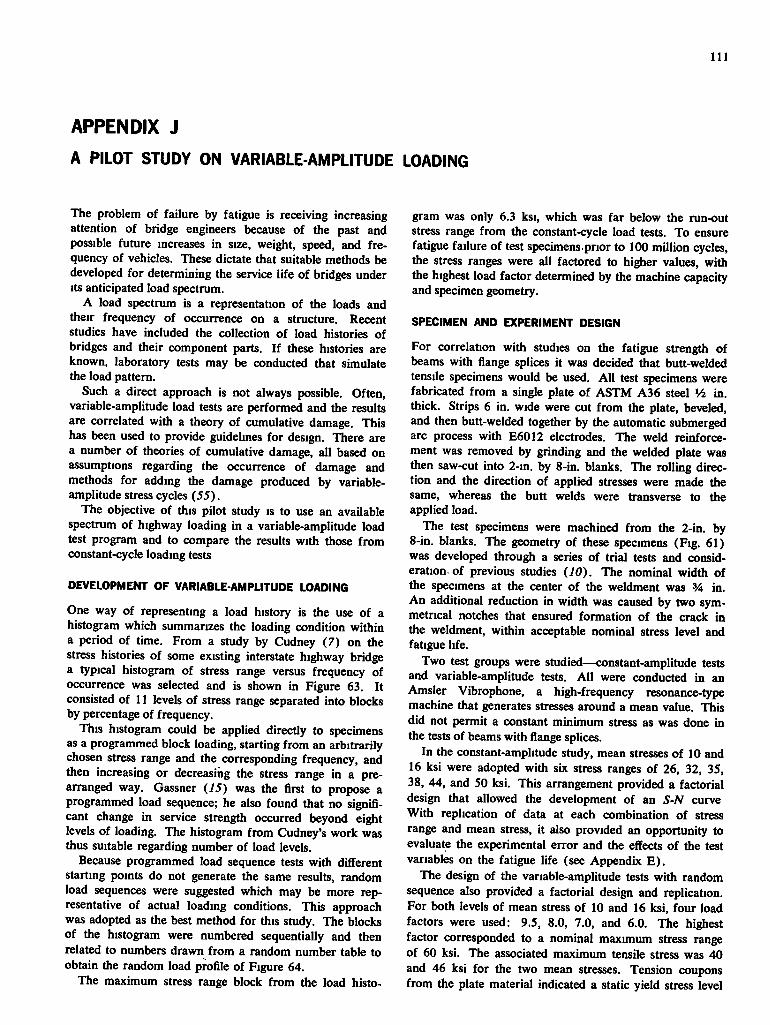
I l l
APPENDIX J
A PILOT STUDY ON VARIABLE-AMPLITUDE LOADING
The problem of failure by fatigue is receiving increasing attention of bridge engineers because of the past and possible future increases in size, weight, speed, and frequency of vehicles. These dictate that suitable methods be developed for determining the service life of bridges under Its anticipated load spectrum.
A load spectrum is a representation of the loads and their frequency of occurrence on a structure. Recent studies have included the collection of load histories of bridges and their component parts. I f these histories are known, laboratory tests may be conducted that simulate the load pattern.
Such a direct approach is not always possible. Often, variable-amplitude load tests are performed and the results are correlated with a theory of cumulative damage. This has been used to provide guidelines for design. There are a number of theories of cumulative damage, all based on assumptions regarding the occurrence of damage and methods for adding the damage produced by variable-amplitude stress cycles (55).
The objective of this pilot study is to use an avaUable spectrum of highway loading in a variable-amplitude load test program and to compare the results with those from constant-cycle loading tests
DEVELOPMENT OF VARIABLE-AMPLITUDE LOADING
One way of representing a load history is the use of a histogram which summarizes the loading condition within a period of time. From a study by Cudney (7) on the stress histories of some existing interstate highway bridge a typical histogram of stress range versus frequency of occurrence was selected and is shown in Figure 63. I t consisted of 11 levels of stress range separated into blocks by percentage of frequency.
This histogram could be applied directly to specimens as a programmed block loading, starting from an arbitrarily chosen stress range and the corresponding frequency, and then increasing or decreasing the stress range in a prearranged way. Gassner (75) was the first to propose a programmed load sequence; he also found that no significant change in service strength occurred beyond eight levels of loading. The histogram from Cudney's work was thus suitable regarding number of load levels.
Because programmed load sequence tests with different starting points do not generate the same results, random load sequences were suggested which may be more representative of actual loading conditions. This approach was adopted as the best method for this study. The blocks of the histogram were numbered sequentially and then related to numbers drawn from a random number table to obtain the random load profile of Figure 64.
The maximum stress range block from the load histo
gram was only 6.3 ksi, which was far below the run-out stress range from the constant-cycle load tests. To ensure fatigue failure of test specimens prior to 100 million cycles, the stress ranges were all factored to higher values, with the highest load factor determined by the machine capacity and specimen geometry.
SPECIMEN AND EXPERIMENT DESIGN
For correlation with studies on the fatigue strength of beams with flange splices it was decided that butt-welded tensile specimens would be used. A l l test specimens were fabricated from a single plate of ASTM A36 steel Vi in. thick. Strips 6 in. wide were cut from the plate, beveled, and then butt-welded together by the automatic submerged arc process with E6012 electrodes. The weld reinforcement was removed by grinding and the welded plate was then saw-cut into 2-in. by 8-in. blanks. The rolling direction and the direction of applied stresses were made the same, whereas the butt welds were transverse to the applied load.
The test specimens were machined from the 2-in. by 8-in. blanks. The geometry of these specimens (Fig. 61) was developed through a series of trial tests and consideration'of previous studies (10). The nominal width of the specimens at the center of the weldment was % in. An additional reduction in width was caused by two symmetrical notches that ensured formation of the crack in the weldment, within acceptable nominal stress level and fatigue life.
Two test groups were studied—constant-amplitude tests and variable-amplitude tests. A l l were conducted in an Amsler Vibrophone, a high-frequency resonance-type machine that generates stresses around a mean value. This did not permit a constant minimum stress as was done in the tests of beams with flange splices.
In the constant-amplitude study, mean stresses of 10 and 16 ksi were adopted with six stress ranges of 26, 32, 35, 38, 44, and 50 ksi. This arrangement provided a factorial design that allowed the development of an S-N curve With replication of data at each combination of stress range and mean stress, it also provided an opportunity to evaluate the experimental error and the effects of the test variables on the fatigue life (see Appendix E ) .
The design of the variable-amplitude tests with random sequence also provided a factorial design and replication. For both levels of mean stress of 10 and 16 ksi, four load factors were used: 9.5, 8.0, 7.0, and 6.0. The highest factor corresponded to a nominal maxunum stress range of 60 ksi. The associated maximum tensile stress was 40 and 46 ksi for the two mean stresses. Tension coupons from the plate material indicated a static yield stress level
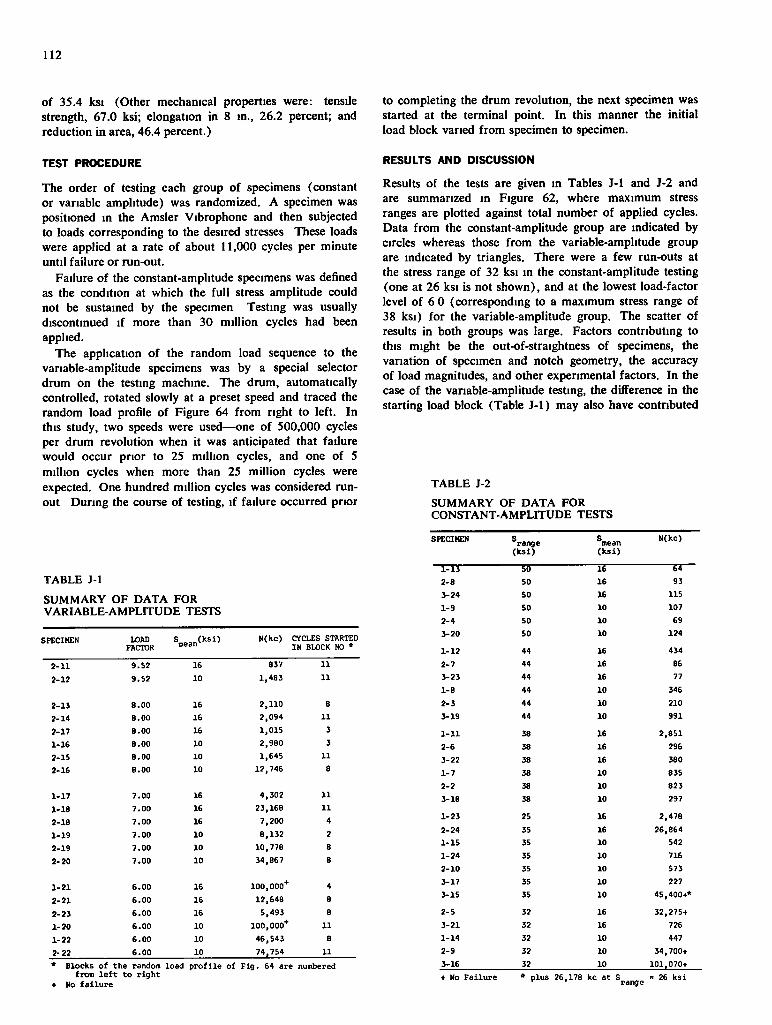
112
of 3S.4 ksi (Other mechanical properties were: tensile strength, 67.0 ksi; elongation in 8 in., 26.2 percent; and reduction in area, 46.4 percent.)
to completing the drum revolution, the next specimen was started at the terminal point. In this manner the initial load block varied from specimen to specimen.
TEST PROCEDURE
The order of testing each group of specimens (constant or variable amplitude) was randomized. A specimen was positioned in the Amsler Vibrophone and then subjected to loads corresponding to the desired stresses These loads were applied at a rate of about 11,000 cycles per minute until failure or run-out.
Failure of the constant-amplitude specimens was defined as the condition at which the full stress amplitude could not be sustained by the specimen Testing was usually discontinued if more than 30 million cycles had been applied.
The application of the random load sequence to the variable-amplitude specimens was by a special selector drum on the testing machine. The drum, automatically controlled, rotated slowly at a preset speed and traced the random load profile of Figure 64 from right to left. In this study, two speeds were used—one of S00,000 cycles per drum revolution when it was anticipated that failure would occur prior to 25 million cycles, and one of S million cycles when more than 25 million cycles were expected. One hundred million cycles was considered runout During the course of testing, if failure occurred prior
TABLE J-1 SUMMARY OF DATA FOR VARIABLE-AMPLFTUDE TESTS
SPECIMEN LOAD FACTOR
S ( k s i ) mean^ N(kc) CYCLES STARTED IN BLOCK NO *
2-11 9.52 16 837 11 2-12 9.52 10 1,483 11
2-13 8.00 16 2,110 8 2-14 8.00 16 2,094 11 2-17 8.00 16 1,015 3 1-16 8.00 10 2,980 3 2-15 8.00 10 1,645 11 2-16 8.00 10 12,746 8
1-17 7.00 16 4,302 11 1-18 7.00 16 23,168 11 2-18 7.00 16 7,200 4 1-19 7.00 10 8,132 2 2-19 7.00 10 10,778 8 2-20 7.00 10 34,867 8
1-21 6.00 16 100,000* 4 2-21 6.00 16 12,648 8 2-23 6.00 16 5,493 8 1-20 6.00 10 100,000* 11 1-22 6.00 10 46,543 8 2- 22 6.00 10 74,754 11
RESULTS AND DISCUSSION
Results of the tests are given in Tables J-1 and J-2 and are summarized in Figure 62, where maximum stress ranges are plotted against total number of applied cycles. Data from the constant-amplitude group are indicated by circles whereas those from the variable-amplitude group are indicated by triangles. There were a few run-outs at the stress range of 32 ksi in the constant-amplitude testing (one at 26 ksi is not shown), and at the lowest load-factor level of 6 0 (corresponding to a maximum stress range of 38 ksi) for the variable-amplitude group. The scatter of results in both groups was large. Factors contributing to this might be the out-of-straightness of specimens, the variation of specimen and notch geometry, the accuracy of load magnitudes, and other experimental factors. In the case of the variable-amplitude testing, the difference in the starting load block (Table J-1) may also have contributed
TABLE J-2
Blocks of the random load profile of Fig. 64 are numbered from l e f t to right
No f a i l u r e
SUMMARY OF DATA FOR CONSTANT-AMPLITUDE TESTS
SPECIMEN ^range ( k s i )
®mean ( k s i )
N(kc)
So 16 £4 2-8 50 16 93 3-24 50 16 115 1-9 50 10 107 2-4 50 10 69 J-20 50 10 124
1-12 44 16 434 2-7 44 16 86 3-23 44 16 77 1-8 44 10 346 2-3 44 10 210 3-19 44 10 991
1-11 38 16 2,851 2-6 38 16 296 3-22 38 16 380 1-7 38 10 835 2-2 38 10 823 3-18 38 10 297
1-23 25 16 2,478 2-24 35 16 26,864 1-15 35 10 542 1-24 35 10 716 2-10 35 10 573 3-17 35 10 227 3-15 35 10 45,400+*
2-5 32 16 32,275+ 3-21 32 16 726 1-14 32 10 447 2-9 32 10 34,700+ 3-16 32 10 101,070+ + No Failure * plus 26,178 kc at S
range = 26 k s i
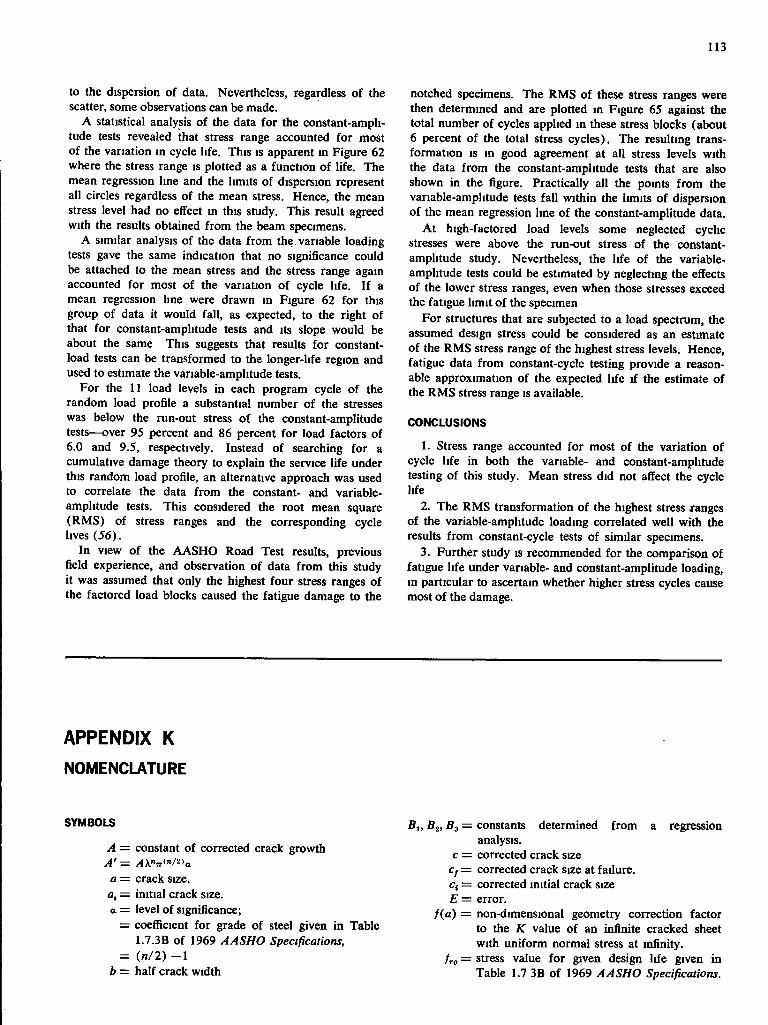
113
to the dispersion of data. Nevertheless, regardless of the scatter, some observations can be made.
A statistical analysis of the data for the constant-amplitude tests revealed that stress range accounted for most of the variation in cycle life. This is apparent m Figure 62 where the stress range is plotted as a function of life. The mean regression Ime and the limits of dispersion represent all circles regardless of the mean stress. Hence, the mean stress level had no effect in this study. This result agreed with the results obtained from the beam specimens.
A similar analysis of the data from the variable loading tests gave the same indication that no significance could be attached to the mean stress and the stress range again accounted for most of the variation of cycle life. I f a mean regression line were drawn in Figure 62 for this group of data it would fall, as expected, to the right of that for constant-amplitude tests and its slope would be about the same This suggests that results for constant-load tests can be transformed to the longer-life region and used to estimate the variable-amplitude tests.
For the 11 load levels in each program cycle of the random load profile a substantial number of the stresses was below the run-out stress of the constant-amplitude tests—over 95 percent and 86 percent for load factors of 6.0 and 9.5, respectively. Instead of searching for a cumulative damage theory to explain the service life under this random load profile, an alternative approach was used to correlate the data from the constant- and variable-amplitude tests. This considered the root mean square (RMS) of stress ranges and the corresponding cycle lives (56).
In view of the AASHO Road Test results, previous field experience, and observation of data from this study it was assumed that only the highest four stress ranges of the factored load blocks caused the fatigue damage to the
notched specimens. The RMS of these stress ranges were then determined and are plotted in Figure 65 against the total number of cycles applied in these stress blocks (about 6 percent of the total stress cycles). The resulting transformation is in good agreement at all stress levels with the data from the constant-amplitude tests that are also shown in the figure. Practically all the points from the variable-amplitude tests fall within the limits of dispersion of the mean regression line of the constant-amplitude data.
At high-factored load levels some neglected cyclic stresses were above the run-out stress of the constant-amplitude study. Nevertheless, the life of the variable-amplitude tests could be estimated by neglecting the effects of the lower stress ranges, even when those stresses exceed the fatigue limit of the specimen
For structures that are subjected to a load spectrum, the assumed design stress could be considered as an estimate of the RMS stress range of the highest stress levels. Hence, fatigue data from constant-cycle testing provide a reasonable approximation of the expected life if the estimate of the RMS stress range is available.
CONCLUSIONS
1. Stress range accounted for most of the variation of cycle life in both the variable- and constant-amplitude testing of this study. Mean stress did not affect the cycle life
2. The RMS transformation of the highest stress ranges of the variable-amplitude loading correlated well with the results from constant-cycle tests of similar specimens.
3. Further study is recommended for the comparison of fatigue life under variable- and constant-amplitude loading, in particular to ascertain whether higher stress cycles cause most of the damage.
APPENDIX K NOMENCLATURE
SYMBOLS
A: A':
a ••
b -
constant of corrected crack growth
crack size, initial crack size, level of significance; coefficient for grade of steel given in Table 1.7.3B of 1969 AASHO Specifications, ( / I / 2 ) - 1 half crack width
Bi , flj, = constants determined from a regression analysis. corrected crack size corrected crack size at failure, corrected mitial crack size error. non-dimensional geometry correction factor to the K value of an infinite cracked sheet with uniform normal stress at infinity, stress value for given design life given in Table 1.7 3B of 1969 AASHO Specifications.
c •• c,-.
E--
114
K =
^K = k,=
X = N =
AN =
Ni = Pi =
S,<r = •^mnx —
•^mcan —
•Smin =
5 , =
a ratio of the measured variation of the yield of a treatment to that of the unassigned or error variation, or tabulated value of the /•-statistic. constant in regression equation, order number for cumulative frequency distribution. elastic stress intensity factor for the leading edge of a crack range of K. coefficient for stress variables given in Table 1.7.3B of 1969 AASHO Specifications. stress concentration factor. number of applied cycles number of cycles required for a crack to grow from initial size to size at failure. sample size, exponent. number of applied cycles at failure, number of applied cycles at initial crack size, plotting position on cumulative frequency diagram for observation i stress. maximum stress, mean stress, minimum stress, stress range thickness
GLOSSARY
For beam specimen designation see Table B-1.
AASHO = American Association of State Highway Officials.
AREA = American Railway Engineering Association
ASA = American Standards Association.
ASTM = American Society for Testing and Materials.
AWS = American Welding Society. CB = beams with cover plates wider
than the beam flange Cell of factorial = a particular testing condition
within the factorial experiment.
CM = beams plates.
Constant-cycle fatigue = fatigue range.
CR = rolled beams with cover plates. C T = beams with cover plates of
thickness equal to twice the flange thickness.
with multiple cover
under constant load
Cumulative damage theories:
CW =
Cycle life =
Factorial experiment =
Failure =
Fatigue =
Fatigue life =
Fatigue strength =
Flaw =
FS =
Limits of dispersion =
Maximum stress =
Minimum stress =
PR = PW =
Regression analysis =
Regression line =
Replication =
RMS =
methods for adding the damages produced by variable-amplitude stress cycles, welded beams with cover plates number of load cycles to failure. experimental plan where observations are taken at all possible combinations that can be formed for the different levels of the factors. increase in midspan deflection of 0.020 in. due to fatigue cracking of the test specimen, initiation and propagation of microscopic cracks into macroscopic cracks by the repeated application of stresses, number of load cycles to failure. relationship between fatigue life and applied stress, any discontinuity m the material. beams with groove-welded flange splices. two standard error of estimates from regression line highest algebraic stress per cycle. lowest algebraic stress per cycle. plain rolled beam, plain welded beam, the use of least square curve fitting to statistically evaluate the significance of the independent stress variables.
: curve obtained from a regression analysts.
: specimens tested under the same testing conditions.
: root mean square—square root of the sum of the squared deviations from the mean divided by the number of observations minus one;
2 ( 5 „ , g - 5 , ) V ( « - 1)
Stress range = algebraic difference between maximum and minimum stress.
Stress ratio = algebraic ratio of minimum stress to maximum stress.
Published reports of the
NATIONAL COOPERATIVE HIGHWAY RESEARCH PROGRAM
are available from:
Highway Research Board National Academy of Sciences
2101 Constitution Avenue Washington, D.C. 20418
Rep. No Title —* A Critical Review of Literature Treating Methods of
Identifying Aggregates Subject to Destructive Volume Change When Frozen in Concrete and a Proposed Program of Research—Intermediate Report (Proj. 4-3(2)), 81 p., $1.80
1 Evaluation of Methods of Replacement of Deteriorated Concrete m Structures (Proj. 6-8), 56 p., $2.80
2 An Introduction to Guidelines for Satellite Studies of Pavement Performance (Proj 1-1), 19 p , $180
2A Guidelines for Satellite Studies of Pavement Performance, 85 p.+ 9 figs, 26 tables, 4 app, $3.00
3 Improved Criteria for Traffic Signals at Individual Intersections—Interim Report (Proj. 3-5), 36 p., $1.60
4 Non-Chemical Methods of Snow and Ice Control on Highway Structures (Proj 6-2), 74 p , $3.20
5 Effects of Different Methods of Stockpiling Aggregates—Interim Report (Proj 10-3), 48 p., $2 00
6 Means of Locating and Communicating with Disabled Vehicles—Interim Report (Proj. 3-4), 56 p. $3.20
7 Comparison of Different Methods of Measuring Pavement Condition—Interim Report (Proj. 1-2), 29 p , $1.80
8 Synthetic Aggregates for Highway Construction (Proj. 4-4), 13 p., $100
9 Traffic Surveillance and Means of Communicating with Drivers—Interim Report (Proj. 3-2), 28 p., $1.60
10 Theoretical Analysis of Structural Behavior of Road Test Flexible Pavements (Proj. 1-4), 31 p., $2.80
11 Effect of Control Devices on Traffic Operations— Interim Report (Proj 3-6), 107 p., $5.80
12 Identification of Aggregates Causing Poor Concrete Performance When Frozen—Interim Report (Proj. 4-3(1)), 47 p., $3.00
13 Running Cost of Motor Vehicles as Affected by Highway Design—Interim Report (Proj. 2-5), 43 p., $2.80
14 Density and Moisture Content Measurements by Nuclear Methods—Interim Report (Proj. 10-5), 32 p , $3.00
15 Identification of Concrete Aggregates Exhibiting Frost Susceptibility—Interim Report (Proj. 4-3(2)), 66 p., $4.00
16 Protective Coatings to Prevent Deterioration of Concrete by Deicing Chemicals (Proj 6-3), 21 p., $1 60
17 Development of Guidelines for Practical and Realistic Construction Specifications (Proj. 10-1), 109 p., $6.00
18 Community Consequences of Highway Improvement (Proj. 2-2), 37 p , $2.80
19 Economical and Effective Deicing Agents for Use on Highway Structures (Proj. 6-1), 19 p , $ 1.20
* Highway Research Board Special Report 80
Rep. No. Title 20 Economic Study of Roadway LighUng (Proj. 5-4),
77 p., $3.20 21 Detecting Variations m Load-Carrymg Capacity of
Flexible Pavements (Proj. 1-5), 30 p., $1.40 22 Factors Influencing Flexible Pavement Performance
(Proj 1-3(2)), 69 p., $2.60 23 Methods for Reducing Corrosion of Reinforcing
Steel (Proj. 6-4), 22 p., $1.40 24 Urban Travel Patterns for Airports, Shopping Cen
ters, and Industrial Plants (Proj. 7-1), 116 p., $5.20
25 Potential Uses of Sonic and Ultrasonic Devices m Highway Construction (Proj. 10-7), 48 p., $2.00
26 Development of Uniform Procedures for Establishing Construction Equipment Rental Rates (Proj. 13-1), 33 p., $1.60
27 Physical Factors Influencing Resistance of Concrete to Deicing Agents (Proj. 6-5), 41 p., $2.00
28 Surveillance Methods and Ways and Means of Communicating with Drivers (Proj. 3-2), 66 p., $2.60
29 Digital-Computer-Controlled Traffic Signal System for a Small City (Proj. 3-2), 82 p., $4.00
30 Extension of AASHO Road Test Performance Concepts (Proj. 1-4(2)), 33 p., $1.60
31 A Review of Transportation Aspects of Land-Use Control (Proj. 8-5), 41 p., $2.00
32 Improved Criteria for Traffic Signals at Individual Intersections (Proj. 3-5), 134 p., $5.00
33 Values of Time Savings of Commercial Vehicles (Proj. 2-4), 74 p., $3.60
34 Evaluation of Construction Control Procedures— Interim Report (Proj 10-2), 117 p., $5.00
35 Prediction of Flexible Pavement Deflections from Laboratory Repeated-Load Tests (Proj. 1-3(3)), 117 p., $5.00
36 Highway Guardrails—A Review of Current Practice (Proj. 15-1), 33 p , $1.60
37 Tentative Skid-Resistance Requirements for Mam Rural Highways (Proj. 1-7), 80 p., $3.60
38 Evaluation of Pavement Joint and Crack Sealing Materials and Practices (Proj. 9-3), 40 p., $2.00
39 Factors Involved in the Design of Asphaltic Pavement Surfaces (Proj. 1-8), 112 p., $5.00
40 Means of Locating Disabled or Stopped Vehicles (Proj. 3-4(1)), 40 p., $2.00
41 Effect of Control Devices on Traffic Operations (Proj. 3-6), 83 p., $3.60
42 Interstate Highway Maintenance Requirements and Unit Maintenance Expenditure Index (Proj. 14-1), 144 p., $5.60
43 Density and Moisture Content Measurements by Nuclear Methods (Proj. 10-5), 38 p., $2.00
44 Traffic Attraction of Rural Outdoor Recreational Areas (Proj. 7-2), 28 p., $1.40
45 Development of Improved Pavement Marking Materials—Laboratory Phase (Proj. 5-5), 24 p., $1.40
46 Effects of Different Methods of Stockpiling and Handling Aggregates (Proj. 10-3), 102 p., $4.60
47 Accident Rates as Related to Design Elements of Rural Highways (Proj 2-3), 173 p., $6.40
48 Factors and Trends in Trip Lengths (Proj. 7-4), 70 p , $3.20
49 National Survey of Transportation Attitudes and Behavior—Phase I Summary Report (Proj. 20-4), 71 p., $3.20
Rep. No. Title 50 Factors Influencing Safety at Highway-Rail Grade
Crossings (Proj. 3-8), 113 p., $5:20 51 Sensing and Communication Between Vehicles (Proj.
3-3), 105 p., $5.00 52 Measurement of Pavement Thickness by Rapid and
Nondestructive Methods (Proj. 10-6), 82 p., $3.80
53 Multiple Use of Lands Within Highway Rights-of-Way (Proj. 7-6), 68 p , $3.20
54 Location, Selection, and Maintenance of Highway Guardrails and Median Barriers (Proj. 15-1(2)), 63 p , $2 60
55 Research Needs in Highway Transportation (Proj. 20-2), 66 p , $2 80
56 Scenic Easements—Legal, Administrative, and Valuation Problems and Procedures (Proj. 11-3), 174 p., $6.40
57 Factors Influencing Modal Trip Assignment (Proj 8-2), 78 p., $3.20
58 Comparative Analysis of Traffic Assignment Techniques with Actual Highway Use (Proj. 7-5), 85 p., $3 60
59 Standard Measurements for Satellite Road Test Program (Proj. 1-6), 78 p , $3.20
60 Effects of Illumination on Operating Characteristics of Freeways (Proj. 5-2) 148 p., $6.00
61 Evaluation of Studded Tires—Performance Data and Pavement Wear Measurement (Proj. 1-9), 66 p., $3.00
62 Urban Travel Patterns for Hospitals, Universities, Office Buildings, and Capitols (Proj. 7-1), 144 p., $5.60
63 Economics of Design Standards for Low-Volume Rural Roads (Proj. 2-6), 93 p., $4.00
64 Motorists' Needs and Services on Interstate Highways (Proj. 7-7), 88 p., $3.60
65 One-Cycle Slow-Freeze Test for Evaluating Aggregate Performance in Frozen Concrete (Proj. 4-3(1)), 21 p., $1.40
66 Identification of Frost-Susceptible Particles in Concrete Aggregates (Proj. 4-3(2)), 62 p., $2.80
67 Relation of Asphalt Rheological Properties to Pavement Durability (Proj. 9-1), 45 p., $2.20
68 Application of Vehicle Operating Characteristics to Geometric Design and Traffic Operations (Proj. 3-10), 38 p., $2.00
69 Evaluation of Construction Control Procedures— Aggregate Gradation Variations and Effects (Proj. 10-2A), 58 p., $2.80
70 Social and Economic Factors Affecting Intercity Travel (Proj 8-1), 68 p., $3.00
71 Analytical Study of Weighing Methods for Highway Vehicles in Motion (Proj. 7-3), 63 p., $2.80
72 Theory and Practice in Inverse Condemnation for Five Representative States (Proj. 11-2), 44 p., $2.20
73 Improved Criteria for Traffic Signal Systems on Urban Arterials (Proj. 3-5/1), 55 p., $2.80
74 Protective Coatings for Highway Structural Steel (Proj. 4-6), 64 p., $2 80
74A Protective Coatings for Highway Structural Steel— Literature Survey (Proj. 4-6), 275 p., $8.00
74B Protective Coatings for Highway Structural Steel-Current Highway Practices (Proj. 4-6), 102 p , $4.00
75 Effect of Highway Landscape Development on Nearby Property (Proj. 2-9), 82 p., $3.60
Rep. No. Title 76 Detecting Seasonal Changes in Load-Carrying Ca
pabilities of Flexible Pavements (Proj. 1-5(2)), 37 p., $2.00
77 Development of Design Criteria for Safer Luminaire Supports (Proj. 15-6), 82 p., $3.80
78 Highway Noise—Measurement, Simulation, and Mixed Reactions (Proj 3-7), 78 p., $3.20
79 Development of Improved Methods for Reduction of Traffic Accidents (Proj. 17-1), 163 p., $6.40
80 Oversize-Overweight Permit Operation on State Highways (Proj. 2-10), 120 p., $5.20
81 Moving Behavior and Residential Choice—A National Survey (Proj. 8-6), 129 p., $5.60
82 National Survey of Transportation Attitudes and Behavior—Phase I I Analysis Report (Proj 20-4), 89 p., $4.00
83 Distribution of Wheel Loads on Highway Bridges (Proj 12-2), 56 p., $2.80
84 Analysis and Projection of Research on TraflBc Surveillance, Communication, and Control (Proj. 3-9), 48 p., $2.40
85 Development of Formed-in-Place Wet Reflective Markers (Proj. 5-5), 28 p., $1.80
86 Tentative Service Requirements for Bridge Rail Systems (Proj. 12-8), 62 p., $3.20
87 Rules of Discovery and Disclosure in Highway Condemnation Proceedings (Proj. 11-1(5)), 28 p , $2.00
88 Recognition of Benefits to Remainder Property in Highway Valuation Cases (Proj. 11-1(2)), 24 p., $2.00
89 Factors, Trends, and Guidelines Related to Trip Length (Proj. 7-4), 59 p., $3.20
90 Protection of Steel in Prestressed Concrete Bridges (Proj. 12-5), 86 p., $4.00
91 Effects of Deicing Salts on Water Quality and Biota —Literature Review and Recommended Research (Proj. 16-1), 70 p., $3.20
92 Valuation and Condemnation of Special Purpose Properties (Proj. 11-1(6)), 47 p., $2.60
93 Guidelines for Medial and Marginal Access Control on Major Roadways (Proj. 3-13), 147 p., $6 20
94 Valuation and Condemnation Problems Involving Trade Fixtures (Proj. 11-1(9)), 22 p., $1.80
95 Highway Fog (Proj. 5-6), 48 p., $2.40 96 Strategies for the Evaluation of Alternative Trans
portation Plans (Proj. 8-4), 111 p., $5.40 97 Analysis of Structural Behavior of AASHO Road
Test Rigid Pavements (Proj. 1-4(1)A), 35 p., $2 60
98 Tests for Evaluating Degradation of Base Course Aggregates (Proj. 4-2), 98 p $5.00
99 Visual Requirements in Night Driving (Proj. 5-3), 38 p., $2.60
100 Research Needs Relating to Performance of Aggregates in Highway Construction (Proj. 4-8), 68 p., $3.40
101 Effect of Stress on Freeze-Thaw Durability of Concrete Bridge Decks (Proj. 6-9), 70 p., $3.60
102 Effect of Weldments on the Fatigue Strength of Steel Beams (Proj. 12-7), 114 p., $5 40
Rep. No. Title
Synthesis of Highway Practice 1 Traffic Control for Freeway Maintenance (Proj. 20-S,
Topic 1), 47 p., $2.20 2 Bridge Approach Design and Construction Practices
(Proj. 20-5, Topic 2) , 30 p., $2.00 3 Traffic-Safe and Hydraulically Efficient Drainage
Practice (Proj. 20-S, Topic 4) , 38 p., $2.20 4 Concrete Bridge Deck Durability (Proj. 20-S, Topic
3), 28 p., $2.20
THE NATIONAL ACADEMY OF SCIENCES is a private, honorary organization of more than 700 scientists and engineers elected on the basis of outstanding contributions to knowledge. Established by a Congressional Act of Incorporation signed by President Abraham Lincoln on March 3, 1863, and supported by private and public funds, the Academy works to further science and its use for the general welfare by bringing together the most qualified individuals to deal with scientific and technological problems of broad significance.
Under the terms of its Congressional charter, the Academy is also called upon to act as an official—yet independent—adviser to the Federal Government in any matter of science and technology. This provision accounts for the close ties that have always existed between the Academy and the Government, although the Academy is not a governmental agency and its activities are not limited to those on behalf of the Government.
THE NATIONAL ACADEMY OF ENGINEERING was established on December 5, 1964. On that date the Council of the National Academy of Sciences, under the authority of its Act of Incorporation, adopted Articles of Organization bringing the National Academy of Engineering into being, independent and autonomous in its organization and the election of its members, and closely coordinated with the National Academy of Sciences in its advisory activities. The two Academies join in the furtherance of science and engineering and share the responsibility of advising the Federal Government, upon request, on any subject of science or technology.
THE NATIONAL RESEARCH COUNCIL was organized as an agency of the National Academy of Sciences in 1916, at the request of President Wilson, to enable the broad community of U . S. scientists and engineers to associate their efforts with the limited membership of the Academy in service to science and the nation. Its members, who receive their appointments from the President of the National Academy of Sciences, are drawn from academic, industrial and government organizations throughout the country. The National Research Council serves both Academies in the discharge of their responsibilities.
Supported by private and public contributions, grants, and contracts, and voluntary contributions of time and effort by several thousand of the nation's leading scientists and engineers, the Academies and their Research Council thus work to serve the national interest, to foster the sound development of science and engineering, and to promote their effective application for the benefit of society.
THE DIVISION OF ENGINEERING is one of the eight major Divisions into which the National Research Council is organized for the conduct of its work. Its membership includes representatives of the nation's leading technical societies as well as a number of members-at-large. Its Chairman is appointed by the Council of the Academy of Sciences upon nomination by the Council of the Academy of Engineering.
THE HIGHWAY RESEARCH BOARD, organized November 11, 1920, as an agency of the Division of Engineering, is a cooperative organization of the highway technologists of America operating under the auspices of the National Research Council and with the support of the several highway departments, the Bureau of Public Roads, and many other organizations interested in the development of transportation. The purpose of the Board is to advance knowledge concerning the nature and performance of transportation systems, through the stimulation of research and dissemination of information derived therefrom.
H I G H W A Y RESEARCH BOARD NATIONAL ACADEMY Of SCIENCES—NAT/ONAt RESEARCH COUNCIL 2101 Constilulion Avenue Woihington, D. C. 10418
ADDRESS CORRECTION REQUESTED
NON-PROFIT O R G . U.S. POSTAGE
PAID W A S H I N G T O N , D.C. PERMIT N O . 42970
-o z r - o * »—4 O CDU) • n CO -* o > -o o m * -<
(/I o
m 2 O m </>

Copyright © 2022 FDOKUMEN