Experimental determination of axial compressive strength of crimped cold-formed channels
Upload
khangminh22Category
view
6download
0
ScienceDirect
Available online at www.sciencedirect.com
Available online at www.sciencedirect.com
ScienceDirect
Structural Integrity Procedia 00 (2016) 000–000 www.elsevier.com/locate/procedia
2452-3216 © 2016 The Authors. Published by Elsevier B.V. Peer-review under responsibility of the Scientific Committee of PCF 2016.
XV Portuguese Conference on Fracture, PCF 2016, 10-12 February 2016, Paço de Arcos, Portugal
Thermo-mechanical modeling of a high pressure turbine blade of an airplane gas turbine engine
P. Brandãoa, V. Infanteb, A.M. Deusc* aDepartment of Mechanical Engineering, Instituto Superior Técnico, Universidade de Lisboa, Av. Rovisco Pais, 1, 1049-001 Lisboa,
Portugal bIDMEC, Department of Mechanical Engineering, Instituto Superior Técnico, Universidade de Lisboa, Av. Rovisco Pais, 1, 1049-001 Lisboa,
Portugal cCeFEMA, Department of Mechanical Engineering, Instituto Superior Técnico, Universidade de Lisboa, Av. Rovisco Pais, 1, 1049-001 Lisboa,
Portugal
Abstract
During their operation, modern aircraft engine components are subjected to increasingly demanding operating conditions, especially the high pressure turbine (HPT) blades. Such conditions cause these parts to undergo different types of time-dependent degradation, one of which is creep. A model using the finite element method (FEM) was developed, in order to be able to predict the creep behaviour of HPT blades. Flight data records (FDR) for a specific aircraft, provided by a commercial aviation company, were used to obtain thermal and mechanical data for three different flight cycles. In order to create the 3D model needed for the FEM analysis, a HPT blade scrap was scanned, and its chemical composition and material properties were obtained. The data that was gathered was fed into the FEM model and different simulations were run, first with a simplified 3D rectangular block shape, in order to better establish the model, and then with the real 3D mesh obtained from the blade scrap. The overall expected behaviour in terms of displacement was observed, in particular at the trailing edge of the blade. Therefore such a model can be useful in the goal of predicting turbine blade life, given a set of FDR data. © 2016 The Authors. Published by Elsevier B.V. Peer-review under responsibility of the Scientific Committee of PCF 2016.
Keywords: High Pressure Turbine Blade; Creep; Finite Element Method; 3D Model; Simulation.
* Corresponding author. Tel.: +351 218419991.
E-mail address: [email protected]
Procedia Structural Integrity 7 (2017) 407–414
2452-3216 Copyright 2017 The Authors. Published by Elsevier B.V.Peer-review under responsibility of the Scientific Committee of the 3rd International Symposium on Fatigue Design and Material Defects.10.1016/j.prostr.2017.11.106
10.1016/j.prostr.2017.11.106 2452-3216
Copyright © 2017 The Authors. Published by Elsevier B.V.Peer-review under responsibility of the Scientific Committee of the 3rd International Symposium on Fatigue Design and Material Defects.
Available online at www.sciencedirect.com
ScienceDirect
Structural Integrity Procedia 00 (2017) 000–000 www.elsevier.com/locate/procedia
2452-3216 © 2017 The Authors. Published by Elsevier B.V. Peer-review under responsibility of the Scientific Committee of the 3rd International Symposium on Fatigue Design and Material Defects.
3rd International Symposium on Fatigue Design and Material Defects, FDMD 2017, 19-22 September 2017, Lecco, Italy
Fatigue strength and life determination of weldments based on fracture mechanics
U. Zerbst a *, M. Madia a and H.Th. Beier b
a Bundesanstalt für Materialforschung und -prüfung (BAM), 9.1, Unter den Eichen 87, D-12205 Berlin, Germany bTechnische Universität Darmstadt, Materials Mechanics Group, Franziska-Braun-Str. 3, D-64287 Darmstadt, Germany
Abstract
The paper provides an overview on the results of a German cluster project on the use of fracture mechanics to the determination of the fatigue strength of weldments with fatigue cracks originating at the weld toes. The approach includes (a) a concept for short crack propagation for which the common ∆K concept is not applicable and the crack closure effects are still being gradually build-up, (b) a method for determining fatigue life relevant initial crack sizes as they are needed in any fracture mechanics analysis and (c) multiple cracking and crack coalescence at load levels higher than the endurance limit. The analyses are stochastically performed. Both, the endurance limit and the finite life branch of the S-N curve are determined.
Besides a brief introduction into the approach, validation examples are presented. These comprise different weldment types (butt welds, cross joints and longitudinal stiffened plates), two steels (S355NL and S960QL) of quite different strengths, different weld geometries due to different welding techniques (WIG, MAG), as-welded and stress relieved welds and different stress ratios varying from R = -1 to R = 0.5.
Keywords: Weldments; fatigue strength, fracture mechanics; initial crack size; short crack propagation; multiple crack propagation
Introduction
The idea to apply fracture mechanics to the fatigue strength and life of weldments is anything but new. Almost half a century ago Maddox (1970) was one of the first to mention it. In 1974 he wrote: “It is now widely recognized that flaws will inevitably exist in welded structures and the old idea of removing all detectable defects must be replaced by the 'fitness for purpose' design philosophy. This makes it necessary to define reliable methods of assessing the significance of flaws, particularly in the context of fatigue, ….
* Corresponding author. Tel.: +49 (0) 30 8104 1531; fax: +49 (0) 30 8104 1537.
E-mail address: [email protected]

408 U. Zerbst et al. / Procedia Structural Integrity 7 (2017) 407–4142 U. Zerbst, M. Madia & H.Th. Beier/ Structural Integrity Procedia 00 (2017) 000–000
The most promising approach to this problem lies in the use of the fracture mechanics based description of fatigue crack propa-gation.” (Maddox, 1974). Since then, many studies have been performed on the issue. There is not enough space here for a detailed discussion of the existing material. What, however, should be pointed out is that even the IIW Recommendations for fatigue assessment of weldments (Hobbacher, 2016) includes fracture mechanics as an option, see also the textbook of Radaj et al. (2006).
With view exceptions, which will be mentioned below, the schemes of the existing approaches for fracture mechanics-based deter-mination of the fatigue strength of weldments are characterized by the following features: (i) the crack driving force is described by the linear elastic ∆K factor, (ii) the initial crack size is assumed as a fixed value originally fitted to or based on back-calculations from S-N data also using the ∆K concept, (iii) the crack closure phenomenon is neglected, (iv) only one crack is considered for which the residual lifetime is obtained, (v) variations in the local geometry of the highly stressed regions in the weldments, e.g. the weld toes, are not taken into account, and (vi) welding residual stresses are not or in a very simplified way taken into account. Any of these assumptions are oversimplifications or at least disputable.
In the German project cluster IBESS (which stands for the German abbreviations for “Integral method for fracture mechanics based determination of the fatigue strength of weldments”) eight partners were involved. The aim was to develop a concept taking into account all the points mentioned above and to avoid the shortcomings as far as possible. The cluster was funded by DFG and AiF. For reasons of space, no exhaustive discussion of all aspects is possible here. Instead the reader is referred to a special issue of the journal Engineering Fracture Mechanics which is in progress.
Short and long crack propagation
With respect to fatigue crack propagation three stages can be distinguished: (i) the growth of microstructurally short cracks, (ii) the growth of mechanically/physically short cracks and (iii) the growth of long cracks. In the presence of material defects the second stage usually plays the major role with respect to the overall lifetime (Polak, 2003). Although comparable with respect to their size which is in the order of the dimension of the plastic zone surrounding the crack tip, mechanically and physically short cracks shall be separately discussed in the following.
Mechanically short crack
The crack driving force of mechanically short cracks cannot be described by the linear elastic ∆K concept but requires an elastic-plastic parameter. Within the IBESS project the cyclic J integral ∆J is used, for the determination of which the authors used an analytical solution of Zerbst et al. (2011). The parameter ∆J is determined by
( )2
2r
KJ f LE
−∆∆ = ⋅ ∆ ′
(1)
with the function f(∆Lr) being a plasticity correction function determined in conformity with the R6 solution (2009) but modified for cyclic loading such that
appr
0
L2∆σ
∆ =⋅σ
. (2)
and ( ) -1 22
ref rr
ref ref ref
E 1 Lf L2 E
⋅ ∆ε ∆∆ = + ∆σ ⋅ ∆ε ∆σ
. (3)
The stresses and strains refer to the stabilized cyclic stress-strain curve. The parameter ∆σapp is the applied cyclic stress range (referring to the gross cross-section) and σ0 is a reference yield stress for which Madia et al. (2014) provided parametric equations. ∆K is obtained by weight function solutions based on the though thickness profiles of the elastic stresses. For the latter, the authors have generated parametric solutions applicable to Single-V and Double-V joints as well as to T- and cruciform joints subjected to tensile and bending loading which cover a wide range of weld toe radii (from 0.1 to 4 mm) and flank angles (from 10o to 60o) (Kiyak et al., 2016). For more details with respect to the determination of ∆J see Madia et at. (2017). The analytical approach has been validated against numerical ∆J solutions. An example for a cruciform joint shows Fig. 1. Details can be found in Tchoffo Ngoula et al. (2017).
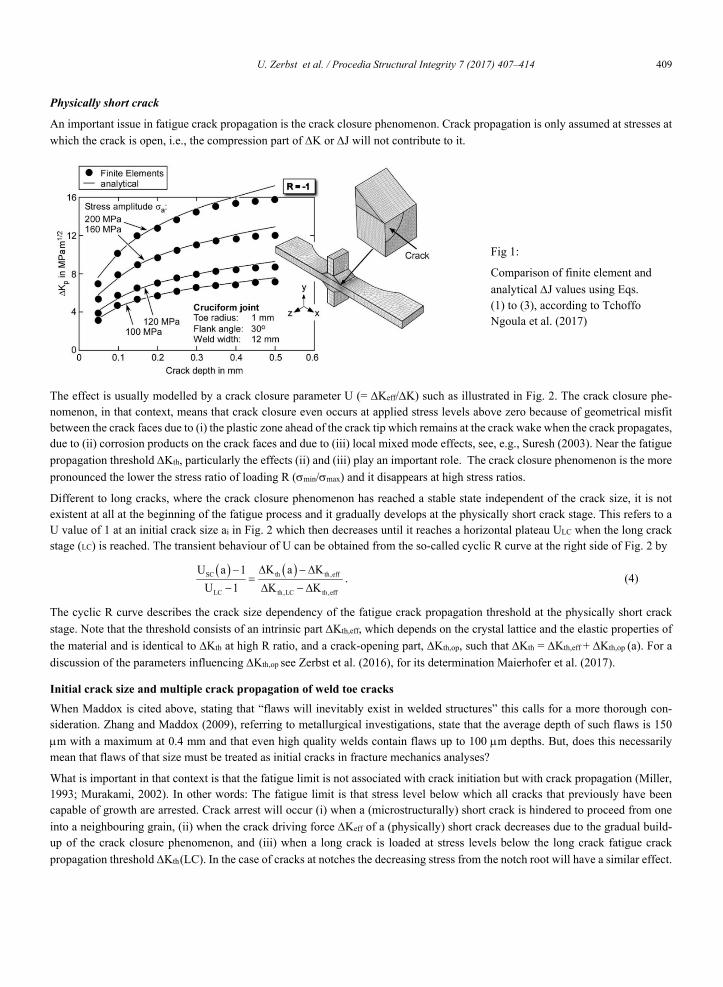
U. Zerbst et al. / Procedia Structural Integrity 7 (2017) 407–414 409 U. Zerbst, M. Madia & H.Th. Beier// Structural Integrity Procedia 00 (2017) 000–000 3
Physically short crack
An important issue in fatigue crack propagation is the crack closure phenomenon. Crack propagation is only assumed at stresses at which the crack is open, i.e., the compression part of ∆K or ∆J will not contribute to it.
Fig 1:
Comparison of finite element and analytical ∆J values using Eqs. (1) to (3), according to Tchoffo Ngoula et al. (2017)
The effect is usually modelled by a crack closure parameter U (= ∆Keff/∆K) such as illustrated in Fig. 2. The crack closure phe-nomenon, in that context, means that crack closure even occurs at applied stress levels above zero because of geometrical misfit between the crack faces due to (i) the plastic zone ahead of the crack tip which remains at the crack wake when the crack propagates, due to (ii) corrosion products on the crack faces and due to (iii) local mixed mode effects, see, e.g., Suresh (2003). Near the fatigue propagation threshold ∆Kth, particularly the effects (ii) and (iii) play an important role. The crack closure phenomenon is the more pronounced the lower the stress ratio of loading R (σmin/σmax) and it disappears at high stress ratios.
Different to long cracks, where the crack closure phenomenon has reached a stable state independent of the crack size, it is not existent at all at the beginning of the fatigue process and it gradually develops at the physically short crack stage. This refers to a U value of 1 at an initial crack size ai in Fig. 2 which then decreases until it reaches a horizontal plateau ULC when the long crack stage (LC) is reached. The transient behaviour of U can be obtained from the so-called cyclic R curve at the right side of Fig. 2 by
( ) ( )th th,effSC
LC th,LC th,eff
K a KU a 1U 1 K K
∆ − ∆−=
− ∆ − ∆. (4)
The cyclic R curve describes the crack size dependency of the fatigue crack propagation threshold at the physically short crack stage. Note that the threshold consists of an intrinsic part ∆Kth,eff, which depends on the crystal lattice and the elastic properties of the material and is identical to ∆Kth at high R ratio, and a crack-opening part, ∆Kth,op, such that ∆Kth = ∆Kth,eff + ∆Kth,op (a). For a discussion of the parameters influencing ∆Kth,op see Zerbst et al. (2016), for its determination Maierhofer et al. (2017).
Initial crack size and multiple crack propagation of weld toe cracks
When Maddox is cited above, stating that “flaws will inevitably exist in welded structures” this calls for a more thorough con-sideration. Zhang and Maddox (2009), referring to metallurgical investigations, state that the average depth of such flaws is 150 µm with a maximum at 0.4 mm and that even high quality welds contain flaws up to 100 µm depths. But, does this necessarily mean that flaws of that size must be treated as initial cracks in fracture mechanics analyses?
What is important in that context is that the fatigue limit is not associated with crack initiation but with crack propagation (Miller, 1993; Murakami, 2002). In other words: The fatigue limit is that stress level below which all cracks that previously have been capable of growth are arrested. Crack arrest will occur (i) when a (microstructurally) short crack is hindered to proceed from one into a neighbouring grain, (ii) when the crack driving force ∆Keff of a (physically) short crack decreases due to the gradual build-up of the crack closure phenomenon, and (iii) when a long crack is loaded at stress levels below the long crack fatigue crack propagation threshold ∆Kth (LC). In the case of cracks at notches the decreasing stress from the notch root will have a similar effect.
410 U. Zerbst et al. / Procedia Structural Integrity 7 (2017) 407–4144 U. Zerbst, M. Madia & H.Th. Beier/ Structural Integrity Procedia 00 (2017) 000–000
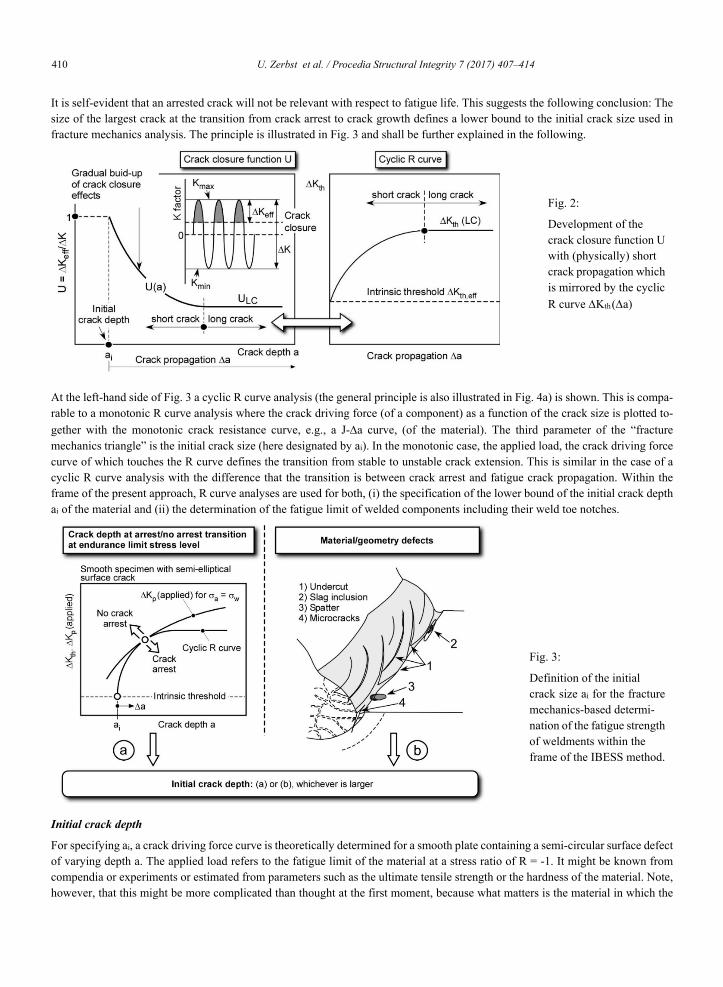
It is self-evident that an arrested crack will not be relevant with respect to fatigue life. This suggests the following conclusion: The size of the largest crack at the transition from crack arrest to crack growth defines a lower bound to the initial crack size used in fracture mechanics analysis. The principle is illustrated in Fig. 3 and shall be further explained in the following.
Fig. 2:
Development of the crack closure function U with (physically) short crack propagation which is mirrored by the cyclic R curve ∆Kth (∆a)
At the left-hand side of Fig. 3 a cyclic R curve analysis (the general principle is also illustrated in Fig. 4a) is shown. This is compa-rable to a monotonic R curve analysis where the crack driving force (of a component) as a function of the crack size is plotted to-gether with the monotonic crack resistance curve, e.g., a J-∆a curve, (of the material). The third parameter of the “fracture mechanics triangle” is the initial crack size (here designated by ai). In the monotonic case, the applied load, the crack driving force curve of which touches the R curve defines the transition from stable to unstable crack extension. This is similar in the case of a cyclic R curve analysis with the difference that the transition is between crack arrest and fatigue crack propagation. Within the frame of the present approach, R curve analyses are used for both, (i) the specification of the lower bound of the initial crack depth ai of the material and (ii) the determination of the fatigue limit of welded components including their weld toe notches.
Fig. 3:
Definition of the initial crack size ai for the fracture mechanics-based determi- nation of the fatigue strength of weldments within the frame of the IBESS method.
Initial crack depth
For specifying ai, a crack driving force curve is theoretically determined for a smooth plate containing a semi-circular surface defect of varying depth a. The applied load refers to the fatigue limit of the material at a stress ratio of R = -1. It might be known from compendia or experiments or estimated from parameters such as the ultimate tensile strength or the hardness of the material. Note, however, that this might be more complicated than thought at the first moment, because what matters is the material in which the
U. Zerbst et al. / Procedia Structural Integrity 7 (2017) 407–414 411 U. Zerbst, M. Madia & H.Th. Beier// Structural Integrity Procedia 00 (2017) 000–000 5
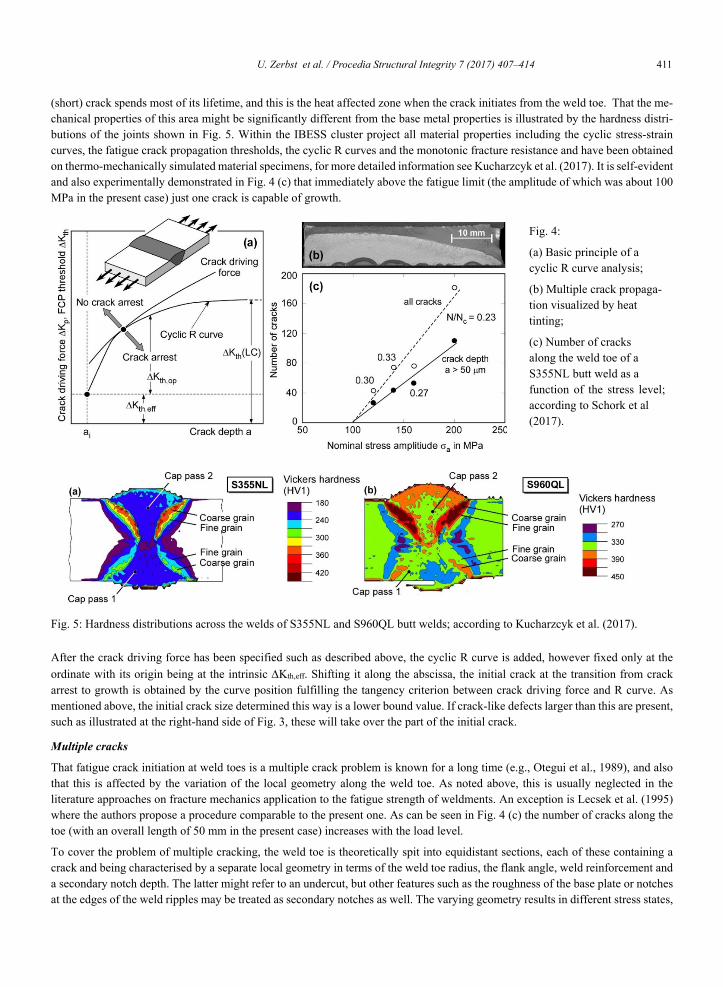
(short) crack spends most of its lifetime, and this is the heat affected zone when the crack initiates from the weld toe. That the me-chanical properties of this area might be significantly different from the base metal properties is illustrated by the hardness distri-butions of the joints shown in Fig. 5. Within the IBESS cluster project all material properties including the cyclic stress-strain curves, the fatigue crack propagation thresholds, the cyclic R curves and the monotonic fracture resistance and have been obtained on thermo-mechanically simulated material specimens, for more detailed information see Kucharzcyk et al. (2017). It is self-evident and also experimentally demonstrated in Fig. 4 (c) that immediately above the fatigue limit (the amplitude of which was about 100 MPa in the present case) just one crack is capable of growth.
Fig. 4:
(a) Basic principle of a cyclic R curve analysis;
(b) Multiple crack propaga- tion visualized by heat tinting;
(c) Number of cracks along the weld toe of a S355NL butt weld as a function of the stress level; according to Schork et al (2017).
Fig. 5: Hardness distributions across the welds of S355NL and S960QL butt welds; according to Kucharzcyk et al. (2017). After the crack driving force has been specified such as described above, the cyclic R curve is added, however fixed only at the ordinate with its origin being at the intrinsic ∆Kth,eff. Shifting it along the abscissa, the initial crack at the transition from crack arrest to growth is obtained by the curve position fulfilling the tangency criterion between crack driving force and R curve. As mentioned above, the initial crack size determined this way is a lower bound value. If crack-like defects larger than this are present, such as illustrated at the right-hand side of Fig. 3, these will take over the part of the initial crack.
Multiple cracks
That fatigue crack initiation at weld toes is a multiple crack problem is known for a long time (e.g., Otegui et al., 1989), and also that this is affected by the variation of the local geometry along the weld toe. As noted above, this is usually neglected in the literature approaches on fracture mechanics application to the fatigue strength of weldments. An exception is Lecsek et al. (1995) where the authors propose a procedure comparable to the present one. As can be seen in Fig. 4 (c) the number of cracks along the toe (with an overall length of 50 mm in the present case) increases with the load level.
To cover the problem of multiple cracking, the weld toe is theoretically spit into equidistant sections, each of these containing a crack and being characterised by a separate local geometry in terms of the weld toe radius, the flank angle, weld reinforcement and a secondary notch depth. The latter might refer to an undercut, but other features such as the roughness of the base plate or notches at the edges of the weld ripples may be treated as secondary notches as well. The varying geometry results in different stress states,

412 U. Zerbst et al. / Procedia Structural Integrity 7 (2017) 407–4146 U. Zerbst, M. Madia & H.Th. Beier/ Structural Integrity Procedia 00 (2017) 000–000
i.e. stress concentration factors and stress-depth profiles along the weld toe with the consequence that the initial cracks in the sections will find quite different growth conditions. In some of the sections they will extend rapidly, in others slowly and in some even not at all. When the surface points of two cracks touch, coalescence is assumed such that the length of the new crack at surface equals the sum of the lengths of the former individual cracks and the depth refers to those of the former deeper crack.
Fig. 6:
Subdivision of the weld toe into equidistant sections each of which is assigned to a random set of the geometry parameters toe radius, flank angle, weld reinforcement and secondary notch deph as the basis for the stochastic determina-tion of both, the finite life fatigue strength and the endurance limit by the IBESS methodology.
Stochastic determination of the finite life fatigue and the endurance limit of weldments
Synthetic weldments are generated by fitting together the sections along the weld toe of Fig. 6 with each section being characterised by a separate local geometry. The random geometry is based on available statistical distributions of the parameters weld toe radius, flank angle, weld reinforcement and secondary notch. Fatigue crack propagation analyses are carried out for both, the finite life fa-tigue strength and the endurance limit. The finite life failure criterion might be monotonic fracture or another criterion such as a certain crack depth to wall thickness ratio. A number of synthetic weldment specimens is generated for each stress level such that the result of the analysis is a scatter band. With respect to the endurance limit (defined for 107 loading cycles in the present case) the number of specimens is counted which fail before reaching the 107 cycles. This number increases with the stress level and vice versa. Based on that information and the total number of specimens “tested” at each stress level a statistical distribution of the endurance limit is established. An example is shown in Fig. 7.
Further validation examples
The method was applied to a large number of welds comprising different weldment types (butt, cruciform, longitudinal stiffened), different materials and plate thicknesses (S355NL and S960QL - T = 10 mm; S355J2+N – T = 3mm) with two weld geometries respectively manufacturing techniques (MAG and TIG) for each, and in the as-welded and stress relieved state. Only few of the results can be shown here because of the limited available space, see, however Madia et al. (2017).
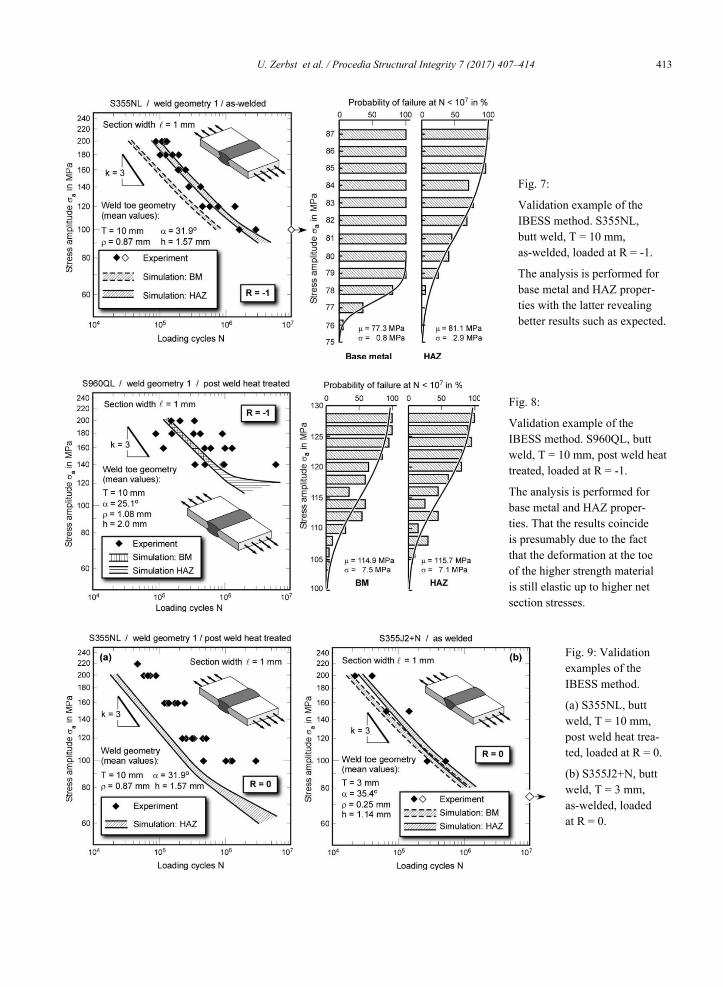
As can be seen in Figs. 7 and 8, for butt welds of S355NL and S960QL tested at a stress ratio of R = -1 the experimental data are predicted well when heat affected zone (HAZ) data are used for the analyses. No validation of the endurance limits was performed, however, comparison with literature data (Ritter, 1994) yielded quite satisfying results. Conservative predictions have been obtain-ned for R = 0 and 0.5 in Figs. 9 (a) and 10 (a). As the reason the authors suspect a local R ratio lower than the nominal one in the tests due to compression residual stresses generated by residual stress re-distribution under cyclic loading (Hensel et al., 2017). No HAZ material data were available for the 3 mm thick butt welded plates of S 355J2+N (Fig. 9b). Instead data from the 10 mm plates have been applied. Finally, Fig. 10 (b) shows an application of an extended weld quality scheme (DIN EN ISO 5817, 2014). Based on this, the weldments were classified by C63 which is in good agremment with the IBESS predictions.
U. Zerbst et al. / Procedia Structural Integrity 7 (2017) 407–414 413 U. Zerbst, M. Madia & H.Th. Beier// Structural Integrity Procedia 00 (2017) 000–000 7
Fig. 7:
Validation example of the IBESS method. S355NL, butt weld, T = 10 mm, as-welded, loaded at R = -1.
The analysis is performed for base metal and HAZ proper- ties with the latter revealing better results such as expected.
Fig. 8:
Validation example of the IBESS method. S960QL, butt weld, T = 10 mm, post weld heat treated, loaded at R = -1.
The analysis is performed for base metal and HAZ proper- ties. That the results coincide is presumably due to the fact that the deformation at the toe of the higher strength material is still elastic up to higher net section stresses.
Fig. 9: Validation examples of the IBESS method.
(a) S355NL, butt weld, T = 10 mm, post weld heat trea- ted, loaded at R = 0.
(b) S355J2+N, butt weld, T = 3 mm, as-welded, loaded at R = 0.

414 U. Zerbst et al. / Procedia Structural Integrity 7 (2017) 407–4148 U. Zerbst, M. Madia & H.Th. Beier/ Structural Integrity Procedia 00 (2017) 000–000
Fig. 10: Validation
(a) S355NL, longi- tudinal stiffened, T = 10 mm, stress reliefed, R = 0.5.
(b) S355NL, butt weld, T = 10 mm, as-welded, R = -1; analysis based on (extended) weld qua-lity (ISO 5817), Schork et al (2017).
References
DIN EN ISO 5817 (2014): Schweißen – Schmelzschweißverbindungen an Stahl, Nickel, Titan und deren Legierungen (ohne Strahlschweißen) – Bewertungsgruppen von Unregelmä-ßigkeiten. Normenausschuss Schweißen und verwandte Verfahren (NAS) in DIN, Berlin. Hensel, J., Nitschke-Pagel, T., Tchoffo Ngoula, D., Beier, H.Th, Tchuindjang, D. and Zerbst, U. (2017): Welding residual stresses, fatigue crack
propagation and fatigue strength. Subm. to Engng. Fracture Mech. Hobbacher, A. F., 2016. Recommendations for fatigue design of welded joints and components, 2nd ed., Springer Int- Publ. Kiyak, Y., Madia, M. and Zerbst, U., 2016. Extended parametric equations for weld toe stress concentration factors and through-thickness stress
distributions in butt-welded plates subject to tensile and bending loading. Weld. World 60, 1247-1259. Kucharzcyk, P., Madia, M., Zerbst, U., Schork, B. Gerwin, P. and Münstermann, S., 2017. Fracture mechanics-based prediction of the fatigue strength of weldments. Material aspects. Submitted to Engng. Fracture Mech. Lecsek, R.L., Yee, R., Lambert, B. and Burns, D.J., 1995. A probabilistic model for initiation and propagation of surface cracks in welded joints. Fatigue Fracture Engng. Mat. Struct. 18, 821-831. Madia, M., Arafah, D. und Zerbst, U. (2014): Reference load solutions for plates with semi-elliptical surface cracks subjected to biaxial tensile loading. Int. J. Pres. Ves. Piping, 119, 19-28. Madia, M., Zerbst, U., Beier, H.Th. and Schork, B., 2017. The IBESS model – elements, realization, validation. Subm. to Engng. Fracture Mech. Maddox, S.J., 1970. Calculating the fatigue strength of a welded joint using fracture mechanics. Metal Construction 2, 327-331. Maddox, S.J., 1974. Assessing the Significance of Flaws in Welds Subject to Fatigue. Welding Res. Suppl. 401s-409s, Sept. 1974. Maierhofer, J., Kolitsch, S., Pippan, R., Gänser, H.-P., Madia, M. and Zerbst, U., 2017. The cyclic R curve – determination, problems and
application. Subm. to Engng. Fracture Mech. Miller, K.J., 1993. The two thresholds of fatigue behavior. Fatigue Fracture Engng. Mat. Struct. 16, 931-939. Murakami, Y., 2002. Metal fatigue. Effects of small defects and nonmetallic inclusions. Elsevier. Oxford. Otegui, J.L., Kerr, H.W., Burns, D.J. and Mohaupt, U.H., 1989. Fatigue crack initiation from defects at weld toes in steel.
Int. J. Press. Vess. Piping 38, 385-417. Polak, J. (2003): Cyclic deformation, crack initiation, and low-cycle fatigue. In: Ritchie, R.O. and Murakami, Y. (Eds.):
Comprehensive Structural Integrity; Volume 4: Cyclic loading and Fracture; Elsevier, 1-39. R6, Revision 4, 2009. Assessment of the Integrity of Structures Containing Defects. British Energy Generation Ltd (BEGL), Barnwood, Gloucester. Radaj, D., Sonsino, C. M. and Fricke, W., 2006. Fatigue assessment of welded joints by local approaches, 2nd ed., Cambridge, England, Woodhead. Ritter, W. (1994): Kenngrößen der Wöhlerlinien für Schweißverbindungen aus Stählen. Veröffentlichungen des Instituts für Stahlbau und Werk- stoffmechanik der TH Darmstadt, Vol. 53. Shork, B., Kucharzcyk, P, Tchuindjang, D., Kaffenberger, M, Madia, M. and Zerbst, U. (2017): The effect of the local weld geometry and material defects on crack initiation and fatigue strength. Subm. to Engng. Fracture Mech. Suresh, S., 2003. Fatigue of materials. Cambridge: Cambridge University Press, 2nd ed. Tchoffo Ngoula, D., Madia, M., Beier, H.Th., Vormwald, M. and Zerbst, U., 2017. Cyclic J integral – numerical and analytical investigations on weldments. Subm. to Engng. Fracture Mech. Zerbst, U., Madia, M. and Hellmann, D., 2011. An analytical fracture mechanics model for estimation of S-N curves of metallic alloys containing large second particles. Engng. Fracture Mech. 82, 115-134. Zerbst, U., Vormwald, M., Pippan, R., Gänser, H.-P., Sarrazin-Baudoux, C. and Madia, M., 2016. About the fatigue crack propagation threshold of metals as a design criterion – a review. Engng. Fracture Mech. 153, 190-243. Zhang, Y.-H. and Maddox, S.J., 2009. Fatigue life prediction for toe ground welded joints. Int. J. Fatigue 31, 1124–1136.
Copyright © 2022 FDOKUMEN