the effect of density - on the repeated-load strength
71
THE EFFECT OF DENSITY ON THE REPEATED-LOAD STRENGTH PROPERTIES OF BITUMINOUS CONCRETE
-
Upload
khangminh22 -
Category
Documents
-
view
0 -
download
0
Transcript of the effect of density - on the repeated-load strength

THE EFFECT OF DENSITYON THE REPEATED-LOAD STRENGTH
PROPERTIES OF BITUMINOUS CONCRETE


Final Iteporc
THE EFFECT OF DmSlTi ON Iffii filiPMTED-LOAD STRENGUi
FaOPEHTIES OF BITUMINOUS CONCREIi-;
l^t li„ Bo Wocdw^, Dirsctoj-Joint Highway- Reaeardi Prjjact
FHOMs H, L, Michaelj> Asslstani; :)ir0OtorJoajit Hi^xvay Research Project
Ncvsaber 19, I959
File
:
a-4-UProject: O-36-6N
T^^ Qf ^^^f^S'^^io repcyt onfei'i^lod, "Tho Effect of Density en the R^Deated-
«v,<-M,^ 22?^®
^J"''"??'^^ P^ii^arily ccncomed with the plastic deforaations^^d^tM^.^h U.O ^p^ated-load tabbing of bitu^So^oa oono.^S^?acing
The report is presented for the rscordo
HIi4:pg
Attachinent
c<jx F, L, Ashbaaiches*J« Ee CooperW, L, Dolchiv'o H, G-ceta
F. F. HavgyG. A. Hawkins (M, B, Scott)Q« A, LeoiTftX'tiB
J« P. tfcl&ughliuR. D. MilosRo E, mils"C* E» ¥qg0lg(33ango. L, WalingJ. E« WilsonSo J« Toder
Respectfully subnitted,
H, L, MichaelJ Secretary

Final Report
THE EFFECT OF EENSir/ ON THE REPBATBD-IOAD STRENGTH
PH)EERTIES OF DITUIOJOUS CO^}CHSTS
by
Jo Ho Dennis, '?radiiate Assistant
Joint. Higjitfay Ras^arch ProjectProject not G~36-6II
Fil3 lilot 2-/^-14
Pui'due Univci-aityIafayett(}p IndLanE
No-vem'oe? 19$^ 1959

Digitized by the Internet Archive
in 2011 with funding from
LYRASIS members and Sloan Foundation; Indiana Department of Transportation
http://www.archive.org/details/effectofdensityoOOdenn

ii
ACKNOWLEDGMENTS
The author is grateful to the Joint Highway Research
Project of Purdue University, Professor K. B. Woods, Director,
whose help in supplying laboratory facilities, extra labor,
and materials made this investigation possible. He also
wishes to express his sincere appreciation to Professor W. H,
Goetz, his major professor and advisor, whose continued guid-
ance and encouragement was of considerable aid in the comple-
tion of the work.

iii
TABLE OF CONTENTS
Pa£e
LIST OF TABLES i^
LIST OF ILLUSTRATIONS v
ABSTRACT ^^
INTRODUCTIONj^
REVIEW OF LITERATURE3
Repeated Loading of Bituminous Materials. ... 3Repeated Loading of Soils '. '. 6
I-IATERIALS -
Aggregates oAsphalt !.'.*.'*'*
12
APPARATUS AND PROCEDURES 1^
Preparation of Slab-Type Specimens I4Preparation of Cylindrical-Type Specimens .'.'.'.'. 17Density Determinations in
Repeated -Load Test .*!*.*.!!!*21Hveem Stabilometer Test *.!!.*.*!.*!! 25
RESULTS28
Repeated-Load Tests 29Cylindrical-Type Specimens ....*!!!.*!!] 32Slab-Type Specimens !!.*!! 39Comparison of Cylindrical and Slab-Type 'specimens 40Hveem Stabilometer Tests 41Comparison of Results from Hveem Stabilometer and
Repeated-Load Tests A3
CONCLUSIONS^^
SUGGESTIONS FOR FURTHER RESEARCH 47
BIBLIOGRAPHY^g
APPENDIX5Q

iv
LIST OF TABLES
Table No. Page
1 Specification Limits for Hot nsphaltic Con-crete Surface Type B and Mixture CompositionUsed for Laboratory Specimens 8
2 Specification Limits for Corps of EngineersSurface Mix (Maximum Aggregate Size - 1/2")and Mixture Composition Used for LaboratorySpecimens 9
3 Gradation of Mineral Filler 11
if Results of Tests on Asphalt Cement 13
5 Typical Data Sheet for Repeated-Load Test -
Cylindrical Specimens 33
6 Results of Repeated-Load Test on CylindricalSpecimens - Indiana Gradation 50
7 Results of Repeated-Load Test on CylindricalSpecimens - Corps of Engineers Gradation . . 52
8 Results of Hveera Stabilometer Test - IndianaGradation 53
9 Results of Hveem Stabilometer Test - Corpsof Engineers Gradation 54
10 Density Determinations of Cylindrical Repeated-Load Test Specimens 55
11 Results of Repeated-Load Test - IndianaGradation - Slab Specimens 12 x 12 x 2-1/2inches 5o

LIST OF ILLUSTRATIONS
Figure No. Page
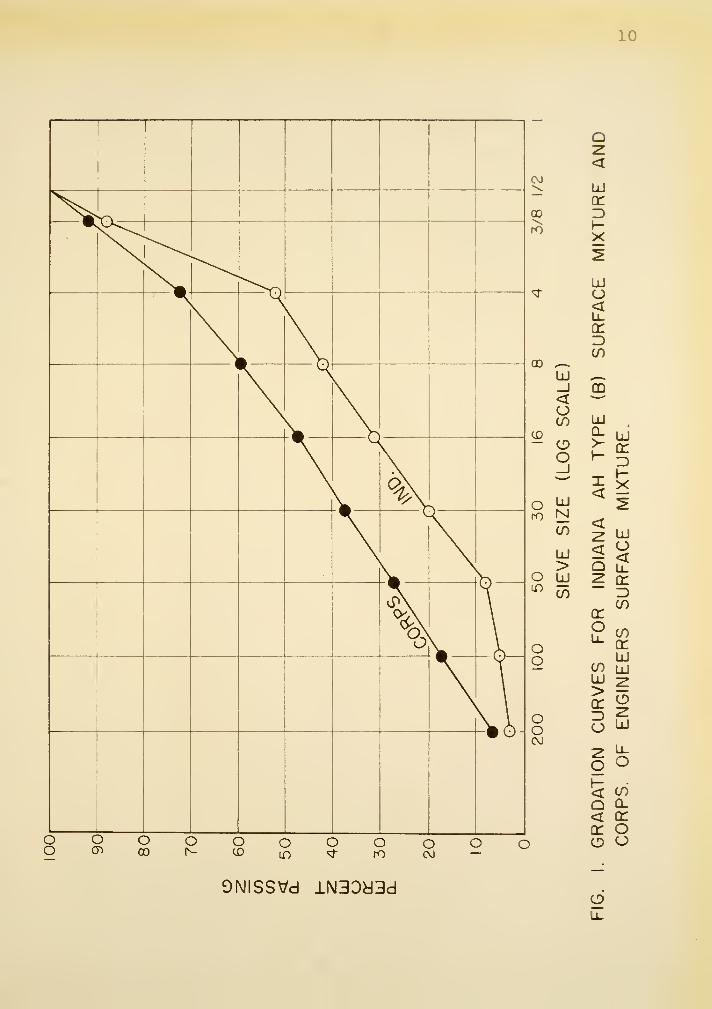
1 Gradation Curves for Indiana AH Type (3) SurfaceMixture and Corps of Engineers Surface Mix-ture 10
2 Pneumatic Vibrator and Mold for Slab Specimens 15
3 Electric Air Hammer and Mold for SlabSpecimens 16
4 Pneumatic Vibrator and Mold for CylindricalSpecimens IS
5 Cores and Cored Slab Specimen 20
b Repeated-Load Test Apparatus. ........ 23
7 Hveem Stabilometer 27
3 Typical Data of Repeated-Load Test (Log-LogPlot) Cylindrical Specimen 30
9 Typical Data of Repeated-Load Test - ArithmeticPlot - Cylindrical Specimen 31
10 Repeated-Load Test Results - Indiana Gradation- Permanent Deformation per Load Repetition -
Cylindrical Specimens 34
11 Repeated-Load Test Results - Corps of EngineersGradation - Permanent Deformation per LoadRepetition - Cylindrical Specimens 35
12 Repeated-Load Test Results - Indiana Gradation- Deformation Index - Cylindrical Specimens. 36
13 Repeated-Load Test Results - Corps of EngineersGradation - Deforuation Index - CylindricalSpecimens 37
14 Hveem Stabilometer Results - Indiana Grada-tion 42

vi
ABSTHACT
Dennis, John Harold. M.S.C.E., Purdue University,
January I960, The Effect of Density on the Hepeated -Load
Strength Properties of Bituminous Concrete . Major Professor:
William H. Goetz.
This study is concerned primarily with the plastic de-
formations obtained through the repeated-load testing of
bituminous concrete surfacing mixtures. Paraneters were cal-
culated from these plastic deformations and were compared with
results from the Hveem Stabiloneter test. In the initial part
of this investigation an attempt was made to obtain a slab-
type specimen which would produce realistic results by the
repeated-load test. Since means were not found to compact a
slab-type specimen to a uniformly high density, a cylindrical-
type specimen was used as an alternative for the repeated-
load test.
In comparing the results of the repeated-load test with
the Hveem Stabilometer test results, it appears that the mix-
tures are evaluated differently by the two methods. The re-
sults from this investigation are not suitable for evaluating
bituminous concrete surface mixtures in regard to rutting
and shoving.

THE EFFECT OF DENSITY ON THE REPEATED-LOAD STRENGTH
PROPERTIES OF BITUMINOUS CONCRETE
INTRODUCTION
The object of this study was to obtain parameters from
the repeated-load test which will define the strength proper-
ties of a bituminous concrete surface mixture. It was spe-
cifically desired to use the repeated-load test in measuring
plastic deformations of bituminous concrete surface mixtures
which might provide information useful in solving the rutting
and shoving problem. Rutting, which is the longitudinal
grooving of the pavement in the wheel tracks, and shoving,
which is permanent distortion which results in transverse
waves, are caused wlien repeated heavy loads result in plastic
deformations which accumulate to form objectionable depres-
sions. The most critical condition for rutting and shoving
is slowly-moving, heavily-loaded vehicles. Since these types
of failure are caused by repeated loads, it was speculated
that the repeated-load test could simulate traffic conditions
and possibly show why they occur.
It was desired to determine parameters using the permanent
(plastic) deformation recorded from the repeated-load test,
and then comparing them with a conventional stability value
(Hveem Stability),
Only surface-type mixtures were used in the study, and

since the specimens rested on a rigid base while being tested,
the results are applicable to the condition of a bituminous
concrete overlay over a portland cement concrete pavement.
As a preliminary part of the study it was desired to
obtain a slab-type specimen of suitable size so that a labora-
tory test which more closely approximates the road prototype
might be had. Due to the fact that means were not found to
compact a slab specimen to a high and laterally uniform den-
sity, this phase of the planned study was minimized and a
cylindrical specimen was used instead.

REVIEW OF LITERATURE
The problem of rutting and shoving in the wheel-track
areas of bituminous concrete overlays on deteriorated portland-
cement concrete pavements was of a minor extent in Indiana
until about 1951. Since then, with the increasing number
and weight of trucks on the highways, these types of failure
have become a major problem. There is at present no standard
design method of bituminous concrete using a repeated-load
type of test. Also there is no design method which can pre-
dict whether or not a pavement will fail by densification
under traffic to the degree that rutting and shoving will
result.
Repeated Loading; of Bituminous Materials
Two studies have been conducted by the Joint Highway
Research Project of Purdue University on the rutting problem.
The first of these was of a fundamental character using sheet-
asphalt and bituminous-concrete specimens of rational size
and tested by rational procedures (11) , The second study,
conducted to relate these data to field conditions, was per-
formed on bituminous-concrete specimens of irrational size,
molded in the laboratory, cored from laboratory-molded slab
specimens, and cored from pavements (o), Goetz, McLaughlin,
1. Numbers in parentheses refer to references listed in thebibliography.

and Wood (3) have concluded that rutting failures are caused
by plastic flow of the mixture.
These authors stated in their report on "Load Deforma-
tion Characteristics of Bituminous Mixtures Under Various
Conditions of Loading" that they approached the laboratory
solution of the rutting problem "first from the fundamental
considerations of the stress-deformation characteristics of
asphaltic mixtures as measured by various methods of test,
and secondly from the application of these test methods to
the evaluation of bituminous concrete." The problem was not
solved, but certain relationships were found among the factors
governing the load-carrying characteristics of bituminous
mixtures that should aid in the solution of the problem. One
of these fundamental relationships which relates the compres-
sive strength of a bituminous mixture to the rate of loading
and temperature is of the form, x^ = A^^l^'^^S "* ^\ where Xq
maximum unconfined compressive stress, psi; x-. = rate of de-
formation, in,/"iiJ^«; ^2 '' temperature, °F; and A,B,C,D are
constants. This relationship has been established for two
basic types of bituminous mixtures and for a variety of test
conditions. The authors concluded from the results of the
repeated-load tests on bituminous mixtures that this type, of
test might provide valuable information concerning the rutting
problem. It might also show the plastic nature of the bitumi-
nous mixture and possibly give a measure of the endurance
limit which they defined as the applied stress that can be
cycled without excessive shear deformations occurring or the

stress level at which no further increase in permanent de-
formation occurs after a small number of load applications.
Finally, in their work on confinement in a thin layer the
results showed that to obtain the same compressive strength
in a conventional triaxial test as that obtained from testing
the mixture in a relatively thin layer, a confining pressure
equal to or greater than the unconfined compressive strength
of the mixture would be necessary.
In 1952, Hveem and Vallerga (5) reported on a study
they had made on density versus stability. Their conclusion
that there is a high degree of correlation between stabilo-
meter results and pavement performance and little correlation
between stabilometer results and the density of the mixture
(except that the stabilometer results are invariably low
when the void spaces are filled or nearly filled with asphalt)
is of interest because if repeated loading tends to fill the
void spaces of a bituminous mixture then it might also lower
the stability. In 195t) it was reported by Monismith and
Vallerga (8), in a study of the relationship between density
and stability of asphaltic paving mixtures, that there is a
relationship between density and stability and that it is
dependent upon the criterion used to determine stability. For
the method they used in determining stability (a stress cor-
responding to a particular strain) an increase in density re-
sulted in an increase or decrease in stability depending upon
the composition of the mix and the range of densities considered,
From these results it can be concluded that there is a

relationship among voids filled with asphalt, density, and
stability. And since rutting is usually accompanied by a
change in density and amount of voids filled with asphalt,
there should be a relationship between rutting and stability.
Repeated Loading of Soils
There has been a great deal of work done on the repeated-
load testing of soils. However, it did not seem pertinent
to report the results of all the literature on this subject.
In a report on the repeated-load testing of soils by
Tschebotarioff and McAlpin (10) there is shown a plot of number
of repetitions of load (log scale) versus plunger penetration
for granular soils (sands), which is closely resembled by the
plots of McLaughlin, Goetz, and Wood showing number of load
repetitions (log scale) versus permanent deformation for bi-
tuminous mixtures. This comparison shows that somewhat simi-
lar relationships are obtained from the repeated-load testing
of soils and bituminous concrete mixtures.

M/iTERIALS
Bituminous concrete mixtures of two gradations were used
in this investigation. One gradation was chosen to meet the
specifications of the State Highway Department of Indiana for
Hot Asphaltic Concrete Surface-Type B (Medium Texture) (9),
and the other to meet the Corps of Engineers specifications
(2) for Surface Mix (Maximum Aggregate Size - 1/2"). The
composition limits for the Indiana Type B and the Corps of
Engineers Surface Mixes are shown respectively in Tables 1
and 2, together with the compositions of the mixtures selected
for this study. Figure 1 shows the grain size distribution
curves for the aggregate gradings selected.
Aggregates
The coarse aggregate (material retained on the No. S
sieve) used in this investigation was a crushed limestone
obtained from the Ohio and Indiana Stone Company, Greencastle,
Indiana, and the fine aggregate (material passing the No. 8
sieve), with the exception of the material passing the No.
200 sieve, was a local sand obtained from the Western Indiana
Sand and Gravel Company, Lafayette, Indiana. A commercial
mineral filler was used to supply the material passing the
No. 200 sieve and it was obtained from the Ohio and Indiana
Stone Company, Greencastle, Indiana. The gradation of the
mineral filler is given in Table 3.

$
Table 1
Specification Limits for Hot Asphaltic Concrete Surface -
Type B and Mixture Composition Used for Laboratory Specimens
PassingSieve
Retainedon Sieve
Composition LimitsPercent
CompositionSelected
Minimum I'laximum Percent
1/2 inch 3/8 inch 2 14 12
3/8 inch No. 4 20 50 36
No. 4 No. 6 11 5
No. 6 No. 8 11 5
No. 8 No. 16 5 20 11
No. lb No. 50 10 25 23
No. 50 No. 100 2 17 3
No. 100 No. 200 1 5 2
No. 200 -- 3 5 3
Total Ret.ained on No. 6 45 55 53
Bitumen 5.5 7.5 4.5-7.5

Table 2
Specification Limits for Corps of Engineers Surface Mix(Maximum Aggregate Size - l/2") and Mixture Composition
Used for Laboratory Specimens
Passing Composition Limits Passing Retained CompositionSieve Percent Sieve on Sieve Selected
Maximum Minimum Percent
100
a4
60
46
35
25
19
11
4
a 6-8
1/2 inch 100
3/8 inch 100
No. 4 85
No. 8 73
No. 16 00
No. 30 48
No. 50 30
No. 100 24
No. 200 9
Bitumen 5
1/2 inch 3/8 inch 8
3/8 inch No. 4 5
No. 4 No. 8 13
No. 8 No. lo 12
No. 16 No. 30 11
No. 30 No. 50 9
No. 50 No. 100 10
No. 100 No. 200 11
No. 200 . 5
10
oo
Xv^
^X ^>n^
\H
k
\<
\^ \\ \\ \
VV
\\\w vJ
oen
O00
CO
CD
rO
OD ,—
CD
LlI
>O LlI
Oo
ooCO
QZ<UJ
3
liJo£
cn
_l CD< ^OCO
OO
UJ
5: UJ
< s
S5 <<
oLi_
UJO<U_cr3(/)
O O O O OrO
OCO
O
COq:UJ
Z ^o o
Q CL< q:cr oCD o
ONISSVd lN30d3dS2

11
Table 3
Gradation of Mineral Filler
Passing Retained PercentSieve on Sieve
No. 30 No. 50 0.5
No. 50 No. 100 4.0
No. 100 No. 200 10.3
No. 200 - S5.2
12
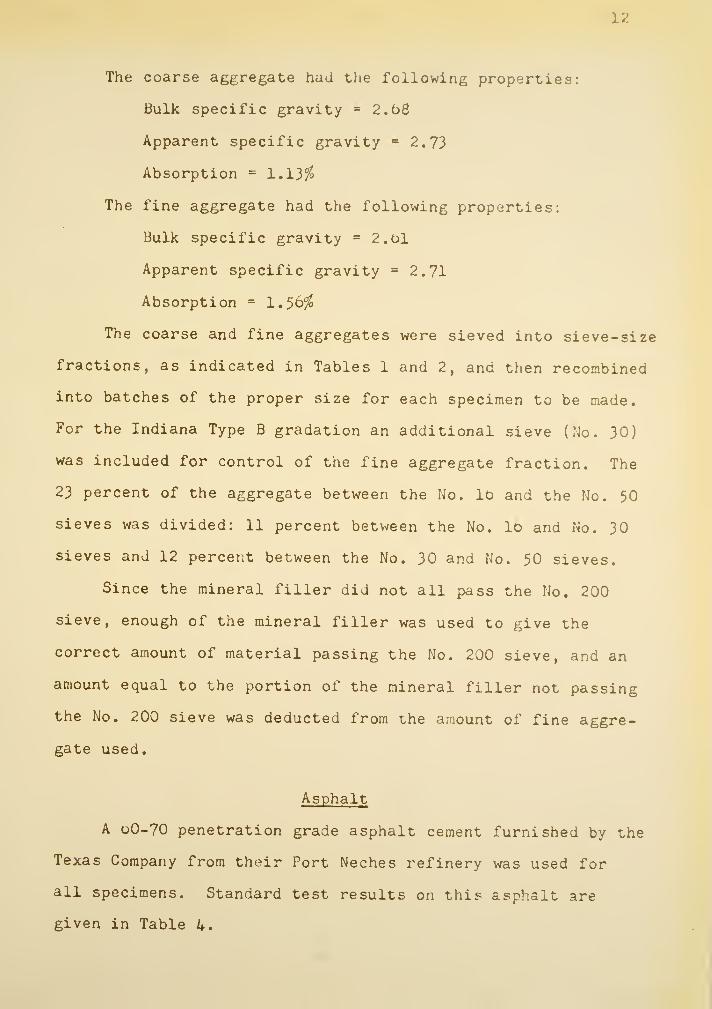
The coarse aggregate had the following properties:
Bulk specific gravity = 2.68
Apparent specific gravity = 2.73
Absorption = l,l'i%
The fine aggregate had the following properties:
Bulk specific gravity = 2.fc>l
Apparent specific gravity = 2.71
Absorption = 1.56^
The coarse and fine aggregates were sieved into sieve-size
fractions, as indicated in Tables 1 and 2, and then recombined
into batches of the proper size for each specimen to be made.
For the Indiana Type B gradation an additional sieve (TJo. 30)
was included for control of the fine aggregate fraction. The
23 percent of the aggregate between the No. lb and the No. 50
sieves was divided: 11 percent between the No. lo and No. 30
sieves and 12 percent between the No. 30 and No. 50 sieves.
Since the mineral filler did not all pass the No, 200
sieve, enough of the mineral filler was used to give the
correct amount of material passing the No. 200 sieve, and an
amount equal to the portion of the mineral filler not passing
the No. 200 sieve was deducted from the amount of fine aggre-
gate used.
Asphalt
A 60-70 penetration grade asphalt cement furnished by the
Texas Company from their Port Neches refinery was used for
all specimens. Standard test results on this asphalt are
given in Table 4.

Table 4
Results of Tests on Asphalt Cement
13
Test Result
Specific Gravity at 77°F
Softening Point, Ring and Ball, °?
Ductility at 77°F, 5 cra,/m±n., cm.
Penetration, 100 grams, 5 sec, 77 F
Penetration, 200 grams, 60 sec, 32°F
Penetration, 50 grams, 5 sec , 115 F
Flash Point, Cleveland Open Cup, F
Solubility in CCl,,percent
Oliensis Spot Test
1.031
122
200+
66
17
300+
620
99.92
Neg.

14
APPARATUS AND PROCEDURES
The five main divisions of this section are concerned
with preparation, testing, and performing density determina-
tions on the specimens. Both types of specimens, the slab
and cylindrical, are discussed under these headings.
Preparation of Slab -Type Specimens
In the preparation of the slab-type specimens, the batched
aggregate was heated to a temperature of 300110''F and the
asphalt was heated to a temperature of Zl^^^Y, The desired
amount of asphalt was weighed into the aggregate and they were
then placed in a Hobart mixer and mixed for three minutes.
The mixtures were then compacted into 12-inch square slabs by
one of the following two methods. ?or one method, a pneumatic
vibrator, Cleveland Type F.A.C., having a 1-1/4 inch piston,
operated at a line pressure of 60 pounds per square inch, with
a vibrational frequency of 3170 cycles per minute and an air
consumption of 8,4 cubic feet per minute was used to compact
the mixture. A steel foot-or-base-plate 3-inches by 0-inches
by l/4-inch in thickness was attached to the vibrator to serve
as a compacting foot. For the other method an electric air
hammer was fitted viith a steel tamping foot 4-inches square by
3/4 -inch thick. Figures 2 and 3 show the compaction equipment
and typical specimens.
The specimens were compacted to a given Height of 2-1/2

15
fr^
miM^•3BilnliP ^^W
Fig. 2 PNEUMATIC VIBRATOR AND MOLDFOR SLAB SPECIMENS

16
Fig, 3 ELECTRIC AIR HAMMER AND MOLD
FOR SLAB SPECIMENS

17
inches. This height was chosen so that cores could be taken
from the slabs and tested in the Hveem Stabiloraeter. For the
initial part of the investigation of the slab-type specimens
it was desired to obtain a density of 142 pounds per cubic
foot, as this value would be the approximate average density
of a newly-constructed bituminous concrete overlay (7).
After testing some specimens at a density of 142 pounds per
cubic foot it was found that the specimens did not densify
enough under a reasonably small enough number of load repe-
titions so it was desired to compact the specimens to a higher
density. The electric air hararaer was used to try to compact
the specimens to a higher density, but it was not possible to
obtain a specimen with a uniformly high lateral density.
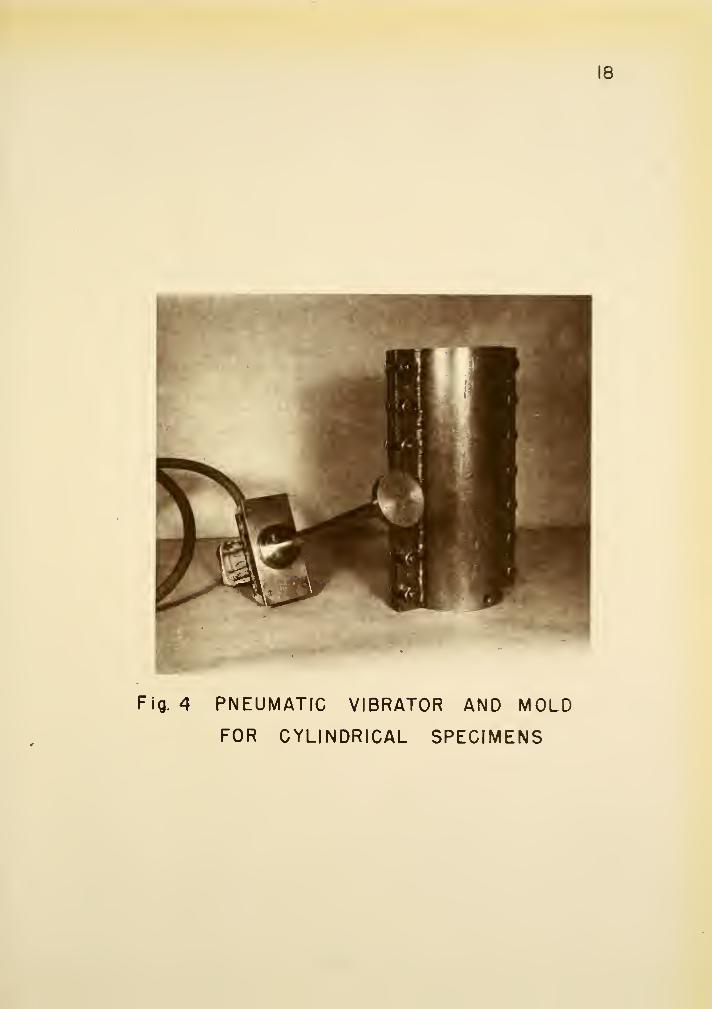
Preparation of Cylindrical - Type Specimens
For the cylindrical-type specimen the aggregate and asphalt
were heated to the same temperatures as for the slab-type
specimens. The aggregate and asphalt were then mixed for two
minutes in the Hobart mixer. The mixed material was then placed
in a preheated, 4-inch diameter split steel mold in three
approximately equal layers. Each layer was rodded 25 times
with a steel rod 17-inches long, 5/8-inch in diameter and
weighing about 1.4 pounds. The material was then vibrated for
one minute with the pneumatic vibrator used in compacting the
slab-type specimens. The base plate used on the pneumatic
vibrator for this operation was 2-l/2-inches in diameter and
l/2-inch thick. Figure 4 shows the mold and compaction equipment,
18
Fig. 4 PNEUMATIC VIBRATOR AND MOLD
FOR CYLINDRICAL SPECIMENS

19
The material was then compressed in a compression testing
machine to the height required for the desired density. The
specimens were then removed from the mold and allowed to cool
to room temperature.
The desired densities for the cylindrical specimens ranged
from 138 to 152 pounds per cubic foot. Since it was founi that
the repeated-load test did not densify the specimens, but that
it made them less dense, the above density range was chosen
so that the effects of the repeated-load test could be deter-
mined over the entire range of densities encountered from
as-constructed bituminous-concrete overlays to fully traffic-
compacted. The amounts of materials for these specimens were
varied so that the heights of the specimens would be approxi-
mately 2-1/2 inches and therefore the specimens could be
tested by the repeated-load type test and also by the Hveem
Stabilometer.
Density Determinations
Density detenninations were made on the cylindrical-
and slab-type specimens before testing and density determina-
tions were also made on some of the cylindrical- and slab-type
specimens after testing. For the slab-type specimens the
initial density was determined from dimension and weight
measurements and after testing, cores were taken from the
center and corners of the slab and density determinations were
performed on these cores. Figure 5 shows the cores and cored
slab. For the cylindrical-type specimens the water displacement

20
^^^^^r
Fig. 5 CORES AND CORED SLAB SPECIMEN

21
method was used both before and after testing.
After the cylindrical specimen had cooled to room tem-
perature it was weighed in air. It was then submerged in
water for one-half hour which allowed the specimen to become
partially saturated. It had previously been determined that
submerging this size specimen in water for one-half hour al-
lowed it to reach a condition of equilibrium, so that the
accurate weight of the specimen submerged in the water could
be determined. The specimen was weighed submerged in the
water. The specimen was then taken from the water, surface
dried and weighed in the saturated-surface-dry condition.
The density was then calculated by dividing the weight in air
by the weight saturated-surface-dry minus the weight in water.
The specimens were then allowed to drain and dry before test-
ing. The aggregate density of the specimens was also calcu-
lated by dividing the weight of aggregate by the volume of the
specimen.
Repeated-Load Test
The procedure for testing the slab-type specimens was
almost the same as for the testing of the cylindrical speci-
mens, and any differences are given at the appropriate steps
in the following outline of the procedure.
The specimens were placed in a constant-temperature w iter
bath at 100_^1*^F before testing. The slab-type specimens ».ere
allowed to remain in the water bath 30 minutes and the cylin-
drical specimens 15 minutes so that they would be at the test

22
temperature before starting the test. The machine used for
the repeated loading was an air motor mounted in a loading
frame as shown in Figure 6(4). The numbers on Figure 6 are ex-
plained in the key on the page facing the figure. This
figure shows the apparatus with the calibration equipment
attached. For clarity, the apparatus is shown without the
water bath which was used to control the temperature of the
specimen. V/ith this apparatus it was possible to apply, hold,
and release a load on the specimen to be tested. Appropriate
valves and controls were present to admit compressed air to
the air motor for a pre-set time interval. The load was trans-
mitted from the air motor by a shaft to a plate which rested
on the specimen to be tested. At the end of the pre-set time
interval, during which the load remained constant, the load
was quickly released by stopping the compressed air from
entering the air motor and by opening an exhaust valve. After
another time interval, which could also be pre-set, the cycle
was repeated.
The above describes the basic operation of the repeated
load machine. The follov/ing is a detailed description of the
equipment used with the machine (O):
"Compressed air at 100 to 110 psi^outlet pressure wassupplied by a Gardner-Denver model 329 LT air compres-sor, pov/ered by a 7-1/2 hp. electric motor. From thecompressor tank a one-inch diameter galvanized pipeled through an air line filter to remove moisture andany foreign partici.es from the air, and thence into aGrove GB 307-06 Powreactor Dome pressure regulator.This regulator, of the diaphragm type was found toregulate the outlet pressure quite accurately whilestill permitting the sudden and intermittent flow ofair required to produce the repetitive type of loading.

23a
Fig, 0. Repeated-Load Test Apparatus,
Ke
1. Air line from air compressor '
2. Main-line switch
3. Agastat
4. Grove GB 307-Ob Powreactor Dome pressure regulator
5. Pressure gauge
C». Air line lubricator
7. Bellows 8002 FR Power Dome air cylinder
8. Extension rod for loading head
9. Lower platen of testing machine
10. Testing-head
11. Specimen
12. Assembly for supporting core of L.V.D.T.
13. Assembly for holding coil of L.V.D.T.
14. Voltmeter|
15. Brush Model BL-320 Universal Analyzer
16. Brush Model BL-292 Oscillograph

23
24
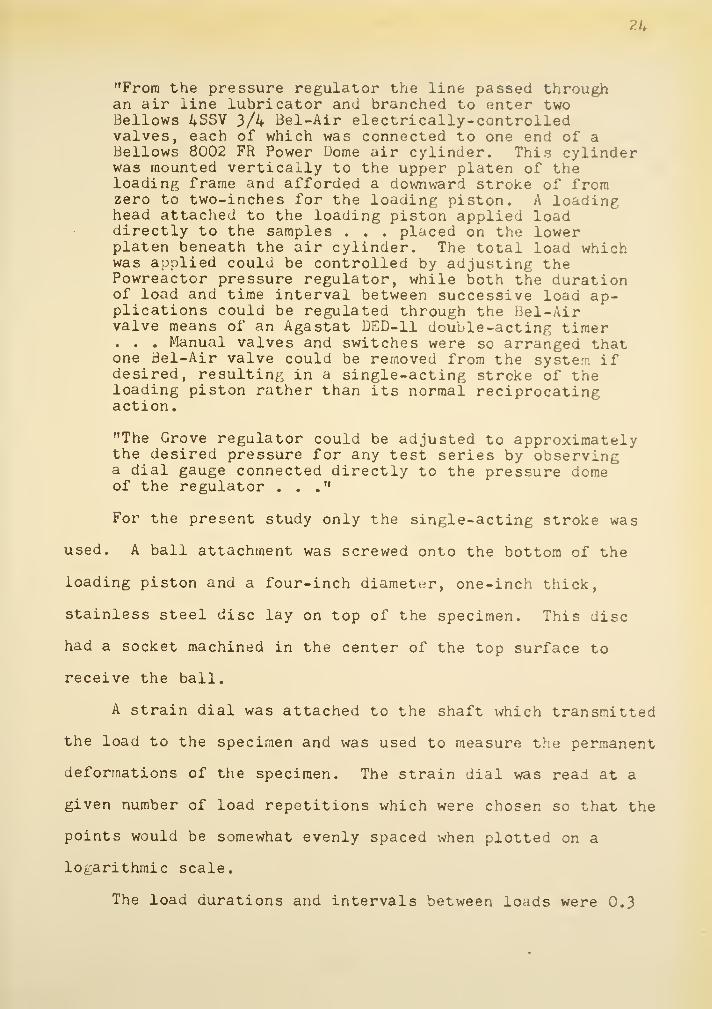
"From the pressure regulator the line passed throughan air line lubricator and branched to enter twoBellows 4SSV 3/4 Bel-Air electrically-controlledvalves, each of which was connected to one end of aBellows 8002 FR Power Dome air cylinder. This cylinderwas mounted vertically to the upper platen of theloading frame and afforded a downward stroke of fromzero to two-inches for the loading piston. A loadinghead attached to the loading piston applied loaddirectly to the samples . . . placed on the lowerplaten beneath the air cylinder. The total load whichwas applied could be controlled by adjusting thePowreactor pressure regulator, while both the durationof load and time interval between successive load ap-plications could be regulated through the Bel-Airvalve means of an Agastat DED-11 double-acting timer. . . Manual valves and switches were so arranged thatone Bel-Air valve could be reraoved from the system ifdesired, resulting in a single-acting stroke of theloading piston rather than its normal reciprocatingaction.
"The Grove regulator could be adjusted to approximatelythe desired pressure for any test series by observinga dial gauge connected directly to the pressure aomeof the regulator ..."
For the present study only the single-acting stroke was
used. A ball attachment was screwed onto the bottom of the
loading piston and a four-inch diameter, one-inch thick,
stainless steel disc lay on top of the specimen. This disc
had a socket machined in the center of the top surface to
receive the ball.
A strain dial was attached to the shaft which transmitted
the load to the specimen and was used to measure the permanent
defonaations of the specimen. The strain dial was read at a
given number of load repetitions which were chosen so that the
points would be somewhat evenly spaced when plotted on a
logarithmic scale.
The load durations and intervals between loads were 0.3

25
and 4.0 seconds, respectively, and these values were held
constant for all repeated-load tests. These times values were
established by measuring the movement of the loading piston
"through the use of a Schaevitz Model .04-0-. 04 Linear
Variable Differential Transformer (L.V.D.T.), the voltage
output from which was passed through a Brush model 3L-320
Universal Analyzer and recorded directly as a deflection-time
curve on a Brush Model BL-292 oscillograph. The core of the
transformer was mounted on the loading piston while the coil
was mounted on an arm fixed to the loading frame" (o).
The contact pressure used for all of the cylindrical
specimens was 100 psi. Three contact pressures (100, 150,
and 200 psi) were used in the testing of the slab-type speci-
mens. The higher contact pressures were used because this
type specimen would not fail at the relatively small number
of load repetitions being used.
The tests on the cylindrical-type specimens were discon-
tinued at about 80 load repetitions, but the tests on the slab-
type specimens were continued until visible signs of failure
(cracking) occurred.
Hveem Stabilometer Test
The cylindrical specimens were tested by the Hveem Method
as follows (1)
:
1. Place specimens in an oven at 140°F. for a minimum
period of one hour before testing.
2. Adjust the compression machine to obtain a head speed

26
of 0.05 in. per minute.
3. Adjust the displacement of the Stabilomater to give
2.00+0.05 turns.
4. Adjust stage on Stabiloraeter so that 2.40 inches of
rubber diaphram will be effective upon the specimen.
5. Place the specimen in the Stabiloraeter.
6. Raise pressure in Stabiloraeter to 5 psi.
7. Apply test loads at previously set head speed and
record readings of test gauge at test loads of 500 lbs.,
1,000 lbs. and each 1,000 lbs. thereafter up to a maximum of
6,000 lbs.
S, Reduce total load on the specimen to 1,000 lbs.
9. Adjust displacement until 5 psi. is recorded on test
gauge
.
10. Turn displacement handle at two turns per second
until 100 psi. is recorded on test gauge.
11. Record the exact number of turns required to increase
test gauge pressure from 5 psi. to 100 psi. as displacement
on specimen.
The Hveem Stabiloraeter is sho\>fn in Figure 7.

27
Fig. 7 HVEEM STABILOMETER

28
RESULTS
The results of the repeated-load and Hveen Stabilometer
tests are presented in Tables 6, 7, 3 and 9 (Appendix) along
with appropriate composition and density data. The results
are discussed in this section and a comparison between test
results by the repeated-load and Hveem Stabilometer procedures
is made.
The variables in this investigation were aggregate gra-
dation, asphalt content and density or degree of compaction.
Two gradations were used, the Corps of Engineers dense grada-
tion for surface mixtures and the Indiana State Highway De-
partment AH Type B surface mixture gradation.
Asphalt contents of 5, C> and 7 percent by weight of
mixture were selected for the Indiana gradation, and an asphalt
content of 7 percent by weight of mixture was selected for the
Corps of Engineers gradation. The asphalt contents used with
the Indiana gradation cover the range of those used in prac-
tice. The asphalt content used with the Corps of Engineers
gradation was selected to produce a plastic type of mixture
and was higher than that usually used in design. Due to a
weighing error there was a variation in the percent asphalt
content of the specimens as molded. The magnitude of this
variation warranted the determination of the percent asphalt
content by extraction for all of the specimens. The results

29
of the extraction tests are given in Tables 6 through 9 of
the Appendix,
It was desired to chose the density levels for this study
so that they would compare to all conditions of a pavement,
from as-constructed to fully traffic-compacted. The minimum
bulk density of approximately 138 pounds per cubic foot was
chosen for both gradations to compare to the compaction con-
dition of a newly-constructed pavement. Other specimens were
compacted to range from this density to the maximum density
obtainable, which approached the maximum theoretical density.
An attempt was made to obtain an even distribution of the
density values between the above limits, but this was not
achieved for mixtures of the Corps of Engineers gradation.
Density results are presented in Tables 6 through 9 of the
Appendix.
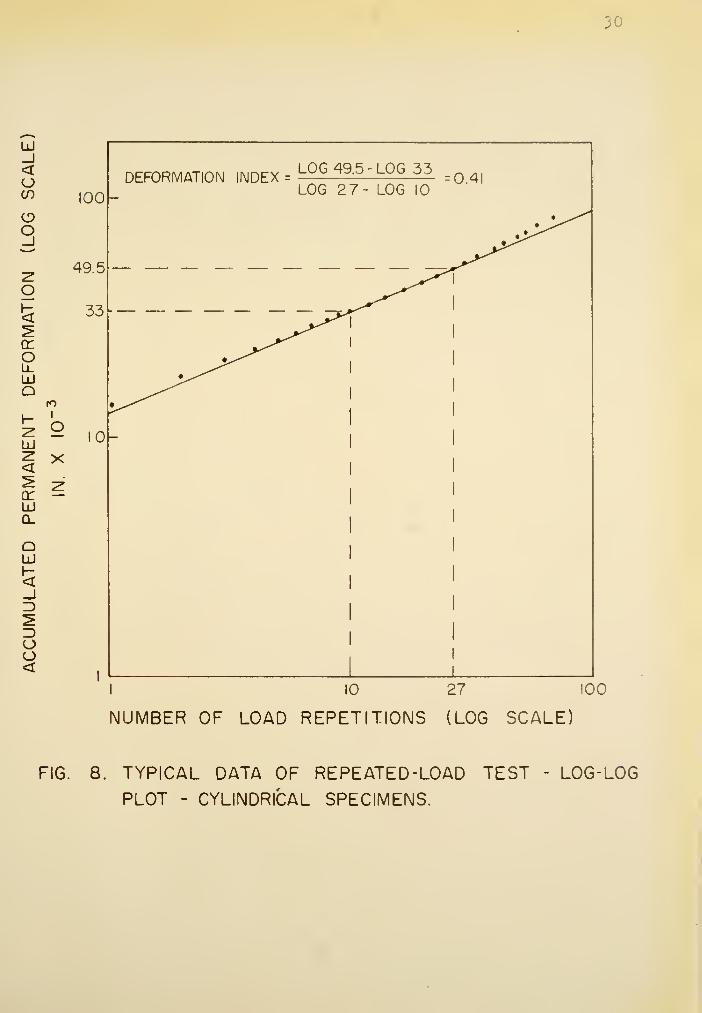
Repeated-Load Tests
There were two parameters obtained from the data of the
repeated-load tests. One of these was the" deformation index,
defined as the. slope of the straight line of the log-log plot
of accumulated permanent deformation versus number of load
repetitions (See Figure 8). The other value obtained from the
repeated-load test was the permanent deformation per load
repetition (See Figure 9). An arithmetic plot of the accumu-
lated permanent deformation per load repetition was drawn and
from the plot it was observed that there was a portion of the
curve between 20 and 50 load repetitions that approached a
30
Hi_i<(/)
CDO
O
croLlUJQ
UJ
<cc:
Ixl
Q.
QLU
Oo<
100
49.5
roI
O
X
I 10 27 100
NUMBER OF LOAD REPETITIONS (LOG SCALE)
FIG. 8. TYPICAL DATA OF REPEATED-LOAD TEST
PLOT - CYLINDRICAL SPECIMENS.
LOG-LOG

31
crou.LJQ
toI
UJ o< X
QUJ
ID
CJO<
COUJIo
90
80
70
60
50
40
30
20
10
PERMANENT DEFORMATIONPER LOAD REPETITION = 50" go
=78 3" X IQ-^
10 20 30 40 50 60 70
NUMBER OF LOAD REPETITIONS
FIG. 9. TYPICAL DATA OF REPEATED-LOAD TEST -
ARITHMETIC PLOT - CYLINDRICAL SPECIMEN

32
straifTht line. The values in this portion were used arbi-
trarily to calculate a value of permanent deformation per
load repetition. Table 5 is a typical data sheet from the
repeated-load test.
Other parameters for the repeated-load test were investi-
gated for the purposes of this study. However, these two were
chosen as being as indicative as any that could be derived
from the data obtained.
Cylindrical-Type Specimens
Values for the two parameters obtained from tests on the
cylindrical specimens for the two gradations are shown in
Tables 6 and 7 of the Appendix. Curves were drawn from these
values by selecting specimens of approximately constant aggre-
gate density and plotting curves of percent asphalt content
by weight of aggregate versus deformation index and curves
of asphalt content versus permanent deformation per load re-
petition. These curves are shown in Figures 10 through 13.
The positions of the curves shown in the figures were estab-
lished by fitting a curve to calculated average deformation
index and permanent deformation per load repetition values for
mixtures of approximately equal asphalt contents.
For the Indiana gradation the two parameters, Figures 10
and 12, give approximately the same shape curves for the three
density levels. For the two lower density levels there is a
decrease and then an increase in the parameter values as the
asphalt content is increased. It was postulated that for the

33
Table 5
Typical Data Sheet for Kepeated-Load TestCylindrical-Type Specimen
Temperature: 100°F Date: July 7, 1958
Pressure: 100 psi Specimen: B-27
Number of AccumulatedLoad Repetitions Permanent
Deformationin. X 10-^
1 142 183 214 235 256 277 29a 309 3210 3312 3514 37.517 40.520 43.523 4627 49.530 5234 5540 6044 6350 6754 7060 7470 81
Permanent Deformationper Load Repetitionin. X 10-3
14432
2
2
2
12
12
2.52.532.53.52.53
5
343
47

34
150
E 125
LxJ
UJ
<O 100
_ ^
UJ vr
g ^
iioli-
lij
Q
2<crUJQ-
" AGGREGATE '
DENSITYLBS/FT^
O 131.5 to 135.2
135.9 to 138.5
A 139.0 to 141.0O
5.0 5.5 6.0 6.5 7.0 7.5 8.0 8.5 9.0
PERCENT ASPHALT CONTENT BY WEIGHTOF AGGREGATE
FIG. 10. REPEATED -LOAD TEST RESULTS -INDIANAGRADATION - CYLINDRICAL-TYPE SPECIMENS -
PERMANENT DEFORMATION PER LOAD REPETITION

35
LJQ.liJ
fi:
<o
UJ I
a. o
i Po ?UJQ
UJ
UiCL
PERCENT ASPHALT CONTENT BY WEIGHTOF AGGREGATE
FIG. II. REPEATED-LOAD TEST RESULTS - CORPS. OFENGINEERS GRADATION - CYLINDRICAL-TYPESPECIMENS - PERMANENT DEFORMATION PERLOAD REPETITION.

36
8.0 8.5
PERCENT ASPHALT CONTENT BY WEIGHT
OF AGGREGATE
FIG. 12. REPEATED-LOAD TEST RESULTS - INDIANAGRADATION - CYLINDRICAL-TYPE SPECIMENSDEFORMATION INDEX.

37
0.48
0.44
X Q40LlI
o?z 0.36oH<Srro 0.32U-LUo
0.28
0.24
20
r-
1
L-
O"^
/
//
/^
1
1
^
/ '-J
PI/
LJ
/ AGGREGATEDENSITYLBS/FT^
G 130.5 to 134 1
134.6 to 139.0
6.0 6.5 7.0 7.5 8.0 8.5 9.0
PERCENT ASPHALT CONTENT BY WEIGHTOF AGGREGATE
FIG. 13. REPEATED-LOAD TEST RESULTS - CORPS. OFENGINEERS - CYLINDRICAL- TYPE SPECIMENSDEFORMATION INDEX.

33
initial part of these two curves the parameter values decreased
because the added amount of asphalt acted as a cementing agent.
This relationship is true only up to a certain asphalt content
and then the added amount of asphalt acts as a lubricant in
the mixture, perhaps because void continuity is lost as the
mixture approaches saturation. When the minimum condition is
reached, greater parameter values are obtained. For the high-
est density levex, the curves show that there is very little
change in parameter value with change in asphalt content.
The lack of change in parameter value with increase of asphalt
content in the initial part of this curve was probably iue to
a thinner asphalt film, caused by the hi^^her aggregate den-
sity, acting to allow less deformation. There is a lacK of
data for mixtures with asphalt contents greater than 7.5 per-
cent. It was supposed that if specimens could have been com-
pacted for this portion, larger parameter values would have
been obtained. Then tliis portion of the curves would have the
same shape as the corresponding portions of the curves for the
other two density levels.
For the Corps of Engineers gradation, results were obtained
only for the two lower density levels. Curves of the same ap-
proximate shape were obtained for the two parameters. For
these curves the portion at the lower asphalt contents is not
well defined since there is a lacK of data in this range. An
increase of the parameter values with an increase in asphalt
content is sho\ifn because the range of asphaxt contents studied
for the Corps of Engineers gradation was in the upper part of

39
the range of those used with the Indiana gradation, and for
this high range of asphalt contents, the lubricating effect
takes place.
Density determinations were performed on some specimens
after testing by means of the repeated-load test (Table 10
of Appendix), and it was found that the specimens of all mix-
tures were less dense after testing than before testing. This
difference in density caused by the repeated-load test varied
from one to four pounds per cubic foot regardless of grada-
tion, density and asphalt content. Since the temperature at
which the tests were made was 100+1 F. , and there was no con-
fining pressure, the specimens expanded laterally. This den-
sity study shows that for this type of specimen there was no
densification caused by the repeated-load that was applied.
Slab-Type Specimens
Only five of the slab-type specimens were tested under
the same test conditions (100 psi. pressure and lOO^F. tempera-
ture) as the cylindrical specimens. They were of the Indiana
gradation with approximately 7 percent asphalt content by
weight of mixture. The size of each slab was 12 by 12 by
2-1/2 inches. The results from the repeated-load test on the
slab-type specimens are given in Table 11 of the Appendix.
From the density determinations on cores taken from the slabs
it was estimated that the bulk density of the material directly
beneath the loading head was 143 pounds per cubic foot. The
7 percent asphalt content by weight of mixture corresponds to

40
7.52 percent asphalt content by weight of aggregate. The
bulk density of 143 pounds per cubic foot corresponds to an
aggregate density of 133.4 pounds per cubic foot.
By cutting the slab-type specimens into sections 2-inchee
square by 2-1/2 inches deep, and performing density deter-
minations on these sections, it was found that the specimens
were not of a uniform density when using either method to com-
pact the specimens. There was a difference in density of
about 6 pounds per cubic foot between the center and the out-
side sections of the specimen. Since the slab specimens were
not of a uniform density it was impossible to determine the
change in density, due to testing, of the loaded portion of
the specimen.
The average deformation index for these specimens was
0,30. The straight-line portion of the arithmetic plots of
accumulated permanent deformation versus number of load re-
petitions (Figure 9) was not reached for the slab-type speci-
mens at 20 repetitions of load (probably due to the support
of the surrounding material) and the portion between 40 and
oO repetitions of load was selected for calculation of a para-
meter value since this portion did approach a straight line.
An average value of 49 x 10~ inches per load repetition was
obtained for the permanent deformation per load repetition
parameter.
Comparison of Cylindrical and Slab-Type Specimens
The influence of specimen size on the results of the

Ul
repeated-load tests is shown by comparing the strength para-
meters of the two types of specimens. The average deforma-
tion index for the Indiana gradation slab-type specimen at
7.52 percent asphalt content by weight of aggregate and an
aggregate density of 133.4 pounds per cubic foot was O.3O.
For the cylindrical-type specimen of the same gradation, per-
cent asphalt content, and aggregate density, the deformation
index was 0.42. This means that there was less permanent de-
formation for the slab-type specimen than for the cylindrical
specimen at a comparable number of load repetitions. This re-
sult is logical since the material surrounding the portion
being tested gave support to the tested portion. This is also
shown by the values for the parameter permanent deformation
per load repetition, since average values of 49 x 10"^ inches
per load repetition for the slab-type specimens and 100 x 10"
inches per load repetition for the cylindrical-type specimens
were obtained.
Hveem Stabilometer Tests
The results of the Hveem Stabilometer tests are given in
Tables 8 and 9 of the Appendix. Figure 14 shows curves of
Hveen Stability versus percent asphalt content by weight of
aggregate for the Indiana gradation at approximately the same
values of aggregate density as used for the curves of the
repeated-load tests. From Figure 14 it can be seen that at
any of the three density levels, the Stabilometer value de-
creases with an increase in asphalt content. Also, at any

U2
6.0 6.5 70 75 8.0 85
PERCENT ASPHALT BY WEIGHT OF AGGREGATE
FIG. 14. HVEEM STABILOMETER RESULTS - INDIANA
GRADATION.

43
given asphalt content vathin the range of those studied there
is an increase in stability with an increase in aggregate
density.
Only five Hveern Stabilometer values for the Corps of
Engineers gradation vdth approximately 7 percent asphalt con-
tent were obtained because the mixture was so unstable that
most of the tests could not be completed. Since there were
only five Hveera Stabilometer values obtained and the range
of asphalt content was small, the effect of asphalt content
in this case was not determined. Also, Hveem Stabilometer
values for mixtures of the two gradations cannot be compared
because adequate Hveem Stabilometer values were not obtained
from the mixture of the Corps of Engineers gradation at the
asphalt contents used.
Comparison of Results from Hveem Stabilometer
and Repeated-Load Tests
The Hveem Stabilometer value is determined by the follow-
ing expression (1):
22.2S =
^^^2)^,0.222(Pv - Ph)
where S = relative stability
Dg = displacement on specimen
Py = vertical pressure at 400 psi. (5,000 lbs.total load)
p. = horizontal pressure corresponding to Py = 400psi.

KU
It can be demonstrated that as the type of material is
varied from rigid to fluid, the Stabilometer value is respec-
tively varied from 100 to zero. This concept can be observed
from the curves of Figure 14 which show that the Stabilometer
value increases as the density increases. The repeated-load
test results show a similar relationshij) in that as the speci-
mens varied from less dense to more dense, the parameter
values varied from high to low. Figures 10, 11, 12 and 13
demonstrate this relationship. The parameters obtained from
the repeated-load test results appear to provide some measure
of the plastic properties of the bituminous mixture, \fith a
larger value corresponding to a more plastic mixture.
A comparison cannot be made between the curves of the re-
peated-load test parameter values and the Hveem Stabilometer
values for the Corps of Engineers gradation because adequate
Hveem Stabilometer results were not obtained for this grada-
tion. In comparing the parameter values from the repeated-
load test for the Indiana gradation with the Hveem Stabilometer
values of the Indiana gradation it can be seen that, for com-
parable ranges of asphalt content at the two lower density
levels, the repeated-load parameter values decrease and then
increase while the Hveem Stabilometer values decrease steadily.
When making the same comparison at the high density level it
can be seen that the parameter values of the repeated-load
test remain approximately constant with an increase in asphalt
content, while the Hveem Stabilometer values decrease with an
increase in asphalt content.

45
From these comparisons of results it appears that the
mixtures are evaluated differently by the two test methods.
This result was anticipated since the parameter values of
the repeated-load test are calculated from permanent deforma-
tion values obtained by applying a repeated-load of constant
magnitude to the specimen, while the Hveem Stabilometer values
are calculated from stress values obtained by applying an
increasing load at a constant rate of deformation.
ut
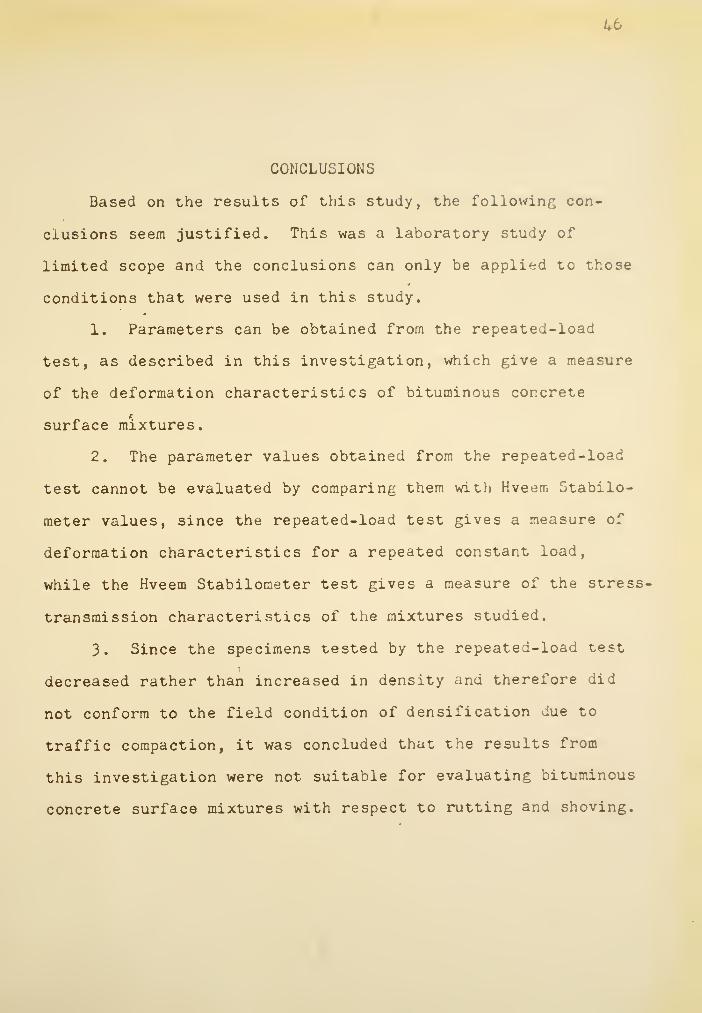
CONCLUSIONS
Based on the results of this study, the following con-
clusions seem justified. This was a laboratory study of
limited scope and the conclusions can only be applied to those
conditions that were used in this study.
1, Parameters can be obtained from the repeated-load
test, as described in this investigation, which give a measure
of the deformation characteristics of bituminous concrete
surface mixtures.
2, The parameter values obtained from the repeated-load
test cannot be evaluated by comparing them with Hveem Stabilo-
meter values, since the repeated-load test gives a measure of
deformation characteristics for a repeated constant load,
while the Hveem Stabilometer test gives a measure of the stress-
transmission characteristics of the mixtures studied.
3, Since the specimens tested by the repeated-load test
decreased rather than increased in density and therefore did
not conform to the field condition of densification due to
traffic compaction, it was concluded that the results from
this investigation were not suitable for evaluating bituminous
concrete surface mixtures with respect to rutting and shoving.

47
SUGGESTIONS FOR FURTHER RESEARCH
It is suggested that a strength value be obtained from
repeated-load test data. In order to obtain a strength value
it is necessary to obtain a failure criterion. This might be
accomplished by a correlation study which would include ob-
taining slabs or cores from pavements at various stages of
rutting and shoving and testing them by use of the repeated-
load and Hveem Stabiloraeter tests. It is also suggested that
more load repetitions be used in the repeated-load test, so
that the permanent deformations at failure might be obtained
and studied.
Another project that might provide useful information is
the repeated-load testing of slab-type specimens compacted
with the kneading compactor. A slab-type specimen is desirable
because it more closely approximates the road prototype. If
a suitable slab-type specimen can be obtained, it is believed
that densification will occur to the loaded portion of the
specimen using a repeated-load type of test. The use of a
confining pressure with the repeated-load test might also
make it possible to obtain the desired densification. This
effect should provide information useful in solving the rutting
and shoving problem.

BIBLIOGRAPHY

us
BIBLIOGRAPHY
1. The Asphalt Institute, Mix Design Methods for Hot-MixAsphalt Paving . Manual Series No. 2, April, 1^5^.
2. Corps of Engineers, Department of the Army, AirfieldPavement Design . Engineering Manual, Part XII, Chapter2, Appendix C, July 1951.
3. Goetz, W. H., McLaughlin, J. F., and Wood, L. E. "Load-Deformation Characteristics of Bituminous Mixtures UnderVarious Conditions of Loading," Proceedings . The Associa-tion of Asphalt Paving Technologists, Vol. 2o, 1957.
4. Havers, J. A., "A Study of the Interactions of SelectedCombinations of Subgrade and dase Course Subjected toRepetitive Loading Tests," A Thesis submitted to PurdueUniversity for the Degree of Doctor of Philosophy. June1950.
5. Hveera, F. N., and Vallerga, B. A., "Density Versus Sta-bility," Proceedings . The Association of Asphalt PavingTechnologists, Vol. 2x, 1952.
6. McLaughlin, J. F. , "The Load-Carrying Characteristics ofa Bituminous Concrete Resurfacing Mixture," A ThesisSubmitted to Purdue University in partial fulfillment ofthe requirements for the degree of Doctor of Philosophy,Jan., 1957.
7. McLaughlin, J. F., and Goetz, W. H., "Results of DensityMeasurements on Bituminous Concrete Experimental SectionSR-37," Purdue University, 1955.
S. Monisraith, C. L., and Vallerga, B. A., "Relationship3etween Density and Stability of Asphaltic Paving Mix-tures," Proceedings . The Association of Asphalt PavingTechnologists, Vol. 25, 195t).
9. State Highway Commission of Indiana, Standard Specifica -
tions for Road and Bridge Constructi on and Maintenance.1957.
10. Tschebotarioff , G. P., ana McAlpin, G. W. , "Vibratory andSlow Repetitional Loading of Soils," Proceeviings . High-way Research Board, Vol. 2o, pp. 551-5o2, 194o.

49
11. Wood, L, E. , "The Stress-Deformation Character-istics ofAsphaltic Mixtures Under Various Conditions of Loading,'A Thesis submitted to Purdue University for the degreeof Doctor of Philosophy, August, 1956.

APPENDIX

50
Co•HpCO
co U XH O 0)
+3 Cm nCO a> cTJ QmCTJ
Uo co £>^
a •P -HTJ O 1
c C 4^ CO •HO03 0) cO O P -H•H C S^ •H-t3 cO S-i P XC S o ti (U
M t. ch a> (X •
0) 0) a. (p c1 Dl. Q a; -H
mCQ) «HS o•HO +J -p -p a> 4J<u /H c: j:: -p ca cO <D M CO 0)
CO x: -p -H W) oa.c 0) (D ^H
rH CO o^ fi 0)
cfl <co bOCL,o Ss W)-H j3<«;
xO tn
•dQJ C Q)
H -H p >«'\X) -H CO P -P(T5 >^ bO-HtMH O
t. C «n
c WD a) ^O bOQ r-t
+>mQ)
Eh>«^
73 •p PCO
O I—i tO'^v.
^ d c w
T3 QrHOPCO
a>a Cm0) ooc! >.c
4-> -p *-> 0) x> o«H rH C J3 U -Ho to 0) ho d -p -p
j:: -P-H P C OCO a, c oj X 0) (0
4J (0 o3: •H O t<
rH << o S ^ P3 >» CD Xw -Q CU W<U
«
SpecimenNumber
-J' ^ -4- ~t -4- -^ ^ -*rHto o cNi r- Onto to o <>j a "^-*to o
oooooooo ooooooooooooo oo
f^r^ooor^oo r- o r^c^ -t f^ r- o c^ r^ t^ o r^ r- 1^
toto itnO uAtoOO.HC^CNf OstOtOtOtOrH rH
C^iu^Oc^iOt^^--*rHrHOr^OOo^ON
C^ rH O^ UNsO tOC~~-f\iC^i/>OJ rHtO -HtOr^Or^OrO O C^-*f\J rr\0^ <-* ^ ^^
C^ O to u> O C^-0>r\ t0Ott)tfNU-\ir\OO t^ O O ^ ^ "^ -^
li^fviOOrHo^C^CNi O O^O rH OJ r^tO O r^ i/N -O f^ f^ -* ^'^
rHOJr^^^-d-~t>^
rHrHrHrHrHrHrHrHr^r^rAc^r^'^r^r^r^c^t^'^'^f^'^rHrHrHrHrHrHrHrHrHrH^-HrHrHrH
rH-d-"^r^tVO(NO Or^CvJrHO<VtOtOOCMC^OOCV(>
CNiOr^rHCNJir\r^r>^ C^ufMr\~^-to^LfM^C^-OC^'^^^^-*^^ ^^ -J- -* -4- -d--*-4--*-t^-J'~t-d-^-*-^:J;:J:5r-t r-i r-\ r-i <-{ r-i r-i r-i r-i r-{ r-i r-{ rA r-{ r--\ r-\ r-< ^ r-i '^ r-i r-i ^
-4 0i-i -i OC^-X) oOr^-J--trHr^OO
-J-r--4-<>i-d-f^-tfVitO>Ot^'50C\JrH|£N
vOk^c^>^-or^wMr\ c^ o r^ uA k^ -*vO ^^ '^^ "O '^ '^ ^
CNJC^f^t^rH^OrHt~kOi t-At-t c^rH CM (N
I I I I I • I I
rHrHCVCNiCNJrH-trHrHrHrHr^rH^U-VI I I I I I I I I I I • ' • ,'

51
T3a;
3C•H+->
cou
CO
co•HpCO
st- xO 0)Cm -aQ) Ca M
co Cir\
P -H T) O 1
f: -p (0 H O3) CO O P .HC S kJ •H05 S P XE O t, 0)
tn Cm 0) ;x •
0) (1) a, C^ cOh n cr. -H
p p ^J 4J +J
CO 0) bi2 hO 0)j::: P -H OJ o<XC O i-, Uw o !3 bS (u<< o tocu
X)
p >.CO -Pr^hC-H p0) W Cm
W) 0) w
P PJ4 H Cm
3 C m
<Mo
P P 0)
p -M p0) X
00000000
OOOOOr^OO• ••••••••J^OO OOtO MrM
OO^OOrHrHOO• •••••••
O. cr O O O O rH Mr-^ r-\ r-i r-t r-\ r-i r-{ rH
r\l -to 00 rH OC^•30 OC5NtOXO OsXO Onr^ -^ -4- -*^ -J- -4- -4-
J=> o
CO
x:
w o<t:o s
X)
c
e a>•tH X)o a
CO
cuto
O -4- CM ^O ^> r'N OMCVOO O 0(V rH ~*r-4
(M On C^ Or-ttOUAr-(^Or-(C^CNJ
I I I I I I I I

52
co c•H•P •Hrt •p13 03
rt s ^(4
0) •0 CVi vO -t to (V to C^ -* t>< r- to<M TJ -* -* -* -J- -J- -4- r^ r*", r^ r-^ 'M '^
10
U0) CM
• • •
d d a d d d d d<u
0)
c c•H o-o cbO P -H 03 Oir\
c C P OHO r-- r'N C^ r^ r^, r- c^ r^ r^ r^
w © OJ (-3 P rH • • • • • • • • • • •
C S -H \0 to sO to to -O r^ to to
tM rt ^ t, p X (O UTN r^ ir, CM rH r^ -4 -^
S 0) (D
t, «M a, a, •
r-l tH r-< rH rH r-i r-t rH r-i
(0 CU 0) Q) Ga CL. C3 ai-H(h
Cm1 (U
p p •
CO rH 4J p 03 Pc ,03 C SZ W) C0) Si Q) ti) i3> <V rH -4- -4- to r^ to CM (^ to -*
s O, P -H in UTN to C^ -3- •H rH LTN u^ CJ- -*
w s: 0) ui Ih
< 3: M <D
•
to•
to•
to•
to•
to•
to• •
to•
C--
•
a> =1: CL.
a- ni?. >,CO J3
0) .t3 <P
rH or p ><*^03 P P LTv rH CNJ to rH OJ r^ -0
03 UE-" T3
UO-rH Cm0) w^-^
• •
r-H
• • •
-J-
•
-J-
•
OA r^ r^ cr
•Hti C w r^ r^ r^ 0^ r^ r^ r^ ,-^ >-^\ r^ •^ r^
hO 0) X> rH rH rH rH r-< r-i f-i rH -H rH —
<
rH
rH bOQ rH>» <C
C
J4 Pr^ CM to C^ X3 r-i to c^ -0 -0 to
0) rH H P3 <n ^
• • • • • • •
t^ r^ -0
CQ C^~\ -4- -J- -d- J- -4- -J- -4- -4- J- ^ -J- ~*
X) Q) J3 rH rH r-{ r-i rH r-i -H rH r-t r-\ r-i rH
03 Ci .H
1
xs «M07
P p >» CCO ^ +i p OJ XI
a0)
03 c x: $-. -Hx: 0) M :3 p PCXP -H P c to -4-
toto to to •X)
2i W C 0) X 0) OJ
<< ^ M CJ tj
• • •
to•
to• • •
c^ r- C^ dc« s: ti p
^^ >> a) X
(0
P crH CU t.
d e <u
0)
cr:
•H X)s rH ^ Csl r^
1
to1Q
rH1
rH1as:
CO1 1 1
Q1
Q1 1Q Q Q Q

Table 8
Results of Hveem Stabilometer TestIndiana Gradation
>3
Specimen /o Asphalt Bulk Aggregate '/i> Asphalt HveemNumber Content Density
lbs/ft3Density Content Stability
by Weight los/ft3 by Weif:ht ofof Aggregate
Mixture PercentPercent byExtraction
B-32 7.00 143.0 133.4 7.52 22.0A-I 0.01 1/+1.2 134.3 0.40 29.8A-22 5.73 142.0 134.
D
0.03 32.5C-lo 7.13 144.8 134.7 7.78 20.8B-5 0.59 144.1 135.0 7.06 31.4B-2/^. 7.07 145.2 135.2 7.O0 28.0A-20 5.99 143.9 135.3 0.38 33.2
C-0 7.00 147.4 130.3 8.22 20.7C-7 7.47 147.7 130.7 8.08 19.9B-14 0.02 140.3 130.8 7.09 30.9C-9 7.51 148.0 137.0 8.13 31.8B-2 0.20 146.0 137.2 O.o2 33.0B-9 0.32 140.9 137.6 0.75 38.3B-17 0.47 147.4 137.9 0.92 43.4C-21 0.35 148.0 137.9 7.3o 37.2C-1 7.06 148.8 138.2 7.00 30.0
C-2 0.95 149.0 138.8 7.48 41.4A-9 5.75 147.5 139.1 o.ll 42.7B-7 5.98 148.5 139.6 0.37 45.5B-2b 0.87 149.8 139.9 7.37 31.0A-4 0.15 149.1 140.1 0.55 44.8B-11 5.73 148.8 140.2 0.07 39.9A-18 5.78 147.8 141.0 0.14 47.7

54
Table 9
Results of Hveem Stabilometer TestCorps of Engineers Gradation
Specimen $ Asphalt Bulic aggregate ""Jo Asphalt HveemNumber Content Density Density Content Stability
By Weight Lbs/ft^ lbs/ft^ By Weightof of
Mixture Aggregateby Percent
Extraction
D-30 7.32 140.2 130.1 7.90 14.0
D-32 7.0O 143.5 132.8 8.30 10.4
D-12 7.34 146.2 134.9 3.50 10.5
D-14 a. 10 147.2 135.5 8.31 12.5
D-16 7.49 147.3 130.5 8.09 11.3

55
Table 10
Density Determinations of Cylindrical Repeatea-LoadTest Specimens
Specimen Aggregate iiulk Density Bulk Uensity DifferenceNumber Density liefore Testing After Testing in iiulk
lbs/ft^ ibs/ft3 lbs/ft-' Densitylbs/ft3
Indiana Gradation
A-1 13B.4 140.2 143.0 3.2
A-10 147.0 145.3 1.7
A-11 130.7 144. B 141.1 3.7
A-12 130.5 143.2 140.2 3.2
A-13 134.0 141.7 13B.0 3.7
A-15 150.7 14'^. 1.1
A-17 140.1 l/f9.1 li.8.0 1.1
A-19 137.5 140.2 144.2 2.0
A -20 134.3 ui.o 139.3 1.7
A-23 130.1 144.1 142.
o
1.5
Corps of Engineers Gradation
D-1 137.0 147.8 140.4 1.4
D-20 139.0 14B.8 148.0 0.8
D-21 138.0 148.1 147.8 C.3

30
m0)
x: co oc •H•H P
03
(NJ 6^^ t. Xr-l o <u
1 Cm X)CM (1) cO MX
(\i C-H O X) C^
P -H CTJ O I
X C P O -H o<D c3 J P rH
OJ C E -H,-1 tT3 l^ t-. P X
S O 0) 0)
CO S-, vh dl, a •
c a) Q) !D c0) CL. a c^ -^
e•HO ./"^i^
<U U-i <U
ex. O P00 P P CO
rH t: p (U P Sx> c3 0) x: t-i c; -HCO x: p ho ;3 0) X.H Cu C -H P O OCO W O QJ X Sh ^
<i: o ;=5 -H (1) o.1 sex, a
>. <fH C X3 —
'
rH O•H
(U +3 0)
rH CTJ P >.X) X) CTJ Pf^CT3 cfl bO-M +J
E-" U <D W CmO ^ C^-.
bi} OJ Wca boa XIc < r-i
CO
•H-a —
»
G T)M >e^ 0)
P P P1 ^ -H Cm lO
rH tO~^^ S•P :3 C « -rH
(0 33 0) X) P<D Q rH «£-> [£1
-—
-
TDcti
O '-M
J O1 0)
T3 p +J p p p0) rH c x: to n•P cO 0) tiO W) 0)
C(S x: P H 0) o0) O. C QJ J" ^i
(X CO O !S tUj CD
0} < o boa.re: >><
X)CmO
G(0 <U Sh
•p a 0)
rH •r^ X)
3 <J s(0 0) :3
0) 0,3ce: CO 1
r- f- r- r-
O CM