the effect of carbon black loading on the tensile strength of
Upload
khangminh22Category
view
0download
0
THE EFFECT OF STRENGTH TRAINING ON PERFORMANCE IN ENDURANCE ATHLETES
Authors: Kris Beattie, Ian C. Kenny, Mark Lyons and Brian P. Carson.
Title: The Effect of Strength Training on Performance in Endurance Athletes
Address: Department of Physical Education and Sport Sciences, University of Limerick,
Limerick, Ireland
Contact Details: Email: [email protected]
Telephone: 00353 61 234781
Fax: 00353 61 202814
brought to you by COREView metadata, citation and similar papers at core.ac.uk
provided by University of Limerick Institutional Repository

THE EFFECT OF STRENGTH TRAINING ON PERFORMANCE IN ENDURANCE ATHLETES
ABSTRACT
BACKGROUND
Economy, velocity/power at maximal oxygen uptake (V OV 2 max / W OV 2 max) and endurance-specific muscle
power tests (i.e. maximal anaerobic running velocity vMART), are now thought to be the best performance
predictors in elite endurance athletes. In addition to cardiovascular function, these key performance indicators are
believed to be partly dictated by the neuromuscular system. One technique to improve neuromuscular efficiency in
athletes is through strength training.
OBJECTIVE
The aim of this systematic review was to search the body of scientific literature for original research
investigating the effect of strength training on performance indicators in well-trained endurance athletes -
specifically economy, V OV 2 max / W OV 2 max and muscle power (VMART).
METHODS
A search was performed using MEDLINE, PubMed, ScienceDirect, SPORTDiscus and Web of Science
search engines. There were twenty-six studies that met the inclusion criteria (athletes had to be trained endurance
athletes with ≥ 6 months endurance training, training ≥ 6 hours per week OR OV 2max ≥ 50 ml/min/kg, the strength
interventions had to be ≥ 5 weeks in duration, and control groups used). All studies were reviewed using the PEDro
scale.
RESULTS
The results showed that strength training improved time trial performance, economy, V OV 2 max / W OV 2 max and
vMART in competitive endurance athletes.
CONCLUSION
The present research available supports the addition of strength training in an endurance athlete’s
programme for improved economy, V OV 2 max / W OV 2 max, muscle power and performance. However, it is evident
that further research is needed. Future investigations should include valid strength assessments (i.e. squats, jump-
squats, drop jumps) through a range of velocities (maximal strength ↔ strength-speed ↔ speed-strength ↔ reactive-
strength), and administer appropriate strength programmes (exercise, load & velocity prescription) over a long-term
intervention period (> 6 months) for optimal transfer to performance.

THE EFFECT OF STRENGTH TRAINING ON PERFORMANCE IN ENDURANCE ATHLETES
1. INTRODUCTION
Endurance sport performance relies on a complex inter-play of physiological and biomechanical factors.
Cardiovascular capacity has often been thought to be the main limiting factor in endurance performance. Classical
measures such as maximal oxygen uptake ( OV 2 max) and lactate threshold (LT) have been traditionally used in the
laboratory to predict the performance potential of runners, cyclists, triathletes and cross-country skiers. [1]
Consequently, physical preparation for these sports has generally focused on developing these two physiological
qualities. However, elite endurance athletes with similar OV 2max levels can have differing abilities during a race and
therefore maximum oxygen uptake cannot fully explain true racing ability. Economy, and assessments that include
an endurance-specific muscle power component such as velocity/power during maximal oxygen uptake (V OV 2 max /
W OV 2 max) and maximal anaerobic running velocity (vMART), are now thought to be superior performance
indicators in an elite population. [2]
Economy is the amount of metabolic energy expended at a given velocity or power output. [3]
Economical
movement is multi-factorial and is determined by training history, anthropometrics, biomechanics and physiology. [4]
During a race, an economical athlete will use less energy at sub-maximal intensities and spare vital carbohydrate
stores for significant stages in competition (i.e. sprint finish). East Africans have dominated distance running for the
past few decades and it is believed that their success is partly due to their superior running economy. [3]
Improvements in economy may be difficult to obtain in highly-trained endurance athletes and therefore any novel
training modality that results in marginal improvements may be crucial for success.
Endurance-specific muscle power is the ability of the neuromuscular system to rapidly produce force following a
sustained period of high-intensity exercise (high glycolytic and/or oxidative energy demand) [5]
. This ability may be
the differentiating factor for elite endurance performance as successful athletes at world-level can produce high
velocities and power outputs to win a race following a sustained period of high-intensity exercise (i.e. sprint finish).
Therefore rate of force development (RFD) is essential not only in sprint and power sports, but also in elite
endurance competition. Endurance-specific muscle power assessments such as peak velocity during the maximal
anaerobic running test (vMART) have been found to be better predictors of running performance in an elite
population because they are both highly influenced by neuromuscular and anaerobic factors. [2]
The vMART consists
of a series of incremental 20 second runs with 100 second recoveries on a treadmill until volitional exhaustion.[6]
Peak velocity/power at OV 2 max (V OV 2 max), is influenced by OV 2 max, economy and lactate threshold. However is
also shown to have a large ‘muscle power’ component because it is strongly correlated to vMART (r = 0.85, p <
0.001). [2]
McLaughlin et al. [7]
found that in well-trained runners v OV 2 max was the best predictor of running
performance over 16 km. Also, Millet et al. [8]
found that peak power output during an incremental cycling test
(Wpeak) was correlated to overall performance in elite triathletes. Consequently, in addition to cardiovascular ability,
limitations to elite endurance performance may be dictated by other dynamical system factors, including
neuromuscular function.
THE EFFECT OF STRENGTH TRAINING ON PERFORMANCE IN ENDURANCE ATHLETES
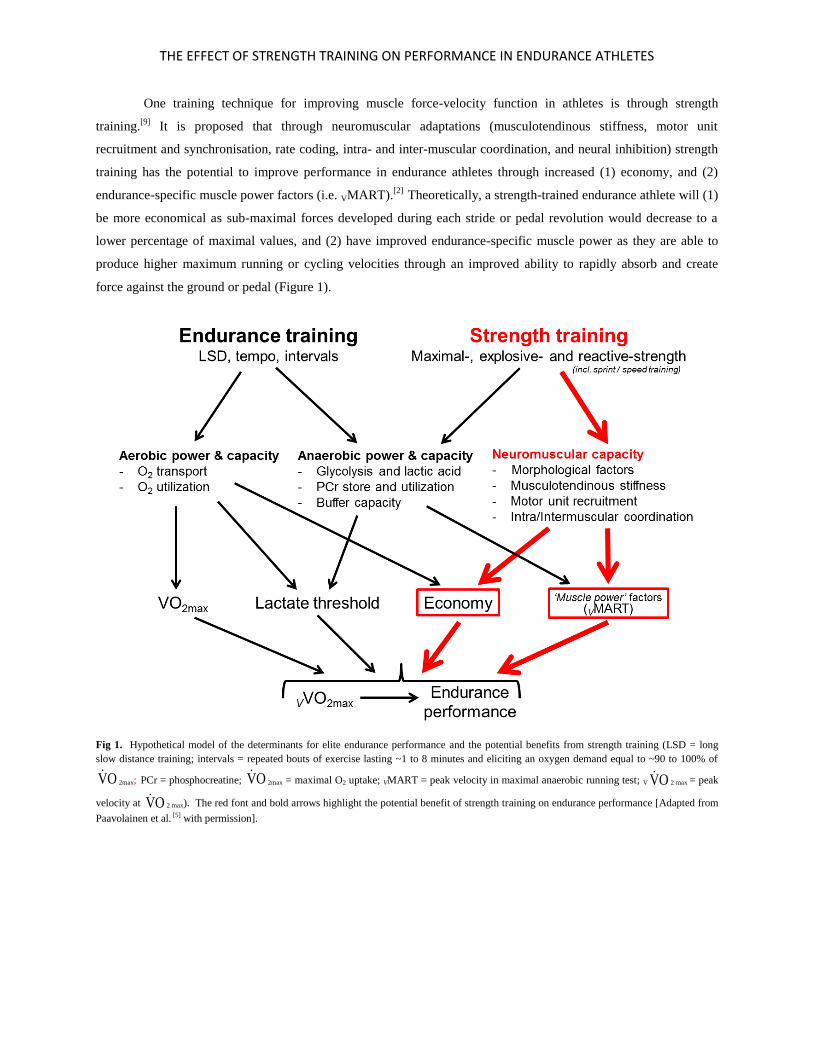
One training technique for improving muscle force-velocity function in athletes is through strength
training.[9]
It is proposed that through neuromuscular adaptations (musculotendinous stiffness, motor unit
recruitment and synchronisation, rate coding, intra- and inter-muscular coordination, and neural inhibition) strength
training has the potential to improve performance in endurance athletes through increased (1) economy, and (2)
endurance-specific muscle power factors (i.e. VMART).[2]
Theoretically, a strength-trained endurance athlete will (1)
be more economical as sub-maximal forces developed during each stride or pedal revolution would decrease to a
lower percentage of maximal values, and (2) have improved endurance-specific muscle power as they are able to
produce higher maximum running or cycling velocities through an improved ability to rapidly absorb and create
force against the ground or pedal (Figure 1).
Fig 1. Hypothetical model of the determinants for elite endurance performance and the potential benefits from strength training (LSD = long
slow distance training; intervals = repeated bouts of exercise lasting ~1 to 8 minutes and eliciting an oxygen demand equal to ~90 to 100% of
OV 2max; PCr = phosphocreatine; OV 2max = maximal O2 uptake; VMART = peak velocity in maximal anaerobic running test; V OV 2 max = peak
velocity at OV 2 max). The red font and bold arrows highlight the potential benefit of strength training on endurance performance [Adapted from
Paavolainen et al. [5] with permission].

THE EFFECT OF STRENGTH TRAINING ON PERFORMANCE IN ENDURANCE ATHLETES
Elite endurance athletes are renowned for their high volume of (low force) endurance training. Unfortunately,
unlike strength training, specific endurance training such as ‘interval’ or ‘tempo’ sessions are not effective in
improving neuromuscular function in well-trained endurance athletes (Figure 1). Traditionally, for unknown
reasons, endurance athletes have been cautious to strength train. In fact, research investigating the training
characteristics of runners competing in the 2008 U.S. Olympic Marathon trials found that they “included little
strength training in their training programs…and nearly half the runners did no strength training at all.” [10]
This
philosophy may be due to endurance athletes and coaches being uneducated in strength training science and the
associated potential performance improvements. The aim of this systematic review was to search the body of
scientific literature for original research investigating the effect of strength training on performance, specifically
economy and assessments that include an endurance-specific muscle power component (i.e. V OV 2 max / W OV 2 max,
and VMART), in well-trained endurance athletes.

THE EFFECT OF STRENGTH TRAINING ON PERFORMANCE IN ENDURANCE ATHLETES
2. METHODS
A search was performed using MEDLINE, PubMed, ScienceDirect, SPORTDiscus and Web of Science search
engines to identify studies that assessed the effect of strength training on performance in competitive endurance
athletes. The following keywords were used in the search (“strength training” OR “resistance training” OR “weight
training” OR “weightlifting” OR “concurrent training” OR “plyometrics”) AND (“endurance athletes” OR
“cyclists” OR “runners” OR “triathletes” OR “cross-country skiers”) AND (“performance”). Strength training was
defined as non-cycling/running/cross-country skiing, weight-loaded activity including bodyweight, free-weight and
machine-based exercises. The sub-categories for strength training included: (1) maximal-strength training that
targets maximal force development through high-load, low-velocity movements (i.e. squats, deadlifts), (2)
explosive-strength training (strength-speed & speed-strength) that improves rate of force development (RFD) and
maximal power output through medium- to high-load, high-velocity movements (i.e. squat jumps, Olympic lifts);
and (3) reactive-strength training that targets musculotendinous stiffness and stretch-shortening cycle function
through low-load, high-velocity exercises (i.e. jumps, drop-jumps, hops, bounds, sprints).
Inclusion criterion for this analysis were (1) athletes had to be trained endurance athletes (≥ 6 months endurance
training, training ≥ 6 hours per week, OV 2max ≥ 50 ml/min/kg), (2) the strength interventions had to be ≥ 5 weeks in
duration, and (3) control groups had to be used. All articles were read and the outcomes of each study summarised.
Articles were excluded if the study methodology did not meet the specific inclusion criteria. Other relevant articles
were obtained through additional bibliographical means (Figure 2).
Fig 2. PRISMA (Preferred Reporting Items for Systematic Reviews) flow chart illustrating the inclusion and exclusion criteria used in the
systematic review. PEDro indicates Physiotherapy Evidence Database.
THE EFFECT OF STRENGTH TRAINING ON PERFORMANCE IN ENDURANCE ATHLETES
The Physiotherapy Evidence Database (PEDro) scale was used to rate the quality of the selected articles.
The PEDro scale is an 11-item scale designed for rating the methodological quality of randomised controlled trials
(Maher et al 2003). Each satisfied item (except for the first item, which relates to external validity) contributes
1 point to the total PEDro score. [11]
The items include random allocation; concealment of allocation; comparability
of groups at baseline; blinding of subjects, researchers, and assessors; analysis by intention to treat; and adequacy of
follow up. The PEDro scale ranges from 0 to 10, where 0 points (the worst possible score) are awarded to a study
that fails to satisfy any of the included items and 10 points (the best possible score) are awarded to a study that
satisfies all the included items. Studies scoring 9 or 10 on the PEDro scale are considered to have methodologically
excellent internal validity, those scoring 6 to 8 are considered good, those scoring 4 or 5 are fair, and those scoring
less than 4 are poor. All studies graded using the PEDro scale were included.
THE EFFECT OF STRENGTH TRAINING ON PERFORMANCE IN ENDURANCE ATHLETES
3. RESULTS
Twenty six papers met the inclusion criteria. Of these papers, eight were from running, nine from cycling, six
from cross-country skiing and three from triathlon. Tables 1 – 3 compare the results. The tables are subdivided into
the four sports (running, cycling, cross-country skiing and triathlon) and are structured to compare (i) subjects
(sample size, sex, standard of racing, OV 2 max, weekly training volume) and research design (PEDro score, group
allocation, control of training) [Table 1], (ii) strength intervention (type of strength training, programme overview,
frequency and duration of training [Table 2] and (iii) results [Table 3].
3.1 PEDro score analysis
Scores on the PEDro scale for the twenty six selected articles ranged from 5 to 6 of a maximum 10 points. Only
fourteen studies randomly allocated their subjects into training groups and scored 6 out of 10 on the PEDro scale. [12-
25] The additional twelve studies scored 5 out of 10: four studies did not mention randomised allocation of subjects
[26-29] and four studies allowed the subjects to select their own groups.
[30-33] Other studies allocated subjects into
training groups by OV 2 max, [34]
OV 2 max and 5 km time trial performance, [5]
mean training time; [35]
or by randomly
allocating half of the subjects into groups and then the rest by age and 5 km time trial performance. [36]
3.2 Running (time trial performance, v OV 2 max and economy)
In runners, improvements were found in time trial performance, economy, v OV 2 max and vMART after a
strength training intervention. The studies show that 8 weeks of explosive-strength training can improve 3 km time
trial performance [15]
, and reactive-strength training can significantly improve 5 km [5]
(p < 0.05) and 3 km [13]
(p <
0.05, ES = 0.13) performance. Both Mikkola et al. [27]
and Berryman et al. [15]
both found in increase in v OV 2 max
from 8 weeks of both reactive-strength and explosive-strength training. The two studies that assessed VMART both
found a significant (p < 0.01) improvement following an 8 week [27]
and 9 week [5]
reactive-strength programme.
Five studies found significant improvements in economy from both maximal- [12, 36]
and reactive-strength training
interventions. [5, 13, 15]
3.3 Cycling (time trial performance, w OV 2 max and economy)
In cyclists, 12-16 weeks of maximal-strength training was found to significantly improve 5 minute [30]
(p < 0.01)
and 45 minute time trial performance [19]
(p < 0.05, ES = 0.66). Improvements were also found in 40 minute [31]
and
60 minute time trial ability; [35]
however these improvements were not found to be significantly different to their
allocated control groups. From the six cycling studies that analysed power at OV 2 max (w OV 2 max), three found
improvements [28, 30, 35]
but only Rønnestad et al.’s work [28, 30]
found a significant effect when compared against the
control group (p < 0.05, ES = 0.81[28]
, ES = 84[30]
). Bastiaans et al [35]
found significant improvements in ‘delta
efficiency’ (p < 0.05, ES = 0.49), and Rønnestad et al [30]
showed increases in economy and ‘work efficiency’ during
the final 60 minutes of a 185 minute cycle test (p < 0.05).
3.4 Cross-country skiing (time trial performance and economy)

THE EFFECT OF STRENGTH TRAINING ON PERFORMANCE IN ENDURANCE ATHLETES
In cross-country skiers, Losnegard et al [33]
found a significant increase in a 1.1 km ‘upper body double-poling’
time trial (p < 0.05), as well as a non-significant improvement in a 1.3 km ‘full-body roller ski’ time trial from their
strength training intervention. Mikkola et al [26]
also found a significant improvement in 2 km ‘upper-body double-
poling,’ however there was no significant difference in change between the control and the experimental group.
Rønnestad et al [32]
found no improvement in 7.5 km ‘full-body roller ski’ time trial performances. Improvements in
economy were seen for both ‘whole-body roller skiing’ [32]
(p < 0.05, ES = 0.77) and ‘isolated upper-body double-
poling’ movements [21, 22, 26]
.
3.5 Triathlon (v OV 2 max, w OV 2 max and economy)
In triathletes, Millet et al. [23]
found a significant increase in peak treadmill velocity at OV 2 max (p < 0.01, ES =
0.55) following a maximal-strength training intervention, whereas Hausswirth et al. [24]
found no difference in w OV 2
max during a cycling protocol. Out of the three studies that investigated running economy in triathletes, only Millet
et al [23]
found significant increases at 25% (p < 0.05, ES = 1.15) and 75% v OV 2 (p < 0.05, ES = 0.14).

THE EFFECT OF STRENGTH TRAINING ON PERFORMANCE IN ENDURANCE ATHLETES
SYSTEMATIC REVIEW

THE EFFECT OF STRENGTH TRAINING ON PERFORMANCE IN ENDURANCE ATHLETES
SYSTEMATIC REVIEW
Table 1. Studies included in the meta-analysis: subjects and research design
Subjects Research design
Reference n Sex Age (y) VO2max
(mL/min/kg)
Level; weekly
volume/hours;
duration of competitiveness
PEDro
score
Assigned
to group?
Intervention (n) Control
(n)
ET controlled? ST replacement
or addition?
Running
Johnston et
al.[12]
12 F 30.3 50.5 32-48 km/ week for
> 1 year
6 RCT 6 6 Yes Addition
Paavolainen et al.[5]
18 M 23 67.7 Elite cross-country 5 Matched with regard
to VO2 and
5 km TT
10 8 Yes Replacement
Spurrs et al.[13] 17 M 25 57.6 Trained; 60-80
km/week for 10 years
6 RCT 8 9 Yes -
monitored
Addition
Saunders et al. [14]
15 M 23.4 71.1 6 internationals, all
national; 107 km/week
6 RCT 7 8 Yes - training
duration matched
Addition
Mikkola et al. [27]
25 M and F 17 62.1 Post-pubertal, high
school runners
5 No
mention of RCT
13 12 Yes -volume Replacement
Støren et al. [36] 17 M and F 29.2 59.9 Trained 5 Half RCT,
other half matched
for 5km
and age
8 9 Yes – volume
& intensity
Addition
Berryman et al. [15]
28 M 28 56.9 Provincial standard, 3-5 sessions per
week
6 RCT 11 (reactive) 12 (explosive)
5 Yes – volume & intensity
Addition
Fletcher et al. [16]
12 M 24.3 67.5 Highly trained; 70-170 km/week
6 RCT 6 6 - -
Cycling
Bastiaans et
al.[35]
14 M 25 - 6 ± 6 years
competing
5 Matched
for mean training
time
6 8 Yes – HR and
training zones
Replacement
Jackson et
al.[17]
23 18 M, 5
F
30 52 ≥0.5 years competing 6 RCT High Res 9,
High Rep 9
5 Yes – HR and
training zones
Addition
Levin et al.[18] 14 M 31 62.75 ≥1 years competing 6 RCT 7 7 Monitored but
not controlled
Addition
Rønnestad et
al. [30]
20 18 M, 2
F
28.5 66.35 Well-trained 5 Self-chosen 11 9 Yes – HR and
training zones
Addition
Rønnestad et 20 18 M, 2 28.5 66.35 Norwegian national- 5 Self-chosen 11 9 Yes – HR and Addition

THE EFFECT OF STRENGTH TRAINING ON PERFORMANCE IN ENDURANCE ATHLETES
SYSTEMATIC REVIEW
Values are means except where stated otherwise (Abbreviations: OV 2 max = maximal oxygen uptake; PEDro score = physiotherapy evidence database score; ET = endurance training; ST = strength
training; HR = heart rate; h = hours; M = male; F = female).
al. [31] F level training zones
Sunde et al. [34] 13 10 M, 3
F
32.85 61.05 Well-trained and
competitive
5 Matched
for VO2max
8 5 Yes – HR and
training zones
Addition
Rønnestad et
al. [28]
12 11 M, 1
F
30 66.25 Norwegian national-
level
5 - 6 6 Yes – HR and
training zones
Addition
Aagaard et al. [19]
14 M 19.5 72.5 U23 international 6 RCT 7 7 Yes – HR and
training zones
Addition
Rønnestad et
al. [29]
27 25 M, 2
F
27.6 63.4 20 highly-trained, 7
recreational
5 - 11 (cyclists)
9 (recreational)
7
(cyclists)
Yes – HR and
training zones
Replacement
Cross-country skiing
Hoff et al.[20] 15 F 17.9 55.3 8.8 h / week 6 RCT 8 7 Yes Replacement of strength-
endurance
Hoff et al.[21] 19 M 19.8 69.4 ‘well-trained’
6 RCT 9 10 Yes Replacement of
strength-endurance
Osteras et al. [22]
19 M 22.7 61.2 ‘highly trained’
> 5 years
6 RCT 10 9 Yes Replacement of
strength-endurance
Mikkola et al. [26]
19 M 23.1 66.5 Finnish national (6-
15 years)
5 - 8 11 - Replacement
Rønnestad et al. [32]
17 M 19.5 66.2 National and international Nordic
combined
5 No – self selected
8 9 Yes Replacement
Losnegard et
al. [33]
19 M and F 21.5 64.7 National 5 No – self
selected
9 10 - -
Triathlon
Millet et al.[23] 15 - 22.85 68.7 20.4 h/week;
elite/international
6 RCT 7 8 Yes -
‘recorded’
Addition
Hausswirth et al. [24]
14 M 31.3 69.2 17.3 h/week; regional and national level
6 RCT 7 7 Yes – ‘strictly aerobic , 75%
HR’
Addition
Bonnacci et al. [25]
8 M and F 21.6 - Competed for 4.4 years
6 RCT 3 5 No Addition

THE EFFECT OF STRENGTH TRAINING ON PERFORMANCE IN ENDURANCE ATHLETES
SYSTEMATIC REVIEW
Table 2. Studies included in the meta-analysis: strength interventions
Reference Type Programme
overview/example
Closed-chain leg
exercises?
Frequency Duration (wk) Time of year
Running
Johnston et al.[12] Maximal-strength 3 x 6RM (parallel squat,
seated press, hammer curl,
lung, heel-raise and bench press)
3 x 8RM (knee
flexion/extension, lateral pull down and seated row)
2 x 20RM (bent leg heel-
raise), 2 x 12RM (straight leg heel-raise) and 2 x
15RM weighted sit-up
Yes – squat and lunge 3 x week 10 -
Paavolainen et al.[5] Reactive-strength Sprints and jumps Alternative jumps,
bilateral
countermovement, drop and hurdle jumps, 1-
legged, 5 jumps
Yes – all reactive exercises
- 9 Off-season
Spurrs et al. [13] Reactive-strength W 1 60 contacts, W2 100,
W3 136, W4 150, W5 170, W6 180.
Plyo progression: Squat
Jump, split scissor jump, double leg bound, SL
hops, depth jump, DL
hurdle hop, SL hurdle hop
Yes – all reactive
exercises
W 1-3: 2 x week,
W 4-6: 3 x week
6 -
Saunders et al [14] Reactive-strength Session 1 (Back extension,
leg press, CMJs, knee
lifts, ankle jumps, hamstring curls)
Session 2 (bounds, skips,
SL ankles, hurdle jumps, scissors for height)
Yes – all reactive
exercises
3 x week 9 -
Mikkola et al. [27] Reactive-strength Sprints (5-10 x 30-150m),
pogos, squat jumps, half squats, knee extensions,
calf raises, curls (2-3 x 6-
10 reps)
Yes – all reactive
exercises
3 x week 8 Pre-competition
Støren et al. [36] Maximal-strength 4 x 4 half squats Yes – squats 3 x week 8 -
Berryman et al. [15] Reactive- and explosive-
strength
Reactive group – drop
jumps
Explosive group – concentric squat jumps
Pmax load
Yes – drop jumps &
concentric squats
1 x week 8 -
Fletcher et al. [16] Maximal- / isometric-
strength
4 x 20s at 80% MVC
isometric plantar flexion
No – isolated isometric
plantar flexion
3 x week 8 Pre-competition
Cycling

THE EFFECT OF STRENGTH TRAINING ON PERFORMANCE IN ENDURANCE ATHLETES
SYSTEMATIC REVIEW
Bastiaans et al.[35] Muscular endurance 4 x 30 (squats, leg press,
step-up) and 2 x 30 (leg pull and core)
Yes – squats and Smith
machine step-ups
3 x week 9 Pre-season
Jackson et al.[17] Muscular endurance and
maximal-strength
Wk 1 – all 2 x 20, Wk 2 –
10 High Res (4 x 4RM),
High Rep (2 x 20RM) ALL squats, leg press, leg
curl, Smith machine step-
ups, planks
Yes – squats and Smith
machine step-ups
3 x week 10 In-season
Levin et al. [18] Maximal-strength,
explosive-strength &
muscular endurance
Strength 4 x 5 (lunges,
squats, RDLs, calf raises
crunches) Power 3 x 6 (Jumps
squats, SL jump squats,
clean grip deadlift, calf raise back extension)
Endurance 3 x 12 (SL leg
press, knee extension, knee flexion, calf raise &
crunches)
Yes – squats, lunges,
RDLs, deadlifts etc
3 x week 6 Pre-season
Rønnestad et al. [30] Maximal-strength W 1-3: 10RM Session 1,
6RM Session 2 W 4-6: 8 RM & 5RM
W 7-12: 6RM & 4RM
ALL half-squat smith, SL leg press, hip flexion &
toe raise.
Yes – Smith squat 2 x week 12 Pre-season
Rønnestad et al. [31] Maximal-strength W 1-3: 10RM Session 1,
6RM Session 2
W 4-6: 8 RM & 5RM
W 7-12: 6RM & 4RM All half-squat smith, SL
leg press, hip flexion &
toe raise.
Yes – Smith squat 2 x week 12 Pre-season
Sunde et al. [34] Maximal-strength 4 x 4RM half-squats
(Smith machine)
Yes – Smith squat 3 x week 8 Pre-season
Rønnestad et al. [28] Maximal-strength W 1-3: 10RM Session 1,
6RM Session 2 W 4-6: 8 RM & 5RM
W 7-12: 6RM & 4RM
ALL half-squat Smith, SL leg press, hip flexion &
toe raise.
W13-25 (SEASON): 2 x 5 (half squat & leg
press)
1 x 6 (hip flexion & ankle plantar flexion)
Yes – Smith squat 2 x week 25 Pre-season prep (12W)
& In-season (12W)
Aagaard et al. [19] Maximal-strength W1: 3 x 12, W2-3: 3 x 10,
W4-5: 3 x 8, W6-16: 2-
No – all machine isolated 2-3 x week 16 -

THE EFFECT OF STRENGTH TRAINING ON PERFORMANCE IN ENDURANCE ATHLETES
SYSTEMATIC REVIEW
3x6
(knee extension, leg press, hamstring curl & calf
raises)
Rønnestad et al. [29] Maximal-strength W 1-3: 10RM Session 1,
6RM Session 2 W 4-6: 8 RM & 5RM
W 7-12: 6RM & 4RM
ALL half-squat smith, SL leg press, hip flexion &
toe raise.
Yes – Smith squat 2 x week 12 -
Levin et al. [18] Maximal-strength,
explosive-strength &
muscular endurance
Strength 4 x 5 (lunges,
squats, RDLs, calf raises
crunches) Power 3 x 6 (Jumps
squats, SL jump squats,
clean grip deadlift, calf raise back extension)
Endurance 3 x 12 (SL leg
press, knee extension, knee flexion, calf raise &
crunches)
Yes – Squats, lunges,
RDLs, deadlifts
3 x week 6 Pre-season
Cross-country skiing
Hoff et al.[20] Maximal-strength Pull-downs – 3 x 6 Increased by 1kg every
session
(control group used their
normal ‘strength-
endurance’ programme
<60% 1RM )
No 3 x week 9 Pre-season
Hoff et al.[21] Maximal-strength Pull-downs – 3 x 6
Increased by 3kg every
session (control group used their
normal ‘strength-
endurance’ programme <85% 1RM)
No 45 min / week 8 Pre-season
Østerås et al. [22] Maximal-strength Pull-downs – 3 x 6
Increased by 3kg every
session (control group used their
normal ’strength
endurance’ programme <85% 1RM)
No 45min / week 9 Pre-season
Mikkola et al. [26] Explosive- & reactive-
strength
Day 1: Specific explosive
- double poling sprints 10 x 10 seconds
Day 2: General explosive
– half squat, pull over, leg
Yes 3 x week 8 -

THE EFFECT OF STRENGTH TRAINING ON PERFORMANCE IN ENDURANCE ATHLETES
SYSTEMATIC REVIEW
press, lat pull-down 3 x 6-
10 Day 3: Reactive – running
sprints, jumps, skating
jumps, pogos 3-6 x 20m
Rønnestad et al. [32] Maximal-strength Deep squat: W1-6 (3-5x4-8), W7-12 (4-5x3-5)
Seated pull-down: W1-6
(3x6-10), W7-12 (3x5-8) Standing double poling
Yes 2 x week 12 -
Losnegard et al. [33] Maximal-strength Half-squat, pull-down,
seated pull-down, double poling, triceps press.
W1-3 (3x6-10), W4 (3x5-
8), W5-8 (4x8), W9-12 (3x4-6)
Yes 2 x week (W1-8)
1 x week (W9-12)
12 Pre-season
Triathlon
Millet et al. [23] Maximal-strength W1 3 x 5, W2 4 x 5, W3 5
x 5 Hamstring curl, leg press,
seated press, parallel
squat, leg extension and heel-raise
Yes – parallel squat 2 x week 14 Pre-season
Hausswirth et al. [24] Maximal-strength 3-5 x 3-5
Leg press, leg extension,
hamstring curl, calf raise.
No 3 x week 5 Pre-season
Bonnacci et al. [25] Reactive-strength CMJs, knee lifts, pogos,
squats, bounds, skips,
scissors etc.
Yes 3 x week 8 -
Values are means except where stated otherwise (Abbreviations: CMJ = countermovement jump; W = week; HR = heart rate; h = hours; M = male; F = female; RM = repetition maximum; RDLs =
Romanian deadlifts; SL = single-leg).

THE EFFECT OF STRENGTH TRAINING ON PERFORMANCE IN ENDURANCE ATHLETES
SYSTEMATIC REVIEW
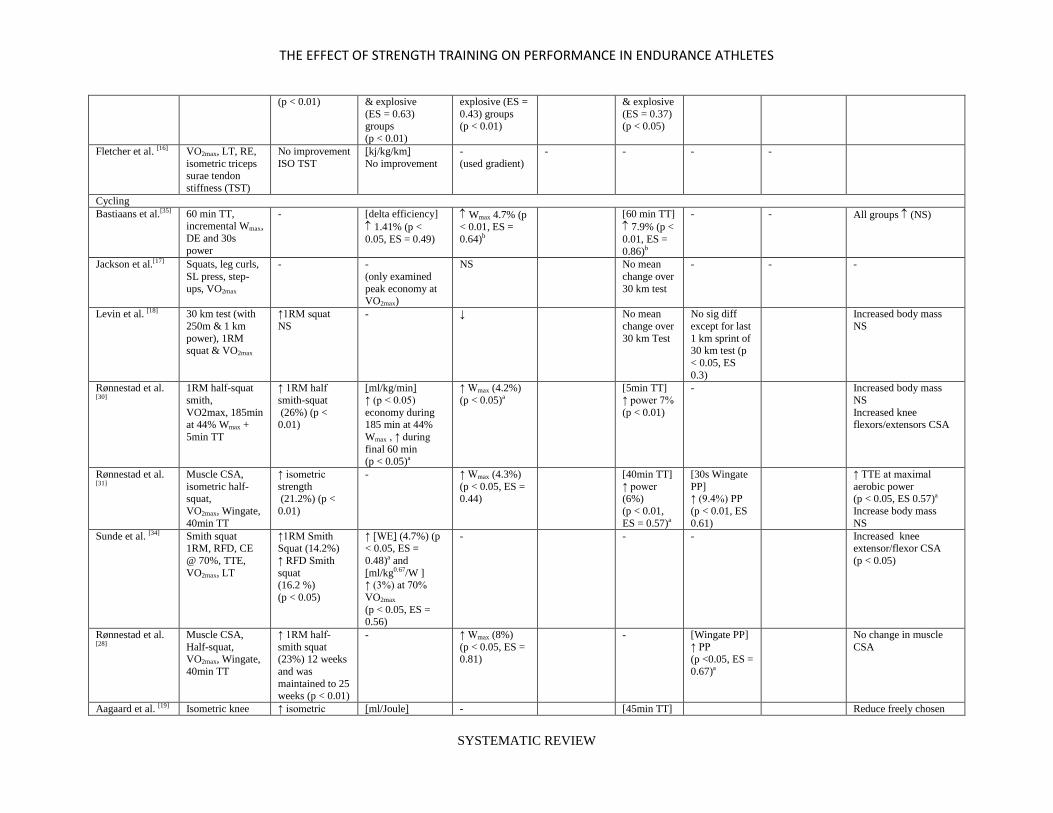
Table 3. Studies included in the meta-analysis: results
Reference Tests Strength Economy vVO2max b
vMART TT PP TTE Body composition/other
performance
Running
Johnston et al.[12] Squat, knee flexion, body
composition, RE
and VO2max
Squat (40%), knee flexion
(27%) [p <
0.05]a
[mL/kg/min]
at 214 m/min
(4%) [ES = 0.72]
and 230 m/min (ES = 0.64) [p <
0.05]a
- - - - - Increased body mass and fat-free mass (NS)
Paavolainen et
al.[5]
5 km TT,
isometric knee
extension, VO2max, LT, RE,
vMART, v20m,
5BJ
Isometric
MVC, v20m,
5BJ (p < 0.01)
[mL/kg/min]
at 4.17 m/s
(8.1%) [p < 0.001]
-
(used gradient) (p < 0.01)a 5 km (3.1%)
[p < 0.05]
- - Increased body mass,
calf and thigh girth
(NS)
Spurrs et al. [13]
RE, VO2max , LT, MTS, Isometric
MVC, RFD,
CMJ, 5BJ, 3km TT
↑ Isometric MVC (12.5%)
MTS @ 75%
MVC (12.9%) RFD (14.5%)
CMJ (13.2%)
5BJ (7.8%) (p < 0.05)
[ml/kg/min] ↑at 12km/h (7.7%,
ES = 0.45),
14 km/h (6.4%, ES = 0.45) &
16km/h (4.1%, ES
= 0.3) (p < 0.05)a
- (used gradient)
- ↑3 km (2.7%,
ES = 0.13)a
- Increased in body mass NS
Saunders et al. [14]
RE, VO2max ,
5CMJ, RFD
↑ 5CMJ (15%),
RFD (14%) NS
[L/min]
↑ at18km/h (4.1%) (p = 0.02, ES =
0.35)a
but NS at 14km/h, 16km/h
- - - - Increased in body mass
NS
Mikkola et al. [27] ISO MVC,
VMART, RE, 30m, 5J, CMJ,
VO2max , v VO2max
↑ Isometric
MVC (8%), 1RM leg
extension (4%),
RFD (31%) (p < 0.05)a.
No sig changes
in CMJ & 5J
[ml/kg/min]
↑ at 12, 13 & 14km/h
NS
↑ 1.2%
NS
↑
3% (p < 0.01)
- - Increased lean body
mass, calf & thigh girth NS
↑V30m (1.1%) (p <
0.05)
Støren et al. [36] 1RM half squat,
RFD, RE, TTE at
MAS,
↑* 1RM
(33.2%), RFD
(26%) of half
squat (p < 0.01)
[ml/kg0.75/min]
↑ at 70% VO2max
(5%)
(p < 0.01, ES = 1.03)a
-
(used gradient)
- - ↑ TTE at MAS
(21.3%)
(p < 0.05)a
Increased body mass
NS
Berryman et al. [15]
VO2max, vVO2,
economy, Ppeak, 3 km TT, RE
↑ Ppeak (W) in
both reactive & explosive group
[ml/kg0.75/min]
↑ in both reactive (ES = 0.96)
↑ in both
reactive (ES = 0.49) &
- ↑3km TT
In reactive (ES = 0.46)
- No changes in body
mass
THE EFFECT OF STRENGTH TRAINING ON PERFORMANCE IN ENDURANCE ATHLETES
SYSTEMATIC REVIEW
(p < 0.01)
& explosive
(ES = 0.63) groups
(p < 0.01)
explosive (ES =
0.43) groups (p < 0.01)
& explosive
(ES = 0.37) (p < 0.05)
Fletcher et al. [16] VO2max, LT, RE,
isometric triceps surae tendon
stiffness (TST)
No improvement
ISO TST
[kj/kg/km]
No improvement
-
(used gradient)
- - - -
Cycling
Bastiaans et al.[35] 60 min TT, incremental Wmax,
DE and 30s
power
- [delta efficiency]
1.41% (p <
0.05, ES = 0.49)
Wmax 4.7% (p < 0.01, ES =
0.64)b
[60 min TT]
7.9% (p <
0.01, ES =
0.86)b
- - All groups (NS)
Jackson et al.[17] Squats, leg curls,
SL press, step-
ups, VO2max
- -
(only examined
peak economy at VO2max)
NS No mean
change over
30 km test
- - -
Levin et al. [18] 30 km test (with
250m & 1 km
power), 1RM squat & VO2max
↑1RM squat
NS - ↓ No mean
change over
30 km Test
No sig diff
except for last
1 km sprint of 30 km test (p
< 0.05, ES
0.3)
Increased body mass
NS
Rønnestad et al. [30]
1RM half-squat
smith,
VO2max, 185min at 44% Wmax +
5min TT
↑ 1RM half
smith-squat
(26%) (p < 0.01)
[ml/kg/min]
↑ (p < 0.05)
economy during 185 min at 44%
Wmax , ↑ during
final 60 min (p < 0.05)a
↑ Wmax (4.2%)
(p < 0.05)a
[5min TT]
↑ power 7%
(p < 0.01)
- Increased body mass
NS
Increased knee flexors/extensors CSA
Rønnestad et al. [31]
Muscle CSA,
isometric half-squat,
VO2max, Wingate,
40min TT
↑ isometric
strength (21.2%) (p <
0.01)
- ↑ Wmax (4.3%)
(p < 0.05, ES = 0.44)
[40min TT]
↑ power (6%)
(p < 0.01,
ES = 0.57)a
[30s Wingate
PP] ↑ (9.4%) PP
(p < 0.01, ES
0.61)
↑ TTE at maximal
aerobic power (p < 0.05, ES 0.57)a
Increase body mass
NS
Sunde et al. [34] Smith squat 1RM, RFD, CE
@ 70%, TTE,
VO2max, LT
↑1RM Smith Squat (14.2%)
↑ RFD Smith
squat (16.2 %)
(p < 0.05)
↑ [WE] (4.7%) (p < 0.05, ES =
0.48)a and
[ml/kg0.67/W ] ↑ (3%) at 70%
VO2max
(p < 0.05, ES = 0.56)
- - - Increased knee extensor/flexor CSA
(p < 0.05)
Rønnestad et al. [28]
Muscle CSA,
Half-squat, VO2max, Wingate,
40min TT
↑ 1RM half-
smith squat (23%) 12 weeks
and was
maintained to 25 weeks (p < 0.01)
- ↑ Wmax (8%)
(p < 0.05, ES = 0.81)
- [Wingate PP]
↑ PP (p <0.05, ES =
0.67)a
No change in muscle
CSA
Aagaard et al. [19] Isometric knee ↑ isometric [ml/Joule] - [45min TT] Reduce freely chosen

THE EFFECT OF STRENGTH TRAINING ON PERFORMANCE IN ENDURANCE ATHLETES
SYSTEMATIC REVIEW
extensor MVC,
RFD, 45 min TT
MVC (12%) (p
< 0.05) & RFD (20%) (p <
0.01)
No change in
strength group
↑ 8% (p <
0.01, ES = 0.66)
cadence
Increased patellar tendon CSA
Rønnestad et al. [29]
VO2max, 1RM
smith half squat, 5min at 125W for
VO2
↑1RM smith-
squat (31%) (p < 0.01)
[ml/kg/min]
↑ economy at 125W but NS
- - All groups (NS)
Cross-country skiing
Hoff et al.[20] 1 RM DP pull-down, peak
force and RFD at
80% and 60% 1RM,
VO2max (running),
VO2peak upper body
‘poling’ , TTE
upper, economy at max
↑ 1RM, time to peak
force at 80%
1RM (p < 0.05)
[UB DP (mL/kg0.67/m)]
↑(p < 0.001)b
- (UB DP
VO2max)
- - - ↑ TTE (p < 0.001)
Hoff et al.[21] 1 RM DP pull-
down, peak force and RFD @
80% and 60%
1RM, VO2max (running),
VO2peak upper
body
‘poling’ , TTE
upper, economy
at max
↑ 1RM (9.9%),
peak force at 80% (34%) and
60% (33%)
1RM (p < 0.05)
[UB DP
(mL/kg0.67/m)] ↑1t 1.81 m/min (p
< 0.05)
-
(UB DP VO2max)
- - - ↑ TTE (56%) at
VO2 peak velocity (p <
0.05)
Østerås et al. [22] 1RM ‘ski pull-
down’
F-V, P-V at various loads
VO2peak, TTE
↑ power &
velocities
at each load (except lowest)
(p < 0.01)
[UB DP
(ml/kg0.67/min)]
↑* double poling at
pre-test VO2peak
force (p < 0.01, ES =
1.66)
-
(UB DP
VO2max)
- - ↑* TTE at
VO2max velocity
(p < 0.05, ES = 1.18)
Mikkola et al. [26] Leg extensor isometric &
concentric force-
time, 30m double
poling with roller
skis, Velocity &
economy 2km
UB double
↑leg extensor ISO & CON
NS
[UB DP (ml/kg/min)]
↑* during constant
velocity 2km (7%) (p < 0.05)
- (walking VO2
max with poles)
- No change 2km UB
poling
velocity
- Increased lean body mass,
↑ 30m (1.4%) double
poling, (p < 0.05)

THE EFFECT OF STRENGTH TRAINING ON PERFORMANCE IN ENDURANCE ATHLETES
SYSTEMATIC REVIEW
poling,
VO2max (walking with poles),
MAST (maximal
anaerobic ski test)
Rønnestad et al. [32]
1RM squat, pull-
down, squat jump
height, VO2max roller ski,
economy, 7.5km
TT
↑ 1RM squat
(12%)
pull-down (23%),
squat jump
(8.8%) (p < 0.01)
[Roller Ski
(ml/kg/min)]
↑ at 5o (3.8%) (p < 0.05, ES =
0.77)a
but no change at 4o
- - No change
rollerski
7.5 km TT
- Increased vastus
lateralis thickness
(p < 0.05) No change in body
mass
Losnegard et al. [33]
1RM half squat & seated pull-down,
CMJ, VO2max
rollerski
↑ 1RM half-squat (12%)
pull down (19%)
(p < 0.01) no change in
CMJ.
[Roller Ski (ml/kg/min)]
unchanged in both
groups
-
- ↑ UB 1.1 km TT (7%)
(p < 0.05)
but NS rollerksi 1.3
km TT
(3.7%)
- No change in 20m, 40m, 80m & 100m
velocity,
↑ 5 min W/kg double-poling
(p < 0.05),
No change in quadriceps CSA
Triathlon
Millet et al. [23]
Concentric half squat & heel
raise,
10s hopping &
limb stiffness
Running analysis:
VO2max and
VVO2max on track,
economy at 25%
and 75% VVO2 during
3km,
VO2 kinetics
↑ 1RM half squat & heel
raise,
(p < 0.01)
↑ hopping height
and power
(p < 0.05) Hopping
stiffness not
different
[ml/kg/min] ↑ at 25% (ES
1.15) and 75%
(ES = 1.14)
VVO2 during
3 km
(p < 0.05)
↑ (p < 0.01, ES = 0.55)
- - - - No change in VO2 kinetics
No change in body
mass
Hausswirth et al. [24]
1RM leg press,
isometric knee
extension Cycling analysis:
VO2max, PVO2max,
gross efficiency
↑ 1RM leg press
(6.6%)
(p < 0.01) ↑ isometric knee
but NS
No differences in
gross efficiency
Remain
unchanged
- - - - No change in body
mass
Bonnacci et al. [25]
Running analysis:
Economy,
EMG (for muscle
recruitment
patterns running
No tests for
strength
12km/h
NS
- - - - - Bike to run testing
protocol
No change in body mass, thigh or calf girth.

THE EFFECT OF STRENGTH TRAINING ON PERFORMANCE IN ENDURANCE ATHLETES
SYSTEMATIC REVIEW
after cycling)
Values are means except where stated otherwise. (Abbreviations: ↑ = improved; a = significant difference between strength group pre-and post-test only; b = except for cycling studies, for which the
parameter is wVO2max.; NS = no significant difference between strength group pre- and post-test; TT = time trial; RE = running economy; LT = lactate threshold; vMART = peak velocity in maximal
anaerobic running test; V OV 2 max = peak velocity at OV 2 max; w OV 2 max,, = peak power at OV 2 max; MVC = maximum voluntary contraction; RFD = rate of force development; CMJ =
countermovement jump; 5 BJ = five broad jump test; ISO = isometric; MAS = maximum aerobic speed; TTE = time to exhaustion; DE = delta economy; SL= single-leg; CSA = cross-sectional area; PP
= peak power)

THE EFFECT OF STRENGTH TRAINING ON PERFORMANCE IN ENDURANCE ATHLETES
SYSTEMATIC REVIEW

THE EFFECT OF STRENGTH TRAINING ON PERFORMANCE IN ENDURANCE ATHLETES
SYSTEMATIC REVIEW
4. DISCUSSION
Despite the abundance of studies investigating concurrent strength and endurance training, relatively few have
examined well-trained endurance athletes. This systematic review is unique due to the focused analysis of strength
training on specific performance indicators (economy, V OV 2 max/W OV 2 max, VMART and time-trials) in well-trained
runners, cyclists, triathletes and cross-country skiers.
4.1 STRENGTH DIAGNOSTICS
As expected, the majority of the reviewed studies demonstrated an improvement in muscle force-velocity
characteristics following a strength intervention. [5, 12, 13, 15, 17, 19, 20-22, 27, 28, 31-34, 36]
However, it is important to
highlight that there were a wide variety of exercises administered throughout the literature to measure maximal-,
explosive- and reactive-strength adaptations. Running, cycling, triathlon and cross-country skiing all require the
hip, knee and ankle musculature to work in unison to produce force against the ground or pedal. A valid strength
test for these sports would measure the force capabilities of the leg extensors in the same way – through closed-
chain, multi-joint exercises such as squats, jump-squats or drop jumps. [37]
However, some studies in this review [5, 19,
24, 27] assessed strength ability through open-chain, isolated exercises (i.e. knee extension, leg press). Testing force
production in an isolated manner may have reduced the validity of the overall force capabilities of the endurance
athlete’s leg musculature. Another criticism is that most studies only measured force output in one or two velocity
ranges, either through low-velocity (one repetition maximum) or high-velocity (unloaded jumps and hops) exercises.
It is important to measure force output through a range of velocities to determine maximal-, explosive- (strength-
speed & speed-strength) and reactive-strength ability.[38]
Assessing force capabilities with valid exercises through a
range of velocities would highlight sensitive changes in strength qualities following an intervention period and allow
for a more accurate relationship between strength adaptation and endurance performance.
4.1.1 Reactive-strength diagnostics in runners and triathletes
Runners and triathletes need to have proficient eccentric muscular capabilities to rapidly absorb and utilise the
elastic energy produced during each ground contact The short ground contact phase in running is the only phase in
which a runner or triathlete can produce force and influence running velocity. Paavolainen et al [5]
demonstrated the
importance of reactive-strength by finding a strong relationship between ground contact time and running economy
(r = 0.64, p < 0.001). Reactive-strength is affected by musculotendinous stiffness and stretch-shortening cycle
(SSC) function. [39]
Schmidtbleicher [40]
demonstrated that the SSC can be classified as either slow or fast. Fast SSC
is characterised by short contact times (< 0.25 seconds) and small angular displacement of the hip, knee and ankle
joint; whereas slow SSC involves longer contact times (> 0.25 seconds) and larger angular joint displacements.
Unfortunately, the running and triathlon studies in the current review did not take into consideration fast or slow
SSC function and only assessed reactive-strength through ‘general’ reactive-strength measurements such as
countermovement jumps, [13, 27]
broad jumps and hopping tests.[5, 13, 14, 23]
The ‘reactive-strength index’ (RSI) is a

THE EFFECT OF STRENGTH TRAINING ON PERFORMANCE IN ENDURANCE ATHLETES
SYSTEMATIC REVIEW
popular assessment used by Strength & Conditioning coaches to examine the relationship between force production
and ground contact time through a series of drop-jumps at differing heights.[41]
The RSI test may have been a more
appropriate and sensitive assessment to track reactive-strength adaptations and transferability to running and
triathlon performance.
4.2 TIME TRIAL PERFORMANCE
In well-trained endurance athletes, the current literature indicates that strength training can significantly
improve 3 km [13]
(p < 0.05, ES = 0.13) and 5 km [5]
(p < 0.05) time trial performance in runners, 5 minute [30]
(p <
0.01) and 45 minute time trial performance [19]
(p < 0.05, ES = 0.66) in cyclists and 1.1 km ‘upper body double-
poling’ time trial performance in cross-country skiers (p < 0.05). However, it is important to note that elite
endurance racing success is not dictated by average velocity or power output over a set distance and therefore time-
trial ability is not a ‘true’ reflection of racing performance. [42]
Further analysis of economy and assessments that
include an endurance-specific muscle power component (i.e. V OV 2 max / W OV 2 max, and VMART) may add to the
potential beneficial effect of strength training on performance in well-trained endurance athletes.
4.3 ECONOMY
Economy is represented by energy expenditure and is normally expressed as submaximal OV 2 at a given
velocity or power output. It is now established that economy is a critical factor for success in elite endurance
sport.[43]
The present research shows that there were significant improvements in economy from both maximal- [12,
36] and reactive-strength training interventions
[5, 13, 15] in well-trained runners. This supports Noakes
[44] philosophy
that runners with poor economy may lack musculotendinous stiffness and therefore strength training may improve
the ability of the leg musculature to rapidly absorb and utilise the elastic energy produced during each ground
contact. Also in cyclists, the literature shows that strength training significantly improved ‘delta efficiency’ [35]
(p <
0.05, ES = 0.49), economy during the final 60 minutes of a 185 minute cycle test [30]
(p < 0.05) and ‘work
efficiency.’ [34]
In cross-country skiers, improvements in economy were found in both ‘whole-body roller skiing’ [32]
(p < 0.05, ES = 0.77) and ‘isolated upper-body double-poling’ movements [21, 22, 26]
. Out of the three studies that
investigated running economy in triathletes, only Millet et al [23]
found significant increases at 25% (p < 0.05, ES =
1.15) and 75% v OV 2 (p < 0.05, ES = 0.14).
Interestingly, improvements in economy were found to be velocity specific in runners. Spurrs et al. [13]
found a
6.7% and 6.4% significant increase at both 12 km/h (ES = 0.45) and 14 km/h (ES = 0.45), but only a 4.1 % increase
at 16 km/h (p < 0.05, E = 0.3). Furthermore, Saunders et al. [14]
only found a significant improvement at 18 km/h in
elite international runners (p = 0.02, ES = 0.35), with no change at 14 km/h and 16 km/h. This supports Berg’s [14]
view on adaptation specificity that marathoners may be more economical at marathon pace than 800m and 1500m
specialists, whereas middle distance runners may be more efficient at higher velocities. Consequently, the most
valid measurement of economy may be at specific race velocities and power outputs, rather than an arbitrary

THE EFFECT OF STRENGTH TRAINING ON PERFORMANCE IN ENDURANCE ATHLETES
SYSTEMATIC REVIEW
submaximal intensity which is commonly used. Future researchers should take this into consideration when
assigning velocities for economy assessment.
4.4 ENDURANCE MUSCLE POWER
Endurance-specific muscle power is the ability of the neuromuscular system to rapidly produce force following
a sustained period of high-intensity exercise (high glycolytic and/or oxidative energy demand) [5]
. This combined
neuromuscular and anaerobic ability may be the differentiating factor for elite endurance performance as successful
athletes at world-level can produce high velocities and power outputs to win a race following a sustained period of
high-intensity exercise (i.e. sprint finish). As illustrated in Figure 1, V OV 2 max is not only dictated by OV 2 max, LT
and economy, but also by muscle power factors (neuromuscular and anaerobic ability). Noakes [47]
originally
suggested that velocity at OV 2 max (V OV 2 max) could be used as a potential measure of muscle power in runners.
From this review, only Mikkola et al. [27]
and Berryman et al. [15]
assessed v OV 2 max. Both researchers found an
increase in v OV 2 max after an 8 week reactive-strength program, with only the latter study showing a significant
effect from both reactive- (p < 0.01, ES = 0.49) and explosive-strength (p < 0.01, ES = 0.43) programmes. From the
six cycling studies that analysed power at OV 2 max (w OV 2 max), three found improvements [28, 30, 35]
but only
Rønnestad et al.’s work [28, 30]
found a significant effect when compared against the control group (p < 0.05, ES =
0.81[28]
, ES = 84[30]
). In triathletes, Millet et al. [23]
established a significant increase in peak treadmill velocity at
OV 2 max (p < 0.01, ES = 0.55), whereas Hausswirth et al. [24]
found no difference in w OV 2 max during a cycling
protocol.
Conversely, Paavolainen et al. [2]
argues that the aerobic system is still strongly involved during a OV 2 max test
and v OV 2 max / w OV 2 max should not be used as a pure measure of endurance-specific muscle power performance.
The vMART (peak velocity attained during a maximal anaerobic running test), which consists of a series of
incremental 20 seconds sprints on a treadmill until exhaustion, is believed to place more emphasis on assessing
neuromuscular and anaerobic performance. The two running studies that assessed VMART in this review both
found a significant (p < 0.01) improvement following an 8 week [27]
and 9 week [5]
reactive-strength programme.
4.5 INTERVENTION ANALYSIS
4.5.1 Programme Duration
Aside from Rønnestad et al.’s [28]
strength intervention lasting 25 weeks, the average intervention period in this
review was approximately 10 weeks. Much of what we know about neurological and structural adaptations in
strength training derives from similar short term (8-12 week) interventions involving relatively untrained or
inexperienced subjects. [48]
There are only a few studies investigating the long-term strength adaptations in well-
trained athletes; however these are from strength and power sports. [49]
Future research in well-trained endurance
athletes should focus on long-term strength interventions (12-18 months) and subsequent endurance performance.

THE EFFECT OF STRENGTH TRAINING ON PERFORMANCE IN ENDURANCE ATHLETES
SYSTEMATIC REVIEW
4.5.2 Exercise Prescription
There were a variety of the strength programmes administered all of the twenty-six investigations. The two
main distinctions in the interventions are in the prescription of (i) exercises, and (ii) loads and velocities of exercises
(see section 4.5.3). ‘Transfer of training’ is a term used to describe the effectiveness of adaptations from a strength
exercise transferring to sporting performance. [50]
The ability to generate force is dependent on the limb and joint
positioning of the leg extensors. [51]
Therefore, the exercises selected in a program can influence the magnitude of
neuromuscular adaptations, strength gains and potential improvements in endurance performance. A large portion
of the strength exercises used in both the cycling [17, 19, 28-31]
and running literature [12, 16]
were open-chain, isolated
and machine-based exercises (i.e. leg extension, seated hamstring curl, leg press, isometric plantar flexion). Stone &
Stone [50]
states that strength programmes dominated by open-chain exercises may not provide adequate movement
pattern specificity for optimal performance improvements in closed-chain sporting movements (i.e. running). As
previously discussed, endurance sports require the hip, knee and ankle joint musculature to work in unison to
produce force against the ground or pedal and provide locomotion. As a result of decreased mechanical specificity,
the transferability of these strength exercises to performance may have been reduced. Although running can contain
a combination of both open- and closed-chain movements, it is the closed-chain phase where force is produced
against the ground to provide locomotion. Also, Stensdotter et al. [52]
demonstrated that there can be varying muscle
activation patterns when an isolated, open-chain quadriceps exercise is compared to a multi-joint, closed-chain
quadriceps exercise. These intra- and inter-muscular differences in exercises may complicate the learning and
neural effects in the transfer of training process. Traditional multi-joint strength exercises, whether they are
maximal- (i.e. squats, deadlifts & single-leg equivalents), explosive- (i.e. jump-squats, Olympic lift variations) or
reactive-strength exercises (i.e. drop-jumps, sprints), are believed to be superior for eliciting optimal neuromuscular
adaptations and increasing the force capabilities of the leg musculature. [50]
Future studies investigating the effect of
strength training in endurance sports should programme these functionally superior exercises.
4.5.3 Load and Velocity Prescription
There are three main types of strength training: maximal-strength, explosive-strength (strength-speed & speed-
strength) and reactive-strength training. Each can be categorised by velocity of the movement. [38]
All types of
strength training were used in this review: reactive-, [5, 13-15, 27]
explosive- [15]
and maximal-strength orientated
programmes. [12, 16, 17, 19, 28-30, 31, 34, 36]
Others used a mixed approach with no emphasis on a specific strength quality.
[17, 18, 35] A strength programme should be tailored to the current strength level of the athlete and evolves as they
increase their force capabilities. Programming for a weak, or neuromuscular inefficient, athlete can be completely
different (exercise, load, velocity, volume and frequency) to a strong athlete. Continual improvements in strong
athletes require the development of programmes that target a specific strength quality (maximal-strength, strength-
speed, speed-strength, and reactive-strength) in the force-velocity relationship. [51]
In contrast, athletes with low
levels of strength, even though they may be a well-trained endurance athlete, can display improvements in
neuromuscular function and force production from relatively non-specific and general strength programmes. [53]
This
could be an explanation for why there were significant improvements in running economy from all three types of

THE EFFECT OF STRENGTH TRAINING ON PERFORMANCE IN ENDURANCE ATHLETES
SYSTEMATIC REVIEW
strength training: reactive-, [5, 13, 15]
explosive- [15]
and maximal-strength interventions. [12, 36]
However, future studies
that investigate longitudinal strength adaptations in endurance athletes should consider specifically prescribed
programming for long-term gains.
Research in untrained subjects has shown that the neuromuscular adaptations from general strength training can
result in a shift of the force–velocity curve in which force production is greater at any given velocity. [54]
Recent
work from Cormie et al. [53]
found that in weak subjects, maximal-strength training not only improved the maximal
force capabilities of the leg extensors, but the programme was also as effective as an explosive-strength programme
in improving maximal power output. Further research from Dymond et al. [55]
found that subjects with higher levels
of relative maximal-strength demonstrated superior reactive-strength ability. Dymond et al.’s [55]
work supports
anecdotal evidence that reactive-strength, specifically the slow stretch-shortening cycle (i.e. a countermovement
jump); can be improved in non-strength trained individuals following a period of maximal-strength training. In
weak endurance athletes, especially where long-term improvements are the goal, a maximal-strength emphasised
programme may initially be an efficient and effective training modality for improving several strength qualities
together. Thus, weak endurance athletes may not necessarily need to place a focus on explosive- or reactive-
strength training until a solid foundation of relative maximal-strength and neuromuscular efficiency is obtained.
Nonetheless, reactive-strength can still be trained in low volume and supplemented alongside a maximal-strength
orientated programme (i.e. basic plyometric progressions, stiff-leg pogos) and emphasis towards strength specificity
can shift as the athlete enhances their neuromuscular ability.
4.5.4 The Interference Effect
As illustrated in Figure 1, appropriate strength training improves neuromuscular capacity, whereas endurance
training targets both aerobic and anaerobic energy systems. However, recent molecular physiology research is
starting to explain the intracellular signalling networks mediating exercise-induced skeletal muscle adaptations to
both strength and endurance training stimuli. Simultaneously training for both strength and endurance may result in
an acute compromised adaptation when compared with single-mode training [56]
. Strength training can activate the
phosphatidylinositol 3-kinase (PI3-k)–Akt–mammalian target of rapamycin (mTOR) signalling pathway that
regulates rate of protein synthesis, and over a prolonged period of time, muscle hypertrophy. Whereas endurance
training activates another signalling cascade, the adenosine-monophosphate-activated protein kinase (AMPK)–p38
mitogen-activated protein kinase (MAPK)–peroxisome proliferator- activated receptor-gamma coactivator (PGC)-1
axis pathway. However, the activation of AMPK from the endurance training stimulus may interfere with, and
inhibit, the mTOR signal for strength training-induced muscle protein synthesis [56]
. In short, an endurance-specific
training session (i.e. LSD, tempo, interval) may inhibit the signalling pathway for optimal neuromuscular adaptation
from the strength training stimulus. Nonetheless, molecular research in the area is in its infancy and there is much
work to be undertaken before the information can be directly applied to the physical preparation of endurance
athletes. Still, it is important that coaches are aware of the potential compromised adaptations when periodizing
strength sessions in an endurance athlete’s programme.

THE EFFECT OF STRENGTH TRAINING ON PERFORMANCE IN ENDURANCE ATHLETES
SYSTEMATIC REVIEW
5. CONCLUSION & FUTURE DIRECTIONS
The present research available suggests the inclusion of strength training in an endurance athlete’s programme
for improved economy, muscle power and performance. It is important that future researchers and coaches are
aware that muscular force-velocity adaptations are dependent upon the duration of the strength programme, the
current strength-level of the athlete and the exercises administered (including the velocity and loads of the
exercises). For long-term improvements in weak (neuromuscular inefficient) or non-strength trained endurance
athletes, the present literature demonstrates that a general maximal-strength orientated programme may initially be
the most appropriate and efficient method for improving maximal force, power and reactive-strength capabilities.
Endurance athletes with high force capabilities may need to place a greater emphasis on specific explosive- and
reactive-strength training to gain further improvements in performance. However, it is evident that further research
is needed in this area. Future investigations should include valid strength assessments (i.e. squats, jump-squats, drop
jumps) through a range of velocities (maximal strength ↔ strength-speed ↔ speed-strength ↔ reactive-strength),
and administer appropriate programming (exercise, load & velocity prescription) over a long-term intervention
period (> 6 months) for optimal transfer to performance.
Acknowledgements
The authors have no potential conflicts of interest that are directly relevant to the content of this review. This
research is supported by funding from the University of Limerick Physical Education and Sport Science (PESS)
Scholarship 2012.
REFERENCES
1. Bassett DR, Howley ET. Limiting factors for maximum oxygen uptake and determinants of endurance
performance. Med Sci Sports Exerc 2000; 32(1): 70-84.
2. Paavolainen L, Nummela A, Rusko H. Muscle power factors and OV 2max as determinants of horizontal
and uphill running performance. Scand J Med Sci Sports 2000; 10: 286-291.
3. Foster C, Lucia A. Running economy: the forgotten factor in elite performance. Sports Med 2007; 37(4-
5): 316-9.
4. Fletcher JR, Esau SP, MacIntosh BR. Economy of running: beyond the measurement of oxygen uptake. J
Appl Physiol 2009; 107: 1918-1922.
5. Paavolainen L, Hakkinen K., Hamalainen I, et al. Explosive strength training improves 5-km running time
by improving running economy and muscle power. J Appl Physiol 1999; 86: 1527–1533.
6. Nummela A, Alberts M, Rijntjes RP, et al. Reliability and Validity of the Maximal Anaerobic Running
Test. Int J Sports Med 1996; 17(2 Suppl.): 97 – 102.
7. McLaughlin JE, Howley ET, Bassett DR, et al. Test of the classic model for predicting endurance running
performance. Med Sci Sports Exerc 2010; 42(5): 991-997.
8. Millet GP, Dréano P, Bentley DJ. Physiological characteristics of elite short- and long-distance triathletes.
Eur J Appl Physiol 2003; 88: 427-430.

THE EFFECT OF STRENGTH TRAINING ON PERFORMANCE IN ENDURANCE ATHLETES
SYSTEMATIC REVIEW
9. Zatsiorsky VM. Science and Practice of Strength Training. Champaign, Il, USA: Human Kinetics; 1995.
10. Karp JR. Training characteristics of qualifiers for the U.S. Olympic Marathon Trials. Int J Sports Physiol
Perform 2007; 2: 72-92.
11. Maher CG, Sherrington C, Herbert RD, et al. Reliability of the PEDro scale for rating quality of
randomized controlled trials. Phys Ther 2003; 83(8): 713–721.
12. Johnston RE, Quinn TJ, Kertzer R, et al. Strength training in female distance runners: Impact on running
economy. J Strength Cond Res 1997; 11 (4): 224-229.
13. Spurrs RW, Murphy AJ, Watsford ML. The effect of plyometric training on distance running performance.
Eur J Appl Physiol 2003; 89: 1-7.
14. Saunders PU, Telford RD, Pyne DB, et al. Short-term plyometric training improves running economy in
highly trained middle and long distance runners. J Strength Cond Res 2006; 20(4): 947-954.
15. Berryman N, Maurel D, Bosquet L. Effect of plyometric vs. dynamic weight training on the energy cost of
running. J Strength Cond Res 2010; 24(7): 1818-1825.
16. Fletcher JR, Esau SP, MacIntosh BR. Changes in tendon stiffness and running economy in highly trained
distance runners. Eur J Appl Physiol 2010; 110: 1037-1046.
17. Jackson NP, Matthew SH, Reiser RF. High resistance / low repetition vs. low resistance / high repetition
training: Effects on performance of trained cyclists. J Strength Cond Res 2007; 21(1): 289-295.
18. Levin GT, McGuigan MR, Laursen PB. (2009). Effect of concurrent resistance and endurance training on
physiologic and performance parameters of well-trained endurance cyclists. J Strength Cond Res 2009;
23(8): 2280-2286.
19. Aagaard P, Andersen JL, Bennekou M, et al. Effects of resistance training on endurance capacity and
muscle fiber composition in young cyclists. Scand J Med Sci Sports 2011; 21: 298 – 307.
20. Hoff J, Helgerud J, Wisløff U. Maximal strength training improves work economy in trained female cross-
country skiers. Med Sci Sports Exerc 1999; 31(6): 870 – 877.
21. Hoff J, Gran A, Helgerud J. Maximal strength training improves aerobic performance. Scand J Med Sci
Sports 2002; 12: 288-295.
22. Østerås H, Helgerud J, Hoff J. Maximal strength-training effects on force-velocity and force-power
relationships explain increases in aerobic performance in humans. Eur J Appl Physiol 2002; 88: 255-263.
23. Millet GP, Jaouen B, Borrani F, et al. Effects of concurrent endurance and strength training on running
economy and VO2 kinetics. Med Sci Sports Exerc 2002; 34(8): 1351-9.
24. Hausswirth C, Argentin S, Bieuzen Y, et al. Endurance and strength training effects on physiological and
muscular parameters during prolonged cycling. J Electromyogr Kinesiol 2009; 20: 330-339.
25. Bonacci J, Green D, Saunders PU, et al. Plyometric training as an intervention to correct altered
neuromotor control during running after cycling in triathletes: A preliminary randomized controlled trial.
Phys Ther Sport 2011; 12: 15-21.
26. Mikkola JS, Rusko HK, Nummela AT, et al. Concurrent endurance and explosive type strength training
increases activation and fast force production of leg extensor muscles in endurance athletes. J Strength
Cond Res 2007; 21(2): 613-620.

THE EFFECT OF STRENGTH TRAINING ON PERFORMANCE IN ENDURANCE ATHLETES
SYSTEMATIC REVIEW
27. Mikkola J, Rusko H, Nummela A, et al. Concurrent endurance and explosive type strength training
improves neuromuscular and anaerobic characteristics in young distance runners. Int J Sports Med 2007;
28(7): 602-611.
28. Rønnestad BR, Hansen EA, Raastad T. In-season strength maintenance training increases well-trained
cyclists’ performance. Eur J Appl Physiol 2010; 110 (6): 1269 – 1282.
29. Rønnestad BR, Hansen EA, Raastad T. Strength training affects tendon cross-sectional area and freely
chosen cadence differently in non-cyclists and well-trained cyclists. J Strength Cond Res 2012; 26(1): 158-
166.
30. Rønnestad BR, Hansen EA, Raastad T. Strength training improves 5-min all out performance following
185 min of cycling. Scand J Med Sci Sports 2011; 21(2): 250-259.
31. Rønnestad BR, Hansen EA, Raastad T. Effect of heavy strength training on thigh muscle cross-sectional
area, performance determinants, and performance in well-trained cyclists. Eur J Appl Physiol 2010; 108:
965–975
32. Rønnestad BR, Kojedal Ø, Losnegard T, et al. Effect of heavy strength training on muscle thickness,
strength, jump performance, and endurance performance in well-trained Nordic Combined athletes. Eur J
Appl Physiol 2012; 112: 2241-2352.
33. Losnegard T, Mikkelson K, Rønnestad BR, et al. The effect of heavy strength training on muscle mass
and physical performance in elite cross country skiers. Scand J Med Sci Sports 2011; 21: 389-401.
34. Sunde A, Støren Ø, Bjerkaas M, et al. Maximal strength training improves cycling economy in competitive
cyclists. J Strength Cond Res 2010; 24 (8): 2157-2165.
35. Bastiaans JJ, Van Diemen AB, Veneberg T, et al. The effects of replacing a portion of endurance training
by explosive strength training on performance in trained cyclists. Eur J Appl Physiol 2001; 86: 79–84.
36. Støren O, Helgerud J, Støa EM, et al. Maximal strength training improves running economy in distance
runners. Med Sci Sports Exerc 2008; 40: 1089– 1094.
37. Newton RU, Cormie P, Cardinale M. Principles of Athletic Testing. In: Cardinale M, Newton R, Nosaka
K, editors. Strength & Conditioning: Biological Principles and Practical Application. Oxford, Wiley-
Blackwell; 2011. pp. 255 – 270.
38. Siff M. Supertraining. 2nd
ed. Denver, USA; 2003. p. 20.
39. Brughelli M, Cronin J. Influence of running velocity on vertical, leg and joint stiffness. Modelling and
recommendations for future research. Sports Med 2008; 38(8): 647-667.
40. Schmidtbleicher D. Training for power events. In: Komi PV, editors. The Encyclopedia of Sports
Medicine. Vol 3: Strength and Power in Sport. Oxford, UK: Blackwell; 1992. pp. 169-179.
41. Flanagan EP, Comyns TM. The use of contact time and the reactive strength index to optimize fast stretch-
shortening cycle training. Strength Cond J 2008; 30(5): 32-38.
42. Jeukendrup AE, Craig NP, Hawley JA. The bioenergetics of world class cycling. J Sci Med Sports 2000;
3(4): 414-433.
43. Saunders PU, Pyne DB, Telford RD, et al. Factors affecting running economy in trained distance runners.
Sports Med 2004; 34(7): 465-485.

THE EFFECT OF STRENGTH TRAINING ON PERFORMANCE IN ENDURANCE ATHLETES
SYSTEMATIC REVIEW
44. Noakes TD. Lore of Running. 4th
ed. Champaign, IL, USA: Human Kinetics; 2003. p 19-21.
45. Berg K. Endurance training and performance in runners. Research limitations and unanswered questions.
Sports Med 2003; 33(1): 59-73.
46. Paavolainen LM, Nummela AT, Rusko HK. Neuromuscular characteristics and muscle power as
determinants of 5 km running performance. Med Sci Sports Exerc 1999; 31: 124-130.
47. Noakes TD. Implications of exercise testing for prediction of athletic performance: a contemporary
perspective. Med Sci Sports Exerc 1988; 20: 319 – 330.
48. Kraemer WJ, Ratamess NA. Fundamentals of resistance training: Progression and exercise prescription.
Med Sci Sports Exerc 2004; 36(4): 674-688.
49. Appleby B, Newton RU, Cormie P. Changes in strength over a 2-year period in professional Rugby Union
players. J Strength Cond Res 2012; 26 (9): 2538-2546.
50. Stone MH, Stone ME. Resistance training modes: a practical perspective. In: Cardinale, M., Newton, R. &
Nosaka, K, editors. Strength & Conditioning: Biological Principles and Practical Application. Oxford:
Wiley-Blackwell; 2011. p. 353.
51. Cormie P, McGuigan MR, Newton RU. Developing maximal neuromuscular power. Part 2 – training
considerations for improving maximal power production. Sports Med 2011; 41(2): 125-146.
52. Stensdotter AK, Hodges PW, Mellor R, et al. Quadriceps activation in closed and in open kinetic chain
exercise. Med Sci Sports Exerc 2003; 35(12): 2043-2047.
53. Cormie R, McGuigan MR, Newton RU. Adaptations in athletic performance after ballistic power versus
strength training. Med Sci Sports Exerc 2010; 42(8): 1582-1598.
54. Kaneko M, Fuchimoto T, Toji H, et al. Training effect of different loads on the force-velocity relationship
and mechanical power output in human muscle. Scand J Med Sci Sports 1983; 5(2): 50-55
55. Dymond C, Flanagan EP, Turner AP. The relationship between maximal strength and plyometric ability in
Rugby players. Rev Port Cein Desp 2011; 11 (Supple. 2).
56. Hawley, J. Molecular responses to strength and endurance training: are they incompatible? Appl Physiol
Nutr Metab 2009;34: 355 – 361.

THE EFFECT OF STRENGTH TRAINING ON PERFORMANCE IN ENDURANCE ATHLETES
SYSTEMATIC REVIEW

THE EFFECT OF STRENGTH TRAINING ON PERFORMANCE IN ENDURANCE ATHLETES
SYSTEMATIC REVIEW
Copyright © 2022 FDOKUMEN