Effect of friction stir processing on fatigue behavior of A356 alloy
15
Effect of friction stir processing on fatigue behavior of an investment cast Al–7Si–0.6 Mg alloy S. Jana a,c , R.S. Mishra a, * , J.B. Baumann b , G. Grant c a Missouri University of Science and Technology, Rolla, MO 65409, USA b The Boeing Company, St Louis, MO 63166, USA c Pacific Northwest National Laboratory, Richland, WA 99352, USA Received 23 June 2009; received in revised form 28 September 2009; accepted 10 October 2009 Available online 11 November 2009 Abstract Cast aluminum alloys in general show poor fatigue performance due to the presence of defects. Friction stir processing (FSP) can be used as a tool to enhance the mechanical properties of cast alloys by eliminating such defects. In the present study FSP led to a five times improvement in fatigue life of an investment cast Al–7Si–0.6 Mg hypoeutectic alloy. The reason for such an enhancement was linked to the closure of casting porosities, which acted as crack nucleation sites in the as cast condition. Porosities acted as notches in the as cast alloy and led to an order of magnitude higher crack growth rate. As FSP eliminated the porosities and refined the Si particles the crack growth rate dropped, due to elimination of the notch effect, together with increased crack path tortuosity. Finally, short crack behavior was noted in both the cast and FSP specimens. The critical crack length, where a transition from a short crack to a long crack behavior took place is related to the respective microstructural characteristic dimensions. Ó 2009 Acta Materialia Inc. Published by Elsevier Ltd. All rights reserved. Keywords: Aluminum alloys; Friction stir processing; Fatigue; Microstructure 1. Introduction In today’s world of rising energy costs cast aluminum alloys are finding increased application in the automotive and aerospace industries because of the associated weight savings and ease of processing. One of the most widely used cast aluminum alloys is Al–7Si–Mg with Mg contents rang- ing between 0.3 and 0.6 wt.%. This hypoeutectic alloy is popular because of its excellent castability, mechanical properties and corrosion resistance [1]. As a cast alloy, however, it is associated with various casting defects, e.g. porosities, oxides and inclusions. These defects are detri- mental to the fatigue properties of Al–7Si–Mg. Sonsino et al. [2] studied the effect of varying porosity levels on the fatigue strength of cast aluminum alloys. They observed that an increased degree of porosity always low- ered the fatigue strength. The level of reduction was higher in unnotched specimens compared with notched specimens, due to the masking effect of external notches. Another work by Zhang et al. [3] showed that alloy A356.2, without strontium modification, had a higher fatigue life due to reduced porosity. When two alloys with same level of strontium modification were compared that with the lower hydrogen content demonstrated the better fatigue life, indi- cating the obvious effect of porosity. Other researchers have concluded similarly that of all defects porosity has the most detrimental effect on fatigue properties, especially when the pore size and number exceed certain values [4–7]. It has been noted by various researchers that reducing the porosity size below 15–25 lm did not further improve fati- gue life for cast Al–7Si–Mg alloys [4,5]. When porosity remains below a critical level oxide inclu- sions become the next operational mechanism in the hierar- chy, since oxide films have been found to be less detrimental to fatigue life than pores [7,8]. Zhang et al. 1359-6454/$36.00 Ó 2009 Acta Materialia Inc. Published by Elsevier Ltd. All rights reserved. doi:10.1016/j.actamat.2009.10.015 * Corresponding author. Address: Department of Materials Science and Engineering, Missouri University of Science and Technology, B37 McNutt Hall, Rolla, MO 65409, USA. E-mail address: [email protected] (R.S. Mishra). www.elsevier.com/locate/actamat Available online at www.sciencedirect.com Acta Materialia 58 (2010) 989–1003
Transcript of Effect of friction stir processing on fatigue behavior of A356 alloy
Available online at www.sciencedirect.com
www.elsevier.com/locate/actamat
Acta Materialia 58 (2010) 989–1003
Effect of friction stir processing on fatigue behaviorof an investment cast Al–7Si–0.6 Mg alloy
S. Jana a,c, R.S. Mishra a,*, J.B. Baumann b, G. Grant c
a Missouri University of Science and Technology, Rolla, MO 65409, USAb The Boeing Company, St Louis, MO 63166, USA
c Pacific Northwest National Laboratory, Richland, WA 99352, USA
Received 23 June 2009; received in revised form 28 September 2009; accepted 10 October 2009Available online 11 November 2009
Abstract
Cast aluminum alloys in general show poor fatigue performance due to the presence of defects. Friction stir processing (FSP) can beused as a tool to enhance the mechanical properties of cast alloys by eliminating such defects. In the present study FSP led to a five timesimprovement in fatigue life of an investment cast Al–7Si–0.6 Mg hypoeutectic alloy. The reason for such an enhancement was linked tothe closure of casting porosities, which acted as crack nucleation sites in the as cast condition. Porosities acted as notches in the as castalloy and led to an order of magnitude higher crack growth rate. As FSP eliminated the porosities and refined the Si particles the crackgrowth rate dropped, due to elimination of the notch effect, together with increased crack path tortuosity. Finally, short crack behaviorwas noted in both the cast and FSP specimens. The critical crack length, where a transition from a short crack to a long crack behaviortook place is related to the respective microstructural characteristic dimensions.� 2009 Acta Materialia Inc. Published by Elsevier Ltd. All rights reserved.
Keywords: Aluminum alloys; Friction stir processing; Fatigue; Microstructure
1. Introduction
In today’s world of rising energy costs cast aluminumalloys are finding increased application in the automotiveand aerospace industries because of the associated weightsavings and ease of processing. One of the most widely usedcast aluminum alloys is Al–7Si–Mg with Mg contents rang-ing between 0.3 and 0.6 wt.%. This hypoeutectic alloy ispopular because of its excellent castability, mechanicalproperties and corrosion resistance [1]. As a cast alloy,however, it is associated with various casting defects, e.g.porosities, oxides and inclusions. These defects are detri-mental to the fatigue properties of Al–7Si–Mg.
Sonsino et al. [2] studied the effect of varying porositylevels on the fatigue strength of cast aluminum alloys. They
1359-6454/$36.00 � 2009 Acta Materialia Inc. Published by Elsevier Ltd. All
doi:10.1016/j.actamat.2009.10.015
* Corresponding author. Address: Department of Materials Science andEngineering, Missouri University of Science and Technology, B37 McNuttHall, Rolla, MO 65409, USA.
E-mail address: [email protected] (R.S. Mishra).
observed that an increased degree of porosity always low-ered the fatigue strength. The level of reduction was higherin unnotched specimens compared with notched specimens,due to the masking effect of external notches. Anotherwork by Zhang et al. [3] showed that alloy A356.2, withoutstrontium modification, had a higher fatigue life due toreduced porosity. When two alloys with same level ofstrontium modification were compared that with the lowerhydrogen content demonstrated the better fatigue life, indi-cating the obvious effect of porosity. Other researchershave concluded similarly that of all defects porosity hasthe most detrimental effect on fatigue properties, especiallywhen the pore size and number exceed certain values [4–7].It has been noted by various researchers that reducing theporosity size below 15–25 lm did not further improve fati-gue life for cast Al–7Si–Mg alloys [4,5].
When porosity remains below a critical level oxide inclu-sions become the next operational mechanism in the hierar-chy, since oxide films have been found to be lessdetrimental to fatigue life than pores [7,8]. Zhang et al.
rights reserved.

Table 1Chemical composition (wt.%) of F357 alloy.
Al Si Fe Cu Mg Ti Other
Balance 6.827 0.063 0.016 0.571 0.178 0.014
990 S. Jana et al. / Acta Materialia 58 (2010) 989–1003
[6] reported that oxide defects acted as crack initiation siteswhenever they were near or at the surface. Old oxide films,i.e. oxides present in the melt during pouring, are more del-eterious to fatigue life than new oxide films, i.e. oxides thatdevelop on the surface of the molten alloy during pouring.They further noted that new oxide films are generally notharmful unless they are folded and aggregated.
It is clear, therefore, that the presence of such castingdefects masks the intrinsic microstructure-based dynamicloading behavior of the cast alloy. With improvements incasting technology it is now possible to control the levelof defects in a cast component. As a result, an effect of var-ious microstructural features, such as secondary dendritearm spacing (SDAS), eutectic Si particle size/shape, etc.,on the fatigue behavior of cast Al–7Si–Mg alloy isapparent.
Increased SDAS in general causes a reduction in fatiguelife [9–12]. Another work, however, reported that fatiguelife decreased with an increase in SDAS up to 60 lm, butalso found that fatigue life increased with a further increasein SDAS for a modified A356 alloy [13]. Zhang et al.rightly pointed out [6] that the effect of SDAS was over-shadowed by the effect of porosity on fatigue life, since ahigh level of porosity is associated with a large SDAS.Lee et al. [14,15] have shown that the size and morphologyof eutectic Si particles have a distinct effect on the fatiguecrack growth characteristics of cast Al–Si–Mg alloys. Dec-ohesion of the particle/matrix interface was observed to bethe predominant mode of failure when the particle size wasin the range 1.5–2.5 lm. Cleavage was the main mode ofcrack growth when particles were larger, i.e. 3–9 lm. Forthe intermediate size range, i.e. 2.5–5.5 lm, both particlecleavage and decohesion were observed. A cast microstruc-ture with finer Si particles showed a slower crack growthrate compared with a microstructure with coarser Si parti-cles. Other studies have also reported a higher fatigue lifeassociated with porosity-free, strontium modified A356and A357 [13,16]. In summary, it is apparent that the poorfatigue performance of Al–7Si–Mg alloys is due to the pres-ence of casting defects and the cast microstructure itself.Therefore, any post-process treatment which could removecasting defects, break the dendritic structure and refine theSi particle size and aspect ratio would improve fatigue per-formance for this class of alloy.
Removal of casting porosities by hot isostatic pressing(HIPing) has been investigated for cast Al–7Si–Mg alloysand a generally beneficial influence on fatigue performancehas been observed [17,18]. A more detailed work foundthat HIPing significantly improved fatigue life of anA356.2 alloy when it was Sr modified. This technique, how-ever, had little effect on an unmodified alloy [19,20]. Itshould be noted that if a proper feeding practice is not fol-lowed, Sr modification leads to hydrogen pick-up and asso-ciated porosity.
In order to refine the cast microstructure, various mod-ifications and heat treatment techniques have also beendeveloped. Chemical modification is intended to refine
the size of Si particles by the addition of very smallamounts of sodium, strontium or antimony to the melt[21]. Of these three additives, strontium is most widely usedbecause of its effectiveness, but it suffers from increased gaspick-up and associated porosity [22]. Thermal modificationis done by holding the casting at the solution treatmenttemperature for a long time in order to spheroidize theeutectic Si particles [1]. Refinement of the coarse primaryaluminum phase has also been tried with the help of heattreatment. Post-process heat treatment at an extremelyhigh temperature of 577 �C for 8 min caused considerablerefinement of the aluminum dendrites in a semi-solid pro-cessed A356 alloy [23].
None of the above mentioned techniques can eliminateporosity effectively and redistribute refined Si particles uni-formly in the aluminum matrix. Recently, friction stir pro-cessing (FSP) has been used as another modificationmethod. This technique, based on the concept of frictionstir welding [24], involves insertion of a rotating tool intoa cast component. The tool is then traversed along thedesired path to cover the region of interest and thus modifythe local cast microstructure. Plastic deformation aroundthe tool results in elimination of dendritic microstructureand porosity. The effect of FSP on the fatigue propertiesof alloy A356 has been examined by Sharma et al.[25,26]. Cast A356 plates were friction stir processed attwo process parameter combinations in order to studythe fatigue properties. Two different tool geometries wereused in order to study the effect of this variation. Fatiguetests were carried under axial load at a stress ratio ofR = 0.1 and a frequency of 80 Hz. Results demonstrateda more than 80% increase in fatigue strength over the castalloy. The fatigue performance enhancement was attrib-uted to a reduction in Si particle size and porosity. As tothe effect of tool geometry on fatigue properties, no trendwas observed. Similar results for the effect of FSP on thefatigue properties of cast Al–7Si–0.3 Mg have beenobtained by other researchers [27,28].
In the present work the effect of FSP on a cast Al–7Si–0.6 Mg alloy was studied. The aim of this work was primar-ily to understand the fundamental reason(s) for fatigue lifeenhancement after FSP.
2. Experimental procedure
Investment cast F357 plates of �3.3 mm thickness wereused for the present study. The actual alloy composition isshown in Table 1. This alloy is a Be-free variant of alloyA357. The alloy was received without any heat treatment.A conical pin with a stepped spiral feature was used forFSP. The diameter of the tool shoulder was 12 mm,

Fig. 1. Cast + T6 micrograph showing porosity.
S. Jana et al. / Acta Materialia 58 (2010) 989–1003 991
whereas the tool pin had a height of 2 mm and a diameterof 4 mm at the mid-plane section. Various process param-eter combinations, i.e. varying the tool rotation rate andtraverse speeds, were tried in order to optimize the tensileproperties after FSP. Tensile properties were determinedusing mini tensile specimens obtained from the nuggetregion. The cast alloy had a yield strength (YS) of290 MPa, an ultimate tensile strength (UTS) of 300 MPaand elongation to failure of �1%. The friction stir pro-cessed alloy, which was processed at a tool rotation rateof 2236 rpm and travel speed of 2.33 mm s–1, showed a sim-ilar YS of 290 MPa, while the UTS and elongation to fail-ure for the friction stir processed alloy increased to330 MPa and 15%, respectively, as a result of (i) break-down of the dendritic microstructure and (ii) refinementof the eutectic Si particles. Standard bending fatigue spec-imens were machined from both friction stir processed andcast plates. The bending fatigue specimens had a totallength of 80 mm. The gauge length of the fatigue specimenwas �25 mm. The width at the big end was �15 mm, and itwas �10 mm at the short end. The thickness of the fatiguespecimens was kept between 1.6 and 3 mm. As the fatiguetest specimen width was much wider than the FSP tooldiameter, multi-pass runs were employed. A total of 10passes, with a distance of 3 mm between each pass, werecarried out in order to cover the region of interest. Oncethe first pass had been made subsequent passes were alwaysmade on the retreating side of the previous pass. Theretreating side is defined as the region, where tool rotationand tool traverse are opposite in direction. On the advanc-ing side these two are in same direction. Since the FSP toolhad a pin height of �2 mm, a cast region was present at thebottom of each friction stir processed plate. This cast areawas always removed before machining of any fatigue spec-imens. As a result, friction stir processed fatigue specimensalways consisted of the fully processed region. Machinedspecimens were then heat treated to peak strength. Thiswas done by carrying out solution treatment at 540 �Cfor 8 h, followed by room temperature water quenching.Artificial aging was done at 170 �C for 6 h. Samples werealways refrigerated after solution treatment in order toavoid any detrimental effect of delayed aging [21]. Speci-mens were finally ground to a 600 grit (16 lm) longitudinalsurface finish on both sides. Fatigue tests were conductedin an LFE 150 desktop bending fatigue machine at a stressratio (R) of �1 and a frequency of 30 Hz. A total of 19samples, 11 in the as cast condition and eight in the FSPcondition, were tested at various stress levels to generateS–N plots. The microstructure of cast and friction stir pro-cessed plates was examined with an optical microscope.ImageJ software was used for size and aspect ratio analysisof Si particles/porosity. Individual porosities/particles inthe micrograph were approximated to the nearest ellipseand were further quantified in terms of equivalent circulardiameter [ECD = (dmaj � dmin)1/2, where dmaj and dmin referto the major and minor axes of the ellipse]. The aspect ratiowas defined as dmaj/dmin. Optical microscopy was also
employed to capture crack initiation sites in the cast vs.FSP condition. In order to study crack growth one of eachof the cast and friction stir processed samples was tested atthe same stress level. These specimens were given a 1 lmsurface finish on both sides prior to the fatigue test. Spec-imen surfaces were examined with an optical microscopeat a fixed interval of cycles by intermittently stopping thetests. The fracture surfaces of the same specimens were alsoexamined by scanning electron microscopy (SEM).Another pair of samples was prepared with a 1 lm surfacefinish in order to capture the crack growth path in the castvs. FSP condition. This was done by optically observingthe specimen surfaces after failure.
3. Results and discussion
3.1. Microstructure evolution
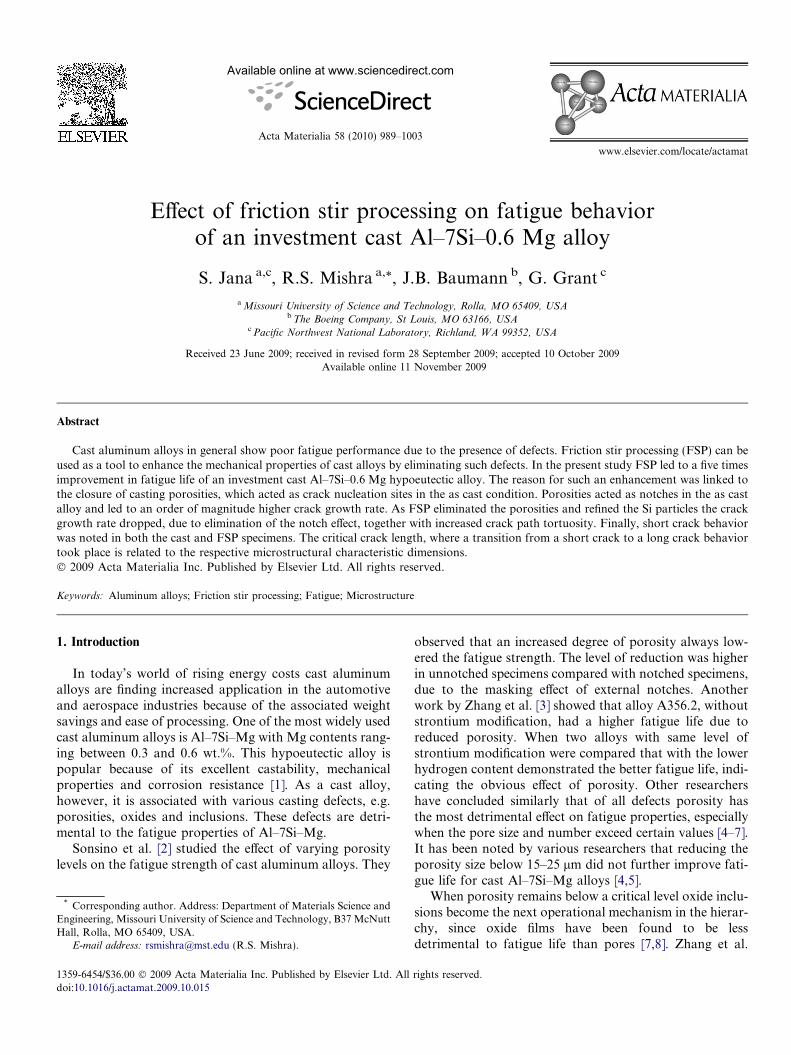
Fig. 1 shows the as cast T6 optical micrograph at lowmagnification. The typical dendritic microstructure withminimal porosity was observed in the as cast material.The acicular nature of the Si particles in the interdendriticregions became evident at higher magnification, as shownin Fig. 2. Images were obtained in the as polished condi-tion, since this better delineated the porosity, as well asSi particles. Standard metallographic procedures indicatedthe porosity volume fraction to be �0.2%. Fig. 3a showsthe frequency distribution of porosity size in the as castsample. The mean porosity size was �10 lm, whereas thelargest porosity was 196 lm, i.e. almost 20 times biggerthan the average defect size. The frequency distributionof the porosity aspect ratio (Fig. 3b) showed a mean of1.88, and the maximum value was 16.0 in the as cast mate-rial. The absence of defects with an aspect ratio close to 1may indicate that these defects are solidification shrinkageporosities rather than gas porosities. Fig. 4a and b showsthe frequency distribution of Si particle size and shape inthe cast + T6 condition. It is evident from both Figs. 3and 4 that the size range of porosities and Si particles inthe as cast alloy is quite large. Further, it is quite possible
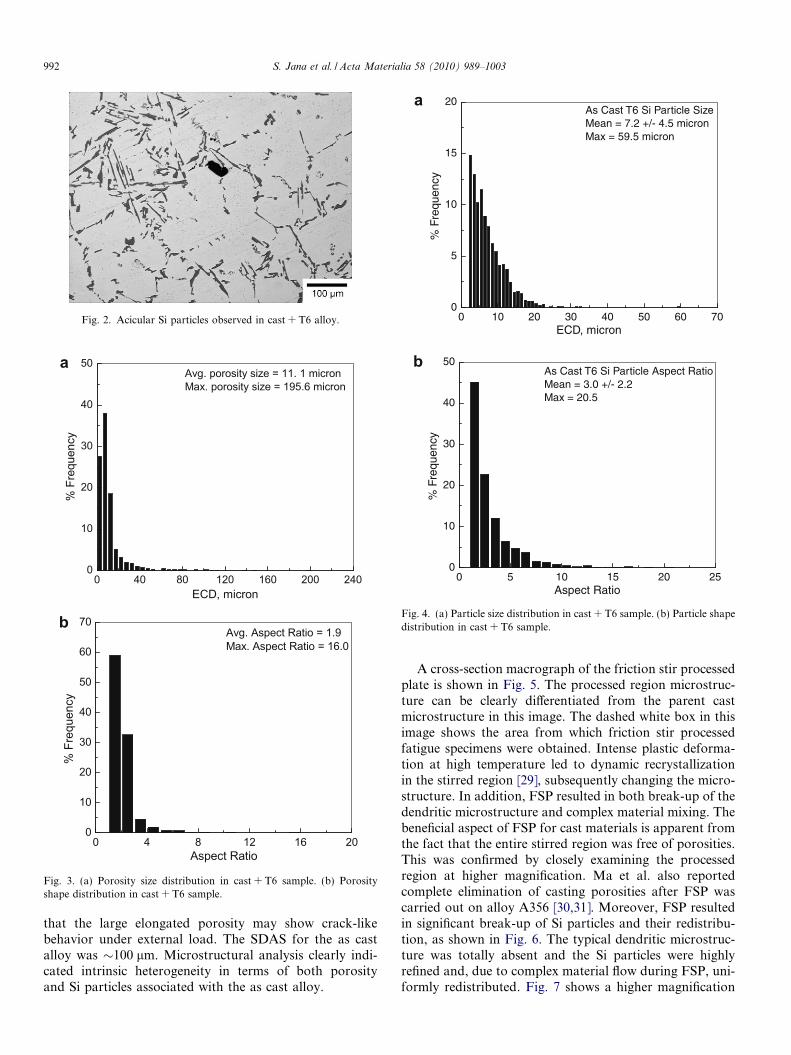
Fig. 2. Acicular Si particles observed in cast + T6 alloy.
0 40 80 120 160 200 2400
10
20
30
40
50Avg. porosity size = 11. 1 micronMax. porosity size = 195.6 micron
% F
requ
ency
ECD, micron
0 4 8 12 16 200
10
20
30
40
50
60
70Avg. Aspect Ratio = 1.9Max. Aspect Ratio = 16.0
% F
requ
ency
Aspect Ratio
a
b
Fig. 3. (a) Porosity size distribution in cast + T6 sample. (b) Porosityshape distribution in cast + T6 sample.
0 10 20 30 40 50 60 700
5
10
15
20As Cast T6 Si Particle SizeMean = 7.2 +/- 4.5 micronMax = 59.5 micron
% F
requ
ency
ECD, micron
0 5 10 15 20 250
10
20
30
40
50As Cast T6 Si Particle Aspect RatioMean = 3.0 +/- 2.2Max = 20.5
% F
requ
ency
Aspect Ratio
a
b
Fig. 4. (a) Particle size distribution in cast + T6 sample. (b) Particle shapedistribution in cast + T6 sample.
992 S. Jana et al. / Acta Materialia 58 (2010) 989–1003
that the large elongated porosity may show crack-likebehavior under external load. The SDAS for the as castalloy was �100 lm. Microstructural analysis clearly indi-cated intrinsic heterogeneity in terms of both porosityand Si particles associated with the as cast alloy.
A cross-section macrograph of the friction stir processedplate is shown in Fig. 5. The processed region microstruc-ture can be clearly differentiated from the parent castmicrostructure in this image. The dashed white box in thisimage shows the area from which friction stir processedfatigue specimens were obtained. Intense plastic deforma-tion at high temperature led to dynamic recrystallizationin the stirred region [29], subsequently changing the micro-structure. In addition, FSP resulted in both break-up of thedendritic microstructure and complex material mixing. Thebeneficial aspect of FSP for cast materials is apparent fromthe fact that the entire stirred region was free of porosities.This was confirmed by closely examining the processedregion at higher magnification. Ma et al. also reportedcomplete elimination of casting porosities after FSP wascarried out on alloy A356 [30,31]. Moreover, FSP resultedin significant break-up of Si particles and their redistribu-tion, as shown in Fig. 6. The typical dendritic microstruc-ture was totally absent and the Si particles were highlyrefined and, due to complex material flow during FSP, uni-formly redistributed. Fig. 7 shows a higher magnification

Fig. 5. Cross-section of friction stir processed cast plate. The dashed rectangle shows the area from which friction stir processed fatigue specimens wereobtained.
Fig. 6. Interface between cast and FSP region.
Fig. 7. Si particles after FSP.
0 5 10 15 20 25 30 35 400
10
20
30
40
50FSP T6 Si Particle SizeMean = 2.8 +/- 2.0 micronMax = 29.2 micron
% F
requ
ency
ECD, micron
40
60
80
100FSP T6 Si Aspect RatioMean = 1.5 +/- 0.5Max = 11.2
% F
requ
ency
a
b
S. Jana et al. / Acta Materialia 58 (2010) 989–1003 993
image of the nugget to illustrate the extent of Si particlerefinement after FSP. Table 2 summarizes the details ofSi particle size and shape before and after FSP, demon-strating that FSP led to a more than 50% reduction in par-ticle size and shape in terms of both mean and maximumvalues. Also notable were the lower standard deviation val-ues associated with the FSP microstructure. The frequency
Table 2Influence of FSP on Si particle size and shape.
Material Particle size (lm) Particle aspect ratio
Mean Maximum Mean Maximum
Cast + T6 7.2 ± 4.5 59.5 3.0 ± 2.2 20.5FSP + T6 2.8 ± 2.0 29.2 1.5 ± 0.5 11.2
distribution plots of Si particle size and shape after FSP areshown in Fig. 8a and b. Further, particle size and distribu-tion were similar throughout the processed cross-section.These results indicate that multiple passes cannot refineSi particles beyond a certain limit, which is in agreementwith reports by other researchers [32].
3.2. Fatigue properties
Fig. 9 shows a S–N plot comparing the fatigue proper-ties of the cast and FSP conditions for a completely
0 3 6 9 12 150
20
Aspect Ratio
Fig. 8. (a) Particle size distribution in FSP + T6 condition. (b) Particleshape distribution in FSP + T6 condition.
103 104 105 106 107 1080
50
100
150
200
250
300
R = -1
Cast + T6 FSP + T6
Max
imum
Ben
ding
Stre
ss, M
Pa
No. of Cyles to failure
Fig. 9. Effect of maximum bending stress (S) on number of cycles tofailure (N).
994 S. Jana et al. / Acta Materialia 58 (2010) 989–1003
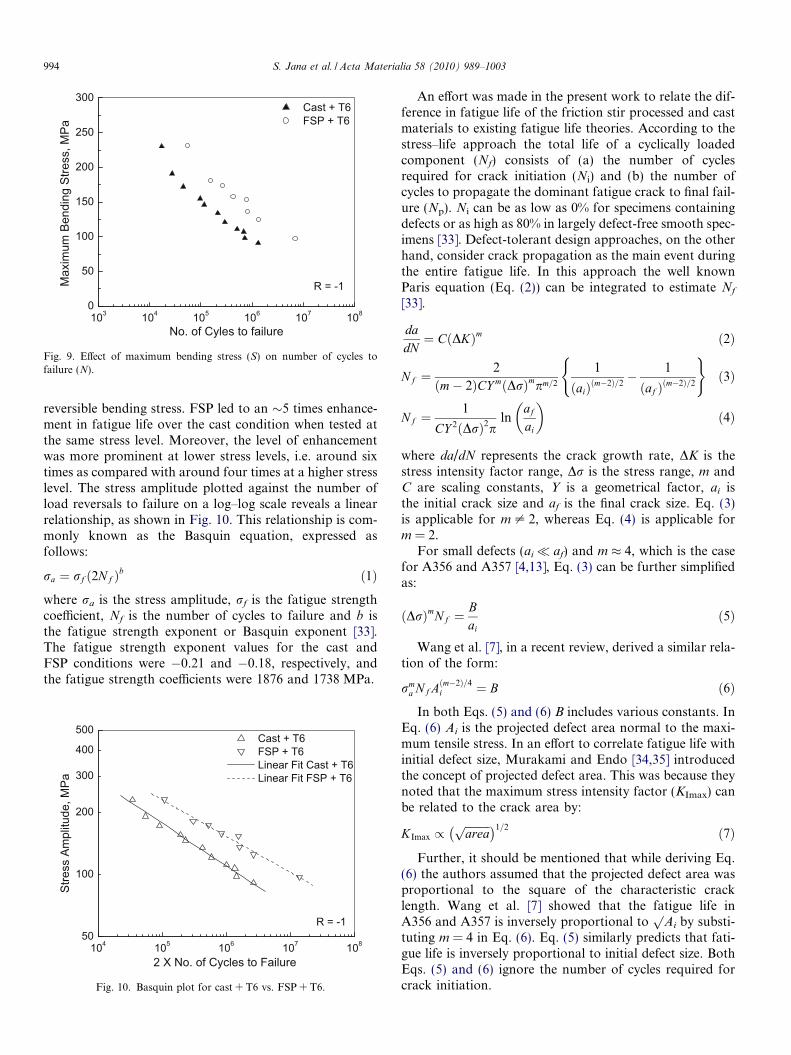
reversible bending stress. FSP led to an �5 times enhance-ment in fatigue life over the cast condition when tested atthe same stress level. Moreover, the level of enhancementwas more prominent at lower stress levels, i.e. around sixtimes as compared with around four times at a higher stresslevel. The stress amplitude plotted against the number ofload reversals to failure on a log–log scale reveals a linearrelationship, as shown in Fig. 10. This relationship is com-monly known as the Basquin equation, expressed asfollows:
ra ¼ rf ð2Nf Þb ð1Þwhere ra is the stress amplitude, rf is the fatigue strengthcoefficient, Nf is the number of cycles to failure and b isthe fatigue strength exponent or Basquin exponent [33].The fatigue strength exponent values for the cast andFSP conditions were �0.21 and �0.18, respectively, andthe fatigue strength coefficients were 1876 and 1738 MPa.
104 105 106 107 10850
100
200
300
400
500
R = -1
Cast + T6 FSP + T6 Linear Fit Cast + T6 Linear Fit FSP + T6
Stre
ss A
mpl
itude
, MPa
2 X No. of Cycles to Failure
Fig. 10. Basquin plot for cast + T6 vs. FSP + T6.
An effort was made in the present work to relate the dif-ference in fatigue life of the friction stir processed and castmaterials to existing fatigue life theories. According to thestress–life approach the total life of a cyclically loadedcomponent (Nf) consists of (a) the number of cyclesrequired for crack initiation (Ni) and (b) the number ofcycles to propagate the dominant fatigue crack to final fail-ure (Np). Ni can be as low as 0% for specimens containingdefects or as high as 80% in largely defect-free smooth spec-imens [33]. Defect-tolerant design approaches, on the otherhand, consider crack propagation as the main event duringthe entire fatigue life. In this approach the well knownParis equation (Eq. (2)) can be integrated to estimate Nf
[33].
dadN¼ CðDKÞm ð2Þ
Nf ¼2
ðm� 2ÞCY mðDrÞmpm=2
1
ðaiÞðm�2Þ=2� 1
ðaf Þðm�2Þ=2
( )ð3Þ
Nf ¼1
CY 2ðDrÞ2pln
af
ai
� �ð4Þ
where da/dN represents the crack growth rate, DK is thestress intensity factor range, Dr is the stress range, m andC are scaling constants, Y is a geometrical factor, ai isthe initial crack size and af is the final crack size. Eq. (3)is applicable for m – 2, whereas Eq. (4) is applicable form = 2.
For small defects (ai� af) and m � 4, which is the casefor A356 and A357 [4,13], Eq. (3) can be further simplifiedas:
ðDrÞmNf ¼Bai
ð5Þ
Wang et al. [7], in a recent review, derived a similar rela-tion of the form:
rma Nf Aðm�2Þ=4
i ¼ B ð6ÞIn both Eqs. (5) and (6) B includes various constants. In
Eq. (6) Ai is the projected defect area normal to the maxi-mum tensile stress. In an effort to correlate fatigue life withinitial defect size, Murakami and Endo [34,35] introducedthe concept of projected defect area. This was because theynoted that the maximum stress intensity factor (KImax) canbe related to the crack area by:
KImax /ffiffiffiffiffiffiffiffiffiareap� �1=2 ð7Þ
Further, it should be mentioned that while deriving Eq.(6) the authors assumed that the projected defect area wasproportional to the square of the characteristic cracklength. Wang et al. [7] showed that the fatigue life inA356 and A357 is inversely proportional to
pAi by substi-
tuting m = 4 in Eq. (6). Eq. (5) similarly predicts that fati-gue life is inversely proportional to initial defect size. BothEqs. (5) and (6) ignore the number of cycles required forcrack initiation.

S. Jana et al. / Acta Materialia 58 (2010) 989–1003 995
The present work found that porosities observed in thecast microstructure were responsible for crack nucleation,as shown by the image of a cast fatigue sample surface inFig. 11a. Cracks could be seen emanating from the cornersof porosities because of the high stress concentrations asso-ciated with these regions. Only those cracks that werealmost perpendicular to the loading direction propagatedand became dominant; others did not grow beyond a cer-tain extent. One such non-propagating crack is shown byan arrow in Fig. 11a. Fig. 11b, which was obtained at alower magnification to record a larger area, confirms theearlier observation. The fatigue life of the cast alloy istherefore governed by the size of such porosities. As theprevious analysis showed, the size of the largest pore ratherthan the mean pore size would be more influential in deter-mining the total fatigue life. Support for such an observa-tion has been obtained from work done by otherresearchers, who were able to show that the fatigue life ofcast Al–7Si–Mg components increased with decreasingpore size until a particular value was reached; beyond thatcrack initiation from other microstructural features becameoperative [4,5]. Similarly, in the present study no crack ini-tiation was observed with comparatively smaller porositiesin the cast fatigue specimens. Since FSP results in the clo-sure of porosities, the fatigue life improves because of areduction in initial defect size. In the case of friction stirprocessed microstructure the cracks were initiated at theSi particle/matrix interface, as noted in Fig. 11c. An arrowshows the advancement of such cracks towards both sidesfrom the particle/matrix interface. It was further observedthat comparatively bigger Si particles were the site for
Fig. 11. Crack initiation sites, cast + T6 vs. FSP + T6. (a) Crack initiating at pCracks propagating normal to loading direction in cast + T6 condition. (c) C
crack nucleation in the case of the friction stir processedmaterial.
It is therefore likely that the observed fatigue life of boththe cast and friction stir processed material can be linked tothe respective initial critical defect size, with the assump-tion that fatigue life is governed by crack growth. The crit-ical defect size in the cast fatigue specimens was determinedby measuring the size of those porosities which showedcracks emanating from the corners. In the case of frictionstir processed fatigue specimens the size of Si particlesshowing similar features was determined. This analysiswas carried out on samples which were tested at a stresslevel of �150 MPa. It should further be noted that the sizeof such microstructural features was determined by animage analysis technique. As mentioned earlier, in thismethod the size of any microstructural feature is deter-mined by approximating it to its nearest ellipse in termsof area. ECD [=
p(dmaj � dmin)] is finally used to represent
the size of an ellipse, where dmaj and dmin are the major andminor diameters. Therefore, ECD is equivalent to
pAi.
The results are shown in Fig. 12a and b. The statisticalaverage of the size of defects (porosities) responsible forfailure in the cast + T6 sample was found to be 47.1 lm.In the case of the FSP + T6 sample this value (Si particlesize) was 9.4 lm. Moreover, the size ratio of the mean crit-ical porosities to mean Si particles was found to be �5.0.This is the same factor by which the fatigue life in theFSP condition improved over that of the cast alloy. Itshould further be noted that the mean size of porositiesand Si particles responsible for failure are higher than theaverage sizes of porosities and Si particles observed in the
orosity in cast + T6 condition. Arrow shows a non-propagating crack. (b)rack initiating at the particle/matrix interface in FSP + T6 specimen.

0 50 100 150 200 250
20
40
60
80
100
Cast + T6
% F
requ
ency
ECD, micron
cracked porosity, mean = 47.1 micron total porosity, mean = 11.1 micron
0 5 10 15 20 25 30 35 400
10
20
30
40
50
FSP + T6
% F
requ
ency
ECD, micron
Total particles, Mean = 3.9 micron Cracked particles, Mean = 9.4 micron
(a) (b)
Fig. 12. Defect size comparisons. (a) Cast + T6 vs. (b) FSP + T6.
996 S. Jana et al. / Acta Materialia 58 (2010) 989–1003
cast and friction stir processed samples, respectively(Fig. 12a and b compared with Figs. 3a and 8a). Thisobservation, therefore, supports the fact that fatigue lifeis governed by the size of the larger feature.
3.3. Crack profile: cast vs. FSP
Post-failure analysis of the fatigue sample surfacesrevealed that cracks in the cast sample moved through bothaluminum dendrites as well as through interdendriticregions, as shown in Fig. 13. A crack initiated at one poros-ity and then propagated towards both sides. Cracks pre-ferred to move in a straight line inside the a-Al dendrites.When a crack encountered Si particles in the interdendriticregion the crack path became tortuous. Both particle/matrix decohesion and particle fracture were noted as thecrack interacted with Si particles throughout its growth.Comparison of the size of failed Si particles along the crackpath demonstrated that, in general, comparatively largerparticles fractured, whereas smaller particles showed parti-cle/matrix decohesion. The transition from particle decohe-sion to particle fracture occurred at �10 lm. Lee et al. [15]compared fatigue crack propagation through microstruc-tures exhibiting both fine and coarse Si morphologies incast Al–Si alloys at the same stress level and stress ratio.They observed that finer Si particles present in the modifiedalloy were resistant to cracking while coarser particles inthe unmodified alloy cracked. They reasoned that the frac-ture strength of the Si particles was inversely proportional
Fig. 13. Crack profile, cast + T6 conditi
to their size, with the result that fine Si particles are muchstronger than the critical stress required for particle crack-ing. Subsequently, fine particles go through decohesion,whereas bigger ones fracture. Further, the propensity forparticle cracking increases at higher crack driving forces,which increases with crack length at a fixed applied exter-nal stress. The present study found that cracks in the initialstage preferred to move through the a-Al dendritic regioninstead of interacting with Si particles. Fig. 14a shows thesurface of a cast fatigue sample after 5000 cycles. Cracksemanating from porosities propagating through the a-Aldendrite are clear. When the crack was forced to interactwith Si particles, particle decohesion occurred, except forbigger and irregularly shaped particles. One such bigcracked particle is indicated by the arrow in Fig. 14b. Typ-ically particles >10 lm are termed ‘big’ in this work. Gallet al. [36], in their work on the fatigue of alloy A356,observed that the crack growth path changed based onthe crack length. They noted that near the crack initiatingdefect when the crack length was small the crack primarilygrew straight through the a-Al dendrites, avoiding theeutectic regions. Particle decohesion occurred only whenthe crack was forced to interact with eutectic regions.The alloy used in their study was Sr modified and thereforehad finer Si particles, thus, particle decohesion was themost common result. They further observed that as thecrack length increased the particle failure morphologychanged from decohesion to cracking. At this stage thecrack preferred to move mainly through large irregularly
on. Arrow shows loading direction.

Fig. 14. Interaction of crack with microstructure in cast + T6 condition. (a) Crack moving preferably through the a-Al dendrite. (b) Relatively larger Siparticle fracturing in the crack path.
S. Jana et al. / Acta Materialia 58 (2010) 989–1003 997
shaped Si particles because these regions provided the pathof least resistance. A similar observation was made in thepresent case for the cast alloy.
The crack profile in FSP conditions is shown in Fig. 15.It differs from the cast conditions in two respects: (i)increased crack meandering, and (ii) increased crackbranching. Since FSP leads to the elimination of dendriticstructure, Si particles were distributed almost uniformlythroughout the a-Al matrix. As a consequence, cracks ini-tiated at the particle/matrix interface in FSP conditionswere forced to interact with Si particles. The mode of par-ticle failure was again governed by particle size at an earlycrack growth stage when the size of the crack was compar-atively short. Fig. 15 indicates that most particles debond-ed, since they were small; only big particles, whose numberswere limited, fractured. Literature data suggest that fatiguecracks experience significant growth retardation when theyare forced to propagate gradually along the particle/matrixinterface [37]. Growth retardation occurs because the effec-tive crack length increases as the crack grows around a net-work of particles within a ductile matrix. In addition, atortuous crack path forces the crack tip to grow underunfavorable local mixed-mode loading conditions, ratherthan under a favorable mode I driving force. Changes inthe crack growth pattern can also be observed in Fig. 15.
Fig. 15. Crack profile in FSP + T6 condition. The crack is seen to move alondebonding or cleavage based on particle size. Arrow indicates faster crack groobserved.
The crack moved in a zigzag manner along the particle/matrix interface for most of its course, but at the right-hand corner of the image the crack is seen to move in analmost straight line, as indicated by the arrows. Locallythat particular region is seen to have a lower number den-sity of Si particles, causing the change in the crack growthpattern. In the cast condition, after nucleating at porosities,cracks moved through the a-Al dendrites almost linearly;avoiding Si particles. This results in a much higher crackgrowth rate. Since FSP distributed the Si particles, fatiguecracks were compelled to move along the particle/matrixinterface and therefore grew at a reduced crack growthrate. This was reflected in the higher fatigue life in FSP con-ditions. Increased crack branching was also associated withthe crack profile in FSP conditions. As noted by Lee et al.,this phenomenon leads to a reduction in crack growth byincreasing the total crack length while reducing the effectivestress intensity at the crack tip when the crack branched[15].
3.4. Study of crack growth: FSP vs. cast
The crack growth study was conducted at rmax/ry = 0.6(rmax = 174 MPa) for R = �1 conditions for both the FSPand cast fatigue samples. The initiation and growth of
g the particle/matrix interface. The failure mode of the particle is eitherwth region due to lower particle number density. Crack branching is also

998 S. Jana et al. / Acta Materialia 58 (2010) 989–1003
cracks was recorded optically by stopping the test intermit-tently. Total life of the FSP specimen was 2.609 � 105
cycles. At the end of 20,000 cycles, when testing of theFSP specimen was stopped for the first time, crack initiationoccurred at multiple sites, as shown in Fig. 16a and b.Therefore, the number of cycles for crack initiation (Ni) rep-resents only 7.6% of the total life. This number could prob-ably be even lower, since considerable crack growth wasobserved, as shown in Fig. 16b. This observation thus vali-dates our earlier assumption of crack growth being themajor life determining event. Although Fig. 16a seems toshow that the crack initiated in the a-Al matrix, Fig. 16bclearly indicates that the particle/matrix interface was thecrack initiation site. In both cases cracks nucleated at thespecimen edge. Moreover, Fig. 16b shows that after nucle-ation cracks preferred to move along the grain boundaries,debonding Si particles whenever they came into contactwith them. Although the crack traversed in an intergranular
Fig. 16. Crack initiation and growth in FSP + T6 condition. (a) Crack initiatmatrix interface after 20,000 cycles. A crack branching along the grain boundaarrow indicates a nucleation site, the red arrow shows the crack tip position ainterface away from the specimen edge cracking at later stages. (f) Crack extens(For interpretation of the references to colours in this figure legend, the reade
manner, the dominant crack moved in a direction normal tothe main loading axis. The dominant crack profile is high-lighted in Fig. 16c by a black arrow, indicating the initiationsite, and a red arrow, indicating the location of the crack tipat the end of 20,000 cycles. The position of the crack tip wasthereafter recorded every 20,000 cycles until the specimenfailed. As the number of cycles increased, more cracks initi-ated at multiple locations, and already nucleated crack tipsadvanced. One such crack, which nucleated between 20,000and 40,000 cycles, is shown in Fig. 16d; it moved at almost45� to the loading axis. This indicates that cracks at thisstage were going through stage I or a near-threshold regimeof crack growth. As the number of cycles further increased,the number of newly nucleated cracks also increased. Theparticle/matrix interface away from the specimen edgestarted cracking, as shown in Fig. 16e. As new cracksappeared at various locations existing cracks grew longer.Growth of the same crack between two observations is
ing in the a-Al matrix after 20,000 cycles. (b) Crack initiation at particle/ry can also be observed. (c) The dominant crack is highlighted (the black
fter 20,000 cycles). (d) Crack showing stage I behavior. (e) Particle/matrixion between two observations. The crack tip shown in (c) has grown by Da.r is referred to the web version of this paper.)

S. Jana et al. / Acta Materialia 58 (2010) 989–1003 999
shown in Fig. 16f. The position of the crack tip at the end of20,000 cycles (indicated by the red arrow in Fig. 16c) movedby Da to a new position at the end of 60,000 cycles, as shownin Fig. 16f, where Da represents the crack extension betweentwo cycles. Thus it was possible to measure the crackgrowth rate. Further, the nature of the crack profiledepended primarily on the crack length. Although newlyinitiated cracks were most often inclined at 45� to the load-ing direction, old cracks were growing at almost 90� to thetensile axis. These cracks became dominant in the laterstages of specimen life. Fig. 16f shows such a dominantcrack. Final failure was associated solely with this crack.The growth rate of fatigue cracks is usually described bythe Paris law (Eq. (2)). Eq. (2) can be further expanded as[33]:
dadN¼ CðDKÞm ¼ C Y Dr
ffiffiffiffiffiffipap� �m ¼ CY mðDrÞmpm=2
ffiffiffiap� �m
ð8Þwhere da/dN indicates crack growth increment and DK isthe stress intensity factor range, which is related to thestress range Dr as shown in Eq. (8), Y is a geometrical fac-tor, a is the crack length and C and m are scaling constants.For a constant amplitude fatigue test da/dN should, there-fore, be a function of crack length, assuming Y to be a con-stant. It is possible, therefore, that a few cracks would growat a faster pace than others when subjected to the samestress conditions, depending on their respective cracklengths. This was found to be the case in the present study.Relatively small cracks grew at a slower speed and in a fewcases did not advance at all during the later stages of thefatigue test. In the present work crack growth incrementswere calculated from optical images and subsequentlycrack growth rates were determined. When average crackgrowth rate data was plotted against
pa on a log–log scale
a typical crack growth curve was obtained, as shown inFig. 17. The crack growth rate remained a linear functionofp
a between 6 � 104 and 2.4 � 105, thus this region
1.010.03-E11E-6
1E-5
1E-4 FSP + T6 linear fit for crack growth data
Aver
age
(da/
dN),
mm
/cyc
le
(Crack length)1/2, m1/2
Fig. 17. Crack growth curve in FSP + T6 condition.
corresponds to the Paris regime. Below the Paris regimethe crack growth rate is oscillatory, whereas above it thereis a precipitous rise in crack growth rate with increasingp
a. The increase in crack growth rate, however, is not soapparent in the upper regime due to a lack of data points.The slope in the Paris regime was �2. In general, geomet-rical models based on crack tip displacement predict a Parisexponent (m) of 2, whereas damage accumulation modelsbased on dislocation plasticity predict m = 4 [33]. As notedpreviously, published research shows m � 4 for A356 andA357 alloys [4,13]. As shown in Fig. 17, where crackgrowth behavior is typical of the Paris regime at around60,000 cycles, there should be similar changes associatedwith the crack growth profile. During stage I crack growthoccurs predominantly by single shear in the direction ofprimary slip systems and therefore leads to a zigzag crackpath. On the other hand, stage II in general involvesduplex slipping, resulting in a crack path normal to thefar-field tensile axis [33]. Such changes in the crack growthpath were observed in the present study, as shown inFig. 18a–e. The crack, which was at an angle of almost45� to the tensile axis at the end of 40,000 cycles(Fig. 18a), gradually changed its path. At the end of80,000 cycles a slight deviation from the 45� line was appar-ent. This change became more evident at 100,000 cycles,and after 120,000 cycles the same crack was seen to prop-agate almost perpendicularly to the tensile axis. The impli-cation of oscillatory crack growth during the initiationstage is discussed in a later section.
The cast fatigue specimens showed a life of 45,500cycles. As expected, cracks were noted to have originatedat porosities when the test was stopped after the first 5000cycles, which implies a 10% or lower crack initiation per-iod. In fact, several studies that have directly observedcracks in defect-containing specimens have suggested thatcrack initiation starts at or soon after the first stress cyclebecause the magnitude of cyclic stress and, therefore, thevalue of cyclic strain at the tip of a defect is very high[38–40]. When average crack growth rate data was plottedagainst
pa a crack growth curve similar to Fig. 17 was
obtained. For comparison, both curves are showntogether in Fig. 19, in which it is evident that the averagecrack growth rate is close to one order of magnitudehigher in the cast + T6 condition as compared with theFSP + T6 condition. Further, the Paris exponent m is�4 in the cast + T6 condition, therefore, a higher crackgrowth rate together with a higher Paris exponent resultedin the shorter fatigue life observed in the cast + T6 condi-tion. Porosities present in the cast specimen acted asnotches and, therefore, resulted in a higher crack growthrate and lower fatigue life. Evidence for such behavior isavailable in fatigue textbooks as well as in published stud-ies [33]. Taylor and Knott [41], in a study of fatigue of castnickel–aluminum bronze, reported easy crack initiation atporosities and a subsequent high growth rate related tothe effects of stress concentration and microstructure.Fig. 19 further indicates that a very short Paris regime is

Fig. 18. Change in crack growth path as a function of fatigue life. (a) After 40,000 cycles. (b) After 60,000 cycles. (c) After 80,000 cycles. (d) After 100,000cycles. (e) After 120,000 cycles. The crack which was growing at 45� to the tensile axis is now almost at 90� to the loading direction. Si particles adjacent tothe crack have been marked for easier identification of the crack extension event.
1.010.03-E11E-6
1E-5
1E-4
1E-3 FSP + T6 CAST + T6
Aver
age
(da/
dN),
mm
/cyc
le
(Crack length)0.5, m1/2
Fig. 19. Crack growth rate curve, cast + T6 vs. FSP + T6.
1000 S. Jana et al. / Acta Materialia 58 (2010) 989–1003
operative in the case of the cast + T6 specimen, i.e. on theright-hand side of the dashed line. In general, stage II orthe Paris regime of fatigue crack growth leads to the for-mation of fatigue ‘striations’ in many engineering alloys.For cyclic loads in the Paris regime of fatigue crackadvance it has been found that the spacing between adja-cent striations correlates with the experimentally measuredaverage crack growth rate per cycle [33]. Therefore, varia-tions in striation spacing is expected on fracture surfacesbetween the cast and FSP specimens, since they showtwo entirely different crack growth rates. Qualitatively,striation spacing should be coarser in the case of a castalloy, whereas a FSP specimen should show fine striations.Fractographic observations confirmed this trend. Fig. 20aand b shows certain regions on the fracture surface of an
FSP specimen at low and high magnification. Characteris-tic striations with an average spacing of 0.5 lm are clearlyvisible in Fig. 20b. On the other hand, the cast specimenfracture surface showed the presence of much coarser stri-ations with a spacing of �1 lm, as shown in Fig. 20d ande. The regions, where final fracture took place also differeddepending on the specimen type. Whereas a dimpled rup-ture morphology was prominent in the FSP specimen,cleavage fracture was associated with the cast specimen(Fig. 20c and f). This distinction is a result of the benefi-cial effect of FSP on the ductility of the alloy. It was alsopossible to calculate total crack length from crack incre-ment data. The FSP specimen showed a final crack sizealmost twice that of the cast specimen, as shown inFig. 21, where crack length has been plotted against thenumber of cycles to failure. Although the initial cracklength was 0 for FSP conditions, the cast specimen hadporosities acting as cracks from the outset. Crack lengthincreased at a faster rate in the cast condition than inthe FSP condition due both to the stress concentrationeffect of porosities and to the higher Paris exponent asso-ciated with the cast condition. The higher final cracklength in FSP conditions may be due to the nature ofcrack advancement along the particle/matrix interface,which leads to increased crack tortuosity and, therefore,a longer crack length. Fig. 22 shows the relationshipbetween crack growth rate as a function of fatigue lifein the cast and FSP conditions. The crack growth ratein both the cast and FSP conditions oscillated duringthe first few hundred cycles, although this oscillatorybehavior is more pronounced in the case of the cast alloy.The crack growth rate accelerated thereafter in both con-ditions. The crack growth rate was at least five timeshigher in the cast condition than the FSP counterpart,

Fig. 20. Comparison of SEM fractographs, FSP + T6 (a–c) vs. cast + T6 (d–f). (b) Fine striations in FSP + T6 condition. (c) Dimpled rupturemorphology is evident in FSP + T6 sample. (e) Coarse striations in cast + T6 condition. (f) Cleavage mode of fracture in cast + T6 sample.
0.0 5.0x10⁴ 1.0x10⁵ 1.5x10⁵ 2.0x10⁵ 2.5x10⁵ 3.0x1050
500
1000
1500
2000
2500
3000
3500 FSP T6 CAST T6
Cra
ck le
ngth
, mic
ron
# of Cycles
Fig. 21. Crack length vs. number of cycles, cast + T6 vs. FSP + T6.
103 104 105 1060
20
40
60
80
100
120
140 CAST + T6 FSP + T6
Cra
ck G
row
th ra
te, n
m/c
ycle
# of Cycles
Fig. 22. Crack growth rate vs. number of cycles, cast + T6 vs. FSP + T6.
S. Jana et al. / Acta Materialia 58 (2010) 989–1003 1001
which once again explains the higher fatigue life of theFSP specimens. The importance of this oscillatory growthbehavior is discussed in the following section.
3.5. Short crack behavior
As noted above, both the cast and FSP specimens dem-onstrated oscillatory crack growth behavior during the firstfew hundred cycles due to the ‘short’ nature of the initiat-ing fatigue flaws. Short cracks can be broadly classified as[33] (i) mechanically small, when size of the crack is compa-rable with the plastic zone size, (ii) microstructurally small,when the crack size is comparable with the scale of themicrostructural characteristic dimensions (MCD), (iii)physically small, when the crack size is significantly largerthan the MCD or plastic zone size but has a length of
around a millimeter or two or (iv) chemically small, whenthe crack size is nominally amenable to linear elastic frac-ture mechanics (LEFM) analyses but shows apparentanomalies in propagation rate due to the effect of environ-mental stress corrosion fatigue on crack dimension. It iswell documented that short cracks undergo transient accel-erated growth followed by retardation, resulting in oscilla-tory behavior below a critical crack size; but beyond thiscritical size crack growth rate data merges with long crackdata [33,42–45]. In general, retardation occurs wheneverthe crack tip encounters an obstacle in its path, whichcan be a grain boundary or a particle, depending on the sit-uation. The so-called anomaly related to the growth ofshort fatigue cracks lies in this retardation. According toLEFM an increase in crack length should result in a higherDK for a fixed far-field cyclic stress, therefore, a higher

1002 S. Jana et al. / Acta Materialia 58 (2010) 989–1003
crack growth rate is expected. This is obviously not the casebelow a critical crack size, thus creating the problem of‘short cracks’.
Critical crack size a0 is demonstratedly related to theintrinsic threshold stress intensity factor range DK0 andsmooth bar fatigue limit re by the following equation [33]:
a0 ¼1
pDK0
re
� �2
ð9Þ
Efforts have been made to link a0 with MCD in a vastspectrum of materials. Taylor [46] proposed a0 to be 10d,where d is the average grain size or another relevant micro-structural distance. This distance can be the mean free pathfor a microstructure in which plasticity is governed by bar-riers other than grain boundary [46,47]. More recently,Lados et al. [48–50] asserted that the critical length of amicrostructurally small crack should be between 5� and10� the MCD.
In the present study an oscillatory crack growth behav-ior was seen up to 450 lm for the cast condition, whereas inthe FSP condition this behavior stopped at 180 lm, asshown in Fig. 23. These values, therefore, should matchthe respective MCDs if the cracks are to qualify as micro-structurally short. For a cast alloy SDAS should be thecritical MCD, since it corresponds to successive Si parti-cle-dominated regions or the mean free path. SDAS forthe present cast alloy was �100 lm, therefore, the transi-tion crack length became �5� the MCD. Lados et al.[48] also treated SDAS as the critical MCD for their studyon crack growth behavior of a 7% Si Al–Si–Mg hypoeutec-tic alloy. In the FSP condition the MCD should corre-spond to interparticle spacing (dSi–Si). The sameparameter was chosen by Lados et al. [48] when consider-ing a 13% Si Al–Si–Mg eutectic alloy in which the crackwas noted to move through eutectic regions. In the presentwork dSi–Si was calculated to be �17 lm, thus making thetransition crack length �10� the corresponding MCD.Thus both observations match well with our understanding
0 500 1000 1500 2000 2500 3000 35001
10
100
Avg.
Cra
ck G
row
th R
ate,
nm
/cyc
le
Crack length, micron
Cast + T6 FSP + T6
Fig. 23. Crack growth rate vs. crack length, cast + T6 vs. FSP + T6.
of critical transition crack length discussed in the currentliterature. As noted earlier, the oscillatory behavior is dueto the interaction of a short fatigue crack with a barrier,which would be interdendritic regions in the cast conditionand individual Si particles in the FSP condition. Ladoset al. [48] showed that such successive peaks and valleysin the crack growth curve corresponded to crack tip posi-tion in the center of the grain (easy growth region) andat the grain boundary (barrier to growth region) for a 1%Si Al–Si–Mg cast alloy. In addition, the present study hasclearly shown the predominantly stage I behavior of micro-structurally short flaws where a crack moves at almost 45�to the far-field tensile axis (Fig. 18). Crack branching ofshort flaws along grain boundaries, which has beenobserved in earlier studies [41], was also noted in the pres-ent study (Fig. 16b). The branched cracks eventuallystopped growing because of an unfavorable alignment ofthe crack tips.
4. Conclusions
FSP led to a five times improvement in fatigue life for ahypoeutectic Al–Si–Mg cast alloy. Life enhancement wasdue to the closure of casting porosities, which acted asnotches.
Crack initiation was associated with porosities for thecast condition, whereas the particle/matrix interface wasresponsible for crack nucleation in the FSP condition. Sizeratio analysis of the respective defects matches well withthe Paris crack growth equation.
The crack growth rate was found to be one order ofmagnitude higher in the cast condition than in the FSPcondition. The crack in the FSP specimen moved alongthe particle/matrix interface, whereas a mixed-mode of par-ticle failure was observed in the cast alloy. This phenome-non could be linked to individual Si particle sizes.
Short crack behavior was observed in both conditions,and the critical transition crack length matched well withthe respective MCDs, e.g. SDAS for the cast conditionand interparticle spacing for the FSP condition.
Acknowledgement
This work was performed under the NSF-IUCRC forFriction Stir Processing. The additional support of NSF-IIP (0531019), GM and Friction Stir Link for the MissouriS&T site is acknowledged. This report was prepared as anaccount of work sponsored by an agency of the US Gov-ernment. The views and opinions of the authors expressedherein do not necessarily state or reflect those of the USGovernment or any agency thereof.
References
[1] Atxaga G, Pelayo A, Irisarri AM. Mater Sci and Tech (UK)2001;17:446–50.
[2] Sonsino CM, Zeise J. Int J Fatigue 1993;15:75–84.

S. Jana et al. / Acta Materialia 58 (2010) 989–1003 1003
[3] Zhang B, Sung PK, Poirier DR, Chen W. In: Transactions of theAmerican foundry society and the 104th annual castings congress.Pittsburgh, PA; 2000, p. 383–89.
[4] Couper MJ, Nesson AE, Griffiths JR. Fatigue Fract Eng MaterStruct 1990;13:213–27.
[5] Wang QG, Apelian D, Lados DA. J Light Met 2001;1:73–84.[6] Zhang B, Poirier DR, Chen W. Metall Mater Trans A 1999;30A:
2659–66.[7] Wang QG, Davidson CJ, Griffiths JR, Crepeau PN. Metall Mater
Trans B 2006;37B:887–95.[8] Lados DA, Apelian D. Mater Sci Eng A 2004;385:200–11.[9] Allison JE, Jones JW, Caton MJ, Boileau JM. In: Fatigue ’99: Seventh
international fatigue congress, Beijing, China; 1999, p. 2021–28.[10] Chen W, Zhang B, Wu T, Poirier D, Sung P, Fang QT. Automotive
alloys II. Warrendale (PA): TMS; 1998. p. 99–113.[11] Chen W, Zhang B, Wu T, Poirier D, Sung P, Fang QT. In: Materials
solutions 98. Rosemont, IL; 1998, p. 207–16.[12] Wickberg A, Gustafsson G, Larsson LE. SAE technical publication
840121; 1984.[13] Wang QG, Apelian D, Lados DA. J Light Met 2001;1:85–97.[14] Lee FT, Major JF, Samuel FH. Fatigue Fract Eng Mater Struct
1995;18:385–96.[15] Lee FT, Major JF, Samuel FH. Metall Mater Trans A 1995;26A:
1553–70.[16] Lados DA, Apelian D, de Figueredo AM. In: Proceedings of the 2nd
international aluminum casting technology symposium, Columbus,OH; 2002, p. 185–96.
[17] Lei CSC, Frazier WE, Lee EW. JOM 1997:38–9.[18] Petrov P, Konstantinova S, Buchvarov G, Petrov I. J Mater Sci Tech
1994;2:26–33.[19] Zhang B, Poirier D R, Chen W. SEM annual conference and
exposition on experimental and applied mechanics, Milwaukee, WI;2002.
[20] Zhang B, Poirier D R, Chen W. In: Transactions of the Americanfoundry society and the 106th annual casting congress, Kansas City,MO; 2002, p. 393–405.
[21] Kashyap KT, Murali S, Raman KS, Murthy KSS. Mater Sci Tech1993;9:189–203.
[22] Hurley TJ, Atkinson RG. Trans AFS 1985;93:291–6.[23] Yu YB, Song PY, Kim SS, Lee JH. Scripta Mater 1999;41:767–71.[24] Thomas WM, Nicholas ED, Needham JC, Murch MG, Templesmith
P, Dawes CJ. UK patent 9125978.8; 1991.
[25] Sharma SR, Ma ZY, Mishra RS. Scripta Mater 2004;51:237–41.[26] Mishra RS, Sharma SR, Mahoney W. AFS Trans 2005;113:
139–43.[27] Santella ML, Engstrom T, Storjohann D, Pan TY. Scripta Mater
2005;53:201–6.[28] Santella ML, Engstrom T, Storjohann D, Pan TY. SAE technical
paper series 2005-01-1249; 2005.[29] Jata KV, Semiatin SL. Scripta Mater 2000;43:743–9.[30] Ma ZY, Sharma SR, Mishra RS. Mater Sci Eng A 2006;433:269–78.[31] Ma ZY, Sharma SR, Mishra RS. Metall Mater Trans A 2006;37A:
3323–36.[32] Ma ZY, Sharma SR, Mishra RS. Scripta Mater 2006;54:1623–6.[33] Suresh S. Fatigue of materials. 2nd ed. Cambridge (UK): Cambridge
University Press; 1998.[34] Murakami Y, Endo M. The behavior of short fatigue cracks. Lon-
don: Mechanical Engineering Publications; 1986. p. 275–93.[35] Murakami Y, Endo M. Eng Fract Mech 1983;17:1–15.[36] Gall K, Yang N, Horstemeyer M, McDowell DL, Fan J. Metall
Mater Trans A 1999;30A:3079–88.[37] Broek D. In: Pratt PL, editor. Fracture. London: Chapman and Hall;
1969. p. 734.[38] Skallerud B, Iveland T, Harkegard G. Eng Fract Mech 1993;44:
857–74.[39] Barter SA, Molent L, Goldsmith N, Jones R. J Eng Fail Anal
2005;12:99–128.[40] Crawford BR, Loader C, Ward AR, Urbani C, Bache MR, Spence
SH, et al. Fatigue Fract Eng Mater Struct 2005;28:795–808.[41] Taylor D, Knott JF. Met Technol 1982;9:221–8.[42] Miller KJ, de los Rios ER, editors. The behavior of short fatigue
cracks. London: Mechanical Engineering Publications; 1986.[43] Ritchie RO, Lankford J, editors. Small fatigue cracks. Warrendale
(PA): TMS; 1986.[44] Kitagawa H, Tanaka T, editors. Fatigue 90. Birmingham: Materials
and Components Engineering Publications; 1990.[45] Shyam A, Allison JE, Jones JW. Acta Mater 2005;53:1499–509.[46] Taylor D. Fatigue thresholds. London: Butterworth; 1989.[47] Yoder GR, Cooley LA, Crooker TW. Metall Trans A
1977;8A:1737–43.[48] Lados DA, Apelian D, Donald JK. Acta Mater 2006;54:1475–86.[49] Lados DA, Apelian D, Jones PE, Major JF. Mater Sci Eng A 2007;
468–470:237–45.[50] Lados DA, Apelian D. Eng Fract Mech 2008;75:821–32.