Structure and Photoluminescence of Pure and Indium-Doped ZnTe Microstructures
Upload
csm-qadissCategory
view
3download
0
Surface & Coatings Technology 270 (2015) 272–283
1
The Influence of the Surface Roughness on the Microstructures and Mechanical
Properties of 6061 Aluminium Alloy Using Friction Stir Welding
Hasan I. Dawood1Kahtan S. Mohammed ,٭
1, Azmi Rahmat
1, Uday M. B.
2
1Universiti Malaysia Perlis,
School of Materials Engineering, Taman Muhibah-Jejawi-Arau 02600
Perlis, Malaysia
2UTM - Centre for Low Carbon Transport in cooperation with Imperial College London, Institute
for Vehicle Systems and Engineering, Universiti Teknologi Malaysia
81310 Skudai, Johor, Malaysia
٭ E-mail address: [email protected], Phone: +60174489057, Fax: 04-979 8178
Abstract
In the present study, four pairs of 6061 aluminium alloy workpieces with different surface
roughness were prepared for welding. The friction stir welding (FSW) technique was used for a
butt-joint configuration of a single pass. The influence of different surface roughness of the
workpieces coincided with a small welding tool shoulder diameter, and the tool pin was examined.
The results demonstrated that spherical nano-sized grains of the joints were produced. The
mechanical properties of the joints were significantly better at the least possible workpiece surface
roughness. The experimental results also indicated that the tensile strength of FSW 6061 aluminium
alloy was notably affected by joining at the different workpiece surface roughness selected.
However, an improvement of the Vickers microhardness in the heat affected zone (HAZ) was also
observed. The microhardness in the nugget zone (NZ) for the welded joint fabricated at the lowest
value of the workpiece surface roughness was higher than that of the base metal (BM). The
fractural surface of the cross-section of the tensile specimens has a gradient to change from brittle
fracture to ductile fracture.
Keywords: Surface roughness; Spherical nano-size grains; Friction stir welding; Microstructures;
Mechanical properties; 6061aluminium alloy
Surface & Coatings Technology 270 (2015) 272–283
2
1. Introduction
FSW is a solid state joining method in which the relative motion between the welding tool
and the material of the work piece produces heat. This heat makes the material soft, thereby
enabling it to be joined via plastic deformation and a thermal cycle effect (i.e., dynamic
recrystallisation) caused by the rotational welding tool. Dynamic recrystallisation is associated with
materials in which the dynamic recovery is sufficient to cover slow passage of the sub grain
boundaries. Such materials undertake this softening by continuous division of their structures. This
division produces a fine grained microstructure without involving any nucleation or growth
mechanisms [1]. This microstructure, in turn, results in a significant grain refinement in the nugget
zone (NZ). This method relies on the direct conversion of the mechanical energy to thermal energy
forming the weld without any external source of heat[2]. In the FSW process, a non-consumable
rotating tool is forced down into the joint line under certain conditions, such as the controlled force,
welding speed, and rotational speed of the tool. All of these factors are important for a successful
FSW process because the welding occurs in a state under the melting point of the material [3].
Thus, all problems related to the solidification of a fused material are avoided. FSW produces an
asymmetric microstructure, represented by the retreating side (RS) and the advancing side (AS). It
is experimentally demonstrated that there are different strain levels in these two sides. Different
thermal cycles induce different properties and precipitate distributions in the welding zones [4].
Although Al-Mg-Si alloys are readily weldable, they suffer severe softening in the HAZ because of
the dissolution of magnesium-silicon (Mg2Si) precipitates during the welding thermal cycle. This
type of mechanical impairment poses a major problem in engineering design. It is more appropriate
to overcome or minimise the HAZ softening to improve the mechanical properties of weldments
[5].
Surface & Coatings Technology 270 (2015) 272–283
3
The relationship between surface roughness and friction was considered in the present study
because it is relevant to the FSW process. One of the early attempts to explain friction was to relate
it to the surface roughness because the surface is not generally smooth; instead, the surface is rough
and wavy. Several investigators attempted to study the effect of surface texture of soft materials on
friction [6-8]. For example, the effect of surface roughness on frictional resistance using different
types of surfaces was studied by Rasp and Wichern [8]. In these researchers experiment, the
condition of the surfaces of the specimen varied greatly: from the as-received state, various states of
being abrasively scratched parallel to perpendicular to the simulated rolling direction, to being as
good as a mirror polished surface. These researchers determined that the arithmetic roughness value
and lubrication regime have a greater influence on the frictional resistance than the directionality.
However, the surface texture of deformed material cannot explain the true friction values during
sliding; thus, it is important to characterise the surface texture of the harder material.
The present study investigated the effect of surface roughness of harder materials on the
friction coefficient. In the literature, several researchers had focused on the effects of surface
texture of harder materials on the friction coefficient during sliding [9-14]. For example, the effects
of surface texture and surface roughness using steel discs of varying roughnesses and textures were
studied by Staph et al. [13]; they concluded that both the surface texture and the surface roughness
affect frictional behaviour. The relationship between the friction and surface roughness using
various lubricants was studied by Hu and Dean[14]. These researchers reported that a random
smoother surface could retain more lubrication and reduce friction. The influence of the
directionality of the surface grinding marks on the friction coefficient and the transfer layer
formation for Al–Mg alloy pin slid against EN8 steel flat under both dry and lubricated conditions
using inclined scratch test was studied by Menezes et al.[15]. The value of the roughness, as
Surface & Coatings Technology 270 (2015) 272–283
4
represented by Ra, of the surfaces varied over a range via preparation using different grit emery
papers. The average friction coefficient and transfer layer formation were observed to rely primarily
on the directionality of the grinding marks but were independent of surface roughness on the harder
mating surface. Lundberg[16]also studied the influence of surface roughness on normal sliding
lubrication and reported that the Rmax was found to be the most significant surface roughness
parameter. The effect of the surface texture on the friction mechanism studied using the universal
testing machine was reported by Koura[17]. Steel specimens were prepared for various degrees of
roughnesses by grinding, lapping and polishing. The results indicated that the surface behaviour
and the friction during sliding depend on the degree of roughness. However, the correlation
coefficient between the friction coefficient and the roughness parameters were noted to depend on
the system. In addition, reports in the literature indicated that the surface roughness is the most
important parameter in describing the surface integrity of a material. The surface roughness also has
a great importance in specifying the function of the surface because a significant proportion of
material failure starts at the surface, due to either the discontinuity or deterioration of the quality of
the surface. The surface finish also plays an important role in corrosion resistance and may increase
the performance and reduce the costs of the life cycle of a part. Therefore, these consequent effects
raise an important issue that must be investigated. However, optimisation of the microstructure and
properties of the surface is an effective approach to enhance the global behaviour and service life
time of materials [18].
Plastic deformation induces grain refinement in the nanometre regime. This process has
been extensively investigated in various metals and alloys over the past decades, both in bulk forms
[19] and in the surface layers of bulk materials [20]. Optimising the surface properties by refining
the grains in the surface layers down to the nanometre scale (referred to as surface nano
Surface & Coatings Technology 270 (2015) 272–283
5
crystallisation) promises to provide more practical industrial applicability. Surface mechanical
attrition treatment (SMAT) is a technique that can induce grain refinement into the nanometre
regime in the surface layer of bulk materials [21]. The SMAT transforms the original coarse grains
in the surface material into refined grains [22]. The grain refining mechanisms in SMAT are
implemented by the random and repetitive impact of milling balls to the sample’s surface. This
technique has been successfully applied in achieving surface nano crystallisation (SNC) in a
variety of materials, including pure metals, alloys and steels [23-26]. Friction sliding, another
technique for grain refinement down to the nano scale, is based on the principle of plastic
deformation-induced grain refinement [27]. However, these two processes suffer from either low
processing efficiencies and limited nano-structured layer thicknesses or structural inhomogeneity in
the surface layer; all of these negative characteristics have hindered the widespread application of
surface nano crystallisation technologies [28].
Regarding the FSW process, it is well-accepted that grain refinement that increases the
strength and ductility of aluminium alloys can lead to a wider use of FSW in a variety of industries,
including the defence industry. To obtain a microstructure with improved mechanical behaviour,
several methods based on plastic deformation have been developed for grain refinement in alloys,
such as rolling, Equal Channel Angular Processing (ECAP) and Equal Channel Angular Extrusion
(ECAE). Due to the importance of this topic, many relevant research studies have been reported.
Brian et al. [29] studied the grain refinement using nitrogen liquid as a cooler; they found that the
average nano-grain size is typically approximately 500nm. Grain refinement via FSW in alloys has
been reported by different researchers [30-36]. The grain structures were found to depend heavily
on the processing conditions, including processing parameters, tool geometry and cooling rate.
Surface & Coatings Technology 270 (2015) 272–283
6
The present study involved development of a simple and efficient method of producing the
desired substructure in materials based on grain refinement into the nanometre regimes. The
investigation attempted to elucidate the effect of surface roughness of the workpiece before the
process of welding, and efforts were made to correlate these roughness parameters with the
coefficient of friction; the results revealed the effect of the small tool welding dimension on the
microstructural evolution, mechanical properties, nano-grain size refinement and HAZ
microhardness of 6061 aluminium alloy.
2. Materials and Experimental Procedures
The material used in this study was the 6061 aluminium alloy supplied by a local supplier
(Heap Sing Huat Metal and Machinery Sdn Bhd). The plates with a thickness of 4mm were sliced
into the required size (210 mm × 200 mm) using a cutting band saw machine (MODEL: UE-712A).
Three pairs of the workpieces were ground using coarser and finer abrasive papers of 240 to 1200
grits to remove material from the workpiece surfaces until the desired surface roughness was
achieved. The first pair of workpieces was ground with abrasive paper of 240 grit, and the other two
pairs were ground with abrasive papers of 240 to 600 and 240 to 1200 grit.
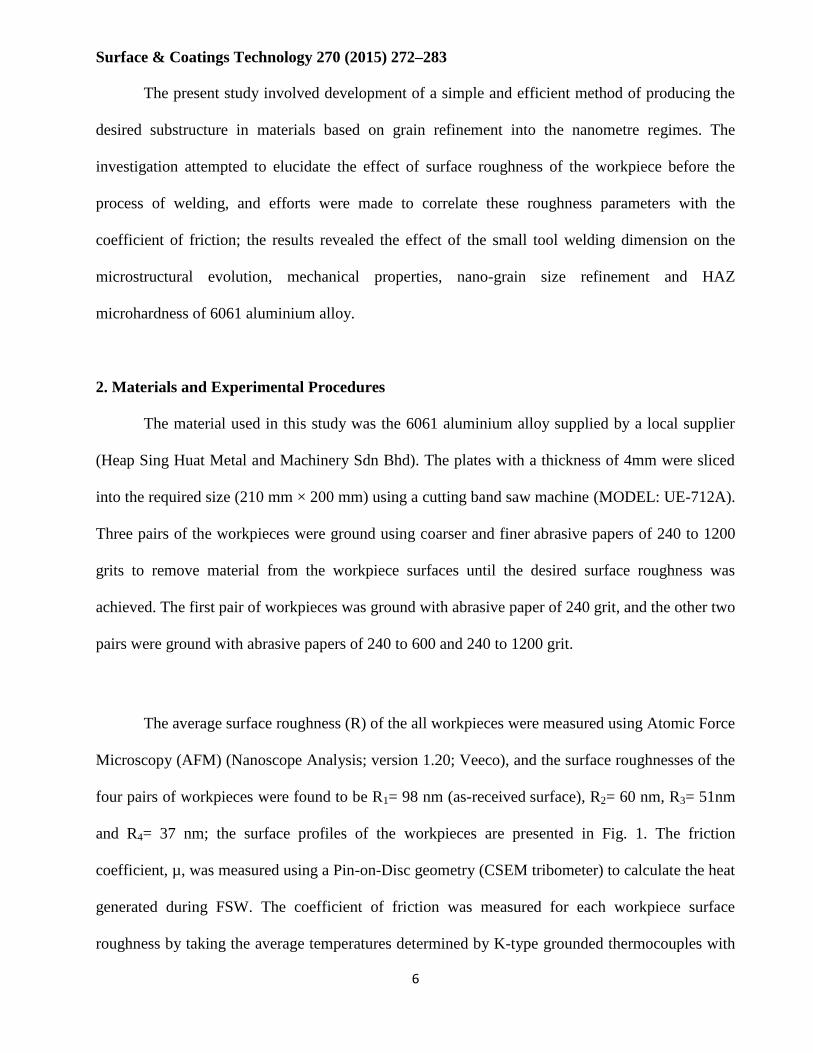
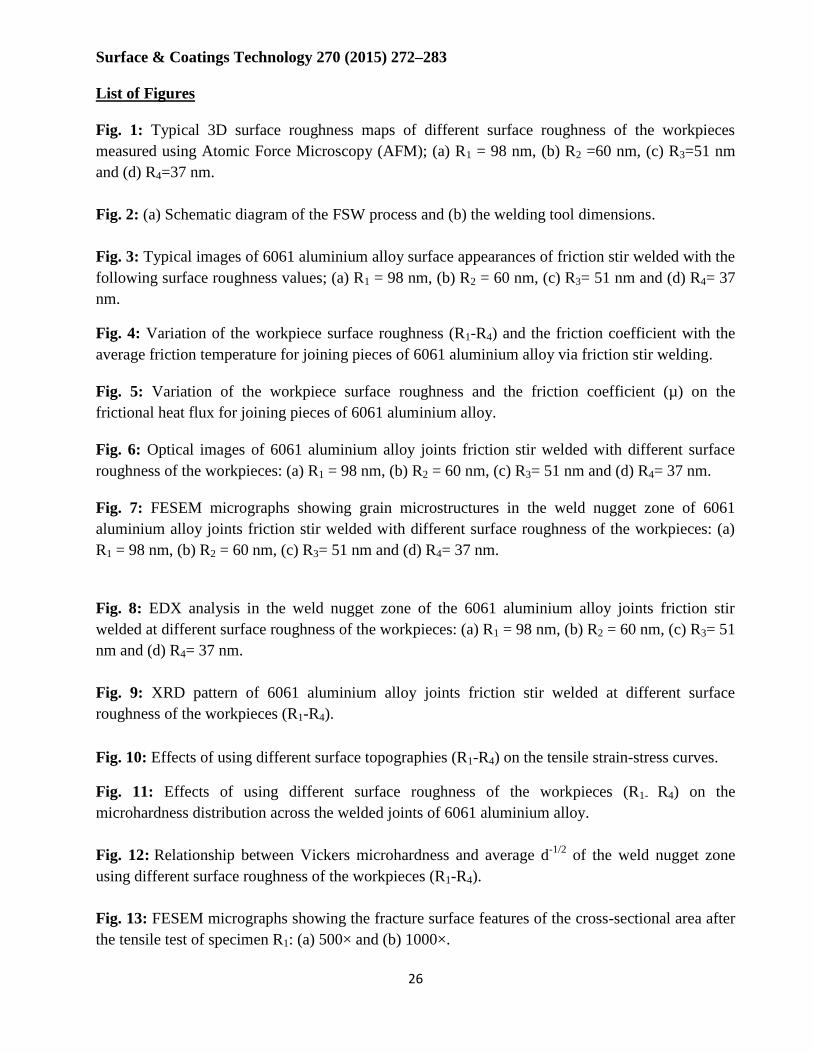
The average surface roughness (R) of the all workpieces were measured using Atomic Force
Microscopy (AFM) (Nanoscope Analysis; version 1.20; Veeco), and the surface roughnesses of the
four pairs of workpieces were found to be R1= 98 nm (as-received surface), R2= 60 nm, R3= 51nm
and R4= 37 nm; the surface profiles of the workpieces are presented in Fig. 1. The friction
coefficient, µ, was measured using a Pin-on-Disc geometry (CSEM tribometer) to calculate the heat
generated during FSW. The coefficient of friction was measured for each workpiece surface
roughness by taking the average temperatures determined by K-type grounded thermocouples with
Surface & Coatings Technology 270 (2015) 272–283
7
a sheath diameter of 1mm attached to the workpiece surfaces at different points near the boundary
of the shoulder during the FSW process. For this purpose, an external oven was used to increase the
temperature of each workpiece surface to the desired value before using the CSEM tribometer. The
measurements of the friction coefficient were performed at a load of 15 N and at a velocity
of1mm/sec. After the test is completed, the average friction coefficient was considered for each
workpiece surface roughness. The test workpieces were rigidly clamped onto the backing plate in a
butt-joint configuration parallel to the rolling direction of the plates. The surface of each of the
plates was cleaned using acetone to remove dirt and grease. The chemical compositions of the BM
are presented in Table 1.
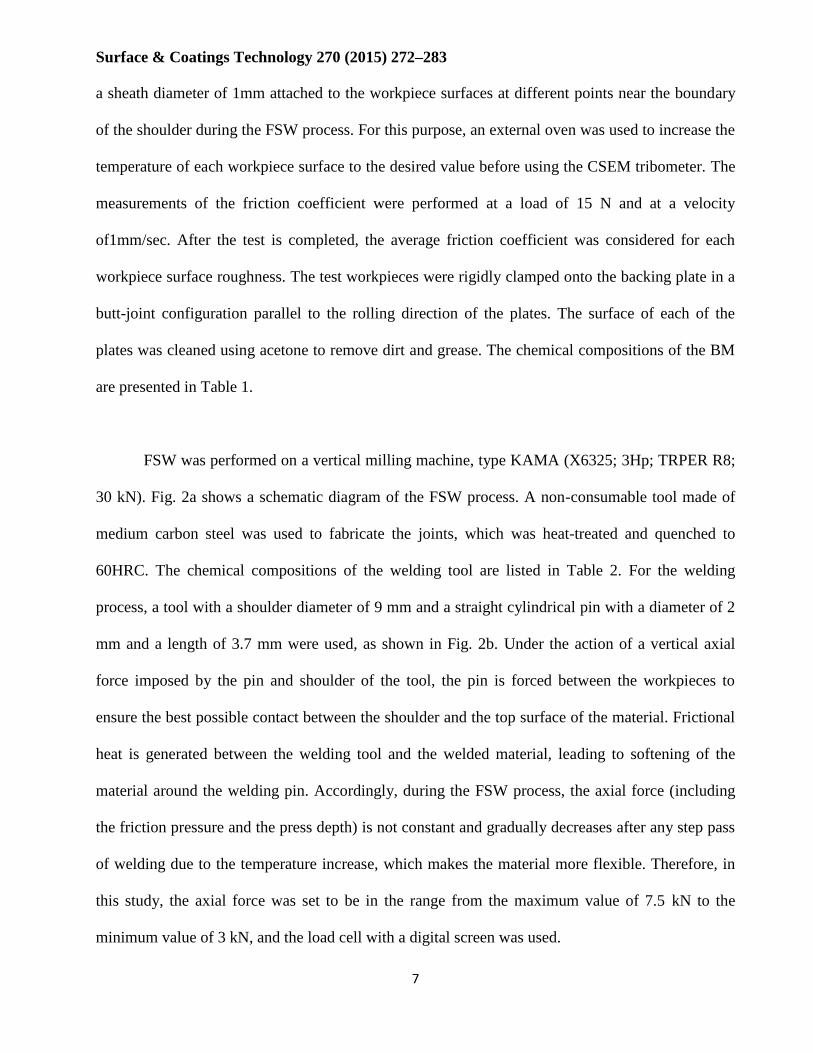
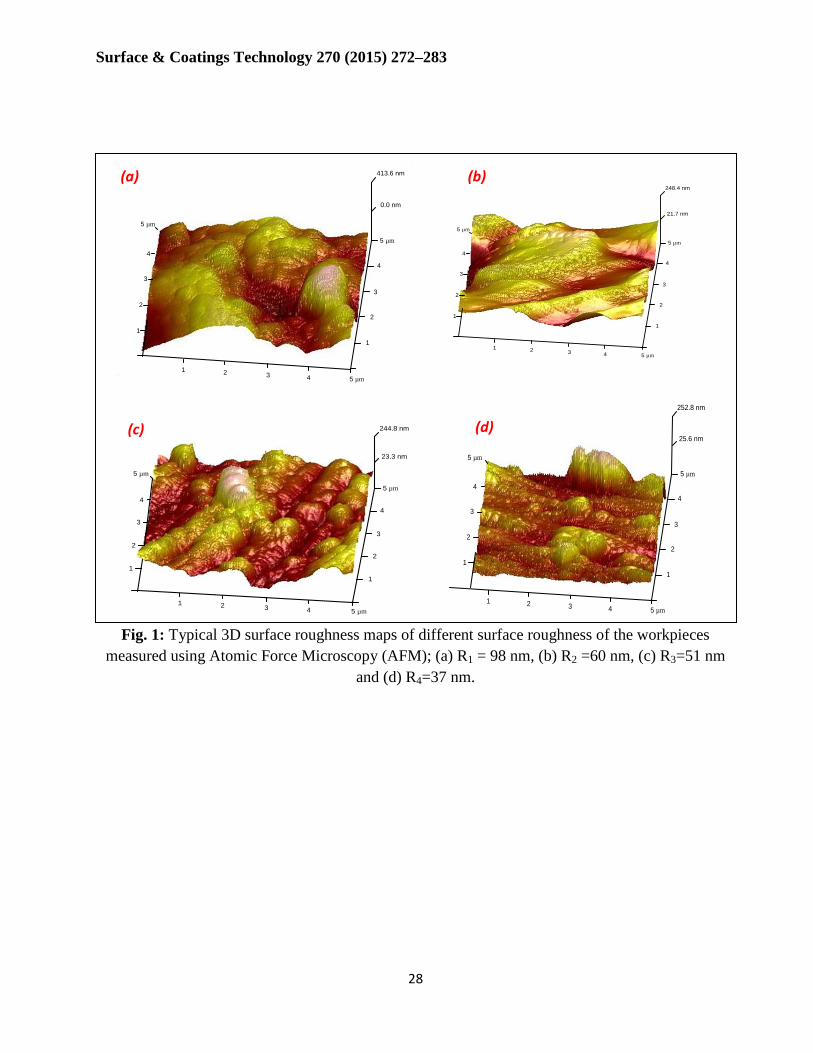
FSW was performed on a vertical milling machine, type KAMA (X6325; 3Hp; TRPER R8;
30 kN). Fig. 2a shows a schematic diagram of the FSW process. A non-consumable tool made of
medium carbon steel was used to fabricate the joints, which was heat-treated and quenched to
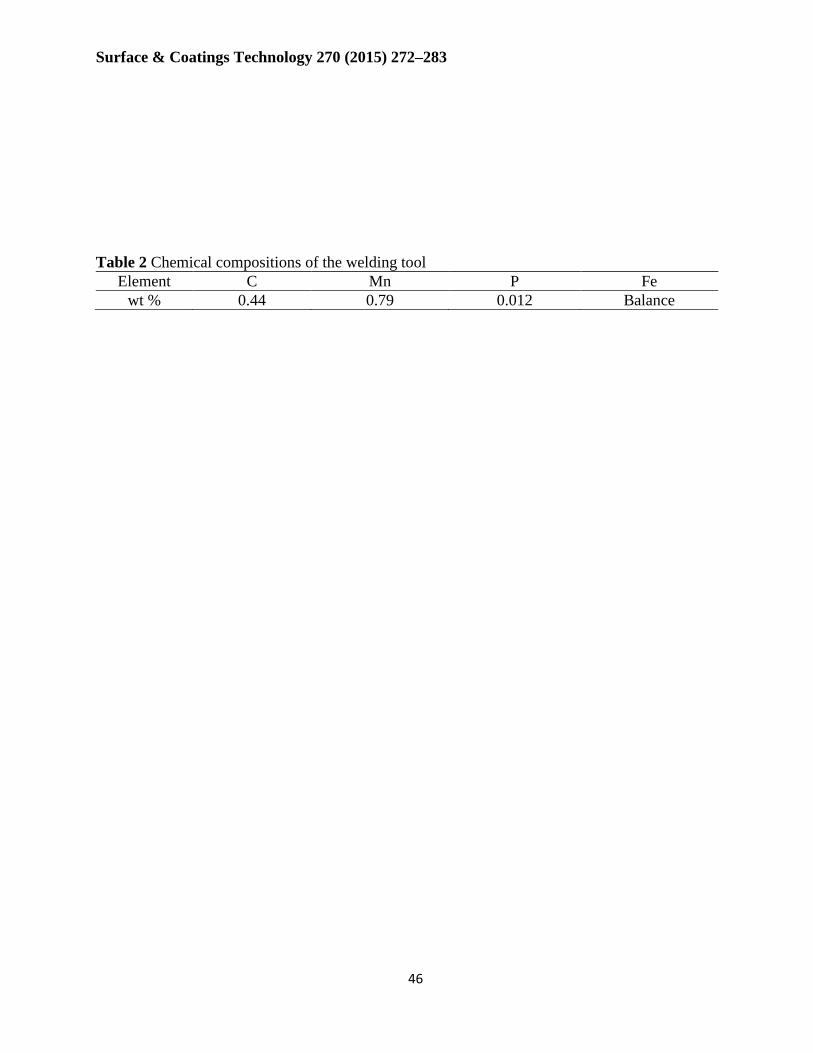
60HRC. The chemical compositions of the welding tool are listed in Table 2. For the welding
process, a tool with a shoulder diameter of 9 mm and a straight cylindrical pin with a diameter of 2
mm and a length of 3.7 mm were used, as shown in Fig. 2b. Under the action of a vertical axial
force imposed by the pin and shoulder of the tool, the pin is forced between the workpieces to
ensure the best possible contact between the shoulder and the top surface of the material. Frictional
heat is generated between the welding tool and the welded material, leading to softening of the
material around the welding pin. Accordingly, during the FSW process, the axial force (including
the friction pressure and the press depth) is not constant and gradually decreases after any step pass
of welding due to the temperature increase, which makes the material more flexible. Therefore, in
this study, the axial force was set to be in the range from the maximum value of 7.5 kN to the
minimum value of 3 kN, and the load cell with a digital screen was used.
Surface & Coatings Technology 270 (2015) 272–283
8
The welding process was implemented using a rotational speed of 1750 rpm in the counter
clockwise direction, and the welding speed was 60 mm/min, which was normal to the rolling
direction. The single pass welding method was implemented to fabricate the joints. Five welds were
performed for each test parameter to ensure the accuracy and repeatability of the results. Afterward,
the best possible welded specimen was selected from each set of the of test parameters of the
specimens to study the microstructure and mechanical properties. Microstructural analysis was
performed on aluminium alloy joints perpendicular to the welding direction. The specimens for
metallographic examination were sectioned to the required sizes from the NZ, TMAZ, HAZ and BM
regions. Next, the samples were ground with 180 to 1200 grit silicon carbide papers. Final polishing
was performed using a diamond paste of particle size of 0.5µm. A solution of Keller’s reagent (3ml
of hydrochloric acid, 5ml of nitric acid, 2ml of hydrofluoric acid and 190 ml of distilled water) was
prepared to reveal the microstructures, according to the American Standard Testing of Materials
(ASTM: E407-07: ETD 2013). The microstructures of the specimens were observed using an optical
microscope (Olympus BX41RF) and a Field-Emission Scanning Electron Microscopy (FESEM)
apparatus (FEI Nova NanoSEM 450) equipped with an energy dispersive X-ray (EDX) analyser to
investigate the effect of plastic deformation on the grain size. The welding sample of the 6061
aluminium alloy was analysed via X-ray diffraction (XRD) using a copper target as the X-ray source
to identify the phases in the welded joints. The instrument used in this XRD work was a D8
Advance X-ray diffractometer (Bruker Analytical X-Ray Systems).
For the tensile tests, the FSW specimens were cut perpendicular to the welding direction
according to ASTM: E8/E8M-11, B557: ETD 2013. The specimens were loaded at the rate of
1kN/min using an INSTRON (Universal Testing Machine). Microhardness testing apparatus using
the conventional Vickers microhardness technique; the measurements were performed across the
Surface & Coatings Technology 270 (2015) 272–283
9
joints and the BM at specific locations according to ASTM E384-11, ISO 6507-1: ETD 2013. For
the measurements of the microhardness, at least 19 Vickers type indentations on both sides of the
welded specimens were performed on polished cross-sections perpendicular to the welding
direction, using a load of 9.8 N (1 kg) and a dwell time of 15 sec using a Future-Tech (FV-700e)
microhardness tester (Future-Tech Corp., Japan). The microhardness was more closely measured,
with measurements being taken every 1 to 1.5 mm. The procedure of the microhardness test was
repeated until at least five impressions were made at widely spaced locations along the welding
line. The FESEM technique was also used to study the fracture surface of the tensile specimens.
3. Results and Discussion
3.1 Effects of surface roughness
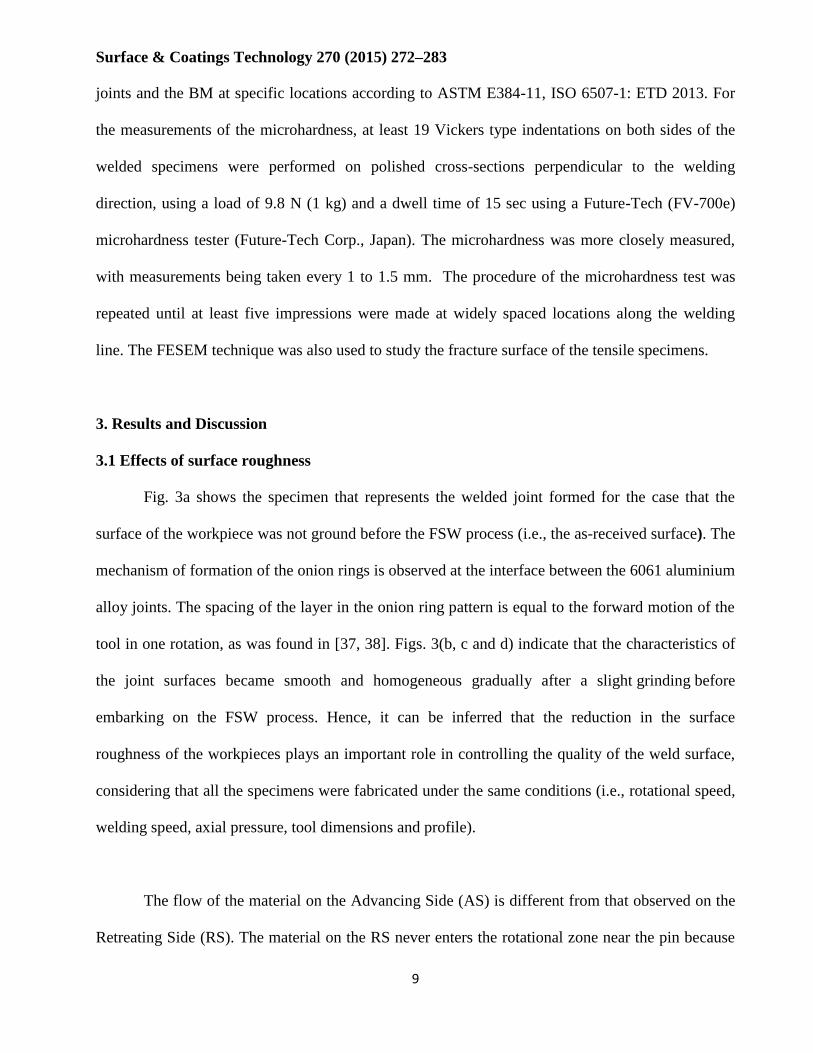
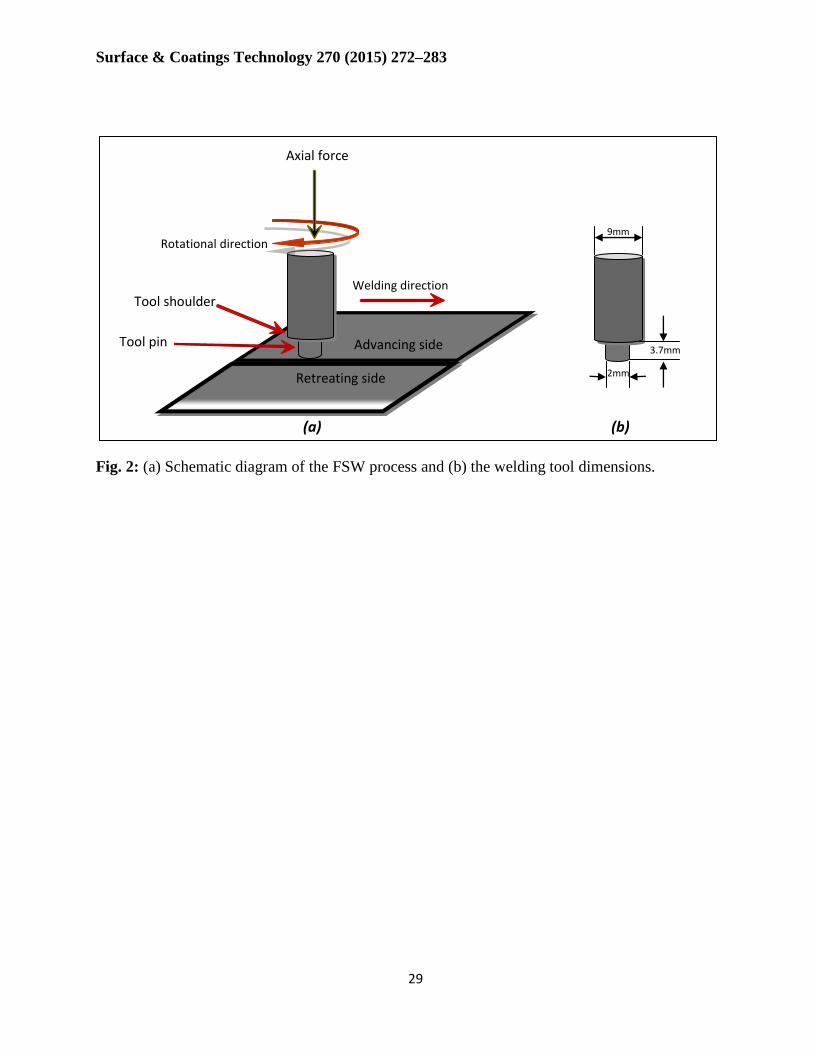
Fig. 3a shows the specimen that represents the welded joint formed for the case that the
surface of the workpiece was not ground before the FSW process (i.e., the as-received surface). The
mechanism of formation of the onion rings is observed at the interface between the 6061 aluminium
alloy joints. The spacing of the layer in the onion ring pattern is equal to the forward motion of the
tool in one rotation, as was found in [37, 38]. Figs. 3(b, c and d) indicate that the characteristics of
the joint surfaces became smooth and homogeneous gradually after a slight grinding before
embarking on the FSW process. Hence, it can be inferred that the reduction in the surface
roughness of the workpieces plays an important role in controlling the quality of the weld surface,
considering that all the specimens were fabricated under the same conditions (i.e., rotational speed,
welding speed, axial pressure, tool dimensions and profile).
The flow of the material on the Advancing Side (AS) is different from that observed on the
Retreating Side (RS). The material on the RS never enters the rotational zone near the pin because

Surface & Coatings Technology 270 (2015) 272–283
10
the material on the AS forms the fluidised bed near the pin and rotates around it. In the transition
zone, material transfer occurs mainly on the RS. This type of motion mechanism was also
supported by Ying et al. [39]. Accordingly, the long-term trend at the retreating side reflects more
flash, as seen in Figs. 3(a and b); in addition, the RS represents the location of the lowest values of
hardness at the same time. Figs. 3(c and d) show the absence of flash on the RS, probably due to the
lack of heat generation caused by the reduction of surface roughness, which makes the material less
flexible and difficult to extrude under the shoulder area.
3.2 Heat generation during the FSW process
The friction heat flow is a highly important factor for the FSW process because the
microstructure in the stir zone is strongly influenced by the friction heat flow [40]. The friction heat
input from the welding tool during the FSW process, qo, can be evaluated according to the report of
Frigaard et al. [41] as follows:
(1)
Where µ is the friction coefficient, F is the axial force, N is the rotational speed and D is the
shoulder diameter. If the contact area is Ac ((D/2)2×π), then the resulting heat flux at the stir zone is
(2)
During the transient heating period, when the temperature starts to build up under the tool
shoulder, Eq. 1 is believed to provide an adequate description of the heat generated during FSW.
This result is probably true as long as the individual contributions of the rotating movement of the
shoulder and the pin are responsible for generating the heat. The frictional heating contributes to the
32
23
4 DFNqo
C
o
A
Surface & Coatings Technology 270 (2015) 272–283
11
formation of a plasticised layer of soft metal beneath the tool shoulder and around the pin. The
mechanism of plastic deformation and the variable frictional conditions at the tool interface are
accounted for by the use of a reasonable average value for the friction coefficient (µ). However, in
the thermal processing of aluminium alloys, it is generally accepted that local melting will occur if
the material is heated above the eutectic temperature at a rate that does not allow the eutectic phase
to fully dissolve. If the conditions for local melting are met, then the presence of a liquid film at the
tool interface will lubricate the tool shoulder, resulting in a lack of friction [41].
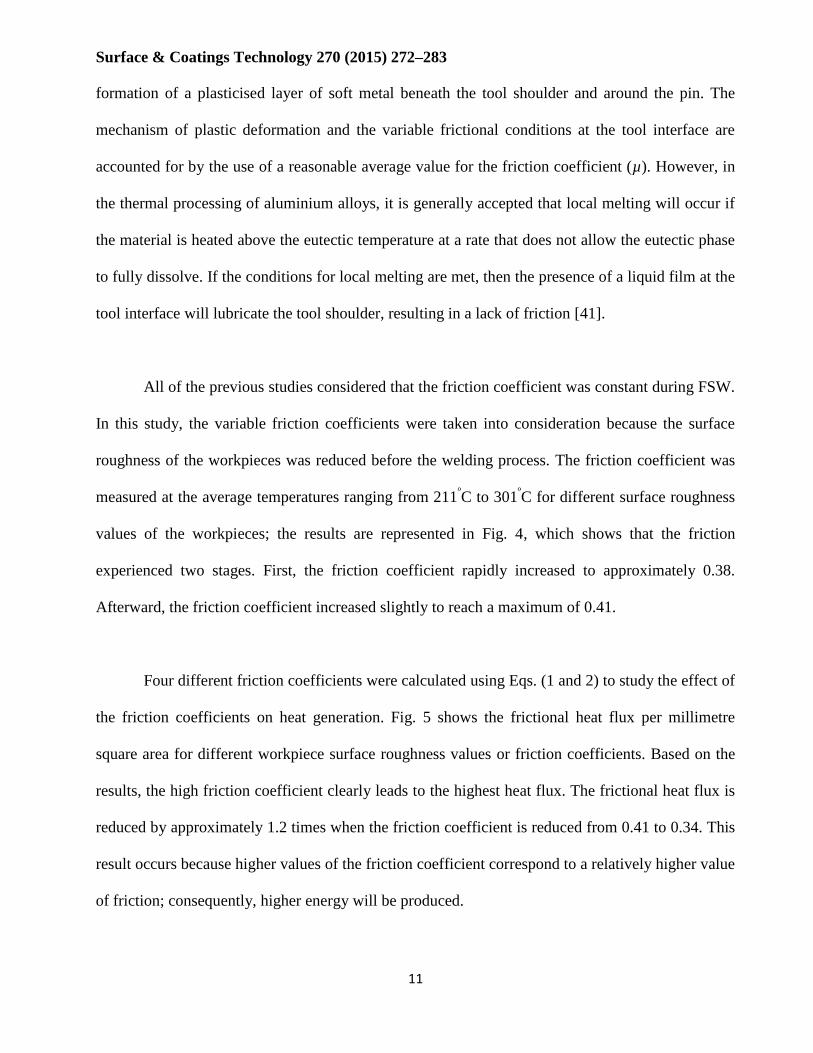
All of the previous studies considered that the friction coefficient was constant during FSW.
In this study, the variable friction coefficients were taken into consideration because the surface
roughness of the workpieces was reduced before the welding process. The friction coefficient was
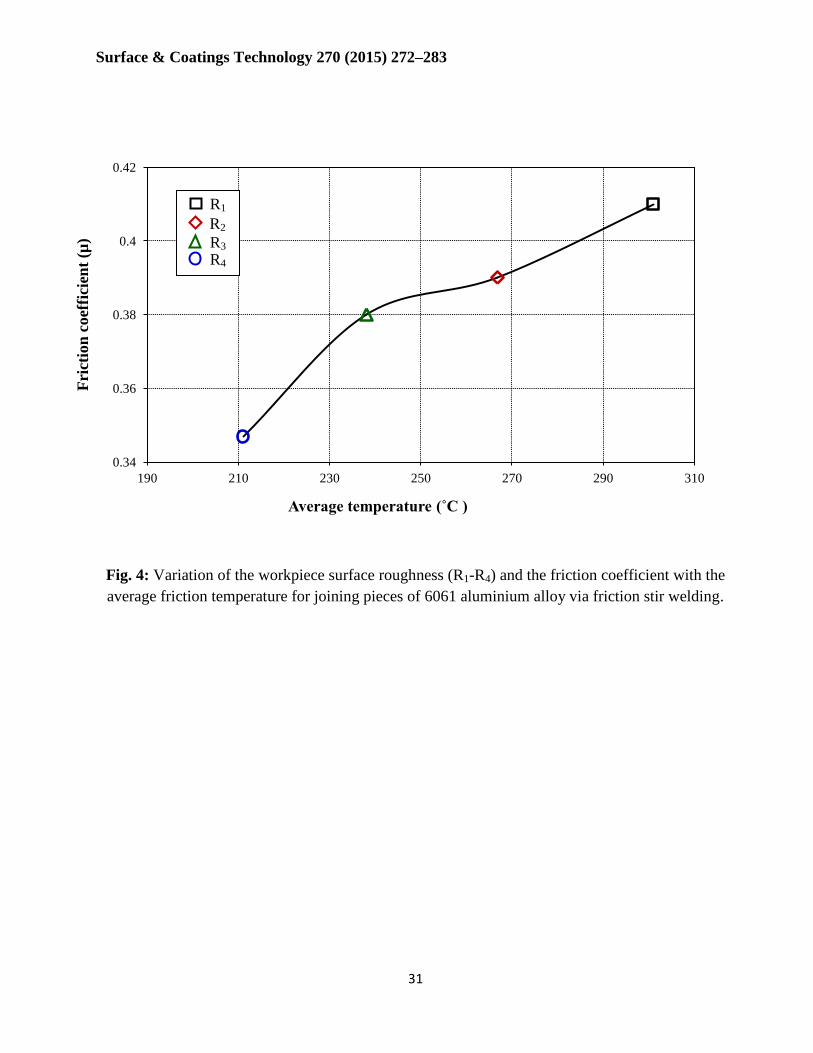
measured at the average temperatures ranging from 211ºC to 301
ºC for different surface roughness
values of the workpieces; the results are represented in Fig. 4, which shows that the friction
experienced two stages. First, the friction coefficient rapidly increased to approximately 0.38.
Afterward, the friction coefficient increased slightly to reach a maximum of 0.41.
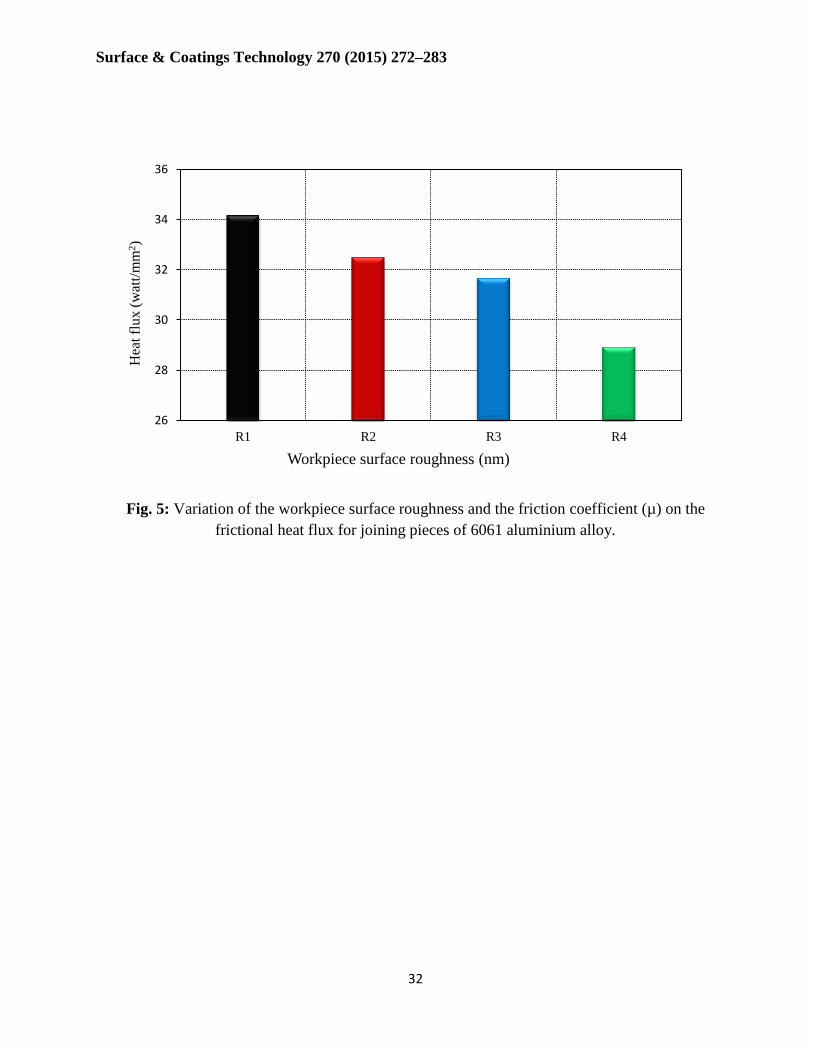
Four different friction coefficients were calculated using Eqs. (1 and 2) to study the effect of
the friction coefficients on heat generation. Fig. 5 shows the frictional heat flux per millimetre
square area for different workpiece surface roughness values or friction coefficients. Based on the
results, the high friction coefficient clearly leads to the highest heat flux. The frictional heat flux is
reduced by approximately 1.2 times when the friction coefficient is reduced from 0.41 to 0.34. This
result occurs because higher values of the friction coefficient correspond to a relatively higher value
of friction; consequently, higher energy will be produced.
Surface & Coatings Technology 270 (2015) 272–283
12
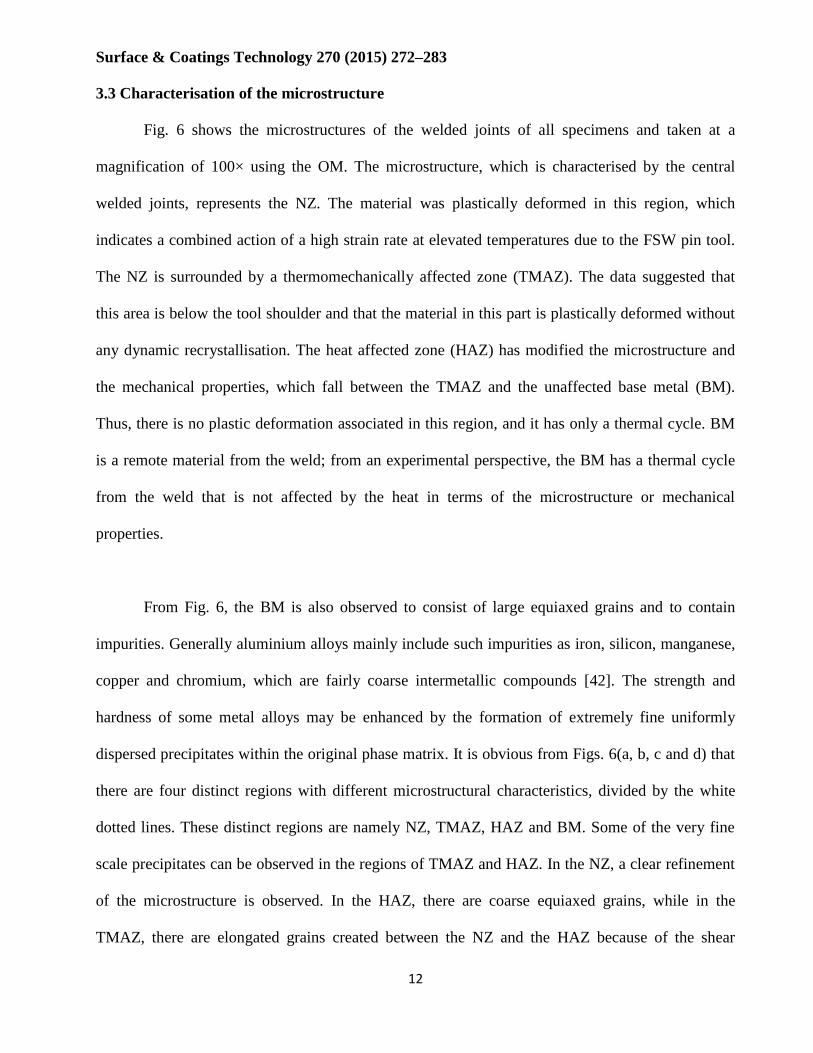
3.3 Characterisation of the microstructure
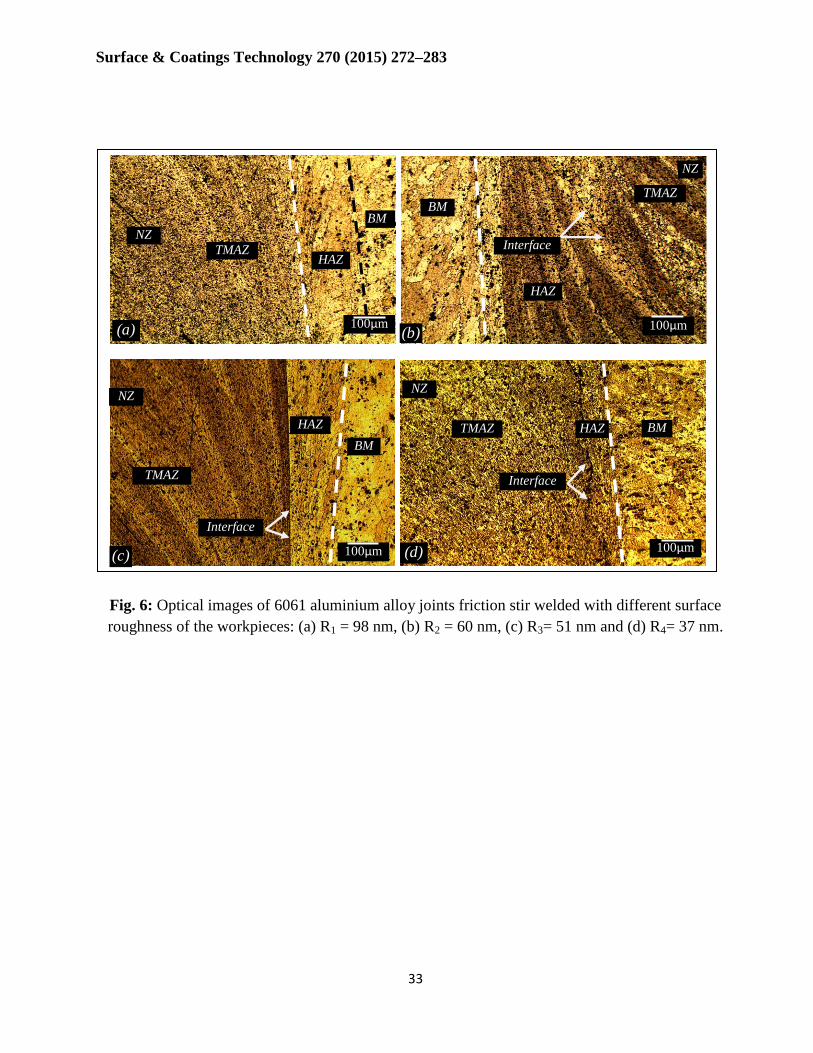
Fig. 6 shows the microstructures of the welded joints of all specimens and taken at a
magnification of 100× using the OM. The microstructure, which is characterised by the central
welded joints, represents the NZ. The material was plastically deformed in this region, which
indicates a combined action of a high strain rate at elevated temperatures due to the FSW pin tool.
The NZ is surrounded by a thermomechanically affected zone (TMAZ). The data suggested that
this area is below the tool shoulder and that the material in this part is plastically deformed without
any dynamic recrystallisation. The heat affected zone (HAZ) has modified the microstructure and
the mechanical properties, which fall between the TMAZ and the unaffected base metal (BM).
Thus, there is no plastic deformation associated in this region, and it has only a thermal cycle. BM
is a remote material from the weld; from an experimental perspective, the BM has a thermal cycle
from the weld that is not affected by the heat in terms of the microstructure or mechanical
properties.
From Fig. 6, the BM is also observed to consist of large equiaxed grains and to contain
impurities. Generally aluminium alloys mainly include such impurities as iron, silicon, manganese,
copper and chromium, which are fairly coarse intermetallic compounds [42]. The strength and
hardness of some metal alloys may be enhanced by the formation of extremely fine uniformly
dispersed precipitates within the original phase matrix. It is obvious from Figs. 6(a, b, c and d) that
there are four distinct regions with different microstructural characteristics, divided by the white
dotted lines. These distinct regions are namely NZ, TMAZ, HAZ and BM. Some of the very fine
scale precipitates can be observed in the regions of TMAZ and HAZ. In the NZ, a clear refinement
of the microstructure is observed. In the HAZ, there are coarse equiaxed grains, while in the
TMAZ, there are elongated grains created between the NZ and the HAZ because of the shear
Surface & Coatings Technology 270 (2015) 272–283
13
stresses. Interestingly, the width of the HAZ is found to decreases gradually with the decrease in the
workpiece surface roughness. Because of the decrease in the workpiece surface roughness causes
the decrease of the heat generation and the lower amount of heat conducted to the HAZ region,
resulting in reduction in the width of the HAZ.
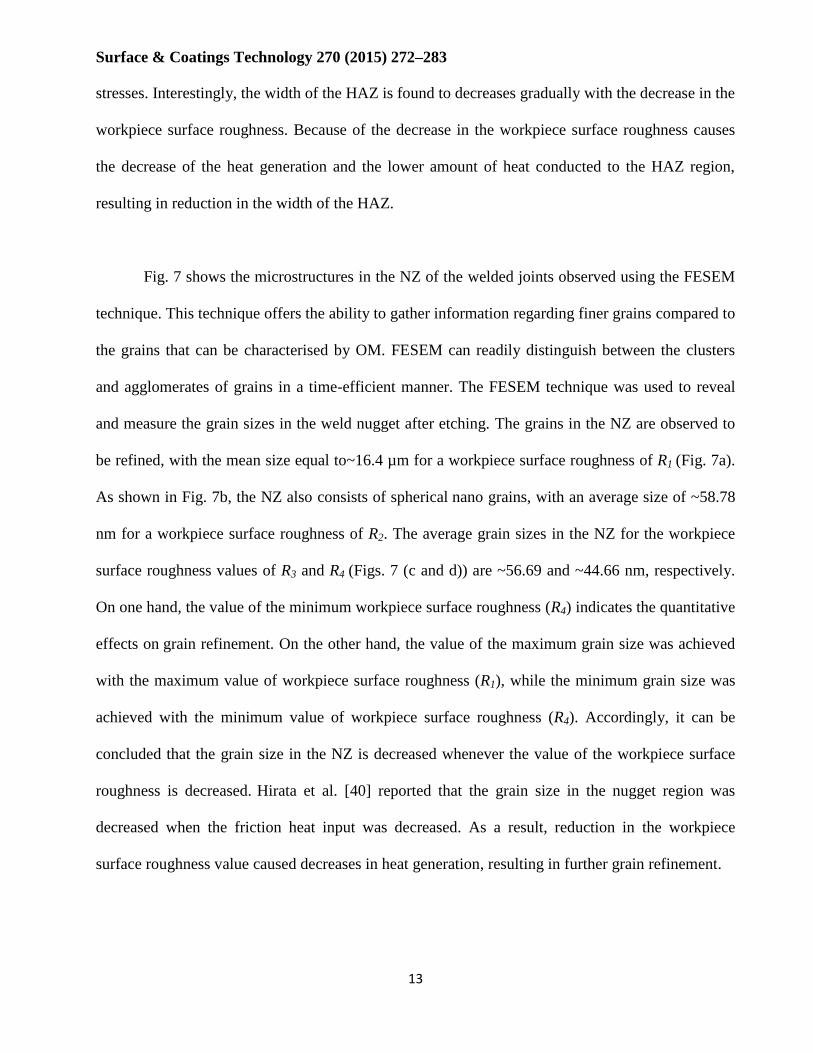
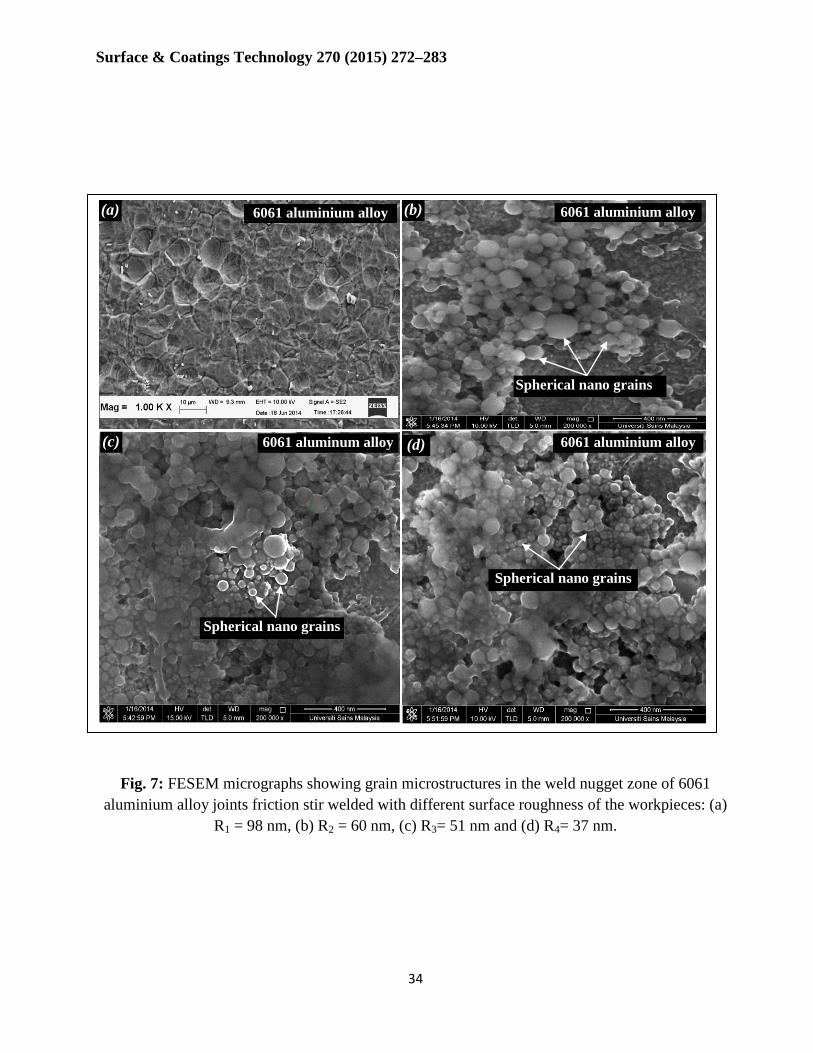
Fig. 7 shows the microstructures in the NZ of the welded joints observed using the FESEM
technique. This technique offers the ability to gather information regarding finer grains compared to
the grains that can be characterised by OM. FESEM can readily distinguish between the clusters
and agglomerates of grains in a time-efficient manner. The FESEM technique was used to reveal
and measure the grain sizes in the weld nugget after etching. The grains in the NZ are observed to
be refined, with the mean size equal to~16.4 µm for a workpiece surface roughness of R1 (Fig. 7a).
As shown in Fig. 7b, the NZ also consists of spherical nano grains, with an average size of ~58.78
nm for a workpiece surface roughness of R2. The average grain sizes in the NZ for the workpiece
surface roughness values of R3 and R4 (Figs. 7 (c and d)) are ~56.69 and ~44.66 nm, respectively.
On one hand, the value of the minimum workpiece surface roughness (R4) indicates the quantitative
effects on grain refinement. On the other hand, the value of the maximum grain size was achieved
with the maximum value of workpiece surface roughness (R1), while the minimum grain size was
achieved with the minimum value of workpiece surface roughness (R4). Accordingly, it can be
concluded that the grain size in the NZ is decreased whenever the value of the workpiece surface
roughness is decreased. Hirata et al. [40] reported that the grain size in the nugget region was
decreased when the friction heat input was decreased. As a result, reduction in the workpiece
surface roughness value caused decreases in heat generation, resulting in further grain refinement.

Surface & Coatings Technology 270 (2015) 272–283
14
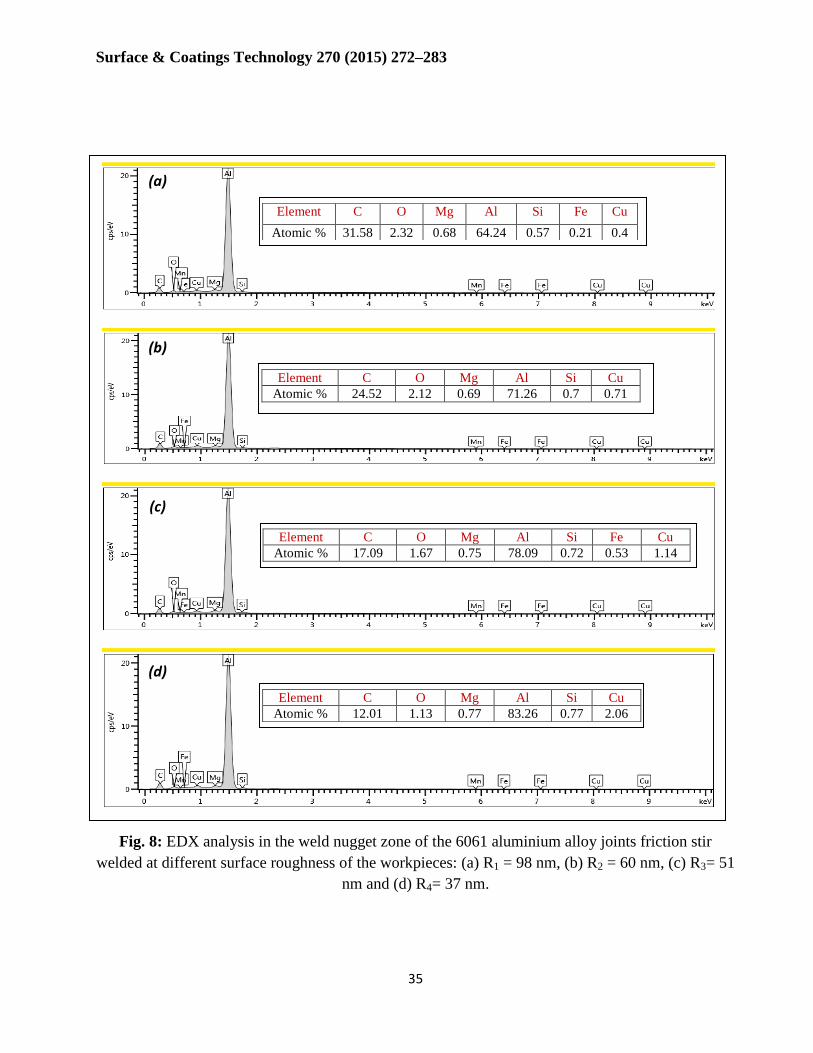
An EDX analysis was performed for the NZ joints to investigate the phases that were
formed during the FSW process. The results illustrated in Figs. 8(a, b, c and d) show that the
chemical composition was varied, without referring to the formation of brittle intermetallic
compounds. This variation is attributed to the variation in dispersive precipitates by pinning the
dislocations up to certain values of the shear and thermal stresses. The results are found to confirm
the presence of a large percentage of carbon particles and a significant proportion of oxygen. The
existence of carbon in the NZ might be due to the action of carbon atom diffusion from the welding
tool during the FSW process. The tool pin profile was observed to tend to wear out after a few runs
of welding, leading to a conical form. This behaviour occurred particularly while working with
relatively higher tensile strength materials. In contrast, Kim et al.[43] reported that, at constant
rotational speed, the mechanical resistance of joints increases with increasing the travel speed,
which is attributed to the decreased heat input. Accordingly, the present study introduced lower
heat generation due to the effects of the lower workpiece surface roughness, the small size of the
welding tool dimensions and the welding speed being relatively high; therefore, the possibility of
welding tool erosion was taken into consideration.
Oxidisation of the Al–Al welded joints is expected. Frictional heat generation and an
atmospheric humidity of 75% enhance the oxidation rates of aluminium during the welding process.
The results of EDX analysis indicate that the formation of aggregation compounds (wt% C and O)
diminishes gradually whenever the value of the workpiece surface roughness is decreased. This
phenomenon explains the absence of any nano pores and void-related effects on the top surface of
the welded joint, when the micro-range surface roughness is modified.
Surface & Coatings Technology 270 (2015) 272–283
15
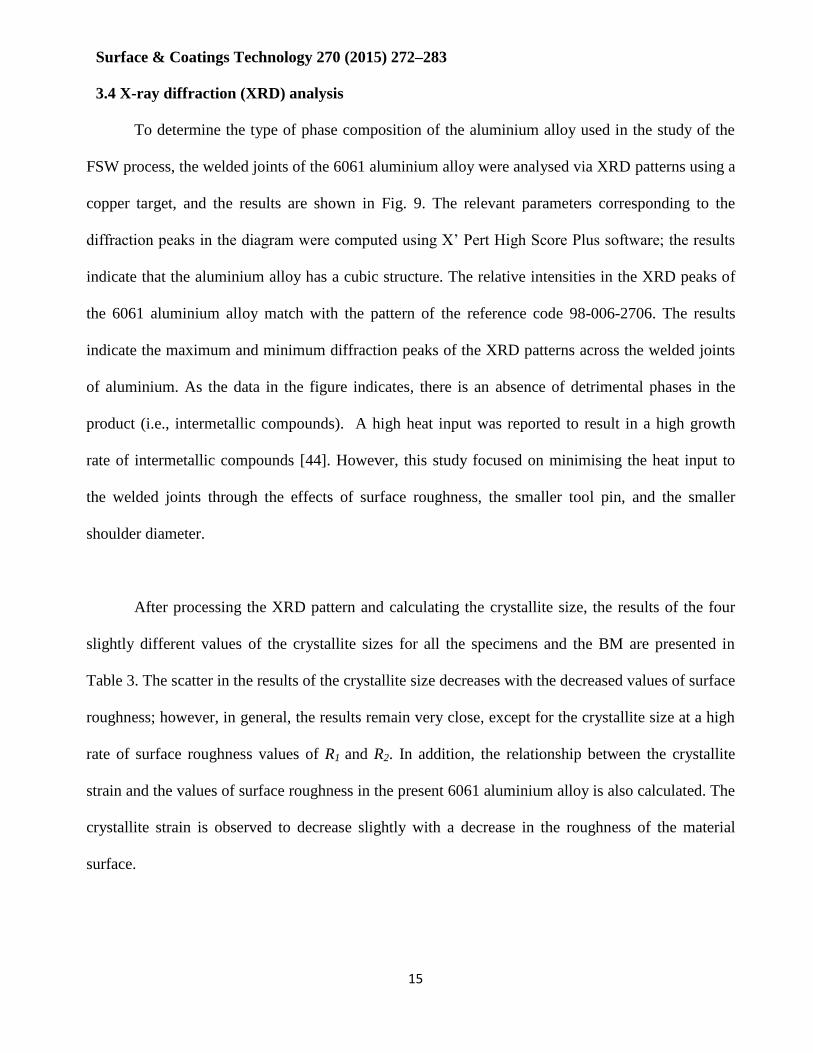
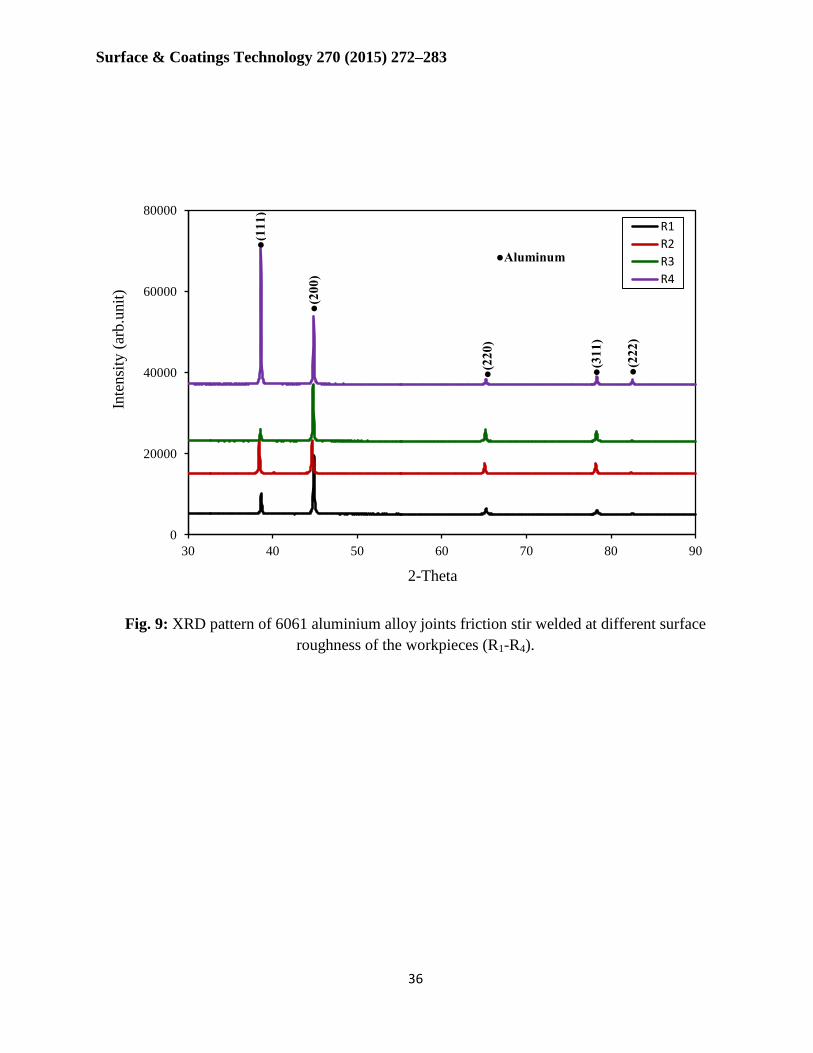
3.4 X-ray diffraction (XRD) analysis
To determine the type of phase composition of the aluminium alloy used in the study of the
FSW process, the welded joints of the 6061 aluminium alloy were analysed via XRD patterns using a
copper target, and the results are shown in Fig. 9. The relevant parameters corresponding to the
diffraction peaks in the diagram were computed using X’ Pert High Score Plus software; the results
indicate that the aluminium alloy has a cubic structure. The relative intensities in the XRD peaks of
the 6061 aluminium alloy match with the pattern of the reference code 98-006-2706. The results
indicate the maximum and minimum diffraction peaks of the XRD patterns across the welded joints
of aluminium. As the data in the figure indicates, there is an absence of detrimental phases in the
product (i.e., intermetallic compounds). A high heat input was reported to result in a high growth
rate of intermetallic compounds [44]. However, this study focused on minimising the heat input to
the welded joints through the effects of surface roughness, the smaller tool pin, and the smaller
shoulder diameter.
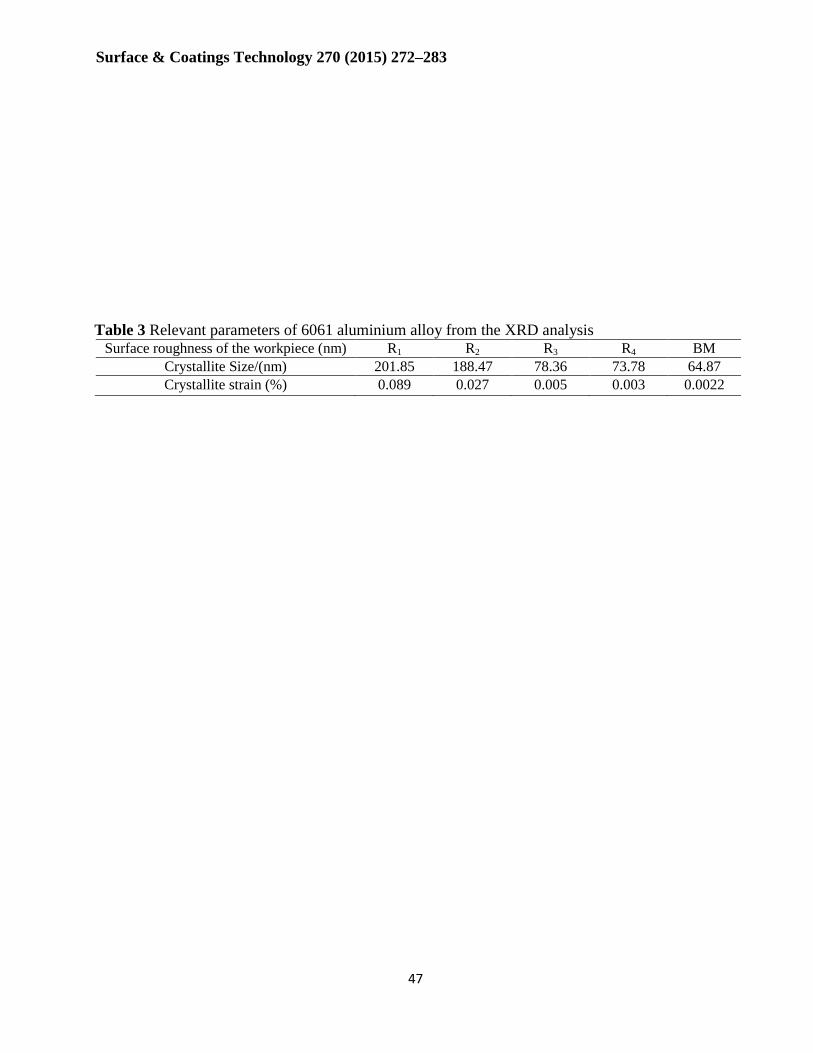
After processing the XRD pattern and calculating the crystallite size, the results of the four
slightly different values of the crystallite sizes for all the specimens and the BM are presented in
Table 3. The scatter in the results of the crystallite size decreases with the decreased values of surface
roughness; however, in general, the results remain very close, except for the crystallite size at a high
rate of surface roughness values of R1 and R2. In addition, the relationship between the crystallite
strain and the values of surface roughness in the present 6061 aluminium alloy is also calculated. The
crystallite strain is observed to decrease slightly with a decrease in the roughness of the material
surface.
Surface & Coatings Technology 270 (2015) 272–283
16
3.5 Measurement of the mechanical properties
3.5.1 Tensile strength of the joints
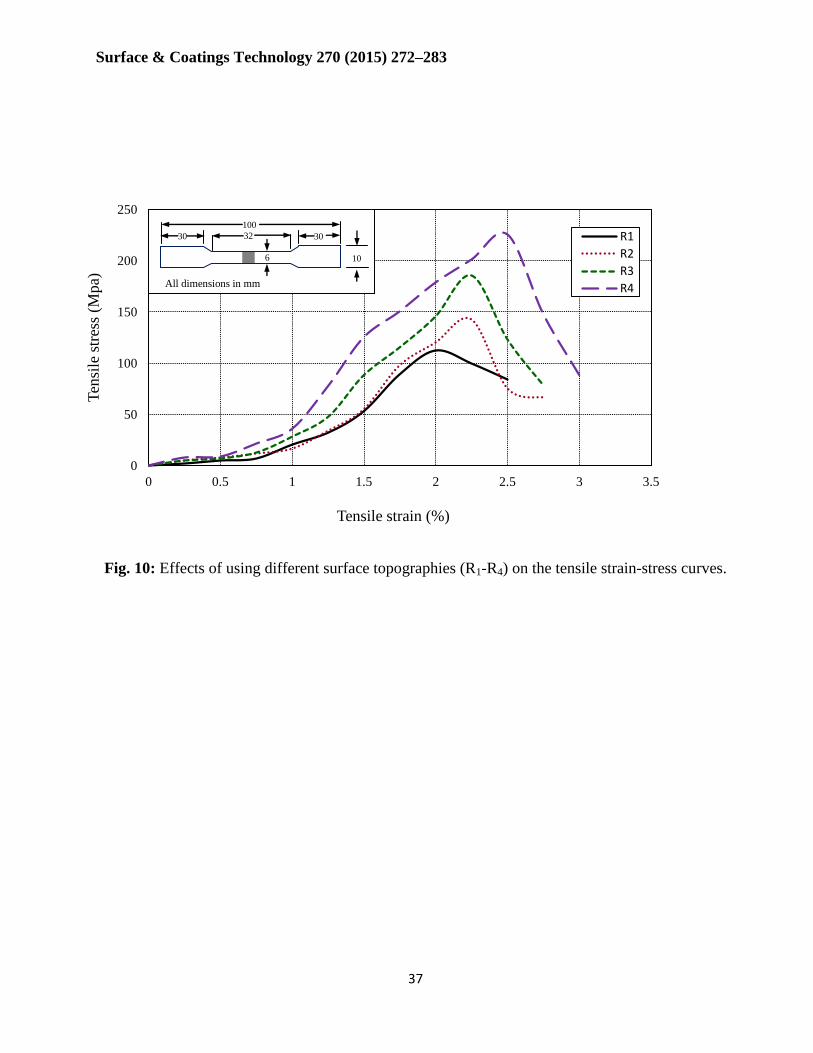
To determine the mechanical properties of the obtained welded joints, tensile engineering
stress-strain curves were performed, as shown in Fig. 10. Of the four joints, the joint fabricated with
a workpiece surface roughness of R4 exhibits a higher ultimate tensile strength (UTS) and
elongation at break compared to the other joints, which were fabricated at workpiece surface
roughnesses of R1, R2 and R3. As seen in this figure, the roughness of the material surface has a
perceptible influence on the tensile properties of the FSW joints. Similarly, the joint fabricated with
a workpiece surface roughness of R3 exhibits a moderate tensile strength when compared to that of
R4. However, the joint fabricated with a workpiece surface roughness of R1 exhibits an inferior UTS
and elongation at break compared to their counterparts.
There are two reasons for the value of UTS of the fabricated joints being less than the value
(355.6 MPa) of BM. One reason is the effect of the dissolved precipitates formed during FSW
process, which causes a reduction in the tensile strength of the joints. The other reason is the strong
tendency for intergranular cracking because of the combined effects of the weak grain boundaries
and the concentration of the grain boundary stress. Hence, cracks can expand rapidly along the
grain boundary. Therefore, the strength of the BM is higher than the strength of the welded joints.
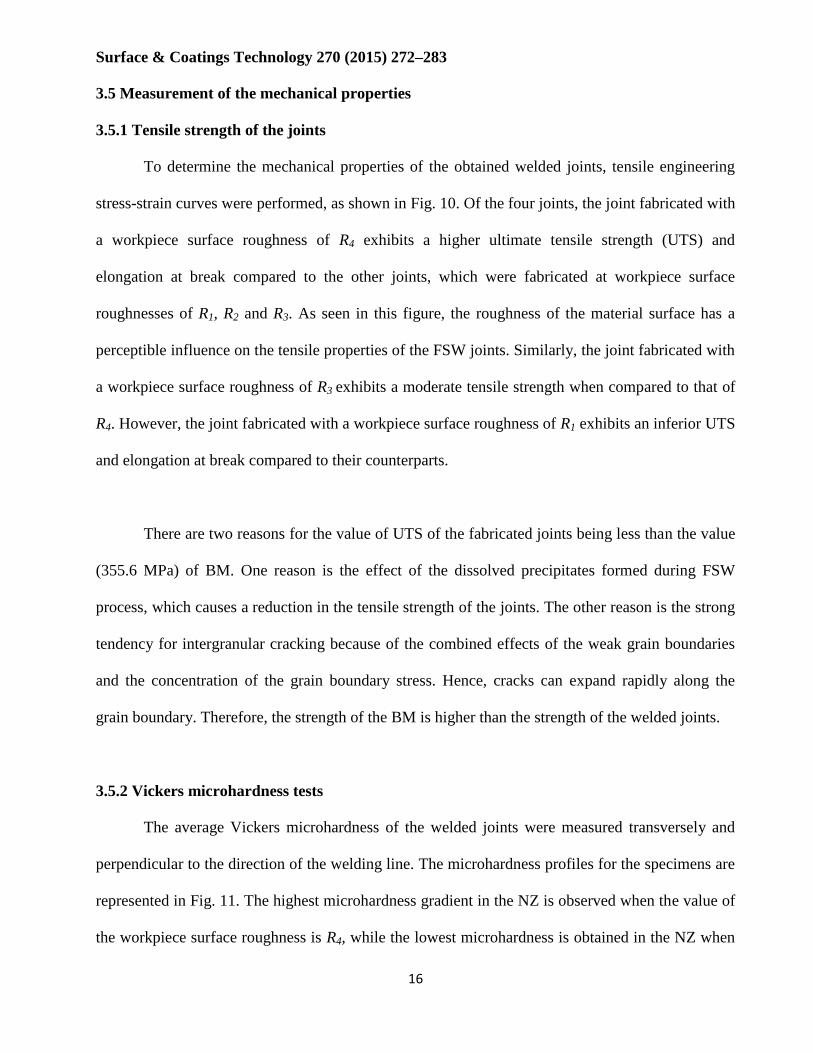
3.5.2 Vickers microhardness tests
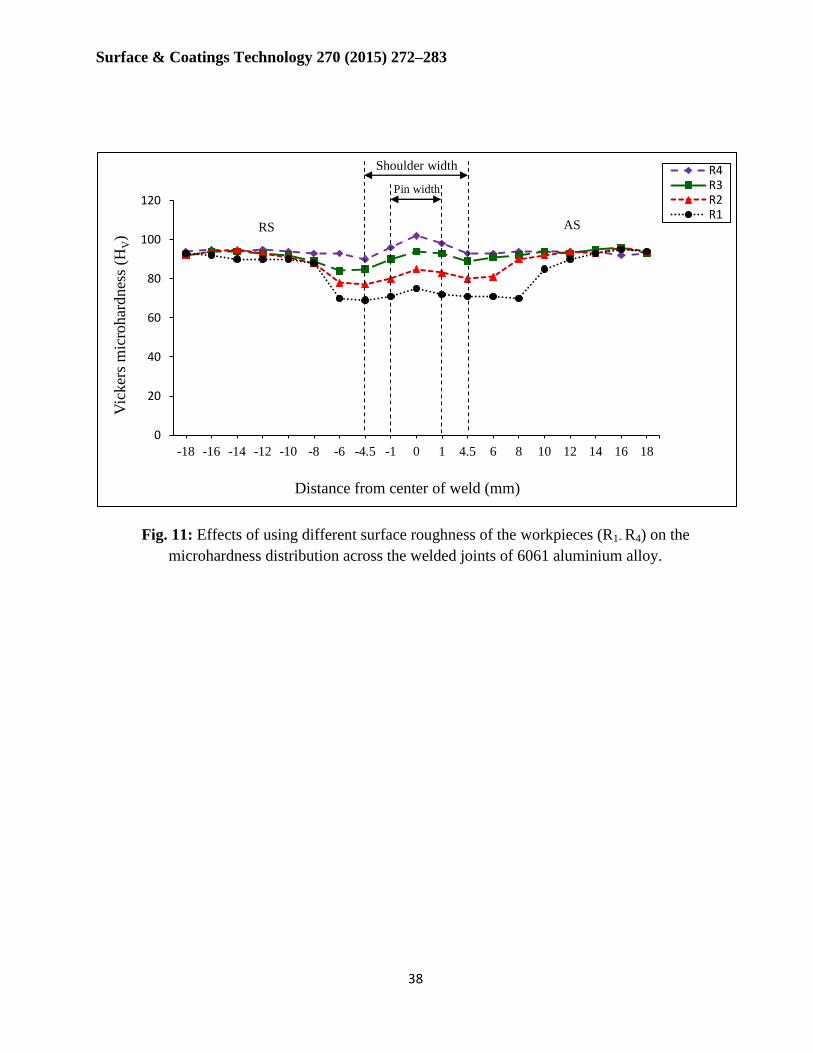
The average Vickers microhardness of the welded joints were measured transversely and
perpendicular to the direction of the welding line. The microhardness profiles for the specimens are
represented in Fig. 11. The highest microhardness gradient in the NZ is observed when the value of
the workpiece surface roughness is R4, while the lowest microhardness is obtained in the NZ when

Surface & Coatings Technology 270 (2015) 272–283
17
the value of the workpiece surface roughness is the highest (R1). Hence, the main difference
between both cases of microhardness is attributed to the workpiece surface roughnesses. As
previously mentioned, the lowest value of workpiece surface roughness will generate less heat
during the friction process. Therefore, in the present study, the microhardness of the NZ was found
to increase with the decreasing heat generation. This result is in good agreement with the respective
findings of Hirata et al. [40].
As described in the literature, in alloys such as the 6061 aluminium alloy, the main
strengthening precipitate is magnesium-silicon (Mg5Si6), which is stable at temperatures lower than
200˚C [45, 46]. This precipitate exists in the BM; however, the precipitate is absent in the NZ and
in the HAZ region. In the FSW, the temperatures are expected to be higher than 200 to 250˚C, and
Mg5Si6 is easily dissolved [42]. This precipitate is the main reason for the hardening behaviour. The
nugget microhardness revival is due to dynamic recrystallisation of a very fine grain structure. An
increase of the microhardness in the NZ was found due to the development of a fine-grained
microstructure. According to the well-known Hall-Petch relationship [40], the microhardness
increases slightly with decreasing grain size;
(3)
where Hv is the hardness, H0 and KH are the appropriate constants associated with the hardness
measurements, and d is the grain size. The reduction in workpiece surface roughness caused
decreases in the grain size; thus it increased the apparent microhardness (Hv) of the NZ according to
the Hall-Petch formula (Eq. 3).
2/1
0
dKHH Hv
Surface & Coatings Technology 270 (2015) 272–283
18
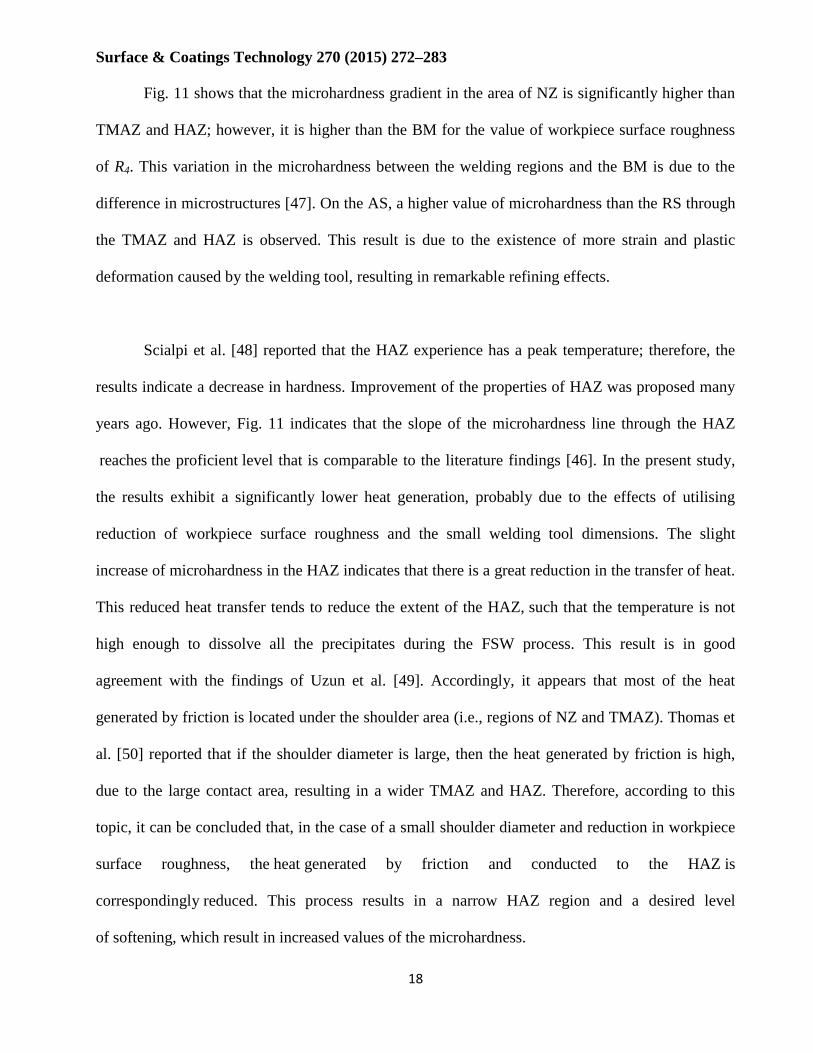
Fig. 11 shows that the microhardness gradient in the area of NZ is significantly higher than
TMAZ and HAZ; however, it is higher than the BM for the value of workpiece surface roughness
of R4. This variation in the microhardness between the welding regions and the BM is due to the
difference in microstructures [47]. On the AS, a higher value of microhardness than the RS through
the TMAZ and HAZ is observed. This result is due to the existence of more strain and plastic
deformation caused by the welding tool, resulting in remarkable refining effects.
Scialpi et al. [48] reported that the HAZ experience has a peak temperature; therefore, the
results indicate a decrease in hardness. Improvement of the properties of HAZ was proposed many
years ago. However, Fig. 11 indicates that the slope of the microhardness line through the HAZ
reaches the proficient level that is comparable to the literature findings [46]. In the present study,
the results exhibit a significantly lower heat generation, probably due to the effects of utilising
reduction of workpiece surface roughness and the small welding tool dimensions. The slight
increase of microhardness in the HAZ indicates that there is a great reduction in the transfer of heat.
This reduced heat transfer tends to reduce the extent of the HAZ, such that the temperature is not
high enough to dissolve all the precipitates during the FSW process. This result is in good
agreement with the findings of Uzun et al. [49]. Accordingly, it appears that most of the heat
generated by friction is located under the shoulder area (i.e., regions of NZ and TMAZ). Thomas et
al. [50] reported that if the shoulder diameter is large, then the heat generated by friction is high,
due to the large contact area, resulting in a wider TMAZ and HAZ. Therefore, according to this
topic, it can be concluded that, in the case of a small shoulder diameter and reduction in workpiece
surface roughness, the heat generated by friction and conducted to the HAZ is
correspondingly reduced. This process results in a narrow HAZ region and a desired level
of softening, which result in increased values of the microhardness.
Surface & Coatings Technology 270 (2015) 272–283
19
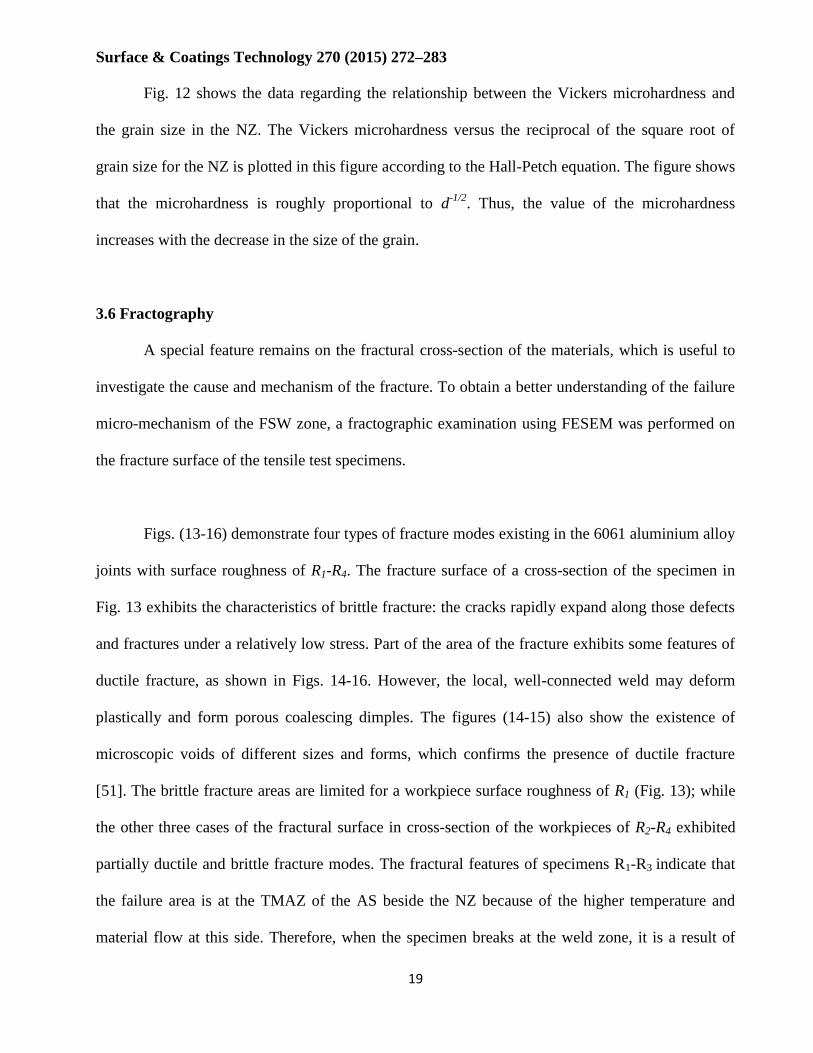
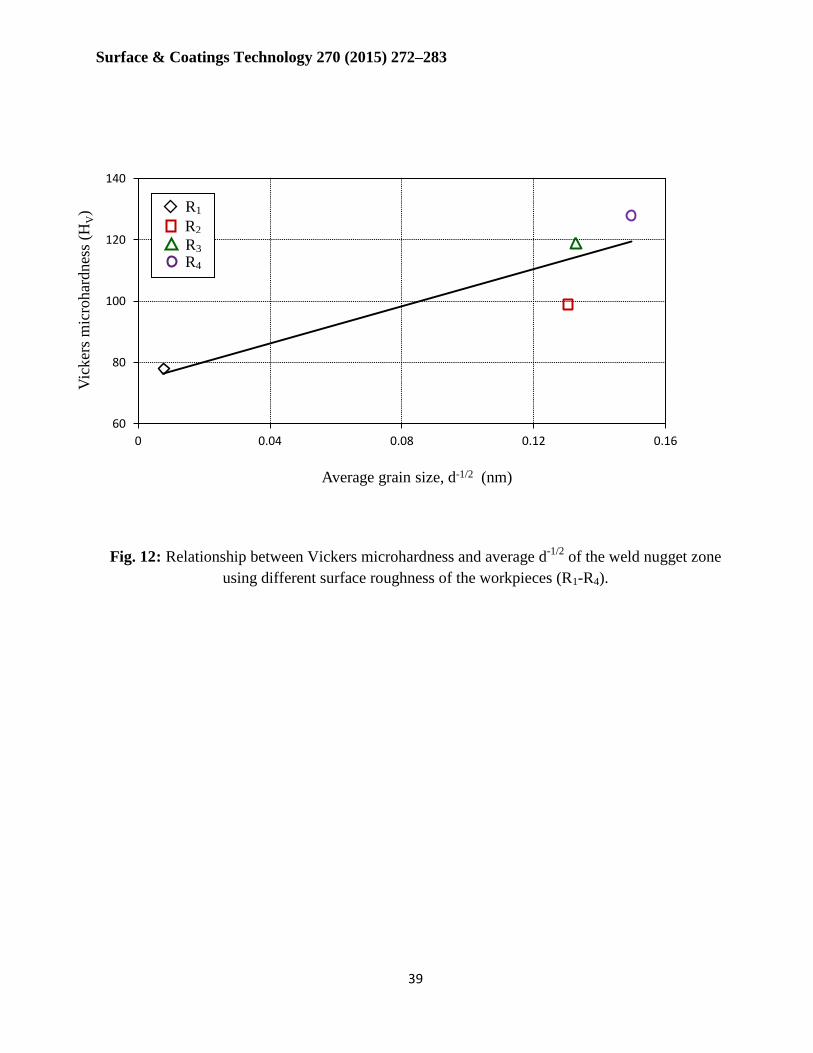
Fig. 12 shows the data regarding the relationship between the Vickers microhardness and
the grain size in the NZ. The Vickers microhardness versus the reciprocal of the square root of
grain size for the NZ is plotted in this figure according to the Hall-Petch equation. The figure shows
that the microhardness is roughly proportional to d-1/2
. Thus, the value of the microhardness
increases with the decrease in the size of the grain.
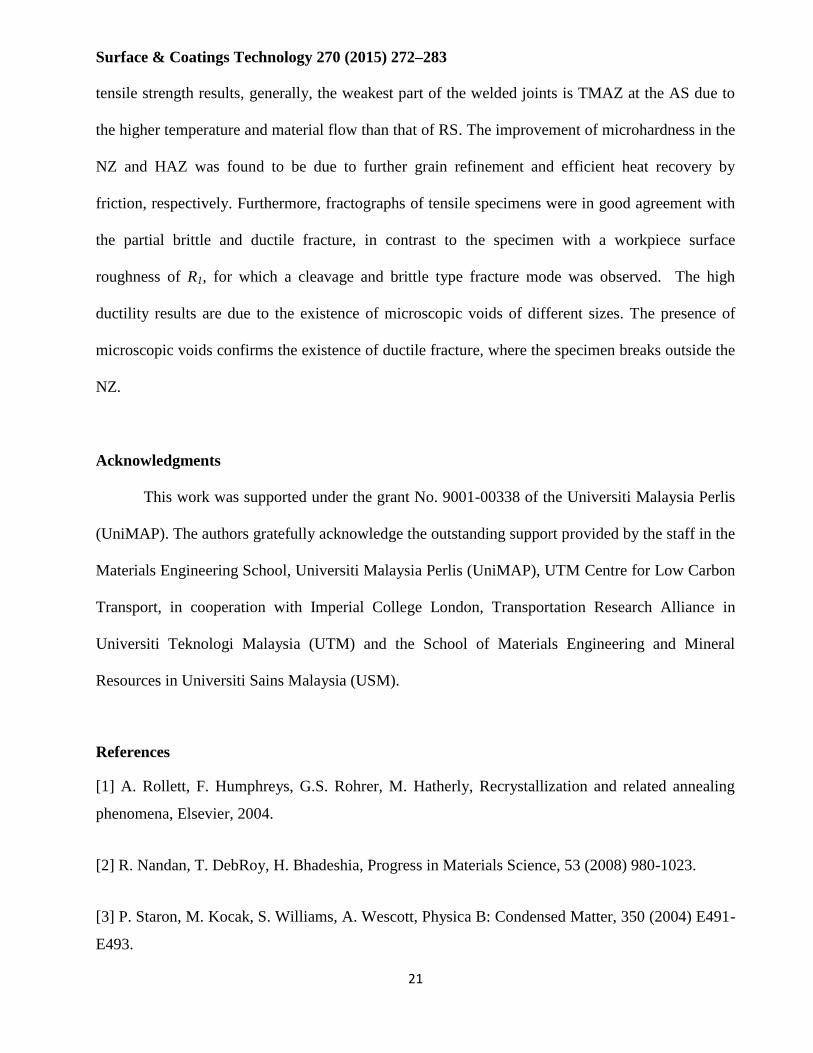
3.6 Fractography
A special feature remains on the fractural cross-section of the materials, which is useful to
investigate the cause and mechanism of the fracture. To obtain a better understanding of the failure
micro-mechanism of the FSW zone, a fractographic examination using FESEM was performed on
the fracture surface of the tensile test specimens.
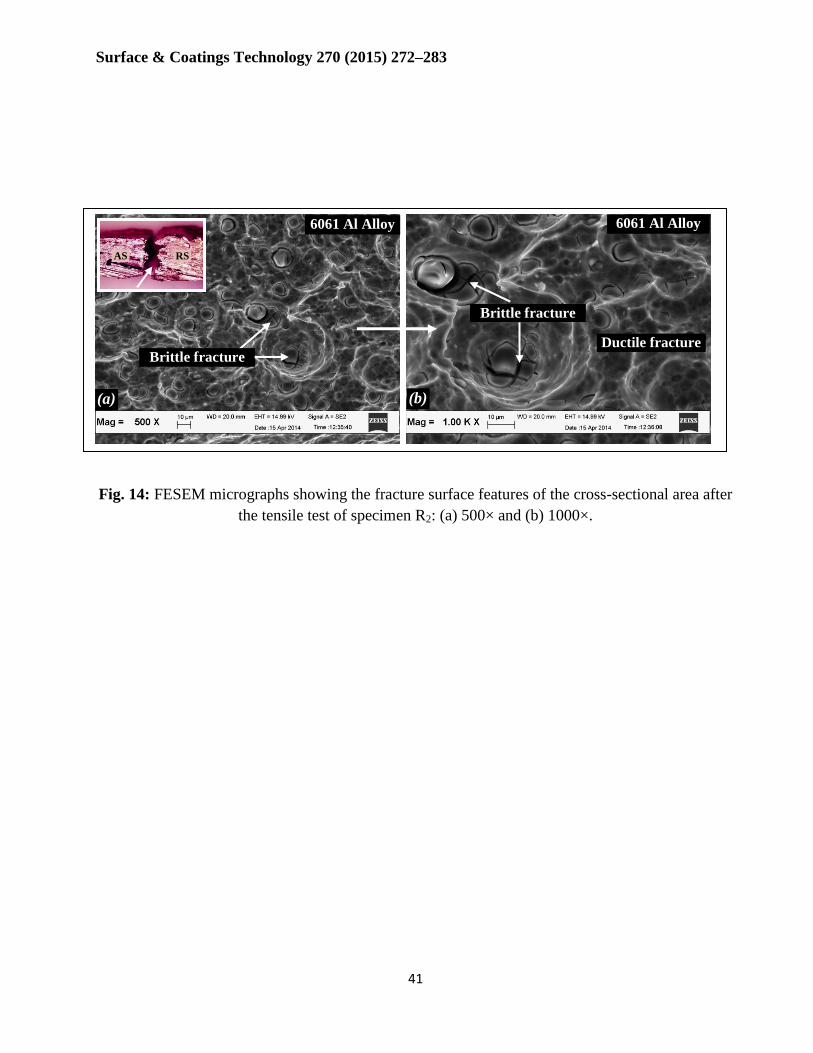
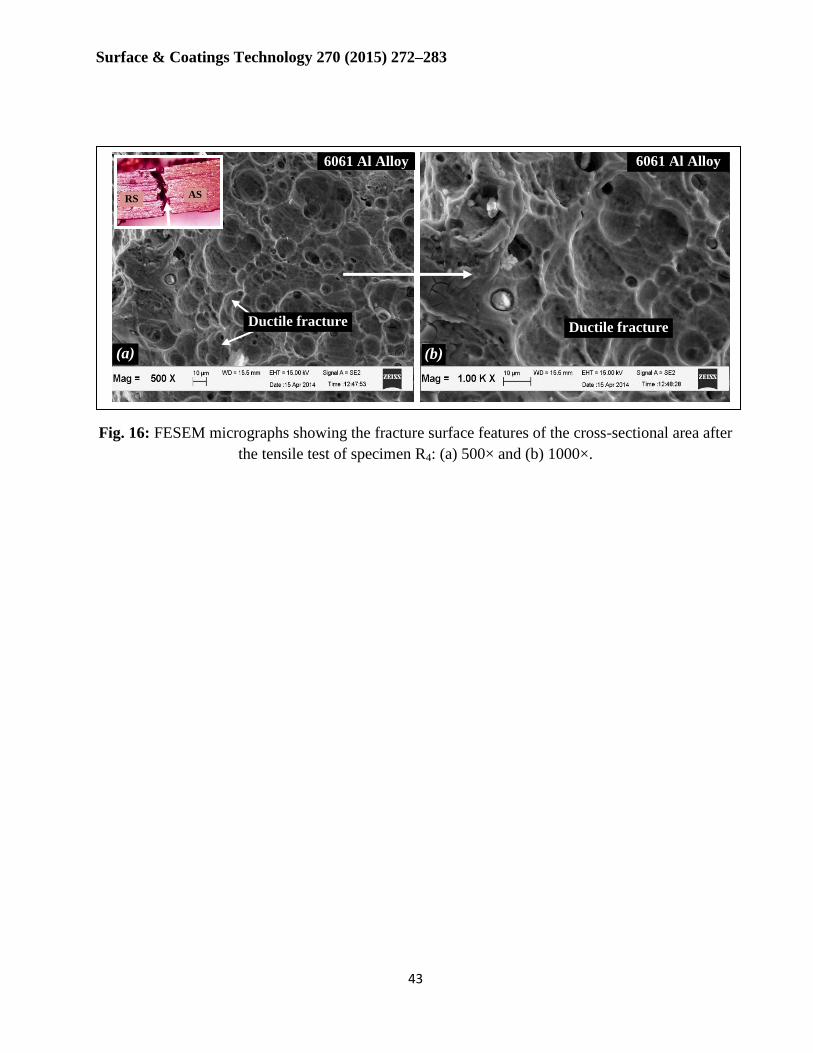
Figs. (13-16) demonstrate four types of fracture modes existing in the 6061 aluminium alloy
joints with surface roughness of R1-R4. The fracture surface of a cross-section of the specimen in
Fig. 13 exhibits the characteristics of brittle fracture: the cracks rapidly expand along those defects
and fractures under a relatively low stress. Part of the area of the fracture exhibits some features of
ductile fracture, as shown in Figs. 14-16. However, the local, well-connected weld may deform
plastically and form porous coalescing dimples. The figures (14-15) also show the existence of
microscopic voids of different sizes and forms, which confirms the presence of ductile fracture
[51]. The brittle fracture areas are limited for a workpiece surface roughness of R1 (Fig. 13); while
the other three cases of the fractural surface in cross-section of the workpieces of R2-R4 exhibited
partially ductile and brittle fracture modes. The fractural features of specimens R1-R3 indicate that
the failure area is at the TMAZ of the AS beside the NZ because of the higher temperature and
material flow at this side. Therefore, when the specimen breaks at the weld zone, it is a result of

Surface & Coatings Technology 270 (2015) 272–283
20
ductile and brittle fracture [51]. Specimen of R4, was fractured from the HAZ near the BM region,
which proves that the weld is sound. Hence, it can be inferred that the position of fracture in the
weld reflects the location of minimum microhardness region. From the microscopic fractographs
(Figs. 14-16) of the fractural surface cross-section, some small equiaxed dimples can be found,
indicating that a ductile fracture mode has occurred in these regions. Yu et al. [52] reported that the
small dimples come from the homogeneous microstructure of the small grains at the failure region.
The fractural surface cross-section also shows many petals, such as rip edges and a cleavage plan.
With the decrease in the value of the workpiece surface roughness (R), the fracture mode is found
to have a tendency to change from brittle fracture to ductile fracture, which corresponds to the
change of the elongation.
4. Conclusions
In this study, 6061 aluminium alloy workpieces with different surface roughness were
welded successfully via the FSW technique. The results indicated that the reduction in surface
roughness of the workpieces plays an important role in controlling the quality of the weld. The RS
of the specimens exhibited disappearance of flash gradually due to the effect of the reduction in
workpiece surface roughness, which caused the reduction of heat generation and made the material
less flexible and difficult to extrude under the tool shoulder area. Characterisations of
microstructure revealed that the HAZ was narrow due to the effect of reduced workpiece surface
roughness, which induced a lower level of shear stress under the tool shoulder. This mechanism
reduces the heat generation and heat conducted through the workpiece, which leads to a narrow
HAZ region. The effect of surface roughness was also found to coincide with a small tool pin and a
small shoulder diameter, which had the responsibility for the main mechanism of grain refinement.
Accordingly, the spherical nano-grain size was achieved in an economical manner. Regarding the
Surface & Coatings Technology 270 (2015) 272–283
21
tensile strength results, generally, the weakest part of the welded joints is TMAZ at the AS due to
the higher temperature and material flow than that of RS. The improvement of microhardness in the
NZ and HAZ was found to be due to further grain refinement and efficient heat recovery by
friction, respectively. Furthermore, fractographs of tensile specimens were in good agreement with
the partial brittle and ductile fracture, in contrast to the specimen with a workpiece surface
roughness of R1, for which a cleavage and brittle type fracture mode was observed. The high
ductility results are due to the existence of microscopic voids of different sizes. The presence of
microscopic voids confirms the existence of ductile fracture, where the specimen breaks outside the
NZ.
Acknowledgments
This work was supported under the grant No. 9001-00338 of the Universiti Malaysia Perlis
(UniMAP). The authors gratefully acknowledge the outstanding support provided by the staff in the
Materials Engineering School, Universiti Malaysia Perlis (UniMAP), UTM Centre for Low Carbon
Transport, in cooperation with Imperial College London, Transportation Research Alliance in
Universiti Teknologi Malaysia (UTM) and the School of Materials Engineering and Mineral
Resources in Universiti Sains Malaysia (USM).
References
[1] A. Rollett, F. Humphreys, G.S. Rohrer, M. Hatherly, Recrystallization and related annealing
phenomena, Elsevier, 2004.
[2] R. Nandan, T. DebRoy, H. Bhadeshia, Progress in Materials Science, 53 (2008) 980-1023.
[3] P. Staron, M. Kocak, S. Williams, A. Wescott, Physica B: Condensed Matter, 350 (2004) E491-
E493.
Surface & Coatings Technology 270 (2015) 272–283
22
[4] G. Liu, L. Murr, C. Niou, J. McClure, F. Vega, Scripta materialia, 37 (1997) 355-361.
[5] J. Koo, M. Luton, N. Bangaru, R. Petkovic, D. Fairchild, C. Petersen, H. Asahi, T. Hara, Y.
Terada, M. Sugiyama, International Journal of Offshore and Polar Engineering, 14 (2004) 2-10.
[6] D. Bello, S. Walton, Tribology international, 20 (1987) 59-65.
[7] P.K. Saha, W.R. Wilson, R.S. Timsit, Wear, 197 (1996) 123-129.
[8] W. Rasp, C. Wichern, Journal of Materials Processing Technology, 125 (2002) 379-386.
[9] R. Lakshmipathy, R. Sagar, International Journal of Machine Tools and Manufacture, 32 (1992)
685-693.
[10] S. Malayappan, R. Narayanasamy, The International Journal of Advanced Manufacturing
Technology, 23 (2004) 636-643.
[11] Y. Xie, J. Williams, Wear, 196 (1996) 21-34.
[12] A. Määttä, P. Vuoristo, T. Mäntylä, Tribology International, 34 (2001) 779-786.
[13] H. Staph, P. Ku, H. Carper, Mechanism and machine theory, 8 (1973) 197-208.
[14] Z. Hu, T. Dean, International Journal of Machine Tools and Manufacture, 40 (2000) 1637-
1649.
[15] P.L. Menezes, S.V. Kailas, Journal of tribology, 128 (2006) 697-704.
[16] J. Lundberg, Tribology international, 28 (1995) 317-322.
[17] M. Koura, Wear, 63 (1980) 1-12.
[18] K. Lu, J. Lu, Materials Science and Engineering: A, 375 (2004) 38-45.
Surface & Coatings Technology 270 (2015) 272–283
23
[19] R.Z. Valiev, R.K. Islamgaliev, I.V. Alexandrov, Progress in materials science, 45 (2000) 103-
189.
[20] L. Jian, J. Mater. Sci. Technol, 15 (1999) 193.
[21] H. Zhang, Z. Hei, G. Liu, J. Lu, K. Lu, Acta Materialia, 51 (2003) 1871-1881.
[22] B. Arifvianto, in: Instrumentation, Communications, Information Technology, and
Biomedical Engineering (ICICI-BME), 2009 International Conference on, IEEE, 2009, pp. 1-4.
[23] G. Liu, J. Lu, K. Lu, Materials Science and Engineering: A, 286 (2000) 91-95.
[24] G. Liu, S. Wang, X. Lou, J. Lu, K. Lu, Scripta Materialia, 44 (2001) 1791-1795.
[25] N. Tao, Z. Wang, W. Tong, M. Sui, J. Lu, K. Lu, Acta Materialia, 50 (2002) 4603-4616.
[26] X. Wu, N. Tao, Y. Hong, B. Xu, J. Lu, K. Lu, Acta Materialia, 50 (2002) 2075-2084.
[27] D. Hughes, N. Hansen, Physical Review Letters, 87 (2001) 135503.
[28] W. Li, N. Tao, K. Lu, Scripta Materialia, 59 (2008) 546-549.
[29] B. Thompson, K. Doherty, J. Su, R. Mishra, Friction Stir Welding and Processing VII, (2013)
9-19.
[30] D. Zhang, M. Suzuki, K. Maruyama, Scripta materialia, 52 (2005) 899-903.
[31] A. Feng, Z. Ma, Scripta materialia, 56 (2007) 397-400.
[32] W. Woo, H. Choo, D. Brown, P. Liaw, Z. Feng, Scripta materialia, 54 (2006) 1859-1864.
[33] C. Chang, X. Du, J. Huang, Scripta Materialia, 57 (2007) 209-212.
Surface & Coatings Technology 270 (2015) 272–283
24
[34] G. Bhargava, W. Yuan, S. Webb, R.S. Mishra, Metallurgical and Materials Transactions A, 41
(2010) 13-17.
[35] C. Chang, X. Du, J. Huang, Scripta materialia, 59 (2008) 356-359.
[36] W. Yuan, S. Panigrahi, J.-Q. Su, R. Mishra, Scripta Materialia, 65 (2011) 994-997.
[37] M. Sutton, B. Yang, A. Reynolds, R. Taylor, Materials Science and Engineering: A, 323
(2002) 160-166.
[38] K. Krishnan, Materials science and engineering: A, 327 (2002) 246-251.
[39] Y. Li, L. Murr, J. McClure, Materials Science and Engineering: A, 271 (1999) 213-223.
[40] T. Hirata, T. Oguri, H. Hagino, T. Tanaka, S.W. Chung, Y. Takigawa, K. Higashi, Materials
Science and Engineering: A, 456 (2007) 344-349.
[41] Ø. Frigaard, Ø. Grong, O. Midling, Metallurgical and materials transactions A, 32 (2001)
1189-1200.
[42] L.-E. Svensson, L. Karlsson, H. Larsson, B. Karlsson, M. Fazzini, J. Karlsson, Science and
technology of welding and joining, 5 (2000) 285-296.
[43] Y. Kim, H. Fujii, T. Tsumura, T. Komazaki, K. Nakata, Materials Science and Engineering: A,
415 (2006) 250-254.
[44] Y.S. Sato, M. Urata, H. Kokawa, Metallurgical and Materials Transactions A, 33 (2002) 625-
635.
[45] Ø. Grong, D. Grong, Metallurgical modelling of welding, Institute of materials London, 1997.
[46] P. Moreira, T. Santos, S. Tavares, V. Richter-Trummer, P. Vilaça, P. De Castro, Materials &
design, 30 (2009) 180-187.
Surface & Coatings Technology 270 (2015) 272–283
25
[47] G.R. Babu, K. Murti, G.R. Janardhana, ARPN Journal of engineering and applied sciences, 3
(2008) 68-74.
[48] A. Scialpi, M. De Giorgi, L. De Filippis, R. Nobile, F. Panella, Materials & Design, 29 (2008)
928-936.
[49] H. Uzun, C. Dalle Donne, A. Argagnotto, T. Ghidini, C. Gambaro, Materials & design, 26
(2005) 41-46.
[50] W. Thomas, E. Nicholas, Materials & design, 18 (1997) 269-273.
[51] K. Kumari, S.K. Pal, S.B. Singh, Journal of Materials Processing Technology, 215 (2015) 132-
141.
[52] L. Yu, K. Nakata, J. Liao, Journal of Alloys and Compounds, 480 (2009) 340-346.
Surface & Coatings Technology 270 (2015) 272–283
26
List of Figures
Fig. 1: Typical 3D surface roughness maps of different surface roughness of the workpieces
measured using Atomic Force Microscopy (AFM); (a) R1 = 98 nm, (b) R2 =60 nm, (c) R3=51 nm
and (d) R4=37 nm.
Fig. 2: (a) Schematic diagram of the FSW process and (b) the welding tool dimensions.
Fig. 3: Typical images of 6061 aluminium alloy surface appearances of friction stir welded with the
following surface roughness values; (a) R1 = 98 nm, (b) R2 = 60 nm, (c) R3= 51 nm and (d) R4= 37
nm.
Fig. 4: Variation of the workpiece surface roughness (R1-R4) and the friction coefficient with the
average friction temperature for joining pieces of 6061 aluminium alloy via friction stir welding.
Fig. 5: Variation of the workpiece surface roughness and the friction coefficient (µ) on the
frictional heat flux for joining pieces of 6061 aluminium alloy.
Fig. 6: Optical images of 6061 aluminium alloy joints friction stir welded with different surface
roughness of the workpieces: (a) R1 = 98 nm, (b) R2 = 60 nm, (c) R3= 51 nm and (d) R4= 37 nm.
Fig. 7: FESEM micrographs showing grain microstructures in the weld nugget zone of 6061
aluminium alloy joints friction stir welded with different surface roughness of the workpieces: (a)
R1 = 98 nm, (b) R2 = 60 nm, (c) R3= 51 nm and (d) R4= 37 nm.
Fig. 8: EDX analysis in the weld nugget zone of the 6061 aluminium alloy joints friction stir
welded at different surface roughness of the workpieces: (a) R1 = 98 nm, (b) R2 = 60 nm, (c) R3= 51
nm and (d) R4= 37 nm.
Fig. 9: XRD pattern of 6061 aluminium alloy joints friction stir welded at different surface
roughness of the workpieces (R1-R4).
Fig. 10: Effects of using different surface topographies (R1-R4) on the tensile strain-stress curves.
Fig. 11: Effects of using different surface roughness of the workpieces (R1- R4) on the
microhardness distribution across the welded joints of 6061 aluminium alloy.
Fig. 12: Relationship between Vickers microhardness and average d-1/2
of the weld nugget zone
using different surface roughness of the workpieces (R1-R4).
Fig. 13: FESEM micrographs showing the fracture surface features of the cross-sectional area after
the tensile test of specimen R1: (a) 500× and (b) 1000×.

Surface & Coatings Technology 270 (2015) 272–283
27
Fig. 14: FESEM micrographs showing the fracture surface features of the cross-sectional area after
the tensile test of specimen R2: (a) 500× and (b) 1000×.
Fig. 15: FESEM micrographs showing the fracture surface features of the cross-sectional area after
the tensile test of specimen R3: (a) 500× and (b) 1000×.
Fig. 16: FESEM micrographs showing the fracture surface features of the cross-sectional area after
the tensile test of specimen R4: (a) 500× and (b) 1000×.
Surface & Coatings Technology 270 (2015) 272–283
28
Fig. 1: Typical 3D surface roughness maps of different surface roughness of the workpieces
measured using Atomic Force Microscopy (AFM); (a) R1 = 98 nm, (b) R2 =60 nm, (c) R3=51 nm
and (d) R4=37 nm.
1
0.0 nm
5 µm
4
3
2
1
5 µm
1 2 3 4
2
3
4
5 µm
413.6 nm
1
21.7 nm
5 µm
4
3
2
1
5 µm
1 2 3 4
2
3
4
5 µm
248.4 nm
244.8 nm
23.3 nm
5 µm
4
3
2
1
5 µm
1 2 3 4
1
2
3
4
5 µm
1
25.6 nm
5 µm
4
3
2
1
5 µm
1 2 3 4
2
3
4
5 µm
252.8 nm
(a) (b)
(c) (d)
Surface & Coatings Technology 270 (2015) 272–283
29
Fig. 2: (a) Schematic diagram of the FSW process and (b) the welding tool dimensions.
Tool shoulder
Axial force
Tool pin
Retreating side
Advancing side
Welding direction
Rotational direction
2mm
3.7mm
9mm
(a) (b)
Surface & Coatings Technology 270 (2015) 272–283
30
Fig. 3: Typical images of 6061 aluminium alloy surface appearances of friction stir welded with the
following surface roughness values; (a) R1 = 98 nm, (b) R2 = 60 nm, (c) R3= 51 nm and (d) R4= 37
nm.
R1 R2
R3 R4
(a) (b)
(c) (d)
Retreating Side
Retreating Side Retreating Side
Retreating Side
Advancing Side
Advancing Side Advancing Side
Advancing Side
Surface & Coatings Technology 270 (2015) 272–283
31
Fig. 4: Variation of the workpiece surface roughness (R1-R4) and the friction coefficient with the
average friction temperature for joining pieces of 6061 aluminium alloy via friction stir welding.
0.34
0.36
0.38
0.4
0.42
190 210 230 250 270 290 310
Fri
ctio
n c
oef
fici
ent
(µ)
Average temperature (˚C )
R4
R3
R2
R1
Surface & Coatings Technology 270 (2015) 272–283
32
Fig. 5: Variation of the workpiece surface roughness and the friction coefficient (µ) on the
frictional heat flux for joining pieces of 6061 aluminium alloy.
26
28
30
32
34
36
R1 R2 R3 R4
Hea
t fl
ux
(w
att/
mm
2)
Workpiece surface roughness (nm)
Surface & Coatings Technology 270 (2015) 272–283
33
Fig. 6: Optical images of 6061 aluminium alloy joints friction stir welded with different surface
roughness of the workpieces: (a) R1 = 98 nm, (b) R2 = 60 nm, (c) R3= 51 nm and (d) R4= 37 nm.
(a)
(d)
(b)
(c)
BM
HAZ
TMAZ
Interface
TMAZ
HAZ
BM
Interface
BM HAZ TMAZ
Interface
TMAZ HAZ
BM
NZ
NZ NZ
NZ
100µm 100µm
100µm 100µm
Surface & Coatings Technology 270 (2015) 272–283
34
Fig. 7: FESEM micrographs showing grain microstructures in the weld nugget zone of 6061
aluminium alloy joints friction stir welded with different surface roughness of the workpieces: (a)
R1 = 98 nm, (b) R2 = 60 nm, (c) R3= 51 nm and (d) R4= 37 nm.
(a) (b) (a) Recrystallized nano grains
(b) Recrystallized nano grains
6061 aluminum alloy
6061 aluminum alloy
6061 aluminum alloy
(c)
(a)
(c)
(b)
Spherical nano grains
6061 aluminium alloy
6061 aluminum alloy
6061 aluminium alloy
Spherical nano grains
Spherical nano grains
(d) 6061 aluminium alloy
Surface & Coatings Technology 270 (2015) 272–283
35
Fig. 8: EDX analysis in the weld nugget zone of the 6061 aluminium alloy joints friction stir
welded at different surface roughness of the workpieces: (a) R1 = 98 nm, (b) R2 = 60 nm, (c) R3= 51
nm and (d) R4= 37 nm.
(a)
(b)
(c)
Element C O Mg Al Si Fe Cu
Atomic % 31.58 2.32 0.68 64.24 0.57 0.21 0.4
Element C O Mg Al Si Cu
Atomic % 24.52 2.12 0.69 71.26 0.7 0.71
Element C O Mg Al Si Fe Cu
Atomic % 17.09 1.67 0.75 78.09 0.72 0.53 1.14
Element C O Mg Al Si Cu
Atomic % 12.01 1.13 0.77 83.26 0.77 2.06
(d)
Surface & Coatings Technology 270 (2015) 272–283
36
Fig. 9: XRD pattern of 6061 aluminium alloy joints friction stir welded at different surface
roughness of the workpieces (R1-R4).
0
20000
40000
60000
80000
30 40 50 60 70 80 90
Inte
nsi
ty (
arb.u
nit
)
2-Theta
R1
R2
R3
R4
●(2
20
)
●(3
11
)
●(2
22
)
●(2
00
)
●(1
11
) ●Aluminum
Surface & Coatings Technology 270 (2015) 272–283
37
Fig. 10: Effects of using different surface topographies (R1-R4) on the tensile strain-stress curves.
0
50
100
150
200
250
0 0.5 1 1.5 2 2.5 3 3.5
Ten
sile
str
ess
(Mpa)
Tensile strain (%)
R1
R2
R3
R4
100
32
6 10
30 30
All dimensions in mm
Surface & Coatings Technology 270 (2015) 272–283
38
Fig. 11: Effects of using different surface roughness of the workpieces (R1- R4) on the
microhardness distribution across the welded joints of 6061 aluminium alloy.
0
20
40
60
80
100
120
-18 -16 -14 -12 -10 -8 -6 -4.5 -1 0 1 4.5 6 8 10 12 14 16 18
Vic
ker
s m
icro
har
dnes
s (H
V)
Distance from center of weld (mm)
R4 R3 R2 R1
Shoulder width
Pin width
AS RS
Surface & Coatings Technology 270 (2015) 272–283
39
Fig. 12: Relationship between Vickers microhardness and average d-1/2
of the weld nugget zone
using different surface roughness of the workpieces (R1-R4).
60
80
100
120
140
0 0.04 0.08 0.12 0.16
Vic
ker
s m
icro
har
dn
ess
(HV)
Average grain size, d-1/2 (nm)
R4
R3
R2
R1

Surface & Coatings Technology 270 (2015) 272–283
40
Fig. 13: FESEM micrographs showing the fracture surface features of the cross-sectional area after
the tensile test of specimen R1: (a) 500× and (b) 1000×.
(b)
6061 Al Alloy 6061 Al Alloy
Brittle fracture
Rip edges
RS AS
(a)
Surface & Coatings Technology 270 (2015) 272–283
41
Fig. 14: FESEM micrographs showing the fracture surface features of the cross-sectional area after
the tensile test of specimen R2: (a) 500× and (b) 1000×.
(a) (b)
6061 Al Alloy 6061 Al Alloy
Ductile fracture
Brittle fracture
AS RS
Brittle fracture

Surface & Coatings Technology 270 (2015) 272–283
42
Fig. 15: FESEM micrographs showing the fracture surface features of the cross-sectional area after
the tensile test of specimen R3: (a) 500× and (b) 1000×.
(a) (b)
6061 Al Alloy 6061 Al Alloy
Brittle fracture
AS RS
Ductile fracture
Ductile fracture
Surface & Coatings Technology 270 (2015) 272–283
43
Fig. 16: FESEM micrographs showing the fracture surface features of the cross-sectional area after
the tensile test of specimen R4: (a) 500× and (b) 1000×.
(a)
6061 Al Alloy
(b)
6061 Al Alloy
RS AS
Ductile fracture Ductile fracture

Surface & Coatings Technology 270 (2015) 272–283
44
List of Tables:
Table 1 Chemical compositions of the base metal
Table 2 Chemical compositions of the welding tool
Table 3 Relevant parameters of 6061 aluminium alloy from the XRD analysis

Surface & Coatings Technology 270 (2015) 272–283
45
Table 1 Chemical compositions of the base metal
Element Al Si Fe Mg Cu Mn
wt % 97.57 0.525 0.339 1.062 0.120 0.080
Surface & Coatings Technology 270 (2015) 272–283
46
Table 2 Chemical compositions of the welding tool
Element C Mn P Fe
wt % 0.44 0.79 0.012 Balance
Surface & Coatings Technology 270 (2015) 272–283
47
Table 3 Relevant parameters of 6061 aluminium alloy from the XRD analysis
Surface roughness of the workpiece (nm) R1 R2 R3 R4 BM
Crystallite Size/(nm) 201.85 188.47 78.36 73.78 64.87
Crystallite strain (%) 0.089 0.027 0.005 0.003 0.0022
Copyright © 2022 FDOKUMEN