Effects of sintering temperatures on microstructures and ...
JOURNAL OF GEOPHYSICAL RESEARCH, VOL. 85, NO. B I 1, PAGES 6253-6262, NOVEMBER 10, 1980
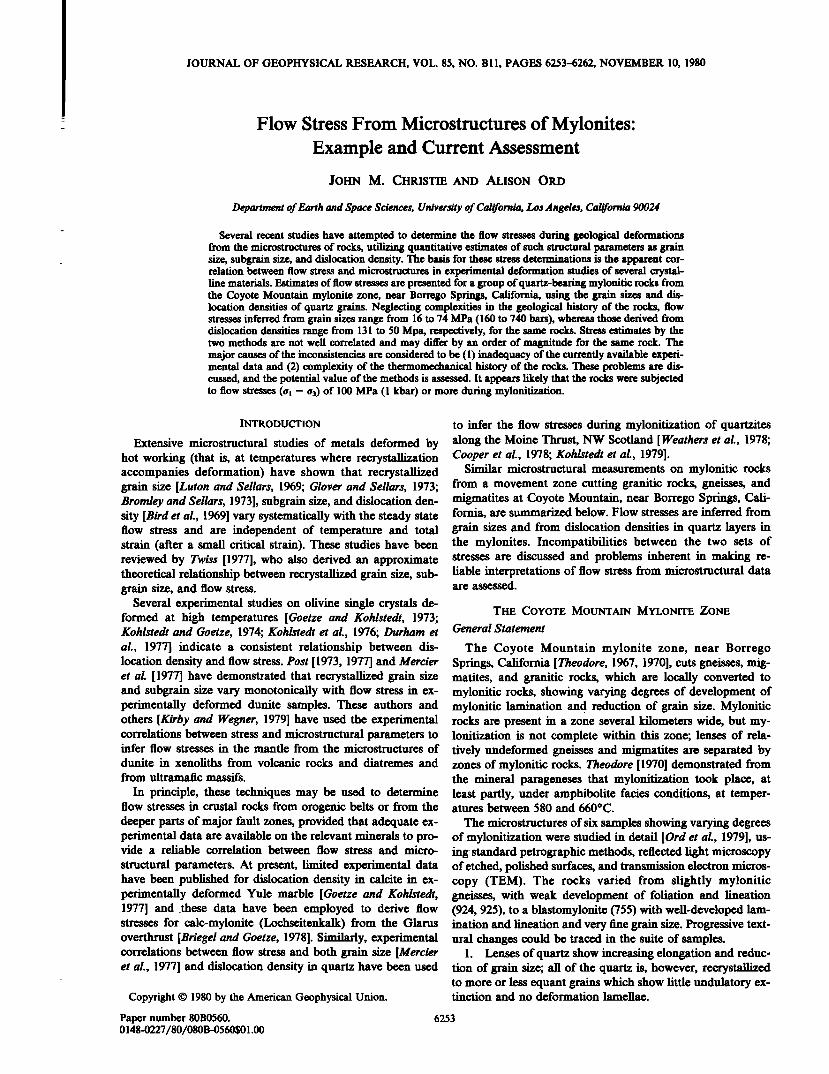
Flow Stress From Microstructures of Mylonites: Example and Current Assessment
JOHN M. CHRISTIE AND ALISON ORD
Department of Earth and Space Sciences, University of California, Los Angeles, California 90024
Several recent studies have attempted to determine the flow stresses during geological deformations from the microstructures of rocks, utilizing quantitative estimates of such structural parameters as grain size, subgrain size, and dislocation density. The basis for these stress determinations is the apparent cor- relation between flow stress and microstructures in experimental deformation studies of several crystal- line materials. Estimates of flow stresses are presented for a group of quartz-bearing mylonitic rocks from the Coyote Mountain mylonite zone, near Borrego Springs, California, using the grain sizes and dis- location densities of quartz grains. Neglecting complexities in the geological history of the rocks, flow stresses inferred from grain sizes range from 16 to 74 MPa (160 to 740 bars), whereas those derived from dislocation demities range from 131 to 50 Mpa, respectively, for the same rocks. Stress estimates by the two methods are not well correlated and may differ by an order of magnitude for the same rock. The major causes of the inconsistencies are considered to be (1) inadequacy of the currently available experi- mental data and (2) complexity of the thermomechanical history of the rocks. These problems are dis- cussed, and the potential value of the methods is assessed. It appears likely that the rocks were subjected to flow stresses (o• - 03) of 100 MPa (1 kbar) or more during mylonitization.
INTRODUCTION
Extensive microstructural studies of metals deformed by hot working (that is, at temperatures where recrystallization accompanies deformation) have shown that recrystallized grain size [Luton and Sellars, 1969; Glover and Sellars, 1973; Bromley and Sellars, 1973], subgrain size, and dislocation den- sity [Bird et al., 1969] vary systematically with the steady state flow stress and are independent of temperature and total strain (after a small critical strain). These studies have been reviewed by Twiss [1977], who also derived an approximate theoretical relationship between recrystallized grain size, sub- grain size, and flow stress.
Several experimental studies on olivine single crystals de- formed at high temperatures [Goetze and Kohlstedt, 1973; Kohlstedt and Goetze, 1974; Kohlstedt et aL, 1976; Durham et aL, 1977] indicate a consistent relationship between dis- location density and flow stress. Post [1973, 1977] and Mercier et al. [1977] have demonstrated that recrystallized grain size and subgrain size vary monotonically with flow stress in ex- perimentally deformed dunitc samples. These authors and others [Kirby and Wegner, 1979] have used the experimental correlations between stress and microstructural parameters to
to infer the flow stresses during mylonitization of quartzites along the Moine Thrust, NW Scotland [Weathers et aL, 1978; Cooper et aL, 1978; Kohlstedt et at, 1979].
Similar microstructural measurements on mylonitic rocks from a movement zone cutting granitic rocks, gneisses, and migmatites at Coyote Mountain, near Borrego Springs, Cali- fornia, are summarized below. Flow stresses are inferred from grain sizes and from dislocation densities in quartz layers in the mylonites. Incompatibilities between the two sets of stresses are discussed and problems inherent in making re- liable interpretations of flow stress from microstructural data are assessed.
THE COYOTE MOUNTAIN MYLONITE ZONE
General Statement
The Coyote Mountain mylonite zone, near Borrego Springs, California [Theodore, 1967, 1970], cuts gneisses, mig- matites, and granitic rocks, which are locally converted to mylonitic rocks, showing varying degrees of development of mylonitic lamination an d reduction of grain size. Mylonitic rocks are present in a zone several kilometers wide, but my- 1onitization is not complete within this zone; lenses of rela-
infer flow stresses in the mantle from the microstructures of tively undeformed gneisses and migmatites are separated by dunitc in xenoliths from volcanic rocks and diatremes and from ultramafic massifs.
In principle, these techniques may -be used to determine flow stresses in crustal rocks from orogenic belts or from the deeper parts of major fault zones, provided that adequate ex- perimental data are available on the relevant minerals to pro- vide a reliable correlation between flow stress and micro-
structural parameters. At present, limited experimental data have been published for dislocation density in calcite in ex- perimentally deformed Yule marble [Goetze and Kohlstedt, 1977] and .these data have been employed to derive flow stresses for calc-mylonite (Lochseitenkalk) from the Glarus overthrust [Briegel and Goetze, 1978]. Similarly, experimental correlations between flow stress and both grain size [Mercier et aL, 1977] and dislocation density in quartz have been used
Copyright ̧ 1980 by the American Geophysical Union.
zones of mylonitic rocks. Theodore [1970] demonstrated from the mineral parageneses that mylonitization took place, at least partly, under amphibolite facies conditions, at temper- atures between 580 and 660øC.
The microstructures of six samples showing varying degrees of mylonitization were studied in detail [Ordet al., 1979], us- ing standard petrographic methods, reflected light microscopy of etched, polished surfaces, and transmi•ion electron micros- copy (TEM). The rocks varied from slightly mylonitic gneisses, with weak development of foliation and lineation (924, 925), to a blastomylonite (755) with well-developed lam- ination and lineation and very fine grain size. Progressive text- ural changes could be traced in the suite of samples.
1. Lenses of quartz show increasing elongation and reduc- tion of grain size; all of the quartz is, however, recrystallized to more or less equant grains which show little undulatory ex- tinction and no deformation lamellae.
Paper number 80B0560. 0148-.0227/80/080B-0560501.00
6253

6254 CHRISTIE AND ORD: FLOW STRESS FROM MICROSTRUCTURE OF MYLONITES
-.
,.,,.,. ,,, ,.• ,;,,,,,,,,, ,•-• ß . :. :•--'-
....... ....,-::;.•;;t.,, -:'""'"':•'::'• ..... -'- -. . .•.. ?... •" •.... - ..
..... '"' '. ...:..•: ß ',t' .... ":"•'• ,,."•,. "•-',J""•"' L:;'. ...... -,.., .; "%'i."" ....
ß -.. '. ........ ' -. -- ..:•.....-:,; ,•,.. .... ....-..,.•.•,.:;;. .:.-. .,- .•;,:•'..' .... . ...:, •, :.'"' ..... ::• -."'.'"-'%•.: . .... '-;. .
C "'" .... *' ..... * ........ •,. ":' ;. '•"•"" ' "'" ' :• i:;¾ ' ':' .... . . • t turn .,,. , ,, . ,•.": .4,.
Fig. I. Optical micrographs of samples 925 (Figures la and lb), CM-13 (Figures lc and ld), and 755 (Figures le and If), illustrating textural variations. Sections are all perpendicular to foliation; Figures la, lc, and le are perpendicular to the lineation, and Figures lb, ld, and If are parallel to the lineation. All micrographs are taken between crossed polarizers except Figure ld, which is in plane-polarized light. Note that the variation in grain size of quartz in pure quartz lenses decreases by an order of magnitude from sample 925 (Figures la and lb) to 755 (Figures le and If).
2. Feldspar porphyroclasts are highly strained and com- monly fractured: They show slight evidence of recrys- tallization to extremely fine equant grains in a thin 'rind' at their margins.
3. Mica porphyroclasts in the coarser samples are bent or kinked, and in the fine-grained rocks the mica is completely recrystallized to fine-grained aggregates parallel to the folia- tion. The textures of three of the samples, representing slight,
CHRISTIE AND ORD: FLOW STRESS FROM MICROSTRUCTURE OF MYLONITES 6255
' ";!i•? .,... ß
..- ' -'•:•:.:.
.... :?' .
.... .•:•:.,'.. ::;;.:; ...... ,.. .-.....?.,. .... : ...... ...•.. .... ..:•.: ,f..' .;:... , .....'-:
.f- , .... ..:,.;....., ...:.•. . , ..... ;;, ..'..? . .:::,:;;:.:..--• ..... '..:.
.??:/.{ •,...,....., ,;•,,/•½ :.•;•:.-::*-',.,..,:-:r:-':: .......... ...;:.•-' .:.'. ".: '•::*..'•*' .-.'.::,". ;'•': .•:a'::'...::; ' ' . ---' . ' ,:.:;; ,;. :;•.•:,,:;.;;•...•;•* ;';.::;.'•:, ,./;•:..,:::?.-'- ,.:,-
,.::.:....,: ...... ...... .... ;--;- ..:,,..• -' .. '"-'--:.<.:;.;<. "*'.:......:%.• '-". .... :-.,;..: -...,..;,. . ,-"--'. .... , ;.: ...' ....,:;•..>-: ...... ,•;;:: :•-:, •:•.-,.,:-:.•,:;.%, :,::,'-:;•,., ...:.a :;.. ß -. ..... ,..';..
: ..... .; .-.,...•,: **;:,' -.....-. :;:, :,%. ::• (,• ..-•-- ;•: :.;;.. :::,---. •..•. ,:•-..... :,• •. .... ...- ..
?'-:.;-:'? '-•;.'; .-. *;. '"'"L•
-,.; ..... t. •. ,.:. - ....
ß ' ,.. ...... .
• ,' .
......
•.....
,100,u.m
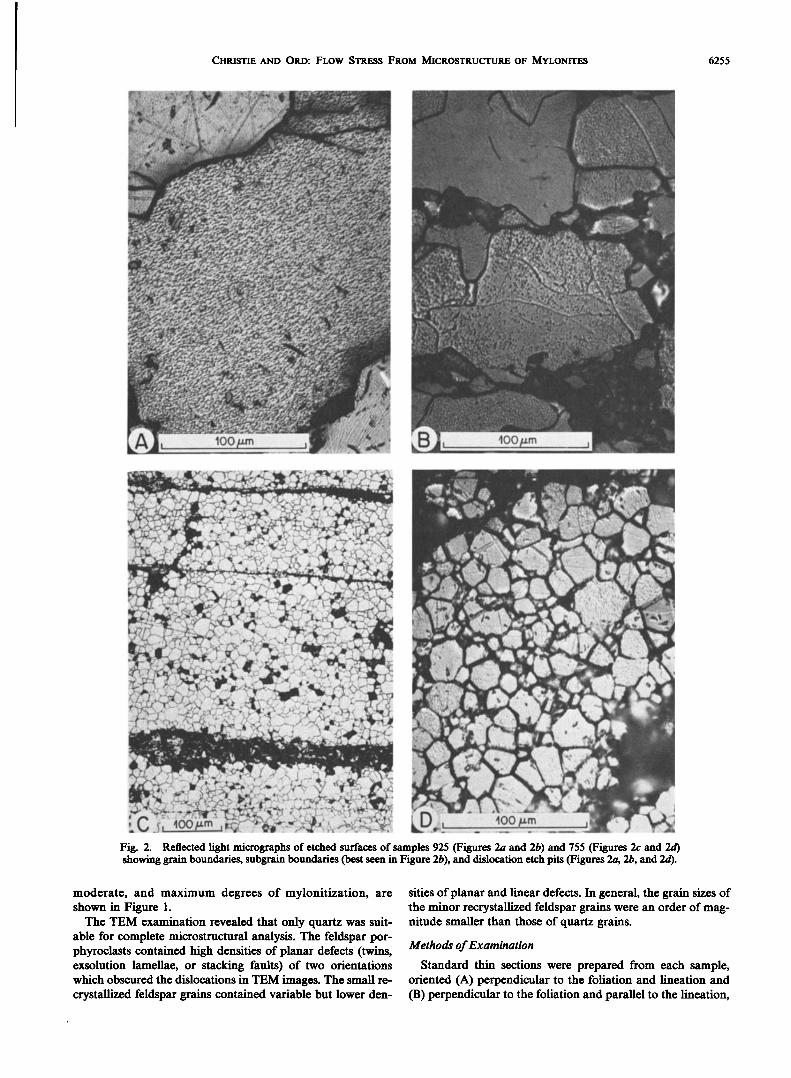
Fig. 2. Reflected light micrographs of etched surfaces of samples 925 (Figures 2a and 2b) and 755 (Figures 2c and 2d) showing grain boundaries, subgrain boundaries (best seen in Figure 2b), and dislocation etch pits (Figures 2a, 2b, and 2d).
moderate, and maximum degrees of mylonitization, are shown in Figure 1.
The TEM examination revealed that only quartz was suit- able for complete microstructural analysis. The feldspar por- phyroclasts contained high densities of planar defects (twins, exsolution lamellae, or stacking faults) of two orientations which obscured the dislocations in TEM images. The small re- crystallized feldspar grains contained variable but lower den-
sities of planar and linear defects. In general, the grain sizes of the minor recrystallized feldspar grains were an order of mag- nitude smaller than those of quartz grains.
Methods of Examination
Standard thin sections were prepared from each sample, oriented (A) perpendicular to the foliation and lineation and (B) perpendicular to the foliation and parallel to the lineation,

6256 CHRISTIE AND ORD: FLOW STRESS FROM MICROSTRUCTURE OF MYLONITES
TABLE 1. Grain Sizes (Quartz) and Inferred Flow Stresses
Flow Stress, MPa Grain Size D, pm
Specimen (+ Standard Mercier et Twiss Number Deviation) al. [1977] [1977]
924 208 (+43) 9 16 925 127 (+30) 12 22 868 122 (+24) 13 23 CM-13 97 (+27) 15 27 897 79 (+22) 17 31 755 22 (+7) 42 74
for petrographic examination and preliminary estimates of grain size.
Slabs of the same orientations (A and B) were mechanically polished and then etched with ammonium bifluoride solution to reveal grain boundaries, subgrain boundaries, and dis- location etch pits. Because of the extreme anisotropy of the rate of solution in different crystallographic directions in quartz it was necessary to employ sequential etches to produce etch structures in grains of all orientations. The cumulative etching times varied from 15 min to 2 hours.
Grain sizes in quartzose layers of the rocks vary consid- erably with the degree of purity of the layer. The grain size is maximal (and uniform) in pure quartz layers, decreasing with increasing proportions of other phases, notably micas. This is a well-known phenomenon in quartz-mica aggregates [Hobbs et al., 1976, pp. 112-113]. The grain size of the quartz is ap- proximately equal to the spacing of the mica grains and is controlled by the high grain boundary energy of mica relative to quartz. In this study, grain size estimates were made only in pure quartz layers by the method of linear intercepts [Smith and Guttrnan, 1953] on etched sample surfaces of both orienta-
tions and were consistent with similar estimates made on thin
sections between crossed polarizers on a polarizing micro- scope. It is emphasized that such measurements should be made in monomineralic layers because of the general ten- dency of other phases to limit grain growth. Details of the etching procedures, which were developed by M. W. Wegner (manuscript in preparation, 1980) are described elsewhere.
The grain size D given here represents a somewhat arbitrary 'mean grain dimension.' It is derived from statistical counts of 'linear intercepts,' that is, the number of intersections of grain boundaries per unit length with lines in three mutually per- pendicular directions (parallel to the lineation l, transverse to the lineation in the foliation t, and normal to the foliation n). The geometric mean of these three quantities N(n, t, l) is The ratio S/V of grain boundary area S to volume V of a polycrystal, an important structural parameter, is exactly twice •,• [Smith and Guttrnan, 1953]. The mean grain dimen- sion D is derived through the arbitrary assumption that all of the grains are cubes with shared faces of edge length D (S/V = 3/D), so that D-
In principle, subgrains can be measured by the linear inter- cept method if the sizes are in the microscopic range. Sub- grains are present in some quartz grains in the Coyote Moun- taM mylonites and are well delineated by the etching methods (Figure 2).
Surface etch pits corresponding to the emergence of dis- locations are present on the surfaces of grains etched for ap- propriate times. In these rocks they are so closely spaced that the pits interfere with each other and are difficult to count. This is consistent with the dislocation densities determined by TEM observations (below), in the range 2.1 to 8.8 x 108 cm/ cm 3. The maximum dislocation densities that can be counted
reliably by optical examination of etch pits are in the range 106 to 107 cm -2.
Fig. 3. Transmission electron micrographs showing dislocation substructures in sample 925: (a) dislocations, triple nodes, and small dislocation loops and (b) a subgrain boundary consisting of a hexagonal network.

CHRISTIE AND ORD: FLOW STRESS FROM MICROSTRUCTURE OF MYLONITES 6257
•--.:: ............. '¾.. ' ........ ' ........ -'-¾ * ......... -";•:: .. "•%"%;. ':"•i•':':' "'•-: ::;:X ....... --'":' ........................ •:' ' ....... 7•::.;•:;•"':':'•L .............. t ....:..x ........ . .';%.½:-' • . . --'? :; .......... ....•:- . .-' .-..... :..'.:. ':.. ""'-,.'...•--x. '-' ' "• ............... •;• "•'::':"'•.•'";.:.,;::::::•:..::';';:.':'"'"'- :•. ":•:---.'% • •"/:•"?•'Z:'--• ;::•-:-'• .:';:'-•;:. h:;:':'•:: . :½':- '" ,-•.. ::•-•: . :..½-s-'-<•'•'s•:'•::.::;;'•:. •-.. ':-'...,-;*'::• .... :• •'• :•'%....; :: ..•.;•- ..: ::;•:::. :j.;:.:::•:;:%-.-;;:;-.::::'•..' ..• ::;'? •'"' %'-"' •":""' "':':'b'""" '""'• •: *'-"--":' "•:' •" ' .... :'.::*½ -'"• :•"•":•::::•?.;:(•:"½::". '• •'
ß •';":' •%:*'%:--::' ":•:t:::' ';•' 'J-.----'-' ':•..: ";•":' :.;:• ........ ½•: "":•;';?.,(.'" ....... -:4•..•.: ....... '" •:•::4•;.• %?"
.... .• ......... :.:,• ...•..%½•,?.?..•:• ,,. .... ß '•.••.•'%•:..•., ,.;;•:.'.:•?..:.......x-.......•:•? ,,:.-:.•::.. .'t;(;L :;•:-----•.•;•:;: .... '"';.- ;:-,.,' "'"'; ....... % .:....:: '•-, :g .... ..•.. :•'•:-•"' "½:/• ..... --,½ :'• .... ;--'•':;'--?.--"-"•::i ,•-.. q;"' .:-:'":d" ...::.•;"•-•½..* "•;•::" .......;:".•:-',
" ...•, •;,• .... .•:•:'7"":.:. •.-:.•:;:.:•.".;.., •':'"{•½-- ';-:•"" ¾" . ::'•-7•-•'.'•'•' ..... ".'"',-':;•.:. '{'•.:;::::'--L•½;;½: ...... ..':•:: 7?? ' •:;
ß :.'?; ...... "..'.'""L.'. ":""L"-:..-..?: ....?•:•Z'-•: .. '"• •:' •".'•:?..2'"•:..:. ':•:Jb.?:& .':•:%.'""%.• ...... ;;;% ..... ,-. :.. . ..:½:?-'-'-: - •. •.. %?-.... :..... •: •.: •.-- ::•. . .- •:..•½:.. •:- -. . ... :•..:-.:•. ,...,. ..................... • .................................. ,½•:•½ . ,. .... ,: ..... :• ............. ...., ......... ..:::, ................................ ... ........... ........................................... ß ' :•'- . ' % ?':.'x
-. ?.•' ":•.t ;; .:•'....* .... "•-'....•½' •'"•.;:;• ..... "•:-: '.'•-:;½; ..%..:'(/--""::':" ..• L ½ / •:• •;".-' .-•Z'½ .::! ,:,4:•;•;.:.•. •::•... :.-.::... -.,½'.:'. •:.:...:-;•:;•, ".: --. ,;:•.•..,,::.•-'- -½•:-- • • .• .. t .• '• . "-.• .v". .... :•'::'";!"."•½ ..' :' .... •',,; .::.:.:...--?.::,,•:"'. ..... •,; ..... •,.....•, .-G•..:.,.*• •_ "•. •. *•..•,-. •".
..... . ...... •;'• '•;:?.:';' .-• ;:; 'q'"',v:.? '..."d; ,,•" ....... ½ '*,;,:.,:-;½..:...•.-:.': '}•. :;% '•-:. ;½:•. "•.•:?:.::'-L -.:• . ::•:-•:-,:::-'-.:..:.?"-•Z? :• •4'.' ..-.:•:•:•½•-':.. '-. -'• ...... •"- ::x: :;•. -..:-?,. '.:• ......... ......... .... '.,.•:.". ....... - - .- :::..::: ...... •r: .... :::. ?'4.: ..... .' ...:• •;. .:" ' - .-"::'-;..•;:.:..:•;•-:<•:•... •-."'"'%•.. 'i.•
C ::.;: '..,,.'%,::;.. :•; t,, t/.zm ] .. : ........ .... f:. :'-::. ... '.-'.,'...•*:..*`..•.L•..:;a•`•,.`•..`:`.*.x..:•::x•::;:..::..;:•:.•.•::•..::::!::::•.•;.x.::::;.•.. , ..... ;.---'•.-i!":'::.::• ...... ß--'::':":•- .... .....':';:.:• ....... .•.*•.•:-*}:•-•i(.:::- :.:!:.:i::• ............... .,..,. •.•..,,.•.
Fig. 4. Transmission electron micrographs of sample CM-13. Figures 4a and 4b show the curved nature and random orientations of the dislocations and small dislocation loops. Figure 4c contains numerous voids, probably bubbles of pre- cipitated H20, on the dislocations.
Electron transparent 'foils' of both orientations (A and B) were prepared from sections of each rock by ion milling and examined at 200 kV in a JEM-200 transmission electron mi-
croscope. Representative areas were photographed at magnifi- cations of 10,000 to 20,000 times. Diffraction conditions were
adjusted by tilting the specimen to provide optimum contrast
of aH the dislocations. Diffraction contrast (tilting) experi- ments were carried out in a few crystals to determine if all the dislocations were in contrast, but this procedure could not be carried out routinely because it is too time-consuming, and the rate of degradation (vitrification) of the quartz crystals in the electron beam was relatively rapid.
6258 CHRISTIE AND ORD: FLOW STRESS FROM MICROSTRUCTURE OF MYLONITES
Intersections of dislocations with both sample surfaces were counted in 15 to 25 micrographs from each foil. The total number of intersections x divided by the area A of the image examined represents the number of dislocations intersecting two surfaces of area A. Half of this value (n -- x/2A) would represent the dislocation density if all dislocations were per- pendicular to the foil surfaces. However, if the dislocations are randomly oriented, it can be shown [e.g., $choeck, 1962] that n underestimates the true dislocation density N by a factor of exactly 2. In the samples studied here the dislocations are ran- domly oriented to a good approximation, and the dislocation density N is given by the total number of intersections x with both surfaces in area A (in square centimeters) of the foil (that is, N (cm -2) -- x/A).
Summary of Microstructural Data
The textures of the mylonitic rocks are represented by the optical micrographs of three samples, including one of the coarsest (924) and one of the finest grained (755), in Figure 1. Estimates of recrystallized grain size in pure quartz layers in the six samples are listed in Table 1. The standard deviations of estimates from different linear counts are between 20 and
32%. The grain sizes vary from 208/an in the coarsest mylo- nitic gneiss (925) to 22/•m in the blastomylonite (755).
Subgrains are well developed in some of the quartz grains in the mylonites, as shown in the micrograph of etched grain surfaces in Figure 2. However, it was not practical in the Coy- ote Mountain mylonites to obtain statistical measurements of theft sizes, since subgrains were present in small numbers (2- 5) in only a small fraction of the suitably etched quartz grains (<20%). It is worth noting that the subgrain size in these rocks is generally too large to be measured by TEM methods, so that the etching procedure is the best method of determining subgrain size in these and most other quartz-bearing rocks.
Typical dislocation substructures in three of the rocks are il- lustrated in Figures 3-5. The dislocation configurations are qualitatively similar in all samples, although the dislocation densities differ considerably between samples. Dislocation networks and other subboundaries are widely spaced at the TEM scale. The free dislocations are uniformly distributed, and they are commonly curved and, to a good approximation, randomly oriented. Triple nodes are relatively common, as are dislocation loops of all sizes. These features are character- istic of metals and minerals either deformed at relatively high temperatures (hot-worked) or partially recovered by anneal- ing after cold-working. The curved dislocations, triple nodes, networks, and small loops all signify extensive climb and in- teraction of dislocations, which may occur in both creep and annealing.
Dislocation densities N for the six samples, estimated with the assumption of random orientation as described above, are listed in Table 2. The standard deviations, based on counts in different micrographs in each sample, provide a measure only of the homogeneity of dislocation density in different regions of quartz in the sample. They do not reflect probable errors in the estimates. Such errors may be present because of (1) out- of-contrast dislocations in some plates, (2) nonrandom orien- tation of dislocations, and (3) counting errors due to overlap of dislocations. These errors should be similar in all samples and are estimated to be less than _+30%.
Flow Stresses Inferred From Microstructures
It has been shown that several metals deformed by hot- working undergo dynamic recrystallization [e.g., Bromley and
Sellars, 1973], and this process has also been demonstrated in quartzite [e.g., Tullis et al., 1973; Ardell et al., 1973]. Under these conditions the recrystallized grain size is related to the flow stress by an equation of the form
(01 -- 03 ) ---- A.D-m
where A and m are constants. On the basis of rather limited
data on quartzites deformed in hydrous assemblies, Mercier et al. [1977] have obtained the relation
(O 1 -- 03) = 381.D -ø.71
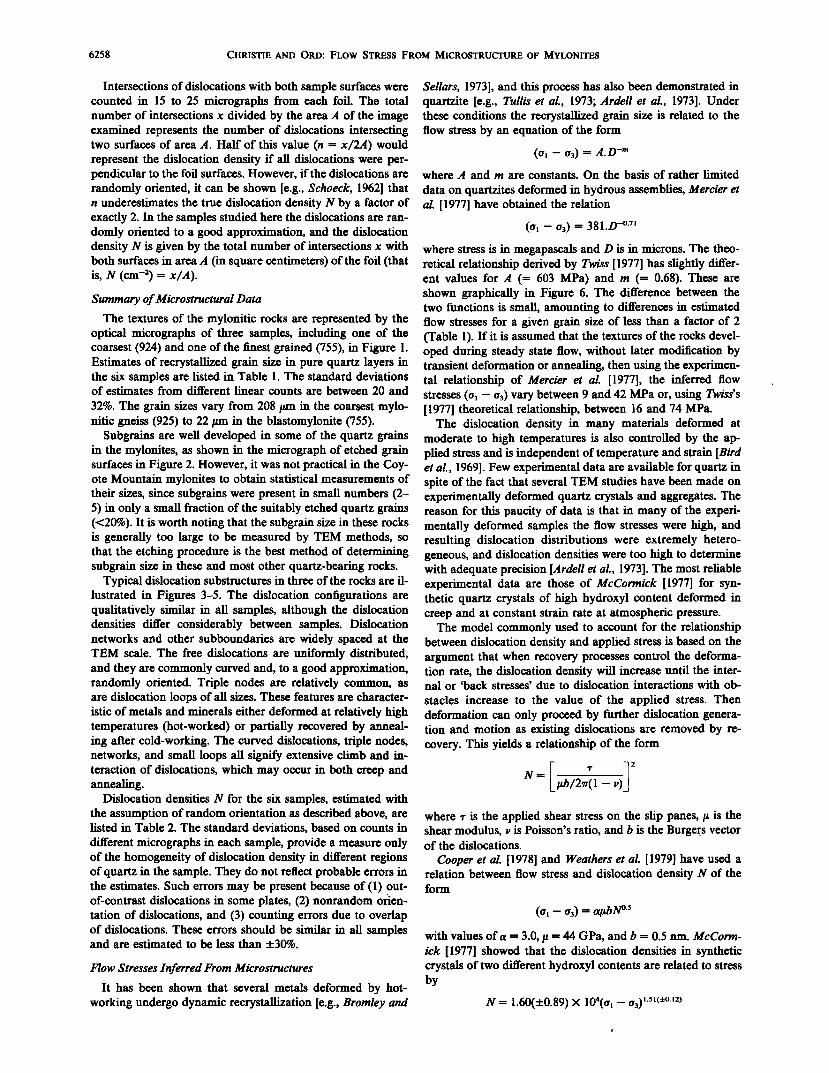
where stress is in megapascals and D is in microns. The theo- retical relationship derived by Twiss [1977] has slightly differ- ent values for A (-- 603 MPa) and m (-- 0.68). These are shown graphically in Figure 6. The difference between the two functions is small, amounting to differences in estimated flow stresses for a given grain size of less than a factor of 2 (Table 1). If it is assumed that the textures of the rocks devel- oped during steady state flow, without later modification by transient deformation or annealing, then using the experimen- tal relationship of Mercier et al. [1977], the inferred flow stresses (o• - 03) vary between 9 and 42 MPa or, using Twiss's [1977] .theoretical relationship, between 16 and 74 MPa.
The dislocation density in many materials deformed at moderate to high temperatures is also controlled by the ap- plied stress and is independent of temperature and strain [Bird et al., 1969]. Few experimental data are available for quartz in spite of the fact that several TEM studies have been made on experimentally deformed quartz crystals and aggregates. The reason for this paucity of data is that in many of the experi- mentally deformed samples the flow stresses were high, and resulting dislocation distributions were extremely hetero- geneous, and dislocation densities were too high to determine with adequate precision [Ardell et al., 1973]. The most reliable experimental data are those of McCormick [1977] for syn- thetic quartz crystals of high hydroxyl content deformed in creep and at constant strain rate at atmospheric pressure.
The model commonly used to account for the relationship between dislocation density and applied stress is based on the argument that when recovery processes control the deforma- tion rate, the dislocation density will increase until the inter- nal or 'back stresses' due to dislocation interactions with ob-
stacles increase to the value of the applied stress. Then deformation can only proceed by further dislocation genera- tion and motion as existing dislocations are removed by re- covery. This yields a relationship of the form
N-- /•b/2•l - v)
where r is the applied shear stress on the slip panes,/• is the shear modulus, v is Poisson's ratio, and b is the Burgers vector of the dislocations.
Cooper et al. [1978] and Weathers et al. [1979] have used a relation between flow stress and dislocation density N of the form
(o, - o,) = abN ø"
with values of a = 3.0,/z = 44 GPa, and b = 0.5 rim. McCorm- ick [1977] showed that the dislocation densities in synthetic crystals of two different hydroxyl contents are related to stress by
N = 1.60(_+0.89) X 104(Ol -- 03) 1'51('4-0'12)

CHRISTIE AND ORD: FLOW STRESS FROM MICROSTRUCTURE OF MYLONITES 6259
Fig. 5. Transmission electron micrographs of sample 755, showing typical microstructures. Figures 5a, 5b, and 5c show grain boundaries and well-equilibrated triple junctions of grain boundaries. Grain boundaries in Figures 5b and 5c contain voids, probably of H20. Typical dislocation structure is seen in Figures 5c and 5d.
where stress is in bars, or
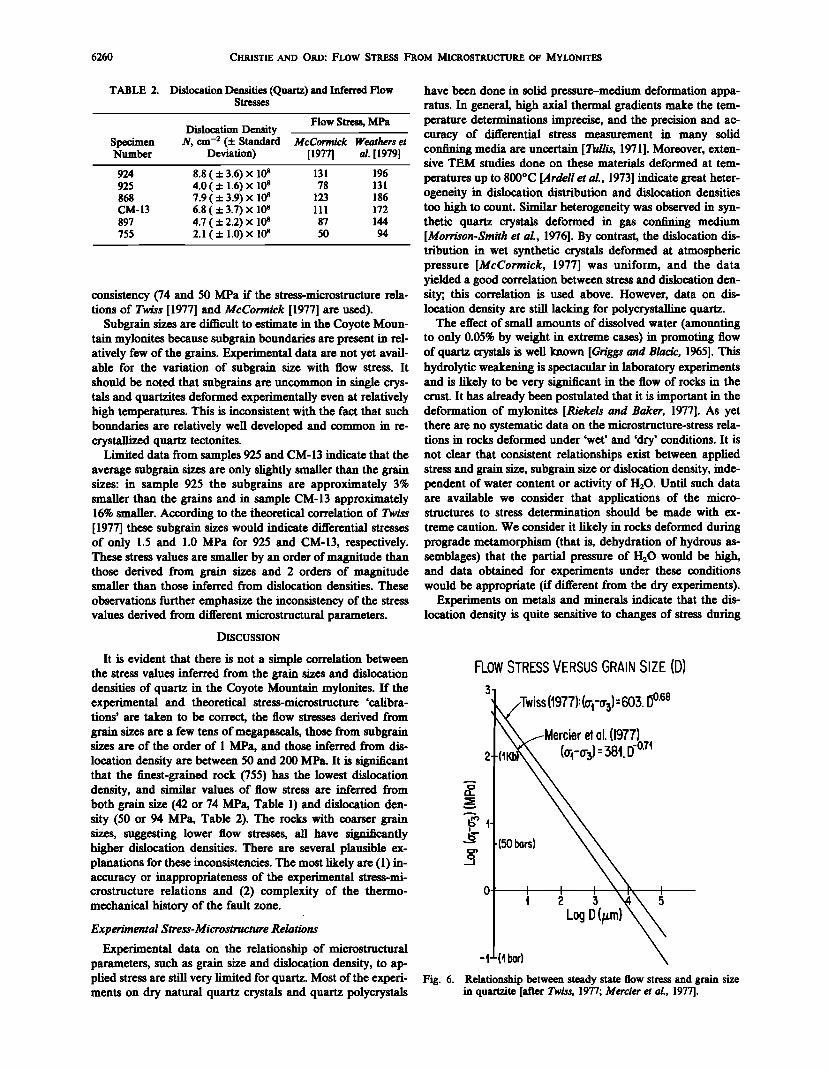
(o•- o3)= 1.64 x 10⁻⁴N 0'66'
where stress is in megapascals. These relations are compared in Figure 7. McCormick showed that the observed dislocation densities in his crystals were smaller by over an order of mag- nitude than those predicted by the back stress model men- tioned above.
The flow stresses inferred from the dislocation densities in
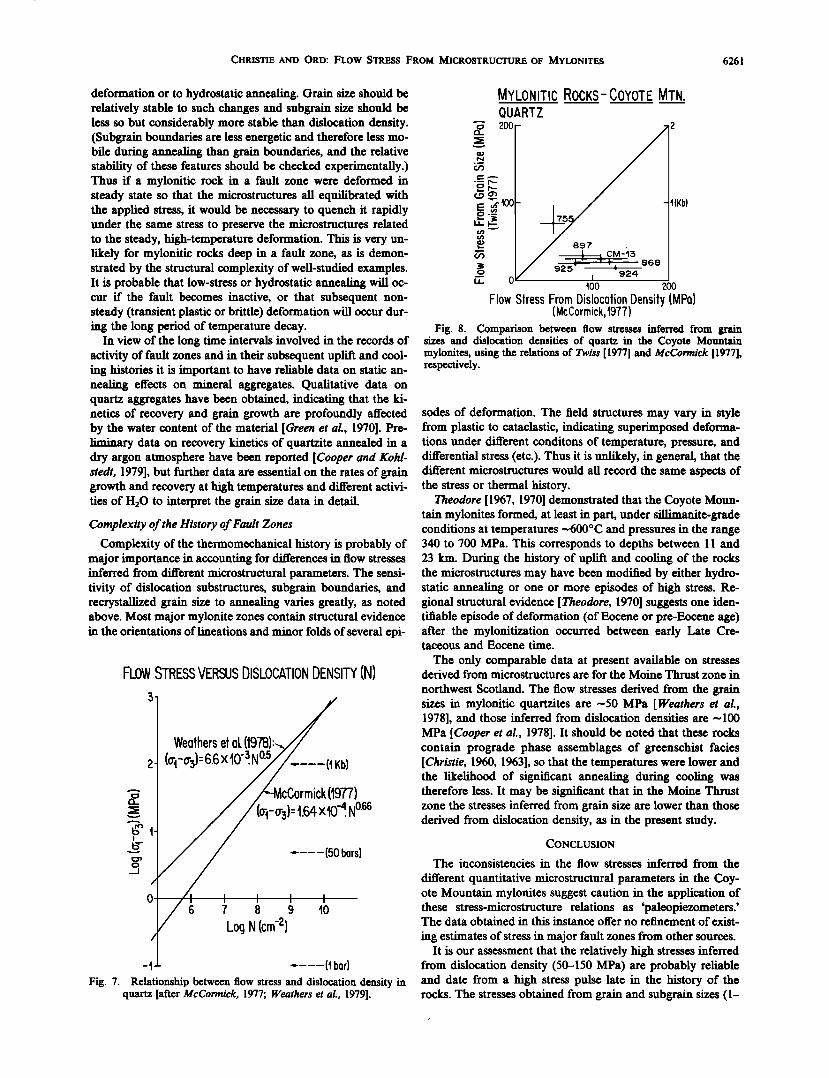
the mylonites (Table 2) vary between 131 and 50 MPa, using McCormick's [1977] relation, and 196 and 94 MPa, using the relation assumed by Weathers et aL [1979]. These stresses are considerably larger than those inferred from the grain size data (Table 1), as shown by the graphical comparison in Fig- ure 8. Only for the blastomylonite (755) do the stresses de- rived from grain size and dislocation density show reasonable
6260 CHRISTIE AND ORD: FLOW STRESS FROM MICROSTRUCTURE OF MYLONITES
TABLE 2. Dislocation Densities (Quartz) and Inferred Flow Stresses
Specimen Number
Flow Stress, MPa Dislocation Density
N, cm -2 (ñ Standard McCormick Weathers et Deviation) [1977] al. [1979]
924 8.8 ( ñ 3.6) x l0 s 131 196 925 4.0 ( ñ 1.6) x l0 s 78 131 868 7.9 ( ñ 3.9) x l0 s 123 186 CM-13 6.8 ( ñ 3.7) x l0 s 111 172 897 4.7 ( ñ 2.2) x 108 87 144 755 2.1 ( ñ 1.0) x 108 50 94
consistency (74 and 50 MPa if the stress-microstructure rela- tions of Twiss [1977] and McCormick [1977] are used).
Subgrain sizes are difficult to estimate in the Coyote Moun- tain mylonites because subgrain boundaries are present in rel- atively few of the grains. Experimental data are not yet avail- able for the variation of subgrain size with flow stress. It should be noted that subgrains are uncommon in single crys- tals and quartzites deformed experimentally even at relatively high temperatures. This is inconsistent with the fact that such boundaries are relatively well developed and common in re- crystallized quartz tectonites.
Limited data from samples 925 and CM-13 indicate that the average subgrain sizes are only slightly smaller than the grain sizes: in sample 925 the subgrains are approximately 3% smaller than the grains and in sample CM-13 approximately 16% smaller. According to the theoretical correlation of Twiss [1977] these subgrain sizes would indicate differential stresses of only 1.5 and 1.0 MPa for 925 and CM-13, respectively. These stress values are smaller by an order of magnitude than those derived from grain sizes and 2 orders of magnitude smaller than those inferred from dislocation densities. These
observations further emphasize the inconsistency of the stress values derived from different microstructural parameters.
DISCUSSION
It is evident that there is not a simple correlation between the stress values inferred from the grain sizes and dislocation densities of quartz in the Coyote Mountain mylonites. If the experimental and theoretical stress-microstructure 'calibra- tions' are taken to be correct, the flow stresses derived from grain sizes are a few tens of megapascals, those from subgrain sizes are of the order of 1 MPa, and those inferred from dis- location density are between 50 and 200 MPa. It is significant that the finest-grained rock (755) has the lowest dislocation density, and similar values of flow stress are inferred from both grain size (42 or 74 MPa, Table 1) and dislocation den- sity (50 or 94 MPa, Table 2). The rocks with coarser grain sizes, suggesting lower flow stresses, all have significantly higher dislocation densities. There are several plausible ex- planations for these inconsistencies. The most likely are (1) in- accuracy or inappropriateness of the experimental stress-mi- crostructure relations and (2) complexity of the thermo- mechanical history of the fault zone.
Experimental $tress-Microstructure Relations
Experimental data on the relationship of microstructural parameters, such as grain size and dislocation density, to ap- plied stress are still very limited for quartz. Most of the experi- ments on dry natural quartz crystals and quartz polycrystals
have been done in solid pressure-medium deformation appa- ratus. In general, high axial thermal gradients make the tem- perature determinations imprecise, and the precision and ac- curacy of differential stress measurement in many solid confining media are uncertain [ Tullis, 1971]. Moreover, exten- sive TEM studies done on these materials deformed at tem-
peratures up to 800øC [Ardell etal., 1973] indicate great heter- ogeneity in dislocation distribution and dislocation densities too high to count. Similar heterogeneity was observed in syn- thetic quartz crystals deformed in gas confining medium [Morrison-Smith etal., 1976]. By contrast, the dislocation dis- tribution in wet synthetic crystals deformed at atmospheric pressure [McCormick, 1977] was uniform, and the data yielded a good correlation between stress and dislocation den- sity; this correlation is used above. However, data on dis- location density are still lacking for polycrystalline quartz.
The effect of small amounts of dissolved water (amounting to only 0.05% by weight in extreme cases) in promoting flow of quartz crystals is well known [Griggs and Blacic, 1965]. This hydrolyric weakening is spectacular in laboratory experiments and is likely to be very significant in the flow of rocks in the crust. It has already been postulated that it is important in the deformation of mylonites [Riekels and Baker, 1977]. As yet there are no systematic data on the microstructure-stress rela- tions in rocks deformed under 'wet' and 'dry' conditions. It is not clear that consistent relationships exist between applied stress and grain size, subgrain size or dislocation density, inde- pendent of water content or activity of H,_O. Until such data are available we consider that applications of the micro- structures to stress determination should be made with ex-
treme caution. We consider it likely in rocks deformed during prograde metamorphism (that is, dehydration of hydrous as- semblages) that the partial pressure of H,_O would be high, and data obtained for experiments under these conditions would be appropriate (if different from the dry experiments).
Experiments on metals and minerals indicate that the dis- location density is quite sensitive to changes of stress during
FLOW STRESS VERSUS GRAIN SIZE (D)
%%,Twiss (1977}:(o--%}=603.13 ø'6e %% Mercier et el. (1977) 38.D -o.7
-(50 bors} •• Log D (/zm) x• { 2 S. •4 • 5
bar)
Fig. 6. Relationship between steady state flow stress and grain size in quartzite [after Twiss, 1977; Mercier et al., 1977].
CHRISTIE AND ORD: FLOW STRESS FROM MICROSTRUCTURE OF MYLONITES 6261
deformation or to hydrostatic annealing. Grain size should be relatively stable to such changes and subgrain size should be less so but considerably more stable than dislocation density. (Subgrain boundaries are less energetic and therefore less mo- bile during annealing than grain boundaries, and the relative stability of these features should be checked experimentally.) Thus if a mylonitic rock in a fault zone were deformed in steady state so that the microstructures all equilibrated with the applied stress, it would be necessary to quench it rapidly under the same stress to preserve the microstructures related to the steady, high-temperature deformation. This is very un- likely for mylonitic rocks deep in a fault zone, as is demon- strated by the structural complexity of well-studied examples. It is probable that low-stress or hydrostatic annealing will oc- cur if the fault becomes inactive, or that subsequent non- steady (transient plastic or brittle) deformation will occur dur- ing the long period of temperature decay.
In view of the long time intervals involved in the records of activity of fault zones and in their subsequent uplift and cool- ing histories it is important to have reliable data on static an- nealing effects on mineral aggregates. Qualitative data on quartz aggregates have been obtained, indicating that the ki- netics of recovery and grain growth are profoundly affected by the water content of the material [Green et al., 1970]. Pre- liminary data on recovery kinetics of quartzite annealed in a dry argon atmosphere have been reported [Cooper and Kohl- stedt, 1979], but further data are essential on the rates of grain growth and recovery at high temperatures and different activi- ties of H20 to interpret the grain size data in detail.
Complexity of the History of Fault Zones
Complexity of the thermomechanical history is probably of major importance in accounting for differences in flow stresses inferred from different microstructural parameters. The sensi- tivity of dislocation substructures, subgrain boundaries, and recrystallized grain size to annealing varies greatly, as noted above. Most major mylonite zones contain structural evidence in the orientations of lineations and minor folds of several epi-
FLOW STRESS VERSUS DISLOCATION DENSITY (N)
Weathers et ol. 0978):
-$ 2 .N ß ---1• Kb)
• '-McCormick (1977) - t.64 x 10 -4. N 0'66
•"- .... (50 bors)
I I I I I 6 7 8 9 •0
Log N (cm '2)
_•• .... (• bor) Fig. ?. Relationship between flow stress and dislocation demity in
quartz [after McCormick, 1977; Weathers et al., 1979].
MYLONITIC ROCKS- COYOTE MTN. QUARTZ 200
E •00- •(Kb)
,.- / 897 , • / . • I C, M-•15 _ __
• / 925 • ' • • • 868 o I 924 • 0 100 2•
Flow S•ress From Dislocefion Oensi•y (MPe) (McCormick,t9??)
•ig. 8. Comparison •twccn flow stresses •c•cd •rom s•cs and dislocation dc•itics o• qua•z in the Coyote my]o•tcs, using the relations o• •w• []977] and rcspcctivciy.
sodes of deformation. The field structures may vary in style from plastic to cataclastic, indicating superimposed deforma- tions under different conditons of temperature, pressure, and differential stress (etc.). Thus it is unlikely, in general, that the different microstructures would all record the same aspects of the stress or thermal history.
Theodore [1967, 1970] demonstrated that the Coyote Moun- tain mylonites formed, at least in part, under s'glimanite-grade conditions at temperatures •600øC and pressures in the range 340 to 700 MPa. This corresponds to depths between 11 and 23 km. During the history of uplift and cooling of the rocks the microstructures may have been modified by either hydro- static annealing or one or more episodes of high stress. Re- gional structural evidence [Theodore, 1970] suggests one iden- tifiable episode of deformation (of Eocene or pre-Eocene age) after the mylonitization occurred between early Late Cre- taceous and Eocene time.
The only comparable data at present available on stresses derived from microstructures are for the Moine Thrust zone in
northwest Scotland. The flow stresses derived from the grain sizes in mylonitic quartzites are •50 MPa [Weathers et al., 1978], and those inferred from dislocation densities are ~100 MPa [Cooper et al., 1978]. It should be noted that these rocks contain prograde phase assemblages of greenschist facies [Christie, 1960, 1963], so that the temperatures were lower and the likelihood of significant annealing during cooling was therefore less. It may be significant that in the Moine Thrust zone the stresses inferred from grain size are lower than those derived from dislocation density, as in the present study.
CONCLUSION
The inconsistencies in the flow stresses inferred from the
different quantitative microstructural parameters in the Coy- ote Mountain mylonites suggest caution in the application of these stress-microstructure relations as 'paleopiezometers.' The data obtained in this instance offer no refinement of exist-
ing estimates of stress in major fault zones from other sources. It is our assessment that the relatively high stresses inferred
from dislocation density (50-150 MPa) are probably reliable and date from a high stress pulse late in the history of the rocks. The stresses obtained from grain and subgrain sizes (1-

6262 CHRISTIE AND ORD: FLOW STRESS FROM MICROSTRUCTURE OF MYLONITES
75 MPa) are probably underestimates in that these parameters were almost certainly affected by hydrostatic or low-stress an- nealing episodes during the thermal peak and extended cool- ing history of these relatively high-temperature mylonitic rocks. An assessment of the data suggests that flow stresses (o• - •3) were probably of the order of 100 MPa (1 kbar) or more during the mylonitization and during subsequent tran- sient high stress episodes of the history.
It is essential that more extensive and accurate experimen- tal data on (1) the relationship between steady state stress and grain size, subgrain size, and dislocation density (and possibly other microstructural parameters) and (2) the kinetics of an- nealing of these microstructures be obtained for quartz aggre- gates before inferences on flow stress can be drawn with con- fidence. When such data are available, the prognosis is good that certain details of the thermomechanical history can be re- solved from study of several types of microstructures in the same rocks. The probability will be greatly improved if similar data are obtained for other coexisting phases. In particular, the feldspars appear to offer the greatest promise, despite their structural complexity and experimental intractability.
Acknowledgments. The microstructural studies of the Coyote Mountain mylonites summarized here were done by the authors in collaboration with Mary W. Wegner, Department of Earth and Space Sciences, UCLA, who developed the etching procedures and advised us on the use of these techniques. This assistance is gratefully ac- knowledged. This work was done under NSF grant EAR 77-23163.
REFERENCES
Ardell, A. J., J. M. Christie, and J. A. Tullis, Dislocation substructure in deformed quartz rocks, Cryst. Lattice Defects, 4, 275-285, 1973.
Bird, J. E., A. K. Mukherjee, and J. F. Dorn, Correlations between high temperature creep behavior and structure, in Quantitative Re- lation between Properties and Microstructure, edited by D. G. Bran- don and R. Rosen, pp. 255-342, Israel Universities Press, Jerusa- lem, 1969.
Briegel, U., and C. Goetze, Estimates of differential stress recorded in the dislocation structure of Lochseiten limestone (Switzerland), Tectonophysics, 48, 61-76, 1978.
Bromley, R., and C. M. Sellars, High temperature deformation of copper and copper-aluminum alloys, in The Microstructure and De- sign of Alloys, p. 380, Institute of Metals, London, 1973.
Christie, J. M., Mylonitic rocks of the Moine Thrust-zone in the As- synt region, north-west Scotland, Trans. Edinburgh Geol. Soc., 18, 79-93, 1960.
Christie, J. M., Moine Thrust zone in the Assynt region, N. W. Scot- land, Univ. Calif. Univ. Los Angeles Publ. Geol. Sci., 40, 345-439, 1963.
Cooper, R. F., and D. L. Kohlstedt, Dislocation recovery in naturally deformed quartz (abstract), Eos Trans. AGU, 60, 370, 1979.
Cooper, R. F., D. L. Kohlstedt, M. S. Weathers, and J. M. Bird, Dis- location structure in deformed quartz grains from the Moine Thrust fault, Scotland (abstract), Eos Trans. AGU, 59, 1207, 1978.
Durham, W. B., C. Goetze, and B. Blake, Plastic flow of oriented single crystals of olivine, 2, Observations and interpretations of the dislocation structures, J. Geophys. Res., 82, 5755-5770, 1977.
Glover, G., and C. M. Sellars, Recovery and recrystallization during high temperature deformation of a-iron, Met. Trans., 4, 765-775, 1973.
Goetze, C., and D. L. Kohlstedt, Laboratory studies of dislocation climb and diffusion in olivine, J. Geophys. Res., 78, 5961, 1973.
Goetze, C., and D. L. Kohlstedt, The dislocation structures of experi- mentally deformed marble, Contrib. Mineral. Petrol., 59, 293-306, 1977.
Green, H. W., D. T. Griggs, and J. M. Christie, Syntectonic and an-
healing recrystallization of fine-grained quartz aggregates, in Ex- perimental and Natural Rock Deformation, edited by P. Paulitsch, pp. 272-335, Springer, New York, 1970.
Griggs, D. T., and J. D. Blacic, Quartz: Anomalous weakness of syn- thetic crystals, Science, 147, 292, 1965.
Hobbs, B. E., W. D. Means, and P. F. Williams, An Outline of Struc- tural Geology, John Wiley, New York, 1976.
Kirby, S. H., and M. W. Wegner, Dislocation substructure of mantle- derived olivine as revealed by selective chemical etching and trans- mission electron microscopy, Phys. Chem. Miner., 3, 309-330, 1979.
Kohlstedt, D. L., and C. Goetze, Low-stress high-temperature creep in olivine single crystals, J. Geophys. Res., 79, 2045-2051, 1974.
Kohlstedt, D. L., C. Goetze, and W. B. Durham, Experimental defor- mation of single crystal olivine with application to flow in the mantle, in Physics and Chemistry of Minerals and Rocks, edited by R. G. J. Strens, pp. 35-49, John Wiley, New York, 1976.
Kohlstedt, D. L., R. F. Cooper, M. S. We•athers, and J. M. Bird• Pa- leostress analysis of deformation-induced microstructures: Moine Thrust zone and Ikertoq shear zone, Analysis of Actual Fault Zones in Bedrock, pp. 394-425, Open File Rep. 79-1239, U.S. Geol. Surv., Menlo Park, Calif., 1979.
Luton, M. J., and C. M. Sellars; Dynamic recrystallization in nickel and nickel-iron alloys during high temperature deformation, Acta Metal., 17, 1033-1043, 1969.
McCormick, J. W., Transmission electron microscopy of experimen- tally deformed synthetic quartz, Ph.D. thesis, 171 pp., Univ. of Calif., Los Angeles, 1977.
Mercier, J.-C., D. A. Anderson, and N. L. Carter, Stress in the litho- sphere: Inferences from steady-state flow of rocks. Pure Appl. Geophys., 115, 199-226, 1977.
Morrison-Smith, D. J., M. S. Paterson, and B. E. Hobbs, An electron microscope study of plastic deformation in single crystals of syn- thetic quartz, Tectonophysics, 33, 43-79, 1976.
Ord, A., M. W. Wegner, and J. M. Christie, Microstructures and flow stresses in mylonitic rocks from Coyote Mountain, California, pa- per presented at the 9th Western Regional Meeting of Electron Mi- croscopists, Calif. Soc. for Electron Microsc., Palm Springs, Calif., April 30-May 3, 1979.
Post, R. L., Jr., The flow laws of Mt. Burnet dunite, Ph.D. thesis, 272 pp., Univ. of Calif., Los Angeles, 1973.
Post, R. L., Jr., High-temperature creep of Mt. Burnet dunite, Tectono- physics, 42, 75-110, 1977.
Riekels, L. M., and D. W. Baker, Origin of the double maximum pat- tern of optic axes in quartzite mylonite, J. Geol., 85, 1-14, 1977.
Schoeck, G., Correlation between dislocation length and density, J. Appl. Phys., 33, 1745-1747, 1962.
Smith, C. S., and L. Guttman, Measurement of internal boundaries in three-dimensional structures by random sectioning, Trans. AIME, 197, 81-87, 1953.
Theodore, T. G., Structure and petrology of the gneisses and mylo- nites at Coyote Mountain, Borrego Springs, California, Ph.D. thesis, 268 pp., Univ. of Calif., Los Angeles, 1967.
Theodore, T. G., Petrogenesis of mylonites of high metamorphic grade in the peninsular ranges of southern California, Geol. Soc. Amer. Bull., 81, 435-450, 1970.
Tullis, J. A., Preferred orientations in experimentally deformed quartz- ites, Ph.D. thesis, 344 pp., Univ. of Calif., Los Angeles, 1971.
Tullis, J. A., J. M. Christie, and D. T. Griggs, Microstructures add preferred orientations of experimentally deformed quartzites, Geol. Soc. Amer. Bull., 84, 297-314, 1973.
Twiss, R. J., Theory and applicability of a recrystallized grain size pa- leopiezometer, Pure Appl. Geophys., 115, 227-244, 1977.
Weathers, M. S., D. L. Kohlstedt, J. M. Bird, and R. F. Cooper, Mi- crostructure of deformed quartzite from the Moine Thrust fault, Scotland, Eos Trans. AGU, 59, 1207, 1978.
Weathers, M. S., R. F. Cooper, D. L. Kohlstedt, and J. M. Bird, Dif- ferential stress determined from deformation-induced micro-
structures of the Moine Thrust zone, J. Geophys. Res., 84, 7495- 7509, 1979.
(Received November 1, 1979; accepted February 27, 1980.)
Copyright © 2022 FDOKUMEN