Electrochemical Impedance Spectroscopy Options for Proton ...
1
EFFECT OF VARYING AXIAL LOAD UNDER FIXED
BOUNDARY CONDITION ON ADMITTANCE
SIGNATURES OF ELECTROMECHANICAL
IMPEDANCE TECHNIQUE
YEE YAN LIM 1 AND CHEE KIONG SOH
2
Division of Structures and Mechanics, School of Civil and Environmental Engineering,
Nanyang Technological University, 50 Nanyang Avenue, Singapore 639798.
1 Research Student, Email: [email protected]
2 Corresponding Author, Professor, Email: [email protected], Tel: (65) 6790-5280.
ABSTRACT
In recent years, researchers in the field of structural health monitoring (SHM) have been
rigorously striving to replace the conventional NDE techniques with the smart material based
SHM techniques. These techniques possess distinct advantages over the conventional
techniques, such as capable of providing autonomous, real-time, reliable and cost efficient
monitoring. For instance, the electromechanical impedance (EMI) technique employing smart
piezo-impedance transducer (PZT) is known for its sensitivity in detecting damage. The
admittance signatures of EMI technique for SHM are susceptible to variation in the static load
applied on the host structure, which should not be ignored. This paper presents a series of
experimental, analytical and numerical studies conducted to investigate the effect of varying
axial load in the presence of fixed boundary condition on the admittance signatures.
Theoretically, extensional vibration is not affected by any static axial load acting in the same
direction. However, it is useful in identifying the effect of stiffening caused by the boundary
condition upon increase in the axial force, which contributes to the discrepancy between the
experiments and theoretical analytical models. This study suggests that the effect of boundary

2
condition is substantial, which should be carefully considered in real-life application of EMI
technique for SHM.
Keywords: Electromechanical impedance (EMI), piezoceramics (PZT), axial load, boundary
condition
This research received no specific grant from any funding agency in the public, commercial,
or not-for-profit sectors.
3
INTRODUCTION
Non-destructive evaluation (NDE) techniques such as ultrasonic wave propagation, acoustic
emission, magnetic field analysis, dye penetrant test, eddy currents and X-ray radiography are
commonly used in the industry for damage detection. However, these techniques generally
depend heavily on visual inspection for gross assessment prior to applying the local
techniques to pinpoint the damage. These conventional techniques can sometimes be very
inefficient and tedious. For instance in large structures, the critical parts may not be readily
accessible. This situation is further aggravated by the requirement of bulky probes or
equipments to be carried along during inspection. Inspectors are also often exposed to
dangerous conditions or uncomfortable working environments. High dependency of visual
inspection on experience of inspector, high cost and unsystematic procedures render the
technique uneconomical and unreliable.
In recent years, researchers in the field of structural health monitoring (SHM) have been
rigorously striving to replace the conventional NDE techniques with the smart material based
SHM techniques, employing smart materials such as piezoelectric materials and fiber optics.
These techniques possess distinct advantages over the conventional techniques, such as
capable of providing autonomous, real-time, reliable and cost efficient monitoring. One of
these techniques, known as the electromechanical impedance (EMI) technique employing
smart piezo-impedance (lead zirconate titanate, PZT) transducer is known for its sensitivity in
detecting local damage. Being non-invasive, extremely light, cost effective, able to perform
self actuating and sensing, the EMI technique is constantly being developed in recent decades.
For instance, Park et al. (2000) reported significant proof-of-concept applications of the EMI
technique on civil-structural components such as composite reinforced masonry walls, steel
bridge joints and pipe joints. Soh et al. (2000) established the damage detection and
localization ability of piezo-impedance transducers on real-life RC structures. Giurgiutiu et al.
(2004) proved the feasibility of concurrent applications of the EMI technique and the wave
propagation technique by employing the same PZT patch attached on an aircraft structure.
Lim et al. (2006) attempted some parametric based damage detection using equivalent
structural parameters in characterizing the severity of damage in lab-sized aluminium and
4
concrete structure. Park et al. (2008) adopted the PCA-data compression technique as a
pre-processing module to reduce the data dimensionality and eliminate the unwanted noises,
which is useful for wireless monitoring. Experimental study inspecting loose bolts in a
bolt-jointed aluminium structure was conducted. The damage detection capability is
significantly enhanced in comparison to the traditional root mean square deviation approach.
The EMI technique is also able to monitor the hydration process of concrete. For
instance, Shin et al. (2008) showed that the EMI signatures obtained from PZT patch surface
bonded on concrete gradually shifted to the right and subsided with curing time. They
attributed these behaviors to the stiffening action due to strength gain of concrete. Detailed
reviews considering various issues on the applications of EMI technique in SHM can be
obtained in publications by Park et al. (2003, 2008) and Annamdas and Soh (2010).
In practice, structures in service are often subjected to constant loading. Even with the
structure in standby mode, static load caused by self weight or dead load still exists.
Annamdas et al. (2007) showed that the electrical admittance signatures, especially its
imaginary component adopted in the EMI technique for SHM, is susceptible to variation in
the static load applied on the host structure. On the other hand, applied loads are associated
with the imposed boundary conditions. Annamdas and Soh (2010) reported in a review paper
that if the host structure is smaller than the sensing range of the PZT transducer bonded on it,
the boundary conditions can also influence the PZT-based signatures. Park et al. (2000)
claimed that the sensing radius of a typical PZT patch might vary from 0.4m on composite
reinforced structures to about 3m on simple metal beams. The boundary conditions in real life
structures are however, extremely difficult to characterize analytically, and tend to exhibit
poor repeatability between structures (David, 2006). Esteban (1996) concluded that structural
discontinuities (at boundaries) acting as the sources of multiple reflections cause maximum
attenuation to the propagating waves. Hu and Yang (2007) investigated the PZT sensing
region based on the elasticity solution of PZT generated wave propagation and PZT–structure
interaction effect. The effect of boundary condition, especially for metallic structure should be
carefully considered for effective SHM. They found that with an excitation voltage of 1V,
applied in the typical excitation frequency range of 100–200 kHz for the EMI technique, the
valid sensing region of PZT sensors is about 2–2.5 m, subjected to the sensing limit of PZT
5
transducer of 0.01V. The sensing zone can be extended with the use of higher excitation
voltage.
Up to date, there are only a few studies (Ong et al. 2002 and Abe et al. 2000) conducted
to investigate the effect of static axial load on admittance signatures. Annamdas and Soh
(2007) presented briefly the effect of different boundary conditions on admittance signatures
without the presence of loading. However, the effect of boundary condition on varying load
has yet to be investigated.
This paper aims at bridging this gap by presenting a series of experimental, analytical
and numerical studies to investigate the effect of axial stress in the presence of fixed boundary
condition on the admittance signatures acquired through EMI technique. The problem is
approached by first revisiting the 1-D analytical model involving axially loaded simple beam
with surface-bonded PZT patch. Both axial and flexural modes of vibration are considered.
Experimental test and finite element (FE) simulation are carried out to verify the model. The
effects of loading and boundary condition are then investigated.
PRINCIPLES OF EMI TECHNIQUE
Application of the EMI technique, employing piezoceramics, in SHM was proposed by
Chaudhry et al. (1994) and Sun et al. (1995). The EMI technique shares similar working
principles as the conventional dynamic response techniques. However, the frequency range
employed in the EMI technique (30 - 1000 kHz) is much higher.
The EMI technique utilizes PZT transducer to simultaneously actuate the host structure
and to sense its response through electromechanical (EM) coupling ability of the piezoelectric
material. In other words, PZT transducer is employed as collocated actuator and sensor. When
a mechanically attached (surface-bonded or embedded) PZT patch is dynamically excited by
an alternating voltage, the vibrational force generated by the PZT patch can be transferred to
the host structure. The corresponding structural response at different excitation frequency will
modulate the electric current across the PZT patch.
The modulated current, in terms of complex electrical admittance (conductance and
susceptance signatures) is also measured and recorded by the impedance analyzer. This
6
admittance signature is a function of the stiffness, mass and damping of the host structure.
The frequency response function (FRF) of the admittance signatures can be graphically
plotted to yield a spectrum that serves as an indication to the structural response. Any
subsequent damage or interference on the structure, which causes a change in structural
response, would directly affect the admittance signatures and can be reflected qualitatively
from the alteration in the spectrum.
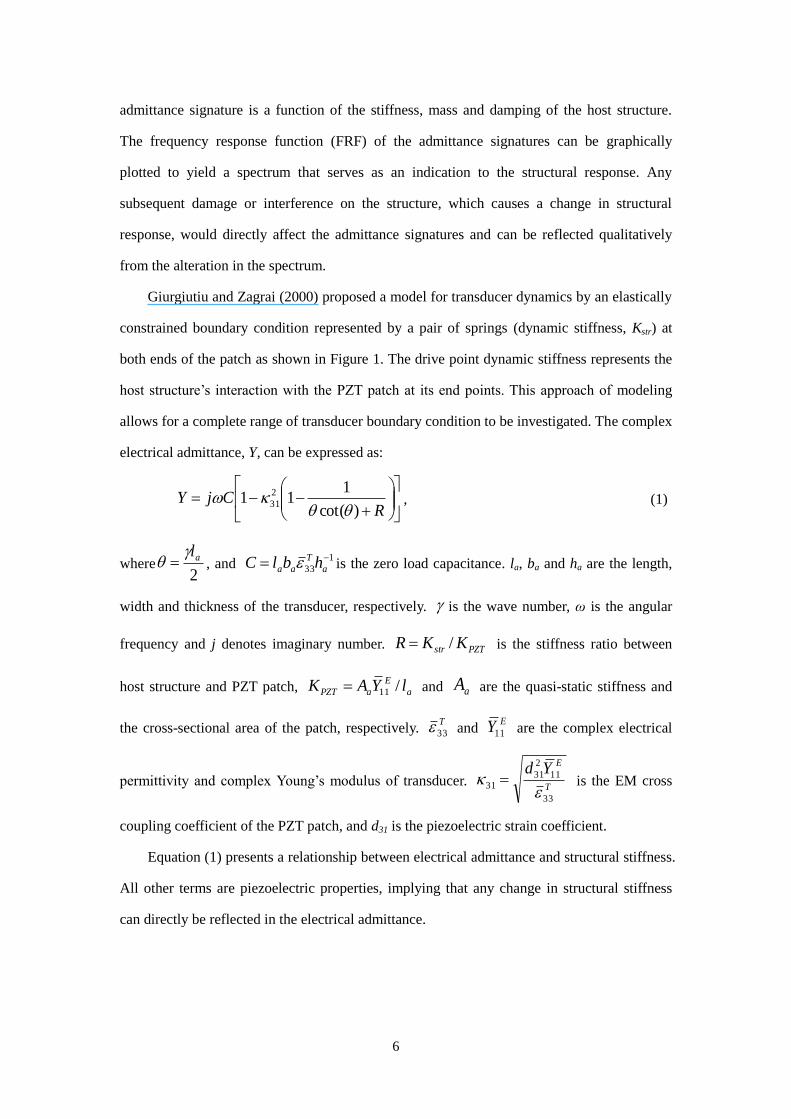
Giurgiutiu and Zagrai (2000) proposed a model for transducer dynamics by an elastically
constrained boundary condition represented by a pair of springs (dynamic stiffness, Kstr) at
both ends of the patch as shown in Figure 1. The drive point dynamic stiffness represents the
host structure’s interaction with the PZT patch at its end points. This approach of modeling
allows for a complete range of transducer boundary condition to be investigated. The complex
electrical admittance, Y, can be expressed as:
RCjY
)cot(
111 2
31
, (1)
where2
al , and 1
33
a
T
aa hblC is the zero load capacitance. la, ba and ha are the length,
width and thickness of the transducer, respectively. is the wave number, ω is the angular
frequency and j denotes imaginary number. PZTstr KKR / is the stiffness ratio between
host structure and PZT patch, a
E
aPZT lYAK /11 and aA are the quasi-static stiffness and
the cross-sectional area of the patch, respectively. T
33 and EY11 are the complex electrical
permittivity and complex Young’s modulus of transducer. T
EYd
33
11
2
3131
is the EM cross
coupling coefficient of the PZT patch, and d31 is the piezoelectric strain coefficient.
Equation (1) presents a relationship between electrical admittance and structural stiffness.
All other terms are piezoelectric properties, implying that any change in structural stiffness
can directly be reflected in the electrical admittance.

7
EFFECT OF AXIAL STRESS ON ADMITTANCE SIGNATURES
Changes in vibrational behavior of host structure, including damage, can be indirectly
measured from the electrical impedance/admittance signatures. Giurgiutiu (2007) modeled the
1-D PZT-beam interaction considering both axial and flexural vibrations. Close agreement
with the experimental counterparts, up to 30 kHz, under free-free boundary condition is
shown. The model, however, did not include the effect of static axial stress.
Abe et al. (2000) first proposed the use of EMI technique for identification of in-situ
stress in thin structural members. Both 1-D and 2-D analytical model based on wave
propagation theory for beam and plate structures were developed, incorporating the effect of
axial stress. They reported that the wave number and wave frequencies can be directly related
to the electrical admittance through the EM coupling equation suggested by Liang et al.
(1994). They showed that the tensile stress increased the resonance frequency in the electrical
impedance spectrum. However, they found that considerable discrepancy exist between the
measured and the predicted stress. No in-depth reasoning is provided regarding the difference.
Ong et al. (2002) investigated the effect of in-situ stress on the FRFs of beam structure
by applying pure bending actuation through a pair of symmetrically located surface-bonded
PZT transducers, activated in out-of phase mode. They simulated the axially loaded beam
structure with PZT patch using 1-D EMI model for an elastically constrained transducer.
Effect of bonding was neglected. Back calculation of the in-situ stress from the electrical
FRFs of the transducer was presented. However, experimental verification was not included.
Both of the abovementioned models concentrated only on flexural vibration of beam under
tension. The extensional (axial) vibration and effect of boundary condition were not
considered.
In the following sections, the model used by Ong et al. (2002) involving an axially
loaded Euler-Bernoulli beam is revisited, but with extensional vibration considered. The EMI
model (Equation 1) based on elastically constrained transducer conditions is adopted to
evaluate the electrical admittance from the PZT transducer. Theoretically, extensional
vibration is not affected by any static axial load acting in the same direction. It is however
useful in identifying the effect of boundary stiffening, which contributes to the discrepancy

8
between experimental and theoretical analytical mode, as presented in the ensuing section.
1-D MODELING OF AXIALLY LOADED BEAM EXCITED BY
PZT TRANSDUCER
Consider a uniform thin beam with a surface bonded PZT patch being loaded axially by a
static force, N, at both ends of the beam in the x-direction as shown in Figure 2(a). To
investigate the effect of static axial force on the admittance signatures acquired from the EMI
technique, we consider the simplified dynamic PZT-structure interaction model as depicted in
Figure 2(b). The PZT patch’s actuation can be modeled as a pair of equivalent axial forces, Ns
and bending moments, Ms to generate the extensional and transverse vibration on the beam.
Rao (1999) suggested that both motions can be considered uncoupled if the amplitude of
vibration is small. Separate solutions for each mode can thus be derived and superimposed to
determine the complete solution.
Since the static axial force is acting in the direction of the extensional vibration, it will
not alter the extensional dynamic equation. Its dynamic response resembles a rod vibrating
axially, which can be expressed as (Rao, 1999):
),('' txfuAuAY nssss , (2)
where u is the displacement in x-direction. sY , As and ρs are the complex Young’s modulus,
cross sectional area and material density of the beam, respectively.
tjn
nn
nnn exFtxf
1
0
)(),( is the distributed loading function for extensional vibration. Fn is
the modal participation coefficient for extensional vibration, n = 1, 2, 3, 4 …… are the
extensional mode numbers, and )(xn is the nth mode shape of the beam in extensional
vibration. ()' and )(
denote spatial and temporal differential operator, respectively.
However, the effect of axial force is substantial in the case of transverse vibration. The
corresponding dynamic equation for forced transverse vibration can be expressed as
(Dukkipati, 2004):

9
),(),(),(''),( txftxwAtxNwtxwIY mss
iv
ss , (3)
where N is the magnitude of the axial load, with positive value denoting tension. w is the
transverse displacement with respect to x, and sI is the moment of inertia of the beam.
tjm
mm
mmm exFtxf
1
0
)(),( is the distributed loading function for transverse vibration. Fm is
the modal participation coefficient for transverse vibration, m = 1, 2, 3,…… are the transverse
mode numbers, and )(xm is the mth mode shape of the beam in transverse vibration.
To solve for Equations (2) and (3), both displacements are assumed to be variable
separable. The solution process can be found in Ong et al. (2002) and Giurgiutiu (2007), and
is hereby omitted. Only significant outcomes are presented.
Considering simply supported boundary conditions, the total forced response of the
system in axial direction is given by:
tj
n
nn nss
nn eA
xFtxu
1
0
22
)(),( , (4)
The nth mode shape of beam in extensional vibration can be evaluated as
s
nl
xnx
cos)( .
The nth natural frequency of beam in axial vibration is:
s
s
n cl
n . (5)
The corresponding total response of the forced vibration in transverse direction is:
1
0
)(),(22
m
mm
tj
m
mss
m exA
Ftxw
, (6)
The mth mode shape of beam in transverse vibration is derived as
x
l
mx
s
m
sin)( , and
the mth natural frequency of the beam in transverse vibration is:
24
1
ss
ss
ss
ml
mN
l
mIY
A
. (7)
On the other hand, the point-wise dynamic stiffness, defined as the ratio between the
excitation force to the displacement at that point can be evaluated by superimposing the

10
displacement from the extensional and transverse vibrations:
1
22
21
22
121
0
1
0
)(')('
2
)()(
m
mm m
mmws
n
nn n
nnussstr
xxkhxxkAK
, (8)
where )()(2
12 xxl
k nn
s
u and
)(')(' 21 xxl
hhk mm
s
asw
respectively.
hs is the thickness of beam.
Equation (8) can be substituted into Equation (1) to derive the electrical admittance. The
difference between the load free beam and the axially loaded beam is highlighted in their
natural frequency, as shown in Equation (7). Note that the mechanical and electrical damping
effects are incorporated in the imaginary component of the complex Young’s modulus and
complex electrical permittivity, respectively.
Effect of Axial Force on Natural Frequency
As discussed in the previous section, the applied axial force will not affect the extensional
behavior but only the natural frequency of the beam. So, when the axial force is increased
from 0 to N1, we can assume a change in the natural frequency (only for the transverse mode),
ΔΩm, and Equation (7) can be reduced to:
mssss AIYN 41 , (9)
In fact, the outcome suggests that a tensile stress will cause an increase in natural
frequency while a compressive stress will lead to a reduction. The variation in natural
frequency is directly proportional to the variation in axial force, regardless of the mode
number and range of frequency. Equation (9) is similar to the outcome presented by Abe et al.
(2000).
Consider three rectangular aluminium beams of the same length (236mm) and width
(26mm) but with different thickness, (hs = 2mm, 4mm and 8mm) being subjected to varying
axial stress, from -100 MPa to 100 MPa. The shifts in natural frequency against axial force
stress are calculated and plotted in Figure 3. The figure shows an interesting observation
whereby the shift in natural frequency is not only affected by the magnitude of stress applied
but also the cross-sectional area of the beam. Doubling or halving the thickness at constant

11
stress will resulted in halving and doubling the amount of shift in natural frequency,
respectively (according to Equation 9). Annamdas et al. (2007) also presented similar findings
in their experimental study. This observation gives meaningful implication for the real-life
application of the EMI technique. In practice, the cross-sectional area of a structure can be
much larger than the beam adopted in this study, thus minimizing the contamination of axial
loading on the admittance signaturesacquired for SHM.
Effect of Axial Force on Admittance Signatures
To investigate the effect of axial force on admittance signatures, we first derived the
theoretical electrical admittance signatures of a PZT transducer surface-bonded at the centre
of an axially loaded aluminium beam (236mm x 26mm x 4mm). The material properties used
for deriving the admittance signatures are tabulated in Table 1. In this study, discussion is
focused on the real part of the admittance signatures (conductance) as they are more useful for
SHM application (Sun et al. 1995). The typical frequency range employed by EMI technique,
between 10 to 100 kHz, is adopted (Yang et al. 2008a, 2008b). Figure 4 depicts the
conductance signatures evaluated at varying tensile forces, N up to 10kN, in the frequency
range of 10 to 50 kHz.
In general, the slope and magnitude of the signatures are unaffected by the axial force.
Five out of seven structural resonance peaks shift progressively to the right (increase in
resonance frequency) with increase in tensile force. These peaks are identified as the peaks
induced by transverse modes of vibration of the beam. On the other hand, two of the
resonance peaks (circled in red) with lower amplitudes, excited by the extensional modes, are
unaffected by the change in axial force. In the following sections, both types of peaks are
separately studied, supported with numerical and experimental verifications.
EXPERIMENTAL SETUP AND TEST
For the experiment on tensile test, an aluminium (grade Al6061-T6) beam specimen of size
236mm x 26mm x 4mm was prepared. One piece of PZT patch (type PIC 151, manufactured
by PI Ceramics) measured 10mm x 10mm x 0.3mm was surface-bonded at the centre of the

12
specimen using two parts high strength epoxy. Wayne Kerr precision impedance analyzer
6420 (Figure 5a) was used to supply alternating voltage and to measure the corresponding
admittance signatures across the PZT patch. A notebook computer with customized software
was used to record the admittance signatures.
In the experiment, tensile force was applied using a Universal Test Machine (UTM) as
shown in Figure 5(b). Baseline signatures were recorded after the specimen was clamped on
the UTM, before application of load. Axial force was applied progressively at 1kN step, up to
a maximum of 10kN, i.e., a maximum applied stress of 96.2MPa which is equivalent to
one-third of the specimen yield strength. Admittance signatures were acquired after each load
step. The load was allowed to stabilize before initiating the signature acquisition process. Two
pieces of strain gauges (each 3mm in length), type FLA-3-11-5LT manufactured by TML,
were installed one at the center of the beam (opposite to face with PZT patch) and another at
5cm from the center of the beam, serving as controllers for load monitoring. The values of
strain measured were consistent with the readings from the UTM (in terms of stress divided
by Young’s modulus of elasticity).
Giurgiutiu et al. (2007) reported that for a PZT patch surface bonded on aluminium beam,
which failed at about 7200 micro-strain, the impedance signatures were minimally affected
when the strain does not exceed 3000 micro-strain. In this study, the maximum strain
measured was 1360 micro which is well below the suggested threshold.
Resonance Peaks Induced by Transverse Vibration
Zooming into the resonance peak induced by transverse mode of vibration, occurring between
46.5 to 48.5 kHz of Figure 4, we can observe a progressive rightward shift in peak against
increase in tensile force as shown in Figure 6.
In addition to experimental test, a 3-D FE model was developed using the commercial
FE software ANSYS 12.1 to verify the theoretical analytical model. Coupled field element
(Solid 5) was adopted to simulate the PZT patch. Brick element (Solid 45) was used to model
the aluminium beam. The FE simulation was performed in two stages. Firstly, a static analysis
was performed in the presence of axial load. The outcome of this static analysis was then
brought forward to perform harmonic analysis under excitation of the PZT transducer. The

13
properties and basic assumptions used in the theoretical analytical model were applied in the
FE model. The details of simulation can be found in Yang et al. (2008b).
The admittance signatures acquired from the experimental test and numerical analyses
are plotted in Figures 7(a) and 7(b) respectively. The frequencies of resonance peak at zero
load were recorded as 44.4 kHz and 43.5 kHz respectively. Both of them behave in the same
manner as the theoretical analytical model where the peaks shift progressively to the right
with increase in tensile force. Note that the selected resonance peaks were excited by
transverse mode of vibration. Similar behavior can be observed in the other peaks actuated by
this mode of vibration. It is worth mentioning that the variations between the magnitudes of
peaks from experimental, numerical and analytical results are attributed to the uncertainties
involved in determining the damping ratios, which are highly depend on trial and error. In this
case, the damping ratios are obtained from previous study without performing rigorous trial
and error. This is because the magnitude of peak does not affect the resonance frequency,
which is the major parameter used in the EMI technique (Yang et al. 2008).
For ease of comparison, the increase in resonance frequency obtained from the numerical
simulation, the analytical model (Equation 1 and 8) and the experimental test (as shown in
Figures 6 and 7) as well as the theoretical increase in natural frequency of beam (Equation 9)
are plotted against the axial load as shown in Figure 8.
The results presented demonstrate the capability of the numerical and the analytical
models in describing the interaction between PZT patch and beam substrate under varying
axial load. All of them exhibit a linear relationship. This conforms to the theoretical change in
beam natural frequency under axial load, as predicted by Equation (9). This result also shows
that the resonance peak obtained from the EMI technique is useful in identifying the structural
resonance frequency. The analytical and numerical results match seamlessly. The
experimental results, however, is consistently larger than those obtained by the models. The
amount of shift at 10kN is equal to 0.8 kHz in the experimental test and 0.5 kHz in both the
models. These variations are mainly attributed to the difficulties involved in simulating the
stiffening effect caused by the boundary conditions present in the experimental test. This issue
will be further discussed in the ensuing sections.
14
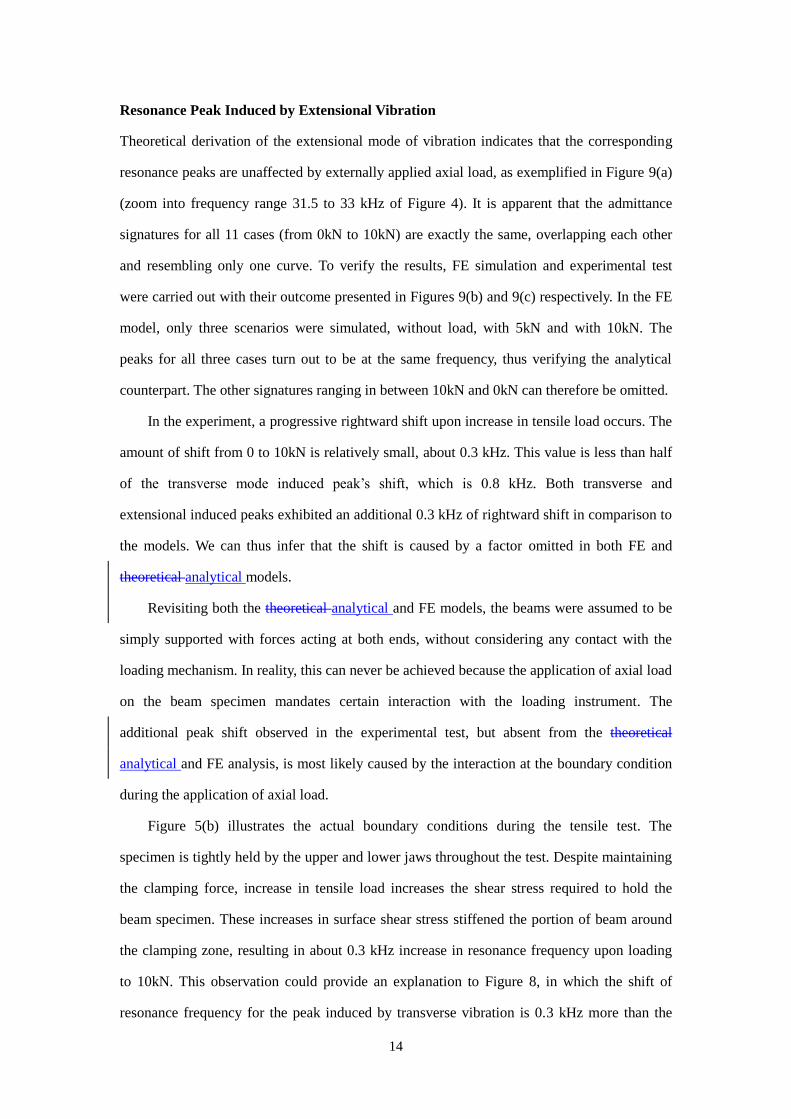
Resonance Peak Induced by Extensional Vibration
Theoretical derivation of the extensional mode of vibration indicates that the corresponding
resonance peaks are unaffected by externally applied axial load, as exemplified in Figure 9(a)
(zoom into frequency range 31.5 to 33 kHz of Figure 4). It is apparent that the admittance
signatures for all 11 cases (from 0kN to 10kN) are exactly the same, overlapping each other
and resembling only one curve. To verify the results, FE simulation and experimental test
were carried out with their outcome presented in Figures 9(b) and 9(c) respectively. In the FE
model, only three scenarios were simulated, without load, with 5kN and with 10kN. The
peaks for all three cases turn out to be at the same frequency, thus verifying the analytical
counterpart. The other signatures ranging in between 10kN and 0kN can therefore be omitted.
In the experiment, a progressive rightward shift upon increase in tensile load occurs. The
amount of shift from 0 to 10kN is relatively small, about 0.3 kHz. This value is less than half
of the transverse mode induced peak’s shift, which is 0.8 kHz. Both transverse and
extensional induced peaks exhibited an additional 0.3 kHz of rightward shift in comparison to
the models. We can thus infer that the shift is caused by a factor omitted in both FE and
theoretical analytical models.
Revisiting both the theoretical analytical and FE models, the beams were assumed to be
simply supported with forces acting at both ends, without considering any contact with the
loading mechanism. In reality, this can never be achieved because the application of axial load
on the beam specimen mandates certain interaction with the loading instrument. The
additional peak shift observed in the experimental test, but absent from the theoretical
analytical and FE analysis, is most likely caused by the interaction at the boundary condition
during the application of axial load.
Figure 5(b) illustrates the actual boundary conditions during the tensile test. The
specimen is tightly held by the upper and lower jaws throughout the test. Despite maintaining
the clamping force, increase in tensile load increases the shear stress required to hold the
beam specimen. These increases in surface shear stress stiffened the portion of beam around
the clamping zone, resulting in about 0.3 kHz increase in resonance frequency upon loading
to 10kN. This observation could provide an explanation to Figure 8, in which the shift of
resonance frequency for the peak induced by transverse vibration is 0.3 kHz more than the

15
theoretical analytical and numerical predictions.
Thus, the extensional mode induced peak’s shift as shown in Figure 9(c) is attributed to
the stiffening effect of boundary condition. These values can be used to compensate for the
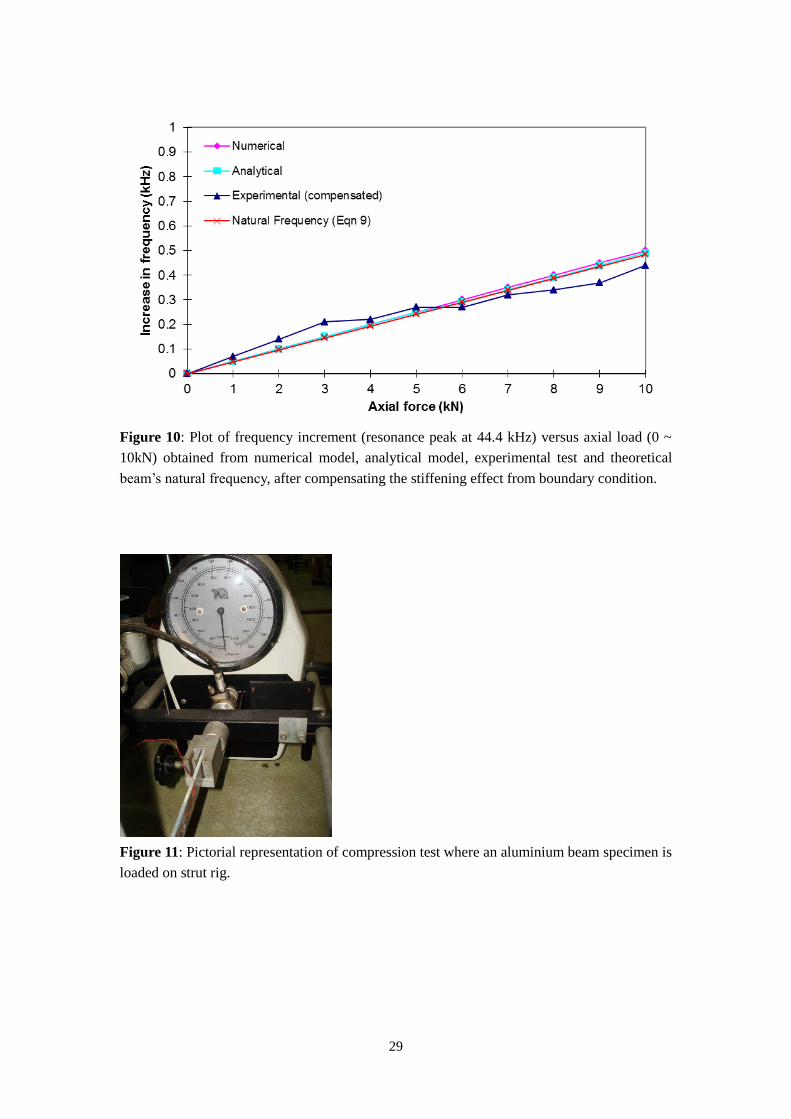
frequency increment of experimental results in Figure 8. Upon compensation, ng the
stiffening effect caused by the boundary condition, Figure 8 is reproduced and presented in
Figure 10. A much closer agreement between the experimental test and the models is achieved.
The discrepancy between them at 10kN is reduced to approximately 0.05 kHz. This suggests
that, in practical application, the effect of boundary condition must be considered along with
the applied axial load. The large discrepancy between theoretical analytical value and
experimental measurement reported by Abe et al. (2002) could be caused by boundary
stiffening. Similar compensation could be achieved by using the other peaks induced by
extensional vibration.
It is worth mentioning that the resonance peaks acquired from experimental test and FE
model match each other closer than with the analytical model. This is mainly attributed to the
fact that the theoretical analytical model is 1-D in nature, being less accurate than the 3-D FE
model. Exact matching is however very difficult due to the difficulty in realistically
simulating the boundary condition used in the experiment. The effect of stiffening will be
further studied in the following section involving compression for beam.
STIFFENING EFFECT INDUCED BY BOUNDARY CONDITION
FOR BEAM UNDER COMPRESSION
Two aluminium beams were prepared to experimentally investigate the effect of compression
under fixed boundary condition on the admittance signatures. A short beam (reusing the
specimen from tensile test, 236mm x 26mm x 4mm) and a long beam (786mm x 26mm x
4mm) having identical cross sectional area were loaded on a strut rig (TQ SM 105 Mk II) as
illustrated in Figure 11. One piece of PZT patch was surface bonded at the center of each
specimen. A maximum load of 600N was exerted on the short beam. Both ends of the beam
were left unconstrained. A certain amount of compressive load was initially applied for
securing the beam on the strut rig, which served as the baseline, because when the applied

16
load was below 100N, the boundary condition was very unstable.
Compression Test on Short Beam
The conductance signatures acquired at various compressive loads for the short beam are
plotted in Figure 12. Two of the resonance peaks occurring at 32.1 kHz and 45.0 kHz are
selected for illustration. Note that they are not exactly the same as for the previous test
because of different initial boundary conditions.
Figure 12 shows that both resonance peaks move to the right upon increase in
compressive load, contradicting the theoretical outcome from Equation (9) and Figure 3, in
which compression will soften the host structure resulting in leftward shift. Analyzing the
peaks’ movements, we found that both peaks shifted about 0.3 kHz when loaded to 600N
(400N increase in compressive load). The corresponding rates of shift averaged at 0.75 kHz /
kN in comparison to -0.048 kHz / kN as calculated from Equation (9). The large variation in
magnitude (15 times difference) and opposite in direction suggest that the rightward shift of
peak must be induced by some other factors, rather than by the compressive load. The
stiffening effect from boundary condition is again suspected to be the main factor.
Compression Test on Long Beam
The conductance signatures acquired at varying compressive load for the long beam are
plotted in Figure 13. The peak once again moved to the right when loaded to 200N and 300N.
However, upon loading to 400N, the peak movement became stagnant. At 500N, the peak
shifted back to the left. Examining the specimen, found obvious curvature was found in the
beam which could have been caused by the P-delta effect at 500N. In other words, the beam
failed in buckling at 500N.
This phenomenon leads to two important observations. Firstly, the effect of local
stiffening remains dominant (though slightly less than that for the short beam) over the effect
of compressive stress in spite of the length of the beam (more than three times of short beam).
The PZT patch remains sensitive to the end conditions. Secondly, buckling of beam (a severe
damage) induced a leftward shift indicating stiffness reduction.

17
Stiffening Induced by Boundary Condition
A simple test was conducted to separately investigate the stiffening effect caused by the
boundary condition. The short beam specimen used previously was clamped with a bench vise
at one end as shown in Figure 14. An attempt was made to minimize the area being clamped
to simulate the boundary condition in previous compression test. The clamping force was
increased progressively by tightening the screw. Admittance signatures were acquired after
each stage. The degree of clamping force applied was labeled as “Wrench” and classified by
the amount of rotation on the screw as tabulated in Table 2. Note that no axial force was
applied.
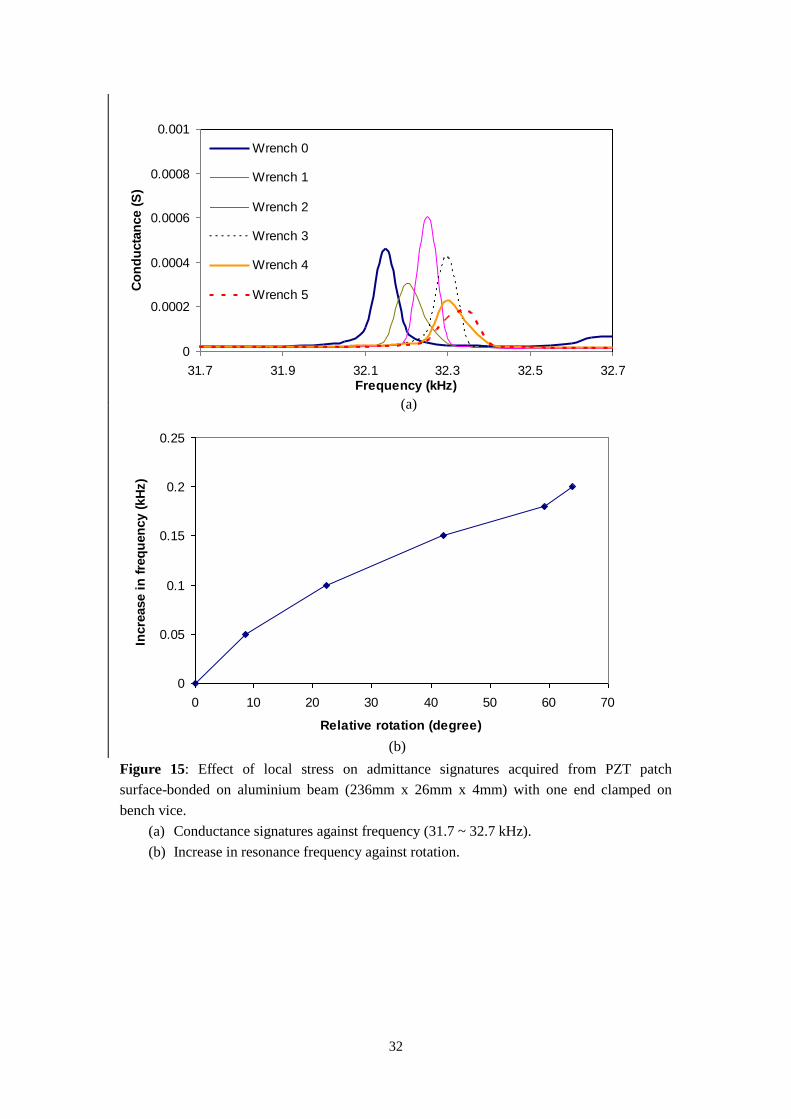
Figure 15(a) plots the conductance signatures against frequency with different levels of
clamping forces applied. Using resonance peak at 32.2 kHz as baseline, the peak shifted
progressively to the right, behaving in a similar manner as observed in the compression test.
The increase in resonance frequency is plotted against the relative rotations in Figure 15(b).
This result clearly shows that the increase in clamping force caused a rightward shift in the
resonance peaks. With increased clamping force, local compressive stress was build up in the
vicinity of the clamp resulting in local stiffening, thus inducing a rightward shift in the
resonance peaks. This observation qualitatively proves that the leftward shift caused by the
compressive force was overwhelmed by the local stiffening due to the boundary condition.
It is worth mentioning that the stiffening effect caused by the boundary condition in the
compression test differed from that in the tensile test. In the compression test, surface
compressive pressures were increasingly built up at both ends by direct compression, whereas
in the tensile test, surface shear stress increased without any increase in surface compressive
pressure. For example, 10kN of shear force in the tensile test and 400N of surface
compressive force both induced approximately 0.3 kHz of stiffening. Obviously, the effect of
surface compressive pressure is more dominant than the surface shear stress as well as the
axial stress itself. Note that this study only considered the axial and transverse mode of
vibration. Resonances induced by the other modes of vibration (width, thickness, torsion etc.)
may behave in different manner.
From the three tests presented in this section, it is apparent that the EMI technique is
very sensitive to local stress induced by the boundary condition upon variations in axial stress,

18
even with the boundary condition fixed. In addition, the admittance signatures acquired from
the tests presented are repeatable for each load step upon loading and unloading as long as the
initial boundary condition is not disturbed. The stiffening effect may also diminish with
increase in the length and size of the structure; but this deserves further investigation.
In practice, SHM could still be performed by acquiring admittance signatures at different
load as baseline. Certain compensation algorithm could also be used to prevent false alarm,
which demands further study.
CONCLUSIONS
This paper investigates the effects of varying axial loadings and boundary conditions on the
admittance signatures acquired from PZT patch surface-bonded on lab-sized beam structure.
An theoretical analytical model was constructed to simulate the interaction between PZT
patch and uniform beam structure in the presence of axial loading. Both extensional and
transverse modes of vibrations were considered. Theoretically, axial load is influential to the
transverse mode of vibration but not the extensional mode. Tensile stress will induce
stiffening effect, resulting in increase in natural frequency as well as resonance frequency of
peaks in the admittance signature spectrum. The effect of stiffening by boundary condition is
investigated using extensional mode of vibration, explaining the variations of resonance peak
(transverse mode) between experimental test and models.
Compression test was also conducted but the expected softening effect, derived
theoretically, cannot be observed because it was overwhelmed by the local stiffening around
the boundary. The EMI technique is also found to be valuable in detecting buckling. This
study suggests that the effect of boundary condition is substantial, which should be carefully
considered in real-life application of EMI technique for SHM.
REFERENCES
Abe, M., Park, G.., Inman, D.J., 2000. “Impedance-Based Monitoring of Stress in Thin
Structural Members,” Proceedings of 11th International conference on adaptive structures and

19
technologies, Oct 23-26, Nagoya, Japan, 285–292.
Annamdas, V. G. M. and Soh, C. K. 2010. “Application of Electromechanical Impedance
Technique for Engineering Structures: Review and Future Issues,” Journal of Intelligent
Material Systems and Structures, 21(1): 41–59.
Annamdas, V.G.M., Yang, Y.W. and Soh, C.K. 2007. “Influence of Loading on
Electromechanical Admittance of Piezoceramic Transducers,” Smart Materials and
Structures, 16: 1888–1897.
Chaudhry, Z., Sun, F. P., and Rogers, C. A. 1994. “Health Monitoring of Space
Structures Using Impedance Measurements,” Fifth International Conference on Adaptive
Structures, Dec. 5 – 7, Sendai, Japan, 584 – 591.
David, D.L.M. 2006. ‘‘Development of an Impedance Method Based Wireless Sensor
Node for Monitoring of Bolted Joint Preload,’’ Master of Science Dissertation, University of
California, San Diego, USA.
Dukkipati, R. V. 2004. Vibration Analysis, Alpha Science International Ltd., Harrow,
UK.
Esteban, J. 1996. “Analysis of the Sensing Region of a PZT Actuator/Sensor”, PhD
Dissertation, Virginia Polytechnic Institute and State University, Blacksburg, VA, USA.
Giurgiutiu, V. 2007. Structural Health Monitoring with Piezoelectric Wafer Active
Sensors, Academic Pr, Oxford.
Giurgiutiu, V. and Zagrai, A. N., 2000, “Characterization of Piezoelectric Wafer Active
Sensors,” Journal of Intelligent Material Systems and Structures, 11: 959–976.
Giurgiutiu, V., Zagrai, A. N. and Bao, J. 2004. “Damage Identification in Aging Aircraft
Structures with Piezoelectric Wafer Active Sensors,” Journal of Intelligent Material Systems
and Structures, 15: 673–687.
Hu, Y. H. and Yang, Y. W. 2007. “Wave Propagation Modeling of PZT Sensing Region
for Structural Health Monitoring,” Smart Materials and Structures, 16: 706–716.
Liang, C., Sun, F. P. and Rogers, C. A. 1994. “Coupled Electro-Mechanical Analysis of
Adaptive Material Systems—Determination of Actuator Power Consumption and System
Energy Transfer,” Journal of Intelligent Material Systems and Structures, 5: 12–20.
20
Lim, Y. Y., Bhalla, S. and Soh, C. K. 2006. “Structural Identification and Damage
Diagnosis Using Self-Sensing Piezo-Impedance Transducers,” Smart Materials and
Structures, 15: 987–995.
Ong, C.W., Yang, Y., Naidu, A.S.K., Lu, Y., Soh, C.K. 2002. “Application of the
Electromechanical Impedance Method for the Identification of In-Situ Stress in Structures,”
Proceedings of SPIE on Smart Structures, Devices and Systems, December 16-18, Melbourne,
503-514.
Park, G., Cudney, H. H. and Inman, D. J. 2000. “Impedance-Based Health Monitoring of
Civil Structural Components,” Journal of Infrastructure Systems, ASCE, 6 (4): 153-160.
Park, G., Sohn, H., Farrar, C. R. and Inman, D. J. 2003. “Overview of Piezoelectric
Impedance-Based Health Monitoring and Path Forward,” The Shock and Vibration Digest, 35
(5): 451-463.
Park, S., Lee, J. J., Inman, D. J. and Yun, C.-B. 2008. “Electro-mechanical
Impedance-Based Wireless Structural Health Monitoring Using PCA and K-Means Clustering
Algorithm,” Journal of Intelligent Material Systems and Structures, 19(4): 509–520.
Park, S., Yun, C.-B. and Inman, D. J. 2008. “Structural health Monitoring Using
Electro-Mechanical Impedance Sensors,” Fatigue & Fracture of Engineering Materials &
Structures, 31: 714–724.
Rao, J.S. 1999. Dynamics of Plates, Narosa Publishing House, New Delhi.
Shin, S.W., Qureshi, A.R., Lee, J.Y. and Yun, C.B. 2008. “Piezoelectric Sensor Based
Nondestructive Active Monitoring of Strength Gain in Concrete,” Smart Materials and
Structures, 17: 055002.
Soh, C. K., Tseng, K. K. H., Bhalla, S., and Gupta, A. 2000. “Performance of Smart
Piezoceramic Patches in Health Monitoring of a RC Bridge,” Smart Materials and Structures,
9(4): 533-542.
Sun, F. P., Chaudhry, Z., Rogers, C. A., Majmundar, M. and Liang, C. 1995. “Automated
Real-Time Structure Health Monitoring via Signature Pattern Recognition,” (edited by I.
Chopra), Proceedings of SPIE Conference on Smart Structures and Materials, San Diego,
California, Feb 27-Mar 1, 2443: 236-247.
Yang, Y., Lim, Y. Y. and Soh, C. K. 2008a. “Practical issues related to the application of

21
the electromechanical impedance technique in the structural health monitoring of civil
structures: I. Experiment,” Smart Materials and Structures, 17: 035008.
Yang, Y., Lim, Y. Y. and Soh, C. K. 2008b. “Practical issues related to the application of
the electromechanical impedance technique in the structural health monitoring of civil
structures: II. Numerical verification,” Smart Materials and Structures, 17: 035009.

22
Table 1(a): Material properties of aluminium beam (T6061-T6).
Parameters Symbols Values Units
Density ρs 2715 kg/m3
Young’s modulus Ys 68.95x10⁹ N/m
2
Mechanical loss factor μ 0.005
Table 1(b): Material properties of PZT patch.
Parameters Symbols Values Units
Piezoelectric constant d31 -2.10 x 10⁻¹⁰
m/V
Electric Permittivity T
33 2.12 x 10⁻⁸
F/m
Density ρa 7800 kg/m3
Young’s modulus EY11 62.1x10⁹ N/m
2
Mechanical loss factor η 0.003
Dielectric loss factor δ 0.02
Table 2: Different levels of clamping forces applied on aluminium beam specimen (236mm x
26mm x 4mm).
Labels Relative
rotations (0)
Descriptions Increase in resonance
frequency (kHz)
Wrench 0 0 Very loose (Touching) 0
Wrench 1 10 Loose 0.05
Wrench 2 20 Medium 0.1
Wrench 3 40 Tight 0.15
Wrench 4 60 Very tight 0.18
Wrench 5 64 Maximum tightness 0.2

23
Figure 1: Elastically constrained 1-D PZT-structure interaction model. (Giurgiutiu and Zagrai,
2000).
Figure 2(a): Pictorial illustration of PZT patch surface bonded on axially loaded beam
structure.
Figure 2(b): Simplified PZT-structure interaction with axial load.
sN sN
sM sM
x1 x2
N N
N N x
z
ls
x1
x2
la PZT patch
Aluminium Beam hs
xa
ya
2Kstr 2Kstr
la
PZT patch

24
-1.0
-0.8
-0.6
-0.4
-0.2
0.0
0.2
0.4
0.6
0.8
1.0
-100 -80 -60 -40 -20 0 20 40 60 80 100
Axial stress (MPa)
Sh
ift
in n
atu
ral
freq
uen
cy (
kH
z)1
hs = 2mm
hs = 4mm
hs = 8mm
Figure 3: Variations in natural frequency against stress with varying beam thickness.
Figure 4: Plot of admittance signatures versus frequency (10 ~ 50 kHz) derived theoretically
analytically from PZT patch surface bonded on aluminium beam (236mm x 26mm x 4mm) at
varying tensile forces.
0
0.0001
0.0002
0.0003
0.0004
10 15 20 25 30 35 40 45 50
Frequency (kHz)
Co
nd
ucta
nce (
S)
N = 0kN N = 2kN N = 4kN N = 6kN
N = 8kN N = 10kN
Peaks excited by extensional
vibration

25
Figure 5: Pictorial illustration of experimental setup.
(a) Precision impedance analyzer.
(b) Aluminium beam monitored by PZT transducer and strain gauges tested on UTM.
Analytical
0
0.0001
0.0002
0.0003
0.0004
0.0005
0.0006
46.5 46.7 46.9 47.1 47.3 47.5 47.7 47.9 48.1 48.3 48.5
Frequency (kHz)
Co
nd
ucta
nce (
S)
N = 0kN N = 1kN N = 2kN N = 3kN
N = 4kN N = 5kN N = 6kN N = 7kN
N = 8kN N = 9kN N = 10kN
Figure 6: Plot of resonance peak (transverse mode) versus frequency (46.5 ~ 48.5 kHz)
derived theoretically analytically from PZT patch surface-bonded on aluminium beam
(236mm x 26mm x 4mm) under varying tensile force.
(a) (b)
Tension: Rightward shift

26
Experimental
0
0.0001
0.0002
0.0003
44 44.2 44.4 44.6 44.8 45 45.2 45.4 45.6
Frequency (kHz)
Co
nd
ucta
nce (
S)
0kN 1kN 2kN 3kN 4kN 5kN
6kN 7kN 8kN 9kN 10kN
Numerical
0
0.0005
0.001
0.0015
0.002
43.2 43.4 43.6 43.8 44 44.2
Frequency (kHz)
Co
nd
ucta
nce (
S)
0N 1kN 2kN 3kN 4kN 5kN
6kN 7kN 8kN 9kN 10kN
Figure 7: Plot of resonance peak (transverse mode) versus frequency (43 ~ 46 kHz) acquired
from PZT patch surface-bonded on aluminium beam (236mm x 26mm x 4mm) under varying
tensile force. (a) Experimental, and (b) Numerical
Tension: Rightward shift
Tension: Rightward shift
(a)
(b)

27
0
0.1
0.2
0.3
0.4
0.5
0.6
0.7
0.8
0.9
0 1 2 3 4 5 6 7 8 9 10
Incre
ase
in
fre
qu
en
cy (
kH
z)
Axial force (kN)
Numerical
Analytical
Experimental
Natural Frequency (Eqn 9)
Figure 8: Plot of frequency increment (resonance peak at 44.4 kHz) versus axial load (0 ~
10kN) obtained from numerical model, analytical model, experimental test and theoretical
beam’s natural frequency.
Analytical
0
0.00005
0.0001
0.00015
0.0002
31.5 31.7 31.9 32.1 32.3 32.5 32.7 32.9
Frequency (kHz)
Co
nd
ucta
nce (
S)
0kN 1kN 2kN 3kN 4kN 5kN
6kN 7kN 8kN 9kN 10kN
(a)

28
Numerical
0
0.001
0.002
0.003
0.004
0.005
31.5 31.7 31.9 32.1 32.3 32.5 32.7 32.9
Frequency (kHz)
Co
nd
ucta
nce (
S)
0N 5kN 10kN
Experimental
0
0.0001
0.0002
0.0003
31.5 31.7 31.9 32.1 32.3 32.5 32.7 32.9
Frequency (kHz)
Co
nd
ucta
nce (
S)
0kN 1kN 2kN 3kN
4kN 5kN 6kN 7kN
8kN 9kN 10kN
Figure 9: Plot of resonance peak (extensional mode) versus frequency (31.5 ~ 33 kHz)
acquired from PZT patch surface-bonded on aluminium beam (236mm x 26mm x 4mm)
under varying tensile load. (a) Analytical, (b) Numerical, and (c) Experimental.
(b)
(c)
29
Figure 10: Plot of frequency increment (resonance peak at 44.4 kHz) versus axial load (0 ~
10kN) obtained from numerical model, analytical model, experimental test and theoretical
beam’s natural frequency, after compensating the stiffening effect from boundary condition.
Figure 11: Pictorial representation of compression test where an aluminium beam specimen is
loaded on strut rig.

30
0
0.0004
0.0008
0.0012
0.0016
31.6 31.8 32 32.2 32.4 32.6
Frequency (kHz)
Co
nd
uc
tan
ce
(S
)200N 300N 400N
500N 600N
0
0.0002
0.0004
0.0006
44.5 44.7 44.9 45.1 45.3 45.5
Frequency (kHz)
Co
nd
uc
tan
ce
(S
)
200N 300N 400N
500N 600N
Figure 12: Plot of conductance signatures versus frequency acquired experimentally from
PZT patch surface-bonded on short aluminum beam (236mm x 26mm x 4mm) at varying
compressive load. (a) 31.6 ~ 32.6 kHz, and (b) 44.5 ~ 45.5 kHz
(a)
(b)

31
0
0.0002
0.0004
0.0006
0.0008
49.6 49.8 50 50.2 50.4 50.6
Frequency (kHz)
Co
nd
ucta
nce (
S)
100N
200N
300N
400N
500N
Figure 13: Plot of conductance signatures versus frequency (49.6 ~ 50.6 kHz) acquired
experimentally from PZT patch surface-bonded on aluminium beam (786mm x 26mm x 4mm)
at varying compressive load.
Figure 14: Pictorial illustration of short beam being clamped on bench vise.
32
0
0.0002
0.0004
0.0006
0.0008
0.001
31.7 31.9 32.1 32.3 32.5 32.7Frequency (kHz)
Co
nd
ucta
nce (
S)
Wrench 0
Wrench 1
Wrench 2
Wrench 3
Wrench 4
Wrench 5
0
0.05
0.1
0.15
0.2
0.25
0 10 20 30 40 50 60 70
Relative rotation (degree)
Incre
ase i
n f
req
uen
cy (
kH
z)
Figure 15: Effect of local stress on admittance signatures acquired from PZT patch
surface-bonded on aluminium beam (236mm x 26mm x 4mm) with one end clamped on
bench vice.
(a) Conductance signatures against frequency (31.7 ~ 32.7 kHz).
(b) Increase in resonance frequency against rotation.
(a)
(b)
Copyright © 2022 FDOKUMEN