Effect of SiC Particulate on Short Glass Fiber Reinforced Polyester Composite in Erosive Wear...
16
http://wjst.wu.ac.th Article Effect of SiC Particulate on Short Glass Fiber Reinforced Polyester Composite in Erosive Wear Environment Ritesh KAUNDAL 1 , Amar PATNAIK 1 and Alok SATAPATHY 2 1 Department of Mechanical Engineering, National Institute of Technology, Hamirpur 177005, India 2 Department of Mechanical Engineering, National Institute of Technology, Rourkela 769008, India (Corresponding author; e-mail: [email protected]) Received: 15 December 2011, Revised: 13 February 2012, Accepted: 20 March 2012 Abstract This study reports the effect on impact strength, physical properties and erosion behavior of silicon carbide (SiC) (0 wt%, 10 wt%, 20 wt%) filled short glass fibers (GF) on reinforced polymer composites. The effect of various operational variables, material parameters and their interactive influences on erosive wear behavior of these composites has been studied systematically. It is observed that silicon carbide (SiC) reinforced glass fiber reinforced polymer composites exhibit better erosion resistance as compared with unfilled polymer composite. However, in particulate filled composites the maximum erosion rate takes place at an impingement angle of 75 ° and for unfilled composite the maximum erosion takes place at an impingement angle of 60 °. In this investigation, the physical and mechanical properties of all the unfilled and particulate filled composites are also evaluated for structural applications. Keywords: Short E-glass fiber, silicon carbide, erosion wear, polymer composite Introduction Polymer composites are used in engineering applications such as aircraft components, automobiles, gears, pump impellers where the components undergo erosive wear. The popularity of polymers is due to their high specific strength and stiffness. However, polymer composites have poor erosion resistance as compared with metal matrix composites [1]. In fact, it is two to three orders of magnitude lower than metallic materials [2]. Hence, it is essential to evaluate their strength as well as their erosive behavior. To overcome such problems a second phase is introduced in the polymer to form a polymer matrix composite. To obtain the desired material characteristics for a particular application, it is important to know how the changes in performance characteristics of the composite vary with filler content under given loading conditions. In these places, fiber reinforced polymers have to function in severe erosive environments and this often leads to their failure. Hard particulate fillers consisting of ceramic or metal particles and fiber fillers made of glass are being used these days to dramatically improve the wear resistance, even up to three orders of magnitude [3]. Fillers affect the strength of the composite according to their packing characteristics, size and interfacial bonding [4]. Srivastava and Shembekar [5] showed that the fracture toughness of epoxy resin could be improved by addition of fly ash particles as filler. Also the improved performance of polymers and their composites in tribological applications by the addition of filler materials has shown great promise and so has lately been a subject of considerable interest. Various kinds of polymers and polymer matrix composites reinforced with metal particles have a wide range of industrial applications, such as heaters, electrodes [6] composites with thermal durability at high temperature [7] etc. The inclusion of inorganic fillers into polymers for commercial applications is primarily aimed at cost reduction and stiffness improvement [8,9]. Along with fiber-reinforced composites, the composites made with particulate Walailak J Sci & Tech 2012; 9(1): 49‐64.
Transcript of Effect of SiC Particulate on Short Glass Fiber Reinforced Polyester Composite in Erosive Wear...
http://wjst.wu.ac.th Article
Effect of SiC Particulate on Short Glass Fiber Reinforced Polyester Composite in Erosive Wear Environment Ritesh KAUNDAL1, Amar PATNAIK1 and Alok SATAPATHY2
1Department of Mechanical Engineering, National Institute of Technology, Hamirpur 177005, India 2Department of Mechanical Engineering, National Institute of Technology, Rourkela 769008, India (Corresponding author; e-mail: [email protected]) Received: 15 December 2011, Revised: 13 February 2012, Accepted: 20 March 2012 Abstract
This study reports the effect on impact strength, physical properties and erosion behavior of silicon carbide (SiC) (0 wt%, 10 wt%, 20 wt%) filled short glass fibers (GF) on reinforced polymer composites. The effect of various operational variables, material parameters and their interactive influences on erosive wear behavior of these composites has been studied systematically. It is observed that silicon carbide (SiC) reinforced glass fiber reinforced polymer composites exhibit better erosion resistance as compared with unfilled polymer composite. However, in particulate filled composites the maximum erosion rate takes place at an impingement angle of 75 ° and for unfilled composite the maximum erosion takes place at an impingement angle of 60 °. In this investigation, the physical and mechanical properties of all the unfilled and particulate filled composites are also evaluated for structural applications.
Keywords: Short E-glass fiber, silicon carbide, erosion wear, polymer composite Introduction
Polymer composites are used in engineering applications such as aircraft components, automobiles, gears, pump impellers where the components undergo erosive wear. The popularity of polymers is due to their high specific strength and stiffness. However, polymer composites have poor erosion resistance as compared with metal matrix composites [1]. In fact, it is two to three orders of magnitude lower than metallic materials [2]. Hence, it is essential to evaluate their strength as well as their erosive behavior. To overcome such problems a second phase is introduced in the polymer to form a polymer matrix composite. To obtain the desired material characteristics for a particular application, it is important to know how the changes in performance characteristics of the composite vary with filler content under given loading conditions. In these places, fiber reinforced polymers have to function in severe erosive environments and this often leads to their failure. Hard particulate fillers consisting of ceramic or metal particles and fiber fillers made of glass are
being used these days to dramatically improve the wear resistance, even up to three orders of magnitude [3]. Fillers affect the strength of the composite according to their packing characteristics, size and interfacial bonding [4]. Srivastava and Shembekar [5] showed that the fracture toughness of epoxy resin could be improved by addition of fly ash particles as filler. Also the improved performance of polymers and their composites in tribological applications by the addition of filler materials has shown great promise and so has lately been a subject of considerable interest. Various kinds of polymers and polymer matrix composites reinforced with metal particles have a wide range of industrial applications, such as heaters, electrodes [6] composites with thermal durability at high temperature [7] etc. The inclusion of inorganic fillers into polymers for commercial applications is primarily aimed at cost reduction and stiffness improvement [8,9]. Along with fiber-reinforced composites, the composites made with particulate
Walailak J Sci & Tech 2012; 9(1): 49‐64.
Particulate Filled Polymer Composites Ritesh KAUNDAL et alhttp://wjst.wu.ac.th
fillers have been found to perform well in tribological conditions.
The possible studies of the erosion characteristics of polymer composites are required due to operational requirements in dusty environments. Therefore, it is necessary to have a full knowledge of all system variables on the wear rate in order to take appropriate steps in the design of machine or structural components, and also to choose such materials to reduce/control this wear mode. Generally, variables influencing the erosive wear of composite materials include mechanical properties of the composites, fiber loading, filler contents, eroding particle size, impingement angle and impact velocity. In viewing literature on erosive wear of composites, most efforts were focused on the study of the influence of the material properties rather than the operating parameters [10-13]. Several investigations on friction and wear properties of polyether ether ketone (PEEK) and its composites filled with fibers, organic, and inorganic fillers have been carried out [14,15]. Cirino et al. [14,16] reported the sliding as well as the abrasive wear behavior of continuous carbon and aramid fiber-reinforced PEEK.
Silicon carbide (SiC) is one such ceramic material that has the potential to be used as a filler in various polymer matrices. It was originally produced by a high temperature electrochemical reaction of sand and carbon. Today the material has been developed into a high quality technical grade ceramic with very good mechanical properties. It is used in abrasives, refractories, ceramics, and numerous high performance applications. The material can also be made an electrical conductor and has applications in resistance heating, flame igniters, and electronic components. Silicon carbide is composed of tetrahedral carbon and silicon atoms with strong bonds in the crystal lattice. This produces a very hard and strong material. It is not attacked by any acids, alkalis, or molten salts up to 800 ºC. The high thermal conductivity coupled with low thermal expansion and high strength gives this material exceptional thermal shock resistant qualities. Silicon carbide has low density of about 3.1 g/cm3, low thermal expansion, high elastic modulus, high strength, high thermal conductivity, high hardness, excellent thermal shock resistance, and superior chemical inertness [17,18].
In this study, physical properties (hardness and density etc.), impact strength and the erosive wear behaviors of SiC/ GFR filled polyester composites were examined. This study evaluates the influence of impingement angle and impact velocity on erosion wear behaviour of composites. The results indicated the effect of short glass fiber reinforcement and inclusion of SiC filler on the impact strength, physical properties and erosive wear behavior of the composites. Materials and methods
Preparation of composites Short glass fibres (Elastic modulus of 72.5
GPa, density of 2.59 gm/cc) (Twaron, Teijin) of 6 mm length were used to prepare the composites. The unsaturated isophthalic polyester resin (Elastic modulus 3.25 GPa, density 1.35 gm/cc) is manufactured by Ciba Geigy and locally supplied by Northern Polymers Ltd. New Delhi, India. The composites are made by conventional hand lay-up technique. Two percent Cobalt naphthenate (as an accelerator) is mixed thoroughly in isophthalic polyester resin and then 2 % methyl-ethyl-ketone-peroxide (MEKP) as a hardener is mixed in the resin prior to reinforcement. The filler material SiC was provided by NICE Ltd, India. Composites of three different compositions (0, 10 and 20 wt% SiC filling) are made and the fiber-loading (weight fraction of glass fiber in the composite) is kept at 50 wt% for all the samples. The castings are put under load for about 24 h for proper curing at room temperature. Specimens of suitable dimension are cut using a diamond cutter for different properties characterization and erosion testing. Physical characterization of composites
Density The theoretical density of composite
materials in terms of weight fraction can easily be obtained from the following equations given by Agarwal and Broutman [19].
1
ρ =ct ( / )+( / )W ρ W ρm mf f
(1)
where, W and ρ represent the weight fraction and density respectively. The suffix f, m and ct stand for the fiber, matrix and the composite materials respectively.
Walailak J Sci & Tech 2012; 9(1) 50
Particulate Filled Polymer Composites Ritesh KAUNDAL et alhttp://wjst.wu.ac.th
The composites under this investigation consist of three components namely matrix, fiber and particulate filler. Hence the modified form of the expression for the density of the composite can be written as
1
ρ =ct ( / )+( / ) + ( /W ρ W ρ W ρm m p pf f ) (2)
where, the suffix p indicates the particulate filler materials.
The actual density (ρce) of the composite, however, can be determined experimentally by simple water immersion. Therefore the volume fraction of voids (Vf) in the composite is calculated using the following equation:
f =V−ρ ρcectρct
(3)
Micro-hardness
Micro-hardness measurement is done using a micro-hardness tester equipped with a square based pyramidal (angle 136 º between opposite faces) diamond indenter by applying a load of 10 N as per ASTM E-18. Impact test
Low velocity instrumented impact tests were carried out on composite specimens. The tests were done as per ASTM D 256 using an impact tester. The pendulum impact testing machine ascertains the notch impact strength of the material by shattering the V notched (45 º) specimen with a pendulum hammer, measuring the spent energy, and relating it to the cross section of the specimen. The standard specimen for ASTM D 256 is 60 ×10 × 4 mm3 and the depth under the notch is 2 mm. The machine is adjusted such that the blade on the free-hanging pendulum just barely contracts the specimen (zero position). The specimens were clamped in a square support and were struck at their central point by a hemispherical bolt of diameter 5 mm. The respective values of impact energy of different specimens were recorded directly from the dial indicator. Taguchi experiment design
For the elaboration of the experimental plan the method of Taguchi for five factors at three levels was used, being understood by levels taken by the factors. In Table 1 is indicated the factors to be studied and the assignment of the corresponding levels. In the present study, we choose the experimental layout of the L27 (313) orthogonal array consisting of five control factors, each one at three levels, as shown in Table 2. The factors and the interactions were assigned to the columns. In practice, these factors can be assigned arbitrarily to any of the arrays columns, provided that all combinations are included.
After assigning appropriate level settings, the S/N analysis (S/N: signal-to-noise ratio) was needed to evaluate experiment results. In S/N analysis, the greater the S/N, the better the experimental results:
η = −10 log (M.S.D.) (4)
where M.S.D. is the mean-square deviation for the output characteristic (erosive wear rate).
As mentioned earlier, there are three categories of quality characteristics, i.e. lower-the-better, higher-the-better, and nominal-the-better. To obtain optimal performance, lower-the-better characteristic for erosion rate must be taken. The mean-square deviation (M.S.D.) for the lower-the-better characteristic can be expressed as [20]:
i 1
1M.S.D=
= ∑m
2iT
m (5)
where m is the number of tests and Ti is the value of experimental result of the i th test.
The plan of the experiments was as follows: the first column was assigned to impact velocity (A), the second column to SiC filler content (B), the fifth column to impingement angle (C), the ninth column to stand-off distance (D) and the tenth column to erodent size (E), the third and fourth column were assigned to (A×B)1 and (A×B)2 respectively to estimate interaction between impact velocity (A) and SiC percentage (B), the sixth and seventh column were assigned to (B×C)1 and (B×C)2 respectively to estimate the interaction between the filler content (B) and impingement angle (C), the eight and eleventh column are assigned to (A×C)1 and (A×C)2 respectively to estimate interaction between the impact velocity (A) and impingement angle (C)
Walailak J Sci & Tech 2012; 9(1)
51
Particulate Filled Polymer Composites Ritesh KAUNDAL et alhttp://wjst.wu.ac.th
and the remaining columns were used to estimate experimental errors. The output to be studied was the erosion rate (Er) and the tests were repeated twice corresponding to 54 tests, to allow the analysis of variance of the results. Furthermore, a statistical analysis of variance (ANOVA) was
performed to identify the process parameters that were statistically significant. With the S/N and ANOVA analyses, the optimal combination of the process parameters can be predicted and their level of significance.
Table 1 Levels for various control factors.
Level Control factor I II III Units A:Velocity of impact 43 54 65 m/sec B:Filler content 0 10 20 % C:Impingement angle 30 60 90 degree D:Stand-off distance 65 75 85 mm E:Erodent size 250 350 450 µm
Table 2 Orthogonal array for an L27 (313) Taguchi Design.
L27 (313)
1 A
2 B
3 (A×B)1
4 (A×B)2
5 C
6 (B×C)1
7 (B×C)2
8 (A×C)1
9 D
10 E
11 (A×C)2
12 13
1 1 1 1 1 1 1 1 1 1 1 1 1 1 2 1 1 1 1 2 2 2 2 2 2 2 2 2 3 1 1 1 1 3 3 3 3 3 3 3 3 3 4 1 2 2 2 1 1 1 2 2 2 3 3 3 5 1 2 2 2 2 2 2 3 3 3 1 1 1 6 1 2 2 2 3 3 3 1 1 1 2 2 2 7 1 3 3 3 1 1 1 3 3 3 2 2 2 8 1 3 3 3 2 2 2 1 1 1 3 3 3 9 1 3 3 3 3 3 3 2 2 2 1 1 1
10 2 1 2 3 1 2 3 1 2 3 1 2 3 11 2 1 2 3 2 3 1 2 3 1 2 3 1 12 2 1 2 3 3 1 2 3 1 2 3 1 2 13 2 2 3 1 1 2 3 2 3 1 3 1 2 14 2 2 3 1 2 3 1 3 1 2 1 2 3 15 2 2 3 1 3 1 2 3 3 1 2 3 1 16 2 3 1 2 1 2 3 3 1 2 2 3 1 17 2 3 1 2 2 3 1 1 2 3 3 1 2 18 2 3 1 2 3 1 2 2 3 1 1 2 3 19 3 1 3 2 1 3 2 1 3 2 1 3 2 20 3 1 3 2 2 1 3 2 1 3 2 1 3 21 3 1 3 2 3 2 1 3 2 1 3 2 1 22 3 2 1 3 1 3 2 2 1 3 3 2 1 23 3 2 1 3 2 1 3 3 2 1 1 3 2 24 3 2 1 3 3 2 1 1 3 2 2 1 3 25 3 3 2 1 1 3 2 3 2 1 2 1 3 26 3 3 2 1 2 1 3 1 3 2 3 2 1 27 3 3 2 1 3 2 1 2 1 3 1 3 2
Walailak J Sci & Tech 2012; 9(1) 52
Particulate Filled Polymer Composites Ritesh KAUNDAL et alhttp://wjst.wu.ac.th
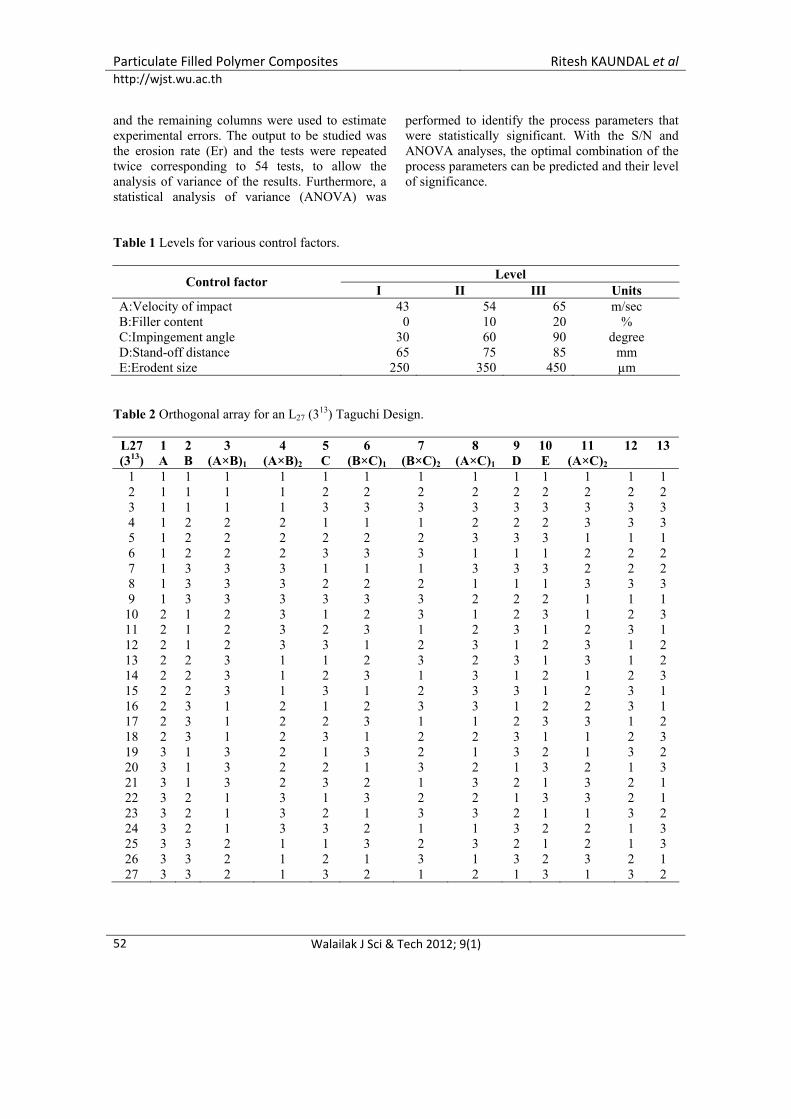
Experimental set-up
Figure 1 shows the schematic diagram of the erosion test rig conforming to ASTM G 76. The set up was capable of creating reproducible erosive situations for assessing erosion wear resistance of the prepared composite samples. The erosion tester consists of an air compressor, an air particle mixing chamber and accelerating chamber. Dry compressed air was mixed with the particles which were fed at constant rate from a sand flow control knob through a convergent brass nozzle of 4 mm internal diameter. These particles impact the specimen which can be held at different angles
with respect to the direction of erodent flow using a swivel and an adjustable sample clip. The velocity of the eroding particles was determined using the double disc method [21].
In the present study, dry silica sand (spherical) of different particle sizes (250, 350, 450 µm) were used as the erodent. The samples were cleaned in acetone, dried and weighed to an accuracy of ± 0.1 mg using a precision electronic balance. The process was repeated till the erosion rate attained a constant value called the steady state erosion rate.
Figure 1 Schematic diagram of the erosion test rig [22].
Scanning electron microscopy
The surfaces of the specimens were examined directly by a scanning electron microscope JEOL JSM-6480LV in the LV mode. The eroded samples were mounted on stubs with silver paste. To enhance the conductivity of the eroded samples, a thin film of platinum was vacuum-evaporated onto them before the photomicrographs were taken.
Results and discussion
Effect of void fraction on filler content of the composite
The theoretical density values for unfilled and particulate filled glass polyester composites are calculated using the rules for mixtures and are presented in Table 3. These values are generally higher than the experimentally measured density values, also presented in Table 3. Reduction in the
Walailak J Sci & Tech 2012; 9(1)
53
Particulate Filled Polymer Composites Ritesh KAUNDAL et alhttp://wjst.wu.ac.th
density of composites compared to the expected values is attributed to the entrapment of air in the polyester matrix material in the process of mechanical mixing of short glass fibers in the resin. Thus the difference between densities calculated by these two techniques is a measure of voids and pores present in the composites. The entrapped air (referred to as voids) is undesired because it adversely affects the mechanical
properties of the composite. But when this glass fiber–reinforced polyester resin is filled with micro-sized SiC particles, the density of the resulting hybrid composites assumes higher values; that is, 1.61 g/cm3 (void fraction 19 %) and 1.72 g/cm3 (void fraction 22 %) for composites with SiC contents of 10 and 20 wt%, respectively. Consequently, the void fraction in the composites increases with the filler content.
Table 3 Theoretical and experimental densities of the composites.
Sl. No. Filler content
(wt.-%) Theoretical density
(gm/cm3) Experimental density
(gm/cm3) Void fraction
(%) 1 0 1.30 1.19 8.4 2 10 1.61 1.29 19 3 20 1.72 1.34 22
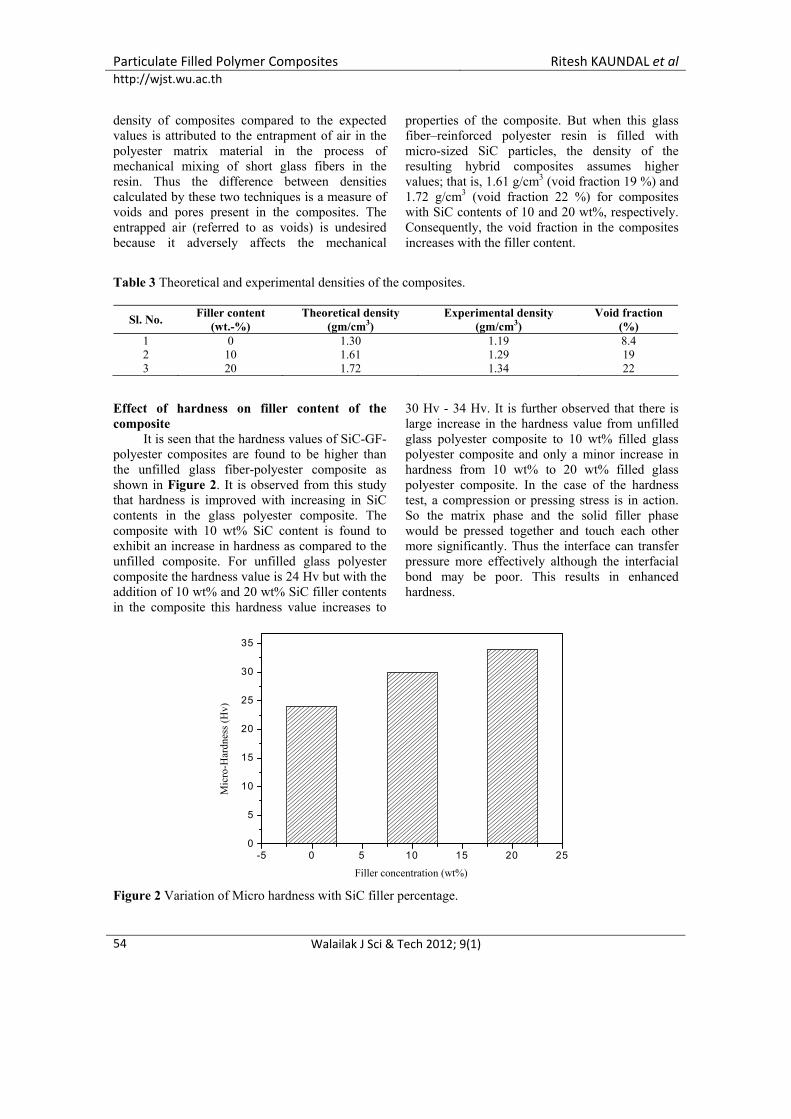
Effect of hardness on filler content of the composite
It is seen that the hardness values of SiC-GF-polyester composites are found to be higher than the unfilled glass fiber-polyester composite as shown in Figure 2. It is observed from this study that hardness is improved with increasing in SiC contents in the glass polyester composite. The composite with 10 wt% SiC content is found to exhibit an increase in hardness as compared to the unfilled composite. For unfilled glass polyester composite the hardness value is 24 Hv but with the addition of 10 wt% and 20 wt% SiC filler contents in the composite this hardness value increases to
30 Hv - 34 Hv. It is further observed that there is large increase in the hardness value from unfilled glass polyester composite to 10 wt% filled glass polyester composite and only a minor increase in hardness from 10 wt% to 20 wt% filled glass polyester composite. In the case of the hardness test, a compression or pressing stress is in action. So the matrix phase and the solid filler phase would be pressed together and touch each other more significantly. Thus the interface can transfer pressure more effectively although the interfacial bond may be poor. This results in enhanced hardness.
-5 0 5 10 15 20 250
5
10
15
20
25
30
35
Mic
ro-H
ardn
ess
(Hv)
Mic
ro-H
ardn
ess (
Hv)
Fi )ller concentration (wt.-%Filler concentration (wt%)
Figure 2 Variation of Micro hardness with SiC filler percentage.
Walailak J Sci & Tech 2012; 9(1) 54
Particulate Filled Polymer Composites Ritesh KAUNDAL et alhttp://wjst.wu.ac.th
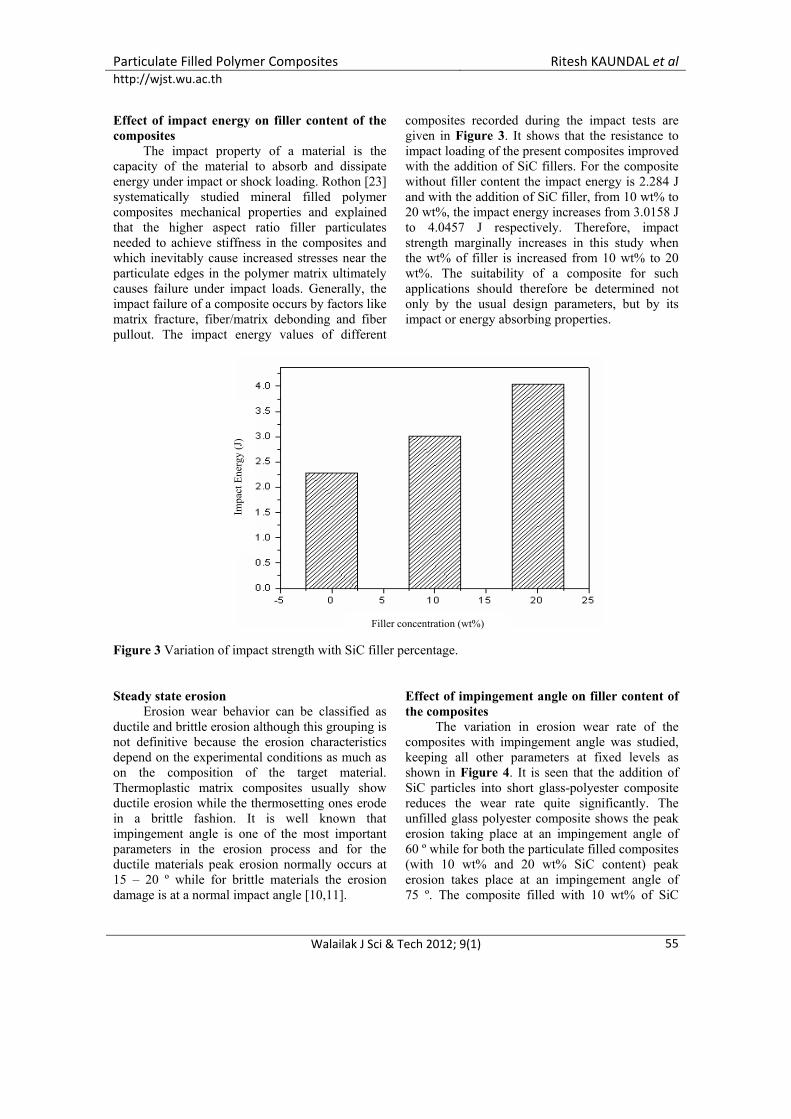
Effect of impact energy on filler content of the composites
The impact property of a material is the capacity of the material to absorb and dissipate energy under impact or shock loading. Rothon [23] systematically studied mineral filled polymer composites mechanical properties and explained that the higher aspect ratio filler particulates needed to achieve stiffness in the composites and which inevitably cause increased stresses near the particulate edges in the polymer matrix ultimately causes failure under impact loads. Generally, the impact failure of a composite occurs by factors like matrix fracture, fiber/matrix debonding and fiber pullout. The impact energy values of different
composites recorded during the impact tests are given in Figure 3. It shows that the resistance to impact loading of the present composites improved with the addition of SiC fillers. For the composite without filler content the impact energy is 2.284 J and with the addition of SiC filler, from 10 wt% to 20 wt%, the impact energy increases from 3.0158 J to 4.0457 J respectively. Therefore, impact strength marginally increases in this study when the wt% of filler is increased from 10 wt% to 20 wt%. The suitability of a composite for such applications should therefore be determined not only by the usual design parameters, but by its impact or energy absorbing properties.
Impa
ct E
nerg
y (J
)
Filler concentration (wt%) Figure 3 Variation of impact strength with SiC filler percentage.
Steady state erosion
Erosion wear behavior can be classified as ductile and brittle erosion although this grouping is not definitive because the erosion characteristics depend on the experimental conditions as much as on the composition of the target material. Thermoplastic matrix composites usually show ductile erosion while the thermosetting ones erode in a brittle fashion. It is well known that impingement angle is one of the most important parameters in the erosion process and for the ductile materials peak erosion normally occurs at 15 – 20 º while for brittle materials the erosion damage is at a normal impact angle [10,11].
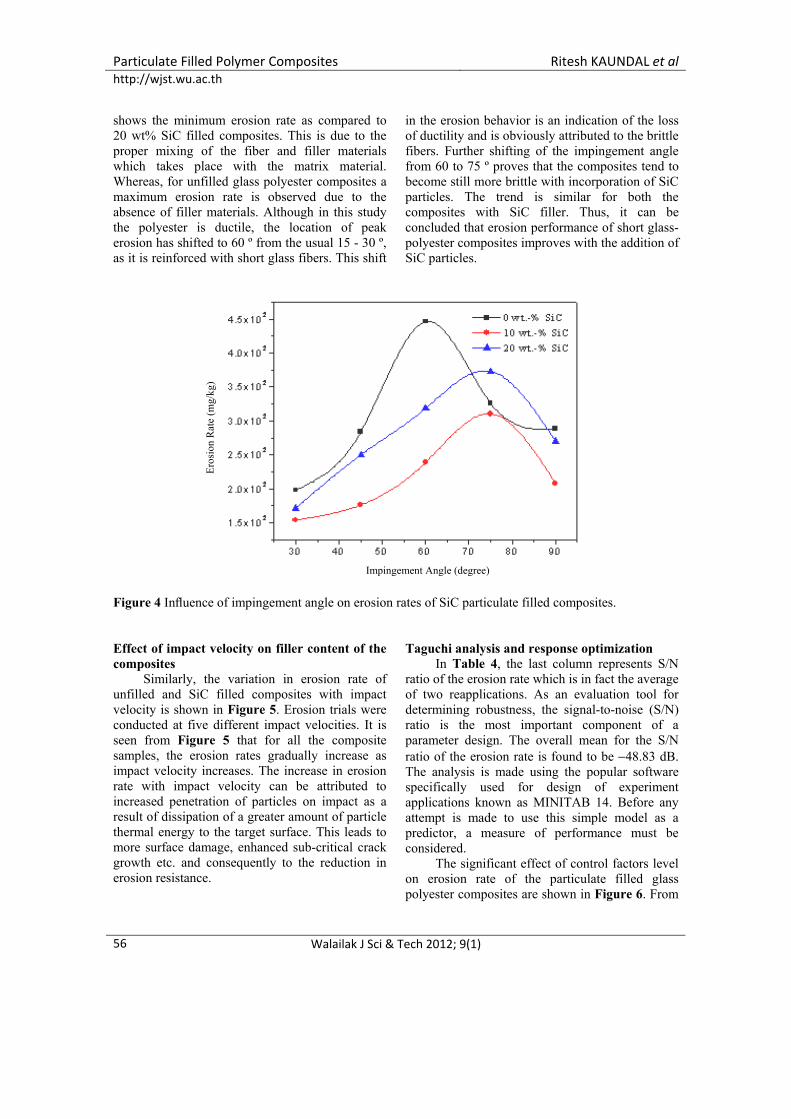
Effect of impingement angle on filler content of the composites
The variation in erosion wear rate of the composites with impingement angle was studied, keeping all other parameters at fixed levels as shown in Figure 4. It is seen that the addition of SiC particles into short glass-polyester composite reduces the wear rate quite significantly. The unfilled glass polyester composite shows the peak erosion taking place at an impingement angle of 60 º while for both the particulate filled composites (with 10 wt% and 20 wt% SiC content) peak erosion takes place at an impingement angle of 75 º. The composite filled with 10 wt% of SiC
Walailak J Sci & Tech 2012; 9(1)
55
Particulate Filled Polymer Composites Ritesh KAUNDAL et alhttp://wjst.wu.ac.th
shows the minimum erosion rate as compared to 20 wt% SiC filled composites. This is due to the proper mixing of the fiber and filler materials which takes place with the matrix material. Whereas, for unfilled glass polyester composites a maximum erosion rate is observed due to the absence of filler materials. Although in this study the polyester is ductile, the location of peak erosion has shifted to 60 º from the usual 15 - 30 º, as it is reinforced with short glass fibers. This shift
in the erosion behavior is an indication of the loss of ductility and is obviously attributed to the brittle fibers. Further shifting of the impingement angle from 60 to 75 º proves that the composites tend to become still more brittle with incorporation of SiC particles. The trend is similar for both the composites with SiC filler. Thus, it can be concluded that erosion performance of short glass-polyester composites improves with the addition of SiC particles.
Eros
ion
Rat
e (m
g/kg
)
Impingement Angle (degree)
Figure 4 Influence of impingement angle on erosion rates of SiC particulate filled composites. Effect of impact velocity on filler content of the composites
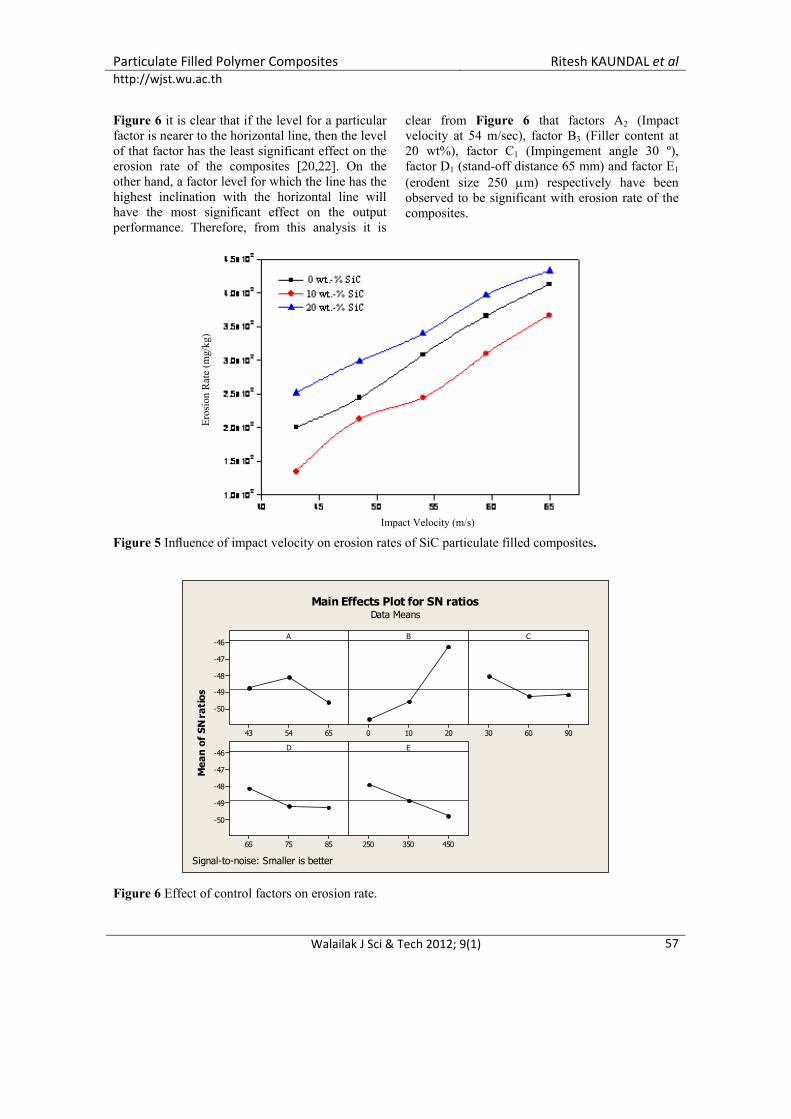
Similarly, the variation in erosion rate of unfilled and SiC filled composites with impact velocity is shown in Figure 5. Erosion trials were conducted at five different impact velocities. It is seen from Figure 5 that for all the composite samples, the erosion rates gradually increase as impact velocity increases. The increase in erosion rate with impact velocity can be attributed to increased penetration of particles on impact as a result of dissipation of a greater amount of particle thermal energy to the target surface. This leads to more surface damage, enhanced sub-critical crack growth etc. and consequently to the reduction in erosion resistance.
Taguchi analysis and response optimization In Table 4, the last column represents S/N
ratio of the erosion rate which is in fact the average of two reapplications. As an evaluation tool for determining robustness, the signal-to-noise (S/N) ratio is the most important component of a parameter design. The overall mean for the S/N ratio of the erosion rate is found to be −48.83 dB. The analysis is made using the popular software specifically used for design of experiment applications known as MINITAB 14. Before any attempt is made to use this simple model as a predictor, a measure of performance must be considered.
The significant effect of control factors level on erosion rate of the particulate filled glass polyester composites are shown in Figure 6. From
Walailak J Sci & Tech 2012; 9(1) 56
Particulate Filled Polymer Composites Ritesh KAUNDAL et alhttp://wjst.wu.ac.th
Figure 6 it is clear that if the level for a particular factor is nearer to the horizontal line, then the level of that factor has the least significant effect on the erosion rate of the composites [20,22]. On the other hand, a factor level for which the line has the highest inclination with the horizontal line will have the most significant effect on the output performance. Therefore, from this analysis it is
clear from Figure 6 that factors A2 (Impact velocity at 54 m/sec), factor B3 (Filler content at 20 wt%), factor C1 (Impingement angle 30 º), factor D1 (stand-off distance 65 mm) and factor E1 (erodent size 250 μm) respectively have been observed to be significant with erosion rate of the composites.
Eros
ion
Rat
e (m
g/kg
)
Figure 5 Influence of impact velocity on erosion rates of SiC particulate filled composites. Impact Velocity (m/s)
655443
-46
-47
-48
-49
-50
20100 906030
857565
-46
-47
-48
-49
-50
450350250
A
Mea
n of
SN
rati
os
B C
D E
Main Effects Plot for SN ratiosData Means
Signal-to-noise: Smaller is better
Figure 6 Effect of control factors on erosion rate.
Walailak J Sci & Tech 2012; 9(1)
57
Particulate Filled Polymer Composites Ritesh KAUNDAL et alhttp://wjst.wu.ac.th
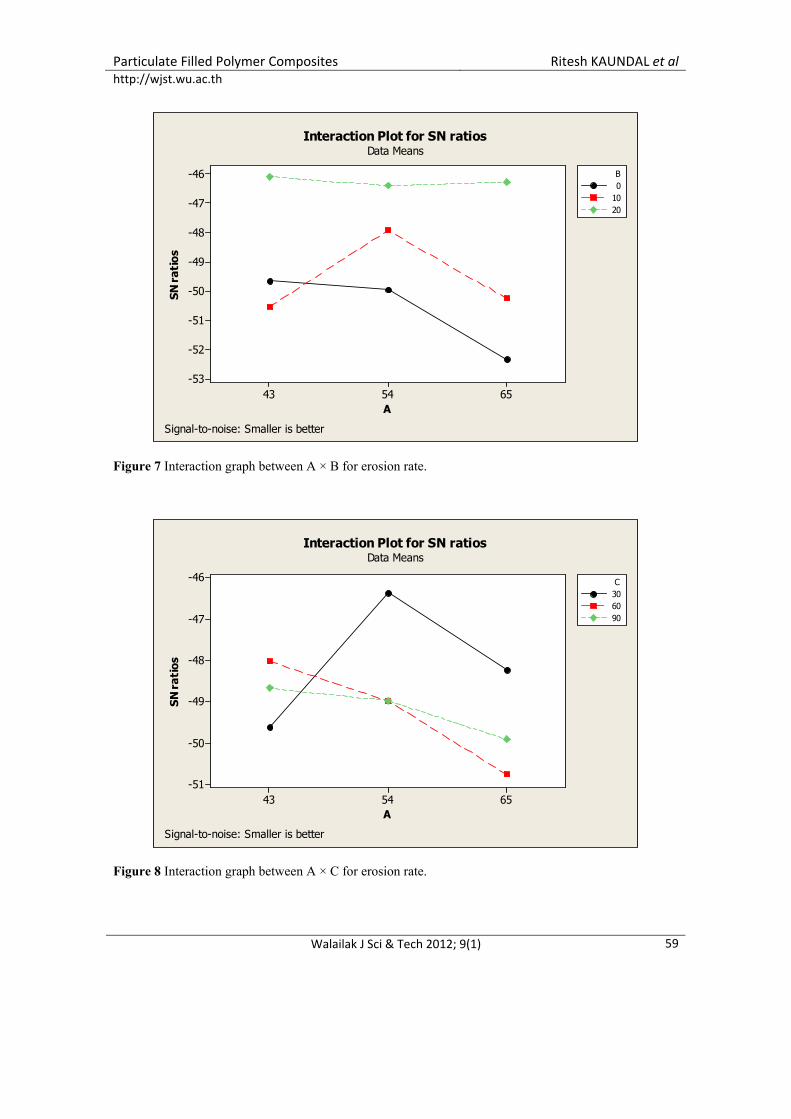
The interaction graphs are shown in the Figures 7 - 9. The interaction between impact velocity and filler content (A×B) is less significant on the output of the composites (Figure 7). From Figure 6 the factor A2 and factor B3 are significant individually on output but the interaction effect of factor A and B on output may be less significant as shown in Figure 7. It is clear from Figure 7 that the factor A1 and B3 line is at the higher side of A2
and B3. Therefore, from this analysis it is clear that impact velocity (A) and filler content (B) have a significant effect on erosion rate independently but their combined effect is less significant. However, Figures 8 and 9 show significant interaction effects on the erosion rate of the composites. The effect of the significance of control factors and interactions on output can be further studied by analysis of variance (ANOVA) in the next step.
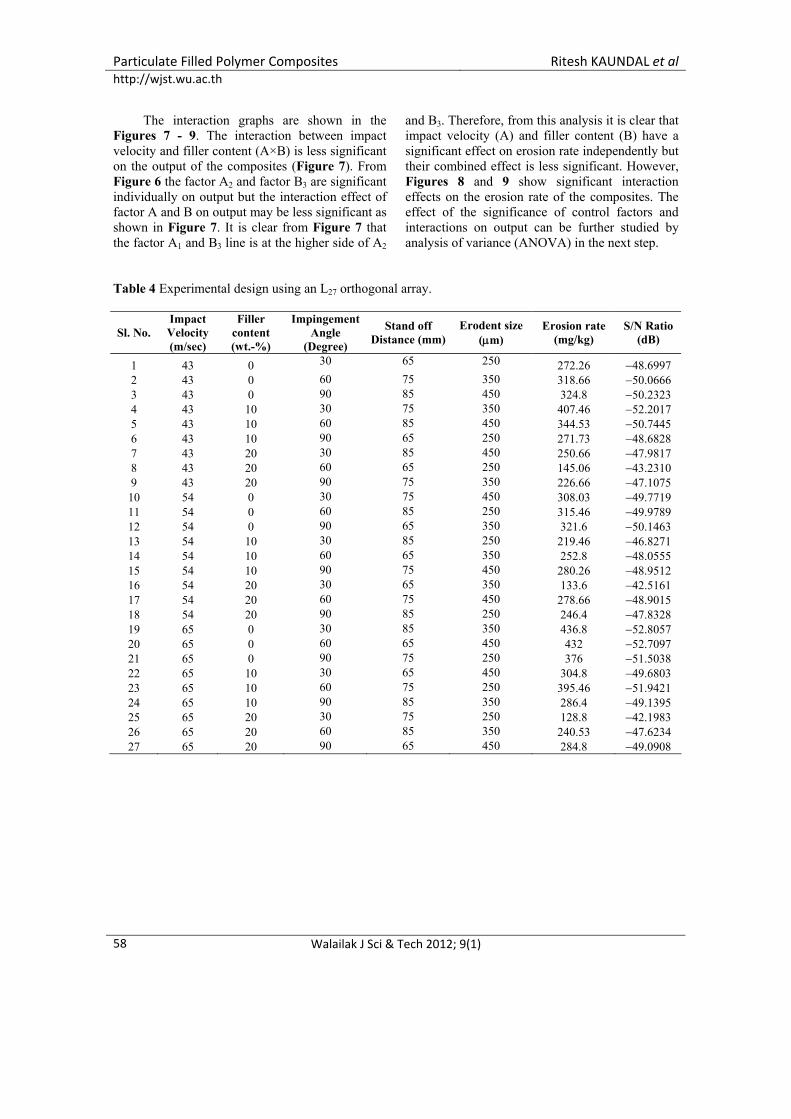
Table 4 Experimental design using an L27 orthogonal array.
Sl. No. Impact Velocity (m/sec)
Filler content (wt.-%)
Impingement Angle
(Degree)
Stand off Distance (mm)
Erodent size (μm)
Erosion rate (mg/kg)
S/N Ratio (dB)
1 43 0 30 65 250 272.26 −48.6997 2 43 0 60 75 350 318.66 −50.0666 3 43 0 90 85 450 324.8 −50.2323 4 43 10 30 75 350 407.46 −52.2017 5 43 10 60 85 450 344.53 −50.7445 6 43 10 90 65 250 271.73 −48.6828 7 43 20 30 85 450 250.66 −47.9817 8 43 20 60 65 250 145.06 −43.2310 9 43 20 90 75 350 226.66 −47.1075 10 54 0 30 75 450 308.03 −49.7719 11 54 0 60 85 250 315.46 −49.9789 12 54 0 90 65 350 321.6 −50.1463 13 54 10 30 85 250 219.46 −46.8271 14 54 10 60 65 350 252.8 −48.0555 15 54 10 90 75 450 280.26 −48.9512 16 54 20 30 65 350 133.6 −42.5161 17 54 20 60 75 450 278.66 −48.9015 18 54 20 90 85 250 246.4 −47.8328 19 65 0 30 85 350 436.8 −52.8057 20 65 0 60 65 450 432 −52.7097 21 65 0 90 75 250 376 −51.5038 22 65 10 30 65 450 304.8 −49.6803 23 65 10 60 75 250 395.46 −51.9421 24 65 10 90 85 350 286.4 −49.1395 25 65 20 30 75 250 128.8 −42.1983 26 65 20 60 85 350 240.53 −47.6234 27 65 20 90 65 450 284.8 −49.0908
Walailak J Sci & Tech 2012; 9(1) 58
Particulate Filled Polymer Composites Ritesh KAUNDAL et alhttp://wjst.wu.ac.th
655443
-46
-47
-48
-49
-50
-51
-52
-53
A
SN r
atio
s0
1020
B
Interaction Plot for SN ratiosData Means
Signal-to-noise: Smaller is better
Figure 7 Interaction graph between A × B for erosion rate.
655443
-46
-47
-48
-49
-50
-51
A
SN r
atio
s
306090
C
Interaction Plot for SN ratiosData Means
Signal-to-noise: Smaller is better
Figure 8 Interaction graph between A × C for erosion rate.
Walailak J Sci & Tech 2012; 9(1)
59
Particulate Filled Polymer Composites Ritesh KAUNDAL et alhttp://wjst.wu.ac.th
20100
-44
-45
-46
-47
-48
-49
-50
-51
B
SN r
atio
s306090
C
Interaction Plot for SN ratiosData Means
Signal-to-noise: Smaller is better
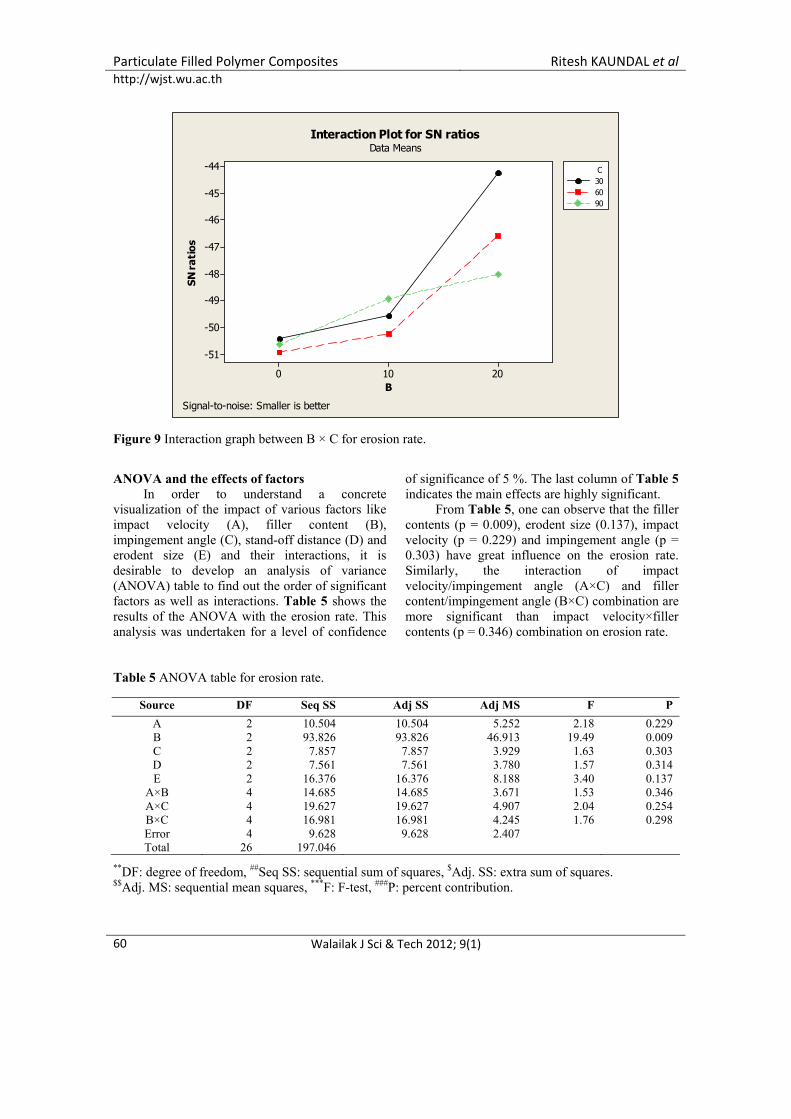
Figure 9 Interaction graph between B × C for erosion rate. ANOVA and the effects of factors
In order to understand a concrete visualization of the impact of various factors like impact velocity (A), filler content (B), impingement angle (C), stand-off distance (D) and erodent size (E) and their interactions, it is desirable to develop an analysis of variance (ANOVA) table to find out the order of significant factors as well as interactions. Table 5 shows the results of the ANOVA with the erosion rate. This analysis was undertaken for a level of confidence
of significance of 5 %. The last column of Table 5 indicates the main effects are highly significant.
From Table 5, one can observe that the filler contents (p = 0.009), erodent size (0.137), impact velocity (p = 0.229) and impingement angle (p = 0.303) have great influence on the erosion rate. Similarly, the interaction of impact velocity/impingement angle (A×C) and filler content/impingement angle (B×C) combination are more significant than impact velocity×filler contents (p = 0.346) combination on erosion rate.
Table 5 ANOVA table for erosion rate.
Source DF Seq SS Adj SS Adj MS F P A 2 10.504 10.504 5.252 2.18 0.229 B 2 93.826 93.826 46.913 19.49 0.009 C 2 7.857 7.857 3.929 1.63 0.303 D 2 7.561 7.561 3.780 1.57 0.314 E 2 16.376 16.376 8.188 3.40 0.137
A×B 4 14.685 14.685 3.671 1.53 0.346 A×C 4 19.627 19.627 4.907 2.04 0.254 B×C 4 16.981 16.981 4.245 1.76 0.298 Error 4 9.628 9.628 2.407 Total 26 197.046
**DF: degree of freedom, ##Seq SS: sequential sum of squares, $Adj. SS: extra sum of squares. $$Adj. MS: sequential mean squares, ***F: F-test, ###P: percent contribution.
Walailak J Sci & Tech 2012; 9(1) 60
Particulate Filled Polymer Composites Ritesh KAUNDAL et alhttp://wjst.wu.ac.th
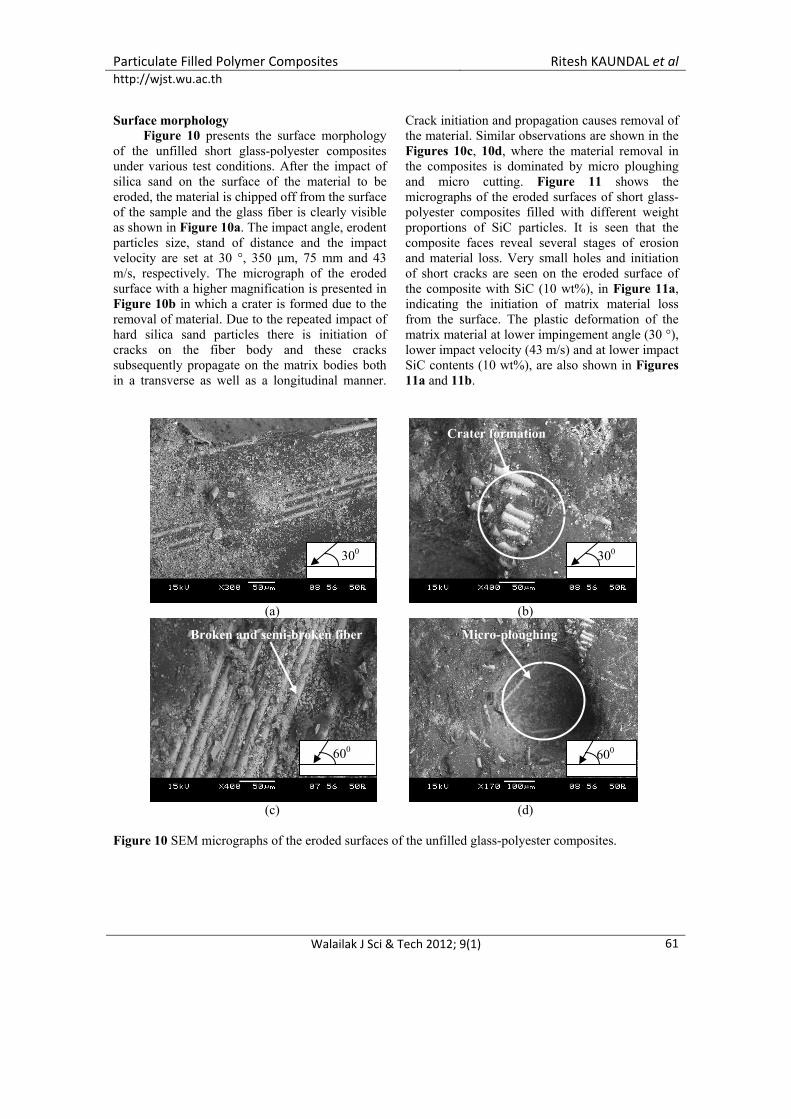
Surface morphology Figure 10 presents the surface morphology
of the unfilled short glass-polyester composites under various test conditions. After the impact of silica sand on the surface of the material to be eroded, the material is chipped off from the surface of the sample and the glass fiber is clearly visible as shown in Figure 10a. The impact angle, erodent particles size, stand of distance and the impact velocity are set at 30 °, 350 μm, 75 mm and 43 m/s, respectively. The micrograph of the eroded surface with a higher magnification is presented in Figure 10b in which a crater is formed due to the removal of material. Due to the repeated impact of hard silica sand particles there is initiation of cracks on the fiber body and these cracks subsequently propagate on the matrix bodies both in a transverse as well as a longitudinal manner.
Crack initiation and propagation causes removal of the material. Similar observations are shown in the Figures 10c, 10d, where the material removal in the composites is dominated by micro ploughing and micro cutting. Figure 11 shows the micrographs of the eroded surfaces of short glass-polyester composites filled with different weight proportions of SiC particles. It is seen that the composite faces reveal several stages of erosion and material loss. Very small holes and initiation of short cracks are seen on the eroded surface of the composite with SiC (10 wt%), in Figure 11a, indicating the initiation of matrix material loss from the surface. The plastic deformation of the matrix material at lower impingement angle (30 °), lower impact velocity (43 m/s) and at lower impact SiC contents (10 wt%), are also shown in Figures 11a and 11b.
(a) (b)
(c) (d)
Crater formation
Figure 10 SEM micrographs of the eroded surfaces of the unfilled glass-polyester composites.
300 300
Broken and semi-broken fiber
600 600
Micro-ploughing
Walailak J Sci & Tech 2012; 9(1)
61
Particulate Filled Polymer Composites Ritesh KAUNDAL et alhttp://wjst.wu.ac.th
(a) (b)
(c) (d)
(e) (f)
Matrix removal
300 300
Multiple fracture and fiber fragmentation
Crater formed and exposed fiber
Figure 11 SEM micrographs of the eroded glass-polyester composites filled with SiC.
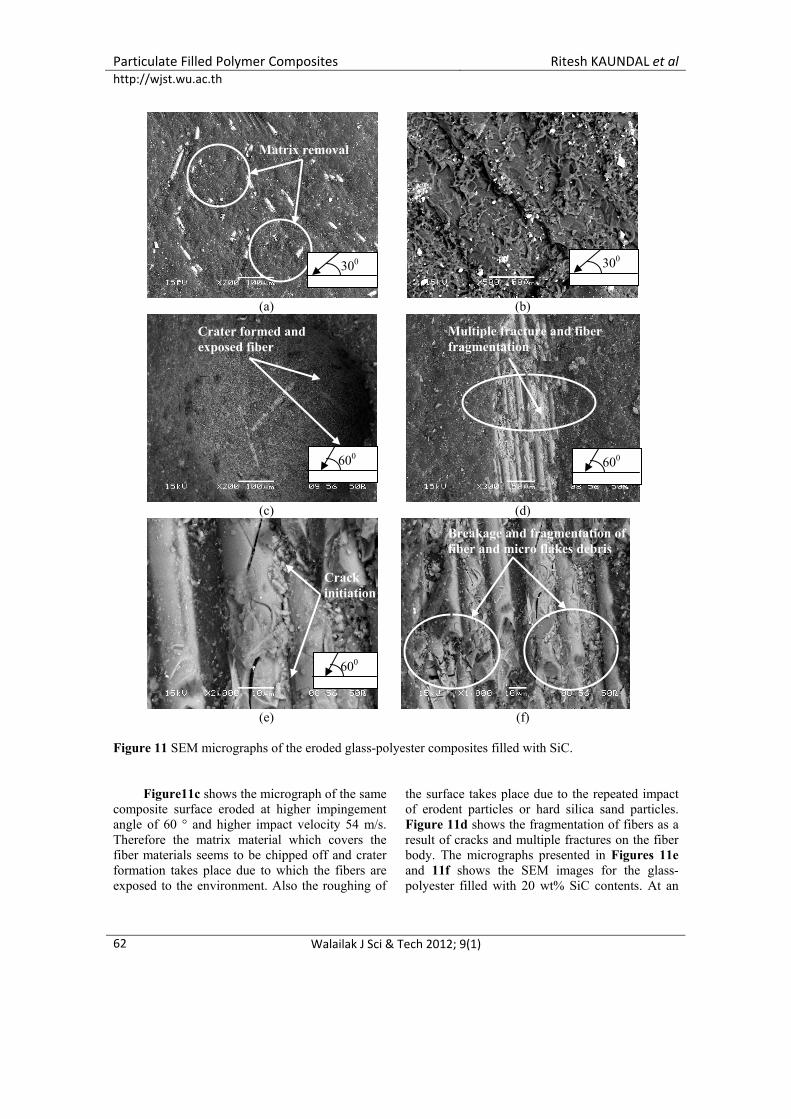
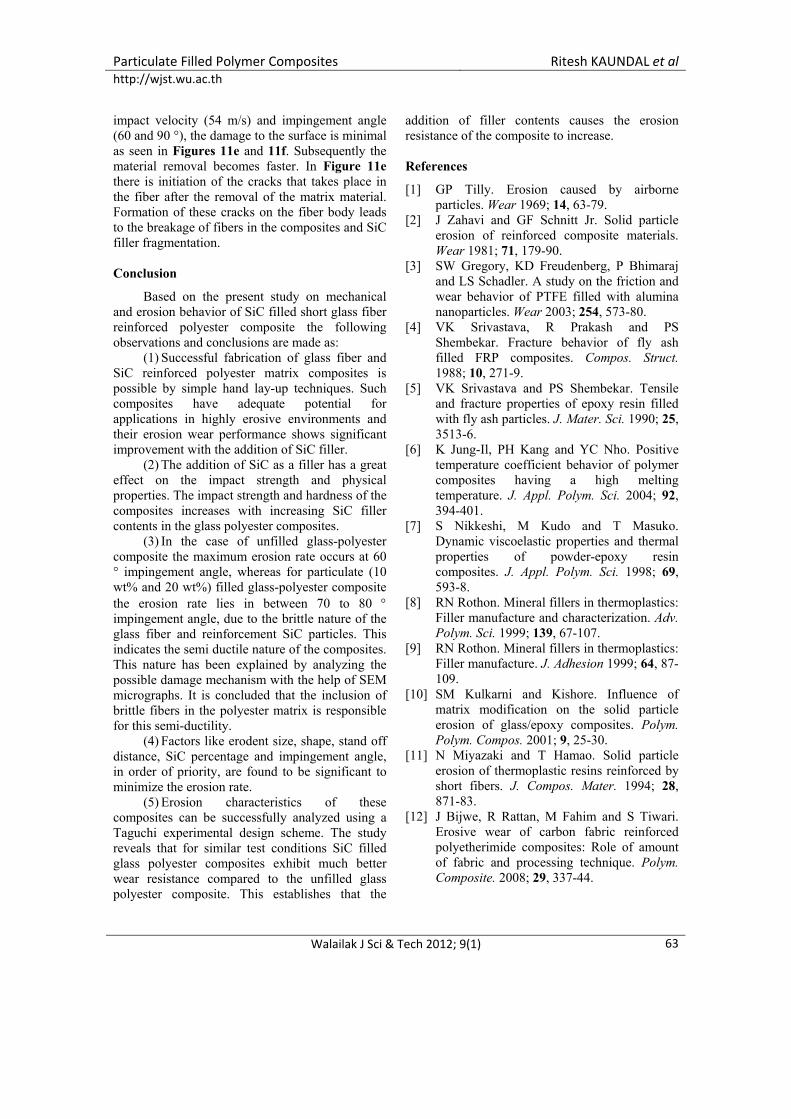
Figure11c shows the micrograph of the same
composite surface eroded at higher impingement angle of 60 ° and higher impact velocity 54 m/s. Therefore the matrix material which covers the fiber materials seems to be chipped off and crater formation takes place due to which the fibers are exposed to the environment. Also the roughing of
the surface takes place due to the repeated impact of erodent particles or hard silica sand particles. Figure 11d shows the fragmentation of fibers as a result of cracks and multiple fractures on the fiber body. The micrographs presented in Figures 11e and 11f shows the SEM images for the glass-polyester filled with 20 wt% SiC contents. At an
Crack initiation
Breakage and fragmentation of fiber and micro flakes debris
600 600
600
Walailak J Sci & Tech 2012; 9(1) 62
Particulate Filled Polymer Composites Ritesh KAUNDAL et alhttp://wjst.wu.ac.th
impact velocity (54 m/s) and impingement angle (60 and 90 °), the damage to the surface is minimal as seen in Figures 11e and 11f. Subsequently the material removal becomes faster. In Figure 11e there is initiation of the cracks that takes place in the fiber after the removal of the matrix material. Formation of these cracks on the fiber body leads to the breakage of fibers in the composites and SiC filler fragmentation. Conclusion
Based on the present study on mechanical and erosion behavior of SiC filled short glass fiber reinforced polyester composite the following observations and conclusions are made as:
(1) Successful fabrication of glass fiber and SiC reinforced polyester matrix composites is possible by simple hand lay-up techniques. Such composites have adequate potential for applications in highly erosive environments and their erosion wear performance shows significant improvement with the addition of SiC filler.
(2) The addition of SiC as a filler has a great effect on the impact strength and physical properties. The impact strength and hardness of the composites increases with increasing SiC filler contents in the glass polyester composites.
(3) In the case of unfilled glass-polyester composite the maximum erosion rate occurs at 60 ° impingement angle, whereas for particulate (10 wt% and 20 wt%) filled glass-polyester composite the erosion rate lies in between 70 to 80 ° impingement angle, due to the brittle nature of the glass fiber and reinforcement SiC particles. This indicates the semi ductile nature of the composites. This nature has been explained by analyzing the possible damage mechanism with the help of SEM micrographs. It is concluded that the inclusion of brittle fibers in the polyester matrix is responsible for this semi-ductility.
(4) Factors like erodent size, shape, stand off distance, SiC percentage and impingement angle, in order of priority, are found to be significant to minimize the erosion rate.
(5) Erosion characteristics of these composites can be successfully analyzed using a Taguchi experimental design scheme. The study reveals that for similar test conditions SiC filled glass polyester composites exhibit much better wear resistance compared to the unfilled glass polyester composite. This establishes that the
addition of filler contents causes the erosion resistance of the composite to increase. References
[1] GP Tilly. Erosion caused by airborne particles. Wear 1969; 14, 63-79.
[2] J Zahavi and GF Schnitt Jr. Solid particle erosion of reinforced composite materials. Wear 1981; 71, 179-90.
[3] SW Gregory, KD Freudenberg, P Bhimaraj and LS Schadler. A study on the friction and wear behavior of PTFE filled with alumina nanoparticles. Wear 2003; 254, 573-80.
[4] VK Srivastava, R Prakash and PS Shembekar. Fracture behavior of fly ash filled FRP composites. Compos. Struct. 1988; 10, 271-9.
[5] VK Srivastava and PS Shembekar. Tensile and fracture properties of epoxy resin filled with fly ash particles. J. Mater. Sci. 1990; 25, 3513-6.
[6] K Jung-Il, PH Kang and YC Nho. Positive temperature coefficient behavior of polymer composites having a high melting temperature. J. Appl. Polym. Sci. 2004; 92, 394-401.
[7] S Nikkeshi, M Kudo and T Masuko. Dynamic viscoelastic properties and thermal properties of powder-epoxy resin composites. J. Appl. Polym. Sci. 1998; 69, 593-8.
[8] RN Rothon. Mineral fillers in thermoplastics: Filler manufacture and characterization. Adv. Polym. Sci. 1999; 139, 67-107.
[9] RN Rothon. Mineral fillers in thermoplastics: Filler manufacture. J. Adhesion 1999; 64, 87-109.
[10] SM Kulkarni and Kishore. Influence of matrix modification on the solid particle erosion of glass/epoxy composites. Polym. Polym. Compos. 2001; 9, 25-30.
[11] N Miyazaki and T Hamao. Solid particle erosion of thermoplastic resins reinforced by short fibers. J. Compos. Mater. 1994; 28, 871-83.
[12] J Bijwe, R Rattan, M Fahim and S Tiwari. Erosive wear of carbon fabric reinforced polyetherimide composites: Role of amount of fabric and processing technique. Polym. Composite. 2008; 29, 337-44.
Walailak J Sci & Tech 2012; 9(1)
63
Particulate Filled Polymer Composites Ritesh KAUNDAL et alhttp://wjst.wu.ac.th
[13] R Rattan and J Bijwe. Carbon fabric reinforced polyetherimide composites: Influence of weave of fabric and processing parameters on performance properties and erosive wear. Mater. Sci. Eng. A-Struct. 2006; 420, 342-50.
[14] M Cirino, RB Pipes and K Friedrich. The abrasive wear behaviour of continuous fibre polymer composites. J. Mater. Sci. 1999; 22, 2481-92.
[15] QH Wang, QJ Xue, WM Liu and JM Chen. The friction and wear characteristics of nanometer SiC and PTFE filled PEEK. Wear 2000; 243, 140-6.
[16] M Cirino, K Friedrich and RB Pipes. Evaluation of polymer composites for sliding and abrasive wear application. Composites 1988; 19, 383-92.
[17] GL Harris. Properties of Silicon Carbide. IET. INSPEC. The Institution of Electrical Engineers, London, 1995, p.170-80.
[18] Properties of Silicon Carbide (SiC). Ioffe Institute, Available at: http://www.ioffe.ru/SVA/NSM/Semicond/SiC, accessed June 2009.
[19] BD Agarwal and LJ Broutman. Analysis and Performance of Fiber Composites. 2nd ed. John Wiley and Sons, Inc., New York, 1990.
[20] SP Glen. Taguchi Methods: A Hands on Approach. Addison-Wesley, New York, 1993.
[21] HA Aglan and TA Jr Chenock. Erosion damage features of polyimide thermoset composites. SAMPEQ 1993; 41-7.
[22] S Kumar, BK Satapathy and A Patnaik. Thermo-mechanical correlations to erosion performance of short carbon fiber reinforced vinyl ester resin composites. Mater. Design 2011; 32, 2260-8.
[23] RN Rothon. Particulate-filled Polymer Composites. 2 nd ed. Rapra Technology Limited, Shrewsbury, 2003.
Walailak J Sci & Tech 2012; 9(1) 64
![Grammatical notes and vocabulary of Nagnuma primier [sic]](https://static.fdokumen.com/doc/165x107/6324da70e491bcb36c0a0414/grammatical-notes-and-vocabulary-of-nagnuma-primier-sic.jpg)