
Anti‐erosive effectiveness of Eucalyptus coppices through the cover management factor estimate
15
Anti-erosive eectiveness of Eucalyptus coppices through the cover management factor estimate Sergio Cinnirella, 1 Francesco Iovino, 1 Paolo Porto 1 and Vito Ferro 2 1 Istituto di Ecologia e Idrologia Forestale, Research National Council (C.N.R.), Via A. Volta, 106/C, 87030 Castiglione Scalo (CS), Italy 2 Istituto di Genio Rurale, Facolta ` di Agraria, Universita ` di Reggio Calabria, Piazza S. Francesco, 4, 89061 Gallina di Reggio Calabria (RC), Italy Abstract: In this paper sediment yield data, measured from 1978 to 1994 in two small Calabrian basins (W2 and W3) reaorested with eucalyptus trees (Eucalyptus occidentalis Engl.), and the Modified Universal Soil Loss Equation (MUSLE) applied in a distributed form are used to evaluate the anti-erosive eects of eucalyptus cover. At first step the sediment yield measurements observed in W2 basin are used to estimate a single cover management factor representative of the eucalyptus coppice and equal to the median value (0 . 164) of the cover management factor values calculated for each runo event. Then, the reliability of the selected representative cover management factor is verified on W3 by comparing the cumulative distribution function (CDF) of the measured sediment yield with the CDF of the calculated one. Finally, the temporal analysis of the crop and management factor is developed searching, at monthly and annual scale, the correlation between crop anti- erosive eectiveness and rainfall erosivity index. # 1998 John Wiley & Sons, Ltd. KEY WORDS soil erosion; cover factor; runo; eucalyptus plantation; forest harvesting INTRODUCTION According to Lull and Reinhart (1972) an undisturbed and totally covered forest soil usually yields no surface runo and it has no sheet and rill erosion. Forest ecosystems aect both soil hydraulic properties (water retention and hydraulic conductivity) and overland flow velocity. In particular, dense forest cover normally reduces runo at the hillslope scale and consequently determines an increase of the concentration time and a smoothing of the flood hydrograph. Therefore, forest cover modifying the hydrological hillslope processes (infiltration and runo) is able to reduce erosion and to support sediment delivery processes. According to Wischmeier and Smith (1978) forest cover has to be considered ‘the most ecacious brake to erosion’. Forest also develops an antierosive action through the supply of organic matter, rainfall interception and reduction of rainfall kinetic energy. Under forest cover, topsoil accumulates a high organic matter content which enhances the stability of the soil structure and reduces soil erodibility (Dissmeyer and Foster, 1981). The crop residue and biological activity of animal organisms can increase the infiltration capacity and improve macro-porosity; in fact, in undisturbed forested soil the dead and decaying root systems can create fissures in which vertical infiltration motion takes place (Kirkby, 1980). Vegetal canopy intercepts rainfall and collects water on its foliage. At the beginning of an event the canopy catches most of the occurring rainfall and the interception goes on until the forces owing to surface tension are greater than those owing to gravity (Horton, 1919; Grah and Wilson, 1944). The percentage of inter- cepted water depends on wood composition (broad-leaf, coniferous, deciduous, evergreen), wood age, CCC 0885–6087/98/040635–15$1750 # 1998 John Wiley & Sons, Ltd. Hydrological Processes Hydrol. Process. 12, 635–649 (1998)
-
Upload
independent -
Category
Documents
-
view
0 -
download
0
Transcript of Anti‐erosive effectiveness of Eucalyptus coppices through the cover management factor estimate

Anti-erosive e�ectiveness of Eucalyptus coppicesthrough the cover management factor estimate
Sergio Cinnirella,1� Francesco Iovino,1 Paolo Porto1 and Vito Ferro21Istituto di Ecologia e Idrologia Forestale, Research National Council (C.N.R.), Via A. Volta, 106/C, 87030 Castiglione Scalo (CS), Italy
2Istituto di Genio Rurale, FacoltaÁ di Agraria, UniversitaÁ di Reggio Calabria, Piazza S. Francesco, 4,89061 Gallina di Reggio Calabria (RC), Italy
Abstract:In this paper sediment yield data, measured from 1978 to 1994 in two small Calabrian basins (W2 and W3)
rea�orested with eucalyptus trees (Eucalyptus occidentalis Engl.), and the Modi®ed Universal Soil LossEquation (MUSLE) applied in a distributed form are used to evaluate the anti-erosive e�ects of eucalyptuscover. At ®rst step the sediment yield measurements observed in W2 basin are used to estimate a single covermanagement factor representative of the eucalyptus coppice and equal to the median value (0.164) of the cover
management factor values calculated for each runo� event. Then, the reliability of the selected representativecover management factor is veri®ed on W3 by comparing the cumulative distribution function (CDF) of themeasured sediment yield with the CDF of the calculated one. Finally, the temporal analysis of the crop and
management factor is developed searching, at monthly and annual scale, the correlation between crop anti-erosive e�ectiveness and rainfall erosivity index. # 1998 John Wiley & Sons, Ltd.
KEY WORDS soil erosion; cover factor; runo�; eucalyptus plantation; forest harvesting
INTRODUCTION
According to Lull and Reinhart (1972) an undisturbed and totally covered forest soil usually yields nosurface runo� and it has no sheet and rill erosion.
Forest ecosystems a�ect both soil hydraulic properties (water retention and hydraulic conductivity) andoverland ¯ow velocity. In particular, dense forest cover normally reduces runo� at the hillslope scale andconsequently determines an increase of the concentration time and a smoothing of the ¯ood hydrograph.Therefore, forest cover modifying the hydrological hillslope processes (in®ltration and runo�) is able toreduce erosion and to support sediment delivery processes. According toWischmeier and Smith (1978) forestcover has to be considered `the most e�cacious brake to erosion'.
Forest also develops an antierosive action through the supply of organic matter, rainfall interception andreduction of rainfall kinetic energy.
Under forest cover, topsoil accumulates a high organic matter content which enhances the stability of thesoil structure and reduces soil erodibility (Dissmeyer and Foster, 1981). The crop residue and biologicalactivity of animal organisms can increase the in®ltration capacity and improve macro-porosity; in fact, inundisturbed forested soil the dead and decaying root systems can create ®ssures in which vertical in®ltrationmotion takes place (Kirkby, 1980).
Vegetal canopy intercepts rainfall and collects water on its foliage. At the beginning of an event the canopycatches most of the occurring rainfall and the interception goes on until the forces owing to surface tensionare greater than those owing to gravity (Horton, 1919; Grah and Wilson, 1944). The percentage of inter-cepted water depends on wood composition (broad-leaf, coniferous, deciduous, evergreen), wood age,
CCC 0885±6087/98/040635±15$17�50# 1998 John Wiley & Sons, Ltd.
Hydrological ProcessesHydrol. Process. 12, 635±649 (1998)
density and structure and total rainfall depth and intensity (Ausennac and Boulangeat, 1980; Ausennac et al.,1982; Nizinski and Saugier, 1989; Borghetti, 1992). Some of the intercepted rainfall never reaches theground, but it is evaporated during and after the event. Some of the intercepted rainfall reaches the ground asstem¯ow and it contributes to runo�. Drops falling from the canopy may be larger than the original rain-drops but they fall from a low height; in other words, the energy of the drops reaching the soil surface is lessthan that of rainfall in non-covered areas.The forest cover also determines the dissipation of the rainfall kinetic energy, and the brushwood and litter
play an important role in providing protection able to absorb residual kinetic energy.Some models using a process-based approach to predict erosion, like EUROSEM (Morgan, 1994) and
LISEM (De Roo et al., 1994), deal in turn with the interception during rainfall (Merriam, 1973; Aston, 1979),the volume of rainfall reaching the ground surface as direct throughfall and leaf drainage and the volume ofstem¯ow.
The USLE-derived models (Bingner, 1990) introduce the crop management factor C into the equationsused to simulate the interrill erosion (Meyer and Wischmeier, 1969; Foster et al., 1977; Wischmeier, 1975).Finally the in progress physically based technology named WEPP (Nearing et al., 1989; La¯en et al., 1991)simulates the processes of detachment, transport and deposition of soil particles on interrill areas by a singleequation in which a ground cover adjustment factor and a canopy cover adjustment factor are introduced.
The vegetation cover also a�ects both the rill pattern developing on the hillslope and the depth andvelocity of concentrated ¯ows.
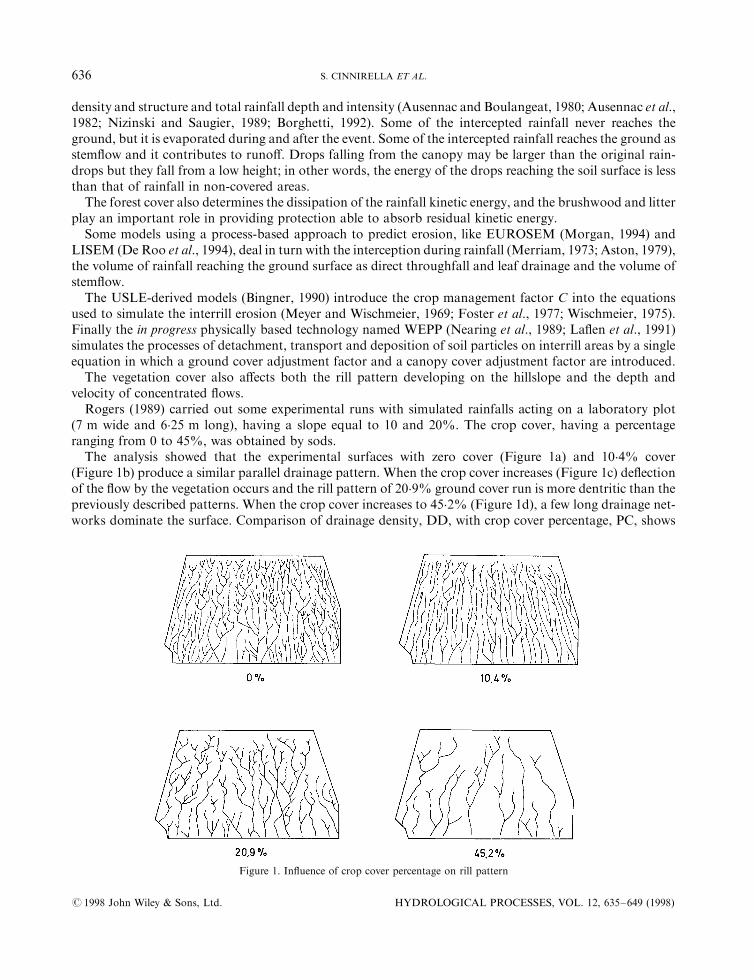
Rogers (1989) carried out some experimental runs with simulated rainfalls acting on a laboratory plot(7 m wide and 6.25 m long), having a slope equal to 10 and 20%. The crop cover, having a percentageranging from 0 to 45%, was obtained by sods.
The analysis showed that the experimental surfaces with zero cover (Figure 1a) and 10.4% cover(Figure 1b) produce a similar parallel drainage pattern. When the crop cover increases (Figure 1c) de¯ectionof the ¯ow by the vegetation occurs and the rill pattern of 20.9% ground cover run is more dentritic than thepreviously described patterns. When the crop cover increases to 45.2% (Figure 1d), a few long drainage net-works dominate the surface. Comparison of drainage density, DD, with crop cover percentage, PC, shows
Figure 1. In¯uence of crop cover percentage on rill pattern
# 1998 John Wiley & Sons, Ltd. HYDROLOGICAL PROCESSES, VOL. 12, 635±649 (1998)
636 S. CINNIRELLA ET AL.
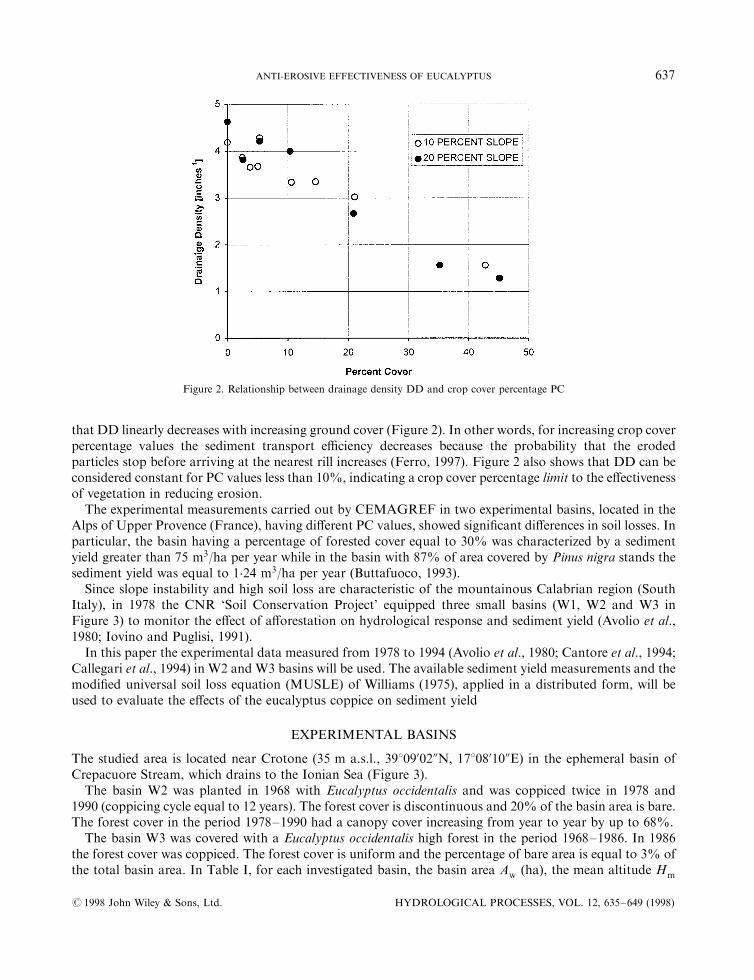
that DD linearly decreases with increasing ground cover (Figure 2). In other words, for increasing crop coverpercentage values the sediment transport e�ciency decreases because the probability that the erodedparticles stop before arriving at the nearest rill increases (Ferro, 1997). Figure 2 also shows that DD can beconsidered constant for PC values less than 10%, indicating a crop cover percentage limit to the e�ectivenessof vegetation in reducing erosion.
The experimental measurements carried out by CEMAGREF in two experimental basins, located in theAlps of Upper Provence (France), having di�erent PC values, showed signi®cant di�erences in soil losses. Inparticular, the basin having a percentage of forested cover equal to 30% was characterized by a sedimentyield greater than 75 m3/ha per year while in the basin with 87% of area covered by Pinus nigra stands thesediment yield was equal to 1.24 m3/ha per year (Buttafuoco, 1993).Since slope instability and high soil loss are characteristic of the mountainous Calabrian region (South
Italy), in 1978 the CNR `Soil Conservation Project' equipped three small basins (W1, W2 and W3 inFigure 3) to monitor the e�ect of a�orestation on hydrological response and sediment yield (Avolio et al.,1980; Iovino and Puglisi, 1991).
In this paper the experimental data measured from 1978 to 1994 (Avolio et al., 1980; Cantore et al., 1994;Callegari et al., 1994) in W2 and W3 basins will be used. The available sediment yield measurements and themodi®ed universal soil loss equation (MUSLE) of Williams (1975), applied in a distributed form, will beused to evaluate the e�ects of the eucalyptus coppice on sediment yield
EXPERIMENTAL BASINS
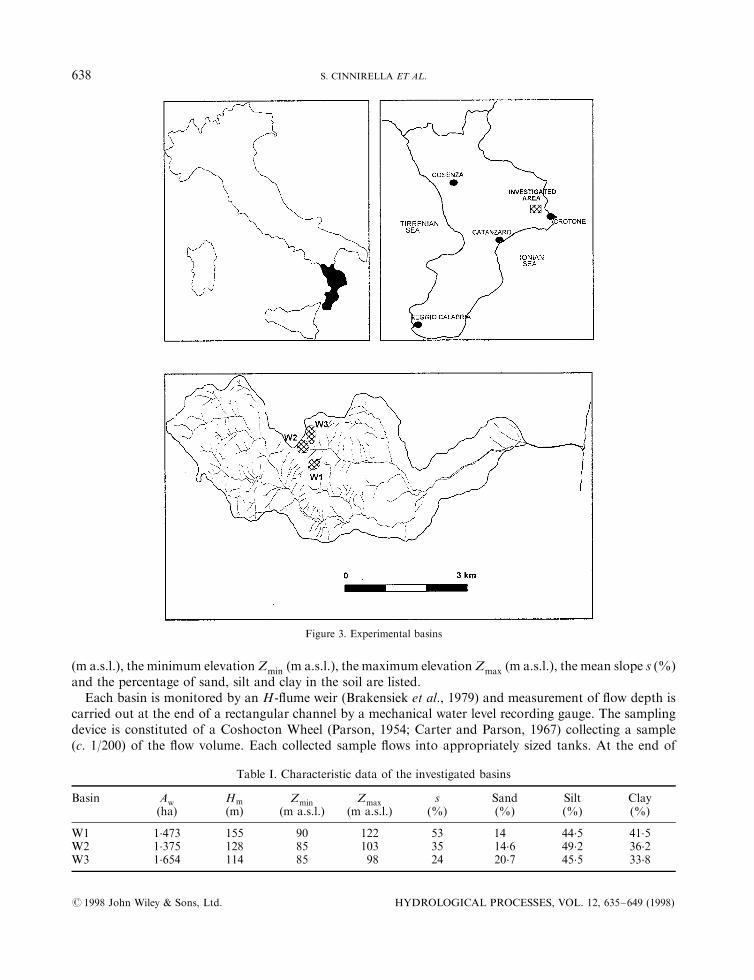
The studied area is located near Crotone (35 m a.s.l., 39809'02@N, 17808'10@E) in the ephemeral basin ofCrepacuore Stream, which drains to the Ionian Sea (Figure 3).
The basin W2 was planted in 1968 with Eucalyptus occidentalis and was coppiced twice in 1978 and1990 (coppicing cycle equal to 12 years). The forest cover is discontinuous and 20% of the basin area is bare.The forest cover in the period 1978±1990 had a canopy cover increasing from year to year by up to 68%.The basin W3 was covered with a Eucalyptus occidentalis high forest in the period 1968±1986. In 1986
the forest cover was coppiced. The forest cover is uniform and the percentage of bare area is equal to 3% ofthe total basin area. In Table I, for each investigated basin, the basin area Aw (ha), the mean altitude Hm
Figure 2. Relationship between drainage density DD and crop cover percentage PC
# 1998 John Wiley & Sons, Ltd. HYDROLOGICAL PROCESSES, VOL. 12, 635±649 (1998)
ANTI-EROSIVE EFFECTIVENESS OF EUCALYPTUS 637
(m a.s.l.), the minimum elevationZmin (m a.s.l.), the maximum elevationZmax (m a.s.l.), the mean slope s (%)and the percentage of sand, silt and clay in the soil are listed.
Each basin is monitored by an H-¯ume weir (Brakensiek et al., 1979) and measurement of ¯ow depth iscarried out at the end of a rectangular channel by a mechanical water level recording gauge. The samplingdevice is constituted of a Coshocton Wheel (Parson, 1954; Carter and Parson, 1967) collecting a sample�c: 1/200) of the ¯ow volume. Each collected sample ¯ows into appropriately sized tanks. At the end of
Figure 3. Experimental basins
Table I. Characteristic data of the investigated basins
Basin Aw Hm Zmin Zmax s Sand Silt Clay(ha) (m) (m a.s.l.) (m a.s.l.) (%) (%) (%) (%)
W1 1.473 155 90 122 53 14 44.5 41.5W2 1.375 128 85 103 35 14.6 49.2 36.2W3 1.654 114 85 98 24 20.7 45.5 33.8
# 1998 John Wiley & Sons, Ltd. HYDROLOGICAL PROCESSES, VOL. 12, 635±649 (1998)
638 S. CINNIRELLA ET AL.
each event the collected suspension is well mixed and suspension samples at di�erent heights, of givenvolume (one litre), are drawn out. The suspended solid content in g of each sample is determined by oven-drying at 105 8C. The ratio between the mean value of the suspended solid content (g) and the samplevolume (one litre) is assumed as the mean suspension concentration Cm (g/l). The sediment yield of eachevent is calculated by the product of the mean concentration Cm and the measured runo� volume.
METHODS
The analysis will be developed for 27 selected events measured at basin W2 and 33 events measured atbasin W3.
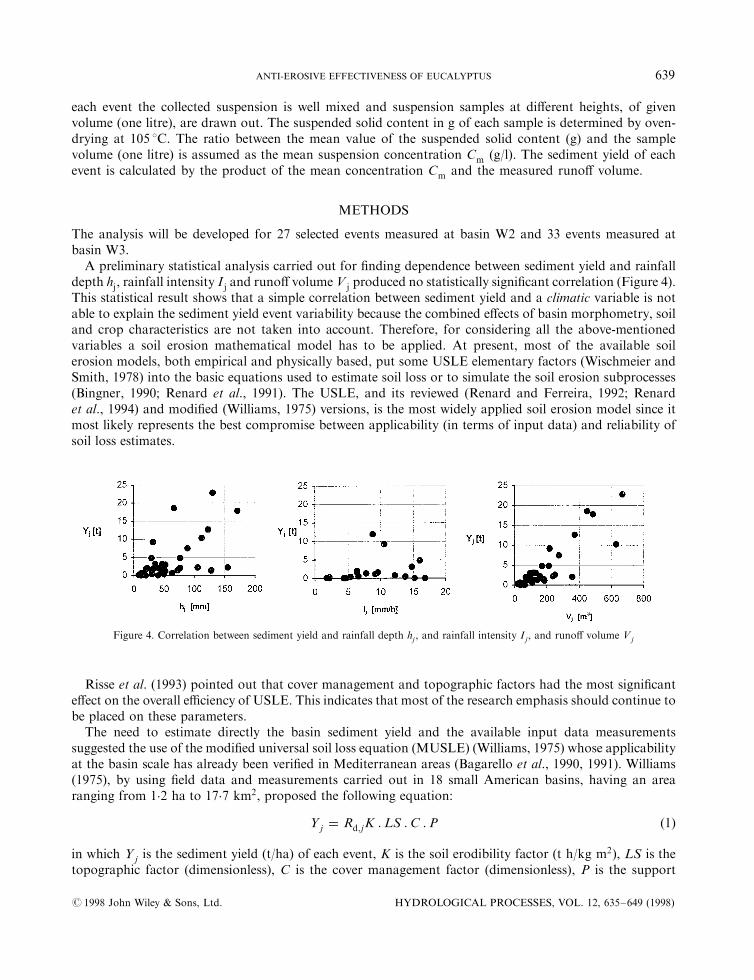
A preliminary statistical analysis carried out for ®nding dependence between sediment yield and rainfalldepth hj, rainfall intensity I j and runo� volume V j produced no statistically signi®cant correlation (Figure 4).This statistical result shows that a simple correlation between sediment yield and a climatic variable is notable to explain the sediment yield event variability because the combined e�ects of basin morphometry, soiland crop characteristics are not taken into account. Therefore, for considering all the above-mentionedvariables a soil erosion mathematical model has to be applied. At present, most of the available soilerosion models, both empirical and physically based, put some USLE elementary factors (Wischmeier andSmith, 1978) into the basic equations used to estimate soil loss or to simulate the soil erosion subprocesses(Bingner, 1990; Renard et al., 1991). The USLE, and its reviewed (Renard and Ferreira, 1992; Renardet al., 1994) and modi®ed (Williams, 1975) versions, is the most widely applied soil erosion model since itmost likely represents the best compromise between applicability (in terms of input data) and reliability ofsoil loss estimates.
Figure 4. Correlation between sediment yield and rainfall depth hj , and rainfall intensity I j, and runo� volume Vj
Risse et al. (1993) pointed out that cover management and topographic factors had the most signi®cante�ect on the overall e�ciency of USLE. This indicates that most of the research emphasis should continue tobe placed on these parameters.
The need to estimate directly the basin sediment yield and the available input data measurementssuggested the use of the modi®ed universal soil loss equation (MUSLE) (Williams, 1975) whose applicabilityat the basin scale has already been veri®ed in Mediterranean areas (Bagarello et al., 1990, 1991). Williams(1975), by using ®eld data and measurements carried out in 18 small American basins, having an arearanging from 1.2 ha to 17.7 km2, proposed the following equation:
Yj � Rd;jK : LS :C :P �1�
in which Yj is the sediment yield (t/ha) of each event, K is the soil erodibility factor (t h/kg m2), LS is thetopographic factor (dimensionless), C is the cover management factor (dimensionless), P is the support
# 1998 John Wiley & Sons, Ltd. HYDROLOGICAL PROCESSES, VOL. 12, 635±649 (1998)
ANTI-EROSIVE EFFECTIVENESS OF EUCALYPTUS 639
practice factor (dimensionless) and Rd;j (t/ha unit ofK� is the runo� factor of each event having the followingexpression:
Rd;j �0�8776Aw
�qp;iVi�0�56 �2�
where qp;j is the peak ¯ow rate of the ¯ood event (m3/s), Vj is the runo� volume (m3) and Aw is the basin area(ha). According to Williams (1975) the values of the K , LS, C and P factors have to be representative of thebasin.
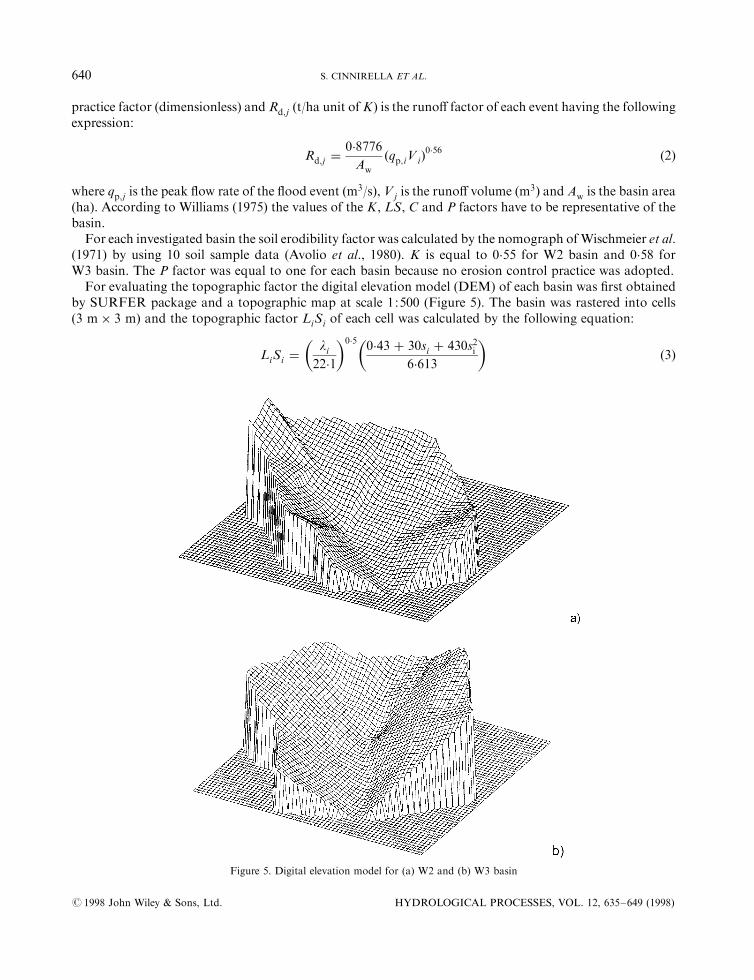
For each investigated basin the soil erodibility factor was calculated by the nomograph ofWischmeier et al.(1971) by using 10 soil sample data (Avolio et al., 1980). K is equal to 0.55 for W2 basin and 0.58 forW3 basin. The P factor was equal to one for each basin because no erosion control practice was adopted.For evaluating the topographic factor the digital elevation model (DEM) of each basin was ®rst obtained
by SURFER package and a topographic map at scale 1:500 (Figure 5). The basin was rastered into cells�3 m� 3 m� and the topographic factor LiSi of each cell was calculated by the following equation:
LiSi �li
22�1� �0�5 0�43 � 30si � 430s2i
6�613� �
�3�
Figure 5. Digital elevation model for (a) W2 and (b) W3 basin
# 1998 John Wiley & Sons, Ltd. HYDROLOGICAL PROCESSES, VOL. 12, 635±649 (1998)
640 S. CINNIRELLA ET AL.
in which li and si are the slope length (m) and the slope steepness (m/m) of the morphological unit, respect-ively.
The analysis was developed into two subsequent phases: model calibration and validation. In thecalibration phase MUSLE and sediment yield measurements was used for calculating the crop managementfactor of each event. Then a single cover management factor value is assumed as representative of the forestcover (eucalyptus coppice). The discontinuity of the forest cover standing on W2 basin suggested develop-ment of the model calibration for the W2 basin and veri®cation of the selected representative value of theC factor for the eucalyptus coppice using the sediment yield measurements carried out at the W3 outlet.
MODEL CALIBRATION
The W2 basin area constitutes vegetated surfaces, having a total area, Av, equal to 11 053 m2, with baresurfaces covering a total area, Ab, equal to 2693 m2. At ®rst the basin is divided into nv morphological unitsfalling into the vegetated area, and into nb morphological units falling into the bare area. The sedimentbalance equation establishes that the sediment production for the basin outlet Ps �t� is equal to the sedimentproduced by all morphological units into which the basin is divided (Ferro and Minacapilli, 1995). Inparticular, for the W2 basin it results in
Ps � Ps;v � Ps;b �4�
in which Ps;v is the sediment yield (t) produced from the nv morphological units, and Ps;b is the sedimentyield (t) of the bare area.
For each event and taking into account Equation (1), the sediment balance Equation (4) can be rewrittenas follows:
Ps;j � Rd;jK Cb
Xnbi�1
LiSiAu;i � Cv;j
Xnvi�1
LiSiAu;i
!�5�
in which Ps;j is the basin sediment yield of each event j measured in t, Au;i is the area (ha) of the i morpho-logical unit, Cb is the cover and management factor of the bare area and Cv;j is the C factor value of theeucalyptus coppice, which is event dependent.
By overlaying the DEM of W2 basin and the land use map, the square cells falling into the bare andvegetated area are determined and the following representative topographic factors are evaluated:
LSb �Xnbi�1
LiSi
Au;i
Ab
�6�
LSv �Xnvi�1
LiSi
Au;i
Av
�7�
in which LSb is the topographic factor of the bare area, equal to 8.42, and LSv is the topographic factor ofthe vegetated surface which is equal to 6.60. Introducing Equations (6) and (7) into Equation (5), we obtain
Ps;j � Rd;jK�CbLSbAb � Cv;jLSvAv� �8�
From Equation (8), assuming Cb � 0�45 which is the value corresponding to the C factor for undisturbedland with no cover (Wischmeier and Smith, 1978), we obtain
Ps;j
Rd;jK� 0�45LSbAb � Cv;jLSvAv �9�
# 1998 John Wiley & Sons, Ltd. HYDROLOGICAL PROCESSES, VOL. 12, 635±649 (1998)
ANTI-EROSIVE EFFECTIVENESS OF EUCALYPTUS 641
and ®nally
Cv;j �Ps;j
Rd;jKLSvAv
ÿ 0�45LSbAb
LSvAv
�10�
For basin W2 Equation (10) gives
Cv;j �Ps;j
4�0122Rd;j
ÿ 0�1399 �11�
For basin W2, for each event Table II lists peak ¯ow rate qpj (m3/s), runo� volume Vj (m
3), the measuredsediment yield Ps;j (t) and the crop and management factor values Cv; j calculated by Equation (11). Table IIalso lists the rainfall erosivity factor Rj (Wischmeier and Smith, 1978) of each rainfall event.
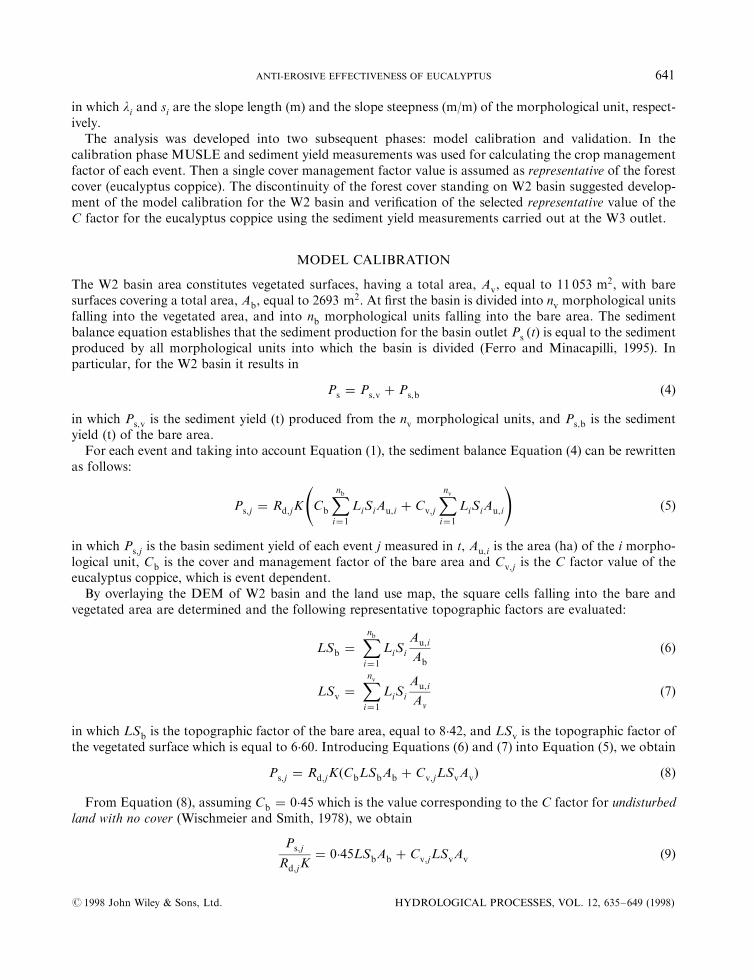
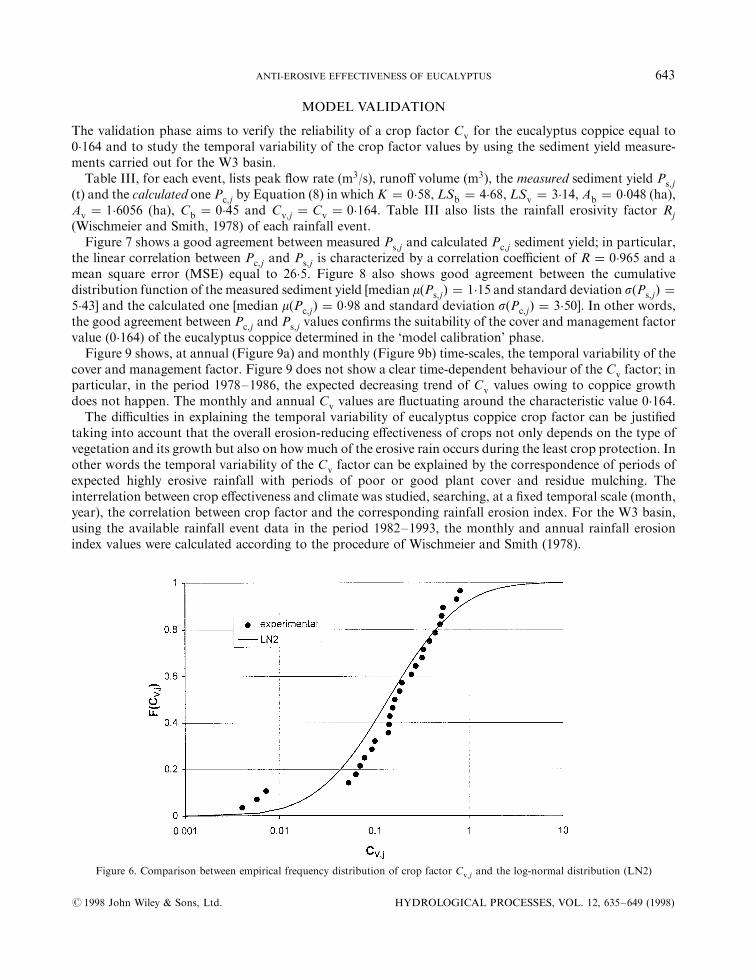
Figure 6 shows the comparison of the empirical cumulative frequency distribution of the crop factorCv;j with a log-normal distribution (LN2) having a mean value and standard deviation equal to the samplevalues. According to this result the eucalyptus coppice of the W2 basin was characterized by a singlerepresentative crop factor Cv equal to the median sample value 0.164. According to Wischmeier (1975)C � 0�164 belongs to `trees with no brush, having a canopy cover ranging from 50 to 75%, and with a groundcover from 20 to 40%'.
Table II. Characteristic data of events measured at W2 basin
Event qp;j Vj Ps;j Cv;j Rj
(m3/s) (m3) (t) (t/ha unit of K)
23/10/78 0.1666 449.5 18.56 0.33005/12/78 0.0241 97.9 1.24 0.07808/02/79 0.0191 71.5 1.74 0.2742±3/3/79 0.0268 63.2 0.70 0.00706/10/79 0.0215 17.0 0.47 0.09326/10/79 0.0169 132.4 5.22 0.80503/11/79 0.0241 120.8 0.92 0.00410±11/01/80 0.0169 239.2 2.17 0.14215/03/80 0.0549 252.5 4.37 0.1456±7/03/82 0.0095 35.7 0.39 0.06322/03/82 0.0080 117.5 1.32 0.24723/10/82 0.0549 94.8 2.98 0.19628/10/82 0.0129 169.1 4.78 0.738 24.9918/12/82 0.0054 19.8 0.33 0.18627/12/82 0.0129 17.7 0.32 0.070 1.7718±20/10/83 0.0841 371.1 12.62 0.382 52.7609/03/84 0.0111 143.0 1.39 0.16413/11/84 0.0956 669.4 22.83 0.492 25.5217/01/85 0.0430 629.6 10.26 0.320 14.2208/03/86 0.0297 274.9 7.45 0.513 23.0610/03/86 0.0638 89.3 1.80 0.053 3.3923/02/87 0.0067 24.7 0.36 0.140 2.4313/04/87 0.0686 68.7 2.01 0.100 13.5129/11±2/12/90 0.0072 92.1 1.62 0.439 9.1014±17/01/1991 0.0549 329.9 11.94 0.530 14.1927±28/01/1991 0.0111 143.0 1.35 0.155 4.0816±19/03/1991 0.0129 324.4 1.14 0.006 5.05
# 1998 John Wiley & Sons, Ltd. HYDROLOGICAL PROCESSES, VOL. 12, 635±649 (1998)
642 S. CINNIRELLA ET AL.
MODEL VALIDATION
The validation phase aims to verify the reliability of a crop factor Cv for the eucalyptus coppice equal to0.164 and to study the temporal variability of the crop factor values by using the sediment yield measure-ments carried out for the W3 basin.
Table III, for each event, lists peak ¯ow rate (m3/s), runo� volume (m3), the measured sediment yield Ps;j
(t) and the calculated one Pc;j by Equation (8) in which K � 0�58, LSb � 4�68, LSv � 3�14, Ab � 0�048 (ha),Av � 1�6056 (ha), Cb � 0�45 and Cv;j � Cv � 0�164. Table III also lists the rainfall erosivity factor Rj
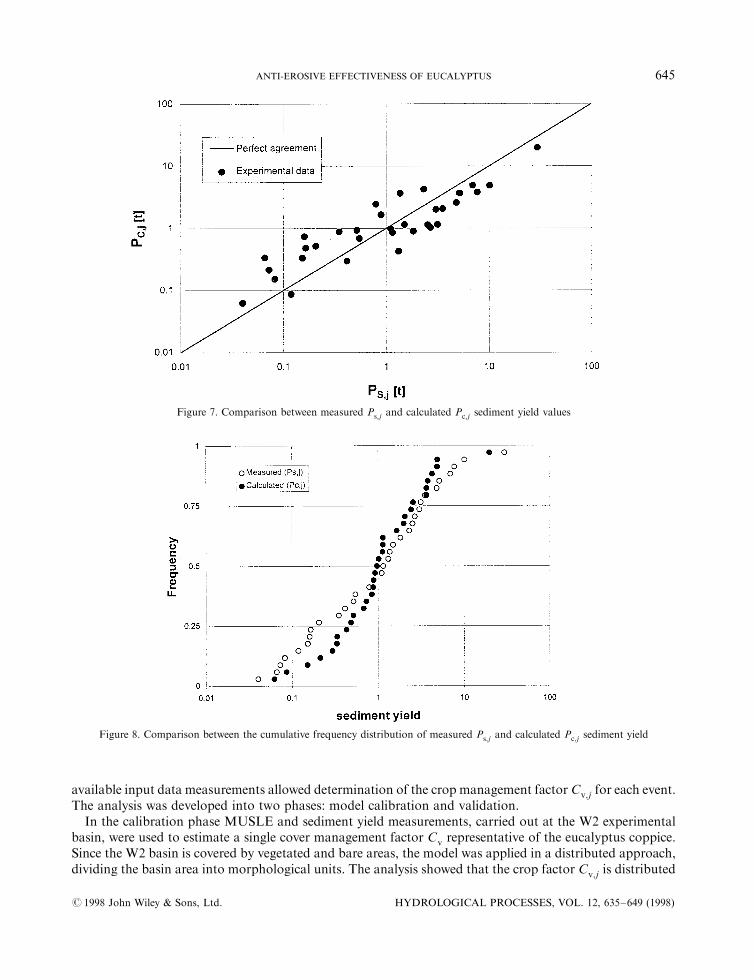
(Wischmeier and Smith, 1978) of each rainfall event.Figure 7 shows a good agreement between measured Ps;j and calculated Pc;j sediment yield; in particular,
the linear correlation between Pc;j and Ps;j is characterized by a correlation coe�cient of R � 0�965 and amean square error (MSE) equal to 26.5. Figure 8 also shows good agreement between the cumulativedistribution function of the measured sediment yield [median m�Ps;j� � 1�15 and standard deviation s�Ps;j� �5�43� and the calculated one [median m�Pc;j� � 0�98 and standard deviation s�Pc;j� � 3�50�. In other words,the good agreement between Pc;j and Ps;j values con®rms the suitability of the cover and management factorvalue (0.164) of the eucalyptus coppice determined in the `model calibration' phase.
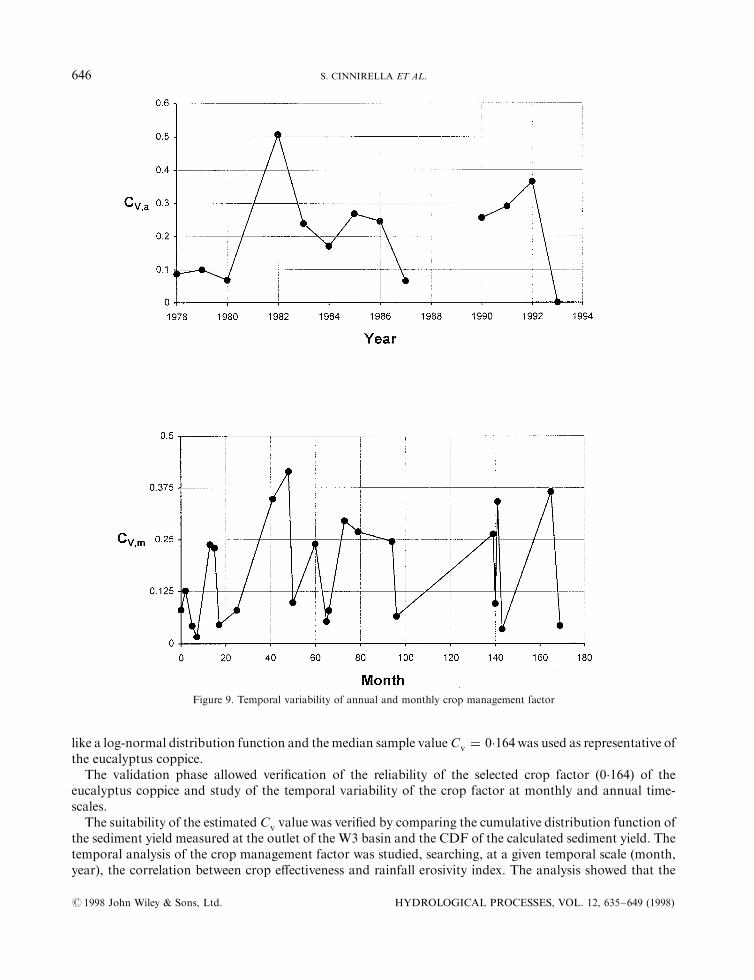
Figure 9 shows, at annual (Figure 9a) and monthly (Figure 9b) time-scales, the temporal variability of thecover and management factor. Figure 9 does not show a clear time-dependent behaviour of the Cv factor; inparticular, in the period 1978±1986, the expected decreasing trend of Cv values owing to coppice growthdoes not happen. The monthly and annual Cv values are ¯uctuating around the characteristic value 0.164.
The di�culties in explaining the temporal variability of eucalyptus coppice crop factor can be justi®edtaking into account that the overall erosion-reducing e�ectiveness of crops not only depends on the type ofvegetation and its growth but also on howmuch of the erosive rain occurs during the least crop protection. Inother words the temporal variability of the Cv factor can be explained by the correspondence of periods ofexpected highly erosive rainfall with periods of poor or good plant cover and residue mulching. Theinterrelation between crop e�ectiveness and climate was studied, searching, at a ®xed temporal scale (month,year), the correlation between crop factor and the corresponding rainfall erosion index. For the W3 basin,using the available rainfall event data in the period 1982±1993, the monthly and annual rainfall erosionindex values were calculated according to the procedure of Wischmeier and Smith (1978).
Figure 6. Comparison between empirical frequency distribution of crop factor Cv;j and the log-normal distribution (LN2)
# 1998 John Wiley & Sons, Ltd. HYDROLOGICAL PROCESSES, VOL. 12, 635±649 (1998)
ANTI-EROSIVE EFFECTIVENESS OF EUCALYPTUS 643
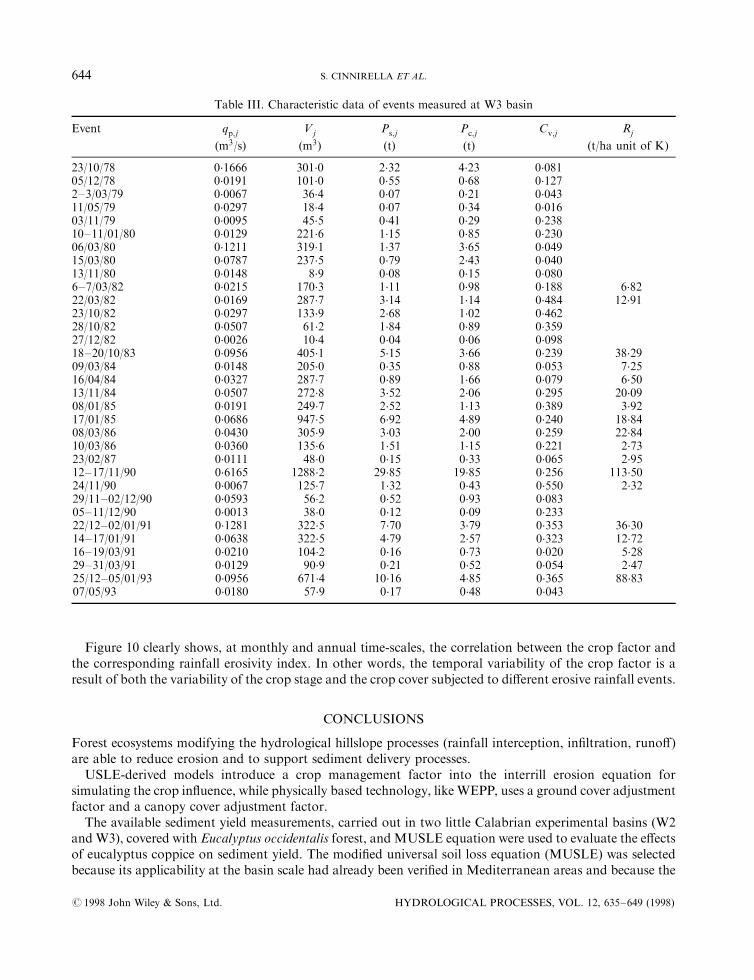
Figure 10 clearly shows, at monthly and annual time-scales, the correlation between the crop factor andthe corresponding rainfall erosivity index. In other words, the temporal variability of the crop factor is aresult of both the variability of the crop stage and the crop cover subjected to di�erent erosive rainfall events.
CONCLUSIONS
Forest ecosystems modifying the hydrological hillslope processes (rainfall interception, in®ltration, runo�)are able to reduce erosion and to support sediment delivery processes.USLE-derived models introduce a crop management factor into the interrill erosion equation for
simulating the crop in¯uence, while physically based technology, like WEPP, uses a ground cover adjustmentfactor and a canopy cover adjustment factor.
The available sediment yield measurements, carried out in two little Calabrian experimental basins (W2andW3), covered with Eucalyptus occidentalis forest, andMUSLE equation were used to evaluate the e�ectsof eucalyptus coppice on sediment yield. The modi®ed universal soil loss equation (MUSLE) was selectedbecause its applicability at the basin scale had already been veri®ed in Mediterranean areas and because the
Table III. Characteristic data of events measured at W3 basin
Event qp;j Vj Ps;j Pc;j Cv;j Rj
(m3/s) (m3) (t) (t) (t/ha unit of K)
23/10/78 0.1666 301.0 2.32 4.23 0.08105/12/78 0.0191 101.0 0.55 0.68 0.1272±3/03/79 0.0067 36.4 0.07 0.21 0.04311/05/79 0.0297 18.4 0.07 0.34 0.01603/11/79 0.0095 45.5 0.41 0.29 0.23810±11/01/80 0.0129 221.6 1.15 0.85 0.23006/03/80 0.1211 319.1 1.37 3.65 0.04915/03/80 0.0787 237.5 0.79 2.43 0.04013/11/80 0.0148 8.9 0.08 0.15 0.0806±7/03/82 0.0215 170.3 1.11 0.98 0.188 6.8222/03/82 0.0169 287.7 3.14 1.14 0.484 12.9123/10/82 0.0297 133.9 2.68 1.02 0.46228/10/82 0.0507 61.2 1.84 0.89 0.35927/12/82 0.0026 10.4 0.04 0.06 0.09818±20/10/83 0.0956 405.1 5.15 3.66 0.239 38.2909/03/84 0.0148 205.0 0.35 0.88 0.053 7.2516/04/84 0.0327 287.7 0.89 1.66 0.079 6.5013/11/84 0.0507 272.8 3.52 2.06 0.295 20.0908/01/85 0.0191 249.7 2.52 1.13 0.389 3.9217/01/85 0.0686 947.5 6.92 4.89 0.240 18.8408/03/86 0.0430 305.9 3.03 2.00 0.259 22.8410/03/86 0.0360 135.6 1.51 1.15 0.221 2.7323/02/87 0.0111 48.0 0.15 0.33 0.065 2.9512±17/11/90 0.6165 1288.2 29.85 19.85 0.256 113.5024/11/90 0.0067 125.7 1.32 0.43 0.550 2.3229/11±02/12/90 0.0593 56.2 0.52 0.93 0.08305±11/12/90 0.0013 38.0 0.12 0.09 0.23322/12±02/01/91 0.1281 322.5 7.70 3.79 0.353 36.3014±17/01/91 0.0638 322.5 4.79 2.57 0.323 12.7216±19/03/91 0.0210 104.2 0.16 0.73 0.020 5.2829±31/03/91 0.0129 90.9 0.21 0.52 0.054 2.4725/12±05/01/93 0.0956 671.4 10.16 4.85 0.365 88.8307/05/93 0.0180 57.9 0.17 0.48 0.043
# 1998 John Wiley & Sons, Ltd. HYDROLOGICAL PROCESSES, VOL. 12, 635±649 (1998)
644 S. CINNIRELLA ET AL.
available input data measurements allowed determination of the crop management factor Cv;j for each event.The analysis was developed into two phases: model calibration and validation.
In the calibration phase MUSLE and sediment yield measurements, carried out at the W2 experimentalbasin, were used to estimate a single cover management factor Cv representative of the eucalyptus coppice.Since the W2 basin is covered by vegetated and bare areas, the model was applied in a distributed approach,dividing the basin area into morphological units. The analysis showed that the crop factor Cv;j is distributed
Figure 7. Comparison between measured Ps;j and calculated Pc;j sediment yield values
Figure 8. Comparison between the cumulative frequency distribution of measured Ps;j and calculated Pc;j sediment yield
# 1998 John Wiley & Sons, Ltd. HYDROLOGICAL PROCESSES, VOL. 12, 635±649 (1998)
ANTI-EROSIVE EFFECTIVENESS OF EUCALYPTUS 645
like a log-normal distribution function and the median sample valueCv � 0�164was used as representative ofthe eucalyptus coppice.
The validation phase allowed veri®cation of the reliability of the selected crop factor (0.164) of theeucalyptus coppice and study of the temporal variability of the crop factor at monthly and annual time-scales.
The suitability of the estimated Cv value was veri®ed by comparing the cumulative distribution function ofthe sediment yield measured at the outlet of the W3 basin and the CDF of the calculated sediment yield. Thetemporal analysis of the crop management factor was studied, searching, at a given temporal scale (month,year), the correlation between crop e�ectiveness and rainfall erosivity index. The analysis showed that the
Figure 9. Temporal variability of annual and monthly crop management factor
# 1998 John Wiley & Sons, Ltd. HYDROLOGICAL PROCESSES, VOL. 12, 635±649 (1998)
646 S. CINNIRELLA ET AL.
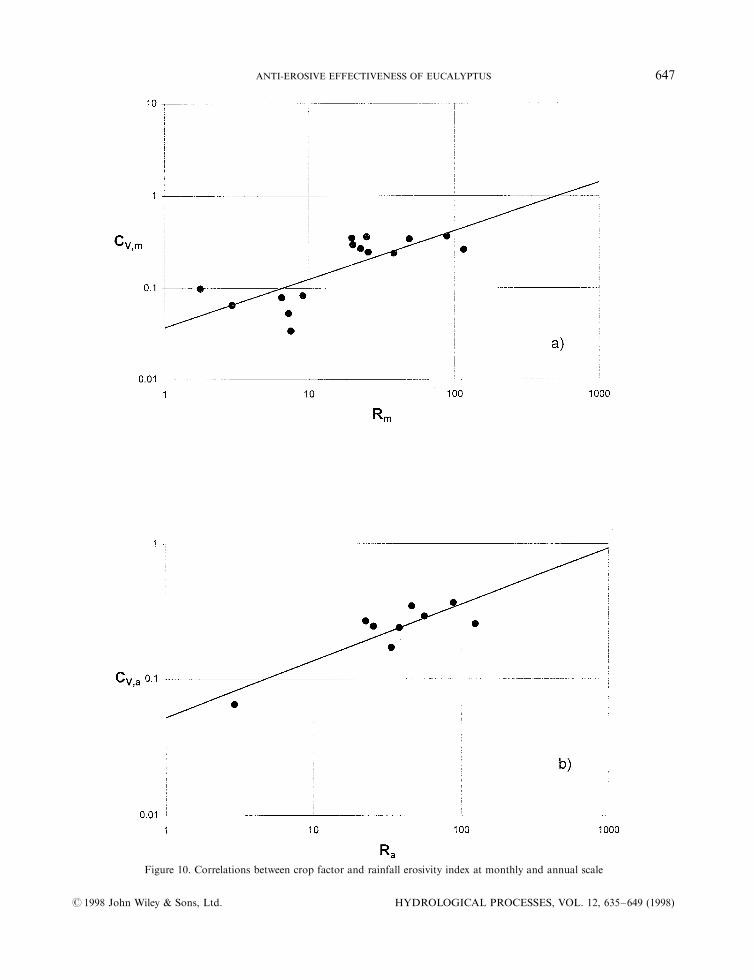
Figure 10. Correlations between crop factor and rainfall erosivity index at monthly and annual scale
# 1998 John Wiley & Sons, Ltd. HYDROLOGICAL PROCESSES, VOL. 12, 635±649 (1998)
ANTI-EROSIVE EFFECTIVENESS OF EUCALYPTUS 647
temporal variability of the crop factor is a result of both the variability of the crop stage and the crop coversubjected to di�erent erosive rainfall events.
In conclusion, the crop factor determined for eucalyptus coppice �Cv � 0�164� belongs to the Wischmeierclass `trees with no brush, having a canopy cover ranging from 50 to 75% and with a ground cover from 20 to40%'. Therefore, according to Iovino and Puglisi (1991), the eucalyptus coppice has a good anti-erosivee�ectiveness, which can be improved if crop cover is uniformly distributed over the area for protection andthe clear-cutting residues are left on the ground for mulching.
ACKNOWLEDGEMENTS
This study was supported by the I.E.I.F.±C.N.R. (Italy) and was carried out in cooperation by the Authors.
REFERENCES
Aston, A. R. 1979. `Rainfall interception by eight small trees', J. Hydrol., 42, 383±396.Aussenac, G. and Boulangeat, C. 1980. `Interception des pre cipitations et e vapotranspiration re elle dans des peuplements de feuillus
(Fagus sylvatica L.) et de re sineux (Pseudotsuga menziesii (Mirb.) Francs)', Ann. Sci. Forest., 37, 91±107.Aussenac, G., Granier, A., and Naud, R. 1982. `In¯uence d'une e clarcie sur la aroissance et le bilan hydrique d'un jeune peuplement de
Douglas (Pseudotsuga menziesii (Mirb.) Franco.)', Can. J. For. Res., 12, 222±231.Avolio, S., Ciancio, O., Grinovero, C., Iovino, F., Mirabella, A., Raglione, M., Sfalanaga, M., and Torri, D. 1980. `E�etti del tipo di
bosco sull'entitaÁ dell'erosione in unitaÁ idrologiche della Calabria Ð modelli erosivi', Ann. Ist. Speriment. Selvicolt., 11, 45±131.Bagarello, V., Ferro, V., and Giordano, G. 1990. `Evaluating Williams' runo� factor for some Sicilian watersheds', Hydrology in
Mountainous Regions. II Arti®cial Reservoirs, Water and Slopes. Proc. two Lausanne Symposia, IAHS Publ., 194, 31±38.Bagarello, V., Ferro, V., and Giordano, G. 1991. `Contributo alla valutazione del fattore di de¯usso di Williams e del coe�ciente di resa
solida per alcuni bacini idrogra®ci siciliani', Rivista di Ingegneria Agraria, 4, 238±251.Bingner, R. L. 1990. `Comparison of the components used in several sediment yield models', Trans. ASAE, 33, 1229±1238.Borghetti, M. 1992. `Relazioni idriche: dall'albero alla foresta'. Pubblicazioni dell'Accademia Italiana di Scienze Forestali, Firenze.Brakensiek, D. L., Osborn, H. B., and Sheridan, J. M. 1979. `Field manual for research in agricultural hydrology', Agriculture
Handbook n. 224. US Department of Agriculture Science and Education Administration. Washington.Buttafuoco, G. 1993. Bilan de la production d'eÂrosion des marnes noires dans le bassin versant du Brusquet. Rapport de stage.
CEMAGREF-Division protection contre les erosions, Grenoble.Callegari, G., Cinnirella, S., and Iovino, F. 1994. `Erosione e trasporto solido in piccoli bacini interessati da piantagioni di eucalitto',
Quaderni di Idronomia Montana, 13, 139±150.Cantore, V., Iovino, F., and Puglisi, S. 1994. `In¯uenza della forma di governo sui de¯ussi liquidi e solidi in piantagioni di eucalitti',
L'Italia Forestale e Montana, 5, 463±477.Carter, C. E. and Parson, D. A. 1967. `Field tests on the Coshocton-Type wheel runo� sampler', Trans. ASAE, 10, 133±135.De Roo, A. P. J., Wesseling, C. G., Cremers, H. D. T., and O�ermans, R. S. E. 1994. `LISEM: a new physically based hydrological
and soil erosion model in a GIS-environment, theory and implementation', Variability in Stream Erosion and Sediment Transport,Proc. Canberra Symp., IAHS Publ., 224, 439±448.
Dissmeyer, G. E. and Foster, G. R. 1981. `Estimating the cover-management factor (C) in the Universal Soil Loss Equation for forestconditions', J. Soil Wat. Conserv., 36, 235±240.
Ferro, V. 1997. `Further remarks on the sediment delivery distributed approach', J. Hydrol. Sci., 42, 5.Ferro, V. and Minacapilli, M. 1995. `Sediment delivery processes at basin scale', J. Hydrol. Sci., 40, 703±717.Foster, G. R., Meyer, L. D., and Onstad, C. A. 1977. `An erosion equation derived from basic erosion principles', Trans. ASAE, 20,
678±682.Grah, R. F. and Wilson, C. C. 1944. `Some components of rainfall interception', J. Forest., 42, 890±898.Horton, R. E. 1919. `Rainfall interception', Mon. Weath. Rev., 47, 603±623.Iovino, F. and Puglisi, S. 1991. `L'ame nagement des reboisements de protection. Un cas d'e tude', 10th World Forestry Congress, Paris.Kirkby, M. J. 1980. Hillslope Hydrology. John Wiley & Sons, New York. p. 389.La¯en, J. M., Elliott, W. J., Simanton, J. R., Holzhey, C. S., and Kohl, K. D. 1991. `WEPP soil erodibility experiments for rangeland
and cropland soils', J. Soil Wat. Conserv., 46, 39±44.Lull, H. W. and Reinhart, G. 1972. `Forests and ¯oods in the eastern United States', Res. Paper NE-226. NE Forest Exp. Sta., Forest
Serv., U.S. Dept. Agr., Upper Darby. 94 pp.Merriam, R. A. 1973. `Fog drip from arti®cial leaves in a fog wind tunnel', Wat. Resour. Res., 9, 1591±1598.Meyer, L. D. and Wischmeier, W. H. 1969. `Mathematical simulation of the process of soil erosion by water', Trans. ASAE, 12,
754±758, 762.Morgan, R. P. C. 1994. `The European soil erosion model: an update on its structure and research base', in Rickson, R. J. (Ed.),
Conserving Soil Resources±European Perspectives. CAB International Wallingford, Oxfordshire. pp. 286±299.Nearing, M. A., Foster, G. R., Lane, L. J., and Finkner, S. C. 1989. `A process-based soil erosion model for USDA-Water Erosion
Prediction Project Technology', Trans. ASAE, 32, 1587±1593.
# 1998 John Wiley & Sons, Ltd. HYDROLOGICAL PROCESSES, VOL. 12, 635±649 (1998)
648 S. CINNIRELLA ET AL.
Nizinski, J. and Saugier, B. 1989. `Dynamique de l'eau dans une cheà naie (Quercus petraea) en foreà t de Fontainebleau', Ann. Sci.Forest., 46, 173±186.
Parson, D. A. 1954. Coshocton-type Runo� Samplers, Laboratory Investigations. US Department of Agriculture, Soil ConservationService, Washington, D.C.
Renard, K. G. and Ferreira, V. A. 1992. `RUSLE model description and database sensitivity', J. Environ. Qual., 22, 458±466.Renard, K. G., Foster, G. R., Weesies, G. A., and Porter, J. P. 1991. `RUSLE Ð revised universal soil loss equation', J. Soil Wat.
Conserv., 46, 30±33.Renard, K. G., Foster, G. R., Yoder, D. C., and McCool, D. K. 1994. `RUSLE revisited: status, questions, answers, and the future',
J. Soil Wat. Conserv., 49, 213±220.Risse, L. M., Nearing, M. A., Nicks, A. D., and La¯en, J. M. 1993. `Error assessment in the universal soil loss equation', Soil Sci. Soc.
Am. J., 57, 825±833.Rogers, R. D. 1989. `In¯uence of sparse vegetation cover on erosion and rill patterns: an experimental study', MSc Thesis, Colorado
State University, Fort Collins.Williams, J. R. 1975. `Sediment-yield prediction with universal equation using runo� energy factor', Present and Prospective Technology
for Predicting Sediment Yields and Source, Proc. Sediment-Yield Workshop. U.S. Dept. of Agr. Sedim. Lab., Oxford, Mississippi.Wischmeier, W. H. 1975. `Estimating the soil loss equation's cover and management factor for undisturbed areas', Present and
Prospective Technology for Predicting Sediment Yields and Source. U.S.D.A. ARS, 5, 40.Wischmeier, W. H. and Smith, D. D. 1978. `Predicting rainfall erosion losses. A guide to conservation planning', U.S.D.A.,
Agr. Handbook, p. 537. USDA, Printing O�ce. Washington.Wischmeier, W. H., Johnson, C. B., and Cross, B. V. 1971. `A soil erodibility nomograph for farmland and construction sites',
J. Soil Wat. Conserv., 26, 189±193.
# 1998 John Wiley & Sons, Ltd. HYDROLOGICAL PROCESSES, VOL. 12, 635±649 (1998)
ANTI-EROSIVE EFFECTIVENESS OF EUCALYPTUS 649