Effect of Phosphorus Concentration On The Growth of Cattail Callus Cells
27
_____________________________________ 11/7/01 1 of 28 Effect of Phosphorus Concentration On The Growth of Cattail Callus Cells Lunique Estime 1 , Marie O’Shea, Michael Borst United States Environmental Protection Agency, Water Supply and Water Resources Division, National Risk Management Research Laboratory, 2890 Woodbridge Avenue (MS-104) Edison, NJ 08837. Jennifer Gerrity, and Shih-Long Liao US Infrastructure Inc. 1090 King George’s Post Road Suite 407, Edison, New Jersey 08837 1 To whom correspondences should be addressed 1 EPA/600/JA-03/290
Transcript of Effect of Phosphorus Concentration On The Growth of Cattail Callus Cells
_____________________________________
11/7/01 1 of 28
Effect of Phosphorus Concentration On The Growth of Cattail Callus Cells
Lunique Estime1, Marie O’Shea, Michael Borst
United States Environmental Protection Agency, Water Supply and Water Resources Division,
National Risk Management Research Laboratory, 2890 Woodbridge Avenue (MS-104) Edison,
NJ 08837.
Jennifer Gerrity, and Shih-Long Liao
US Infrastructure Inc. 1090 King George’s Post Road Suite 407, Edison, New Jersey 08837
1 To whom correspondences should be addressed
1
EPA/600/JA-03/290

11/7/01 2 of 28
ABSTRACT
This investigation examined the growth of Typha latifolia (cattail) callus cells grown in five (0,
11, 22, 33, 44 mg!L-1) different phosphorus concentrations. The cells were grown for two
successive subcultures on semi-solid media, and subsequently in suspension culture with the
same phosphorus levels. On semi-solid media, the fresh weight of the cells varied by a maximum
of 36% through both subcultures. The 33 mg!L -1 phosphorus supplied in the original Gamborgs
B5 media promoted the greatest fresh weight of the cells in suspension culture over all other
concentrations tested. When grown in suspension culture with 0 and 11 mg!L-1 phosphorus, the
cells showed a 42 and 29% reduction in fresh weight, respectively.
Incubating the cells with 22 and 44 mg!L-1 phosphorus caused a 20 and 13% reduction in fresh
weight, respectively. In addition, this study compared the phosphorus concentration of callus
cells against literature-reported values of whole cattail plants incubated at similar phosphorus
concentrations. Data from this study demonstrate that when the cattail callus cells and whole
plants are exposed to similar phosphorus concentrations, the phosphorus concentration in the
plant leaves is within the confidence interval (p # 0.05) of the phosphorus concentration in the
cattail callus cells. This suggests that cattail callus cells can be used to predict the concentration
of phosphorus in cattail leaves when they are supplied with similar phosphorus levels. If this
relationship between callus cells and whole plants is found to be applicable to other marsh plant
species, stormwater wetland managers can use callus cells as a rapid method to screen plants for
2

11/7/01 3 of 28
their capacity to absorb phosphorus before the plant is established in a wetland. This can
increase the effectiveness of the wetland to absorb unwanted pollutants from the stormwater
entering the site.
INTRODUCTION
Phosphorus is a critical element in plant biochemistry (George et al., 1989). Phosphorus-
containing compounds are involved in energy capture during photosynthesis, carbohydrate
metabolism, and protein and nucleic acid synthesis (George et al., 1989; Raven et al., 1999).
Phosphorus is absorbed into plants in the form of phosphates through an energy-requiring
process. Biochemically, phosphorus is required only as the fully oxidized orthophosphate.
However, it is usually added to the culture media of plant callus cells in the form of monovalent
and divalent anions that are interconvertible in the media, depending on the pH (George et al.,
1989).
Most of the tissue culture media on the market today contain relatively low concentrations of
phosphorus (George et al., 1985). This may be due to the fact that at high concentrations,
phosphate ions are likely to associate with calcium (Ca+2), forming insoluble calcium phosphate
(George et al., 1989). Therefore, to prevent the accumulation of calcium phosphate in the media,
the phosphorus concentration is kept relatively low. However, several researchers have
suggested that the relatively low concentrations of phosphorus in plant cell culture media is
3

11/7/01 4 of 28
inadequate for healthy growth of the cells (Ohira et al., 1973; Curtis et al, 1991). In suspension
culture, opium poppy cells showed an almost 50% increase in growth when the phosphorus
concentration in the media was doubled (Curtis, 1991).
Although phosphorus is an essential element in plant tissue culture, it can cause eutrophication
which is a severe environmental problem that occurs when an excessive amount of phosphorus
enters lakes and rivers particularly from stormwater runoff (Kadlec and Knight, 1996).
Laboratory and greenhouse studies are being conducted to examine the capacity of marsh plants
to absorb excess (an amount above what is essential for normal growth and development)
phosphorus from the environment (Kadlec and Knight, 1996). The tissue culture system is
proving to be a valuable tool in environmental research. For example, researchers are using
callus cells to determine the capacity of plant species to degrade organic pollutants (Wilkens et
al., 1995; Wang et al., 1996; Estime and Rier, 2001). Studies have been carried out that
demonstrate plant cell culture can be used to predict ability of the whole plant of the same
species to degrade organic pollutants (Harms and Kottutz, 1990). Surprisingly, little attention has
been paid to determining if callus cells could also predict the capacity of plant cells to absorb
and retain nutrients, such as phosphorus.
Only a limited number of marsh plants, such as Typha sp., have been investigated for their
nutrient absorption capacity when grown in stormwater wetlands (Kadlec and Knight, 1996).
For example, Typha sp. (cattail) is a marsh plant that is known to be very effective at absorbing
4

11/7/01 5 of 28
and retaining phosphorus from stormwater wetlands (Stockdale, 1991; Strecker, 1992; Kadlec
and Knight, 1996). However, thousands of marsh plant species exist in New Jersey alone (Reed,
1988). Some of these plants may prove to be preferentially effective in absorbing phosphorus
from stormwater wetlands. A limited number of studies have investigated the nutrient absorption
capacity of marsh plants. Tissue culture techniques may be useful in screening marsh plants for
their effectiveness in absorbing and retaining nutrients, which is very similar to studies that are
using callus cells to screen plant species for their capacity to degrade organic pollutants (Fletcher
et al., 1987; Wilken et al., 1995; Wang et al., 1996; Estime and Rier, 2001).
Using callus cells to provide relatively rapid data on the absorption capacity of marsh plants is
potentially valuable to stormwater wetland managers who are concerned with controlling the
nutrient load entering nearby receiving waters. Gaining an understanding of how the plant will
perform before it is cultivated in the field can allow these mangers to maximize the removal
effectiveness of the site. The objective of this present study was two-fold: 1) monitor the growth
of cattail callus cells in various phosphorus levels during three successive subcultures (two on
semi-solid media, and the third in liquid medium), and 2) determine whether cattail callus cells
will contain comparable phosphorus concentrations as reported in cattail leaves when the plant is
supplied with similar levels of phosphorus.
The knowledge gained from this study could be used to devise a selection system to identify
mutant callus cells capable of growing in low phosphorus content medium. This would be very
valuable because the callus cells could be regenerated to whole plants and possibly survive in
5

11/7/01 6 of 28
newly constructed stormwater wetlands containing sandy or highly organic soils, where the
phosphorus concentration is generally low, and plant growth is very slow (Kadlec and Knight,
1996; Alloush et al., 2000). It takes a typical stormwater wetland containing sandy soil several
years to develop adequate plant density required to become effective stormwater treatment
systems. This delay is mainly attributed to the relative inability of sandy soil to retain nutrients
(Kadlec and Knight, 1996). Therefore, regenerating callus cells that can grow under phosphorus-
starved conditions may produce whole plants that can flourish under nutrient limiting conditions
in the field, such as in newly constructed wetlands containing sandy or highly organic soil. This
decreases the amount of time required for a newly constructed wetland to obtain an adequate
plant density to effectively treat stormwater entering the wetland.
MATERIAL AND METHODS
Incubation of Callus Cells On Semi-Solid Media
Regenerable Typha latifolia L. (cattail) callus cells were initiated from immature inflorescence
spikes. These cells were grown for seven months on B5 basal medium (Gamborg et al., 1976)
supplemented with 5 mg!L-1 dicamba, 1 mg!L-1 BA, 0.8% agar, and 3% sucrose adjusted to a
pH of 5.6 with 1N hydrochloric acid (HCL) or 1N potassium hydroxide (KOH). These cells were
maintained in the dark at 25 ± 1oC. They were subcultured every three weeks onto fresh medium
and incubated under the same conditions. The growth experiments were initiated by aseptically
6

11/7/01 7 of 28
placing 2 gm of the cells on semi-solid media containing B5 media (supplemented as above)
made with 0, 11, 22, 33, and 44 mg!L -1 phosphorus, in the form of sodium phosphate (NaH2PO4
• H2O). Only phosphate-free water was used to make up the culture media in this study. All of
the glassware was rinsed with hot, dilute HCL, then three rinses with sterile phosphate-free water
to remove any residual phosphorus from the washing detergent. The phosphorus concentration
supplied in the standard B5 basal media is 33 mg!L-1, so cells grown at this concentration
represented the control. The plants cells were grown for three successive subcultures in the same
phosphorus concentrations. The first two subcultures occurred on semi-solid media; the last
subculture was carried out in liquid media.
Sodium phosphate is the only source of phosphorus (33 mg!L-1) in Gamborg’s B5 medium
(Gamborg, 1976). Since the phosphorus concentration in the media was altered by manipulation
of the NaH2PO4•H20, this also affected the concentration of sodium (Na) in the culture medium.
In tissue culture systems, Na+ only appears to be essential for the growth of salt-tolerant plants
which have C4 or crassulacean acid metabolism (George et al., 1988); therefore, the lack of Na+
in the culture media caused by a decrease in the concentration of sodium phosphate salt was not
a concern.
Growth of the cattail cells was monitored to determine the effect of the differing concentrations
of phosphorus in the media. To incubate the cells on semi-solid media, 25 mL of the media was
added to labeled petri dishes, and 2 gm of the callus cells were aseptically added to each petri
7

11/7/01 8 of 28
dish. The petri dishes were then placed in an incubator in the dark at 25 ± 1oC. After three weeks
of incubation, the cells were subcultured onto fresh media containing the same nutritional
components. After an additional three weeks, the cells were subcultured into flasks containing
the same media formulations from which the cells were derived, minus the agar. The callus cells
grown on semi-solid media were extracted and analyzed as stated below for the cells grown in
suspension culture.
Initiation of Suspension Cultures
Five grams of callus cells were added to 60 mL of liquid media in 125 mL Erlenmeyer flasks.
The flasks were topped with a cotton plug and wrapped with aluminum foil. All flasks were
incubated in the dark at 25 ± 1 oC at 75 rpm. Four flasks were removed from the shaker every
four days. Once removed from the shaker, the flask’s contents were vacuum-filtered to separate
the callus cells from the media. The entire growth curve for the cells at all the phosphorus
concentrations spanned 44 days.
The extraction procedure used to obtain the phosphorus concentration in the cells and media was
the Acid Digestion of Sediments, Sludges, and Soils (Method #3050), and the extracts were
analyzed according to the Ascorbic Acid Method (Method #4500-PE) (Clesceri, 1998). An
analysis of variance (p #0.05) was done to compare the growth of the cells at the various
phosphorus levels using the SigmaStat® software package.
8
11/7/01 9 of 28
Comparison Of The Phosphorus Concentration Of Cattail Callus Cells and Cattail Leaves
The mean phosphorus concentration of the cattail leaves from a study reported by Cary and
Weerts (1984) was compared to the phosphorus content of the callus cells (at the point of
maximum fresh weight) incubated in suspension culture with similar phosphorus levels. Cary
and Weerts (1984) grew whole cattail plants in glass jars for 90 days at various concentrations of
phosphorus. Conducting this experiment in glass jars allowed all of the phosphorus to be
bioavailable to the plants. The objective of this portion of the study was to determine whether the
mean phosphorus concentration of the plant leaves from the study reported by Cary and Weerts
(1984) was equivalent to (p #0.05) the phosphorus concentration of the callus cells when
exposed to similar phosphorus levels.
RESULTS
Growth of Callus Cells
9

11/7/01 10 of 28
During the second subculture, a small fraction of the cells (Table 1) on all of the phosphorus
concentrations began to turn brown, while another group of cells formed roots. It is unclear why
the cells began to change color and undergo organogenesis. These cells were in culture for many
months before the start of this experiment, and these changes were never observed. These
variations can possibly be attributed to the normal physiological changes that plant cells can
experience, which tend to be short lived (Curtis, 1991; Utomo et al., 1995). To obtain the fresh
weight of the cells on semi-solid media and initiate suspension cultures, only healthy, shinny,
and light golden brown cells (original color of the cells) free of roots were used.
The cells grew surprisingly well in the 0 mg!L -1 phosphorus. At the end of the first and second
subculture, the fresh weight of the cells in 0 mg!L-1 phosphorus was 28% less than the control
(Table 1). This is similar to what was observed in tomato cells that were capable of near-normal
rates of growth under phosphate-starved conditions (Goldstein, 1991). A decrease in the
phosphorus level in the media to 11 mg!L -1 (67% reduction) lessened the fresh weight of the
cells by only 13 and 10% during the first and second subcultures, respectively (Table 1).
On the other hand, incubating these cells in 22 mg!L-1 phosphorus (a 33% reduction) promoted
approximately the same fresh weight of the cells on semi-solid media as the control cells. The
fresh weight of the cells in 22 mg!L-1 phosphorus was 5 and 2% (not statistically significant)
higher than the control cells after the first and second subcultures, respectively. This study
demonstrates that a 67 and 33% reduction in the phosphorus concentration of the culture media
10

11/7/01 11 of 28
will support healthy growth of the cattail cells, which is in agreement with the work of
Gamborgs et al., (1968), and George et al., (1988) who reported that the phosphorus
concentration in the culture media is more than adequate to support healthy growth of plant cells.
The cells supplied with 44 mg!L-1 phosphorus (25% increase) had a 12% greater fresh weight
over control cells at the conclusion of the first subculture (Table 1). However, at the end of the
second subculture, the fresh weight of the cells in 44 mg!L-1 phosphorus and the control cells
was the same (Table 1). A similar comparison of the cells in 22 and 44 mg!L-1 phosphorus
shows that the higher phosphorus level promoted only an 8% increase and a 0.02% (not
significant) decrease in the fresh weight of the cells at the end of the first and second subcultures,
respectively (Table 1). This reinforces the fact that a lower phosphorus level in the media does
not negatively impact the growth of this cell line on semi-solid media.
Growth of The Cells In Suspension Culture
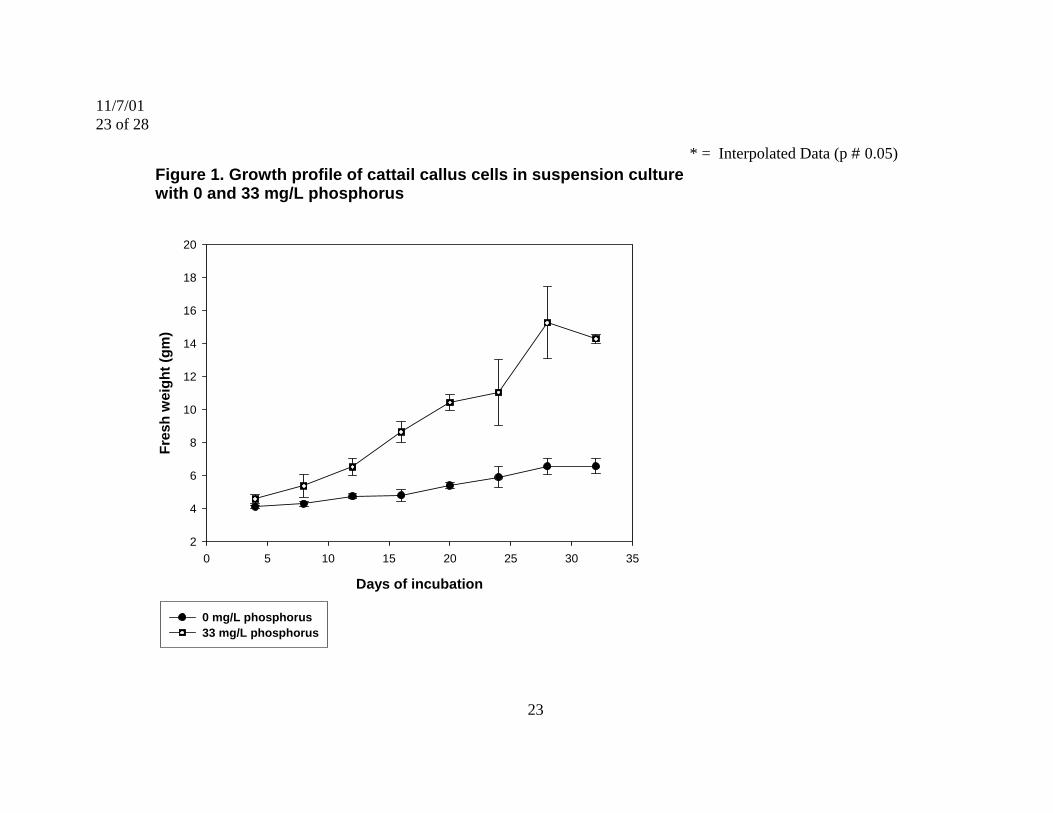
When placed in suspension culture, the fresh weight of the cells in 33 mg!L-1 phosphorus was
significantly (p# 0.05) greater than the fresh weight of the cells grown in all of the other
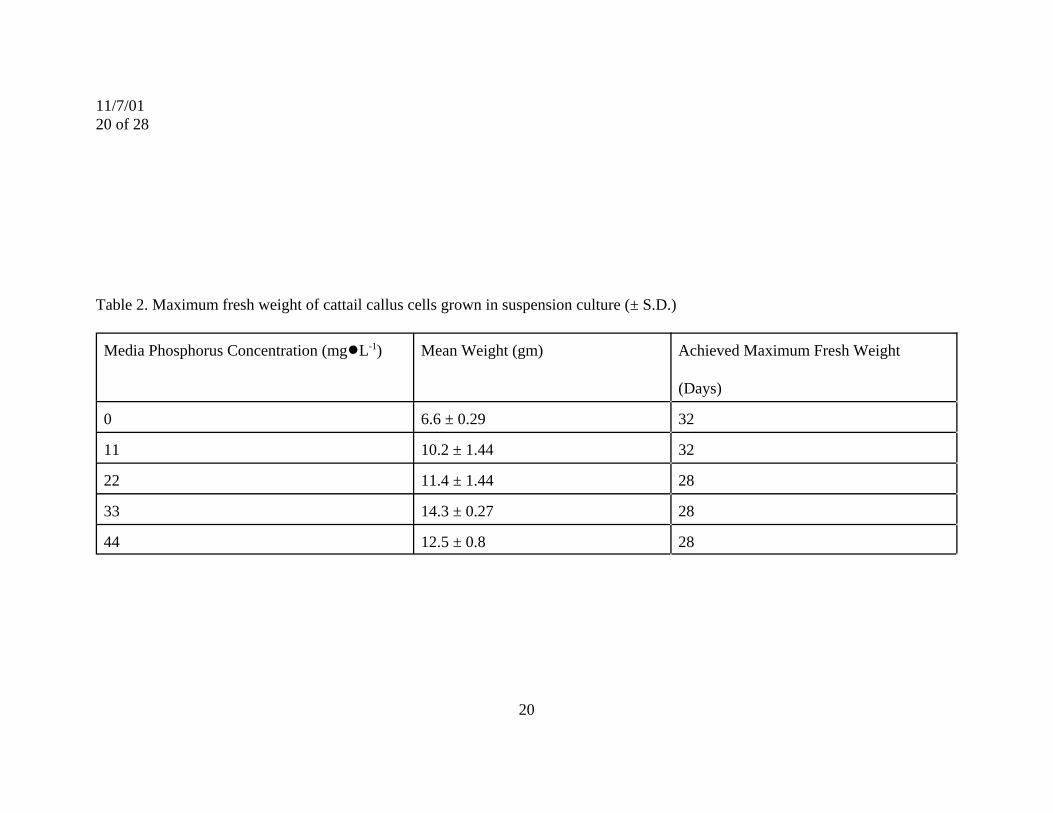
phosphorus concentrations tested. The maximum fresh weight of the cells in 0 mg!L-1
phosphorus was reached at day 32 (Table 2). At this point, the mean weight of the cells was 6.6
11
11/7/01 12 of 28
mg, which is a 42% reduction in the fresh weight of the cells as compared to the control cells
(Figure 1). The fresh weight of the cells in 11 mg!L-1 phosphorus was 29% less than the control
cells (Figure 2). The maximum fresh weight of the cells in 11 mg!L-1 occurred on day 32 (Table
2). The fresh weight of the control cells were 20% greater than the cells in 22 mg!L-1 (Figure 3).
The maximum fresh weight of the cells in 22 mg!L-1 and the control cells occurred on day 28
(Table 2). In suspension culture, 0, 11, and 22 mg!L-1 phosphorus caused a significant
(p #0.05) decrease in the fresh weight of the cells (Table 3). However, placing these cells with
the same phosphorus concentration on semi-solid media did not cause a significant decrease (p #
0.05) in the fresh weight of the cells. This may be due to the increased oxygen transfer to the
cells when they are aerated on a rotary shaker, which is known to greatly enhance the growth of
plant cells (Robertson et al., 1989; Kyte and Kleyn, 1999).
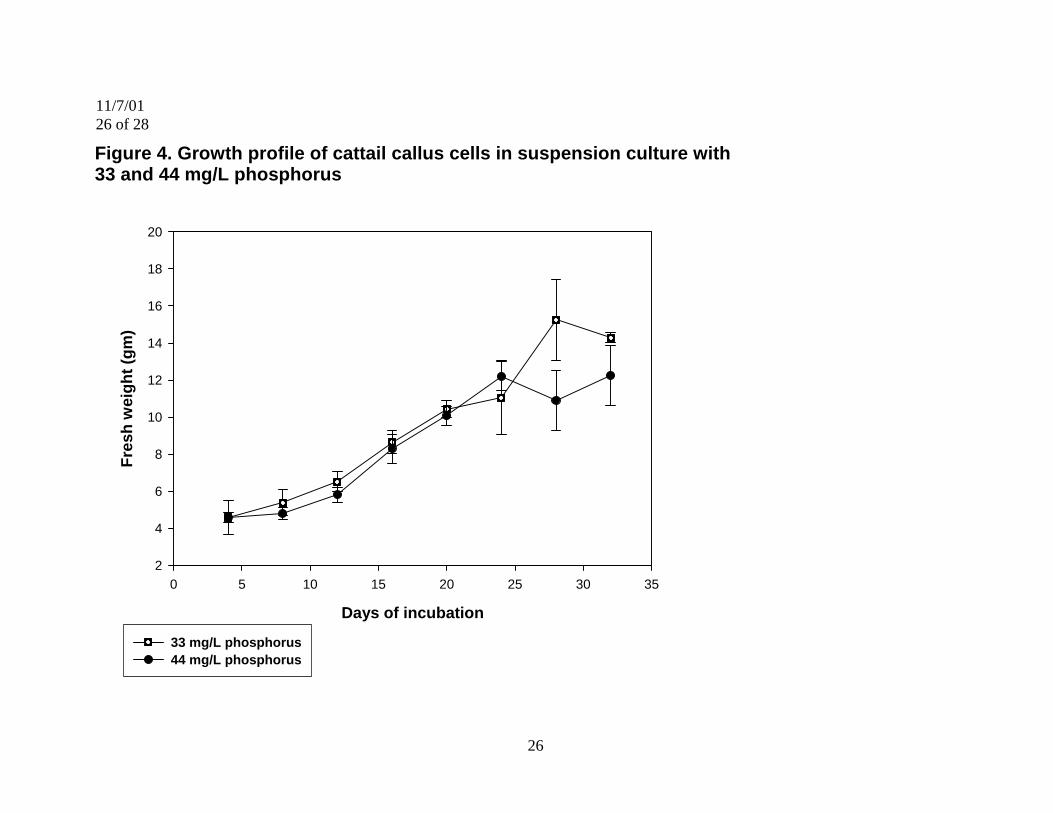
The cells grown in 44 mg!L-1 achieved their maximum fresh weight on day 28 (Table 2). The
fresh weight of the cells grown in 44 mg!L-1 was reduced by 13% as compared to the control
cells (Figure 4), indicating the increased phosphorus level in the culture media inhibited the
growth of the cells. A significant difference (p # 0.05) does exist between the fresh weight of the
cells in 33 mg!L-1 (control) and 44 mg!L-1 when these cells are grown in suspension culture
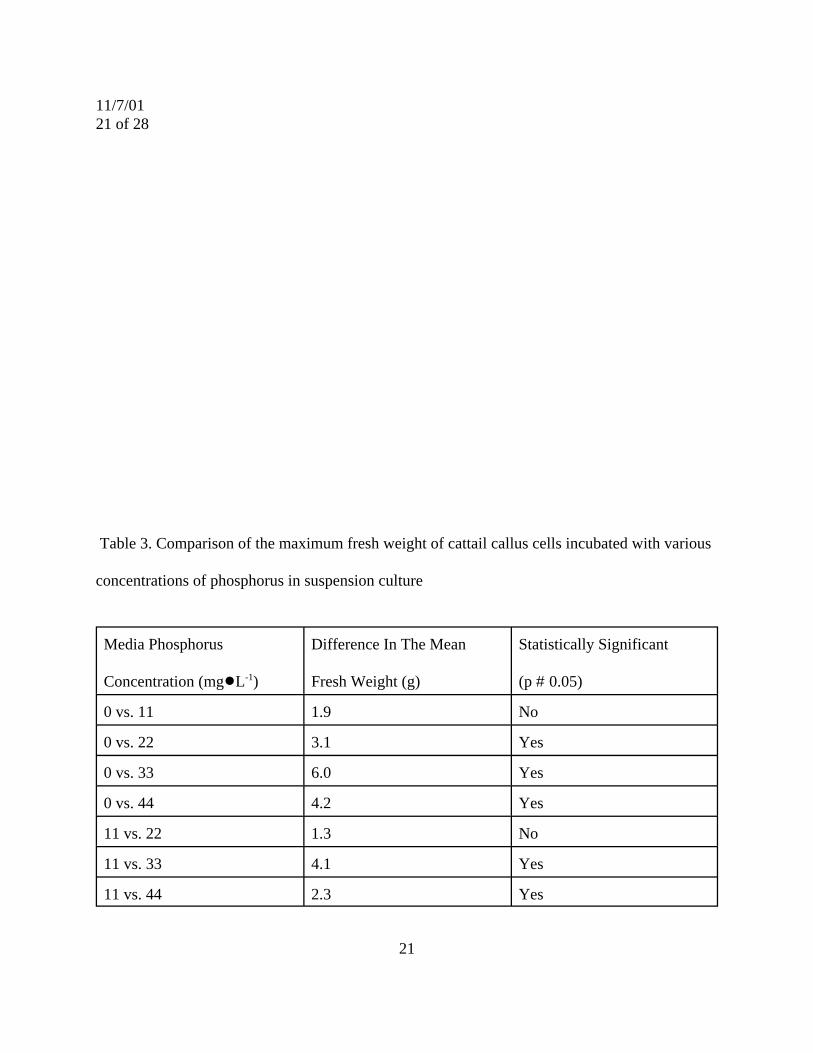
(Table 2). Data from this study demonstrates that the 33 mg!L-1 phosphorus supplied in the
original Gamborgs (1976) B5 basal media is optimum for the growth of this cell line in
suspension culture over all other concentrations tested (Table 3). It appears that a delicate
balance in the phosphorus concentration exists for the proper growth of this cell line in
12
11/7/01 13 of 28
suspension culture. For example, reducing the phosphorus concentration by 33% or more, as
well as increasing it by 25%, will cause a significant decrease in the fresh weight of this cell line
in suspension culture.
Uptake of Phosphorus From The Culture Media
The cells grown in 0 mg!L-1 began to release phosphorus into the media at day 4 when the
average concentration was 0.77 mg!L-1 (Figure 5). It is evident that these cells had an internal
reserve pool of phosphorus which they excreted into the media. Many researchers have reported
that phosphorus will be completely exhausted from the media in only a few days (Curtis et al.,
1991; Mantell, 1983; Wilson, 1978). However, in this study, phosphorus was always detectable
in the culture media even after several weeks. Only the cells in 11 mg!L -1 phosphorus nearly
exhausted the media supply, reducing the phosphorus concentration in the media to a minimum
of 1.1 mg!L-1 by day 4 (Figure 5).
The cells grown in the remaining phosphorus levels (22, 33, and 44 mg!L-1) never totally
depleted the media supply (Figure 5). The cells supplied with 22 mg!L-1 phosphorus reached a
minimum concentration of 3.4 mg!L-1 at day 12. The cells grown in 33 mg!L-1 phosphorus
reduced the media concentration to a minimum of 3.4 mg!L-1 on day 16, while the cells in 44
mg!L-1 had a minimum phosphorus concentration on day 20 of 8.2 mg!L-1. Once the minimum
media concentrations were reached, the nutrient level of the media would remain relatively
constant for several days (data not shown). A noticeable increase in the phosphorus level in the
13

11/7/01 14 of 28
media would occur when the cells would enter their stationary growth phase, and cell lysis
would outnumber cell formation.
Comparison of Phosphorus Level in Cattail Callus Cell And Cattail Leaves
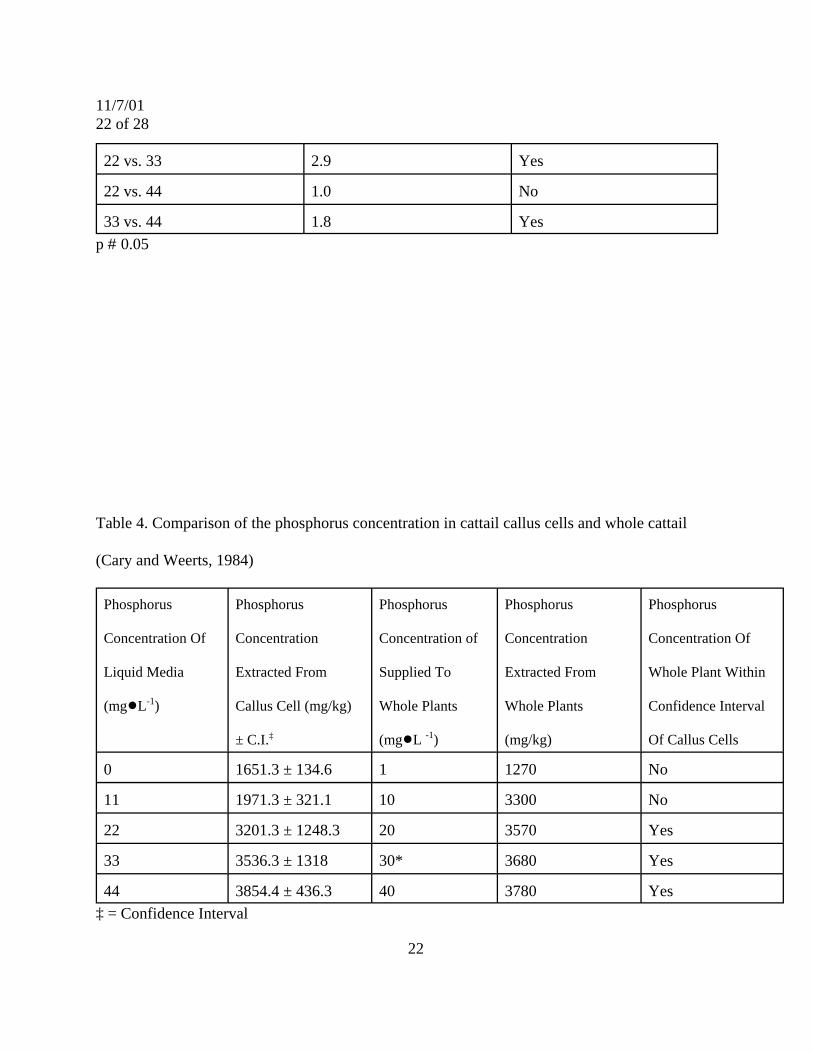
Cary and Weerts (1984) reported that the phosphorus concentration in the cattail leaves vary
depending on the phosphorus levels supplied to the plants (Table 4). This is in agreement with
the data from this study which also shows that the phosphorus concentration in cattail callus cells
will vary according to the phosphorus level supplied. Data from this present study demonstrates
that when cattail callus cells and whole plants are supplied with similar phosphorus
concentrations, the nutrient level in the plant leaves is similar (p # 0.05) to the mean
concentration of the callus cells at their point of maximum fresh weight (Table 4). This statement
is valid for the three highest concentrations (22, 33, and 44 mg!L-1) tested, which demonstrates
that the cattail callus cells used in this study could have been used to predict the phosphorus
concentration of the cattail leaves reported by Cary and Weerts (1984).
This study presents a procedure that could be used to estimate the amount of phosphorus cattail
leaves will absorb when grown in the field. If this procedure is found to be applicable to other
marsh plants, it would allow researchers to screen a variety of marsh plants relatively quickly for
their capacity to absorb phosphorus, after the callus cells are obtained. This can possibly provide
wetland managers with a data- base of marsh plants to use in their decision-making process when
14
11/7/01 15 of 28
establishing a stormwater wetland. The wetland manager could select the most appropriate plant
based on the climatic conditions and phosphorus level of the site. For example, a wetland
manager may select a set of plants from the database for a site in New Jersey containing
relatively low phosphorus levels, while another set of plants would be selected for a site located
in Florida containing a higher level of phosphorus.
Acknowledgment
We thank Dr. Chee-Kok Chin from the Department of Plant Science at Rutgers University for
the assistance he provided to us in conducting this project. In addition, we appreciate the
technical assistance provided by Jin-Song Xing from the Department of Plant Science, Rutgers
University, Cook College, New Brunswick, NJ.
REFERENCES
1. Alloush, G.A.; Zeto, S.K.; Clark, R.B. Phosphorus Source, Organic Matter, and Arbuscular
Mycorrhiza Effects On Growth and Mineral Acquisition of Chickpea Grown In Acidic
Soils. J Plant Nutr. 2000, 23(9), 1352-1369.
2. Cary, P.R; Weerts, P.G. Growth and Nutrient Composition of Typha Orientalis As Affected
By Water Temperature and Nitrogen and Phosphorus Supply. Aquatic Botany 1984
19,105-118.
3. Clesceri, L.S.; Greenburg, A.E.; Eaton, A.D. Standard Methods For The Examination of
15

11/7/01 16 of 28
Wastewater. 20th Edition. American Public Health Association: Washington, D.C., 1988;
1156 pp.
4. Curtis, W.R.; Hosogawa, P.M.; Emery, A. Modeling Linear and Variable Growth In
Phosphate Limited Suspension Cultures of Opium Poppy. Biotech Bioeng 1991, 38, 371
379.
5. Estime, L.; Rier, J.P. Disappearance of Polychlorinated Biphenyls (PCBs) When Incubated
With Tissue Cultures of Different Plant Species. Bull. Environ Contam. & Toxicol. 2001,
66, 671-678.
6. Fletcher, J.; Groeger, A.W.; McFarlene, J.C. Metabolism of 2-Chlorobiphenly By Suspension
Cultures of Paul’s Scarlet Rose. Bull. Environ. Contam Toxicol. 1987, 39, 960-965.
7. Gamborg, O.L.; Miller, R.A.; Ojima, K. Nutrition Requirements of Suspension Cultures of
Soybean Root Cells. Exper. Cell Res. 1968, 50, 151-158.
8. Gambor, O.L.; Murashige, T.; Thrope, T.A.; Vasil, I.K. Plant Tissue Culture Media. In Vitro.
1976, 12, 473-478.
9. George, E.F.; D.J.M. Puttock.; H.J. George. The Constituents of Culture Media. Plant Culture
Media. Commentary and Analysis; Exegetics Limited: Edington, Westbury, Wilts. BA13
4QG, England, 1988; Volume 2. 348 - 350.
10. Goldstein, A.H. Plant Cells Selected For Resistance To Phosphate Starvation Show
Enhanced P Use Efficiency. Theo. Appl. Genet 1991, 82, 191-194.
11. Harms, H.; Lungebartels, K. Standardized Plant Cell Suspension Test Systems For An
16

11/7/01 17 of 28
Ecotoxicological Evaluation of The Metabolic Fate of Xenobiotics. Plant Science 1986,
45: 157-165.
12. Harms, H.; Kottutz, E. Bioconversion of Xenobiotics In Different Plant Systems - Cell
Suspension Cultures, Root Cultures and Intact Plants. Proceedings of the 7th
International Symposium on Plant Tissue and Cell Cultures. Amsterdam, Netherlands,
July 17 -26, 1990.
13. Kadlec, R.H.; Knight, R.L. Treatment Wetlands; Lewis Publishers: Boca Raton, FL, 1996.
893 pp.
14. Mantell, S.H.; Pearson, D.W.; Hazell, L.P.; Smith, H. The Effect of Intital Phosphate and
Sucrose Levels On Nicotine Accumulation In Batch Suspension Cultures of Nicotiana
Tabacum L. Plant Cell Report 1983, 2, 73-77.
15. Raven, P.H.; R.F. Evert.; S.E. Eichhorn. The Molecular Composition of Plant Cells. In
Biology of Plants, Sixth Edition; W.H. Freeman and Company. Worth Publishers: NY,
New York, 1999; 944 pp.
16. Reed, P.B. National List of Plant Species That Occur In Wetlands: New Jersey. US
Department of Fish and Wildlife Service: St. Petersburg, FL, 1988; 225 pp.
17. Robertson, G.H.; Doyle, L.R.; Sheng, P.; Pavlath, A.E.; Goodman, N. Diosgenin Formation
By Freely Suspended and Entrapped Plant Cell Cultures of Dioscorea Deltoidea. Biotec.
Bioeng. 1989, 34, 1114-1125.
17

11/7/01 18 of 28
18. Stockdale, E.C. (1991). Freshwater Wetlands, Urban Storm Water, and Nonpoint Pollution
Control: A Literature Review and Annotated Bibliography. Resource Planning Section
King County Department of Parks Planning and Resources. Seattle, Washington, 1991;
267 pp.
19. Strecker, E.W.; Kersnar, J.M.; Driscoll, E.D. (1992). The Use of Wetlands For Controlling
Storm Water Pollution. The Terrene Institute. Washington, D.C, 1992; 65 pp.
20. Utomo, H.S.; Croughan, S.S.; Croughan, T.P. Suspension and Protoplast Culture of U.S.
Rice Cultivars. Plant Cell Reports 1995, 15, 34-37.
21. Wang, M.J.; Bokern, M.; Boehme, C.; Jones, K.C.; H. Harms. Phytotoxicity, Uptake and
Metabolism of 1,4-Dichlorobenzene By Plant Cells. Environ. Tox. Chem. 1996, 15(7),
1109-1114.
22. Wilken, A.; Bock, C.; Bokern, M.; Harms, H. Metabolism Of Different PCB Congeners In
Plant Cell Cultures. Environ Chem 1995, 14(12), 2017-2022.
23. Wilson, G. A Simple and Inexpensive Design of Chemostate Enabling Steady-State Growth
of Acer Pseudoplatanus L. Cells Under Phosphate-Limiting Conditions. Ann. Bot 1976,
40, 919-932.
24. Wilson, G.; Marron, P. Growth and Anthraquinone Biosynthesis by Galium Molluga L. Cells
In Batch and Chemostat Culture. J. Exper. Botany 1978, 29(111), 837-851.
18

11/7/01 19 of 28
Table 1. Growth of cattail callus cells on semi-solid medium
Media
Phosphorus
Concentratio
n (mg!L-1)
Initial Callus
Mass
Per Plate
(gm)
Average Mass
of Cells Per
Plate After
First
Subculture
(gm)
Average Mass
of Cells Per
Plate After
Second
Subculture
(gm)
Cells
Turning
Brown (%)
Cells
Forming
Roots (%)
0 2 2.9 2.8 7 3
11 2 3.6 3.5 4 5
22 2 4.2 4.0 8 4
33 2 4.0 3.9 6 10
44 2 4.5 3.9 14 8
19
11/7/01 20 of 28
Table 2. Maximum fresh weight of cattail callus cells grown in suspension culture (± S.D.)
Media Phosphorus Concentration (mg!L-1) Mean Weight (gm) Achieved Maximum Fresh Weight
(Days)
0 6.6 ± 0.29 32
11 10.2 ± 1.44 32
22 11.4 ± 1.44 28
33 14.3 ± 0.27 28
44 12.5 ± 0.8 28
20
11/7/01 21 of 28
Table 3. Comparison of the maximum fresh weight of cattail callus cells incubated with various
concentrations of phosphorus in suspension culture
Media Phosphorus
Concentration (mg!L-1)
Difference In The Mean
Fresh Weight (g)
Statistically Significant
(p # 0.05)
0 vs. 11 1.9 No
0 vs. 22 3.1 Yes
0 vs. 33 6.0 Yes
0 vs. 44 4.2 Yes
11 vs. 22 1.3 No
11 vs. 33 4.1 Yes
11 vs. 44 2.3 Yes
21
11/7/01 22 of 28
22 vs. 33 2.9 Yes
22 vs. 44 1.0 No
33 vs. 44 1.8 Yes p # 0.05
Table 4. Comparison of the phosphorus concentration in cattail callus cells and whole cattail
(Cary and Weerts, 1984)
Phosphorus
Concentration Of
Liquid Media
(mg!L-1)
Phosphorus
Concentration
Extracted From
Callus Cell (mg/kg)
± C.I.‡
Phosphorus
Concentration of
Supplied To
Whole Plants
(mg!L -1)
Phosphorus
Concentration
Extracted From
Whole Plants
(mg/kg)
Phosphorus
Concentration Of
Whole Plant Within
Confidence Interval
Of Callus Cells
0 1651.3 ± 134.6 1 1270 No
11 1971.3 ± 321.1 10 3300 No
22 3201.3 ± 1248.3 20 3570 Yes
33 3536.3 ± 1318 30* 3680 Yes
44 3854.4 ± 436.3 40 3780 Yes ‡ = Confidence Interval
22
11/7/01 23 of 28
* = Interpolated Data (p # 0.05) Fr
esh
wei
ght (
gm)
Figure 1. Growth profile of cattail callus cells in suspension culturewith 0 and 33 mg/L phosphorus
20
18
16
14
12
10
8
6
4
2 0 5 10 15 20 25 30 35
Days of incubation
0 mg/L phosphorus 33 mg/L phosphorus
23

11/7/01 24 of 28
Figure 2. Growth profile of cattail callus cells in suspension culture with 11 and 33 mg/L phosphorus
20 Fr
esh
wei
ght (
gm)
18
16
14
12
10
8
6
4
2 0 5 10 15 20 25 30 35
Days of incubation
11 mg/L phosphorus 33 mg/L phosphorus
24

11/7/01 25 of 28
Figure 3. Growth profile of cattail callus cells in suspension culture with 22 and 33 mg/L phosphorus
Fres
h w
eigh
t (gm
)
20
18
16
14
12
10
8
6
4
2 0 5 10 15 20 25 30 35
Days of incubation
22 mg/L phosphorus 33 mg/L phosphorus
25
11/7/01 26 of 28
Fres
h w
eigh
t (gm
) Figure 4. Growth profile of cattail callus cells in suspension culture with 33 and 44 mg/L phosphorus
20
18
16
14
12
10
8
6
4
2 0 5 10 15 20 25 30 35
Days of incubation
33 mg/L phosphorus 44 mg/L phosphorus
26

11/7/0127 of 28
Figure 5. Uptake of Phosphorus From The Culture Media By Cattail Callus Cells Grown In Suspension Culture
50
40
30
20
10
0
Day 0
Days of Incubation
Day 4 Day 8 Day 12 Day 16
Phos
phor
us C
once
ntra
tion
0 mg/L Phosphorus 11 mg/L Phosphorus 22 mg/L Phosphorus 33 mg/L Phosphorus 44 mg/L Phosphorus
27