Consumer acceptability of ovine cheese from ewes fed extruded linseed-enriched diets
Upload
independentCategory
view
3download
0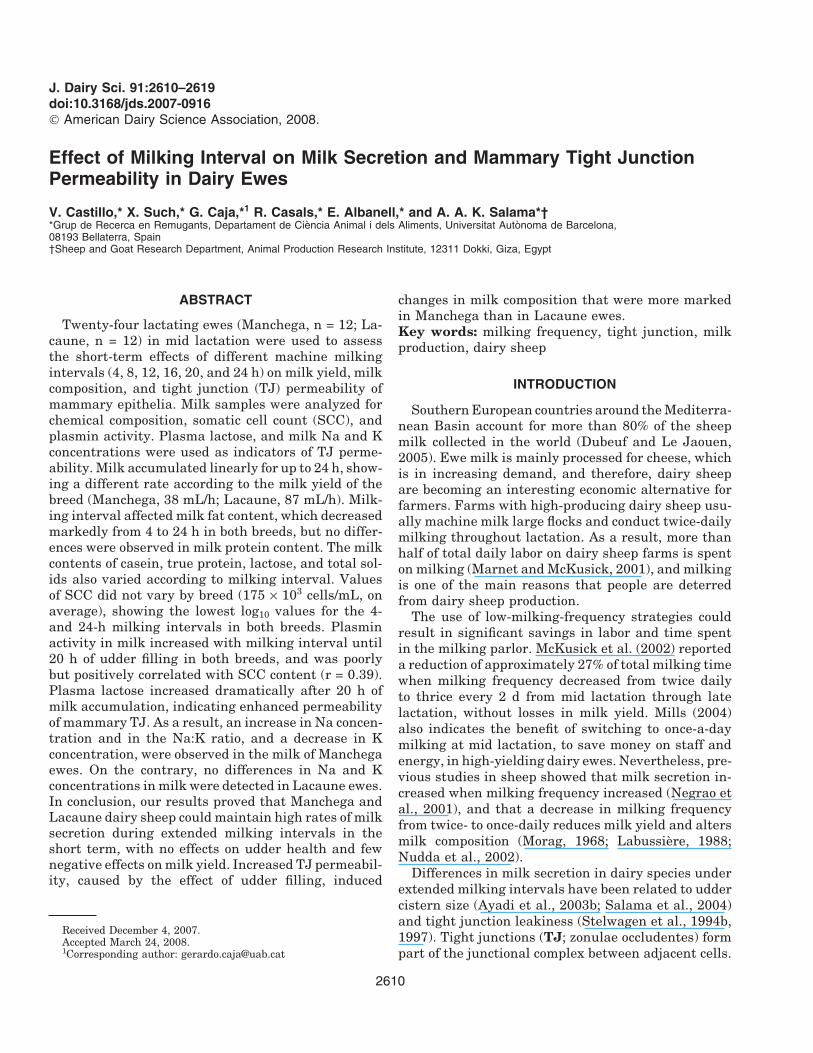
J. Dairy Sci. 91:2610–2619doi:10.3168/jds.2007-0916© American Dairy Science Association, 2008.
Effect of Milking Interval on Milk Secretion and Mammary Tight JunctionPermeability in Dairy Ewes
V. Castillo,* X. Such,* G. Caja,*1 R. Casals,* E. Albanell,* and A. A. K. Salama*†*Grup de Recerca en Remugants, Departament de Ciencia Animal i dels Aliments, Universitat Autonoma de Barcelona,08193 Bellaterra, Spain†Sheep and Goat Research Department, Animal Production Research Institute, 12311 Dokki, Giza, Egypt
ABSTRACT
Twenty-four lactating ewes (Manchega, n = 12; La-caune, n = 12) in mid lactation were used to assessthe short-term effects of different machine milkingintervals (4, 8, 12, 16, 20, and 24 h) on milk yield, milkcomposition, and tight junction (TJ) permeability ofmammary epithelia. Milk samples were analyzed forchemical composition, somatic cell count (SCC), andplasmin activity. Plasma lactose, and milk Na and Kconcentrations were used as indicators of TJ perme-ability. Milk accumulated linearly for up to 24 h, show-ing a different rate according to the milk yield of thebreed (Manchega, 38 mL/h; Lacaune, 87 mL/h). Milk-ing interval affected milk fat content, which decreasedmarkedly from 4 to 24 h in both breeds, but no differ-ences were observed in milk protein content. The milkcontents of casein, true protein, lactose, and total sol-ids also varied according to milking interval. Valuesof SCC did not vary by breed (175 × 103 cells/mL, onaverage), showing the lowest log10 values for the 4-and 24-h milking intervals in both breeds. Plasminactivity in milk increased with milking interval until20 h of udder filling in both breeds, and was poorlybut positively correlated with SCC content (r = 0.39).Plasma lactose increased dramatically after 20 h ofmilk accumulation, indicating enhanced permeabilityof mammary TJ. As a result, an increase in Na concen-tration and in the Na:K ratio, and a decrease in Kconcentration, were observed in the milk of Manchegaewes. On the contrary, no differences in Na and Kconcentrations in milk were detected in Lacaune ewes.In conclusion, our results proved that Manchega andLacaune dairy sheep could maintain high rates of milksecretion during extended milking intervals in theshort term, with no effects on udder health and fewnegative effects on milk yield. Increased TJ permeabil-ity, caused by the effect of udder filling, induced
Received December 4, 2007.Accepted March 24, 2008.1Corresponding author: [email protected]
2610
changes in milk composition that were more markedin Manchega than in Lacaune ewes.Key words: milking frequency, tight junction, milkproduction, dairy sheep
INTRODUCTION
Southern European countries around the Mediterra-nean Basin account for more than 80% of the sheepmilk collected in the world (Dubeuf and Le Jaouen,2005). Ewe milk is mainly processed for cheese, whichis in increasing demand, and therefore, dairy sheepare becoming an interesting economic alternative forfarmers. Farms with high-producing dairy sheep usu-ally machine milk large flocks and conduct twice-dailymilking throughout lactation. As a result, more thanhalf of total daily labor on dairy sheep farms is spenton milking (Marnet and McKusick, 2001), and milkingis one of the main reasons that people are deterredfrom dairy sheep production.
The use of low-milking-frequency strategies couldresult in significant savings in labor and time spentin the milking parlor. McKusick et al. (2002) reporteda reduction of approximately 27% of total milking timewhen milking frequency decreased from twice dailyto thrice every 2 d from mid lactation through latelactation, without losses in milk yield. Mills (2004)also indicates the benefit of switching to once-a-daymilking at mid lactation, to save money on staff andenergy, in high-yielding dairy ewes. Nevertheless, pre-vious studies in sheep showed that milk secretion in-creased when milking frequency increased (Negrao etal., 2001), and that a decrease in milking frequencyfrom twice- to once-daily reduces milk yield and altersmilk composition (Morag, 1968; Labussiere, 1988;Nudda et al., 2002).
Differences in milk secretion in dairy species underextended milking intervals have been related to uddercistern size (Ayadi et al., 2003b; Salama et al., 2004)and tight junction leakiness (Stelwagen et al., 1994b,1997). Tight junctions (TJ; zonulae occludentes) formpart of the junctional complex between adjacent cells.

MILKING INTERVAL EFFECTS ON MILK COMPOSITION OF SHEEP 2611
They are semipermeable extracellular structures thatsurround cells in a gasket-like manner and are locatedin proximity to the apical domain of the cell (Stelwagenet al., 1995). They act as a barrier between adjacentepithelial and endothelial cells, thus preventing para-cellular transport and maintaining the electrochemi-cal gradient (Stelwagen et al., 1995). Permeability ofTJ in lactating mammary glands increases with alveoliengorgement and switches to a leaky state after 18 hof milk accumulation in cows (Stelwagen et al., 1997),and after 21 h in goats (Stelwagen et al., 1994b). Thisallows the movement of milk components into the in-terstitial fluid and vice versa (Stelwagen et al., 1997)and results in a decrease in milk yield (Stelwagen etal., 1995) and milk secretion (Stelwagen et al., 1994b,1997). Lactose is not produced in any organ other thanthe mammary gland (Kuhn and Linzell, 1970) and isnot secreted basolaterally (Stelwagen et al., 1998), soits presence in blood can only be explained by its move-ment from milk into blood via leaky TJ. The use ofplasma lactose as a reliable indicator of TJ permeabil-ity has been extensively studied in dairy cows andgoats (Stelwagen et al. 1994b; 1995; 1997).
Although loss of TJ integrity may also be a key factorresponsible for milk yield loss or milk component vari-ation produced by milking omission in dairy ewes(McKusick et al., 2002; Nudda et al., 2002), no studiesexist that prove that TJ open and if they do at whattime this occurs in dairy sheep.
Extended milking intervals may also negatively af-fect milk composition and cheese yield as a result ofincreasing protease activity in milk. Plasmin (PL), aserine proteinase associated with CN micelles, is themost responsible for protease activity in milk (Bastianand Brown, 1996). Stelwagen et al. (1994c) and Kellyet al. (1998) reported significant increments in theactivity of PL in milk during extended milking inter-vals, indicating that paracellular leakage may contrib-ute to increased protease activity in milk. Thus, lossesof mammary TJ integrity may not only compromisemilk yield but also affect milk quality and cheese char-acteristics.
The primary aim of this study was to assess whetherextended milking interval affects secretion of milk andmilk components and if it compromises udder health.The secondary aim was to elucidate if tight junctionsopen, and, if they do, at what time this occurs, in 2different breeds of dairy sheep markedly differing inmilk yield and milk composition, by varying the lengthof the milking interval.
MATERIALS AND METHODS
The experimental procedures and animal care condi-tions were approved by the Ethical Committee of Ani-
Journal of Dairy Science Vol. 91 No. 7, 2008
mal and Human Experimentation of the UniversitatAutonoma de Barcelona (reference CEEAH 02/410).
Animals and Management Conditions
Multiparous ewes of 2 dairy breeds (Manchega, n =12; Lacaune, n = 12) were used in a short-term experi-ment done in wk 11 and 16 of lactation. Ewes withsymmetrical and healthy udders were chosen from theflock of the SGCE (Servei de Granges i Camps Experi-mentals) of the Universitat Autonoma de Barcelona(Bellaterra, Spain), on the basis of similar stage oflactation (70 ± 3 DIM), milk yield by breed (Manchega,1.11 ± 0.09 L/d; Lacaune, 2.32 ± 0.11 L/d), and SCC(64 ± 48 × 103 cells/mL) in the week previous (wk 10) tothe start of the experiment. Absence of intramammaryinfections was checked by milk sample bacteriologyaccording to Salama et al. (2003).
Ewes were allocated at wk 10 and 15 of lactationinto 6 groups of 4 ewes each (Manchega, n = 2; Lacaune,n = 2), and they were housed in a barn separate fromthe main flock to avoid conditioned stimulation of milkletdown between planned milkings as a consequenceof milking machine operation. Ewes received constantillumination to minimize diurnal and nocturnal differ-ences. They were offered a mixture of dehydrated al-falfa and fescue hay fed ad libitum, and were supple-mented with 0.8 kg/d of concentrate mixture pelletscontaining 1.75 Mcal of NEL/kg and 16.5% CP (DMbasis).
Ewes were milked, after the weaning of their lambs(wk 5), in a double-12 stall parallel milking parlor(Westfalia Surge Iberica, Granollers, Spain) equippedwith recording jars and low-line milk pipeline. Milkingwas performed at a vacuum pressure of 42 kPa, a pul-sation rate of 120 pulses/min, and a pulsation ratio of50%. The milking routine for the regular daily milk-ings (0800 and 1800 h) as well as for irregular experi-mental milkings (daily schedule depending on experi-mental design; Table 1) included machine milkingwithout udder preparation or teat cleaning, machinestripping, and teat dipping in an iodine solution (P3-ioshield, Ecolab Hispano-Portuguesa, Barcelona,Spain) after cluster removal.
Experimental Procedures
The experiment consisted of a crossover with 6 milk-ing intervals (4, 8, 12, 16, 20, and 24 h) at random,replicated in wk 11 and 16 of lactation. Milking inter-val schedule during each experimental week was ap-plied successively (total length 84 h) without any pe-riod of washing-out between milking intervals. Milk-ing order for groups of ewes was randomized to avoid

CASTILLO ET AL.2612
Table 1. Experimental schedule for each studied group applied at wk 11 and 16 of lactation in Manchegaand Lacaune dairy ewes
Treatment order1
Group Ewes, n 1 2 3 4 5 6
1 4 24 h 4 h 20 h 8 h 16 h 12 h2 4 4 h 8 h 20 h 16 h 12 h 24 h3 4 16 h 4 h 24 h 8 h 12 h 20 h4 4 20 h 4 h 12 h 8 h 24 h 16 h5 4 8 h 4 h 24 h 12 h 20 h 16 h6 4 12 h 4 h 16 h 8 h 20 h 24 h
1Treatments included machine milking at intervals of 4, 8, 12, 16, 20, and 24 h.
possible carryover effects between milking intervals(Table 1).
The experiment started (0 h) after complete udderemptying by machine milking with the help of an i.v.injection of oxytocin (2 IU/ewe; Veterin Lobulor, Labor-atorios Andreu, Barcelona, Spain) to remove residualmilk. Thereafter, 1 of the 6 milking interval treat-ments was randomly applied, and the same udder-emptying procedure by using oxytocin was repeatedfor each milking interval treatment.
Sampling and Analyses
Milk yield was recorded and milk samples weretaken at each milking. For milk composition analysis,a sample of approximately 100 mL was collected andpreserved with K2Cr2O7 (0.3 g/L) at 4°C. Unhomoge-nized milk samples were analyzed for main milk com-ponents by a near infrared spectrometer (TechniconInfraAlyzer-450, Bran+Luebbe SL, Nordersted, Ger-many), according to Albanell et al. (1999). For SCC,samples were preserved with an antimicrobial tablet(Bronopol, Broad Spectrum Micro-tabs II, D&F Con-trol Systems Inc., San Ramon, CA) and kept at 4°Cuntil analysis. The SCC was determined in the DairyHerd Improvement Laboratory of Catalonia (ALLIC,Cabrils, Barcelona, Spain) using an automatic cellcounter (Fossomatic 5000, Foss Electric, Hillerød,Denmark) previously calibrated for sheep milk.
Concentrations of Na and K in milk and of lactosein plasma were used as indicators of the leakiness ofTJ. Milk samples (10 mL) were collected at each milk-ing interval and frozen at −20°C until analysis. Con-tents of Na and K were determined using inductivelycoupled plasma atomic emission spectroscopy in theChemical Analysis Service of the Universitat Auto-noma de Barcelona. To determine concentrations ofplasma lactose for each milking interval, blood sam-ples (10 mL) of 2 experimental ewe groups (Manchega,n = 4; Lacaune, n = 4) were individually collected im-mediately after milking from the jugular vein into hep-
Journal of Dairy Science Vol. 91 No. 7, 2008
arinized tubes (Venoject, Terumo Europe, Madrid,Spain), refrigerated at 4°C, and centrifuged at 490 ×g for 15 min. Plasma was collected and stored at −20°Cuntil analysis of lactose by use of an enzymatic assay(Lactose/D-Galactose UV-method; Boehringer Mann-heim/R-Biopharm, Darmstadt, Germany) according toStelwagen et al. (1994a).
Finally, a third milk sample (10 mL) from each eweat the first experimental period (wk 11) was collectedand immediately frozen and preserved (−80°C) untilanalysis of plasmin activity. Plasmin activity was de-termined according to Baldi et al. (1996). Assays wereperformed in duplicate by using 250 �L of 0.1 M Tris-HCl buffer (pH 7.4), 0.6 mM Val-Leu-Lys-p-nitroani-lide (Bachem AG, Bubendorf, Switzerland), and 30 �Lof the milk supernatant. The reaction mixture wasincubated at 37°C for 3 h, and absorbance at 405 nmwas recorded at 30-min intervals. A sample withoutsupernatant served as a control for the detection ofspontaneous breakdown of the substrate. The rate of p-nitroanilide formation was calculated from the linearportion of the absorbance vs. time curve. Plasmin wasexpressed as units, 1 unit being the amount of enzymethat produced a change in absorbance at 405 nm of0.1 in 60 min.
Statistical Analyses
Data were analyzed by the PROC MIXED procedurefor repeated measurements of SAS (SAS 9.1, SAS Inst.Inc., Cary, NC). The mixed model used included thefixed effects of milking interval (4, 8, 12, 16, 20, and24 h), breed (Manchega and Lacaune), group (1 to 6),period (wk 11 and 16), and order of treatment applica-tion (first to sixth); the random effect of animal nestedwithin the group and breed; the interactions betweenbreed and interval, period and interval; and the resid-ual error. Plasmin activity analysis did not include theeffect of period and their interactions in the model.Differences between least squares means were deter-mined with the PDIFF test of SAS. Pearson correlation

MILKING INTERVAL EFFECTS ON MILK COMPOSITION OF SHEEP 2613
Figure 1. Effect of different milking intervals (4, 8, 12, 16, 20,and 24 h) on milk yield at wk 11 (�, �) and 16 (�, ▲) of lactationin Manchega (open symbols) and Lacaune (solid symbols) dairy ewes.Values are least squares means. Mean values within the same breedand lactation week differ at P < 0.05; vertical bars represent SEM.Milk yield (mL) = a × time after milking (h); where a = 44.0, 31.1,94.3, and 78.9 in (�), (�), (�), and (▲), respectively; R2 = 0.99 forall equations.
coefficients between measurements were also calcu-lated. Significance was declared as P < 0.05 unlessotherwise indicated.
RESULTS AND DISCUSSION
Milk Yield and Milk Secretion Rate
Breed and period affected (P < 0.001) milk volume,with the Manchega ewes producing less milk than La-caune ewes (averaged across all intervals, 0.53 vs. 1.23L, respectively). Milk volume was also affected (P <0.001) by milking interval and accumulated linearly(P < 0.05) up to 24 h in both breeds (Figure 1). Milkaccumulation in the udder between milkings was de-scribed by the following equations (y = milk yield, mL;x = time after udder milking, h; average of both experi-mental periods):
Manchega: y = 37.5x (R2 = 0.98)
Lacaune: y = 86.6x (R2 = 0.99).
The linear pattern of milk accumulation accordingto milking interval obtained in Manchega and Lacauneewes agreed with earlier observations in other dairyewe breeds (McKusick et al., 2002) and dairy goats(Salama et al., 2004). Milk accumulation rate de-pended on the milk yield potential of the breed (P <0.001), being greater in Lacaune than in Manchega
Journal of Dairy Science Vol. 91 No. 7, 2008
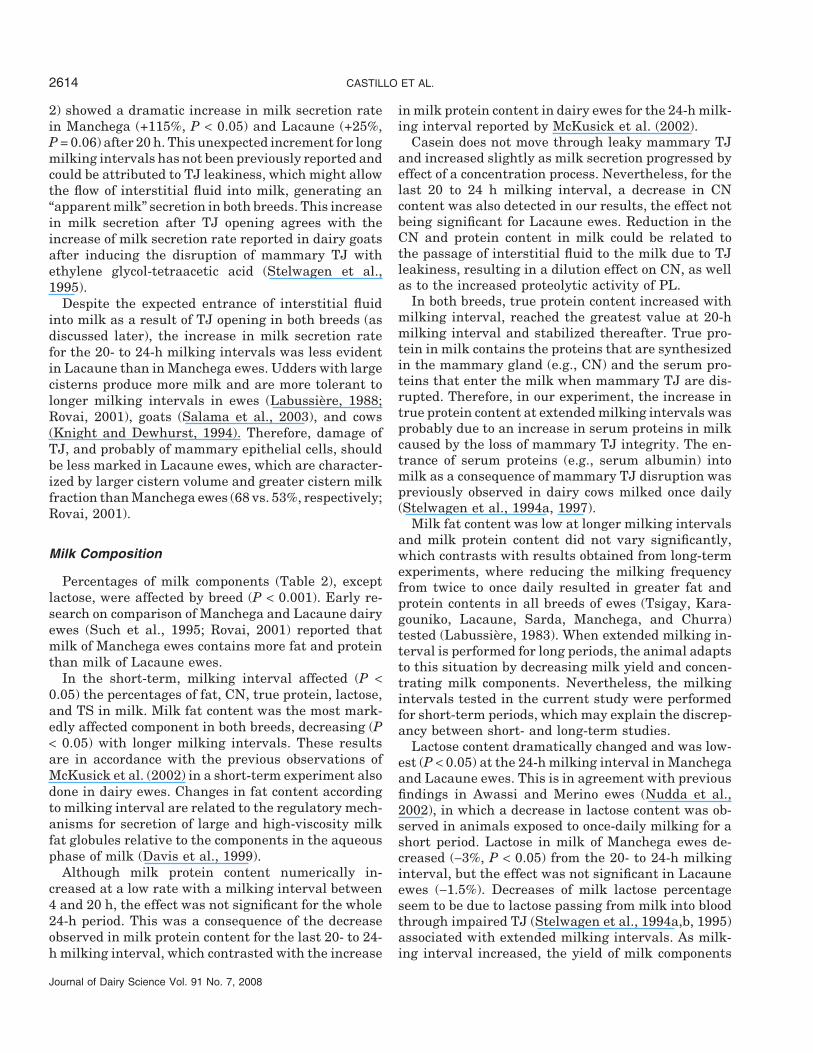
Figure 2. Milk secretion rates per milking interval in Manchega(�) and Lacaune (�) dairy ewes. Values are least squares means.a–cMeans within the same breed with different letters differ at P <0.05; vertical bars represent SEM.
ewes (87 vs. 38 mL/h; P < 0.05). In addition, the linearmilk accumulation was greater (P < 0.05) in wk 11than in wk 16 (Figure 1), showing that milk secretionrate decreased throughout lactation. In both breeds,the milk accumulation rate reached the greatest valuewith the 8-h milking interval and the lowest at the20- to 24-h interval (data not shown), indicating a se-cretion rate saturation effect with time, as reportedin dairy ewes (McKusick et al., 2002), goats (Salamaet al., 2003), and cows (Knight et al., 1994; Ayadi etal., 2003a). The reduction of milk accumulation rate,after reaching the maximum value, was more marked(P < 0.05) in Manchega than in Lacaune ewes (−20%and −11%, respectively, from the 8- to 20-h milkinginterval), suggesting that Lacaune ewes tolerate ex-tended milking intervals better than Manchega ewes.
Milk secretion rate reached the greatest values inthe 4- to 8-h milking interval (Manchega, 51 mL/h;Lacaune, 112 mL/h) and decreased as time after milk-ing increased (Figure 2). The lowest milk secretionvalues (Manchega, 27 mL/h; Lacaune, 73 mL/h) wereobtained in the 16- to 20-h milking interval.
Extended milking intervals in the present experi-ment were conducted in the short term, so reductionof milk secretion rate might be due to changes in TJpermeability (Stelwagen et al., 1995) and incrementsof intraalveolar pressure (Davis et al., 1999) or to theincrease in the concentration of the putative feedbackinhibitor of lactation in the mammary gland (Wilde etal., 1995) recently identified as serotonin (Hernandezet al., 2008).
Although lower milk secretion rates were expectedfor the 20- to 24-h milking interval, our results (Figure
CASTILLO ET AL.2614
2) showed a dramatic increase in milk secretion ratein Manchega (+115%, P < 0.05) and Lacaune (+25%,P = 0.06) after 20 h. This unexpected increment for longmilking intervals has not been previously reported andcould be attributed to TJ leakiness, which might allowthe flow of interstitial fluid into milk, generating an“apparent milk” secretion in both breeds. This increasein milk secretion after TJ opening agrees with theincrease of milk secretion rate reported in dairy goatsafter inducing the disruption of mammary TJ withethylene glycol-tetraacetic acid (Stelwagen et al.,1995).
Despite the expected entrance of interstitial fluidinto milk as a result of TJ opening in both breeds (asdiscussed later), the increase in milk secretion ratefor the 20- to 24-h milking intervals was less evidentin Lacaune than in Manchega ewes. Udders with largecisterns produce more milk and are more tolerant tolonger milking intervals in ewes (Labussiere, 1988;Rovai, 2001), goats (Salama et al., 2003), and cows(Knight and Dewhurst, 1994). Therefore, damage ofTJ, and probably of mammary epithelial cells, shouldbe less marked in Lacaune ewes, which are character-ized by larger cistern volume and greater cistern milkfraction than Manchega ewes (68 vs. 53%, respectively;Rovai, 2001).
Milk Composition
Percentages of milk components (Table 2), exceptlactose, were affected by breed (P < 0.001). Early re-search on comparison of Manchega and Lacaune dairyewes (Such et al., 1995; Rovai, 2001) reported thatmilk of Manchega ewes contains more fat and proteinthan milk of Lacaune ewes.
In the short-term, milking interval affected (P <0.05) the percentages of fat, CN, true protein, lactose,and TS in milk. Milk fat content was the most mark-edly affected component in both breeds, decreasing (P< 0.05) with longer milking intervals. These resultsare in accordance with the previous observations ofMcKusick et al. (2002) in a short-term experiment alsodone in dairy ewes. Changes in fat content accordingto milking interval are related to the regulatory mech-anisms for secretion of large and high-viscosity milkfat globules relative to the components in the aqueousphase of milk (Davis et al., 1999).
Although milk protein content numerically in-creased at a low rate with a milking interval between4 and 20 h, the effect was not significant for the whole24-h period. This was a consequence of the decreaseobserved in milk protein content for the last 20- to 24-h milking interval, which contrasted with the increase
Journal of Dairy Science Vol. 91 No. 7, 2008
in milk protein content in dairy ewes for the 24-h milk-ing interval reported by McKusick et al. (2002).
Casein does not move through leaky mammary TJand increased slightly as milk secretion progressed byeffect of a concentration process. Nevertheless, for thelast 20 to 24 h milking interval, a decrease in CNcontent was also detected in our results, the effect notbeing significant for Lacaune ewes. Reduction in theCN and protein content in milk could be related tothe passage of interstitial fluid to the milk due to TJleakiness, resulting in a dilution effect on CN, as wellas to the increased proteolytic activity of PL.
In both breeds, true protein content increased withmilking interval, reached the greatest value at 20-hmilking interval and stabilized thereafter. True pro-tein in milk contains the proteins that are synthesizedin the mammary gland (e.g., CN) and the serum pro-teins that enter the milk when mammary TJ are dis-rupted. Therefore, in our experiment, the increase intrue protein content at extended milking intervals wasprobably due to an increase in serum proteins in milkcaused by the loss of mammary TJ integrity. The en-trance of serum proteins (e.g., serum albumin) intomilk as a consequence of mammary TJ disruption waspreviously observed in dairy cows milked once daily(Stelwagen et al., 1994a, 1997).
Milk fat content was low at longer milking intervalsand milk protein content did not vary significantly,which contrasts with results obtained from long-termexperiments, where reducing the milking frequencyfrom twice to once daily resulted in greater fat andprotein contents in all breeds of ewes (Tsigay, Kara-gouniko, Lacaune, Sarda, Manchega, and Churra)tested (Labussiere, 1983). When extended milking in-terval is performed for long periods, the animal adaptsto this situation by decreasing milk yield and concen-trating milk components. Nevertheless, the milkingintervals tested in the current study were performedfor short-term periods, which may explain the discrep-ancy between short- and long-term studies.
Lactose content dramatically changed and was low-est (P < 0.05) at the 24-h milking interval in Manchegaand Lacaune ewes. This is in agreement with previousfindings in Awassi and Merino ewes (Nudda et al.,2002), in which a decrease in lactose content was ob-served in animals exposed to once-daily milking for ashort period. Lactose in milk of Manchega ewes de-creased (−3%, P < 0.05) from the 20- to 24-h milkinginterval, but the effect was not significant in Lacauneewes (−1.5%). Decreases of milk lactose percentageseem to be due to lactose passing from milk into bloodthrough impaired TJ (Stelwagen et al., 1994a,b, 1995)associated with extended milking intervals. As milk-ing interval increased, the yield of milk components
MILKING INTERVAL EFFECTS ON MILK COMPOSITION OF SHEEP 2615
Table 2. Short-term effects of milking interval on milk volume and milk composition in Manchega andLacaune dairy breed ewes1
Milking interval (h)
Item 4 8 12 16 20 24 SEM
Milk volume, mLManchega 157f,x 344e,x 484d,x 609c,x 701b,x 904a,x 66Lacaune 345f,y 761e,y 1,098d,y 1,436c,y 1,712b,y 2,012a,y 66
Milk composition, %Fat
Manchega 8.52a,x 8.22ab,x 8.01ab,x 7.94bc,x 7.58c,x 6.97d,x 0.23Lacaune 7.50a,y 6.70b,y 6.61b,y 6.41b,y 6.30b,y 5.86c,y 0.22
ProteinManchega 6.07x 6.26x 6.32x 6.36x 6.48x 6.24x 0.11Lacaune 5.68y 5.59y 5.68y 5.68y 5.73y 5.59y 0.11
CaseinManchega 4.54c,x 4.78b,x 4.87ab,x 4.90ab,x 5.02a,x 4.81b,x 0.09Lacaune 4.31y 4.30y 4.38y 4.36y 4.40y 4.26y 0.09
True proteinManchega 5.58c,x 5.79bc,x 5.84b,x 5.87ab,x 6.04a,x 6.02ab,x 0.12Lacaune 5.24abc,y 5.07c,y 5.37ab,y 5.28b,y 5.47a,y 5.32ab,y 0.11
LactoseManchega 4.72ab 4.76ab 4.77a 4.83a 4.81a 4.68b 0.19Lacaune 4.82a 4.74ab 4.76ab 4.72ab 4.75ab 4.68b 0.26
Total solidsManchega 21.5a,x 20.5ab,x 20.0b,x 20.1b,x 19.6bc,x 18.9c,x 0.45Lacaune 18.9a,y 17.6b,y 17.6b,y 17.6b,y 17.6b,y 17.1b,y 0.43
SCC, log10 cells/mLManchega 5.14b 5.53a 5.35b 5.39ab 5.32b 5.23b 0.10Lacaune 5.05b 5.26a 5.28a 5.13ab 5.15ab 5.08b 0.10
a–fMeans with different superscripts within a row differ (P < 0.05).x,yMeans with different superscripts within a column for each item differ (P < 0.05).1Values are least squares means.
increased significantly in both breeds in accordancewith the increase in milk yield (data not shown).
Milk SCC was similar (P > 0.10) between ewes ofboth breeds, which showed a very low level of SCC atall milking intervals tested (211 and 144 × 103 cells/mL on average, respectively), indicating that sheepudders were healthy and were not affected by differentmilking intervals in a short period. Nevertheless, milkSCC values (Table 2) varied slightly (P < 0.001) withmilking interval. The greatest logSCC in milk wasobserved at 8-h milking interval in Manchega and at8 to 12 h in Lacaune, probably due to a concentrationeffect. Our results are in agreement with other studiesconducted in dairy ewes (McKusick et al., 2002) anddairy goats (Salama et al., 2003), where milk obtainedat short milking intervals had slightly greaterlogSCC values.
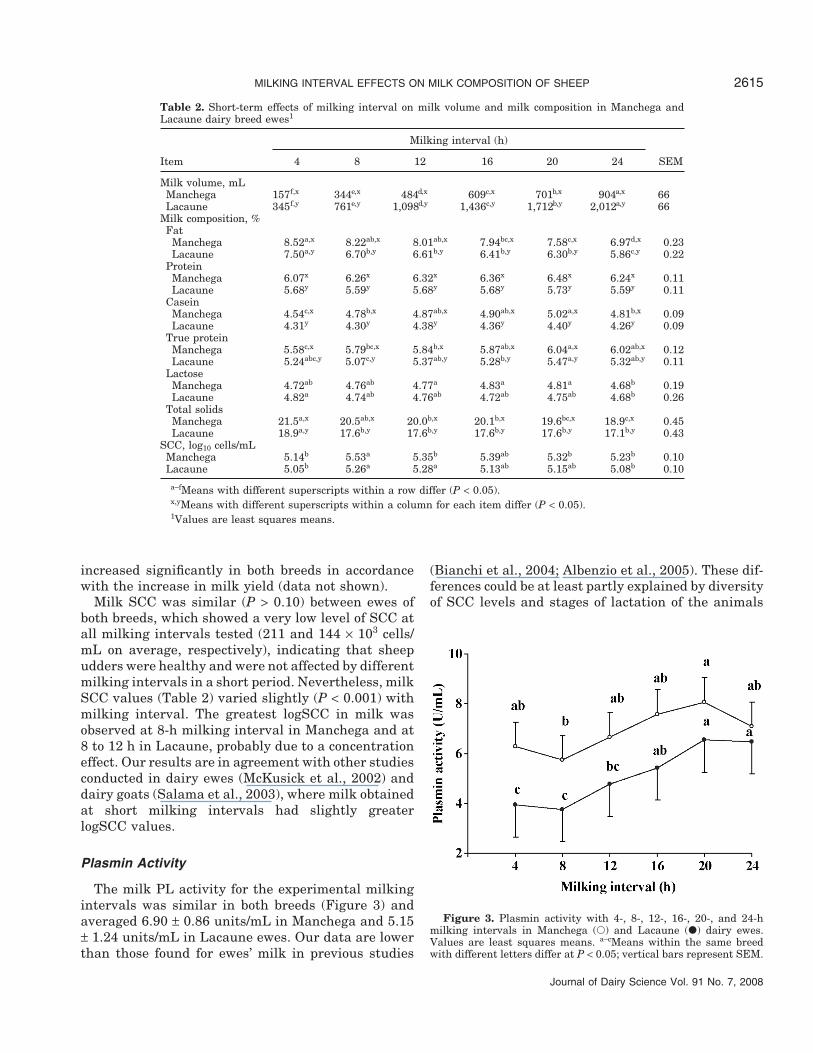
Plasmin Activity
The milk PL activity for the experimental milkingintervals was similar in both breeds (Figure 3) andaveraged 6.90 ± 0.86 units/mL in Manchega and 5.15± 1.24 units/mL in Lacaune ewes. Our data are lowerthan those found for ewes’ milk in previous studies
Journal of Dairy Science Vol. 91 No. 7, 2008
(Bianchi et al., 2004; Albenzio et al., 2005). These dif-ferences could be at least partly explained by diversityof SCC levels and stages of lactation of the animals
Figure 3. Plasmin activity with 4-, 8-, 12-, 16-, 20-, and 24-hmilking intervals in Manchega (�) and Lacaune (�) dairy ewes.Values are least squares means. a–cMeans within the same breedwith different letters differ at P < 0.05; vertical bars represent SEM.

CASTILLO ET AL.2616
used in each experiment, because PL activity in ewes’milk was reported to be markedly affected by SCC andstage of lactation (Albenzio et al., 2004, 2005; Bianchiet al., 2004).
Milking interval affected (P < 0.05) PL activity inthe milk of both breeds, which is in agreement withresults shown in dairy cows by Stelwagen et al. (1994c)and Kelly et al. (1998), where the increase of milkinginterval increased PL activity. However, Klei et al.(1997) and O’Brien et al. (2002) did not find significanteffects of different milking frequencies on PL concen-trations in dairy cows.
In our case, PL activity increased with milking inter-val up to 20 h for both ewe breeds and stabilized there-after. The PL activity may be augmented either byincreasing leakage from blood or by conversion of plas-minogen from blood to plasmin in milk (Politis et al.,1989). It appears likely that, in our study, the increasein PL activity was the result of an enhanced influx ofenzyme from the blood to the milk across damaged TJ,when extended milking intervals were performed (seediscussion below).
A low and negative correlation between milk yieldand PL activity (r = −0.18; P < 0.05) was observed.This may be related to the fact that ewes with greatermilk yield usually have larger cisterns and are moretolerant to longer milking intervals (Labussiere, 1988;Rovai, 2001). Therefore, it is possible that they do notsuffer a high TJ leakiness and consequently, the plas-minogen and PL entrance from the blood into the milkin large-cisterned ewes is less marked than in eweswith smaller cisterns.
On the contrary, positive correlations were observedbetween PL and SCC (r = 0.39; P < 0.001) in agreementwith previous findings in sheep (Albenzio et al., 2004),bovine (Politis et al., 1989; Baldi et al., 1996), and goatmilk (Fantuz et al., 2001). Milk protein (r = 0.40; P <0.001), CN (r = 0.37; P < 0.001), and true protein (r =0.40; P < 0.001) contents also correlated positively withPL activity. It is well known that plasminogen andplasminogen activators are associated with CN mi-celles (Richardson, 1983). Thus, it may be hypothe-sized that the greater the CN content, the greater theamount of plasminogen activator that remains boundinto the micelles and converts the plasminogen to PL(Albenzio et al., 2004).
TJ Permeability
Results described above suggest the impairment ofTJ as one of the main causes of variations in milksecretion rate and milk composition when extendedmilking intervals are performed. To confirm this hy-pothesis, lactose concentration in plasma and mineral
Journal of Dairy Science Vol. 91 No. 7, 2008
concentration (Na and K) in milk were used as indica-tors of the state of TJ (Table 3 and Figure 4) as indi-cated by Stelwagen et al. (1994a,b).
Lactose in plasma was considered the main indicatorof mammary TJ permeability in the present study be-cause changes in Na and K concentrations may simplyreflect an alteration in the transport of theseions across transcellular rather than paracellularpathways.
Our results did not show interbreed differences inlactose concentration in plasma (11.9 ± 6.3 �mol/L onaverage; P = 0.35) because of the high variability oflactose analyses. Stage of lactation tended to affect (P =0.07) the concentration of lactose in plasma. Averageconcentration of lactose at wk 11 (15.7 ± 5.3 �mol/L)tended to be greater than at wk 16 (8.1 ± 5.3 �mol/L).Udder distension was greater in the first experimentalperiod than in the second one because of the greatermilk production. This fact seemed to favor the TJ im-pairment during this period.
Milking interval affected (P < 0.01) lactose concen-tration in plasma (Figure 4). In both breeds the concen-tration of lactose in plasma was somewhat steady until20 h, when it dramatically increased. In the 20- to 24-h interval, plasma lactose in Manchega increased by5-fold (5.2 to 26.7 �mol/L; P < 0.01), whereas in La-caune it increased by only 1.5-fold (19.1 to 27.8 �mol/L; P = 0.28), indicating that the TJ leakiness effectwas greater in Manchega than in Lacaune ewes. Ourresults showed that TJ became disrupted after 20 hof udder filling in dairy ewes, but this effect was moremarked in Manchega ewes. No previous data are avail-able on the timing of TJ opening during extended milk-ing intervals in dairy ewes.
In previous studies, TJ were leaky after 20 h in dairygoats (Stelwagen et al., 1994b), whereas TJ were leakyearlier (18 h) in dairy cows (Stelwagen et al., 1997),in accordance with the lower cisternal capacity in dairycows compared with goats.
Ewe breed affected (P < 0.01) Na and K concentrationin milk (Table 3). Manchega showed, on average,greater Na concentration (21.0 ± 1.2 vs. 16.6 ± 1.2mmol/L; P < 0.01) and lower K concentration (29.7 ±0.8 vs. 35.0 ± 0.8 mmol/L; P < 0.001) than Lacauneewes. Interaction of breed × milking interval was sig-nificant (P < 0.05) for Na concentration and Na:K ratio.The Na concentration in milk for Manchega ewes wassteady until 20 h and increased markedly thereafter(Table 3). Milking interval did not modify Na contentin milk for Lacaune ewes. Only slight changes wereobserved for K values in milk of Manchega, obtainingthe lowest value with a 24-h interval in Manchega. Nochanges were observed for Lacaune ewes. Moreover,a greater Na:K ratio in the milk was observed at ex-

MILKING INTERVAL EFFECTS ON MILK COMPOSITION OF SHEEP 2617
Table 3. Effect of different milking intervals (4, 8, 12, 16, 20, and 24 h) on the concentration of Na, K andthe Na to K ratio in the milk of Manchega and Lacaune breeds1
Milking interval (h)
Item 4 8 12 16 20 24 SEM
Na, mmol/LManchega 19.47c 19.86c 19.91c 20.88c 22.18b 23.73a 1.23Lacaune 16.85 16.01 16.23 17.06 16.62 16.75 1.23
K, mmol/LManchega 28.79bc 30.90a 30.90a 29.08bc 30.35ab 28.41c 0.97Lacaune 33.14 35.30 35.39 35.53 35.36 34.70 0.97
Na:KManchega 0.70bc 0.65c 0.66c 0.76b 0.76b 0.86a 0.05Lacaune 0.52 0.46 0.46 0.49 0.49 0.50 0.05
a–cMeans with different superscripts within row differ (P < 0.05).1Values are least squares means.
tended milking intervals in Manchega ewes, whereasin Lacaune this ratio was constant (Table 3). The Naand K balance between alveolar and blood compart-ments is controlled by TJ. Therefore, an increase inNa concentration and Na:K ratio in milk of Manchegashould be a consequence of TJ opening at extendedmilking intervals, in accordance with the increasedplasma lactose values observed (Figure 4). To ourknowledge, this finding has not been reported beforein dairy sheep. Despite the TJ leakiness after 20 h inLacaune ewes (Figure 4), no changes in Na and Kconcentrations were detected at extended milking in-tervals. The degree of TJ leakiness in Lacaune eweswas not sufficient to induce significant changes in iontransport from blood to milk and vice versa. Thegreater Na:K ratio in the milk from udders milked lessfrequently in Manchega breed in our study agreed with
Figure 4. Plasma lactose concentrations obtained 4, 8, 12, 16, 20,and 24 h after the last milking. Values are least squares means ±SEM for 8 dairy ewes of Manchega (n = 4; �) and Lacaune (n = 4;�) breed. a,bMeans within the same breed with different letters differat P < 0.05; vertical bars represent SEM.
Journal of Dairy Science Vol. 91 No. 7, 2008
previous reports in dairy goats (Stelwagen et al.,1994b, 1997) and in dairy cows (Lacy-Hulbert et al.,1999).
Stelwagen et al. (1999) showed that the adverse ef-fects of Na variations on milk secretion were not due toa high intracellular concentration of Na per se. Thus,either an increase or a reduction in the Na:K ratiowas related to a low milk secretion. Therefore, in ourexperiment, the increase of the Na:K ratio after the16-h milking interval in Manchega ewes could alsoexplain the decrease of milk secretion rate observedat 20 h of udder filling (Figure 2). Furthermore, thefact that variations in ion concentration were only sig-nificant in the Manchega ewe milk allow us to suggestthat udders of Manchega ewes had a lower capacityfor adaptation to extended milking intervals andgreater TJ leakiness compared with Lacaune ewes.
CONCLUSIONS
Manchega and Lacaune dairy ewes were able to tol-erate extended milking intervals during short-termexperiments, maintaining linear increases of milk pro-duction up to 24 h of udder filling with no negativeeffects on udder health. However, milk secretion rateand milk composition varied in extended milking in-tervals, especially in the case of milk fat and milklactose, partly as a consequence of paracellular leak-age across the mammary epithelium. Furthermore,the present experiment demonstrates that TJ disrup-tion occurs in dairy sheep after 20 h of milk accumula-tion, as reported earlier in goats. However, degree ofTJ leakiness differed according to breed, being morepronounced in Manchega (small udder cisterns) thanin Lacaune ewes (large udder cisterns). Dairy ewesmay be able to support 20 h of udder filling withoutnegative effects on milk yield or milk composition,making possible the use of once-a-day or occasional

CASTILLO ET AL.2618
milking omission schedules. Nevertheless, furtherlong-term studies are required.
ACKNOWLEDGMENTS
This work is part of a CICYT research project(AGL2002–03472) of the Spanish Ministry of Scienceand Technology. The authors are grateful to RamonCosta and the team of the SGCE (Servei de Grangesi Camps Experimentals) of the Universitat Autonomade Barcelona for the care of the animals and to NicAldam for the English revision of the manuscript.
REFERENCES
Albanell, E., P. Caceres, G. Caja, E. Molina, and A. Gargouri. 1999.Determination of fat, protein, and total solids in ovine milk bynear-infrared spectroscopy. J. AOAC Int. 82:753–758.
Albenzio, M., M. Caroprese, A. Santillo, R. Marino, A. Muscio, andA. Sevi. 2005. Proteolytic patterns and plasmin activity in ewes’milk as affected by somatic cell count and stage of lactation. J.Dairy Res. 72:86–92.
Albenzio, M., M. Caroprese, A. Santillo, R. Marino, L. Taibi, and A.Sevi. 2004. Effects of somatic cell count and stage of lactationon the plasmin activity and cheese-making properties of ewemilk. J. Dairy Sci. 87:533–542.
Ayadi, M., G. Caja, X. Such, and C. H. Knight. 2003a. Use of ultraso-nography to estimate cistern size and milk storage at differentmilking intervals in the udder of dairy cows. J. Dairy Res. 70:1–7.
Ayadi, M., G. Caja, X. Such, and C. H. Knight. 2003b. Effect ofomitting one milking weekly on lactational performances andmorphological udder changes in dairy cows. J. Dairy Sci.86:2352–2358.
Baldi, A., G. Savoini, F. Cheli, F. Fantuz, E. Senatore, L. Bertocchi,and I. Politis. 1996. Changes in plasmin-plasminogen-plasmino-gen activator system in milk from Italian friesian herds. Int.Dairy J. 6:1045–1053.
Bastian, E. D., and R. J. Brown. 1996. Plasmin in milk and dairyproducts: An update. Int. Dairy J. 6:435–457.
Bianchi, L., A. Bolla, E. Budelli, A. Caroli, C. Casoli, M. Pauselli,and E. Duranti. 2004. Effect of udder health status and lactationphase on the characteristics of Sardinian ewe milk. J. Dairy Sci.87:2401–2408.
Davis, S. R., V. C. Farr, and K. Stelwagen. 1999. Regulation of yieldloss and milk composition during once-daily milking: A review.Livest. Prod. Sci. 59:77–94.
Dubeuf, J. P., and J. C. Le Jaouen. 2005. The sheep and goat dairysectors in the European Union: Present situation and stakes forthe future. Pages 1–6 in Special Issue of the International DairyFederation 0501/Part 1. Future of the sheep and goats dairysectors. Zaragoza, Spain.
Fantuz, F., F. Polidori, F. Cheli, and A. Baldi. 2001. Plasminogenactivation system in goat milk and its relation with compositionand coagulation properties. J. Dairy Sci. 84:1786–1790.
Hernandez, L. L., C. M. Stiening, J. B. Wheelock, L.H. Baumgard,A. M. Parkhurst, and R. J. Collier. 2008. Evaluation of serotoninas a feedback inhibitor of lactation in the bovine. J. Dairy Sci.91:1834–1844.
Kelly, A. L., S. Reid, P. Joyce, W. J. Meaney, and J. Foley. 1998.Effect of decreased milking frequency of cows in late lactation onmilk somatic cell count, polymorphonuclear leucocyte numbers,composition and proteolytic activity. J. Dairy Res. 65:365–373.
Klei, L. R., J. M. Lynch, D. M. Barbano, P. A. Oltenacu, A. J. Lednor,and D. K. Bandler. 1997. Influence of milking three times a dayon milk quality. J. Dairy Sci. 80:427–436.
Knight, C. H., and R. J. Dewhurst. 1994. Once daily milking of dairycows: Relationship between yield loss and cisternal milk storage.J. Dairy Res. 61:441–449.
Journal of Dairy Science Vol. 91 No. 7, 2008
Knight, C. H., D. Hirst, and R. J. Dewhurst. 1994. Milk accumulationand distribution in the bovine udder during the interval betweenmilkings. J. Dairy Res. 61:167–177.
Kuhn, N., and J. L. Linzell. 1970. Measurement of the quantity oflactose passing into mammary venous plasma and lymph ingoats and in a cow. J. Dairy Res. 37:203–208.
Labussiere, J. 1983. Projet d’etude des caracteristiques de traitedes differentes races de brebis laitieres exploitees dans de bassinmediterraneen. III Symposium Internacional de ordeno meca-nico de pequenos rumiantes, Valladolid, 730–768.
Labussiere, J. 1988. Review of physiological and anatomical factorsinfluencing the milking ability of ewes and the organization ofmilking. Livest. Prod. Sci. 18:253–274.
Lacy-Hulbert, S. J., M. W. Woolford, G. D. Nicholas, C. G. Prosser,and K. Stelwagen. 1999. Effect of milking frequency and pastureintake on milk yield and composition of late lactation cows. J.Dairy Sci. 82:1232–1239.
Marnet, P. G., and B. C. McKusick. 2001. Regulation of milk ejectionand milkability in small ruminants. Livest. Prod. Sci. 70:125–133.
McKusick, B. C., D. L. Thomas, Y. M. Berger, and P. G. Marnet.2002. Effect of milking interval on alveolar versus cisternal milkaccumulation and milk production and composition in dairyewes. J. Dairy Sci. 85:2197–2206.
Mills, O. 2004. Sheep husbandry. Milking management. Pages2507–2517 in Encyclopedia of Dairy Sciences. H. Roginski, ed.Academic Press, Amsterdam, the Netherlands.
Morag, M. 1968. The effect of varying the daily milking frequencyon the milk yield of the ewe and evidence on the nature of theinhibition of milk ejection by half-udder milking. Ann. Zootech.17:351–369.
Negrao, J. A., P. G. Marnet, and J. Labussiere. 2001. Effect of milk-ing frequency on oxytocin release and milk production in dairyewes. Small Rumin. Res. 39:181–187.
Nudda, A., R. Bencini, S. Mijatovic, and G. Pulina. 2002. The yieldand composition of milk in Sarda, Awassi, and Merino sheepmilked unilaterally at different frequencies. J. Dairy Sci.85:2879–2884.
O’Brien, B., G. Ryan, W. J. Meaney, D. McDonagh, and A. Kelly.2002. Effect of frequency of milking on yield, composition andprocessing quality of milk. J. Dairy Res. 69:367–374.
Politis, I., E. Lachance, E. Block, and J. D. Turner. 1989. Plasminand plasminogen in bovine milk: A relationship with involution?J. Dairy Sci. 72:900–906.
Richardson, B. C. 1983. The proteinases of bovine milk and the effectof pasteurization on their activity. N.Z. J. Dairy Sci. Technol.18:233–245.
Rovai, M. 2001. Caracteres morfologicos y fisiologicos que afectanla aptitud al ordeno mecanico en ovejas de raza Manchega yLacaune. Doctoral thesis. Universidad Autonoma de Barce-lona, Spain.
Salama, A. A. K., G. Caja, X. Such, S. Peris, A. Sorensen, and C.H. Knight. 2004. Changes in cisternal udder compartment in-duced by milking interval in dairy goats milked once or twicedaily. J. Dairy Sci. 87:1181–1187.
Salama, A. A. K., X. Such, G. Caja, M. Rovai, R. Casals, E. Albanell,M. P. Marın, and A. Martı. 2003. Effects of once versus twicedaily milking throughout lactation on milk yield and milk compo-sition in dairy goats. J. Dairy Sci. 86:1673–1680.
Stelwagen, K., S. R. Davis, V. C. Farr, and S. J. Eichler. 1994a.Effect of once daily milking and concurrent somatotropin onmammary tight junction permeability and yield of cows. J. DairySci. 77:2994–3001.
Stelwagen, K., S. R. Davis, V. C. Farr, C. G. Prosser, and R. A.Sherlock. 1994b. Mammary epithelial cell tight junction integ-rity and mammary blood flow during an extended milking inter-val in goats. J. Dairy Sci. 77:426–432.
Stelwagen, K., V. C. Farr, S. R. Davis, and C. G. Prosser. 1995.EGTA-induced disruption of epithelial cell tight junctions in thelactating caprine mammary gland. Am. J. Physiol. 269:R848–R855.

MILKING INTERVAL EFFECTS ON MILK COMPOSITION OF SHEEP 2619
Stelwagen, K., V. C. Farr, and H. A. McFadden. 1999. Alterationof the sodium to potassium ratio in milk and effect on milksecretion in goats. J. Dairy Sci. 88:52–59.
Stelwagen, K., V. C. Farr, H. A. McFadden, C. G. Prosser, andS. R. Davis. 1997. Time course of milk accumulation-inducedopening of mammary tight junctions and blood clearance of milkcomponents. Am. J. Physiol. 273:R379–R386.
Stelwagen, K., R. D. McLaren, S. A. Turner, H. A. McFadden, andC. G. Prosser. 1998. No evidence for basolateral secretion of milkprotein in the mammary gland of lactating goats. J. Dairy Sci.81:434–437.
Journal of Dairy Science Vol. 91 No. 7, 2008
Stelwagen, K., I. Politis, J. H. White, B. Zavizion, C. G. Prosser, S.R. Davis, and V. C. Farr. 1994c. Effect of milking frequency andsomatotropin on the activity of plasminogen activator, plasmino-gen, and plasmin in bovine milk. J. Dairy Sci. 77:3577–3583.
Such, X., G. Caja, L. Perez, and S. Peris. 1995. Primeros resultadosde la comparacion de la aptitud al ordeno mecanico de ovejasLacaune y Manchega: 1. Estudio del fraccionamiento de lechey la morfologıa mamaria. ITEA Prod. Anim. 16:708–710.
Wilde, C. J., C. V. P. Addey, L. M. Boddy, and M. Peaker. 1995.Autocrine regulation of milk secretion by a protein in milk. Bio-chem. J. 305:51–58.
Copyright © 2022 FDOKUMEN