Modelling the adoption of automatic milking systems in Noord-Holland
18
ISSN 2280-6180 (print) © Firenze University Press ISSN 2280-6172 (online) www.fupress.com/bae Bio-based and Applied Economics 2(1): 73-90, 2013 Modelling the adoption of automatic milking systems in Noord-Holland MATTEO FLORIDI 1 , FABIO BARTOLINI 2, *, JACK PEERLINGS 3 , NICO POLMAN 4 , DAVIDE VIAGGI 1 1 Department of Agricultural Science, University of Bologna 2 Department of Agriculture, Food and Agri-environmental, University of Pisa 3 Agricultural Economics and Rural Policy Group, Wageningen University 4 Regional Economy & Land Use Group, LEI Wageningen University Abstract. Innovation and new technology adoption represent two central elements for the business and industry development process in agriculture. One of the most rel- evant innovations in dairy farms is the robotisation of the milking process through the adoption of Automatic Milking Systems (AMS). e purpose of this paper is to assess the impact of selected Common Agricultural Policy measures on the adoption of AMS in dairy farms. e model developed is a dynamic farm-household model that is able to simulate the adoption of AMS taking into account the allocation of productive factors between on-farm and off-farm activ- ities. e model simulates the decision to replace a traditional milking system with AMS using a Real Options approach that allows farmers to choose the optimal timing of investments. Results show that the adoption of AMS, and the timing of such a decision, is stron- gly affected by policy uncertainty and market conditions. e effect of this uncertainty is to postpone the decision to adopt the new technology until farmers have gathered enough information to reduce the negative effects of the technological lock-in. AMS adoption results in an increase in farm size and herd size due to the reduction in the labour required for milking operations. Keywords. real options; dairy livestock; automatic milking systems; investment; uncertainty; Common Agricultural Policy JEL Codes. Q18, Q12, Q16 1. Introduction and objectives Innovation and new technology adoption are two central elements in the continuity of enterprises and industries. Generally, innovation is an important driver of economic growth and rural development. Research, innovation adoption and diffusion play a central role in meeting the 2020 EU challenges (European Commission, 2010) and are a key part of the Common Agricultural Policy (CAP) reform process. In particular, within post 2013 * Corresponding author: [email protected].
Transcript of Modelling the adoption of automatic milking systems in Noord-Holland
ISSN 2280-6180 (print) © Firenze University Press ISSN 2280-6172 (online) www.fupress.com/bae
Bio-based and Applied Economics 2(1): 73-90, 2013
Modelling the adoption of automatic milking systems in Noord-Holland
Matteo Floridi1, Fabio bartolini2,*, Jack Peerlings3, nico PolMan4, davide viaggi1
1 Department of Agricultural Science, University of Bologna2 Department of Agriculture, Food and Agri-environmental, University of Pisa3 Agricultural Economics and Rural Policy Group, Wageningen University4 Regional Economy & Land Use Group, LEI Wageningen University
Abstract. Innovation and new technology adoption represent two central elements for the business and industry development process in agriculture. One of the most rel-evant innovations in dairy farms is the robotisation of the milking process through the adoption of Automatic Milking Systems (AMS).The purpose of this paper is to assess the impact of selected Common Agricultural Policy measures on the adoption of AMS in dairy farms. The model developed is a dynamic farm-household model that is able to simulate the adoption of AMS taking into account the allocation of productive factors between on-farm and off-farm activ-ities. The model simulates the decision to replace a traditional milking system with AMS using a Real Options approach that allows farmers to choose the optimal timing of investments. Results show that the adoption of AMS, and the timing of such a decision, is stron-gly affected by policy uncertainty and market conditions. The effect of this uncertainty is to postpone the decision to adopt the new technology until farmers have gathered enough information to reduce the negative effects of the technological lock-in. AMS adoption results in an increase in farm size and herd size due to the reduction in the labour required for milking operations.
Keywords. real options; dairy livestock; automatic milking systems; investment; uncertainty; Common Agricultural Policy
JEL Codes. Q18, Q12, Q16
1. Introduction and objectives
Innovation and new technology adoption are two central elements in the continuity of enterprises and industries. Generally, innovation is an important driver of economic growth and rural development. Research, innovation adoption and diffusion play a central role in meeting the 2020 EU challenges (European Commission, 2010) and are a key part of the Common Agricultural Policy (CAP) reform process. In particular, within post 2013
* Corresponding author: [email protected].
74 M. Floridi, F. Bartolini, J. Peerlings, N. Polman, D. Viaggi
CAP objectives, innovation is expected to contribute to the promotion of farm competive-ness as well as to the sustainable use of natural resources and the balanced development of the rural areas (European Commission, 2011a, 2011b).
The EU dairy sector is facing several challenges in the near future. The expected soft landing of the milk quota and the opening of the market will likely cause an increase in competition with respect to milk production and the need to reduce production costs. In addition, in recent years, milk prices have shown very large fluctuations (OECD-FAO, 2012), which imply uncertainty for investment choices. Finally, the reduction in house-hold labour availability and the need to reduce production costs have encouraged the adoption of labour-saving technologies (Sauer and Zilberman, 2012).
Automatic Milking Systems (AMS) that automate all the functions of the milking pro-cess provided by Conventional Milking Systems (CMS) are a labour saving technology in dairy farming. This new technology is considered to be one of the main innovations in the dairy sector (Meskens et al., 2001). By the end of year 2009 more than 8,000 dairy farms worldwide had adopted AMS (de Koning, 2010), and this number is rapidly increasing (Heikkila et al., 2012). The majority of the adopting farmers (90%) are located in the Northern Europe (Sauer and Zilberman, 2012). One of the areas with a high adoption rate is the Netherlands, where more than 10% of the farmers have already applied this technol-ogy (Steeneveld et al., 2012).
AMS became commercially available in the early 1990s. The technology was mostly developed in the Netherlands and was thought to be applied on large family dairy farms. In fact, AMS are a complete automation of the milking process and are composed of: a milking machine, laser sensors, robotic arms and gate systems for controlling cow access with the aim of saving labour allocated to the milking operation (Rotz et al., 2003).
AMS allow milking at any time of the day. As a result the milk yield increases about 10-15% on average (Steeneveld et al., 2012) by increasing the milking frequency from two to three times per day (Castro et al., 2012). AMS have the potential to significantly reduce the production costs or indeed to change the capital-labour ratio (Steeneveld et al., 2012). In fact, by replacing CMS with AMS, the estimated saving is 20 to 30% (Mathijs, 2004; Bijl, et al., 2010; Sauer and Zilbermann, 2012) of the labour allocated to the milking activities. Other authors have highlighted that there is no statistical difference in labour use between AMS and CMS but they have found differences in task and work flexibilities (Steeneveld et al., 2012). Recently, Steeneveld et al. (2012) quantified the capital cost of AMS at 12.71 € per 100 kg of milk instead of 10.10 € per 100 kg of milk for CMS.
The economic literature has highlighted the positive effect of the CAP in promoting the process of innovation and investment. Both direct payments and Rural Development Program (RDP) payments affect the decision to invest in agriculture, ensuring liquidity and reducing investments or participation costs (see for example: Sounding and Zilber-man, 2010; Bartolini et al., 2011). Recently Heikkila et al., (2012) found that increasing investment payments by 1% increases the probability to adopt robotics and automation in dairy farms by about 2%.
This paper seeks to assess the impact of alternative levels of subsidies in the form of co-financing of investments (measure 121 of RDP) on the adoption of AMS on dairy farms in the Netherlands, under uncertainty regarding labour costs, Single Farm Payment levels and milk price. Under measure 121, the Dutch RDP 2007-2013 provides investment
75Modelling the adoption of automatic milking systems in Noord-Holland
subsidies to farmers as high as 35-50% of investment costs, with milking machinery being one of the eligible investment categories (Regiebureau, 2012).
In order to achieve this objective, the paper uses a dynamic farm-household model which is able to simulate the timing of the adoption decision and how such a decision will affect the allocation of productive factors between on-farm and off-farm activities. The model implements a Real Options (RO) approach that represents the farmer’s choice about the optimal timing of investment, when investment is affected by uncertainty. The model is used to simulate the decision to replace a traditional milking system with AMS. The simulations consider uncertainty in labour costs, milk prices and the level of the Sin-gle Farm Payment (SFP) after 2013. In this paper the methodology presented by Was et al. (2011) was applied to the case study area of Noord-Holland, a province of the Neth-erlands. Unlike in the paper by Was et al. (2011) in this study AMS adoption is simulated in a very competitive region. These characteristics of the region affect the farm structure including off-farm allocations of household labour and hence the potential profitability of innovation adoption. Furthermore, also unlike Was et al. (2011) in this case the current policy framework (2009 Health Check) is considered, including SFP and cross-compliance, measures following from the Nitrate Directive and the abolishment of the milk quotas in 2015. The paper is structured as follows: section 2 we describe the conceptual framework; in section 3 we discuss the methodology and present the case study to which the empiri-cal methodology is applied. Section 4 provides a discussion of the results, and is followed by the conclusion.
2. Conceptual framework
The study of the adoption and diffusion of innovation plays a central role in the agri-cultural economics literature (Sauer and Zilberman, 2012). One of the first studies was conducted by Griliches (1957) who explained the diffusion of innovation by means of an imitation process. Earlier works on this issue described innovation diffusion as an S-shape function (Rogers, 1962), where the new technology is firstly introduced by a group of Innovators, then followed by Earlier Adopters, then by the Early and Late Majority, and finally by Laggards. Davis (1979) observed farm heterogeneities and differences in learn-ing and farm skills, and he applied a threshold model to explain pattern of innovation adoption and diffusion. Later, other studies applied models based on the Expected Utility function which added elements of risk attitude, size effects and human capital, and learn-ing effects as drivers of technology adoption (Sauer and Zilberman, 2012). A large body of literature has investigated the effect of risk attitudes when innovation decisions are affected by uncertainty in future variables (Just and Zilberman, 1983). Literature in this field has highlighted that technological progress contributes significantly to the reduction of farmers’ risk exposure and otherwise farmers’ risk attitude plays an important role in determining the adoption and diffusion of innovations (Kim and Chavas, 2003; Sauer and Zilberman, 2012). Other authors have considered uncertainty without assumptions about risk attitudes (or using risk neutral agents) developing the RO model (Dixit and Pindyck, 1994). The RO model allows to quantify the value of the option to delay investment deci-sions until further information about the state of nature (as well as market and other pric-es) has been collected or shown (Trigeorgis, 1988). The RO model, as differentiated from
76 M. Floridi, F. Bartolini, J. Peerlings, N. Polman, D. Viaggi
Capital Budgeting tools, allows to improve the analysis of investment decisions when the outcome is affected by irreversibility and uncertainty (Schwartz and Trigeorgis, 2004).
A growing body of literature has investigated the adoption of AMS on dairy farms. Generally speaking, the majority of the models are normative in nature (Steeneveld et al., 2012) and focus on measuring the profitability of the adoption (Hyde and Engel, 2002; Dijkhuizen et al., 1997; Rotz et al., 2003). Was et al. (2011), in applying a RO model to Pol-ish farmers, found that future conditions such as market prices and expectations about the CAP strongly affect the profitability of AMS adoption. Large farms with large herds have a higher expected profitability, hence higher probability to adopt AMS. Recently, Sauer and Zilberman (2012) highlighted the effect of a sequence of innovations connecting the expan-sion of the herd size to the adoption of the new technology. The Authors found that larger scale of milk production and larger herd size positively affects the AMS adoption, hence confirming that larger farms are likely to find the adoption of AMS more profitable.
This paper addresses the decision to adopt AMS using a RO approach. As highlighted by the literature, AMS adoption is strongly affected by uncertainty in relevant decision var-iables. Elements that determine uncertainty are mainly those classified with labour avail-ability and market conditions (cost of household labour allocated off-farm, agricultural output prices, and the cost of hired labour). Furthermore, they can be associated with vari-ables related to the financial management of the investment such as loan rates, loan acces-sibility, and the amount and certainty of SFPs and RDP payments. Under conditions of uncertainty and investment irreversibility the RO approach allows for the calculation of the Net Present Value (NPV) increment due to the option to delay the AMS investment until a later period, when the farmer has access to more information about the exogenous uncer-tain variables determining investment profitability (Sauer and Zilberman, 2010).
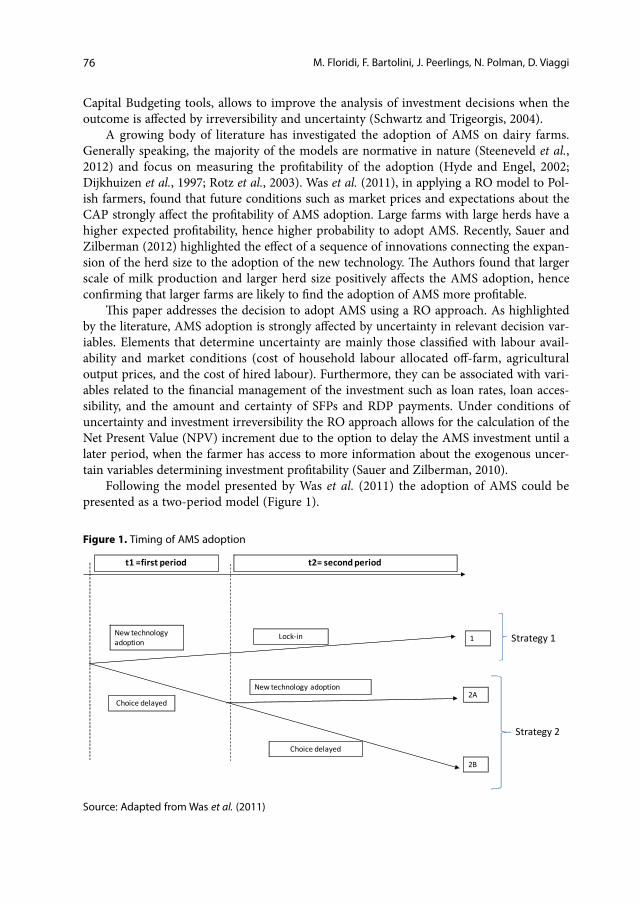
Following the model presented by Was et al. (2011) the adoption of AMS could be presented as a two-period model (Figure 1).
Figure 1. Timing of AMS adoption
New technology adoption
Choice delayed
Lock-in
t1 =first period t2= second period
New technology adoption
1
2A
2B
Choice delayed
Strategy 1
Strategy 2
Source: Adapted from Was et al. (2011)
77Modelling the adoption of automatic milking systems in Noord-Holland
We assume that a discrete choice about the decision to adopt a new technology can be undertaken in two separate periods: either the first or the second period. When a farmer invests during the first period he is locked-in by the investment in the second period (strat-egy 1), where the lock-in situation is a consequence of the high investment and sunk costs and by the irreversibility of the investment (Carruth et al., 2000). Otherwise, a farmer can delay the investment decision to period 2 when unknown future variables are revealed or he has obtained more information about the uncertain variables. Given the information obtained in period 2 the farmer can decide to invest in AMS in period 2 (strategy 2A). Otherwise, the farmer can choose to further delay the investment in AMS (strategy 2B).
In order to operationalise this modelling framework, we apply a model developed by Was et al. (2011) and modified by Bartolini and Viaggi (2012).
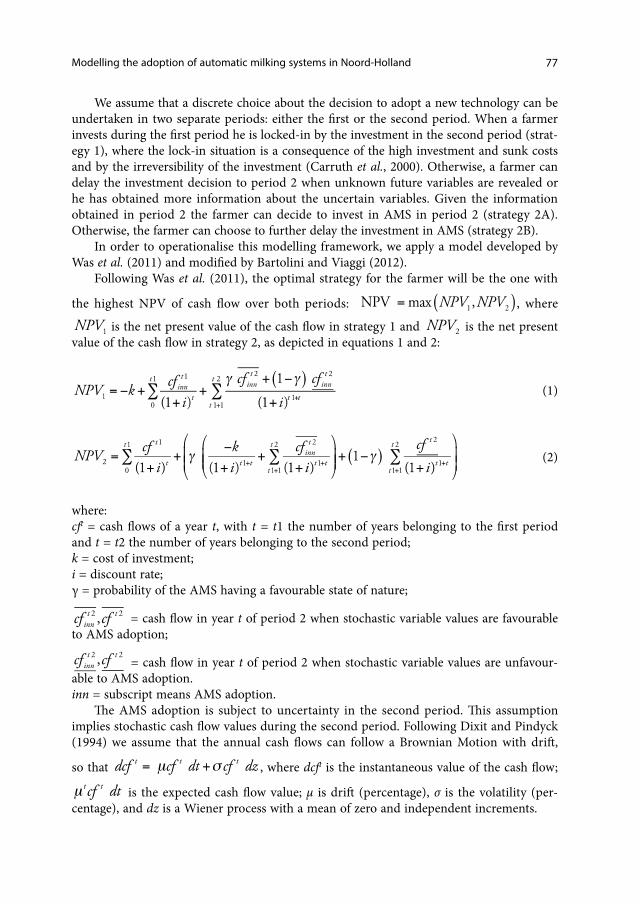
Following Was et al. (2011), the optimal strategy for the farmer will be the one with
the highest NPV of cash flow over both periods: , where
is the net present value of the cash flow in strategy 1 and is the net present value of the cash flow in strategy 2, as depicted in equations 1 and 2:
(1)
(2)
where:cft = cash flows of a year t, with t = t1 the number of years belonging to the first period and t = t2 the number of years belonging to the second period;k = cost of investment;i = discount rate;γ = probability of the AMS having a favourable state of nature;
= cash flow in year t of period 2 when stochastic variable values are favourable to AMS adoption;
= cash flow in year t of period 2 when stochastic variable values are unfavour-able to AMS adoption. inn = subscript means AMS adoption.
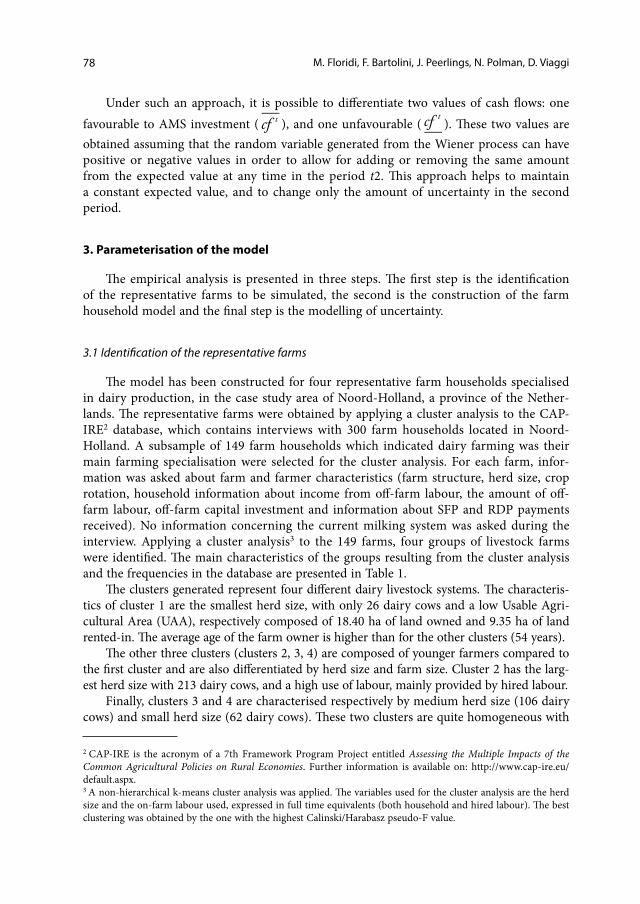
The AMS adoption is subject to uncertainty in the second period. This assumption implies stochastic cash flow values during the second period. Following Dixit and Pindyck (1994) we assume that the annual cash flows can follow a Brownian Motion with drift,
so that , where dcft is the instantaneous value of the cash flow;
is the expected cash flow value; μ is drift (percentage), σ is the volatility (per-centage), and dz is a Wiener process with a mean of zero and independent increments.
78 M. Floridi, F. Bartolini, J. Peerlings, N. Polman, D. Viaggi
Under such an approach, it is possible to differentiate two values of cash flows: one favourable to AMS investment ( ), and one unfavourable ( ). These two values are obtained assuming that the random variable generated from the Wiener process can have positive or negative values in order to allow for adding or removing the same amount from the expected value at any time in the period t2. This approach helps to maintain a constant expected value, and to change only the amount of uncertainty in the second period.
3. Parameterisation of the model
The empirical analysis is presented in three steps. The first step is the identification of the representative farms to be simulated, the second is the construction of the farm household model and the final step is the modelling of uncertainty.
3.1 Identification of the representative farms
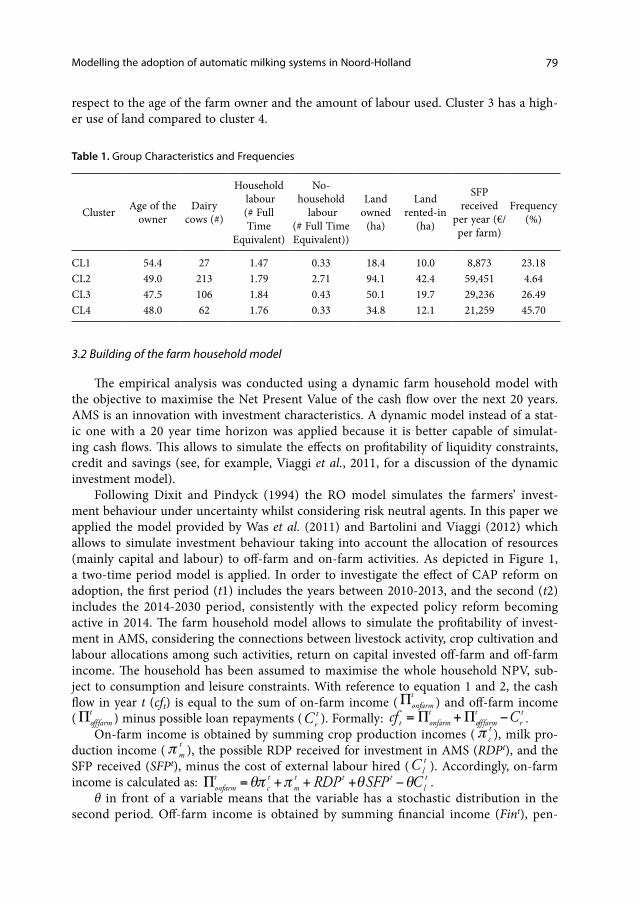
The model has been constructed for four representative farm households specialised in dairy production, in the case study area of Noord-Holland, a province of the Nether-lands. The representative farms were obtained by applying a cluster analysis to the CAP-IRE2 database, which contains interviews with 300 farm households located in Noord-Holland. A subsample of 149 farm households which indicated dairy farming was their main farming specialisation were selected for the cluster analysis. For each farm, infor-mation was asked about farm and farmer characteristics (farm structure, herd size, crop rotation, household information about income from off-farm labour, the amount of off-farm labour, off-farm capital investment and information about SFP and RDP payments received). No information concerning the current milking system was asked during the interview. Applying a cluster analysis3 to the 149 farms, four groups of livestock farms were identified. The main characteristics of the groups resulting from the cluster analysis and the frequencies in the database are presented in Table 1.
The clusters generated represent four different dairy livestock systems. The characteris-tics of cluster 1 are the smallest herd size, with only 26 dairy cows and a low Usable Agri-cultural Area (UAA), respectively composed of 18.40 ha of land owned and 9.35 ha of land rented-in. The average age of the farm owner is higher than for the other clusters (54 years).
The other three clusters (clusters 2, 3, 4) are composed of younger farmers compared to the first cluster and are also differentiated by herd size and farm size. Cluster 2 has the larg-est herd size with 213 dairy cows, and a high use of labour, mainly provided by hired labour.
Finally, clusters 3 and 4 are characterised respectively by medium herd size (106 dairy cows) and small herd size (62 dairy cows). These two clusters are quite homogeneous with
2 CAP-IRE is the acronym of a 7th Framework Program Project entitled Assessing the Multiple Impacts of the Common Agricultural Policies on Rural Economies. Further information is available on: http://www.cap-ire.eu/default.aspx.3 A non-hierarchical k-means cluster analysis was applied. The variables used for the cluster analysis are the herd size and the on-farm labour used, expressed in full time equivalents (both household and hired labour). The best clustering was obtained by the one with the highest Calinski/Harabasz pseudo-F value.
79Modelling the adoption of automatic milking systems in Noord-Holland
respect to the age of the farm owner and the amount of labour used. Cluster 3 has a high-er use of land compared to cluster 4.
Table 1. Group Characteristics and Frequencies
Cluster Age of the owner
Dairy cows (#)
Household labour(# Full Time
Equivalent)
No- household
labour(# Full Time Equivalent))
Land owned
(ha)
Land rented-in
(ha)
SFP received
per year (€/ per farm)
Frequency (%)
CL1 54.4 27 1.47 0.33 18.4 10.0 8,873 23.18CL2 49.0 213 1.79 2.71 94.1 42.4 59,451 4.64CL3 47.5 106 1.84 0.43 50.1 19.7 29,236 26.49CL4 48.0 62 1.76 0.33 34.8 12.1 21,259 45.70
3.2 Building of the farm household model
The empirical analysis was conducted using a dynamic farm household model with the objective to maximise the Net Present Value of the cash flow over the next 20 years. AMS is an innovation with investment characteristics. A dynamic model instead of a stat-ic one with a 20 year time horizon was applied because it is better capable of simulat-ing cash flows. This allows to simulate the effects on profitability of liquidity constraints, credit and savings (see, for example, Viaggi et al., 2011, for a discussion of the dynamic investment model).
Following Dixit and Pindyck (1994) the RO model simulates the farmers’ invest-ment behaviour under uncertainty whilst considering risk neutral agents. In this paper we applied the model provided by Was et al. (2011) and Bartolini and Viaggi (2012) which allows to simulate investment behaviour taking into account the allocation of resources (mainly capital and labour) to off-farm and on-farm activities. As depicted in Figure 1, a two-time period model is applied. In order to investigate the effect of CAP reform on adoption, the first period (t1) includes the years between 2010-2013, and the second (t2) includes the 2014-2030 period, consistently with the expected policy reform becoming active in 2014. The farm household model allows to simulate the profitability of invest-ment in AMS, considering the connections between livestock activity, crop cultivation and labour allocations among such activities, return on capital invested off-farm and off-farm income. The household has been assumed to maximise the whole household NPV, sub-ject to consumption and leisure constraints. With reference to equation 1 and 2, the cash flow in year t (cft) is equal to the sum of on-farm income ( ) and off-farm income ( ) minus possible loan repayments ( ). Formally: .
On-farm income is obtained by summing crop production incomes ( ), milk pro-duction income ( ), the possible RDP received for investment in AMS (RDPt), and the SFP received (SFPt), minus the cost of external labour hired ( ). Accordingly, on-farm income is calculated as: .
θ in front of a variable means that the variable has a stochastic distribution in the second period. Off-farm income is obtained by summing financial income (Fint), pen-
80 M. Floridi, F. Bartolini, J. Peerlings, N. Polman, D. Viaggi
sions received by household members (Penst) and income obtained by allocating house-hold labour to off-farm activities (Oint). Formally, off-farm income is calculated as
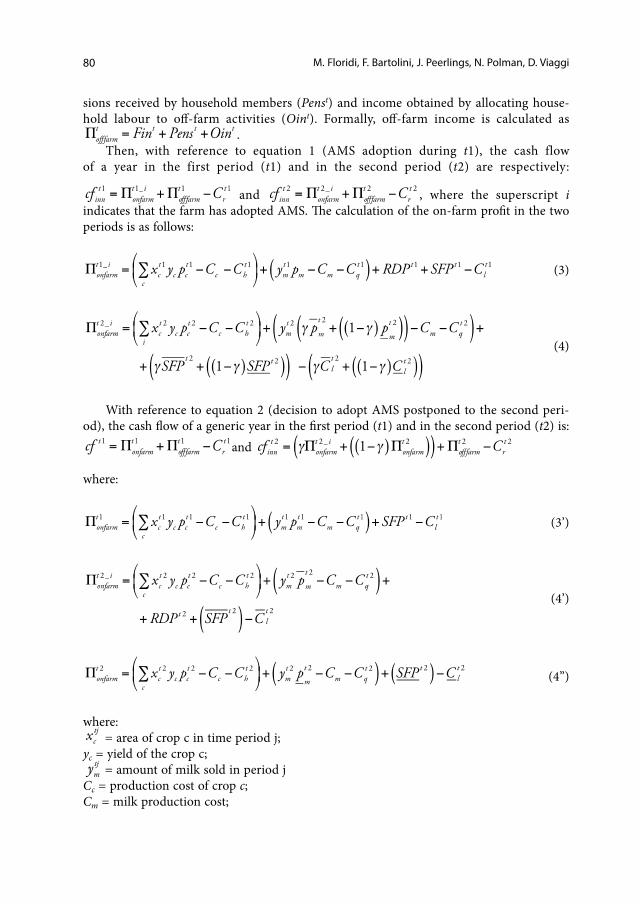
.Then, with reference to equation 1 (AMS adoption during t1), the cash flow
of a year in the first period (t1) and in the second period (t2) are respectively:
and , where the superscript i indicates that the farm has adopted AMS. The calculation of the on-farm profit in the two periods is as follows:
(3)
(4)
With reference to equation 2 (decision to adopt AMS postponed to the second peri-od), the cash flow of a generic year in the first period (t1) and in the second period (t2) is:
and
where:
(3’)
(4’)
(4”)
where: = area of crop c in time period j;
yc = yield of the crop c; = amount of milk sold in period j
Cc = production cost of crop c; Cm = milk production cost;
81Modelling the adoption of automatic milking systems in Noord-Holland
= cost of land rented-in in year t;
= milk quota rent;
= crop prices in year t;
= milk price in year t;γ = probability to have favourable conditions for AMS4;
; = favourable and non-favourable milk prices respectively in the second period;
; = favourable and non-favourable SFP respectively in the second period;
; = favourable (low) and non-favourable (high) labour cost respectively in the second period.
In the model, rotation constraints, livestock housing capacity and manure and slurry spreading constraints are included. Finally, a liquidity constraint has been applied in order to force the farm model to obtain a loan and to pay interest on the loan, when cash is insufficient to finance the AMS.
3.3 Modelling uncertainty
The objective of the paper is to assess the impact of alternative levels of subsidies in the form of co-financing of investments (measure 121 of RDP) on the adoption of AMS on dairy farms in the Netherlands, when choice is affected by uncertainty in relevant con-text parameters. Then effects of certainty in RDP co-financing investment measure with uncertainty in relevant stochastic parameters (the amount of SFP received by the farm, milk prices, and labour costs) on adoption decision have been assessed. We assume that during period t1 (first period) the farmer knows the first two moments (expected value and variability) of stochastic parameters in the second period. Formally, uncertainty can
be governed by a Wiener process: , where St2 is the expected value for a year belonging to the second period (t2); Se is the average or known value during the first period; σ is the maximum oscillation (known during the first period) and dz is a random variable uniformly distributed with a minimum value of 0 and a maximum value of 1. Through a Monte Carlo Approach, dz has been simulated as a N x M matrix of random values, where M represents the times at which each stochastic parameter changes during the second period, and N represents the number of samples generated by the Monte Carlo simulation.
This general approach has different specifications depending on the stochastic param-eter considered. Concerning the SFP parameters, Se is the expected value of the SFP dur-ing the second period, which is equal to half of the current SFP5, and σ is the maximum
4 The set of equations refers to a situation in which all three stochastic parameters simultaneously turn favourable or non-favourable. However, as explained in the results section, empirical analysis is undertaken developing one model for each stochastic parameter.5 This value is equal to the average between the current value and SFP equal to zero.
82 M. Floridi, F. Bartolini, J. Peerlings, N. Polman, D. Viaggi
oscillation with a value equal to Se. Under this assumption, we simulate that farmers expect a reduction in the current SPF amount and that the SFP can take values between the current value (2010-2013) and zero for each year in the second period. With regard to milk price, we have the following specification: Se is the average net producer milk price in the years 2007-2009 (LEI, 2009) and σ was calculated using the forecasted prices for the period 2009-2018 in the OECD-FAO Agricultural Outlook 2009 report. The OECD-FAO Agricultural Outlook 2009 expected annual reductions in milk prices and we have added an annual drift (μ) which was calculated as the annual percentage reduction to obtain the forecasted price level from the OECD-FAO Agricultural Outlook 2009 report. Finally, the labour costs Se used are the 2009 labour costs obtained from Eurostat, while σ was cal-culated using the forecasted labour costs in the Scenar2020 report (European Communi-ties, 2007). Due to expected trends regarding increases in labour costs, we have added an annual drift (μ) which was calculated as the annual percentage increase to obtain the fore-casted price level in 2020 (European Communities, 2007).
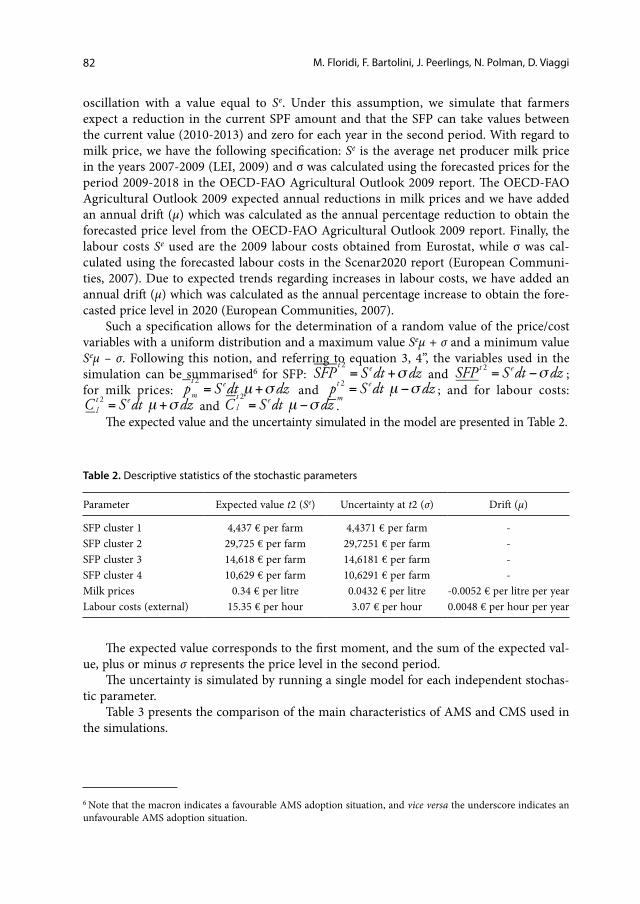
Such a specification allows for the determination of a random value of the price/cost variables with a uniform distribution and a maximum value Seμ + σ and a minimum value Seμ – σ. Following this notion, and referring to equation 3, 4”, the variables used in the simulation can be summarised6 for SFP: and ; for milk prices: and ; and for labour costs:
and .The expected value and the uncertainty simulated in the model are presented in Table 2.
Table 2. Descriptive statistics of the stochastic parameters
Parameter Expected value t2 (Se) Uncertainty at t2 (σ) Drift (μ)
SFP cluster 1 4,437 € per farm 4,4371 € per farm -SFP cluster 2 29,725 € per farm 29,7251 € per farm -SFP cluster 3 14,618 € per farm 14,6181 € per farm -SFP cluster 4 10,629 € per farm 10,6291 € per farm -Milk prices 0.34 € per litre 0.0432 € per litre -0.0052 € per litre per yearLabour costs (external) 15.35 € per hour 3.07 € per hour 0.0048 € per hour per year
The expected value corresponds to the first moment, and the sum of the expected val-ue, plus or minus σ represents the price level in the second period.
The uncertainty is simulated by running a single model for each independent stochas-tic parameter.
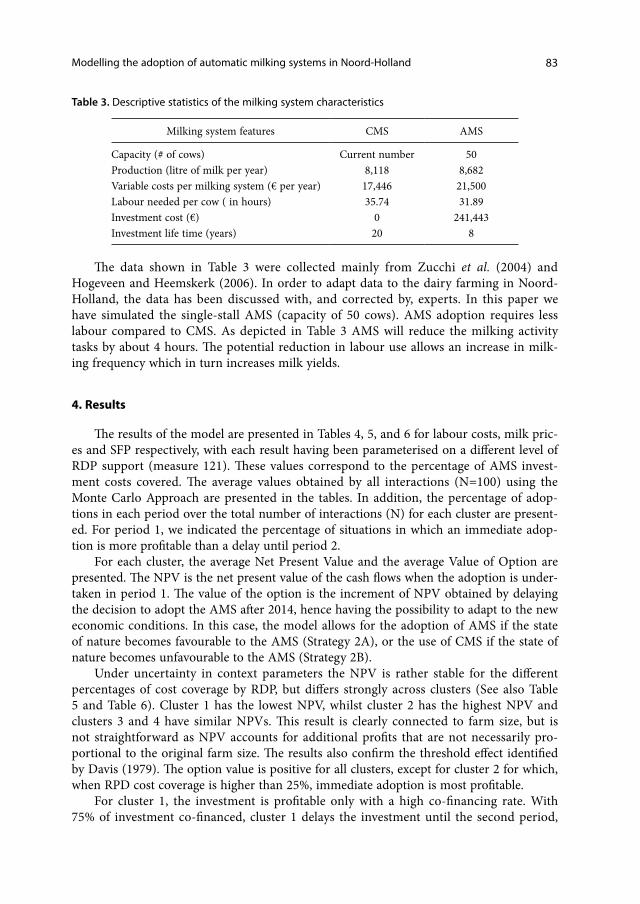
Table 3 presents the comparison of the main characteristics of AMS and CMS used in the simulations.
6 Note that the macron indicates a favourable AMS adoption situation, and vice versa the underscore indicates an unfavourable AMS adoption situation.
83Modelling the adoption of automatic milking systems in Noord-Holland
Table 3. Descriptive statistics of the milking system characteristics
Milking system features CMS AMS
Capacity (# of cows) Current number 50 Production (litre of milk per year) 8,118 8,682Variable costs per milking system (€ per year) 17,446 21,500Labour needed per cow ( in hours) 35.74 31.89Investment cost (€) 0 241,443Investment life time (years) 20 8
The data shown in Table 3 were collected mainly from Zucchi et al. (2004) and Hogeveen and Heemskerk (2006). In order to adapt data to the dairy farming in Noord-Holland, the data has been discussed with, and corrected by, experts. In this paper we have simulated the single-stall AMS (capacity of 50 cows). AMS adoption requires less labour compared to CMS. As depicted in Table 3 AMS will reduce the milking activity tasks by about 4 hours. The potential reduction in labour use allows an increase in milk-ing frequency which in turn increases milk yields.
4. Results
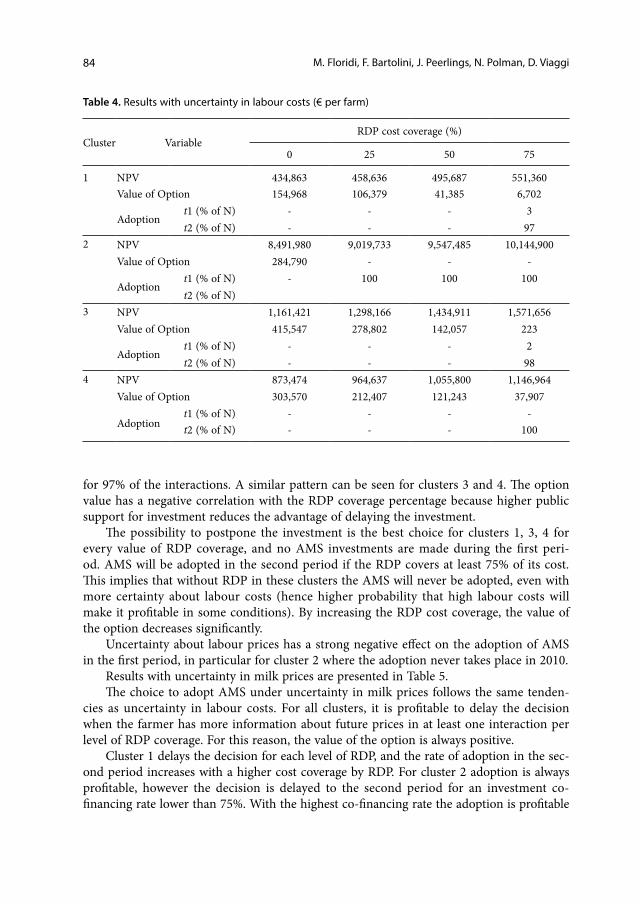
The results of the model are presented in Tables 4, 5, and 6 for labour costs, milk pric-es and SFP respectively, with each result having been parameterised on a different level of RDP support (measure 121). These values correspond to the percentage of AMS invest-ment costs covered. The average values obtained by all interactions (N=100) using the Monte Carlo Approach are presented in the tables. In addition, the percentage of adop-tions in each period over the total number of interactions (N) for each cluster are present-ed. For period 1, we indicated the percentage of situations in which an immediate adop-tion is more profitable than a delay until period 2.
For each cluster, the average Net Present Value and the average Value of Option are presented. The NPV is the net present value of the cash flows when the adoption is under-taken in period 1. The value of the option is the increment of NPV obtained by delaying the decision to adopt the AMS after 2014, hence having the possibility to adapt to the new economic conditions. In this case, the model allows for the adoption of AMS if the state of nature becomes favourable to the AMS (Strategy 2A), or the use of CMS if the state of nature becomes unfavourable to the AMS (Strategy 2B).
Under uncertainty in context parameters the NPV is rather stable for the different percentages of cost coverage by RDP, but differs strongly across clusters (See also Table 5 and Table 6). Cluster 1 has the lowest NPV, whilst cluster 2 has the highest NPV and clusters 3 and 4 have similar NPVs. This result is clearly connected to farm size, but is not straightforward as NPV accounts for additional profits that are not necessarily pro-portional to the original farm size. The results also confirm the threshold effect identified by Davis (1979). The option value is positive for all clusters, except for cluster 2 for which, when RPD cost coverage is higher than 25%, immediate adoption is most profitable.
For cluster 1, the investment is profitable only with a high co-financing rate. With 75% of investment co-financed, cluster 1 delays the investment until the second period,
84 M. Floridi, F. Bartolini, J. Peerlings, N. Polman, D. Viaggi
for 97% of the interactions. A similar pattern can be seen for clusters 3 and 4. The option value has a negative correlation with the RDP coverage percentage because higher public support for investment reduces the advantage of delaying the investment.
The possibility to postpone the investment is the best choice for clusters 1, 3, 4 for every value of RDP coverage, and no AMS investments are made during the first peri-od. AMS will be adopted in the second period if the RDP covers at least 75% of its cost. This implies that without RDP in these clusters the AMS will never be adopted, even with more certainty about labour costs (hence higher probability that high labour costs will make it profitable in some conditions). By increasing the RDP cost coverage, the value of the option decreases significantly.
Uncertainty about labour prices has a strong negative effect on the adoption of AMS in the first period, in particular for cluster 2 where the adoption never takes place in 2010.
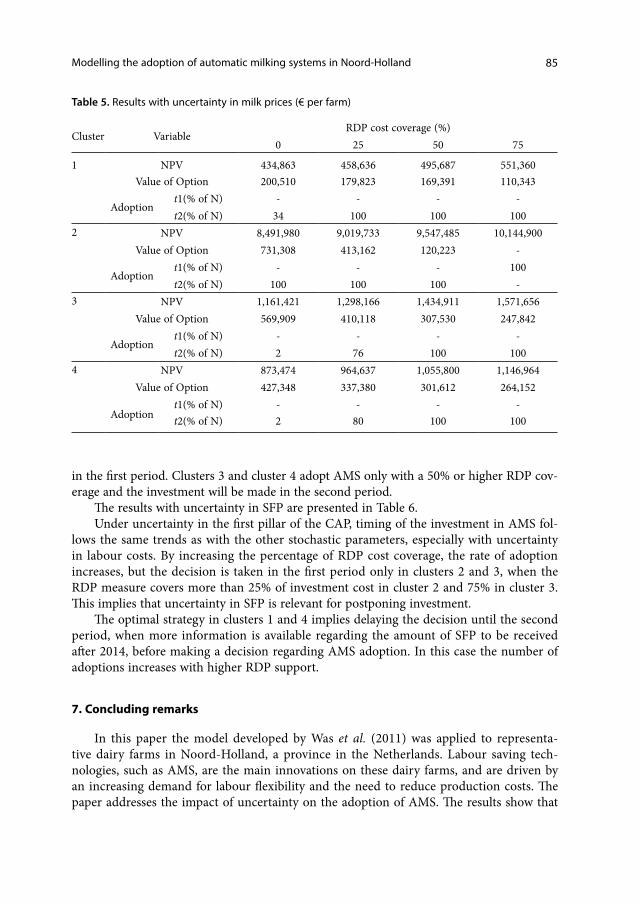
Results with uncertainty in milk prices are presented in Table 5.The choice to adopt AMS under uncertainty in milk prices follows the same tenden-
cies as uncertainty in labour costs. For all clusters, it is profitable to delay the decision when the farmer has more information about future prices in at least one interaction per level of RDP coverage. For this reason, the value of the option is always positive.
Cluster 1 delays the decision for each level of RDP, and the rate of adoption in the sec-ond period increases with a higher cost coverage by RDP. For cluster 2 adoption is always profitable, however the decision is delayed to the second period for an investment co-financing rate lower than 75%. With the highest co-financing rate the adoption is profitable
Table 4. Results with uncertainty in labour costs (€ per farm)
Cluster VariableRDP cost coverage (%)
0 25 50 75
1 NPV 434,863 458,636 495,687 551,360Value of Option 154,968 106,379 41,385 6,702
Adoption t1 (% of N) - - - 3t2 (% of N) - - - 97
2 NPV 8,491,980 9,019,733 9,547,485 10,144,900Value of Option 284,790 - - -
Adoption t1 (% of N) - 100 100 100t2 (% of N)
3 NPV 1,161,421 1,298,166 1,434,911 1,571,656Value of Option 415,547 278,802 142,057 223
Adoptiont1 (% of N) - - - 2t2 (% of N) - - - 98
4 NPV 873,474 964,637 1,055,800 1,146,964Value of Option 303,570 212,407 121,243 37,907
Adoptiont1 (% of N) - - - -t2 (% of N) - - - 100
85Modelling the adoption of automatic milking systems in Noord-Holland
in the first period. Clusters 3 and cluster 4 adopt AMS only with a 50% or higher RDP cov-erage and the investment will be made in the second period.
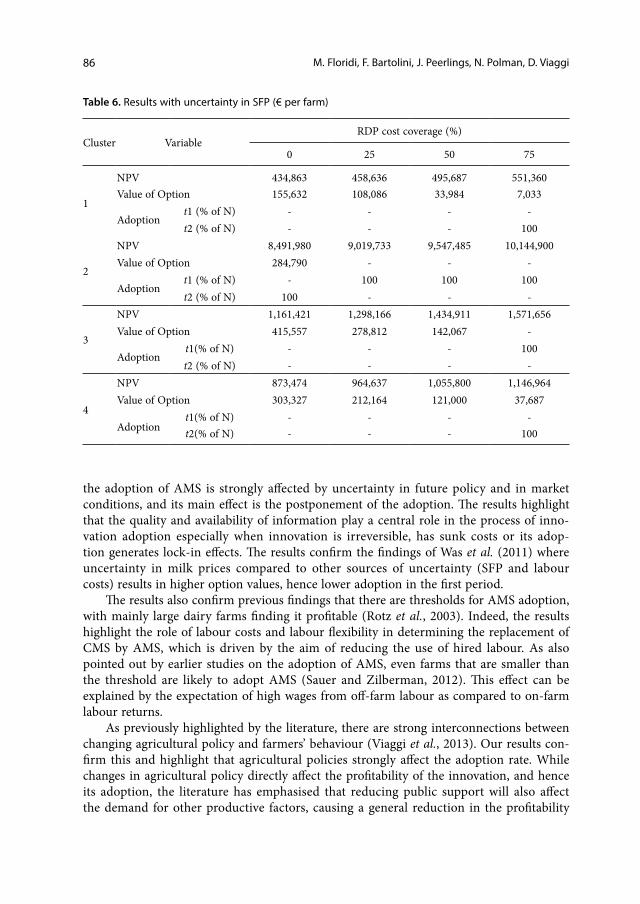
The results with uncertainty in SFP are presented in Table 6.Under uncertainty in the first pillar of the CAP, timing of the investment in AMS fol-
lows the same trends as with the other stochastic parameters, especially with uncertainty in labour costs. By increasing the percentage of RDP cost coverage, the rate of adoption increases, but the decision is taken in the first period only in clusters 2 and 3, when the RDP measure covers more than 25% of investment cost in cluster 2 and 75% in cluster 3. This implies that uncertainty in SFP is relevant for postponing investment.
The optimal strategy in clusters 1 and 4 implies delaying the decision until the second period, when more information is available regarding the amount of SFP to be received after 2014, before making a decision regarding AMS adoption. In this case the number of adoptions increases with higher RDP support.
7. Concluding remarks
In this paper the model developed by Was et al. (2011) was applied to representa-tive dairy farms in Noord-Holland, a province in the Netherlands. Labour saving tech-nologies, such as AMS, are the main innovations on these dairy farms, and are driven by an increasing demand for labour flexibility and the need to reduce production costs. The paper addresses the impact of uncertainty on the adoption of AMS. The results show that
Table 5. Results with uncertainty in milk prices (€ per farm)
Cluster VariableRDP cost coverage (%)
0 25 50 75
1 NPV 434,863 458,636 495,687 551,360Value of Option 200,510 179,823 169,391 110,343
Adoption t1(% of N) - - - -t2(% of N) 34 100 100 100
2 NPV 8,491,980 9,019,733 9,547,485 10,144,900Value of Option 731,308 413,162 120,223 -
Adoption t1(% of N) - - - 100t2(% of N) 100 100 100 -
3 NPV 1,161,421 1,298,166 1,434,911 1,571,656Value of Option 569,909 410,118 307,530 247,842
Adoptiont1(% of N) - - - -t2(% of N) 2 76 100 100
4 NPV 873,474 964,637 1,055,800 1,146,964Value of Option 427,348 337,380 301,612 264,152
Adoptiont1(% of N) - - - -t2(% of N) 2 80 100 100
86 M. Floridi, F. Bartolini, J. Peerlings, N. Polman, D. Viaggi
the adoption of AMS is strongly affected by uncertainty in future policy and in market conditions, and its main effect is the postponement of the adoption. The results highlight that the quality and availability of information play a central role in the process of inno-vation adoption especially when innovation is irreversible, has sunk costs or its adop-tion generates lock-in effects. The results confirm the findings of Was et al. (2011) where uncertainty in milk prices compared to other sources of uncertainty (SFP and labour costs) results in higher option values, hence lower adoption in the first period.
The results also confirm previous findings that there are thresholds for AMS adoption, with mainly large dairy farms finding it profitable (Rotz et al., 2003). Indeed, the results highlight the role of labour costs and labour flexibility in determining the replacement of CMS by AMS, which is driven by the aim of reducing the use of hired labour. As also pointed out by earlier studies on the adoption of AMS, even farms that are smaller than the threshold are likely to adopt AMS (Sauer and Zilberman, 2012). This effect can be explained by the expectation of high wages from off-farm labour as compared to on-farm labour returns.
As previously highlighted by the literature, there are strong interconnections between changing agricultural policy and farmers’ behaviour (Viaggi et al., 2013). Our results con-firm this and highlight that agricultural policies strongly affect the adoption rate. While changes in agricultural policy directly affect the profitability of the innovation, and hence its adoption, the literature has emphasised that reducing public support will also affect the demand for other productive factors, causing a general reduction in the profitability
Table 6. Results with uncertainty in SFP (€ per farm)
Cluster VariableRDP cost coverage (%)
0 25 50 75
1
NPV 434,863 458,636 495,687 551,360Value of Option 155,632 108,086 33,984 7,033
Adoption t1 (% of N) - - - -t2 (% of N) - - - 100
2
NPV 8,491,980 9,019,733 9,547,485 10,144,900Value of Option 284,790 - - -
Adoption t1 (% of N) - 100 100 100t2 (% of N) 100 - - -
3
NPV 1,161,421 1,298,166 1,434,911 1,571,656Value of Option 415,557 278,812 142,067 -
Adoptiont1(% of N) - - - 100t2 (% of N) - - - -
4
NPV 873,474 964,637 1,055,800 1,146,964Value of Option 303,327 212,164 121,000 37,687
Adoptiont1(% of N) - - - -t2(% of N) - - - 100
87Modelling the adoption of automatic milking systems in Noord-Holland
of agricultural activities (Bartolini and Viaggi, 2013). The results show a positive effect of co-financing investment measures in increasing both the adoption rate and the time of the adoption. This is particularly true for large farms that are more exposed to uncertainty. The results also highlight the positive effects of SFP on the profitability of AMS and its adoption by mainly providing liquidity and reducing risk exposure.
The results underscore the need to reinforce (or build) links between investment sup-port measures and uncertainty reducing measures (such as insurance). Such measures are suitable to prevent excessive exposition to risk for those farmers with the strongest intention to invest and encourage a more timely reaction by farmers with funding oppor-tunities. Altogether, the results suggest that there is a need to develop a coherent policy framework, in which, besides milk quota abolishment, measures to support and promote investment/innovation are needed to increase farm competitiveness and ensure the conti-nuity of farm activity. In particular, the abolishment of milk quotas could affect milk price fluctuations, and in turn increase the uncertainty in milk prices with the effect of further delaying investment in AMS.
The literature highlights that innovation adoption is negatively affected by uncertainty when famers are risk adverse. As pointed out by Sauer and Zilberman (2012), while the average milk price positively affects AMS adoption, milk price variability negatively affects adoption. Our results, even with risk neutral agents, confirm such findings, where uncer-tainty has the effect of delaying investment decisions.
The paper addresses the combined effect of uncertainty and differences in farm struc-ture in affecting farmers’ innovation behaviour and reactions to the alternative design of measure 121 of the RDP. Hence, the methodology applied emphasises differences between farmers, rather than providing a territorial representativeness of the case study area. How-ever, the results obtained by each cluster could be representative for different production scales and input uses.
The paper has several limitations that are connected to the simplification of the pro-cess of innovation adoption and to the data used. Concerning the first point, the model-ling strategy adopted imposes a particular stylisation of the decision process in the direc-tion of not considering the effect of learning on the adoption rate. The economic literature has found that differences in farmers’ skills or quality of extension services affect the prof-itability of an innovation (Tsur et al., 1990). In addition, we have assumed a two-period model: relaxing such assumptions and allowing the adoption to be made in more than two periods, with learning effects, could improve the quality of the results.
With respect to the data used, sensitivity analyses could be added to analyse the effects of uncertainty in other decision variables (e.g. investment costs, off-farm wages). In addi-tion, the simulation could account for the effects of correlation between different uncertain variables, in order to increase the model’s quality and the robustness of the results.
Acknowledgments
Financial support from the FP7 project CAP-IRE (Assessing the multiple Impacts of the Common Agricultural Policies on Rural Economies) is acknowledged and greatly appreciated. The authors are solely responsible for the content of the paper. This work does not necessarily reflect the view of the European Union and in no way discloses the Com-
88 M. Floridi, F. Bartolini, J. Peerlings, N. Polman, D. Viaggi
mission’s future policy in this area. The authors wish to thank the two anonymous referees and the associated editor for their fruitful comments on an earlier version of this paper.
References
Bartolini, F. and Viaggi, D. (2012). An Analysis of Policy Scenario Effects on the Adoption of Energy Production on the Farm. A Case Study in Emilia-Romagna (Italy). Energy Policy 51: 454-464.
Bartolini, F., Latruffe, L. and Viaggi, D. (2011). Assessing the Effect of the CAP on Farm Innovation Adoption. An Analysis in Two French Regions. Paper presented at 122th EAAE Seminar, February 17-18, 2011, Ancona, Italy.
Bartolini, F. and Viaggi, D. (2013). The Common Agricultural Policy and the Determi-nants of Changes in EU Farm Size. Land Use Policy 31: 126-135.
Bijl, R., Kooistra, S.R. and Hogeveen, H. (2010). The Profitability of Automatic Milking on Dutch Dairy Farms. Journal of Dairy Science 90(1): 239-248.
Carruth, A., Dickerson, A. and Henley, A. (2000). What do We Know About Investment Under Uncertainty? Journal of Economic Surveys 14(2): 119-154.
Castro, A., Pereira, J.M., Amiama, C. and Bueno, J. (2012). Estimating Efficiency in Auto-matic Milking Systems. Journal of Dairy Science 95(2): 929-936.
Davis, P.A. (1979). Inter-firm Diffusion of Process Innovations. European Economic Review 12(4): 299-317.
de Koning, C.J.A.M. (2010). Automatic Milking—Common Practice on Dairy Farms, Pro-ceedings of the First North American Conference on Precision Dairy Management, Toronto, ON, Canada, 52-67.
Dijkhuizen, A.A., Huirne, R.B.M., Harsh, S.B. and Gardner, R.W. (1997). Economics of Robot Application. Computer and Electronics in Agriculture 17(1):111-121.
Dixit, A. and Pindyck, R. (1994). Investment Under Uncertainty. Princeton: Princeton University Press.
European Commission (2010). The CAP Towards 2020: Meeting the Food, Natural Resources and Territorial Challenges of the Future. COM(2010) 672 final. Brussels.
European Commission (2011a). Proposal for a Regulation of the European Parliament and of the Council Establishing Rules for Direct Payments to Farmers Under Support Schemes Within the Framework of the Common Agricultural Policy. COM(2011) 625 final. Brussels.
European Commission (2011b). Proposal for a Regulation of the European Parliament and of the Council on Support for Rural Development by the European Agricultural Fund for Rural Development (EAFRD). COM(2011) 627 final. Brussels.
European Communities (2007) SCENAR 2020. Scenario Study on Agriculture and the Rural World. Luxembourg: Office for Official Publications of the European Com-munities.
Griliches, Z. (1957). Hybrid Corn: an Exploration in the Economics of Technological Change. Econometrica 25(4): 501-522.
Hekkila, A.M., Myyra, S. and Pietola, K. (2012). Effects of Economics Factors on Adop-tion of Robotics and Consequences of Automation fro Productivity Growth of Dairy Farms. Working Paper n. 32 of the FP7 project Factor Markets.
89Modelling the adoption of automatic milking systems in Noord-Holland
Hogeveen, H. and Heemskerk, K. (2006). Zelf Melken of Robot Inzetten? Arbeid Belangri-jkste Motivatie om in Melkrobot te Investeren. Veeteelt 23(16): 10-12.
Hyde, J. and Engel, P.D. (2003). A Real Option Analysis of Automatic Milking Systems. Agricultural and Resource Economics Review 32(2): 282-294.
Just, R.E. and Zilberman, D. (1983). Stochastic Structure, Farm Size, and Technology Adoption in Developing Agriculture. Oxford Economic Papers 35(2): 307-328.
Kim, K. and Chavas, J.P. (2003). Technological Change and Risk Management: an Applica-tion to the Economics of Corn Production. Agricultural Economics 29(2): 125-142.
LEI (2009). Land-en Tuinbouwcijfers 2009, LEI, The Hague (p. 143). http://edepot.wur.nl/11183. Accessed 27 March 2013.
Mathijs, E. (2004). Socio-Economic Aspects of Automatic Milking. In: Meijering, A., Hogeveen, H. and de Koning, C.J.A.M. (Eds.), Automatic Milking, Wageningen: The Netherlands, 46-55.
Meskens, L., Vandermersch, M. and Mathijs, E. (2001). Implication of the Introduction of Automatic Milking on Dairy Farm. Literature Review on the Determinants and implications of technology adoption. Deliverable D1. FP5 EU project Implications of the introduction of automatic milking on dairy farms.
OECD – FAO (2012) Agricultural Outlook 2012-2021. http://www.oecd.org/site/oecd-fao-agriculturaloutlook/ Accessed 27 March 2013.
Regiebureau (2012). Summary of Dutch RDP. linkhttp://www.regiebureau-pop.nl/nl/eng-lish/. Accessed 27 March 2013.
Rogers, E.M. (1962). Diffusion of Innovation. Glencoe: Free Press.Rotz, C.A., Coiner, C.U. and Soder, K.J. (2003). Automatic Milking Systems, Farm Size,
and Milk Production. Journal of Dairy Science 86(12): 4167-4177.Sauer, J. and Zilberman, D. (2010). Innovation Behaviour at Farm Level – Selection and
Identification. Paper presented at 114th EAAE seminar, April 15-16, 2010, Berlin, Germany.
Sauer, J. and Zilberman, D. (2012). Sequential Technology Implementation, Network Externalities, and Risk: The Case of Automatic Milking Systems. Agricultural Eco-nomics 43(3): 233-252.
Schwartz, E.S. and Trigeorgis, L. (2004). Real Options and Investment Under Uncertain-ty. In: Schwartz, E.S. and Trigeorgis, L. (eds) Real Options and Investment Under Uncertainty – Classical Readings and Recent Contribution. Cambridge: The MIT Press. 1-16.
Steeneveld, W., Tauer, L. W., Hogeveen, H. and Oude Lansink, A. G. J. M. (2012). Com-paring Technical Efficiency of Farms with an Automatic Milking System and a Con-ventional Milking System. Journal of Dairy Science 95(12): 7391-7398.
Sunding, D. and Zilberman, D. (2001). The Agricultural Innovation Process: Research and Technology Adoption in a Changing Agricultural Sector. In: Gardner, B.L. and Rausser, G.C. (eds) Handbook of Agricultural Economics, Amsterdam: Elsevier, 207-261.
Trigeorgis, L. (1988). A Conceptual Options Framework for Capital Budgeting. Advances in Future and Options Research 3: 145-167.
Tsur, Y., Sternberg, M. and Hochman, E. (1990). Dynamic Modelling of Innovation Process Adoption with Risk Aversion and Learning. Oxford Economics Paper 42(2): 336-355.
90 M. Floridi, F. Bartolini, J. Peerlings, N. Polman, D. Viaggi
Viaggi, D., Bartolini, F., Raggi, M., Sardonini, L., Sammeth, F. and Gomez y Paloma, S. (2011). Farm Investment Behaviour Under the CAP Reform Process. Luxembourg: Publications Office of the European Union.
Viaggi, D., Gomez Y Paloma, S., Mishra, A. and Raggi, M. (2013). The Role of the EU Common Agricultural Policy: Assessing Multiple Effects in Alternative Policy Sce-narios. Land Use Policy 31: 99-101.
Was, A., Majewsky E., Cygansky, L. Bartolini, F., Floridi, M. and Viaggi, D. (2011). Assess-ment of Economic Effects of Innovation in Automatic Milking Systems in Podlaskie Region (Poland) with the Use of Real Option Approach. Acta Scientiarum Polono-rum Oeconomia 10(2): 107-120.
Zucchi, G., Zappavigna, P., Broekman, A. and Frascari, D. (2004). Analisi Zooeconomica dell’Impiego degli AMS. negli Allevamenti dei Bovini da Latte in Italia. Bologna: Avenue Media.