Effect of Land-Cover Change on Terrestrial Carbon Dynamics in the Southern United States
15
Effect of Land-Cover Change on Terrestrial Carbon Dynamics in the Southern United States Hua Chen, Hanqin Tian,* Mingliang Liu, Jerry Melillo, Shufen Pan, and Chi Zhang ABSTRACT Land-cover change has significant influence on carbon storage and fluxes in terrestrial ecosystems. The southern United States is thought to be the largest carbon sink across the conterminous United States. However, the spatial and temporary variability of carbon storage and fluxes due to land-cover change in the southern United States remains unclear. In this study, we first reconstructed the annual data set of land- cover of the southern United States from 1860 to 2003 with a spatial resolution of 8 km. Then we used a spatially explicit process-based biogeochemical model (Terrestrial Ecosystem Model [TEM] 4.3) to simulate the effects of cropland expansion and forest regrowth on the carbon dynamics in this region. The pattern of land-cover change in the southern United States was primarily driven by the change of cropland, including cropland expansion and forest regrowth on abandoned cropland. The TEM simulation estimated that total carbon storage in the southern United States in 1860 was 36.8 Pg C, which likely was overestimated, including 10.8 Pg C in the southeast and 26 Pg C in the south-central. During 1860–2003, a total of 9.4 Pg C, including 6.5 Pg C of vegetation and 2.9 Pg C of soil C pool, was released to the atmosphere in the southern United States. The net carbon flux due to cropland expansion and forest regrowth on abandoned cropland was approximately zero in the entire southern region between 1980 and 2003. The temporal and spatial variability of regional net carbon exchange was influenced by land-cover pattern, especially the distribution of cropland. The land-use analysis in this study is incomplete and preliminary. Finally, the limitations, improve- ments, and future research needs of this study were discussed. T HE TERRESTRIAL ECOSYSTEMS in North America have been suggested as a major carbon sink (Fan et al., 1998; Pacala et al., 2001). Land-use changes such as cropland establishment and cultivation, cropland aban- donment, and subsequently forest regrowth are the primary mechanisms for transferring carbon between the land and the atmosphere (Houghton et al., 1999; Caspersen et al., 2000; Pacala et al., 2001; Tian et al., 2003; Birdsey and Lewis, 2003). Based on the Forest Inventory and Analysis (FIA) biomass data from late 1970s to the early 1990s, Pacala et al. (2001) estimated a carbon sink of between 0.30 and 0.58 Pg C yr 21 in the conterminous United States and about half of this sink was due to the forest regrowth on abandoned cropland. Using FIA data of five eastern states, Caspersen et al. (2000) showed that land-use change is the dominant factor contributing carbon accumulation in the eastern United States. Houghton et al. (1999) estimated an annual accumulation of 0.037 Pg C in the United States because of the land-use change in the 1980s, and the forest regrowth has taken up 0.280 Pg C each year during the same period using a bookkeeping model. The southern United States covers about 215.6 million ha of land in 13 states from the Mid-Atlantic coast west to Texas and Oklahoma, representing approximately 24% of the land area, 60% of the forest land, and 25% of the agricultural land for the entire United States. This region has undergone a long-term transition from agricultural land use to secondary forests (Wear, 2002). Three major periods characterize land-use change in the southern United States: (i) the era of agricultural exploitation, (ii) the era of timber exploitation, and (iii) the era of recovery and renewal (Wear, 2002). Agricultural exploi- tation started in the 17th century but reached its peak in the late 19th century, when a vast cotton industry stretched from the Atlantic to Texas. Timber exploitation peaked in the first part of the 20th century. By the Great Depression, intensive agriculture and timbering had seriously degraded the land. Cropland was abandoned, and forests were reestablished and renewed over the next 40 yr (Wear, 2002). However, how the historical land-cover change influenced carbon storage and fluxes in the southern United States remains unclear, although Turner et al. (1995) suggested that the southern United States had the strongest biological carbon sink in the United States due to the young forest age structure in this region. Traditionally, studies on effects of land-cover change on carbon dynamics have primarily depended on the FIA data and other land-cover inventory data sets (Turner et al., 1995; Brown and Schroeder, 1999; Hough- ton et al., 1983, 1999; Caspersen et al., 2000; Houghton and Hackler 2000a, 2000b; Pacala et al., 2001; Birdsey and Lewis, 2003). However, the FIA program started about 1930 and the field inventory was conducted only once every 10 yr until the late 1990s. The land-use his- tory in the southern United States is much longer than the FIA data history. Data availability becomes an issue to examine the effects of long-term historical land-cover change on carbon dynamics. Even in the available FIA data, the estimate and extrapolation of belowground biomass and dead wood biomass still needs to be ad- dressed adequately (Brown, 2002). Moreover, in most cases, the studies using FIA data could only provide the average values of carbon storage and fluxes for certain regions and time periods. As spatial and temporary variability of carbon dynamics is increasingly important H. Chen, H. Tian, M. Liu, S. Pan, and C. Zhang, School of For- estry and Wildlife Sciences, Auburn University, Auburn, AL 36849. J. Melillo, The Ecosystem Center, Marine Biological Lab., Woods Hole, MA 0254. Received 17 May 2005. *Corresponding author (tianhan@ auburn.edu). Published in J. Environ. Qual. 35:1533–1547 (2006). Special Submissions doi:10.2134/jeq2005.0198 ª ASA, CSSA, SSSA 677 S. Segoe Rd., Madison, WI 53711 USA Abbreviations: FIA, Forest Inventory and Analysis; NCE, net carbon exchange; SC, south-central region; SE, southeast region; TEM, Terrestrial Ecosystem Model. Reproduced from Journal of Environmental Quality. Published by ASA, CSSA, and SSSA. All copyrights reserved. 1533
Transcript of Effect of Land-Cover Change on Terrestrial Carbon Dynamics in the Southern United States
Effect of Land-Cover Change on Terrestrial Carbon Dynamics in theSouthern United States
Hua Chen, Hanqin Tian,* Mingliang Liu, Jerry Melillo, Shufen Pan, and Chi Zhang
ABSTRACTLand-cover change has significant influence on carbon storage and
fluxes in terrestrial ecosystems. The southern United States is thoughtto be the largest carbon sink across the conterminous United States.However, the spatial and temporary variability of carbon storage andfluxes due to land-cover change in the southern United States remainsunclear. In this study, we first reconstructed the annual data set of land-cover of the southern United States from 1860 to 2003 with a spatialresolution of 8 km. Then we used a spatially explicit process-basedbiogeochemical model (Terrestrial Ecosystem Model [TEM] 4.3) tosimulate the effects of cropland expansion and forest regrowth on thecarbon dynamics in this region. The pattern of land-cover change inthe southern United States was primarily driven by the change ofcropland, including cropland expansion and forest regrowth onabandoned cropland. The TEM simulation estimated that total carbonstorage in the southern United States in 1860 was 36.8 Pg C, whichlikely was overestimated, including 10.8 Pg C in the southeast and26 Pg C in the south-central. During 1860–2003, a total of 9.4 Pg C,including 6.5 Pg C of vegetation and 2.9 Pg C of soil C pool, wasreleased to the atmosphere in the southern United States. The netcarbon flux due to cropland expansion and forest regrowth onabandoned cropland was approximately zero in the entire southernregion between 1980 and 2003. The temporal and spatial variability ofregional net carbon exchange was influenced by land-cover pattern,especially the distribution of cropland. The land-use analysis in thisstudy is incomplete and preliminary. Finally, the limitations, improve-ments, and future research needs of this study were discussed.
THE TERRESTRIAL ECOSYSTEMS in North America havebeen suggested as a major carbon sink (Fan et al.,
1998; Pacala et al., 2001). Land-use changes such ascropland establishment and cultivation, cropland aban-donment, and subsequently forest regrowth are theprimary mechanisms for transferring carbon betweenthe land and the atmosphere (Houghton et al., 1999;Caspersen et al., 2000; Pacala et al., 2001; Tian et al.,2003; Birdsey and Lewis, 2003). Based on the ForestInventory and Analysis (FIA) biomass data from late1970s to the early 1990s, Pacala et al. (2001) estimated acarbon sink of between 0.30 and 0.58 Pg C yr21 in theconterminous United States and about half of this sinkwas due to the forest regrowth on abandoned cropland.Using FIA data of five eastern states, Caspersen et al.(2000) showed that land-use change is the dominantfactor contributing carbon accumulation in the eastern
United States. Houghton et al. (1999) estimated anannual accumulation of 0.037 Pg C in the United Statesbecause of the land-use change in the 1980s, and theforest regrowth has taken up 0.280 Pg C each yearduring the same period using a bookkeeping model.
The southern United States covers about 215.6 millionha of land in 13 states from theMid-Atlantic coast west toTexas and Oklahoma, representing approximately 24%of the land area, 60% of the forest land, and 25% of theagricultural land for the entire United States. This regionhas undergone a long-term transition from agriculturalland use to secondary forests (Wear, 2002). Three majorperiods characterize land-use change in the southernUnited States: (i) the era of agricultural exploitation,(ii) the era of timber exploitation, and (iii) the era ofrecovery and renewal (Wear, 2002). Agricultural exploi-tation started in the 17th century but reached its peakin the late 19th century, when a vast cotton industrystretched from theAtlantic to Texas. Timber exploitationpeaked in the first part of the 20th century. By the GreatDepression, intensive agriculture and timbering hadseriously degraded the land. Cropland was abandoned,and forests were reestablished and renewed over thenext 40 yr (Wear, 2002). However, how the historicalland-cover change influenced carbon storage and fluxesin the southern United States remains unclear, althoughTurner et al. (1995) suggested that the southern UnitedStates had the strongest biological carbon sink in theUnited States due to the young forest age structure inthis region.
Traditionally, studies on effects of land-cover changeon carbon dynamics have primarily depended on theFIA data and other land-cover inventory data sets(Turner et al., 1995; Brown and Schroeder, 1999; Hough-ton et al., 1983, 1999; Caspersen et al., 2000; Houghtonand Hackler 2000a, 2000b; Pacala et al., 2001; Birdseyand Lewis, 2003). However, the FIA program startedabout 1930 and the field inventory was conducted onlyonce every 10 yr until the late 1990s. The land-use his-tory in the southern United States is much longer thanthe FIA data history. Data availability becomes an issueto examine the effects of long-term historical land-coverchange on carbon dynamics. Even in the available FIAdata, the estimate and extrapolation of belowgroundbiomass and dead wood biomass still needs to be ad-dressed adequately (Brown, 2002). Moreover, in mostcases, the studies using FIA data could only provide theaverage values of carbon storage and fluxes for certainregions and time periods. As spatial and temporaryvariability of carbon dynamics is increasingly important
H. Chen, H. Tian, M. Liu, S. Pan, and C. Zhang, School of For-estry and Wildlife Sciences, Auburn University, Auburn, AL 36849. J.Melillo, The Ecosystem Center, Marine Biological Lab., Woods Hole,MA 0254. Received 17 May 2005. *Corresponding author ([email protected]).
Published in J. Environ. Qual. 35:1533–1547 (2006).Special Submissionsdoi:10.2134/jeq2005.0198ª ASA, CSSA, SSSA677 S. Segoe Rd., Madison, WI 53711 USA
Abbreviations: FIA, Forest Inventory and Analysis; NCE, net carbonexchange; SC, south-central region; SE, southeast region; TEM,Terrestrial Ecosystem Model.
Repro
duced
from
Journ
alof
Environm
enta
lQ
ualit
y.
Publis
hed
by
AS
A,
CS
SA
,and
SS
SA
.A
llcopyrights
reserv
ed.
1533
to understand with respect to the mechanisms responsi-ble for regional carbon dynamics (Schimel et al., 2000;Tian et al., 2003), it remains unclear how the spatial andtemporal variability of carbon storage and fluxes re-sulting from the land-cover change in the southernUnited States changes over time. Spatial and temporalvariability of carbon dynamics in terrestrial ecosystemscould be well simulated at local, regional, and globalscales using process-based spatially explicit biogeochem-ical models. Terrestrial Ecosystem Model (TEM), aprocess-based biogeochemical model, has been used toexamine the effects of land-cover change on carbon dy-namics in several studies (McGuire et al., 2001; Tianet al., 1999, 2003; Zhang et al., 2006). McGuire et al.(2001) compared four process-based ecosystem models,including TEM, to examine the effects of land-coverchange as well as the effects of increasing CO2 concen-tration and climate variability on global terrestrial car-bon storage between 1920 and 1992. Tian et al. (2003)simulated the effects of land-cover change, climate vari-ability, and increasing atmospheric CO2 concentrationon the regional carbon dynamics in monsoon Asia witha spatial resolution of one-half degree.The objectives of this study were to examine (i) how
land-cover change, in particular clearing for cropland,crop cultivation and harvest, and cropland abandonmentand subsequent forest regrowth, influenced carbonstorage and fluxes in the southern United States from1860 to 2003 and (ii) how carbon storage and fluxesresulting from the land-cover change varied spatially andtemporally during the period examined. In spatial scales,we focused carbon dynamic analysis on the twosubregions—southeast and south-central—in the south-ern United States. In temporal scales, we concentratedthe analysis in two periods—1860–2003 and 1981–2003.In this study, we first reconstructed the annual time seriesdata set of land-cover of the southernUnited States from1860–2003 with a spatial resolution of 8 km. Then weused a spatially explicit process-based biogeochemicalmodel (TEM 4.3) to simulate the effects of land-coverchange on the carbon dynamics in this region.
MATERIALS AND METHODS
Study Region
The southern United States region extends roughly from 758to 1008 west longitude and from 308 to 378 north latitude,including the southeast (SE) and south-central (SC) subregion.The SE covers Florida, Georgia, North Carolina, SouthCarolina, and Virginia while the SC includes Alabama,Arkansas, Kentucky, Louisiana, Mississippi, Oklahoma, Ten-nessee, and Texas. The SE and SC cover approximately 28 and72% of the southern United States, respectively. Elevationswithin the region range from near sea level along the Gulf andAtlantic coasts to more than 1800 m in the AppalachianMountains. Overall, the climate is temperate, becoming largelysubtropical near the coast. Summers are long, hot, and humid,with little day-to-day temperature change. Late June to mid-August receive local afternoon thundershowers. The coldestmonths are December, January, and February. Severely coldweather seldom occurs (Cooter, 1992). The dominant foresttypes in this region include temperate coniferous forest,
temperate deciduous forest, and temperate mixed forest.There is some patchy distribution of tropical evergreen forestand tropical deciduous forest in the Gulf coastal states. Thesouthern region produces over 50% of commercial timberharvests for the nation (Mickler et al., 2002). Most timberharvests occur in forest plantations with intensive forestmanagement including site preparation, utilization of pesti-cides and fertilization, and rotation (Siry, 2002). Fire is anothermajor disturbance in this region. Use of prescribed fire is animportant forest management activity in the southeasternUnited States (approximately 2 million ha burned per year)(Mickler et al., 2002). Fire is used to remove logging slash be-fore plantation establishment, reduce hardwood and herba-ceous competition in young stands, improve wildlife habitat,and minimize catastrophic wildfire hazard in older stands.
Model Overview
The TEM is a process-based biogeochemistry model thatwas originally designed to simulate the dynamics of carbon andnitrogen in natural terrestrial ecosystems at continental toglobal scales (Raich et al., 1991; Melillo et al., 1993; McGuireet al., 1997; Tian et al., 1998, 1999, 2000). Due to the increasingimportance of land-use change on carbon dynamics, TEM 4.2incorporated the ideas of the Terrestrial CarbonModel (TCM)of Houghton et al. (1983) to track carbon fluxes generatedfrom conversion of natural ecosystems to cultivation, includingthe fate of carbon in products (McGuire et al., 2001; Tian et al.,2003). The products are placed into three pools with residencetimes of 1, 10, and 100 yr, respectively. Unlike Houghton et al.(1983), however, changes in carbon storage are influenced bythe relative rates of net primary production (NPP) andheterotrophic respiration (RH) and the effects of environmen-tal conditions on these fluxes. In addition, the model estimatesof the initial carbon storage in vegetation and soils beforedisturbance are also influenced by spatial and temporal varia-tions in environmental conditions. TEM 4.2 is able to simulatechanges in carbon storage during three stages of disturbance:(i) conversion from natural vegetation to cultivation, (ii) pro-duction and harvest on cultivated land, and (iii) forest re-growth on abandoned cropland (Tian et al., 2003). The annualnet carbon exchange (NCE) of the terrestrial biosphere withthe atmosphere can be described by the equation:
NCE 5 NPP 2 RH 2 ENAD 2 EAD 2 Ep [1]
where NPP is net primary production, RH is heterotrophicrespiration, ENAD represents emissions associated with non-anthropogenic disturbance (e.g., wildfires, insect infestations),and EAD represents emissions from anthropogenic disturbancesuch as cropland conversion from forests. In Eq. [1], EAD isexpressed as the conversion flux (e.g., the burning of slash andfuelwood). The term Ep represents the decomposition ofproducts harvested from ecosystems for use by humans andassociated livestock. In this study, we will not consider ENAD
due to the lack of the spatial data of wildfires and insectinfestations. Thus, the NCE equation can be described by theequation:
NCE 5 NPP 2 RH 2 EAD 2 Ep [2]
A negative NCE value indicates that terrestrial ecosystemsare carbon sources to the atmosphere, whereas a positive NCEvalue means a terrestrial carbon sink. The details of how TEM4.2 simulates these processes are referenced in McGuire et al.(2001) and Tian et al. (2003). On the basis of TEM 4.2, TEM4.3 has been developed to include the effects of ozone on plantgrowth in terrestrial ecosystems (Felzer et al., 2004). In ad-dition, TEM 4.3 includes a new scheme to estimate NPP in
Repro
duced
from
Journ
alof
Environm
enta
lQ
ualit
y.
Publis
hed
by
AS
A,
CS
SA
,and
SS
SA
.A
llcopyrights
reserv
ed.
1534 J. ENVIRON. QUAL., VOL. 35, JULY–AUGUST 2006
agricultural ecosystems. In TEM 4.2, a spatially explicit,empirically derived relative agricultural productivity (RAP)database was used to infer the effects of agricultural practiceson crop productivity (McGuire et al., 2001; Tian et al., 2003).Agricultural production was determined by simply multiplyingthe NPP of the original natural vegetation by a RAP value forthe appropriate grid cell. In TEM 4.3, agricultural productivityis no longer dependent on the productivity rates of the originalnatural vegetation. Instead, the model uses grassland param-eterizations to describe the carbon and nitrogen dynamics ofcrop plants. In this study, we used TEM 4.3 to simulate theeffects of cropland expansion and forest regrowth on aban-doned cropland on terrestrial ecosystem carbon dynamics inthe southern United States. The soil organic matter dynamicsof cropland, however, are still based on the parameterizationsof the original natural vegetation (Felzer et al., 2004). We didnot include ozone effect in this simulation by using zero ozoneconcentrations across the region.
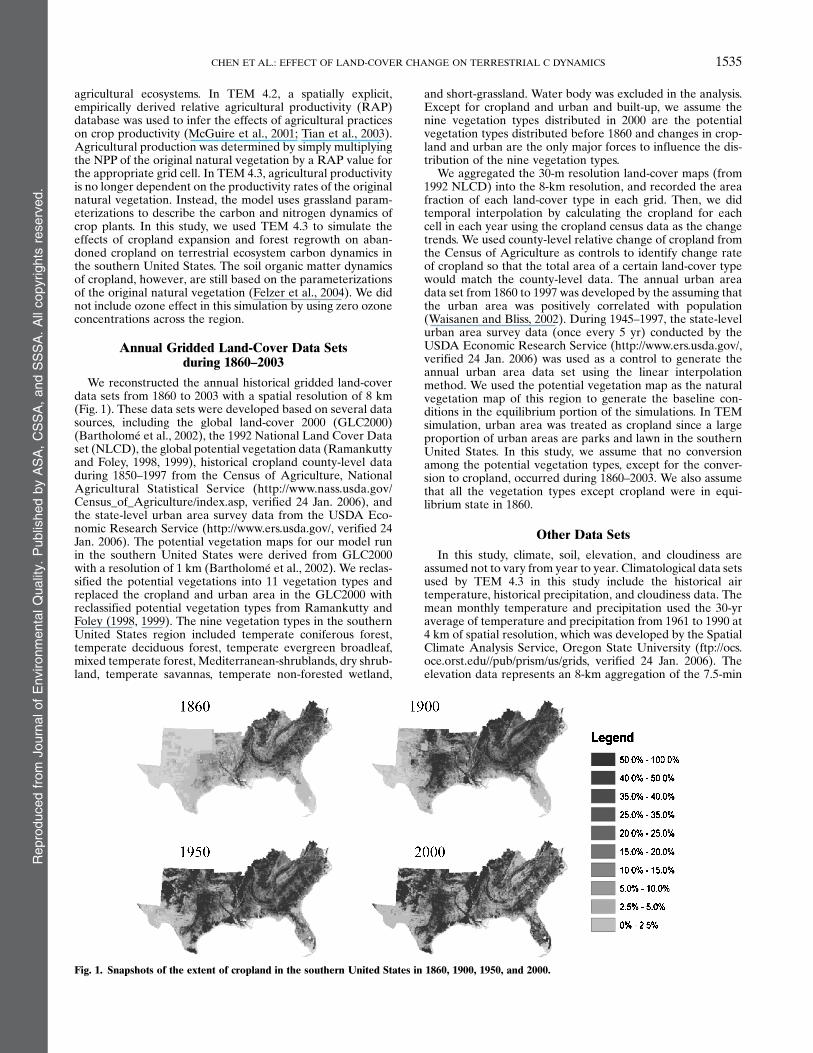
Annual Gridded Land-Cover Data Setsduring 1860–2003
We reconstructed the annual historical gridded land-coverdata sets from 1860 to 2003 with a spatial resolution of 8 km(Fig. 1). These data sets were developed based on several datasources, including the global land-cover 2000 (GLC2000)(Bartholome et al., 2002), the 1992 National Land Cover Dataset (NLCD), the global potential vegetation data (Ramankuttyand Foley, 1998, 1999), historical cropland county-level dataduring 1850–1997 from the Census of Agriculture, NationalAgricultural Statistical Service (http://www.nass.usda.gov/Census_of_Agriculture/index.asp, verified 24 Jan. 2006), andthe state-level urban area survey data from the USDA Eco-nomic Research Service (http://www.ers.usda.gov/, verified 24Jan. 2006). The potential vegetation maps for our model runin the southern United States were derived from GLC2000with a resolution of 1 km (Bartholome et al., 2002). We reclas-sified the potential vegetations into 11 vegetation types andreplaced the cropland and urban area in the GLC2000 withreclassified potential vegetation types from Ramankutty andFoley (1998, 1999). The nine vegetation types in the southernUnited States region included temperate coniferous forest,temperate deciduous forest, temperate evergreen broadleaf,mixed temperate forest, Mediterranean-shrublands, dry shrub-land, temperate savannas, temperate non-forested wetland,
and short-grassland. Water body was excluded in the analysis.Except for cropland and urban and built-up, we assume thenine vegetation types distributed in 2000 are the potentialvegetation types distributed before 1860 and changes in crop-land and urban are the only major forces to influence the dis-tribution of the nine vegetation types.
We aggregated the 30-m resolution land-cover maps (from1992 NLCD) into the 8-km resolution, and recorded the areafraction of each land-cover type in each grid. Then, we didtemporal interpolation by calculating the cropland for eachcell in each year using the cropland census data as the changetrends. We used county-level relative change of cropland fromthe Census of Agriculture as controls to identify change rateof cropland so that the total area of a certain land-cover typewould match the county-level data. The annual urban areadata set from 1860 to 1997 was developed by the assuming thatthe urban area was positively correlated with population(Waisanen and Bliss, 2002). During 1945–1997, the state-levelurban area survey data (once every 5 yr) conducted by theUSDA Economic Research Service (http://www.ers.usda.gov/,verified 24 Jan. 2006) was used as a control to generate theannual urban area data set using the linear interpolationmethod. We used the potential vegetation map as the naturalvegetation map of this region to generate the baseline con-ditions in the equilibrium portion of the simulations. In TEMsimulation, urban area was treated as cropland since a largeproportion of urban areas are parks and lawn in the southernUnited States. In this study, we assume that no conversionamong the potential vegetation types, except for the conver-sion to cropland, occurred during 1860–2003. We also assumethat all the vegetation types except cropland were in equi-librium state in 1860.
Other Data Sets
In this study, climate, soil, elevation, and cloudiness areassumed not to vary from year to year. Climatological data setsused by TEM 4.3 in this study include the historical airtemperature, historical precipitation, and cloudiness data. Themean monthly temperature and precipitation used the 30-yraverage of temperature and precipitation from 1961 to 1990 at4 km of spatial resolution, which was developed by the SpatialClimate Analysis Service, Oregon State University (ftp://ocs.oce.orst.edu//pub/prism/us/grids, verified 24 Jan. 2006). Theelevation data represents an 8-km aggregation of the 7.5-min
Fig. 1. Snapshots of the extent of cropland in the southern United States in 1860, 1900, 1950, and 2000.
Repro
duced
from
Journ
alof
Environm
enta
lQ
ualit
y.
Publis
hed
by
AS
A,
CS
SA
,and
SS
SA
.A
llcopyrights
reserv
ed.
1535CHEN ET AL.: EFFECT OF LAND-COVER CHANGE ON TERRESTRIAL C DYNAMICS

USGS National Elevation Dataset (http://ned.usgs.gov/, veri-fied 24 Jan. 2006). We used the 8-km resolution digital generalsoil association map (STATSGO map) developed by theNational Cooperative Soil Survey to create the soil texturemap of the study area. The texture information of each mapunit was estimated using the USDA soil texture triangle(Miller and White, 1998). The mean monthly cloudiness datain this study was derived from the Climatic Research Unit(CRU) TS 2.0 climate data-set (T.D. Mitchell et al., unpub-lished data). The original resolution is 0.5 degree. We con-structed the cloudiness map of 8-km resolution in the researcharea by linear interpolation.
Simulation Approach
To determine the effects of land-cover change alone, we ranTEM 4.3 using the gridded annual land-cover data set only andall other input data sets were constant values. The constantinput data sets included the long-term mean monthly climate(30-yr averages of 1961 to 1990) and a constant atmosphericCO2 concentration (286 ppmv in year 1860). To apply TEM to atransient scenario, it is first necessary to run the model toequilibrium with a long-term baseline climate appropriate tothe initial year of the simulation. Then we ran TEM in transientmode using the annual land-covermap from 1860 to 2003 as theinput. In the TEM simulation, we ran three times of spin upwith 40 yr for each spin. The data used to calibrate the modelfor different vegetation types is documented in previous work(Raich et al., 1991; McGuire et al., 1992; Tian et al., 1999).Detailed documentation on the development, parameteriza-tion, and calibration of the dynamic version of TEM has alsobeen published in a previous work (Tian et al., 1999, 2003).
RESULTSLand-Cover Change during 1860–2003
Land-Cover Change in the Southeast
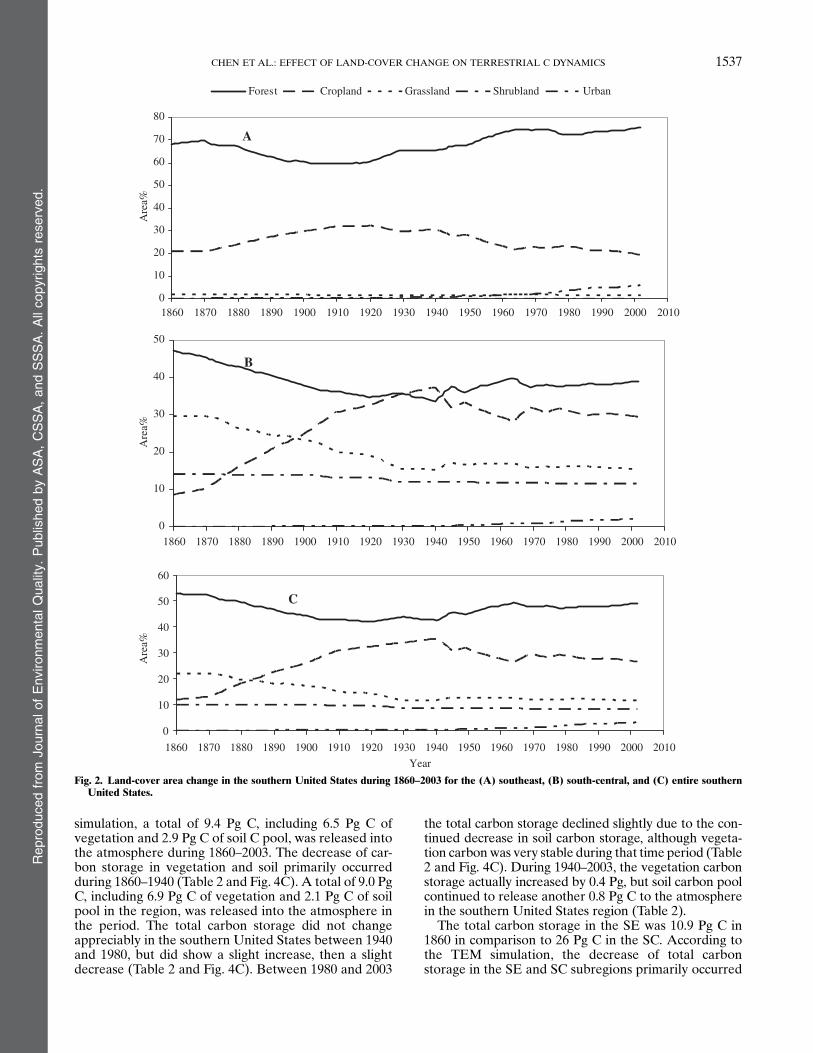
The major land-cover types in the SE included forestsand cropland (Fig. 2A). Forests covered about 40.7million ha and 68.3% of the SE land in 1860. In the next45 yr, the amount of forest land declined by 5.2 millionha. In contrast, the cropland increased from 12.5 millionha and 21% of the SE land in 1860 to 19 million ha and32% of the SE land around 1910. Since 1910, forest areastarted to increase and reach about 45 million ha with75.6% of coverage in 2003. Meanwhile, cropland areadecreased over time to reach about 19% of the SE landwith a total of 11.5 million ha in 2003. In addition, theurban area increased, especially after 1945, reachingabout 6% of the SE land in 2003.
Land-Cover Change in the South-Central
The major land-cover in this subregion includedforests, cropland, short-grasslands, and Mediterranean-shrublands (Fig. 2B). Forests covered about 73.6 millionha and 47.1% of the SC land in 1860. During 1860–1940,the amount of forests declined by 15.3 million ha. Incontrast, cropland increased from 13.5 million ha and8.6% of the SC land in 1860 to 58.3 million ha and 37%of the SC land in 1940. In the same period, grasslandslost about 27.4 million ha and kept relatively stable afterthat period. However, that was not the case for forests
and cropland. After 1940, forest area started to increaseand reach about 60.8 million ha with a 39% of coveragerate in 2003. Meanwhile, cropland area decreased overtime to reach about 30% of the SC land with a total of 46million ha in 2003. In addition, the urban area increased,especially after 1945, reaching about 2% of the SC landin 2003.
Land-Cover Change in the EntireSouthern United States
In the southern United States as a whole, land-coverchange varied with types and time during 1860–2003(Fig. 2C). Forest cover on average declined from 53% in1860 to 42% in 1940 and showed a steady increase sincethen to reach 49% in 2003. In contrast, the croplandincreased from 12% in 1860 to its peak of 35% in 1940and decreased gradually to 26% in 2003. Grasslandsshowed a steady decrease in area during 1860–1930, andleveled off after that. Shrubland decreased slightlyduring the whole period. The urban area increasedover time, and the increase picked up since 1940 to reach3.2% on average in 2003.
During 1860–1940, net area change of land-covershowed that about 22.7 million ha of forests and 22.6million ha of grasslands were converted to cropland. Inaddition, 3 million ha of shrublands and 2.9 million ha ofwetlands and savanna were cultivated for crops duringthe same period (Table 1). The trend was reversedduring 1940–2003. About 14.4 million ha of croplandwere abandoned and converted to forests, although asmall amount of shrubland and wetland and savannacontinued to be cultivated (Table 1).
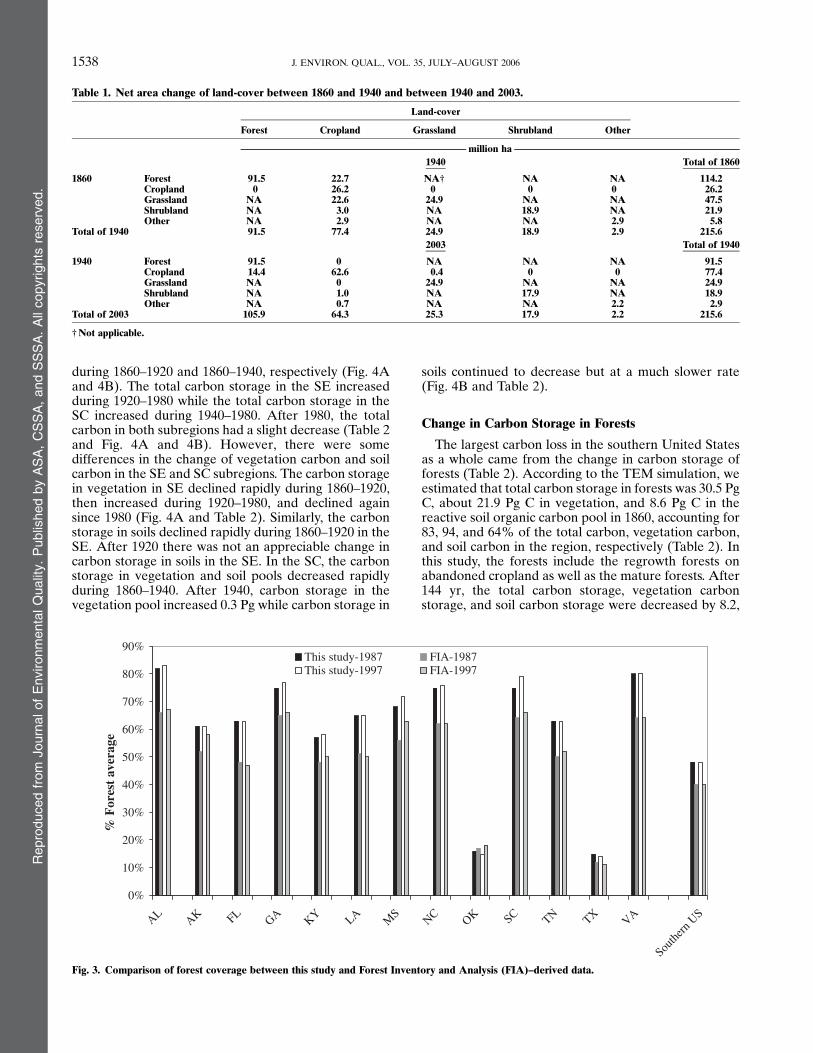
Comparison of Forest Cover Data with ForestInventory and Analysis Data
We compared the forest cover data in this study to theforest cover data derived from FIA data. The forestcoverage rates in 1987 and 1997 were comparable to theFIA forest cover data, although our results usually werehigher (Fig. 3). On average, the forest coverage rate inthe southern United States was 48% in comparison toFIA’s 40% in both 1987 and 1997. For Oklahoma andTexas, our data were very close to the FIA’s data. Thelarge differences of our forest coverage rates and FIA’sdata occurred in Alabama, Florida, and Virginia, andthe difference could be up to 16%.
Carbon Storage ChangeChange in Carbon Storage in theSouthern United States
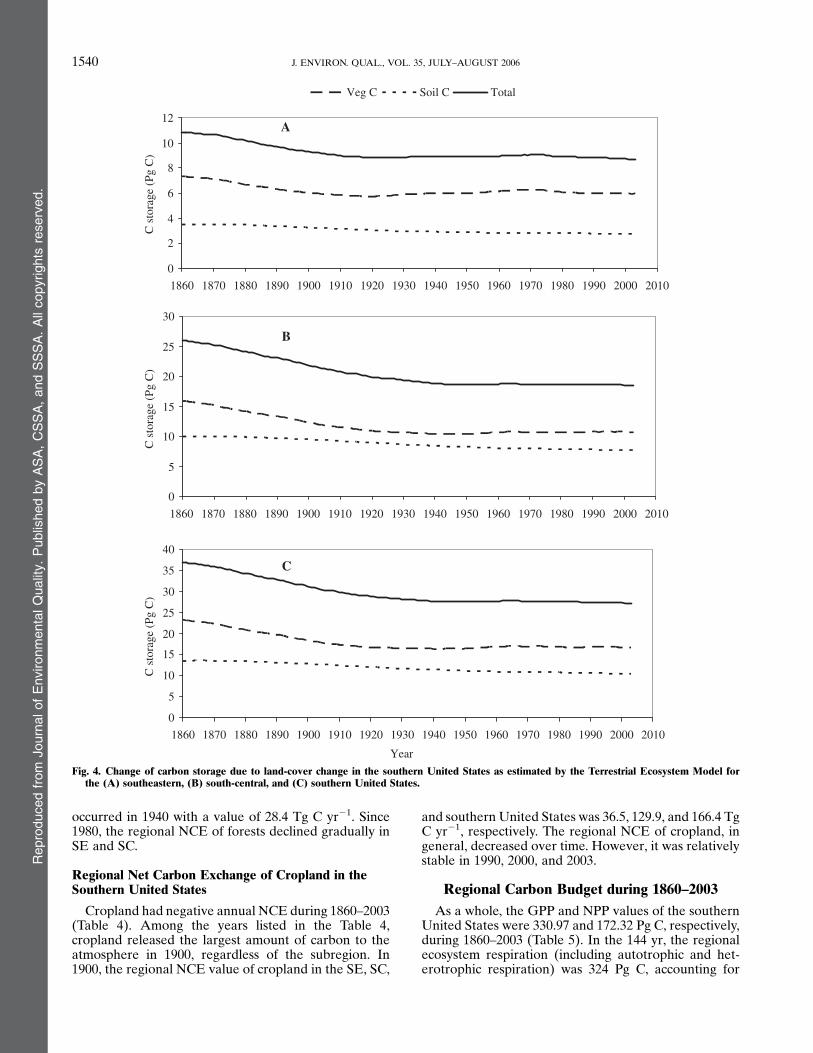
The carbon storage in terrestrial ecosystems in thesouthern United States decreased due to land-coverchange since 1860 (Table 2 and Fig. 4C). The TEMsimulation estimated that total carbon storage in thesouthern United States in 1860 was 36.8 Pg C, with about23.3 Pg C in the vegetation and 13.5 Pg C in the reac-tive soil organic carbon pool. According to the TEM
Repro
duced
from
Journ
alof
Environm
enta
lQ
ualit
y.
Publis
hed
by
AS
A,
CS
SA
,and
SS
SA
.A
llcopyrights
reserv
ed.
1536 J. ENVIRON. QUAL., VOL. 35, JULY–AUGUST 2006
simulation, a total of 9.4 Pg C, including 6.5 Pg C ofvegetation and 2.9 Pg C of soil C pool, was released intothe atmosphere during 1860–2003. The decrease of car-bon storage in vegetation and soil primarily occurredduring 1860–1940 (Table 2 and Fig. 4C). A total of 9.0 PgC, including 6.9 Pg C of vegetation and 2.1 Pg C of soilpool in the region, was released into the atmosphere inthe period. The total carbon storage did not changeappreciably in the southern United States between 1940and 1980, but did show a slight increase, then a slightdecrease (Table 2 and Fig. 4C). Between 1980 and 2003
the total carbon storage declined slightly due to the con-tinued decrease in soil carbon storage, although vegeta-tion carbonwas very stable during that time period (Table2 and Fig. 4C). During 1940–2003, the vegetation carbonstorage actually increased by 0.4 Pg, but soil carbon poolcontinued to release another 0.8 Pg C to the atmospherein the southern United States region (Table 2).
The total carbon storage in the SE was 10.9 Pg C in1860 in comparison to 26 Pg C in the SC. According tothe TEM simulation, the decrease of total carbonstorage in the SE and SC subregions primarily occurred
0
10
20
30
40
50
60
70
80
Are
a%A
rea%
Are
a%
Forest Cropland Grassland Shrubland Urban
A
0
10
20
30
40
50
B
0
10
20
30
40
50
60
1860 1870 1880 1890 1900 1910 1920 1930 1940 1950 1960 1970 1980 1990 2000 2010
1860 1870 1880 1890 1900 1910 1920 1930 1940 1950 1960 1970 1980 1990 2000 2010
1860 1870 1880 1890 1900 1910 1920 1930 1940 1950 1960 1970 1980 1990 2000 2010
Year
C
Fig. 2. Land-cover area change in the southern United States during 1860–2003 for the (A) southeast, (B) south-central, and (C) entire southernUnited States.
Repro
duced
from
Journ
alof
Environm
enta
lQ
ualit
y.
Publis
hed
by
AS
A,
CS
SA
,and
SS
SA
.A
llcopyrights
reserv
ed.
1537CHEN ET AL.: EFFECT OF LAND-COVER CHANGE ON TERRESTRIAL C DYNAMICS
during 1860–1920 and 1860–1940, respectively (Fig. 4Aand 4B). The total carbon storage in the SE increasedduring 1920–1980 while the total carbon storage in theSC increased during 1940–1980. After 1980, the totalcarbon in both subregions had a slight decrease (Table 2and Fig. 4A and 4B). However, there were somedifferences in the change of vegetation carbon and soilcarbon in the SE and SC subregions. The carbon storagein vegetation in SE declined rapidly during 1860–1920,then increased during 1920–1980, and declined againsince 1980 (Fig. 4A and Table 2). Similarly, the carbonstorage in soils declined rapidly during 1860–1920 in theSE. After 1920 there was not an appreciable change incarbon storage in soils in the SE. In the SC, the carbonstorage in vegetation and soil pools decreased rapidlyduring 1860–1940. After 1940, carbon storage in thevegetation pool increased 0.3 Pg while carbon storage in
soils continued to decrease but at a much slower rate(Fig. 4B and Table 2).
Change in Carbon Storage in Forests
The largest carbon loss in the southern United Statesas a whole came from the change in carbon storage offorests (Table 2). According to the TEM simulation, weestimated that total carbon storage in forests was 30.5 PgC, about 21.9 Pg C in vegetation, and 8.6 Pg C in thereactive soil organic carbon pool in 1860, accounting for83, 94, and 64% of the total carbon, vegetation carbon,and soil carbon in the region, respectively (Table 2). Inthis study, the forests include the regrowth forests onabandoned cropland as well as the mature forests. After144 yr, the total carbon storage, vegetation carbonstorage, and soil carbon storage were decreased by 8.2,
Table 1. Net area change of land-cover between 1860 and 1940 and between 1940 and 2003.
Land-cover
Forest Cropland Grassland Shrubland Other
million ha1940 Total of 1860
1860 Forest 91.5 22.7 NA† NA NA 114.2Cropland 0 26.2 0 0 0 26.2Grassland NA 22.6 24.9 NA NA 47.5Shrubland NA 3.0 NA 18.9 NA 21.9Other NA 2.9 NA NA 2.9 5.8
Total of 1940 91.5 77.4 24.9 18.9 2.9 215.62003 Total of 1940
1940 Forest 91.5 0 NA NA NA 91.5Cropland 14.4 62.6 0.4 0 0 77.4Grassland NA 0 24.9 NA NA 24.9Shrubland NA 1.0 NA 17.9 NA 18.9Other NA 0.7 NA NA 2.2 2.9
Total of 2003 105.9 64.3 25.3 17.9 2.2 215.6
†Not applicable.
0%
10%
20%
30%
40%
50%
60%
70%
80%
90%
ALAK FL
GA KY LA MS
NC OK SC TN TX VA
Southe
rn U
S
This study-1987 FIA-1987This study-1997 FIA-1997
% F
ores
t av
erag
e
Fig. 3. Comparison of forest coverage between this study and Forest Inventory and Analysis (FIA)–derived data.
Repro
duced
from
Journ
alof
Environm
enta
lQ
ualit
y.
Publis
hed
by
AS
A,
CS
SA
,and
SS
SA
.A
llcopyrights
reserv
ed.
1538 J. ENVIRON. QUAL., VOL. 35, JULY–AUGUST 2006
5.9, and 2.3 Pg C, respectively. These carbon lossesaccounted for 85, 89, and 77% of the entire regionalcarbon loss in total carbon, vegetation carbon, and soilcarbon, respectively. Most of the carbon loss primarilyoccurred before 1900 in the SE and before 1940 in theSC. Since 1940 the forest regrowth on abandoned crop-land increased carbon storage in the southern UnitedStates by as much as 0.7 Pg, including 0.5 and 0.2 Pg C invegetation and soil, respectively. The carbon sink due toforest regrowth from 1940 to 2003 was 0.1 and 0.4 Pg Cin the SE and SC, respectively.
Change in Carbon Storage in Cropland
The total carbon storage in cropland in the southernUnited States as a whole increased from 0.929 Pg in 1860to 1.146 Pg C in 2003 (Table 2). The carbon storage incropland vegetation was much smaller than the carbonstorage in soil (Table 2). In the SE, there was no increasein carbon storage in crops, and even a decrease incarbon storage in cropland soil since 1940. However, thecarbon storage in crop and soil in the SC continued toincrease after 1940, but at lower rates.
Comparison of Carbon Density with Forest Inventoryand Analysis–Derived Data
To check the quality of carbon density results of TEMsimulation, we compared the average vegetation carbondensity and soil density of hardwood in three states withthe FIA-derived carbon density (Table 3). The vegeta-tion carbon density of Georgia, Oklahoma, and Virginiain 1987 was 77.3, 42.5, and 106.5 Mg ha21 in comparisonto the corresponding FIA data of 63.7 to 67.1, 34.6 to41.2, and 83 to 97.6 Mg ha21, respectively. The soil car-bon density of the three states was 73.2, 84.3, and 76.6Mgha21 in comparison to FIAdata of 71.1, 70.8, and 76.1Mgha21, respectively. In addition, we also compared the
vegetation carbon and soil density in 1997 with thecorresponding FIA data. In general, the TEM simulationresults of vegetation carbon density were higher.
Temporal and Spatial Patterns of Regional NetCarbon Exchange
Regional Net Carbon Exchange in theSouthern United States
The annual regional NCE had substantial temporaland spatial variations (Table 4). The regional NCEvalues in 1860, 1900, 1940, 1980, 1990, 2000, and 2003 arelisted in Table 4. Most years, the regional NCE values inthe southern United States as a whole were negativevalues. The largest carbon source value in the southeast,south-central, and southern United States was in 1900with 30.1, 96.2, and 126.3 Tg C yr21, respectively. Ingeneral, the carbon source values were getting smallerover time, although the region was still a carbon sourceto the atmosphere in 1980, 1990, and 2000.
The average NCE had temporal and spatial variabilityacross the region as well (Fig. 5). From 1860 to 1900,most terrestrial ecosystems in this region released car-bon. This pattern was changed during 1901–1950. Someareas, in particular the SE, became a carbon sink. Thearea of carbon sink continued to expand westward. From1951 to 2000, most southeast states, except for Florida,and south-central states became a carbon sink.
Regional Net Carbon Exchange of Forests in theSouthern United States
Forests had a positive annual NCE value in all theyears listed in Table 4. Among the years, the highestregional NCE in the SE was in 1940 with a value of16.7 Tg C yr21 while the highest regional NCE in the SCwas in 1980 with a value of 15.5 Tg C yr21. For the entiresouthern United States, the largest regional NCE value
Table 2. Change of carbon storage due to land-cover change in the southern United States, forests, and cropland as estimated by theTerrestrial Ecosystem Model (TEM).
Southeast South-central Southern
Year VEGC† SOLC‡ TOTC§ VEGC SOLC TOTC VEGC SOLC TOTC
Pg CSouthern United States
Baseline (1860) 7.3 3.5 10.8 16.0 10.0 26.0 23.3 13.5 36.81900 21.3 20.2 21.5 23.7 20.5 24.2 25.0 20.7 25.71940 21.3 20.6 21.9 25.5 21.5 27.0 26.9 22.1 29.01980 21.2 20.7 21.9 25.3 22.1 27.4 26.5 22.8 29.32003 21.3 20.7 22.0 25.2 22.2 27.4 26.5 22.9 29.4
Forests
Baseline (1860) 7.1 2.8 9.9 14.8 5.8 20.6 21.9 8.6 30.51900 21.3 20.5 21.8 23.4 21.3 24.7 24.7 21.8 26.51940 21.4 20.6 22.0 25.0 21.9 26.9 26.4 22.5 28.91980 21.2 20.5 21.7 24.7 21.9 26.6 25.9 22.4 28.32003 21.3 20.5 21.8 24.6 21.8 26.4 25.9 22.3 28.2
Cropland
Baseline (1860) 0.004 0.537 0.541 0.003 0.385 0.388 0.007 0.922 0.9291900 10.003 10.280 10.283 10.020 11.661 11.681 10.023 11.941 11.9641940 10.001 10.007 10.008 10.030 12.245 12.275 10.031 12.252 12.2831980 0.000 20.145 20.145 10.020 11.523 11.543 10.020 11.378 11.3982003 0.000 20.214 20.214 10.016 11.344 11.360 10.016 11.130 11.146
†Vegetation carbon.‡Reactive soil organic carbon.§ Total carbon storage.
Repro
duced
from
Journ
alof
Environm
enta
lQ
ualit
y.
Publis
hed
by
AS
A,
CS
SA
,and
SS
SA
.A
llcopyrights
reserv
ed.
1539CHEN ET AL.: EFFECT OF LAND-COVER CHANGE ON TERRESTRIAL C DYNAMICS
occurred in 1940 with a value of 28.4 Tg C yr21. Since1980, the regional NCE of forests declined gradually inSE and SC.
Regional Net Carbon Exchange of Cropland in theSouthern United States
Cropland had negative annual NCE during 1860–2003(Table 4). Among the years listed in the Table 4,cropland released the largest amount of carbon to theatmosphere in 1900, regardless of the subregion. In1900, the regional NCE value of cropland in the SE, SC,
and southern United States was 36.5, 129.9, and 166.4 TgC yr21, respectively. The regional NCE of cropland, ingeneral, decreased over time. However, it was relativelystable in 1990, 2000, and 2003.
Regional Carbon Budget during 1860–2003As a whole, the GPP and NPP values of the southern
United States were 330.97 and 172.32 Pg C, respectively,during 1860–2003 (Table 5). In the 144 yr, the regionalecosystem respiration (including autotrophic and het-erotrophic respiration) was 324 Pg C, accounting for
0
2
4
6
8
10
12
1860 1870 1880 1890 1900 1910 1920 1930 1940 1950 1960 1970 1980 1990 2000 2010
1860 1870 1880 1890 1900 1910 1920 1930 1940 1950 1960 1970 1980 1990 2000 2010
1860 1870 1880 1890 1900 1910 1920 1930 1940 1950 1960 1970 1980 1990 2000 2010
C s
tora
ge (
Pg C
) C
sto
rage
(Pg
C)
C s
tora
ge (
Pg C
)
Veg C Soil C Total
A
0
5
10
15
20
25
30
B
0
5
10
15
20
25
30
35
40
Year
C
Fig. 4. Change of carbon storage due to land-cover change in the southern United States as estimated by the Terrestrial Ecosystem Model forthe (A) southeastern, (B) south-central, and (C) southern United States.
Repro
duced
from
Journ
alof
Environm
enta
lQ
ualit
y.
Publis
hed
by
AS
A,
CS
SA
,and
SS
SA
.A
llcopyrights
reserv
ed.
1540 J. ENVIRON. QUAL., VOL. 35, JULY–AUGUST 2006

97% of the GPP. About 4.34 Pg C was released via theburning of slash and fuelwood due to the clearing ofnatural vegetation for agriculture in the period (Table5). The C emissions from 1-, 10-, and 100-yr productswere 9.37, 2.04, and 0.56 Pg, respectively, in the entireperiod. During 1860–2003, the southern United Statesreleased a total of 9.4 Pg carbon into the atmosphere.During 1860–2003, the GPP and NPP in the SE were
94.16 and 46.95 Pg C and in the SC were 236.81 and125.37 Pg C, respectively. About 98.2 and 97.8% of GPPwas consumed by ecosystem respiration in the SE andSC during the 144 yr, respectively. In total, about 2.48and 9.48 Pg C was released from the products composedby various residence times in the SE and SC subregions,respectively. The SE contributed about 22% while theSC contributed the other 78% of the total net carbonsource of 9.4 Pg C in 144 yr.
DISCUSSIONLand-Cover Change
Our study indicated that the southern United Statesregion experienced a long-term transition from foreststo agricultural land use, and then to secondary forestsduring 1860–2003. In this transition, the pattern of land-cover change in the southern United States was pri-marily driven by the change of cropland. This couldbe explained using the three primary waves of land-use change that occurred in the 144-yr period in thesouthern United States. The first wave of land-usechange was cropland expansion moving from the eastto the west (Fig. 1). New cropland was established byconversion from natural vegetation between 1860 and1910 in the SE and between 1860 and 1940 in the SC(Fig. 2A and 2B). History of land clearing for croplandin this region could trace back much earlier. Agriculturalexploitation started in the 17th century but reachedits zenith in the late 19th century, when a vast cottonindustry stretched from the Atlantic coast to Texas(Wear, 2002). The second wave of land-use change wascharacterized by forest regrowth on abandoned crop-land. This wave of change also moved from the east tothe west. Forest area increased about 10 million ha in theSE between 1910 and 2003. Similarly, forest area in-
creased about 8 million ha in the SC between 1940 and2003. The magnitude of this wave of land-use changewas much smaller than the first wave of cropland ex-pansion, especially in the SC (Fig. 2B). The land-usepattern has experienced relatively stability since 1940.During the past 144 yr, total cropland only declined by1 million ha and the total forest area increased by lessthan 5 million ha in the SE. However, total croplandarea actually increased by about 33 million ha, and totalof forest area declined by 13 million ha in the SC.Urbanization is themost recent wave of land-use change.Urban area increased rapidly since 1940 (Fig. 2),especially in the SE. The urban area in the southernUnited States increased by more than six times to reach3.5 million ha more in 2003 than in 1941.
The land-cover pattern observed in this study wasconsistent with the few available studies (Wear, 2002).Wear (2002) found most states in the southern United
Table 3. Comparison of carbon density of forests in the southern United States from Terrestrial EcosystemModel (TEM) simulation in thisstudy with Forest Inventory and Analysis (FIA)–derived carbon density from other studies.
Year
1987 1997
Data source
Component State This study Birdsey and Lewis (2003) Brown et al. (2003)† This study Birdsey and Lewis (2003)
Mg ha21
Vegetation C Georgia 77.3 63.7 67.1 78.7 67.9Oklahoma 42.5 34.6 41.2 41.2 42.1Virginia 106.5 83 97.6 106.5 88.3
Soil C Georgia 73.2‡ 71.1 NA§ 74.2‡ 70.1Oklahoma 84.3‡ 70.8 NA 84.6‡ 71.8Virginia 76.6‡ 76.1 NA 77.9‡ 72.8
†Data were collected between 1983–1996. The biomass data were converted to carbon density using a constant of 0.5.‡Reactive soil organic carbon.§Not available.
Table 4. Change of net carbon exchange (NCE) in the southernUnited States, forests, and cropland between 1860 and 2003 asestimated by the Terrestrial Ecosystem Model (TEM).
Year Southeast South-central Southern
Tg C yr21
Southern United States
Baseline (1860) 22.4 22.0 24.41900 230.1 296.2 2126.31940 13.8 245.2 241.41980 216.0 27.4 223.41990 24.9 27.6 212.52000 210.9 211.6 222.52003 23.4 27.6 211.0
Forests
Baseline (1860) 10.1 10.2 10.31900 14.7 11.2 15.91940 116.7 111.7 128.41980 17.2 115.5 122.71990 15.7 112.5 118.22000 16.4 18.8 115.22003 17.2 19.4 116.6
Cropland
Baseline (1860) 22.5 22.2 24.71900 236.5 2129.9 2166.41940 215.3 267.5 282.81980 225.6 227.5 253.01990 210.7 221.4 232.12000 220.6 221.9 242.52003 210.7 218.8 229.5
Repro
duced
from
Journ
alof
Environm
enta
lQ
ualit
y.
Publis
hed
by
AS
A,
CS
SA
,and
SS
SA
.A
llcopyrights
reserv
ed.
1541CHEN ET AL.: EFFECT OF LAND-COVER CHANGE ON TERRESTRIAL C DYNAMICS
States experienced relatively stable land-cover distribu-tion between 1945 and 1992. Stable forest area orcropland, however, does not mean that there has beenno change in the character of the forest or cropland.There have been shifts from agriculture to forests andvice versa. The higher forest cover in our study than inthe FIA-derived forest cover data could be attributed toseveral factors. The annual forest cover in this study wasderived from the global land-cover 2000 and annualcropland distribution. The global land-cover 2000 wasdeveloped from Landsat TM with a spatial resolution of30 m. Thus, the forest cover data here included forestcover in urban areas such as city parks, while the FIAforest cover data did not. Moreover, minimum areaconsidered for classification in FIA is 0.4047 ha, largerthan the minimum area considered by the global land-cover 2000. All these differences could cause the forestcover in this study to be higher than the correspondingFIA-derived data.
Change in Regional Carbon StorageOur study indicates that land-cover change has
significant influence on carbon dynamics in the southernUnited States. The conversion of natural forests to crop-land can release substantial amounts of carbon to theatmosphere through the loss of carbon from both vege-
tation and soils. During 1860–2003, terrestrial ecosys-tems in the southern United States acted as a source ofcarbon to the atmosphere (Table 2). According to theTEM simulation, the regional carbon storage decreasedfrom 36.8 Pg C in 1860 to 27.4 Pg C in 2003, resultingfrom the land-cover change. Most of the 9.4 Pg C de-crease in storage occurred in the SC subregion, while the
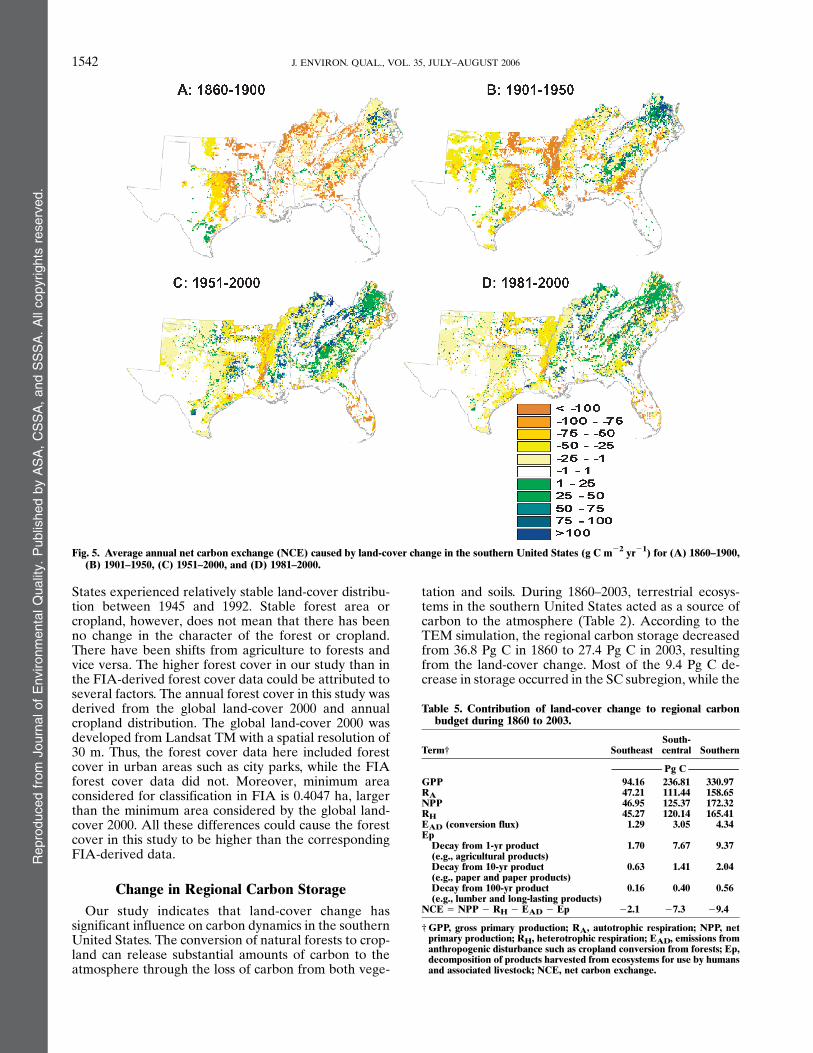
Fig. 5. Average annual net carbon exchange (NCE) caused by land-cover change in the southern United States (g C m22 yr21) for (A) 1860–1900,(B) 1901–1950, (C) 1951–2000, and (D) 1981–2000.
Table 5. Contribution of land-cover change to regional carbonbudget during 1860 to 2003.
Term† SoutheastSouth-central Southern
Pg CGPP 94.16 236.81 330.97RA 47.21 111.44 158.65NPP 46.95 125.37 172.32RH 45.27 120.14 165.41EAD (conversion flux) 1.29 3.05 4.34Ep
Decay from 1-yr product(e.g., agricultural products)
1.70 7.67 9.37
Decay from 10-yr product(e.g., paper and paper products)
0.63 1.41 2.04
Decay from 100-yr product(e.g., lumber and long-lasting products)
0.16 0.40 0.56
NCE 5 NPP 2 RH 2 EAD 2 Ep 22.1 27.3 29.4
†GPP, gross primary production; RA, autotrophic respiration; NPP, netprimary production; RH, heterotrophic respiration; EAD, emissions fromanthropogenic disturbance such as cropland conversion from forests; Ep,decomposition of products harvested from ecosystems for use by humansand associated livestock; NCE, net carbon exchange.
Repro
duced
from
Journ
alof
Environm
enta
lQ
ualit
y.
Publis
hed
by
AS
A,
CS
SA
,and
SS
SA
.A
llcopyrights
reserv
ed.
1542 J. ENVIRON. QUAL., VOL. 35, JULY–AUGUST 2006
SE only lost 2.1 Pg C in the 144 yr. This pattern wasprimarily due to the high proportion of cropland in theSC (Fig. 2B). In 2003, cropland in the subregion was30% of the land with 46 million ha, three times morethan the cropland area in 1860. In contrast, cropland inthe SE was only 19% of the land in 2002 with 11.5million ha, smaller than the amount of cropland in 1860in the subregion. In addition to the spatial variation, thechanges in carbon storage also varied temporally. In theSE, the carbon storage did not change appreciably since1940 while the carbon storage in the SC did not changesince 1980.The initial regional carbon storage of 36.8 Pg C in
1860 (Table 2) was probably overestimated due to themodel assumption. This was also reflected by the highercarbon density in this study than in the FIA-derived data(Table 3). In the model simulation, we assume all thevegetation types were mature and in equilibrium stateexcept cropland in 1860. This assumption is unlikely tobe true given the history of land clearing for croplandcould trace back much earlier than 1860 in this region(Wear, 2002). Thus, forest regrowth on abandoned crop-land could occur before 1860, suggesting that someforests in 1860 were secondary forests instead of matureforests. As the carbon storage in secondary forests waslower than mature forests (Birdsey and Lewis, 2003), themodel estimate of carbon storage in 1860 was likelyoverestimated. As agricultural exploitation started inthe 17th century in this region (Wear, 2002; Smith andDarr, 2005) it is necessary to develop longer-termhistorical land-cover data sets than 144 yr to make abetter estimate of the historical carbon storage dynamicsin this region.Independent studies, in which the total net flux of
carbon (change in total carbon storage) was estimatedusing a bookkeeping model (Houghton and Hackler,2000a, 2000b) and FIA data (Birdsey and Heath 1995;Birdsey and Lewis, 2003; Turner et al., 1995), could beused for the result comparisons. Houghton and Hackler(2000a, 2000b) used a bookkeeping model to examine theeffects of land-cover change on terrestrial carbon storagein the United States during 1700–1990. They estimatedthe total flux for the 290-yr period was a release of32.6 Pg C. About 8.5 Pg Cwas released from the southernUnited States region during 1860–1990 based on thegraph estimation, which was very close to our estimation(9.4 PgC).Althoughwe did not consider possible changesin harvest within managed forests as Houghton andHackler (2000a) did, however, the clearing for croplandwith subsequent cultivation and forest regrowth inabandoned cropland was the major source of carbon tothe atmosphere, accounting for more than 83% of thelong-term total flux (Houghton and Hackler, 2000a).Moreover, emissions of carbon associated with theharvest of industrial wood, including the storage of carbonin products and their oxidation, were general small. Thecarbon release from 10- and 100-yr product in this study,on average, was only 4.4 and 1.1 Tg yr21, respectively.The carbon sink resulting from forest regrowth on
abandoned cropland in this study was smaller than theresults derived from FIA data (Birdsey and Heath, 1995;
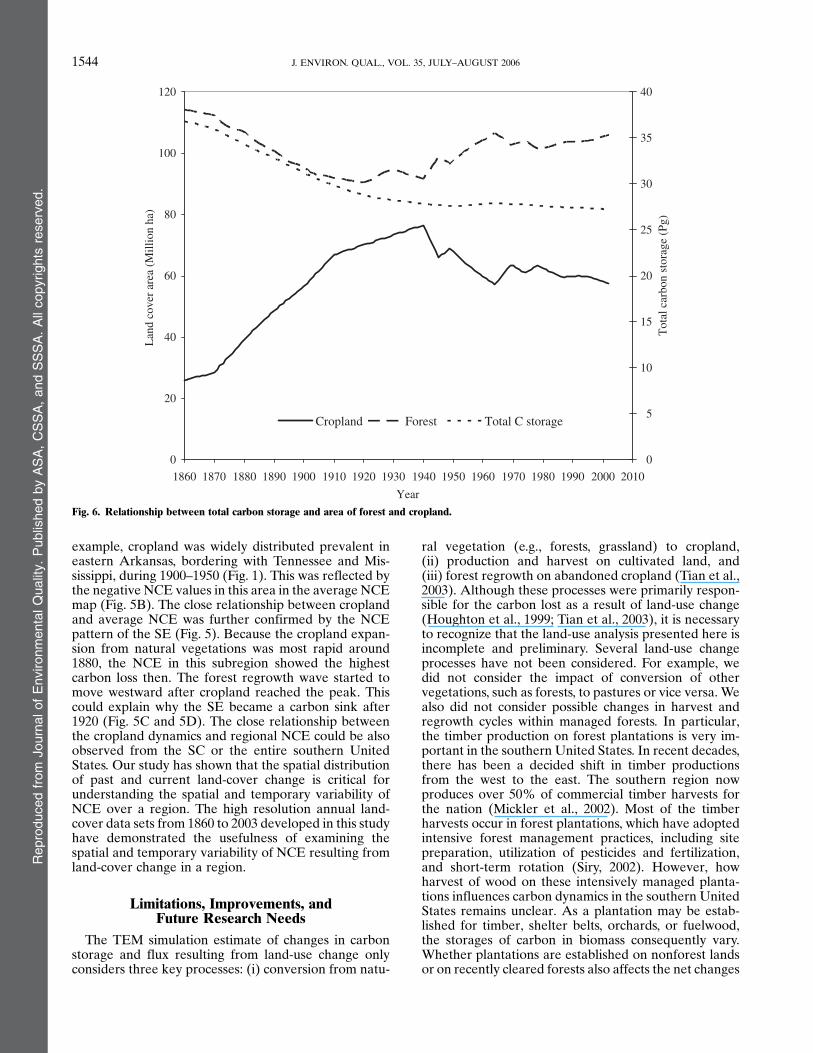
Turner et al., 1995). Turner et al. (1995) used FIA data toestimate a net carbon sink for the SE and SC subregionof 74 and 75 Tg yr21 in the 1980s, respectively. Ourresults indicated that the carbon sink of forests in thesetwo subregions was 5.9 and 14.6 Tg yr21, respectively.Birdsey and Heath (1995) estimated a carbon sink of260 Tg yr21 on average over the period 1952–1992. TheTEM simulation indicated that the carbon sink of forestregrowth in the SE and SC was 12.9 and 22.1 Tg yr21 forthe same time period, respectively. As the FIA-derivedcarbon sink is almost always 10-fold higher than ours, webelieve that the carbon accumulation in forest regrowthon abandoned cropland may have been underestimatedin this study. This was further confirmed by the stabletotal carbon storage in the southern United States evenafter 1940 when net forest area increased due to crop-land abandonment (Fig. 6). This underestimation of car-bon accumulation may have something to do with theTEM model. TEM was originally developed to simulatenatural ecosystems (Raich et al., 1991; Melillo et al.,1993). Although TEM is later modified to simulate thetransitional processes such as land-cover change on car-bon dynamics (McGuire et al., 2001; Tian et al., 2003),the model algorithms and calibrated parameters arebased on mature terrestrial ecosystems instead of youngforests. New sets of calibration of young forests may beneeded for the TEM to better simulate the carbon accu-mulation in regrowing forests on abandoned cropland.
Temporal and Spatial Variability ofNet Carbon Exchange
The temporal and spatial variability of annual netcarbon exchange is strongly influenced by clearing forcultivation and forest regrowth on abandoned cropland(Houghton et al., 1999; Cairns et al., 2000; Tian et al.,2003). Houghton et al. (1999) found that these two land-use changes were responsible for more than 68% of thenet land-use change flux, while harvest of wood, con-version of forests to pastures, and shifting cultivationaccounted for 16, 13, and 4% of the net flux, respec-tively. Tian et al. (2003) indicated that cropland es-tablishment and abandonment during 1860–1990 wasresponsible for most of the carbon losses in monsoonAsia. The conversion of closed forests to agriculturalland caused a loss of approximately 85% of the ter-restrial carbon storage in tropical Mexico (Cairns et al.,2000). A meta data review by Murty et al. (2002) indi-cated that conversion of forest to cultivated land led toan average loss of approximately 30% of soil carbon.Similarly, Guo and Gifford (2002) found that soil carbondeclined 42 and 59% after land-use change from nativeforest, grassland to cropland, respectively.
The magnitude of the land-use change on annual netcarbon exchange is highly related to the land-coverchange, especially the amount and distribution of crop-land (Fig. 1 and 4). In the southern United States, crop-land expanded westward (Fig. 1). The average annualNCE map followed a similar pattern by indicating thatmore carbon was released in the areas with a highproportion of cropland distribution (Fig. 1 and 5). For
Repro
duced
from
Journ
alof
Environm
enta
lQ
ualit
y.
Publis
hed
by
AS
A,
CS
SA
,and
SS
SA
.A
llcopyrights
reserv
ed.
1543CHEN ET AL.: EFFECT OF LAND-COVER CHANGE ON TERRESTRIAL C DYNAMICS
example, cropland was widely distributed prevalent ineastern Arkansas, bordering with Tennessee and Mis-sissippi, during 1900–1950 (Fig. 1). This was reflected bythe negative NCE values in this area in the average NCEmap (Fig. 5B). The close relationship between croplandand average NCE was further confirmed by the NCEpattern of the SE (Fig. 5). Because the cropland expan-sion from natural vegetations was most rapid around1880, the NCE in this subregion showed the highestcarbon loss then. The forest regrowth wave started tomove westward after cropland reached the peak. Thiscould explain why the SE became a carbon sink after1920 (Fig. 5C and 5D). The close relationship betweenthe cropland dynamics and regional NCE could be alsoobserved from the SC or the entire southern UnitedStates. Our study has shown that the spatial distributionof past and current land-cover change is critical forunderstanding the spatial and temporary variability ofNCE over a region. The high resolution annual land-cover data sets from 1860 to 2003 developed in this studyhave demonstrated the usefulness of examining thespatial and temporary variability of NCE resulting fromland-cover change in a region.
Limitations, Improvements, andFuture Research Needs
The TEM simulation estimate of changes in carbonstorage and flux resulting from land-use change onlyconsiders three key processes: (i) conversion from natu-
ral vegetation (e.g., forests, grassland) to cropland,(ii) production and harvest on cultivated land, and(iii) forest regrowth on abandoned cropland (Tian et al.,2003). Although these processes were primarily respon-sible for the carbon lost as a result of land-use change(Houghton et al., 1999; Tian et al., 2003), it is necessaryto recognize that the land-use analysis presented here isincomplete and preliminary. Several land-use changeprocesses have not been considered. For example, wedid not consider the impact of conversion of othervegetations, such as forests, to pastures or vice versa. Wealso did not consider possible changes in harvest andregrowth cycles within managed forests. In particular,the timber production on forest plantations is very im-portant in the southern United States. In recent decades,there has been a decided shift in timber productionsfrom the west to the east. The southern region nowproduces over 50% of commercial timber harvests forthe nation (Mickler et al., 2002). Most of the timberharvests occur in forest plantations, which have adoptedintensive forest management practices, including sitepreparation, utilization of pesticides and fertilization,and short-term rotation (Siry, 2002). However, howharvest of wood on these intensively managed planta-tions influences carbon dynamics in the southern UnitedStates remains unclear. As a plantation may be estab-lished for timber, shelter belts, orchards, or fuelwood,the storages of carbon in biomass consequently vary.Whether plantations are established on nonforest landsor on recently cleared forests also affects the net changes
0
20
40
60
80
100
120
0
10
5
15
20
25
30
35
40
1860 1870 1880 1890 1900 1910 1920 1930 1940 1950 1960 1970 1980 1990 2000 2010
Year
Lan
d co
ver
area
(M
illio
n ha
)
Tot
al c
arbo
n st
orag
e (P
g)
Cropland Forest Total C storage
Fig. 6. Relationship between total carbon storage and area of forest and cropland.
Repro
duced
from
Journ
alof
Environm
enta
lQ
ualit
y.
Publis
hed
by
AS
A,
CS
SA
,and
SS
SA
.A
llcopyrights
reserv
ed.
1544 J. ENVIRON. QUAL., VOL. 35, JULY–AUGUST 2006
in biomass and soil carbon that result (Houghton andGoodale, 2004). Houghton et al. (1999) indicated thatharvest of wood alone was responsible for 16% of thenet land-use flux on average after studying a global levelland-use change. Clearly, this is an important land-useprocess which deserves more attention. Better spatialand temporary data sets of timber harvest and planta-tion establishment are needed to assess the exact impactof harvest of wood and plantation on carbon dynamics.These data sets should include better spatial and tem-porary information such as locations of timber harvestand plantations, harvested timber volume, plantationarea, type of forest product, and change over time.Urbanization is another important land-use change
in the southern United States (Wear, 2002). The re-cent U.S. Forest Service Southern Forest Resource As-sessment recognized that increased urbanization mayrepresent the most important threat to the southernUnited States forest land over the next 20 yr (Wear,2002). The urban area has increased more than eightfoldsince 1940 in the SE and SC. Conversion of forests intourban buildup could release a tremendous amount ofcarbon into the atmosphere (Milesi et al., 2003). In thisstudy, we simply consider urban area as cropland inTEM simulation. This simplification provides us a firstlook. In the future, it is necessary to separate urbanfrom cropland to examine the exact effects of urbani-zation on carbon dynamics.Other than land clearing for cropland and urban
development, no land-use change is more common insouthern forests than fire (Stanturf et al., 2002). Firecould directly influence how much carbon is stored intrees or dead wood (Dale et al., 2001). Repeated firescould reduce the average biomass of forests (Houghtonand Hackler, 2000b). Moreover, fire exclusion in theUnited States is estimated to have been responsible fora cumulative net sink of 8 to 13 Pg C over the period1850–1990 and 0.05 Pg C yr21 during the 1990s(Houghton and Goodale, 2004). Furthermore, use ofprescribed fire is an important forest managementactivity in the southeastern United States (approximate-ly 2 million ha burned per year) by reducing hardwoodand herbaceous competition in young stands, improvingwildlife habitat, and minimizing catastrophic wildfire(Mickler et al., 2002). Fire is also used to remove loggingslash before plantation establishment. To determine theexact spatial and temporary effects of fire on carbondynamics in the southern United States, better spatialand temporary data sets are needed, including what andhow much vegetation is killed, and thus how much car-bon is released in the years following a fire. Houghtonand Hackler (2000b) indicated that adding fire and firemanagement to an analysis of land-use change reducedthe emissions of carbon over the period 1700–1990 by25% (8 Pg C) in the United States. As the area burnedannually in the southern United States is traditionallyalmost 70% of the total area burned in the entire UnitedStates (Birdsey, personal communications) the analysisof land-use change including fire and fire managementon carbon dynamics in the southern United States couldreduce the carbon loss resulting from the land-use change.
Land clearing for cropland, cultivation, and forestregrowth on abandoned cropland have significant im-pact on regional carbon dynamics (Houghton et al.,1999; Houghton and Hackler, 2000a, 2000b; Tian et al.,1999, 2003). Several key land-use processes such aswood harvest on forest plantations, urbanization, fire,and fire management need to be included in future re-search to better reflect the effects of land-use change onthe spatial and temporary variability of carbon dynamicsin the southern United States. In addition, longer-termhistorical land-cover data sets before 1860 need to bereconstructed to better reflect the land-use change his-tory in this region. Finally, new sets of calibration ofyoung forests may be needed for the TEM model tobetter simulate the carbon accumulation in regrowingforests on abandoned cropland.
CONCLUSIONSDuring 1860–2003, the pattern of land-cover change in
the southern United States was primarily driven by thechange of cropland. Three waves of land-use changeoccurred in the 144-yr time period in the southernUnitedStates. The first wave of land-use change was croplandexpansion from natural vegetation during 1860–1910 inthe southeast and 1860–1940 in the south-central. Thesecond wave of land-use change was characterized byforest regrowth on abandoned cropland, moving fromthe east to the west as well. Forest area increased about10 and 8 million ha in the southeast (during 1910–2003)and south-central (during 1940–2003), respectively.Urbanization is themost recent wave of land-use change.Urban area increased rapidly since 1940, especially inthe SE.
Land-cover change has significant influence on carbonstorage and fluxes in terrestrial ecosystems. The TEMsimulation estimated that total carbon storage in thesouthern United States in 1860 was 36.8 Pg C, whichlikely was overestimated, including 10.8 Pg C in thesoutheast and 26 Pg C in the south-central. During 1860–2003, a total of 9.4 Pg C, including 6.5 Pg C of vegetationand 2.9 Pg C of soil C pool, was released to the at-mosphere in the southern United States, suggesting thisregion on average acted as a carbon source due to theland-use change. The net carbon flux was approximatelyzero in the entire southern region between 1980 and2003. The temporal and spatial variability of annual netcarbon exchange is strongly influenced by land-coverpattern, especially the amount and distribution of crop-land. A huge amount of carbon was released via theclearing of land for agriculture (e.g., burning of slash andfuelwood) and 1-yr agricultural product. The carbon lossfrom 10- and 100-yr production pools was much smaller.
We recognize that the land-use analysis in this studyis incomplete and preliminary. Several key land-useprocesses such as wood harvest on forest plantations,urbanization, fire, and fire management need to beincluded in future research to better reflect the effectsof land-use change on the spatial and temporaryvariability of carbon dynamics in the southern UnitedStates. In addition, longer-term historical land-cover
Repro
duced
from
Journ
alof
Environm
enta
lQ
ualit
y.
Publis
hed
by
AS
A,
CS
SA
,and
SS
SA
.A
llcopyrights
reserv
ed.
1545CHEN ET AL.: EFFECT OF LAND-COVER CHANGE ON TERRESTRIAL C DYNAMICS
data sets before 1860 need to be reconstructed to betterreflect the land-use change history in this region. Finally,we also suggest that new calibration sets for the TEMmodel need to be developed to better simulate forestregrowth on abandoned cropland in the southernUnited States.
ACKNOWLEDGMENTS
This study has been supported by the Auburn UniversityPeak of Excellence Program, EPA 2004-STAR-L1 Program,Alabama Agricultural Experiment Station Foundation GrantProgram, and McIntire-Stennis Program. We thank Christo-pher Daly at Oregon State University for allowing us to use thehigh resolution climate data sets (1890–2004) for the southernUnited States developed by the Spatial Climate Analysis Ser-vice, Oregon State University. We would also like to ac-knowledge the helpful advice of D.W. Kicklighter.
REFERENCESBartholome, E., A.S. Belward, and F. Achard. 2002. GLC2000—
Global landcover mapping for the year 2000. Project status,November 2002. EUR 20524 EN. European Commission, JRC,Ispra, Italy.
Birdsey, R.A., and L.S. Heath. 1995. Carbon changes in U.S. forests.p. 56–70. In L.A. Joyce (ed.) Productivity of America’s forests andclimate change. Gen. Tech. Rep. RM-271. USDA, For. Serv., RockyMountain For. and Range Exp. Stn., Fort Collins, CO.
Birdsey, R.A., and G.M. Lewis. 2003. Carbon in US forests and woodproducts, 1987–1997: State-by-state estimates. Gen. Tech. Rep. NE-310. USDA, For. Serv., Washington, DC.
Brown, S.L. 2002. Measuring carbon in forests: Current status andfuture challenges. Environ. Pollut. 116:363–372.
Brown, S.L., and P.E. Schroeder. 1999. Spatial patterns of above-ground production and mortality of woody biomass for eastern USforests. Ecol. Appl. 9:968–980.
Brown, S.L., P. Schroeder, and J.S. Kern. 2003. Woody biomass foreastern US forests, 1983–1996. Data set. Available at http://www.daac.ornl.gov (verified 24 Jan. 2006). Oak Ridge Natl. Lab. Dis-tributed Active Archive Center, Oak Ridge, TN.
Cairns, M.A., P.K. Haggerty, R. Alvarez, B.H.J. De Jong, and I.Olmsted. 2000. Tropical Mexico’s recent land-use change: Aregion’s contribution to the global carbon cycle. Ecol. Appl. 10:1426–1441.
Caspersen, J.P., S.W. Pacala, J.C. Jenkins, G.C. Hurtt, P.R. Moorcroft,and R.A. Birdsey. 2000. Contributions of land-use history to carbonaccumulation in US forests. Science 290:1148–1151.
Cooter, E.J. 1992. General circulation models scenarios for theSouthern United States. In R.A. Mickler and S. Fox (ed.) The pro-ductivity and sustainability of Southern forest ecosystems in achanging environment. Ecological Studies 128. Springer, NewYork.
Dale, V.H., L.A. Joyce, S. McNulty, R.P. Neilson, M.P. Ayres, M.D.Flannigan, P.J. Hanson, L.C. Irland, A.E. Lugo, C.J. Peterson, D.Simberloff, F.J. Swanson, B.J. Stocks, and B.M. Wotton. 2001.Climate change and forest disturbances. Bioscience 51:723–734.
Fan, S.M., M. Gloor, J. Malhlman, S. Pacala, J. Sarmiento, T.Takahashi, and P. Tans. 1998. A large terrestrial carbon sink inNorth America implied by atmospheric and oceanic CO2 data andmodels. Science 282:442–446.
Felzer, B., D.W. Kicklighter, J. Melillo, C. Wang, Q. Zhuang, and R.Prinn. 2004. Effects of ozone on net primary production and carbonsequestration in the conterminous United States using a biogeo-chemistry model. Tellus 56B:230–248.
Guo, L.B., and R.M. Gifford. 2002. Soil carbon stocks and land-usechange: A meta analysis. Glob. Change Biol. 8:345–360.
Houghton, R.A., and C.L. Goodale. 2004. Effects of land-use changeon the carbon balance of terrestrial ecosystems. p. 85–98. In R.DeFries, G. Asner, and R.A. Houghton (ed.) Ecosystems and land-use change. Geophysical Monograph Series 153. AGU, Washing-ton, DC.
Houghton, R.A., and J.L. Hackler. 2000a. Changes in terrestrial car-bon storage in the United States: I. the roles of agriculture andforestry. Glob. Ecol. Biogeogr. 9:125–144.
Houghton, R.A., and J.L. Hackler. 2000b. Changes in terrestrialcarbon storage in the United States: II. the roles of fire and firemanagement. Glob. Ecol. Biogeogr. 9:145–170.
Houghton, R.A., J.L. Hackler, and K.T. Lawrece. 1999. The US carbonbudget: Contributions from land-use change. Science 285:574–578.
Houghton, R.A., J.E. Hobbie, J.M. Melillo, B. Moore, B.J. Peterson,G.R. Shaver, and G.M. Woodwell. 1983. Changes in the carboncontent of terrestrial biota and soils between 1860 to 1980: A netrelease of CO2 to the atmosphere. Ecol. Monogr. 53:235–262.
McGuire, A.D., J.M. Melillo, L.A. Joyce, D.W. Kicklighter, A.L.Grace, B. Moore III, and C.J. Vorosmarty. 1992. Interactions be-tween carbon and nitrogen dynamics in estimating net primaryproductivity for potential vegetation in North America. GlobalBiogeochem. Cycles 6:101–124.
McGuire, A.D., J.M. Melillo, D.W. Kicklighter, Y. Pan, X. Xiao, J.Helfrich, B. Moore III, C.J. Vorosmarty, and A.L. Schloss. 1997.Equilibrium responses of global primary production and carbonstorage to doubled atmospheric carbon dioxide: Sensitivity tochanges in vegetation nitrogen concentration. Global Biogeochem.Cycles 11:173–189.
McGuire, A.D., S. Sitch, J.S. Clein, R. Dargaville, G. Esser, J. Foley,M. Heimann, J. Kaplan, D.W. Kicklighter, R.A. Meier, J. Melillo,B. Moore III, I.C. Prentice, N. Ramankutty, T. Reichenau, A.Schloss, H.Q. Tian, L.J. Williams, and U. Wittenberg. 2001. Carbonbalance of the terrestrial biosphere in the twentieth century: Anal-ysis of CO2, climate and land-use effects with four process-basedecosystem models. Global Biogeochem. Cycles 15:183–206.
Melillo, J.M., A.D. McGuire, D.W. Kicklighter, B. Moore III, C.J.Vorosmarty, and A.L. Schloss. 1993. Global climate change andterrestrial net primary production. Nature 363:234–240.
Mickler, R.A., T.S. Earnhardt, and J.A. Moore. 2002. Regional esti-mation of current and future forest biomass. Environ. Pollut. 116:S7–S16.
Milesi, C., C.D. Elvidge, R.R. Nemani, and S.W. Running. 2003. As-sessing the impact of urban land development on net primaryproductivity in the southeastern United States. Remote SensingEnviron. 86:401–410.
Miller, D.A., and R.A. White. 1998. A conterminous United Statesmulti-layer soil characteristics data set for regional climate andhydrology modeling. Earth Interact. 2:1–26.
Murty, D., M.U.F. Kirschbaum, R.E. Mcmurtrie, and H. Mcgilvray.2002. Does conversion of forest to agricultural land change soilcarbon and nitrogen? A review of the literature. Glob. Change Biol.8:105–123.
Pacala, S.W., G.C. Hurtt, D. Baker, P. Peylin, R.A. Houghton, R.A.Birdsey, L. Heath, E.T. Sundquist, R.F. Stallard, P. Ciais, P.Moorcroft, J.P. Caspersen, E. Shevliakova, B. Moore, G. Kohlmaier,E. Holland, M. Gloor, M.E. Harmon, S.M. Fan, J.L. Sarmiento, C.L.Goodale, D. Schimel, and C.B. Field. 2001. Consistent land- andatmosphere-based US carbon sink estimates. Science 292:2316–2320.
Raich, J.W., E.B. Rastetter, J.M. Melillo, D.W. Kicklighter, P.A.Steudler, B.J. Peterson, A.L. Grace, B. Moore III, and C.J.Vorosmarty. 1991. Potential net primary productivity in southAmerica: Application of a global model. Ecol. Appl. 1:399–429.
Ramankutty, N., and J.A. Foley. 1998. Characterizing patterns ofglobal land use: An analysis of global croplands data. GlobalBiogeochem. Cycles 12:667–685.
Ramankutty, N., and J.A. Foley. 1999. Estimating historical changes inglobal land cover: Croplands from 1700 to 1992. Global Biogeo-chem. Cycles 13:997–1027.
Schimel, D., J. Melillo, H.Q. Tian, A.D. McGuire, D.W. Kicklighter, T.Kittel, N. Rosenbloom, S. Running, P. Thornton, D. Ojima, W.Parton, R. Kelly, M. Sykes, R. Neilson, and B. Rizzo. 2000.Contributions of increasing CO2 and climate to carbon storage byecosystems in the United States. Science 287:2004–2006.
Siry, J.P. 2002. Intensive timber management practices. p. 327–340. InD.N. Wear and J.G. Greis (ed.) Southern forest resource as-sessment. Tech. Rep. GTR SRS-53. USDA, For. Serv., Washing-ton, DC.
Smith, W.B., and D. Darr. 2005. US forest resources facts and historicaltrends. FS-801. USDA, For. Serv., Washington, DC.
Repro
duced
from
Journ
alof
Environm
enta
lQ
ualit
y.
Publis
hed
by
AS
A,
CS
SA
,and
SS
SA
.A
llcopyrights
reserv
ed.
1546 J. ENVIRON. QUAL., VOL. 35, JULY–AUGUST 2006
Stanturf, J.A., D.D. Wade, T.A. Waldrop, D.K. Kennard, and G.L.Achtemeier. 2002. Fire in Southern forest landscapes. p. 607–630.In D.N. Wear and J.G. Greis (ed.) Southern forest resourceassessment. Tech. Rep. GTR SRS-53. USDA, For. Serv., Washing-ton, DC.
Tian, H., J.M. Melillo, D.W. Kicklighter, A.D. McGuire, and J.Helfrich. 1999. The sensitivity of terrestrial carbon storage to his-torical atmospheric CO2 and climate variability in the UnitedStates. Tellus 51B:414–452.
Tian, H.Q., J. Melillo, D.W. Kicklighter, A.D. McGuire, J.V.K. HelfrichIII, B. Moore III, and C.J. Vorosmarty. 1998. Effects of interannualclimate variability on carbon storage in Amazonian ecosystems.Nature 396:664–667.
Tian, H.Q., J. Melillo, D.W. Kicklighter, A.D. McGuire, J.V.K. HelfrichIII, B. Moore III, and C.J. Vorosmarty. 2000. Climatic and bioticcontrols on annual carbon storage in Amazonian ecosystems. Glob.Ecol. Biogeogr. 9:315–336.
Tian, H.Q., J. Melillo, D.W. Kicklighter, S.F. Pan, J.Y. Liu, A.D.McGuire, and B. Moore III. 2003. Regional carbon dynamics inmonsoon Asia and its implications for the global carbon cycle.Global Planet. Change 37:201–217.
Turner, D.P., G. Koerper, M.E. Harmon, and J.J. Lee. 1995. A carbonbudget for forests of the conterminous United States. Ecol. Appl. 5:421–436.
Waisanen, P.J., and N.B. Bliss. 2002. Changes in population andagricultural land in conterminous United States counties, 1790 to1997. Global Biogeochem. Cycles 16:1137–1155.
Wear, D.N. 2002. Land use. p. 153–174. In D.N. Wear and J.G. Greis(ed.) Southern forest resource assessment. Tech. Rep. GTR SRS-53. USDA, For. Serv., Washington, DC.
Zhang, C., H.Q. Tian, S.F. Pan, M.L. Liu, G. Lockaby, E.B. Schilling,and J. Stanturf. 2006. Effects of forest regrowth and urbanizationon ecosystem carbon storage in a rural-urban gradient in thesoutheast US. Ecosystems (in press).
Repro
duced
from
Journ
alof
Environm
enta
lQ
ualit
y.
Publis
hed
by
AS
A,
CS
SA
,and
SS
SA
.A
llcopyrights
reserv
ed.
1547CHEN ET AL.: EFFECT OF LAND-COVER CHANGE ON TERRESTRIAL C DYNAMICS