Variations in Subpixel Fire Properties with Season and Land Cover in Southern Africa
29
Variations in Subpixel Fire Properties with Season and Land Cover in Southern Africa Ted C. Eckmann* Geography Department, Bowling Green State University, Bowling Green, Ohio, and Geography Department, University of California at Santa Barbara, Santa Barbara, California Christopher J. Still, Dar A. Roberts, and Joel C. Michaelsen Geography Department, University of California at Santa Barbara, Santa Barbara, California Received 17 January 2010; accepted 7 April 2010 ABSTRACT: Some of the most widely used datasets for monitoring the world’s fires come from the Moderate Resolution Imaging Spectroradiometer (MODIS) sensors aboard NASA’s Terra and Aqua satellites. For virtually all remote sensing systems, including MODIS, pixels that contain fires comprise a mix of burning and nonburning components, each with sizes and temperatures that vary between pixels. Current remote sensing products provide little in- formation about these subpixel components, severely limiting estimates of the gas and aerosol emissions and ecological impacts from the world’s fires. This study shows how multiple endmember spectral mixture analysis (MESMA) can estimate subpixel fire sizes and temperatures from MODIS and can overcome many limitations of existing methods for characterizing fire intensities from remotely sensed data, such as the fire radiative power (FRP) approach. This study used MESMA to estimate subpixel fire sizes and temperatures for MODIS scenes in southern Africa, analyzed how these sizes and temperatures varied * Corresponding author address: Ted C. Eckmann, Geography Department, Bowling Green State University, Bowling Green, OH 43403-0187. E-mail address: [email protected] Earth Interactions d Volume 14 (2010) d Paper No. 6 d Page 1 DOI: 10.1175/2010EI328.1 Copyright Ó 2010, Paper 14-006; 69337 words, 11 Figures, 3 Animations, 3 Tables. http://EarthInteractions.org
-
Upload
oregonstate -
Category
Documents
-
view
4 -
download
0
Transcript of Variations in Subpixel Fire Properties with Season and Land Cover in Southern Africa

Variations in Subpixel Fire Propertieswith Season and Land Coverin Southern AfricaTed C. Eckmann*
Geography Department, Bowling Green State University, Bowling Green, Ohio, andGeography Department, University of California at Santa Barbara, Santa Barbara,California
Christopher J. Still, Dar A. Roberts, and Joel C. Michaelsen
Geography Department, University of California at Santa Barbara, Santa Barbara,California
Received 17 January 2010; accepted 7 April 2010
ABSTRACT: Some of the most widely used datasets for monitoring theworld’s fires come from the Moderate Resolution Imaging Spectroradiometer(MODIS) sensors aboard NASA’s Terra and Aqua satellites. For virtually allremote sensing systems, including MODIS, pixels that contain fires comprise amix of burning and nonburning components, each with sizes and temperaturesthat vary between pixels. Current remote sensing products provide little in-formation about these subpixel components, severely limiting estimates of thegas and aerosol emissions and ecological impacts from the world’s fires. Thisstudy shows how multiple endmember spectral mixture analysis (MESMA) canestimate subpixel fire sizes and temperatures from MODIS and can overcomemany limitations of existing methods for characterizing fire intensities fromremotely sensed data, such as the fire radiative power (FRP) approach. Thisstudy used MESMA to estimate subpixel fire sizes and temperatures for MODISscenes in southern Africa, analyzed how these sizes and temperatures varied
* Corresponding author address: Ted C. Eckmann, Geography Department, Bowling GreenState University, Bowling Green, OH 43403-0187.
E-mail address: [email protected]
Earth Interactions d Volume 14 (2010) d Paper No. 6 d Page 1
DOI: 10.1175/2010EI328.1
Copyright � 2010, Paper 14-006; 69337 words, 11 Figures, 3 Animations, 3 Tables.http://EarthInteractions.org
with season and land cover, and compared these to analyses made with FRP.This study could be the first to analyze fire sizes and temperatures on a spatialscale as large as a MODIS scene and a temporal scale as large as a full fireseason. The variations in MESMA estimates of fire temperature with season andland cover were more consistent than the FRP estimates. Based on these find-ings, MESMA appears to be more effective than FRP at capturing some vari-ations in fire temperatures, which strongly influence the gas and aerosolemissions from fires, along with their effects on ecosystems.
KEYWORDS: Fire temperature; MODIS; Southern Africa
1. IntroductionFires are important sources of trace gases and aerosols (e.g., Andreae and Merlet
2001), ecosystem disturbance (e.g., Drewa et al. 2002), and land-cover change(e.g., Cochrane et al. 1999) on a variety of spatial and temporal scales. In manyareas of the world, changing fire regimes are likely influencing and being influ-enced by climate change (e.g., Lenihan et al. 2003; van der Werf et al. 2006; vander Werf et al. 2008). Unfortunately, the responses of various fire regimes toclimate change, and the impacts that changes in fire regimes have on ecosystemsand atmospheric composition, are complex and not well understood (e.g., Daleet al. 2000; Hoelzemann et al. 2004). This study therefore seeks to demonstratenew methods that could improve understanding of the world’s fires and theirimpacts.
This study focuses on the Moderate Resolution Imaging Spectroradiometer(MODIS) sensors aboard the National Aeronautics and Space Administration(NASA) Terra and Aqua satellites, which can cover the entire Earth multiple timeseach day and provide some of the most widely used datasets for monitoring theworld’s fires. MODIS products currently provide better information about globalfire activity than any other existing sources: many fires that are detected by MODISare not reported consistently, if at all, by suborbital or on-the-ground surveys, andother satellite sensors used for monitoring fires are in many ways more limited thanMODIS in spatial or temporal coverage, revisit frequency, geolocational accuracy,false-alarm rates, or sensitivity to small fires (e.g., Csiszar et al. 2005; Giglio et al.2006). Measurements made by MODIS of actively burning fires are summarized inthe MOD14 Thermal Anomalies/Fire product, which is described in Giglio et al.(Giglio et al. 2003). Postfire estimates of burned area are also produced usingMODIS data and summarized in the MODIS burned area product (Roy et al. 2005).
Although many studies have found both of these MODIS fire products to beuseful, they are both limited because neither of them provides information on firetemperatures, which significantly influence trace gas and aerosol emissions andecosystem impacts of the world’s fires. For example, fire temperatures exert stronginfluences on postfire nutrient levels in soils (e.g., Jensen et al. 2001). Plant speciesalso differ in their survival rates, regrowth, and recruitment following fires ofdiffering temperatures; thus, fire temperatures influence the postfire species com-position of many ecosystems worldwide (e.g., Gignoux et al. 1997; Hanley andFenner 1998). Likewise, studies that estimate regional and global emissions ofatmospheric gases and aerosols from fires contain significant uncertainties (Palacios-Orueta et al. 2005), in part because fire emission factors vary considerably as afunction of many variables, including fire temperature (Andreae and Merlet 2001).
Earth Interactions d Volume 14 (2010) d Paper No. 6 d Page 2

The primary obstacle to measuring fire temperatures from MODIS is thatMODIS pixels containing actively burning fires usually also contain areas that havealready burned but are no longer on fire, as well as areas that have not yet burned orwill not burn in that particular fire. Pixel-level temperature measurements wouldthus not be representative of the fire’s temperature but rather a combination of thetemperatures of the burning and nonburning components, which vary substantiallyin sizes and temperatures on a per-pixel basis (e.g., Eckmann et al. 2008). TheMOD14 product includes estimates of the fire radiant power (FRP) within eachpixel (Kaufman et al. 1998), but this quantity cannot separate a fire’s size andtemperature: a small, hot fire can have the same radiant power as a larger, coolerfire. Fire temperatures could theoretically be calculated from FRP if subpixel firesizes at the time of the FRP estimates were known. However, the subpixel sizes ofactively burning fire components vary in complex ways between MODIS pixels(Morisette et al. 2005) and are not available from postfire measurements, whichsupply estimates of total burned area instead of instantaneous snapshots of a fire’ssize at the time the FRP estimates are made. Thus, it may not be possible to producean accurate estimate of fire temperatures using FRP or any other informationprovided within existing MODIS fire products.
This study addresses these limitations by demonstrating new methods for esti-mating the subpixel sizes and temperatures of actively burning fires detected byMODIS. Three MODIS scenes from southern Africa were chosen for this dem-onstration (Figure 1) because this area includes some of the world’s highest rates ofbiomass burning (Giglio et al. 2006) and fire emission factors have been found tovary by up to a factor of 8 across the diverse land-cover classes in this area (Wardet al. 1996). Furthermore, this area exhibits pronounced changes in fire behaviorand emissions over the course of its fire season (Korontzi 2005), and existingapproaches to modeling fire emissions have not adequately accounted for seasonalvariations in combustion completeness (e.g., Duncan et al. 2003; Ito and Penner2004; van der Werf et al. 2004), which is a function of fire temperature (Palacios-Orueta et al. 2005). Thus, the three MODIS scenes chosen for this demonstrationwere selected to be representative of early, middle, and late stages in southernAfrica’s fire season to examine whether MODIS estimates of fire temperatureswould show any changes over the course of this area’s fire season.
Most, and perhaps all, existing studies that report fire temperatures from biomassburning are very limited in spatial and temporal coverage, typically involvingintentional burns of small vegetation plots for short periods of time, and thereforemay not represent the temperatures of larger, more long-lived fires or the fullvariety in fire types across a region (e.g., Stronach and McNaughton 1989; Gibsonet al. 1990; Iverson et al. 2004). This is primarily due to the limitations in spatialand temporal coverage inherent to on-the-ground studies of fires, but the fewstudies that have reported remotely sensed measures of active fire temperatureshave also been very limited in spatial and temporal coverage (e.g., Dennison et al.2006; Eckmann et al. 2008; Eckmann et al. 2009). Thus, many of the larger-scalevariations in fire temperatures with land-cover class and season have likely neverbeen measured for most areas of the world. This study could be the first to analyzesubpixel fire sizes and temperatures on a spatial scale as large as a MODIS sceneand a temporal scale as large as a full fire season, and it demonstrates how thesequantities can reveal aspects of fire regimes that existing MODIS products cannot.
Earth Interactions d Volume 14 (2010) d Paper No. 6 d Page 3

Figure 1. True-color browse images of the three MODIS scenes used in this study,which were acquired from 0840 to 0845 UTC on (a) 17 Jun, (b) 20 Aug, and(c) 7 Oct 2004; images from NASA (available online at http://ladsweb.nascom.nasa.gov).
Earth Interactions d Volume 14 (2010) d Paper No. 6 d Page 4
2. MethodsThis study’s methods involved three main steps: 1) estimating subpixel fire sizes
and temperatures from three MODIS scenes, 2) analyzing how these estimatesvaried with season and across areas of different land cover, and 3) comparing theseto analyses made with FRP. The following three subsections describe each of thesethree main steps in detail. A fourth subsection then summarizes some limitations ofthe methods and data used in this study, and a fifth subsection then addressesaccuracy assessment.
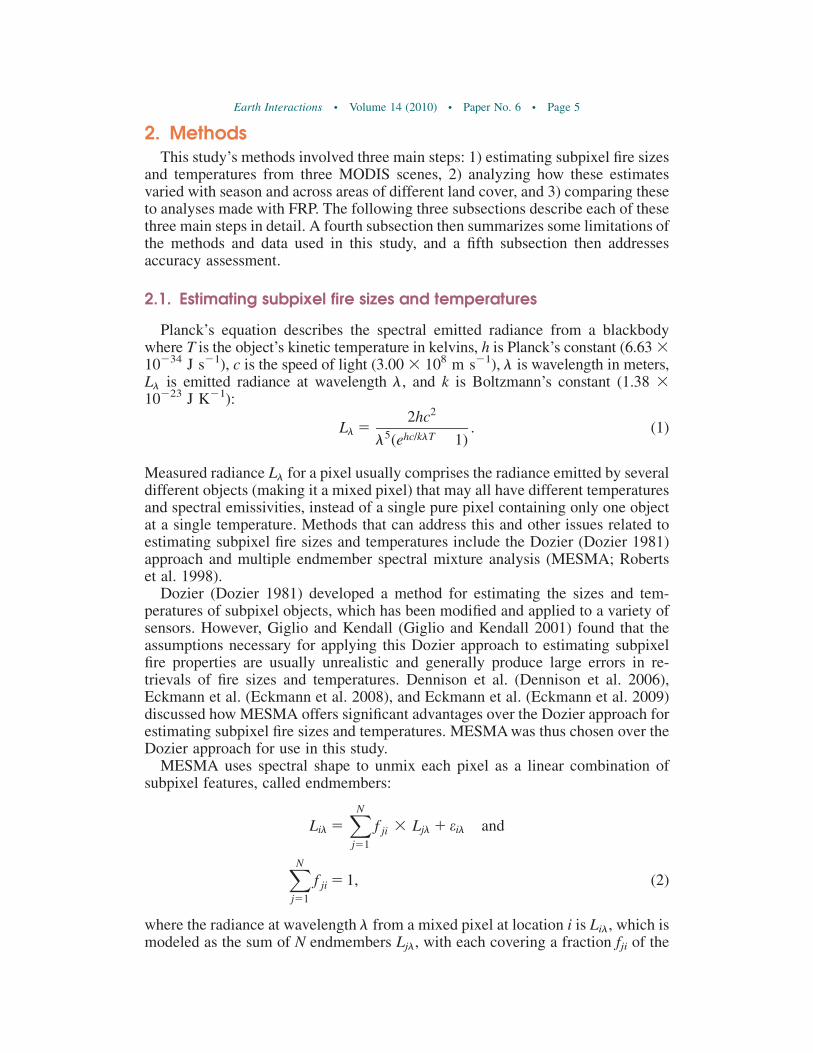
2.1. Estimating subpixel fire sizes and temperatures
Planck’s equation describes the spectral emitted radiance from a blackbodywhere T is the object’s kinetic temperature in kelvins, h is Planck’s constant (6.63 310234 J s21), c is the speed of light (3.00 3 108 m s21), l is wavelength in meters,Ll is emitted radiance at wavelength l, and k is Boltzmann’s constant (1.38 310223 J K21):
Ll 52hc2
l5(ehc/klT � 1). (1)
Measured radiance Ll for a pixel usually comprises the radiance emitted by severaldifferent objects (making it a mixed pixel) that may all have different temperaturesand spectral emissivities, instead of a single pure pixel containing only one objectat a single temperature. Methods that can address this and other issues related toestimating subpixel fire sizes and temperatures include the Dozier (Dozier 1981)approach and multiple endmember spectral mixture analysis (MESMA; Robertset al. 1998).
Dozier (Dozier 1981) developed a method for estimating the sizes and tem-peratures of subpixel objects, which has been modified and applied to a variety ofsensors. However, Giglio and Kendall (Giglio and Kendall 2001) found that theassumptions necessary for applying this Dozier approach to estimating subpixelfire properties are usually unrealistic and generally produce large errors in re-trievals of fire sizes and temperatures. Dennison et al. (Dennison et al. 2006),Eckmann et al. (Eckmann et al. 2008), and Eckmann et al. (Eckmann et al. 2009)discussed how MESMA offers significant advantages over the Dozier approach forestimating subpixel fire sizes and temperatures. MESMA was thus chosen over theDozier approach for use in this study.
MESMA uses spectral shape to unmix each pixel as a linear combination ofsubpixel features, called endmembers:
Lil 5XN
j51
f ji 3 Ljl 1 eil and
XN
j51
f ji 5 1, (2)
where the radiance at wavelength l from a mixed pixel at location i is Lil, which ismodeled as the sum of N endmembers Ljl, with each covering a fraction fji of the
Earth Interactions d Volume 14 (2010) d Paper No. 6 d Page 5

pixel. The residual term eil describes the unmodeled portion of the radiance, andthe model selected for each pixel is the one that minimizes the root-mean-squareerror (RMSE) over the included number of bands used in unmixing B:
RMSE 5XB
k51
(eil)2
,B
" #1/2
. (3)
Although not specifically intended for application to active fires, MESMA hasbeen used for this purpose before (e.g., Dennison et al. 2006; Eckmann et al. 2009).However, to the authors’ knowledge, only one study has applied MESMA tomeasure fire properties from MODIS (Eckmann et al. 2008) and only to a portionof a single MODIS scene; therefore, the potential usefulness for MESMA estimatesof fire properties remained largely unexplored prior to this study. Following themethods of Dennison et al. (Dennison et al. 2006) and Eckmann et al. (Eckmannet al. 2008), the Moderate Resolution Transmission Model (MODTRAN) 4.3.1(Berk et al. 1989) was used to create a fire endmember at every 10-K step from 500to 1500 K, because this range spans the temperatures typical of biomass-burningfires (Pyne et al. 1996). In this approach, MODTRAN assumes the fires are emittingas blackbodies from the surface and adjusts this to the expected at-sensor radiancefor each of these simulated fire temperatures given the atmospheric conditionsand solar/sensor angles, also following Dennison et al. (Dennison et al. 2006) andEckmann et al. (Eckmann et al. 2008).
Giglio and Kendall (Giglio and Kendall 2001) discussed errors that may beintroduced by assuming that fires emit as blackbodies, because this assumptionmay only be valid when the pathlength through the flames from the sensor’s view isapproximately 6 m or longer, with shorter pathlengths tending to produce lower fireemissivities and thus greater errors in retrieved fire properties. Because Dennisonet al. (Dennison et al. 2006) found this blackbody assumption to be valid for Air-borne Visible/Infrared Imaging Spectrometer (AVIRIS) pixels with spatial reso-lutions of only ;5 m, it should also be valid for the ;1-km MODIS pixels usedhere, though this could be a source of error in MESMA retrievals.
All of the needed inputs for generating the fire endmembers used here could beavailable operationally in near–real time from the existing MODIS products listedin Table 1, which are automatically generated for virtually every MODIS granule.For example, the MOD03 geolocation product supplies sensor zenith angle, solarzenith angle, and ground altitude as ‘‘height above geoid’’ and the MOD07 productsupplies total-column precipitable water vapor, using the thermal–infrared method,which works in daytime and nighttime (King et al. 2003). After being generated byMODTRAN 4.3.1, these at-sensor fire endmembers were then resampled sepa-rately to the spectral responses of each MODIS band.
Following Eckmann et al. (Eckmann et al. 2008), background endmembers foreach of the scenes used here were selected automatically from nonburning pixels ineach scene. Only MODIS bands 5, 6, 7, 21, 29, 31, and 32 were used for unmixingto avoid wavelengths near strong absorption features of atmospheric gases andwavelengths shorter than 1200 nm, where attenuation of radiation by smoke canbecome significant. Each MODIS pixel flagged as containing fire by the MOD14product within each of the three scenes used here was thus unmixed with MESMA,
Earth Interactions d Volume 14 (2010) d Paper No. 6 d Page 6

following the procedures in Eckmann et al. (Eckmann et al. 2008). This producedestimates of a single temperature for the burning portion of each pixel: givenenough bands, MESMA could theoretically solve for multiple temperatures of thefire components within each pixel, but this study solved for only a single firetemperature in each pixel to simplify the analyses and interpretations of the results.A future study will investigate the possibilities of using MESMA to solve formultiple fire temperatures within each pixel.
2.2. Analyzing fire properties with respect to season and land cover
The three MODIS scenes selected for this study were chosen to minimize theamount of cloud cover throughout each scene because MODIS cannot detect ormeasure the properties of fires under thick clouds. However, given the large spatialextent of the chosen study area and its frequent cloud cover, the three MODISscenes used in this study do contain some clouds (Figure 1). Fire activity canexhibit a significant diurnal cycle (e.g., Giglio 2007), some of which MODIS cancapture, as MODIS Aqua and Terra combine to image this area 4 times per day formost days. Each day, Terra overpasses occur within a few hours of 1030 and 2230local time (LT) and Aqua overpasses occur within a few hours of 1330 and 0130 LT.Because this study focuses on analyzing changes in subpixel fire properties withland cover and season, the three scenes chosen for this study were all acquired byMODIS Terra from 0840 to 0845 UTC to minimize the effects of the diurnal firecycle on this study’s analysis.
Another reason for using the three specific dates shown in Figure 1 lies in the16-day repeat cycle of the Terra satellite, which means that Terra follows almostexactly the same ground track every 16 days but follows significantly differentground tracks on the other days of the cycle. MODIS pixel sizes and atmosphericpathlengths increase with increasing angle away from nadir, which can decreasethe performance of MODIS fire detection algorithms, along with potentially de-creasing the accuracy of any method for estimating fire properties from MODIS
Table 1. Filenames and all the bands/data used from the three MODIS scenes an-alyzed in this study. All of these files were from the most recent collection versionsavailable to the public at the time of this study. Here, ‘‘yyyy’’ represents the year,‘‘ddd’’ represents the Julian date, and ‘‘hhmm’’ represents the beginning of the5-min period during which the scene was collected (all in UTC). Figure 1 shows thedates and times for the three scenes used here. The asterisk in each filenamerepresents the processing date and time, which could vary because some of theseproducts may be regenerated when ordered.
Filename Bands/data used
MOD021KM.Ayyyyddd.hhmm.005.*.hdf MODIS swath-perspective radiance at sensor, using bands5, 6, and 7 (resampled to 1 km from 500 m) and bands21, 29, 31, and 32 (collected at 1 km)
MOD03.Ayyyyddd.hhmm.005.*.hdf MODIS geolocation data, sensor zenith angle, solar zenithangle, and ground altitude as height above geoid
MOD07_L2.Ayyyyddd.hhmm.005.*.hdf Total-column precipitable water vapor from the MODISthermal–infrared method
MOD14.Ayyyyddd.hhmm.005.*.hdf Locations of MODIS pixels flagged as containing fire and FRP
Earth Interactions d Volume 14 (2010) d Paper No. 6 d Page 7

data (e.g., Giglio et al. 2006). Thus, the specific dates used in this study wereselected so that the sensor angle for any given ground area within the three sceneswould be essentially unchanged across those three scenes, so as not to bias theanalyses by having an area that was viewed from far off nadir on one date and fromnear nadir on another date. This was accomplished by finding scenes that wereseparated by intervals evenly divisible by the 16-day repeat cycle of Terra, whichwere also relatively free of clouds and representative of seasonal fire activity in thearea. Although the resulting three scenes are a small sample size for observingseasonal patterns, this study focused on minimizing the potential sources of biasamong these selected scenes and on demonstrating new methods that a subsequentstudy will employ for a more thorough investigation of seasonal patterns in sub-pixel fire properties.
This study employed version 3.0 of the widely used Global Land Cover 2000(GLC 2000) map of Africa for analyzing relationships between land-cover class andMESMA estimates of subpixel fire properties for the three scenes shown in Figure 1.This GLC 2000 dataset, which is described in Mayaux et al. (Mayaux et al. 2004),was produced at a 1-km spatial resolution using imagery acquired mostly during theyear 2000 by several orbiting sensors. Figure 2 shows the locations of all the MODISpixels flagged as containing fire by the MOD14 product in the three scenes used inthis study, mapped atop the GLC 2000 dataset. Table 2 shows the number of thesefire pixels within each land-cover class for each of the three scenes.
This study also employed collection 4, version 3 of the 2004 MODIS VegetationContinuous Fields (VCF) product, which is described in Hansen et al. (Hansenet al. 2003), as an additional source of land-cover data for comparison to MESMAestimates of subpixel fire properties. This VCF product was used in addition to theGLC 2000 product because each dataset captures some variations in land cover notdiscernible in the other that may be important in understanding fire emissions(Wiedinmyer et al. 2006) and because the datasets were made independently withdifferent inputs, thus adding to the robustness of the analyses in this study. TheVCF product supplies estimates of percent tree cover within each 500-m MODISpixel, where percent tree cover refers to the amount of skylight obstructed by treecanopies equal to or greater than 5 m in height (Hansen et al. 2003). Because theamount of biomass and the woody proportion of that biomass are important con-trols on fire temperatures and the amount of smoldering, this product provides avery useful comparison to and constraint on the retrieved fire temperatures pre-sented in this study. Table 3 shows the number of MODIS pixels flagged as con-taining fire within bins of percent tree cover from the VCF product.
2.3. Comparing MESMA and FRP estimates
The analyses of fire properties with respect to season and land cover wereconducted using the MESMA estimates described in this paper and again withestimates of FRP to assess whether MESMA would offer any additional infor-mation beyond that available from FRP, which is the only existing measure of fireintensity from the current MODIS active fire product. According to Roberts et al.(Roberts et al. 2005), a fire’s true radiative power FRPtrue in joules per second (orwatts) is
Earth Interactions d Volume 14 (2010) d Paper No. 6 d Page 8

Figure 2. Map of all the MODIS pixels flagged as containing fire for the three MODISscenes used in this study, from the MOD14 collection 5 product atop theGLC 2000 land-cover dataset used in this study.
Earth Interactions d Volume 14 (2010) d Paper No. 6 d Page 9
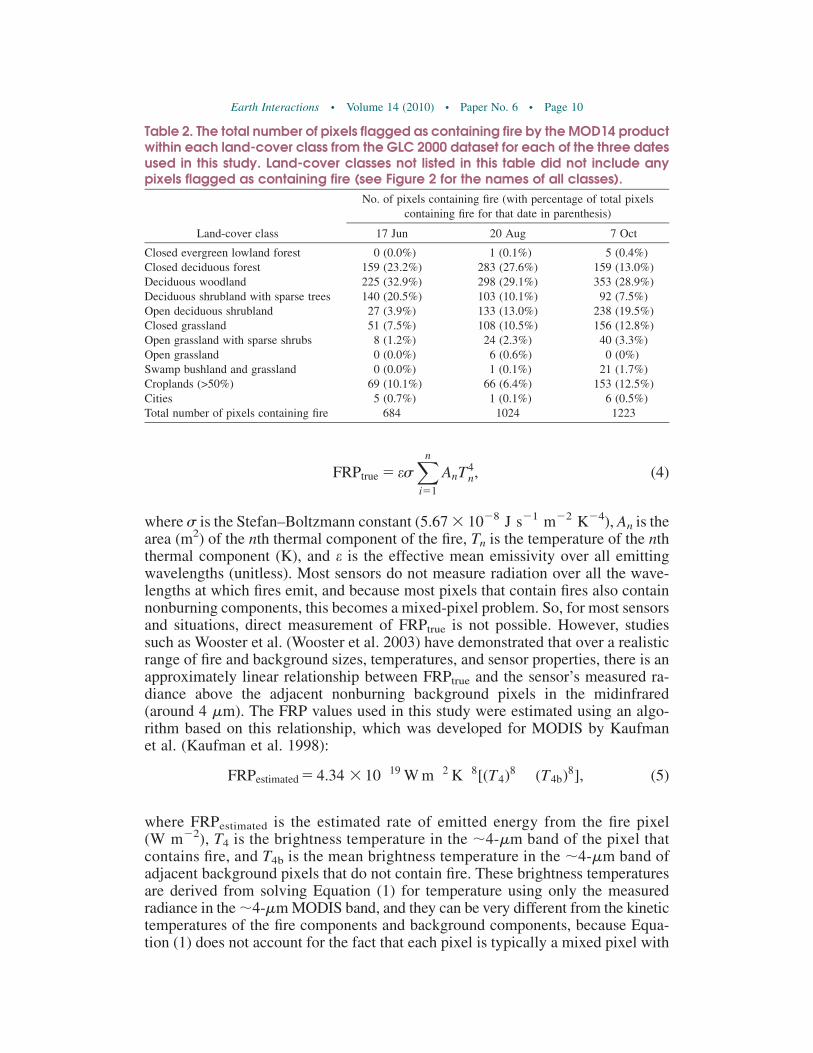
FRPtrue 5 esXn
i51
AnT4n, (4)
where s is the Stefan–Boltzmann constant (5.67 3 1028 J s21 m22 K24), An is thearea (m2) of the nth thermal component of the fire, Tn is the temperature of the nththermal component (K), and e is the effective mean emissivity over all emittingwavelengths (unitless). Most sensors do not measure radiation over all the wave-lengths at which fires emit, and because most pixels that contain fires also containnonburning components, this becomes a mixed-pixel problem. So, for most sensorsand situations, direct measurement of FRPtrue is not possible. However, studiessuch as Wooster et al. (Wooster et al. 2003) have demonstrated that over a realisticrange of fire and background sizes, temperatures, and sensor properties, there is anapproximately linear relationship between FRPtrue and the sensor’s measured ra-diance above the adjacent nonburning background pixels in the midinfrared(around 4 mm). The FRP values used in this study were estimated using an algo-rithm based on this relationship, which was developed for MODIS by Kaufmanet al. (Kaufman et al. 1998):
FRPestimated 5 4.34 3 10�19 W m�2 K�8[(T4)8 � (T4b)8], (5)
where FRPestimated is the estimated rate of emitted energy from the fire pixel(W m22), T4 is the brightness temperature in the ;4-mm band of the pixel thatcontains fire, and T4b is the mean brightness temperature in the ;4-mm band ofadjacent background pixels that do not contain fire. These brightness temperaturesare derived from solving Equation (1) for temperature using only the measuredradiance in the ;4-mm MODIS band, and they can be very different from the kinetictemperatures of the fire components and background components, because Equa-tion (1) does not account for the fact that each pixel is typically a mixed pixel with
Table 2. The total number of pixels flagged as containing fire by the MOD14 productwithin each land-cover class from the GLC 2000 dataset for each of the three datesused in this study. Land-cover classes not listed in this table did not include anypixels flagged as containing fire (see Figure 2 for the names of all classes).
Land-cover class
No. of pixels containing fire (with percentage of total pixelscontaining fire for that date in parenthesis)
17 Jun 20 Aug 7 Oct
Closed evergreen lowland forest 0 (0.0%) 1 (0.1%) 5 (0.4%)Closed deciduous forest 159 (23.2%) 283 (27.6%) 159 (13.0%)Deciduous woodland 225 (32.9%) 298 (29.1%) 353 (28.9%)Deciduous shrubland with sparse trees 140 (20.5%) 103 (10.1%) 92 (7.5%)Open deciduous shrubland 27 (3.9%) 133 (13.0%) 238 (19.5%)Closed grassland 51 (7.5%) 108 (10.5%) 156 (12.8%)Open grassland with sparse shrubs 8 (1.2%) 24 (2.3%) 40 (3.3%)Open grassland 0 (0.0%) 6 (0.6%) 0 (0%)Swamp bushland and grassland 0 (0.0%) 1 (0.1%) 21 (1.7%)Croplands (>50%) 69 (10.1%) 66 (6.4%) 153 (12.5%)Cities 5 (0.7%) 1 (0.1%) 6 (0.5%)Total number of pixels containing fire 684 1024 1223
Earth Interactions d Volume 14 (2010) d Paper No. 6 d Page 10

multiple components of varying temperatures and emissivities. These brightnesstemperatures are thus also different from the fire temperatures estimated usingMESMA with Equations (2) and (3). FRP calculated using Equation (5) provides avalue in units of watts per meter, which is then multiplied by the area of eachMODIS pixel to provide a value in watts, accounting for the increase in the groundarea covered by each MODIS pixel with increasing angle away from nadir.
2.4. Limitations of the methods and data used in this study
Several limitations are inherent to the MODIS data used in this study and thusaffect MESMA, FRP, and any other approach to measuring fire properties from thesensor. One of the most fundamental limitations of any measure of active fireproperties from MODIS is that MODIS cannot detect fires beneath thick cloud cover.Although the three scenes used in this study were selected specifically to minimizethe effects of cloud cover, they are not free of clouds. Thus, it is possible that thevariations in cloud cover between these scenes introduced small biases into thisstudy’s analysis of fire properties changing through the seasons and with land cover,because the distribution of cloud cover also changes with season and land cover.
Additionally, although smoke plumes from biomass burning are mostly trans-parent at the wavelengths used for FRP and MESMA estimates in this study(Kaufman et al. 2003; Dennison et al. 2006), smoke may have influenced some ofthe radiance measurements that were used in FRP and MESMA calculations. Thedensity, composition, and temperatures of smoke plumes also vary with land-covertype and through the burning season in southern Africa (e.g., Ichoku et al. 2003),which may have exerted some influence on the results of this study. Smoke plumescan even become thick enough to reduce fire detection rates by the MOD14 algo-rithm (Csiszar et al. 2006), so smoke could have also reduced the amount of dataavailable for use in this study. Other factors may have reduced the number of MOD14fire detections for use in this study as well; for example, the 17 June scene includessome small areas of missing data, which are visible as the dark stripes in Figure 1.
Table 3. The total number of pixels flagged as containing fire by the MOD14 productwithin each tree-cover bin from the 2004 MODIS VCF product for each of the threedates used in this study.
Percent tree cover
No. of pixels containing fire (with percentage of total pixelscontaining fire for that date in parenthesis)
17 Jun 20 Aug 7 Oct
0%–10% 54 (7.9%) 80 (7.8%) 176 (14.4%)10%–20% 71 (10.4%) 156 (15.2%) 245 (20.0%)20%–30% 283 (41.4%) 307 (30.0%) 503 (41.1%)30%–40% 98 (14.3%) 129 (12.6%) 121 (9.9%)40%–50% 133 (19.4%) 162 (15.8%) 114 (9.3%)50%–60% 44 (6.4%) 187 (18.3%) 60 (4.9%)60%–70% 1 (0.1%) 3 (0.3%) 2 (0.2%)70%–80% 0 (0.0%) 0 (0.0%) 2 (0.2%)80% and up 0 (0.0%) 0 (0.0%) 0 (0.0%)Total number of pixels containing fire 684 1024 1223
Earth Interactions d Volume 14 (2010) d Paper No. 6 d Page 11

Another limitation inherent to the MODIS sensor lies in its geolocation error,which for the 1-km bands is ;73 m at 1s according to Wolfe et al. (Wolfe et al.2002). This error is small relative to the spatial resolutions of the GLC 2000 (1 km)and VCF (500 m) land-cover data used in this study, but this could produce a verysmall amount of error in analyses of fire properties from MODIS with respect tothese land-cover datasets. Each MODIS pixel that contained fire was assigned tothe land-cover class at the center of that pixel, so the footprints of some MODISpixels that contained fire could have overlapped multiple land-cover classes, whichmay have also introduced very small errors to the analyses within this study.Additionally, errors and limitations exist in the land-cover datasets: Mayaux et al.(Mayaux et al. 2004), Mayaux et al. (Mayaux et al. 2006), Bartholome and Belward(Bartholome and Belward 2005), and Fritz and See (Fritz and See 2005) discusssome limitations of the GLC 2000 data, and Hansen et al. (Hansen et al. 2003;Hansen et al. 2005; and Hansen et al. 2008) discuss some limitations of the VCFdataset.
Although the VCF product used in this study is from 2004, the same year as theMODIS scenes in Figure 1, the GLC 2000 product was created from slightly olderdata that were acquired mostly during the year 2000, although some of the inputs tothe GLC 2000 were from earlier years. For both the GLC 2000 and VCF products,it is possible that some of the land-cover data used in this study were not repre-sentative of the land cover at the time of the MODIS scenes in Figure 1. However,these changes in land cover over time are unlikely to have been so dramatic as tosignificantly influence a large-scale analysis such as the one in this study (e.g.,Mayaux et al. 2004).
Although one goal of this study is to analyze variations in fire properties withland cover, some land-cover types may adversely influence the performance of theMODIS active fire detection algorithm, along with decreasing the accuracy ofsome estimates of fire properties. For example, fire detection algorithms may havedifficulty detecting some surface fires burning underneath thick tree canopy cover(e.g., Korontzi 2005). This could help to explain why the MODIS fire detectionsused in this study included almost no fires within pixels estimated by the VCFproduct to have more than 60% tree cover (Table 3). Even for fires that the MODISactive fire product successfully detects, thick tree cover may obscure part of the firefrom MODIS and thus cause the FRP and MESMA approaches to underestimatethe fire’s size. However, obscuration by tree branches, twigs, and leaves, which aremostly opaque at the wavelengths used in this study, will not substantially changethe spectral shape of the fire’s radiation that does reach MODIS. Thus, MESMAestimates of the fire’s temperature should theoretically still be valid, because theseare determined only by the fire’s spectral shape and not by its size [Equation (2)]. Incontrast, thick tree cover can reduce the accuracy of FRP estimates if it preventssome of a fire’s radiation from reaching the sensor [Equations (4) and (5)], so thiscould represent an important advantage of MESMA over FRP. Eckmann et al.(Eckmann et al. 2008) discuss other relative advantages and disadvantages ofMESMA versus FRP and other sources of error inherent to both approaches.
Ideally, in situ measurements of fire sizes, temperatures, and FRP would beavailable to validate the remotely sensed measures of those properties used in thisstudy. However, the authors are not aware of any suitable in situ measurements thatwere acquired simultaneously with these MODIS scenes. This data gap is typical
Earth Interactions d Volume 14 (2010) d Paper No. 6 d Page 12

for fire research because of the danger and difficulty of measuring fire propertiesfrom the ground on the spatial scale of a MODIS pixel (e.g., Morisette et al. 2005).Although this lack of suitable validation data presents a limitation to this study, italso provides reinforcement for the necessity of this research: no sources of tem-perature data exist for the vast majority of the world’s fires, because in situ mea-surements are seldom available.
2.5. Accuracy assessment
Despite the lack of in situ measurements, which would be the ideal data sourcesfor validation, an assessment of the accuracy of the MODIS estimates used in thisstudy is still possible by using finer-resolution remotely sensed data. The AdvancedSpaceborne Thermal Emission and Reflection Radiometer (ASTER) acquiredseveral images of fires within the study area simultaneously with the three MODISscenes in Figure 1, and comparisons with these finer-resolution ASTER imagesprovide some assessment of the accuracy of the MODIS estimates of subpixel firesizes. Following the methods in Eckmann et al. (Eckmann et al. 2008), this as-sessment involved counting pixels with radiances of 2.00 W m22 mm21 sr21 orhigher in ASTER’s band 9 (2.36–2.43 mm) as containing fire, thus providing anestimate of fire sizes from an ASTER band with a 30-m nominal resolution. Pixelswith band 9 radiances above this threshold but without radiances significantlyabove those of surrounding areas in ASTER’s thermal infrared bands or othervisual indications of burning such as smoke plumes in ASTER’s visible bands weremanually identified as being highly reflective but nonburning land-cover types andnot counted as fires, as in Morisette et al. (Morisette et al. 2005). Each of the threeMODIS scenes used in this study had at least 1 MODIS pixel flagged as containingfire that corresponded to an area imaged by ASTER, but only 15 MODIS fire pixelsin total from the three MODIS scenes were available for comparison to ASTERdata. This is not surprising, because ASTER typically acquires images for only afraction of each orbit and has a very small swath (only ;60 km wide) as comparedto MODIS, which has a swath width of ;2330 km; thus, ASTER acquires imagesof only a small fraction of the fires that MODIS detects.
Figure 3 shows this comparison of fire size estimates from MODIS to theASTER pixel counts from the ground areas corresponding to the footprints of these15 MODIS pixels. The small sample size of 15 points limits the significance of theconclusions that can be drawn from these data, and spatial autocorrelation amongthese points may cause statistical measures of relationships within these data to beoverstated. Unfortunately, the small sample size may also invalidate any analysesof the spatial autocorrelation within the data and any methods to compensate for it(e.g., Fortin et al. 1989), but simple regression analyses using these data show thatMESMA estimates of subpixel fire sizes indeed show a noticeable correlation withASTER pixel counts (R2 of 0.75; p 5 0.000 026). It is not surprising that Figure 3does not show a better correlation with ASTER pixel counts, because ASTER band9 pixels are also mixed pixels and thus are not exact measurements of fire sizes.Many possible combinations of fire sizes and temperatures could produce thethreshold used in this study for counting an ASTER band 9 pixel as containing fire.MESMA can also be used to find subpixel fire sizes and temperatures from ASTER(Eckmann et al. 2009), but MESMA does not work effectively on bands that are
Earth Interactions d Volume 14 (2010) d Paper No. 6 d Page 13

saturated and, unfortunately, the ASTER scenes used for this comparison do notcontain enough unsaturated bands for MESMA to effectively measure subpixel firesizes and temperatures from them.
Other fine-resolution images showing the study area on later dates are alsoavailable from ASTER, Landsat, and other sensors, and these images can provideinformation on the sizes of the burn scars that these fires eventually produced.However, burn scars are almost always very different in size from the instanta-neously measured sizes of the fires that produce them; for example, a long-livedfire with a small actively burning area can eventually produce a much larger burnscar than a large active fire that burns out faster. The aim of this study is to analyzethe sizes and temperatures of only the portions of the fires that were actively burningduring the three MODIS scenes. Thus, no attempt was made to compare MESMAestimates of instantaneously measured active fire sizes to the sizes of the burn scarsthose fires eventually produced: burn-scar sizes and instantaneous fire sizes are verydifferent quantities. Therefore, the comparison between MODIS estimates of firesizes and ASTER pixel counts presented in Figure 3 could be the best informationavailable on the accuracy of the subpixel fire size estimates used in this study.
3. Results and discussion
3.1. Variations in MESMA fire property estimates with land cover
MESMA estimates of subpixel fire sizes and temperatures exhibited some sig-nificant variations between land-cover classes from the GLC 2000 dataset, as
Figure 3. MESMA estimates of subpixel fire sizes from MODIS using the methodsdescribed in this study, compared to the number of ASTER pixels abovethe fire detection threshold within the corresponding footprint of eachMODIS pixel. Each point in the scatterplot represents 1 of the 15 MODIS firepixels that had available ASTER data for comparison.
Earth Interactions d Volume 14 (2010) d Paper No. 6 d Page 14

shown in Figures 4 and 5. These figures include only the land-cover classes withmore than 25 MODIS fire pixels in each of the three scenes, because the smallersample sizes for the other land-cover classes would have produced less robustresults (Table 2). MESMA estimates of fire temperatures were generally lower forthe land-cover classes with higher biomass (closed deciduous forest, deciduous
Figure 4. MESMA estimates of fire temperatures for the three MODIS scenes usedin this study, (a) 17 Jun, (b) 20 Aug, and (c) 7 Oct 2004, compared acrossthe land-cover classes from Table 2; the dots are means, and bars show95% confidence intervals for the means.
Earth Interactions d Volume 14 (2010) d Paper No. 6 d Page 15

woodland, and deciduous shrubland with sparse trees) as compared to the otherland-cover classes (open deciduous shrubland, closed grassland, and croplands).However, fire temperatures from the 17 June scene in the closed grassland classshow an exception to this, which is discussed in the following subsection aboutseasonal changes in estimated fire properties from MESMA. MESMA estimates of
Figure 5. MESMA estimates of subpixel fire sizes for the three MODIS scenes usedin this study, (a) 17 Jun, (b) 20 Aug, and (c) 7 Oct 2004, compared acrossthe land-cover classes from Table 2; the dots are means, and bars show95% confidence intervals for the means.
Earth Interactions d Volume 14 (2010) d Paper No. 6 d Page 16

subpixel fire sizes showed less variation between land-cover classes than MESMAestimates of fire temperatures did. However, some scenes included large differ-ences in subpixel fire sizes between land-cover classes, such as the closed grasslandin the 7 October scene as compared to all the other classes and to a lesser extent theopen deciduous shrubland in the 20 August scene.
Differences in biomass, vegetation structure, fuel moisture, fuel types, fuelpacking, and other factors should produce substantial differences in fire temperaturesbetween different land-cover classes (e.g., Pyne et al. 1996). MESMA estimatesof fire temperatures indeed show substantial differences between some land-coverclasses (Figure 4). One reason why this is important is because fires with tem-peratures below approximately 850 K are dominated by incomplete (smoldering)combustion and release primarily CO, NH3, H2, and hydrocarbons, whereas hotterfires are dominated by flaming combustion and produce higher proportions of CO2,NO, NO2, N2O, and N2 (Palacios-Orueta et al. 2005). Average MESMA estimatesof fire temperatures for closed deciduous forest and deciduous woodland are belowthis transition temperature of approximately 850 K in all three scenes, whereasaverage MESMA estimates of fire temperatures for the open deciduous shrublandand croplands tend to be near or slightly above 850 K (Figure 4). Average tem-peratures for the closed grassland and deciduous shrubland with sparse trees appearto cross this 850-K threshold in their respective seasonal changes, which will bediscussed further in the next subsection.
The observed differences in fire temperatures between land-cover classes couldhave many causes. For example, MESMA estimates showing the forest andwoodland classes to have the lowest average fire temperatures could be due to firesin those land-cover classes having the longest periods of smoldering relative to theduration of the flaming phase. This would fit with observations, because eachMODIS scene used in this study captured fires in a variety of different stages intheir lives, so land-cover classes producing fires that smolder longer than the firesin other classes would tend to have lower average fire temperatures. Shea et al.(Shea et al. 1996) found that fires in southern Africa typically had substantiallylonger periods of smoldering combustion in woody land-cover types than ingrasslands, which would support this theory. The majority of fires in southernAfrica are surface fires, and surface vegetation growth can become suppressed asthe closure of a tree canopy increases (e.g., Korontzi 2005), which could also helpto explain the lower fire temperatures in the more tree-dominated land-coverclasses. Additionally, MESMA estimates showing the forest and woodland classesto have the lowest average fire temperatures could also be due to those land-coverclasses producing more litter than the other land-cover classes. Shea et al. (Sheaet al. 1996) found that woodlands in southern Africa typically had significantlymore litter than grasslands, and Ward et al. (Ward et al. 1996) found that litterlayers in southern Africa burned primarily through smoldering rather than flaming,which would support this theory. In any case, some of the differences in MESMAestimates of fire temperatures between land-cover classes appear to be consistentwith factors known to influence the ratios of flaming to smoldering combustion insouthern Africa’s fires.
Other differences between the land-cover classes, such as differences in fuelmoisture, winds, or a variety of other factors, could also explain some of theobserved variations in fire temperatures between land-cover classes. Some of these
Earth Interactions d Volume 14 (2010) d Paper No. 6 d Page 17

differences in fire temperatures could be important indicators of land-cover changethrough burning. For example, Cochrane et al. (Cochrane et al. 1999) describedhow fires in some areas of the Amazon forest are of much higher intensity the moreoften the area burns, which can result from several feedback mechanisms thatpromote burning and increase burning intensity, potentially to the point of trans-forming some tropical forests into scrub or savanna. MESMA estimates of fireproperties could potentially provide useful data for future studies to investigatethese mechanisms and the causes for variations in fire temperatures in southernAfrica, the Amazon basin, and other ecologically important areas. For example,estimates of fire temperature may help inform the debate about whether some ofthe grasslands and savannas that exist in areas receiving enough precipitation tobecome closed canopy forests are maintained as grasslands and savannas by fire(e.g., Sankaran et al. 2005). Because grassland fires burn more intensely and arehotter, they would more likely kill young trees than grasses, and the estimates ofgrass fire temperatures from this study support such a disturbance-mediatedmodel.
Figures 6 and 7 show the relationships between percent tree cover from the VCFproduct and MESMA estimates of subpixel fire sizes and temperatures. Similar tothe analysis with the GLC 2000 dataset, these figures include only the tree-coverbins with more than 25 MODIS fire pixels in each of the three scenes, because thesmaller sample sizes for the other tree-cover bins would have produced less robustresults (Table 3). MESMA estimates of subpixel fire sizes and temperatures showmany of the same phenomena when analyzed with respect to the VCF dataset(Figures 6 and 7) as they do in the analyses with the GLC 2000 dataset (Figures 4and 5). For example, with the exception of the 50%–60% bin in the 7 Octoberscene, average MESMA estimates of fire temperatures consistently decrease withincreasing percent tree cover in all three MODIS scenes (Figure 6). This agreeswith the MESMA estimates showing that the forest and woodland classes had thelowest average fire temperatures among the GLC 2000 land-cover classes (Figure 4).Moreover, the 50%–60% bin in the 7 October scene may not actually have a loweraverage temperature than the 40%–50% bin, because the 95% confidence intervalfor the 50%–60% bin’s mean extends below the mean for the 40%–50% bin.Therefore, this is not a statistically significant exception to the observed trend offire temperatures tending to decrease with increasing percent tree cover.
As in the analyses with GLC 2000 data, MESMA estimates of subpixel fire sizesshowed less variation with tree cover from VCF than MESMA estimates of firetemperatures did. However, some scenes included significant differences in sub-pixel fire sizes between tree-cover bins, such as the 0%–10% and 10%–20% bins inthe 7 October scene as compared to the other bins (Figure 7c). Although theMODIS VCF product used in this study only provides data on percent tree cover ineach 500-m pixel, the GLC 2000 classifications for these areas show that grassesand shrubs likely dominate the remainder of each of these pixels (Table 2). Thus,the GLC 2000 and VCF analyses are largely in agreement, because the highestaverage fire temperatures tended to occur in the grass- and shrub-dominated GLC2000 classes and in the VCF pixels with the lowest percent tree cover, which arelikely dominated by grasses and shrubs. The explanations for possible causes of thepatterns in fire temperatures observed with the GLC 2000 data thus also fit thepatterns observed in the VCF data.
Earth Interactions d Volume 14 (2010) d Paper No. 6 d Page 18

Several factors could explain why the VCF product displays the relationshipof decreasing fire temperatures with increasing tree cover more clearly than theGLC 2000 dataset (cf. Figures 4 and 6). One of these is that the VCF productprovides estimates of land cover in units of percent tree cover rather than the land-cover classes of the GLC 2000 that include other factors apart from tree cover.
Figure 6. MESMA estimates of fire temperatures for the three MODIS scenes used inthis study, (a) 17 Jun, (b) 20 Aug, and (c) 7 Oct 2004, compared across thebins of percent tree cover from Table 3; the dots are means, and bars show95% confidence intervals for the means.
Earth Interactions d Volume 14 (2010) d Paper No. 6 d Page 19

The VCF data also represent land cover from 2004, the same year as the firedata, whereas the GLC 2000 dataset was created using inputs from the year 2000and even earlier. Thus, changes in land cover over time would likely make theVCF more representative than the GLC 2000 of the land cover at the time of thesefires.
Figure 7. MESMA estimates of subpixel fire sizes for the three MODIS scenes used inthis study, (a) 17 Jun, (b) 20 Aug, and (c) 7 Oct 2004, compared across thebins of percent tree cover from Table 3; the dots are means, and bars show95% confidence intervals for the means.
Earth Interactions d Volume 14 (2010) d Paper No. 6 d Page 20

3.2. Seasonal changes in estimated fire properties from MESMA
MESMA estimates across all land-cover classes in this study show a decrease inaverage fire temperatures through the fire season (Figure 8a) and an increase inaverage subpixel fire size (Figure 8b). Because larger fires are more likely tooccupy multiple pixels and more likely to be detected by MODIS, the increase insubpixel fire size through the season is consistent with the increase in pixel-levelfire size, as seen by the increase in the number of MOD14 pixels flagged as con-taining fire through these three scenes (Table 2). This also agrees with other studiesthat have found southern Africa’s fire pixel counts peaking in the late part of theburning season (e.g., van der Werf et al. 2003; Giglio et al. 2006).
Although the observed decrease in fire temperatures through the season haslikely never been measured before on this scale, this result is consistent with thefindings of other studies. For example, Bremer et al. (Bremer et al. 2004) foundpronounced increases in measured CO over southern Africa during the late burningseason, which is consistent with the decreasing fire temperatures in Figure 8a,
Figure 8. MESMA estimates of (a) fire temperatures and (b) subpixel fire sizes for thethree MODIS scenes used in this study, including data from all land-coverclasses; the dots are means, and bars show 95% confidence intervals forthe means.
Earth Interactions d Volume 14 (2010) d Paper No. 6 d Page 21

because CO emission increases as fire temperatures decrease below the thresholdof approximately 850 K that separates flaming from smoldering combustion (e.g.,Palacios-Orueta et al. 2005). Although the 95% confidence intervals for the meantemperatures in Figure 8a extend below this 850-K threshold for all three scenesand the threshold temperature is approximate and depends on a variety of factors,the overall trend indicates that fires later in the burning season are more likely to besmoldering than fires early in the season. Many studies have suggested biomassburning as a major determinant of the seasonal, interannual, and geographicaldistributions of CO (e.g., Bremer et al. 2004; McMillan et al. 2005; Edwards et al.2006), and the MESMA estimates in Figure 8a suggest that variations in firetemperatures likely influence these distributions and potentially the distributions ofother products of incomplete combustion.
The observed differences in seasonal fire temperature changes between differentland-cover classes are also consistent with previously published findings. For ex-ample, in modeling biomass-burning emissions from fires in southern Africa,Korontzi (Korontzi 2005) found that woodlands emitted more products of in-complete combustion later in the fire season. This is consistent with the observeddecrease in fire temperatures for the tree-dominated land-cover classes through thefire season (Figure 4): as fire temperatures in these woodlands decreased throughthe fire season, their emissions of incomplete combustion products would be ex-pected to increase. Korontzi (Korontzi 2005) also found that grasslands burningearly in the fire season emitted more products of incomplete combustion as com-pared to later in the season, which is consistent with the observed increase ingrassland fire temperatures through the fire season (Figure 4).
3.3. Comparing FRP and MESMA estimates of fire properties
The change in FRP estimates over the course of the fire season is less clear thanthe seasonal changes in MESMA estimates of fire properties (cf. Figure 9 to Figure 8).Although the small number of MODIS scenes is very limiting in this seasonal
Figure 9. Estimates of FRP for the three MODIS scenes used in this study, including allland-cover classes; the dots are means, and bars show 95% confidenceintervals for the means.
Earth Interactions d Volume 14 (2010) d Paper No. 6 d Page 22

analysis, the comparisons of FRP across different land covers provide a morerobust demonstration that FRP estimates provide less information about the vari-ability of fire characteristics in these three scenes than MESMA estimates of firetemperatures do (cf. Figure 10 to Figure 4 and Figure 11 to Figure 6). For example,it is difficult to identify any consistent trends in the variation of FRP with land-cover
Figure 10. Estimates of FRP for the three MODIS scenes used in this study, (a) 17 Jun,(b) 20 Aug, and (c) 7 Oct 2004, compared across the land-cover classesfrom Table 2; the dots are means, and bars show 95% confidence inter-vals for the means.
Earth Interactions d Volume 14 (2010) d Paper No. 6 d Page 23

class (Figure 10) or with percent tree cover (Figure 11). In contrast, the MESMAestimates of fire temperatures show clear relationships with these datasets that areconsistent with observations of flaming versus smoldering behavior in differentfuel types, as discussed in the previous subsections.
Although the variations in fire temperatures with land cover are fairly clear(Figures 4 and 6), as are the physical mechanisms that could explain these variations,
Figure 11. Estimates of FRP for the three MODIS scenes used in this study, comparedacross the bins of percent tree cover from Table 3; the dots are means,and bars show 95% confidence intervals for the means.
Earth Interactions d Volume 14 (2010) d Paper No. 6 d Page 24

the variations of fire sizes with land cover are inconsistent (Figures 5 and 7), whichcould explain why variations of FRP with land cover are also inconsistent (Figures 10and 11). This is because FRP depends on both the subpixel size and temperature ofthe burning portion of each pixel [Equation (4)], so variability in the subpixel firesizes will decrease the sensitivity of FRP to changes in fire temperatures. Thiscould also explain why the change in FRP through the burning season is ambigu-ous (Figure 9) because MESMA estimates show subpixel fire sizes to be increas-ing while fire temperatures are decreasing through those three scenes (Figure 8). IfMESMA estimates are correct, increased fire sizes and decreased fire temperatureswould counterbalance each other, potentially explaining why there is no signifi-cant difference in FRP between the 17 June and 20 August scenes. According toMESMA estimates, the decrease in fire temperature from 20 August to 7 October isrelatively small (Figure 8a), whereas the increase in subpixel fire size betweenthose dates appears larger (Figure 8b), which could help to explain why FRP valuesincreased significantly between those two scenes.
4. ConclusionsThis study used MESMA to produce estimates of subpixel fire sizes and tem-
peratures for three MODIS scenes in southern Africa, analyzed how these esti-mates varied with season and across areas of different land cover, and comparedthese to analyses made with FRP. MESMA estimates of fire temperatures exhibitedmore consistent variation with land cover than MESMA estimates of subpixel firesizes did. Out of the land-cover classes in this study, MESMA estimates showed themore tree-dominated areas to have the lowest average fire temperatures, whereasfire temperatures were typically higher in the more grass-dominated areas. Thesevariations in fire temperature were consistent with other studies that have foundsouthern Africa’s tree-dominated areas to promote smoldering fires more than itsgrass-dominated areas do.
Averaged across all land-cover types, MESMA estimates of subpixel fire sizes inthese three scenes showed a clear increase through the burning season, whereasMESMA estimates of fire temperatures showed a clear decrease through the sea-son. The increase in subpixel fire size is consistent with studies that have found firepixel counts to reach their maxima in the late part of the burning season in southernAfrica. The decrease in fire temperatures through the burning season is consistentwith other studies that have identified pronounced increases in measured CO oversouthern Africa during the late burning season. This is because fires emit more COand other products of incomplete combustion as their temperatures decrease belowthe threshold of approximately 850 K that separates flaming from smolderingcombustion. This exemplifies the importance of the new methods for estimatingfire temperatures demonstrated in this paper: a fire’s temperature is an importantdeterminant of the gases and aerosols it emits to the atmosphere and thus the fire’simpact on atmospheric composition and climate.
The changes in FRP estimates over the course of the fire season were less clearthan the seasonal changes in MESMA estimates of fire properties. The variations inFRP with land cover were also less consistent than were the MESMA estimates offire temperature. In both cases, this is likely because subpixel fire sizes also variedwith season and land cover, and FRP cannot separate a fire’s subpixel size from its
Earth Interactions d Volume 14 (2010) d Paper No. 6 d Page 25

temperature. This study thus demonstrates an advantage of MESMA over FRP,because MESMA appears to be more effective at capturing variations in firetemperatures, which strongly influence the gas and aerosol emissions from fires,along with their effects on ecosystems. Future studies could thus potentially useMESMA estimates of subpixel fire properties for improving quantification of thegas and aerosol emissions from the world’s fires and for improving our under-standing of the roles that fires play within many of the world’s ecosystems and howthese roles are changing as fire regimes change.
Acknowledgments. This work was supported by the National Aeronautics and SpaceAdministration (NASA) headquarters under the NASA Earth and Space Science Fellow-ship Program Grant NNX06AF77H. The MODIS and ASTER data used in this study weredistributed by the Land Processes Distributed Active Archive Center (LP DAAC), locatedat the U.S. Geological Survey (USGS) Center for Earth Resources Observation and Sci-ence (EROS; available online at http://lpdaac.usgs.gov), and by the NASA Level 1 andAtmosphere Archive and Distribution System (LAADS; available online at http://ladsweb.nascom.nasa.gov). The Global Land Cover 2000 dataset was from the EuropeanCommission Joint Research Centre (available online at http://bioval.jrc.ec.europa.eu/products/glc2000/glc2000.php). The Vegetation Continuous Fields (VCF) dataset on per-cent tree cover was from the Global Land Cover Facility (available online at http://www.landcover.org). We thank James Randerson, Philip Dennison, Keith Clarke, DylanParenti, Kerry Halligan, Greg Husak, and Seth Peterson for their help and suggestions. Wewould also like to thank the undergraduate and high school students who have assisted withthis research, including Susannah Pitman, Jacquelynn Ybarra, Dani Luna, Julie Rueckheim,Ryan Del Rosario, Andrea Romano, Cara Moore, Alex Samarin, Lindsey Everett, MonicaAltmaier, Brian Boyce, Mike Isaacs, Marjorie Tamoro, Julia Sweet, Clarissa Esteves,Brenda Salguero, Jenny Douthett, and Dylan Aronson. Finally, we thank Rezaul Mahmoodand the anonymous reviewers for their very helpful comments.
References
Andreae, M. O., and P. Merlet, 2001: Emission of trace gases and aerosols from biomass burning.Global Biogeochem. Cycles, 15, 955–966.
Bartholome, E., and A. S. Belward, 2005: GLC2000: A new approach to global land cover mappingfrom Earth observation data. Int. J. Remote Sens., 26, 1959–1977.
Berk, A., L. S. Bernstein, and D. C. Robertson, 1989: MODTRAN: A moderate resolution modelfor LOWTRAN7. Air Force Geophysics Laboratory Tech. Rep. AFGL-TR-89-0122GL-TR-89-0122, 38 pp.
Bremer, H., and Coauthors, 2004: Spatial and temporal variation of MOPITT CO in Africa andSouth America: A comparison with SHADOZ ozone and MODIS aerosol. J. Geophys. Res.,109, D12304, doi:10.1029/2003JD004234.
Cochrane, M. A., A. Alencar, M. D. Schulze, C. M. Souza Jr., D. C. Nepstad, P. Lefebvre, andE. A. Davidson, 1999: Positive feedbacks in the fire dynamic of closed canopy tropicalforests. Science, 284, 1832–1835.
Csiszar, I., L. Denis, L. Giglio, C. O. Justice, and J. Hewson, 2005: Global fire activity from twoyears of MODIS data. Int. J. Wildland Fire, 14, 117–130.
——, J. T. Morisette, and L. Giglio, 2006: Validation of active fire detection from moderate-resolution satellite sensors: The MODIS example in northern Eurasia. IEEE Trans. Geosci.Remote Sens., 44, 1757–1764.
Earth Interactions d Volume 14 (2010) d Paper No. 6 d Page 26

Dale, V. H., L. A. Joyce, S. McNulty, and R. P. Neilson, 2000: The interplay between climatechange, forests, and disturbances. Sci. Total Environ., 262, 201–204.
Dennison, P. E., K. Charoensiri, D. A. Roberts, S. H. Peterson, and R. O. Green, 2006: Wildfiretemperature and land cover modeling using hyperspectral data. Remote Sens. Environ., 100,212–222.
Dozier, J., 1981: A method for satellite identification of surface temperature fields of subpixelresolution. Remote Sens. Environ., 11, 221–229.
Drewa, P. B., W. J. Platt, and E. B. Moser, 2002: Fire effects on resprouting of shrubs in headwatersof southeastern longleaf pine savannas. Ecology, 83, 755–767.
Duncan, B. N., R. V. Martin, A. C. Staudt, R. Yevich, and J. A. Logan, 2003: Interannual andseasonal variability of biomass burning emissions constrained by satellite observations.J. Geophys. Res., 108, 4100, doi:10.1029/2002JD002378.
Eckmann, T. C., D. A. Roberts, and C. J. Still, 2008: Using multiple endmember spectral mixtureanalysis to retrieve subpixel fire properties from MODIS. Remote Sens. Environ., 112, 3773–3783.
——, ——, and ——, 2009: Estimating subpixel fire sizes and temperatures from ASTER usingmultiple endmember spectral mixture analysis. Int. J. Remote Sens., 30, 5851–5864.
Edwards, D. P., G. Petron, P. C. Novelli, L. K. Emmons, J. C. Gille, and J. R. Drummond, 2006:South Hemisphere carbon monoxide interannual variability observed by Terra/Measurementof Pollution in the Troposphere (MOPITT). J. Geophys. Res., 111, D16303, doi:10.1029/2006JD007079.
Fortin, M.-J., P. Drapeau, and P. Legendre, 1989: Spatial autocorrelation and sampling design inplant ecology. Plant Ecol., 83, 209–222.
Fritz, S., and L. See, 2005: Comparison of land cover maps using fuzzy agreement. Int. J. Geogr.Inf. Sci., 19, 787–807.
Gibson, D. J., D. C. Hartnett, and G. L. S. Merrill, 1990: Fire temperature heterogeneity in con-trasting fire prone habitats: Kansas tallgrass prairie and Florida sandhill. Bull. Torrey Bot.Club, 117, 349–356.
Giglio, L., 2007: Characterization of the tropical diurnal fire cycle using VIRS and MODIS ob-servations. Remote Sens. Environ., 108, 407–421.
——, and J. D. Kendall, 2001: Application of the Dozier retrieval to wildfire characterization: Asensitivity analysis. Remote Sens. Environ., 77, 34–49.
——, J. Descloitres, C. O. Justice, and Y. J. Kaufman, 2003: An enhanced contextual fire detectionalgorithm for MODIS. Remote Sens. Environ., 87, 273–282.
——, I. Csiszar, and C. O. Justice, 2006: Global distribution and seasonality of active fires asobserved with the Terra and Aqua Moderate Resolution Imaging Spectroradiometer (MODIS)sensors. J. Geophys. Res., 111, G02016, doi:10.1029/2005JG000142.
Gignoux, J., J. Clobert, and J.-C. Menaut, 1997: Alternative fire resistance strategies in savannatrees. Oecologia, 110, 576–583.
Hanley, M. E., and M. Fenner, 1998: Pre-germination temperature and the survivorship and onwardgrowth of Mediterranean fire-following plant species. Acta Oecol., 19, 181–187.
Hansen, M. C., R. S. DeFries, J. R. G. Townshend, M. Carroll, C. Dimiceli, and R. A. Sohlberg,2003: Global percent tree cover at a spatial resolution of 500 meters: First results of theMODIS vegetation continuous fields algorithm. Earth Interact., 7. [Available online at http://EarthInteractions.org.]
——, J. R. G. Townshend, R. S. DeFries, and M. Carroll, 2005: Estimation of tree cover usingMODIS data at global, continental and regional/local scales. Int. J. Remote Sens., 26, 4359–4380.
——, D. P. Roy, E. Lindquist, B. Adusei, C. O. Justice, and A. Altstatt, 2008: A method forintegrating MODIS and Landsat data for systematic monitoring of forest cover and change inthe Congo Basin. Remote Sens. Environ., 112, 2495–2513.
Hoelzemann, J. J., M. G. Schultz, G. P. Brasseur, C. Granier, and M. Simon, 2004: Global WildlandFire Emission Model (GWEM): Evaluating the use of global area burnt satellite data.J. Geophys. Res., 109, D14S04, doi:10.1029/2003JD003666.
Earth Interactions d Volume 14 (2010) d Paper No. 6 d Page 27

Ichoku, C., L. A. Remer, Y. J. Kaufman, R. Levy, D. A. Chu, D. Tanre, and B. N. Holben, 2003:MODIS observation of aerosols and estimation of aerosol radiative forcing over South Africaduring SAFARI 2000. J. Geophys. Res., 108, 8499, doi:10.1029/2002JD002366.
Ito, A., and J. E. Penner, 2004: Global estimates of biomass burning emissions based on satelliteimagery for the year 2000. J. Geophys. Res., 109, D14S05, doi:10.1029/2003JD004423.
Iverson, L. R., D. A. Yaussy, J. Rebbeck, T. F. Hutchinson, R. P. Long, and A. M. Prasad, 2004: Acomparison of thermocouples and temperature paints to monitor spatial and temporal char-acteristics of landscape-scale prescribed fires. Int. J. Wildland Fire, 13, 311–322.
Jensen, M., A. Michelsen, and M. Gashaw, 2001: Responses in plant, soil inorganic and microbialnutrient pools to experimental fire, ash and biomass addition in a woodland savanna.Oecologia, 128, 85–93.
Kaufman, Y. J., and Coauthors, 1998: Potential global fire monitoring from EOS-MODIS. J. Geo-phys. Res., 103, 32 215–32 238.
——, C. Ichoku, L. Giglio, S. Korontzi, D. A. Chu, W. M. Hao, R.-R. Li, and C. O. Justice, 2003:Fire and smoke observed from the Earth Observing System MODIS instrument—Products,validation, and operational use. Int. J. Remote Sens., 24, 1765–1781.
King, M. D., and Coauthors, 2003: Cloud and aerosol properties, precipitable water, and profiles oftemperature and water vapor from MODIS. IEEE Trans. Geosci. Remote Sens., 41, 442–458.
Korontzi, S., 2005: Seasonal patterns in biomass burning emissions from South African vegetationfires for the year 2000. Global Change Biol., 11, 1680–1700.
Lenihan, J. M., R. Drapek, D. Bachelet, and R. P. Neilson, 2003: Climate change effects onvegetation distribution, carbon, and fire in California. Ecol. Appl., 13, 1667–1681.
Mayaux, P., E. Bartholome, S. Fritz, and A. Belward, 2004: A new land-cover map of Africa for theyear 2000. J. Biogeogr., 31, 861–877.
——, and Coauthors, 2006: Validation of the global land cover 2000 map. IEEE Trans. Geosci.Remote Sens., 44, 1728–1739.
McMillan, W. W., and Coauthors, 2005: Daily global maps of carbon monoxide from NASA’sAtmospheric Infrared Sounder. Geophys. Res. Lett., 32, L11801, doi:10.1029/2004GL021821.
Morisette, J., L. Giglio, I. Csiszar, and C. O. Justice, 2005: Validation of the MODIS active fireproduct over South Africa with ASTER data. Int. J. Remote Sens., 26, 4239–4264.
Palacios-Orueta, A., E. Chuvieco, A. Parra, and C. Carmona-Moreno, 2005: Biomass burningemissions: A review of models using remote-sensing data. Environ. Monit. Assess., 104, 189–209.
Pyne, S. J., P. L. Andrews, and R. D. Laven, 1996: Introduction to Wildland Fire. 2nd ed. Wiley,769 pp.
Roberts, D. A., M. Gardner, R. Church, S. Ustin, G. Scheer, and R. O. Green, 1998: Mappingchaparral in the Santa Monica mountains using multiple endmember spectral mixture models.Remote Sens. Environ., 65, 267–279.
Roberts, G., M. J. Wooster, G. L. W. Perry, N. Drake, L.-M. Rebelo, and F. Dipotso, 2005: Retrievalof biomass combustion rates and totals from fire radiative power observations: Application toSouth Africa using geostationary SEVIRI imagery. J. Geophys. Res., 110, D21111, doi:10.1029/2005JD006018.
Roy, D. P., Y. Jin, P. E. Lewis, and C. O. Justice, 2005: Prototyping a global algorithm for systematicfire-affected area mapping using MODIS time series data. Remote Sens. Environ., 97,137–162.
Sankaran, M., and Coauthors, 2005: Determinants of woody cover in African savannas. Nature,438, 846–849.
Shea, R. W., B. W. Shea, J. B. Kauffman, D. E. Ward, C. I. Haskins, and M. C. Scholes, 1996: Fuelbiomass and combustion factors associated with fires in savanna ecosystems of South Africaand Zambia. J. Geophys. Res., 101, 23 551–23 568.
Stronach, N. R. H., and S. J. McNaughton, 1989: Grassland fire dynamics in the Serengeti eco-system, and a potential method of retrospectively estimating fire energy. J. Appl. Ecol., 26,1025–1033.
Earth Interactions d Volume 14 (2010) d Paper No. 6 d Page 28

van der Werf, G. R., J. T. Randerson, G. J. Collatz, and L. Giglio, 2003: Carbon emissions from firesin tropical and subtropical ecosystems. Global Change Biol., 9, 547–562.
——, ——, ——, ——, P. S. Kasibhatla, A. F. Arellano Jr., S. C. Olsen, and E. S. Kasischke, 2004:Continental-scale partitioning of fire emissions during the 1997 to 2001 El Nino/La Ninaperiod. Science, 303, 73–76.
——, ——, L. Giglio, G. J. Collatz, P. S. Kasibhatla, and A. F. Arellano Jr., 2006: Interannualvariability of global biomass burning emissions from 1997 to 2004. Atmos. Chem. Phys., 6,3243–3441.
——, ——, ——, N. Gobron, and A. J. Dolman, 2008: Climate controls on the variability of firesin the tropics and subtropics. Global Biogeochem. Cycles, 22, GB3028, doi:10.1029/2007GB003122.
Ward, D. E., W. M. Hao, R. A. Susott, R. E. Babbitt, R. W. Shea, J. B. Kauffman, and C. O. Justice,1996: Effect of fuel composition on combustion efficiency and emission factors for Africansavanna ecosystems. J. Geophys. Res., 101, 23 569–23 576.
Wiedinmyer, C., B. Quayle, C. Geron, A. Belote, D. McKenzie, X. Zhang, S. O’Neill, andK. K. Wynne, 2006: Estimating emissions from fires in North America for air qualitymodeling. Atmos. Environ., 40, 3419–3432.
Wolfe, R. E., M. Nishihama, A. J. Fleig, J. A. Kuyper, D. P. Roy, J. C. Storey, and F. S. Patt, 2002:Achieving sub-pixel geolocation accuracy in support of MODIS land science. Remote Sens.Environ., 83, 31–49.
Wooster, M. J., B. Zhukov, and D. Oertel, 2003: Fire radiative energy for quantitative study ofbiomass burning: Derivation from the BIRD experimental satellite and comparison toMODIS fire products. Remote Sens. Environ., 86, 83–107.
Earth Interactions is published jointly by the American Meteorological Society, the American Geophysical
Union, and the Association of American Geographers. Permission to use figures, tables, and brief excerpts
from this journal in scientific and educational works is hereby granted provided that the source is ac-
knowledged. Any use of material in this journal that is determined to be ‘‘fair use’’ under Section 107 or that
satisfies the conditions specified in Section 108 of the U.S. Copyright Law (17 USC, as revised by P.IL. 94-
553) does not require the publishers’ permission. For permission for any other from of copying, contact one of
the copublishing societies.
Earth Interactions d Volume 14 (2010) d Paper No. 6 d Page 29