Effect of Discrete Macroion Charge Distributions on Electric Double Layer of a Spherical Macroion
10
This article was downloaded by: [York University Libraries] On: 02 November 2013, At: 14:33 Publisher: Taylor & Francis Informa Ltd Registered in England and Wales Registered Number: 1072954 Registered office: Mortimer House, 37-41 Mortimer Street, London W1T 3JH, UK Journal of Dispersion Science and Technology Publication details, including instructions for authors and subscription information: http://www.tandfonline.com/loi/ldis20 Effect of Discrete Macroion Charge Distributions on Electric Double Layer of a Spherical Macroion Khawla Qamhieh a , Mirfit Amleh a & Mai Khaleel a a Department of Physics, College of Science and Technology , Al-Quds University , Jerusalem , Palestine Accepted author version posted online: 10 Jan 2013.Published online: 23 Oct 2013. To cite this article: Khawla Qamhieh , Mirfit Amleh & Mai Khaleel (2013) Effect of Discrete Macroion Charge Distributions on Electric Double Layer of a Spherical Macroion, Journal of Dispersion Science and Technology, 34:11, 1517-1525, DOI: 10.1080/01932691.2012.751878 To link to this article: http://dx.doi.org/10.1080/01932691.2012.751878 PLEASE SCROLL DOWN FOR ARTICLE Taylor & Francis makes every effort to ensure the accuracy of all the information (the “Content”) contained in the publications on our platform. However, Taylor & Francis, our agents, and our licensors make no representations or warranties whatsoever as to the accuracy, completeness, or suitability for any purpose of the Content. Any opinions and views expressed in this publication are the opinions and views of the authors, and are not the views of or endorsed by Taylor & Francis. The accuracy of the Content should not be relied upon and should be independently verified with primary sources of information. Taylor and Francis shall not be liable for any losses, actions, claims, proceedings, demands, costs, expenses, damages, and other liabilities whatsoever or howsoever caused arising directly or indirectly in connection with, in relation to or arising out of the use of the Content. This article may be used for research, teaching, and private study purposes. Any substantial or systematic reproduction, redistribution, reselling, loan, sub-licensing, systematic supply, or distribution in any form to anyone is expressly forbidden. Terms & Conditions of access and use can be found at http:// www.tandfonline.com/page/terms-and-conditions
-
Upload
independent -
Category
Documents
-
view
3 -
download
0
Transcript of Effect of Discrete Macroion Charge Distributions on Electric Double Layer of a Spherical Macroion

This article was downloaded by: [York University Libraries]On: 02 November 2013, At: 14:33Publisher: Taylor & FrancisInforma Ltd Registered in England and Wales Registered Number: 1072954 Registered office: Mortimer House,37-41 Mortimer Street, London W1T 3JH, UK
Journal of Dispersion Science and TechnologyPublication details, including instructions for authors and subscription information:http://www.tandfonline.com/loi/ldis20
Effect of Discrete Macroion Charge Distributions onElectric Double Layer of a Spherical MacroionKhawla Qamhieh a , Mirfit Amleh a & Mai Khaleel aa Department of Physics, College of Science and Technology , Al-Quds University ,Jerusalem , PalestineAccepted author version posted online: 10 Jan 2013.Published online: 23 Oct 2013.
To cite this article: Khawla Qamhieh , Mirfit Amleh & Mai Khaleel (2013) Effect of Discrete Macroion Charge Distributionson Electric Double Layer of a Spherical Macroion, Journal of Dispersion Science and Technology, 34:11, 1517-1525, DOI:10.1080/01932691.2012.751878
To link to this article: http://dx.doi.org/10.1080/01932691.2012.751878
PLEASE SCROLL DOWN FOR ARTICLE
Taylor & Francis makes every effort to ensure the accuracy of all the information (the “Content”) containedin the publications on our platform. However, Taylor & Francis, our agents, and our licensors make norepresentations or warranties whatsoever as to the accuracy, completeness, or suitability for any purpose of theContent. Any opinions and views expressed in this publication are the opinions and views of the authors, andare not the views of or endorsed by Taylor & Francis. The accuracy of the Content should not be relied upon andshould be independently verified with primary sources of information. Taylor and Francis shall not be liable forany losses, actions, claims, proceedings, demands, costs, expenses, damages, and other liabilities whatsoeveror howsoever caused arising directly or indirectly in connection with, in relation to or arising out of the use ofthe Content.
This article may be used for research, teaching, and private study purposes. Any substantial or systematicreproduction, redistribution, reselling, loan, sub-licensing, systematic supply, or distribution in anyform to anyone is expressly forbidden. Terms & Conditions of access and use can be found at http://www.tandfonline.com/page/terms-and-conditions

Effect of Discrete Macroion Charge Distributions onElectric Double Layer of a Spherical Macroion
Khawla Qamhieh, Mirfit Amleh, and Mai KhaleelDepartment of Physics, College of Science and Technology, Al-Quds University, Jerusalem, Palestine
GRAPHICAL ABSTRACT
The effect of replacing the conventional uniform macroion surface charge density with discretemacroion charge distributions on the structure of electric double layer (EDL) of a spherical macro-ion has been investigated byMonte Carlo (MC) simulations. Two discrete models have been inves-tigated in addition to the central macroion charge: point charges localized on the macroion surfaceand finite-sized charges protruding into the solution. Both models have been studied with fixed andmobile macroion charges. The radial functions of local densities and electrostatic potential inEDL, are calculated and compared to the results obtained for the central macroion charge distri-bution. It is concluded that the model of charge distribution significantly affects the EDL structureclose to the macroion, while the effect is much weaker at larger distances. With point chargeslocalized on the macroion surface, counterions become stronger accumulated to the macroion,as a result the absolute values of surface potential u0 and zeta n potential are decreased. Withprotruding charges, the excluded volume effect dominates over the increased correlation ability;hence the counterions are less accumulated near the macroions and the absolute values of u0
and n potentials are increased.
Keywords Discrete macroion charge, electric double layer, Monte Carlo simulation, surfacepotential, zeta potential
1. INTRODUCTION
For many years, the scientific community has investi-gated the structural characteristics of charged colloidal solu-tions trying to understand the role of the electrostatic andentropic correlations in their observable properties. Electro-static interactions in colloidal suspensions and their relationto their phase stability have always been attracting muchattention because of their occurrence in many biologicaland technological circumstances. The ionic structure, orelectrical double layer (EDL), in the vicinity of colloidalparticles serves as a basis on the stability and coagulation
of disperse systems in the DLVO theory.[1,2] An EDL maybe of different geometries such as planar,[3] cylindrical,[4]
spherical,[5] or ellipsoidal,[6] depending on the geometriesof the charged surfaces. In the DLVO theory, the correla-tions between the ions have been neglected through applyingthe mean field approaches. It however only recently becameclear that the electrostatic correlations between the ions canlead to variety of exciting phenomena in systems containingcharged polyions, such as charge inversion or short-rangeattraction between like-charged macroions.[7–24] The primi-tive model of asymmetric electrolytes forms a firm basisfor examining the distribution of small ions near chargedcolloids. In this model, the charged macroions, referredto colloids, and the small ions are both represented as acharged hard spheres, whereas the solvent is entered inthe calculation through its dielectric constant. Some of the
Received 17 November 2012; accepted 19 November 2012.Address correspondence to Khawla Qamhieh, Department of
Physics, College of Science and Technology, Al-Quds University,P.O. Box 20002, Jerusalem, Palestine. E-mail: [email protected]
Journal of Dispersion Science and Technology, 34:1517–1525, 2013
Copyright # Taylor & Francis Group, LLC
ISSN: 0193-2691 print=1532-2351 online
DOI: 10.1080/01932691.2012.751878
1517
Dow
nloa
ded
by [
Yor
k U
nive
rsity
Lib
rari
es]
at 1
4:33
02
Nov
embe
r 20
13

recent theoretical and simulation advances are summarizedin several reviews.[25–29] The widespread use of the primitivemodel to investigate the double layer has led to significantprogress in the field, due to its ability to explain a large var-iety of colloidal phenomena, and, therefore, has establishedto be the standard representation of the EDL.[30]
Usually the charge of a macroion is described as a centralone, which is equal to a uniform distribution of the chargeon the macroion surface. However, this homogeneous sur-face charge density has been replaced by a discrete macroioncharges to represent macroions surfactant micelles,[31–36]
and globular proteins.[37–38] It turned out, that the distri-bution pattern of macroion surface charge could consider-ably affect the structure of the dense part of EDL.
The goal of the present contribution is to more firmlyunderstand the effects of different macroion charge distri-butions on the characteristics of EDL by using MonteCarlo (MC) method. These characteristics include (i) bulkcharge distribution in the EDL, and (ii) distribution ofelectrostatic potential u(r),
Semashko et al. investigated the effect of macroioncharge discretization for spherical macroions on the EDLstructure, where the macroion charges were randomly dis-tributed on the macroion surface and have been shifted intothe interior by Rs, the radius of the elementary charge.[35,36]
Throughout their study, they employed molecular dynamic(MD) simulations, and concluded that the character ofcharge distribution significantly affects the EDL structurenear the macroion, while its effect is much weaker at largerdistance. The present contribution differs with respect thatwe are using MC simulation to investigate the effect of dis-crete macroion charge distribution on the character of EDLby employing other models than what has been used bySemashko. Two discrete macroion charge distributionsare considered in addition to the central macroion charge:one where the finite-sized charges possess a hard-sphereradius and protrude into the solution, and one where pointcharges are localized on the macroion surface. Both discretecharged distributions were examined for fixed and mobilecharges. These models are similar to what have beenemployed by Qamhieh et al.[34]
2. MODEL AND METHOD
2.1. Model
Consider solutions of asymmetric electrolytes containMacroions and counterions, described within the frame-work of the primitive model. The macroions are representedas hard spheres of radius RM¼ 20 A, and a charge ZMe¼�60e, originating from NS¼ 60 charged sites with radiusRS, where e is the elementary charge. The counterions arerepresented by hard spheres of radius RI¼ 2 A, with chargeZIe¼þ1e, þ2e, and þ3e. The water enters the model by itsrelative dielectric permeability er.
Through our study, three types of macroion chargedistributions have been considered, similar to the modelsadopted by Qamhieh et al.[35] (1) The central chargedistribution (C), in which the total macroion charges arepositioned at the center of the sphere, which is equivalentto a homogeneous surface charge distribution. (2) The sur-face charge distribution (S), in which NS sites are localizedon the surface of the macroion, at a distance rS¼RM fromthe center of it. In this model the macroion charges are con-sidered as a point without any extension. (3) The protrud-ing (P) charge distribution, in which NS are positioned at adistance rS¼RMþ 2 A from the center of the macroion.Here the macroion charges are considered as hard sphereswith a radius of 2 A, localized outside the hard-sphere sur-face and are protruding 4 A into the solution. Two differentcases have been considered to the surface as well as to theprotruding charges distributions. The frozen (F) one, inwhich the charges are immobile and their distribution isselected to be isomorphic to that of the carbon positionsin the fullerene C60 molecule, and the mobile (M) arrange-ment in which the charges are laterally mobile on the sur-face, at the distance rS from the center of the macroion.The five different macroion models were used can be sum-marized as the following: the central charge (C), the frozensurface charges (FS), the mobile surface charges (MS), thefrozen protruding charges (FP), and the mobile protrudingcharges (MP).
A spherical cell with radius RC¼ 100 A equal to 5RM
containing one macroion at the center of the cell has beenemployed, in which the electroneutrality was established bysupplying relevant amount of counterions, NI¼ jZM=ZIj.In this approach, a complicated many-body problem isreduced to an effective one macroion problem.
In our model, the interaction between the particles ispairwise additive, and is given by
Uij rð Þ ¼1; r < Ri þ Rj
� �ZiZje
2
4pe0er1r ; r � ðRi þ RjÞ
( ); ½1�
where i and j denote either a macroion, a macroion sites, ora counterion, with Ri represents the radius of particle i, r isthe center to center separation between particles i and j, Zi
is the charge of particle i, e is the elementary charge, and e0is the permittivity of vacuum.
The systems are considered at a fixed macroion numberdensity qM ¼2:5�10�7A�3 corresponding to a macroionvolume fraction /M¼ 0.0084. A temperature of T¼ 298Kand a relative dielectric permittivity of er¼ 78.4 were used.As a result of these conditions the Bjerrum length, denotingthe distance between two unit charges at which theCoulomb interaction is equal to the thermal energy,becomes 7.15 A.
1518 K. QAMHIEH ET AL.
Dow
nloa
ded
by [
Yor
k U
nive
rsity
Lib
rari
es]
at 1
4:33
02
Nov
embe
r 20
13

2.2. Method and Simulation
Upon calculations, we applied Monte Carlo (MC) simu-lation method in the canonical (NVT) ensemble accordingto the standard Metropolis algorithm, and the Ewald sum-mation for handling the electrostatic interactions wasemployed.
Several types of trial displacements were applied. Trialrotation of macroions (frozen macroion charges) or lateraltrial displacement of single macroion charges (mobile macro-ion charges) and trial displacement of counterions were made.
The simulation package MOLSIM by Per Linse et al.was used to perform all the simulations.[39]
3. RESULTS AND DISCUSSION
Results for the systems with different macroion charge dis-tributions are presented, first without salt, then with 3:1 salt.
3.1. Systems Without Salt
3.1.1. Central Charge Distribution
The radial functions of local charge density of counter-ions qI(r) for the central charge distribution with differentcounterion valences are shown in Figure 1a, where
qI rð Þ ¼ zI.I gMI ; ½2�
where zI is the valence of the counterions, .I is the uniformdensity of the counterions, and gMI is the radial distribution
function of the counterions around the macroion. Suchfunctions of charge density can characterize the structureof the ionic atmosphere of macroion. The functions providethe local charge density of counterions at distance r from themacroion. The equilibrium counterion distribution is acompromise between the macroion-counterion electrostaticattraction striving to a complete adsorption of the counter-ions on the macroion surface and the counterion entropypromoting a homogeneous counterion density. At increasingcounterion valence, the macroion-counterion electrostaticincreases in magnitude, leading to a more uneven counteriondistribution. Figure 1a shows a strong accumulation of thecounterions near the macroion surface with all counterionvalences. This accumulation is increased by increasing thevalence where the highest charge density of the counterionsis established for systems with trivalent ones.
The mean electrostatic potential at distance r from themacroion is
u rð Þ ¼Z 1
r
dr0E r0ð Þ ¼ e
4pe
Z 1
r
dr0Pðr0Þr02
½3�
where E(r) is the electric field and P(r) is the integratedcharge number, also can be called the accumulated runningcharge, within a distance r from the center of the colloidalparticle, e is the elementary charge.
P rð Þ ¼ ZM þZ r
R
Xi
ziqi r0ð Þ
" #4pr02dr0 ½4�
where i refers to the type of the microion. Since the typicalintegrated charge rapidly decays to zero,[40] the uppercutoff in Equation (3) is taken to be 60 A. The zeta poten-tial (n), is the potential at the boundary called the slippingplane or hydrodynamic shear surrounding a particlesurface. Following Diehl et al.,[40] the shear plane waslocated at one ionic diameter from the colloidal surface,so that�u(Rs), where Rs¼Rþ 2RI.
Figure 1b illustrates electrostatic potentials u(r) of themacroion EDL as a function of the radial distance at indi-cated values of the counterion valences for central macroioncharge model. From the graph we can conclude that themagnitude of the negative electric potential is decreased rap-idly in the region close to the macroion as a result of theaccumulation of counterions at all valences, with trivalentcounterions the decrease is the largest. At ZI¼ 1, 2, and 3the values of the surface potential u0 are about �145.6mv,�69.8mv, and �30mv, respectively, while the values of zetapotential (n) are �111mv, �43mv, and �9.7mv. The valueof the surface potential of �145.6mv for the system withmonovalent counterion is in good agreement with the experi-mental result of �145mv determined for the surface poten-tial of micelles in aqueous SDS solutions, and comparable to
FIG. 1. a) Radial functions of local charge density of counterions qI(r)and b) electrostatic potential u(r) of the macroion EDL as a function of
the radial distance at indicated values of the counterion valence for the
central charge distribution.
DISCRETE MACROION CHARGE DISTRIBUTIONS 1519
Dow
nloa
ded
by [
Yor
k U
nive
rsity
Lib
rari
es]
at 1
4:33
02
Nov
embe
r 20
13

the value predicted by Somashko et al. of �148 for thesystem of central macroion charge distribution.[35]
3.1.2. Different Macroion Charge Distributions
3.1.2.1. Effect of Counterion Valence. The radial func-tions of local charge density of counterions qI(r) for the fivedifferent macroion charge models are shown in Figure 2 atdifferent values of counterion valence. From Figure 2, wecan conclude that the local charge density near the macro-ion is larger with the two surface charge distributions FSand MS comparing to the central charge distribution, therelative increase becoming stronger with increase counter-ion valence. With the protruding charge distributions FPand MP, the local charge density qI(r) near the macroionis weaker than with the central one, but further and atr¼ 26 A a cusp appears, which is prominent with ZI¼ 1but weaker with multivalent counterions. The decrease ofthe local charge density qI(r) near the macroion comparingto the central distribution is in agreement to what has beenfound by Semashko et al. for protruding charge distributionresulting from the excluded volume of the macroioncharges.[35] In general we can notice that the deviationsfrom the central charge distribution is mainly localized tothe nearest �10 A from the macroion surface.
Figure 3 shows the mean electrostatic potential of themacroion EDL with the five macroion charge distributionsat different values of counterion charge valence. It is clearfrom Figure 3 that the magnitude of the negative electricpotential is decreased rapidly in the region close to the
macroion as a result of the accumulation of counterions,and the values of u0 and n potentials of the systems areaffected by the distribution of the macroion charge andthe counterion valence. The magnitudes of u0 and n poten-tials, with all macroion charge models, are decreased as thecounterion valence is increased, and they are increased withthe two protruding charge distributions FP and MPrelative to the central model, while with the other twosurface charge distributions FS and MS, they are decreasedwith a very small values. The absolute values of u0 andn potentials are smallest with the surface chargedistribution MS, and largest with the protruding chargedistribution MP.
3.1.2.2. Effect of Counterion Size. Figure 4 shows thelocal charge density functions for the counterions qI(r) atindicated values of radii of the counterion at valenceZI¼ 1, for different models of macroion charge distribu-tions. A decrease in the size of the counterion causes a shiftin the maxima to the left and increases the values of thesemaxima. This can be explained by increasing the electro-static interaction between macroion and counterions at clo-ser approach between them. Also we can conclude that thelocal charge density near the macroion, with all radii of thecounterions, is larger with the two surface charge distribu-tions FS and MS comparing to the central charge distri-bution. With the other two protruding chargedistributions FP and MP, the local charge density qI(r)near the macroion is smaller than with the central one.Which means that the effect of the discretization of
FIG. 2. Radial functions of local charge density of counterions qI(r) at indicated values of the counterion valence: a) ZI¼ 1, b) ZI¼ 2, and c) ZI¼ 3
with MS, FS, C, FP, and MP macroion charge distributions.
1520 K. QAMHIEH ET AL.
Dow
nloa
ded
by [
Yor
k U
nive
rsity
Lib
rari
es]
at 1
4:33
02
Nov
embe
r 20
13

FIG. 4. Radial functions of local charge density of counterions qI(r) at indicated values of radii for the monovalent counterions, for systems with:
a) C, b) FP, c) FS, d) MP, and e) MS macroion charge distributions.
FIG. 3. Electrostatic potential u(r) of the macroion EDL as a function of the radial distance at indicated values of the counterion valence: a) ZI¼ 1,
b) ZI¼ 2, and c) ZI¼ 3 with MS, FS, C, FP, and MP macroion charge distributions.
DISCRETE MACROION CHARGE DISTRIBUTIONS 1521
Dow
nloa
ded
by [
Yor
k U
nive
rsity
Lib
rari
es]
at 1
4:33
02
Nov
embe
r 20
13

the macroion charge depends on the excluded volume ofthese charges, when the charges are modeled as a protrud-ing ones the qI(r) decreases, relative to the central model,while qI(r) increases when the macroion charges are mod-eled as a point ones.
As a result the electrostatic potential u(r) of the macro-ion EDL will be affected. It is clear from Figure 5 that theabsolute values of u0 and n potentials of the systems withmonovalent counterions, increase by increasing the sizeof the counterion, and also increase with the two protrud-ing charge distributions FP and MP relative to the centralmodel, while with the other two surface charge distribu-tions FS and MS, the decrease, in these values, is smaller.
Figure 6 illustrates u0 and n potentials as a function ofcounterion size, with different macroion charge distribu-tions. From Figure 6, we can conclude that the decreasein the absolute value of these potentials is almost linearwhen the counterion radius is changed from 1 A to 3 A,and the variation in the potential by changing the macroioncharge distribution, is largest when RI¼ 1 A while it is smal-lest when RI¼ 3 A. The negative values of uo and n poten-tials with MP charge distribution is very close to thosewith FP, especially when RI is 2 and 3 A. These potentialsare much more negative than those with C, FS, and MS
distributions because of the exclude volume of the surfacecharges of the macroion.
3.2. Systems with Salt
The macroion EDL for the systems with the five modelsof macroion charge distribution at different concentrationsof 3:1 salt have been studied considering RI¼ 2 A for thecounterions. We characterize the amount of added salt bya ratio of the overall added cation charge to the overallmacroion charge, b¼Zcqc=(ZMqM), where Zc and qc arethe valence and the number density of the cationic respect-ively. The integrated running charge curves P(r) for the sys-tems are presented in Figure 7. There is a distinct qualitativedifference between the systems with different salt concen-tration. In the systems with low salt concentration b< 1the total charge is decaying monotonously and reaches zeroonly at the cell boundary, in the other systems with highersalt concentration the charge exhibit a sharp drop to zerowithin a very narrow region, and the sign of the charge ischanging from negative to positive, then decaying slowly,which means that the macroion is overcharged and chargeinversion occurred. The charge inversion is larger with thesurface macroion charge distributions FS and MS relativeto the central one, while it is smaller with the protruding
FIG. 5. Electrostatic potential u(r) of the macroion EDL as a function of the radial distance at indicated values of radii for the monovalent
counterions, for systems with: a) C, b) FP, c) FS, d) MP, and e) MS macroion charge distributions.
1522 K. QAMHIEH ET AL.
Dow
nloa
ded
by [
Yor
k U
nive
rsity
Lib
rari
es]
at 1
4:33
02
Nov
embe
r 20
13

macroion charge distributions FP and MP. Close to the cellboundary, one can see the cation charge build-up whichoriginates from repulsion between the charge invertedmacroions and cations.
The charge inversion of the macroion is clear also inFigure 8, which represents the electrostatic potential ofthe macroion EDL for the systems with monovalent coun-terions and with all macroion charge distributions at differ-ent concentrations of 3:1 salt. From Figure 8 we can see thatthe absolute values of u0 and n potentials of the systemsdecrease by increasing the value of b, keeping the value ofu0 as a negative one, while the value of n potential becomespositive for b> 1, which reflect the charge inversion of themacroion charge. With the surface macroion charge distri-butions, FS and MS the inversion is larger than with thecentral one, while it is smaller with the protruding chargedispersions FP and MP.
Figure 9 illustrates u0 and n potentials as a function of3:1 salt concentration represented by b, with differentmacroion charge distributions. From Figure 9 we canconclude that the negative values of these potentialsare decreasing linearly and very rapidly when b changesfrom zero to one, when b> 1 the decrease in these potentialsby increasing the salt concentration is very slow. Figure 9ashows that the values of the surface potential are getting
FIG. 7. The integrated charge number P(r) within a distance r from the center of the macroion, with monovalent counterions, at different 3:1 salt
concentrations, for systems with a) C, b) FP, c) FS, d) MP, and e) MS macroion charge distributions.
FIG. 6. a) Surface electrostatic potential uo of the macroion and b)
zeta potential as a function of counterions size.
DISCRETE MACROION CHARGE DISTRIBUTIONS 1523
Dow
nloa
ded
by [
Yor
k U
nive
rsity
Lib
rari
es]
at 1
4:33
02
Nov
embe
r 20
13
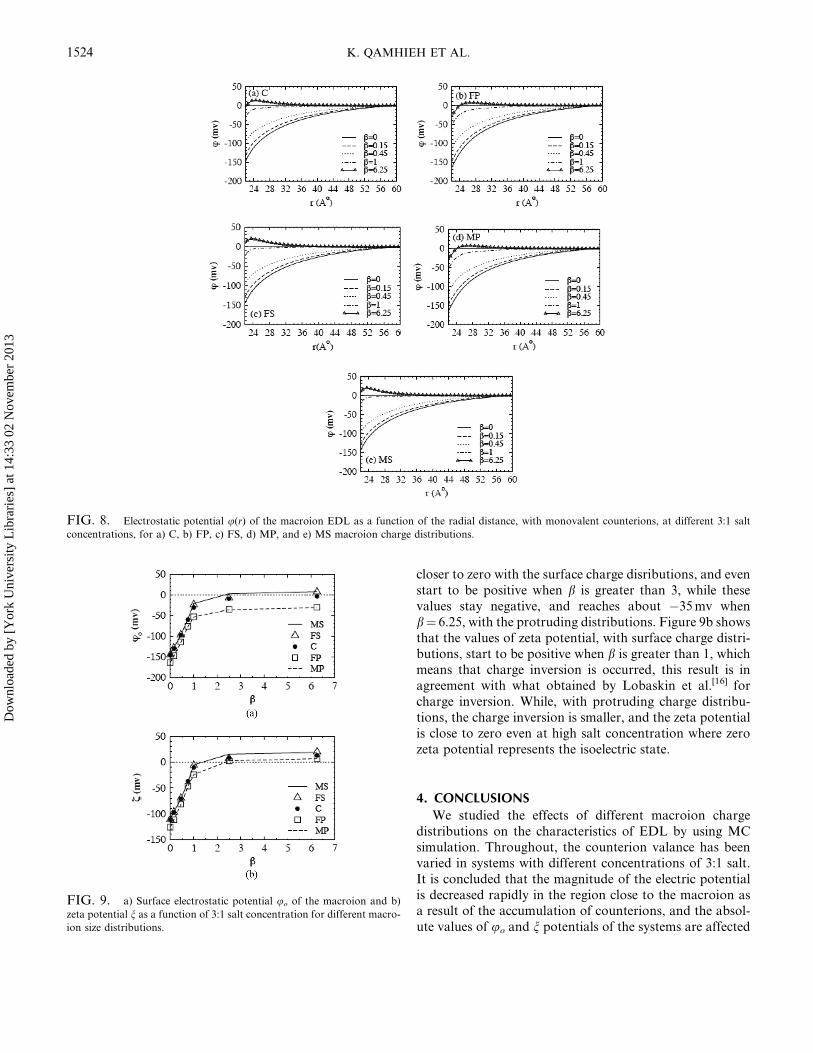
closer to zero with the surface charge disributions, and evenstart to be positive when b is greater than 3, while thesevalues stay negative, and reaches about �35mv whenb¼ 6.25, with the protruding distributions. Figure 9b showsthat the values of zeta potential, with surface charge distri-butions, start to be positive when b is greater than 1, whichmeans that charge inversion is occurred, this result is inagreement with what obtained by Lobaskin et al.[16] forcharge inversion. While, with protruding charge distribu-tions, the charge inversion is smaller, and the zeta potentialis close to zero even at high salt concentration where zerozeta potential represents the isoelectric state.
4. CONCLUSIONS
We studied the effects of different macroion chargedistributions on the characteristics of EDL by using MCsimulation. Throughout, the counterion valance has beenvaried in systems with different concentrations of 3:1 salt.It is concluded that the magnitude of the electric potentialis decreased rapidly in the region close to the macroion asa result of the accumulation of counterions, and the absol-ute values of uo and n potentials of the systems are affected
FIG. 8. Electrostatic potential u(r) of the macroion EDL as a function of the radial distance, with monovalent counterions, at different 3:1 salt
concentrations, for a) C, b) FP, c) FS, d) MP, and e) MS macroion charge distributions.
FIG. 9. a) Surface electrostatic potential uo of the macroion and b)
zeta potential n as a function of 3:1 salt concentration for different macro-
ion size distributions.
1524 K. QAMHIEH ET AL.
Dow
nloa
ded
by [
Yor
k U
nive
rsity
Lib
rari
es]
at 1
4:33
02
Nov
embe
r 20
13

by the distribution of the macroion charge, the counterionvalence, the size of the counterions and the concentrationof the slat. Decreasing the size of the counterions causes ashift to the left, in the maxima of qI(r), and increases thevalues of these maxima, as a result the Electrostatic poten-tial u(r) of the macroion EDL has been affected. The nega-tive values of uo and n potentials of the systems withmonovalent counterions, increase by decreasing the size ofcounterions, and also increase with the two protrudingcharge distributions FP and MP relative to the centralmodel, while with the other two surface charge distributionsFS and MS, the decrease, in these values, is very small.These values of potentials also decrease by increasing theconcentration of 3:1 salt, keeping the value of uo as a nega-tive one, while the value of n potential becomes positive forb> 1, where charge inversion of the macroion has beenestablished. With the surface macroion charge distributions,FS and MS the inversion is larger than with the central one,while it is smaller with the protruding charge dispersions FPand MP. When b changes from zero to one the decrease inthe absolute values of uo and n potentials is very rapid, whilewith b> 1 the decrease is very slow.
REFERENCES
[1] Derjaguin, B.V. and Landau, L. (1941) Acta Physicochim.URSS, 14: 633–662.
[2] Verwey, E.J. and Overbeek, I.Th.G. (1948) Theory of theStability of Lyophobic Colloid; New York: Elsevier.
[3] Hiemenz, P. and Rajagopalan, R. (1997) Principles of Colloidand Surface Chemistry; New York: Marcel Dekker.
[4] Crozier, P.S., Rowley, R.L., and Henderson, D.J. (2001)Chem. Phys., 114: 7513–7517.
[5] Boda, D., Fawcett, W.R., Henderson, D., and Sokolowski,S.J. (2002) Chem. Phys., 116: 7170–7176.
[6] Torrie, G.M. and Valleau, J.P.J. (1980) Chem. Phys., 73:5807–5816.
[7] Gronbech-Jensen, N., Beardmore, K.M., and Pincus, P.(1998) Physica A, 261: 74–81.
[8] Rouzina, I. and Bloomfield, V.A. (1996) J. Phys. Chem., 100:9977–9989.
[9] Linse, P. and Lobaskin, V. (1999) Phys. Rev. Lett., 83:4208–4211.
[10] Shklovskii, B. (1999) Phys. Rev. Lett., 82: 3268–3271.[11] Netz, R.R. and Orland, H. (1999) Europhys. Lett., 45:
726–732.[12] Linse, P. and Lobaskin, V. (2000) J. Chem. Phys., 112:
3917–3927.
[13] Messina, R., Holm, C., and Kremer, K. (2001) Phys. Rev. E,64: 021405-1–021405-14.
[14] Grosberg, A.Yu., Nguyen, T.T., and Shklovskii, B.I. (2002)Rev. Mod. Phys., 74: 329–345.
[15] (a) Levin, Y. (1999) Physica A, 265: 432–439; (b) Rep. Prog.Phys. (2002) 65: 1577–1632.
[16] Lobaskin, V. and Qamhieh, K. (2003) J. Phys. Chem. B, 107:8022–8029.
[17] Qamhieh, K., Nylander, K., and Ainalem, T.M.L. (2009)Biomacromolecules, 10: 1720–1726.
[18] Qamhieh, K, Nylander, K., and Ainalem, T.M.L. (in press)Biomacromolecules.
[19] Linse, P. (2000) J. Chem. Phys., 113: 4359–4373.[20] Lobaskin, V., Lyubartsev, A., and Linse, P. (2001) Phys. Rev.
E, 63: 020401–020404.[21] Belloni, L. (2002) J. Phys. Condens. Matter, 14: 9323–9337.[22] Linse, P. (2002) J. Phys. Condens. Matter, 14: 13449–
13467.[23] Angelescu, D.G. and Linse, P. (2003) Langmuir, 19:
9661–9668.
[24] Ran, N., Dapeng, C., and Wenchuan, W. (2006) J. Phys.Chem. B, 110: 26232–26239.
[25] Vlachy, V. (1999) Annu. Rev. Phys. Chem., 50: 145–165.[26] Hansen, J.-P. and Lowen, H. (2000) Annu. Rev. Phys. Chem.,
51: 209–242.[27] Belloni, L. (2000) J. Phys. Condens. Matter, 12: R549–R587.[28] Bhuiyan, L.B., Vlachy, V., and Outhwaite, C.W. (2002) Int.
Rev. Phys. Chem., 21: 1–36.[29] Linse, P. (2005) Adv. Polym. Sci., 185: 111–162.[30] Guerrero-Garcıa, I.G., Gonzalez-Tovar, E., and Chavez-
Paez1, M. (2009) Phys. Rev. E, 80: 021501-1–021501-10.[31] da Silva, F.L.B., Bogren, Soderman, D. O., Akesson, T., and
Jonsson, B. (2002) J. Phys. Chem., 106: 3515–3515.[32] Messina, R., Holm, C., and Kremer, K. (2001) Eur. Phys. J.
D, 4: 363–370.[33] Messina, R. (2002) Physica A, 308: 59–79.[34] Qamhieh, K. and Linse, P. (2005) J. Chem. Phys., 123:
104901-1–104901-12.[35] Semashko, O.V. and Brodskaya, E.N. (2005) Colloid Journal,
67: 625–630.
[36] Semashko, O.V. and Brodskaya, E.N. (2006) Colloid Journal,68: 617–622.
[37] Linse, S., Jonsson, B., and Chazin, W.J. (1995) Proc. Natl.Acad. Sci. USA, 92: 4748–4752.
[38] Carlsson, F., Malmsten, M., and Linse, P. (2001) J. Phys.Chem. B, 105: 12189–12195.
[39] Linse, P. (2004) MOLSIM, Lund University, Lund, Sweden[software package].
[40] Diehl, A. and Levin, Y. (2006) J. Chem. Phys., 125: 054902-1–054902-2.
DISCRETE MACROION CHARGE DISTRIBUTIONS 1525
Dow
nloa
ded
by [
Yor
k U
nive
rsity
Lib
rari
es]
at 1
4:33
02
Nov
embe
r 20
13