Effect of caloric restriction with and without exercise training on oxidative stress and endothelial...
16
J. Clin. Endocrinol. Metab. 2011 96:E312-E321 originally published online Dec 1, 2010; , doi: 10.1210/jc.2010-1971 Eric Ravussin Muehlbauer, Robert D. Stevens, Brett R. Wenner, Virginia B. Kraus, Christopher B. Newgard, William E. Kraus and Leanne M. Redman, Kim M. Huffman, Lawrence R. Landerman, Carl F. Pieper, James R. Bain, Michael J. Intermediates in Nonobese Men and Women Effect of Caloric Restriction with and without Exercise on Metabolic Society please go to: http://jcem.endojournals.org//subscriptions/ or any of the other journals published by The Endocrine Journal of Clinical Endocrinology & Metabolism To subscribe to Copyright © The Endocrine Society. All rights reserved. Print ISSN: 0021-972X. Online
-
Upload
independent -
Category
Documents
-
view
3 -
download
0
Transcript of Effect of caloric restriction with and without exercise training on oxidative stress and endothelial...

J. Clin. Endocrinol. Metab. 2011 96:E312-E321 originally published online Dec 1, 2010; , doi: 10.1210/jc.2010-1971
Eric Ravussin Muehlbauer, Robert D. Stevens, Brett R. Wenner, Virginia B. Kraus, Christopher B. Newgard, William E. Kraus and
Leanne M. Redman, Kim M. Huffman, Lawrence R. Landerman, Carl F. Pieper, James R. Bain, Michael J.
Intermediates in Nonobese Men and WomenEffect of Caloric Restriction with and without Exercise on Metabolic
Society please go to: http://jcem.endojournals.org//subscriptions/ or any of the other journals published by The EndocrineJournal of Clinical Endocrinology & MetabolismTo subscribe to
Copyright © The Endocrine Society. All rights reserved. Print ISSN: 0021-972X. Online
Effect of Caloric Restriction with and withoutExercise on Metabolic Intermediates in NonobeseMen and Women
Leanne M. Redman, Kim M. Huffman, Lawrence R. Landerman, Carl F. Pieper,James R. Bain, Michael J. Muehlbauer, Robert D. Stevens, Brett R. Wenner,Virginia B. Kraus, Christopher B. Newgard, William E. Kraus, and Eric Ravussin
Pennington Biomedical Research Center (L.M.R., E.R.), Baton Rouge, Louisiana 70808; Department ofPhysical Medicine and Rehabilitation (K.M.H.), Veterans Affairs Medical Center, Durham, North Carolina27705; and Center for Aging and Human Development (L.R.L., C.F.P.) and Sarah W. Stedman Nutritionand Metabolism Center and Departments of Pharmacology and Cancer Biology and Medicine (J.R.B.,M.J.M., R.D.S., B.R.W., C.B.N.), Division of Rheumatology (V.B.K.), Department of Medicine, andDivision of Cardiovascular Medicine (W.E.K.), Department of Medicine, Duke University Medical Center,Durham, Durham, North Carolina 27708
Objectives: The objective of the study was to evaluate whether serum concentrations of metabolicintermediates are related to adiposity and insulin sensitivity (Si) in overweight healthy subjects andcompare changes in metabolic intermediates with similar weight loss achieved by diet only or dietplus exercise.
Design: This was a randomized controlled trial.
Participants and Intervention: The cross-sectional study included 46 (aged 36.8 � 1.0 yr) overweight(body mass index 27.8 � 0.7 kg/m2) subjects enrolled in a 6-month study of calorie restriction. Todetermine the effect of diet only or diet plus exercise on metabolic intermediates, 35 subjects wererandomized to control (energy intake at 100% of energy requirements); CR (25% calorie restric-tion), or CR�EX: (12.5% CR plus 12.5% increase in energy expenditure by exercise).
Main Outcome Measures: Serum concentrations of eight fatty acids, 15 amino acids, and 45 acyl-carnitines (ACs) measured by targeted mass spectrometry.
Results: In overweight subjects, the concentrations of C2 AC and long-chain ACs were positivelyassociated with percent fat (R2 � 0.75, P � 0.0001) and Si (R2 � 0.12, P � 0.05). The percent fat (R2 �
0.77, P � 0.0001), abdominal visceral fat (R2 � 0.64, P � 0.0001), and intrahepatic fat (R2 � 0.30,P � 0.0002) were positively associated with fatty acid concentrations. There was a significantincrease in an AC factor (comprised of C2 and several medium chain ACs) in the CR group (P � 0.01).
Conclusion: In nonobese subjects, fasted serum ACs are associated with Si and fat mass. Despitesimilar weight loss, serum ACs increase with CR alone but not CR�EX. A greater improvement inSi with weight loss during CR�EX interventions may be related to improved coupling of �-oxida-tion and tricarboxylic acid cycle flux induced by exercise. (J Clin Endocrinol Metab 96: E312–E321,2011)
ISSN Print 0021-972X ISSN Online 1945-7197Printed in U.S.A.Copyright © 2011 by The Endocrine Societydoi: 10.1210/jc.2010-1971 Received August 23, 2010. Accepted October 22, 2010.First Published Online December 1, 2010
Abbreviations: AA, Amino acid; AC, acylcarnitine; AIRg, acute insulin response to glucose;BMI, body mass index; CALERIE, Comprehensive Assessment of the Long-Term Effects ofReducing Intake of Energy; CR, caloric restriction; CR�EX, CR plus increase in energyexpenditure by exercise; FA, fatty acid; FFA, free fatty acid; HOMA, homeostasis modelassessment; PCA, principal components analysis; PGC1�, peroxisome proliferator-acti-vated receptor-� coactivator 1�; Si, insulin sensitivity.
J C E M O N L I N E
H o t T o p i c s i n T r a n s l a t i o n a l E n d o c r i n o l o g y — E n d o c r i n e R e s e a r c h
E312 jcem.endojournals.org J Clin Endocrinol Metab, February 2011, 96(2):E312–E321

The Comprehensive Assessment of the Long-Term Ef-fects of Reducing Intake of Energy (CALERIE; phase
1) was a study that examined the potential health benefitsof caloric restriction (CR) in sedentary, nonobese, healthyindividuals. Whereas the primary aim of the study was todetermine the impact of CR on metabolic adaptation andon biomarkers of longevity, the secondary aims were toevaluate changes in risk factors for type 2 diabetes mellitusand cardiovascular disease. In the first phase of CALERIE,a 6-month study of 25% CR (with or without exercise)was conducted in overweight men and women at Penning-ton Biomedical Research Center (Baton Rouge, LA) (1).As reported, several metabolic improvements were ob-served including a lowering of the metabolic rate and ametabolic adaptation (1), improvements in biomarkersof longevity such as fasting insulin and body core tem-perature (1), an improvement in insulin sensitivity (Si)(2), and a lowering of 10-yr estimated cardiovasculardisease risk (3).
Another objective was to better understand the metabolicpathwaysofaCR-induced improvement in insulinresistancein overweight individuals and explore possible mechanismsby which CR can prevent diseases of aging. Metabolic pro-filing by targeted mass spectrometry, termed metabolom-ics, is proving to be an important tool in human metabolicdisease research (4). Targeted metabolic profiling hasidentified an association between branched-chain aminoacids (AA) and insulin resistance in multiple human co-horts (5–7). It has also led to development of a novel hy-pothesis for obesity-induced insulin resistance in whichincreased availability of energy, particularly dietary fatand protein, overloads muscle mitochondria and increases�-oxidation, which in turn induces mitochondrial stressand intramitochondrial accumulation of incompletely ox-idized lipids that can impair insulin action (4, 6, 8–10). Insupport of this hypothesis, an improvement in Si with diet-induced weight loss in obese subjects was accompanied bydecreases in branched-chain AAs and related metabolites(11). No studies have yet compared the metabolic corre-lates of weight loss and increased Si induced by CR only orin conjunction with exercise.
In our cohort of nonobese individuals, 6 months of CRwith or without aerobic exercise led to similar losses ofbody weight, fat mass, and abdominal visceral fat (12). Inaddition, participants in both groups had a significant in-crease in Si and a decrease of the acute insulin response toglucose [AIRg (increased �-cell function)] when comparedwith the control condition (2). We observed that the in-crease in Si was associated with losses of body weight, fatmass, and abdominal visceral fat but not with changes inectopic lipid in skeletal muscle or liver.
There were three objectives of this study: first, to eval-uate whether serum concentrations of metabolic interme-diates measured by targeted mass spectrometry are relatedto adiposity and Si at baseline; second, to investigatewhether calorie restriction or calorie restriction in con-junction with exercise led to unique changes in circulatingmetabolic intermediate concentrations; and finally to de-termine whether such changes in concentrations of met-abolic intermediates with calorie restriction without orwith exercise are associated with changes in body com-position or Si.
Subjects and Methods
SubjectsThe study was approved by the Pennington Biomedical Re-
search Center Institutional Review Board and the Data SafetyMonitoring Board of CALERIE, and subjects provided writteninformed consent before participating. Of 48 randomized sub-jects, 46 healthy, overweight [25 � body mass index (BMI) � 30]men (25–50 yr) and premenopausal women (25–45 yr) com-pleted the study. Details of the screening process and study pop-ulation have been extensively described (1).
Study designParticipants were randomized into one of four groups for 24
wk: control, healthy weight maintenance based on AmericanHeart Association step 1 diet (five males and six females); CR,25% calorie restriction from baseline energy requirements (sixmales and six females); CR plus increase in energy expenditureby exercise (CR�EX), 12.5% calorie restriction and 12.5% in-crease in energy expenditure through structured aerobic exercise(five males and seven females); and low-calorie diet (890 kcal/duntil 15% weight loss) and weight loss maintenance.
Dietary interventionsDuring 3 wk at baseline and wk 1–12 and 22–24 of the in-
tervention, participants were provided with all meals, whichwere prepared by the metabolic kitchen at the center. Individu-alized energy intakes were prescribed from two consecutive mea-sures of energy expenditure by doubly labeled water at baseline(13). For wk 13–22, participants consumed a closely monitored(by food records and daily body weight) self-selected diet. Thediet composition was based on the American Heart Associationguidelines, 30% calories from fat, 15% from protein, and 55%from carbohydrate.
Exercise prescription and complianceCR and control participants were required to continue their
usual pattern of physical activity, whereas participants inCR�EX increased their energy expenditure by 12.5% abovebaseline through structured aerobic exercise (i.e. walking, run-ning, or stationary cycling), 5 d/wk according to an individual-ized exercise prescription (14). The target energy cost of theexercise sessions was calculated from the weekly energy expen-diture target divided by 5 d/wk. Individual exercise prescriptionsto meet target energy expenditure goals were calculated by mea-
J Clin Endocrinol Metab, February 2011, 96(2):E312–E321 jcem.endojournals.org E313

suring the oxygen cost (VMax 29 Series; SensorMedics, YorbaLinda, CA) during three individually prescribed levels of activity(i.e. walking at 3.0, 3.5, and 4.0 MPH), generating an energy costequation from the workload vs. oxygen cost above rest, andassigning exercise duration according to target energy expendi-ture and self-selected workload. The energy equivalents weredetermined using the calculated food quotient of 4.89 kcal/literof oxygen consumed.
To prevent skeletal muscle soreness and injury, the exerciseload was progressively increased during the initial 6 wk andenergy intake was adjusted so that the energy deficit equaled25% of daily energy requirements. Following wk 6, participantswere allowed to self-select exercise intensity (as long as theirheart rate was within 65–90% of maximal heart rate), and ex-ercise duration was adjusted accordingly to maintain the targetenergy expenditure. During the first 6 wk, all exercise sessionswere conducted at the Pennington Biomedical Research CenterHealth and Fitness Center under supervision. For wk 7–24, atleast three of the five weekly sessions were conducted at thecenter under supervision. A wireless heart rate monitor (PolarS-610; Polar Beat, Port Washington, NY) was used to recordexercise duration and average heart rate during both supervisedand unsupervised sessions. The target energy cost was main-tained at 403 � 63 kcal per session for women and 569 � 118kcal per session for men throughout the entire intervention, re-sulting in an average exercise duration of 53 � 11 and 45 � 14min per session for women and men, respectively (14).
Clinical testingAll physiological testing was conducted during a 5-d stay in
the inpatient unit at baseline and during wk 12 and 24 of theintervention (1). Following a 12-h fast and morning void, percentbody fat was measured using dual-energy x-ray absorptiometry(Hologics QDR 4500A, Bedford, MA) and fat mass and fat-freemass calculated. Muscle and liver lipid stores were determined byproton magnetic resonance spectroscopy using point-resolvedspectroscopy as previously detailed (2). Si and AIRg weredetermined by the insulin-modified frequently sampled iv glu-cose tolerance test (2).
Blood sample collection and metabolic profilingOn the fourth inpatient day, subjects underwent a 24-h
blood-sampling protocol. For this analysis, two fasted plasmaaliquots collected 30 min apart were pooled and used to measureconcentrations of eight fatty acids (FAs), 15 AAs, and 45 acyl-carnitines (ACs), as described previously (6, 8), by gas chroma-tography/mass spectrometry and tandem mass spectrometry. In-sulin was analyzed via immunoassay on the DPC 2000(Diagnostic Product Corp., Los Angeles, CA).
Data analysisPrincipal components analysis (PCA) was used to reduce the
dimensionality of the data. PCA was performed on each separateclass of metabolites; AAs, FAs, and ACs. For our first objective,we determined whether metabolic intermediates might be asso-ciated with adiposity and Si in all 46 overweight individualsduring weight maintenance at baseline. Data for each metabolitewere logarithmically transformed [log10(metabolite � 1)] to ap-proximate a normal distribution. Then PCA was performed usingvarimax rotation and components with an eigen value greater than1wasretained. Individualmetaboliteswithacomponent loadof0.5
or greater were considered as comprising that factor. These metab-olites are reported for each factor (see Tables 1 and 3).
To determine the effects of calorie restriction on concentra-tions of metabolic intermediates, we elected to study only CR,CR�EX, and control (n � 35). The rationale for this approachwas that these two groups had the same energy deficit (25%reduction from baseline), which resulted in similar weight lossand time course of weight loss. For each participant we computeda trajectory (or slope) for each metabolite over time (M0, M3,and M6). Individual trajectories were reduced within each me-tabolite class by PCA with varimax rotation, such that one PCAwas performed for changes in FAs, changes in ACs, and changesin AAs. The numbers of components retained for each model wasselected to obtain a solution that explained the greatest percentvariance. ANOVA was then used to test for between-group dif-ferences in factor scores derived from the changes in metabolicintermediates over time.
To test whether factor scores derived from the changes withCR (trajectories) were associated with changes in adiposity andSi, the individual trajectories for adiposity, and Si variables overtimes (M0, M3, and M6) were computed and then used as de-pendent variables in the regression analyses. For each separateclass of metabolites (FA, AC, or AA), we performed multiplelinear regressions initially with full models, which included thefactor scores retained from the PCA analysis, sex, age, and theirinteraction terms. If the interaction terms were not significant,these terms were removed and the reduced models were refitted.P � 0.05 was considered statistically significant. Data are re-ported as means � SEM, unless otherwise stated. SAS version 9.12(SAS Institute, Cary, NC) was used for analysis.
Results
At baseline, 26 women (57%) and 20 men (43%) com-prised the 46 subjects. Thirty subjects (65%) were Cau-casian, 15 subjects (32%) were African-American, andone subject (3%) was Asian. The subjects were young(aged 38.5 � 6.4 yr), overweight (BMI 27.7 � 1.7, kg/m2)but in good health including a good Si 3.2 � 1.4, 10�4
mU/liter�1 � min�1.
PCA at baseline in 46 nonobese subjectsPrevious work had indicated that metabolic interme-
diates typically clustered into factors comprised of inter-mediates from the same class, such that FAs clustered intoa single factor, and ACs clustered into factors mostly withother ACs (5). Given this, we chose to perform PCA sep-arately for each metabolite class (Table 1). Of note, per-forming PCA separately or with all metabolites togetherproduced similar results (data not shown). For FAs, weobserved that a single factor comprised of seven FAs (ofeight) explained 72% of the variance in FAs (Table 1). ForAAs, a single-factor solution comprised 11 AAs (of 15)had an eigen value of 6.7 explained 45% of the variancein AA concentrations. When PCA was performed for ACs,one, two, three, four, and five factor models were evaluated.
E314 Redman et al. Calorie Restriction and Metabolic Intermediates J Clin Endocrinol Metab, February 2011, 96(2):E312–E321

A three-factor model was selected for ACs, given that factorsfour and five models were dominated by a single AC. Thethree-factor solution had an eigen value of 3.1 (for 45 ACs)and explained 46% of the variance in fasting AC concentra-tions at baseline (Table 1).
The association of metabolic intermediates withadiposity and Si in nonobese men and women
After reducing the data into the three separate classes ofmetabolic intermediates by PCA, we sought to determinewhether concentrations of fasting metabolic intermediateswere related to adiposity (weight, percent fat, visceral fat,intrahepatic lipid, intramyocellular lipid, and abdominalfat cell size) or factors related to insulin action (Si, AIRg,and fasting insulin) at baseline. Results of the significantregression models are shown in Table 2.
Fatty acidsFasting FA concentrations measured by targeted mass
spectrometry were positively associated with serum FAsmeasured by ELISA (Table 2). The single FA factor (FAfactor 1) was associated with measures of adiposity. Withadjustments for sex and age, FA factor 1 (Table 2) wasstrongly associated with percent body fat (r2 � 0.77, P �
0.0001) and also visceral fat (r2 � 0.64, P � 0.0001).Interestingly, the FA factor was also associated with ec-topic liver fat, explaining 30% of the variance.
AcylcarnitinesAfter controlling for sex and age (Table 2), AC factor 1,
comprised predominantly of medium-chain ACs, was posi-tively associated with whole percent body fat (r2 � 0.75, P �
0.0001). AC factor 2 comprised of C2 and long-chain ACswas also positively associated with Si (r2 � 0.12, P � 0.05)and with serum FA concentrations, (r2 � 0.20, P � 0.02).AC factor 3, which contains end products of AA metab-olism, was not associated with measures of adiposity or Siin this nonobese group of men and women.
Amino acidsThe single AA factor (AA factor 1) was not associated
with any measure of adiposity. Additionally, in contrast toprevious reports in three separate human cohorts, includ-ing Asian subjects with average BMI of 24 kg/m2 (5–7), theAA factor (containing leucine/isoleucine, valine, and phe-nylalanine) was not associated with Si at baseline. Fur-thermore, there was also no correlation between leucine/isoleucine and Si or valine and Si when examining thelog-transformed raw data.
TABLE 1. PCA for fasting metabolites at baseline
ComponentsComponent
loadingsEigenvalue
Cumulativevariance
FA factor 1Palmitic acid 0.95 5.74 0.72Linoleic acid 0.94Oleic acid 0.94Palmitoleic acid 0.90Myristic acid 0.88�-Linolenic acid 0.82Stearic acid 0.81
AA factor 1Leucine/isoleucine 0.92 6.67 0.45Ornithine 0.86Phenylalanine 0.85Valine 0.81Methionine 0.81Aspartate/asparagine 0.76Histidine 0.71Glutamine/glutamate 0.71Tyrosine 0.62Alanine 0.66Proline 0.57
AC factor 1C8:1 0.65 14.04 0.31C8 0.59C6-DC 0.50C10:3 0.57C10:2 0.51C10:1 0.71C10 0.73C10-OH/C8-DC 0.61C12:1 0.76C12 0.81C12-OH/C10-DC 0.64C14:2 0.75C14:1 0.86C14:1-OH 0.52C20-OH/C18-DC 0.53C16:2 0.57
AC factor 2C2 0.60 3.67 0.39C16 0.69C18:2 0.54C18:1 0.68C18 0.54C18:1-OH 0.56C20 0.73C16:2 0.54C16:1 0.73C16:1-OH/C14:1-DC 0.56C20:4 0.71
AC factor 3C3 0.72 3.08 0.46C4/Ci4 0.70C5s 0.75C5-OH/C3-DC 0.55Ci4-DC/C4-DC 0.62C8:1 0.50C5-DC 0.51C10:3 0.61C10:2 0.63
PCA was performed separately for each metabolite class: FAs, ACs,and AAs. Key metabolites within each component (i.e. metaboliteswith component load �0.5) are presented.
J Clin Endocrinol Metab, February 2011, 96(2):E312–E321 jcem.endojournals.org E315
The association of calorie restriction or calorierestriction in conjunction with exercise withunique changes in circulating metabolicintermediate concentrations
As reported previously (12), the 25% energy deficit byCR or CR�EX resulted in equivalent losses of bodyweight (CR: �10 � 1%; CR�EX: �10 � 1%), fat mass(CR: �24 � 3%; CR�EX: �25 � 3%), and abdominalvisceral (CR: �28 � 4%; CR�EX: �27 � 3%) and sc fatstores (CR: �26 � 4%; CR�EX: �28 � 3%). Si wasimproved in both CR and CR�EX but reached signifi-cance only in the CR�EX group (CR: 40 � 20%;CR�EX: 66 � 22%). Fasting insulin (CR: �28 � 6%;CR�EX: �20 � 12%) and insulin secretion (AIRg: CR:�29 � 7%; CR�EX: �30 � 8%), however, were de-creased significantly in both treatment groups (2).
To determine the effect of a 25% energy deficit by CRor CR with exercise on serum metabolite species, we mea-sured serum metabolic concentrations after 3 and 6months. To simplify these time-series data, we calculatedthe changes in serum metabolite species from a linear re-gression of serum metabolite species over time (BL, M3,and M6). We rationalized these data based on the obser-vation that the weight loss curves over this time periodwere roughly linear. The slopes for each metabolite werereduced further within each separate class of metabolitesby PCA. Each significant factor solution and componentsare reported in Table 3.
For free fatty acid (FFA) trajectories (changes in FFAsover time), PCA identified that changes in FFA speciescould be condensed to a single factor (FA change factor 1),
comprised of changes of eight FAs. This single factor hadan eigen value of 6.5 and explained 82% of the variancein the serum FA species changes over time (Table 3).
When PCA was performed on the changes in AAs, one-,two-, three-, and four-factor models were evaluated. Atwo-factor model was selected because factors three andfour contained only a single AA. Together the two-factorsolution explained 54% of the variance in changes in AAconcentrations over time (Table 3). The first AA factor(AA change factor 1) was comprised of alanine, proline,methionine, tyrosine, histidine, arginine, leucine/isoleu-cine, valine, glycine, phenylalanine, and citrulline and ex-plained 40% of the variance in the time-series changes inAAs. The second AA factor (AA change factor 2) ex-plained an additional 15% of the total variance and iscomprised of glutamine/glutamate, aspartate/asparagine,phenylalanine, and ornithine. Phenylalanine had similarloadings for each factor.
For ACs, the PCA performed on the AC trajectoriesdetermined that a single AC factor explained 24% of thevariance in the AC species changes (Table 3). This singleAC factor (AC change factor 1) had an eigen value of 10.7(for 45 ACs) and was comprised of AC (C2) and mediumchain ACs (Table 3).
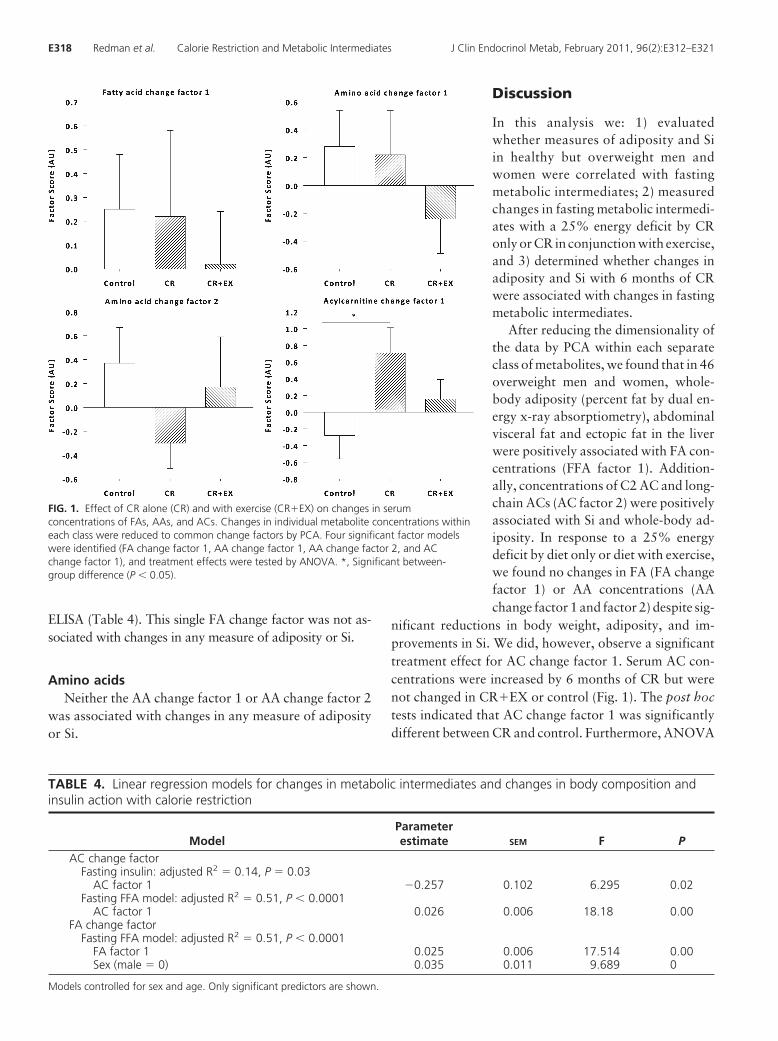
Using ANOVA, we tested between-group differences ineach change factor (Fig. 1). First with three treatmentgroups in the model (CR, CR�EX, and control), we ob-served no significant treatment effect for FA change factor1 (P � 0.80) or AA change factors 1 (P � 0.37) and 2 (P �
0.34). There was a significant treatment effect for AC
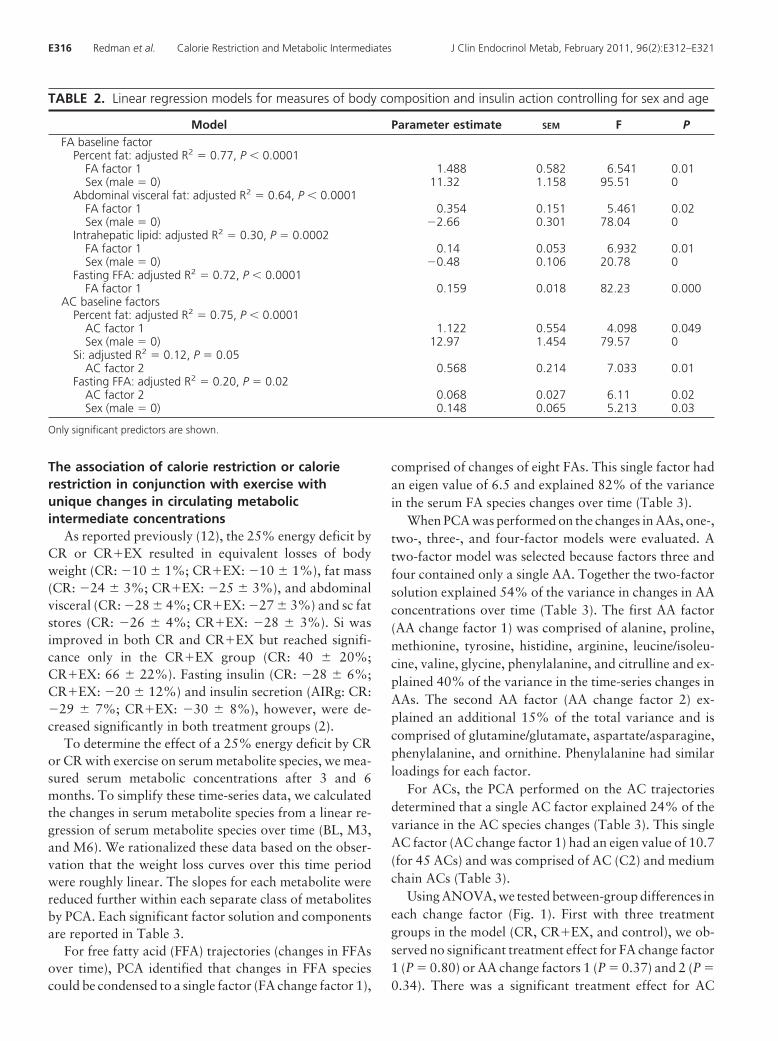
TABLE 2. Linear regression models for measures of body composition and insulin action controlling for sex and age
Model Parameter estimate SEM F PFA baseline factor
Percent fat: adjusted R2 � 0.77, P � 0.0001FA factor 1 1.488 0.582 6.541 0.01Sex (male � 0) 11.32 1.158 95.51 0
Abdominal visceral fat: adjusted R2 � 0.64, P � 0.0001FA factor 1 0.354 0.151 5.461 0.02Sex (male � 0) �2.66 0.301 78.04 0
Intrahepatic lipid: adjusted R2 � 0.30, P � 0.0002FA factor 1 0.14 0.053 6.932 0.01Sex (male � 0) �0.48 0.106 20.78 0
Fasting FFA: adjusted R2 � 0.72, P � 0.0001FA factor 1 0.159 0.018 82.23 0.000
AC baseline factorsPercent fat: adjusted R2 � 0.75, P � 0.0001
AC factor 1 1.122 0.554 4.098 0.049Sex (male � 0) 12.97 1.454 79.57 0
Si: adjusted R2 � 0.12, P � 0.05AC factor 2 0.568 0.214 7.033 0.01
Fasting FFA: adjusted R2 � 0.20, P � 0.02AC factor 2 0.068 0.027 6.11 0.02Sex (male � 0) 0.148 0.065 5.213 0.03
Only significant predictors are shown.
E316 Redman et al. Calorie Restriction and Metabolic Intermediates J Clin Endocrinol Metab, February 2011, 96(2):E312–E321

change factor 1 (P � 0.05). The post hoc comparisonindicated a significant difference between CR and control(P � 0.04). LS means indicated a significant increase in ACchange factor 1 for CR but not for CR�EX, indicating anincrease in C2 and medium-chain AC concentrations wasunique to CR (Fig. 1).
To confirm the results of a differential effect betweenCR and CR�EX on serum ACs, we computed the changesfrom baseline to M3 and baseline to M6 for each ACspecies and performed a simple ANOVA to test for within-and between-treatment group effects. In support of thePCA, there was a significant treatment effect for several ofthe AC species comprised within AC change factor 1. C2AC was significantly increased from baseline at M3 (P �0.000) and M6 (P � 0.000) with CR. Pair-wise compar-isons (with Tukey-Kramer adjustment) indicated a signif-icant difference between CR and CR�EX (P � 0.003) andalso CR and control (P � 0.000). Similarly, C14:1 (P �0.001), C16 (P � 0.032), and C18:1 (P � 0.03) weresignificantly increased from baseline at M3 and M6 withCR and not with CR�EX. These findings confirm that C2as well as medium-chain and long-chain (C16 and C18:1)ACs are increased uniquely with 6 months of CR and notwith CR�EX.
Association of changes in concentrations ofmetabolic intermediates with calorie restrictionwithout or with exercise with changes in bodycomposition or Si
Although mean changes indicated an increase in ACconcentrations over time with CR and a decrease withcontrol, there was significant variation across the sample.To determine which change was associated with improve-ments in adiposity and insulin action, the changes in ACs(change factors described above) were related to thechanges in Si, fasting insulin, and adiposity measures. Weused multiple linear regressions (controlling for sex andage) to determine whether changes in metabolic interme-diates were associated with changes in adiposity and mea-sures of Si during the 6-month study.
AcylcarnitinesAfter controlling for sex and age, we found that the
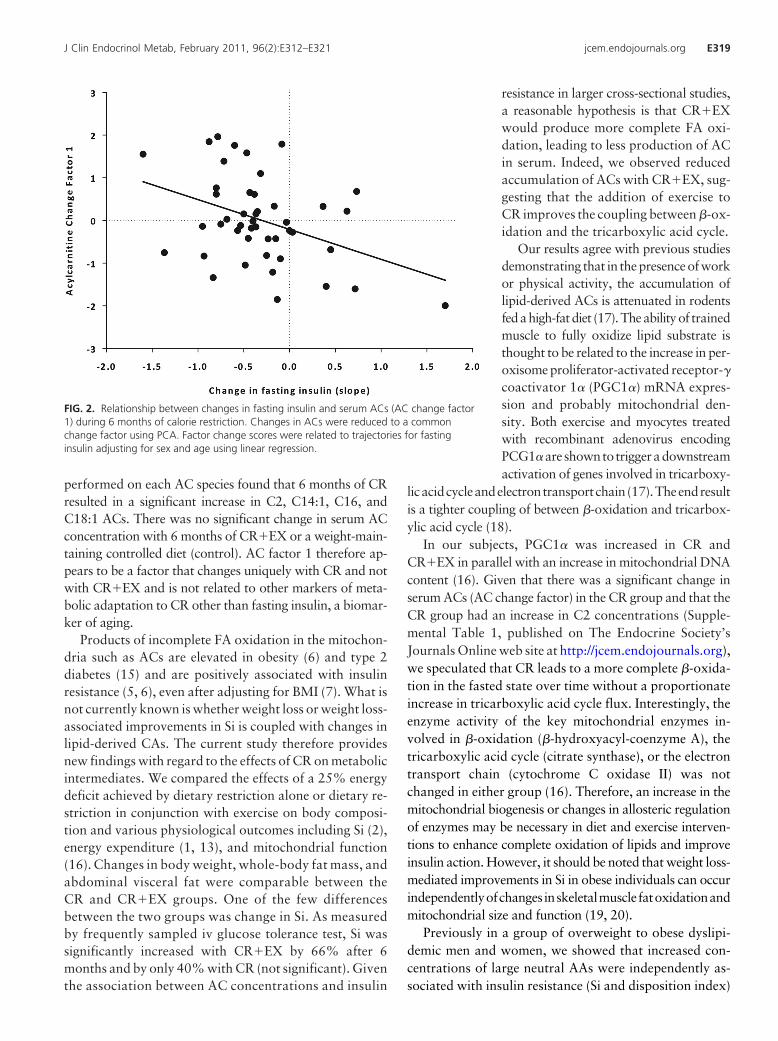
single AC change factor was inversely associated with thechange in fasting insulin, accounting for 14% of the vari-ance in this parameter (Table 4). Interestingly the resultsindicate that greater increases in fasting AC concentra-tions were associated with greater reductions in fastinginsulin concentrations (Fig. 2). Consistent with the base-line analysis, the single AC change factor was also posi-tively related to changes in serum FA concentrations, mea-sured by ELISA, and accounted for 51% of the variance(P � 0.001).
Fatty acidsImportantly, as observed at baseline, the changes in fast-
ing FA species measured by targeted mass spectrometry werepositivelyassociatedwithchanges in serumFAsmeasuredby
TABLE 3. PCA for changes in metabolic intermediateswith CR
ComponentsComponent
loadingsEigenvalue
Cumulativevariance
FA change factor 1Linoleic acid 0.98 6.54 0.82Oleic acid 0.97Myristic acid 0.96Palmitoleic acid 0.94Palmitic acid 0.93Stearic acid 0.90�-Linolenic acid 0.89Arachidonic acid 0.60
AA change factor 1Alanine 0.84 6.1 0.40Proline 0.83Methionine 0.82Tyrosine 0.77Histidine 0.75Arginine 0.73Leucine/isoleucine 0.67Valine 0.65Glycine 0.64Phenylalanine 0.56Citrulline 0.52
AA change factor 2Glutamine/glutamate 0.87 2.0 0.54Aspartate/asparagine 0.76Ornithine 0.60Phenylalanine 0.56
AC change factor 1C2 0.70 10.7 0.24Ci4-DC/C4-DC 0.51C8 0.74C6-DC 0.59C10:2 0.63C10:1 0.71C10 0.69C10-OH/C8-DC 0.57C12:1 0.84C12 0.86C12-OH/C10-DC 0.45C14:2 0.73C14:1 0.84C14 0.47C14:1-OH 0.48C14-OH/C12-DC 0.45C16 0.68C18:2 0.63C18:1 0.66C16:2 0.57C16:1 0.64
Using slopes of change for each metabolite, PCA was performedseparately for each metabolite class: FAs, ACs, and AAs. Keymetabolites within each component (i.e. metabolites with componentload �0.5) are presented.
J Clin Endocrinol Metab, February 2011, 96(2):E312–E321 jcem.endojournals.org E317
ELISA (Table 4). This single FA change factor was not as-sociated with changes in any measure of adiposity or Si.
Amino acidsNeither the AA change factor 1 or AA change factor 2
was associated with changes in any measure of adiposityor Si.
Discussion
In this analysis we: 1) evaluatedwhether measures of adiposity and Siin healthy but overweight men andwomen were correlated with fastingmetabolic intermediates; 2) measuredchanges in fasting metabolic intermedi-ates with a 25% energy deficit by CRonly or CR in conjunction with exercise,and 3) determined whether changes inadiposity and Si with 6 months of CRwere associated with changes in fastingmetabolic intermediates.
After reducing the dimensionality ofthe data by PCA within each separateclass of metabolites, we found that in 46overweight men and women, whole-body adiposity (percent fat by dual en-ergy x-ray absorptiometry), abdominalvisceral fat and ectopic fat in the liverwere positively associated with FA con-centrations (FFA factor 1). Addition-ally, concentrations of C2 AC and long-chain ACs (AC factor 2) were positivelyassociated with Si and whole-body ad-iposity. In response to a 25% energydeficit by diet only or diet with exercise,we found no changes in FA (FA changefactor 1) or AA concentrations (AAchange factor 1 and factor 2) despite sig-
nificant reductions in body weight, adiposity, and im-provements in Si. We did, however, observe a significanttreatment effect for AC change factor 1. Serum AC con-centrations were increased by 6 months of CR but werenot changed in CR�EX or control (Fig. 1). The post hoctests indicated that AC change factor 1 was significantlydifferent between CR and control. Furthermore, ANOVA
FIG. 1. Effect of CR alone (CR) and with exercise (CR�EX) on changes in serumconcentrations of FAs, AAs, and ACs. Changes in individual metabolite concentrations withineach class were reduced to common change factors by PCA. Four significant factor modelswere identified (FA change factor 1, AA change factor 1, AA change factor 2, and ACchange factor 1), and treatment effects were tested by ANOVA. *, Significant between-group difference (P � 0.05).
TABLE 4. Linear regression models for changes in metabolic intermediates and changes in body composition andinsulin action with calorie restriction
ModelParameterestimate SEM F P
AC change factorFasting insulin: adjusted R2 � 0.14, P � 0.03
AC factor 1 �0.257 0.102 6.295 0.02Fasting FFA model: adjusted R2 � 0.51, P � 0.0001
AC factor 1 0.026 0.006 18.18 0.00FA change factor
Fasting FFA model: adjusted R2 � 0.51, P � 0.0001FA factor 1 0.025 0.006 17.514 0.00Sex (male � 0) 0.035 0.011 9.689 0
Models controlled for sex and age. Only significant predictors are shown.
E318 Redman et al. Calorie Restriction and Metabolic Intermediates J Clin Endocrinol Metab, February 2011, 96(2):E312–E321
performed on each AC species found that 6 months of CRresulted in a significant increase in C2, C14:1, C16, andC18:1 ACs. There was no significant change in serum ACconcentration with 6 months of CR�EX or a weight-main-taining controlled diet (control). AC factor 1 therefore ap-pears to be a factor that changes uniquely with CR and notwith CR�EX and is not related to other markers of meta-bolic adaptation to CR other than fasting insulin, a biomar-ker of aging.
Products of incomplete FA oxidation in the mitochon-dria such as ACs are elevated in obesity (6) and type 2diabetes (15) and are positively associated with insulinresistance (5, 6), even after adjusting for BMI (7). What isnot currently known is whether weight loss or weight loss-associated improvements in Si is coupled with changes inlipid-derived CAs. The current study therefore providesnew findings with regard to the effects of CR on metabolicintermediates. We compared the effects of a 25% energydeficit achieved by dietary restriction alone or dietary re-striction in conjunction with exercise on body composi-tion and various physiological outcomes including Si (2),energy expenditure (1, 13), and mitochondrial function(16). Changes in body weight, whole-body fat mass, andabdominal visceral fat were comparable between theCR and CR�EX groups. One of the few differencesbetween the two groups was change in Si. As measuredby frequently sampled iv glucose tolerance test, Si wassignificantly increased with CR�EX by 66% after 6months and by only 40% with CR (not significant). Giventhe association between AC concentrations and insulin
resistance in larger cross-sectional studies,a reasonable hypothesis is that CR�EXwould produce more complete FA oxi-dation, leading to less production of ACin serum. Indeed, we observed reducedaccumulation of ACs with CR�EX, sug-gesting that the addition of exercise toCR improves the coupling between �-ox-idation and the tricarboxylic acid cycle.
Our results agree with previous studiesdemonstrating that in thepresenceofworkor physical activity, the accumulation oflipid-derived ACs is attenuated in rodentsfedahigh-fatdiet (17).Theabilityof trainedmuscle to fully oxidize lipid substrate isthought to be related to the increase in per-oxisome proliferator-activated receptor-�coactivator 1� (PGC1�) mRNA expres-sion and probably mitochondrial den-sity. Both exercise and myocytes treatedwith recombinant adenovirus encodingPCG1�are shownto triggeradownstreamactivation of genes involved in tricarboxy-
licacidcycleandelectrontransportchain(17).Theendresultis a tighter coupling of between �-oxidation and tricarbox-ylic acid cycle (18).
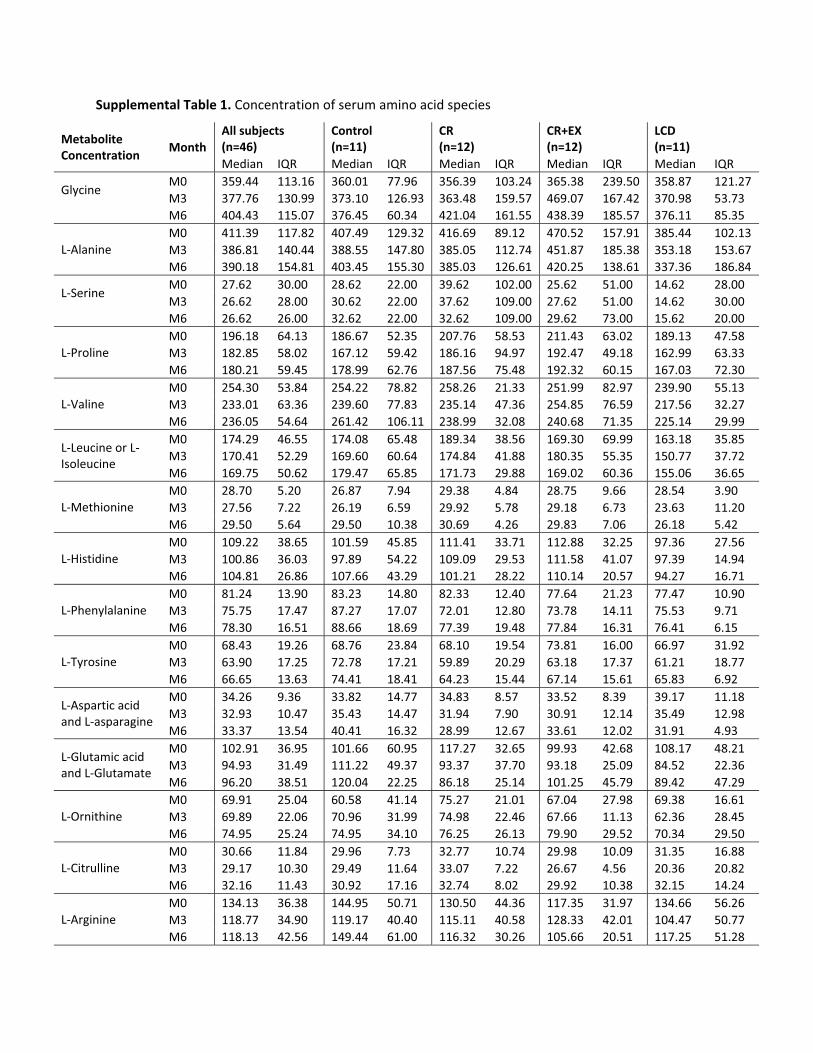
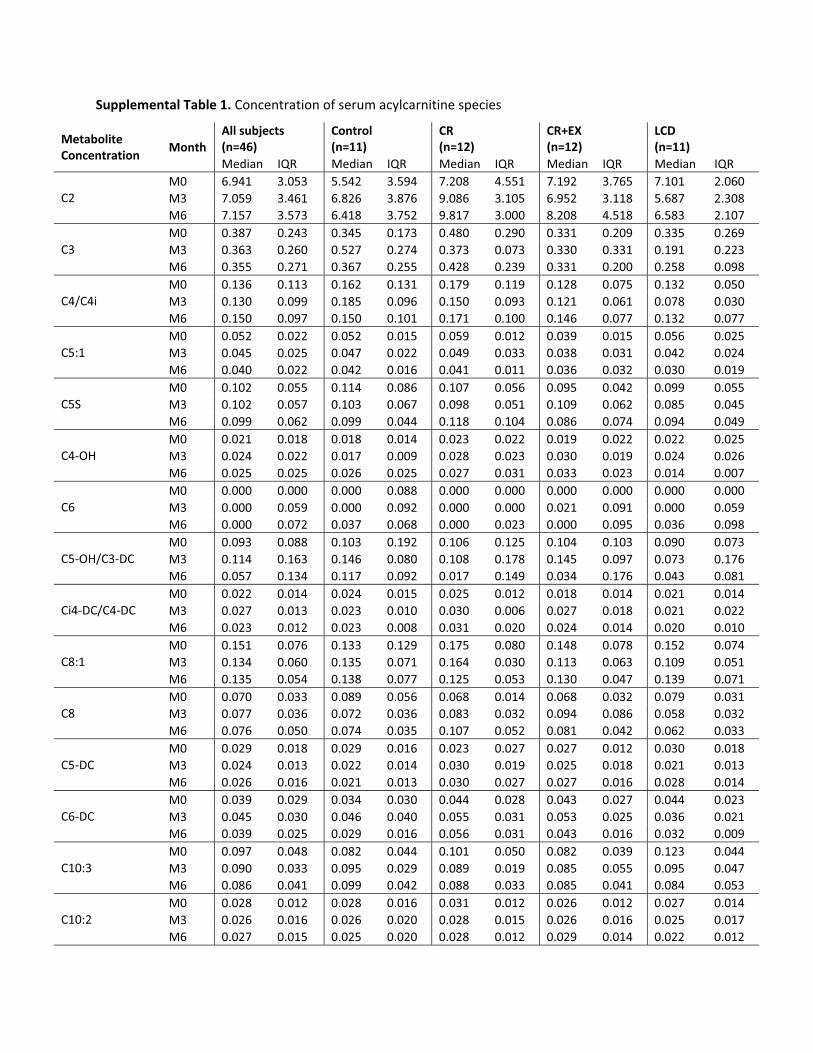
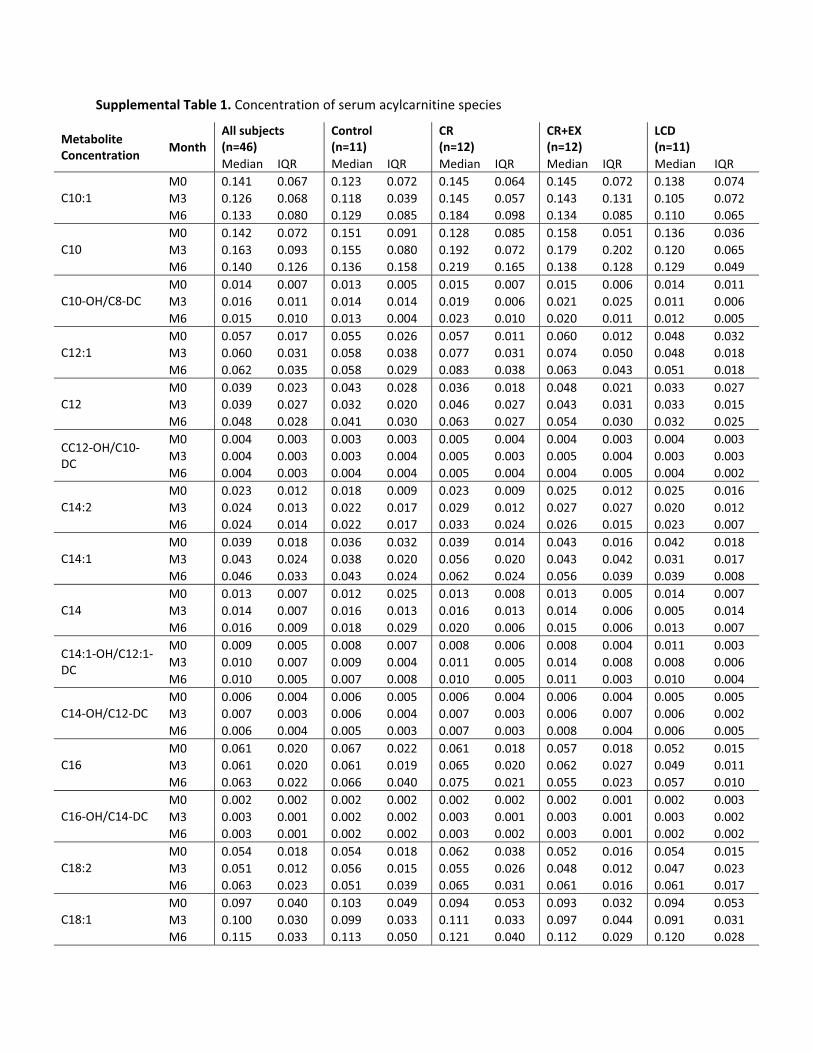
In our subjects, PGC1� was increased in CR andCR�EX in parallel with an increase in mitochondrial DNAcontent (16). Given that there was a significant change inserum ACs (AC change factor) in the CR group and that theCR group had an increase in C2 concentrations (Supple-mental Table 1, published on The Endocrine Society’sJournals Online web site at http://jcem.endojournals.org),we speculated that CR leads to a more complete �-oxida-tion in the fasted state over time without a proportionateincrease in tricarboxylic acid cycle flux. Interestingly, theenzyme activity of the key mitochondrial enzymes in-volved in �-oxidation (�-hydroxyacyl-coenzyme A), thetricarboxylic acid cycle (citrate synthase), or the electrontransport chain (cytochrome C oxidase II) was notchanged in either group (16). Therefore, an increase in themitochondrial biogenesis or changes in allosteric regulationof enzymes may be necessary in diet and exercise interven-tions to enhance complete oxidation of lipids and improveinsulin action. However, it should be noted that weight loss-mediated improvements in Si in obese individuals can occurindependentlyofchanges inskeletalmuscle fatoxidationandmitochondrial size and function (19, 20).
Previously in a group of overweight to obese dyslipi-demic men and women, we showed that increased con-centrations of large neutral AAs were independently as-sociated with insulin resistance (Si and disposition index)
FIG. 2. Relationship between changes in fasting insulin and serum ACs (AC change factor1) during 6 months of calorie restriction. Changes in ACs were reduced to a commonchange factor using PCA. Factor change scores were related to trajectories for fastinginsulin adjusting for sex and age using linear regression.
J Clin Endocrinol Metab, February 2011, 96(2):E312–E321 jcem.endojournals.org E319
(5). Furthermore, previous studies identified that a distinctmetabolic signature defined by branched chain AAs, otherAA species, and C3 and C5 ACs (by-products of isoleu-cine, leucine, and valine catabolism) was significantly el-evated in obese individuals compared with lean individu-als (6). Independent of sex, age, and race, this branchedchain AA-related metabolic factor was positively associ-ated with insulin resistance as measured by homeostasismodel assessment (HOMA) (6, 7). In our study, the singleAA factor was not associated with any measure of insulinaction. Furthermore, AC factor 3, in which fasting C3 andC5 AC concentrations were heavily loaded, was also notassociated with insulin action. In agreement with our factoranalysis, we did not find any relationships between fastingleucine/isoleucine or valine concentrations (log transformeddata), key AAs believed to be important in skeletal muscleinsulin resistance, and insulin resistance (5, 6), Si, or fastinginsulin.
A major difference between the current study and fore-going studies by our group linking branched chain AAsand related metabolites with insulin resistance is that sub-jects in the current study were not insulin resistant at base-line. Thus, in our prior comparison of obese, insulin-re-sistant subjects with lean, insulin-sensitive controls, theformer group had a HOMA score of 5.73, and the lattergroup a HOMA score of 2.51. The mean HOMA score forall subjects of the current study at baseline was 2.35.Moreover, among a subset of lean and obese subjects inwhich Si was measured in our prior study, Si was 2.12 inobese subjects and 4.44 in lean controls; in the currentstudy, the Si at baseline for all subjects was 2.8 (2). In ourprior study, the relationship between AAs and insulin re-sistance did not hold in analysis of the lean subjects alone,probably due to the small variability in Si in this group (6).We believe that the small variance in Si among the currentsubjects also explains the lack of association. We also notethat PCA analysis performed in our prior study was ap-plied to the entire metabolite data set, resulting a PCAfactor comprised of a mixture of AAs and ACs, whereas inthe current study, we chose to perform PCA separately onAAs and ACs. Finally, there is also the issue of statisticalpower with only 46 subjects in our cross-sectional anal-ysis. With this limited number of subjects, we cannot beconfident that the current finding of no association be-tween AA concentrations and Si would hold true in alarger sample of overweight subjects. Nevertheless,with these caveats in mind, our study does show thatwhen analyzing small but significant changes in Si inhealthy subjects in response to CR or CR�EX, suchchanges are associated with changes in ACs butnot AAs.
It is also important to recognize that baseline testing inthis study was conducted after all subjects consumed acalorie-controlled isoenergetic weight-maintaining diet(fluctuations in daily weight �250 g) for 14 d. The foodsthat were prepared by the metabolic kitchen provided only30% calories from fat, 15% calories from protein, and55% calories from carbohydrate. Thus, the current studymay have reduced intraindividual variability in fat andprotein intake by imposing a standardized diet in ourhealthy overweight (not obese) participants. If the notionthat an oversupply of dietary fat and protein is responsibleat least in part for incomplete mitochondrial fat oxidation(6, 9, 10), then it is likely that the mitochondria were notoverloaded in the fasted state in our subjects. According toour metabolic kitchen records, the percent calories from pro-tein and fat ranged from 15–20 and 28–37%, respectively.It was interesting when comparing these data with those pre-viously published in lean and obese subjects (6) that the me-dian concentration of leucine/isoleucine, valine, and C3 andC5 in our overweight subjects (Supplemental Table 1) fellbetween those of lean and obese subjects.
In summary, we found that in healthy overweight indi-viduals consuming a weight-maintenance, macronutrient-controlled diet, serum ACs and FA species in the fasted stateare related to measures of adiposity and insulin action. In re-sponse to a 25% energy deficit by diet only or diet and struc-tured exercise, CR alone produced an increase in serum ACconcentrations, whereas with CR and exercise, the increasein serum AC concentrations is attenuated. A greater im-provement in Si with diet and exercise interventions maytherefore be related to an exercise-induced coupling of �-ox-idation and tricarboxylic acid cycle flux.
Acknowledgments
Address all correspondence and requests for reprints to: Dr.Leanne Redman, Assistant Professor, Pennington BiomedicalResearch Center, 6400 Perkins Road, Baton Rouge, Louisiana70808. E-mail: [email protected].
This work was supported by Grant U01 AG20478 (to E.R.)and in part by Grant 1P30 DK072476 (to E.R.) and by GrantP30AG028716 (principal investigator, H. J. Cohen). L.M.R. issupported by Grant K99 HD060762. K.M.H. was supported bythe American College of Rheumatology Research and EducationFoundation/Association of Specialty Professors Junior CareerDevelopment Award in Geriatric Medicine funded by AtlanticPhilanthropies, the American College of Rheumatology Re-search and Education Foundation, the John A. Hartford Foun-dation, and the Association of Specialty Professors as well asNational Institutes of Health/National Institute of Arthritis andMusculoskeletal and Skin Diseases Grant K23AR054904.
Disclosure Summary: The authors have nothing to discloserelated to this study.
E320 Redman et al. Calorie Restriction and Metabolic Intermediates J Clin Endocrinol Metab, February 2011, 96(2):E312–E321
References
1. Heilbronn LK, de Jonge L, Frisard MI, DeLany JP, Larson-MeyerDE,RoodJ,NguyenT,MartinCK,VolaufovaJ,MostMM,GreenwayFL, Smith SR, Deutsch WA, Williamson DA, Ravussin E 2006 Effect of6-month calorie restriction on biomarkers of longevity, metabolic ad-aptation, and oxidative stress in overweight individuals: a randomizedcontrolled trial. JAMA 295:1539–1548
2. Larson-Meyer DE, Heilbronn LK, Redman LM, Newcomer BR,Frisard MI, Anton S, Smith SR, Alfonso A, Ravussin E 2006 Effectof calorie restriction with or without exercise on insulin sensitivity,�-cell function, fat cell size, and ectopic lipid in overweight subjects.Diabetes Care 29:1337–1344
3. Lefevre M, Redman LM, Heilbronn LK, Smith JV, Martin CK, RoodJC, Greenway FL, Williamson DA, Smith SR, Ravussin E 2009 Ca-loric restriction alone and with exercise improves CVD risk inhealthy non-obese individuals. Atherosclerosis 203:206–213
4. Bain JR, Stevens RD, Wenner BR, Ilkayeva O, Muoio DM, NewgardCB 2009 Metabolomics applied to diabetes research: moving frominformation to knowledge. Diabetes 58:2429–2443
5. Huffman KM, Shah SH, Stevens RD, Bain JR, Muehlbauer M, SlentzCA, Tanner CJ, Kuchibhatla M, Houmard JA, Newgard CB, KrausWE 2009 Relationships between circulating metabolic intermedi-ates and insulin action in overweight to obese, inactive men andwomen. Diabetes Care 32:1678–1683
6. Newgard CB, An J, Bain JR, Muehlbauer MJ, Stevens RD, Lien LF,Haqq AM, Shah SH, Arlotto M, Slentz CA, Rochon J, Gallup D,Ilkayeva O, Wenner BR, Yancy Jr WS, Eisenson H, Musante G,Surwit RS, Millington DS, Butler MD, Svetkey LP 2009 A branched-chain amino acid-related metabolic signature that differentiatesobese and lean humans and contributes to insulin resistance. CellMetab 9:311–326
7. Tai ES, Tan ML, Stevens RD, Low YL, Muehlbauer MJ, Goh DL,Ilkayeva OR, Wenner BR, Bain JR, Lee JJ, Lim SC, Khoo CM, ShahSH, Newgard CB 2010 Insulin resistance is associated with a met-abolic profile of altered protein metabolism in Chinese and Asian-Indian men. Diabetologia 53:757–767
8. An J, Muoio DM, Shiota M, Fujimoto Y, Cline GW, Shulman GI,Koves TR, Stevens R, Millington D, Newgard CB 2004 Hepaticexpression of malonyl-CoA decarboxylase reverses muscle, liver andwhole-animal insulin resistance. Nat Med 10:268–274
9. Koves TR, Ussher JR, Noland RC, Slentz D, Mosedale M, IlkayevaO, Bain J, Stevens R, Dyck JR, Newgard CB, Lopaschuk GD, MuoioDM 2008 Mitochondrial overload and incomplete fatty acid oxi-dation contribute to skeletal muscle insulin resistance. Cell Metab7:45–56
10. Noland RC, Koves TR, Seiler SE, Lum H, Lust RM, Ilkayeva O,
Stevens RD, Hegardt FG, Muoio DM 2009 Carnitine insufficiencycaused by aging and overnutrition compromises mitochondrial per-formance and metabolic control. J Biol Chem 284:22840–22852
11. Lien LF, Haqq AM, Arlotto M, Slentz CA, Muehlbauer MJ,McMahon RL, Rochon J, Gallup D, Bain JR, Ilkayeva O, WennerBR, Stevens RD, Millington DS, Muoio DM, Butler MD, NewgardCB, Svetkey LP 2009 The STEDMAN project: biophysical, bio-chemical and metabolic effects of a behavioral weight loss interven-tion during weight loss, maintenance, and regain. OMICS 13:21–35
12. Redman LM, Heilbronn LK, Martin CK, Alfonso A, Smith SR,Ravussin E 2007 Effect of calorie restriction with or without exerciseon body composition and fat distribution. J Clin Endocrinol Metab92:865–872
13. Redman LM, Heilbronn LK, Martin CK, de Jonge L, WilliamsonDA, Delany JP, Ravussin E 2009 Metabolic and behavioral com-pensations in response to caloric restriction: implications for themaintenance of weight loss. PLoS One 4:e4377
14. Larson-Meyer DE, Redman L, Heilbronn LK, Martin CK, RavussinE 2010 Caloric restriction with or without exercise: the fitness versusfatness debate. Med Sci Sports Exerc 42:152–159
15. Adams SH, Hoppel CL, Lok KH, Zhao L, Wong SW, Minkler PE,Hwang DH, Newman JW, Garvey WT 2009 Plasma acylcarnitineprofiles suggest incomplete long-chain fatty acid �-oxidation andaltered tricarboxylic acid cycle activity in type 2 diabetic African-American women. J Nutr 139:1073–1081
16. Civitarese AE, Carling S, Heilbronn LK, Hulver MH, Ukropcova B,Deutsch WA, Smith SR, Ravussin E 2007 Calorie restriction in-creases muscle mitochondrial biogenesis in healthy humans. PLoSMed 4:e76
17. Koves TR, Li P, An J, Akimoto T, Slentz D, Ilkayeva O, Dohm GL,Yan Z, Newgard CB, Muoio DM 2005 Peroxisome proliferator-activated receptor-� co-activator 1�-mediated metabolic remodel-ing of skeletal myocytes mimics exercise training and reverses lipid-induced mitochondrial inefficiency. J Biol Chem 280:33588–33598
18. Muoio DM, Koves TR 2007 Skeletal muscle adaptation to fatty aciddepends on coordinated actions of the PPARs and PGC1�: impli-cations for metabolic disease. Appl Physiol Nutr Metab 32:874–883
19. Berggren JR, Boyle KE, Chapman WH, Houmard JA 2008 Skeletalmuscle lipid oxidation and obesity: influence of weight loss andexercise. Am J Physiol Endocrinol Metab 294:E726–E732
20. Toledo FG, Menshikova EV, Azuma K, Radikova Z, Kelley CA,Ritov VB, Kelley DE 2008 Mitochondrial capacity in skeletal muscleis not stimulated by weight loss despite increases in insulin actionand decreases in intramyocellular lipid content. Diabetes 57:987–994
J Clin Endocrinol Metab, February 2011, 96(2):E312–E321 jcem.endojournals.org E321
Supplemental Table 1. Concentration of serum amino acid species
Metabolite Concentration
Month All subjects (n=46)
Control (n=11)
CR (n=12)
CR+EX (n=12)
LCD (n=11)
Median IQR Median IQR Median IQR Median IQR Median IQR
Glycine
M0 359.44 113.16 360.01 77.96 356.39 103.24 365.38 239.50 358.87 121.27 M3 377.76 130.99 373.10 126.93 363.48 159.57 469.07 167.42 370.98 53.73 M6 404.43 115.07 376.45 60.34 421.04 161.55 438.39 185.57 376.11 85.35
L-Alanine M0 411.39 117.82 407.49 129.32 416.69 89.12 470.52 157.91 385.44 102.13 M3 386.81 140.44 388.55 147.80 385.05 112.74 451.87 185.38 353.18 153.67 M6 390.18 154.81 403.45 155.30 385.03 126.61 420.25 138.61 337.36 186.84
L-Serine
M0 27.62 30.00 28.62 22.00 39.62 102.00 25.62 51.00 14.62 28.00 M3 26.62 28.00 30.62 22.00 37.62 109.00 27.62 51.00 14.62 30.00 M6 26.62 26.00 32.62 22.00 32.62 109.00 29.62 73.00 15.62 20.00
L-Proline M0 196.18 64.13 186.67 52.35 207.76 58.53 211.43 63.02 189.13 47.58 M3 182.85 58.02 167.12 59.42 186.16 94.97 192.47 49.18 162.99 63.33 M6 180.21 59.45 178.99 62.76 187.56 75.48 192.32 60.15 167.03 72.30
L-Valine M0 254.30 53.84 254.22 78.82 258.26 21.33 251.99 82.97 239.90 55.13 M3 233.01 63.36 239.60 77.83 235.14 47.36 254.85 76.59 217.56 32.27 M6 236.05 54.64 261.42 106.11 238.99 32.08 240.68 71.35 225.14 29.99
L-Leucine or L-Isoleucine
M0 174.29 46.55 174.08 65.48 189.34 38.56 169.30 69.99 163.18 35.85 M3 170.41 52.29 169.60 60.64 174.84 41.88 180.35 55.35 150.77 37.72 M6 169.75 50.62 179.47 65.85 171.73 29.88 169.02 60.36 155.06 36.65
L-Methionine M0 28.70 5.20 26.87 7.94 29.38 4.84 28.75 9.66 28.54 3.90 M3 27.56 7.22 26.19 6.59 29.92 5.78 29.18 6.73 23.63 11.20 M6 29.50 5.64 29.50 10.38 30.69 4.26 29.83 7.06 26.18 5.42
L-Histidine M0 109.22 38.65 101.59 45.85 111.41 33.71 112.88 32.25 97.36 27.56 M3 100.86 36.03 97.89 54.22 109.09 29.53 111.58 41.07 97.39 14.94 M6 104.81 26.86 107.66 43.29 101.21 28.22 110.14 20.57 94.27 16.71
L-Phenylalanine M0 81.24 13.90 83.23 14.80 82.33 12.40 77.64 21.23 77.47 10.90 M3 75.75 17.47 87.27 17.07 72.01 12.80 73.78 14.11 75.53 9.71 M6 78.30 16.51 88.66 18.69 77.39 19.48 77.84 16.31 76.41 6.15
L-Tyrosine M0 68.43 19.26 68.76 23.84 68.10 19.54 73.81 16.00 66.97 31.92 M3 63.90 17.25 72.78 17.21 59.89 20.29 63.18 17.37 61.21 18.77 M6 66.65 13.63 74.41 18.41 64.23 15.44 67.14 15.61 65.83 6.92
L-Aspartic acid and L-asparagine
M0 34.26 9.36 33.82 14.77 34.83 8.57 33.52 8.39 39.17 11.18 M3 32.93 10.47 35.43 14.47 31.94 7.90 30.91 12.14 35.49 12.98 M6 33.37 13.54 40.41 16.32 28.99 12.67 33.61 12.02 31.91 4.93
L-Glutamic acid and L-Glutamate
M0 102.91 36.95 101.66 60.95 117.27 32.65 99.93 42.68 108.17 48.21 M3 94.93 31.49 111.22 49.37 93.37 37.70 93.18 25.09 84.52 22.36 M6 96.20 38.51 120.04 22.25 86.18 25.14 101.25 45.79 89.42 47.29
L-Ornithine M0 69.91 25.04 60.58 41.14 75.27 21.01 67.04 27.98 69.38 16.61 M3 69.89 22.06 70.96 31.99 74.98 22.46 67.66 11.13 62.36 28.45 M6 74.95 25.24 74.95 34.10 76.25 26.13 79.90 29.52 70.34 29.50
L-Citrulline M0 30.66 11.84 29.96 7.73 32.77 10.74 29.98 10.09 31.35 16.88 M3 29.17 10.30 29.49 11.64 33.07 7.22 26.67 4.56 20.36 20.82 M6 32.16 11.43 30.92 17.16 32.74 8.02 29.92 10.38 32.15 14.24
L-Arginine M0 134.13 36.38 144.95 50.71 130.50 44.36 117.35 31.97 134.66 56.26 M3 118.77 34.90 119.17 40.40 115.11 40.58 128.33 42.01 104.47 50.77 M6 118.13 42.56 149.44 61.00 116.32 30.26 105.66 20.51 117.25 51.28

Supplemental Table 1. Concentration of serum fatty acid species
Metabolite Concentration
Month All subjects (n=46)
Control (n=11)
CR (n=12)
CR+EX (n=12)
LCD (n=11)
Median IQR Median IQR Median IQR Median IQR Median IQR Myristic (uM) C14:0
M0 6.64 4.21 6.73 4.43 5.95 3.35 6.68 3.03 7.29 7.92 M3 6.65 4.07 7.11 4.52 6.45 4.62 6.10 2.28 7.02 5.23 M6 6.97 4.03 6.97 4.91 5.79 5.26 6.75 4.74 7.54 2.66
Palmitoleic (uM) C16:0
M0 13.19 11.31 13.59 10.15 11.25 10.29 13.39 10.02 13.76 22.31 M3 15.40 9.47 12.49 8.30 18.21 12.27 12.90 13.45 16.98 10.58 M6 15.11 11.21 16.57 7.49 14.97 17.31 15.16 15.44 14.24 8.58
Palmitic (uM) C16:0
M0 110.55 60.05 101.05 79.76 92.25 47.81 116.85 15.55 110.10 84.47 M3 111.07 67.57 99.39 38.31 140.97 77.16 104.24 59.66 112.46 68.31 M6 112.91 60.12 102.63 84.04 124.28 89.06 114.76 52.92 105.70 41.24
Alpha-Linolenic (uM) C18:3
M0 5.15 2.40 5.65 3.28 4.90 2.60 5.10 1.41 6.01 5.06 M3 5.76 2.79 5.60 2.81 6.75 2.44 4.61 2.64 6.48 3.20 M6 4.97 3.31 5.30 3.12 5.47 3.12 4.63 2.61 5.65 3.71
Linoleic (uM) C18:2
M0 77.39 53.11 74.00 65.16 77.39 70.50 79.80 27.17 74.94 62.83 M3 86.51 36.77 78.94 39.06 104.28 53.60 73.72 28.72 91.97 45.61 M6 84.67 57.97 80.91 82.27 104.37 54.37 86.38 38.81 83.77 43.72
Oleic (uM) C18:1
M0 165.70 64.42 156.01 73.45 127.90 70.11 166.92 44.40 168.85 151.92 M3 179.73 98.42 139.99 64.72 214.40 128.12 161.06 92.22 194.16 85.47 M6 182.74 75.92 165.32 80.00 201.07 148.19 193.07 99.97 181.06 52.48
Stearic (uM) C18:0
M0 41.96 17.98 37.76 26.06 41.96 23.46 46.64 16.65 43.65 24.02 M3 44.22 13.69 38.86 15.37 48.80 11.81 42.40 10.30 46.02 19.91 M6 41.54 22.89 38.25 25.17 46.01 22.40 40.08 11.61 50.61 26.39
Arachidonic (uM) C20:4
M0 4.18 1.62 4.00 3.41 4.76 2.00 4.15 0.95 3.87 1.75 M3 4.03 1.89 3.84 3.15 4.30 1.98 4.00 1.04 4.20 2.63 M6 4.48 1.44 4.75 2.56 4.16 1.81 4.58 1.19 3.84 1.50
Supplemental Table 1. Concentration of serum acylcarnitine species
Metabolite Concentration
Month All subjects (n=46)
Control (n=11)
CR (n=12)
CR+EX (n=12)
LCD (n=11)
Median IQR Median IQR Median IQR Median IQR Median IQR
C2 M0 6.941 3.053 5.542 3.594 7.208 4.551 7.192 3.765 7.101 2.060 M3 7.059 3.461 6.826 3.876 9.086 3.105 6.952 3.118 5.687 2.308 M6 7.157 3.573 6.418 3.752 9.817 3.000 8.208 4.518 6.583 2.107
C3 M0 0.387 0.243 0.345 0.173 0.480 0.290 0.331 0.209 0.335 0.269 M3 0.363 0.260 0.527 0.274 0.373 0.073 0.330 0.331 0.191 0.223 M6 0.355 0.271 0.367 0.255 0.428 0.239 0.331 0.200 0.258 0.098
C4/C4i M0 0.136 0.113 0.162 0.131 0.179 0.119 0.128 0.075 0.132 0.050 M3 0.130 0.099 0.185 0.096 0.150 0.093 0.121 0.061 0.078 0.030 M6 0.150 0.097 0.150 0.101 0.171 0.100 0.146 0.077 0.132 0.077
C5:1 M0 0.052 0.022 0.052 0.015 0.059 0.012 0.039 0.015 0.056 0.025 M3 0.045 0.025 0.047 0.022 0.049 0.033 0.038 0.031 0.042 0.024 M6 0.040 0.022 0.042 0.016 0.041 0.011 0.036 0.032 0.030 0.019
C5S M0 0.102 0.055 0.114 0.086 0.107 0.056 0.095 0.042 0.099 0.055 M3 0.102 0.057 0.103 0.067 0.098 0.051 0.109 0.062 0.085 0.045 M6 0.099 0.062 0.099 0.044 0.118 0.104 0.086 0.074 0.094 0.049
C4-OH M0 0.021 0.018 0.018 0.014 0.023 0.022 0.019 0.022 0.022 0.025 M3 0.024 0.022 0.017 0.009 0.028 0.023 0.030 0.019 0.024 0.026 M6 0.025 0.025 0.026 0.025 0.027 0.031 0.033 0.023 0.014 0.007
C6 M0 0.000 0.000 0.000 0.088 0.000 0.000 0.000 0.000 0.000 0.000 M3 0.000 0.059 0.000 0.092 0.000 0.000 0.021 0.091 0.000 0.059 M6 0.000 0.072 0.037 0.068 0.000 0.023 0.000 0.095 0.036 0.098
C5-OH/C3-DC M0 0.093 0.088 0.103 0.192 0.106 0.125 0.104 0.103 0.090 0.073 M3 0.114 0.163 0.146 0.080 0.108 0.178 0.145 0.097 0.073 0.176 M6 0.057 0.134 0.117 0.092 0.017 0.149 0.034 0.176 0.043 0.081
Ci4-DC/C4-DC M0 0.022 0.014 0.024 0.015 0.025 0.012 0.018 0.014 0.021 0.014 M3 0.027 0.013 0.023 0.010 0.030 0.006 0.027 0.018 0.021 0.022 M6 0.023 0.012 0.023 0.008 0.031 0.020 0.024 0.014 0.020 0.010
C8:1 M0 0.151 0.076 0.133 0.129 0.175 0.080 0.148 0.078 0.152 0.074 M3 0.134 0.060 0.135 0.071 0.164 0.030 0.113 0.063 0.109 0.051 M6 0.135 0.054 0.138 0.077 0.125 0.053 0.130 0.047 0.139 0.071
C8 M0 0.070 0.033 0.089 0.056 0.068 0.014 0.068 0.032 0.079 0.031 M3 0.077 0.036 0.072 0.036 0.083 0.032 0.094 0.086 0.058 0.032 M6 0.076 0.050 0.074 0.035 0.107 0.052 0.081 0.042 0.062 0.033
C5-DC M0 0.029 0.018 0.029 0.016 0.023 0.027 0.027 0.012 0.030 0.018 M3 0.024 0.013 0.022 0.014 0.030 0.019 0.025 0.018 0.021 0.013 M6 0.026 0.016 0.021 0.013 0.030 0.027 0.027 0.016 0.028 0.014
C6-DC M0 0.039 0.029 0.034 0.030 0.044 0.028 0.043 0.027 0.044 0.023 M3 0.045 0.030 0.046 0.040 0.055 0.031 0.053 0.025 0.036 0.021 M6 0.039 0.025 0.029 0.016 0.056 0.031 0.043 0.016 0.032 0.009
C10:3 M0 0.097 0.048 0.082 0.044 0.101 0.050 0.082 0.039 0.123 0.044 M3 0.090 0.033 0.095 0.029 0.089 0.019 0.085 0.055 0.095 0.047 M6 0.086 0.041 0.099 0.042 0.088 0.033 0.085 0.041 0.084 0.053
C10:2 M0 0.028 0.012 0.028 0.016 0.031 0.012 0.026 0.012 0.027 0.014 M3 0.026 0.016 0.026 0.020 0.028 0.015 0.026 0.016 0.025 0.017 M6 0.027 0.015 0.025 0.020 0.028 0.012 0.029 0.014 0.022 0.012
Supplemental Table 1. Concentration of serum acylcarnitine species
Metabolite Concentration
Month All subjects (n=46)
Control (n=11)
CR (n=12)
CR+EX (n=12)
LCD (n=11)
Median IQR Median IQR Median IQR Median IQR Median IQR
C10:1 M0 0.141 0.067 0.123 0.072 0.145 0.064 0.145 0.072 0.138 0.074 M3 0.126 0.068 0.118 0.039 0.145 0.057 0.143 0.131 0.105 0.072 M6 0.133 0.080 0.129 0.085 0.184 0.098 0.134 0.085 0.110 0.065
C10 M0 0.142 0.072 0.151 0.091 0.128 0.085 0.158 0.051 0.136 0.036 M3 0.163 0.093 0.155 0.080 0.192 0.072 0.179 0.202 0.120 0.065 M6 0.140 0.126 0.136 0.158 0.219 0.165 0.138 0.128 0.129 0.049
C10-OH/C8-DC M0 0.014 0.007 0.013 0.005 0.015 0.007 0.015 0.006 0.014 0.011 M3 0.016 0.011 0.014 0.014 0.019 0.006 0.021 0.025 0.011 0.006 M6 0.015 0.010 0.013 0.004 0.023 0.010 0.020 0.011 0.012 0.005
C12:1 M0 0.057 0.017 0.055 0.026 0.057 0.011 0.060 0.012 0.048 0.032 M3 0.060 0.031 0.058 0.038 0.077 0.031 0.074 0.050 0.048 0.018 M6 0.062 0.035 0.058 0.029 0.083 0.038 0.063 0.043 0.051 0.018
C12 M0 0.039 0.023 0.043 0.028 0.036 0.018 0.048 0.021 0.033 0.027 M3 0.039 0.027 0.032 0.020 0.046 0.027 0.043 0.031 0.033 0.015 M6 0.048 0.028 0.041 0.030 0.063 0.027 0.054 0.030 0.032 0.025
CC12-OH/C10-DC
M0 0.004 0.003 0.003 0.003 0.005 0.004 0.004 0.003 0.004 0.003 M3 0.004 0.003 0.003 0.004 0.005 0.003 0.005 0.004 0.003 0.003 M6 0.004 0.003 0.004 0.004 0.005 0.004 0.004 0.005 0.004 0.002
C14:2 M0 0.023 0.012 0.018 0.009 0.023 0.009 0.025 0.012 0.025 0.016 M3 0.024 0.013 0.022 0.017 0.029 0.012 0.027 0.027 0.020 0.012 M6 0.024 0.014 0.022 0.017 0.033 0.024 0.026 0.015 0.023 0.007
C14:1 M0 0.039 0.018 0.036 0.032 0.039 0.014 0.043 0.016 0.042 0.018 M3 0.043 0.024 0.038 0.020 0.056 0.020 0.043 0.042 0.031 0.017 M6 0.046 0.033 0.043 0.024 0.062 0.024 0.056 0.039 0.039 0.008
C14 M0 0.013 0.007 0.012 0.025 0.013 0.008 0.013 0.005 0.014 0.007 M3 0.014 0.007 0.016 0.013 0.016 0.013 0.014 0.006 0.005 0.014 M6 0.016 0.009 0.018 0.029 0.020 0.006 0.015 0.006 0.013 0.007
C14:1-OH/C12:1-DC
M0 0.009 0.005 0.008 0.007 0.008 0.006 0.008 0.004 0.011 0.003 M3 0.010 0.007 0.009 0.004 0.011 0.005 0.014 0.008 0.008 0.006 M6 0.010 0.005 0.007 0.008 0.010 0.005 0.011 0.003 0.010 0.004
C14-OH/C12-DC M0 0.006 0.004 0.006 0.005 0.006 0.004 0.006 0.004 0.005 0.005 M3 0.007 0.003 0.006 0.004 0.007 0.003 0.006 0.007 0.006 0.002 M6 0.006 0.004 0.005 0.003 0.007 0.003 0.008 0.004 0.006 0.005
C16 M0 0.061 0.020 0.067 0.022 0.061 0.018 0.057 0.018 0.052 0.015 M3 0.061 0.020 0.061 0.019 0.065 0.020 0.062 0.027 0.049 0.011 M6 0.063 0.022 0.066 0.040 0.075 0.021 0.055 0.023 0.057 0.010
C16-OH/C14-DC M0 0.002 0.002 0.002 0.002 0.002 0.002 0.002 0.001 0.002 0.003 M3 0.003 0.001 0.002 0.002 0.003 0.001 0.003 0.001 0.003 0.002 M6 0.003 0.001 0.002 0.002 0.003 0.002 0.003 0.001 0.002 0.002
C18:2 M0 0.054 0.018 0.054 0.018 0.062 0.038 0.052 0.016 0.054 0.015 M3 0.051 0.012 0.056 0.015 0.055 0.026 0.048 0.012 0.047 0.023 M6 0.063 0.023 0.051 0.039 0.065 0.031 0.061 0.016 0.061 0.017
C18:1 M0 0.097 0.040 0.103 0.049 0.094 0.053 0.093 0.032 0.094 0.053 M3 0.100 0.030 0.099 0.033 0.111 0.033 0.097 0.044 0.091 0.031 M6 0.115 0.033 0.113 0.050 0.121 0.040 0.112 0.029 0.120 0.028
Metabolite Concentration
Month All subjects (n=46)
Control (n=11)
CR (n=12)
CR+EX (n=12)
LCD (n=11)
Median IQR Median IQR Median IQR Median IQR Median IQR
C18 M0 0.026 0.009 0.025 0.007 0.022 0.010 0.027 0.010 0.027 0.007 M3 0.029 0.011 0.028 0.011 0.033 0.009 0.029 0.010 0.029 0.011 M6 0.031 0.011 0.030 0.020 0.032 0.022 0.034 0.009 0.030 0.011
C18:1-OH/C16:1-DC
M0 0.004 0.002 0.004 0.002 0.004 0.002 0.004 0.003 0.005 0.002 M3 0.004 0.002 0.004 0.002 0.004 0.004 0.004 0.004 0.003 0.002 M6 0.004 0.003 0.003 0.003 0.005 0.002 0.005 0.003 0.005 0.003
C18-OH/C16-DC M0 0.003 0.003 0.003 0.002 0.004 0.003 0.003 0.003 0.004 0.004 M3 0.004 0.002 0.003 0.002 0.004 0.002 0.003 0.005 0.005 0.002 M6 0.004 0.002 0.003 0.002 0.005 0.003 0.004 0.002 0.003 0.003
C20 M0 0.003 0.003 0.003 0.003 0.004 0.002 0.003 0.004 0.004 0.003 M3 0.003 0.002 0.002 0.002 0.005 0.003 0.003 0.002 0.003 0.002 M6 0.004 0.002 0.004 0.003 0.004 0.003 0.004 0.002 0.004 0.002
C20:1-OH/C18:1-DC
M0 0.004 0.002 0.005 0.002 0.004 0.002 0.003 0.003 0.005 0.003 M3 0.005 0.002 0.004 0.002 0.005 0.003 0.006 0.003 0.005 0.001 M6 0.005 0.003 0.004 0.002 0.007 0.004 0.006 0.002 0.005 0.002
C20-OH/C18-DC M0 0.005 0.004 0.004 0.005 0.005 0.002 0.005 0.004 0.005 0.002 M3 0.005 0.004 0.004 0.002 0.008 0.005 0.005 0.004 0.005 0.002 M6 0.005 0.002 0.004 0.003 0.005 0.002 0.006 0.004 0.005 0.002
C22 M0 0.002 0.002 0.002 0.001 0.002 0.002 0.002 0.003 0.002 0.001 M3 0.002 0.002 0.001 0.004 0.002 0.002 0.002 0.002 0.003 0.002 M6 0.002 0.002 0.001 0.001 0.002 0.001 0.002 0.003 0.003 0.002
C6:1-DC/C8:1-OH
M0 0.022 0.012 0.023 0.012 0.019 0.012 0.023 0.016 0.023 0.012 M3 0.023 0.011 0.023 0.004 0.021 0.013 0.025 0.013 0.016 0.013 M6 0.022 0.012 0.026 0.017 0.023 0.015 0.019 0.012 0.017 0.008
C7-DC M0 0.000 0.006 0.000 0.000 0.000 0.007 0.002 0.010 0.000 0.000 M3 0.000 0.007 0.000 0.007 0.000 0.008 0.000 0.010 0.000 0.000 M6 0.000 0.000 0.000 0.005 0.000 0.000 0.000 0.004 0.000 0.000
C8:1-DC M0 0.014 0.008 0.016 0.011 0.012 0.006 0.013 0.003 0.013 0.010 M3 0.016 0.008 0.016 0.006 0.016 0.014 0.017 0.008 0.013 0.009 M6 0.015 0.009 0.015 0.008 0.020 0.006 0.017 0.010 0.015 0.007
C16:2 M0 0.006 0.003 0.005 0.004 0.005 0.002 0.006 0.002 0.007 0.005 M3 0.005 0.003 0.005 0.001 0.007 0.004 0.006 0.006 0.005 0.002 M6 0.007 0.003 0.006 0.005 0.008 0.003 0.007 0.002 0.006 0.001
C16:1 M0 0.015 0.006 0.015 0.009 0.014 0.006 0.018 0.008 0.016 0.004 M3 0.014 0.006 0.013 0.006 0.016 0.010 0.015 0.007 0.013 0.004 M6 0.018 0.008 0.020 0.016 0.021 0.009 0.018 0.006 0.017 0.003
C16:1-OH/C14:1-DC
M0 0.005 0.002 0.005 0.001 0.005 0.002 0.005 0.005 0.005 0.003 M3 0.006 0.003 0.006 0.003 0.007 0.004 0.006 0.002 0.004 0.003 M6 0.006 0.003 0.006 0.003 0.006 0.003 0.006 0.002 0.005 0.003
C18:2-OH M0 0.004 0.004 0.004 0.005 0.002 0.005 0.004 0.005 0.005 0.004 M3 0.004 0.004 0.004 0.004 0.004 0.005 0.005 0.003 0.004 0.005 M6 0.005 0.004 0.003 0.005 0.006 0.008 0.006 0.002 0.005 0.003
C20:4 M0 0.006 0.004 0.005 0.004 0.008 0.005 0.006 0.004 0.006 0.004 M3 0.005 0.003 0.006 0.003 0.006 0.005 0.005 0.003 0.004 0.003 M6 0.005 0.004 0.005 0.006 0.006 0.007 0.005 0.004 0.005 0.002