ANNEXES TO ANNEX XV RESTRICTION REPORT - ECHA
494
P.O. Box 400, FI-00121 Helsinki, Finland | Tel. +358 9 686180 | echa.europa.eu ANNEXES TO ANNEX XV RESTRICTION REPORT SUBSTANCE NAME(S): Per- and polyfluoroalkyl substances (PFASs) in firefighting foams CONTACT DETAILS OF THE DOSSIER SUBMITTER: European Chemicals Agency (ECHA) Telakkakatu 6, PO BOX 400, FI-00121, Helsinki, Finland VERSION NUMBER: 1.0 DATE: 14 January 2022
-
Upload
khangminh22 -
Category
Documents
-
view
1 -
download
0
Transcript of ANNEXES TO ANNEX XV RESTRICTION REPORT - ECHA

P.O. Box 400, FI-00121 Helsinki, Finland | Tel. +358 9 686180 | echa.europa.eu
ANNEXES TO ANNEX XV RESTRICTION REPORT
SUBSTANCE NAME(S): Per- and polyfluoroalkyl substances (PFASs) in firefighting foams
CONTACT DETAILS OF THE DOSSIER SUBMITTER:
European Chemicals Agency (ECHA)
Telakkakatu 6, PO BOX 400, FI-00121, Helsinki, Finland
VERSION NUMBER: 1.0
DATE: 14 January 2022

ANNEX XV RESTRICTION REPORT – PFAS IN FIREFIGHTING FOAMS
P.O. Box 400, FI-00121 Helsinki, Finland | Tel. +358 9 686180 | echa.europa.eu
i
CONTENTS
Annex A. Manufacture and uses .............................................................................. 1
A.1. Manufacture, import and export ...................................................................................... 1
A.2. Uses ............................................................................................................................ 2
A.2.1. Introduction .......................................................................................................... 2
A.2.2. Tonnages of fluorosurfactants used in firefighting foams production ............................. 2
A.2.3. PFAS-based firefighting foams ................................................................................. 3
A.2.4. Fluorine-free alternatives ........................................................................................ 9
A.3. Uses advised against by the registrants ......................................................................... 11
Annex B. Information on hazard and risk ............................................................. 13
B.1. Identity of the substance(s) and physical and chemical properties ..................................... 13
B.1.1. Name and other identifiers of the substance(s) ........................................................ 14
B.1.1.2.1. PFSAs an ....................................................................................................... 17
B.1.2. Composition of the substance(s) ............................................................................ 29
B.1.3. Physicochemical properties .................................................................................... 29
B.1.4. Justification for grouping ....................................................................................... 54
B.2. Manufacture and uses (summary) ................................................................................. 56
B.3. Classification and labelling ............................................................................................ 57
B.3.1. Classification and labelling in Annex VI of Regulation (EC) No 1272/2008 (CLP Regulation) ................................................................................................................... 57
B.3.2. Classification and labelling in classification and labelling inventory/ Industry’s self classification(s) and labelling1 ......................................................................................... 61
B.4. Environmental fate properties ....................................................................................... 68
B.4.1. Degradation ........................................................................................................ 68
B.4.2. Environmental distribution................................................................................... 115
B.4.3. Bioaccumulation ................................................................................................. 132
B.4.4. Enrichment in plants ........................................................................................... 153
B.4.5. Removal from the environment, decontamination and purification ............................ 173
B.5. Human health hazard assessment ............................................................................... 177
B.5.1. Toxicokinetics/ADME (absorption, metabolism, distribution and elimination) of non-polymeric PFASs .......................................................................................................... 182
B.5.2. Evidence from animal data .................................................................................. 191

ANNEX XV RESTRICTION REPORT – PFAS IN FIREFIGHTING FOAMS
P.O. Box 400, FI-00121 Helsinki, Finland | Tel. +358 9 686180 | echa.europa.eu
ii
B.5.3. Evidence from epidemiological studies .................................................................. 205
B.5.4. Combined toxicity .............................................................................................. 205
B.5.5. Derivation of DNEL(s)/DMEL(s) ............................................................................ 206
B.6. Human health hazard assessment of physicochemical properties ..................................... 207
B.7. Environmental hazard assessment ............................................................................... 207
B.7.1. Ecotoxicity ........................................................................................................ 207
B.7.2. Atmospheric compartment – global warming potential ............................................ 217
B.7.3. Microbiological activity in sewage treatment systems .............................................. 221
B.7.4. Endocrine activity and endocrine disruption ........................................................... 221
B.8. PBT and vPvB assessment .......................................................................................... 255
B.9. Exposure assessment ................................................................................................ 255
B.9.1. General discussion on releases and exposure ......................................................... 255
B.9.2. Manufacturing.................................................................................................... 255
B.9.3. Use 1: Firefighting foams .................................................................................... 255
B.9.4. Other sources (for example natural sources, unintentional releases) ......................... 277
B.9.5. Overall environmental exposure assessment ......................................................... 277
B.9.6. Combined human exposure assessment ................................................................ 277
B.10. Risk characterisation ................................................................................................ 278
Annex C. Justification for action on a Union-wide basis ...................................... 279
Annex D. Baseline ............................................................................................... 280
Annex E. Impact Assessment ............................................................................. 281
E.1. Risk Management Options .......................................................................................... 281
E.1.1. Proposed option(s) for restriction ......................................................................... 281
E.1.2. Discarded restriction options ................................................................................ 285
E.1.3. Union-wide risk management options other than restriction ..................................... 285
E.2. Alternatives .............................................................................................................. 288
E.2.1. Description of the use and function of the restricted substance(s) ............................ 288
E.2.2. Substances used in fluorine-free foam concentrates ............................................... 288
E.2.3. Identification of alternative foam concentrates and techniques ................................. 299
E.2.4. Risk reduction, technical and economic feasibility, and availability of alternatives ....... 301
E.2.5. Technical feasibility of alternatives for specific sectors of use ................................... 327

ANNEX XV RESTRICTION REPORT – PFAS IN FIREFIGHTING FOAMS
P.O. Box 400, FI-00121 Helsinki, Finland | Tel. +358 9 686180 | echa.europa.eu
iii
E.2.6. Representative case studies where fluorine-free alternatives are already in use in the EU ................................................................................................................................. 338
E.2.7. Summary comparison across sectors of use ........................................................... 342
E.3. Response to restriction scenario(s) .............................................................................. 349
E.4. Economic impacts ...................................................................................................... 349
E.4.1. Cost calculations ................................................................................................ 349
E.4.2. Results ............................................................................................................. 357
E.4.3. Additional information on cost categories .............................................................. 367
E.4.4. Other economic impacts ...................................................................................... 387
E.5. Human health and environmental impacts .................................................................... 388
E.5.1. Human health impacts ........................................................................................ 388
E.5.2. Environmental impacts ........................................................................................ 388
E.5.3. Changes in emission, exposure and risk ................................................................ 404
E.6. Other impacts ........................................................................................................... 405
E.6.1. Social impacts.................................................................................................... 405
E.6.2. Wider economic impacts ...................................................................................... 405
E.6.3. Distributional impacts ......................................................................................... 405
E.7. Practicality and monitorability ..................................................................................... 406
E.8. Proportionality (comparison of options) ........................................................................ 408
E.8.1. Cost-effectiveness .............................................................................................. 408
E.8.2. Stakeholder input on transition periods ................................................................. 413
E.8.3. Stakeholder input on concentration thresholds ....................................................... 414
E.8.4. Comparison of Restriction Options ........................................................................ 415
E.8.5. Comparison of costs and benefits ......................................................................... 415
Annex F. Assumptions, uncertainties and sensitivities ....................................... 416
Annex G. Stakeholder information ...................................................................... 417
G.1. Introduction ............................................................................................................. 417
G.2. Approach ................................................................................................................. 417
G.3. Outcome and conclusions ........................................................................................... 418
References ......................................................................................................... 419

ANNEX XV RESTRICTION REPORT – PFAS IN FIREFIGHTING FOAMS
P.O. Box 400, FI-00121 Helsinki, Finland | Tel. +358 9 686180 | echa.europa.eu
iv
TABLES
Table A.1. Tonnage of fluorosurfactants purchased for the production of firefighting foams by manufacturers participating in the 2018 Eurofeu survey ............................................. 2
Table B.1. PFSAs (identified by CAS) with ≥C6 incl. CAS/EC identifier, the designation, the acronym and the supplier and/or product name, from (Wood et al., 2020) ..................... 17
Table B.2. PFCAs (identified by CAS) with ≥C8 incl. CAS/EC identifier, the designation, the acronym and the supplier and/or product name, from (Wood et al., 2020) ..................... 18
Table B.3. PFSAs (identified by CAS) with <C6 incl. CAS/EC identifier, the designation, the acronym and the supplier and/or product name, from (Wood et al., 2020) ..................... 19
Table B.4. PFCAs (identified by CAS) with <C8 incl. CAS/EC identifier, the designation, the acronym and the supplier and/or product name .......................................................... 20
Table B.5. Identified derivates of perfluoroalkyl sulfonic PFAS (also PASF-based substances), from (Wood et al., 2020) .......................................................................................... 21
Table B.6. Fluorotelomer (identified by CAS) substances incl. CAS/EC identifier, the designation, the acronym and the supplier and/or product name, from (Wood et al., 2020) ............................................................................................................................. 23
Table B.7. Other per- or polyfluorinated substances (identified by CAS) incl. CAS/EC identifier, the designation, the acronym and the supplier and/or product name, from (Wood et al., 2020) ........................................................................................................... 27
Table B.8. Substance ID indicated by stakeholders to be used in firefighting foams ......... 28
Table B.9. Basic substance information and physical chemical properties of PFCAs (Perfluoroalkylcarboxylic acids). ................................................................................ 30
Table B.10. Basic substance information and physical chemical properties of PFSAs (Perfluoroalkane sulfonic acids). ................................................................................ 35
Table B.11. Basic substance information and physical chemical properties of Perfluoroalkanes. ..................................................................................................... 40
Table B.12. Basic substance information and physical chemical properties of Haloperfluoroalkanes and Perfluoroalkylethers (PFAEs; acyclic and cyclic). ..................... 44
Table B.13. Basic substance information and physical chemical properties of Perfluoroalkylphosphonic acids (PFPAs). ..................................................................... 47
Table B.14. Basic substance information and physical chemical properties of Perfluoroalkylamines. ............................................................................................... 51
Table B.15. Summary of key preliminary market analysis results, from (Wood et al., 2020) ............................................................................................................................. 56
Table B.16. PFASs with harmonised classification for carcinogenicity (C), mutagenicity (M), reproductive toxicity (R), lactation effects (L) and/or specific target organ toxicity following repeated exposure (STOT RE). PFASs known as active substances in plant protection products (PPP) and biocidal products (BP) are listed in the second part of the table. ........ 58
Table B.17. PFASs (subdivided into PFAS categories) with harmonised or self-classification

ANNEX XV RESTRICTION REPORT – PFAS IN FIREFIGHTING FOAMS
P.O. Box 400, FI-00121 Helsinki, Finland | Tel. +358 9 686180 | echa.europa.eu
v
for carcinogenicity (Carc.), mutagenicity (Muta.), reproductive toxicity (Repr.), effects on or via lactation (Lact.) and/or specific target organ toxicity following repeated exposure (STOT RE), re-arranged into ‘arrowheads’ and ‘possible PFAA precursors’ ................................. 61
Table B.18. PFASs with harmonised or self-classification for carcinogenicity (C), mutagenicity (M), reproductive toxicity (R), lactation effects (L) and/or specific target organ toxicity following repeated exposure (STOT RE), subdivided into ECHA PFAS categories. .. 65
Table B.19. PFASs with harmonised or self-classification for carcinogenicity (C), mutagenicity (M), reproductive toxicity (R), lactation effects (L) and/or specific target organ toxicity following repeated exposure (STOT RE), re-arranged into three PFAS main classes, and ‘currently not-classifiable’ PFASs. ........................................................................ 66
Table B.20. Details on available classification information for the endpoints of concern C, M, R, L, STOT RE for classified PFASs in the three PFAS main classes, and non-assignable PFASs. ................................................................................................................... 67
Table B.21. List of substances selected for QSAR modelling of degradation. .................... 70
Table B.22. Predicted biodegradability of the analysed PFAS categories and molecules. .... 72
Table B.23. Summary of formed PFCAs during degradation of n:2 FTOHs and the intermediate products (5:3 acid, fluorotelomer carboxylic acid (FTCA) and fluorotelomer unsaturated carboxylic acid (FTUCA))......................................................................... 87
Table B.24. Summary of formed PFCAs during degradation of n:2 fluorotelomer derivatives ............................................................................................................................. 93
Table B.25. log KOC (sediment organic carbon-normalised distribution coefficient) for PFAAs shown in dependence of the carbon chain length. ....................................................... 119
Table B.26. log KOC (sediment organic carbon-normalised distribution coefficient)for PFCs shown in dependence of the carbon chain length ........................................................ 120
Table B.27. KOC (sediment organic carbon-normalised distribution coefficient) for perfluoroalkylamines and perfluorethers .................................................................... 120
Table B.28. Estimated characteristic travel distances of fluorotelomecic alcohols and the respective input parameter for the OECD tool ............................................................ 128
Table B.29. Estimated characteristic travel distances of selected PFCAs and the respective input parameter for the OECD tool ............................................................................ 128
Table B.30. Overview on bioconcentration factors (BCFs) and bioaccumulation factors (BAFs; L/kg wet wt) for fish for whole-body, muscle/fillet, and liver tissues (median ± standard deviation, n) provided by Burkhard (2021). Bold numbers = above the B criterion of REACH Annex XIII. SS = steady state; OECD = Organisation for Economic Co-operation and Development; .................................................................................................. 140
Table B.31. Summary of bioaccumulation studies in fish according to OECD 305 for HFPO- DA, EEA-NTH and ADONA (SVHC dossier for HPFO-DA, ECHA CHEM 2021). ................... 148
Table B.32. Uptake of PFASs in plants ....................................................................... 157
Table B.33. PFASs in assessed literature and study reports. ......................................... 177
Table B.34. Ecotoxicological threshold values for different PFASs from scientific literature recorded in the PFASTox database. Additional information (Endpoint, species / cell line) are

ANNEX XV RESTRICTION REPORT – PFAS IN FIREFIGHTING FOAMS
P.O. Box 400, FI-00121 Helsinki, Finland | Tel. +358 9 686180 | echa.europa.eu
vi
included to allow for a superficial classification of the threshold values. ......................... 211
Table B.35. GWP-values (GWP-100) collected from the IPCC fourth Assessment Report. . 217
Table B.36. GWP-values (GWP-100) for selected fluranes. ........................................... 219
Table B.37. Overview over EA / ED of different PFASs ................................................. 222
Table B.38. Studies investigating the EA / ED of PFAS ................................................. 229
Table B.39. PFAS-based substances for selection, based on (Wood et al., 2020) ............. 256
Table B.40. annual usage rate of PFAS foams per sector (compared to stock), calculated based on WFVD survey (WFVD, 2020) ....................................................................... 262
Table B.41. yearly PFAS total emissions under the baseline scenarios, broken down by sector/type of use. ................................................................................................. 267
Table B.42. Cumulative PFAS emissions over 30 years under the baseline scenarios, broken down by sector/type of use. ..................................................................................... 267
Table B.43. log Koc values for a set of solvents, POPs and PFAS based substances as indicative guide to partitioning against Koc values. ..................................................... 269
Table B.44. Information on study population, comparison group, geographic location, kind of study and comments on reliability extracted from the relevant references. NHANES = National Health and Nutrition Examination Survey, WFBC = Woman Firefighting Biomonitoring Collaborative. .................................................................................... 272
Table E.1. Transitional periods for placing on the market by sector/type of use .............. 281
Table E.2. Transitional periods for placing on the market and use by sector/type of use .. 282
Table E.3. Transitional periods for placing on the market and use by sector/type of use .. 284
Table E.4. Transitional periods for placing on the market and use by sector/type of use .. 285
Table E.5. Other risk management options than restriction considered .......................... 286
Table E.6. Identified hydrocarbons (identified by CAS) incl. CAS/EC identifier, the substance name, chemical group and the supplier and/or product name, from (Wood et al., 2020) . 290
Table E.7. Identified detergents (identified by CAS) incl. CAS/EC identifier, the substance name, chemical group and the supplier and/or product name, from (Wood et al., 2020) . 292
Table E.8. Siloxanes (identified by CAS) incl. CAS/EC identifier, the substance name, chemical group and the supplier and/or product name, from (Wood et al., 2020) ........... 297
Table E.9. Shortlist of fluorine-free alternative products for assessment, from (Wood et al., 2020) ................................................................................................................... 300
Table E.10. Assessment of Respondol ATF 3-6%, from (Wood et al., 2020) ................... 302
Table E.11. Assessment of Re-Healing Foam RF3x6 ATC, from (Wood et al., 2020) ......... 304
Table E.12. Assessment of Re-Healing Foam RF1 1%, from (Wood et al., 2020) ............. 306
Table E.13. Assessment of Moussol FF 3x6 (F-15), from (Wood et al., 2020) ................. 309
ANNEX XV RESTRICTION REPORT – PFAS IN FIREFIGHTING FOAMS
P.O. Box 400, FI-00121 Helsinki, Finland | Tel. +358 9 686180 | echa.europa.eu
vii
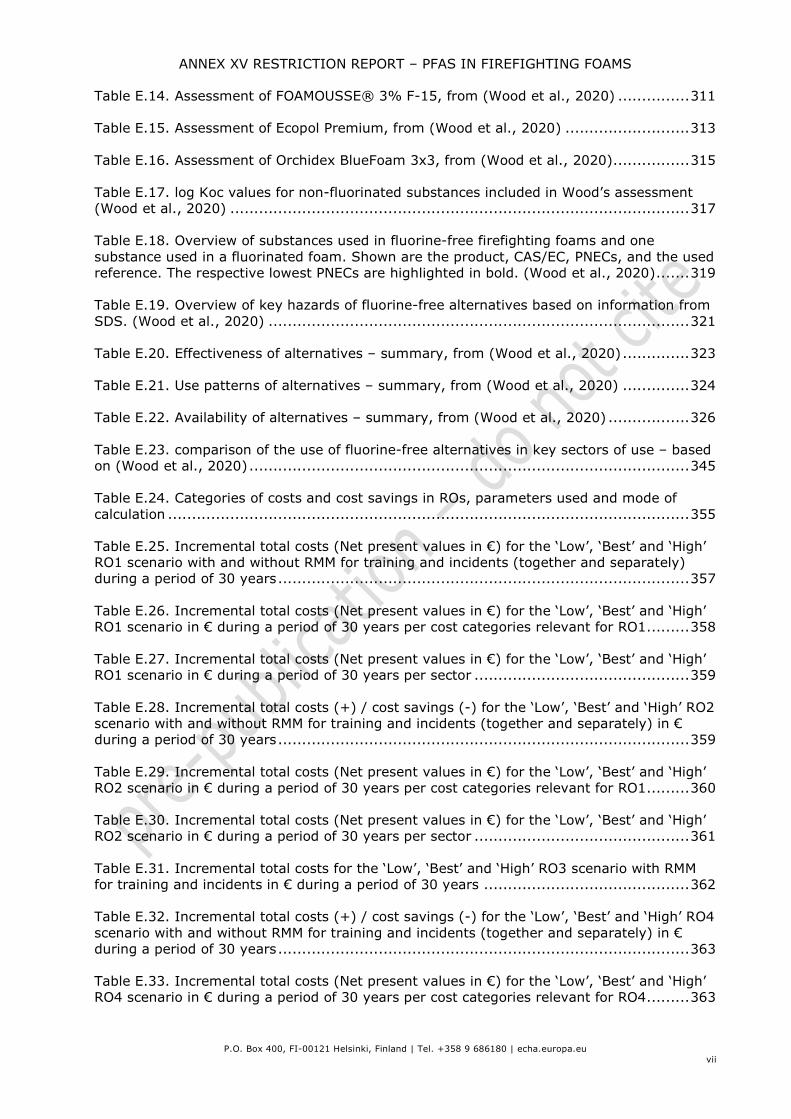
Table E.14. Assessment of FOAMOUSSE® 3% F-15, from (Wood et al., 2020) ............... 311
Table E.15. Assessment of Ecopol Premium, from (Wood et al., 2020) .......................... 313
Table E.16. Assessment of Orchidex BlueFoam 3x3, from (Wood et al., 2020) ................ 315
Table E.17. log Koc values for non-fluorinated substances included in Wood’s assessment (Wood et al., 2020) ................................................................................................ 317
Table E.18. Overview of substances used in fluorine-free firefighting foams and one substance used in a fluorinated foam. Shown are the product, CAS/EC, PNECs, and the used reference. The respective lowest PNECs are highlighted in bold. (Wood et al., 2020) ....... 319
Table E.19. Overview of key hazards of fluorine-free alternatives based on information from SDS. (Wood et al., 2020) ........................................................................................ 321
Table E.20. Effectiveness of alternatives – summary, from (Wood et al., 2020) .............. 323
Table E.21. Use patterns of alternatives – summary, from (Wood et al., 2020) .............. 324
Table E.22. Availability of alternatives – summary, from (Wood et al., 2020) ................. 326
Table E.23. comparison of the use of fluorine-free alternatives in key sectors of use – based on (Wood et al., 2020) ............................................................................................ 345
Table E.24. Categories of costs and cost savings in ROs, parameters used and mode of calculation ............................................................................................................. 355
Table E.25. Incremental total costs (Net present values in €) for the ‘Low’, ‘Best’ and ‘High’ RO1 scenario with and without RMM for training and incidents (together and separately) during a period of 30 years ...................................................................................... 357
Table E.26. Incremental total costs (Net present values in €) for the ‘Low’, ‘Best’ and ‘High’ RO1 scenario in € during a period of 30 years per cost categories relevant for RO1 ......... 358
Table E.27. Incremental total costs (Net present values in €) for the ‘Low’, ‘Best’ and ‘High’ RO1 scenario in € during a period of 30 years per sector ............................................. 359
Table E.28. Incremental total costs (+) / cost savings (-) for the ‘Low’, ‘Best’ and ‘High’ RO2 scenario with and without RMM for training and incidents (together and separately) in € during a period of 30 years ...................................................................................... 359
Table E.29. Incremental total costs (Net present values in €) for the ‘Low’, ‘Best’ and ‘High’ RO2 scenario in € during a period of 30 years per cost categories relevant for RO1 ......... 360
Table E.30. Incremental total costs (Net present values in €) for the ‘Low’, ‘Best’ and ‘High’ RO2 scenario in € during a period of 30 years per sector ............................................. 361
Table E.31. Incremental total costs for the ‘Low’, ‘Best’ and ‘High’ RO3 scenario with RMM for training and incidents in € during a period of 30 years ........................................... 362
Table E.32. Incremental total costs (+) / cost savings (-) for the ‘Low’, ‘Best’ and ‘High’ RO4 scenario with and without RMM for training and incidents (together and separately) in € during a period of 30 years ...................................................................................... 363
Table E.33. Incremental total costs (Net present values in €) for the ‘Low’, ‘Best’ and ‘High’ RO4 scenario in € during a period of 30 years per cost categories relevant for RO4 ......... 363

ANNEX XV RESTRICTION REPORT – PFAS IN FIREFIGHTING FOAMS
P.O. Box 400, FI-00121 Helsinki, Finland | Tel. +358 9 686180 | echa.europa.eu
viii
Table E.34. Incremental total costs (Net present values in €) for the ‘Low’, ‘Best’ and ‘High’ RO4 scenario in € during a period of 30 years per sector ............................................. 364
Table E.35. Incremental total costs (+) / cost savings (-) for the ‘Low’, ‘Best’ and ‘High’ RO2 scenario with and without RMM for training and incidents (together and separately) in € during a period of 30 years ...................................................................................... 365
Table E.36. Incremental total costs (Net present values in €) for the ‘Low’, ‘Best’ and ‘High’ in € during a period of 30 years per cost categories relevant for RO5 ............................ 366
Table E.37. Incremental total costs (Net present values in €) for the ‘Low’, ‘Best’ and ‘High’ RO5 scenario in € during a period of 30 years per sector ............................................. 366
Table E.38. potential cost savings from avoided disposal of expired foams ..................... 370
Table E.39. Nordic Council report case studies of PFAS contamination from AFFF use, from (Wood et al., 2020) ................................................................................................ 372
Table E.40. Typical cost per site of remediation of PFAS contamination resulting from the use of firefighting foams .......................................................................................... 374
Table E.41. Comparison between equipment cleaning procedures ................................. 381
Table E.42. Comparison of disposal techniques for PFAS-contaminated water (fire run-off and equipment cleaning), PFAS-based firefighting foams in hazardous waste incinerators (HWI) and cement kilns........................................................................................... 385
Table E.43. Additional quantitative data on economic costs .......................................... 387
Table E.44. Avoided emissions for the ‘Low’, ‘Best’ and ‘High’ RO1 scenario with and without RMM for training and incidents in t PFASs after a period of 30 years ............................. 392
Table E.45. Avoided emissions for the ‘Low’, ‘Best’ and ‘High’ emission estimate RO2 scenario with RMM for training and incidents in t PFASs after a period of 30 years .......... 395
Table E.46. Avoided emissions for the ‘Low’, ‘Best’ and ‘High’ emission estimate RO3 (with export ban) scenario with RMM for training and incidents in t PFASs after a period of 30 years and based on the parameters in section 3 “Assumptions, uncertainties and sensitivities” of the Annex XV report. ........................................................................ 398
Table E.47. Avoided emissions for the ‘Low’, ‘Best’ and ‘High’ emission estimate RO4 scenario with RMM for training and incidents in t PFASs after a period of 30 years .......... 398
Table E.48. Avoided emissions for the ‘Low’, ‘Best’ and ‘High’ emission estimate RO5 scenario with RMM for training and incidents in t PFASs after a period of 30 years .......... 401
Table E.49. avoided emissions of PFASs over 30 years per sector/use for the five ROs with RMMs under the best scenario .................................................................................. 404
Table E.50. Cost-effectiveness analysis for RO1 with RMM for training and incidents ....... 409
Table E.51. Cost-effectiveness analysis for RO1 without RMM for training and incidents... 409
Table E.52. Cost-effectiveness analysis of RMM for training and incidents as separate isolated measures for RO1 ....................................................................................... 409
Table E.53. Cost-effectiveness analysis for RO2 with RMM for training and incidents ....... 410

ANNEX XV RESTRICTION REPORT – PFAS IN FIREFIGHTING FOAMS
P.O. Box 400, FI-00121 Helsinki, Finland | Tel. +358 9 686180 | echa.europa.eu
ix
Table E.54. Cost-effectiveness analysis for RO2 without RMM for training and incidents... 410
Table E.55. Cost-effectiveness analysis of RMM for incidents as separate isolated measures ............................................................................................................................ 410
Table E.56. Incremental cost-effectiveness in €/t emissions avoided of RO2 compared to RO1 with RMMs ...................................................................................................... 411
Table E.57. Cost-effectiveness analysis for RO3 with RMM for training and incidents ....... 411
Table E.58. Incremental cost-effectiveness in €/t emissions avoided of RO3 compared to RO2 ...................................................................................................................... 411
Table E.59. Cost-effectiveness analysis for RO4 with RMM for training and incidents ....... 412
Table E.60. Cost-effectiveness analysis for RO5 with RMM for training and incidents ....... 412
FIGURES
Figure A.1. Split of the volume of PFAS-based firefighting foams by sector ....................... 4
Figure A.2. Yearly use of fluorine-free firefighting foams by sector. .................................. 9
Figure B.1. Extract of Figure 1 of OECD (2021b) illustrating examples of substances which belong or do not belong to the scope of the PFASs. See OECD 2021a for more details. ..... 14
Figure B.2. Chemical structure of Dodecafluoro-2-methylpentan-3-one, a fluorinated ketone, from (Wood et al., 2020) .......................................................................................... 27
Figure B.3. Frequency of hazard classes on the five endpoints of concern (C = Carcinogenicity, M= Mutagenicity, R = Toxicity in Reproduction, L = Lactation effects, STOT RE = specific target organ toxicity following repeated exposure). .................................. 63
Figure B.4. PFAS with self-classifications on hazardous to the aquatic environment and the ozone layer ............................................................................................................. 68
Figure B.5. Example structure: perfluorohexane. ......................................................... 72
Figure B.6. Example structure: 1,2-dichloro-1,1,2,2-tetrafluoroethane. .......................... 73
Figure B.7. Example structure: 1,1,2,2-tetrafluoro-1,2-bis(trifluoromethoxy)ethane. ....... 73
Figure B.8. Example structure: Perfluorobutanoic acid (PFBA). ...................................... 74
Figure B.9. Example structure: Perfluorobutane sulfonic acid (PFBS). ............................. 76
Figure B.10. Example structure: Perfluorohexyl phosphonic acid. ................................... 78
Figure B.11. Example structure: Perfluamine (=perfluoro(tripropyl)amine). .................... 79
Figure B.12. Examples of substances with a combination of structural elements. ............. 81
Figure B.13. Examples of fluoropolymers. ................................................................... 82
Figure B.14. Example of an n:2 fluorotelomer alcohol: 4:2 FTOH ................................... 83
Figure B.15. Proposed 6:2 FTOH biotransformation pathways in aerobic sediment system (based on Zhao et al., 2013a). .................................................................................. 84

ANNEX XV RESTRICTION REPORT – PFAS IN FIREFIGHTING FOAMS
P.O. Box 400, FI-00121 Helsinki, Finland | Tel. +358 9 686180 | echa.europa.eu
x
Figure B.16. Aerobic degradation pathways of 8:2 FTOH in soil and activated sludge (figure based on Liu and Avendano, 2013). Stable and semi-stable compounds are shown inside dashed boxes. 2H-PFOA (2H-C8-PFCA) has been proposed, but it has not been successfully validated. ............................................................................................................... 86
Figure B.17. Example of an n:2 fluorotelomer iodide: 4:2 FTI ....................................... 89
Figure B.18. Example of an ester of an n:2 FTOH: 4:2 fluorotelomer methacrylate (4:2 FTMA) .................................................................................................................... 89
Figure B.19. Example of an n:2 monoPAP/diPAP: 4:2 monoPAP ..................................... 89
Figure B.20. Example of an n:2 fluorotelomer urethane monomer: hexamethylene-1,6-di-(4:2 fluorotelomer urethane) .................................................................................... 90
Figure B.21. Example of an n:2 fluorotelomer sulfonic acid: 4:2 fluorotelomer sulfonic acid ............................................................................................................................. 90
Figure B.22. Example of an n:2 fluorotelomer thioether amido sulfonate: 4:2 FTTAoS (FTTAoSs are used in aqueous film-forming foam (AFF) formulations) ............................ 90
Figure B.23. Example of an n:2 fluorotelomer silane: triethoxy(3,3,4,4,5,5,6,6,7,7,8,8,8-tridecafluorooctyl)silane ........................................................................................... 91
Figure B.24. Example of an n:2 fluorotelomer olefin: 4:2 FTO ....................................... 91
Figure B.25. Proposed atmospheric degradation pathway for n:2 fluorotelomer olefins into PFCAs (from Nielsen, 2014) ...................................................................................... 91
Figure B.26. Example of an n:2 fluorotelomer-based side-chain fluorinated polymer: 4:2 fluorotelomer acrylate polymer .................................................................................. 92
Figure B.27. Example of an amide of a perfluoroalkyl carboxylic acid: N-ethyl-perfluoro-butyramide ............................................................................................................. 96
Figure B.28. Example of a n:1 fluorotelomer alcohol: 5:1 FTOH ..................................... 96
Figure B.29. Example of a perfluoroalkyl alcohol: perfluorohexanol ................................ 97
Figure B.30. Example of a perfluoroalkyl iodide: perfluoropentyl iodide .......................... 97
Figure B.31. Example of a perfluorinated olefin: perfluoropent-2-ene ............................. 97
Figure B.32. Mechanism for the atmospheric oxidation of perfluorobut-2-ene (from Young et al. 2009). ............................................................................................................... 98
Figure B.33. Example of a side-chain fluorinated aromatic: (Heptafluoropropyl)benzene ... 98
Figure B.34. Structural formula of flurtamone ............................................................. 99
Figure B.35. Structural formula of saflufenacil ............................................................ 100
Figure B.36. Structural formula of fluazinam .............................................................. 100
Figure B.37. Structural formulas of fluometuron (a); trifloxystrobin (b); cyflumetofen (c) 100
Figure B.38. The pharmaceutical active substances fluoxetine (a) and sitagliptine (b) and the plant protecting active substances flufenacet (c), flurtamone (d) and fluopyram (e) were

ANNEX XV RESTRICTION REPORT – PFAS IN FIREFIGHTING FOAMS
P.O. Box 400, FI-00121 Helsinki, Finland | Tel. +358 9 686180 | echa.europa.eu
xi
examined for their potential degradation to TFA in wastewater treatment plants during activated sludge treatment or upon ozonation (Scheurer et al., 2017) ........................... 101
Figure B.39. Khan and Murphy (2021) proposed the above degradation pathway for fluoxetine based on the predicted intermediates from the EAWAG Biocatalysis/Biodegradation Database and the experimental observations. Degradation products that were observed with 19F NMR and/or GC–MS analyses are shown inside dashed boxes. ........................................................................................................ 102
Figure B.40. Photolysis degradation pathways of TFM proposed by Ellis and Mabury (2000) ............................................................................................................................ 103
Figure B.41. Degradation routes of some key intermediates from F-gases. .................... 105
Figure B.42. Degradation pathway for HFO-1234ze according to Campbell et al. (2021). . 107
Figure B.43. Degradation scheme of a selection of PFSA precursors, exemplified by PFHxS precursors. ............................................................................................................ 109
Figure B.44. Oxidation processes from sulphides/thiols to the corresponding PFSA ......... 110
Figure B.45. Generic structures of PFSA precursors. R = any chemical group, n = 0 or higher. .................................................................................................................. 111
Figure B.46. Degradation pathway of 6:6 perfluoroalkyl phosphinic acid (6:6 PFPiA) ....... 111
Figure B.47. Concentrations of chemicals C (panel (i)) and D (panel (ii)) as function of time in the scenario with dynamic emissions. For both chemicals, emissions start in year 0, increase by 10 mol h-1 every year, peak in year 10 at a value of 100 mol h-1, then decrease by 10 mol h-1 every year, and end in year 20. Note the much higher levels of chemical D compared to chemical C. ......................................................................... 114
Figure B.48. Overview of PFAS fate and transport from use of firefighting foams, from (Wood E&I Solutions, 2017), in (Wood et al., 2020) .................................................... 131
Figure B.49. (provided in Burkhard 2021). Measured bioconcentration factors (BCFs) and bioaccumulation factors (BAFs) in log units from different aquatic species. .................... 145
Figure B.50. Reproduction of model for biota concentration development from Crookes and Fisk (2018). Impact of persistence on the concentration of a substance in biota in relation to bioaccumulation potential. ....................................................................................... 152
Figure B.51. Material flow diagram for the formulation phase ....................................... 259
Figure B.52. Material flow diagram for the ‘stock’ life cycle stage .................................. 260
Figure B.53. Material flow diagram for the training and incidents life cycle stages under the baseline scenario. ................................................................................................... 261
Figure B.54. Material flow diagram for the waste treatment phase. ............................... 264
Figure E.1. Chemical structure of sodium octyl sulphate, from (Wood et al., 2020) ......... 292
Figure E.2. Sugar-based siloxane as described by Hetzer et al., from (Wood et al., 2020) 298
Figure E.3. Overview of “Remediation” vs. “Clean-up” ................................................. 372
Figure E.4. Material flow diagram for the life cycle stages training and incidents, including

ANNEX XV RESTRICTION REPORT – PFAS IN FIREFIGHTING FOAMS
P.O. Box 400, FI-00121 Helsinki, Finland | Tel. +358 9 686180 | echa.europa.eu
xii
RMMs as foreseen in all the ROs. .............................................................................. 390
Figure E.5. Cumulative total emission (t PFASs) for scenario RO1 with and without RMM (all sectors, “Best” estimate scenario). ........................................................................... 393
Figure E.6. Yearly total emissions (t PFASs) with and without RMMs for scenario RO1 (all sectors, “Best” estimate scenario). ........................................................................... 394
Figure E.7. Cumulative total emission (t PFASs) for scenario RO2 with and without RMM (all sectors, “Best” estimate scenario). ........................................................................... 396
Figure E.8. Total emission (t PFASs) with and without RMMs for scenario RO2 (all sectors, “Best” estimate scenario). ....................................................................................... 397
Figure E.9. Cumulative total emission (t PFASs) for scenario RO4 with and without RMMs (all sectors, “Best” estimate scenario). ........................................................................... 400
Figure E.10. Total emission (t PFASs) with RMM for scenario RO4 (all sectors, “Best” estimate scenario). ................................................................................................. 401
Figure E.11. Total emission (t PFASs) with and without RMM for scenario RO5 (all sectors, “Best” estimate scenario). ....................................................................................... 403
Figure E.12. Total yearly emission (t PFASs) with and without RMMs for scenario RO5 (all sectors, “Best” estimate scenario). ........................................................................... 404
Figure E.13. PFAS-contents of a 1% AFFF Premix, measured using different analytical techniques. ............................................................................................................ 407

P.O. Box 400, FI-00121 Helsinki, Finland | Tel. +358 9 686180 | echa.europa.eu
1
Annex A. Manufacture and uses
A.1. Manufacture, import and export
This study focuses on the use of PFASs in firefighting foams. The available data on the use of PFASs in firefighting foams as well as the sales and uses of these foams in the EU are described in detail in the following section.
In personal communication, Eurofeu indicated that the manufacture of PFAS-based firefighting foams in the EU is similar to the sales. Hence, the quantity of PFAS-based firefighting foams manufactured in the EU is expected to be in a similar order of magnitude as the sales presented below (14 000 to 20 000 tonnes per year), while import and export are expected to represent 25% of that.
In their comment on the PFHxA restriction Annex XV dossier (FFFC, 2020), the Firefighting Foam Coalition (FFFC) indicated that there are approximately 20-25 manufacturers of class B firefighting foams in the EU, selling products all over the world, in particular Africa, Asia and the Middle East. Their sales of foam and foam equipment worldwide are estimated in the range of €120-150 million annually with foam agent sales accounting for about €60-70 million of that total and with 20 to 25% resulting from exports to non-EEA countries. According to FFFC, currently about 85-95% of their class B foam sales are fluorinated foams, whereas Eurofeu’s data shows a proportion of 68% for PFAS-containing foams and 32% fluorine-free foams.
In absence of more specific information, it is assumed that the exports in the EEA equal the imports and represent 25% of the tonnage (and associated economic value) of foam concentrates placed on the market in the EU. Taking the sales figures from Eurofeu, this would mean that exports and imports would range between 3 500 and 5 000 tonnes per year, equivalent to a range of €10.5 million to €15 million per year (taking an average price of foam concentrate of €3 000/t)1.
According to Eurofeu (Eurofeu, 2021d), several EU foam manufacturers maintain production facilities outside the EU. Therefore, a ban on the export of PFAS-based foams could affect companies differently. However, no specific numbers have been provided by Eurofeu.
According to Eurofeu, the major manufacturers are ANGUS (Eau et Feu, National Foam, Angus), Johnson Controls (TYCO, SABO Foam), Perimeter Solutions (Auxquimica, Solberg), STHAMER, BioEx, Incendin (Orchidee, Rühl, Uniteq), Fomtech, VS Focum, ProFoam, OneSeven, F500, 3F (UK), and Oiltechnic (toll manufacturer).
By desktop research 27 individual companies have been identified. It needs to be noted that the market is dominated by corporate groups, which are the result of several mergers over the last decades. The following bigger corporate groups have been identified (individual companies in brackets):
1. Johnson Controls (Chemguard, SABO Foam, ANSUL, Tyco Fire Products LP)
2. Angus International Safety Group (Angus Fire, Eau et Feu, Kerr Fire, National Foam, Oil Technics (Aberdeen Foam))
3. Perimeter Solutions LP (AUXQUIMIA, FIRE TROL, PHOS-CHEK, SOLBERG)
1 This is also in line with the figures estimated by FFFC: €60 Mio to €65 Mio of foam concentrate sales from the EU (EEA market and export) with around 90% being PFAS foams and 25% of them exported, considering 3 000€/ton would lead to 4 500 to 4 875 tonnes/year exported.

P.O. Box 400, FI-00121 Helsinki, Finland | Tel. +358 9 686180 | echa.europa.eu
2
4. Incendin/GIMV (Orchidee Europe, UNITEQ, Rühl Feuerlöschmittel GmbH)
Interviewed foam manufacturers indicated that to their knowledge all foam manufacturers have both fluorine free and PFAS-based foams in their portfolio (Angus-Interview, 2021); (Eurofeu, 2021b); (FFFC-Interview, 2021).
However, by desktop research a manufacturer from Germany, Febbex, has been identified that only sells fluorine free foams. Another manufacturer, Viking from Denmark, has been found to only sell PFAS-based foam. In October 2020, Viking Lifesaving Equipment reached a global partnership agreement with Dr. Sthamer from Germany. Perimeter Solutions plans a voluntary transition of their entire portfolio to fluorine-free foam technology.
A.2. Uses
A.2.1. Introduction
An estimation of the tonnages of fluorine-based and fluorine-free firefighting foams manufactured and placed on the market in the EU has been performed. The different functions (e.g. film-forming, surfactants, solvents) provided by different components of firefighting foams and the type of fires for which their use is recommended is also discussed. In addition, an overview of market data (and functions provided) for fluorine-free alternatives is also given, to support the analysis of alternatives and socio-economic impacts.
A.2.2. Tonnages of fluorosurfactants used in firefighting foams production
According to data provided by Eurofeu, five foam manufacturers - representing approximately 60-70 % of the EU market - purchase approximately 335 tonnes of fluorosurfactants per annum in the EU (data collected in 2018). These data include seven specific known fluoro-compounds and three unknown fluoro-compounds (see Table A.1). They are used to produce firefighting foam concentrates or liquid ready for use agents (pre-fill for fixed firefighting systems and/or portable extinguishers). An average concentration of fluorosurfactants in the foams of around 2-3% was indicated by various stakeholder responses to the consultation (Wood et al., 2020).
It should be noted that the identity of the substances with the largest tonnages was not specified in these data as the data were confidential. Based on the approximate share of the market reflected in these data, it is estimated that the total tonnage of fluorosurfactants used in firefighting foams in the EU is approximately 480-560 tonnes per year2. This is consistent with the total tonnage of PFAS-based firefighting foams estimated further below.
Table A.1. Tonnage of fluorosurfactants purchased for the production of firefighting foams by manufacturers participating in the 2018 Eurofeu survey Fluoro-compound CAS number Tonnes per
year Share of the total market
1-Propanaminium,N-(carboxymethyl)-N,N-dimethyl-3-[[(3,3,4,4,5,5,6,6,7,7,8,8,8-tridecafluorooctyl)sulfonyl]amino]-,inner salt
34455-29-3 21.1 6%
1-Propanaminium, 3-amino-N-(carboxymethyl)-N,N-dimethyl-N-[[(gamma-omega-perfluoro-C6-C16-
80475-32-7 17.2 5%
2 According to Eurofeu, the data is expected to cover 60-70% of the EU market. The total market has been estimated by dividing 335 tonnes by 70% (lower end of range) and by 60% (upper end of range), respectively.

P.O. Box 400, FI-00121 Helsinki, Finland | Tel. +358 9 686180 | echa.europa.eu
3
Fluoro-compound CAS number Tonnes per year
Share of the total market
alkyl)thio]acetyl] derives., inner salts
2-methyl-2 - [(1-oxo-3 - [(3,3,4,4,5,5,6,6,7,7,8,8,8-tridecafluorooctyl) thio] propyl) amino] -1-propanesulfonic acid, sodium salt
62880-93-7 0.5 <1%
2-hydroxy-N,N,N-trimethyl-3-[(3,3,4,4,5,5,6,6,7,7,8,8,8-tridecafluorooctyl)thio]-1-Propanaminium, chloride (1:1)
88992-45-4 0.2 <1%
2-Propenamide, telomer with 4-[(3,3,4,4,5,5,6,6,7,7,8,8,8-tridecafluorooctyl)thio]-1-butanethiol )
unknown 0.2 <1%
2-Propenoic acid, telomer with 2-propenamide and 4-[(3,3,4,4,5,5,6,6,7,7,8,8,8-tridecafluorooctyl)thio]-1-butanethiol, sodium salt
unknown 0.3 <1%
2-Propenamide, telomer with 3,3,4,4,5,5,6,6,7,7,8,8,8-tridecafluoro-1-octanethiol
76830-12-1 0.9 <1%
unknown C-6 fluorinated substances unknown 17.1 5%
unknown 1 unknown 138.6 41%
unknown 2 unknown 138.6 41%
Total (2018 Eurofeu survey) 335
Total EU market (extrapolated) 480-560 [1]
Source: (Wood et al., 2020), based on data provided to the authors by Eurofeu. Notes: Substances marked as unknown have not been revealed by the individual manufacturers to preserve commercially sensitive information. [1] According to Eurofeu, the data is expected to cover 60-70% of the EU market. The total market has been estimated by dividing 335 tonnes by 70% (lower end of range) and by 60% (upper end of range), respectively. Results were rounded to two significant figures.
A.2.3. PFAS-based firefighting foams
A.2.3.1. Sales of firefighting foams by user sector
Eurofeu also provided figures on the yearly sales of PFAS-based firefighting foams to various user sectors in Europe, based on a 3-year average (2016-2018). Six Eurofeu member companies3 have provided data. In total, they sell 13 669 tonnes of PFAS-based firefighting foams per year. Of these, an estimated 8 200 tonnes are employed in fixed systems and
3 Dr. STHAMER Hamburg, Auxquimia (Perimeter Solutions), Solberg Scandinavia, Dafo Fomtec, Orchidee, Johnson Controls (aka Tyco)

P.O. Box 400, FI-00121 Helsinki, Finland | Tel. +358 9 686180 | echa.europa.eu
4
5 500 tonnes in mobile systems4. The split of the volume by sector is detailed in Figure A.1 below. This shows that chemical/petrochemical is by far the largest user sector (59%), but municipal fire brigades, marine applications, airports and defence applications also account for significant volumes5. Ready for use products only account for a very small share of the volume of PFAS-based foams according to this data. The main category are fire extinguishers and some stakeholders have suggested that the number of fire extinguishers using PFAS-based foams could be significant. An estimate is provided in the following sub-section.
Figure A.1. Split of the volume of PFAS-based firefighting foams by sector Source: (Wood et al., 2020) based on data provided to the authors by Eurofeu.
Eurofeu estimate that the data they provided based on an internal survey covers roughly 70% of the EU market. It is therefore estimated that the total annual EU use of PFAS-based firefighting foams could be in the order of 20 thousand tonnes6.
Eurofeu’s data on sales per sector of use does not specify which proportion of the foam volume sold to the chemical/petrochemical sector would be for Seveso establishment as this piece of information is not available to Eurofeu. In absence of specific information, for the emissions and cost calculations, the Dossier Submitter assumes that 98% of the volume sold to the chemical/petrochemical sector would be for Seveso establishments and the remaining 2% for other sites not covered by the Seveso Directive (offshore oil/gas/chemical facilities and minor
4 The number of companies that provided a response on whether the foams are used in fixed or mobile systems is lower than those that provided a response for the sectoral overview, therefore in the original data the total tonnage of the former is lower than the latter. To fill this gap, the tonnages for both fixed and mobile systems have been inflated so that their total matches the total in the sectoral split. The original values were 5 010 tonnes for fixed systems and 3 350 tonnes for mobile systems (total 8 360 tonnes).
5 According to personal communication with Eurofeu, there is some uncertainty in the data available to foam manufacturers about the precise distinction between user sectors. This is because although certain products may be marketed primarily for a specific user sector, it is not always known to whom the products are ultimately sold through traders and vending companies, and what they ultimately use it for (particularly for large users active across several sectors). Generally, “chemical/petrochemical” is expected to include offshore oil and gas platforms (in addition to refineries and other facilities storing, processing or transporting flammable liquids), while “marine applications” refers to the shipping industry (Eurofeu indicated that there is not always a clear distinction between land-based systems/uses in harbours and sea going vessels and that generally, a harbour use would in most cases be considered as non-marine). However, due to the above uncertainty some of the tonnage for marine applications may also reflect use in offshore oil and gas platforms as well as use in harbours. 6 Calculated as 13 669 tonnes divided by 70% and rounded to the closest thousand tonne.

P.O. Box 400, FI-00121 Helsinki, Finland | Tel. +358 9 686180 | echa.europa.eu
5
users such as power plants, glass manufacturers, waste treatment facilities, food processing industry, metal processing, etc.). These proportions have been considered plausible by Eurofeu.
A.2.3.2. Estimate of use in fire extinguishers
Wood et al. (2020) identified three different sources for the number of fire extinguishers using PFAS-based firefighting foam that are in service in the EU, ranging from 15 million (Eurofeu, 2019a) to 90 million (extrapolation from German data). Considering that the latter number is a high-level estimate based on extrapolation from German data and expert judgement, Eurofeu’s estimate of 15 million fire extinguishers is likely more accurate and is taken forward by the Dossier Submitter in this assessment.
Based on Eurofeu data, it was estimated that the total annual use of PFAS-based firefighting foams in the EU is at least 14 000 tonnes but it could be up to around 20 000 tonnes. Figure A.1 (also based on Eurofeu data) estimates the share of ready-for-use products at 1%, so the annual tonnage of ready-for-use products is around 140-200 tonnes7.
A.2.3.3. Other information on tonnages from the consultation
The following additional information on tonnages was provided in the consultation:
Additional firefighting foam manufacturers (not covered by Eurofeu’s internal survey) provided figures for three different products they manufacture where the PFAS Carboxymethyldimethyl-3-[[(3,3,4,4,5,5,6,6,7,7,8,8,8-tridecafluorooctyl)sulphonyl]amino]propylammonium hydroxide (CAS number 34455-29-3) and 6:2 FTS are used (i.e. all three products use both substances combined). The three products are employed in different sectors:
o The first is used by the respondents’ customers in airport and marine applications. Of this foam, 700 000 litres are manufactured/imported and 200 000 litres are sold in the EU every year.
o The second is used in oil and gas, marine, chemistry and municipal firefighting applications. 450 000 litres of this product are manufactured/imported in the EU and 250 000 litres are sold every year in the EU.
o The third product is used in the oil and gas and marine sectors. 250 000 litres of this foam are manufactured/imported and 100 000 litres are sold every year in the EU.
o These volumes are additional to the Eurofeu data presented above. The three foams in sum account for 550 000 litres of annual sales in the EU. Assuming a density of approximately 1kg/liter, this would be equivalent to about 550 tonnes of foam that can be added to the Eurofeu total (but would already be included in the EU total extrapolated from Eurofeu data). However, given that the exact sector split is not known, they have not been added to the sector breakdown.
One respondent operating in the field of industrial safety, in particular dedicated to technical support and training, stated that they manufacture 5 000 litres per year of a foam containing a C6 fluorine compound, which is used only for training purposes. As above, this is additional to the Eurofeu data, but has not directly been added because the tonnage or density is not known,
7 Calculated by multiplying the total tonnage of firefighting foams (14 000-20 000 tonnes) with the share of ready for use products (1%).

P.O. Box 400, FI-00121 Helsinki, Finland | Tel. +358 9 686180 | echa.europa.eu
6
One respondent operating in the oil and gas sector provided figures for four firefighting foams they purchase; two of these contain poly(1,1,2,2-tetrafluoro-1,2-ethanediyl),alpha fluoro-omega-2-(3-((caboxylatomethyl)dimetylammonoi)propylaminosulfonyl)ethyl, whereas the other two contain different PFAS that have not been specified:
o The two products containing poly(1,1,2,2-tetrafluoro-1,2-ethanediyl),alpha fluoro-omega-2-(3-((caboxylatomethyl)dimetylammonoi)propylaminosulfonyl)ethyl are used in the offshore oilrig and refinery sectors for spills8, accidents and function tests in process plant fires and trainings. They purchase less than 5 tonnes per year of each of these foams and employ less than 5 tonnes in each instance of use.
o The third product is used in the offshore oil and refinery sectors in cases of spills, accidents and function tests in alcohol fires. Similar to the previous, less than 5 tonnes are bought every year and less than 5 tonnes are employed in each instance of use.
o A volume between 30 tonnes and 70 tonnes of a fourth product is purchased every year by the respondent, but no other details have been provided regarding the use of this foam.
One respondent operating in industrial safety for the oil refineries, chemicals and petrochemicals sectors provided figures for one foam based on the C6 fluorine compound, which is used for training exercises on large hydrocarbon fires. They purchase 5 tonnes per year of this product and typically employ it 100 days a year.
Another respondent operating in the oil refineries, chemicals and petrochemicals sectors provided figures for one product they purchase, which can be used for almost all class B fires. They purchase between 20 and 60 tonnes per year of this foam and in 75% of cases fires are extinguished with less than 400 litres of foam concentrate.
Respondents quoted prices for PFAS-based firefighting foams in the range from €2 to €30 per litre of concentrates. For those PFAS based firefighting foams for which data on tonnage and price is available, the weighted average price is around €3 per litre, but note that these products reflect only a small share of the total market, so this estimate is uncertain. Some consultation responses suggest that, generally speaking, foams providing a higher performance often contain a higher concentration of PFAS which is associated with a higher cost.
A.2.3.4. Number of sites using firefighting foams
No detailed data on the number of sites using firefighting foams (PFAS-based or fluorine-free) was available. However, to estimate the order of magnitude of user sites, the total number of sites in some of the main user sectors can be considered:
Oil/chemicals/petrochemicals: There are around 12 000 establishments covered under the EU’s Seveso III Directive (European Commission, 2021). One of the main accident scenarios linked to most Seveso-regulated substances is related to fires. According to the Commission’s report, among the activities used to categorise Seveso establishments, four account for almost 45% of establishments:
8 AFFF are in some cases also used as prevention in spills that have not (yet) caught fire. See for instance: https://www.nrl.navy.mil/accomplishments/materials/aqueous-film-foam

P.O. Box 400, FI-00121 Helsinki, Finland | Tel. +358 9 686180 | echa.europa.eu
7
(1) General chemicals production and distribution (1 850 establishments representing 15.1%);
(2) Power generation, supply and distribution (1 606 establishments representing 13.2%);
(3) Fuel storage (1 190 establishments representing 9.8%); and
(4) Wholesale and retail (930 establishments representing 7.6%).
According to Eurofeu, around 1 166 tank terminal facilities operate in the EU (Eurofeu, 2020a).
In the cost calculations, 10 000 of these Seveso establishments are assumed to be affected by the restriction.
‘Other industries’: In the absence of specific information, 1 000 sites are assumed for other industries (offshore oil/gas/chemical facilities and minor users such as power plants, glass manufacturers, waste treatment facilities, food processing industry, metal processing, etc.).
‘Marine applications’: Europe’s maritime traffic is responsible for some 15 000 seagoing vessels9.
Airports: There are 401 commercial airports in the EU-2810, many of which will have multiple firefighting foam storages/use equipment.
Municipal fire brigades: There are over 50 000 public fire brigades in the EU, excluding those covering airports and private brigades covering industrial risks11.
Defence: In the European Economic Area, there are about 239 military airbases.
Based on the above, there are likely to be several tens of thousands of facilities using (or at least possessing) firefighting foams. In addition, there are likely many other sites possessing fire extinguishers using firefighting foams.
A.2.3.5. Conclusions of the market analysis for PFAS-based firefighting foams
In conclusion, based on information provided by Eurofeu and additional manufacturers, it has been estimated that at least 14 000 tonnes, but probably around 20 000 tonnes of PFAS-based firefighting foams are sold in the EU annually. The main application is the oil/chemical and petrochemical industry, which employs 59% of these foams. This is followed by municipal fire brigades, marine applications, airports and the defence sector. The foams are used in fire incidents, spills, tests and training exercises.
There are likely several tens or potentially hundreds of thousands of facilities using (or at least possessing) firefighting foams, not counting those only using fire extinguishers. Prices for PFAS based firefighting foams range from €2 to €30 per litre for concentrates, with the average estimated at around €3 per litre (subject to significant uncertainty).
9 In early 2019, the total world fleet stood at 95 402 ships. Europe accounted for 16% of container port traffic (as a proxy for the share of global vessels relevant to Europe). Source: UNCTAD Review of Maritime Transport 2019. Available at https://unctad.org/en/PublicationsLibrary/rmt2019_en.pdf. In terms of ports, over 1 200 commercial seaports operate in the EU (European Commission (2013): Europe's Seaports 2030: Challenges Ahead. Available at: https://ec.europa.eu/commission/presscorner/detail/en/MEMO_13_448). However, seaports are generally not considered as part of the marine applications in the present report. 10 Eurostat: Number of commercial airports (with more than 15 000 passenger units per year) [avia_if_arp], Data for 2017. 11 FEU statistics, https://www.f-e-u.org/career2.php

P.O. Box 400, FI-00121 Helsinki, Finland | Tel. +358 9 686180 | echa.europa.eu
8
A.2.3.6. Functions provided in the foams and types of fires the foams are used for
According to the consultation, the PFAS-based firefighting foams find application in a broad range of sectors, such as aviation, marine, oil and gas, offshore oil, refineries, chemicals and railways12.
The main function of the PFAS contained in the foam is to act as a surfactant, i.e. to form a film over the burning liquid surface in order to prevent flammable gases from being released from it. Different types of PFAS foams are available on the market, mainly: “Aqueous Film Forming Foam” (AFFF) which form an aqueous film on the surface of the flammable liquid by the foam solution as it drains from the foam blanket; “Alcohol Resistant-Aqueous Film Forming Foam” (AR-AFFF) which are resistant to polar solvent and alcohol liquids; fluoroprotein foam concentrates and film forming fluoro-protein (FFFP)13. AFFF foams generate an aqueous film, i.e. a thin layer of water floating on top of the lighter non-water miscible liquid14, which is a key feature provided by fluorosurfactants. The stable foam blanket formed enables the sealing of the flammable liquid surface, impeding the release of flammable gasses with the ambient air. PFAS surfactants in the firefighting foams also prevent the emulsification of the hydrocarbon liquid with the foam, even for water-miscible hydrocarbon liquids such as alcohols, avoiding therefore the risk of fuel pick-up, which would alter the foam structure and make it flammable. AFFF have been considered very effective and also very forgiving with respect to application, proportioning and foam expansion. They allow the use of specific techniques such as sub-surface injection in non‐water miscible flammable liquids, application at very low expansion ratios (e.g. delivered by sprinklers, hollow‐jet nozzles, non‐aspirated hand lines and monitors) or forceful applications. Overall, AFFF made firefighting foams are easy to use at a very high level of reliability and performance (Eurofeu, 2019a).
These features are particularly relevant that enable applications in industrial fires - for example tank fires, where large quantities of flammable liquid are stored. They are used for training purposes and in a variety of fire incidents, from small fires to the above-mentioned large tank fires, and can be applied both with mobile and stationary equipment.
According to Eurofeu (Eurofeu, 2019a), AFFF are still amongst the first-choice agents for scenarios where the foam needs to be applied over certain distance (vertical and/or horizontal) onto liquid fuel having a certain depth (like large tank farms of flammable liquids). On fires of shallow fuel spills, emulsification does not play a major role in overall fire performance of the foam agent because there is not enough fuel depth for the foam to sink in. These fires (e.g. damaged cars or even road tankers) likely may not require an AFFF. Similarly, still according to Eurofeu, municipal firefighting, fires of solid combustibles (so called “Class A‐fires”) and fires of melting fuels (solid materials becoming liquid due to heat, such as plastics, fats and waxes) do not require AFFF, the latter fire risks being able to be addressed with modern high-performing fluorine-free foam agents.
12 A respondent responsible for railway maintenance stated that PFAS-based foams are used in railways; the use of firefighting foams is particularly relevant for fire-protection in railway tunnels. The reason is that railways can carry various chemicals and other dangerous goods and, if they catch fire in tunnels, it is particularly critical and fires can be much more difficult to extinguish.
13 https://www.chemguard.com/about-us/documents-library/foam-info/general.htm
14 Water has a higher specific gravity compared to most hydrocarbon liquids, hence sinks if applied onto them.

P.O. Box 400, FI-00121 Helsinki, Finland | Tel. +358 9 686180 | echa.europa.eu
9
A.2.4. Fluorine-free alternatives
A.2.4.1. Sales of firefighting foams by user sector
Consultation with Eurofeu provided figures on the yearly consumption of fluorine-free firefighting foams in various sectors in Europe, based on a 3-year average (2016-2018), highlighting a total use of 6 553 tonnes per year. Of these 6 553 tonnes, 2 134 are utilised in fixed systems and 4 418 in mobile systems15. The split by sector is detailed in Figure A.2 below. Notably, it varies considerably from that of PFAS-based foams, with a much larger share used by municipal fire brigades but a much smaller share in the chemical/petrochemical sectors.
Figure A.2. Yearly use of fluorine-free firefighting foams by sector. Source: (Wood et al., 2020). Data provided to the authors by Eurofeu. Notes: The majority of the ‘ready for use products’ are fire extinguishers. However, not all foam fire extinguishers use ready-for-use foams.
Eurofeu estimate that the data they provided based on an internal survey covers roughly 70% of the EU market. It is therefore estimated that the total EU use of fluorine-free firefighting foams could be in the order of 9 000 tonnes.
A.2.4.2. Other information on tonnages from the consultation
The following information on tonnages was provided in the consultation. Information on which chemical group of alternatives (based on the grouping established in the substance identification, see Section B.1) is also listed.
Additional firefighting foam manufacturers (not covered by Eurofeu’s internal survey) stated that they manufacture/import a total of 1 250 000 litres and sell
15 The number of companies that provided a response on whether the foams are used in fixed or mobile systems is lower than those that provided a response for the sectoral overview, therefore in the original data the total tonnage of the former is lower than the latter. To fill this gap, the tonnages for both fixed and mobile systems have been inflated so that their total matches the total in the sectoral split. The original values are 1 259 tonnes for fixed systems and 2 605 tonnes for mobile systems (total 3 864 tonnes).

P.O. Box 400, FI-00121 Helsinki, Finland | Tel. +358 9 686180 | echa.europa.eu
10
380 000 litres of PFAS-free foams (based on hydrocarbon surfactants) per year in the EU. Assuming a density of approximately 1 kg/liter, this would be equivalent to about 380 tonnes of foam that can be added to the Eurofeu total (but would already be included in the EU total extrapolated from Eurofeu data). However, given the exact sector split is not known, they have not been added to the sector breakdown.
One respondent operating in fire protection for oil refineries/storage, chemicals, petrochemicals and municipalities provided figures for three types of fluorine-free foams (chemical groups of alternatives unknown) used for different purposes:
o The first is used by the respondent for exercise and testing of fixed systems (i.e. not for firefighting), about 12-20 times per year at 300-10 000 kg per use. They purchase 15 000-30 000 kg of this foam per year.
o The second is used by the respondent for testing of proportioning systems (i.e. not for firefighting), typically 4-6 times per year, with 1 000-6 000 kg used in each instance. They purchase 10 000 kg of this product per year.
o The third was due to start testing in autumn 2019, therefore they did not yet have any experience on real fires with this foam. It is expected that this product will be used about 50 times per year, with 1-400 kg used in each instance.
One respondent operating in the field of industrial safety, particularly dedicated to technical support and training, provided figures for two different fluorine-free foams, both used for training purposes:
o The first (a product shown to contain detergents according to the substance identification task) is used by the respondent for hydrocarbon fires in the oil and gas sector, with a typical frequency of 150 days per year. They purchase 4 000 kg of this product per year.
o The second (chemical group of alternatives unknown) is used by the respondent for alcohol fires, about 30 days a year. They purchase 1 000 kg of this foam per year.
One respondent providing training in the safety sector gave figures for one type of fluorine-free foam (a product shown to contain detergents according to the substance identification task). This is used only for training purposes on fires of different sizes and in various sectors, such as airports, oil and gas and marine. They purchase 1 200 kg of this product a year and typically use it around 4 hours per week, depending on the training activity.
One respondent active in the airport sector provided figures for one fluorine-free foam (a product shown to contain hydrocarbon surfactants and detergents according to the substance identification task), which is used for all aircraft applications and training activities. They purchase 3 600 litres of this foam a year. Approximately 300 litres are used each month, with a typical use of 15 minutes per month.
Another respondent working in the airport sector stated that they purchase 5 000 litres per year of a fluorine-free foam (chemical group of alternatives unknown), which is used only for training and system testing.
Additional respondents have stated they use fluorine-free foams based on hydrocarbon surfactants and detergents in aviation, offshore oil installations and onshore terminals and refineries, without specifying quantities.
Respondents quoted prices for fluorine-free foams ranging from €0.7 to €10 per litre. For those fluorine-free firefighting foams for which data on the tonnage and price is available, the weighted average price is around €3 per litre, but note that these products reflect only a small share of the total market, so this estimate is uncertain. Although the range is lower and the

P.O. Box 400, FI-00121 Helsinki, Finland | Tel. +358 9 686180 | echa.europa.eu
11
average is similar to prices of PFAS-based foams (see above), some respondents suggested that fluorine-free foams are around 50% more expensive than comparable foams containing fluorine. However, fluorine-free foams are still predicted to have a growing presence on the market, due to increasing regulations/controls on firefighting training and testing.
A.2.4.3. Conclusions of the market analysis for fluorine-free alternatives
Based on information provided by Eurofeu and additional manufacturers, it has been estimated that at least some 7 000 tonnes, but probably around 9 000 tonnes of fluorine-free firefighting foams are sold in the EU annually.
A breakdown by chemical group of alternatives (based on the grouping established in the substance identification) is not available, but consultation responses suggest that the main alternatives used are based on hydrocarbon surfactants and detergents.
The split by sector of use varies considerably from that of PFAS-based foams, with a much larger share used by municipal fire brigades but a much smaller share in the chemical/petrochemical sectors.
Prices for fluorine-free foams range from €0.7 to €10 per litre, with the average estimated around €3 per litre (subject to significant uncertainty).
A.2.4.4. Functions provided in the foams and types of fires the foams are used for
The fluorine-free firefighting foams considered in this analysis are specifically those that can potentially be used as alternatives to the PFAS-based foams. As such, they are potentially used in the same applications. The consultation responses specifically indicated that fluorine-free alternatives are currently used for training, process fires, alcohol fires and fuel fires, as well as for testing proportioning systems and are applied both with fixed and mobile equipment. The areas of applications of the alternative products have been analysed in more detail in the analysis of alternatives (see Section E.2.).
The substance identification (Section E.2) identified the following groups of substances that PFAS-free firefighting foams are based on: hydrocarbons, siloxanes, protein foams, and detergents. All of these groups largely mimic the function of fluoro-surfactants in the PFAS-based firefighting foams. For instance hydrocarbon foams use hydrocarbon surfactants16, siloxanes are also primarily used in firefighting foams to function as surfactants17 and detergents are by definition surfactants.
A.3. Uses advised against by the registrants
The analysis in this Annex XV dossier is based on substances that have been identified as being used in firefighting foams.
No review of registration dossiers for all of the potentially relevant PFAS substances has been undertaken in terms of identifying any specific uses that are advised against by the registrants.
16 See for example: https://www.fomtec.com/fluorine-free/category38.html or https://www.chemguard.com/about-us/documents-library/documents/Martin2009ReebokEcoguardpresentation2010-10-11.pdf.
17 See for example: https://www.nfpa.org/-/media/Files/News-and-Research/Resources/Research-Foundation/Symposia/2016-SUPDET/2016-Papers/SUPDET2016Hetzer.ashx?la=en.

P.O. Box 400, FI-00121 Helsinki, Finland | Tel. +358 9 686180 | echa.europa.eu
12

P.O. Box 400, FI-00121 Helsinki, Finland | Tel. +358 9 686180 | echa.europa.eu
13
Annex B. Information on hazard and risk
B.1. Identity of the substance(s) and physical and chemical properties
An identification of the PFAS substances (including long- and short-chain, their salts and precursors, intentionally used or as impurities) present in firefighting foams and any non-PFAS fluorinated alternatives (if they exist) has been conducted. The constituents of the fluorine-free firefighting foams is described under section E.2. on alternatives. Most of the results have been reported in (Wood et al., 2020) and are described below.
The substance identification was based on desktop research covering:
Literature research based on:
o Scientific peer reviewed literature (pubmed, google scholar);
o Reports or other publications by national and regional environmental agencies; and
o Reports or other publications by NGOs.
Information gathered in the framework of regulations:
o REACH (for example RMOAs, Annex XV restriction reports, RAC & SEAC documents of PFAS substances);
o Stockholm convention (for example risk management evaluation, AoA reports, technical paper on the identification and assessment of alternatives); and
o Basel convention(technical guidelines).
Safety Data Sheets ((M)SDS) and any other information of known producers/associations;
Environmental and human (bio-)monitoring data and case studies; and
Expert knowledge (international experts).
In general, all the above documents were screened by using the following search terms: fire, foam, fluor and/or alternative. More specifically, in case the documents covered the analysis of alternatives (e.g. documents by REACH, Stockholm and NGOs) the documents were screened using the search terms fire and foam. This strategy was also undertaken in the screening of more general reports, for example those reports that cover PFAS in general. These kinds of reports were mostly published by environmental agencies.
In cases where analytical measurements were reported (case studies, (bio-) monitoring and scientific publications) it was made sure, that an unambiguous assignment to the usage of firefighting foam could be made. Only in cases where this was possible, the respective data was extracted.
A different strategy was elaborated for (M)SDS, in this case only the term “fluor” was used.
More detail about the specific search terms applied and the specific documents screened is provided alongside the results in the following sub-sections.

P.O. Box 400, FI-00121 Helsinki, Finland | Tel. +358 9 686180 | echa.europa.eu
14
B.1.1. Name and other identifiers of the substance(s)
B.1.1.1. Substance identification - PFAS
Per- and polyfluoroalkyl substances (PFASs) are a class of synthetic compounds that have attracted much public attention since the late 1990s and early 2000s, when the hazards and ubiquitous occurrence in the environment of two PFASs, perfluorooctanoic acid (PFOA) and perfluorooctane sulfonic acid (PFOS), started to be reported and recognized. Early communications used many different terminologies for what nowadays are called PFASs (e.g. per- and polyfluorinated chemicals, perfluorinated organics, perfluorochemical surfactants, highly fluorinated compounds).
It is noted, that although the definition of PFASs historically encompasses both per- and polyfluoroalkyl substances, the polyfluoroalkyl substances belong to the scope of PFASs only when containing also at least one perfluorinated moiety (one fully fluorinated methyl or methylene group) and hence can also be called perfluoroalkyl substances. Polyfluoroalkyl substances which only contain partially fluorinated carbon atoms are not within the scope of the restriction proposal. OECD (2021a,b) provide example structures of included and excluded substances (see Figure B.1 below).
Figure B.1. Extract of Figure 1 of OECD (2021b) illustrating examples of

P.O. Box 400, FI-00121 Helsinki, Finland | Tel. +358 9 686180 | echa.europa.eu
15
substances which belong or do not belong to the scope of the PFASs. See OECD 2021a for more details.
B.1.1.2. PFASs and other organofluorine substances in firefighting foams
To identify any potential non-PFAS fluorinated substances used in firefighting foams, a literature research in PubMed and Google Scholar was undertaken, using the following search terms:
(("substance" OR "chemical" OR “compound”)) AND ("fire fighting foam" OR firefighting "fire fighting")
As of April 2019, the PubMed search returned 53 results. However, the relevant results covered only poly- and perfluorinated compounds. The same result was found using Google Scholar.
Safety data sheets (SDS)/supplier information, monitoring data, Environmental Protection Agencies (EPAs), NGOs, case studies and legislation were also screened for information on non-PFAS fluorinated substances (simultaneously with the screenings for information on the substance identity of PFAS- and fluorine free-chemicals, discussed below).
No non-PFAS fluorinated substances that are used in firefighting foams were identified in this way.
In conclusion, the analysis suggests that fluorinated non-PFAS alternatives in the area of firefighting foams do not exist. This was confirmed in a personal communication with Zhanyun Wang (ETH Zürich), an international expert on PFAS chemicals. It was also discussed and not disputed at the September 2019 stakeholders workshop organised by ECHA.
Generally, most information on PFAS in firefighting foams was found in the scientific literature. This is partially due to the fact that SDS and other supplier information only indicate general terms like “fluorinated surfactant” without naming a CAS number and/or referring to proprietary information. EPAs mostly also cite scientific literature, so this information overlaps with substances already identified in the review of the scientific literature. This is also true for information from legislation (REACH, Stockholm, Basel Convention).
When searching PubMed and Google Scholar, the following search terms were used:
("fluorochemical*" OR "per- and polyfluoroalkyl" OR "perfluoroalkyl" OR "polyfluoralkyl" OR "fluorinated" OR "PFAS") AND ("fire fighting" OR "airport" OR "fire")
As of April 2019, this search yielded 86 results. The thus identified publications were to a large extent highly relevant, and the substance details were extracted into Excel sheets for use in the following working steps.
An additional source of information is case studies and monitoring activities. However, these are considered to be of less importance because only a very limited number of PFAS substances was covered. Additionally, where environmental/human samples are considered, for fluorinated foams, also environmental and biological degradation processes need to be considered.
It was not possible to associate a CAS/EC number with most of the substances identified in the scientific literature. A CAS/EC number was identified for 63 substances, while around 213 were only identified by substance name/structure. This lack of unequivocal identifiers may be due to the fact that those substances were described for the first time by the respective author or were perhaps polymeric substances that do not necessarily have CAS numbers. In general, these numbers might also indicate that a lot of currently poorly known substances are used.
The following information relates only to those substances that were fully identified in terms of CAS/EC, substance name and/or acronym.

P.O. Box 400, FI-00121 Helsinki, Finland | Tel. +358 9 686180 | echa.europa.eu
16
Based on the CAS-identified PFAS-substances that were/are used in firefighting foams the following grouping is possible (the number of substances found is indicated in brackets):
Unsubstituted long-chain PFAS (14),
Unsubstituted short-chain PFAS (8),
Substituted short- and long-chain PFAS (12),
Fluorotelomers (22), and
Others (7).
These PFAS groups are described in OECD (2021a) and (Buck et al., 2011). See also the glossary for explanation of individual substance names. One author highlights that PFCAs were primary components in early 3M AFFFs from 1965 up to 1986 (Barzen-Hanson and Field, 2015).
The following subsections provide the detailed list of substances found and the related trademarks.

P.O. Box 400, FI-00121 Helsinki, Finland | Tel. +358 9 686180 | echa.europa.eu
17
B.1.1.2.1. PFSAs and PFCAs
Table B.1. PFSAs (identified by CAS) with ≥C6 incl. CAS/EC identifier, the designation, the acronym and the supplier and/or product name, from (Wood et al., 2020) CAS EC Designation
(synonyms) Acronym Supplier and Product Name
355-46-4
206-587-1
Perfluorohexane sulfonic acid
PFHxS Ansul AFFF Ansulite® 3M LightWater Angus Fire, na Angus Fire, 2000 ; Niagara 1-3, Angus Fire, 1997; Forexpan Angus Fire, 2007; Hi Combat A ™ 3M, 2005; ATC-603 Light water ATC3 3M, 1999; FC-203FC Light water Brand AFFF 3M 1999 3M 1992 3M 1993 3M 1998 (slightly different shares) 3M 1989 3M 1988
375-92-8
206-800-8
perfluoroheptane sulfonic acid
PFHpS 3M 1992 3M 1993 3M 1998 (slightly different shares) 3M 1989 3M 1988
1763-23-1
217-179-8
Perfluorooctanesulfonic acid
PFOS 3M AFFF ("PFSAs have been components of 3M AFFF from the 1970s to 2001") 3M LightWater FC-203FC 3M, 2005; ATC-603 Light water ATC3 3M, 1999; FC-203FC Light water Brand AFFF 3M 1992 3M 1993 3M 1998 (slightly different shares) 3M 1988 3M 1989 Ansul Ansulite® AFFF Angus Fire, na Angus Fire, 2000 ; Niagara 1-3, Angus Fire, 1997; Forexpan Angus Fire, 2007; Hi Combat A ™ Hazard Control Technologies, Inc., 2003 F-500 Dr. Sthamer STHMEX-AFFF 3%
68259-12-1
N/a Perfluoronone sulfonic acid
PFNS 3 M Lightwater PFSAs have been components of 3M AFFF from the 1970s to 2001
335-77-3
206-401-9
Perfluorodecanesulfonic acid
PFDS 3M Ansul AFFF Angus Fire, N/a Fomtec MB 5
749786-16-1
N/a Perfluoroundecan sulfonic acid
PFUnDS No product/supplier is mentioned; Publications are based on environmental samples
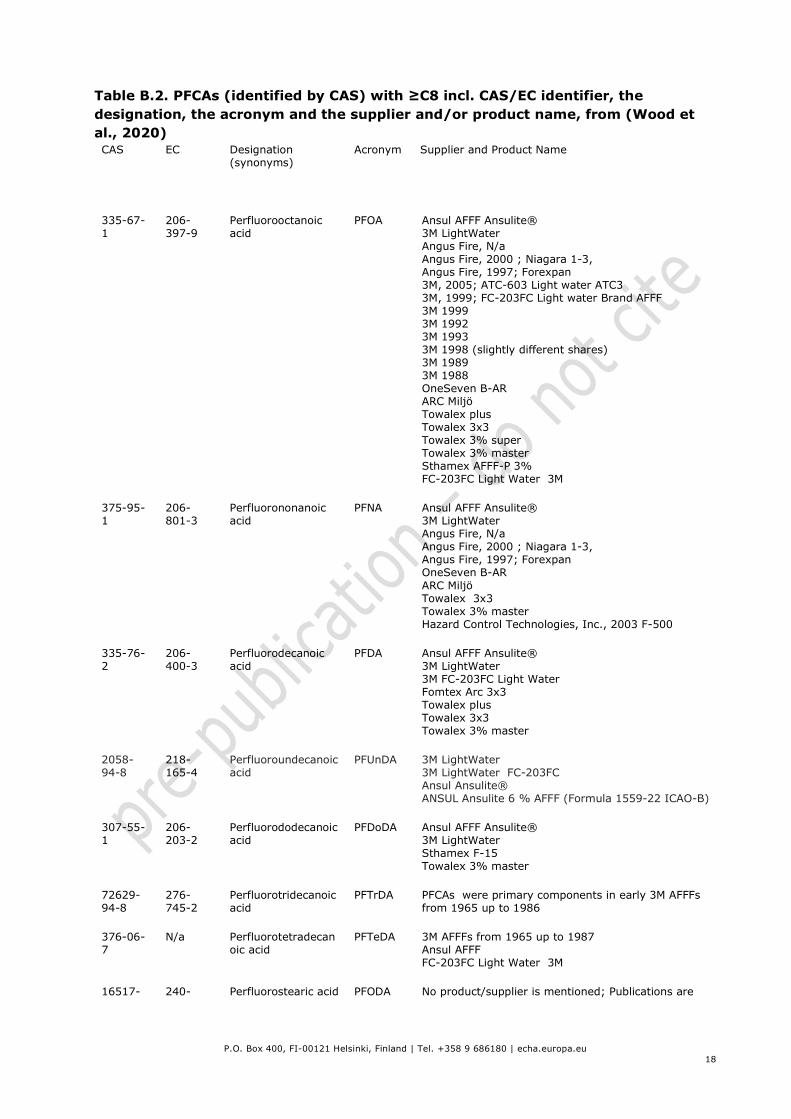
P.O. Box 400, FI-00121 Helsinki, Finland | Tel. +358 9 686180 | echa.europa.eu
18
Table B.2. PFCAs (identified by CAS) with ≥C8 incl. CAS/EC identifier, the designation, the acronym and the supplier and/or product name, from (Wood et al., 2020) CAS EC Designation
(synonyms) Acronym Supplier and Product Name
335-67-1
206-397-9
Perfluorooctanoic acid
PFOA Ansul AFFF Ansulite® 3M LightWater Angus Fire, N/a Angus Fire, 2000 ; Niagara 1-3, Angus Fire, 1997; Forexpan 3M, 2005; ATC-603 Light water ATC3 3M, 1999; FC-203FC Light water Brand AFFF 3M 1999 3M 1992 3M 1993 3M 1998 (slightly different shares) 3M 1989 3M 1988 OneSeven B-AR ARC Miljö Towalex plus Towalex 3x3 Towalex 3% super Towalex 3% master Sthamex AFFF-P 3% FC-203FC Light Water 3M
375-95-1
206-801-3
Perfluorononanoic acid
PFNA Ansul AFFF Ansulite® 3M LightWater Angus Fire, N/a Angus Fire, 2000 ; Niagara 1-3, Angus Fire, 1997; Forexpan OneSeven B-AR ARC Miljö Towalex 3x3 Towalex 3% master Hazard Control Technologies, Inc., 2003 F-500
335-76-2
206-400-3
Perfluorodecanoic acid
PFDA Ansul AFFF Ansulite® 3M LightWater 3M FC-203FC Light Water Fomtex Arc 3x3 Towalex plus Towalex 3x3 Towalex 3% master
2058-94-8
218-165-4
Perfluoroundecanoic acid
PFUnDA 3M LightWater 3M LightWater FC-203FC Ansul Ansulite® ANSUL Ansulite 6 % AFFF (Formula 1559-22 ICAO-B)
307-55-1
206-203-2
Perfluorododecanoic acid
PFDoDA Ansul AFFF Ansulite® 3M LightWater Sthamex F-15 Towalex 3% master
72629-94-8
276-745-2
Perfluorotridecanoic acid
PFTrDA PFCAs were primary components in early 3M AFFFs from 1965 up to 1986
376-06-7
N/a Perfluorotetradecanoic acid
PFTeDA 3M AFFFs from 1965 up to 1987 Ansul AFFF FC-203FC Light Water 3M
16517- 240- Perfluorostearic acid PFODA No product/supplier is mentioned; Publications are

P.O. Box 400, FI-00121 Helsinki, Finland | Tel. +358 9 686180 | echa.europa.eu
19
CAS EC Designation (synonyms)
Acronym Supplier and Product Name
11-6 582-5 based on environmental samples
Table B.3. PFSAs (identified by CAS) with <C6 incl. CAS/EC identifier, the designation, the acronym and the supplier and/or product name, from (Wood et al., 2020) CAS EC Designation
(synonyms) Acronym Supplier and Product Name
354-88-1 N/a Perfluoroethane sulfonic acid
PFEtS 3M AFFFs Shorter chains C2-C3 PFSAs used in from 1988 to 2001
423-41-6 N/a Perfluoropropane sulfonic acid
PFPrS 3M AFFFs Shorter chains C2-C3 PFSAs used in from 1988 to 2001
375-73-5 206-793-1
Perfluorobutanesulfonic acid
PFBS Ansul AFFF Ansulite® 3M LightWater Angus Fire, N/a Angus Fire, 2000 ; Niagara 1-3, Angus Fire, 1997; Forexpan Angus Fire, 2007; Hi Combat A ™ 3M, 2005; ATC-603 Light water ATC3 3M, 1999; FC-203FC Light water Brand AFFF 3M 1999 3M 1992 3M 1993 3M 1998 (slightly different shares) 3M 1989 3M 1988
2706-91-4
220-301-2
Perfluoropentane sulfonic acid
PFPeS No product/supplier is mentioned; Publications are based on environmental samples

P.O. Box 400, FI-00121 Helsinki, Finland | Tel. +358 9 686180 | echa.europa.eu
20
Table B.4. PFCAs (identified by CAS) with <C8 incl. CAS/EC identifier, the designation, the acronym and the supplier and/or product name CAS EC Designation
(synonyms) Acronym Supplier and Product Name
375-22-4 206-786-3
perfluoro-n-butanoic acid
PFBA Ansul AFFF Ansulite® 3M LightWater Angus Fire, N/a Angus Fire, 2000 ; Niagara 1-3, Angus Fire, 1997; Forexpan Angus Fire, 2007; Hi Combat A ™ 3M, 2005; ATC-603 Light water ATC3 3M, 1999; FC-203FC Light water Brand AFFF OneSeven B-AR ARC Miljö Towalex 3x3 Towalex 3% master Sthamex AFFF-P 3%
2706-90-3 220-300-7
Perfluoropentanoic acid
PFPeA 3M LightWater FC-203FC 3M 1999 3M 1992 3M 1993 3M 1998 (slightly different shares) 3M 1989 3M 1988 Angus Fire, 2000 ; Niagara 1-3, Angus Fire, 1997; Forexpan Ansul AFFF Ansulite®
307-24-4 206-196-6
Perfluorohexanoic acid
PFHxA Ansul AFFF Ansulite® 3M LightWater Angus Fire, N/a Angus Fire, 2000 ; Niagara 1-3, Angus Fire, 1997; Forexpan 3M, 2005; ATC-603 Light water ATC3 3M, 1999; FC-203FC Light water Brand AFFF 3M 1999 3M 1992 3M 1993 3M 1998 (slightly different shares) 3M 1989 3M 1988 OneSeven B-AR ARC Miljö Towalex plus Towalex 3x3 Towalex 3% super Towalex 3% master Sthamex AFFF-P 3%
375-85-9 206-798-9
Perfluoroheptanoic acid
PFHpA Ansul AFFF Ansulite® 3M LightWater Angus Fire, N/a Angus Fire, 2000 ; Niagara 1-3, Angus Fire, 1997; Forexpan Angus Fire, 2007; Hi Combat A ™ Angus Fire, 2004 Tridol S 3 % 3M, 2005; ATC-603 Light water ATC3 3M, 1999; FC-203FC Light water Brand AFFF FC-203FC Light Water 3M OneSeven B-AR ARC Miljö Towalex 3x3 Towalex 3% master Sthamex AFFF-P 3%

P.O. Box 400, FI-00121 Helsinki, Finland | Tel. +358 9 686180 | echa.europa.eu
21
B.1.1.2.2. Derivatives of perfluoroalkyl sulfonic PFAS (also PASF-based substances)
All the substances listed above are characterized by a perfluorinated alkaline carbon chain that is connected to a sulfonic- or carboxylic acid head group. In other PFAS substances, this head group is also equipped with additional chemical groups. This group is also called perfluroalkane sulfonyl fluoride substances (PASF), as their synthesis is based on perfluroalkane sulfonyl fluoride. The chemical formulae of this group can be summarised as:
Perfluoroalkane sulfonyl fluoride (PASF) = CnF2n+1SO2F
PASF-based derivates = CnF2n+1SO2-R, where R = NH, NHCH2CH2OH, etc.
This can be for example an amide (sometimes methylated or ethylated). However, in most cases, these substances were not found when the actual foam was tested but rather when environmental samples were tested in the connection of firefighting. In addition, some of the substances are also known to be environmental transformation products. Other substances are raw materials for surfactant and surface protection products (EtFOSE and N-MeFOSe) (Buck et al., 2011). The table below lists the substances of this sub-group found. Some of those are known PFOS-precursors (for example PFOSaAm, EtFOSAA, PFOSI, EtFOSE).
Table B.5. Identified derivates of perfluoroalkyl sulfonic PFAS (also PASF-based substances), from (Wood et al., 2020) CAS EC Designation
(synonyms) Acronym Supplier and
Product Name
13417-01-1 236-513-3 PPerfluoroalkyl sulfonamido amines
PFOSaAm National Foam ; Ansulite; 3M lightwater; 3M
167398-54-1 N/a Perfluoroheptane sulfonamidoethanol
C7-FASA (PFHpSA) 3 M Lightwater was used from 1988 until 2001 OR Ansul (telomer-based foam)
647-29-0 N/a N/a C8-PFSiA (PFOSI) 3M 1988 3M 1989
2991-50-6 / 1336-61-4
221-061-1 N-Ethyl perfluorooctane sulfonamidoacetic acid
EtFOSAA No product/supplier is mentioned; Publications are based on environmental samples
4151-50-2 223-980-3 N-Methyl perfluorooctane sulfonamidoacetic acid
EtFOSE No product/supplier is mentioned; Publications are based on environmental samples
68298-12-4 N/a N-Methylperfluorobutanesulfonamide
FBSA No product/supplier is mentioned
2806-24-8 N/a perfluorooctane sulfonamido acetic acid
FOSAA No product/supplier is mentioned; Publications are based on environmental samples

P.O. Box 400, FI-00121 Helsinki, Finland | Tel. +358 9 686180 | echa.europa.eu
22
CAS EC Designation (synonyms)
Acronym Supplier and Product Name
754-91-6 212-046-0 Perfluorooctane sulfonamide
FOSA No product/supplier is mentioned; Publications are based on environmental samples
10116-92-4 N/a N/a FOSE No product/supplier is mentioned; Publications are based on environmental samples
2355-31-9 N/a N-methyl perfluorooctanesulfonamidoacetic acid
N-MeFOSA No product/supplier is mentioned; Publications are based on environmental samples
24448-09-7 246-262-1 N-Methyl perfluorooctane sulfonamidoethanol
N-MeFOSE No product/supplier is mentioned; Publications are based on environmental samples
68555-77-1 271-455-2 perfluoroalkyl sulfonamido amines
PFBSaAm No product/supplier is mentioned; Publications are based on environmental samples
80475-32-7 279-481-6 N-[3-(Dimethyloxidoamino)propyl] -3,3,4,4,5,5,6,6,7,7,8,8,8-Tridecafluor-1-octanesulfonamid
N/a Dupont, Forafac® 1183
133875-90-8 N/a (Carboxymethyl)dimethyl [3- (gamma-omega-perfluor-1-C6-14-Alkansulfonamid)propyl)ammonium (inneres Salz)
N/a Dupont, Forafac® 1203
In addition to the tables above, the identified substances and their respective chemical relationship can be visualised in terms of a hierarchical clustering. This is shown in the figure 1 of the Annex XV Report.
B.1.1.2.3. Fluorotelomers
Fluorotelomers are defined as having an additional non-fluorinated spacer between the perfluorinated alkyl chain and the charged head group (denotated as number of perfluorinated carbons: number of non-fluorinated carbons). The substances fully identified in the search (i.e. by CAS/EC number) are shown in Table B.6. The most known homologues of this

P.O. Box 400, FI-00121 Helsinki, Finland | Tel. +358 9 686180 | echa.europa.eu
23
subgroup are those that have a two-carbon atom spacer (defined as CnF2n+1-C2H4-R)18.
Fluorotelomers cover a wide range of positively/negatively charged head groups or combinations of those. Most of the fully identified substances, exhibit the xx:2 structure, where two non-fluorinated carbon atoms are inserted between the perfluorinated carbon chain and the head group. However, in the case of fluorotelomer betaines also xx:1:2 and xx:3 are found. In the latter case, three non-fluorinated carbon atoms are inserted between the perfluorinated carbon chain and the head group. In the case of the xx:1:2 substances, an additional fluorinated carbon is inserted between the perfluorinated alkyl chain and the non-fluorinated spacer.
As shown in the table below, the 22 identified fluorotelomers cover a wide range of positively/negatively charged head groups or combinations of those. Most of the fully identified substances, exhibit the xx:2 structure, where two non-fluorinated carbon atoms are inserted between the perfluorinated carbon chain and the head group. However, in the case of fluorotelomer betaines also xx:1:2 and xx:3 are found. In the latter case, three non-fluorinated carbon atoms are inserted between the perfluorinated carbon chain and the head group. In the case of the xx:1:2 substances, an additional fluorinated carbon is inserted between the perfluorinated alkyl chain and the non-fluorinated spacer.
Based on the manufacturing dates that are cited in the respective publications, it can be assumed that the use of fluorotelomers in firefighting foams began later than the use of traditional PFAS substances without a non-fluorinated spacer.
Table B.6. Fluorotelomer (identified by CAS) substances incl. CAS/EC identifier, the designation, the acronym and the supplier and/or product name, from (Wood et al., 2020) CAS EC Designation
(synonyms) Acronym Supplier and
Product Name
34455-35-1 N/a 10:2 Fluorotelomer sulfonamide alkylbetaine
10:2 FTAB F-500, Hazard Control Tech., 1997 National Foam 2005 National Foam 2007 National Foam 2008 Fire Service Plus AFFF 2011 National Foam 2003-2008
53826-13-4 N/a 10:2 Fluorotelomer carboxylic acid
10:2 FTCA No product/supplier is mentioned; Publications are based on environmental samples
70887-84-2 N/a 10:2 fluorotelomer unsaturated carboxylic acid
10:2 FTUCA No product/supplier is mentioned; Publications are based on environmental samples
18 This corresponds with the general classification of per- and polyfluoroalkyl substances (PFASs) by the OECD, however flurotelomers used in firefighting foams have also been identified with a spacer of three non-fluorinated carbon atoms (for example 7:3 FTB), as well as fluorotelomers with a non-fluorinated and an additional single-fluorinated carbon.

P.O. Box 400, FI-00121 Helsinki, Finland | Tel. +358 9 686180 | echa.europa.eu
24
CAS EC Designation (synonyms)
Acronym Supplier and Product Name
278598-45-1 N/a Fluorotelomer sulfonamido betaines
12:2 FtSaB 3M Ansul, 2006 Ansul Anulite ARC
757124-72-4 816-391-3 Fluorotelomer sulfonates
4:2 FTS Angus Fire, 2004 Tridol S 3% Ansul 2002 Anslite 3% AFFF-DC-6 Hazard Control Tech 1197 F-500 National Foam
1432486-88-8 N/a 4:2 fluorotelomer thioamido sulfonates
4:2 FtTAoS Ansul AFFF formulations Angus Fire, 2004 Tridol S Ansul, 2002 Ansulite 3% AFFF DC-3 Ansul, 2006 Ansul Anulite ARC Hazard Control Tech., 1997 F-500 Chemguard Ansul Angus
171184-02-4 N/a 5:1:2 fluorotelomer betaine
5:1:2 FTB 3M Ansul, 2002 Ansulite 3% AFFF DC-3 Buckeye 2009 Buckeye AFFF 2004
171184-14-8 N/a 5:3 fluorotelomer betaine
5:3 FTB 3M Buckeye
34455-29-3 252-046-8 6:2 Fluorotelomer sulfonamide betaine
6:2 FTAB Chemours, STHAMEX® -AFFF 3% F-15 #4341 Dupont Forafac 1157 Dr. Sthamer, 3M National Foam F-500, Hazard Control Tech., 1997 (Foam 1) Angus Fire, 2004 Tridol S Angus Fire, 2000 Niagara 1-3 Chemours
647-42-7 211-477-1 6:2 Fluorotelomer alcohol
6:2 FTOH No product/supplier is mentioned; Publications are based on environmental samples

P.O. Box 400, FI-00121 Helsinki, Finland | Tel. +358 9 686180 | echa.europa.eu
25
CAS EC Designation (synonyms)
Acronym Supplier and Product Name
27619-97-2 248-580-6 6:2 Fluorotelomer Sulfonate
6:2 FTS Dr. Richard Sthamer GmbH & Co. KG STHMEX-AFFF 3% Hazard Control Tech., 1997 F-500 Angus Fire, 2004 Tridol S 3 % Angus Fire, 2000 ; Niagara 1-3, Angus Fire, 1997; Forexpan Angus Fire, 2004 Tridol S 3 % Ansul, 2002 Ansulite 3 % AFFF - DC-4 Ansul, 2006; Ansul Anulite ARC National Foam 2005 National Foam 2007 National Foam 2008 (slightly different shares)
1383438-86-5 N/a 6:2 fluorotelomer sulfonamide amine
6:2 FtSaAm 3M, National Foam 2005 National Foam 2007 National Foam 2008 (slightly different shares)
88992-47-6 N/a 6:2 fluorotelomer thioether amido sulfonic acid
6:2 FtTAoS Angus Fire, 2004 Tridol S Ansul 1986 Ansul 1987 Angus Fire, 2000 Niagara 1-3 Ansul, 2002 Ansulite 3% AFFF DC-3 Ansul 2009 Ansul 2010 Chemguard 2008 F-500, Hazard Control Tech., 1997
88992-46-5 N/a 6:2 fluorotelomer thio hydroxy ammonium
6:2 FtTHN+ 3M
171184-03-5 N/a 7:1:2 fluorotelomer betaine
7:1:2 FTB 3M Buckeye 2009
171184-15-9 N/a 7:3 fluorotelomer betaine
7:3 FTB Buckeye Ansul, 2002 Ansulite 3% AFFF DC-3
27854-31-5 N/a 8:2 Fluorotelomer carboxylic acid
8:2 FTCA F-500, Hazard Control Tech., 1997

P.O. Box 400, FI-00121 Helsinki, Finland | Tel. +358 9 686180 | echa.europa.eu
26
CAS EC Designation (synonyms)
Acronym Supplier and Product Name
34455-21-5 N/a 8:2 Fuorotelomer sulfonamide betaine
8:2 FTAB National Foam, F-500, Hazard Control Tech., 1997 National Foam 2005 National Foam 2007 National Foam 2008 (slightly different shares) Fireade
39108-34-4 254-295-8 Fluorotelomer sulfonates
8:2 FTS Ansul, 2002 Anslite 3 % AFFF - DC-5 Hazard Control Tech., 1997 F-500 Angus Fire, 2000 ; Niagara 1-3, Angus Fire, 1997; Forexpan National Foam 2005 National Foam 2007 National Foam 2008
1383439-45-9 N/a 8:2 fluorotelomer thioamido sulfonates
8:2 FtTAoS Chemguard, Ansul, 2006; Ansul Anulite ARC; Ansul, 2002 Ansulite 3% AFFF DC-3 Angus Fire, 2004 Tridol S Angus Fire, 2000; Niagara 1-3 Hazard Control Tech., 1997 F-500;
171184-04-6 N/a 9:1:2 fluorotelomer betaine
9:1:2 FTB 3M Buckeye AFFF 2004 Buckeye 2009
171184-16-0 N/a 9:3 fluorotelomer betaine
9:3 FTB Buckeye 2009 3M 1988 3M 1989 3M 1993A 3M 1993B 3M 1998 3M 2001 Ansul, 2002 Ansulite 3% AFFF DC-3
B.1.1.2.4. Other PFAS substances
In some cases, perfluorinated substances that do not belong to any of the listed groups (long-/short-chain PFAS, fluorotelomers, and derivates of PFAS) were identified. These substances are shown in the table below. Also shown below is the substance Dodecafluoro-2-methylpentan-3-one, a fluorinated ketone.

P.O. Box 400, FI-00121 Helsinki, Finland | Tel. +358 9 686180 | echa.europa.eu
27
Figure B.2. Chemical structure of Dodecafluoro-2-methylpentan-3-one, a fluorinated ketone, from (Wood et al., 2020) Table B.7. Other per- or polyfluorinated substances (identified by CAS) incl. CAS/EC identifier, the designation, the acronym and the supplier and/or product name, from (Wood et al., 2020) CAS EC Designation
(synonyms) Acronym Supplier and
Product Name
1280222-90-3 480-310-4 ammonium 2,2,3 trifluor-3-(1,1,2,2,3,3-hexafluoro-3-trifluormethoxypropoxy), propionate
ADONA Mentioned in annex_xv_svhc_ec_206-397-9_pfoa_11549 as a substitute. However, no other source for this information.
756-13-8 616-243-6 / 436-710-5
Dodecafluoro-2-methylpentan-3-one
N/a 3M NOVEC TM 1230
161278-39-3 500-631-6 Poly(1,1,2,2-tetrafluoro-1,2-ethanediyl), α-fluoro-ω-2-[3-((carboxylatomethyl) dimethylammonio)propylaminosulfonyl]ethyl-
N/a PROFOAM Profilm AFFF
70969-47-0 N/a Thiols, C8-20, gamma-omega-perfluoro, telomers with acrylamide
Thiols, C8-20, gamma-omega-perfluoro, telomers with acrylamide
Towalex 3% master
70829-87-7 N/a Sodium p-perfluorous nonenoxybenzene sulfonate
OBS No product/supplier is mentioned; Publications are based on environmental samples
13269-86-8 236-267-7
Bis(trifluorovinyl)ether
N/a Fire-extinguishing foam cited in Nordic working paper
B.1.1.2.5. Substance identification based on stakeholder surveys
Information on PFAS substance identities used in firefighting foams was requested from European foam manufacturers. However, invoking trade secrets, these identities were generally not communicated. A survey among Eurofeu members in 2018 provided a list of seven substances with estimated tonnages. It should be noted however that these substances only represent a small fraction of the total amount of PFAS used in firefighting foams (less

P.O. Box 400, FI-00121 Helsinki, Finland | Tel. +358 9 686180 | echa.europa.eu
28
than 15%; Table A.1 in section A.2 for more details).
Table B.8. Substance ID indicated by stakeholders to be used in firefighting foams Substance name CAS number
1-Propanaminium,N-(carboxymethyl)-N,N-dimethyl-3-[[(3,3,4,4,5,5,6,6,7,7,8,8,8-tridecafluorooctyl)sulfonyl]amino]-,inner salt
34455-29-3
1-Propanaminium, 3-amino-N-(carboxymethyl)-N,N-dimethyl-N-[[(gamma-omega-perfluoro-C6-C16-alkyl)thio]acetyl] derives., inner salts
80475-32-7
2-methyl-2 - [(1-oxo-3 - [(3,3,4,4,5,5,6,6,7,7,8,8,8-tridecafluorooctyl) thio] propyl) amino] -1-propanesulfonic acid, sodium salt
62880-93-7
2-hydroxy-N,N,N-trimethyl-3-[(3,3,4,4,5,5,6,6,7,7,8,8,8-tridecafluorooctyl)thio]-1-Propanaminium, chloride (1:1)
88992-45-4
2-Propenamide, telomer with 4-[(3,3,4,4,5,5,6,6,7,7,8,8,8-tridecafluorooctyl)thio]-1-butanethiol )
unknown
2-Propenoic acid, telomer with 2-propenamide and 4-[(3,3,4,4,5,5,6,6,7,7,8,8,8-tridecafluorooctyl)thio]-1-butanethiol, sodium salt
unknown
2-Propenamide, telomer with 3,3,4,4,5,5,6,6,7,7,8,8,8-tridecafluoro-1-octanethiol
76830-12-1
Other stakeholders (i.e. not Eurofeu members) indicated the following other substances being used in firefighting foams:
Carboxymethyldimethyl-3-[[(3,3,4,4,5,5,6,6,7,7,8,8,8-tridecafluorooctyl)sulphonyl]amino]propylammonium hydroxide (CAS number 34455-29-3)
6:2 Fluorotelomer Sulfonate (6:2 FTS); CAS number not specified
poly(1,1,2,2-tetrafluoro-1,2-ethanediyl),alpha fluoro-omega-2-(3-((caboxylatomethyl)dimetylammonoi)propylaminosulfonyl)ethyl; CAS number not specified
poly(1,1,2,2-tetrafluoro-1,2-ethanediyl),alpha fluoro-omega-2-(3-((caboxylatomethyl)dimetylammonoi)propylaminosulfonyl)ethyl; CAS number not specified
According to FFFC, all foams produced today are based on C6-chemistry and might be also subject to export to non-EU countries. FFFC further indicates that PFAS substances based on <C6-chemistry have never been used as an active ingredient for firefighting foams, as the chemistry is not suitable. PFAS with shorter chains than C6-substances are unintended by-products of the synthesis process (telomerization process) (FFFC-Interview, 2021).
Eurofeu further commented that C8-based foams are solely legacy foams and that there has been no use of C8 beyond impurities in the C6‐surfactant production since 2010. Eurofeu has not received any information about fluorocompounds with chain lengths of less than C6 being used in firefighting foam technology today. According to the information received by their members, sales for fluorine-containing foams for aviation and municipal fire brigades

P.O. Box 400, FI-00121 Helsinki, Finland | Tel. +358 9 686180 | echa.europa.eu
29
applications are declining rapidly. Regarding the latter, Eurofeu indicates that the share of AFFF is estimated to be in the low single digit % of total sales rapidly declining (Eurofeu, 2021c).
B.1.2. Composition of the substance(s)
No additional information.
B.1.3. Physicochemical properties
See below in Table B.9 the basic substance information and physical chemical properties of PFCAs, PFSAs, Perfluoroalkanes, Haloperfluoroalkanes and Perfluoroalkylethers, PFPAs and Perfluoroalkylamines.

P.O. Box 400, FI-00121 Helsinki, Finland | Tel. +358 9 686180 | echa.europa.eu
30
Table B.9. Basic substance information and physical chemical properties of PFCAs (Perfluoroalkylcarboxylic acids). abbreviation C1-PFCA C4-PFCA C6-PFCA C8-PFCA C9-PFCA C10-PFCA C11-PFCA C12-PFCA C13-PFCA C14-PFCA
acronym TFA PFBA PFHxA PFOA PFNA PFDA PFUnDA PFDoDA PFTrDA PFTeDA
IUPAC name trifluoroacetic acid
butanoic acid, heptafluoro-
hexanoic acid, undecafluoro-
octanoic acid, pentadeca-fluoro-
nonanoic acid, heptadeca-fluoro-
decanoic acid, nonadeca-fluoro-
undecanoic acid, henicosa-fluoro-
dodecanoic acid, tricosafluoro-
tridecanoic acid, pentacosa-fluoro-
tetradecanoic acid, heptacosa-fluoro-
molecular formula
CF3-COOH CF3(CF2)2-COOH
CF3(CF2)4-COOH
CF3(CF2)6-COOH
CF3(CF2)7-COOH
CF3(CF2)8-COOH
CF3(CF2)9-COOH
CF3(CF2)10-COOH
CF3(CF2)11-COOH
CF3(CF2)12-COOH
CAS number 76-05-1 375-22-4 307-24-4 335-67-1 375-95-1 335-76-2 2058-94-8 307-55-1 72629-94-8 376-06-7
physico-chemical data
molecular weight g/mol
114,02 214.04 314.05 414.07 464.08 514.08 564.09 614.10 664.11 714.11
partitioning coefficient log KOW
0.79 ± 0.48 at 25°C (calculated with QSAR; REACH registration data (2021-05-31))
0.50 (Predicted using US EPA EPI-Suite (KOWWIN v1.67))
3.39 ± 0.60 at 25°C(calculated using Advanced Chemistry Development (ACD/Labs) Software V11.02)
2.43 (Predicted using US EPA EPI-Suite (KOWWIN v1.67))
4.06 (calc., COSMOtherm (temp. not specified) (Wang et al., 2011b)
4.13 (exp. value, MSDS LabNetwork)
5.30 (calc., COSMOtherm (temp. not specified) (Wang et al., 2011b)
5.9 (calc., COSMOtherm, (Wang et al., 2011b))
7.27 (Predicted using US EPA EPI-Suite (KOWWIN v1.67))
6.5 (calc., COSMOtherm, (Wang et al., 2011b))
7.667 (exp. value, MSDS LabNetwork)
7.2 (calc., COSMOtherm, (Wang et al., 2011b))
8.548 (exp. value, MSDS LabNetwork)
7.8 (calc., COSMOtherm, (Wang et al., 2011b))
9.429 (exp. value, MSDS LabNetwork)
8.25 (calc., COSMOtherm, (Wang et al., 2011b))
8.90 (calc., COSMOtherm, (Wang et al., 2011b))
11.191 (exp. value, MSDS LabNetwork)
log KOA 5.843 at 25°C (Estimate from Log Kow [0,50 (KowWin estimate)] and
4.743 at 25°C (Estimate from Log Kow [2.43 (KowWin estimate)] and
6.63 (calc., COSMOtherm (Wang et al., 2011b)
7.23 (calc., COSMOtherm, (Wang et al., 2011b))
7.50 (calc., COSMOtherm, (Wang et al., 2011b))
7.77 (calc., COSMOtherm, (Wang et al., 2011b))
8.08 (calc., COSMOtherm, (Wang et al., 2011b))
8.36 (calc., COSMOtherm, (Wang et al., 2011b))
8.63 (calc., COSMOtherm, (Wang et al., 2011b))
8.87 (calc., COSMOtherm, (Wang et al., 2011b))

P.O. Box 400, FI-00121 Helsinki, Finland | Tel. +358 9 686180 | echa.europa.eu
31
abbreviation C1-PFCA C4-PFCA C6-PFCA C8-PFCA C9-PFCA C10-PFCA C11-PFCA C12-PFCA C13-PFCA C14-PFCA
acronym TFA PFBA PFHxA PFOA PFNA PFDA PFUnDA PFDoDA PFTrDA PFTeDA
log Kaw [-5.343 (exp. database)]; Predicted using US EPA EPI-Suite (KOAWIN v1.10 estimate))
log Kaw [-2.313 (HenryWin estimate)]; Predicted using US EPA EPI-Suite (KOAWIN v1.10 estimate))
log KAW -5.343 at 25°C (exp. database US EPA)
-2.313 at 25°C (Predicted using US EPA EPI-Suite (HenryWin v3.10 estimate))
-2.66 (calc., (European Chemicals Agency, 2016a))
-1.93 (calc., COSMOtherm, (Wang et al., 2011b))
-1.58 (calc., COSMOtherm, (Wang et al., 2011b))
-1.27 (calc., COSMOtherm, (Wang et al., 2011b))
-0.92 (calc., COSMOtherm, (Wang et al., 2011b))
-0.58 (calc., COSMOtherm, (Wang et al., 2011b))
-0.38 (calc., COSMOtherm, (Wang et al., 2011b))
0.03 (calc., COSMOtherm, (Wang et al., 2011b))
dissociation constant
pKa 0.05±0.10 (calculated using Advanced Chemistry Development (ACD/Labs) Software V11.02)
0.32–0.42 (exp. value, potentiometric titration of aq. sol.; Cabala, 2017)
-0.16 (Zhao et al., 2014)
0.5 (calculated from exp. values, (Vierke, 2014))
1.3 (López-Fontán et al., 2005)
< 1.6 (calculated from exp. values, (Vierke, 2014))
0.82 (calc., COSMOtherm, (Wang et al., 2011b))
2.58 (exp. value, measurement of the PFCAs solubility change with pH; Cabala, 2017)
< 1.6 (calculated from exp. values, (Vierke, 2014))
2.58 (Moroi et al., 2001)
2.61 (exp. value, measurement of the PFCAs solubility change with pH; Cabala, 2017)
< 1.6 (calculated from exp. values, (Vierke, 2014))
3.13 (exp. value, measurement of the PFCAs solubility change with pH; Cabala, 2017)

P.O. Box 400, FI-00121 Helsinki, Finland | Tel. +358 9 686180 | echa.europa.eu
32
abbreviation C1-PFCA C4-PFCA C6-PFCA C8-PFCA C9-PFCA C10-PFCA C11-PFCA C12-PFCA C13-PFCA C14-PFCA
acronym TFA PFBA PFHxA PFOA PFNA PFDA PFUnDA PFDoDA PFTrDA PFTeDA
partition coefficients log Kd (sediment and overlapping dissolved phase)
n.a. n.a. 1.4 – 3.1 (Li et al., 2011)
0.04 (Ahrens et al., 2010b)*
0.6 (Ahrens et al., 2010b)*
1.8 (Ahrens et al., 2010b)*
3.0 (Ahrens et al., 2010b)*
log KOC (sediment organic carbon-normalised distribution coefficient)
0.437 (Predicted using US EPA EPI-Suite (PCKOCWIN v1.66))
1.767 (Predicted using US EPA EPI-Suite (PCKOCWIN v1.66))
1.63 – 2.35 (Sepulvado et al., 2011)
2.06 (Higgins and Luthy, 2006b)
1.09 (Ahrens et al., 2010b)*
2.39 (Higgins and Luthy, 2006b)
2.4 (Ahrens et al., 2010b)*
2.76 (Higgins and Luthy, 2006b)
3.6 (Ahrens et al., 2010b)*
3.3 (Higgins and Luthy, 2006b)
4.8 (Ahrens et al., 2010b)*
water solubility
miscible with water (>10 g/cm³)(exp. result; REACH registration data (2021-05-31))
1000 g/L at 20°C, fully miscible (exp. data, SRC PhysProp database, REACH registration data (2021-05-31))
0.7657 g/L (Estimate from Log Kow [2.43 (KowWin est)]; Predicted using US EPA EPI-Suite (WSKOW v1.41))
15.7 g/L (25 °C) (Zhao et al., 2014)
9.5 g/L (25° C)
4.14 g/L (22 °C)
(European Chemicals Agency, 2013)
practically insoluble in water (exp. result; MSDS Alfa Aesar)
1.882⋅10-6 g/L (Estimate from Log Kow [7.27 (KowWin est)]; Predicted using US EPA EPI-Suite (WSKOW v1.41))
5.14 g/L at 25 °C (European Chemicals Agency, 2016b)
1.2⋅10-4 g/L; pH 1 at 25 °C
9.0⋅10-4 g/L; pH 2 at 25 °C
8.5⋅10-3 g/L; pH 3 at 25 °C
0.056 g/L; pH 4 at 25 °C
0.14 g/L; pH 5 at 25 °C
0.16 g/L; pH 6-10 at 25 °C
(calculated)
(European Chemicals Agency,
2.9⋅10-5 g/L pH 1 at 25 °C
2.2⋅10-4 g/L pH 2 at 25 °C
2.0⋅10-3 g/L pH 3 at 25 °C
0.014 g/L pH 4 at 25 °C
0.034 g/L pH 5 at 25 °C
0.039 g/L pH 6 at 25 °C
0.040 g/L pH 7 at 25 °C
0.041 g/L pH
7.3⋅10-6 g/L; pH 1 at 25 °C
5.5⋅10-5 g/L; pH 2 at 25 °C
5.1⋅10-4 g/L; pH 3 at 25 °C
3.5⋅10-3 g/L; pH 4 at 25 °C
8.6⋅10-3 g/L; pH 5 at 25 °C
0.0100 g/L; pH 6-10 at 25 °C
(calculated)
(European Chemicals
1.9⋅10-6 g/L; pH 1 at 25 °C
1.4⋅10-5 g/L; pH 2 at 25 °C
1.3⋅10-4 g/L; pH 3 at 25 °C
9.3⋅10-4 g/L; pH 4 at 25 °C
2.2⋅10-3 g/L; pH 5 at 25 °C
2.6⋅10-3 g/L; pH 6-10 at 25 °C
(calculated)
(European Chemicals

P.O. Box 400, FI-00121 Helsinki, Finland | Tel. +358 9 686180 | echa.europa.eu
33
abbreviation C1-PFCA C4-PFCA C6-PFCA C8-PFCA C9-PFCA C10-PFCA C11-PFCA C12-PFCA C13-PFCA C14-PFCA
acronym TFA PFBA PFHxA PFOA PFNA PFDA PFUnDA PFDoDA PFTrDA PFTeDA
2012a) 8-10 at 25 °C
(calculated)
(European Chemicals Agency, 2012d)
Agency, 2012c)
Agency, 2012b)
vapour pressure
12.4 kPa at 20°C (interpolated from exp. results; REACH registration data (2021-05-31))
15.5 kPa at 25°C (Predicted using US EPA EPI-Suite (Mean VP of Antoine & Grain methods, MPBPWIN v1.42))
12.8 kPa at 25°C (calculated using Advanced Chemistry Development (ACD/Labs) Software
1.3 kPa at 25°C (calculated using Advanced Chemistry Development (ACD/Labs) Software V11.02)
1.98 mm Hg at 25 °C; equals to 263.93 Pa
US EPA; Estimation Program Interface (EPI) Suite. Ver. 4.11. Nov, 2012. Available from, as of Jan 11, 2015
4.2 Pa (25 °C) extrapolated from measured data
2.3 Pa (20 ° C) extrapolated from measured data
128 Pa (59.3 °C) measured
(European Chemicals Agency, 2013)
22.8 Pa at 25°C (calculated using Advanced Chemistry Development (ACD/Labs) Software V11.02)
3.1 to 99.97 kPa (129.6 to 218.9 C)
(calculated)
(European Chemicals Agency, 2016b)
0.6 to 99.97 kPa (112 to 237.7 °C) (calculated)
(European Chemicals Agency, 2012a)
1.25 Pa at 25 °C (calculated)
(European Chemicals Agency, 2012d)
0.48 Pa at 25 °C (calculated)
(European Chemicals Agency, 2012c)
0.18 Pa at 25 °C (calculated)
(European Chemicals Agency, 2012b)

P.O. Box 400, FI-00121 Helsinki, Finland | Tel. +358 9 686180 | echa.europa.eu
34
abbreviation C1-PFCA C4-PFCA C6-PFCA C8-PFCA C9-PFCA C10-PFCA C11-PFCA C12-PFCA C13-PFCA C14-PFCA
acronym TFA PFBA PFHxA PFOA PFNA PFDA PFUnDA PFDoDA PFTrDA PFTeDA
V11.02)
boiling point 71.78°C (extrapolated, exp. result, ebulliometer; REACH registration data (2021-05-31))
73°C (Handbook data: CRC; REACH registration data (2021-05-31))
72.4°C (Handbook data: Merck index; REACH registration data (2021-05-31))
120.0°C (Cabala, 2017)
157 °C (Savu, 2000)
189.0°C (Cabala, 2017)
218 °C
(European Chemicals Agency, 2015)
218 °C measured
(European Chemicals Agency, 2016b)
238.4 °C (calculated)
(European Chemicals Agency, 2012a)
249 °C
(European Chemicals Agency, 2012d)
260.7 °C (calculated)
(European Chemicals Agency, 2012c)
270 °C
(European Chemicals Agency, 2012b)
Henrys Law constant
4.31E-006 atm-m3/mole at 25°C (Predicted using US EPA EPI-Suite (Bond Method, HENRYWIN v3.10))
1.19E-004 atm-m3/mole at 25°C (Predicted using US EPA EPI-Suite (Bond Method, HENRYWIN v3.10))
3.29E-003 atm-m3/mole at 25°C (Predicted using US EPA EPI-Suite (Bond Method, HENRYWIN v3.10))
9.08E-002 atm-m3/mole at 25°C (Predicted using US EPA EPI-Suite (Bond Method, HENRYWIN v3.10))
4.77E-001 atm-m3/mole at 25°C (Predicted using US EPA EPI-Suite (Bond Method, HENRYWIN v3.10))
n.a. n.a. n.a. n.a. n.a.

P.O. Box 400, FI-00121 Helsinki, Finland | Tel. +358 9 686180 | echa.europa.eu
35
Table B.10. Basic substance information and physical chemical properties of PFSAs (Perfluoroalkane sulfonic acids). abbreviation C1-PFSA C2-PFSA C3-PFSA C4-PFSA C6-PFSA C8-PFSA C10-PFSA C12-PFSA C13-PFSA C14-PFSA
acronym TFMS, TFSA, HOTf or TfOH
PFBS PFHxS PFOS PFDS PFDoDA PFTrDA PFTeDA
IUPAC name Trifluoromethanesulfonic acid
Pentafluoroethanesulfonic acid
1,1,2,2,3,3,3-Heptafluoro-1-propanesulfonic acid
1,1,2,2,3,3,4,4,4-Nonafluo-ro-1-butane-sulfonic acid
1,1,2,2,3,3,4,4,5,5,6,6,6-Tridecafluoro-1-hexane-sulfonic acid
1,1,2,2,3,3,4,4,5,5,6,6,7,7,8,8,8-Hepta-decafluoro-1-octanesulfonic acid
1,1,2,2,3,3,4,4,5,5,6,6,7,7,8,8,9,9,10,10,10-henicosafluorodecane-1-sulfonic acid
1,1,2,2,3,3,4,4,5,5,6,6,7,7,8,8,9,9,10,10,11,11,12,12,12-Pentacosafluorododecane-1-sulphonic acid
1,1,2,2,3,3,4,4,5,5,6,6,7,7,8,8,9,9,10,10,11,11,12,12,13,13,13-Heptacosafluorotridecane-1-sulfonic acid
1,1,2,2,3,3,4,4,5,5,6,6,7,7,8,8,9,9,10,10,11,11,12,12,13,13,14,14,14-Nonacosafluorotetradecane-1-sulfonic acid
other names Triflic acid Perfluoroethanesulfonic acid
Perfluoropropanesulfonic acid
Perfluorobutanesulfonic acid
Perfluorohexanesulfonic acid
Perfluorooctanesulfonic acid
Perfluorodecanesulfonic acid
Perfluorododecanesulfonic acid
Perfluorotridecanesulfonic acid
Perfluorotetradecanesulfonic acid
molecular formula
CF3-SO3H CF3(CF2)-SO3H CF3(CF2)2-SO3H
CF3(CF2)3-SO3H
CF3(CF2)5-SO3H
CF3(CF2)7-SO3H
CF3(CF2)9-SO3H
CF3(CF2)11-SO3H
CF3(CF2)12-SO3H
CF3(CF2)13-SO3H
CAS number 1493-13-6 354-88-1 423-41-6 375-73-5 355-46-4 1763-23-1 335-77-3 79780-39-5 791563-89-8 1379460-39-5
EC number 216-087-5 - - 206-793-1 206-587-1 217-179-8 206-401-9 279-259-9 - -
physico-chemical data
molecular weight g/mol
150.1 200.1 250.1 300.1 400.1 500.1 600.2 700.2 750.2 800.2
partitioning coefficient log KOW
< 0.3 at 25°C and pH 1, (exp. result, HPLC method, OECD 117; REACH registration data (2021-05-21))
0.48 (Predicted using US EPA EPI-Suite (KOWWIN v1.67 estimate))
1.45 (Predicted using US EPA EPI-Suite (KOWWIN v1.67 estimate))
-0.34 at 23°C and pH 1.7 (exp. result, shake flask method EU Method A.8; REACH registration data (2021-
5.17 (calc., COSMOtherm, (Wang et al., 2011b))
4.57 (exp. value, MSDS LabNetwork)
4.34
4.512±0.862 at 25 °C (calculated using Advanced Chemistry Development (ACD/Labs) Software
5.972±0.891 at 25 °C (calculated using Advanced Chemistry Development (ACD/Labs) Software
7.432±0.916 at 25 °C (calculated using Advanced Chemistry Development (ACD/Labs) Software
8.161±0.927 at 25 °C (calculated using Advanced Chemistry Development (ACD/Labs) Software
8.891±0.939 at 25 °C (calculated using Advanced Chemistry Development (ACD/Labs) Software

P.O. Box 400, FI-00121 Helsinki, Finland | Tel. +358 9 686180 | echa.europa.eu
36
abbreviation C1-PFSA C2-PFSA C3-PFSA C4-PFSA C6-PFSA C8-PFSA C10-PFSA C12-PFSA C13-PFSA C14-PFSA
acronym TFMS, TFSA, HOTf or TfOH
PFBS PFHxS PFOS PFDS PFDoDA PFTrDA PFTeDA
-0.49 (QSAR estimation (KOWWIN); REACH registration data (2021-05-21))
05-26))
2.41 (Predicted using US EPA EPI-Suite (KOWWIN v1.67 estimate))
2.808 (exp. value, MSDS LabNetwork)
(Predicted using US EPA EPI-Suite (KOWWIN v1.67 estimate))
V11.02)
4.49 (Predicted using US EPA EPI-Suite; HSDB, National Library of Medicine (US))
V11.02)
V11.02)
V11.02)
V11.02)
log KOA 4.902 at 25°C (Estimate from Log Kow [-0.49 (KowWin estimate)] and log Kaw [-5.392 (HenryWin estimate)]; Predicted using US EPA EPI-Suite (KOAWIN v1.10 estimate))
5.152 at 25°C (Estimate from Log Kow [0.48 (KowWin estimate)] and log Kaw [-4.672 (HenryWin estimate)]; Predicted using US EPA EPI-Suite (KOAWIN v1.10 estimate))
5.401 at 25°C (Estimate from Log Kow [1.45 (KowWin estimate)] and log Kaw [-3.951 (HenryWin estimate)]; Predicted using US EPA EPI-Suite (KOAWIN v1.10 estimate))
5.640 at 25°C (Estimate from Log Kow [2.41 (KowWin estimate)] and log Kaw [-3.230 (HenryWin estimate)]; Predicted using US EPA EPI-Suite (KOAWIN v1.10 estimate))
7.55 (calc., COSMOtherm, (Wang et al., 2011b))
6.130 at 25°C (Estimate from Log Kow [4.34 (KowWin estimate)] and log Kaw [-1.790 (HenryWin estimate)]; Predicted using US EPA EPI-Suite (KOAWIN v1.10 estimate))
n.a. n.a. n.a. n.a. n.a.
log KAW -5.392 at 25°C (Predicted using US EPA
-4.672 at 25°C (Predicted using US EPA
-3.951 at 25°C (Predicted using US EPA
-3.230 at 25°C (Predicted using US EPA
-2.38 (calc., COSMOtherm, (Wang et al.,
n.a. n.a. n.a. n.a. n.a.

P.O. Box 400, FI-00121 Helsinki, Finland | Tel. +358 9 686180 | echa.europa.eu
37
abbreviation C1-PFSA C2-PFSA C3-PFSA C4-PFSA C6-PFSA C8-PFSA C10-PFSA C12-PFSA C13-PFSA C14-PFSA
acronym TFMS, TFSA, HOTf or TfOH
PFBS PFHxS PFOS PFDS PFDoDA PFTrDA PFTeDA
EPI-Suite (HenryWin v3.10 estimate))
EPI-Suite (HenryWin v3.10 estimate))
EPI-Suite (HenryWin v3.10 estimate))
EPI-Suite (HenryWin v3.10 estimate))
2011b))
-1.790 at 25°C (Predicted using US EPA EPI-Suite (HenryWin v3.10 estimate))
dissociation constant
pKa<0 (REACH registration data (2021-05-25))
pKa -3.86±0.50 (calculated using Advanced Chemistry Development (ACD/Labs) Software V11.02)
pKa -3.63±0.50 (calculated using Advanced Chemistry Development (ACD/Labs) Software V11.02)
pKa -3.57±0.50 (calculated using Advanced Chemistry Development (ACD/Labs) Software V11.02)
-3.45 (calc., COSMOtherm, (Wang et al., 2011b))
pKa -3.34±0.50 (calculated using Advanced Chemistry Development (ACD/Labs) Software V11.02)
pKa -3.27±0.50 (calculated using Advanced Chemistry Development (ACD/Labs) Software V11.02)
pKa -3.26±0.50 (calculated using Advanced Chemistry Development (ACD/Labs) Software V11.02)
pKa -3.26±0.50 (calculated using Advanced Chemistry Development (ACD/Labs) Software V11.02)
pKa -3.26±0.50 (calculated using Advanced Chemistry Development (ACD/Labs) Software V11.02)
pKa -3.26±0.50 (calculated using Advanced Chemistry Development (ACD/Labs) Software V11.02)
partition coefficients log Kd (sediment and overlapping dissolved phase)
n.a. n.a. n.a. n.a. n.a. n.a. n.a. n.a. n.a. n.a.
log KOC (sediment organic carbon-normalised
0.352 (Predicted using US EPA EPI-Suite (PCKOCWIN
1.016 (Predicted using US EPA EPI-Suite (PCKOCWIN
1.681 (Predicted using US EPA EPI-Suite (PCKOCWIN
2.345 (Predicted using US EPA EPI-Suite (PCKOCWIN
3.675 (Predicted using US EPA EPI-Suite (PCKOCWIN
n.a. n.a. n.a. n.a. n.a.
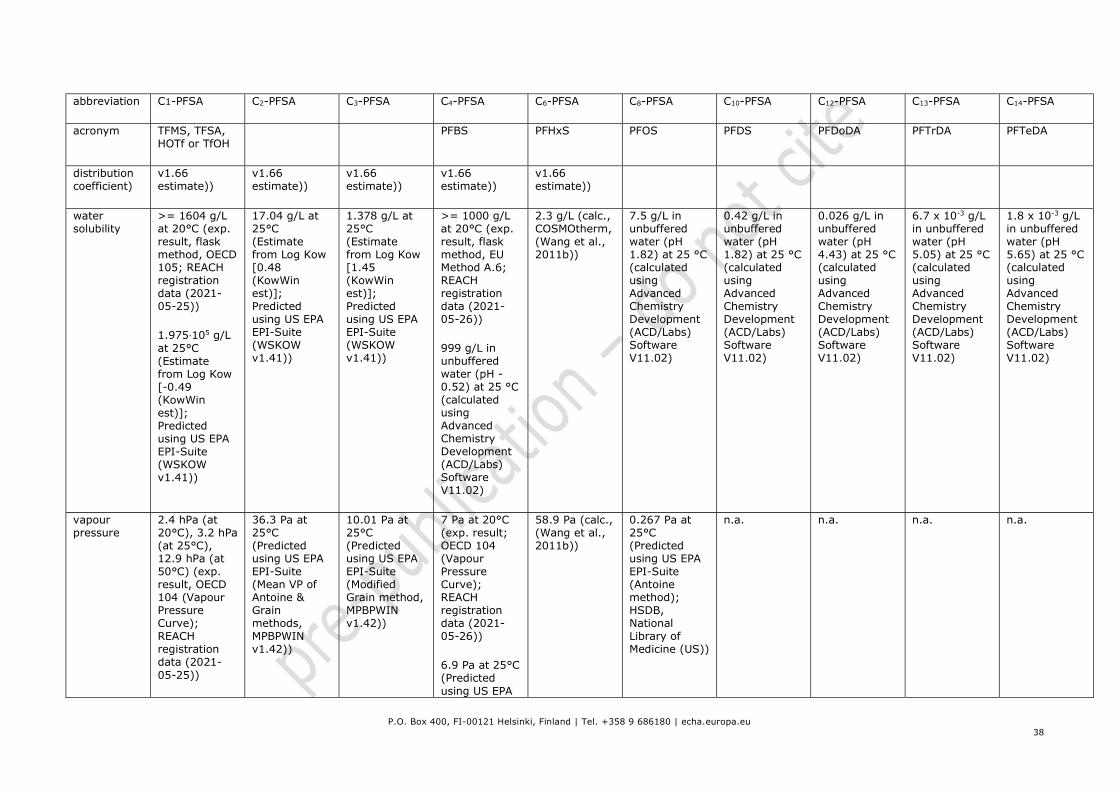
P.O. Box 400, FI-00121 Helsinki, Finland | Tel. +358 9 686180 | echa.europa.eu
38
abbreviation C1-PFSA C2-PFSA C3-PFSA C4-PFSA C6-PFSA C8-PFSA C10-PFSA C12-PFSA C13-PFSA C14-PFSA
acronym TFMS, TFSA, HOTf or TfOH
PFBS PFHxS PFOS PFDS PFDoDA PFTrDA PFTeDA
distribution coefficient)
v1.66 estimate))
v1.66 estimate))
v1.66 estimate))
v1.66 estimate))
v1.66 estimate))
water solubility
>= 1604 g/L at 20°C (exp. result, flask method, OECD 105; REACH registration data (2021-05-25))
1.975⋅105 g/L at 25°C (Estimate from Log Kow [-0.49 (KowWin est)]; Predicted using US EPA EPI-Suite (WSKOW v1.41))
17.04 g/L at 25°C (Estimate from Log Kow [0.48 (KowWin est)]; Predicted using US EPA EPI-Suite (WSKOW v1.41))
1.378 g/L at 25°C (Estimate from Log Kow [1.45 (KowWin est)]; Predicted using US EPA EPI-Suite (WSKOW v1.41))
>= 1000 g/L at 20°C (exp. result, flask method, EU Method A.6; REACH registration data (2021-05-26))
999 g/L in unbuffered water (pH -0.52) at 25 °C (calculated using Advanced Chemistry Development (ACD/Labs) Software V11.02)
2.3 g/L (calc., COSMOtherm, (Wang et al., 2011b))
7.5 g/L in unbuffered water (pH 1.82) at 25 °C (calculated using Advanced Chemistry Development (ACD/Labs) Software V11.02)
0.42 g/L in unbuffered water (pH 1.82) at 25 °C (calculated using Advanced Chemistry Development (ACD/Labs) Software V11.02)
0.026 g/L in unbuffered water (pH 4.43) at 25 °C (calculated using Advanced Chemistry Development (ACD/Labs) Software V11.02)
6.7 x 10⁻³ g/L in unbuffered water (pH 5.05) at 25 °C (calculated using Advanced Chemistry Development (ACD/Labs) Software V11.02)
1.8 x 10⁻³ g/L in unbuffered water (pH 5.65) at 25 °C (calculated using Advanced Chemistry Development (ACD/Labs) Software V11.02)
vapour pressure
2.4 hPa (at 20°C), 3.2 hPa (at 25°C), 12.9 hPa (at 50°C) (exp. result, OECD 104 (Vapour Pressure Curve); REACH registration data (2021-05-25))
36.3 Pa at 25°C (Predicted using US EPA EPI-Suite (Mean VP of Antoine & Grain methods, MPBPWIN v1.42))
10.01 Pa at 25°C (Predicted using US EPA EPI-Suite (Modified Grain method, MPBPWIN v1.42))
7 Pa at 20°C (exp. result; OECD 104 (Vapour Pressure Curve); REACH registration data (2021-05-26))
6.9 Pa at 25°C (Predicted using US EPA
58.9 Pa (calc., (Wang et al., 2011b))
0.267 Pa at 25°C (Predicted using US EPA EPI-Suite (Antoine method); HSDB, National Library of Medicine (US))
n.a. n.a. n.a. n.a.

P.O. Box 400, FI-00121 Helsinki, Finland | Tel. +358 9 686180 | echa.europa.eu
39
abbreviation C1-PFSA C2-PFSA C3-PFSA C4-PFSA C6-PFSA C8-PFSA C10-PFSA C12-PFSA C13-PFSA C14-PFSA
acronym TFMS, TFSA, HOTf or TfOH
PFBS PFHxS PFOS PFDS PFDoDA PFTrDA PFTeDA
EPI-Suite (Modified Grain method, MPBPWIN v1.42))
boiling point 161-162 °C (exp. result; MSDS Alfa Aesar)
162 °C (handbook data; REACH registration data (2021-05-25))
178°C (exp. result; SRC [Syracuse Research Corporation of Syracuse, New York (US)])
196°C (exp. result; SRC [Syracuse Research Corporation of Syracuse, New York (US)])
198 °C at 1013 hPa (exp. result; EU Method A.2; REACH registration data (2021-05-26))
238.5 °C (exp. result; SRC [Syracuse Research Corporation of Syracuse, New York (US)])
249 °C (exp. result; HSDB, National Library of Medicine (US))
n.a. n.a. n.a. n.a.
Henrys Law constant
9.92⋅10-8 atm-m3/mole at 25°C (Predicted using US EPA EPI-Suite (Bond Method, HENRYWIN v3.10))
5.21⋅10-7 atm-m3/mole at 25°C (Predicted using US EPA EPI-Suite (Bond Method, HENRYWIN v3.10))
2.74⋅10-6 atm-m3/mole at 25°C (Predicted using US EPA EPI-Suite (Bond Method, HENRYWIN v3.10))
1.44⋅10-5 atm-m3/mole at 25°C (Predicted using US EPA EPI-Suite (Bond Method, HENRYWIN v3.10))
3.97⋅10-4 atm-m3/mole at 25°C (Predicted using US EPA EPI-Suite (Bond Method, HENRYWIN v3.10))
n.a. n.a. n.a. n.a. n.a.

P.O. Box 400, FI-00121 Helsinki, Finland | Tel. +358 9 686180 | echa.europa.eu
40
Table B.11. Basic substance information and physical chemical properties of Perfluoroalkanes. abbreviation C1-PFC C2-PFC C3-PFC C4-PFC C6-PFC C8-PFC C10-PFC C12-PFC
IUPAC name Tetrafluoromethane Hexafluoroethane Octafluoropro-pane
Decafluorobutane Tetradecafluoro-hexane
Octadecafluoro-octane
Docosafluorodecane Hexacosafluorododecane
other names Carbon tetrafluoride Perfluoroethane Perfluoropropane Perfluorobutane Perfluorohexane Perfluorooctane Perfluorodecane Perfluorododecane
molecular formula
CF4 C2F6 C3F8 C4F10 C6F14 C8F18 C10F22
CAS number 75-73-0 76-16-4 76-19-7 355-25-9 355-42-0 307-34-6 307-45-9 307-59-5
EC number 200-896-5 200-939-8 200-941-9 206-580-3 206-585-0 206-199-2 - 206-204-8
molecular weight g/mol
88.01 138.01 188.02 238.03 338.04 438.06 538.07 638.09
partitioning coefficient log KOW
1.18 (HSDB, National Library of Medicine (US); REACH registration data (2021-05-31))
1.19 (Predicted using US EPA EPI-Suite (KOWWIN v1.67 estimate))
2.00 (exp. database US EPA, Hansch, C et al. (1995))
2.15 (Predicted using US EPA EPI-Suite (KOWWIN v1.67 estimate))
2.15 (estimated with QSAR; REACH registration data (2021-05-31))
2.8 at 25°C (calculated; REACH registration data (2021-05-31))
3.12 (Predicted using US EPA EPI-Suite (KOWWIN v1.67 estimate))
4.09 (Predicted using US EPA EPI-Suite (KOWWIN v1.67 estimate))
4.822 (exp. value, MSDS LabNetwork)
6.02 (Predicted using US EPA EPI-Suite (KOWWIN v1.67 estimate))
≥ 4.5 (OECD 107 (Shake Flask Method), estimation method (solubility ratio); REACH registration data (2021-06-08))
6.584 (exp. value, MSDS LabNetwork)
7.95 (Predicted using US EPA EPI-Suite (KOWWIN v1.67 estimate))
ca. 6.2 at 25°C, pH 7 (estimated using US EPA EPI-Suite; REACH registration data (2021-06-09))
8.346 (exp. value, MSDS LabNetwork)
8.011±0.865 at 25 °C (calculated using Advanced Chemistry Development (ACD/Labs) Software V11.02)
9.470±0.893 at 25 °C (calculated using Advanced Chemistry Development (ACD/Labs) Software V11.02)
11.87 (exp. value, MSDS LabNetwork)
log KOA -1.143 at 25°C (Estimate from Log Kow [1.18 (exp. database)] and log
-0.919 at 25°C (Estimate from Log Kow [2.00 (exp. database)] and log
-0.010 at 25°C (Estimate from Log Kow [3.12 (KowWin
-0.346 at 25°C (Estimate from Log Kow [4.09 (KowWin
0.144 at 25°C (Estimate from Log Kow [6.02 (KowWin
0.633 at 25°C (estimate from Log Kow [7.95 (KowWin estimate)] and log
n.a. n.a.

P.O. Box 400, FI-00121 Helsinki, Finland | Tel. +358 9 686180 | echa.europa.eu
41
abbreviation C1-PFC C2-PFC C3-PFC C4-PFC C6-PFC C8-PFC C10-PFC C12-PFC
Kaw [2.323 (exp. database)]; Predicted using US EPA EPI-Suite (KOAWIN v1.10 estimate))
-0.950 (exp. database US EPA)
-0.95 (HSDB, National Library of Medicine (US))
Kaw [2.919 (exp. database)]; Predicted using US EPA EPI-Suite (KOAWIN v1.10 estimate))
estimate)] and log Kaw [3.130 (exp. database)]; Predicted using US EPA EPI-Suite (KOAWIN v1.10 estimate))
estimate)] and log Kaw [4.436 (HenryWin estim.)]; Predicted using US EPA EPI-Suite (KOAWIN v1.10 estimate))
estimate)] and log Kaw [5.876 (HenryWin estim.)]; Predicted using US EPA EPI-Suite (KOAWIN v1.10 estimate))
Kaw [7.317 (HenryWin estim.)]; Predicted using US EPA EPI-Suite (KOAWIN v1.10 estimate))
log KAW 2.323 (exp. database US EPA)
2.919 (exp. database US EPA)
3.130 (exp. database US EPA)
4.436 at 25°C (Predicted using US EPA EPI-Suite (HenryWin v3.10 estimate))
5.876 at 25°C (Predicted using US EPA EPI-Suite (HenryWin v3.10 estimate))
7.317 at 25°C (Predicted using US EPA EPI-Suite (HenryWin v3.10 estimate))
n.a. n.a.
dissociation constant
no dissociable groups
no dissociable groups
no dissociable groups
no dissociable groups
no dissociable groups
no dissociable groups
no dissociable groups
no dissociable groups
partition coefficients log Kd (sediment and overlapping dissolved phase)
n.a. n.a. n.a. n.a. n.a. n.a. n.a. n.a.
log KOC (sediment organic carbon-normalised distribution coefficient)
1.687 (Predicted using US EPA EPI-Suite (PCKOCWIN v1.66 estimate))
2.352 (Predicted using US EPA EPI-Suite (PCKOCWIN v1.66 estimate))
3.016 (Predicted using US EPA EPI-Suite (PCKOCWIN v1.66 estimate))
3.681 (Predicted using US EPA EPI-Suite (PCKOCWIN v1.66 estimate))
5.010 (Predicted using US EPA EPI-Suite (PCKOCWIN v1.66 estimate))
6.339 (Predicted using US EPA EPI-Suite (PCKOCWIN v1.66 estimate))
n.a. n.a.
water 18.8 - 20 mg/L (exp. result; REACH registration data
0.52 g/L at 25°C (exp. result, OECD 105, column elution
5.7 mg/L at 20°C (calculated value; REACH
1.612 mg/L at 25°C (Estimate from Log Kow
≤0.1 mg/L at 20°C, pH 7.1-7.2 (exp. result,
ca. 10 µg/L at 20°C, pH 7 (exp. result; WoE, REACH
0.00031 µg/L in unbuffered water (pH 7) at 25 °C
0.00031 µg/L in unbuffered water (pH 7) at 25 °C

P.O. Box 400, FI-00121 Helsinki, Finland | Tel. +358 9 686180 | echa.europa.eu
42
abbreviation C1-PFC C2-PFC C3-PFC C4-PFC C6-PFC C8-PFC C10-PFC C12-PFC
solubility (2021-05-31))
4.1 g/L in unbuffered water (pH 7) at 25 °C (calculated using Advanced Chemistry Development (ACD/Labs) Software V11.02)
method; REACH registration data (2021-05-31))
0.36 g/L in unbuffered water (pH 7) at 25 °C (calculated using Advanced Chemistry Development (ACD/Labs) Software V11.02)
registration data (2021-05-31))
5.7 mg/L at 15 °C (HSDB, National Library of Medicine (US))
[4.09 (KowWin est)]; Predicted using US EPA EPI-Suite (WSKOW v1.41))
1.4 mg/L in unbuffered water (pH 7) at 25 °C (calculated using Advanced Chemistry Development (ACD/Labs) Software V11.02)
extrapolated, slow-stirring flask method; REACH registration data (2021-06-09))
0.0096 mg/L at 25°C (Estimate from Log Kow [6.02 (KowWin est)]; Predicted using US EPA EPI-Suite (WSKOW v1.41))
0.0081 mg/L in unbuffered water (pH 7) at 25 °C (calculated using Advanced Chemistry Development (ACD/Labs) Software V11.02)
registration data (2021-06-09))
0.052 µg/L at 25°C (Estimate from Log Kow [7.95 (KowWin est)]; Predicted using US EPA EPI-Suite (WSKOW v1.41))
0.048 µg/L in unbuffered water (pH 7) at 25 °C (calculated using Advanced Chemistry Development (ACD/Labs) Software V11.02)
(calculated using Advanced Chemistry Development (ACD/Labs) Software V11.02)
(calculated using Advanced Chemistry Development (ACD/Labs) Software V11.02)
vapour pressure
2.3 ⋅107 Pa at 25°C (exp. result; REACH registration data (2021-05-31))
1.13 ⋅107 Pa at 25°C (calculated using Advanced Chemistry Development (ACD/Labs) Software V11.02)
2902.1 kPa at 18°C (exp. result, static cell method; REACH registration data (2021-05-31))
3.2 ⋅106 Pa at 25°C (calculated using Advanced Chemistry Development (ACD/Labs) Software V11.02)
883.9 kPa at 25°C (exp. result; HSDB, National Library of Medicine (US))
767 kPa at 20°C (exp. value, handbook data; REACH registration data (2021-05-31))
268.0 kPa at 25°C (exp. result; HSDB, National Library of Medicine (US))
258.6 kPa at 25°C (calculated using Advanced Chemistry Development (ACD/Labs) Software V11.02)
ca. 26.5 kPa at 25°C (calculated with QSAR; REACH registration data (2021-06-09))
30.4 kPa at 25°C (calculated using Advanced Chemistry Development (ACD/Labs) Software V11.02)
ca. 3 kPa at 25°C (exp. result; WoE, REACH registration data (2021-06-09))
5.17 kPa at 25°C (calculated using Advanced Chemistry Development (ACD/Labs) Software V11.02)
599.95 Pa at 25°C (calculated using Advanced Chemistry Development (ACD/Labs) Software V11.02)
92.39 Pa at 25°C (calculated using Advanced Chemistry Development (ACD/Labs) Software V11.02)
boiling point -127.9 °C (handbook data; CRC Handbook of
-78.1 °C (exp. result; HSDB, National Library of
-37 °C (exp. value, handbook data; REACH
-2.1 °C (handbook data; CRC Handbook of
58.45°C (exp. result, EU Method A.2; REACH
105.9 °C (exp. result; HSDB, National Library of
150°C (exp. result; source: Benning, Anthony F.;
178°C (exp. result; source: Haszeldine, R. N.; Journal of

P.O. Box 400, FI-00121 Helsinki, Finland | Tel. +358 9 686180 | echa.europa.eu
43
abbreviation C1-PFC C2-PFC C3-PFC C4-PFC C6-PFC C8-PFC C10-PFC C12-PFC
Chemistry and Physics. 95th Edition)
Medicine (US)) registration data (2021-05-31))
Chemistry and Physics. 95th Edition)
registration data (2021-06-09))
Medicine (US)) US2490764, 1949; Scifinder [CAS])
the Chemical Society, (1950); Scifinder [CAS])
Henrys Law constant
5.15 atm-m3/mole (exp. database US EPA)
4.59 atm-m3/mole at 25°C (Predicted using US EPA EPI-Suite (Bond Method, HENRYWIN v3.10))
20.3 atm-m3/mole (exp. database US EPA)
24.1 atm-m3/mole at 25°C (Predicted using US EPA EPI-Suite (Bond Method, HENRYWIN v3.10))
33.0 atm-m3/mole (exp. database US EPA)
24.5 atm-m3/mole at 25°C (Predicted using US EPA EPI-Suite (Group Method, HENRYWIN v3.10))
245 atm-m3/mole at 25°C (Predicted using US EPA EPI-Suite (Group Method, HENRYWIN v3.10))
2.45⋅104 atm-m3/mole at 25°C (Predicted using US EPA EPI-Suite (Group Method, HENRYWIN v3.10))
2.45⋅106 atm-m3/mole at 25°C (Predicted using US EPA EPI-Suite (Group Method, HENRYWIN v3.10))
n.a. n.a.

P.O. Box 400, FI-00121 Helsinki, Finland | Tel. +358 9 686180 | echa.europa.eu
44
Table B.12. Basic substance information and physical chemical properties of Haloperfluoroalkanes and Perfluoroalkylethers (PFAEs; acyclic and cyclic).
abbreviation/acronym
Cryofluorane Fluobrene PFME PFEE Perfluoroglyme Perfluorodiglyme Tetrafluorooxirane HFPO
IUPAC name 1,2-Dichlorotetrafluoroethane
1,2-Dibromotetrafluoroethane
Trifluoro(trifluoromethoxy)methane
1,1,1,2,2-Pentafluoro-2-(pentafluoroethoxy)ethane
1,1,2,2-Tetrafluoro-1,2-bis(trifluoromethoxy)ethane
1,1,2,2-Tetrafluoro-1-[1,1,2,2-tetrafluoro-2-(trifluoromethoxy)ethoxy]-2-(trifluoromethoxy)ethane
2,2,3,3-Tetrafluorooxirane
2,2,3-Trifluoro-3-(trifluoromethyl)oxirane
other names Cryofluorane Fluobrene Perfluorodimethyl ether; Perfluoromethyl ether
Perfluorodiethyl ether; Perfluoroethyl ether
Perfluoroglyme Perfluorodiglyme Tetrafluorooxirane Trifluoro(trifluoromethyl)oxirane; Hexafluoro-1,2-epoxypropane
molecular formula
C2Cl2F4 C2Br2F4 C2F6O C4F10O C4F10O2 C6F14O3 C2F4O C3F6O
CAS number 76-14-2 124-73-2 1479-49-8 358-21-4 378-11-0 40891-99-4 694-17-7 428-59-1
EC number 200-937-7 204-711-9 - - - - 211-767-8 207-050-4
molecular weight g/mol
170.92 259.82 154.01 254.03 270.03 386.04 116.01 166.02
partitioning coefficient
2.82 (exp. database US EPA; source: Hansch,C et al.
2.96 (Predicted using US EPA EPI-Suite (KOWWIN
2.00 (Predicted using US EPA EPI-Suite (KOWWIN
3.93 (Predicted using US EPA EPI-Suite (KOWWIN
6.120±0.807 at 25 °C (calculated using Advanced
5.55 (Predicted using US EPA EPI-Suite (KOWWIN
1.10 (Predicted using US EPA EPI-Suite (KOWWIN
1.72 (Predicted using US EPA EPI-Suite (KOWWIN

P.O. Box 400, FI-00121 Helsinki, Finland | Tel. +358 9 686180 | echa.europa.eu
45
abbreviation/acronym
Cryofluorane Fluobrene PFME PFEE Perfluoroglyme Perfluorodiglyme Tetrafluorooxirane HFPO
log KOW (1995)) v1.67 estimate)) v1.67 estimate)) v1.67 estimate)) Chemistry Development (ACD/Labs) Software V11.02)
v1.67 estimate))
v1.67 estimate))
v1.67 estimate))
log KOA 0.761 at 25°C (Estimate from Log Kow [2.82 (exp. database)] and log Kaw [2.059 (exp. database)]; Predicted using US EPA EPI-Suite (KOAWIN v1.10 estimate))
2.139 at 25°C (Estimate from Log Kow [2.96 (KowWin estimate)] and log Kaw [0.821 (HenryWin estimate)]; Predicted using US EPA EPI-Suite (KOAWIN v1.10 estimate))
1.660 at 25°C (Estimate from Log Kow [2.00 (KowWin estimate)] and log Kaw [0.340 (HenryWin estimate)]; Predicted using US EPA EPI-Suite (KOAWIN v1.10 estimate))
2.148 at 25°C (Estimate from Log Kow [3.93 (KowWin estimate)] and log Kaw [1.782 (HenryWin estimate)]; Predicted using US EPA EPI-Suite (KOAWIN v1.10 estimate))
n.a. 6.437 at 25°C (Estimate from Log Kow [5.55 (KowWin estimate)] and log Kaw [-0.887 (HenryWin estimate)]; Predicted using US EPA EPI-Suite (KOAWIN v1.10 estimate))
2.214 at 25°C (Estimate from Log Kow [1.10 (KowWin estimate)] and log Kaw [-1.114 (HenryWin estimate)]; Predicted using US EPA EPI-Suite (KOAWIN v1.10 estimate))
2.113 at 25°C (Estimate from Log Kow [1.72 (KowWin estimate)] and log Kaw [-0.393 (HenryWin estimate)]; Predicted using US EPA EPI-Suite (KOAWIN v1.10 estimate))
log KAW 2.059 (exp. database US EPA)
0.821 at 25°C (Predicted using US EPA EPI-Suite (HenryWin v3.10 estimate))
0.340 at 25°C (Predicted using US EPA EPI-Suite (HenryWin v3.10 estimate))
1.782 at 25°C (Predicted using US EPA EPI-Suite (HenryWin v3.10 estimate))
n.a. -0.887 at 25°C (Predicted using US EPA EPI-Suite (HenryWin v3.10 estimate))
-1.114 at 25°C (Predicted using US EPA EPI-Suite (HenryWin v3.10 estimate))
-0.393 at 25°C (Predicted using US EPA EPI-Suite (HenryWin v3.10 estimate))
dissociation constant
no dissociable groups
no dissociable groups
n.a. n.a. n.a. n.a. n.a. n.a.
partition coefficients log Kd (sediment and overlapping dissolved phase)
n.a. n.a. n.a. n.a. n.a. n.a. n.a. n.a.
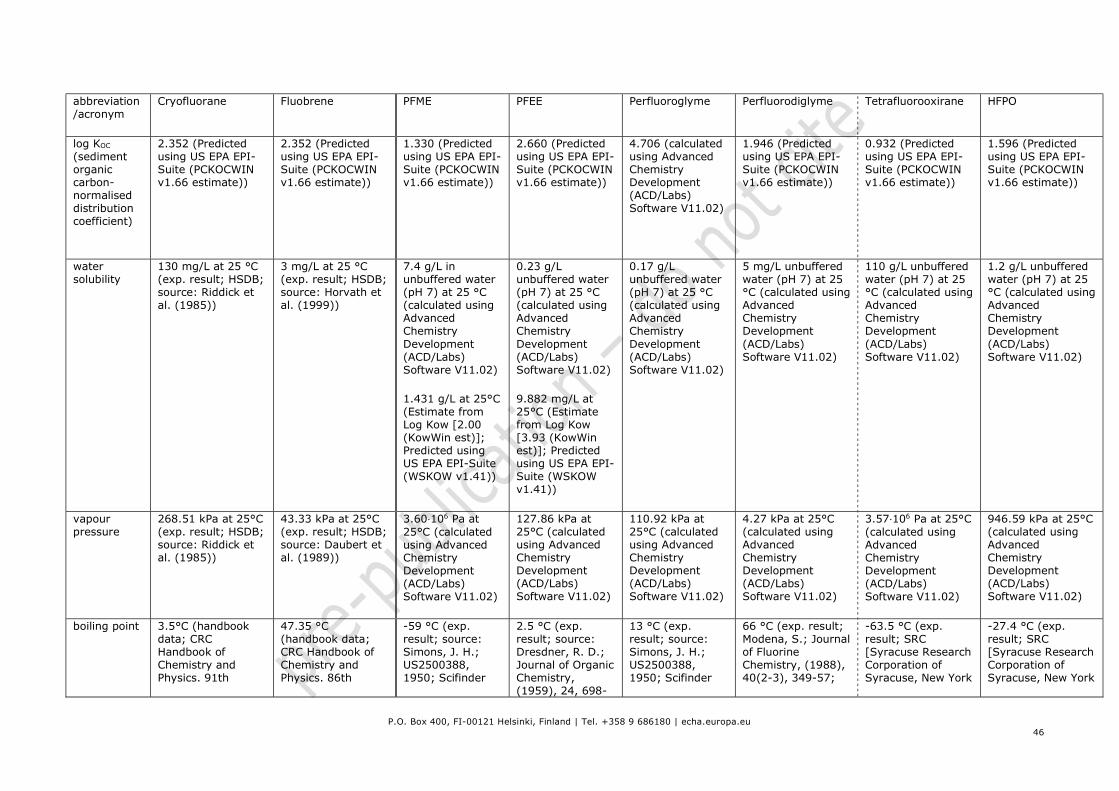
P.O. Box 400, FI-00121 Helsinki, Finland | Tel. +358 9 686180 | echa.europa.eu
46
abbreviation/acronym
Cryofluorane Fluobrene PFME PFEE Perfluoroglyme Perfluorodiglyme Tetrafluorooxirane HFPO
log KOC (sediment organic carbon-normalised distribution coefficient)
2.352 (Predicted using US EPA EPI-Suite (PCKOCWIN v1.66 estimate))
2.352 (Predicted using US EPA EPI-Suite (PCKOCWIN v1.66 estimate))
1.330 (Predicted using US EPA EPI-Suite (PCKOCWIN v1.66 estimate))
2.660 (Predicted using US EPA EPI-Suite (PCKOCWIN v1.66 estimate))
4.706 (calculated using Advanced Chemistry Development (ACD/Labs) Software V11.02)
1.946 (Predicted using US EPA EPI-Suite (PCKOCWIN v1.66 estimate))
0.932 (Predicted using US EPA EPI-Suite (PCKOCWIN v1.66 estimate))
1.596 (Predicted using US EPA EPI-Suite (PCKOCWIN v1.66 estimate))
water solubility
130 mg/L at 25 °C (exp. result; HSDB; source: Riddick et al. (1985))
3 mg/L at 25 °C (exp. result; HSDB; source: Horvath et al. (1999))
7.4 g/L in unbuffered water (pH 7) at 25 °C (calculated using Advanced Chemistry Development (ACD/Labs) Software V11.02)
1.431 g/L at 25°C (Estimate from Log Kow [2.00 (KowWin est)]; Predicted using US EPA EPI-Suite (WSKOW v1.41))
0.23 g/L unbuffered water (pH 7) at 25 °C (calculated using Advanced Chemistry Development (ACD/Labs) Software V11.02)
9.882 mg/L at 25°C (Estimate from Log Kow [3.93 (KowWin est)]; Predicted using US EPA EPI-Suite (WSKOW v1.41))
0.17 g/L unbuffered water (pH 7) at 25 °C (calculated using Advanced Chemistry Development (ACD/Labs) Software V11.02)
5 mg/L unbuffered water (pH 7) at 25 °C (calculated using Advanced Chemistry Development (ACD/Labs) Software V11.02)
110 g/L unbuffered water (pH 7) at 25 °C (calculated using Advanced Chemistry Development (ACD/Labs) Software V11.02)
1.2 g/L unbuffered water (pH 7) at 25 °C (calculated using Advanced Chemistry Development (ACD/Labs) Software V11.02)
vapour pressure
268.51 kPa at 25°C (exp. result; HSDB; source: Riddick et al. (1985))
43.33 kPa at 25°C (exp. result; HSDB; source: Daubert et al. (1989))
3.60⋅106 Pa at 25°C (calculated using Advanced Chemistry Development (ACD/Labs) Software V11.02)
127.86 kPa at 25°C (calculated using Advanced Chemistry Development (ACD/Labs) Software V11.02)
110.92 kPa at 25°C (calculated using Advanced Chemistry Development (ACD/Labs) Software V11.02)
4.27 kPa at 25°C (calculated using Advanced Chemistry Development (ACD/Labs) Software V11.02)
3.57⋅106 Pa at 25°C (calculated using Advanced Chemistry Development (ACD/Labs) Software V11.02)
946.59 kPa at 25°C (calculated using Advanced Chemistry Development (ACD/Labs) Software V11.02)
boiling point 3.5°C (handbook data; CRC Handbook of Chemistry and Physics. 91th
47.35 °C (handbook data; CRC Handbook of Chemistry and Physics. 86th
-59 °C (exp. result; source: Simons, J. H.; US2500388, 1950; Scifinder
2.5 °C (exp. result; source: Dresdner, R. D.; Journal of Organic Chemistry, (1959), 24, 698-
13 °C (exp. result; source: Simons, J. H.; US2500388, 1950; Scifinder
66 °C (exp. result; Modena, S.; Journal of Fluorine Chemistry, (1988), 40(2-3), 349-57;
-63.5 °C (exp. result; SRC [Syracuse Research Corporation of Syracuse, New York
-27.4 °C (exp. result; SRC [Syracuse Research Corporation of Syracuse, New York

P.O. Box 400, FI-00121 Helsinki, Finland | Tel. +358 9 686180 | echa.europa.eu
47
abbreviation/acronym
Cryofluorane Fluobrene PFME PFEE Perfluoroglyme Perfluorodiglyme Tetrafluorooxirane HFPO
Edition) Edition) (CAS)) 700; Scifinder (CAS))
(CAS)) Scifinder (CAS)) (US)]) (US)])
Henrys Law constant
1.51 atm-m3/mole at 25°C (Predicted using US EPA EPI-Suite (Bond Method, HENRYWIN v3.10))
0.162 atm-m3/mole at 25°C (Predicted using US EPA EPI-Suite (Bond Method, HENRYWIN v3.10))
0.0535 atm-m3/mole at 25°C (Predicted using US EPA EPI-Suite (Bond Method, HENRYWIN v3.10))
1.48 atm-m3/mole at 25°C (Predicted using US EPA EPI-Suite (Bond Method, HENRYWIN v3.10))
n.a. 0.00317 atm-m3/mole at 25°C (Predicted using US EPA EPI-Suite (Bond Method, HENRYWIN v3.10))
0.00188 atm-m3/mole at 25°C (Predicted using US EPA EPI-Suite (Bond Method, HENRYWIN v3.10))
0.0099 atm-m3/mole at 25°C (Predicted using US EPA EPI-Suite (Bond Method, HENRYWIN v3.10))
Table B.13. Basic substance information and physical chemical properties of Perfluoroalkylphosphonic acids (PFPAs). acronym PFMPA PFEPA PFBPA PFPPA PFHxPA PFOPA PFDPA PFDoPA
IUPAC name (Trifluoromethyl)-phosphonic acid
(Pentafluoroethyl)-phosphonic acid
(Nonafluorobutyl)phosphonic acid;
(Undecafluoropenty)lphosphonic acid
(Tridecafluorohexyl)phosphonic acid
Heptadecafluorooctylphosphonic acid
(Henicosafluorodecyl)phosphonic acid
(Pentacosafluorododecyl)phosphonic acid
other names Trifluoromethyl-phosphic acid; Perfluoromethyl phosponic acid
Pentafluoroethyl-phosphonic acid; Perfluoroethyl phosponic acid
Perfluorobutyl-phosphonic acid
Perfluoropentyl-phosphonic acid
Perfluorohexanephosphonic acid
Perfluorooctyl-phosphonic acid
Perfluorodecylphosphonic acid
Perfluorododecylphosphonic acid
molecular formula
CH2F3O3P C2H2F5O3P C4H2F9O3P C5H2F11O3P C6H2F13O3P C8H2F17O3P C10H2F21O3P C12H2F25O3P
CAS number 374-09-4 103305-01-7 52299-24-8 2109769-70-0 40143-76-8 40143-78-0 52299-26-0 63225-55-8
EC number - - - - - - - -
molecular weight g/mol
149.99 200.00 300.02 350.02 400.03 500.05 600.06 700.08
partitioning -0.28 (Predicted 0.68 (Predicted 4.093±0.674 at 4.659±0.696 at 5.389±0.741 at 6.849±0.834 at 25 8.308±0.917 at 25 9.768±0.993 at 25
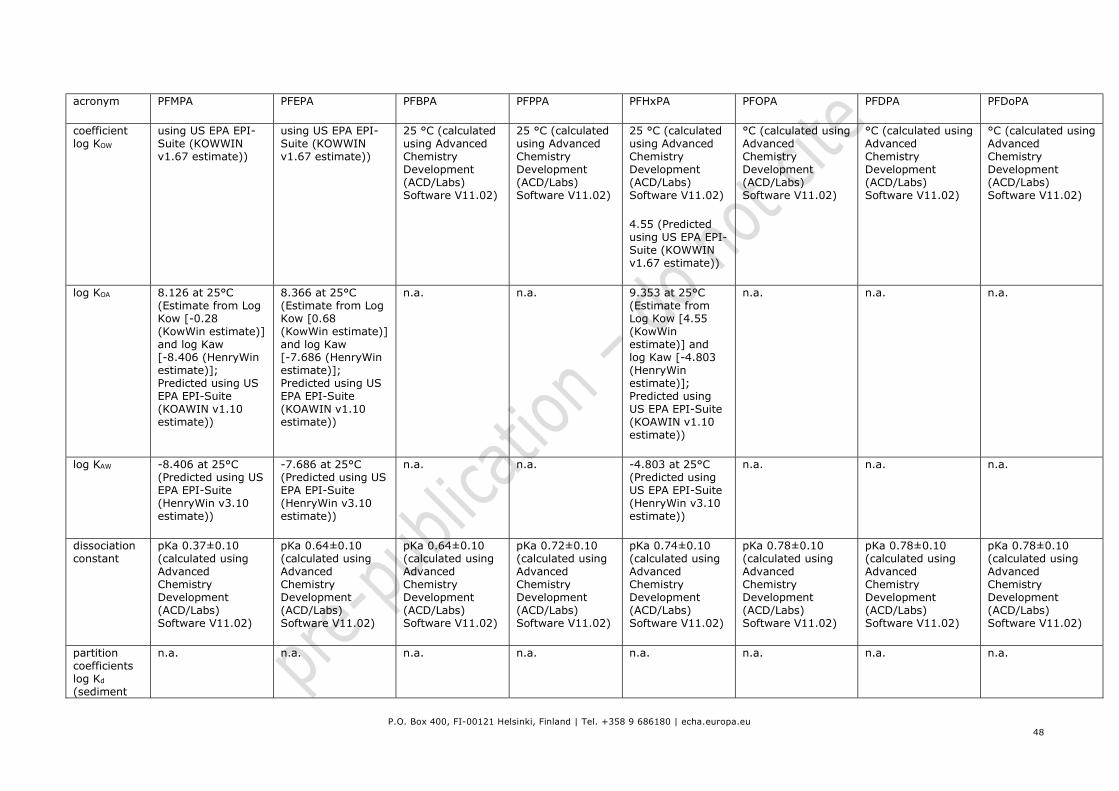
P.O. Box 400, FI-00121 Helsinki, Finland | Tel. +358 9 686180 | echa.europa.eu
48
acronym PFMPA PFEPA PFBPA PFPPA PFHxPA PFOPA PFDPA PFDoPA
coefficient log KOW
using US EPA EPI-Suite (KOWWIN v1.67 estimate))
using US EPA EPI-Suite (KOWWIN v1.67 estimate))
25 °C (calculated using Advanced Chemistry Development (ACD/Labs) Software V11.02)
25 °C (calculated using Advanced Chemistry Development (ACD/Labs) Software V11.02)
25 °C (calculated using Advanced Chemistry Development (ACD/Labs) Software V11.02)
4.55 (Predicted using US EPA EPI-Suite (KOWWIN v1.67 estimate))
°C (calculated using Advanced Chemistry Development (ACD/Labs) Software V11.02)
°C (calculated using Advanced Chemistry Development (ACD/Labs) Software V11.02)
°C (calculated using Advanced Chemistry Development (ACD/Labs) Software V11.02)
log KOA 8.126 at 25°C (Estimate from Log Kow [-0.28 (KowWin estimate)] and log Kaw [-8.406 (HenryWin estimate)]; Predicted using US EPA EPI-Suite (KOAWIN v1.10 estimate))
8.366 at 25°C (Estimate from Log Kow [0.68 (KowWin estimate)] and log Kaw [-7.686 (HenryWin estimate)]; Predicted using US EPA EPI-Suite (KOAWIN v1.10 estimate))
n.a. n.a. 9.353 at 25°C (Estimate from Log Kow [4.55 (KowWin estimate)] and log Kaw [-4.803 (HenryWin estimate)]; Predicted using US EPA EPI-Suite (KOAWIN v1.10 estimate))
n.a. n.a. n.a.
log KAW -8.406 at 25°C (Predicted using US EPA EPI-Suite (HenryWin v3.10 estimate))
-7.686 at 25°C (Predicted using US EPA EPI-Suite (HenryWin v3.10 estimate))
n.a. n.a. -4.803 at 25°C (Predicted using US EPA EPI-Suite (HenryWin v3.10 estimate))
n.a. n.a. n.a.
dissociation constant
pKa 0.37±0.10 (calculated using Advanced Chemistry Development (ACD/Labs) Software V11.02)
pKa 0.64±0.10 (calculated using Advanced Chemistry Development (ACD/Labs) Software V11.02)
pKa 0.64±0.10 (calculated using Advanced Chemistry Development (ACD/Labs) Software V11.02)
pKa 0.72±0.10 (calculated using Advanced Chemistry Development (ACD/Labs) Software V11.02)
pKa 0.74±0.10 (calculated using Advanced Chemistry Development (ACD/Labs) Software V11.02)
pKa 0.78±0.10 (calculated using Advanced Chemistry Development (ACD/Labs) Software V11.02)
pKa 0.78±0.10 (calculated using Advanced Chemistry Development (ACD/Labs) Software V11.02)
pKa 0.78±0.10 (calculated using Advanced Chemistry Development (ACD/Labs) Software V11.02)
partition coefficients log Kd (sediment
n.a. n.a. n.a. n.a. n.a. n.a. n.a. n.a.

P.O. Box 400, FI-00121 Helsinki, Finland | Tel. +358 9 686180 | echa.europa.eu
49
acronym PFMPA PFEPA PFBPA PFPPA PFHxPA PFOPA PFDPA PFDoPA
and overlapping dissolved phase)
log KOC (sediment organic carbon-normalised distribution coefficient)
0.654 (Predicted using US EPA EPI-Suite (PCKOCWIN v1.66 estimate))
1.318 (Predicted using US EPA EPI-Suite (PCKOCWIN v1.66 estimate))
n.a. n.a. 3.977 (Predicted using US EPA EPI-Suite (PCKOCWIN v1.66 estimate))
n.a. n.a. n.a.
water solubility
85 g/L in unbuffered water (pH 0.49) at 25 °C (calculated using Advanced Chemistry Development (ACD/Labs) Software V11.02)
22 g/L in unbuffered water (pH 1.10) at 25 °C (calculated using Advanced Chemistry Development (ACD/Labs) Software V11.02)
3.6 g/L in unbuffered water (pH 1.96) at 25 °C (calculated using Advanced Chemistry Development (ACD/Labs) Software V11.02)
1.7 g/L in unbuffered water (pH 2.33) at 25 °C (calculated using Advanced Chemistry Development (ACD/Labs) Software V11.02)
0.8 g/L in unbuffered water (pH 2.71) at 25 °C (calculated using Advanced Chemistry Development (ACD/Labs) Software V11.02)
0.19 g/L in unbuffered water (pH 3.44) at 25 °C (calculated using Advanced Chemistry Development (ACD/Labs) Software V11.02)
0.038 g/L in unbuffered water (pH 4.18) at 25 °C (calculated using Advanced Chemistry Development (ACD/Labs) Software V11.02)
5.7 mg/L in unbuffered water (pH 4.98) at 25 °C (calculated using Advanced Chemistry Development (ACD/Labs) Software V11.02)
vapour pressure
10.15 Pa at 25°C (calculated using Advanced Chemistry Development (ACD/Labs) Software V11.02)
105.59 Pa at 25°C (calculated using Advanced Chemistry Development (ACD/Labs) Software V11.02)
40.80 Pa at 25°C (calculated using Advanced Chemistry Development (ACD/Labs) Software V11.02)
18.67 Pa at 25°C (calculated using Advanced Chemistry Development (ACD/Labs) Software V11.02)
8.12 Pa at 25°C (calculated using Advanced Chemistry Development (ACD/Labs) Software V11.02)
1.40 Pa at 25°C (calculated using Advanced Chemistry Development (ACD/Labs) Software V11.02)
0.227 Pa at 25°C (calculated using Advanced Chemistry Development (ACD/Labs) Software V11.02)
35.60 mPa at 25°C (calculated using Advanced Chemistry Development (ACD/Labs) Software V11.02)
boiling point 210.5±45.0 °C (calculated using Advanced Chemistry Development (ACD/Labs) Software V11.02)
426.42 °C at 101325 Pa (exp. result, extrapolated; MSDS Oakwood)
186.0±50.0 °C (calculated using Advanced Chemistry Development (ACD/Labs) Software V11.02)
199.9±50.0 °C (calculated using Advanced Chemistry Development (ACD/Labs) Software V11.02)
214.3±50.0 °C (calculated using Advanced Chemistry Development (ACD/Labs) Software V11.02)
243.6±50.0 °C (calculated using Advanced Chemistry Development (ACD/Labs) Software V11.02)
272.4±50.0 °C (calculated using Advanced Chemistry Development (ACD/Labs) Software V11.02)
300.2±52.0 °C (calculated using Advanced Chemistry Development (ACD/Labs) Software V11.02)
Henrys Law constant
9.60⋅10-11 atm-m3/mole at 25°C (Predicted using US
5.04⋅10-10 atm-m3/mole at 25°C (Predicted using US
n.a. n.a. 3.85⋅10-7 atm-m3/mole at 25°C (Predicted using
n.a. n.a. n.a.

P.O. Box 400, FI-00121 Helsinki, Finland | Tel. +358 9 686180 | echa.europa.eu
50
acronym PFMPA PFEPA PFBPA PFPPA PFHxPA PFOPA PFDPA PFDoPA
EPA EPI-Suite (Bond Method, HENRYWIN v3.10))
EPA EPI-Suite (Bond Method, HENRYWIN v3.10))
US EPA EPI-Suite (Bond Method, HENRYWIN v3.10))

P.O. Box 400, FI-00121 Helsinki, Finland | Tel. +358 9 686180 | echa.europa.eu
51
Table B.14. Basic substance information and physical chemical properties of Perfluoroalkylamines. acronym PFMAm PFEAm PFPrAm PFBAm PFHxAm
IUPAC name 1,1,1-Trifluoro-N,N-bis(trifluoromethyl)methanamine
1,1,2,2,2-Pentafluoro-N,N-bis(pentafluoroethyl)ethanamine
1,1,2,2,3,3,3-Heptafluoro-N,N-bis(1,1,2,2,3,3,3-heptafluoropropyl)-1-propanamine
1,1,2,2,3,3,4,4,4-Nonafluoro-N,N-bis(nonafluorobutyl)-1-butanamine
1,1,2,2,3,3,4,4,5,5,6,6,6-Tridecafluoro-N,N-bis(tridecafluorohexyl)-1-hexanamine
1,1,2,2,2-Pentafluoro-N-(pentafluoroethyl)-N-(trifluoromethyl)ethanamine
other names Tris(trifluoromethyl)amine; Perfluorotrimethylamine
Pentadecafluorotriethylamine; Perfluorotriethylamine
Heneicosafluorotripropylamine; Perfluorotripropylamine; Perfluamine
Tris(perfluoro-butyl)amine; Perfluorotributylamine
Perfluorotrihexylamine Perfluoromethyldiethyl-amine; Perfluorodiethylmethylamine
molecular formula
C3F9N;
[(CF3)3N]
C6F15N;
[(C2F5)3N]
C9F21N;
[(C3F7)3N]
C12F27N;
[(C4F9)3N]
C18F39N;
[(C6F13)3N]
C5F13N
CAS number 432-03-1 359-70-6 338-83-0 311-89-7 432-08-6 758-48-5
EC number - 206-632-5 206-420-2 206-223-1 - -
molecular weight g/mol
221.02 371.05 521.07 671.09 971.14 321.04
partitioning coefficient log KOW
1.29 (Predicted using US EPA EPI-Suite (KOWWIN v1.67 estimate))
4.18 (Predicted using US EPA EPI-Suite (KOWWIN v1.67 estimate))
6.462 (exp. value, MSDS LabNetwork)
>= 5.3 - <= 6.1 (read-across: log Kow of 5.3 is for PFHp (perfluoroheptanes); log Kow of 6.1 is for PTBA (perfluorotributylamines); REACH registration data (2021-06-14))
9.105 (exp. value, MSDS LabNetwork)
15.109±0.941 at 25 °C (calculated using Advanced Chemistry Development (ACD/Labs) Software V11.02)
11.748 (exp. value, MSDS LabNetwork)
19.103±0.998 at 25 °C (calculated using Advanced Chemistry Development (ACD/Labs) Software V11.02)
3.22 (Predicted using US EPA EPI-Suite (KOWWIN v1.67 estimate))
log KOA 1.428 at 25°C (Estimate from Log Kow [1.29 (KowWin estimate)] and log Kaw [-0.138 (HenryWin estimate)];
2.155 at 25°C (Estimate from Log Kow [4.18 (KowWin estimate)] and log Kaw [2.025 (HenryWin estimate)]; Predicted
n.a. n.a. n.a. 1.916 at 25°C (Estimate from Log Kow [3.22 (KowWin estimate)] and log Kaw [1.304 (HenryWin estimate)];

P.O. Box 400, FI-00121 Helsinki, Finland | Tel. +358 9 686180 | echa.europa.eu
52
acronym PFMAm PFEAm PFPrAm PFBAm PFHxAm
Predicted using US EPA EPI-Suite (KOAWIN v1.10 estimate))
using US EPA EPI-Suite (KOAWIN v1.10 estimate))
Predicted using US EPA EPI-Suite (KOAWIN v1.10 estimate))
log KAW -0.138 at 25°C (Predicted using US EPA EPI-Suite (HenryWin v3.10 estimate))
2.025 at 25°C (Predicted using US EPA EPI-Suite (HenryWin v3.10 estimate))
n.a. n.a. n.a. 1.304 at 25°C (Predicted using US EPA EPI-Suite (HenryWin v3.10 estimate))
dissociation constant
pKa -28.74±0.50 (calculated using Advanced Chemistry Development (ACD/Labs) Software V11.02)
pKa -27.46±0.50 (calculated using Advanced Chemistry Development (ACD/Labs) Software V11.02)
pKa -27.02±0.50 (calculated using Advanced Chemistry Development (ACD/Labs) Software V11.02)
pKa -26.84±0.50 (calculated using Advanced Chemistry Development (ACD/Labs) Software V11.02)
pKa -26.31±0.50 (calculated using Advanced Chemistry Development (ACD/Labs) Software V11.02)
pKa -28.57±0.50 (calculated using Advanced Chemistry Development (ACD/Labs) Software V11.02)
partition coefficients log Kd (sediment and overlapping dissolved phase)
n.a. n.a. n.a. n.a. n.a. n.a.
log KOC (sediment organic carbon-normalised distribution coefficient)
3.104 (Predicted using US EPA EPI-Suite (PCKOCWIN v1.66 estimate))
5.098 (Predicted using US EPA EPI-Suite (PCKOCWIN v1.66 estimate))
n.a. n.a. n.a. 4.433 (Predicted using US EPA EPI-Suite (PCKOCWIN v1.66 estimate))
water solubility
0.21 g/L in unbuffered water (pH 7) at 25 °C (calculated using Advanced Chemistry Development (ACD/Labs) Software V11.02)
1.2 mg/L in unbuffered water (pH 7) at 25 °C (calculated using Advanced Chemistry Development (ACD/Labs) Software V11.02)
0.381 ug/L (exp. result, mean value, EPA OPPTS 830.7840 (Water Solubility), flask method; REACH registration data (2021-06-14))
insoluble (exp. result; HSDB, National Library of Medicine (US))
0.081 ug/L in unbuffered water (pH 7) at 25 °C (calculated using Advanced Chemistry Development (ACD/Labs)
5.2⋅10-11 g/L in unbuffered water (pH 7) at 25 °C (calculated using Advanced Chemistry Development (ACD/Labs) Software V11.02)
5.5 mg/L in unbuffered water (pH 7) at 25 °C (calculated using Advanced Chemistry Development (ACD/Labs) Software V11.02)
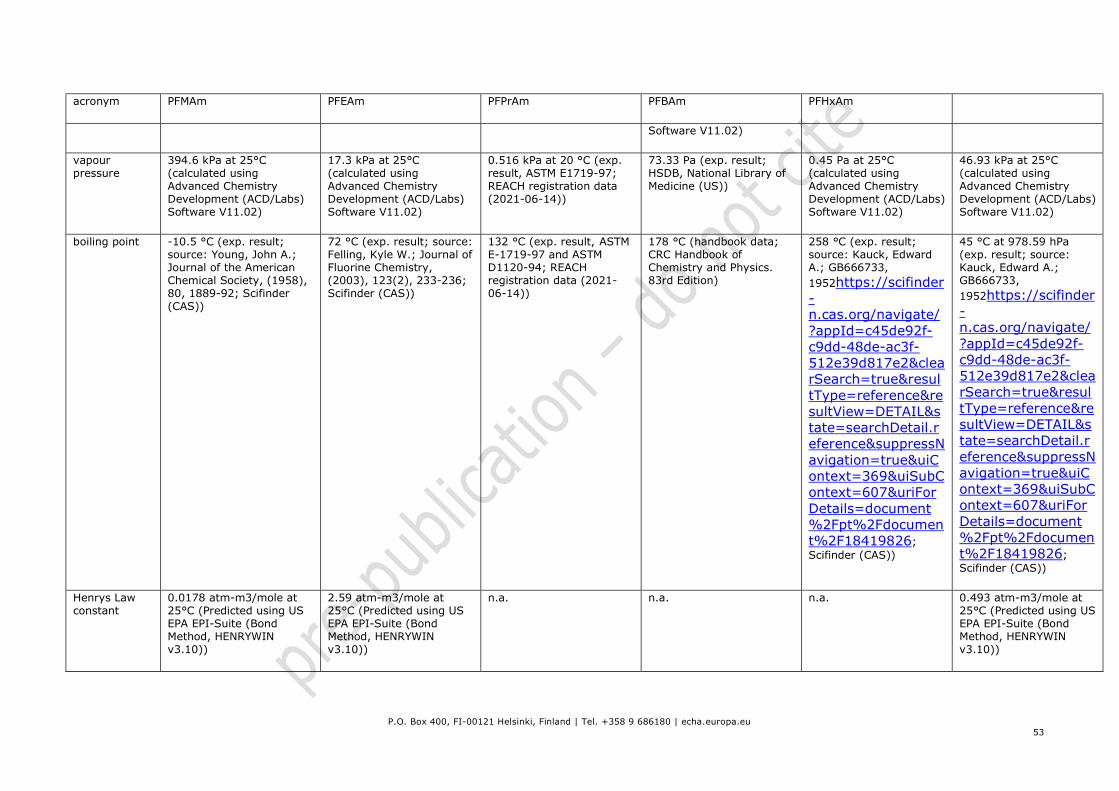
P.O. Box 400, FI-00121 Helsinki, Finland | Tel. +358 9 686180 | echa.europa.eu
53
acronym PFMAm PFEAm PFPrAm PFBAm PFHxAm
Software V11.02)
vapour pressure
394.6 kPa at 25°C (calculated using Advanced Chemistry Development (ACD/Labs) Software V11.02)
17.3 kPa at 25°C (calculated using Advanced Chemistry Development (ACD/Labs) Software V11.02)
0.516 kPa at 20 °C (exp. result, ASTM E1719-97; REACH registration data (2021-06-14))
73.33 Pa (exp. result; HSDB, National Library of Medicine (US))
0.45 Pa at 25°C (calculated using Advanced Chemistry Development (ACD/Labs) Software V11.02)
46.93 kPa at 25°C (calculated using Advanced Chemistry Development (ACD/Labs) Software V11.02)
boiling point -10.5 °C (exp. result; source: Young, John A.; Journal of the American Chemical Society, (1958), 80, 1889-92; Scifinder (CAS))
72 °C (exp. result; source: Felling, Kyle W.; Journal of Fluorine Chemistry, (2003), 123(2), 233-236; Scifinder (CAS))
132 °C (exp. result, ASTM E-1719-97 and ASTM D1120-94; REACH registration data (2021-06-14))
178 °C (handbook data; CRC Handbook of Chemistry and Physics. 83rd Edition)
258 °C (exp. result; source: Kauck, Edward A.; GB666733, 1952https://scifinder-n.cas.org/navigate/?appId=c45de92f-c9dd-48de-ac3f-512e39d817e2&clearSearch=true&resultType=reference&resultView=DETAIL&state=searchDetail.reference&suppressNavigation=true&uiContext=369&uiSubContext=607&uriForDetails=document%2Fpt%2Fdocument%2F18419826; Scifinder (CAS))
45 °C at 978.59 hPa (exp. result; source: Kauck, Edward A.; GB666733, 1952https://scifinder-n.cas.org/navigate/?appId=c45de92f-c9dd-48de-ac3f-512e39d817e2&clearSearch=true&resultType=reference&resultView=DETAIL&state=searchDetail.reference&suppressNavigation=true&uiContext=369&uiSubContext=607&uriForDetails=document%2Fpt%2Fdocument%2F18419826; Scifinder (CAS))
Henrys Law constant
0.0178 atm-m3/mole at 25°C (Predicted using US EPA EPI-Suite (Bond Method, HENRYWIN v3.10))
2.59 atm-m3/mole at 25°C (Predicted using US EPA EPI-Suite (Bond Method, HENRYWIN v3.10))
n.a. n.a. n.a. 0.493 atm-m3/mole at 25°C (Predicted using US EPA EPI-Suite (Bond Method, HENRYWIN v3.10))

P.O. Box 400, FI-00121 Helsinki, Finland | Tel. +358 9 686180 | echa.europa.eu
54
B.1.4. Justification for grouping
Generally, due to the perfluoroalkyl moieties, PFAS are either very persistent themselves or degrade to form (over a short or long timescale) terminal degradation products which still contain one or several perfluoroalkyl moieties (rendering them very persistent).
For analogy, according to ECHA guidance R.11 (ECHA, 2017), if transformation/degradation products with PBT/vPvB properties are generated, the substances themselves must be regarded as PBT/vPvB substances and should be treated like PBT/vPvB substances with regard to emission estimation and exposure control.
If there are specific PFASs for which sufficient evidence is provided that the perfluorinated bond is broken at a rate which indicates them to be not persistent, resulting a substance/substances which is/are not a PFAS, then those substances/groups should be excluded from the scope. Currently, no such PFASs are known to the dossier submitter.
PFASs have been so far subjected to regulatory risk management on a subgroup basis. For the following PFASs the Committee for risk assessment (RAC) and the Committee for Socio-economic analysis (SEAC) adopted the suggested restrictions as appropriate on reducing the risk to human health and/or the environment due to the PBT/vPvB properties of the terminal PFAS degradation products: perfluorooctanoic acid (PFOA), its salts and PFOA-related substances (ECHA, 2015); PFNA, PFDA, PFUnDA, PFDoDA, PFTrDA, PFTeDA including their salts and precursors (ECHA, 2018a); perfluorohexane sulfonic acid (PFHxS) including its salts and related substances (ECHA, 2019a); undecafluorohexanoic acid (PFHxA), its salts and related substances (ECHA, 2021a). All of the above substances were also identified as SVHC (ECHA, 2012a, ECHA, 2012b, ECHA, 2012c, ECHA, 2012d, ECHA, 2013, ECHA, 2015, ECHA, 2016c, ECHA, 2017b). Additionally, PFBS and HFPO-DA have been identified as SVHC (ECHA, 2019d, ECHA, 2019e).
Due to the high number of PFAS subgroups (see section 1.1.1) on the global market, it would take a significant amount of time to submit and process restriction proposals on all PFASs on a subgroup-by-subgroup basis, whereas the environmental stock of the very persistent PFASs would simultaneously continue to increase. Ban of single PFAS substances or subgroups may also lead to the substitution by other PFASs as the number of substances in this group is very high, so-called regrettable substitution. For some applications, production volumes may be low for specific PFASs (or even zero currently). It is noted that the overall PFAS volume across all uses is assumed to be significant (European Commission, 2020a). Consequently, the European Commission’s Chemicals Strategy for Sustainability (CSS) reiterates the concern for the persistent class of PFAS substances and suggests a group approach under relevant regulations in order to address PFASs. They state their aim as phasing out “persistent substances such as per- and polyfluoroalkyl substances (PFASs), unless their use is proven essential for society” (European Commission, 2020b).
Based on the above considerations, managing all PFASs together as a group is a clear benefit to environment and humans.
A class-based approach has been chosen for the current restriction proposal in order to prevent the possibility for regrettable substitution. This dossier has put some weight on the link between the physicochemical properties of PFASs (persistence) and their environmental and toxicological effects. This is in line with the findings from the examination of strategies for grouping of PFASs by Cousins et al. (2020a), although these authors went one step further and recommended to regulate PFASs solely on the basis of persistence (“the P-sufficient approach”). The selected grouping approach is based on the persistence of PFASs as its main concern. Almost all PFASs either are persistent themselves or degrade to environmentally stable degradation end products which are still PFASs. However, there are supporting properties triggering additional concerns in combination

P.O. Box 400, FI-00121 Helsinki, Finland | Tel. +358 9 686180 | echa.europa.eu
55
with persistence that add to the overall assessment. Those are other environmental or toxicological concerns like bioaccumulation, aqueous mobility, long-range transport, effects on humans or the environment, and high global warming potential.
It is noted that the first example of regulation of PFASs as a chemical class according to the P-sufficient approach has been introduced in California. Here a regulation of PFASs as a class is in place for certain consumer products under the California Safer Consumer Products Program (Balan et al., 2021).
In a review paper, Cousins et al. (2016) looked at the precautionary principle and chemicals management in relation to PFAA contamination of groundwater. The authors argue that all PFASs entering groundwater, irrespective of their perfluoroalkyl chain length and bioaccumulation potential, will result in poorly reversible exposures and risks, as well as further clean-up costs for society. In order to protect groundwater resources for future generations, the authors call for a precautionary approach and prevention of use and release of highly persistent and mobile chemicals such as PFASs.
For most of the investigated PFASs at least one of the mentioned additional hazardous properties applies. For the larger part of the PFAS subclass, data is still lacking, but the current restriction dossier justifies that the probability for harmful effects for the less-known PFASs, in addition to the intrinsic persistence, is sufficient for a preventive approach and a class-based restriction. A preventive approach of not using highly persistent synthetic organic substances is more protective and also overall less costly for society, both in terms of fewer tests and reduction in externalized societal costs including the expected costs of health care, loss of biodiversity, loss of ecosystem services, loss of property value and remediation (Cousins 2020a).
The proposed scope definition is in line with previous PFAS restriction proposals with an analogue approach to, e.g., PFOA, PFHxS and PFHxA with a scope definition based on a molecular structure formula. The inclusion of perfluorinated alkyl moieties as short as one perfluorinated carbon atom is in agreement with the definition of PFAS according to the UNEP/OECD Global PFC Group. Trifluoromethyl fragments are also linked via degradation to trifluoroacetic acid (TFA) which has been demonstrated to be a persistent substance with harmful properties in a comparable way as other PFASs with longer fluorinated alkyl chains. Support for the outlined justification for grouping may be found in the scientific literature, and in particular in the key papers of Wang et al. (2017), Cousins et al. (2020), Kwiatkowski et al (2020).
Naturally occurring organofluorine substances
In a review article on fluorine-containing natural products from 1999, O'Hagan and Harper explain that although ca. 3000 natural products containing the halogens chlorine, bromine and iodine have been reported, only 13 natural substances containing fluorine have been discovered. This is in contrast to fluorine being the most abundant halogen in the earth's crust (O'Hagan and Harper, 1999). The majority of the natural fluorine-containing substances are fatty acids with a single fluorine atom at the end of the carbon chain. None of the reported substances were per- or polyfluorinated. On several of the major continents, plants have been found that biosynthesise the highly toxic monofluoroacetate, presumably for the purpose of defenceFrank et al. (2002) stated that the total amount of trifluoroacetate (TFA) present in the global environment greatly exceeds what may be expected to be contributed from various industrial sources. In their study of the concentrations of trifluoroacetate (TFA) in ocean waters, the authors concluded that TFA in oceans have mostly a natural origin, while in the atmosphere, precipitate, freshwaters and needles of conifers, TFA most likely stems from anthropogenic sources.
Scott et al. (2005) further investigated whether TFA concentrations in the marine

P.O. Box 400, FI-00121 Helsinki, Finland | Tel. +358 9 686180 | echa.europa.eu
56
environment could have natural sources by determining a series of depth profiles of TFA in the Arctic, North and South Atlantic, and Pacific Oceans. They concluded that underwater vents could contribute to the TFA concentrations in the oceans. It was indicated that the heterogeneous distribution of TFA can only be partially explained by recent anthropogenic sources, while the total inventory of TFA in the oceans cannot be explained entirely by human activities. TFA in freshwaters is thought to have solely anthropogenic sources, while TFA found in oceans may be of both natural and anthropogenic origin (Fleet et al., 2018).
Zhai et al. (2015) measured the concentrations of TFA in urban landscape waters, tap water and snow in Beijing, China. A comparison between 2002- and 2012-values demonstrated a 17-fold increase from 23–98 ng/L to 345–828 ng/L in urban landscape waters. In the same period an increase from not detected to 155 ng/L occurred to TFA in tap water.
TFA in precipitation was measured by Freeling et al. (2020) in samples collected in Germany over one year. The article points to anthropogenic sources, and in particular formation of TFA in the atmosphere by photodegradation of certain hydrofluorocarbons (HFCs), hydrochlorofluorocarbons (HCFCs), and unsaturated hydrofluorocarbons (hydrofluoroolefins, HFOs) as sources of atmospheric TFA. Their findings indicate a considerable increase in the atmospheric deposition of TFA in Germany over the last two decades. Substitution of HFCs and HFOs by halogen-free gases was suggested as an effective measure to reduce the TFA load in precipitation, as HFCs and HFOs are considered as rising sources.
In summary, the number of naturally occurring organic fluorine-containing substances is low compared to other halogenated substances. TFA has been found to have natural sources in oceans (underwater vents), and oceans are the final environmental sink of the substance. TFA in the atmosphere, precipitate, freshwaters and needles of conifers most likely stems from anthropogenic sources. Concentrations of TFA in urban waters and tap water have been increasing over the last decades.
B.2. Manufacture and uses (summary)
The table below summarises some of the key results that have been discussed in more detail above (Annex A).
Table B.15. Summary of key preliminary market analysis results, from (Wood et al., 2020) PFAS-based firefighting foams Fluorine-free alternatives
Tonnage of foam used in the EEA [1]
14 000-20 000 tonnes per year 7 000 – 9 000 tonnes per year
Tonnage by substance / Substances most commonly used
Estimated at 480-560 tonnes of fluoro-surfactants used annually in EU.
Breakdown of tonnage for 8 substances available (see Table A.1 in Annex A and directly below the table), but for majority of tonnage the substances are not known.
No quantitative data.
Main alternatives used are based on hydrocarbon surfactants and detergents. Specific products are discussed in Annex E.2 (analysis of alternatives).
Breakdown of tonnage by use sector
Chemical/Petrochemical: 59%
Municipal fire brigades: 13%
Chemical/Petrochemical: 29%
Municipal fire brigades: 44%

P.O. Box 400, FI-00121 Helsinki, Finland | Tel. +358 9 686180 | echa.europa.eu
57
PFAS-based firefighting foams Fluorine-free alternatives
Marine applications: 11%
Airports: 9%
Defence: 6%
Ready for use products: 1%
Marine applications: 16%
Airports: 7%
Defence: 2%
Ready for use products: 1%
Prices Average (uncertain): €3
Reported range: €2 to €30 per litre
Average (uncertain): €3
Reported range: €0.7 to €10 per litre
Revenues [2] Best estimate: €60 million Potential range: €28-600 million
Best estimate: €27 million Potential range: €5-90 million
Functions provided and types of fires used for
Surfactant to form a film over the burning surface. Particularly relevant for fire involving flammable liquids (Class B fires).
Consultation suggests it is used both in training and true emergency responses.
Those fluorine-free foams considered alternatives to PFAS-based foams in principle provide the same (or a similar) function.
Consultation suggests it is used both in training and true emergency responses, but in some cases in training only.
Trends Rapid shift from PFAS towards fluorine-free foam in recent years, expected to continue.
Notes: [1] The original data from Eurofeu covers approximately 70% of the market, therefore this has been inflated to reflect the whole market. The lower end of the range represents the original data, whilst the upper end represents the extrapolation to the whole market. [2] The best estimate is based on the upper end of the quantity range and a weighted average price of €3/litre. The potential range is based on the lower end of the quantity range multiplied with the lower end of the price range, and the upper end of the quantity range multiplied with the upper end of the price range. An average density of 1 kg/litre has been assumed.
B.3. Classification and labelling
B.3.1. Classification and labelling in Annex VI of Regulation (EC) No 1272/2008 (CLP Regulation)
In a screening of Annex VI of CLP for PFASs with harmonised classifications, human health endpoints carcinogenicity (C), mutagenicity (M), reproductive toxicity (R) including lactation effects (L), and specific target organ toxicity following repeated exposure (STOT RE) were considered of most concern following long-term exposure. In total, 44 PFASs were identified having such a classification for one or more of these five endpoints (see Table B.16). Please note that most of these substances have additional harmonised classification for other endpoints (human health, environment and/or physicochemical properties) as well; these are however not listed in Table B.16, which is limited to C, M, R, L and STOT RE classifications. Of further note, a number of the harmonised classifications were based on read-across and not on actual data on the substance. The list contains a number of PFAAs known to be used as active substances in plant protection products and biocides which are further known to be TFA precursors.
Since the time of screening, the Committee for Risk Assessment (RAC) has evaluated

P.O. Box 400, FI-00121 Helsinki, Finland | Tel. +358 9 686180 | echa.europa.eu
58
classification proposals for a few additional PFASs (e.g. PFHpA and 6:2 FTOH). These are included in Table B.16 indicated as “CLH proposal agreed”, because so far (January 2022) they have not been officially inserted in Annex VI of CLP.
Table B.16. PFASs with harmonised classification for carcinogenicity (C), mutagenicity (M), reproductive toxicity (R), lactation effects (L) and/or specific target organ toxicity following repeated exposure (STOT RE). PFASs known as active substances in plant protection products (PPP) and biocidal products (BP) are listed in the second part of the table.
Index no.
EC Number
CAS number Substance name/abbr.
Harmonised classification for Carc./Muta./Repr./Lact. and/or STOT RE
607-704-00-2
206-397-9
335-67-1 PFOA
Carc. 2; H351 / Repr. 1B; H360D / Lact.; H362 / STOT RE 1; H372 [liver]
607-720-00-X
206-400-3
335-76-2 PFDA
Carc. 2; H351 / Repr. 1B; H360Df / Lact.; H362
607-718-00-9
206-801-3
375-95-1 PFNA
Carc. 2; H351 / Repr. 1B; H360Df / Lact.; H362 / STOT RE 1; H372 [liver; thymus; spleen]
607-624-00-8
217-179-8
1763-23-1 PFOS
Carc. 2; H351 / Repr. 1B; H360D / Lact.; H362 / STOT RE 1; H372
602-086-00-0
219-014-5
2314-97-8 Trifluoroiodomethane Muta. 2; H341
607-624-00-8
220-527-1
2795-39-3 PFOS-Potassium salt
Carc. 2; H351 / Repr. 1B; H360D / Lact.; H362 / STOT RE 1; H372
607-703-00-7
223-320-4
3825-26-1 APFO (PFOA Ammonium salt)
Carc. 2; H351 / Repr. 1B; H360D / Lact.; H362 / STOT RE 1; H372 [liver]
607-624-00-8
249-415-0
29081-56-9 PFOS Ammonium salt
Carc. 2; H351 / Repr. 1B; H360D / Lact.; H362 / STOT RE 1; H372
607-624-00-8
249-644-6
29457-72-5 PFOS Lithium salt
Carc. 2; H351 / Repr. 1B; H360D / Lact.; H362 / STOT RE 1; H372
607-624-00-8
274-460-8
70225-14-8 PFOS Diethanolamine
Carc. 2; H351 / Repr. 1B; H360D / Lact.; H362 / STOT RE 1; H372
612-094-00-6
402-190-4
113674-95-6
4-(2-chloro-4-trifluoromethyl)phenoxy-2-fluoroaniline hydrochloride STOT RE 2; H373 / STOT RE 1; H372
616-048-00-6
406-740-4
1939-27-1 3'-trifluoromethylisobutyranilide STOT RE 2; H373
607-344-
407-810-
- (PFAS mixture) STOT RE 2; H373

P.O. Box 400, FI-00121 Helsinki, Finland | Tel. +358 9 686180 | echa.europa.eu
59
Index no.
EC Number
CAS number Substance name/abbr.
Harmonised classification for Carc./Muta./Repr./Lact. and/or STOT RE
00-6 7
613-183-00-2
413-640-4 - (PFAS mixture) STOT RE 2; H373
616-124-00-9
415-300-0
90076-65-6
lithium bis(trifluoromethylsulfonyl)imide STOT RE 2; H373
613-198-00-4
415-500-8
145963-84-4
2-amino-4-dimethylamino-6-trifluoroethoxy-1,3,5-triazine STOT RE 2; H373
606-124-00-7
421-080-7
161462-35-7
1-cyclopropyl-3-(2-methylthio-4-trifluoromethylphenyl)-1,3-propanedione STOT RE 2; H373
616-197-00-7
422-500-1 - (PFAS reaction mass) STOT RE 2; H373
607-527-00-0
423-180-6 - (PFAS mixture) STOT RE 2; H373
613-236-00-X
424-520-6
65753-47-1 2-chloro-3-trifluoromethylpyridine STOT RE 1; H372
616-158-00-4
427-880-2
90357-53-2
N-[4-cyano-3-trifluoromethylphenyl]methacrylamide STOT RE 2; H373
612-221-00-5
429-560-8
4274-38-8 - STOT RE 2; H373
607-612-00-2
432-190-1
182176-52-9 (PFAS reaction mass) STOT RE 2; H373
603-221-01-3
433-580-2
214353-17-0 - Carc. 1B; H350
607-718-00-9 -
21049-39-8 PFNA Sodium salt
Carc. 2; H351 / Repr. 1B; H360Df / Lact.; H362 / STOT RE 1; H372 [liver; thymus; spleen]
607-720-00-X
- 3108-42-7 PFDA Ammonium salt
Carc. 2; H351 / Repr. 1B; H360Df / Lact.; H362
607-720-00-X
- 3830-45-3 PFDA Sodium salt
Carc. 2; H351 / Repr. 1B; H360Df / Lact.; H362
607-718-00-9
- 4149-60-4 PFNA Ammonium salt
Carc. 2; H351 / Repr. 1B; H360Df / Lact.; H362 / STOT RE 1; H372 [liver; thymus; spleen]

P.O. Box 400, FI-00121 Helsinki, Finland | Tel. +358 9 686180 | echa.europa.eu
60
Index no.
EC Number
CAS number Substance name/abbr.
Harmonised classification for Carc./Muta./Repr./Lact. and/or STOT RE
-
647-42-7 6:2 FTOH
CLH proposal agreed (STOT RE 2; H373 [teeth, bone]
- 206-798-9
375-85-9 PFHpA
CLH proposal agreed (Repr. 1B, H360D / STOT RE1 [liver]
PFASs known as active substances in plant protection products a./o. biocidal products (approved or not approved)
606-054-00-7
604-222-4
141112-29-0 Isoxaflutole* Repr. 2; H361d
613-164-00-9
604-290-5
142459-58-3 Flufenacet* STOT RE 2; H373
607-700-00-0
604-398-2
144171-61-9 Indoxacarb*/**
STOT RE 1; H372 [blood; nervous system; heart]
607-700-00-0
605-683-4
173584-44-6 s-Indoxacarb*/**
STOT RE 1; H372 [blood; nervous system; heart]
606-149-00-3
608-879-8
335104-84-2 Tembotrione*
Repr. 2; H361d / STOT RE 2; H373 [eyes; kidneys; liver]
609-046-00-1
216-428-8
1582-09-8 Trifluralin* Carc. 2; H351
607-714-00-7
603-146-9
126535-15-7 Trisulfuron-methyl* Carc. 2; H351
612-289-00-6
614-708-8
68694-11-1 Triflumizole* Repr. 1B; H360D / STOT RE 2; H373 [liver]
613-181-00-1
405-090-9
67485-29-4 Hydramethylnon* STOT RE 1; H372
607-304-00-8
274-125-6
69806-50-4 Fluazifop-butyl* Repr. 1B; H360D
607-305-00-3
616-669-2
79241-46-6 Fluazifop-P-butyl* Repr. 2; H361d
612-287-00-5
616-712-5
79622-59-6 Fluazinam* Repr. 2; H361d
607-699-00-7
617-373-6
82657-04-3 Bifenthrin*/**
Carc. 2; H351 / STOT RE 1; H372 [nervous system]

P.O. Box 400, FI-00121 Helsinki, Finland | Tel. +358 9 686180 | echa.europa.eu
61
Index no.
EC Number
CAS number Substance name/abbr.
Harmonised classification for Carc./Muta./Repr./Lact. and/or STOT RE
608-055-00-8
424-610-5
120068-37-3 Fipronil** STOT RE 1; H372
607-375-00-5
421-960-0
90035-08-8 Flocoumafen** Repr. 1B; H360D / STOT RE 1; H372 [blood]
616-206-00-4
417-680-3
101463-69-8 Flufenoxuron** Lact.; H362
* = PPP; ** = BP
B.3.2. Classification and labelling in classification and labelling inventory/ Industry’s self classification(s) and labelling1
Self-classifications on human health hazards:
Of the approximately 11 000 PFASs listed in total in the ECHA and OECD databases, almost 6 800 are listed in the ECHA databases on registrations and notifications. Hence, for almost 61 % of the PFASs there is information on classification. Of these 6 800 PFASs, almost 6 600 have a (self-)classification indicated in the registrations or notifications for at least one environmental, human health and/or physicochemical endpoint. Among these, an additional 344 substances to the 44 already identified in B.3.1 have a self-classification for one or more of the five human health endpoints considered of most concern following long term exposure of humans to PFASs (C, M, R, L, STOT RE). Table B.18 presents the total of 388 PFASs classified for C, M, R, L and/or STOT RE (mostly self-classifications), subdivided into PFAS categories used in ECHA’s mass screenings. The 388 substances fall into 46 ECHA PFAS -categories in total. The listed PFASs are most often classified for STOT RE (234), followed by R (179), C (82), L (45) and M (40) (Figure B.3). The remaining 192 PFASs have no classification indicated for ecotoxicological, toxicological and/or physicochemical properties in either the registrations or notifications. This might very well be due to absence of data and not due to data showing that classification is not required.
Table B.17. PFASs (subdivided into PFAS categories) with harmonised or self-classification for carcinogenicity (Carc.), mutagenicity (Muta.), reproductive toxicity (Repr.), effects on or via lactation (Lact.) and/or specific target organ toxicity following repeated exposure (STOT RE), re-arranged into ‘arrowheads’ and ‘possible PFAA precursors’
EC-no. Counts PFAS categories Carc. Muta. Repr. STOT RE Lact.
POSSIBLE PFAA PRECURSORS
14 CnF2n* 3 5 10 9 0
5 complex** 3 0 1 1 0
5 fluorotelomer alcohol 1 0 2 4 0
2 fluorotelomer epoxides 2 2 0 0 0
1 fluorotelomer methacrylates (other) 0 0 0 1 0
4 hydrofluoroethers 2 0 1 2 0
2 hydrofluoroolefins (HFO) 0 2 0 1 0

P.O. Box 400, FI-00121 Helsinki, Finland | Tel. +358 9 686180 | echa.europa.eu
62
EC-no. Counts PFAS categories Carc. Muta. Repr. STOT RE Lact.
4 n:1 fluorotelomer alcohols (FTOHs) 1 0 2 2 0
27 n:1 fluorotelomer-based non-polymers 4 2 15 13 1
1 n:1 FT (meth)acrylate 1 0 0 0 0
1 n:2 fluorotelomer acrylates 0 0 0 1 0
1 n:2 fluorotelomer alcohols 0 0 1 1 0
1 n:2 fluorotelomer ethoxylates 0 1 1 0 0
1 n:2 fluorotelomer methacrylates 0 0 0 1 0
4 n:2 fluorotelomer olefins 0 0 1 4 0
1 n:2 fluorotelomer phosphate esters 0 0 0 1 0
2 n:2 fluorotelomer silanes 0 0 1 2 0
6 n:2 fluorotelomer sulfonic acids (n:2 FTSAs) 0 0 0 6 0
1 n:2 fluorotelomer sulfonyl based compounds 0 0 0 1 0
5 n:2 fluorotelomer-based non-polymers 0 0 0 5 0
1 n:2 fluorotelomer-thiol derivatives 0 0 1 1 0
4 other carbonyl-based non-polymers 3 0 0 2 0
20 other fluorotelomer-based non-polymers 2 0 16 9 8
11 other per - and polyfluoroalkyl ether based substances 0 0 2 9 1
4 other sulfonyl-based non-polymers 0 0 0 4 0
2 perfluoroalkenes 1 0 0 2 0
5 perfluoroalkyl carbonyl amides 3 1 3 1 0
2 perfluoroalkyl carbonyl halides 0 0 0 2 0
2 Perfluoroalkyl carboxylic acids (PFCAs) esters 0 1 1 0 1
1 perfluoroalkyl epoxides 0 0 0 1 0
5 perfluoroalkyl iodides 0 1 2 3 0
2 perfluoroalkyl ketones 0 0 2 1 0
2 perfluoroalkyl phosphate esters (PAPs) 0 0 0 2 0
5 perfluoroalkyl sulfonamides 0 0 2 4 0
2 perfluoroalkyl sulfonamidoethanols 0 0 1 2 0
1 per- and polyfluoroether carboxylic acids (PFECAs) halides 0 0 0 1 0
1 perfluoroalkyl sulfonyl halides 0 0 1 1 0
7 perfluoroalkyl sulfonic acids (PFSA) esters 2 2 2 2 2
155 side-chain aromatics 25 14 81 90 14
320 possible PFAA precursors 53 31 149 192 27
88% of total PFASs (n=362) 17% 10% 47% 60% 8%
ARROWHEADS
4 no ECHA category, OECD category: perfluoroalkyl carboxylic acids (PFCAs) + salts 4 0 4 2 4
5 per- and polyfluoroether carboxylic acids (PFECAs) 0 0 1 4 0
8 perfluoroalkyl carboxylic acids (PFCAs) + salts 5 0 7 4 4
10 perfluoroalkyl sulfonic acids (PFSAs) + salts 8 0 7 8 6
27 Arrowheads (PFAAs) 17 0 19 18 14

P.O. Box 400, FI-00121 Helsinki, Finland | Tel. +358 9 686180 | echa.europa.eu
63
EC-no. Counts PFAS categories Carc. Muta. Repr. STOT RE Lact.
8% of total PFASs (n=362) 63% 0% 70% 67% 52%
Not assignable to a category (currently)
10 no ECHA category, no OECD category, entry in ECHA list 3 0 3 7 0
5 other PFASs 0 2 2 3 0
15 Not assignable to a category 3 2 5 10 0
4% of total PFASs (n=362) 21% 14% 36% 71% 0% * The PFAS category ‘CnF2n’ refers to PFASs containing a -CF2- moiety. These substances fulfil the PFAS definition in section 1.1.1. ** The PFAS category ‘complex’ refers to metal complexes.
The 362 substances fall into 43 PFAS categories in total. The listed PFASs are most often classified for STOT RE (220), followed by Repr. (173), Carc. (73), Lact. (41), and Muta. (33) (Figure B.3).
Figure B.3. Frequency of hazard classes on the five endpoints of concern (C = Carcinogenicity, M= Mutagenicity, R = Toxicity in Reproduction, L = Lactation effects, STOT RE = specific target organ toxicity following repeated exposure).
The fact that several thousands of PFASs do not have (self-)classification for the endpoints of most concern (C, M, R, L and/or STOT RE) does not mean that these PFASs do not have these properties, but most likely that study data to base classification on are lacking for the majority of them. Given the fact that the current (self-)classifications concern already so many different PFAS categories, it can certainly not be excluded that they may have one or more of the properties of concern.
The 388 PFASs from the ECHA database found in the classification analysis, originating from 46 ECHA PFAS categories, were re-arranged into three main classes: polymers, precursors and arrowheads. From Table B.19, the result of the re-arrangement, it can be seen that the majority of the 388 substances classified for C, M, R, L and/or STOT RE are PFAA precursors (such as fluorotelomers, perfluoroalkyl carbonyl amides and -halides, etc.)
Carc., 20%
Muta., 9%
Repr., 48%
Lact, 11%
STOT RE, 61%

P.O. Box 400, FI-00121 Helsinki, Finland | Tel. +358 9 686180 | echa.europa.eu
64
as well as potential TFA precursors, such as side chain aromatics with CF3-R (where R=non-PFAS). Approximately 7% of the 388 PFASs are PFAA arrowheads (including carboxylic and sulfonic acids and salts as well as PFA ethers). It should be, however, noted that the allocation between PFAA and TFA precursors is not straightforward and the allocation in the table should be considered as indicative only.
Repeated exposure to the classified PFASs affected various organs such as liver, kidney, thymus, endocrine system, immune system, nervous system, respiratory system, spleen, blood, heart and cardiovascular system, brain, bone marrow, skin, lymph nodes, testicles, uterus, and gastrointestinal tract. Target effects of reproductive and developmental toxicity are reported as adverse effects on i.e. fertility, pup survival, offspring viability and on the foetal skeleton. Carcinogenicity and mutagenicity in categories 1 and 2 are reported as well as lactation effects. For further details, please see Table B.20 below.

P.O. Box 400, FI-00121 Helsinki, Finland | Tel. +358 9 686180 | echa.europa.eu
65
Table B.18. PFASs with harmonised or self-classification for carcinogenicity (C), mutagenicity (M), reproductive toxicity (R), lactation effects (L) and/or specific target organ toxicity following repeated exposure (STOT RE), subdivided into ECHA PFAS categories.
Note: The ECHA category ‘complex’ refers to metal complexes.
EC-no. Counts ECHA categories
C M R STOT RE
L C+M C+R M+R C+M+R
C+SR C+L M+SR R+SR R+L R+SR+L
C+M+L
C+R+SR
C+R+L
C+R+SR+L
CMR+SR CMR+L C only M only R only SR only L only Total
37 CnF2n 11 12 16 20 4 3 1 0 0 0 0 1 4 1 0 2 0 0 0 3 1 1 2 6 12 0 37
5 complex 3 0 1 1 0 0 0 0 0 0 0 0 0 0 0 0 0 0 0 0 0 3 0 1 1 0 5
5 fluorotelomer alcohol 1 0 2 4 0 0 0 0 0 0 0 0 2 0 0 0 0 0 0 0 0 1 0 0 2 0 5
2 fluorotelomer epoxides 2 2 0 0 0 2 0 0 0 0 0 0 0 0 0 0 0 0 0 0 0 0 0 0 0 0 2
1 fluorotelomer methacrylates (other) 0 0 0 1 0 0 0 0 0 0 0 0 0 0 0 0 0 0 0 0 0 0 0 0 1 0 1
4 Hydrofluoroethers 2 0 1 2 0 0 0 0 0 0 0 0 1 0 0 0 0 0 0 0 0 2 0 0 1 0 4
2 Hydrofluoroolefins (HFO) 0 2 0 1 0 0 0 0 0 0 0 1 0 0 0 0 0 0 0 0 0 0 1 0 0 0 2
4 n:1 fluorotelomer alcohols (FTOHs) 1 0 2 2 0 0 0 0 0 0 0 0 1 0 0 0 0 0 0 0 0 1 0 1 1 0 4
27 n:1 fluorotelomer-based non-polymers 4 2 15 13 1 0 1 0 0 0 1 1 5 0 0 0 0 0 0 0 0 2 1 9 7 0 27
1 n:1 FT (meth)acrylate 1 0 0 0 0 0 0 0 0 0 0 0 0 0 0 0 0 0 0 0 0 1 0 0 0 0 1
1 n:2 fluorotelomer acrylates 0 0 0 1 0 0 0 0 0 0 0 0 0 0 0 0 0 0 0 0 0 0 0 0 1 0 1
1 n:2 fluorotelomer alcohols 0 0 1 1 0 0 0 0 0 0 0 0 1 0 0 0 0 0 0 0 0 0 0 0 0 0 1
1 n:2 fluorotelomer ethoxylates 0 1 1 0 0 0 0 1 0 0 0 0 0 0 0 0 0 0 0 0 0 0 0 0 0 0 1
1 n:2 fluorotelomer methacrylates 0 0 0 1 0 0 0 0 0 0 0 0 0 0 0 0 0 0 0 0 0 0 0 0 1 0 1
4 n:2 fluorotelomer olefins 0 0 1 4 0 0 0 0 0 0 0 0 1 0 0 0 0 0 0 0 0 0 0 0 3 0 4
3 n:2 fluorotelomer phosphate esters (PAPs) 0 0 0 3 0 0 0 0 0 0 0 0 0 0 0 0 0 0 0 0 0 0 0 0 3 0 3
2 n:2 fluorotelomer silanes 0 0 1 2 0 0 0 0 0 0 0 0 1 0 0 0 0 0 0 0 0 0 0 0 1 0 2
6 n:2 fluorotelomer sulfonic acids (n:2 FTSAs) 0 0 0 6 0 0 0 0 0 0 0 0 0 0 0 0 0 0 0 0 0 0 0 0 6 0 6
1 n:2 fluorotelomer sulfonyl based compounds 0 0 0 1 0 0 0 0 0 0 0 0 0 0 0 0 0 0 0 0 0 0 0 0 1 0 1
5 n:2 fluorotelomer-based non-polymers 0 0 0 5 0 0 0 0 0 0 0 0 0 0 0 0 0 0 0 0 0 0 0 0 5 0 5
1 n:2 fluorotelomer-thiol derivatives 0 0 1 1 0 0 0 0 0 0 0 0 1 0 0 0 0 0 0 0 0 0 0 0 0 0 1
11 no ECHA category, no OECD category, Entry in ECHA list 3 0 3 8 0 0 0 0 0 0 0 0 3 0 0 0 0 0 0 0 0 3 0 0 5 0 11
4 no ECHA category, OECD category: perfluoroalkyl carboxylic acids (PFCAs), their salts and esters4 0 4 2 4 0 0 0 0 0 0 0 0 0 0 0 0 2 2 0 0 0 0 0 0 0 4
4 other carbonyl-based non-polymers 3 0 0 2 0 0 0 0 0 1 0 0 0 0 0 0 0 0 0 0 0 2 0 0 1 0 4
20 other fluorotelomer-based non-polymers 2 0 16 9 8 0 0 0 0 1 0 0 4 6 1 0 0 1 0 0 0 0 0 4 3 0 20
11 other per - and polyfluoroalkyl ether based substances 0 0 2 9 1 0 0 0 0 0 0 0 0 1 0 0 0 0 0 0 0 0 0 1 9 0 11
3 other PFAS 0 1 2 2 0 0 0 0 0 0 0 0 2 0 0 0 0 0 0 0 0 0 1 0 0 0 3
4 other sulfonyl-based non-polymers 0 0 0 4 0 0 0 0 0 0 0 0 0 0 0 0 0 0 0 0 0 0 0 0 4 0 4
5 Per- and polyfluoroether carboxylic acids (PFECAs) 0 0 1 4 0 0 0 0 0 0 0 0 0 0 0 0 0 0 0 0 0 0 0 1 4 0 5
1 Per- and polyfluoroether carboxylic acids (PFECAs) halides 0 0 0 1 0 0 0 0 0 0 0 0 0 0 0 0 0 0 0 0 0 0 0 0 1 0 1
1 perfluoroalkanes 0 0 0 1 0 0 0 0 0 0 0 0 0 0 0 0 0 0 0 0 0 0 0 0 1 0 1
4 perfluoroalkenes 2 0 0 4 0 0 0 0 0 2 0 0 0 0 0 0 0 0 0 0 0 0 0 0 2 0 4
5 perfluoroalkyl carbonyl amides 3 1 3 1 0 0 0 0 1 0 0 0 1 0 0 0 0 0 0 0 0 2 0 1 0 0 5
2 perfluoroalkyl carbonyl halides 0 0 0 2 0 0 0 0 0 0 0 0 0 0 0 0 0 0 0 0 0 0 0 0 2 0 2
2 Perfluoroalkyl carboxylic acids (PFCAs) + esters 0 1 1 0 1 0 0 0 0 0 0 0 0 1 0 0 0 0 0 0 0 0 1 0 0 0 2
8 Perfluoroalkyl carboxylic acids (PFCAs) + salts 5 0 7 4 4 0 0 0 0 0 0 0 1 0 0 0 0 1 3 0 0 1 0 2 0 0 8
1 perfluoroalkyl epoxides 0 0 0 1 0 0 0 0 0 0 0 0 0 0 0 0 0 0 0 0 0 0 0 0 1 0 1
1 perfluoroalkyl halides 0 1 0 0 0 0 0 0 0 0 0 0 0 0 0 0 0 0 0 0 0 0 1 0 0 0 1
5 perfluoroalkyl iodides 0 1 2 3 0 0 0 0 0 0 0 0 1 0 0 0 0 0 0 0 0 0 1 1 2 0 5
2 perfluoroalkyl ketones 0 0 2 1 0 0 0 0 0 0 0 0 1 0 0 0 0 0 0 0 0 0 0 1 0 0 2
5 Perfluoroalkyl sulfonamides 0 0 2 4 0 0 0 0 0 0 0 0 1 0 0 0 0 0 0 0 0 0 0 1 3 0 5
2 Perfluoroalkyl sulfonamidoethanols 0 0 1 2 0 0 0 0 0 0 0 0 1 0 0 0 0 0 0 0 0 0 0 0 1 0 2
10 Perfluoroalkyl sulfonic acids (PFSAs) + salts 8 0 7 8 6 0 0 0 0 0 0 0 1 0 0 0 0 0 6 0 0 2 0 0 1 0 10
1 perfluoroalkyl sulfonyl halides 0 0 1 1 0 0 0 0 0 0 0 0 1 0 0 0 0 0 0 0 0 0 0 0 0 0 1
7 PFSAs esters 2 2 2 2 2 0 0 0 0 0 0 0 0 1 1 0 0 0 0 0 0 2 2 0 1 0 7
155 Side-chain aromatics 25 14 81 90 14 0 7 2 2 3 0 4 21 5 6 0 3 1 1 0 0 8 6 33 52 1 155
388 46 82 40 179 234 45 5 9 3 3 7 1 7 55 15 8 2 3 5 12 3 1 31 16 62 139 1 388

P.O. Box 400, FI-00121 Helsinki, Finland | Tel. +358 9 686180 | echa.europa.eu
66
Table B.19. PFASs with harmonised or self-classification for carcinogenicity (C), mutagenicity (M), reproductive toxicity (R), lactation effects (L) and/or specific target organ toxicity following repeated exposure (STOT RE), re-arranged into three PFAS main classes, and ‘currently not-classifiable’ PFASs.
EC-no. Counts ECHA categories
C M R STOT RE
L
PFAA PRECURSORS
37 CnF2n 11 12 16 20 4
5 complex 3 0 1 1 0
5 fluorotelomer alcohol 1 0 2 4 0
2 fluorotelomer epoxides 2 2 0 0 0
1 fluorotelomer methacrylates (other) 0 0 0 1 0
4 Hydrofluoroethers 2 0 1 2 0
2 Hydrofluoroolefins (HFO) 0 2 0 1 0
4 n:1 fluorotelomer alcohols (FTOHs) 1 0 2 2 0
27 n:1 fluorotelomer-based non-polymers 4 2 15 13 1
1 n:1 FT (meth)acrylate 1 0 0 0 0
1 n:2 fluorotelomer acrylates 0 0 0 1 0
1 n:2 fluorotelomer alcohols 0 0 1 1 0
1 n:2 fluorotelomer ethoxylates 0 1 1 0 0
1 n:2 fluorotelomer methacrylates 0 0 0 1 0
4 n:2 fluorotelomer olefins 0 0 1 4 0
3 n:2 fluorotelomer phosphate esters (PAPs) 0 0 0 3 0
2 n:2 fluorotelomer silanes 0 0 1 2 0
6 n:2 fluorotelomer sulfonic acids (n:2 FTSAs) 0 0 0 6 0
1 n:2 fluorotelomer sulfonyl based compounds 0 0 0 1 0
5 n:2 fluorotelomer-based non-polymers 0 0 0 5 0
1 n:2 fluorotelomer-thiol derivatives 0 0 1 1 0
4 other carbonyl-based non-polymers 3 0 0 2 0
20 other fluorotelomer-based non-polymers 2 0 16 9 8
11 other per - and polyfluoroalkyl ether based substances 0 0 2 9 1
4 other sulfonyl-based non-polymers 0 0 0 4 0
4 perfluoroalkenes 2 0 0 4 0
5 perfluoroalkyl carbonyl amides 3 1 3 1 0
2 perfluoroalkyl carbonyl halides 0 0 0 2 0
2 Perfluoroalkyl carboxylic acids (PFCAs) + esters 0 1 1 0 1
1 perfluoroalkyl epoxides 0 0 0 1 0
1 perfluoroalkyl halides 0 1 0 0 0
5 perfluoroalkyl iodides 0 1 2 3 0
2 perfluoroalkyl ketones 0 0 2 1 0
5 Perfluoroalkyl sulfonamides 0 0 2 4 0
2 Perfluoroalkyl sulfonamidoethanols 0 0 1 2 0
1 perfluoroalkyl sulfonyl halides 0 0 1 1 0
7 PFSAs esters 2 2 2 2 2
190 PFAA precursors 37 25 74 114 17
49% of total PFAS (n=388) 19% 13% 39% 60% 9%
TFA PRECURSORS
155 Side-chain aromatics (TFA presursors) 25 14 81 90 14
40% of total PFAS (n=388) 16% 9% 52% 58% 9%
ARROW HEADS
4 no ECHA category, OECD category: perfluoroalkyl carboxylic acids (PFCAs), their salts and esters4 0 4 2 45 Per- and polyfluoroether carboxylic acids (PFECAs) 0 0 1 4 0
1 Per- and polyfluoroether carboxylic acids (PFECAs) halides 0 0 0 1 01 perfluoroalkanes 0 0 0 1 0
8 Perfluoroalkyl carboxylic acids (PFCAs) + salts 5 0 7 4 410 Perfluoroalkyl sulfonic acids (PFSAs) + salts 8 0 7 8 6
29 Arrow Heads (PFAAs) 17 0 19 20 14
7% of total PFAS (n=388) 59% 0% 66% 69% 48%
Not Classifiable (currently)
11 no ECHA category, no OECD category, Entry in ECHA list 3 0 3 8 03 other PFAS 0 1 2 2 0
14 Not assignable to a category 3 1 5 10 0
4% of total PFAS (n=388) 21% 7% 36% 71% 0%

P.O. Box 400, FI-00121 Helsinki, Finland | Tel. +358 9 686180 | echa.europa.eu
67
Table B.20. Details on available classification information for the endpoints of concern C, M, R, L, STOT RE for classified PFASs in the three PFAS main classes, and non-assignable PFASs.
PFAS class
Percentage of 362 classified PFASs
Carc. Muta. Repr. Lact. STOT RE STOT RE affected organs:
Possible PFAA precursors incl. TFA precursors (incl. telomers, epoxides, halides, F-gases, olefins, esters, side-chain aromatics, etc.)
88% 17% 10% 47% 8% 60%
Multiple tissues and organs, damage to various organs; liver, hepatobiliary system, kidneys, adrenals, adrenal gland, blood, blood vessels, hematological effects, teeth, nervous system, heart, lower urinary tract, gastrointestinal tract, pancreas, thyroid, adrenal gland, lungs, respiratory organs/system, prostate, testicles, seminal vesicle, skin, female reproductive organs, ovaries, uterus, endocrine system, immune system, lymph nodes, skeletal muscle, bone tissue, bones, bone marrow, eyes, brain, thymus, spleen, gonads, mouth, pharynx, oesophagus face mussels, pancreas.
Arrowheads (incl. carboxylic, sulfonic acids and salts)
8% 61% 0% 68% 50% 68% Damage to organs, liver, kidneys, blood, lung, central nervous system, cardiovascular system.
Not assignable PFASs 4% 21% 14% 36% 0% 64%
Liver, kidneys, adrenals, renal system, ovary, testes, gastrointestinal tract, nervous system, hematopoietic system, immune system, respiratory system.

P.O. Box 400, FI-00121 Helsinki, Finland | Tel. +358 9 686180 | echa.europa.eu
68
Self-classifications on environmental hazards:
1 129 PFASs of the 6 600 PFASs listed in ECHA database on registration and C&L notification have a self-classification on hazardous to the aquatic environment (Aquatic Acute and/or Aquatic Chronic) or hazardous to the ozone layer. Further 4 substances have self-classifications on hazardous to the aquatic environment (Aquatic Chronic 2 and 3) as well as to the ozone layer. The PFASs are most often classified for Aquatic Chronic 4 (444) followed by Aquatic Acute 1 + Aquatic Chronic 1 (322), Aquatic Chronic 2 (135) and Aquatic Chronic 3 (110). Further self-classifications are shown in Figure B.4. For information on the evaluation of the database: If for one substance different self-classifications on long-term aquatic hazard (different categories on Aquatic Chronic) were listed, the classification with the most entries were chosen. If the number was the same, the more stringent was selected.
Figure B.4. PFAS with self-classifications on hazardous to the aquatic environment and the ozone layer
B.4. Environmental fate properties
B.4.1. Degradation
B.4.1.1. Degradation - general
Common for PFASs is that they have perfluoroalkyl moieties present, resulting in a shared resistance to environmental and metabolic degradation. The resistance to degradation of the perfluoroalkyl moiety is primarily due to the high electronegativity and low polarisability of fluorine, which results in the strongest covalent bond known in organic chemistry: the C-F bond (Kissa, 2001). The C-F bond is resistant to acids, bases, oxidation and reduction, and even high temperatures. Multiple C–F bonds on the same geminal carbon lead to additional strengthening of the C–F bond. The strong electron withdrawing effect of the fluorine atoms in perfluoroalkyl moieties also strengthens the skeletal bonds in the carbon chain (Cousins et al., 2020b);(O'Hagan, 2008). It is not expected that the length of the perfluoroalkyl chain
23
444
110
135
30
53
3
13
322
0 50 100 150 200 250 300 350 400 450 500
Hazardous to the Ozone Layer (Category 1)
solely Aquatic Chronic 4
solely Aquatic Chronic 3
solely Aquatic Chronic 2
solely Aquatic Chronic 1
solely Aquatic Acute 1
Aquatic Acute 1 + Aquatic Chronic 3
Aquatic Acute 1 + Aquatic Chronic 2
Aquatic Acute 1 + Aquatic Chronic 1

P.O. Box 400, FI-00121 Helsinki, Finland | Tel. +358 9 686180 | echa.europa.eu
69
has any major impact on the inherent stability of PFASs.
As illustrated in Figure 1 in section 1.1.1, many PFASs have non-fluorinated moieties attached to the perfluorinated moiety. During degradation processes non-fluorinated moieties of molecules are transformed and oxidative processes often lead to a gradual conversion of non-fluorinated carbon atoms to CO2 which is lost to the atmosphere while the degrading substance structure is gradually getting smaller. In the end most of the non-fluorinated parts are usually lost, with the perfluoroalkyl part is remaining, often attached to a functional group at its highest oxidation state (e.g. carboxylic acid). Such functional groups often carry a negative charge which leads to an increased polarity for the degradation products. Small molecules tend to be more volatile than large ones, and high polarity of compounds are usually associated with increased solubility in water. Hence, degradation products of PFASs may be assumed to have elevated mobility with water and air currents compared to their corresponding precursor substances. Examples of such degradation include 6:2 FTOH which degrades in the environment with formation of PFHxA (see PFHxA restriction dossier), and some side-chain fluorinated polymers which degrade via the loss of fluorotelomer side-chains which are transformed to PFCAs in the environment in oxidative degradation.
All PFASs are, or ultimately transform into, stable substances, often PFAAs (Cousins et al., 2020b). PFCAs degrade slowly in the air with atmospheric life-times estimated at 130 to 230 days (for C1 to C4 PFCAs), while the main atmospheric removal mechanism is via wet and dry deposition which occurs in a timescale of the order of 10 days (Hurley et al., 2004). (Liou et al., 2010) investigated the biodegradability of PFOA and found the substance to be microbiologically inert and environmentally persistent. If PFAAs degrade, they do it so slowly that it is not observable and their half-lives could be in the order of decades, centuries or even greater (Parsons et al., 2008).
Wang et al. (2017b) explain that perfluoroalkyl (CnF2n+1-) and perfluoroether (CnF2n+1−O−CmF2m+1−) moieties are very persistent under natural conditions. Even though some PFASs may partially degrade in the environment and biota, they will all ultimately transform into highly stable end products, which are usually the very persistent perfluoroalkyl or perfluoroalkyl(poly)ether acids (here collectively termed “PFAAs”), for example, PFCAs, PFSAs, PFECAs, and PFESAs.
Parsons et al. (2008) reviewed the biodegradation of perfluorinated compounds. The authors pointed out that the most theoretically plausible degradation pathway for PFASs is through reductive defluorination, which could occur under anaerobic conditions. The same authors reported for PFOS that no biodegradation was observed under aerobic conditions, while there were some observations of degradation of PFOS under anaerobic conditions though no metabolites were measured in these studies. In principle, it cannot be ruled out that some degradation of other PFASs under anaerobic conditions can occur (e.g. in hypoxic groundwater, marine water or sediments), or will occur in the future if bacteria adapt to utilise the energy present in the PFAS substrates. Indications for such bacterial behaviour were found when a PFOA-degrading bacterial strain was isolated from soil near a PFAS production plant (Yi et al., 2016). The PFOA-degradation has been demonstrated at lab conditions with a low degradation efficiency only, and have yet to be observed in the environment (Arp and Slinde, 2018).
B.4.1.2. PFAS subgroups
Lack for degradation of selected PFAS subgroups is considered in more detail below. The subgroups have been selected on the basis of their expected stability in the environment, and they are representing arrowhead substances or arrowhead subgroups, i.e. final degradation products that do not undergo any further degradation in the environment. The arrowhead approach may be defined as a risk management approach when a representative PFAS is managed together with its salts and precursors. The approach has been recognized by scientists (e.g. (Cousins et al., 2020a)) and represents the dominant current approach to

P.O. Box 400, FI-00121 Helsinki, Finland | Tel. +358 9 686180 | echa.europa.eu
70
grouping PFASs for risk assessment and risk management globally.
It is noted that the information presented below is on the PFASs where the perfluorinated moieties make the largest part of the substance. However, there are many PFASs which have a separate nonfluorinated part for which a perfluorinated moiety makes a relatively small part of the substance. For these substances it can generally be expected that the primary degradation will target the nonfluorinated part, while the fluorinated moiety is resistant to biotic/abiotic transformation. The degradation behaviour will follow the pattern of a substance similar to the nonfluorinated part of the PFAS, until that part has been fully degraded forming thereby the stable arrowhead perfluorinated moiety.
QSAR modelling of degradation
The persistence of selected subgroups was investigated with QSAR modelling of abiotic/biotic degradation of three representative members of the different subgroups (p.t. apart from haloperfluoroalkanes). The QSAR models used in this study were selected according to their capacity and competence of predicting abiotic and biotic degradation of the selected PFASs. For the purpose of this study, capacity means that the substance or similar substances are part of the training set of the model, while competence refers to the applicability domain (AD) for the endpoint to be predicted.
A complete list of substances selected for QSAR modelling is found in Table B.21.
Table B.21. List of substances selected for QSAR modelling of degradation.
PFAS category PFAS name CAS number
Carboxylic acids PFOA 335-67-1
PFHxA 307-24-4
PFBA 375-22-4
Sulfonic acids PFOS 1763-23-1
PFHxS 355-46-4
PFBS 375-73-5
Phosphonic acids Perfluorooctyl phosphonic acid (PFOPA) 40143-78-0
Perfluorohexyl phosphonic acid (PFHxPA) 40143-76-8
Perfluorobutyl phosphonic acid (PFBPA) 52299-24-8
Perfluoroalkanes Perfluorohexane 355-42-0
Perfluorooctane 307-34-6
Perfluorodecaline (perflunafene) 306-94-5
Perfluoroalkylamines Perfluamine 338-83-0
Perfluoromethyldiethylamine 758-48-5
Perfluorotrihexylamine 432-08-6
Ethers Perfluorodiethylether, CF3CF2-O-CF2CF3 358-21-4
CF3-O-CF2-CF2-O-CF3 378-11-0
2,2,3,3,4,4,5-heptafluorotetrahydro-5-(nonafluorobutyl)furan 335-36-4
Abiotic degradation
For abiotic degradation, the modelling suites used were AOPWIN and HYDROWIN from EPI Suite, which predict the atmospheric and water degradation, respectively; OPERA, which predicts the hydroxylation rate; and VEGA, which predicts persistence in air, water, sediment, and soil in seven (7) different models.
Abiotic degradation predictions were of low reliability for all analysed PFASs in water, sediment

P.O. Box 400, FI-00121 Helsinki, Finland | Tel. +358 9 686180 | echa.europa.eu
71
and soil. The abiotic degradation models have a very low coverage of perfluorinated compounds in their training sets, and overall, the models were found unsuitable to reliably predict photodegradation of PFASs. Hence, we do not recommend the use of any of the models investigated to estimate abiotic degradation of PFASs, as the currently available versions of the QSARs are not trained to accurately model perfluoroalkyl compounds.
Biotic degradation
For biodegradation, the modelling suites used were BIOWIN v4.11 of EpiSuite, which incorporates seven (7) different models to predict different endpoints related to biodegradability; OPERA, which predicts biodegradation and ready biodegradability; and VEGA, which predicts ready biodegradability.
BIOWIN1 (linear probability model) and BIOWIN2 (non-linear probability model) are intended to convey a general indication of biodegradability under aerobic conditions. BIOWIN3 (expert survey ultimate biodegradation model) and BIOWIN4 (expert survey primary biodegradation model) rate the ultimate and primary biodegradation of each compound on a semi-quantitative scale of 1 (longer than months) to 5 (hours). Primary biodegradation is the transformation of a parent compound to an initial metabolite. Ultimate biodegradation is the transformation of a parent compound to carbon dioxide and water, mineral oxides of any other elements present in the test compound, and new cell material. BIOWIN5 (MITI linear model) and BIOWIN6 (MITI non-linear model) are predictive models for assessing a compound’s biodegradability in the Japanese MITI ready biodegradation test (OECD 301C). The critical biodegradation evaluations (results of the MITI tests) are either "readily degradable" (value of 1) or "not readily degradable” (value of 0). 0 to 1 is the full probability range. BIOWIN7 (anaerobic biodegradation model) estimates the probability of fast biodegradation under methanogenic anaerobic conditions; specifically, under the conditions of the "serum bottle" anaerobic biodegradation screening test. This endpoint is assumed to be predictive of degradation in a typical anaerobic digestor.
The screening criteria for persistence in the environment are BIOWIN2 <0.5 or BIOWIN6 <0.5 and BIOWIN3 <2.25 (ECHA, 2017a).
Apart from the fragment [-CF3], which is included in the training sets of BIOWIN 1 to 4, BIOWIN is generic when it considers “C bonded to atoms other than H”, not being specific to C-F bonds. In addition, the fragment [-F] is included only in the training sets of BIOWIN 5 and 6 (MITI models). These limitations hamper BIOWIN’s biodegradability prediction reliability, and the outputs should be interpreted individually and with caution.
BIOWIN may be used as a supporting tool for aerobic biodegradability predictions, if results are interpreted individually, and all limitations stated. In addition, due to the apparent lack of [-F] and [-CF3] fragments in the training set of BIOWIN 7, the prediction of PFASs anaerobic biodegradation using BIOWIN should also be interpreted with great care.
OPERA and VEGA returned a low reliability in the predictions of PFAS biodegradability for all subclasses. The results from these models are therefore not used in the assessment and only outputs from BIOWIN (for which the applicability domain is not explicit in the outputs) will be further discussed. For BIOWIN, there is no universally accepted definition of the applicability domain, and therefore different parameters should be considered to evaluate the prediction reliability.
Having these limitations in mind, the main finding of the QSAR modelling study is that all BIOWIN biotic models predict a (very) slow degradation of PFAS. QSAR modelling results of biotic degradation for the individual subgroups are summarized below. For all substances investigated the estimated values are within the BIOWIN criteria indicating potentially persistent substances.
The predicted biodegradability of individual PFAS substances is found in Table B.22.

P.O. Box 400, FI-00121 Helsinki, Finland | Tel. +358 9 686180 | echa.europa.eu
72
Table B.22. Predicted biodegradability of the analysed PFAS categories and molecules.
Perfluoroalkanes
Figure B.5. Example structure: perfluorohexane.
Ravishankara et al. (1993) investigated the atmospheric lifetimes of long-lived halogenated species, including CF4, C2F6, c-C4F8, (CF3)2c-C4F6, C5F12 and C6F14. The possible atmospheric loss processes of these gases were assessed by determining the rate coefficients for the reactions of these gases with O(1D), H, and OH and the absorption cross sections at 121.6 nm in the laboratory and using these data as input to a two-dimensional atmospheric model. The lifetimes of all the studied perfluoroalkane compounds were found to be more than 2000 years.
These findings were confirmed by Say et al. (2021) who looked at the global trends and European emissions of tetrafluoromethane (CF4), hexafluoroethane (C2F6) and octafluoropropane (C3F8). The fully fluorinated hydrocarbons were said to be potent greenhouse gases with lifetimes in the order of thousands to tens of thousands of years

P.O. Box 400, FI-00121 Helsinki, Finland | Tel. +358 9 686180 | echa.europa.eu
73
(50.000 years for CF4).
Thermal decomposition of perfluoroalkanes starts above 800 °C (compounds with tertiary carbon atoms above 600 °C) with the formation of saturated and unsaturated decomposition products and some carbon (Siegemund et al., 2012).
From the group of perfluoroalkanes, perfluorohexane, perfluorooctane and perfluorodecaline were investigated with QSAR biodegradation models. The three substances were predicted to not biodegrade fast (BIOWIN 1, 2, 5 6 and 7). Ultimate biodegradation (BIOWIN 3) predicted the three substances to be recalcitrant. Primary biodegradation (BIOWIN 4) estimated perfluorooctane and perfluorodecaline to be recalcitrant, while half-life of perfluorohexane was estimated to be months. All perfluoroalkanes were predicted as not readily biodegradable.
Haloperfluoroalkanes
Figure B.6. Example structure: 1,2-dichloro-1,1,2,2-tetrafluoroethane.
Fully halogenated compounds (Cl and Br in addition to F) with a high fluorine content have excellent thermal stability and are non-flammable. Chlorofluoroalkanes are characterized by high chemical and thermal stabilities, which increase with their fluorine content. At high temperature, thermal cleavage of the C-Br bond of bromoperfluoroalkanes into radicals may occur. The chemical stability of bromofluoroalkanes is slightly lower than that of the corresponding chlorofluoroalkanes. However, as with the chlorofluoroalkanes, stability increases with the fluorine : bromine ratio. In contrast to chloro- and bromofluoroalkanes, iodofluoroalkanes readily undergo chemical reactions, reacting preferentially by homolytic cleavage of the C-I bond (Siegemund et al., 2012). However, when exposed to ultraviolet light in the upper atmosphere, chloro- and bromofluoroalkanes may suffer cleavage with release of chlorine or bromine radicals that can go on to destroy ozone in catalytic cycles. The atmospheric lifetime of the compound 1,2-dichloro-1,1,2,2-tetrafluoroethane was reported to be 220 years (Solomon, 1999).
[This PFAS subgroup has not been investigated so far with QSAR modelling]
Perfluoroalkylethers (PFAEs)
Figure B.7. Example structure: 1,1,2,2-tetrafluoro-1,2-bis(trifluoromethoxy)ethane.
The thermal stability of perfluoroalkylethers (PFAEs) was studied by Helmick and Jones Jr (1990) in relation to the potential application of the substances as high temperature engine

P.O. Box 400, FI-00121 Helsinki, Finland | Tel. +358 9 686180 | echa.europa.eu
74
lubricants. A range of PFAEs was studied and found to have decomposition temperatures in the interval 301-389 °C which demonstrates the high thermal stability of the substances. The stability of the PFAEs was not affected by intrinsic factors such as carbon chain length, branching, or cumulated -CF2- groups.
Hori et al. (2009) investigated the oxygen-induced mineralization of perfluoroalkylether sulfonates in subcritical water. They pointed out that ether linkages originally were inserted into the perfluoroalkyl chains so that the molecules should contain only short perfluoroalkyl fragments. In the first place these molecules were expected to decompose more easily than other PFASs because of the presence of the ether linkages, but no one has confirmed that they do in fact decompose more easily. Indeed, the authors observed that perfluoroalkylether sulfonates decomposed only at 350 °C in the presence of oxygen gas in supercritical water, while below 300 °C no reaction was observed.
Under environmentally relevant conditions perfluoroalkylether chains are similarly resistant to abiotic (photolysis, reactions with OH radicals, and hydrolysis) and biotic degradation as the perfluoroalkyl chains (Wang et al., 2015b).
Three ether substances were investigated with QSAR modelling for biodegradation: perfluorodiethylether, 1,1,2,2-tetrafluoro-1,2-bis(trifluoromethoxy)ethane and 2,2,3,3,4,4,5-heptafluorotetrahydro-5-(nonafluorobutyl)furan. All were predicted not to biodegrade fast (BIOWIN 1, 2, 5, 6 and 7). Ultimate biodegradation (BIOWIN 3) categorized all substances as recalcitrant, while primary biodegradation (BIOWIN 4) was weeks-months for perfluorodiethylether and 1,1,2,2-tetrafluoro-1,2-bis(trifluoromethoxy)ethane, and of months for 2,2,3,3,4,4,5-heptafluorotetrahydro-5-(nonafluorobutyl)furan. All three compounds were predicted as not readily biodegradable. The QSAR models include a negative fragment contribution of the aliphatic ether bond on the degradation potential. This indicates that the ether bond in PFECAs and PFESAs is not expected to decrease the environmental persistence as compared to PFCAs or PFSAs.
The ether substance 2,3,3,3-tetrafluoro-2-(heptafluoropropoxy)propionic acid (HFPO-DA/GenX), its salts and its acyl halides were recognized as very persistant by the Member State Committee and the substances identified as substances of very high concern, among others on the basis of an equivalent level of concern having probable serious effects to the environment which give rise to an equivalent level of concern to those of PBT/vPvB substances (ECHA, 2019d).
Perfluoroalkylcarboxylic acids (PFCAs)
Figure B.8. Example structure: Perfluorobutanoic acid (PFBA).
The sources, fate and transport of PFCAs were reviewed by Prevedouros et al. (2006). The PFCAs were evaluated as highly water-soluble and persistent with a high potential for long-range aquatic transport to the Arctic. PFCAs were shown to not undergo degradation in the environment. The global historical industry-wide emissions of total PFCAs were estimated to be 3200-7300 tonnes. It was assumed that the majority (∼80%) of this was released to the environment from fluoropolymer manufacture and use.

P.O. Box 400, FI-00121 Helsinki, Finland | Tel. +358 9 686180 | echa.europa.eu
75
Qu et al. (2016) looked at the photochemical decomposition of the environmentally persistent PFCA-class. It was emphasized that the class of PFCAs are chemically inert due to the strong electronegativity of fluorine and very strong C-F bond, making them resistant to normal environmental degradation. In the study, the photodegradation of a series of PFCAs (C2-C12) in water by a medium-pressure mercury lamp was experimentally and theoretically examined. The PFCAs were mainly decomposed into shorter carbon chain length PFCAs in a stepwise manner, with the accumulation of TFA and fluoride ions as the end products. These findings could enhance the general understanding of the photodegradation of PFCAs, although the conditions investigated are not directly environmentally relevant.
Taniyasu et al. (2013) studied the environmental photolysis of PFASs in natural environment at high altitudes in Mt. Mauna Kea (Hawaii, USA; 4200 m) and Mt. Tateyama (Toyama, Japan; 2500 m). They observed decomposition of long-chain PFCAs (and PFSAs) with successive dealkylation and formation of short-chain compounds such as PFBA (and PFBS), typically with 20-30% decomposition after 106 days. However, these observations were disputed by Wang et al. (2015a), who argued that the perfluoroalkyl carboxylic and sulfonic acids are too stable to undergo atmospheric photolysis and asked for information on whether adsorption of long-chain substances on the surface of the vials was considered in the experiments.
Among the perfluoroalkylcarboxylic acids, PFOA, PFHxA and PFBA were investigated for biodegradability with QSAR modelling. BIOWIN 1 and 2 predicted all of them not to biodegrade fast. BIOWIN 3 (ultimate biodegradation) predicted that PFOA and PFHxA are recalcitrant, while PFBA has a half-life of months. For primary biodegradation, BIOWIN 4 predicted semi-quantitative half-lives as PFOA (weeks-months) > PFHxA (weeks) > PFBA (days-weeks). For PFOA and PFHxA BIOWIN 5 and 6 predicted that these compounds do not biodegrade fast. For PFBA the linear model of BIOWIN 5 predicted fast biodegradability, while the non-linear model of BIOWIN 6 predicted that the substance does not biodegrade fast. The overall assessment of biodegradability by BIOWIN for all three perfluoroalkylcarboxylic acids was that they are not readily biodegradable.
BIOWIN 1-4 were reliable to predict all fragments except [-F]. Considering that [-F] contributes positively to biodegradation in BIOWIN 5 (linear MITI model), these results should be interpreted with caution, particularly for PFBA, which was predicted to biodegrade fast by BIOWIN 5, which is an unexpected result that does not match well with the range of observations of PFBA in environmental samples.
Perfluorooctanoic acid (PFOA) as well as six long-chained perfluorinated carboxylic acids (C9-C14 PFCAs) have been identified as substances of very high concern (SVHC) fulfilling the P and vP criteria according to REACH Annex XIII (ECHA, 2012a, ECHA, 2012b, ECHA, 2012c, ECHA, 2012d, ECHA, 2013, ECHA, 2015, ECHA, 2016c). Furthermore, a REACH restriction on C9-C14 PFCAs including their salts and precursors has recently been adopted (ECHA, 2018a) due to their P and vP properties. A restriction on PFHxA its salts and related substances has been proposed based on its high persistence exceeding by far the P and vP criteria (ECHA, 2021a).
In 2019, PFOA its salts and PFOA-related substances were listed in the Stockholm Convention, and the restriction is included in the EU POPs regulation since 2020. Just recently a proposal has been submitted for long-chain perfluorocarboxylic acids, their salts and related compounds19 under the Stockholm Convention.
19 Long-chain PFCAs and their salts are a homologous series of substances with the molecular formula of CnF2n+1CO2H (where 8 ≤ n ≤ 20). Related compounds are viewed as any substance that is a precursor and may degrade or transform to long-chain PFCAs, where the perfluorinated alkyl moiety has the formula CnF2n+1 (where 8 ≤ n ≤ 20) and is directly bonded to any chemical moiety other than a fluorine, chlorine or bromine atom

P.O. Box 400, FI-00121 Helsinki, Finland | Tel. +358 9 686180 | echa.europa.eu
76
Trifluoroacetic acid (TFA)
The environmental fate of TFA, together with trichloro-, dichloro-, and monochloroacetic acids, was investigated using field aquatic microcosms and laboratory sediment–water systems (Ellis et al., 2001). TFA was extremely persistent and showed no degradation during a one-year field study.
Biodegradation of mono-, di- and trifluoroacetate by microbial cultures with different origins was investigated by Alexandrino et al. (2018). Microbial inocula samples collected from a site with a long history of industrial contamination and activated sludge obtained from a municipal wastewater treatment plant were used in the study. Defluorination was obtained in the cultures fed with monofluoroacetate, while difluoroacetate and TFA were recalcitrant in all tested conditions. The authors pointed out that the persistence and accumulation of these substances in the environment is a relevant issue that may lead to disturbance in ecosystems.
TFA and its sources, pathways, and consequences for drinking water were assessed by Scheurer et al. (2017). It was pointed out that there are contradictory results in the scientific literature with regards to microbial degradation of TFA. Some studies have observed TFA to be persistent, while some other studies have reported microbial degradation of TFA; Visscher et al. (1994) reported the rapid microbial degradation of TFA in sediments under oxic and anoxic conditions, with formation of fluoroform. Kim et al. (2000) performed a long-term (90 weeks) study to assess biodegradation of TFA in an engineered anaerobic reactor. TFA was found to be co-metabolically degradable, and the authors indicated that anaerobic degradation is a potential sink for TFA in freshwater sediments and may limit their accumulation in the environment. In their own study of degradation of TFA in a WWTP, Scheurer et al. (2017) observed no decrease of TFA concentrations.
TFA is registered in the 100-1000 t/a tonnage band in the ECHA database. In the registration dossier, the registrants have concluded, based on experimental evidence, that TFA was found to be highly resistant to abiotic and biotic degradation and, coupled with its extreme chemical stability, these results suggest a very long lifetime for TFA in the environment. However, it was also stated that a 'not assignable study' shows that co-metabolic degradation in anaerobic conditions can happen. TFA was not investigated specifically in QSAR modelling of biodegradation.
Perfluoroalkane sulfonic acids (PFSAs)
Figure B.9. Example structure: Perfluorobutane sulfonic acid (PFBS).
The Global PFC Group refers to PFSAs as very persistent in the environment, while their potential precursors are transformed into PFSAs abiotically or biotically (OECD/UNEP Global PFC Group, 2013). Due to the high resistance to heat and chemical agents, the perfluoroalkyl substances have been frequently used in products with high versatility, strength, resilience and durability. However, the high persistence allows for a wide distribution in the environment, and many PFSAs have been detected globally in the environment.
Perfluoroalkane sulfonic acids (PFSAs) are remarkably stable, with an outstanding thermal and chemical stability. Anhydrous PFSAs are stable at 400 °C in the absence of air, but they

P.O. Box 400, FI-00121 Helsinki, Finland | Tel. +358 9 686180 | echa.europa.eu
77
may form hydrogen fluoride at this temperature when moisture is present. The sulfur atoms in PFSAs are at their maximum oxidation state, and cannot be oxidised further (Arp and Slinde, 2018).
Defluorination of fluorinated sulfonates by a Pseudomonas strain was investigated by Key et al. (1998). Trifluoromethane sulfonate, PFOS and some related not fully fluorinated substances were subjected to biodegradation by Pseudomonas under aerobic, sulfur-limiting conditions. Growth and defluorination were observed for the compounds containing hydrogen on the carbon chain, while it is reported that trifluoromethane sulfonate and PFOS were not degraded.
Sáez et al. (2008) studied the degradation of PFASs, including the sulfonic acids PFBS and PFOS, in closed bottle tests with municipal sewage sludge. Bacterial communities from sewage sludge were exposed to a mixture of PFASs under aerobic and anaerobic conditions. Individual PFAS concentrations were determined after solid phase extraction. The experiments were based on the OECD guideline 301D (closed bottle test) with slight modifications. It was found that the PFASs tested in these experiments are nonbiodegradable under the conditions used.
A few studies have reported the degradation of PFOS by isolated bacterial strains under special laboratory conditions or by a specific enzyme when incubated with a mediator substance in laboratory conditions. A summary of the studies may be found in the SVHC Support Document for PFBS (ECHA, 2019e). These results show that bacteria may adapt to utilise the energy present in the PFAS substrates. However, such transformations have not been observed at environmentally relevant conditions.
PFOS, PFHxS and PFBS were investigated for biodegradation potential in QSAR modelling. All three substances were predicted not to biodegrade fast (BIOWIN 1, 2, 5, 6 and 7). BIOWIN 3 estimated the compounds to be recalcitrant, while the primary biodegradation model (BIOWIN 4) estimation was PFOS (months) > PFHxS (weeks-months) > PFBS (weeks). All three PFASs were predicted as not readily biodegradable.
It should be noted that the sulfonic acid structure fragment is not included in the MITI models of BIOWIN 5 and 6. Hence, the results from these models should be given little weight in the assessment.
In 2009, PFOS and its derivatives were included in the Stockholm Convention on Persistent Organic Pollutants to eliminate their use before being restricted in the EU under the POPs Regulation.
PFBS and its salts have been included in the REACH Candidate List meeting the criteria under REACH Article 57(f), due to its very high persistence (ECHA, 2019e).
PFHxS fulfils the criteria for being “very persistent” and has been adopted as SVHC by the Member State Committee in 2017 (ECHA, 2017b). PFHxS, its salts and PFHxS-related compounds have been recommended for listing in the Stockholm Convention without any exemptions for use, the discussions on this listing will be at the Conference of the Parties in June 2022.

P.O. Box 400, FI-00121 Helsinki, Finland | Tel. +358 9 686180 | echa.europa.eu
78
Perfluoroalkylphosphonic acids (PFPAs)
Figure B.10. Example structure: Perfluorohexyl phosphonic acid.
PFPAs are not expected to undergo hydrolysis under environmentally relevant conditions. They are resistant to basic hydrolysis (Emeléus and Smith, 1959) and stable in water at elevated temperatures up to 180 °C (Mahmoodi and Shreeve, 1986), similarly as PFCAs and PFSAs.
Biotransformation of PFPAs has not been observed. In a metabolism study, rats dosed with C8 PFPA did not produce 1H-perfluorooctane, which has been observed for the similar substances perfluorophosphinic acids at a lower oxidation stage (Joudan et al., 2017). A microbial degradation study conducted according to OECD Test Guideline (TG) 309 found no evidence of biodegradation of C6, C8 or C10 PFPA after incubation for 30 days (Llorca-Casamayor, 2012).
Wang et al. (2016) reviewed the environmental properties of e.g. perfluoroalkyl phosphonic acids. Existing evidence demonstrated high resistance of these substances to heat, oxidants, bases and aerobic degradation in surface waters. The authors concluded that the data suggested a high or very high persistence of PFPAs in the environment and biota, and a high long-range transport potential.
PFOPA, PFHxPA and PFBPA were investigated with the QSAR models in BIOWIN v4.11 of EpiSuite for biodegradability. All substances were predicted not to biodegrade fast (BIOWIN 1, 2, 5, 6 and 7). Ultimate biodegradation (BIOWIN 3) categorized all substances as recalcitrant, and primary biodegradation predicted half-life of PFOPA (months) > PFHxPA (months) > PFBPA (weeks-months). All three PFASs were predicted as not readily biodegradable. However, all the BIOWIN models lack coefficients for phosphonate (C-P bond), which reduces the strength of the BIOWIN modelling results for this subclass.
Perfluoroalkylamines
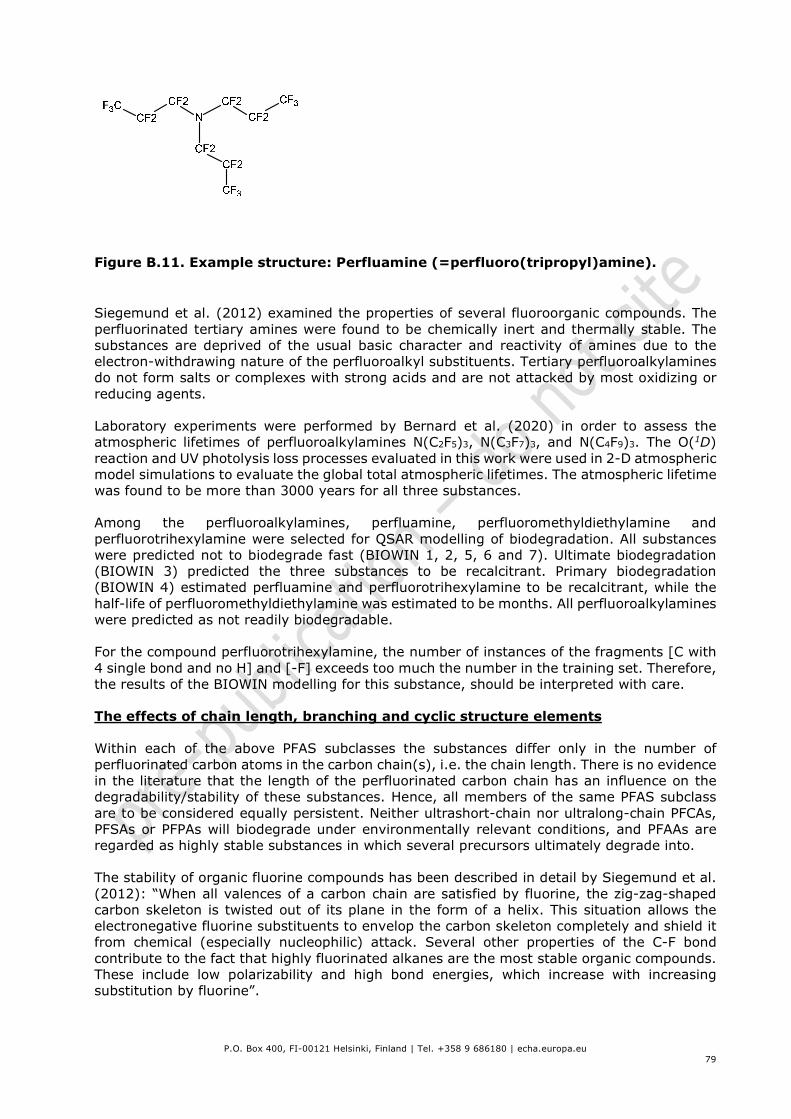
P.O. Box 400, FI-00121 Helsinki, Finland | Tel. +358 9 686180 | echa.europa.eu
79
Figure B.11. Example structure: Perfluamine (=perfluoro(tripropyl)amine).
Siegemund et al. (2012) examined the properties of several fluoroorganic compounds. The perfluorinated tertiary amines were found to be chemically inert and thermally stable. The substances are deprived of the usual basic character and reactivity of amines due to the electron-withdrawing nature of the perfluoroalkyl substituents. Tertiary perfluoroalkylamines do not form salts or complexes with strong acids and are not attacked by most oxidizing or reducing agents.
Laboratory experiments were performed by Bernard et al. (2020) in order to assess the atmospheric lifetimes of perfluoroalkylamines N(C2F5)3, N(C3F7)3, and N(C4F9)3. The O(1D) reaction and UV photolysis loss processes evaluated in this work were used in 2-D atmospheric model simulations to evaluate the global total atmospheric lifetimes. The atmospheric lifetime was found to be more than 3000 years for all three substances.
Among the perfluoroalkylamines, perfluamine, perfluoromethyldiethylamine and perfluorotrihexylamine were selected for QSAR modelling of biodegradation. All substances were predicted not to biodegrade fast (BIOWIN 1, 2, 5, 6 and 7). Ultimate biodegradation (BIOWIN 3) predicted the three substances to be recalcitrant. Primary biodegradation (BIOWIN 4) estimated perfluamine and perfluorotrihexylamine to be recalcitrant, while the half-life of perfluoromethyldiethylamine was estimated to be months. All perfluoroalkylamines were predicted as not readily biodegradable.
For the compound perfluorotrihexylamine, the number of instances of the fragments [C with 4 single bond and no H] and [-F] exceeds too much the number in the training set. Therefore, the results of the BIOWIN modelling for this substance, should be interpreted with care.
The effects of chain length, branching and cyclic structure elements
Within each of the above PFAS subclasses the substances differ only in the number of perfluorinated carbon atoms in the carbon chain(s), i.e. the chain length. There is no evidence in the literature that the length of the perfluorinated carbon chain has an influence on the degradability/stability of these substances. Hence, all members of the same PFAS subclass are to be considered equally persistent. Neither ultrashort-chain nor ultralong-chain PFCAs, PFSAs or PFPAs will biodegrade under environmentally relevant conditions, and PFAAs are regarded as highly stable substances in which several precursors ultimately degrade into.
The stability of organic fluorine compounds has been described in detail by Siegemund et al. (2012): “When all valences of a carbon chain are satisfied by fluorine, the zig-zag-shaped carbon skeleton is twisted out of its plane in the form of a helix. This situation allows the electronegative fluorine substituents to envelop the carbon skeleton completely and shield it from chemical (especially nucleophilic) attack. Several other properties of the C-F bond contribute to the fact that highly fluorinated alkanes are the most stable organic compounds. These include low polarizability and high bond energies, which increase with increasing substitution by fluorine”.

P.O. Box 400, FI-00121 Helsinki, Finland | Tel. +358 9 686180 | echa.europa.eu
80
It is not expected that branching of the perfluoroalkyl chain will affect the high persistency of the corresponding unbranched PFAS substances as long as the alkyl chain is fully fluorinated. Branch at a point where all neighbouring carbons are fully shielded can be assumed to be fully shielded by the close-by fluorine atoms.
Likewise, cyclic perfluoroalkyl structures are expected to be as persistent as linear or branched PFASs, potentially with the exception of very small ring structures with high ring strain (i.e. 3- or 4-membered rings). However, perfluorocyclobutane has an atmospheric lifetime of 3200 years, which demonstrates the high persistence even of 4-membered ring structures. The cyclic PFAS substance ammonium difluoro{[2,2,4,5-tetrafluoro-5-(trifluoromethoxy)-1,3-dioxolan-4-yl]oxy}acetate (CAS no 1190931-27-1) was shown to be not readily biodegradable (5% DOC removal) in a screening test for ready biodegradability (OECD 301A).
Monitoring programs have detected the presence of perfluoroethylcyclohexane sulfonate ("cyclic PFOS") in the Baltic Sea and Northern Sea, in the Devon Ice Cap, in the Great Lakes and in several location downstream known PFAS pollution sources, see section on monitoring data.
Structural elements in combination
As described above, selected PFAS subclasses, or structural elements (different moieties), have been investigated and shown to be persistent and highly stable in the environment. The remarkable stability arises from the high strength of the C-F bond, in combination with structural elements which are not transformed under environmental conditions and which do not inflict sufficient reactivity to neighbouring C-F units. Hence, the PFAS subgroups described represent final degradation products that do not undergo any further degradation in the environment and are designated arrowhead substances or arrowhead subgroups.
Perfluoroalkyl acids with an acid functional group at its highest oxidation state, i.e. carboxylic, sulfonic and phosphonic acids represent structural endpoints in an oxidative environment. Degradation studies and monitoring data show that these substances are extremely persistent and do not undergo biotic or abiotic degradation in the environment.
It should be noted that all substances in the above assessment are perfluorinated substances with fully fluorinated carbon chains in combination with selected functional groups. If other functional groups or C-H bonds are included in the substance structure, further assessment of the stability may need to be conducted.
Any substance with a combination of the above mentioned structure elements is also expected to be persistent. There is no reason to expect that these structure elements in combination will induce considerably higher reactivity in a perfluorinated substance as compared to substances containing these elements separately.
Examples of substances that contain a combination of several of the mentioned structure elements include HFPO-DA (GenX), ADONA, F-53B, perfluoroalkyl ether sulfonic acids and perfluoro-N-methylmorpholine (PMM) and may be found in Figure 8.

P.O. Box 400, FI-00121 Helsinki, Finland | Tel. +358 9 686180 | echa.europa.eu
81
GenX ADONA
NH4+
Perfluoroalkylether sulfonic acid, C2F5OC2F4SO3H F53B (major compound)
Figure B.12. Examples of substances with a combination of structural elements.
In the SVHC identification of HFPO-DA (GenX) it was concluded, based on available experimental evidence and QSAR information, that the substance meets the P and vP-criteria of REACH by far (ECHA, 2019d). Gordon (2011) evaluated toxicological aspects of ADONA and indicated that ADONA is a non-reactive, stable and not readily biodegradable substance that decomposes only at 125-175 °C. Perfluoroalkylether sulfonic acids, including C2F5OC2F4SO3H, were shown to not undergo any reaction even in supercritical water with oxygen gas for 6 h at temperatures up to 300 °C (Hori et al., 2009). S. Wang et al. (2013) looked at the environmental occurrence of F-53B in China and assessed its toxicity and persistence. Ready biodegradability of F-53B was measured in a Closed Bottle Test (CBT) according to OECD Guideline 301D. In addition, the stability of F-53B under various advanced oxidation process (AOP) conditions was assessed. Although the compound showed a slow degradation throughout the test period in the CBT, it did not meet the OECD criteria to satisfy ready biodegradation. Under all AOP test conditions, the degradation of F-53B was very low. The authors concluded that F-53B is not readily biodegradable, and their data suggested that F-53B is as persistent as PFOS. This is supported by the ubiquitous presence of F-53B in the environment in China, US, UK, Sweden, the Netherlands and Korea, while China is the only known location for emissions of the substance. This is a strong indication of high persistence of the substance. However, indications of slow de-chlorination of F-53B was found in an increased molar ratio of the H-analogue as compared to the manufactured mixture (Pan et al., 2018). Perfluoro-N-methylmorpholine (PMM), which contains both an ether structure unit and a tertiary amine in combination, is considered as very persistent by the registrant in the ECHA database (tonnage band: 100-1000 tonnes/year). The substance was assessed as very persistent by Arp (2019) on the basis of QSAR and biodegradation screening tests, and it has been added to the ChemSec SIN list as a very persistent and very mobile substance.

P.O. Box 400, FI-00121 Helsinki, Finland | Tel. +358 9 686180 | echa.europa.eu
82
Fluoropolymers and side-chain fluorinated polymers
Many of the mentioned structural elements may be combined multiple times in polymeric chains. Again, the combination of persistent structural elements is expected to result in a persistent overall structure, where the number of persistent parts is high. Examples of fluoropolymers constructed from the mentioned persistent structure elements include e.g. polytetrafluoroethylene (PTFE), perfluoroalkoxy polymer (PFA), etc.
PTFE
PFA
Figure B.13. Examples of fluoropolymers.
Lohmann et al. (2020) investigated whether fluoropolymers may be regarded as polymers of low concern for human and environmental health. With regards to persistence, they pointed out that fluoropolymers are very persistent under environmental conditions, which, in the same way as for other polymers, can lead to a wide array of issues, particularly with respect to disposal of fluoropolymer-containing wastes and products. Current concern over microplastics present in the oceans is also related to fluoropolymers.
In a paper by Henry et al. (2018) fluoropolymers are in general considered highly stable and persistent. Furthermore, PTFE is said to be highly stable and persistent in the environment, resistant to thermal degradation (stable for decades at temperatures up to 260 °C), stable in terms of hydrolysis, oxidation, and light, as well as stable in terms of anaerobic and aerobic degradation.
The side-chain fluorinated polymers (SFPs) are different from the fluoropolymers in that they usually contain a non-fluorinated backbone with fluorinated alkyl side-chains attached to the backbone via a linker (Buck et al., 2011). These linkers are often labile and may be cleaved under environmental conditions with liberation of well-known PFASs. The side-chain fluorinated polymers are as such not principally different from non-polymeric PFAS precursors and are expected to follow the same reactivity pattern. See next section for examples of degradation of SFPs to form PFAAs. Further discussion on the degradation of SFPs is provided, e.g., in the restriction proposal of PFHxA, its salts and related substances (ECHA, 2021a).

P.O. Box 400, FI-00121 Helsinki, Finland | Tel. +358 9 686180 | echa.europa.eu
83
B.4.1.3. Degradation of precursors into the corresponding PFAS arrowheads
There are many PFASs which contain degradable non-perfluorinated moieties. These precursor substances are not ultimately persistent themselves but degrade to ultimately (single or multiple) persistent arrowheads (usually perfluoroalkyl acids, PFAAs), through reactions such as atmospheric oxidation, metabolic transformations, and hydrolysis. It is expected that the degradation will primarily target the nonfluorinated parts. During the degradation process the non-fluorinated moieties of molecules are transformed and oxidative processes often lead to the gradual conversion of non-fluorinated carbon atoms into oxidized species such as CO2 while the degrading substance structure is gradually getting smaller. In the end most of the non-fluorinated parts are usually lost, while the perfluoroalkyl part is remaining (although defluorination of the carbon atom next to the non-fluorinated part can occur), attached to a functional group at its highest oxidation state (e.g. carboxylic acid). Such functional groups often carry a negative charge which leads to an increased polarity for the degradation products. Small molecules tend to be more volatile than large ones, and high polarity of compounds are usually associated with increased solubility in water. Hence, the fluorinated degradation products of PFAS may be assumed to have elevated mobility with water and air currents compared to precursor substances.
In the following subsections, relevant available information on degradation of precursors into the corresponding arrowheads are summarised. These data on various PFAS subgroups includes degradation in different compartments, such as air, soil, and water and involves different degradation mechanisms and pathways. Hence, the actual fate for a specific PFAS substance in the environment depends both on available degradation pathways for that PFAS subgroup and the physicochemical properties of the specific substance, like volatility and solubility, that determines the partitioning to different compartments. The presence of microorganisms in those compartments is an additional factor that influences the degradation.
B.4.1.3.1. Degradation of PFCA precursors
Degradation pathways of several PFCA precursors into the corresponding PFCAs (Perfluoroalkyl carboxylic acids) are extensively described in the Background documents to the Opinion on the Annex XV dossier proposing restrictions on PFOA (ECHA, 2018b), C9-C14 PFCAs (ECHA, 2018a), and PFHxA (ECHA, 2021a). Hence, this section is to a large extent based on the degradation information in these documents which have already been evaluated by RAC . However, the subsection “Other PFCA precursors” are mainly PFAS subgroups that were not included in the background documents of the previous restrictions.
The following PFAS subgroups are expected to degrade into PFCAs:
n:2 Fluorotelomer alcohols (FTOHs)
Figure B.14. Example of an n:2 fluorotelomer alcohol: 4:2 FTOH
Based on the available data it can be expected that n:2 FTOHs will be degraded and transformed into Cx-PFCAs (with x= n-2, n-1, n, n+1; see Table B.23). This means that up to three -CF2- groups can be defluorinated and mineralized to CO2 and HF until the respective ultimate very persistent PFCA is formed.

P.O. Box 400, FI-00121 Helsinki, Finland | Tel. +358 9 686180 | echa.europa.eu
84
The degradation pathways of n:2 FTOHs exemplified by the degradation of 6:2 FTOH
6:2 FTOH degrades to the corresponding PFCAs under various conditions (see Table B.23).
The degradation pathways of 6:2 FTOH in an aerobic river sediment system proposed by Zhao et al. (2013a) are illustrated in Figure B.15 and these pathways are typical for 6:2 FTOHs. In this specific study, after 100 days, 22.4 mol% 5:3 acid (5:3 fluorotelomer carboxylic acid), 10.4 mol% C5-PFCA (PFPeA), 8.4 mol% C6-PFCA (PFHxA), and 1.5 mol% C4-PFCA (PFBA) were detected. Major intermediates during biotransformation of 6:2 FTOH were 6:2 FTCA (6:2 fluorotelomer carboxylic acid), 6:2 FTUCA (6:2 fluorotelomer unsaturated carboxylic acid), 5:2 ketone, and 5:2 sFTOH. The recovery of 6:2 FTOH and quantifiable transformation products ranged 71-88 mol% of initially applied 6:2 FTOH. The lower mass balance can be explained by formation of bound residues.
Another study investigated the biotransformation of the intermediate degradation product 5:3 acid (5:3 fluorotelomer carboxylic acid) in activated sludge (Wang et al., 2012). After 90 days the 5:3 acid biotransformation yielded 14.2 mol% 4:3 acid, 5.9 mol% C5-PFCA (PFPeA) and 0.8 mol% C4-PFCA (PFBA). These results implicate that 5:3 acid (5:3 fluorotelomer carboxylic acid) should not be regarded as an arrowhead, but rather a relatively stable intermediate that will ultimately degrade to the corresponding PFCAs. Still, the degradation rate of 5:3 acid is highly dependent on the specific environmental conditions. E.g., Liu et al. (2010b) incubated 5:3 acid in aerobic soil and after 60 days only 2% 4:3 acid was observed. According to the authors, this indicates that 5:3 acid is relatively resistant to biodegradation in soil due to its strong tendency to become irreversibly adsorbed to soil.
Figure B.15. Proposed 6:2 FTOH biotransformation pathways in aerobic sediment system (based on Zhao et al., 2013a).
In one biodegradation study with 6:2 FTOH in an aerobic microbial culture (Sun et al., 2020) C2-PFCA (trifluoroacetic acid) (2.3 mol%) was formed along with other degradation products, meaning that in this specific case up to five -CF2- groups were defluorinated for a minor

P.O. Box 400, FI-00121 Helsinki, Finland | Tel. +358 9 686180 | echa.europa.eu
85
fraction of the starting material. However, once the PFCA, for example C4-PFCA (PFBA) is formed, that specific PFCA is very persistent and will not show any further defluorination of -CF2- groups.
The photooxidation of 6:2 FTOH was investigated at the surface of TiO2, SiO2, Fe2O3, Mauritanian sand, and Icelandic volcanic ash (Styler et al., 2013). At all surfaces the photooxidation resulted in the production of surface-sorbed PFCAs (PFHpA, PFHxA and PFPeA). These results provide evidence that the heterogeneous photooxidation of FTOHs at metal-rich atmospheric surface may provide a significant loss mechanism for FTOHs and also act as a source of aerosol-phase PFCAs close to source regions. The long-range transport of these aerosols is a possible source of PFCAs to remote areas.
The degradation pathways of n:2 FTOHs exemplified by the degradation of 8:2 FTOH
8:2 FTOH degrades to the corresponding PFCAs under various conditions (see Table B.23). 8:2 FTOH metabolism universally shows the formation of PFOA and, to a smaller fraction, PFNA and lower-chain-length PFCAs (Butt et al., 2014).
The proposed degradation pathways of 8:2 FTOH in soil and activated sludge are illustrated in Figure B.16 and are very similar to those proposed for 6:2 FTOH in Figure B.15. The percentages of the degradation products refer to studies by Dinglasan et al., 2004; Wang et al., 2005a; Wang et al., and 2009; Wang et al., 2005b.
8:2 FTOH metabolism universally shows the formation of PFOA and, to a smaller fraction, PFNA and lower-chain-length PFCAs – mainly PFHPA and PFHxA (Butt et al., 2014). 7:3 acid (7:3 fluorotelomer carboxylic acid) is usually also a major degradation product but should not be regarded as an arrowhead, but rather a relatively stable intermediate that will ultimately degrade to the corresponding PFCAs (Li et al., 2018; Butt et al., 2010).

P.O. Box 400, FI-00121 Helsinki, Finland | Tel. +358 9 686180 | echa.europa.eu
86
Figure B.16. Aerobic degradation pathways of 8:2 FTOH in soil and activated sludge (figure based on Liu and Avendano, 2013). Stable and semi-stable compounds are shown inside dashed boxes. 2H-PFOA (2H-C8-PFCA) has been proposed, but it has not been successfully validated. In one biodegradation study with 8:2 FTOH in an anaerobic activated sludge (Li et al., 2018) perfluoropentanoic acid (1.2 %) and perfluorobutanoic acid (1.9 %) were formed along with other degradation products, meaning that in this specific case up to five -CF2- groups were defluorinated. However, once the PFCA, for example C6-PFCA (PFHxA) is formed, that specific PFCA is very persistent and will not show any further defluorination of -CF2- groups.
Atmospheric degradation was studied in a smog chamber (Ellis et al., 2004). Experiments were performed in 750 Torr of air at 296 K. Reaction mixtures were subject to 0.5 to 15 min UV radiation leading to a consumption of FTOH in the range of 66 to > 98 %. It was shown that 8:2 FTOH is oxidized, initiated by Cl atoms which represent OH radicals, and forms PFNA, PFOA (1.5 % C mass balance of 8:2 FTOH) and PFCAs containing a carbon chain of less than eight carbon atoms. The formation of PFOA is expected to be greater because intermediate transformation products were still observed (e.g. 26 % 8:2 FTCA, 6 % 8:2 fluorotelomer aldehyde (8:2 FTAL)). The authors stress that the formation of PFOA is small but significant and postulate that FTOH degradation is likely an important source of PFOA and other PFCAs in remote areas.
It can be assumed that the degradation mechanisms for n:2 FTOHs are independent of the chain length (see also Section 4.1.2 concerning the effects of chain length, branching and cyclic structure elements on persistence). A limited number of available degradation studies on n:2 FTOHs and the intermediate products are summarized in Table B.23.

P.O. Box 400, FI-00121 Helsinki, Finland | Tel. +358 9 686180 | echa.europa.eu
87
Table B.23. Summary of formed PFCAs during degradation of n:2 FTOHs and the intermediate products (5:3 acid, fluorotelomer carboxylic acid (FTCA) and fluorotelomer unsaturated carboxylic acid (FTUCA)) Substance Compartment Study
duration C4-PFCA [%]
C5-PFCA [%]
C6-PFCA [%]
C7-PFCA [%]
C8-PFCA [%]
C9-PFCA [%]
C10-PFCA [%]
Reference
6:2 FTOH Atmosphere + + + + (Ellis et al., 2004)
Atmosphere + + + (Styler et al., 2013)
Soil (flow through) 84 d 0.8 4.2 4.5 - (Liu et al., 2010a)
Soil (closed system)
180 d 1.8 30 8.1 - (Liu et al., 2010b)
Mixed bacterial culture
90 d <0.5 <0.5 5 - (Liu et al., 2010b)
WWTP-activated sludge
60 d - 4.4 mol% 11 mol% - (Zhao et al., 2013b)
Aerobic river sediment system
100 d 1.5 mol% 10.4 mol% 8.4 mol% - (Zhao et al., 2013a)
Anaerobic digester sludge
90 d - 0.2 mol% - (Zhang et al., 2013) 176 d - 0.4 mol% -
Anaerobic sediment 100 d - - 0.6 mol% (Zhang et al., 2016)
5:3 acid (5:3 FTCA)
WWTP-activated sludge
90 d 0.8 mol% 5.9 mol% (Wang et al., 2012)
8:2 FTOH Atmosphere 0.1 0.1 0.24 0.32 1.5 1.6 (Ellis etal., 2004) Aqueous photolysis – H2O2 solution
10 h 40 +
(Gauthier and Mabury, 2005) Aqueous photolysis
–synthetic field water
140-146 h 1-8 +
Aqueous photolysis –Lake Ontario
3 + (but
below LOQ)
mixed microbial system (sediment and groundwater
81 d - 3 - (Dinglasan et al., 2004)
mixed bacterial culture
90 d 1 Not evaluated
6 - (Wang et al., 2005a)

P.O. Box 400, FI-00121 Helsinki, Finland | Tel. +358 9 686180 | echa.europa.eu
88
activated sludge 28 d
Not evaluated
2.1 - (Wang et al., 2005b)
Soil 197 d 1-4 - 10-40 (average
25)
(Wang et al., 2009)
Anaerobic digester sludge
181 d - - 0.3 mol%
(Zhang et al., 2013)
Anaerobic activated sludge
150 d 1.9 1.2 5.4 8.9 17
(Li et al., 2018)
8:2 FTCA Sediment-water system
50 d 21 mol% (water)
9.3 mol% (sed.)
(Myers and Mabury, 2010)
8:2 FTUCA Sediment-water system
35 d 12 mol% (water, at day 22)
27 mol% (water) 9
mol% (sed.)
< 1 mol% < 1 mol% (Myers and Mabury, 2010)
10:2 FTOH soil 30 d 5.1 mol% 4.3 mol% 59.7 mol%
(Zhao and Zhu, 2017)
Soil-earthworm 8.7 mol% 7.3 mol% 74.9 mol%
Soil-wheat 8.9 mol% 5.9 mol% 77.8 mol%
Soil-earthworm- wheat
9.9 mol% 6.0 mol% 74.8 mol%
10:2 FTCA Sediment-water system
50 d
11 mol% (sed.)
(Myers and Mabury, 2010)
10:2 FTUCA
Sediment-water system
35 d 0.37 mol% (sed.)
1.9 mol% (sed.)
1.1 mol% (water)
1.7 mol% (sed.)
6 mol% (water)
22 mol% (sed.)
(Myers and Mabury, 2010)
[+] detected, but not quantified; [-] not detected; [ ] not evaluated

P.O. Box 400, FI-00121 Helsinki, Finland | Tel. +358 9 686180 | echa.europa.eu
89
Other n:2 fluorotelomer derivatives
o n:2 Fluorotelomer iodides (FTIs)
Figure B.17. Example of an n:2 fluorotelomer iodide: 4:2 FTI
Based on the available data it can be expected that n:2 FTIs will be degraded and transformed into Cx-PFCAs (with x= n-1, n, n+1; see references and % PFCAs in Table B.24). n:2 FTIs follow a similar degradation pattern as the n:2 fluorotelomer alcohols forming the corresponding PFCAs, generally via an initial hydrolysis step forming the corresponding n:2 FTOH.
o Esters of n:2 fluorotelomer alcohols
Figure B.18. Example of an ester of an n:2 FTOH: 4:2 fluorotelomer methacrylate (4:2 FTMA)
Based on the available data it can be expected that esters of n:2 fluorotelomer alcohols (e.g. n:2 fluorotelomer (meth)acrylates (FT(M)As), n:2 fluorotelomer stearate monoesters, and n:2 fluorotelomer citrate trimesters) will be degraded and transformed into Cx-PFCAs (with x= n-2, n-1, n; see references and % PFCAs in Table B.24). Esters of n:2 fluorotelomer alcohols follow the same degradation pattern as the n:2 fluorotelomer alcohols forming the corresponding PFCAs, generally via an initial hydrolysis step forming the corresponding n:2 FTOH.
o n:2 Polyfluoroalkyl phosphoric acid mono-/diesters (monoPAPs/diPAPs)
Figure B.19. Example of an n:2 monoPAP/diPAP: 4:2 monoPAP Based on the available data it can be expected that n:2 monoPAPs and n:2 diPAPs will be degraded and transformed into Cx-PFCAs (with x= n-2, n-1, n, n+1; see references and % PFCAs in Table B.24). n:2 monoPAPs and n:2 diPAPs follow the same degradation pattern as the n:2 fluorotelomer alcohols forming the corresponding PFCAs, generally via an initial hydrolysis step forming the corresponding n:2 FTOH.
o n:2 Fluorotelomer urethane (monomers)

P.O. Box 400, FI-00121 Helsinki, Finland | Tel. +358 9 686180 | echa.europa.eu
90
Figure B.20. Example of an n:2 fluorotelomer urethane monomer: hexamethylene-1,6-di-(4:2 fluorotelomer urethane)
Based on the available data it can be expected that n:2 fluorotelomer urethane (monomers) will be degraded and transformed into Cx-PFCAs (with x= n-2, n-1, n; see references and % PFCAs in Table B.24). n:2 Fluorotelomer urethane monomers follow a similar degradation pattern as the n:2 fluorotelomer alcohols forming the corresponding PFCAs (generally via an initial hydrolysis step forming the corresponding n:2 FTOH.
o n:2 Fluorotelomer sulfonic acids (FTSAs)
Figure B.21. Example of an n:2 fluorotelomer sulfonic acid: 4:2 fluorotelomer sulfonic acid
Based on the available data it can be expected that n:2 FTSAs will be degraded under aerobic conditions and transformed into Cx-PFCAs (with x= n-2, n-1, n, n+1; see references and % PFCAs in Table B.24). n:2 Fluorotelomer sulfonic acids follow a similar degradation pattern as the n:2 fluorotelomer alcohols forming the corresponding PFCAs, generally via an initial de-sulfonation step forming the corresponding n:2 FTOH or the corresponding n:2 FTAL (fluorotelomer aldehyde) directly, depending on the conditions.
o n:2 Fluorotelomer thioether amido sulfonates (FTTAoSs) [belonging to the PFAS subgroup n:2 fluorotelomer-thiol derivatives]
Figure B.22. Example of an n:2 fluorotelomer thioether amido sulfonate: 4:2 FTTAoS (FTTAoSs are used in aqueous film-forming foam (AFF) formulations)
Based on the available data it can be expected that FTTAoS (and similar substances belonging to the PFAS subgroup n:2 fluorotelomer-thiol derivatives) will be degraded under aerobic conditions and transformed into PFCAs (see references and % PFCAs in Table B.24). n:2 FTTAoSs follow a similar degradation pattern as the n:2 fluorotelomer alcohols forming the corresponding PFCAs, generally via initial oxidation of the thioether-group into a sulfinyl group followed by an oxidation/C-S-cleavage step to form a n:2 fluorotelomer sulfonic acid, followed by a de-sulfonation step primarily forming the corresponding n:2 FTOH or the corresponding n:2 FTAL (fluorotelomer aldehyde) directly, depending on the conditions.

P.O. Box 400, FI-00121 Helsinki, Finland | Tel. +358 9 686180 | echa.europa.eu
91
o n:2 Fluorotelomer silanes
Figure B.23. Example of an n:2 fluorotelomer silane: triethoxy(3,3,4,4,5,5,6,6,7,7,8,8,8-tridecafluorooctyl)silane
Based on the available data it can be expected that n:2 fluorotelomer silanes will be degraded and transformed into corresponding PFCAs in the atmosphere (see references and % PFCAs in Table B.24). Nielsen (2014) proposed a photo-oxidation-mediated mechanism in which the corresponding n:2 fluorotelomer carboxylic acids (n:2 FTCAs) are initially formed by oxidation/Si-C cleavage, followed by further degradation into the corresponding PFCAs (in analogy with degradation of FTOHs).
In a study by Zhu et al. (2019) 8:2 polyfluoroalkyl trimethoxysilane (8:2 PTrMeOSi) was degraded in a hydroxyl radical-based total oxidizable precursor assay, yielding perfluoroheptanoic acid (PFHpA, 49 ± 11%) (-2 CF2), perfluorooctanoic acid (PFOA, 14 ± 3%) (-1 CF2), perfluorohexanoic acid (PFHxA, 12 ± 3%) (-3 CF2), perfluorononanoic acid (PFNA, 2 ± 0.2%) (-0 CF2) and the other shorter-chain analogues with decreasing molar yields.
o n:2 Fluorotelomer olefins (FTOs)
Figure B.24. Example of an n:2 fluorotelomer olefin: 4:2 FTO
Based on the available data it can be expected that n:2 fluorotelomer olefins will be degraded and transformed into corresponding PFCAs in the atmosphere via a photo-oxidation-mediated mechanism (see Figure B.25 and references in Table B.24).
Figure B.25. Proposed atmospheric degradation pathway for n:2 fluorotelomer

P.O. Box 400, FI-00121 Helsinki, Finland | Tel. +358 9 686180 | echa.europa.eu
92
olefins into PFCAs (from Nielsen, 2014)
o n:2 Fluorotelomer-based side-chain fluorinated polymers
Figure B.26. Example of an n:2 fluorotelomer-based side-chain fluorinated polymer: 4:2 fluorotelomer acrylate polymer
Based on the available data it can be expected that the n:2 fluorotelomer-based side-chain fluorinated polymers will degrade in the same way as the small-molecule precursors into the corresponding PFCAs (Russell et al., 2008; Russell et al., 2010; Washington et al., 2009; Washington and Jenkins, 2015; Rankin et al., 2014), generally via an initial hydrolysis step forming the corresponding FTOH.
It can be assumed that the degradation mechanisms of the n:2 fluorotelomer derivatives described above are independent from the chain length (see also Section 4.1.2 concerning the effects of chain length, branching and cyclic structure elements on persistence). A limited number of available degradation studies on fluorotelomer derivatives are summarized in table 2.

P.O. Box 400, FI-00121 Helsinki, Finland | Tel. +358 9 686180 | echa.europa.eu
93
Table B.24. Summary of formed PFCAs during degradation of n:2 fluorotelomer derivatives Substance Compartment Study
duration C4-PFCA [%]
C5-PFCA [%]
C6-PFCA [%]
C7-PFCA [%]
C8-PFCA [%]
C9-PFCA [%]
C10-PFCA [%]
Reference
n:2 Fluorotelomer iodides (FTIs) 6:2 FTI Soil 91 d - 20 mol% 3.8 mol% 16 mol% (Ruan et al., 2010) 4:2 FTI Atmosphere + + (Young et al.,
2008; Young and Mabury, 2010)
FTI Hydrolysis (modelling)
Corresponding FTOHs and PFCAs (Nielsen, 2014; Rayne and Forest, 2010)
Esters of n:2 fluorotelomer alcohols 8:2 fluorotelomer stearate monoester
Agricultural soil
80 d 0.16 mol%
0.38 mol%
1.7 mol% 0.009 mol%
(Dasu et al., 2012)
8:2 fluorotelomer stearate monoester
Forest soil 94 d 0.2 mol% 0.9 mol% 4 mol% (Dasu et al., 2013)
8:2 Fluorotelomer citrate triester
Forest soil 218 d 0.2 mol% 0.8 mol% 4 mol% (Dasu et al., 2013)
n:2FT(M)A (n=2-12) Hydrolysis (modelling)
Corresponding FTOHs and PFCAs (Nielsen, 2014; Rayne and Forest, 2010)
8:2 FTA Soil 105 d <0.4 mol%
1.3 mol% 8 mol% (Royer et al., 2015)
8:2 FTMA Soil 105 d <0.4 mol%
3.4 mol% 10.3 mol%
(Royer et al., 2015)
4:2 FTA Atmosphere 10 d Corresponding PFCAs (1-10 mol%) (Butt et al., 2009) n:2 Polyfluoroalkyl phosphoric acid mono-/diesters (monoPAPs/diPAPs) n:2 diPAPs (n = 4, 6, 8, 10)
Rats Corresponding FTOHs and PFCAs (D'eon and Mabury, 2011)
6:2 monoPAP Wastewater and sewage sludge
92 d 0.7 mol%
2.1 mol%
8.4 mol%
(Lee et al., 2010) 6:2 diPAP Wastewater
and sewage sludge
92 d 1.5 mol%
6.2 mol%
7.3 mol%
n:2 monoPAPs (n = 4, 6, 8, 10)
Wastewater and sewage sludge
92 d Corresponding FTOHs (1-2% after 92 days) and PFCAs

P.O. Box 400, FI-00121 Helsinki, Finland | Tel. +358 9 686180 | echa.europa.eu
94
6:2 diPAP Soil and plant 5.5 months
+ + + + (Lee et al., 2014)
6:2 diPAP Activated sludge
30 d 0.47 mol%
2 mol% 0.04 mol%
(Lewis et al., 2016)
6:2 diPAP Soil 112 d 0.73 6.4 6 (Liu and Liu, 2016)
8:2 diPAP Soil 112 d 0.34 0.25 2.1 8:2 diPAP compost
amended soil 2.4
108 d + + 10 %
(Bizkarguenaga et al., 2016)
compost amended substrate
+ + 62 %
in presence of crops (carrot)
3 months + + + + + +
in presence of crops (lettuce)
1 month +
8:2 monoPAP and diPAP
Hydrolysis 14 d 8:2 FTOH
(D'eon and Mabury, 2007; Nielsen, 2014; Rayne and Forest, 2010)
8:2 monoPAP and diPAP
Rats 15 d - + + - (D'eon and Mabury, 2007)
n:2 Fluorotelomer urethane (monomers) toluene-2,4-di-(8:2 fluorotelomer urethane) (FTU)
Agricultural soil
180 d + (from residual
8:2 FTOH)
(Dasu and Lee, 2016) Forest soil 117 d 0.07
mol% 0.11 mol%
0.84 mol%
hexamethylene-1,6-di(8:2 fluorotelomer urethane) (HMU)
Forest soil 180 d 0.06 mol%
0.14 mol%
0.94 mol%
n:2 Fluorotelomer sulfonic acids (FTSAs) 6:2 FTSA WWTP-
activated sludge
90 d 0.14 1.5 1.1 - (Wang et al., 2011)
6:2 FTSA Aerobic sediment
90 d - 21 mol% 20 mol% 0.55 mol%
(Zhang et al.,

P.O. Box 400, FI-00121 Helsinki, Finland | Tel. +358 9 686180 | echa.europa.eu
95
Anaerobic sediment
100 d - - - - 2016)
n:2 Fluorotelomer thioether amido sulfonates (FTTAoSs) [belonging to the PFAS subgroup n:2 fluorotelomer-thiol derivatives] n:2 FTTAoS (n=4,6,8)
Soil amended with an AFFF solution
60 d + + + + (Harding- Marjanovic et al., 2015)
n:2 Fluorotelomer olefins (FTOs) n:2 Fluorotelomer olefins
Atmosphere Corresponding FTOHs and PFCAs (Nielsen, 2014; Sulbaek Andersen et al., 2005; Young and Mabury, 2010)
n:2 Fluorotelomer silanes n:2 Fluorotelomer silanes
Atmosphere Corresponding PFCAs (Nielsen, 2014; Zhu et al., 2019)
[+] detected, but not quantified; [-] not detected; [ ] not evaluated

P.O. Box 400, FI-00121 Helsinki, Finland | Tel. +358 9 686180 | echa.europa.eu
96
Other PFCA precursors (majority of these PFAS subgroups were not included in the background documents to previous PFCA restrictions)
o Perfluoroalkyl carboxylic acid halides
Based on the available data it can be expected that perfluoroalkyl carboxylic acid halides will undergo hydrolysis with formation of the corresponding PFCAs. In the manufacturing of PFCAs, perfluoroalkyl carboxylic acid fluorides, CnF2n+1C(O)F are hydrolysed in the last synthesis step to yield the corresponding PFCA CnF2n+1C(O)OH (Buck et al., 2011). Perfluoroalkyl carboxylic acid fluorides, as well as other perfluoroalkyl carboxylic acid halides, are expected to undergo hydrolysis also under environmental conditions (Young and Mabury, 2010).
o Amides of perfluoroalkyl carboxylic acids
Figure B.27. Example of an amide of a perfluoroalkyl carboxylic acid: N-ethyl-perfluoro-butyramide
Based on the available data it can be expected that amides of perfluoroalkyl carboxylic acids (CnF2n+1C(O)NRR’) can be abiotically degraded (primarily in the atmosphere via a photooxidation-mediated mechanism) and transformed into corresponding PFCAs (mainly CnF2n+1C(O)OH; Jackson et al., 2013; Jackson and Mabury, 2013).
o n:1 Fluorotelomer alcohols
Figure B.28. Example of a n:1 fluorotelomer alcohol: 5:1 FTOH
Based on the available data it can be expected that in the atmosphere n:1 fluorotelomer alcohols (n:1 FTOHs) can undergo OH-radical-mediated oxidation to form perfluoroaldehydes F(CF2)nC(O)H, which can be further oxidized to form the corresponding PFCAs (Wang et al., 2014; Hurley et al., 2004b; Hurley et al., 2006). In a study by Hurley et al. (2004b), n:1 FTOHs F(CF2)nCH2OH (n = 1-4) were reacted with Cl radicals in a smog chamber (UV irradiation of F(CF2)nCH2OH/Cl2 in air; the Cl radicals represent OH radicals). The reaction was followed by FTIR analysis. In all cases, the perfluoroaldehyde, F(CF2)nC(O)H, was the sole primary product. F(CF2)nCOOH, C(O)F2, CF3OH, and CF3O3CF3 were observed as secondary products. According to the authors, reaction of F(CF2)nCH2OH (n = 1-4) is initiated by the abstraction of hydrogen, followed by reaction with oxygen, leading to formation of the perfluoroaldehyde, F(CF2)nC(O)H. In a separate study by Hurley et al. (2006), it was suggested that perfluoroaldehydes F(CF2)nC(O)H can be further oxidized in the atmosphere via initial formation of perfluoroacyl

P.O. Box 400, FI-00121 Helsinki, Finland | Tel. +358 9 686180 | echa.europa.eu
97
peroxy radicals F(CF2)nC(O)O2 that can react further with HO2 radicals, forming the corresponding PFCAs. The perfluoroaldehydes can also degrade via another route, forming F(CF2)n radicals and CO, that can react further via a chain shortening mechanism. The authors argued that the relative importance of these two reaction pathways in the atmosphere requires detailed knowledge of the temperature- and pressure-dependence of respective pathway.
o Perfluoroalkyl alcohols
Figure B.29. Example of a perfluoroalkyl alcohol: perfluorohexanol
Based on the available data it can be expected that in the atmosphere perfluoroalkyl alcohols (CnF2n+1OH) can undergo heterogeneous elimination of HF to give the acyl fluorides Cn-1F2n-
1C(O)F, which can hydrolyze to give the corresponding PFCAs Cn-1F2n-1C(O)OH (Ellis et al., 2004).
o Perfluoroalkyl iodides (PFAIs)
Figure B.30. Example of a perfluoroalkyl iodide: perfluoropentyl iodide
Based on the available data it can be expected that perfluoroalkyl iodides can be abiotically degraded and transformed into PFCAs. Perfluoroalkyl iodides are known to readily undergo chemical reactions under certain laboratory conditions, such as gas phase photolysis, reacting preferentially by homolytic cleavage of the C–I bond (Nielsen, 2014; Siegemund et al., 2012). Based on this intrinsic property, perfluoroalkyl iodides can be expected to generate the radical species CnF2n+1· under certain environmental conditions, e.g. in the atmosphere, via a photooxidation-mediated mechanism. CnF2n+1· is a potential source for PFCAs.
o Perfluorinated olefins (with the formula CnF2n+1-CF=CF-CmF2m+1)
Figure B.31. Example of a perfluorinated olefin: perfluoropent-2-ene
Based on the available data it can be expected that in the atmosphere perfluorinated olefins (CnF2n+1-CF=CF-CmF2m+1) can undergo OH-radical-mediated degradation forming the

P.O. Box 400, FI-00121 Helsinki, Finland | Tel. +358 9 686180 | echa.europa.eu
98
perfluoroacyl fluorides CnF2n+1C(O)F + CmF2m+1C(O)F that can subsequently hydrolyse to the corresponding PFCAs CnF2n+1C(O)OH + CmF2m+1C(O)OH (Young and Mabury, 2010, Young et al. 2009; see Figure B.32).
Figure B.32. Mechanism for the atmospheric oxidation of perfluorobut-2-ene (from Young et al. 2009).
Young et al. (2009) investigated the expected atmospheric fate of two perfluorobutenes, CF3CF=CFCF3 and CF3CF2CF=CF2, using smog chamber techniques. Rate constants for reaction with chlorine atoms and hydroxyl radicals were measured with relative rate techniques. The atmospheric lifetimes of CF3CF=CFCF3 and CF3CF2CF=CF2 are determined by reaction with OH radicals and are approximately 24 and 6 days, respectively. The chlorine atom- and OH radical-initiated oxidation of CF3CF=CFCF3 in 700 Torr of air gives CF3C(O)F in a molar yield indistinguishable from 200%, while the oxidation of CF3CF2CF=CF2 gives CF3CF2C(O)F and COF2 in molar yields indistinguishable from 100%. The atmospheric fate of CF3C(O)F and CF3CF2C(O)F is hydrolysis to give perfluorocarboxylic acids (PFCAs), CF3C(O)OH and CF3CF2C(O)OH.
In a review article on atmospheric perfluorinated acid precursors, Young and Mabury (2010) argued that because perfluorinated chain length has not been shown to affect reaction mechanism in experiments with alcohols and acids, it is likely that any alkene, in which a C–F bond and a perfluorinated alkane chain appear on one side of the double bond, would be expected to follow this pathway, producing perfluoroacyl fluorides, and subsequently, PFCAs, in 100% molar yield. Fluorinated alkenes form PFCAs in 100 or 200% yield, under typical atmospheric conditions, in the presence or absence of NOx.
o Side-chain fluorinated aromatics
Figure B.33. Example of a side-chain fluorinated aromatic: (Heptafluoropropyl)benzene
Based on the available data it can be expected that side-chain fluorinated aromatics (CnF2n+1-Ar) can be degraded and transformed into the corresponding PFCAs (CnF2n+1C(O)OH).

P.O. Box 400, FI-00121 Helsinki, Finland | Tel. +358 9 686180 | echa.europa.eu
99
The PFAS subgroup side-chain fluorinated aromatics is a very diverse group defined as “aromatics that have one or more aliphatic fully fluorinated saturated carbon moiety on the side chain(s) attached to the aromatic ring(s)” (OECD, 2021). The aromatic ring can be a phenyl group or any heteroaromatic group, with or without additional substituents. The fluorinated side-chain can have different carbon chain lengths and branching. The trifluoromethyl group is the most widely applied fluorinated side-chain.
There are many pesticides that contain a trifluoromethyl-substituted aromatic ring. The corresponding PFCA, Trifluoroacetic acid (TFA), has been identified as a significant degradation product in numerous studies conducted as part of the EU evaluation of plant protecting active substances (with a variety of structural features), including:
Flurtamone (Figure B.34): Metabolism of flurtamone in primary crops was investigated in the cereals/grass (wheat, barley) and in oilseeds/pulses (sunflower, peanuts) crop groups, using 14C-flurtamone (EFSA, 2016). TFA metabolite was identified as the most abundant compound of the total residues in wheat grain (86–93% total radioactive residue - TRR), in wheat forage (44% TRR) and in wheat straw (49% TRR), while 3-(trifluoromethyl)benzoic acid metabolite was predominantly identified in sunflower seed (19% TRR). The metabolism of flurtamone in primary crops proceeds mainly by hydroxylation, respectively, of the phenyl and trifluoromethylphenyl rings, followed by conjugation with malonic acid and glucose, N-demethylation, oxidative cleavage of the trifluoromethylphenyl moiety leading to TFA metabolite, and oxidative ring opening of the furanone moiety with subsequent cleavage and degradation of the carbon chain.
Figure B.34. Structural formula of flurtamone
Saflufenacil (Figure B.35): Metabolism of saflufenacil in primary crops was investigated in maize, soybean and tomatoes, using 14C- saflufenacil (EFSA, 2014). In maize, TFA was the predominant constituent (30.5% to 88% TRR, in grain it accounted for 0.004 mg/kg). Since the potentially corresponding 14C-phenyl-labelled metabolites as counter parts of TFA were not detected at adequate quantities, the occurrence of TFA was explained by the uptake of this metabolite or a respective precursor molecule from the soil. In soya beans after pre-emergence application to the soil surface, TFA was the major compound identified (65.4 %TRR (beans) to 85.2%TRR (forage)). In tomatoes TFA was also found being the predominant constituent (48.6% TRR (in fruit) to 82.2%TRR (in tomato plant)). The occurrence of TFA was explained by the uptake of this metabolite or of a respective precursor molecule from the soil.

P.O. Box 400, FI-00121 Helsinki, Finland | Tel. +358 9 686180 | echa.europa.eu
100
Figure B.35. Structural formula of saflufenacil
Fluazinam (Figure B.36): Fluazinam is proposed to be used on crops that can be grown in rotation with other crops. In the confined rotational crop studies (EFSA, 2017), TFA was the only relevant compound in rotational crops (lettuces, barley grains, carrots). Fluazinam or any of its primary metabolites were not found.
Figure B.36. Structural formula of fluazinam
Fluometuron, trifloxystrobin and cyflumetofen (Figure B.37) are additional examples of plant protecting active substances where TFA has been identified as a significant metabolite in their respective EU evaluation (EFSA, 2019; EFSA, 2017b; EFSA 2021).
a) b) c)
Figure B.37. Structural formulas of fluometuron (a); trifloxystrobin (b); cyflumetofen (c)
In a study by Scheurer et al. (2017) the potential TFA formation in wastewater treatment plants (WWTP) was investigated for a number CF3-containing compounds, including five trifluoromethyl substituted aromatics: the pharmaceutical active substances fluoxetine and

P.O. Box 400, FI-00121 Helsinki, Finland | Tel. +358 9 686180 | echa.europa.eu
101
sitagliptine and the plant protecting active substances flufenacet, flurtamone and fluopyram (see Figure B.38).
a) b) c)
d) e) Figure B.38. The pharmaceutical active substances fluoxetine (a) and sitagliptine (b) and the plant protecting active substances flufenacet (c), flurtamone (d) and fluopyram (e) were examined for their potential degradation to TFA in wastewater treatment plants during activated sludge treatment or upon ozonation (Scheurer et al., 2017) The TFA-evolution-potential of the test compounds by chemical oxidation were examined. A concentration of 100 μg/L of the test compound was applied in demineralized water and two different ozone dosages (0.4–0.5 mg/L and 4–5 mg/L) were used. Samples were taken after contact times between 5 min and 60 min. Fluoxetine and flurtamone were rapidly degraded by ozone and could not be detected after 5 min contact time at both ozone concentrations applied. Approx. 40% TFA had been formed on a molar base from fluoxetine and flurtamone after 60 min. The respective precursor compounds were completely oxidized after 5 min contact time but a steady increase of TFA over the course of the test indicated that intermediates are formed, which are further oxidized to TFA. A comparatively fast but incomplete oxidation after 60 min was also observed for flufenacet and fluopyram. TFA yields were 19% and 32%, respectively. Sitagliptine was completely degraded after 60 min contact time in the batches with 4 mg/L, but the TFA yield was lower (4%). The biological degradation of the test compounds was investigated by conducting a modified OECD guideline 302 B Zahn-Wellens test. In the test, sewage sludge directly taken from the activated sludge basin of the local WWTP was used as inoculum and were spiked with an aqueous solution of the test compound to obtain a final concentration of 1 mg/L. Samples were collected at least once a week and at days 27 and 28 according to the guideline. The primary degradation of the compounds and the formation of TFA was followed by LC/MS/MS. At the end of the test (28 d) removal of 67% fluoxetine, 56% flufenacet, 51% flurtamone, 25% fluopyram and 20% sitagliptine was observed. A steady increase of TFA was observed and after 28 d the following TFA concentrations were measured: 1.4 μg/L (fluoxetine), 7.4 μg/L (flufenacet), 1.4 μg/L (flurtamone), 1.2 μg/L (fluopyram), 0.31 μg/L (sitagliptine). These TFA concentrations correspond to up to 5% molar transformation of the degraded parent compound (flufenacet).
In a mechanistic study by Khan and Murphy (2021), the microbial degradation pathways of the pharmaceutical active substance fluoxetine by common environmental bacteria were investigated by 19F NMR and GC–MS analyses. After fluoxetine had been incubated with

P.O. Box 400, FI-00121 Helsinki, Finland | Tel. +358 9 686180 | echa.europa.eu
102
bacteria, TFMP was shown to accumulate, and it is proposed that the ether bond in fluoxetine is initially hydrolysed yielding 4-(trifluoromethyl)phenol (TFMP) and 3-(methylamino)-1-phenylpropan-1-ol. The latter degraded further while TFMP remained in the culture supernatant. In a subsequent experiment, when TFMP was incubated with bacteria separately, it was degraded further and TFA was ultimately formed. In addition to TFA, 19F NMR signals from the meta-cleavage products were detected as well as for fluoride ions. The formation of fluoride ions was explained by a competing photolytic degradation of the meta-cleavage products, resulting in defluorination. The extent this defluorination pathway was facilitated by the exposure of light. The overall degradation pathways were proposed based on these experimental observations and predicted intermediates from the EAWAG Biocatalysis/Biodegradation Database (Figure B.39).
Figure B.39. Khan and Murphy (2021) proposed the above degradation pathway for fluoxetine based on the predicted intermediates from the EAWAG Biocatalysis/Biodegradation Database and the experimental observations. Degradation products that were observed with 19F NMR and/or GC–MS analyses

P.O. Box 400, FI-00121 Helsinki, Finland | Tel. +358 9 686180 | echa.europa.eu
103
are shown inside dashed boxes.
In a mechanistic study by Ellis and Mabury (2000), photolysis degradation experiments of 3-trifluoromethyl-4-nitrophenol (TFM) were carried out at 365 nm in buffered deionized water (pH 7 and pH 9) and analysed by 19F NMR and HPLC–UV. The half-life of TFM at was found to be 22 h at pH 9 yielding 5.1% TFA, and 91.7 h at pH 7 yielding 17.8% TFA. In addition to TFA, the formation of fluoride ions was also observed and explained by competing degradation pathways that seemed to be facilitated by a higher pH (see proposed degradation pathways in Figure B.40). This type of defluorination degradation pathway (via the deprotonated TFM) has been reported previously for orto- and para trifluoromethyl phenol (as the only degradation pathway under abiotic degradation conditions; Sakai and Santi, 1973). This was also verified in separate experiments with orto- and para trifluoromethyl phenol within this study.
Figure B.40. Photolysis degradation pathways of TFM proposed by Ellis and Mabury (2000)
Conclusions on degradation of PFCA precursors
In conclusion, all PFCA precursor share the same basic structural features: a perfluorinated part (F(CF2)n-) (linear/branched/cyclic) attached to a degradable moiety, including for example -CH2CH2-R, -CH2-R, -aromatic ring, -C(O)NRR’. These substances can be degraded to PFCAs by abiotic and/or biotic processes in the environment. However, there may be a large variation in the degradation rates, pathways and to what extent the corresponding PFCAs are formed depending on the specific environmental conditions. For those substances where no specific degradation studies are available, degradation pathways can in many cases be assumed based on the chemical similarity with related substances, irrespective of chain length or branching of the perfluoroalkyl moieties. Still, physicochemical properties like volatility and solubility of a specific substance influences the partitioning to different compartments in the environment.
The above conclusions are to a large extent based on the reasoning in the Background documents to the Opinion on the Annex XV dossier proposing restrictions on PFOA (ECHA, 2018b), C9-C14 PFCAs (ECHA, 2018), and PFHxA (ECHA, 2021) which has been discussed and approved by RAC for the purpose of these restrictions.

P.O. Box 400, FI-00121 Helsinki, Finland | Tel. +358 9 686180 | echa.europa.eu
104
B.4.1.3.2. Degradation of F-gases
F-gases constitute a subclass of PFAS which end up in the atmosphere after releases and therefore degrade under different conditions, as compared to PFAS that mainly partition to water and soil. Following release into the environment, F-gases reside in the atmosphere where they are oxidized into a variety of degradation products. Some degrade easily in the atmosphere, while others are more stable and require much longer times. Some degradation routes lead to complete degradation and formation of degradation products like CO2 and HF, while other routes lead to formation of trifluoroacetic acid (TFA) which precipitates with rain and snow. In many cases, one substance may degrade via several pathways.
o Hydrofluorocarbons (HFCs) and hydrofluoroolefins (HFOs)
When evaluating the degradation of F-gases there are some key intermediates which are formed from several different starting F-gases. These include trifluoroacetaldehyde (CF3CHO), trifluoroacetyl fluoride (CF3COF) and trifluoromethanol (CF3OH), see Figure B.41 below. For example, F-gases containing one or more C-H bonds are susceptible to attack by OH radicals in the lower atmosphere (Wallington et al., 1994). These radical processes lead to carbonyl compound intermediates, e.g. trifluoroacetaldehyde (CF3CHO) or trifluoroacetyl fluoride (CF3COF). It is known that the atmospheric decomposition of e.g. HFO-1234ze (CHF=CH-CF3) yields trifluoroacetaldehyde (CF3CHO) with 100% molar yield (Nilsson et al., 2009; Qing et al., 2018; Campbell et al., 2021).

P.O. Box 400, FI-00121 Helsinki, Finland | Tel. +358 9 686180 | echa.europa.eu
105
Three different degradation pathways: a) the OH-initiated abstraction reaction, b) hydrolysis or c) photolysis. TFA formation indicated at up to 10%.
100%
Trifluoroacetic acid (TFA),Precipitates
Atm. lifetime ca. 5 yearsGWP unknown, Toxic
HF
Trifluoroacetaldehyde (CF3CHO)
Atm. lifetime ca. 4 days
Trifluoroacetyl fluoride (CF3COF),Atm. lifetime short
Trifluoromethanol (CF3OH)
Trifluoroacetic acid (TFA),Precipitates
CO2, HF
CO2, HF
Figure B.41. Degradation routes of some key intermediates from F-gases.
The sequence of gas-phase reactions that follow from an initial attack of OH radicals on the parent halocarbon are sufficiently rapid that heterogeneous and aqueous processes play no role. In contrast, the lifetimes of the carbonyl products are relatively long (weeks) and hydrolysis in water droplets may be relevant for the removal of halogenated halogen compounds (Wallington et al., 1994).
Buszek and Francisco (2009) looked at the gas-phase decomposition of trifluoromethanol (CF3OH) with water. They pointed out that it is known that trifluoromethanol quickly degrades into carbonyl fluoride (CF2O) and HF at room temperature, while the photolytic lifetime of the substance in the atmosphere below 40 km is on the million-year scale. Hence, trifluoromethanol in the atmosphere is acting as a sink for hydrofluorocarbons (HFCs) and hydrofluoroethers (HFEs). However, the authors identified a catalytic mechanism with water and OH radical to be relevant for the decomposition of trifluoromethanol and formation of carbonyl fluoride (CF2O) and HF.

P.O. Box 400, FI-00121 Helsinki, Finland | Tel. +358 9 686180 | echa.europa.eu
106
For trifluoroacetaldehyde (CF3CHO) reaction with OH radicals is important, while trifluoroacetyl fluoride (CF3COF) is removed almost entirely into water droplets. Although acid fluorides are almost insoluble in water, they hydrolyze quickly with formation of HF and the corresponding carboxylic acid which are very water soluble. Hence, hydrolysis removes trifluoroacetyl fluoride (CF3COF) from the gas phase irreversibly as TFA. For trifluoroacetaldehyde (CF3CHO) further gas-phase oxidation processes are important.
The atmospheric degradation of trifluoroacetaldehyde (CF3CHO) can occur via three competing reactions: a) the OH-initiated abstraction reaction, b) hydrolysis or c) photolysis (UBA 2021, page 106, and references therein). TFA may be the outcome of some of these processes and subprocesses (e.g. path b, hydrolysis), with CO2 and HF indicated as the final end products in the other processes. How important the three different degradation processes are relative to each other is unclear, while up to 10% formation of TFA from trifluoroacetaldehyde (CF3CHO) has been estimated in UBA (2021), page 109.
Sulbaek Andersen et al. (2018) investigated the atmospheric degradation of HCFO-1233zd(E), E-CF3CH=CHCl in a 3-dimensional global atmospheric chemistry and transport model. Atmospheric degradation of E-CF3CH=CHCl is initiated by reaction with OH radicals, which leads to several chemical oxidation products. The atmospheric lifetime was estimated ta ca. 36 days, and GWP at <5. The degradation pathways were shown to go via CF3CHO as a key intermediate, which over time degrades further to HF and CO2 or TFA. In this model TFA formation was indicated at approximately 2%.
Campbell et al. (2021) looked further into the atmospheric photodissociation of trifluoroacetaldehyde (CF3CHO) as a degradation intermediate from HFO-1234ze. They found that although photolysis of trifluoroacetaldehyde (CF3CHO) with formation of trifluoromethyl (CF3) and formyl (CHO) radicals, which is further transformed into CO2 and HF, is the dominating decomposition pathway (79%), up to 11% of the trifluoroacetaldehyde (CF3CHO) in the atmosphere decomposes with formation of CO and fluoroform (CHF3, HFC-23), see Figure B.42. Fluoroform has a GWP = 12690, while its parent HFOs may have GWPs of less than 1 (e.g. HFO-1234ze). However, the authors point at uncertainties in the study and call for experiments to investigate these considerable findings further. The atmospheric lifetime of fluoroform (HFC-23) is ca. 228 years (Stanley et al., 2020).

P.O. Box 400, FI-00121 Helsinki, Finland | Tel. +358 9 686180 | echa.europa.eu
107
HFO-1234ze
CHF=CH-CF3
100%
Trifluoroacetaldehyde, CF3CHO
Atm. half life ca. 4 days
79%
CO2, HF
11%
CO CHF3, fluoroform (HFC-23)
Atm. lifetime ca. 228 yearsGWP = 12690
GWP < 1
Figure B.42. Degradation pathway for HFO-1234ze according to Campbell et al. (2021).
The degradation routes for a range of F-gases were examined by the Environmental Coalition on Standards (ECOS, 2021). Their overview shows that modern HFCs and HFOs degrade primarily to carbonyl fluoride (CF2O, which further degrades to CO2 and HF), trifluoroacetaldehyde (CF3CHO, which further degrades to e.g. fluoroform, HFC-23 with high GWP) or trifluoroacetyl fluoride CF3COF, which further degrades to TFA which precipitates). The authors concluded that some low-GWP fluorinated refrigerants may contribute substantially to global warming through their degradation products.
In a recent study of the tropospheric photolysis of CF3CHO, Sulbaek Andersen and Nielsen (2022) came to a different conclusion when they, in a chamber study, used broadband actinic radiation and FTIR spectroscopy for detection of the photolysis products. No formation of CF3H (HFC-23), was observed under any of the experimental conditions and an estimated upper limit for the yield of HFC-23 of 0.3% was established.
The atmospheric chemistry of short-chain haloolefins (e.g. substance HFO-1234ze in Figure B.42) were investigated by Wallington et al. (2015). They concluded that haloolefins containing the CF3CF= group leads to TFA as a persistent degradation product, while haloolefins containing the CF3CH= group were reported to degrade with formation of CF3CHO

P.O. Box 400, FI-00121 Helsinki, Finland | Tel. +358 9 686180 | echa.europa.eu
108
as the primary key intermediate. This general rule will identify among others the substances HCFO-1224yd(Z) (CF3CF=CHCl), HFO-1234yf (CF3CF=CH2) and HFO-1216 (CF3CF=CF2) as TFA-precursors.
o Hydrofluoroethers (HFEs)
Tsai (2005) looked into the degradation of hydrofluoroethers (HFEs) as these are being used as third generation replacements to chlorofluorocarbons (CFCs), hydrochlorofluorocarbons (HCFCs) and perfluorocarbons (PFCs). With regards to atmospheric degradation, the author uses HFE-7100, C4F9OCH3, as a typical example and explains that OH radical initiated hydrogen abstraction is common. Following oxidative reactions then lead to the corresponding formate ester C4F9OC(O)H. Such substances are rather unreactive towards further radical processes but may undergo hydrolysis in droplets. Nohara et al. (2001) found that for the formate esters such, as C4F9OC(O)H, the formate group is cleaved off with formation of the corresponding alcohol C4F9OH, which again suffers C-C cleavage and formation of the carboxylic acid C3F7CO2H with one C-atom less in the fluoroalkyl chain. In general terms: CnF2n+1OCH3 --> Cn-1F2n-1CO2H.
o Perfluoroalkyl ketones
According to a study by Taniguchi et al. (2003) the ketone substance C2F5C(O)CF(CF3)2 (Novec 612) in the atmosphere suffers photolytic cleavage which results in CF3C(O)F and COF2. As indicated above, CF3C(O)F will be incorporated into rain/cloud/seawater where it will undergo hydrolysis to give TFA, while COF2 will be converted to CO2 and HF. The half-life of trifluoromethanol (CF3OH) with respect to decomposition into COF2 was found to be 4-5 h in this study.
o F-gas nitrile compounds
The atmospheric chemistry of the nitrile coumpound Novec 4710, (CF3)2CFCN, was studied by Sulbaek Andersen et al. (2017) in FTIR/smog chamber experiments and ab initio quantum calculations. They estimated the atmospheric lifetime of Novec 4710 at approximately 22 years and GWP at 1490. The sole atmospheric degradation products were found to be NO, COF2, and CF3C(O)F. The latter is known to hydrolyze in droplets with formation of TFA. The yield of formation of CF3C(O)F from Novec 4710 was indicated at 100%.
Conclusions on degradation of F-gases
In conclusion, F-gases have a complex atmospheric chemistry often based on radical oxidation processes via trifluoroacetaldehyde (CF3CHO) or trifluoroacetyl fluoride (CF3COF) as intermediates. The latter of these key intermediates is further hydrolyzed in high yield to trifluoroacetic acid (TFA) in water droplets which precipitates with rain and snow, while trifluoroacetaldehyde may degrade to TFA in up to 10% yield in one of three degradation pathways. Other key degradation products from F-gases include longer chain substances like PFBA which is formed from the hydrofluoroether HFE-7100 (C4F9OCH3).
B.4.1.3.3. Degradation of PFSA precursors
The degradation pathways of several PFSA precursors into the corresponding PFSAs (mainly C4, C6 and C8 perfluoroalkane sulfonic acids) are described in the Annex XV restriction report for the restriction proposal on perfluorohexane sulfonic acid (PFHxS, ECHA, 2019c). Hence, this section is based on the information in the PFHxS Annex XV restriction report. It can be assumed that the degradation mechanisms for PFSAs of other chain lengths are the same as for C4, C6 and C8 PFSA precursors.
In a literature study carried out by the University of Oslo (Nielsen, 2017), the formation of PFBS and PFHxS through abiotic degradation of precursors was investigated. PFBS/PFHxS-related substances were found to include PFBS/PFHxS sulfonic acid halides, sulfonic esters

P.O. Box 400, FI-00121 Helsinki, Finland | Tel. +358 9 686180 | echa.europa.eu
109
(alkyl, olefinic and aryl) and sulfonamides, side-chain fluorinated polymers containing the PFBS/PFHxS moiety, as well as subclasses of PFBS/PFHxS-related substances like sulfones and sulfinic acids.
Abiotic degradation of the identified precursors to PFSAs may proceed either via reaction with water or via oxidative radical processes in the atmosphere. However, in the radical processes, for the sulfonyl group may also be cleaved off in a different degradation pathway with formation of perfluoroalkyl radicals that may suffer sequential CF2-loss and formation of shorter chain-length PFCAs (this pathway has been reported for perfluoroalkane sulfonamides, Martin, et al., 2006; D'Eon, et al., 2006; see Figure B.43). To what extent the precursors will end up as PFSAs or PFCAs may vary with the environmental conditions and is difficult to predict. The rate of degradation may vary for the different precursors, and in some cases the process may take years. Little information about the rate of degradation of such substances has been published.
...
PFHxS sulfonic ester,R = alkyl, olefin, aryl
PFHxS sulfonic halides,X = F, Cl, Br
PFHxS sulfonamides,R, R' = H, alkyl, olefin, aryl
PFCAs
hydrolysis orradical processes
radicalprocesses
PFHxS
Figure B.43. Degradation scheme of a selection of PFSA precursors, exemplified by PFHxS precursors.
A review article on the atmospheric oxidation of organic sulfur-containing substances shows that dimethyl sulphide is oxidized in radical initiated oxidation processes in the atmosphere via dimethylsulfoxide and methane sulfinic acid to methane sulfonic acid as the end product (Barnes, et al., 2006). Oxidation of the relevant sulfinic acids to PFBS and PFHxS is also described in a study of potential precursors to PFBS and PFHxS (Nielsen, 2017). The findings suggest sulphides, thiols and intermediate oxidation products as precursors to PFSAs, as shown in Figure B.44.

P.O. Box 400, FI-00121 Helsinki, Finland | Tel. +358 9 686180 | echa.europa.eu
110
Figure B.44. Oxidation processes from sulphides/thiols to the corresponding PFSA
A review of the microbial degradation of polyfluoroalkyl chemicals in the environment points out that perfluoroalkane sulfonamido derivatives may undergo aerobic biodegradation, via the relatively stable intermediate sulfonamides, to the corresponding PFSAs as the final degradation products (Liu and Avendano, 2013). Liu et al. (2019) investigated the biotransformation of perfluoroalkane sulfonamide compounds in aerobic soil and looked specifically at differences between the linear and branched isomers in the transformation of PFOS-precursors to PFOS. However, as there are several degradation pathways for the different precursors, there was no clear overall trend that differentiates between the linear and the branched precursors.
In biological systems it has been demonstrated that perfluoroalkane sulfonamides like N-EtFOSA are precursors to PFOS in fish (Tomy, et al., 2004) and N-EtFOSA was biotransformed by earthworms to PFOS after in vivo and in vitro exposure (Zhao, et al., 2018). Further in vitro depletion of PFOS precursors (N-EtFOSA and perfluorooctane sulfonamide (FOSA)) was confirmed in a liver microsomal assay approach in polar bear, ringed seal and laboratory rat (Letcher, et al., 2014). Perfluoroalkane sulfonamido alcohols like N-EtFOSE are degraded to PFOS in activated sludge (Rhoads, et al., 2008) and levels of PFSA-precursors in sludge from WWTP exceeded those of PFSAs itself (Eriksson, et al., 2017).
Conclusions on degradation of PFSA precursors
In conclusion, all molecules that contain a CnF2n+1SO2-, CnF2n+1SO- or CnF2n+1S- moiety (Figure B.45) can form the corresponding PFSAs (CnF2n+1SO3H) through abiotic and/or biotic degradation in the environment. However, concerning perfluoroalkane sulfonamides, the sulfonyl group may also be cleaved off in a different degradation pathway in the atmosphere with formation of perfluoroalkyl radicals that may suffer sequential CF2-loss and formation of shorter chain-length PFCAs. For those substances where no degradation studies are available it can be assumed that based on the chemical similarity, irrespective of chain length or branching of the perfluorinated moieties, they will most likely be degraded in a similar way (see also Section 4.1.2 concerning the effects of chain length, branching and cyclic structure elements on persistence). It was also concluded in the Annex XV restriction report for PFHxS that side-chain fluorinated polymers containing e.g., perfluoroalkane sulfonamide-based side-

P.O. Box 400, FI-00121 Helsinki, Finland | Tel. +358 9 686180 | echa.europa.eu
111
chains, will degrade in the same way as the corresponding small-molecule precursors.
Figure B.45. Generic structures of PFSA precursors. R = any chemical group, n = 0 or higher.
PFAS subgroups that are considered as PFSA precursors includes, e.g.:
o Perfluoroalkane sulfonic acid halides o Perfluoroalkane sulfonic acid esters o Perfluoroalkane sulfonamides (FASAs) o Perfluoroalkane sulfide derivatives o Perfluoroalkane sulfoxide derivatives o Perfluoroalkane sulfinic acid derivatives o Side-chain fluorinated polymers based on sulfonic acid derivatives (mainly
sulfonamides)
B.4.1.3.4. Degradation of PFPA precursors
Precursors to perfluoroalkyl phosphonic acids (PFPAs)
o Perfluoroalkyl phosphinic acids (PFPiAs)
Figure B.46. Degradation pathway of 6:6 perfluoroalkyl phosphinic acid (6:6 PFPiA)
In a review by Wang et al. (2016), available information on degradation of perfluoroalkyl phosphinic acids (PFPiAs) were evaluated. PFPiAs were found to degrade to perfluoralkyl phosphonic acids (PFPAs) and 1H-perfluoroalkanes CnF2n+1H under various laboratory conditions. The environmental relevance of this degradation remains however somewhat unclear. Biodegradation of PFPiAs into PFPAs were found in some in vivo studies, while no degradation of PFPiAa was observed in a 28-day OECD 301-F test on ready biodegradability. 1H-Perfluoroalkanes can also potentially be oxidized to form corresponding PFCAs (e.g. via reaction with OH radicals in the atmosphere. Wang et al., 2014; Young and Mabury, 2010).
Conclusion: Based on the available data it can be expected that perfluoroalkyl phosphinic acids can be abiotically or biotically degraded and transformed into the corresponding perfluoroalkyl phosphonic acids (PFPAs) and 1H-perfluoroalkanes CnF2n+1H. 1H-Perfluoroalkanes could potentially degrade further to form the corresponding PFCAs.

P.O. Box 400, FI-00121 Helsinki, Finland | Tel. +358 9 686180 | echa.europa.eu
112
B.4.1.3.5. Degradation of other precursors
Structural elements in combination
Above, the degradation patterns of different structural elements in per- and polyfluorinated substances have been investigated for representative PFAS substances. Most often perfluoroalkyl chains remain mainly intact, while degradation processes take place elsewhere in the precursor molecules, especially in non-fluorinated moieties. In many cases degradation stops when a perfluoroalkyl group attached to a functional group at its highest oxidation step has been reached, i.e. PFAAs. However, in some cases molecules suffer loss of fluorine from the carbon atom next to the non-fluorinated part of the substance. Persistent final degradation products, i.e. arrowheads, have been investigated in detail in Section 4.1.2.
The degradation processes of molecules are dictated by their chemical structure and the conditions that prevail where the substances are found. Hence, it is important to take into consideration if a substance partitions to air, soil or water. However, under identical conditions one specific type of functional group often behaves in the same way with similar neighbouring groups in a molecule. The length of a perfluoroalkyl chain, branching or the presence of cyclic structures is not expected to affect the reactivity and degradation of a functional group considerably. The same applies for the different types of polymers within the PFAS scope, which are in general assumed to follow the same degradation pattern for each specific functional group. The degradability of a substance can often be assessed by looking at one reactive structure element at the time, when these elements are separated by non-reactive moieties, like in many PFASs.
Based on the understanding of the reactivity of structural elements in per- and fluorinated substances, one can assess expected degradation routes of similar compounds for which experimental studies of degradation have not been published. In combination with the knowledge summarised in Section 4.1.2 on persistent structural elements, one can estimate the degradation patterns, and in many cases the final degradation products, of a large part of the PFAS universe.
B.4.1.4. Persistence of PFASs under regulatory and scientific scrutiny
The European Environment Agency stresses that the major concern of PFASs is due to their persistence, and that PFASs either are, or degrade to, persistent chemicals, with many of them accumulating in humans and animals, and all of them ultimately accumulating in the environment (EEA, 2020).
The Global PFC Group points out that PFAAs are very persistent in the environment, whereas their potential precursors are transformed in the environment abiotically or biotically into PFCAs and/or PFSAs. PFAAs and their potential precursors are ubiquitous in the environment, even in remote regions. Several PFASs have lately been recognised as very persistent, potentially bioaccumulative and toxic (OECD/UNEP, 2013).
According to the Californian toxic substances' authorities, all PFASs or their degradation, reaction, or metabolism products, are environmentally persistent. And for this reason, PFASs as a class are regulated in certain consumer products in California (Balan et al., 2021). It is emphasised by these authorities that persistence of a chemical in the environment promotes sustained exposure and contributes to accumulation in the environment. Because persistence is an inherent property of a chemical in the environment that results in increased exposure to the chemical and consequently potential for health risks, it can appropriately be identified as a hazard trait.
In the Helsingør Statement on PFASs a group of scientists pointed out that the current knowledge demonstrates that the perfluorinated parts of any PFAS are recalcitrant and will form terminal transformation products, including PFCAs and PFSAs, which are persistent in

P.O. Box 400, FI-00121 Helsinki, Finland | Tel. +358 9 686180 | echa.europa.eu
113
the environment (Scheringer et al., 2014). Extensive and increasing use and emissions of fluorinated alternatives will lead to increasing levels of PFCAs, PFSAs and other stable perfluorinated degradation products in the environment, biota and humans. In the follow-up Madrid statement, it was warned that PFASs are very persistent man-made substances found everywhere. PFASs contain perfluorinated chains that only degrade very slowly, if at all, under environmental conditions (Blum et al., 2015).
The high persistence of PFASs allows for a wide distribution in the environment, and many PFASs have been detected globally in the environment. A large group of scientists has reached a consensus that PFASs are the most environmentally persistent substances among organic chemicals and support a broad scope in restricting the use of PFAS in society (Wang et al., 2019; see also Cousins et al. (2020b). PFAS has been given the nickname “forever chemicals” in the popular press.
Cousins et al. 2019 investigated the consequences of persistence for organic substances and provided case studies for three different classes of very persistent substances: chlorofluorocarbons, polychlorinated biphenyls, and PFASs. They argue that high persistence has important implications for the behaviour of chemicals in the environment. Persistent chemicals are distributed widely, often globally, and reach (much) higher concentrations than short-lived chemicals emitted at the same rate.
The implications of high persistence for the levels and time trends of chemicals in the environment were modelled using a simple multimedia environmental fate model. The model was a so-called unit-world model with three compartments: the global troposphere (height 6000 m, volume 3.06 x 10¹⁸ m3), the global surface ocean water (depth 100 m, volume 3.62 x 10¹⁶ m3), and the global surface soil (depth 0.1 m, volume 1.48 x 10¹³ m3). In each compartment, a first-order degradation process takes place. In addition, there are three non-degradative losses: diffusion to the stratosphere, settling to deep ocean water, and burial in deep soil.
Substances C and D were assigned the following properties:
Log KAW Log KOW t1/2 (days)
Substance C -1 8 2
Substance D -1 8 2000
A half-life of 2 000 days or 5.5 years is long, but not excessively high. PFASs, for example most PFAAs, can have much longer half-lives. If PFAAs degrade, they do it so slowly that it is not observable and their half-lives could be on the order of decades, centuries or even greater. Log KOW for the two substances compared in the study was 8, which is typical for more lipophilic substances.
In a first emission scenario, the same constant emission rate to air (100 mol h-1) was assumed for each chemical and the concentrations in air, water and soil calculated at steady-state and in a dynamic scenario where the initial concentrations in all media are equal to zero. The model showed that an increase in the degradation half-life by a factor of 1000 (from 2 days to 2000 days) leads to an increase in the time to steady-state by a factor of 600–880 (from 20 days to 33–48.5 years). Similarly, the increase in the total inventory of chemical in the model system is only around a factor of 550 to 600 because of the increasing effect of the non-degradation losses. The long-lived chemical (chemical D) shows a marked overshoot with increasing concentrations for more than 4 years after the emission peak in year 10 (concentration peak in year 14.5, see Figure B.47 below). Moreover, the decreasing concentrations form a long tail that extends for many years after the stop of the emissions in year 20. An important finding from the model results is that the KOW is of less importance and

P.O. Box 400, FI-00121 Helsinki, Finland | Tel. +358 9 686180 | echa.europa.eu
114
does not modify the general implications of high persistence.
Figure B.47. Concentrations of chemicals C (panel (i)) and D (panel (ii)) as function of time in the scenario with dynamic emissions. For both chemicals, emissions start in year 0, increase by 10 mol h-1 every year, peak in year 10 at a value of 100 mol h-1, then decrease by 10 mol h-1 every year, and end in year 20. Note the much higher levels of chemical D compared to chemical C.
In the case that unexpected effects are caused by a short-lived chemical, it is possible to rapidly cease environmental contamination by restricting or banning its use, which then also means that no additional effects will be caused by that chemical. In contrast, in the case of very persistent chemicals, it is not possible to cease environmental contamination within a reasonable time frame by simply restricting or banning their use. Environmental contamination by very persistent chemicals – and the effects related to this contamination – will continue for years to decades. This poor reversibility of contamination is because very persistent chemicals are, by definition, difficult to degrade.
In summary, the main concerns with very persistent chemicals are:
(1) The continuous release of very persistent chemicals will lead to widespread, long-lasting, and increasing contamination.
(2) Increasing concentrations will result in increasing probabilities that known and unknown effects occur, be it by a single chemical and/or in a mixture with other substances.
(3) Once adverse effects are identified, it will be technically challenging, energy intensive, and thus costly, to reverse the chemical contamination and therefore the effects. These measures are limited to contamination hotspots, whereas, for most of the environment, no remediation or clean-up will be possible.
It is argued that high persistence should be given particular emphasis in chemicals assessment and management and that very persistent chemicals should be regulated on the basis of their persistence alone (P-sufficient approach).

P.O. Box 400, FI-00121 Helsinki, Finland | Tel. +358 9 686180 | echa.europa.eu
115
B.4.2. Environmental distribution
B.4.2.1. Adsorption/desorption/mobility in water
B.4.2.1.1. Factors influencing adsorption potential of PFASs
Chain length:
Sorption of PFASs in soils has been shown to increase with an increase in the chain length of PFAS compounds. Adsorption in soils and sediments happens dominantly via hydrophobic attraction and functional groups. Elmoznino et al. (2018) demonstrated that an increase in log Koc correlates to the alkyl chain length. Baduel et al. (2017) demonstrated a predictable pattern for the effect of alkyl-chain length on mobility in soil for PFSAs, where the vertical distribution is a function of the alkyl chain length, such that mobility is higher for shorter chain lengths. In sewage sludge, Zhang et al. (2013) also recorded an increased sorption with increasing chain length. Milinovic et al. (2015) reported that among three studied PFAS compounds, namely PFOS, PFOA and PFBS, PFOS was the most strongly adsorbed by six different soils. The authors attributed the strong interaction of PFOS with soil particles to hydrophobic interaction, as indicated by a strong correlation between the log Kow values of the three PFAS compounds, the functional hydrophilic group, i.e. sulfonic vs. carboxylic acid, and the log Koc values of the soils. Campos Pereira et al. (2018) showed that the PFAS sorption was further found to increase with increasing perfluorocarbon chain length with 0.60 log KOC units per CF2 moiety for C3-C10 PFCAs and 0.83 log Koc units per CF2 moiety for C4, C6, and C8 PFSAs. Short-chained PFASs, were weakly sorbed (less than 10% on average), while long-chained PFASs sorbed strongly (on average, 99-100%).
In general, for PFAAs with chain lengths ~C5 - ~C15 the sorption of PFAAs substances is dependent on chain length in a predictable way, with the increase in the chain-length resulting in an increase in adsorption.
The shorter the chain length the more important the polar-polar interaction becomes (Zhao et al., 2012). For C2-C4 PFAAs, the adsorption on sludge increases with decrease in chain length (Zhang et al., 2013). The interpretation of this phenomenon given by the authors is that the hydrophobicity of short-chain PFAAs decreases with decreasing chain length so that electrostatic interaction was dominant for sludge-water interactions for C2-C4 PFAAs in contrast to hydrophobic interactions, which dominate the sorption for longer chain PFAAs. Therefore, electrostatic interactions are also an important factor though adsorption/desorption to soils is commonly normalised to the organic carbon fraction (i.e. Koc value) assuming hydrophobic interaction mainly governing adsorption/desorption. However, the clay fraction is for instance also considered a relevant sorption phase for organic cations such as the PFAAs (Droge and Goss, 2013).
Functional groups
The increase in sorption with increase in chain length at least for longer chain PFASs (C5- C15) has been observed across all PFAAs subclasses (PFCAs, PFSAs, PFPAs, PFPiAs), in sediments (Higgins and Luthy, 2006a), sludge (Arvaniti et al., 2014, Zhou et al., 2010) and soil (Lee and Mabury, 2017). Elmoznino et al. (2018) observed that PFSAs would partition more strongly to effluent-derived suspended particulate matter than PFCAs with the same number of perfluorinated carbons. The authors attribute this to differences in sorption, as log Koc values are one and two units lower for PFHxS and PFBS, respectively, than for PFOS. Also Campos Pereira et al. (2018) found that PFSAs sorbed more strongly than PFCAs.
Lee and Mabury concluded that PFPAs are more sorptive than PFCAs at equal chain length (Lee and Mabury, 2017) by comparing the Kd values calculated for PFPiAs and PFPAs via aqueous loss method and direct soil analysis in a soil-sorption experiment with those reported in literature for other PFAAs. The differences between the sorption of PFPAs and PFSAs of

P.O. Box 400, FI-00121 Helsinki, Finland | Tel. +358 9 686180 | echa.europa.eu
116
equal perfluorocarbon chain length were not consistent between the direct soil analysis and aqueous loss method. Although there is no data available to compare the Kd of PFPiAS with other PFAAs of the same chain length, based on the data from Lee and Malburry it is expected that PFPiAs are at least as sorptive as other PFAAs. Differences in sorption between sediment soil and sludge and the water phase have been reported for PFCAs, PFSAs and PFPAs with the same chain length. The partition coefficients between sediments and the overlaying water phase by direct analysis have been reported to be higher for PFOS than PFOA (Ahrens, 2011). In soil, Pereira, et al., 2018 demonstrated that the sorption of PFSAs was stronger than of PFCAs and the sorption increased with increasing perfluorocarbon chain length. An increase of 0.60 and 0.83 log KOC units per CF2 moiety for PFCAs and PFSAs, respectively, was observed. Higher partition coefficient of PFSAs over PFCAs has been also reported in sorption experiments via the aqueous loss method in sediments (Higgins and Luthy, 2006) and activated sludge (Zhou et al. 2010).
Cyclic structure and ether groups Based on modelled data (COSMOlogic), cyclic PFAAs (C5-C7) can be (highly) adsorbed by soil (LogKoc > 3.5), with increasing sorption with increasing number of perfluorinated carbons. The presence of ether groups in the carbon chain does not alter the electron density in the carbon chain. Thus, short-chain PFECAs and PFESAs are expected to behave similar as PFCAs and PFSAs, with shorter chain substances having low adsorption potential, which is expected to increase with increasing chain length. The high mobility of HPFO-DA (5 Carbons) is described in the Annex XV dossier on the proposal for identification of HFPO-DA as a substance of very high concern (ECHA, 2019c).
Role of the sorbent Soils consist of organic matter, minerals and pore spaces filled with air and water (Bradry, 2010, Hellsing et al., 2016). Sand, silt and clay all provide minerals and surface area for the sorption of PFASs. Sand, silt and clay differ in their particle size, and smaller clay particles have colloidal properties carrying positive and/or negative charges.
Influence of ions and pH versus fraction of organic components
PFAS sorption is influenced by the soil pH and soil solution ionic strength. Pereira et al. (2018) investigated the effect of solution pH and concentrations of Al3+, Ca2+ and Na+ on the sorption of PFASs in soils. According to this study longer chain PFASs will have the greatest effect from pH, intermediate length PFASs (C5-C8) will be more affected by changes to the composition of cations, especially calcium and aluminium (Pereira, et al., 2018). Hellsing et al. (2016) found that a negatively charged silica surface was not able to adsorb anionic PFAS compounds such as PFHxA, PFOA, PFOS, and PFNA. On the contrary, positively charged alumina surface adsorbed significant amounts of these compounds, indicating that an electrostatic mechanism might come into partial effect for adsorbing PFAS compounds on electrically charged soil components (Higgins and Luthy, 2006). One study investigated Sorption to the phyllosilicate clay minerals Illite, kaolinite, and bentonite (Droge and Goss, 2013). The authors point out that clays and minerals can have widely differing available surface areas for sorption and cation-exchange capacity values. It therefore would be challenging to include a generic parameter to account for clay sorption., It has been proposed that with an increase in the fraction of organic components (foc) in the soil hydrophobic interaction of PFAS becomes more pronounced (Brusseau, 2018, Milinovic et al., 2015).
Influence of humic acid and formation of complexes
Humic Acid or other dissolved organic matter might form complexes with PFAS compounds in the soil solution and inhibit sorption of those chemicals on to soil components such as clay minerals and particulate organic matter. In river water, PFASs like PFHxS, PFHxA, PFBS and PFOA were shown to be co-transported with dissolved organic carbon (DOC). These PFCAs

P.O. Box 400, FI-00121 Helsinki, Finland | Tel. +358 9 686180 | echa.europa.eu
117
and PFSAs carry a negative charge in natural waters, and the correlation was observed only for the shorter chained (≤C7 for PFCAs and ≤C6 for PFSAs) and more hydrophilic substances. The authors suggest that one possible explanation for the observed phenomenon could be that these PFASs readily bind to positively charged ions that are complex bound to DOC (e.g. Ca2+) with negatively charged head groups, while the longer chained PFASs (≥C7 for PFCAs and ≥C6 for PFSAs) rather partition to even more hydrophobic phases in the water, such as the organic carbon fraction of suspended particulate matter (Nguyen et al., 2019).
Influence of proteins
Protein binding can also be an important factor influencing the adsorption for instance to sewage sludge. The presence of protein lead to an increased adsorption of PFASs to sludge (Zhang, et al., 2013). For PFSAs, unlike PFCAs, carbohydrates were found to lead to an increase of adsorption.
B.4.2.1.2. Adsorption and desorption of arrowhead PFAS
As pointed out in section B.4.1 most PFASs form in the environment their corresponding arrowhead PFASs. These PFASs are therefore looked at with regard to adsorption potential. Please refer also to section B.1.3. for the physical-chemical properties. pKa Values: With regard to electrostatic interactions it is important to differentiate between neutral and charged PFAS. PFCAs, PFSAs and PFPAs have low pKa values and are therefore almost completely dissociated at environmentally relevant pH -values and therefore have a negatively charged headgroup. In contrast perfluoroalkylamines have very high pKa values and thus will react as bases at environmental relevant pH. Consequently, the polar=polar interactions of perfluoroalkylamines will in contrast to the PFAAs be to negatively charged moieties in the soil and sediment. Van der Waals interactions will however play a role for both groups, PFAAs and amines, dependent on the length of the hydrophic carbon chain.
Because soils are generally anionically charged, anionically charged PFAAs become more mobile whereas cationic charged bases such as perfluoroalkylamines become less mobile as they can be retained by cation exchange processes. However, for some soil types, such as those with metal oxides, which can have a large anionic exchange capacity, this general rule of thumb may not apply. In sum , an assessment merely on the Koc value may underestimate mobility of positively charged PFAAs and overestimate the mobility of negatively charged amines (Arp, 2019).
KocValues:
According to the physical chemical data for PFCAs, PFSAs and PFPAs (all acids) there is a trend of increasing Koc values with increasing chain length. The increasing adsorption potential pattern from PFCAs over PFPAs to PFSAs, as reported in the previous section, however, is not that clearly reflected in the KOC values.
Perfluoralkanes which lack a functional group have higher KOC values than the PFAAs of the same chain length. It is thus expected that PFASs with a lack of a functional group will be more adsorptive. It should, however, be noted that up to a chain length of 4 carbons perfluoralkanes have boiling points below 0 C° and their Henrys Law constants indicate that they are volatile (see B.4.2.2 on volatilisation). It is thus more likely that these short chained perfluoralkanes evaporate into the air when released to the environment. The same applies to the shorter chained perfluorethers without further functional groups. The two C4 perfluorethers (1,1,1,2,2-Pentafluoro-2-(pentafluoroethoxy) ethane and 1,1,2,2-Tetrafluoro-1,2-bis(trifluoromethoxy)ethane) have boiling points below 2.5C° and 13 C° and their Henrys Law constants indicate that they are volatile (see B.4.2.2 on volatilisation). HPFO-DA, a

P.O. Box 400, FI-00121 Helsinki, Finland | Tel. +358 9 686180 | echa.europa.eu
118
branched C5 ether with a carboxylic group is described in the Annex XV dossier on the proposal for identification of HFPO-DA as a substance of very high concern (ECHA, 2019b). In the dossier log KOC values for HFPO-DA are 2.48 and 1.92 based on molecular connectivity indices and on estimated log Kow, respectively. Also, ADONA, a diether with five perfluorinated carbons and a carboxylic functional group can be considered mobile on the basis of its estimated log KOC < 1.3.
With respect to the carbon chain length, it should be noted that precursor substances which have a non-fluorinated moiety are expected to degrade to arrowhead PFASs with less carbons (see section B.4.1). Hence those precursors are expected to form more PFASs once they have been released to the environment.

P.O. Box 400, FI-00121 Helsinki, Finland | Tel. +358 9 686180 | echa.europa.eu
119
Table B.25. log KOC (sediment organic carbon-normalised distribution coefficient) for PFAAs shown in dependence of the carbon chain length.
1Carbon 2 Carbons 3 Carbons 4 Carbons 6 Carbons 8 Carbons 9 Carbons 10 Carbons 11 Carbons Perfluoroalkylcarboxylic acids TFA
PFBA PFHxA PFOA PFNA PFDA PFUnDA
log KOC (sediment organic carbon-normalised distribution coefficient)
0.437 (Predicted using US EPA EPI-Suite (PCKOCWIN v1.66))
1.767 (Predicted using US EPA EPI-Suite (PCKOCWIN v1.66))
1.63 – 2.35 (Sepulvado et al., 2011)
2.06 (Higgins and Luthy, 2006) 1.09 (Ahrens et al., 2010a)*
2.39 (Higgins and Luthy, 2006) 2.4 (Ahrens et al., 2010a)*
2.76 (Higgins and Luthy, 2006) 3.6 (Ahrens et al., 2010a)*
3.3 (Higgins and Luthy, 2006) 4.8 (Ahrens et al., 2010a)*
Perfluoroalkane sulfonic acids
C-PFSA C2-PFSA C3-PFSA C4-PFSA C6-PFSA
log KOC (sediment organic carbon-normalised distribution coefficient)
0.352 (Predicted using US EPA EPI-Suite (PCKOCWIN v1.66 estimate))
1.016 (Predicted using US EPA EPI-Suite (PCKOCWIN v1.66 estimate))
1.681 (Predicted using US EPA EPI-Suite (PCKOCWIN v1.66 estimate))
2.345 (Predicted using US EPA EPI-Suite (PCKOCWIN v1.66 estimate))
3.675 (Predicted using US EPA EPI-Suite (PCKOCWIN v1.66 estimate))
Perfluoroalkylphosphonic acids
PFMPA PFEPA PFBPA PFHxPA
log KOC (sediment organic carbon-normalised distribution coefficient)
0.654 (Predicted using US EPA EPI-Suite (PCKOCWIN v1.66 estimate))
1.318 (Predicted using US EPA EPI-Suite (PCKOCWIN v1.66 estimate))
n.a.
3.977 (Predicted using US EPA EPI-Suite (PCKOCWIN v1.66 estimate))

P.O. Box 400, FI-00121 Helsinki, Finland | Tel. +358 9 686180 | echa.europa.eu
120
Table B.26. log KOC (sediment organic carbon-normalised distribution coefficient)for PFCs shown in dependence of the carbon chain length
Perfluoralkanes
1 carbon 2 carbons 3 carbons 4 carbons 5 carbons 6 carbons 8 carbons
C-PFC C2-PFC C3-PFC C4-PFC C5-PFC C6-PFC C8-PFC
log KOC (sediment organic carbon-normalised distribution coefficient)
1.687 (Predicted using US EPA EPI-Suite (PCKOCWIN v1.66 estimate))
2.352 (Predicted using US EPA EPI-Suite (PCKOCWIN v1.66 estimate))
3.016 (Predicted using US EPA EPI-Suite (PCKOCWIN v1.66 estimate))
3.681 (Predicted using US EPA EPI-Suite (PCKOCWIN v1.66 estimate))
n.a. 5.010 (Predicted using US EPA EPI-Suite (PCKOCWIN v1.66 estimate))
6.339 (Predicted using US EPA EPI-Suite (PCKOCWIN v1.66 estimate))
Table B.27. KOC (sediment organic carbon-normalised distribution coefficient) for perfluoroalkylamines and perfluorethers
Perfluorethers
molecular formula C2F6O C4F10O C4F10O2 C6F14O3 C2F4O C3F6O
1.330 (Predicted using US EPA EPI-Suite (PCKOCWIN v1.66 estimate))
2.660 (Predicted using US EPA EPI-Suite (PCKOCWIN v1.66 estimate))
4.706 (calculated using Advanced Chemistry Development (ACD/Labs) Software V11.02)
1.946 (Predicted using US EPA EPI-Suite (PCKOCWIN v1.66 estimate))
0.932 (Predicted using US EPA EPI-Suite (PCKOCWIN v1.66 estimate))
1.596 (Predicted using US EPA EPI-Suite (PCKOCWIN v1.66 estimate))
log KOC (sediment organic carbon-normalised distribution coefficient)
Perfluoroalkylamines
Acronym PFMAm PFEAm PFPrAm PFBAm PFHxAm
molecular formula C3F9N; C6F15N; C9F21N; C12F27N; C18F39N;
C5F13N [(CF3)3N] [(C2F5)3N] [(C3F7)3N] [(C4F9)3N] [(C6F13)3N]
log KOC (sediment organic carbon-normalised distribution coefficient)
3.104 (Predicted using US EPA EPI-Suite (PCKOCWIN v1.66 estimate))
5.098 (Predicted using US EPA EPI-Suite (PCKOCWIN v1.66 estimate))
n.a. n.a. n.a.
4.433 (Predicted using US EPA EPI-Suite (PCKOCWIN v1.66 estimate))

P.O. Box 400, FI-00121 Helsinki, Finland | Tel. +358 9 686180 | echa.europa.eu
121
Conclusion on sorption
Several studies have confirmed a relationship between sorption and perfluorocarbon chain length. Although generally there is a linear relationship between the carbon chain length and log Koc value, it should also be noted that for the substances with shorter carbon chain length, the polar-polar interaction, determined by a functional group such as carboxylic acid or amine, gains importance. Most of the studies investigating distribution focussed on PFCAs and PFSAs but also PFPAs, PFPiAs, PFECAs and PFESAs and cyclic PFAAs (C5-C7) have been investigated to some extent. PFPAs are more sorptive than PFCAs at equal chain length. Sorption differences of PFPAs and PFSAs did not follow a systematic pattern. Because PFASs have both hydrophobic fluoroalkyl chains and hydrophilic ionizable functional group, show complex behaviours in the environment in terms of their sorption and desorption processes (Ahrens, 2011, Kannan, 2011). Neutral PFASs are more likely to adsorb to organic matter. It is difficult to predict the sorption of the PFAS universe from a single sorbent bulk property. Also the properties of the sorbent needs to be considered.
B.4.2.1.3. Mobility in water
Specific criteria have been proposed for identifying mobile or very mobile substances and are currently under consideration for including into legislation. For example, the German Environment Agency (UBA) has proposed the following: M is indicated by water solubility ≥0.15 mg/l and log Koc ≤4.0 or log Kow is ≤4.0, and vM by water solubility ≥0.15 mg/l and log Koc ≤3.0 or log Kow is ≤3.0 (Neumann & Schliebner, 2017). In the continuing discussion water solubility has been considered not to be a suitable property to set a threshold for the assessment of mobility. The principal reasons are difficulties when assessing ionic and ionizable substances, in which water solubility is dependent on counter ions (Arp, 2019, Rüdel et al., 2020). For the purpose of this restriction proposal no specific cut off values are proposed to be used but the comparisons below are for background information.
With respect to the suggested mobility criteria as described above all PFCAs up to a chain length of 11 carbons can be considered either vM (up to PFDA) or M (PFUnDA). Likewise all PFSAs up to 6 carbons can either be considered vM (up to C4-PFA) or M (PFHxS). The same can be concluded for the PFPAs. Considering the perfluoroalkylamines only PFMAm fulfils the M criterion based on the KOC value. With the exception of C4F10O2 all perfluoroethers fulfil either the vM or M criterion based on their KOC values. It is noted that perfluorinated olefins perfluorinated alkanes and alkenes in general are expected to degrade to PFCAs (see section B.4.1.3), which are mobile. Perfluoralkanes up to four carbons can be themselves considered mobile. However, as mentioned above, it should be noted that up to chain length of 4 carbons perfluoralkanes have boiling points below 0 C°. It is thus more likely that these short chained perfluoralkanes evaporate into the air when released to the environment. The same applies to the short-chain perfluoroethers without further functional groups.
Three PFAS have been accepted as being mobile so far:
- PFBS has been identified as identified as a substance of very high concern based on its equivalent level of concern: very high persistence, high mobility in water and soil, high potential for long-range transport, and difficulty of remediation and water purification as well as moderate bioaccumulation in humans (Commitee, 2019);
- HPFO-DA, a branched C5 ether with a carboxylic group, has been identified as a substance of very high concern based on its equivalent level of concern due to its mobility and persistence (Commitee, 2019);

P.O. Box 400, FI-00121 Helsinki, Finland | Tel. +358 9 686180 | echa.europa.eu
122
- RAC has agreed that PFHxA, its salts and related substances possess properties, in particular very high persistence combined with mobility, that can be considered to constitute an intrinsic hazard (Assessment, 2021).
Many PFASs belong to the precursors of PFAAs, which have been demonstrated above to be either mobile or very mobile. Hence a large part of PFASs can be considered as mobile in water, either by themselves or as result of their degradation into PFAAs. However, no or insufficient data are available on physico-chemical properties and fate of many PFASs not covered by these two groups. Uncertainties remain regarding mobility of several PFASs in water.
As described in section B.4.2.1.3 in detail several PFAS have been detected in fresh and ocean water as well as ground and drinking water indicating their mobility. Though routine target analyses mainly focus on PFCAs and PFSAs and some of the precursors of these PFAAs it cannot be cancelled out that other PFAS are in these compartments. For instance HFPO-DA, HFPO-TA, ADONA, 6:2 Cl-PFESA, 8:2 Cl-PFESA, 6:2 H-PFESA and 6:2 FTSA, were ubiquitously detected in worldwide surface waters (Wang et al., 2019c). Studies on the aquatic environment published between 2009 and 2017 have discovered 455 new PFASs (including nine fully and 446 partially fluorinated compounds) (Xiao, 2017). In another study 104 suspect-target PFASs were screened in drinking water samples from Canada and other countries (Burkina Faso, Chile, Ivory Coast, France, Japan, Mexico, Norway, and the USA), the study is the first to observe perfluoroalkane sulfonate (PFECHS) and C4–C6 perfluoroalkane sulfonamides (FBSA, FHxSA) in drinking water (Kaboré et al., 2018).
Additionally, it is important to note that for instance also the long-chain PFAAs such as PFDAas well as PFDS have been reported in some drinking water samples (see section B.4.2.1.3). Short-chain PFASs are more likely than long-chain PFASs be distributed to drinking water based on their properties and have also been found therein although they have been followed only more recently in the monitoring. However, also for PFASs considered not as mobile due to their adsorptive properties it cannot be excluded that they due to the high persistence enter drinking water.
Mobility as a concern Mobility is a contributing factor for
1. Potential for long range transport via water (see section B.4.2.5)
2. Potential for drinking water contamination (see also section B.4.5 and B.4.2.1.3)
3. Uptake in plants and crops (see section B.4.4)
4. Making very persistent substances available for increase of internal concentrations in biota along the increase of the environmental exposures (see section B.4.3, “Persistence compensating low bioaccumulation potential” and section 1.1.4 of the main report “High potential for ubiquitous, increasing and irreversible exposure of the environment and humans”).
For substances mobile in water phase, there are no local or intermittent sinks for the pollution stock, and therefore mobile substances have a high potential for continuously increasing environmental concentrations and exposure of wildlife. Oceanwater is important as a sink and for transport of these compounds. The occurrence of high concentrations of PFASs in coastal waters could possibly be problematic, because the substances will be bioavailable and can accumulate in the marine food chain (Cai et al., 2012). Furthermore, it is difficult in practice to manage exposures due to the high mobility and the fact that exposures may take place at

P.O. Box 400, FI-00121 Helsinki, Finland | Tel. +358 9 686180 | echa.europa.eu
123
a different location than where releases occurred and at a different moment in time. Mobile PFAS may end up in drinking water, posing a potential risk to human health. Reemtsma et al. (2016) concluded that persistent and mobile organic compounds may be of concern for water quality because they are persistent in the environment and are not removed from water by sorption processes due to their high polarity and excellent water solubility. A problem which has been underestimated due to an analytical gap in the past.
Raw water which is used for drinking water is obtained either from groundwater, bank filtration or surface waters. In average about 50 percent of the water for drinking water production is taken from groundwater, whereas the amount from surface water is about 36 percent (European Commission, 2016). With regard to groundwater and bank filtration adsorption and desorption in soil and sediment is thus a crucial for drinking water quality. Due to their persistence, the residence time of PFASs in groundwater is at least the residence time of groundwater because transport away from the site in water is the only removal mechanism. As a consequence PFAS -contaminated groundwater can act as a long-lasting source, leading to poorly reversible exposure (Cousins et al., 2016). Residence time of groundwater is >40 days up to an order of millennia (Małoszewski and Zuber, 1982, McGuire et al., 2005).
Contaminated sites -cases provided in sections B.4.2.1.3 “Contaminated sites” and E.4.3.5.2 illustrate the long-lasting problems and hardly reversible contaminations with groundwater and drinking water contamination.
B.4.2.2. Volatilisation
The threshold for volatile substances (HENRY > 250 Pa*m³/mol) from REACH Guidance R.16 (ECHA, 2016b). For PFAS which are below this threshold aqueous compartments are more relevant compared to the atmosphere.
Neutral PFAS can have a relatively high vapor pressure whereas dissociated charged PFAS have a negligible vapor pressure, are soluble in water, and have a very low air−water partition coefficient (Barton et al., 2007, Kaiser et al., 2005). Vierke and co-workers concluded in their work on PFCAs that the extent of volatilization of PFCAs in the environment will depend on the water pH and their pKa. Knowledge of the pKas of PFCAs is therefore vital for understanding their environmental transport and fate (Vierke et al., 2013).
PFAAs may exist as neutral PFASs with higher volatility and lower water solubility or ionic PFAS with lower volatility and higher water solubility. Considering their low pKa values it can be considered that the PFAAs almost completely dissociated at environmentally relevant pH values and are therefore charged have a low vapor pressure and higher water solubility than their neutral forms and their volatility can be regarded as negligible. In their review on distribution modelling the authors consider volatilization not a major concern for most PFASs with functional groups which dissociate such as PFAAs (Sima and Jaffé, 2021).
Furthermore, it can be expected that larger molecules with a high molecular weight are non-volatile. Largest molecules among the PFASs, e.g, side-chain fluorinated polymers, gradually degrade into the PFAAs, and are therefore expected to have negligible volatility (see also section B.4.1.3). Same applies to other PFASs which contain a large nonfluorinated aromatic moiety.
Neutral PFAS such as the perfluorinated olefins, perfluorethers and halofluoralkanes are volatile depending on their molecular size and water solubility (see section B.1.3). As discussed in the section on long range transport (B.4.2.5) precursors such as Fluorotelomer alcohols (FTOHs) are veryvolatile due to their high vapor pressures and non-ionic status (Chen et al., 2020a)https://www.sciencedirect.com/science/article/pii/S0048969720373241?via%3Dihub - bb0175 as well as uncharged PFASs like perfluoroalkyl sulphonamides (FASAs),

P.O. Box 400, FI-00121 Helsinki, Finland | Tel. +358 9 686180 | echa.europa.eu
124
perfluoroalkyl sulfonamidoethanols (FASEs) and fluorotelomer alcohols (FTOHs) are less water-soluble and more volatile. Also for many of these degradation (as provided in section B.4.1.3) to a less volatile and more water soluble arrowhead PFAS applies, depending on the chain length of the resulting arrowhead.
B.4.2.3. Distribution modelling
Not assessed.
B.4.2.4. Measured levels in environmental compartments
See Appendix 10.
B.4.2.5. Long-range transport potential
The potential for environmental long-range transport (LRTP) is one major concern for persistent pollutants. By long range transport a shift of potential risks occurs off of the point of emission and often time-delayed. According to the OECD definition, long-range transport (LRT) refers to the transport of substances within the moving mass to locations distant from its sources (mainly for a distance greater than 100 kilometres). LRT potential is indicated, if these substances are measured in distant locations in concentrations that are of “potential concern”. The moving mass could be air, water or particles, as discussed below.
B.4.2.5.1. Transport pathways
As outlined below contamination is not geographically limited but PFASs are found ubiquitously in the environment. Because of non-degradability, the movement of their carriers like leads to global drift of PFASs over long distances from the point of release. Depending on their specific physical-chemical properties PFAS distribute between the respective compartment. Three main hypotheses are currently proposed for the global transport of PFASs.
- Non-charged, volatile precursor compounds could undergo long-range atmospheric transport and be degraded to persistent arrow head PFASs being deposited via wet or dry atmospheric deposition in atmosphere and reaching remote areas (Schenker et al., 2008, Martin et al., 2006, Ellis et al., 2004, Wong et al., 2018).
- ionic and water soluble PFASs could be transported directly by river waters into estuaries and coastal waters.
- additionally, PFASs can be transported by particles to which it is adsorbed or absorbed, such as dust, sediments, or through matrices in which it is included as additive, e.g. polymers. Above, that a long-range transport of PFASs may occur by biota/migratory birds.
Further, due to complex interactions between a substance and the compartments and a broad variety of environmental conditions the transport into remote areas is not limited to a single pathway. PFAS are concentrated in different compartments to a certain extent. And, by changing environmental conditions, a substance-shift between the compartments may occur. However, the existing studies only focus on legacy PFASs. Air and water Generally, short-chain PFASs have a higher potential for long-range transport in aquatic environments (Muir et al., 2019). The physical-chemical characteristics also influence the type of long-range transport in the aqueous environment, e.g., sea spray, microlayer, surface water, deep ocean water Ahrens et al. (2010a).

P.O. Box 400, FI-00121 Helsinki, Finland | Tel. +358 9 686180 | echa.europa.eu
125
Early modelling studies indicated that PFAAs are more likely to be transported via oceanic currents than the atmosphere (Wania, 2007, Armitage et al., 2006) but recent study by (Yeung et al., 2017) suggested that atmospheric input accounts for the majority of measured PFOA in the Arctic Ocean. Global transport by marine ocean currents was indicated as the major pathway of PFASs delivery to non-emission regions by both monitoring and modelling results (Yeung et al., 2017, Stemmler and Lammel, 2010) though the single processes are yet not fully understood.
PFASs are globally distributed in the marine environment (Yamashita et al., 2011). The movement of PFASs, from coastal areas influenced by urban emissions, to sub-Arctic and Arctic Ocean waters, was illustrated by (Ahrens et al., 2010c), who found C6–C10 PFCAs averaging about 700 pg/L in coastal seawater of southern Norway and at detection limits (∼10 pg/L) in the open Norwegian Sea. Overall, ocean currents and related dilution effects have a crucial influence on PFAS distribution in seawater, in which industrial and coastal areas and atmospheric deposition are considered as sources of PFASs, and ocean waters are important as sinks (Lohmann et al., 2013, Yeung et al., 2017) and for transportation of these compounds (Ahrens et al., 2010b).
The transport of PFAS with water also could be time delayed. PFAS-loaded river water often runs not directly into oceans, but into more or less enclosed estuaries and adjacent seas, like into the North Sea, the Baltic Sea or the Mediterranean. Despite the North Sea having a wide-open connection to the Atlantic Ocean, the exchange between both seas is partially limited due to the morphology of the North Sea. The water circulates in the shallow North Sea continental shelf and the formation of thermo- and haloclines further hampers the water exchange. It is assumed that the North Sea water is totally exchanged within one or two years (Gyory et al.) The trapping effect of persistent pollutants is much higher in areas with lower exchange rates with the oceans due to deep basins and narrow links or due to natural barriers to the ocean. So, the water in the Baltic Sea is exchanged every 25 -35 years (Kraatz 2004). The residence time of water in the Mediterranean of approximately 100 years, making the Mediterranean especially sensitive to the increase of the pollution stock of highly persistent substances like PFAS (Millot 1989). Depending on water exchange rates from the adjacent seas with the oceans the translocation of PFAS could last several decades.
Particularly volatile precursors, such as FTOHs, can undergo long-range atmospheric transport (Ellis et al., 2004). The detection of FTOHs for instance in the Arctic and Antarctic air agreed with the model prediction and conclusion, which supported the hypothesis of atmospheric transport toward remote regions (Paul et al., 2009, Dreyer et al., 2009, Bengtson Nash et al., 2010).
Finally, sea spray aerosols (SSA) could be an important source of PFASs to the atmosphere and, over certain areas where sea spray deposition is important, a significant source to terrestrial environments (Johansson et al., 2019). SSA formation and their subsequent atmospheric transport and deposition have been suggested to play a prominent role in the occurrence of ionizable PFASs in the maritime Antarctica and other remote regions. However, field studies on SSA's role as vector of transport of PFAS are lacking. The effective enrichment of certain PFASs, such as PFAAs and possibly other PFASs in sea spray aerosols (SSA) was recently demonstrated in laboratory studies, suggesting that SSA is a potential source of PFAAs to the atmosphere (Sha et al., 2022). The first field work by Casas et al. (2020) assessed the simultaneous occurrence of PFASs simultaneously at South Bay (Livingston Island, Antarctica) in seawater (SW), the sea-surface microlayer (SML) and SSA. Average PFASs concentrations were 313 pg L−1, 447 pg L−1, and 0.67 pg m−3 in SW, the SML and SSA, respectively. The enrichment factors of PFAS in the SML and SSA ranged between 1.2 and 5, and between 522 and 4690, respectively. This amplification of concentrations in the SML is consistent with the surfactant properties of PFASs, while the large enrichment of PFASs in atmospheric SSA may be facilitated by the large surface area of SSA and the sorption of PFAS to aerosol organic matter. The measured large amplification of concentrations in marine aerosols supports the role of

P.O. Box 400, FI-00121 Helsinki, Finland | Tel. +358 9 686180 | echa.europa.eu
126
SSA as a relevant vector for long-range atmospheric transport of PFASs. The transport via SSA may impact large areas of inland Europe and other continents in addition to coastal areas. Thus, SSA may currently be an important source PFASs to the atmosphere and, over certain areas, to terrestrial environments triggering also long-range transport.
Particles and plastic debris
Several PFAS may adsorb to particles. These particles such as dust or sediments may be easily drifted by air and water, too and could be deposited far away from the point of release. Longer chain PFASs like PFSAs, EtFOSAA and FOSA are preferentially distributed in biota or the abiotic environment such as sediments, which could act as a sink for PFASs (Muir et al., 2019). Dust can be transported vertically and horizontally. The main anthropogenic sources for particulate organic matter are the transport and the industrial sector. About 3.1Mt/a of these particles are emitted in Europe annually (Koolen et al. 2019). Global annual dust emissions are currently estimated to range between 1 000 and 3 000 Mt/a, whereas, beside anthropogenic sources, major dust source regions include the Sahara, the Arabian and Asian deserts (Tegen & Schepanski, 2009). As well the anthropogenic as the natural particles could be loaded with PFAS. Dust deposition in remote areas occurs through both dry deposition and wet deposition associated with cloud and precipitation processes. As such, deposition involves a complex set of physical processes. Global dust deposition rates are strongly interlinked with the origin of the particles and with the meteorological and seasonal conditions (Knippertz & Todd, 2012).
Rivers carry enormous amounts of sediments into coastal areas. For example, the annual transfer of sand, gravel and cobbles from the hinterland towards the Rhine delta was estimated by Frings et al. 2014 with 0.66 Mt/a. Not only natural sediments are transported by rivers and marine currents. The long-range transport of plastic debris and microplastics in the marine environment has been extensively documented (Eriksen et al., 2014; Howell et al., 2012; Maximenko et al., 2012; Obbard, 2018; Van Sebille et al., 2020). Plastics enter the oceans in massive amounts every year (4.8 to 12.7 Mt) (Jambeck et al., 2015) and accumulate in the oceans as plastic gyres (Eriksen et al., 2014) or in sediments.
The transport of PFASs often does not take the direct and fastest routes from the point of release to remote areas. Depending on particles size, particles could remain for long times in the atmosphere and a deposition may occur even many years later. Adsorptive PFASs undergo long-range marine transport via plastic debris to a vast extent (Rani et al., 2017; Takada, 2020; Tanaka et al., 2020a). Already a large share of larger and microparticles found in the environment already consists of plastic debris. As well non-fluorinated as fluorinated plastics absorb large amounts of low-molecular PFAS. Consequently, both polymeric PFAS and low-molecular PFAS like additives can be transported as and with plastic debris. Larger plastic particles become suspended microplastics over time by mechanical crushing and by chemical transformation processes, which much easier could be moved to remote areas. Due to its density PE and PP float in the ocean surface and are easily transported by surface ocean currents and winds, whereas PVC tends to sink near sources. An estimated amount of about 35 000 tons of microplastics are floating in the world’s oceans (Cozar et al. 2014 or Eriksen et al. 2014). However, according to Koelmans et al., 2017, this represents less than 1% of the floating accumulated plastic discharge. The remaining share is settled below the surface, at deep seafloor and in coastal sediments. The floating particles are transported with the ocean currents and a large part is trapped in the five subtropical gyres for about 40 years. It is estimated, that plastic debris are transported across the global oceans for more than 70 years (Wu et al. 2021). The Arctic Ocean appears to be a dead-end for plastic debris due to the poleward transport from sub-polar North Atlantic Ocean. The Arctic Ocean seafloor (e.g. Barents Seas) is thus an important sink of marine plastics (Cózar

P.O. Box 400, FI-00121 Helsinki, Finland | Tel. +358 9 686180 | echa.europa.eu
127
et al., 2017). It can be concluded, that PFAS associated with plastic debris are transported over long distances for many decades. It has to be mentioned further, that especially PFAS loaded plastic debris (as well macro- as microparticles) undergo long-range transport mediated by migratory species e.g. seabirds (Takada, 2020). Moreover, substances are subject of complex exchange processes between the different compartments. So, sediments may serve as temporary sinks for a certain time for instance for substances which are adsorbed to particles.
B.4.2.5.2. LRTP based on physical-chemical data
PFASs can be expected to be more volatile the higher their air water coefficient logKaw is. Volatile PFASscan undergo long-range atmospheric transport. It is highly likely that, e.g., F-gases, short-chain fluorotelomer alcohols and perfluorinated olefins are transported this way due to their volatility. Of these the PFASs which gradually degrade into ionic PFCAs (see sections B.4.1.3 and B.4.2.1 “Mobility in water”) may change their route of long-range transport from air to water, depending on the chain length of the resulting PFCA. In general, uncharged PFASs like perfluoroalkyl sulphonamides (FASAs), perfluoroalkyl sulfonamidoethanols (FASEs) and fluorotelomer alcohols (FTOHs) are less water-soluble and more volatile than ionic PFASs. Once released in the environment, these PFASs can be (bio)degraded in the atmosphere or in other compartments under aerobic conditions to PFCAs and PFSAs (Ellis et al. 2004, Martin et al. 2006, Schenker et al. 2008, Rhoads et al. 2008, see also section B.4.1.3). PFCAs and PFSAs are PFAS subgroups that exist in anionic form in water. Therefore, these substances are highly water soluble. They could be transported by river waters and by ocean currents to remote regions. (Armitage et al. 2009, McMurdoet al. 2008, Prevedouros et al. 2008). See also sections B.1.3 and B.4.2.1 for data on the properties relevant for LRTP. Substances with higher log Koc-values (>3.5) like long-chain PFASs and cyclic PFAAs can be (highly) adsorbed by particles. For ionic and ionizable substances, the water solubility and/or the sorption potential is dependent on counter ions (section B.4.2.1). So, cationic charged PFAS like perfluoroalkylamines also may adsorb to particles because of mainly anionically charged soil particles. Depending on natural circumstances, such substances could be moved either by water or adsorbed with particles. Not only natural particles serve as PFAS acceptor. As described above, particles of plastic debris are an important vector for highly adsorptive PFAS. Because of their small size, especially microplastics (<1 mm) have a large ratio of surface area to volume. That promotes adsorption of chemical contaminants to their surface. Microplastic particles therefore have a very high capacity to facilitate the transport of PFAS. Using substance physico-chemical property data, the potential for long-range transport can be estimated. Different models use different matrices as basis for calculation. The OECD Tool (LRTP-Tool; ©OECD, 2009), which is used for the LRTP estimates, is a generic multimedia box model that yields estimates of numerical indicators for LRTP like the Characteristic Travel Distance (CTD [km]) for screening purposes. CTD is defined as the point in space at which the concentration as a function of place has decreased to 1/e (abt. 37%) of the initial value. The CTD is applied for water and for air (CTDwater, CTDair) (Bennett et al. 1998). High CTD values were calculated for fluorotelomer alcohols. for the calculation an atmospheric lifetime of about 20 days was used from Ellis et al. (2003). For degradation half-life in water a value of 93 h from Gauthier and Mabury (2005) for 8:2 FTOH was used for all FTOHs20. The respective logKaw values based on Arp et al. 2006 (Episuite calculation) and the log Kow
20 It is noted that this value is only used here for the purpose of LRTP calculation whereas it is not provided here for the purpose of the degradation assessment.

P.O. Box 400, FI-00121 Helsinki, Finland | Tel. +358 9 686180 | echa.europa.eu
128
values based on Arp’s COSMOTHERM estimations were used as input parameter to estimate the LRTP with the OECD-tool for fluorotelomer alcohols. The models standard setting was retained for the calculation. Based on their log Kow and the log Kaw, FTOHs are mainly emitted to air. It is noted that with increasing chain length the CTD is decreasing (see Table B.28). Table B.28. Estimated characteristic travel distances of fluorotelomecic alcohols and the respective input parameter for the OECD tool
Because FTOHs are forming corresponding PFCAs (see section B.4.1.3), PFCAs may be released into the environment secondarily from a release of FTOHs within a very long distance. For PFCAs the respective with Episuite calculated logKaw values and the log Kow values calculated with COSMOTHERM based on Arp et al. 2006 were used as input parameters for the OECD-tool to estimate the LRTP for perfluoroalkyl carboxylic acids. The standard half-life’s for non-degradable substances of 106 h for all compartments, provided in the OECD tool, were used for the calculation.
Table B.29. Estimated characteristic travel distances of selected PFCAs and the respective input parameter for the OECD tool [unit] PFPeA PFHxA PFHpA PFOA PFNA PFDA
CAS-Nr. 2706-90-3 307-24-4 375-85-9 335-67-1 375-95-1 335-76-2
CTD air km 398 785 667 771 852 725 1 010 029 1 042 881 1 045 656
CTD water km 25 917 18 187 11 993 6 598 4 005 2 249
[unit] 4:2 FTOH 6:2 FTOH 8:2 FTOH 10:2 FTOH
CAS-Nr. 2043-47-2 647-42-7 678-39-7 865-86-1
CTD air km 9 405 6 727 3 816 2 839
CTD water km 11 9 10 10
molecular weight
g x mol-1 264.09 364.10 464.12 564.13
logKaw -1.35 -2.39 -3.25 -4.23
logKow 3.21 4.44 5.66 6.91
degradation half-life air
h 480 480 480 480
degradation half-life water
h 107 93 93 93
half-life soil h 72 72 72 72

P.O. Box 400, FI-00121 Helsinki, Finland | Tel. +358 9 686180 | echa.europa.eu
129
molecular weight
g x mol-1
264.05 314.05 364.06 414.07 464.08 514.09
logKaw -3.04 -2.66 -2.37 -2.03 -1.79 -1.52
logKow 3.43 3.26 3.82 4.30 4.84 5.30
half-life air h 1 000 000 1 000 000 1 000 000 1 000 000 1 000 000 1 000 000
half-life water
h 1 000 000 1 000 000 1 000 000 1 000 000 1 000 000 1 000 000
half-life soil
h 1 000 000 1 000 000 1 000 000 1 000 000 1 000 000 1 000 000
CTD estimations show, that PFCAs could be transported by air multiple times across the earth, due to their non-degradability. Furthermore, for PFCAs the long-range transport by water also becomes important. Short-chain PFCAs like PEPeA are distributed with water more than 20 000 km. Assuming a multidirectional substance distribution, that means a distribution over the complete earth surface. With increasing chain length, the CTD in water decreases, however, long-chain PFCAs are still transported for several thousand kilometres (see Table B.29).
As described in chapter B.4.2.1, PFASs with high log KOC and log KOW strongly adsorb to particles. Highly adsorptive PFAS are PFOS, PFOA and PFBS, PFOS. Especially cyclic PFAAs (C5-C7, and greater) strongly adsorb to soil and particles. For these substances a particle mediated long-range transport is highly likely. It is not common to provide CTD values for particles. But looking at data provided before, particle associated PFASs, especially those which are adsorbed to plastic debris, may transported over the whole earth surface for many decades, too.
B.4.2.5.3. LRTP evaluation based on monitoring data
Various PFASs are already ubiquitously detectable in remote areas like in arctic-, antarctic- or glacier firns, at open sea or even in the higher atmosphere. These data confirm the long-range transport. For further details of the measured data, see chapter B.4.2.4, “Measured levels indicating potential for long-range transport”. Data for tracking PFASs along the way from its point of release to these areas are rare. In the following one such study is presented. In their studies Möller et al. 2010 investigated the distribution and sources of 40 PFASs in the river Rhine watershed in the Rhine-Waal-Scheldt-Estuary and at open North Sea. PFOS, PFOA, PFBS and PFBA usually were the main detected substances.
In the North Sea, about 175 kilometres offshore, an average summarised PFAS concentration of 0.35 ng/L was provided in this publication. The measured concentration of PFAS in the North Sea seems to be low, however, if linked to the volume of the North Sea of 54,000 cubic kilometres (areal of the North Sea 575.000 square kilometres with an average depth of 94 m) it results in 2.000 t PFAS which can’t be the result of an intense use of PFAS off shore at the North Sea. Many large rivers drain into the North Sea. The river basins are densely populated and large industries occur in this area. Going from open sea via river estuaries upstream the rivers, an increasing PFAS concentration could be measured. Along the Dutch coast, in the Rhine-Waal-Scheldt-Estuary, an average PFAS concentration of about 12 ng/L could be detected. The average PFAS concentration at the mouth of the rivers Rhine and

P.O. Box 400, FI-00121 Helsinki, Finland | Tel. +358 9 686180 | echa.europa.eu
130
Waal, in the Haringvliet, is 121 ng/l. Going further upstream the rivers, a high amount of PFAS’s is released into the Nederrijn and in the river Waal (average concentration of summarised PFAS: 260 ng/L). Large amounts of PFAS’s are also drained into the North Sea by the river Scheldt. At the Scheldt rivers’ mouth (Western Scheldt) an average PFAS concentration of 95 ng/L was measured. The highest mean concentration of PFAS was measured in the river Scheldt with 498 ng/L. In the river Ruhr (into which the river Moehne is drained) at the inflow into the Rhine an average PFAS concentration of 47 ng/l was detected. Downstream Leverkusen the mean concentration of summarised PFAS raised to 181 n/L instantaneously, compared to the average summarised PFAS concentration of about 21 ng/L in the Rhine upstream Leverkusen.
The respective increasing PFAS concentration in the rivers Rhine, Waal and Scheldt was obviously caused by direct industrial emissions or indirectly via wastewater treatment plants or by the inflow of contaminated water from the several tributaries. Another source of PFAS contamination in river water may result from application of contaminated sludge to fields. The PFASs are eroded from the soil by rain. The substances are transported via river effluent over long distances into the Rhine-Waal-Scheldt-Estruary. So, for example, the linear distances from the point of emission are >200 km, from Leverkusen to a monitoring point in the North Sea or > 300 km from contaminated soil in the river Moehnes drainage area to the same monitoring point at the open sea. On the one hand, the substances are diluted within the North Sea due to the large amount of marine water, but also trapped in the North Sea for a while.
Conclusion:
Many PFAS have potential for long-range transport mainly due to the high persistence. Also mobility in water and volatility contribute to the LRTP. Some precursors, such as FTOH, are themselves long-range transported. Same can be expected to other volatile PFASs. Precursor PFASs degrade over time to PFAAs which can be expected based on their physical-chemical properties and high persistence to be long-range transported. This was demonstrated with model calculation for selected PFCAs. The LRT pathways are different, depending on the PFASs, and may change when a precursor degrades to the corresponding arrowhead. Volatile PFAS such as F-Gases and uncharged PFASs like perfluoroalkyl sulphonamides (FASAs), perfluoroalkyl sulfonamidoethanols (FASEs) and partially fluorotelomer alcohols (FTOHs) are mainly transported via air. The long-range transport via water is the predominant pathway for anionic PFAS like PFCAs and PFSAs). An important vector to remote areas is plastic debris for adsorptive PFAS.
B.4.2.6. Environmental distribution of firefighting foams
PFAS compounds experience a fate and transport that can be generalised for most occurrences and described as follows (see Figure B.4821 below).
At the location of the active firefighting activity PFAS-laden waters enter the subsurface resulting in PFAS-impacted soils – the source area (No. 1). The source area typically holds the greatest PFAS mass. Precipitation supports leaching of PFAS compounds in the unsaturated soil column to greater depth (No. 2) in the soil column eventually reaching groundwater which is then the starting point of a PFAS plume in groundwater (No. 3). Depending on the fuel that was extinguished, PFAS have a tendency to accumulate with free phase products22 at the water table intersection. The plume will extend in the direction of and
21 Wood E&I Solutions, 2017.
22 Common petroleum hydrocarbon-based fuels are lighter than water (light non-aqueous phase liquids – LNAPL) and accumulate at the water table intersection when they are released to the environment at large enough quantities. “Free phase” refers to a fuel layer on the groundwater table.

P.O. Box 400, FI-00121 Helsinki, Finland | Tel. +358 9 686180 | echa.europa.eu
131
grow with groundwater flow as more PFAS-mass leaches from the source area. Eventually the plume might grow to a size extending past the property boundary (airport, oil and gas refinery, etc.) migrating off-site. The PFAS plume size might have grown in size and extended into areas where groundwater extraction could occur for domestic (No. 9), commercial or public use (No. 10) including private drinking water wells, agricultural irrigation and livestock feeds, and drinking water production facilities. Stormwater runoff from a fire training area or live fire incident can migrate in various directions predominantly following land surface morphology (No. 5). In consequence, surface water runoff can spread PFAS contamination in directions beyond groundwater flow. Stormwater runoff can directly or indirectly occur via some sort of controlled or uncontrolled overland flow or through underground utilities. Damaged/leaking utility structures can be locations where PFAS could enter the subsurface at a point that is in only limited relation to the actual firefighting area. Stormwater or surface runoff could eventually discharge to a surface water body such as the sea, a lake or pond, or a stream, river, creek or brook (No. 6). Sediments at the bottom of surface water structures including the surface water runoff ditches, drains, channels, ponds, lakes, or the sea can have PFAS-laden sediments as precipitated solids as part of the surface water feature (No. 7).
Figure B.48. Overview of PFAS fate and transport from use of firefighting foams, from (Wood E&I Solutions, 2017), in (Wood et al., 2020)
B.4.2.6.1. PFAS-containing foams
For PFAS-containing foams at legacy sites, contamination patterns normally include soil, both unsaturated and saturated, to be impacted by PFAS at higher concentrations, because the PFAS entry point into the subsurface occurs from above ground in most scenarios, specifically for firefighting and training events. PFAS leaching to greater depths in the soil column by infiltrating precipitation eventually reaching groundwater is commonly observed at legacy sites. Leaching is supported by the physicochemical characteristics of PFAS. PFAS in shallow soils can also be transported via overland flow by storm water run-off during precipitation events. Storm water would either infiltrate into the ground at an area geographically separated from the original firefighting activities, or storm water run-off can directly discharge to a surface water body such as a river, stream, or lake, or it can be captured in a storm-/ wastewater treatment facility. Historically, storm- or wastewater facilities were not required to analyse for PFAS compounds. It can be assumed that most PFAS have passed untreated through a treatment works without awareness of the operator allowing for PFAS to spread to

P.O. Box 400, FI-00121 Helsinki, Finland | Tel. +358 9 686180 | echa.europa.eu
132
the wider environment (NordicCouncil, 2019).
The PFAS-laden soils in the source area continue to be an emission source for groundwater contamination for many years, if not decades. Once PFAS-compounds have reached the aquifer or a water-bearing unit, those compounds tend to migrate laterally and in a hydraulically downgradient direction with limited retardation from the soil matrix and negligible, if at all occurring, breakdown through biotic or abiotic processes in the aquifer (Concawe, 2016). As a consequence, PFAS tend to generate large plumes in groundwater. Acceptable PFAS threshold concentrations are extremely low, and plumes can be many kilometres long. In the Veneto region, Italy, a PFAS-production facility contaminated an area spanning more than 200 square km (WHO, 2016). Various scenarios can result from PFAS-impacted groundwater. Groundwater could be extracted and used as drinking water. Extracted groundwater could also be used for irrigation of agricultural land. In addition to soil and groundwater impacts, surface water could be impacted from historically contaminated soils by means of surface water run-off. Under certain hydrogeological conditions, groundwater can become surface water or interact with surface water in brooks, creeks, streams, or river beds. PFAS-impacted ground or surface water can become a challenge when they enter a water treatment works at privately owned locations (e.g. oil and gas sites or airports) or public treatment works, as indicated above. In most cases PFASs are not analysed for in water treatment works and the presence or absence of PFASs are consequentially unknown. Also those water suppliers which measure PFASs, only measure a minor subset (several tens of to max around 100 specific PFASs) of PFASs (see sections on monitorability for further details). For discussion on the water treatment, please, see section B.4.5. PFASs would require in most, if not all, cases, a separate treatment step in the water treatment works with potential requirements for additional pre-treatment (e.g. high dissolved organic carbon (DOC) can be a problem in treating PFAS) and retrofitting of the treatment works at a substantial cost.
B.4.2.6.2. Fluorine-free foams
Based on the definition of “remediation” and “clean-up” there would not be a remediation scenario that includes fluorine-free foam compounds as of now. For one, replacement products are fairly new to the market and possible/potential impacts from fluorine-free foams to the wider environment has not yet caused long-term adverse effects. The current expectation is that replacement products (alternatives to PFAS-based foams) do not have the potential to contaminate soil and/or groundwater in a way that remediation can be assumed or predicted to be needed. The analysis of alternatives has shown that the substances contained in shortlisted fluorine-free alternatives (i.e. a set of alternatives considered likely to be used) exhibit lower hazards than PFAS and rapid biodegradation. Even if those alternative substances have the potential to contaminate soil and groundwater, remediation scenarios/technologies are hard to define. Remediation in most EU countries is risk driven. That risk from alternative products cannot reasonably be anticipated at this point to develop a “remediation scenario” including treatment technologies and associated costs.
There was anecdotal evidence presented by one stakeholder that fluorine-free foam caused emulsification of the run-off water in a water treatment works. Should emulsification be a recurring issue for use of fluorine-free foams, then a separate treatment step to break up the emulsion would need to be included at the water treatment works as a retrofit at an additional cost.
Also, an anecdotal example was presented from another stakeholder that a permit was granted where 5 000 litres of firewater runoff from fluorine-free foams could be discharged directly to a sewer after “only” a fuel separator step.
B.4.3. Bioaccumulation
B.4.3.1. Procedural information
The C8-C14 PFCAs and C6-PFSA as well as the ammonium and sodium salts of C9-PFCA and

P.O. Box 400, FI-00121 Helsinki, Finland | Tel. +358 9 686180 | echa.europa.eu
133
C10-PFCA, the ammonium salt of C8-PFCA, and the salts of C6-PFSA are listed as substances of very high concern on the REACH Candidate List. C8-PFSA (PFOS) its salts and perfluorooctane sulfonyl fluoride (PFOS-F) are included in the Annex B to the Stockholm Convention on Persistent Organic Pollutants. C11-C14 PFCAs has been assessed to fulfil the vB-criterion of REACH Annex XIII. C8-C10-PFCA, as well as their salts meet the B-criterion (vB not assessed). C6-PFSA has been assessed to meet the vB criterion of REACH Annex XIII. PFOS and its salts have been assessed to meet the POP criterion for bioaccumulation
due to its potential to bioaccumulate and biomagnify in mammals and piscivorous birds Details of the assessment can be found in the supporting documentation of the listing in the Candidate List (European Chemicals Agency, 2018, 2017, 2015, 2013a, 2013b, 2012a, 2012b). For this dossier a review of peer-reviewed more recent articles and scientific reports was carried out. The recent data illustrate further the specific mechanisms of bioconcentration and biomagnification and list in particular results of PFASs not yet regulated or assessed. In the following data from modelling, laboratory and field studies, as well as from monitoring campaigns are presented. B.4.3.2. Toxicokinetics of PFAS in animals
The overall body burden and target site concentration of a chemical and its metabolites is governed by its toxicokinetics (i.e., processes of absorption, distribution, metabolism, and excretion, ADME). Yet available toxicokinetic data primarily focus mainly on PFAAs (De Silva et al., 2008; Kudo, 2015; Kudo and Kawashima, 2003). Overall, there are more robust data regarding the ADME of PFAS in humans and rats than other species, and of PFOA and PFOS than the other PFAS. As discussed in chapter on toxicokinetic processes (B.5.1), studies with mammalian species show that PFCAs and many PFASs are readily absorbed and distributed especially among protein-rich tissues like liver, serum, kidney (Ahrens et al., 2009; Chen et al., 2021; De Silva et al., 2021; Martin et al., 2003; Shi et al., 2020, 2018). Due the high sorption capacities (e.g. Armitage et al., 2012a; Luebker et al., 2002), the toxicokinetic behaviors of many PFASs (uptake, translocation, bioaccumulation, biotransformation, elimination, etc.) differ considerably from the common hydrophobic and persistent organic pollutants (Ng and Hungerbühler, 2013). Indeed, PFAAs were found to sorb strongly to serum albumin, α globulins, and fatty acid-binding proteins (reviewed in: Ebert et al., 2020). For instance, the evidence suggests that PFOA, PFOS, and PFBS preferentially distribute to the liver in most species; PFBA and PFHxS appear to preferentially distribute to the serum and, to a lesser extent, to the liver in animals.
The enterohepatic circulation of PFASs likely contributes to their extended elimination half lives in humans. It was demonstrated that PFBS, PFHxS, and PFOS were transported into hepatocytes both in a sodium-dependent and a sodium-independent manner by Na+/taurocholate co-transporting polypeptide (NTCP). PFBS, PFHxS, PFOS and PFCAs with 7-10 carbons are substrates of organic anion transporting polypeptides (OATPs). Chinese Hamster Ovary and Human Embryonic Kidney cells were used to demonstrate that human OATPs can transport PFBS, PFHxS, PFOS and the 2 PFCAs (C8 and C9). In addition, it was shown that rat different OATPs transport all 3 sulfonates. This study suggests that besides NTCP and the human apical sodium-dependent bile salt transporter, OATPs also are capable of contributing to the enterohepatic circulation and extended human serum elimination half-lives of PFBS and other PFASs (Zhao et al., 2017). As outlined in chapter B.5.1 on toxicokinetics, in mammals the major route of excretion for PFASs is renal elimination and to a smaller extent biliary and fecal (Consoer et al., 2014; Kudo, 2015). For instance, elimination of PFOA in rainbow trout occurred primarily via the renal route, which is consistent with numerous studies also in mammals suggesting that fish possess membrane transporters that facilitate the movement of PFOA from plasma to urine

P.O. Box 400, FI-00121 Helsinki, Finland | Tel. +358 9 686180 | echa.europa.eu
134
(Consoer et al., 2014).
In both humans and animals, PFASs are transferred to the fetus via the placenta and to the offspring via breast milk (e.g. Dewitt, 2015). PFASs do not readily cross the mature blood-brain barrier. This is supported by findings from Harada et al., (2007) in which PFOA and PFOS cerebral spinal fluid concentrations in adult humans were more than 500-fold lower than serum concentrations. However, high levels of PFSAs and PFCAs were found in the brain of wild mammals and birds, e.g. in polar bears or gulls (Leranth et al., 2008; Verreault et al., 2005).
Also in birds, maternal transfer is a major exposure route for PFASs (Göckener et al., 2020; Jouanneau et al., 2021; Kowalczyk et al., 2020) though little is known, about the extent of the transfer of the different PFASs compounds to the eggs, especially for alternative fluorinated compounds. A recent study by Jouanneau et al., (2021) showed that contamination of both females and eggs were dominated by linPFOS then PFUnA or PFTriA. They measured PFASs, including Gen-X, ADONA, and F-53B, in the plasma of prelaying black-legged kittiwake females breeding in Svalbard. There was a linear association between females and eggs for most of the PFASs and maternal transfer ratios in females and eggs suggest that the transfer is increasing with PFASs carbon chain length, therefore the longest chain perfluoroalkyl carboxylic acids (PFCAs) were preferentially transferred to the eggs.
PFCAs are not metabolised in animals (Kudo, 2015). Studies on PFOA as well as PFSAs such as PFOS (C8-PFSA) and C10-PFSA in rats have shown that they are excreted untransformed without forming any metabolites or conjugates. Thus, PFCAs are believed to represent metabolically inert and stable end-stage products. However, certain precursors have in rodents been shown to transform, to various extents, into e.g. their perfluorinated carboxylate “backbone structures”, such as 8:2 FTOH that is metabolised into e.g. PFOA and C9-PFCA (Henderson and Smith, 2007). E.g. neutral volatile atmospheric precursors such as FTOH and FASA can biotransform in humans and wildlife, contributing to overall exposures of the terminal end products such as PFOS and PFOA (de Silva et al., 2021).
Conclusion: Many PFASs are readily absorbed and distributed especially among protein-rich tissues (especially liver, serum, kidney) and, thus, the toxicokinetic behaviors of PFASs differs considerably from the traditional hydrophobic chemicals. Many PFASs are transferred to the fetus via the placenta and via eggs, and to the offspring via breast milk. B.4.3.3. Characteristics influencing bioaccumulation and toxicokinetic behaviour
Protein binding
Some of the PFAS have been discussed as being proteinophilic rather than lipophilic substances questioning the usual bioaccumulation assessment scheme.
As discussed in the PFHxA restriction, the relationship between structure (e.g. chain length) and affinity to proteins is complex and thus still a matter of research In mammals, serum albumin, fatty acid binding proteins (FABPs) and organic anion transporters (OATs) have been identified as important to the tissue distribution, species-specific accumulation, and species- and gender-specific elimination rates of perfluoroalkyl carboxylates and perfluoroalkane sulfonates (Han et al., 2003; Ng and Hungerbühler, 2015; Zhang et al., 2013). Several biological matrices with high sorption capacities and the corresponding distribution coefficients or binding affinities have been reported for some PFAAs. These include serum albumin as a transport protein in blood, phospholipids as the major component of cellular membranes, alpha globulins, and liver fatty acid binding proteins (FABPs) that belong to the intracellular lipid-binding protein superfamily (Allendorf et al., 2019a; Armitage et al., 2012b; Bischel et al., 2011; Droge, 2019; Han et al., 2003; Luebker et al., 2002; Sheng et al., 2016;

P.O. Box 400, FI-00121 Helsinki, Finland | Tel. +358 9 686180 | echa.europa.eu
135
Weaver et al., 2009; Woodcroft et al., 2010; Zhang et al., 2013). Unlike the accumulation in adipose tissue, binding to proteins and accumulation in specific organs has a higher potential to cause adverse effects, since organ toxic effects may arise (B.5.1 on toxicity).
Certain PFAAs tend to accumulate in organisms caused by binding to proteins. A study with fish (rainbow trout) showed that different Perfluorocarboxylates (PFPA, PFHxA, PFHpA, PFOA, PFDA, PFUnA, PFDoA, PFTA) and -sulfonates (PFBS, PFHxS, PFOS) accumulate to the greatest extent in blood > kidney > liver > gall bladder and bioconcentration can be neglected for carboxylates and sulfonates with F-chain length shorter than seven and six carbons, respectively (Martin et al., 2003, 2003).
Bischel et al., 2011, investigated with equilibrium dialysis the binding of PFCAs with two to 12 carbons (C2–C12) and PFSAs with four to eight carbons (C4, C6, and C8) PFCAs to bovine serum albumin (BSA). An increase in the protein water distribution (KPW) with increasing chain length was observed for PFCAs with four to six perfluorinated carbons. Log KPW values for C4 to C12 PFAAs range from 3.3 to 4.3. Affinity for BSA increases with PFAA hydrophobicity but decreases from the C8 to C12 PFCAs, likely due to steric hindrances associated with longer and more rigid perfluoroalkyl chains. With the exception of PFDoA over 90% of all PFAAs were bound to BSA (Bischel et al., 2011).
Allendorf et al., (2021) analysed a consistent set of distribution coefficients for a series of PFAAs and 4 of their alternatives to physiologically relevant matrices including albumin, membrane lipids, structural proteins, and storage lipids. The results of the physiologically based distribution calculations showed that albumin with the highest partitioning coefficients as well as membrane lipids, and structural proteins are of major relevance in estimating the accumulation of PFAAs in different organs. Log KPW values for C7 to C11 PFCAs range from 4.6 to 4.86. For PFSAs with four to eight carbons (C4, C6, and C8) Log KPW values are 3.34, 4,94 and 4.81 respectively. For HFPO-DA, DONA, 9Cl-PF3ONS and PFECHS Log KPW values are 3.19, 4.06, 5.14 and 4.68 respectively. The albumin/water partition coefficients for the alternatives (HFPO-DA, DONA, 9Cl-PF3ONS and PFECHS) are in the same range as for classical PFAAs. Structural modifications such as the introduction of ether groups into the chain do not reduce sorption to albumin, whereas the chlorine atom in 9Cl-PF3ONS seems to even increase the sorption to albumin (Allendorf et al., 2019b). This study concludes that the introduced ether groups do not considerably alter the distribution properties compared to PFCAs.
As outlined in the monitoring section (B.4.2), PFASs are transferred to off-spring, milk and eggs in many taxa, including livestock species (see review by Death et al., 2021). For instance, Sharpe et al., (2010) showed that when zebrafish underwent a reproductive cycle in the presence of PFOS, approximately 10% of the adult PFOS body burden was transferred to the developing embryos, resulting in a higher total PFOS concentration in eggs (116 ± 13.3 µg/g) than in the parent fish (72.1 ± 7.6 µg/g). Grønnestad et al., (2017) demonstrated in hooded seals (Cystophora cristata) how 8 PFAS were transferred from mother to offspring via maternal transfer via both milk and the placenta, of which placental transfer is the dominant pathway reaching high levels in pub plasma.
Apart from serum albumin the binding to other proteins may have an impact. In the study by (Zhang et al., 2013b). the binding strength to a fatty acid binding protein, a high-abundance protein in liver, was found to be dependent on the length of the fluorocarbon tail and the polar headgroup. According to the authors, this dependence can be rationalized by the binding mode inside the protein’s ligand-binding cavity, as revealed by molecular docking analysis. The authors conclude that based on their calculation, the potential disruption of the uptake and transport of fatty acids cannot be ignored.
According to previous studies, shorter chained PFAAS have a comparable high affinity to serum proteins as do longer chained PFAAs (Bischel et al., 2011). This property is combined with a markedly higher Kd (Gao, 2019). This might, beside placental transfer, also affect other aspects of accumulation, such as passage of the blood-cerebral barrier. Notably, a previous

P.O. Box 400, FI-00121 Helsinki, Finland | Tel. +358 9 686180 | echa.europa.eu
136
comparative study demonstrated occurrence of PFASs in human brain, using autopsies of various organs that had been sampled from 20 subjects. In this study, the concentrations of 21 PFASs (C4-C18 PFCA, C4, C6 and C8 PFSA, and perfluorohexyl ethanoic acid (FHEA), perfluorooctyl ethanoic acid FOEA, and perfluorodecyl ethanoic acid FDEA; perfluorooctanesulfonamide (PFOSA)) were analyzed in 99 samples of autopsy tissues (brain, liver, lung, bone, and kidney) from subjects who had been living in Tarragona (Catalonia, Spain). All samples showed detectable values of at least two of the investigated compounds. Although PFASs accumulation followed different trends depending on the specific tissue, some similarities were observed between liver and brain, on one hand, and between kidney and lung, on the other hand. In liver, PFHxA, PFOS and FHEA were the most prevalent compounds, with median concentrations of 68.3, 41.9 and 16.7 ng/g, respectively. PFOS was present in 90% of the samples, while PFOA could be quantified in 45% of the samples (median: 4.0 ng/g). In brain, PFHxA was the main compound, being detected in all the samples at concentrations ranging from 10.1 to 486 ng/g. The contributions of PFNA (median: 13.5 ng/g) and PFDA (median: 12.4 ng/g) were also relatively important in brain samples. In contrast, PFOS was only quantified in 20% of the samples (median: 1.9 ng/g), whereas PFOA was not detected in any of them. In general terms, lung was the tissue showing the highest accumulation of PFASs. In contrast, detection of PFHxS and other PFAS was much lower in the investigated brain samples (Pérez et al., 2013). Again, further studies are required to clarify whether this effect is related to neurological or neurobehavioral health risks. Protein binding is assumed as one of the main mechanisms explaining facilitated tissue distribution. This hypothesis is supported by the findings of Numata et al., (2014). Four PFSAs and 3 PFCAs were quantifiable in feed, plasma, edible tissues, and urine of pigs. As percentages of unexcreted PFAA, the substances accumulated in plasma (up to 51%), fat, and muscle tissues (collectively, meat 40–49%), liver (under 7%), and kidney (under 2%) for most substances. An exception was PFOS, with lower affinity for plasma (23%) and higher for liver (35%) in the body of pigs (see section B.4.3.2). Nevertheless, the potential to bind to BSA may not fully explain the toxicokinetics. Transporter proteins as described above may also have an impact on toxicokinetics. Apart from this, a study has shown that PFAAs bind to peroxisome proliferator-activated receptors. This plays a role in lipid metabolism, induces conformational changes of this receptor and may thus change the function of the protein (Zhang et al., 2014b). Chain length and chemical structure
Depending on chain length and functional groups PFAS vary in their ability to bioaccumulate. This has been mainly investigated for PFCAs and PFSAs. As discussed in the PFHxA restriction, the affinity of PFAAs to proteins is chain-length dependent and increases up to a certain number of perfluorinated carbons depending on the protein (Ng and Hungerbühler, 2014a; Zhang et al., 2013). A study with fish (rainbow trout) showed that different Perfluorocarboxylates (PFPA, PFHxA, PFHpA, PFOA, PFDA, PFUnA, PFDoA, PFTA) and -sulfonates (PFBS, PFHxS, PFOS) accumulate to the greatest extent in blood > kidney > liver > gall bladder and bioconcentration can be neglected for carboxylates and sulfonates with F-chain length shorter than seven and six carbons, respectively (Martin et al., 2003). Shi et al., (2018) investigated how the differential tissue distribution and bioaccumulation behaviour of 25 PFASs in crucian carp from two field sites impacted by point sources can provide information about the processes governing uptake, distribution and elimination of PFASs. Transformation of concentration data into relative body burdens demonstrated that blood, gonads, and muscle together accounted for >90% of the amount of PFASs in the organism. Functional group was a relatively more important predictor of internal distribution than chain-length for PFASs. This may be one reason why whole body bioaccumulation factors (BAFs) for short-chain PFASs deviated from the positive relationship with hydrophobicity observed for longer-chain homologues. Overall, the results of Shi et al, (2018) suggest that

P.O. Box 400, FI-00121 Helsinki, Finland | Tel. +358 9 686180 | echa.europa.eu
137
TBR, RBB, and BAF patterns were most consistent with protein binding mechanisms, although partitioning to phospholipids may contribute to the accumulation of long-chain PFASs in specific tissues. Ahrens and Bundschuh (2014) published a review paper on the behaviour and impacts of different PFASs in aquatic systems, including bioaccumulation in various taxa. They showed that the average PFOS+PFOA concentrations were typically in the ranges of 0.1-10 µg/kg ww for invertebrates, 1-100 µg/kg ww for fish and reptiles, 1-500 µg/kg ww for birds and 5-10,000 µg/kg ww for mammals. PFOS concentrations were typically up to 3 orders of magnitude higher compared with PFOA. The lower bioaccumulation potential of PFOA in comparison to PFOS was believed to be driven by both a shorter F-chain and differences in the functional group (e.g. carboxylic acids vs. sulfonates). Branched isomers were measured and were generally more readily excreted than linear isomers, which lead linear isomers to appear as more bioaccumulative than the comparable branched isomers in the addressed aquatic taxa.
De Silva et al., (2008) conducted dietary exposure studies in rainbow trout, administering technical ECF PFOA isomer, linear perfluorononanoate PFNA, and isopropyl PFNA for 36 d. Throughout exposure and depuration phases, blood and tissue sampling ensued. The accumulation ratio revealed similar accumulation propensity of n-PFOA and two minor branched PFOA isomers; however, the majority of branched isomers (n=5) had lower accumulation ratio values than n-PFOA. Sharpe et al., (2010) investigated the bioaccumulation of branched and linear PFOS isomers in rainbow trout and zebrafish. They found the branched PFOS isomers to bioaccumulate significantly less than the linear PFOS isomers, which may explain the relative lower concentration of branched PFOS isomers in some aquatic species in the field. The study remained unclear about whether this observed difference was due to differences in the uptake phase or in the elimination phase.
A different study with fish has found that linear PFOS isomers will accumulate more readily than the branched PFOS isomers, possibly being the result of a more efficient elimination of the branched PFOS isomers (Hassell et al., 2020). Conclusion: It is evident that protein binding of various PFASs efficiently distribute them into different organs and tissues, allowing for passage across brain and placental barriers, yielding in maternal- offspring transfer also via the milk. Due to their surfactant properties and the broad range of chemical structures among PFAS, the affinity of different PFAA for proteins varies widely, suggesting binding site-specific interactions, while the toxicokinetic behaviour is complex.
B.4.3.4. Modelling partitioning and bioaccumulation behaviour
Mechanistic bioaccumulation models developed for neutral lipophilic contaminants such as polychlorinated biphenyls and organochlorine pesticides have been widely used by academics, risk-assessment professionals, and regulatory authorities (Arnot and Gobas, 2004). Strong relationships between empirically derived bioaccumulation metrics (BCF, BAF, TMF) and distribution ratios for protein–water (DPW) and membrane–water (DMW) of individual PFAA have been demonstrated for some ecosystems (Chen et al., 2016a; Kelly et al., 2004). DPW and DMW are 2 key parameters that may be useful for predicting PFAS bioaccumulation potential. However, distinction between protein is warranted, since different protein types can exhibit different sorptive capacities (Henneberger et al., 2016). Accordingly, simple equilibrium partitioning‐based models may require utilizing a series of distribution coefficients for different proteins (e.g., transporter protein–water distribution ratios and structural protein–water distribution ratios). This approach was e.g. used to assess tissue‐specific bioaccumulation of PFAA and other ionic compounds in laboratory exposed fish (Chen et al. 2016, 2017). Chen et al., (2017) showed a positive linear relationships between log BCFss

P.O. Box 400, FI-00121 Helsinki, Finland | Tel. +358 9 686180 | echa.europa.eu
138
values and physical-chemical properties such as octanol–water distribution coefficients (log Dow), membrane–water distribution coefficients (log Dmw), albumin–water distribution coefficients (log DBSAw), and muscle protein–water distribution coefficients (log Dmpw), indicating the importance of lipid–, phospholipid–, and protein–water partitioning.
A chemical activity–based approach to ecological risk assessment bridges some gaps between traditional empirical modelling efforts and mechanistic models (Gobas et al., 2018, 2017). This approach was used to assess bioaccumulation and exposure risks of several PFAS in wildlife at AFFF-impacted sites (Gobas, 2020). The chemical activities of PFOS and other PFAA indicated that these compounds tend to primarily biomagnify in food webs composed of air-breathing wildlife (birds, mammals, terrestrial reptiles) compared to those comprising only aquatic organisms. An advantage of this approach that is particularly relevant to PFAS is that it can be used effectively for both neutral and ionic substances, including anionic, cationic, and zwitterionic compounds (De Silva et al., 2021).
Beyond simple partitioning-based models for substance screening, more sophisticated approaches may be required for higher-resolution modeling. For example, ionic compounds binding to intra- and extracellular protein (serum albumin, L-FABP), as well as membrane-associated organic anion transporters, may act to provide both enhanced sorption capacity and advective transport across biological membranes (Ng and Hungerbuehler 2013). This affects uptake and elimination rates as well as tissue distribution and helps explain the long elimination half-lives of PFAA in organisms.
Wang et al., 2011 conducted studies employing the COSMOtherm model to estimate physicochemical properties for 130 individual PFASs, namely perfluoroalkyl acids (including branched isomers for C4–C8 perfluorocarboxylic acids), their precursors and some important intermediates. The estimated physicochemical properties are interpreted using structure-property relationships and rationalised with insight into molecular interactions. Within a homologous series of linear PFASs with the same functional group, both air–water and octanol–water partition coefficient increase with increasing perfluorinated chain length, likely due to increasing molecular volume. For PFASs with the same perfluorinated chain length but different functional groups, the ability of the functional group to form hydrogen bonds strongly influences the chemicals’ partitioning behaviour). The partitioning behaviour of all theoretically possible branched isomers can vary considerably; however, the predominant isopropyl and monomethyl branched isomers in technical mixtures have similar properties as their linear counterparts (differences below 0.5 log units). Even with the large number of studies available, physiologically based toxicokinetic models for predicting the bioaccumulation of PFAS are, however, still in developmental phases (Armitage et al., 2017) and thus highly uncertain.
Two fish bioaccumulation models have been developed that account for some of the physicochemical characteristics of PFAS. One is the BIOconcentration model for Ionogenic Organic Compounds (BIONIC) model (Armitage et al., 2013), and the other is a protein-partitioning bioaccumulation model from Ng and Hungerbühler (2013, 2014). Due to data availability, these models were built on training sets limited to PFCAs with carbon chain lengths greater than 7. Both models focused on predictions in freshwater fish. Given the lack of protein-partitioning values for fish, the protein-partitioning component of the bioaccumulation model (i.e., Ng and Hungerbuhler, 2013, 2014) used rat and human protein-partitioning values. The BIONIC model (Armitage et al., 2013) considers phospholipids, rather than proteins, as the primary repository for PFAS, but the model does recognize the ionization potential of these substances. However, because PFAS bind primarily to fatty acid–binding proteins and lipoproteins/albumin, and then are sequestered in protein-rich tissues, these proteins are important to consider. However, the protein-partitioning model underestimated the bioaccumulation of PFHxS (6 carbons) and generally underestimated whole-body bioaccumulation (Ankley et al., 2021). Thus, it is possible that the active clearance and reabsorption processes described in the protein-partitioning model do not operate in the same way or to the same extent in fish as in rats or humans (Ankley et al., 2021). None of these

P.O. Box 400, FI-00121 Helsinki, Finland | Tel. +358 9 686180 | echa.europa.eu
139
models offer predictions for short-chain (less than 7 carbon) PFAS, but available empirical data from Martin et al. (2003a, 2003b), used in both models, showed that short-chain PFCAs (i.e., PFHxA, PFHpA) did not bioconcentrate in any rainbow trout tissue.
Physiologically based toxicokinetic (PBTK) models incorporating absorption, distribution, metabolism, and excretion metrics have been developed to assess the toxicokinetic of PFOS and PFOA in various animal models, including fish and mammals (Andersen et al., 2008; Consoer et al., 2014; Khazaee and Ng, 2018) but are still in the developmental phase.
Conclusion: Several modelling studies indicated that simple equilibrium partitioning‐based models may require utilizing a series of distribution coefficients for different proteins. Positive linear relationships BCF values and physical-chemical properties such as octanol–water distribution coefficients, membrane–water distribution coefficients, albumin–water distribution coefficients, and muscle protein–water distribution coefficients. Even with the large number of studies available, physiologically based toxicokinetic models for predicting the bioaccumulation of PFAS are, however, still in developmental phases and thus highly uncertain. B.4.3.5. Laboratory and field studies on bioaccumulation
A recent review article by Burkhard (2021) evaluated literature for bioconcentration factors (BCFs) and bioaccumulation factors (BAFs) in freshwater species for PFAS for 22 taxonomic classes. The assembled data were evaluated for quality, and for gaps and limitations in bioaccumulation information for the PFAS universe of chemicals. For BCFs, measurements have been focused on perfluorohexane sulfonic acid (PFHxS), PFOS, perfluorooctanoic acid (PFOA), PFNA, and PFDA. Accordingly, in general, carbonyl and sulfonyl PFAS classes are relatively data rich, whereas phosphate, fluorotelomer, and ether PFAS classes are data limited for fish and non-existent for most other taxonomic classes. Laboratory studies are limited to species with standardized testing protocols. Taxonomic classes with the most measurements were, in descending order, Teleostei (fish), Bivalvia, and Malacostraca. The numbers of PFAS chemicals with available measured BCFs (and BAFs) are summarized in Table 1 by structure category, and these counts cover all tissue types (BCFs and BAFs for whole body, muscle, fillet, liver, and other organs). The bioconcentration factors reported were measured in the laboratory using standardized protocols with aquatic organisms and a water-borne exposure procedure. Steady state was demonstrated for all tests. Tests are typically run with a 28-d uptake phase followed by a depuration phase running from 14 to 28 d depending on the chemical. As commonly noted in the literature, BCFs and BAFs with 8 or more carbons increase uniformly with increasing number of carbons in the alkyl chain (Kwadijk et al., 2010; Labadie and Chevreuil, 2011; Munoz et al., 2017; Chen et al., 2018). For the other taxa groups, a similar large increase in BCFs and BAFs generally occurs between PFOA and PFNA. BCF values of different PFASs groups followed the order phosphinic acids > PFCAs > PFSAs > others. Among the 43 PFASs compounds for which BCF and BAF studies are available in different aquatic species 62 % (27 compounds) have a median ± SD BCF and/or BAF values above the REACH threshold for B (log BCF> 3.3). Table B.30 and Figure B.49 show large inter and intra species variability and that differences between individual studies and the medians across all studies exist for BCFs, as also confirmed by Wassenaar et al., (2020). These may have several reasons: there is an inherent variability in BCF and BAF measurements, which is commonly observed in BCF and BAF measurements for a chemical (Arnot and Gobas, 2006, Wassenaar et al.,2020 ). Furthermore, bioaccumulation of PFAS chemicals appears to have a slight dependency on concentration of the chemical (Chen et al., 2016; Dai et al., 2013; Hoke et al., 2015; Inoue et al., 2012a) though other reporting demonstrated significant correlation of concentrations for PFOA (RIVM, 2017) and different studies have different exposure concentrations. Laboratory measurements suggest that BCFs decline with increasing exposure concentration (Chen et al., 2016; Dai et al., 2013; Hoke et al., 2015; Inoue et al., 2012). For example, Inoue et al. (2012) reported BCFs of 720 and 1300 with aqueous concentrations of 16 and 1.88 µg/L,

P.O. Box 400, FI-00121 Helsinki, Finland | Tel. +358 9 686180 | echa.europa.eu
140
respectively, for PFOS with common carp, a 1.8-fold increase in BCF with an 8.5-fold decrease in exposure concentration. As reviewed by Burkhard (2021), within a study, most often, lower concentrations provide higher measured BCFs, for example, PFOS with 3 amphibian species (Abercrombie et al., 2019), 4 of 7 PFAS chemicals with common carp (Inoue et al., 2012), 16 of 21 chemicals with zebrafish (Chen et al., 2016), and for exposures of 6 PFAS at concentrations of 1, 5 and 10 μg/L to Daphnia magna, 15 of 18 comparisons (Dai et al., 2013). Cause(s) of the decrease in BCFs with higher concentrations are unknown. However, PFAS residues are known to be controlled by a combination of passive diffusion and active transport processes (Ankley et al., 2021; Ng and Hungerbühler, 2014). Passive diffusion processes are generally not concentration dependent, which suggests there might be some type of capacity limitation in the active transport processes. Table B.30. Overview on bioconcentration factors (BCFs) and bioaccumulation factors (BAFs; L/kg wet wt) for fish for whole-body, muscle/fillet, and liver tissues (median ± standard deviation, n) provided by Burkhard (2021). Bold numbers = above the B criterion of REACH Annex XIII. SS = steady state; OECD = Organisation for Economic Co-operation and Development;
Chemical Tissue
B metric
CAS no.
Whole body
Log BCF SS and
Log BCF kinetic
Muscle/fillet
Log BCF SS and
Log BCF kinetic
Liver
Log BCF SS
Log BCF kinetic
Whole body
Log BAF
Muscle/fillet
Log BAF
Liver
Log BAF
Carbonyl compounds: OECD structure category 100
Carboxylic acids: OECD structure category 102
PFBA 45048-62-2
1.18 ± 0.08 (2)
–0.22 ± 1.15 (5)
1.80 ± 1.23 (5)
2.16 ± 1.68 (6)
0.47 ± 0.96 (40)
0.37 ± 1.11 (3)
PFPeA 45167-47-3
–0.05 ± — (1)
–0.64 ± 1.21 (3)
1.15 ± 1.53 (3)
1.74 ± 2.45 (5)
0.15 ± 1.46 (18)
1.48 ± 1.43 (4)
PFHxA 92612-52-7
0.98 ± 0.3 (3)
0.40 ± 1.01 (5)
1.73 ± 0.99 (5)
1.40 ± 1.51 (11)
0.09 ± 1.34 (19)
2.79 ± 1.62 (6)
PFHpA 120885-29-
2
1.26 ± — (1)
0.51 ± 1.24 (3)
1.78 ± 1.20 (3)
1.80 ± 1.24 (10)
–0.16 ± 1.27 (32)
0.92 ± 0.99 (6)
PFOA 45285-51-6
1.38 ± 0.61 (14)
0.82 ± 1.18 (7)
1.93 ± 1.00 (14)
2.16 ± 0.87 (48)
0.90 ± 1.14 (105)
1.97 ± 1.05 (48)
PFNA 72007-68-2
2.78 ± 0.51 (6)
2.80 ± 0.40 (4)
3.79 ± 0.24 (4)
2.80 ± 1.15 (41)
2.07 ± 0.76 (88)
2.84 ± 0.73 (20)
PFDA 73829-36-4
3.79 ± 0.48 (3)
3.81 ± 0.54
2.98 ± 0.93 (8)
3.45 ± 0.62
3.06 ± 0.49
3.72 ± 0.65

P.O. Box 400, FI-00121 Helsinki, Finland | Tel. +358 9 686180 | echa.europa.eu
141
(4) (43) (72) (30)
PFUnDA 196859-54-
8
3.57 ± 0.31 (5)
3.97 ± 0.88 (4)
3.41 ± 0.74 (8)
3.47 ± 1.01 (21)
3.89 ± 0.77 (54)
4.34 ± 0.72 (28)
PFDoDA 171978-95-
3
3.64 ± 0.60 (8)
4.12 ± 0.83 (4)
4.46 ± 1.16 (4)
2.18 ± — (1)
4.50 ± 1.57 (28)
4.32 ± 1.52 (17)
PFTrDA 862374-87-
6
4.34 ± 0.46 (2)
4.51 ± 0.85 (2)
5.22 ± 1.08 (2)
— 4.66 ± 0.16 (3)
5.43 ± — (1)
PFTeDA 365971-87-
5
4.40 ± 0.56 (4)
4.96 ± 0.62 (2)
4.74 ± 1.09 (3)
— 4.38 ± — (1)
5.08 ± — (1)
PFHxDA 67905-19-5
3.68 ± 0.01 (2)
— — — — —
PFOcDA 16517-11-6
2.57 ± 0.09 (2)
— — — — —
Sulfonyl compounds: OECD structure category 200
Sulfonic acids: OECD structure category 202
PFBS 375-73-5
1.06 ± 0.49 (7)
0.09 ± 1.15 (4)
1.74 ± 1.06 (5)
2.00 ± 1.13 (5)
1.35 ± 0.84 (16)
1.18 ± 0.34 (5)
PFHxS 355-46-4
2.07 ± 0.25 (6)
1.34 ± 0.19 (2)
2.41 ± 0.4 (4)
2.30 ± 0.74 (25)
1.28 ± 0.86 (56)
2.18 ± 0.58 (17)
PFHpS 375-92-8
— — — — 2.20 ± — (1)
3.20 ± 0.10 (3)
PFOS 1763-23-1
3.01 ± 0.66 (21)
3.27 ± 0.96 (7)
3.17 ± 0.88 (18)
3.52 ± 0.78 (81)
3.09 ± 0.60
(155)
3.74 ± 0.84 (61)
PFDS 335-77-3
— — 3.21 ± — (1)
1.30 ± — (1)
— 4.20 ± 0.15 (3)
PFECHS — — — — — — —
Sulfonamides: OECD structure category 203.01
FOSA 754-91-6
— — — 3.70 ± 0.53 (12)
2.95 ± 0.94 (24)
4.00 ± 0.2 (11)
Sulfonamidoacetic acids: OECD structure category 203.05

P.O. Box 400, FI-00121 Helsinki, Finland | Tel. +358 9 686180 | echa.europa.eu
142
MeFOSAA 2355-31-9
— — — 4.10 ± 0.16 (2)
— —
EtFOSAA 2991-50-6
— — — 3.50 ± 0.06 (2)
— 3.45 ± 0.21 (2)
Perfluoroalkane sulfonyl amido ethanols, phosphate esters (SAmPAPs): OECD structure category 203.02
SAmPAP 2965-52-8
1.42 ± — (1)
— — — — —
Perfluoroalkyl phosphate compounds: OECD structure category 300
Phosphonic acids: OECD structure category 302
PFHxPA 40143-76-8
1.46 ± 0.36 (2)
1.44 ± 0.14 (2)
2.83 ± 0.35 (2) — — —
PFOPA 40143-78-0
1.92 ± 0.13 (2)
1.74 ± 0.12 (2)
2.66 ± 0.18 (2) — — —
PFDPA 52299-26-0
2.21 ± 0.13 (2)
1.87 ± 0.04 (2)
3.36 ± 0.67 (2) — — —
Phosphinic acids: OECD structure category 303
C6/C6 PFPiA 40143
-77-9 5.12 ±
0.71 (2)
5.51 ± 0.16 (2)
5.50 ± 0.69 (2) — — —
C6/C8 PFPiA
— 7.36 ±
1.24 (2)
7.03 ± 0.88 (2)
7.35 ± 0.93 (2) — — —
C8/C8 PFPiA 40143
-79-1 8.30 ±
0.89 (2)
7.44 ± 1.43 (2)
7.36 ± 1.65 (2) — — —
C6/C10 PFPiA
— 8.52 ±
1.01 (2)
7.78 ± 1.43 (2)
7.43 ± 1.36 (2) — — —
C8/C10 PFPiA
— 5.79 ±
0.07 (2)
2.71 ± 3.80 (2)
1.85 ± 2.28 (2) — — —
C6/C12 PFPiA
— 6.30 ±
0.98 (2)
5.35 ± 1.56 (2)
4.89 ± 2.73 (2) — — —
Fluorotelomer-related compounds: OECD structure category 400
Fluorotelomer alcohols: OECD structure category 402.03
8:2 FTOH 678- 2.50 ±
— — — — —

P.O. Box 400, FI-00121 Helsinki, Finland | Tel. +358 9 686180 | echa.europa.eu
143
39-7 0.42 (2)
n:2 Fluorotelomer alcohol, phosphate esters (PAPs): OECD structure category 402.04
6:2 diPAP 57677-95-9 — —
3.50 ± — (1) — — —
8:2 diPAP 678-41-1 — —
2.39 ± — (1) — — —
Fluorotelomer sulfonate: OECD structure category 402.07
4:2 FTSA 757124-72-
4 — — — 4.14 ± — (1)
1.49 ± — (1) —
6:2 FTSA 27619-97-2
1.54 ± 0.62 (3) — — — — —
8:2 FTSA 39108-34-4 — — —
4.86 ± 0.41 (2)
3.94 ± 0.56 (4) —
Per- and polyfluoroalkyl ether-based compounds: OECD structure category 500
PFECAs, salts, and esters–monoethers: OECD structure category 502.01
4:2 Cl-PFESA — — — — — —
3.27 ± — (1)
F-53B (6:2 Cl-PFESA)
73606-19-6
2.85 ± 1.16 (6) —
3.43 ± 0.20 (4)
4.33 ± 0.19 (5)
3.85 ± 0.42 (6)
4.76 ± 0.4 (6)
8:2 Cl-PFESA
83329-89-9
0.40 ± — (1) — — —
4.69 ± — (1)
5.64 ± — (1)
HFPO-DA 13252-13-6 — — — —
0.61 ± — (1)
0.50 ± — (1)
PFECAs, salts and esters–diethers: OECD structure category 502.02
HFPO-TA 13252-14-7 — — — —
1.05 ± — (1)
1.75 ± — (1)
A synthesis of 513 laboratory-based and 931 field-based measurements indicates that long-chain PFCAs with a 12 to 14 carbon-chain length generally exhibit the highest bioaccumulation potential, with whole-body BCF values ranging between 18 000 and 40 000 L/kg (Gobas 2020). Laboratory-based whole-body BCFs of PFCA with 8 to 11 carbon-chain lengths are generally lower (BCF range 4.0–4900 L/kg). As described in the monitoring section B.4.2.4, field studies show that air-breathing organisms are more likely to bioaccumulate PFAAs compared to gill breathing organisms since they cannot eliminate PFAAs via ventilation. Accordingly, certain PFASs like C8-C10 PFCAs and C6 PFSA are more likely to bioaccumulate in air-breathing organisms, including humans, as compared to gill breathing organisms and that trophic magnification occurs in certain food

P.O. Box 400, FI-00121 Helsinki, Finland | Tel. +358 9 686180 | echa.europa.eu
144
webs in the environment where air breathing organisms are top-predators in the food chains (e.g. de Wit et al., 2020, De Silva et al., 2020). Conclusion: For BCFs, measurements have been focused on PFHxS, PFOS, PFOA, PFNA, and PFDA. Accordingly, in general, carbonyl and sulfonyl PFAS classes are relatively data rich, whereas phosphate, fluorotelomer, and ether PFAS classes are data limited for fish and non-existent for most other taxonomic classes. Generally, measured BCF values show extremely large inter and intra species variability for the same compounds indicating large uncertainties. Among the 43 PFASs compounds for which BCF and BAF studies are available in different aquatic species 62 % (27 compounds) have a median ± SD BCF and/or BAF values above the REACH threshold for B (log BCF> 3.3). BCF values of PFAS groups follow the order phosphinic acids > sulfonyl acids > carbonyl acids > others. In general, BCFs decline with increasing exposure concentration, while BCFs/BAFs of PFASs with 8 or more carbons increase uniformly with increasing number of carbons in the alkyl chain, with highest bioaccumulation potential of compounds with 12 to 14 carbon-chain length. However, aqueous testing underestimates the potential of bioaccumulation of PFASs, since air-breathing organisms are more likely to bioaccumulate PFASs compared to gill breathing organisms. Thus, established assessment methods of bioaccumulation based on bioconcentration testing in aquatic organisms do not suffice to assess the bioaccumulation behaviour of PFASs. B.4.3.6. Bioaccumulation and trophic magnification in wildlife
As outlined in the monitoring section (B.4.2), analyses of biota at different trophic levels of the ecosystem show clearly that many PFASs that do not accumulate in aqueous species, bioaccumulate and biomagnify to high concentration levels in air breathers including top predator animals like polar bears, whales and seals (for example De Silva et al. 2020, Chen et al.,2021). The latter shows that dietary uptake routes indeed are important in PFASs toxicokinetics, especially for uptake in mammalian and top predator species. The recent review by De Silva et al., (2020) demonstrated that elevated exposures of wildlife to PFAS represent a concern for their health directly and for human populations that consume wildlife (Fair et al., 2019; Guillette et al., 2020). PFASs were detected in endangered species like green turtles and polar bears (Eggers Pedersen et al., 2015; Wood et al., 2021). In 2001, the first report on the global occurrence of PFOS in wildlife was released, illustrating widespread presence in biological tissues even in remote regions such as the Arctic (Giesy and Kannan, 2001). Concentrations of PFOS and other PFAA have been detected in invertebrates, fish, amphibians, reptiles, birds, and mammals worldwide (Ahrens and Bundschuh, 2014b; Penland et al., 2020). Several comprehensive reviews (Houde et al., 2011; Muir et al., 2019; Reiner et al., 2011) have synthesized data from available biomonitoring studies.
The highest PFAS concentrations in wildlife tend to be associated with proximity to contaminated sites. For example, one of the highest reported fish PFOS concentrations (maximum 9349 ng/g dry wt in whole fish tissue) was from an AFFF-impacted site downstream from Barksdale Air Force Base in Louisiana (Lanza et al., 2017). Many biomonitoring studies have identified elevated exposures to legacy and emerging PFAS as the result of industrial activities (Groffen et al., 2019; Guillette et al., 2020; Liu et al., 2017; Lopez-Antia et al., 2021).
As shown by Burkhard (2021), for species commonly consumed by humans (e.g., fish, clams, mussels, oysters, and scallops, lobsters, crabs, shrimp, and prawns and winkles), there are BCF and BAF measurements for the carboxylic acids (n‐PFHxA through n-perfluoroundecanoic acid), sulfonic acids (n‐PFBS, n‐PFHxS, and n‐PFOS) and FOSA (except for Gastropoda). For other chemicals, BCF and BAF data are limited, and measurements for chemicals beyond the PFAS just listed are needed. Comparison of laboratory BCFs with field BAFs revealed that 60% (26 of 43 comparisons) of the BAFs are greater than their corresponding BCFs, and similar proportions exist for BAFs based on whole body, muscle, and liver (Burkhard 2021, Table B.30, Figure B.49). The BAFs include all exposure routes and, as suggested by the modeling

P.O. Box 400, FI-00121 Helsinki, Finland | Tel. +358 9 686180 | echa.europa.eu
145
efforts of (Larson et al., 2018), sedimentary sources of the PFAS can cause BAFs to be greater than BCFs. Trophic magnification factors (which are food web average biomagnification factors) are slightly >1 for some PFAS compounds (Chen et al., 2018; Fang et al., 2014; Loi et al., 2011; Martin et al., 2004; Munoz et al., 2017).These field data suggest that BAFs for some PFAS should be larger than their BCFs for aquatic species because of biomagnification processes within the food web.
Figure B.49. (provided in Burkhard 2021). Measured bioconcentration factors (BCFs) and bioaccumulation factors (BAFs) in log units from different aquatic species. Avian and marine mammalian food webs exhibit the highest reported TMFs for PFAA (e.g. Kelly et al., 2009). In aquatic piscivorous food webs TMFs tend to be much lower. For example, TMFs of PFOS in the Lake Ontario aquatic piscivorous food webs including air breathing top predators, e.g. dolphins range between 1.9 and 5.9 (Houde et al., 2008; Martin et al., 2004). In particular, PFOS and several other PFAS of concern, which are likewise moderately hydrophobic and poorly metabolizable substances, may not biomagnify extensively in aquatic food webs because of efficient respiratory elimination to water via gills (Kelly et al., 2009; De Silva et al., 2020). Conversely, these substances can biomagnify to a high degree in food webs containing air-breathing animals because elimination of these substances via lung–air exchange is negligible.
PFOS is the dominant PFAS in apex predators, with an average proportion of approximately

P.O. Box 400, FI-00121 Helsinki, Finland | Tel. +358 9 686180 | echa.europa.eu
146
60%, and the proportion of PFOS in many cases (>25%) is above 80%. Meanwhile, long-chain PFCAs (C9-C14) are major PFASs in apex predators as well (Y. Chen et al., 2021).
The contribution of PFAA precursors to field-based measurements of BAFs represents a major gap in understanding of PFAS bioaccumulation. For example, one study noted higher than expected accumulation of PFCA with 5 and 6 carbons in marine plankton from the northwestern Atlantic and posited that this reflects the accumulation of degraded precursor compounds (Zhang et al., 2019). Another study that included liver tissues from marine mammals from the same region found a large fraction (30–75%) of unidentified organofluorine (Spaan et al., 2020).
Conclusion: As outlined in the monitoring section (B.4.2) analyses of biota at different trophic levels of the ecosystem show clearly that many PFASs bioaccumulate and biomagnify to high concentration levels in top predator animals. Comparison of laboratory BCFs with field BAFs revealed that in most cases the BAFs are greater than their corresponding BCFs likely due to multiple exposure pathways in wildlife. Avian and marine mammalian food webs exhibit the highest reported TMFs for PFAA while in aquatic piscivorous food webs TMFs tend to be much lower. In particular, PFOS and several other PFAS of concern, which are likewise moderately hydrophobic and poorly metabolizable substances, may not biomagnify extensively in aquatic food webs because of efficient respiratory elimination to water via gills but can biomagnify to a high degree in food webs containing air-breathing animals because elimination of these substances via lung–air exchange is negligible.
B.4.3.7. Substance specific bioaccumulation data
Bioaccumulation of long chain (C8-C14) PFCAs and (C6-C8) PFSAs
C8-C14 PFCAs and C6-PFSA as well as the ammonium and sodium salts of C9-PFCA and C10-PFCA, the ammonium salt of C8-PFCA, and the salts of C6-PFSA are listed as substances of very high concern on the REACH Candidate List. C8-PFSA (PFOS) its salts and perfluorooctane sulfonyl fluoride (PFOS-F) are included in the Annex B to the Stockholm Convention on Persistent Organic Pollutants. C11-C14 PFCAs has been assessed to fulfil the vB-criterion of REACH Annex XIII. C8-C10-PFCA, as well as their salts meet the B-criterion (vB not assessed). C6-PFSA has been assessed to meet the vB criterion of REACH Annex XIII. PFOS and its salts have been assessed to meet the POP criterion for bioaccumulation due
to its potential to bioaccumulate and biomagnify in mammals and piscivorous birds Details of the assessment can be found in the supporting documentation of the listing in the Candidate List. Most PFASs, do not follow the behaviour of traditional hydrophobic compounds with partitioning into fatty tissues, but instead bind to proteins in blood and liver. The long elimination half-lives in humans of C10-PFCA (>4 years), C9-PFCA (>1.7 years), C8-PFCA (>3.5), and C6-PFSA (>8.5 years), together with the observed bioaccumulation in other air- breathing mammals lead to the conclusion that these substances are bioaccumulative according to the annex XIII of REACH (ECHA, 2013; ECHA 2015c, ECHA, 2016b; ECHA, 2017). Bioaccumulation of short-chain (C4-C6) PFCAs and (C6-C8) PFSAs and C7 PFCA
For the shorter chain PFCAs and PFSAs no bioconcentration in aquatic organisms due to uptake from the aqueous phase by diffusion via the gills is expected (ECHA, 2018b). Due to their high water solubility SC-PFAAs are, unlike C8-C10-PFCAs and C6-PFSA, expected to be quickly excreted via gill permeation. Martin et al. (Martin et al., 2003b, 2003c) conducted a bioconcentration and a biomagnification study with Oncorhynchus mykiss. Both studies investigated a homologous series of perfluoroalkyl carboxylates and sulfonates. Carboxylates

P.O. Box 400, FI-00121 Helsinki, Finland | Tel. +358 9 686180 | echa.europa.eu
147
and sulfonates with perfluoroalkyl chain lengths shorter than eight and six carbons, respectively, could not be detected in most tissues and were considered to have insignificant bioconcentration factors (BCF).
SC-PFCAs and SC-PFSAs are to some extent bioaccumulative in air breathing organisms, as far as this has been possible to assess. Elimination half-lives, which have been recently used for LC-PFAAs as a metric to estimate bioaccumulation potential in air-breathing organisms, are shorter in comparison with long-chain homologues. Depending on the species, half-lives range from a couple of hours to several days in mammals (Chengelis et al., 2009; Gannon et al., 2011; Numata et al., 2014) and up to over a month-almost a year in humans (e.g. Russell et al., 2013; see toxicokinetic section B.5.1) Bioaccumulation of cyclic PFAAs
Silva et al., (2011) estimated the Bioaccumulation factors (BAFs whole-body) for lake trout and Walleye (Sander vitreus), of several PFAAs, including PFECHS based on the ratio of fish to water concentrations measured in samples from the Great Lakes. The mean log BAF (whole body homogenate, wet weight) values for fish corresponded to 2.8 for PFECHS, 2.1 for PFOA, and 4.5 for PFOS. BAFs are calculated with the assumption that the concentration of the pollutant observed in the fish is the result of exposure to the same pollutant in the water and diet. As such, if the pollutant in the fish is the result of biotransformation of a precursor, then the resulting BAF may be an overestimate. It is not probable that the fishes could have been exposed to precursors to PFECHS, as no precursors to this substance are known. A trend in tissue/blood ratios (liver > kidney > bladder > muscle) was observed for PFECHS, PFPCPeS, br-PFOS, lin-PFOS, and F-53B suggesting that these compounds share similar mechanisms for uptake and distribution in the body (Wang et al., 2016). Overall, the trend of mean Log BAFwhole-body F-53B (4.6) ≈ lin-PFOS (4.6) > br-PFOS (3.8) > PFECHS (2.7) > PFPCPeS (1.9) appeared to follow the hydrophobicity pattern, with lowest BAF for the less hydrophobic cyclic PFAAs. Isomer-specific differences in the tissue/blood distribution ratios and BAF whole‐body for PFECHS and PFPCPeS indicate that ring structure and position of the sulfonic acid group affect the bioaccumulation potential. No studies of the biomagnification or trophic magnification of PFECHS or other cyclic PFAAs have been identified. Bioaccumulation of PFECAs and PFESAs
Few laboratory studies are available on the bioaccumulation potential of PFECAs in fish (see Table B.31); additional data on field studies for HFPO-DA are presented in the Annex XV dossier on the proposal for identification of HFPO-DA as a substance of very high concern (ECHA, 2019). According to the SVHC support document for HFPO-DA (ECHA, 2019) the BCFs for HFPO-DA are below 2000. Based on the structural similarities with PFOA, it can be expected that bioaccumulation factors are higher at low environmental concentrations. Although bioaccumulation of HFPO-DA is still low at these environmental concentrations, fish consumption could be a relevant exposure route for humans as it is for PFOA (ECHA, 2019). Chlorinated polyfluoroalkyl ether sulfonic acid (Cl-PFESA) is regarded as a Chinese perfluorooctane sulfonate (PFOS) alternative with a commercial name of F-53B, in which the main component is 6:2 Cl-PFESA with its two homologues (8:2 and 10:2 Cl-PFESA) as impurities (Jin et al., 2020). Shi et al., (2018) recently reported on the first detection of F-53B in biological samples and determined the tissue distribution and whole body bioaccumulation factors (BAFwhole body) in crucian carp (Carassius carassius). Tissue/blood ratios showed that distribution of F-53B primarily occurs to the kidney, gonad, liver, and heart. Median Log BAFwhole body values for F-53B exceeded regulatory bioaccumulation criterion and were significantly higher than those of PFOS in the same data sets. On the basis of its apparent omnipresence and strong bioaccumulation propensity, it was hypothesized that F-53B could explain a significant fraction of previously unidentified organofluorine in biological samples from China. However, no laboratory study on the bioaccumulation of F-53B is

P.O. Box 400, FI-00121 Helsinki, Finland | Tel. +358 9 686180 | echa.europa.eu
148
available. Table B.31. Summary of bioaccumulation studies in fish according to OECD 305 for HFPO- DA, EEA-NTH and ADONA (SVHC dossier for HPFO-DA, ECHA CHEM 2021).

P.O. Box 400, FI-00121 Helsinki, Finland | Tel. +358 9 686180 | echa.europa.eu
149
Test substance
Method Results Reliability
Reference
EEA-NH4 EC: 700-323-3
Cyprinus carpio Aqueous (freshwater) flow-through; Concentrations tested: 2 and 20 μg/L Total uptake duration: 28 d Details of method: None OECD Guideline 305
BCF: <= 0.59 dimensionless (whole body ww) (kinetic) (concentration 20 μg/L) (The concentration in fish was below the detection limit.) BCF: <= 5.8 dimensionless (whole body ww) (kinetic) (concentration 2 μg/L) (The concentration in fish was below the detection limit) Lipid content: 2.43 % (start of exposure) 2.48 % (end of exposure)
1 (key study)
Registration dossier
ADONA EC: 480-310-4
Cyprinus carpio Aqueous (freshwater) flow-through; Total uptake duration: 34 d OECD Guideline 305
BCF: 0.094 whole body ww (Time of plateau: 34 d) (steady state) (34d BCF of ADONA at a concentration of 0.1 mg/L active ingredient was 0.094 ± 0.0071.)
1 (reliable without restriction) key study experimental result
Registration dossier
HFPO-DA EC: 700-242-3
Cyprinus carpio Aqueous (freshwater) flow-through; Total uptake duration: 28 days; A depuration phase was not conducted. Japanese new chemical substance testing guidelines which are similar to USEPA OPPTS, 850.1730 and OECD TG 305 test guidelines.
HFPO-DA could not be detected in fish at none of the two concentrations tested (<0.55 mg/kg), which resulted in BCF values <30 and <3 L/kg. Concentrations tested 20 and 198 mg/L Average lipid content of the fish was 3.3% at test initiation and 3.8% at test end
1 (reliable without restriction)
(Hoke et al., 2016)
Ammonium difluoro{[2,2,4,5-tetrafluoro-5-(trifluoromethoxy)-1,3-dioxolan-4-yl]oxy}acetate EC: 682-238-0
Oncorhynchus mykiss (Rainbow trout); Aqueous (freshwater) flow-through; Total uptake duration: 17 days; Total depuration duration: 7 days OECD 305 test guidelines
No uptake of the substance was observed. Therefore, no uptake / depuration rates and no bioconcentration factors (steady state and kinetic, respectively) have been calculated. Bioconcentration factors at any sampling date during the uptake phase have been calculated based on fish body weight. No depuration rates were calculated since no uptake was observed.
1 (reliable without restriction)
Registration dossier
GX903 2,3,3,3-tetrafluoro-2-(heptafluoropropoxy)propionic acid
Cyprinus carpio (Carp); Aqueous exposure Total uptake phase: 36 days; Total depuration phase: 28 days According to OECD TG 305, under GLP
The reported steady-state BCF values were 8, 7, 2 ,1 and 1 L/kg for the increasing nominal exposure concentrations of 0.01, 0.1, 1, 10 and 100 µg/L. Short-comings: Low exposure concentrations; exposure concentrations were not maintained within ±20% of the mean measured concentrations; cross-contamination
2 / 3 ???
Goodband 2019

P.O. Box 400, FI-00121 Helsinki, Finland | Tel. +358 9 686180 | echa.europa.eu
150
The available data indicate that bioconcentration factors and bioaccumulation factors (BAF) are low for shorter chain PFECAs. Similarly, as for LC-PFCAs, it can be expected that PFECAs with more than the seven perfluorinated carbons would show a higher potential for bioconcentration. However, there are no bioconcentration studies available for longer chain PFECAs.
The only PFESA that has been commercialised is 6:2 Cl-PFESA, the major component of F-53B, a substitute of PFOA used for decades in China in the chrome plating industry. In a Chinese field bioaccumulation study 6:2 Cl-PFESA (substitute of PFOS) was detected in the tissues (kidney, gill, muscle, brain, heart, gladder, gonad, liver) and blood of all sampled Crucian carp (n=43) from two different locations (Shi et al., 2015). The median Log BAFwhole
body (L/kg, ww) values for 6:2 Cl-PFESA ranged from 3.80 to 5.23.
Wang et al., (2016) conducted a study on the bioaccumulation factors and tissue distribution of F-53B and other PFAAs in Crucian carp (Carassius carassius) downstream of the Beijing Airport in China. The median concentration for F53-B was highest in blood (11.42 ng/g ww) followed by kidney (10.02 ng/g ww), liver (8.73 ng/g ww) and bladder (8.54 ng/g ww) and lowest in muscle (1.75 ng/g ww). The mean concentration in the surface water for the sampling sites ranged from <MLQ to 5.32 ng/L. The median Log BAFwhole body (L/kg, ww) for F-53B was 4.59.
In another Chinese field study (Chen et al., 2018) 6:2 Cl-PFESA was detected in muscle tissue invertebrates, fishes, seabirds and mammals collected from the Bohai Sea (n=152, detection frequency of 81,3%). The logarithm BAFs of 6:2 Cl-PFESA reported in this study for fish were in the range of 2.41–3.80, with an average value of 3.00, which is about one order of magnitude than the values reported by Shi et al. (2015) in freshwater crucian carp. Chen et al., (2018) estimated the value for trophic magnification factor (TMF) for 6:2 Cl-PFESA was 3.94 in the studied marine foodweb, indicating the potential for this substance to biomagnify in the marine food chain. A first report of a field study of the estuarine food web of the Xiaoqing River, China measured PFECAs and other PFAS in water, sediment, plankton, bivalves, crustacean, gastropods and fish (Li et al., 2021). Highest concentrations in water samples were measured for PFOA, PFO2HxA, PFMOAA, PFO3OA, HFPO-TrA, and HFPO−DA. The highest concentrations in biota were observed for PFMOAA and HFPO-TrA. The detection frequency of PFMOAA was 100% with highest concentrations found in gastropods in a range of 15900−16700 ng/g dw. HFPO-TrA was found at a detection frequency of 100% with highest concentrations in crustacea in a range of 20.9−138 ng/g dw and fish in a range of 11.9−188 ng/g dw. Logarithmic BAFs were 1.15 ± 1.06 for PFMOAA and 0.65 ± 0.67 for HFPO-TrA. The authors found that BAFs values of PFECAs were dependent on carbon chain length and increase with longer chains. Trophic magnification was observed for HFPO-TrA (TMF = 5.25), HFPO-TeA (TMF = 2.95), PFO5DoA (TMF = 5.62), HPFMO2OSA (TMF = 2.69) and PFOS (TMF = 1.62). Based on BAFs, long chain PFECAs are expected to accumulate to a greater extent than short-chain PFECAs.
Bioaccumulation of PFPiAs and PFPAs
Bioaccumulation potential of PFPiAs and PFPAs has been assessed under IMAP (2018), and a review of available data their bioaccumulation has also been done by Wang et al. (2016), which are summarised below: Similar to other PFAAs, PFPAs and PFPIAs, do not follow the behaviour of traditional hydrophobic compounds with partitioning into fatty tissues, but instead have high affinities for proteins (i.e., they are proteophilic) and they tend to partition to protein-rich tissues (Ng and Hungerbühler, 2014). In a bioconcentration study conducted according to OECD TG 305 (Chen, et al., 2016), zebrafish were exposed to a technical mixture of PFPAs (C6-10 PFPAs) and PFPiAs (C6/C6, C6/C8, C8/C8, C6/C10, C8/C10, C6/C12 PFPiAs). Measured bioconcentration factor (BCF) values indicated that PFPiAs had very high bioconcentration potential, with a lowest measured whole-body BCF for C6/C6 PFPiA (12 perfluorinated carbons) of 41700 L/kg, meeting the B and vB criteria of REACH Annex XIII. The study suggests that aqueous exposure will result in a high bioaccumulation potential of longer chain PFPiAs in gill-breathing organisms. It is noted that the results from this study

P.O. Box 400, FI-00121 Helsinki, Finland | Tel. +358 9 686180 | echa.europa.eu
151
appear to follow the same pattern as observed for PFCAs, where the total number of the perfluoroalkyl carbons is indicative of the bioaccumulation potential in gill breathers. The results should, however, be considered indicative only of the expected aquatic bioconcentration pattern.
In a biomagnification study, dietary exposure of a mixture of C6/C6, C6/C8 and C8/C8 PFPiAs in juvenile rainbow trout gave biomagnification factors (BMF) of less than one for each congener (Lee, et al., 2012).
The bioconcentration and biomagnification potential of PFPAs were also investigated in the studies discussed above (Chen, et al., 2016, Lee, et al., 2012). PFPAs were found to have low bioconcentration potential in zebrafish when exposed to the technical mixture of PFPAs and PFPiAs, with a measured whole-body BCF of 204 L/kg for C10 PFPA (Chen, et al., 2016) which is below the numerical criteria 2000/5000 of REACH annex XII for B and vB. BCF values in plasma (67 L/kg), liver (1400 L/kg), muscle (80 L/kg) and ovary (200 L/kg) were also reported.
Conclusion: By now, C11-C14 PFCAs and C6-PFSA have been shown to fulfil the vB-criterion and C8-C10-PFCA the B criterion of REACH Annex XIII. For the shorter chain (SC) PFCAs and PFSAs no high bioconcentration factors in aquatic organisms due to uptake from the aqueous phase by diffusion via the gills is expected (ECHA, 2018b). However, SC-PFCAs and SC-PFSAs are to some extent bioaccumulative in air breathing organisms, as far as this has been possible to assess. Due to the binding to serum albumin the blood estimation of true bioaccumulation potential of SC-PFASs is not possible with conventional methods related to lipid adsorption. Currently no systematic approach for assessing bioaccumulation potential in particular for air-breathing species for this kind of substances is available. Studies on the bioaccumulation factors and tissue distribution of F-53B and other PFAAs in fish indicate that F-53B and p-perfluorous nonenoxybenzenesulfonate (OBS) are in the range of fulfilling the B/vB criteria of Annex XIII to REACH. No studies on the biomagnification or trophic magnification of PFECHS or other cyclic PFAAs have been identified. As for LC-PFCAs, it can be expected that PFECAs with more than the seven perfluorinated carbons will show a higher potential for bioconcentration. However, there are no bioconcentration studies available for longer chain PFECAs. Measured bioconcentration factor (BCF) values indicated that PFPiAs had very high bioconcentration potential, with a lowest measured whole-body BCF for C6/C6 PFPiA (12 perfluorinated carbons) of 41700 L/kg, meeting the B /vB criteria of REACH Annex XIII. Studies suggests that PFPiAs are B/vB in gill-breathing organisms. The investigated PFPAs were found to have low but not negligible bioconcentration potential in fish, as expected based on the total number of the perfluorinated carbons. However, it is finally noted that a low bioconcentration in gill breathing organisms and the accumulation in lipids is not the most relevant endpoint to consider for PFASs. It must be, however, noted that our current understanding of PFAS bioaccumulation and other hazards is based on a relatively small number of compounds, and little is known about the properties and behaviour of most of the thousands of PFAS as individual chemicals or as the much more commonly present complex mixtures.
B.4.3.8. Persistence compensating low bioaccumulation potential
As outlined in the Restriction Dossier (ECHA 2020), when considering persistence-based concerns, it is important that they are framed within an appropriate time scale. It is important to consider that accumulation in environmental media (water, sediment, soil, air) is a time-dependent process that depends on the rate of input (release, transport from other compartments, uptake in case of biota), rate of removal (degradation, transport to other compartments, elimination in case of biota; see also section on mobility B.4.2.1.3). Assuming a continuous release rate, the ultimate steady-state concentration reached in a given environmental compartment is a balance of these parameters (Crookes and Fisk, 2018). Accordingly, Crookes and Fisk (2018) investigated how the concentrations of mobile and persistent chemicals in the environment develop over time and compared their findings with

P.O. Box 400, FI-00121 Helsinki, Finland | Tel. +358 9 686180 | echa.europa.eu
152
the bioaccumulation criteria of the Stockholm Convention. They found that substances that are both persistent and mobile in the environment have the potential to be transported long distances from the point of emission. If such substances accumulate over time in the environment, they can reach levels that may have effects on both ecosystems and human health. With other words, persistence is the key for increase of environmental exposures whereas mobility in the environment (particularly the aquatic environment) that is a prerequisite for a rapid wide distribution and hence for a rapid wide exposure.
Crookes and Fisk (2018) modelled the expected time-trend for concentrations in biota of substances with a certain combination of half-life in water and bioconcentration factors, see Figure B.50 for the reproduction of their simulation below. Persistence in this model relates to the life-time in the relevant compartment, water, and degradation as well as sedimentation and other processes that remove the substance from the compartment is included in the P. The authors found that for a given mass emission rate, as the half-life increases, the steady state concentration predicted in biota for substances with relatively low BCF values can, over extended periods of time, approach that of a substance that is considered to have a high bioaccumulation potential, and the steady state concentration ultimately reached is a function of both the persistence and BCF.
Figure B.50. Reproduction of model for biota concentration development from Crookes and Fisk (2018). Impact of persistence on the concentration of a substance in biota in relation to bioaccumulation potential.
Arp et al. (2019) have discussed the quantifier of mobility with regard to the persistence criteria given under REACH. With regard to PFASs, which may remain in the environment for centuries, persistence gains more importance than the actual mobility. This has for instance been discussed by Gellrich et al. (2012). This study observed that in groundwater, PFASs with short-chain lengths (<7 fluorinated carbon atoms) predominate in concentrations. However, the concentrations of PFOA and PFOS, i.e longer chained and more adsorptive in water and other environmental matrices, are likely to increase because of (1) the continuous desorption of PFOS and PFOA that are still bound to soil particles, and (2) the slow transformation of precursors of these compounds in environmental compartments (Frömel and Knepper, 2010). Model results (unit-world model) show the higher the persistence of a chemical, the longer the time-to-steady state, the higher the steady-state concentrations, and the greater the overshoot and long-lasting contamination tail at the end of the emissions irrespective of the values of the partition coefficients (Cousins 2019).
Conclusion: Substances that are both persistent and mobile in the environment have the

P.O. Box 400, FI-00121 Helsinki, Finland | Tel. +358 9 686180 | echa.europa.eu
153
potential to be transported long distances from the point of emission. If such substances accumulate over time in remote regions they can reach levels that may have effects on both ecosystems and human health. when the model from the Crookes and Fisk (2018) report is used for PFAS, the concentrations of very persistent and mobile subgroups in biota may be expected to ultimately exceed the biota concentrations for a persistent and bioaccumulative
B.4.4. Enrichment in plants
Many PFASs are highly water soluble, and are thus easily absorbed, transferred and to a certain degree also bioaccumulated in plants (Zhang et al., 2021b, Zhang et al., 2020a, Brown et al., 2020). Consumption of PFASs-contaminated agricultural products represents a feasible pathway for the trophic transfer of these toxic chemicals along food webs, leading to risks associated with human and animal health (Wang et al., 2020a). Considering that agricultural crops constitute a major portion of livestock and human diets, consumption of the PFASs-laden food represents an important route responsible for the accumulation of PFASs in animals and humans (Pérez et al., 2014, Brambilla et al., 2015, Blaine et al., 2014a).
Root uptake from nutrition matrixes and foliar absorption from atmosphere are two prevailing pathways for organic chemicals transported to plants (Paterson et al., 1994, Collins and Finnegan, 2010). The volatile or particle-bound PFASs precursors can be absorbed via plant leaves from air and subsequently metabolized into PFCAs and PFSAs (Ghisi et al., 2019). For instance, Tian et al. (2018) demonstrated that foliar uptake of PFASs from the atmosphere was an important exposure route for Chinese pine (Pimus tabulaeformis Carr.), oriental plane (Platanus orientalis Linn), and white poplar (Populusalba) surrounding the landfill sites.
Consumption of plant material, e.g. grains and vegetables either as roots or above ground plant parts, function as source of PFASs to humans. This is of relevance for example when agricultural soil is contaminated with PFASs, leading to the contamination of agricultural plants. Via plants, PFASs enter the food chains of humans and animals.
Several studies investigated the uptake of PFASs from the surrounding environment into plants (e.g. agricultural crops, vegetables). An overview of the studies and further details on the studies as well as results can be found in Table B.32). The studies were conducted under strictly controlled laboratory conditions, under semi-natural conditions and under environmental conditions (field studies). The results of the studies are not directly comparable due to the different conditions (e.g. hydroponic systems, soil systems, varying exposure times, plant physiology etc.). Furthermore, the uptake and accumulation of PFASs in plants may be affected by various abiotic and biotic factors, e.g. soil properties like pH, temperature, salinity, organic carbon and clay content (Wang et al., 2020b, Jiao et al., 2020b).
Most of the studies have been focused on PFCAs and PFSAs (e.g. (Felizeter et al., 2012, Felizeter et al., 2014, Krippner et al., 2014, Wen et al., 2014, Zhang et al., 2019b)) but enrichment in plants was also investigated for other PFASs like diPAPs, FTOHs, fluorotelomer sulfonic acids, perfluoroalkyl phosphinic acids or perfluoro alkyl ethers (Bizkarguenaga et al., 2016, Lin et al., 2020b, Yoo et al., 2011, Zhang et al., 2021a, Zhou et al., 2020). The uptake of PFASs in plants depends on several parameters, e.g. carbon chain length, functional group, plant species, lipid and protein content, soil and water characteristics, transpiration streams, etc. (Brandsma et al., 2019).
Bioaccumulation factor (BAF, ratio of contaminant concentration in plant to growth matrix) is commonly used to characterize the uptake and translocation efficiency of organic compounds in plants (Jiao et al., 2020a).
PFAS bioaccumulation factors (BAF) for 37 agricultural plant species were reviewed by Lesmeister et al. (Lesmeister et al., 2021). The review compiles soil-to-plant BAFs for 45 PFASs from 24 studies. Most studies suggest that BAFs depend on the hydrophobicity of the PFASs. The BAFs were higher for vegetative plant parts than for reproductive and storage

P.O. Box 400, FI-00121 Helsinki, Finland | Tel. +358 9 686180 | echa.europa.eu
154
organs. In hydroponic studies (plants grown in nutrient solution instead of soil) the root-BAFs either increased with increasing chain length or showed a u-shaped dependency with minima for C6 or C7 PFAAs. The root-BAFs of C2 and C3 PFCAs were one or two orders of magnitude higher than for all other investigated PFCAs. Contrary to the observations in hydroponic studies, root-BAFs based on soil concentrations show only very low or no chain length dependency or they decreased with increasing chain length. The BAF for other vegetative compartments and reproductive organs decreased with increasing chain length. This was also true if root-BAFs did not show this correlation and was independent of the type of study (culture in hydroponic solutions or soil). Combining all shoot-BAFs per single PFCA (C4-C14) and PFSA (C4-C10), median log BAFs decreased by -0.25(±0.029) and -0.24(±0.013) per CF2 group increasement (note: experimental conditions in the studies were quite heterogeneous in terms of plant species, plant parts, soils, PFASs etc.). Lesmeister et al. also investigated the effect of functional groups on BAFs. Compared to the chain length, functional head groups have lesser impact on the transfer. The presence of precursor can complicate the calculation of BAFs for individual compounds as it often is unclear if precursors have been transformed in the soil or in the plant after uptake.
The observations from Lesmeister et al. are similar to the ones reported in other reviews (Costello and Lee, 2020, Mei et al., 2021, Wang et al., 2020b, Ghisi et al., 2019). For example, Mei et al. also identified a significant and positive correlation for PFASs between the root concentration factor (RCF) and hydrophobicity (log Kow) under hydroponic conditions, whereas for PFCAs u-shaped relationships between the RCF and chain length were occasionally observed. Soil cultural experiments show no significant correlation between RCFs and hydrophobicity (log Kow) of PFASs. The translocation factor (ratio of concentration in aboveground tissues to that in roots) decreases with increasing chain length, regardless of whether plants were grown hydroponically or in soil. PFASs with a small molecular size and low hydrophobicity may be preferentially translocated. Furthermore, the translocation potential of branched isomers could be higher than those of linear isomers due to the higher hydrophilicity of branches isomers.
Similarly, (Li et al., 2022) recently compared the bioaccumulation pattern of PFASs among different plant species (e.g., cereals, vegetables and fruits) growing on contaminated soil. Among different kinds of vegetables, the BAFs for PFBA and PFOA in leafy vegetables were the highest, followed by fruit vegetables and root vegetables (see monitoring section B.4.2.4). BAFs for PFBA and PFHpA in cabbage were the highest, while high BAFs for PFPeA, PFHxA, and PFOA were found in sponge gourd, sweet pepper, and zucchini, respectively.
Based on the large variety in chemical structure and physico-chemical properties of the different PFASs their uptake, distribution and accumulation in plants varies widely. For instance, at the tissue level, PFOA and PFOS are transported from the nutrient solution to the plant root cortex via both apoplastic and symplastic route (Li et al., 2022). At the cellular level, PFOA and PFOS were accumulated in cell walls, various root cell organelles (e.g., Golgi apparatus, cytoplasm, cell nucleus, and chondriosome), and intercellular space in the cortex (Li et al., 2022). Generally, the accumulated short-chain PFASs (e.g., PFBA, PFPeA, PFHxA, PFBS) were more concentrated in the vegetative compartments than in the storage organs with TFshoot/root higher than unity (Lechner and Knapp, 2011). The root may be the main organ for bioaccumulation of other PFASs with TFshoot/root lower than unity (Costello and Lee, 2020). Further information on the translocation and bioaccumulation principles of PFASs in plants can be found from Zhou et al. (2021)
Recent research on exposure routes, bioaccumulation and toxic effects of PFASs on plants shows that bioaccumulation of PFASs in plants from contaminated sites varied extremely (review by Li et al., 2022). The reported log BAF values in the review by Li et al. (2022) range in general between 0 and 1 indicating potential to transfer from soil to plant. High accumulation of some PFASs is indicated also by the study by Blaine et al. (2013), where the accumulation of PFCAs (C5-C10) and PFSAs (C4, C6, C7, C8, C10) was investigated in lettuce and tomato grown on biosolid-amended soils. The reported BAFs (lettuce, municipal soil) in

P.O. Box 400, FI-00121 Helsinki, Finland | Tel. +358 9 686180 | echa.europa.eu
155
this study ranged between 0.19 – 28.4 and BAFs (lettuce, industrially impacted soil) between 0.52 – 56.8 (C10 PFDS < LOQ). The greatest accumulation was seen for C4 PFCA. Another study with plants from biosolid-amended fields (Yoo et al., 2011) reports the highest accumulation factor among all measured PFASs (PFCAs, PFSAs, FTOHs) for PFHxA, with a grass/soil accumulation factor of 3.8. Accumulation potential decreased logarithmically with increasing chain length.
Furthermore, root and leaf BCFs have been studied for several perfluoroalkyl carboxylic acids (PFCAs) and perfluoroalkane sulfonic acids (PFSAs) in two aquatic plant species, including one submerged species (Echinodorus horemanii) and one free-floating species (Eichhornia crassipes) (Pi et al. (2017)). Long-chain perfluorotetradecanoic acid (PFTeDA, 12 C) and per-fluorotridecanoic acid (PFTrDA, 13C) exhibited whole-plant BCFs of 865 and 1280 L/kg, respectively, while lower BCF values were observed for PFASs with the perfluoroalkylchain length below 9. The enrichment of HFPO-DA (substance of the group of perfluoro alkyl ethers) in plants has also been discussed in the support document for identification of HFPO-DA as a SVHC (European Chemicals Agency, 2019). It was summarized that HFPO-DA may enrich more strongly in plants than PFOA and may be more comparable to short-chain PFCAs. Due to the uptake observed in vegetables and fruits, consumption of these by humans and wildlife may contribute to the total exposure to HFPO-DA. The distribution of five selected PFAS-ether (HFPO-DA, ADONA, PFMOPrA, PFMOBA, F-53B) in longhair sedge was investigated by Zhang et al. (Zhang et al., 2021a). All PFAS-ether were taken up by plant roots and translocated to shoot. The highest translocation factor was observed for HFPO-DA. Only F-53B had a translocation factor < 1. Which was explained by the relatively higher hydrophobicity and lipophilicity compared to the other PFAS-ether. The environmentally relevant concentrations of PFASs rarely lead to obvious phenotypic/physiological damages in plants, but markedly perturb some biological activities at biochemical and molecular scales (review by Li et al., 2022). PFAS exposure induces the over-generated reactive oxygen species and further damages plant cell structure and organelle functions. A number of biochemical activities in plant cells are perturbed, such as photosynthesis, gene expression, protein synthesis, carbon and nitrogen metabolisms.
Conclusion: Studies on accumulation of PFASs in plants are lacking for the majority of PFASs. However, several studies provide evidence that plants accumulate many PFASs to levels which exceed the expected levels based on equilibrium partitioning. Laboratory tests and field data indicate that short-chain PFASs accumulate in above-ground plant parts, while long-chain PFASs accumulate in roots and show lower translocation factors to the above-ground plant parts. This is influenced by the higher water solubility, lower molecular size and lower hydrophobicity of the short-chain PFASs. The transfer rates of PFASs in decrease from roots to leaves to fruits, due to natural barriers within the plants. Most of the laboratory studies focused on PFCAs and PFSAs but enrichment in plants was also investigated for other PFASs like diPAPs, FTOHs, fluorotelomer sulfonic acids, perfluoroalkyl phosphinic acids or perfluoro alkyl ethers. The reviewed laboratory studies suggest that bioaccumulation factors (BAFs) depend on the hydrophobicity of the PFASs and are higher for vegetative plant parts than for reproductive and storage organs. Root-BAFs either increase with increasing chain length or show a u-shaped dependency with minima for C6 or C7 PFAAs. Based on the various chemical structures and associated physico-chemical properties of different PFASs, their accumulation behaviour varies considerably. Particularly 6:2 Cl-PFESA has been shown to accumulate in plants but studies on accumulation of PFASs in plants are generally lacking for the majority of subgroups. In summary, although it is challenging to make a direct comparison among studies in the scientific literature due to differences in sampling and reporting, laboratory and field data indicate PFAS have the property to enrich in plants, but it remains

P.O. Box 400, FI-00121 Helsinki, Finland | Tel. +358 9 686180 | echa.europa.eu
156
unclear if all substances/subgroups may have this property as for the majority of PFAS data are lacking. With regard to the measured levels of PFASs in plants it can be concluded that plants are widely exposed to PFASs. The exposures lead to enrichment and high concentrations of certain PFASs in different parts of the plants. Consumption of PFASs-contaminated agricultural and other plant products represents an efficient pathway for the trophic transfer of PFASs along food webs.

P.O. Box 400, FI-00121 Helsinki, Finland | Tel. +358 9 686180 | echa.europa.eu
157
Table B.32. Uptake of PFASs in plants Method Plant species
(plant parts) substances
Results Reference
Hydroponic studies
climate chamber
(100 µg/L of each individual PFAA per litre of nutrient solution at pH 5, pH 6 and pH 7);
analysis of plant material after 5 days of exposure
maize (Zea mays)
(root, shoot)
PFCAs (C4-C10)
PFSAs (C4, C6, C8)
All PFAAs reached the shoot of maize plants Uptake rate by roots: of all PFCAs C4 PFCA had the highest mean uptake
rate; of all PFSAs C8 PFSA had the highest mean uptake rate Shoot:root ratio decreased with increasing carbon chain: Short-chain PFAAs
are transferred predominantly and at higher concentrations to the shoot (shoot:root ratio >2). Long-chain PFAAs increasingly accumulated in the roots with increasing carbon chain (shoot:root ratio < 1)
(Krippner et al., 2014)
greenhouse – hydroponic system
(PFAA-spiked nutrient solution with nominal concentration of 10 ng/L to 10 µg/L of each spiked PFAA)
lettuce (Lactuca sativa)
(root, foliage)
PFCAs (C4-C14)
PFSAs (C4, C6, C8)
Root concentration factors (RCF) for PFSAs increased with increasing carbon chain length
RCF for PFCAs decrease with increasing carbon chain length from C4 to C6, then increase between C6 and C11 and are quite similar for C11 to C14 (U-shaped relationship with chain length)
Foliage to root concentration factor (FRCF) for PFAAs decreased exponentially with increasing carbon chain length (FRCF > 1 for C4 and C5 PFCAs)
Translocation of PFAAs from root to foliage can by described by transpiration stream concentration factor (TSCF) (assumption: substance is not degraded in the plant, elimination from the plant is negligible, substance is only taken up through roots). Except for C4 PFCA (TSCF ~ 0.8) the TSCF values were less than 1, which means that transfer from nutrient solution to leaves was inhibited. No simple relationship between the TSCF and carbon chain length of PFAAs could be observed.
(Felizeter et al., 2012)
greenhouse – hydroponic system
(PFAA-spiked nutrient solution
tomato (Solanum
lycopersicum var.
PFCAs (C4-C14)
RCFs increased with increasing chain length and were highest for long-chain PFCAs (≥ C11) in all three plant species. RCFs were a factor of about 2-3 higher for PFSAs than for PFCAs (with same carbon chain)
Higher stem concentration factors were observed for C8-C11 PFAAs (sharp decrease of stem concentration factors ≥ C11 PFCAs)
(Felizeter et al., 2014)

P.O. Box 400, FI-00121 Helsinki, Finland | Tel. +358 9 686180 | echa.europa.eu
158
with nominal concentration of 10 ng/L to 10 µg/L of each spiked PFAA)
Moneymaker), cabbage (Brassica
oleracea convar. capitata var. alba) and zucchini (Cucurbita pepo var. Black Beauty)
(root, stem, leaf, twig, and edible parts)
PFSAs (C4, C6, C8)
Leaf concentration factor were in all plant species > 1 (except long-chain PFCAs). Compared with the concentration factors of the other aboveground parts of the plants, the leaves show the highest concentration factors for most of the PFAAs.
Edible part concentration factor (cabbage head, tomato and zucchini fruit) were highest for the short-chain PFCAs and decrease with increasing chain length. No concentrations were detected above LOQ for C12-C14 PFCAs. ECF was > 1 for C4-C6 PFCAs in cabbage and tomato and for C5 PFCA in zucchini
All other PFAAs than C12-C14 PFCAs were present in the above ground plant parts. They are taken up with the transpiration stream and accumulate primarily in the leaves. Distribution within the plants were similar between plant species and among PFAAs.
Transpiration stream concentration factor was < 1 for all compounds in all plant species, which means transfer from the nutrient solution to the vegetative parts of the plants was inhibited.
All edible part /leaf transfer factor factors were < 1, which indicates that leafy crops with open leaves (spinach or some lettuce) accumulate higher amounts in the edible part than fruit-bearing crops. Leafy crops pose a higher risk for human exposure.
semi-static mesocosm study (exposure phase 14 days, depuration period 14 days, individual PFAA concentration = 20 µg/L)
aquatic macrophytes:
Echinodorus horemanii (submerged species) and Eichhornia
crassipes (free-floating species)
PFCAs (C5-C14)
PFSAs (C4, C6, C8)
BCFs increased with increasing carbon chain length Higher BCFs for PFSAs compared to PFCAs with identical chain length Leaf: BCF = 16.6 – 835 (E. horemanii), BCF = 21.2 - 349 (E. Crassipes)
(higher leaf BCF in submerged species) Root: BCF = 3.5 – 1620 (E. horemanii), BCF = 3.1 - 2590 (E. Crassipes) Whole-plant: BCF = 13.7 – 910 (E. horemanii), BCF = 18.8 - 1280 (E.
Crassipes) Translocation factors (TF): After exposure phase only C4 PFSA, C5 PFCA and
C6-PFCA allocate more in leaf compared to roots (TF > 1) in both species. At the end of depuration phase additionally C6 PFSA, C7 PFCA and C8 PFCA were observed to be more allocated in leaf than in roots. During exposure phase TFs were generally higher for the submerged species compared to the free-floating specie (except for C5 and C6 PFCA). During depuration phase TFs were higher in the free-floating species (except for C13 and C14 PFCA).
A sigmoidal relationship between BCFs and chain length as well as membrane-water distribution coefficient, protein-water distribution coefficient and organic carbon-water partition coefficient was observed.
(Pi et al., 2017)
greenhouse, water lettuce (Lactuca PFCAs (C4- PFAA plant concentrations increased linearly with the aqueous concentration (Blaine et

P.O. Box 400, FI-00121 Helsinki, Finland | Tel. +358 9 686180 | echa.europa.eu
159
augmented with varying concentrations of PFAAs (nominal 0.2 - 40 µg/L).
sativa) and strawberry (Fragaria ananassa)
(lettuce leaf and strawberry root, shoot, fruit)
C9)
PFSAs (C4, C6, C8)
of PFAAs PFCAs bioaccumulated to a greater degree than PFSAs Chain length dependency trends in lettuce shoot and strawberry fruit:
decreasing concentrations with increasing chain length In strawberry fruit concentrations for C7-C9 PFCAs and C6, C8 PFSAs were
below LOQ (suggestion that other specific transport mechanisms exist for long-chain PFAAs)
Strawberry: fruit-soil concentration factor (at 10 µg/L water concentration): C4 PFCA = 203, C5 PFCA 243, C6 PFCA 34.5 (overall average decrease of fruit-soil concentration factor per CF2 group was ~0.3 log units)
Lettuce: The BAFs for PFCAs decreased ~0.4 -0.7 log units per additional CF2 group. Dependent on organic carbon content of the soil the BAFs for PFCAs ranged from 0.938 to 3390 and for PFSA from 0.759 to 316 (at 10 µg/L water concentration)
Bioaccumulation potential depends on analyte functional group and chain length, concentration in the reclaimed water, and organic carbon content of the soil
al., 2014c)
greenhouse study, designed to assess PFAA phytoremediation (PFAA were added weekly to irrigation water (nominal 1 mg/L of each compound), 14 to 18-week establishment period, sand was used as growth media)
herbaceus plant species: amaranth (Amaranthus tricolor), mustard (Brassica juncea), bemudagrass (Cynodon dactylon), horsetail (Esquisetum hyemale), sunflower (Helianthus annuus), tall fescue (Schedonorus
PFCAs (C5, C6, C8)
PFSAs (C4, C6, C8, C10)
Highest BCF was observed for C5 PFCA (18.0 – 174.6 in herbaceous plant species, 0.3 – 156.2 in woody plant species) and lowest for C8 PFSA (0.7 – 5.5 in herbaceous plant species, 0.0 – 16.4 in woody plant species)
BCFs for PFCAs were higher than for PFSAs BCFs decreased with increasing chain length (except for C4 PFSA) BCF of the best performing tree species (based on foliage concentrations,
Salix nigra) were lower than BCF of the best performing herbaceous species (Festuca rubra) but were generally in the same overall range of the herbaceous plants.
(Huff et al., 2020)

P.O. Box 400, FI-00121 Helsinki, Finland | Tel. +358 9 686180 | echa.europa.eu
160
arundinaceus), red fescue (Festuca rubra)
and Crimson clover (Trifolium incarnatum)
woody plant species:
river birch (Betula nigra), green ash (Fraxinus pennsylvanica), sweetgun (Liquidambar styraciflua), tulip poplar (Liriodendron tulipfera), sycamore (Platanus occidentalis), loblollv pine (Pinus taeda), black willow (Salix nigra)
hydroponic model plant system (PFAA concentrations
wall cress (Arabidopsis thaliana)
PFCAs (C4- C10)
Rapid saturation of root concentration occurred for all PFAAs (except C4 PFCA). Shoot concentrations increased continuously.
RCFs and SCFs of PFCAs followed U-shaped trend with increasing chain length (highest for C4, C9 and C10 PFCAs). For PFSAs the RCFs and SCFs increased
(Müller et al., 2016)

P.O. Box 400, FI-00121 Helsinki, Finland | Tel. +358 9 686180 | echa.europa.eu
161
nominal 2 µg/L)
(root, shoot)
PFSAs (C4, C6, C8)
with increasing chain-length.
climate chamber - hydroponic system
(nutrient solution spiked with PFAAs at 0.5 mg/L and 1 mg/L; sampling after 1, 2, 6, 13 and 20 days)
grass (Bromus diandrus)
PFCAs (C4, C8, C10)
PFSAs (C4, C6, C8)
The transfer factor from nutrient solution to the aerial part of plant increased with exposure time for both concentration levels, except from day 13 to day 20 at the higher concentration level where no increasing transfer factor was observed.
For PFCAs the transfer factor decreased with increasing chain length. No statistical differences in transfer factor values were observed for PFSAs.
After 20 days transfer factors were highest for C4-PFCA, but all PFAAs were greater than 1 (2.036 – 5.65)
(Garcia-Valcarcel et al., 2014)
climate chamber -
hydroponic system
(1. time-dependent: nutrient solution spiked with each PFAA at 0.1 mg/L; sampling after 2, 4, 8, 6, 32 and 80 hours; 2. concentration-dependent: nutrient solution spiked with PFAA at 0, 0.1, 0.5, 0.7, 1.0, 1.5, 2.0, 2.5 mg/L; sampling after 4 hours;3. effect of metabolic, aquaporin and anion-channel
wheat (Triticum acstivnm L.)
(root, shoot)
PFCAs (C2-C4, C6, C8)
PFSA (C8)
Time-dependent uptake: All PFAAs were efficiently absorbed by wheat roots. C2 and C3 PFCAs were rapidly taken up within the 80-hour exposure period and no steady state was observed. The uptake rates of the C4-C8 PFAAs slowed during the late exposure period. The C8 PFAAs reached a steady state at the end of exposure period. Root concentrations of PFCAs decreased with increasing chain length, achieving a minimum at C6 PFCA, and then increased again with the chain length.
The concentrations in shoots were lower than in roots, except C4 PFCA. The final shoot concentration decreased with increasing chain length.
The translocation factors (concentration ratio shoot:root) were all less than 1 and declined with increasing chain length except for C4 PFCA (translocation factor = 1.1). The relatively low translocation factor for C2 and C3 PFCA could be a result due to their high concentrations in roots and the short exposure time (80 hours). Therefore, an increase is expected as the bioaccumulation proceeds for a longer time.
Concentration-dependent uptake: The uptake of PFAAs was nonlinear and followed Michaelis-Menden model well, indicating that the uptake is a carrier-mediated process.
The absorption of different types of PFAAs (PFCAs and PFSAs) and different chain lengths may follow different pathways in wheats. The uptake of PFAAs by wheat is mainly an energy-dependent active process, whereas for C2 and C3 PFCAs, anion channels and aquaporins also participate in the uptake
(Zhang et al., 2019b)

P.O. Box 400, FI-00121 Helsinki, Finland | Tel. +358 9 686180 | echa.europa.eu
162
inhibitors) process.
greenhouse study, hydroponic system exposed with three different solutions: effluents from two WWTPs (C4-C8 PFCAs and C4, C8 PFSAs detected in effluent) and a PFAAs-spiked drinking water solution (nominal concentration of 500 ng/L for each PFAA); exposure time: 45 (lettuce) and 55 (spinach) days
lettuce
(Lactuca sativa L.) and spinach (Spinacia oleracea L.)
(root, shoot)
PFCAs (C4-C14)
PFSAs (C4, C6, C8)
The root concentration factor showed similar pattern under different treatments. The root concentration factor values ranged from 5.4 (C4 PFSA) to 2400 (C11 PFCA) for lettuce and from 1.7 (C4 PFSA) to 1500 (C12 PFCA) for spinach, respectively. The root concentration factor was generally higher in lettuce than spinach. The values for PFCAs decreased from C4 to C6 and from C11 to C14, while it increased in the range between C6 and C11. For PFSAs the root concentration factor increased with increasing chain length.
The leaf concentration factor showed similar pattern under different treatments. The highest leaf concentration factor was observed for C4 PFCA (median values between 47 and 440) followed by C5 PFCA (49-64) and C6 PFCA (9.8-22).
The translocation factor from root to shoot decreased with increasing carbon chain length (except for C5 PFCA in spinach which has a higher TF than C4 PFCA). For lettuce, the translocation factor was > 1 only for C4 PFCA and C5 PFCA for the treatment with WWTP effluents. For all other PFAAs and treatments the translocation factor was less than 1. For spinach, translocation factors > 1 were observed for C4 – C6 PFCAs and C4 PFSA in all treatments and additionally C7 PFCA in treatment with PFAA-spiked solution. Comparing PFCAs and PFSAs with the same carbon chain length, show that PFCAs had a greater affinity to shoots accumulation than PFSAs.
(Dal Ferro et al., 2021)
climate chamber - hydroponic system
(nutrient solution spiked with 6:2 FTSA at 1.100 nmol/mL; exposure time: 12 days)
pumpkin (Cucurbita maxima L.)
(root, shoot)
6:2 fluorotelomer sulfonic acid (6:2 FTSA)
PFCAs (C2-C8)
PFSAs (C4,
6:2 FTSA and all tested PFAAs had a root concentration factor > 1. The root concentration factor of 6:2 FTSA was 2.6-24.2-fold as high as those of PFAAs of the same or much shorter carbon chain length, demonstrating much higher bioaccumulative ability of 6:2 FTSA in pumpkin roots.
C2-C7 PFCAs were found as metabolites in roots and shoots. C7 PFCA and C4 PFCA were the major metabolite in roots, while C4 PFCA was the major metabolite in shoots.
Neither the PFAAs nor 6:2 FTSA had higher concentrations in shoots than in roots, leading to translocation factors lower than 1. The translocation factor decreased with increasing perfluorinated carbon chain length (and increasing log Kow).
(Zhao et al., 2019)

P.O. Box 400, FI-00121 Helsinki, Finland | Tel. +358 9 686180 | echa.europa.eu
163
C6, C8)
hydroponic greenhouse study (nutrient solution spiked with FOSA at 1.856 nmol/mL; exposure time: 12 days)
soybean (Glycine max L. Merrill) and pumpkin (Cucurbita maxima L.)
(root, shoot)
Perfluorooctane sulfonamide (FOSA) + degradation products
(C8 PFSA is also present as impurity (~8 mol%) in the FOSA standard)
The translocation factor of FOSA from roots to shoots was 1.5-fold higher for pumpkin (0.09) than for soybean (0.06). The higher root lipid content of pumpkin might be an explanation.
C4, C6 and C8 PFSA were found as metabolites in roots and shoots of pumpkin and soybean. The concentration in roots were higher than in shoots for all metabolites. The concentration increased with increasing chain length.
(Zhao et al., 2018)
growth chamber (nutrient solution spiked with C8 PFSA or F53-B concentrations at 0.05 and 0.1 µg/ml; exposure time: 7 days)
wheat (Triticum aestivum L.)
(root, shoot)
C8 PFSA, commercial F53-B (6:2 Cl-PFAES as major component and 8:2 Cl-PFAES as impurity)
Root concentrations of C8 PFSA and Cl-PFAESs were an order of magnitude higher than those in shoots.
There was no significant difference in BCFshoot values between C8 PFSA and 6:2 Cl-PFAESs at both tested levels (BCFshoot = 2.614 – 4.182). The BCFshoot values for 8:2 Cl-PFAES were about 70-76% lower than for C8 PFSA. On the contrary, the BCFroot values for 8:2 Cl-PFAES were 1.4-1.9-fold higher than for C8 PFSA (BCFroot 8:2 Cl-PFASES = 194.7 and 266.7).
The translocation factor values from root to shoot were similar for C8 PFSA and 6:2 Cl-PFAES (0.023-0.029) and quite lower for 8:2 Cl-PFAES (0.004 and 0.005).
6:2 Cl-PFAES had a similar accumulation pattern as C8 PFSA, whereas 8:2 Cl-PFAES was predominantly restricted to the roots, which might be attributed to their hydrophobicity and carbon chain length.
(Lin et al., 2020b)
Soil studies
field study (biosolid amended soils; biosolids applied =
wheat (Triticum aestivum L.)
PFCAs (C4-C11, C14)
No correlation between the root concentration factor and carbon chain length of PFAAs
Transfer potential from roots to straws and further to the grains was higher
(Wen et al., 2014)

P.O. Box 400, FI-00121 Helsinki, Finland | Tel. +358 9 686180 | echa.europa.eu
164
4.5, 9, 18, 36 t/(ha∙y))
(root, straw, husk, grain)
PFSAs (C4, C6, C8)
for short-chain PFAAs than for long-chain PFAAs Transfer factor from roots to straws: higher for PFCAs than for PFSAs (with
same carbon chain) Transfer factor from straws to grains: higher for PFSAs than for PFCAs (with
same carbon chain) PFCA concentrations in grain increased logarithmically with increasing PFCA
concentrations in soils while PFSA concentrations in grain were correlated linearly with PFSA concentrations in soils, indicating that PFCAs and PFSAs may have different transport pathways from soil to grain.
pot experiment
(soil was spiked with an aqueous solution of 0.25 mg individual PFAA/kg soil and 1.00 mg individual PFAA/kg soil).
After 128 days straw and kernels were
harvested.
maize (Zea mays)
(straw, kernel)
PFCAs (C4-C10)
PFSAs (C4, C6, C8)
Straw: PFAA concentrations decreased significantly with increasing chain length
4-fold increase in spiking (1.00 mg of the individual substances/kg soil versus 0.25 mg/kg soil) leads to a 4-fold higher concentration of PFAAs with chain lengths ≥ C6 in the straw of maize plants. 4-fold increase in spiking concentration leads only to a 2-fold increase of C4 PFCA, C5 PFCA and C4 PFSA in the straw.
Kernel: only C4-C7 PFCAs and C4 PFSA were detected (highest concentration for C5 PFCA)
Concentrations of PFAAs detected in kernels were lower than those measured in the straw
PFCAs are always found in higher concentrations than PFSAs Highest soil-to-plant transfer for both straw and kernels was determined for
short-chain PFAAs. The PFAA transfer from soil to straw decreased with increasing chain length. Transfer factors in straw was > 1 for C4-C7 PFCAs and C4 PFSA. Transfer factors in kernels were all below 1.
PFAAs accumulate to a greater degree in vegetative plant parts and only to a small degree in generative organs.
(Krippner et al., 2015)
field study (grass from biosolid-applied fields)
grass (tall fescue, barley, Bermuda grass, Kentucky bluegrass)
PFCAs (C6-C14)
PFSAs (C4, C6, C8)
The shortest PFCA had the highest grass /soil accumulation factor (GSAF) and the accumulation potentials decreased with increasing carbon chain length (C6 to C9 mean decrease of 32-fold, C9 to C14 mean decrease 2-fold)
The accumulation potential is higher for C8 PFCA than for C8 PFSA (GSAF for other PFSAs were not provided) FTOHs, sFTOH were quantifiable in only a few plant samples and only at very low concentrations compared to PFCAs (e.g. 8:2 FTOH 10-fold lower concentrations than C8 PFCA)
(Yoo et al., 2011)

P.O. Box 400, FI-00121 Helsinki, Finland | Tel. +358 9 686180 | echa.europa.eu
165
n:2 FTOH (n= 6, 8, 10, 12, 14), n:2 sFTOH (n= 7, 9, 11, 13), 8:2 FTA
greenhouse study with biosolids-amended soil (industrially impacted soil (PFAA contaminated biosolids), municipal soil)
limited-scale field study (fertilization via biosolids with different agronomic rate for nitrogen (0.5x, 1x, 2x, 4x))
lettuce (Lactuca sativa) and tomato (Lycopersicon
lycopersicum)
(lettuce leaf and tomato fruit)
PFCAs (C5-C10)
PFSAs (C4, C6, C7, C8, C10)
Greenhouse study:
The BAFs for PFAAs in greenhouse lettuce decreased approximately 0.3 log units per additional CF2 group (C4 PFSA excluded from regression calculation)
BAFs in lettuce in industrially impacted soil higher than in municipal soil. BAFs (lettuce, municipal soil) = 0.19 – 28.4, BAFs (lettuce, industrially impacted soil) = 0.52 – 56.8 (C10 PFDS < LOQ); greatest accumulation was seen for C4 PFCA
No apparent linear trend for PFAA log BAFs in tomato. BAF decreases approximately 0.5 – 0.9 log units (C4 PFCA excluded from regression calculation)
BAFs (tomato, industrially impacted soil) = 0.1 – 17.1 (C9, C10 PFCAs and C7, C8, C10 PFSAs < LOQ); greatest accumulation was seen for C5 PFCA
Bioaccumulation of PFAAs from biosolid-amended soils depend strongly on PFAA concentrations, soil properties, the type of crop, and analyte
transpiration stream concentration factor (TSCF) lettuce: except for C4 PFCA in municipal soil (TSCF ~ 1.25) the TSCF values were less than 1 for all analytes and both biosolids-amended soils
Limited-scale field study:
BAFs decreased with increasing chain length (only calculated for 4x plot) Lettuce: BAFs could only be calculated for C4 PFCA (40.0), C5 PFCA (16.3),
C4 PFSA (2.02), C6 PFSA (1.51), C8 PFSA (0.1); concentrations for all other PFAAs were below LOQ
Tomato: BAFs could only be calculated for C4 PFCA (18.2), C5 PFCA (14.9) and C6 PFCA (6.84); concentrations for all other PFAAs were below LOQ
(Blaine et al., 2013)

P.O. Box 400, FI-00121 Helsinki, Finland | Tel. +358 9 686180 | echa.europa.eu
166
greenhouse study with biosolids-amended soil (industrially impacted biosolids and municipal biosolids)
radish (Raphanus sativus), celery (Apium graveolens var.
dulce), tomato (Lycopersicon lycopersicum), and sugar snap pea (Pisum sativum
var. macrocarpon)
(radish and celery: root and shoot; tomato and pea: root shoot and fruit)
PFCAs (C4-C10)
PFSAs (C4, C6, C8)
Root-soil concentration factors (RCF) for tomato and pea were independent of PFCA chain length, while radish and celery RCFs showed a slight decrease with increasing chain length (chain length trends were not calculated for PFSAs as only three analytes were studied).
PFCAs: Shoot-soil concentration factors (SCF) for all crops showed a decrease with increasing chain length (0.11 to 0.36 log decrease per CF2 group).
PFCAs: Fruit-soil concentration factors (FCF) decreased with increasing chain length (0.54−0.58 log decrease per CF2 group).
Fruit crops were found to accumulate fewer long-chain PFAAs than shoot or root crops presumably due to an increasing number of biological barriers as the contaminant is transported throughout the plant (root to shoot to fruit).
Edible parts: radish root (RCF > 1 for C4, C6, C9 PFCA and C4, C6 PFSA), celery shoot (SCF > 1 for C4-C7 PFCA and all three PFSAs), tomato fruit and pea fruit (FCF > 1 for C4-C6 PFCAs)
(Blaine et al., 2014b)
Outdoor lysimeter (soil spiked with a mixture of PFAAs – nominal concentration of each PFAA: 0.1 mg/kg dw, 1 mg/kg dw, 5 mg/kg dw, 10 mg/kg dw)
Radish (Rapahnus
sativus), lettuce (Lactuca sativa), pea (Pisum sativum) and maize (Zea mays)
PFCAs (C4-C14)
PFSAs (C4, C8)
Phytotoxic effects of PFAAs: radish and lettuce plants grown in the highest exposure level soil were smaller at the time of harvest compared to those growing in lower exposure levels. Pea and maize plants showed no visible effects of phytotoxicity.
Edible part/soil concentration factors ranged over seven orders of magnitude and decreased strongly with increasing PFAA chain length, by a factor of 10 for each additional CF2 group for pea.
Root retention factors increased by a factor 1.7 for each CF2 group. Fruit/leaf concentration factors decreased by a factor 2.5 for each CF2 group. Independent of the plant species the highest concentrations were found in
leaves and roots of the plants and the lowest in the fruits. Therefore, leafy and root vegetables pose the highest risk for dietary exposure followed by fruit-bearing crops.
(Felizeter et al., 2021)

P.O. Box 400, FI-00121 Helsinki, Finland | Tel. +358 9 686180 | echa.europa.eu
167
(radish: roots, bulb, foliage; lettuce: roots, foliage; pea: roots, stem, twigs,
leaves, pods, peas; maize: roots, stem, leaves,
hull leaves, cobs, kernels)
climate chamber,
two biosolid amended soils (anaerobically digested thermal drying sludge and anaerobically digested municipal solid waste compost); exposure time: 28 days (spinach) and 6 months (tomato)
spinach (Spinacia oleracea),
tomato (Solanum lycopersicum L.),
(tomato: root, stem, leaf, fruit)
PFCAs (C4-C16)
PFSAs (C4, C6, C8, C10)
FOSA, N-MeFOSA, N-EtFOSA
Tomato: C8 PFSA (75%) and C7–C10 PFCAs (54–96%) preferentially remained in roots and C4–C6 PFCAs tended to be translocated to above-ground tissues (leaf: 31–56%, fruit: 32–48%). Transfer factor values for PFASs in fruit were > 1 for C4 (30.87 and 69.82), C5 (31.22) and C6 PFCAs (3.64). Transfer factors between tomato plant parts were determined to evaluate the translocation and distribution within the plant: leaf concentration factor for C5–C8 PFCA > 1 (2.69 – 6.92), edible part concentration factor only for C5-PFCA > 1 (1.12)
Spinach: only C5, C8 PFCA and C8 PFSA were detected (transfer factor 1.08 – 4.47)
C6 PFSA, C10 PFSA, C13-C16 PFCA, FOSA, N-MeFOSA and N-EtFOSA were not detected in any sample.
(Navarro et al., 2017)
climate chamber, soils fortified by addition of technical mixture of C8 PFSA (~50 mg/kg soil); exposure time: 28
maize (Zea mays)
(root, leaf)
technical mixture of C8 PFSA
High levels of C4 and C6 PFSA were also detected in roots and leaves as the commercial mixture of C8 PFSA also contains ~ 1.5% of C4 and C6 PFSAs.
C8 PFSA is highly presented in roots (89%), whereas C4 PFSA (88%) and C6 PFSA (82%) were preferentially found in leaves. The transfer factor values in roots were highest for C8 PFSA (8.82) followed by C4 PFSA (5.00) and C6 PFSA (2.62). Transfer factor values in leaves were: 9.39 (C6 PFSA), 4.00 (C4 PFSA) and 0.80 (C8 PFSA).
(Navarro et al., 2017)

P.O. Box 400, FI-00121 Helsinki, Finland | Tel. +358 9 686180 | echa.europa.eu
168
days
greenhouse, water-soil-plant system, derived from a surface flow constructed wetland; surface water enriched with PFAA at two different concentrations (low PFAA concentration 0.18 – 4.22 µg/L; high PFAA concentration 64-4300 µg/L)
bulrush (Typha angustifolia)
(root, shoot)
PFCAs (C4- C8)
PFSAs (C4, C6, C8)
Longer-chain PFAAs showed higher root uptake potential compared to shorter-chain PFAAs. PFSAs exhibited higher concentrations in the roots compared to PFCAs.
BAFroot/water = 8.1 – 45.7 at low concentrations and 0.7 – 15.6 at higher concentrations; BAFshoots/water = 7.3 – 26.6 at low concentrations and 1.4 – 3.5 at higher concentrations. BAFplant/water decreased with increasing PFAA initial concentrations.
A positive correlation between BAFplant/soil and chain length was observed. Translocation factor from roots to shoots decreased with increasing chain
length (TF > 1 for C4-C7 PFCAs and C4 PFSA). Higher translocation factors were observed for PFCAs compared to PFSAs with similar chain length.
(Zhang et al., 2020b)
pot experiments in greenhouse with wheat-soil system (PFAA concentrations: 200 and 2000 µg/kg soil)
wheat (Triticum aestivum L.)
(root, shoot)
PFCAs (C4, C6, C8)
PFSAs (C4, C6, C8)
Both the root and shoot accumulated PFAAs from soil. The accumulation of PFAAs was enhanced at the higher spiking levels of PFAAs and increased with decreasing chain length. PFCAs showed higher accumulation in wheat than PFSAs of the same chain lengths, which corresponds to their differences of log Kow values.
Root: BAF values were all greater than 1. BAF values for PFCAs decreased with increasing chain length, while the BAF were at similar level for PFSAs
Shoot: BAF values were greater than 1 for C4 and C6 PFAAs. Transfer factor from root to shoot: no significant difference was observed
between the two spiking levels. For C4 and C6 PFAAs the transfer factors were greater than 1 (C4 PFCA: 11.1 and 11.9; C4 PFSA: 4.51 and 1.86; C6 PFCA: 2.6 and 1.9; C6 PFSA: 1.04 and 1.28) indicating their higher accumulation potential in shoot. The limited transfer potential of long-chain PFAAs from root to shoot may be due to their low solubility and greater interaction with biological macromolecules (e.g. protein and lipid) in root.
(Lan et al., 2018)
greenhouse microcosm experiment (duration 5.5
alfalfa plants (Medicago truncatula)
DiPAPs
Greenhouse study:
DiPAPs (6:2 diPAP, 6:2/8:2 diPAP, 8:2 diPAP, 8:2/10:2 diPAP, 10:2 diPAP, 10:2/12:2 diPAP) as well as PFCAs (C4-C13) were detected in control soil and
(Lee et al., 2014)

P.O. Box 400, FI-00121 Helsinki, Finland | Tel. +358 9 686180 | echa.europa.eu
169
months; four different treatments: 1. Soil without biosolids; 2. WWTP biosolids-amended soil (16g biosolids/kg soil); 3. WWTP- and paper fibre biosolids-amended soil (mixture 1:4); 4. 6:2 diPAP-spiked WWTP biosolids-amended soil)
and field experiment (compost and paper fibre biosolids (1:4) were applied to two farmfields)
pumpkin (Cucurbita maxima)
(root, stalk, flower, leaf, fruit)
PFCAs (C4-C14)
biosolid-amended soils prior application. The majority of the 6:2 diPAP resided in the soil (99%), with minor uptake
observed in the plants (1%) FTOHs were not analysed and the microcosms were open to the atmosphere
of the greenhouse. The following transformation products were observed in the soil-plant
microcosm: 6:2 FTCA, 6:2 FTUCA, 5:3 FTCA, C4-C6 PFCAs The plant-soil accumulation factor for PFCAs decreased with increasing carbon
chain length
Field study:
several PFCAs were present in the field soil collected prior to the application. No diPAPs were detected.
DiPAPs can migrate to lower soil depths. 2 months after application 6:2/8:2 diPAP, 8:2 diPAP, 8:2/10:2 diPAP were observed at a soil depth of 5-10 and 6:2 diPAP even at a depth of 10-15 inches
Uptake of diPAPs and PFCAs in the root, stalk, flower, leaf and fruit of pumpkins were observed after 3.5 months
pot experiment
with two different compost amended soils (soil 2.4 and substrate, 8:2 diPAP concentration nominal 500 ng/g)
(growth periods: carrot ~ 3 months, lettuce ~1 month)
lettuce (Lactuca sativa) and carrot (Daucus carota ssp sativus)
(carrot: peel, core, leaf; lettuce: leaf, heart)
8:2 diPAP + degradation products
In the presence of crops different degradation products were detected in the soil compared to the experiment in absence of crop.
Degradation products in the absence of crop: 8:2 monoPAP, 8:2 saturated and unsaturated fluorotelomer carboxylate (8:2 FTCA and 8:2 FTUCA), 7:3 FTCA, C6-C8 PFCAs
Carrot experiments: degradation products: C4-C9 PFCAs, 7:3 FTCA; Lower 8:2 diPAP concentrations were observed in the carrot parts compared to the soil. This could mean that the substance retained to the soil or that metabolization occurs. The highest concentrations of PFCAs were found in leaves. BCF and translocation of PFCAs increased with increasing solubility. Independent of type of soil BCF values decreased with increasing chain length.
Lettuce experiments: only C8 PFCA was detected as degradation product in the heart of the lettuce. No translocation through the plant was observed as in the leaves concentrations of 8:2 diPAP and C8 PFCA were below method
(Bizkarguenaga et al., 2016)

P.O. Box 400, FI-00121 Helsinki, Finland | Tel. +358 9 686180 | echa.europa.eu
170
detection limits (MDL for 8:2 diPAP = 3 ng/g; MDL for C8 PFCA not mentioned).
climate chamber with plant-soil system (solutions of PFAS-ether at 500 or 2000 ng/L of each PFAS-ether; sampling at day 52 and 80)
longhair sedge
(Carex comosa)
(root, shoot)
PFAS-ether:
2,2,3,3-Tetrafluoro-3-(trifluoromethoxy)propionic acid (PFMOPrA),
perfluoro(4-methoxybutanoic) acid (PFMOBA),
2,3,3,3-tetrafluoro-2-(heptafluoropropoxy)propionic acid (HFPO-DA),
ammonium
All PFAS-ether were taken up by plant roots, translocated to shoots, and accumulated in plant tissues. Exposure concentration and time positively affected the plant uptake of the PFAS-ether. The uptake in shoots was significantly higher for the other PFAS-ether than for F-53B. F-53B, which has the longest carbon chain among the PFAS-ether in this study and a sulfonic functional group, was largely accumulated in roots with very limited upwards translocation.
Plants exposed to HFPO-DA (500 ng/L, 52 days) had the highest translocation factor. Only F-53B had a translocation factor less than 1. The relatively higher hydrophobicity and lipophilicity of F-53B (log Kow =7.03) could cause greater interactions between the substance and the biological macromolecules in plant roots (e.g., proteins, lipids). This could lead to decreasing penetration of F-53B through the Casparian strip.
The concentration of PFAS-ether in water-soluble fraction increased with decreasing carbon chain length and logKow values and had a positive linear relationship with PFAS-ether mass in whole plants and plant shoots. PFAS-ether that had higher concentration in water-soluble fraction (e.g. PFMOPrA and PFMOBA) may have higher leachability to surrounding environments. Aging process could facilitate PFAS-ether to become non-extractable, hence reducing their mobility in soil and bioavailability to plants.
(Zhang et al., 2021a)

P.O. Box 400, FI-00121 Helsinki, Finland | Tel. +358 9 686180 | echa.europa.eu
171
2,2,3 trifluor-3-(1,1,2,2,3,3-hexafluoro-3-trifluormethoxypropoxy), propionate (ADONA),
Potassium 2-(6-chloro-1,1,2,2,3,3,4,4,5,5,6,6-dodecafluorohexyloxy)-1,1,2,2-
tetrafluoroethane sulfonate
(F-53B)
pot experiment (soil was spiked with a stock solution of target PFASs to achieve nominal concentrations of 200 ng/g and 500
wheat (Triticum aestivum L.), maize (Zea mays L.), soybean (Glycine max L. Merrill), and
6:2 fluorotelomer sulfonate (6:2 FTS), 6:2 chlorinated polyfluoroal
All four PFASs were detected in all compartments of all four plant species in both spiked treatments. The concentration of the four PFASs in the plant roots were significantly higher than those in shoots and leaves.
The mean concentrations in the plant roots and aboveground tissues decreased in order of 6:2 FTS > F53-B > C6/C6 PFPiA > C8/C8 PFPiA with increasing hydrophobicity (increasing log Kow).
The root soil concentration factor as well as the translocation factor from root
(Zhou et al., 2020)

P.O. Box 400, FI-00121 Helsinki, Finland | Tel. +358 9 686180 | echa.europa.eu
172
ng/g; exposure time: 60 days)
pumpkin (Cucurbita maxima L.)
(Wheat: root, shoot; maize, soybean, pumpkin: root, shoot, leaf)
kyl ether sulfonates (6:2 Cl-PFAES, trade name F-53B) and perfluorophosphinates (C6/C6 and C8/C8 PFPiAs)
to shoot were inversely proportional to their log Kow for all four plant species. All translocation factor values were below 1.
Pot experiment in outdoor transparent shelter
(irrigation with PFAS contaminated river water from Lee's Creek (AFFF contamination, < 1 µg/L PFAS) and PFAS-free water)
Tomato (Solanum lycopersicum), lettuce (Lactuca sativa)
and beet (Beta vulgaris ssp. vulgaris)
(tomato: root, stem, foliage, flower, foliage;
lettuce and beet: root, foliage)
PFCAs (C4-C12)
PFSAs (C4, C6, C8, C10),
PFOSA (perfluorooctanesulfonamide)
Short-chain PFASs: tomato plants (exception of roots) showed significant increases of short-chain PFAS concentrations with river treatment (highest concentration in flowers). This effect could not be observed in lettuce or beet.
Long-chain PFASs: Concentration of long-chain PFASs only increased in tomato foliage and lettuce roots and foliage.
Tomato: In small fruits higher concentrations of short-chain PFAS but lower absolute PFAS mass were observed. Whereas in larger fruits lower concentration of short-chain PFAS but higher absolute PFAS mass was detected.
Biomagnification of short-chain PFASs in flowers could have implications for pollinators depending on where the contaminants reside (e.g. in pollen or nectar, exposure to insects could be meaningful).
(McDonough et al., 2021)

P.O. Box 400, FI-00121 Helsinki, Finland | Tel. +358 9 686180 | echa.europa.eu
173
B.4.5. Removal from the environment, decontamination and purification
Clean-up of sites facing a PFAS contamination and remediation of historically contaminated sites can in certain cases mitigate the impact of these pollutions. A general description of these approaches, summary of case studies and their costs is provided in Annex E.4.4 “Remediation and clean-up”. Below, a high-level description of possible treatment approaches is provided.
The point of treatment of a PFAS contamination can be selected based on economic considerations. The investment in Euros spent per mass unit of PFAS removed is largest in the source area (No. 1 in Figure B.48). The absolute PFAS mass removed is greater in the source area when comparing to groundwater extraction and subsequent treatment. Also, PFAS mass removed in the source area will not be available to support plume growth in groundwater. The point of treatment can also be based to protect a sensitive receptor such as a drinking water (domestic No. 9, commercial, or public No. 10). Here an end-of-pipe technology would treat the PFAS-impacted and extracted groundwater to acceptable levels prior to use or distribution. Hydraulic control of a site could be critical to prevent contaminants to extend beyond the property boundary (No. 4). A series of extraction wells or a drainage wall/trench near the property boundary would ensure that PFAS-impacted groundwater does not extend beyond the property boundary by groundwater flow. The extraction well gallery or drainage would need to be installed perpendicular (as far as possible) to the groundwater flow direction and be long enough to cover the plume width. In most, if not all, cases, remediation of an entire PFAS-plume in groundwater is economically not viable since PFAS plumes are extremely large and, in comparison to other contaminants such as hydrocarbons or chlorinated solvents, they are a concern at very low concentrations.
Source area treatment: Unsaturated and saturated soils are typically treated/remediated by means of excavation and disposal / incineration. Here the largest PFAS mass is typically removed from the subsurface in a short amount of time with a high effectivity, efficiency and potentially long-lasting reduced environmental impact (depending on the end disposal route, e.g. if the leachate from the landfill is correctly collected and treated or if the incineration uses temperatures high enough to reliably destroy PFAS).
Hydraulic site control: To eliminate off-site migration of PFAS-contaminated groundwater, impacted groundwater is extracted at the site boundary through one or more extraction wells or a drainage structure. The extraction process eliminates or greatly reduces the mass flux across the property line. While the hydraulic containment system is not able to recover PFAS-impacted groundwater that has already migrated to off-site areas, it can greatly reduce the potential impact on receptors that could be downgradient, including neighbouring properties or sensitive points of use such as private or public drinking water wells or agricultural use wells or surface water structures.
“End-of-pipe” treatment: In the event that PFAS contaminated groundwater is extracted for human use or consumption or for agricultural use, groundwater would need to be treated after extraction. Commercially available treatment technologies to recover PFAS molecules from water include adsorption technologies such as granular activated carbon (GAC) or resins (regenerable and non-regenerable). Reverse osmosis can also be used to treat extracted groundwater.
Short-chain PFAS can be more resilient to some of these treatment technologies, so that more rigorous measures are required for effective treatment (e.g. a secondary treatment step using a resin that is optimised to retain the specific short-chain PFAS compounds, or higher temperature incineration). Different treatment options are discussed below.
Drinking water treatment:
A recent review paper from (Li et al., 2020) on occurrence, impacts and treatment of short-chain PFASs concludes that:

P.O. Box 400, FI-00121 Helsinki, Finland | Tel. +358 9 686180 | echa.europa.eu
174
1) short-chain PFASs are more widely detected, more persistent and mobile in aquatic systems, and thus may pose broader risks on the human and ecosystem health;
2) conventional adsorption, ion-exchange, and membrane filtration can remove short-chain PFASs, but are less effective than for the long-chain homologues, and are challenged with poor material regeneration efficiency and disposal of process waste residual;
3) thermolysis and sonolysis can achieve complete mineralization, but come with a high process cost;
4) direct photolysis, oxidation/reduction, photocatalysis, and electrochemical reaction may degrade short-chain PFASs following similar degradation pathways as long-chain PFASs, but at a slower rate, and photocatalytic processes appear most promising.
Overall, this review reveals an urgent need for developing more cost-effective treatment technologies for short-chain PFASs in drinking water.
Conventional water treatment
Conventional and advanced water treatment processes cannot remove PFCAs and PFSAs (coagulation/flocculation/sedimentation, raw and settled water ozonation, BAC filtration, and disinfection by medium-pressure UV lamps and free chlorine)( Quinñones et al., 2009; Shivakoti et al., 2010; Eschauzier et al., 2012 ; Rahman et al., 2014 ; Appleman et al. 2014).
PFECAs have been detected downstream of a PFASs manufacturer where they could not be removed from drinking water by conventional and advanced water treatment processes (raw water, ozonation, coagulation/flocculation/sedimentation, settled water ozonation, biological activated carbon (BAC) filtration, and disinfection by medium-pressure UV lamps and free chlorine; Sun et al. 2016). No removal was either observed in a study by Hopkins et al. (2018) by conventional surface water treatment processes (coagulation, flocculation, sedimentation, filtration, disinfection with free chlorine), neither by several advanced water treatment processes, including raw and settled water ozonation, biofiltration, and disinfection with medium-pressure ultraviolet (UV) lamps.
There is little information on the occurrence of PFPAs in water and the effectiveness of water treatment process on their removal. C8-PFPA (1.1–25 ng/L) and C10-PFPA (8.2–23 ng/L) have been detected in tap water from Spain and C10-PFPA (10 ng/L) in one sample in Germany (Llorca et al., 2012a); which suggests that conventional water treatment processes are not able to remove PFPAs from water.
Water treatment with powdered activated carbon (PAC) filters
LC-PFCAs and LC-PFSAs can be removed with powdered activated carbon (PAC) filters, with higher removal efficiency for PFSAs compared to PFCAs analogues (Eschauzier et al., 2012, Rahman et al., 2014; Sun et al. 2016).
Sun et al. performed adsorption experiment with (PAC) in a batch reactor using water samples contaminated with PFECAs, downstream a fluorochemical plant. The PAC achieved a 95% removal for PFO4DA (C6HF11O6), 54% for PFO3OA (C5HF9O5) and less than 40% for PFMOAA (C3HF5O3), PFMOPrA (C4HF7O3), PFOMBA (C5HF9O3),

P.O. Box 400, FI-00121 Helsinki, Finland | Tel. +358 9 686180 | echa.europa.eu
175
PFPrOPrA (GenX C6HF11O3) and PFO2HxA (C4HF7O4) (Sun et al. 2016).
PFECAs exhibited adsorbabilities to PAC lower than those of PFCAs and PFSAs of the same chain length (calculated as the sum of carbon, ether oxygen and sulphur atoms), (e.g., PFMOBA < PFHxA and GenX< PFOA), suggesting that the replacement of a CF2 group with an ether oxygen atom decreases the affinity of PFASs for PAC (Sun et al. 2016).
SC-PFAAs (and C7-PFCA) cannot be effectively removed by granular activated carbon (GAC) or PAC filters (Eschauzier et al., 2012; Rahman et al., 2014; Zaggia et al., 2016).
As the decrease in chain length for PFAAs leads to an increase in water solubility and decrease in sorption potential (section 1.1.1.5 and section B.4.2.1), it can be assumed that the more hydrophilic SC-PFAAs, including SC-PFESAs, SC-PFECAs and SC-PFPAs cannot be effectively removed from drinking water in routine applications by granular activated carbon (GAC) or powdered activated carbon (PAC) filtration. Less efficiency of removal is expected for PFAAs with carboxylic acids groups (PFCAs and PFECAs) compared to sulfonic acids groups (PFSAs and PFESAs) or phosphonic groups (PFPAs) due to their lower sorption potential and higher water solubility (section 1.1.1.6).
Water treatment with ion exchange resins
LC-PFAAs can be removed with ion exchange resins, higher removal efficiency is achieved for PFSAs compare to PFCAs analogues (Rahman et al., 2014; Appleman et al., 2014). In a full-scale treatment plant, iron infused AIX resin that was designed for arsenic removal (5-9 months old) was able to remove C4-PFSA (81%) and partially remove C7-PFCA (46%) and C8-PFCA (75%) but not C4-PFCA (Appleman et al., 2014)
Removal of C4-PFCA and C4-PFSA with GAC and PAC filters and anion exchange resins has also been reported in pilot-scale column experiments (Rahman et al., 2014; Zaggia et al., 2016), but with extremely premature breakthroughs (<3 months) that make these solutions not practicable for routine applications.
When selecting an ion exchange resin, regeneration issues (e.g. loss of saturation capacity after regeneration) can be as important as the removal capacities of the resin (Rahman et al., 2014, Zaggia et al., 2016).
High-pressure membranes (high pressure nanofiltration and reverse osmosis) have shown to be effective (>90% removal efficiency) removing PFAAs (≥C4 PFSAs and ≥C4 PFCAs from water) in bench (Appleman et al., 2013; Zhen et al., 2017) and full-scale studies (Thompson et al., 2011, Appleman el al., 2014). High efficiency of removal could also be expected for PFECAs and PFESAs (Hopkins et al 2018). The disposal of concentrate, which will contain elevated concentrations of PFASs, will need to be addressed.
To summarise, the properties of especially the most stable PFASs resulting from the

P.O. Box 400, FI-00121 Helsinki, Finland | Tel. +358 9 686180 | echa.europa.eu
176
degradation of other PFASs in the environment, are such that render water treatment very difficult hence increasing the technical demands (and costs) of the treatment of water obtained for drinking water, process water and household water uses. The increasing number of findings of PFASs in surface waters, groundwaters and drinking water (see section B.4.2.4 for monitoring data) demonstrates the need for purification of drinking water. EUREAU (2021) has also assessed the purification methods for water suppliers and concludes that PFASs should be managed at their source due to the challenges in the water supply.
Wastewater treatment
Several studies showed that conventional wastewater treatment has a limited efficiency in removing both, short-chain and long-chain PFCAs and PFSAs from aqueous waste streams. SC- and LC-PFCAs and PFSAs accumulate in sludge and are released to receiving waters via WWTP effluents (Bossi et al., 2008; Arvaniti and Stasinakis, 2015; Eriksson et al., 2017).
SC- and LC- PFCAs are generally found in higher concentrations in the effluent water than the influent water (Bossi et al., 2008; Sinclair and Kannan, 2014; Eriksson et al., 2017), which indicates that they are hard to remove from water during waste water treatment process and that precursors compounds can be degraded into PFCAs and PFSAs during the waste water treatment.
Several PFCAs precursors (FTSAs, FTCA/FTUCA, diPAP) were found in lower concentration in the effluent water than the influent water of three WWTP in Sweden (Eriksson et al., 2017), which, together with the calculated increase in the daily discharge of PFCAs (effluent and sludge) compared with the daily incoming amount in the influent water indicates that PFCAs precursors can potentially degraded to PFCAs during waste water treatment process.
More than 75% of the PFASs detected in sludge from 3 WWTP in Sweden were precursor compounds and intermediates to PFAAs (FTSAs, FTCAs, FTUCAs, diPAP, monoPAP; Erickson et al., 2017).
The formation of PFAAs from precursors in WWTP is dependent on process temperature and treatment type, with higher rates of formation in biological WWTP (during the acerbic biological step) at longer hydraulic retention times and higher temperatures. (Guerra et al., 2014). Care should be taken when comparing concentration of PFASs measured in the waste streams between WWTPs, due to the effect of the treatment process and the specific sampling strategies (e.g. sampling at high or low flow periods and seasonal effects, Guerra et al., 2014, Sinclair and Kannan, 2016)
PFPAs with short perfluoroalkyl chains (≤C6) are expected to combine high water solubility and low sorption to organic matter, therefore there will be hardly removed from water in WWTP. However, sorption is expected increase with increasing chain length PFAAs (Wang et al., 2016; see section 1.1.1.4), with larger fraction of the LC-PFPAs partitioning into the sludge.
The adsorption of LC-PFAAs in sludge has been observed to increase with increasing chain length (increase in distribution coefficient between influent water and sludge; Erickson et al., 2017), which can be explained due to the increase of hydrophobicity

P.O. Box 400, FI-00121 Helsinki, Finland | Tel. +358 9 686180 | echa.europa.eu
177
of the molecules (Zhang et al. 2013). However, for SC-PFAAs, the electrostatic interactions between the anionic functional group and the sludge are expected to play a more important role than hydrophobic interactions (Zhang et al. 2013).
Higher solid-liquid distribution coefficients have been observed in WWTP for PFOS compared to PFOA (Guerrra et al., 2014; Erickson et al., 2017) and laboratory incubation (Zhang et al., 2013), which can be explained due to the stronger hydrophobic properties of the sulfonic analogues (see section 1.1.1.5). The lower distribution coefficient of PFHxS compare to PFHxA in sludge from a WWTP observed by Erickson et al, (Erickson et al., 2017) could be due to the higher formation of PFHxA from precursors in the sludge.
Municipal waste water treatment plants are not able to effectively remove SC- or LC-PFAAs and the discharge of municipal sewage water is a significant source of PFAAs to the aquatic environment (Becker et al., 2008; Loos et al., 2013; Filipovi and Berger, 2014). In addition, the disposal of the sludge from industrial and municipal WWTP can also be a significant source of PFAAs to the terrestrial environment (Washington et al. 2010; Gomez-Canela et al., 2012 Erickson et al., 2017).
Remediation of contaminated sites
Leaching of PFASs to groundwater from contaminated soils can be reduced by sorbent amendment using activated carbon (94 and 99.9% PFOS reduction), compost soil (29 and 34% PFOS reduction) and montmorillonite (28 and 40% PFOS reduction)(Hale S. et al. 2017). However, the suitability of the method for field application with higher PFAS concentrations and different PFASs is still required.
B.5. Human health hazard assessment
The majority of available data on human health effects address the toxicity of PFAAs (mainly PFCAs and PFSAs; in particular PFOA and PFOS), while less or no data are available for other PFAS groups. For the vast majority of PFASs (estimated > 99%), no data on repeated-dose toxicity, carcinogenicity, or reproductive toxicity is available. Existing recent literature reviews and assessments were explored (EFSA, 2020, NTP, 2016a, Fenton et al., 2021, Rice et al., 2021, Zeng et al., 2021, ATSDR, 2021, PFAS-TOX-DATABASE, 2021, -IRIS, 2021) to identify the main types of effects of PFASs. Besides literature reviews and assessment reports, also registration data from the ECHA dissemination site and IUCLID were screened and available information used for the assessment. In addition, information from literature searches was included (Embase, Medline, Web of Science, PubMed, Scifinder). The literature searches were performed in 2021 to identify published data with relevance to human health that has not been covered by recent reviews and search terms were selected based on (EFSA, 2020). Table B.33 lists the PFASs for which data have been reported in one or more of these reviews, assessments, and studies.
Table B.33. PFASs in assessed literature and study reports.
PFAS group No. of C PFAS Abbreviation CAS No EC Nos
PFCAs Perfluoroalkyl carboxylic acids / carboxylates C2 Trifluroacetic acid TFA 76-05-1
2923-18-4 (Na+ salt)
200-929-3 220-879-6

P.O. Box 400, FI-00121 Helsinki, Finland | Tel. +358 9 686180 | echa.europa.eu
178
PFAS group No. of C PFAS Abbreviation CAS No EC Nos C4 Perfluorobutanoic acid, Perfluorobutyric acid PFBA 375-22-4
10495-86-0 (NH4
+ salt)
206-786-3 ?
C5 Perfluoropentanoic acid PFPeA 2706-90-3 220-300-7
C6 Perfluorohexanoic acid PFHxA 307-24-4 2923-26-4 (Na+-salt) 21615-47-4 (NH4
+ salt)
206-196-6 ? ?
C7 Perfluoroheptanoic acid PFHpA 375-85-9 ? (Na+ salt)
206-798-9
C8 Perfluorooctanoic acid PFOA APFO
335-67-1 3825-26-1 (NH4
+salt)
206-397-9 ?
C9 Perfluorononanoic acid PFNA 375-95-1 4149-60-4 (NH4
+ salt)
206-801-3 ?
C10 Perfluorodecanoic acid PFDA 335-76-2 3108-42-7 (NH4
+ salt)
206-400-3 ?
C11 Perfluoroundecanoic acid PFUnDA 2058-94-8 218-165-4
C12 Perfluorododecanoic acid PFDoDA 307-55-1 206-203-2
C13 Perfluorotridecanoic acid PFTrDA 72629-94-8 276-745-2
C14 Perfluorotetradecanoic acid PFTeDA 376-06-7 206-803-4
C16 Perfluorohexadecanoic acid PFHxDA 67905-19-5 267-638-1
C18 Perfluorooctadecanoic acid PFODA 16517-11-6 240-582-5
PFSAs Perfluoroalkane sulfonic acids / sulfonates
C1 Trifluoromethanesulfonic acid TFMS 1493-13-6 2926-27-4 (K+-salt)
216-087-5 608-334-4
C4 Perfluorobutane sulfonic acid PFBS 375-73-5 29420-49-3 (K+-salt)
206-793-1 249-616-3
C5 Perfluoropentane sulfonic acid PFPeS 2706-91-4 220-301-2
C6 Perfluorohexane sulfonic acid PFHxS 355-46-4 3871-99-6 (K+-salt)
206-587-1 223-393-2
C7 Perfluoroheptane sulfonic acid PFHpS 375-92-8 206-800-8
C8 Perfluorooctane sulfonic acid PFOS 1763-23-1 2795-39-3 (K+-salt)
217-179-8 220-527-1
C9 Perfluorononane sulfonic acid PFNS 68259-12-1 -
C10 Perfluorodecane sulfonic acid PFDS 335-77-3 206-401-9
PFSIAs Perfluoroalkane sulfinic acids
C8 Perfluorooctane sulfinic acid PFOSI 1763-23-1 647-29-0
217-179-8
PFPiAs Perfluorophosphinic acids
C6/C8 Perfluorophosphinic acids C6/C8 PFPiA -
C8/C8 Perfluorophosphinic acids C8/C8 PFPiA -
C6/C12 Perfluorophosphinic acids C6/C12 PFPiA -
C8/C10 Perfluorophosphinic acids C8/C10 PFPiA -
PFECAs Perfluoroalkyl ether carboxylic acids
Hexafluoropropylene oxide dimer acid HFPO-DA, GenX 13252-13-6 62037-80-3 (NH4
+ salt)
236-236-8 700-242-3
Dodecafluoro-3H-4,8-dioxanonanoic acid DONA ADONA
- 958445-44-8 (NH4
+ salt)
- 480-310-4

P.O. Box 400, FI-00121 Helsinki, Finland | Tel. +358 9 686180 | echa.europa.eu
179
PFAS group No. of C PFAS Abbreviation CAS No EC Nos
2,3,3,3-tetrafluoro-2-[1,1,2,3,3,3-hexafluoro-2-(heptafluoropropoxy)propoxy]propionic acid
HFPO-TA 13252-14-7 236-237-3
Hexafluoropropylene oxide tetramer HFPO-tetramer 65294–16-8 -
Ammonium difluoro[1,1,2,2-tetrafluoro-2-(pentafluoroethoxy)ethoxy]acetate
EEA-NH4 908020-52-0 (NH4
+ salt) 700-323-3
Potassium 2-(3-trifluoromethoxy-1,1,2,2,3,3-hexafluoropropoxy)-2,3,3,3-tetrafluoropropionate
mv31 K+ 496805-64-2 (K+ salt)
669-836-7
Ammonium difluoro{[2,2,4,5-tetrafluoro-5-(trifluoromethoxy)-1,3-dioxolan-4-yl]oxy}acetate
F-DIOX 1190931-27-1 (NH4
+ salt) 682-238-0
Perfluoro-2-methoxypropanoic acid PFMOPrA 13140-29-9 -
Perfluoro-4-methoxybutanioc acid PFMOBA 863090-89-5 640-688-5
PFESAs Perfluoroalkyl ether sulfonic acids
6:2 chlorinated polyfluorinated ether sulfonic acid
6:2 Cl-PFESA; F-53B
73606-19-6 -
8:2 chlorinated polyfluorinated ether sulfonic acid
8:2 Cl-PFESA; PFESA-BP2, Nafion Byproduct 2
801209-99-4 (K+-salt)
-
PASFs Perfluoroalkane sulfonyl fluorides
Perfluorooctanesulfonyl fluoride POSF - -
n:2 FTOHs n:2 Fluorotelomer alcohols
6:2 Fluorotelomer alcohol 6:2 FTOH 647-42- 7 211-477-1
8:2 Fluorotelomer alcohol 8:2 FTOH 678-39-7 211-648-0
n:2 FTSAs n:2 Fluorotelomer sulfonic acids
6:2 Fluorotelomer sulfonic acid, Ammonium Perfluorohexylethylsulfonate
6:2 FTSA 59587-39-2 (NH4
+ salt) 682-841-9
8:2 Fluorotelomer sulfonic acid 8:2 FTSA ? ?
n:2 PAPs n:2 Polyfluoroalkyl phosphoric acid esters (PAPs)
8:2 Fluorotelomer phosphate monoester 8:2 monoPAP 57678-03-2 -
8:2 Fluorotelomer phosphate diester 8:2 diPAP 678-41-1 211-649-6
FASAs Perfluoroalkane sulfonamides
Perfluorooctane sulfonamide PFOSA, FOSA 754-91-6 212-046-0
N-ethyl perfluorooctane sulfonamide
EtFOSA 4151-50-2 223-980-3
N-Methyl perfluorooctane sulfonamidoacetic acid
(N)MeFOSAA, Me-PFOSA-AcOH
- -
N-Ethyl perfluorooctane sulfonamidoacetic acid
(N)EtFOSAA, Et-PFOSA-AcOH
- -
N-ethyl perfluorooctanesulfonamidoethanol EtFOSE 1691-99-2 216-887-4
Perfluoroalkyl phosphate
Ammonium bis[2-[N-ethyl (heptadecafluorooctane) sulfonylamino]ethyl]phosphate
FC-807 - -
PFE alkanes Perfluoroether alkanes
A 3:1 mixture of perfluoro(5,8,9,12-tetramethyl-4,7,10,13-tetraoxahexadecane) and perfluoro(5,6,9,12-tetramethyl-4,7,10,13-tetraoxahexadecane)
Hostinert 216 - 403-050-5 (3:1-mixture of 404-710-5 and 404-730-4)
PFE alkenes Perfluoroether alkenes
1,1,2-Trifluoro-2-(trifluoromethoxy)ethene PMVE 1187-93-5 214-703-7

P.O. Box 400, FI-00121 Helsinki, Finland | Tel. +358 9 686180 | echa.europa.eu
180
PFAS group No. of C PFAS Abbreviation CAS No EC Nos 1,1,1,2,2,3,3-heptafluoro-3-
[(trifluorovinyl)oxy]propane perfluorpropylvinylether
PPVE 1623-05-8 216-600-2
1,1,2-Trifluoro-2-(pentafluoroethoxy)ethene PEVE 10493-43-3 234-018-7
1,1,2,2,3,3-hexafluoro-1-trifluoromethoxy-3-trifluorovinyloxypropane
Mv31 - 442-390-9
1-[difluoro(trifluoromethoxy)methoxy]-1,2,2-trifluoroethylene
Move3 700874-87-9 615-064-0
Hexafluoropropylene HFO-1216 116-15-4 204-127-4
Other PFEAS
Other ether-based PFASs
2,2,3,3,5,5,6,6-octafluoro-4-(trifluoromethyl)morpholine
FC-3284 382-28-5 206-841-1
1-[3-[4-((heptadecafluorononyl)oxy)-benzamido]propyl]-N,N,N-trimethylammonium iodide
PF-310 59493-72-0 407-400-8
1-[2-(2,4-Dichlorophenyl)-3-(1,1,2,2-tetrafluoroethoxy)propyl]-1H-1,2,4-triazole
Tetraconazole 112281-77-3 407-760-6
2-(trifluoromethoxy)-benzenesulphonamide - 37526-59-3 448-450-0
reaction mass of 2,2,3,3,5,5,6,6-octafluoro-4-(1,1,1,2,3,3,3-heptafluoropropan-2-yl)morpholine and 2,2,3,3,5,5,6,6-octafluoro-4-(heptafluoropropyl)morpholine
- - 473-390-7
1-[3,5-dichloro-2-fluoro-4-(1,1,2,3,3,3-hexafluoropropoxy)phenyl]-3-(2,6-difluorobenzoyl)urea
Noviflumuron 121451-02-3 601-779-5
(1s,4r)-4-Propyl-4'-[4-(trifluoromethoxy)phenyl]-1,1'-bi(cyclohexyl)
ccp-30cf3 133937-72-1 603-782-7
2',3,5-Trifluoro-4''-(trans-4-propylcyclohexyl)-4-trifluoromethoxy-[1,1';4',1'']terphenyl
cpgu-3-ot 524709-77-1 610-847-3
2,3,3,4,4-pentafluoro-2,5-bis(1,1,1,2,3,3,3-heptafluoropropan-2-yl)-5-methoxytetrahydrofuran
Novec 7700 957209-18-6 812-244-2
HFCs Hydrofluorocarbons
Pentafluoroethane HFC-125 354-33-6 206-557-8
1,1,1,2-Tetrafluoroethane HFC-134a; Norflurane
811-97-2 212-377-0
1,1,1,2,3,3,3-heptafluoropropane HFC-227ea 431-89-0 207-079-2
1,1,1,3,3,3-hexafluoropropane HFC-236fa 690-39-1 425-320-1
1,1,1,2,3,3-hexafluoropropane HFC-236ea 431-63-0 207-076-6
reaction mass of (R, R)-1,1,1,2,2,3,4,5,5,5-decafluoropentane and (S, S)-1,1,1,2,2,3,4,5,5,5-decafluoropentane
HFC-4310mee; Vertrel XF
142347-07-7; 138495-42-8
420-640-8; 604-080-3
1,1,1,2,2,3,3,4,4,5,5,6,6-tridecafluorohexane
HFC-5213 355-37-3 206-581-9
1,1,1-trifluoroethane HFC-143a 420-46-2 206-996-5
1,1,1,3,3-pentafluoropropane HFC-245fa 460-73-1 419-170-6
1,1,1,3,3-pentafluorobutane HFC-365mfc 406-58-6 430-250-1; 609-856-5
1,1,1,2,2,3,3,4,4,5,5,6,6-tridecafluorooctane HFC-7613; C6-ethane
80793-17-5 700-684-7
1,1,2,2,3,3,4-heptafluorocyclopentane HFCPA; ZEORORA
15290-77-4 430-710-1
HFEs Hydrofluoroethers
1,1,1,2,2,3,3,4,4-Nonafluoro-4-methoxybutane - 2-[difluoro(methoxy)methyl]-1,1,1,2,3,3,3-heptafluoropropane (1:1)
HFE-7100 - 422-270-2
1-ethoxy-1,1,2,2,3,3,4,4,4-nonafluorobutane; reaction mass of: 1-
HFE-7200 - 425-340-0

P.O. Box 400, FI-00121 Helsinki, Finland | Tel. +358 9 686180 | echa.europa.eu
181
PFAS group No. of C PFAS Abbreviation CAS No EC Nos ethoxy-1,1,2,3,3,3-hexafluoro-2-(trifluoromethyl)propane
1,1,1,2,2,3,4,5,5,5-Decafluoro-3-methoxy-4-(trifluoromethyl)pentane
HFE-7300 132182-92-4 459-520-5
3-Ethoxyperfluoro(2-methylhexane) HFE-7500 297730-93-9 435-790-1
3-(Difluoromethoxy)-1,1,2,2-tetrafluoropropanec
HFE-356pcf3 35042-99-0 700-755-2
Sevoflurane 28523-86-6 643-089-7
HFOs Hydrofluoroolefins
2,3,3,3-Tetrafluoro-1-propene HFO-1234yf 754-12-1 468-710-7
3,3,3-trifluoropropene HFO-1243zf 677-21-4 211-637-0
(1E)-1,3,3,3-Tetrafluoro-1-propene HFO-1234ze(E) 1645-83-6 471-480-0
(2Z)-1,1,1,4,4,4-Hexafluoro-2-butene HFO-1336mzz(Z)
692-49-9 700-651-7
(2E)-1,1,1,4,4,4-Hexafluoro-2-butene HFO-1336mzz(E)
66711-86-2 811-213-0
1-1-difluoroethene HFO-1132a; Vinylidenfluoride
75-38-7 200-867-7
TFA PRECURSOR
2,2,2-Trifluoroethanol - 75-89-8 200-913-6
Polymeric PFASs
Polychlorotrifluoroethylene (i.p.: pure trimer, pure tetramer, Halocarbon 3.1 oils)
PCTFE 9002-83-9 618-336-7
Polytetrafluoroethylene (i.p.: granulates, fine powders, nano & micro-powders, or aqueous dispersions)
PTFE 9002-84-0 618-337-2
Polyvinylidene fluoride PVDF 24937-79-9 607-458-6
Perfluoropolyether (i.p.: PFPE K, PFPE D, PFPE Z, PFPE D)
PFPE - -
fluorotelomer-based acrylate polymer - - -
fluorotelomer-based urethane polymer - - -
i.p. = in particular
From these reviews, assessments, and experimental data (peer-reviewed publications as well as study reports from industry), it can be inferred that exposure to PFASs can result in various health effects. The strength of evidence is not the same for all effects and all PFASs, given that not all endpoints and all PFASs have been studied extensively. EFSA (2018) and EFSA (2020) reviewed the epidemiological evidence for association between PFAS exposure and adverse effects in humans. Most of the available information was on PFOS and PFOA, but information was also available for other PFASs, especially PFCAs and PFSAs. Based on human data, EFSA concluded that there is sufficient evidence for an association between serum levels of at least PFOS and PFOA and a reduction in antibody response after vaccination, increased serum cholesterol, increased serum alanine transferase (ALT) and reduced birth weight. There was also some evidence to suggest associations with increased propensity of infections. For other outcomes investigated, there was insufficient evidence to conclude such associations. EFSA selected effects on the immune system as the critical effect in both experimental animals and humans and derived the TWI for four PFASs based on a human study (EFSA, 2020).
For PFOS, PFOA, PFNA, and PFDA and their salts sufficient data for harmonized classifications for carcinogenicity (Carc. 2), reproductive toxicity (Repr. 1B), effects on or via lactation (Lact.) and STOT RE 1 (except for PFDA) are available, see Table B.16. Harmonized classifications have recently also been agreed by RAC for PFHpA (Repr. 1B and

P.O. Box 400, FI-00121 Helsinki, Finland | Tel. +358 9 686180 | echa.europa.eu
182
STOT RE 1)23 and 6:2 FTOH (STOT RE 2)24; these await official publication. Annex A. Despite a lack of harmonized classification available studies indicate similar concerns for some other PFASs. Of note, HFPO-DA, POSF, 6:2 FTSA and 8:2 FTSA have self-classifications for STOT RE, and POSF as well for reproductive toxicity. Of further note and supporting evidence for similarities in the toxicity profile, is that a number of other PFAAs and PFAA precursors have self-classifications for Carc., Repr., Lact. and STOT RE (see Table B.17 and Table B.20). A summary of the human health concerns from the available information is presented in the sections below. The dossier submitter applied a qualitative approach for the description of human health concerns with focus on endpoints considered most relevant for long-term exposure: repeated-dose toxicity (with targets most consistently affected by PFASs in experimental animals: liver, kidney, thyroid, immune system, serum lipids), carcinogenicity, and toxicity to reproduction. The endpoints acute toxicity, irritation, corrosivity, and sensitisation are not considered relevant for the human health risk assessment of this restriction proposal for PFASs. Mutagenic effects are reported only for a minority of PFASs and hence, this endpoint is also not considered further for the PFAS hazard assessment. An update of epidemiological data not included in the EFSA 2020 scientific opinion is presented in B.5.3. The following sections only include statements for substances which were screened to date.
B.5.1. Toxicokinetics/ADME (absorption, metabolism, distribution and elimination) of non-polymeric PFASs
The current state of knowledge on toxicokinetics of numerous and structurally diverse PFASs relies on studies with considerable heterogeneity. Existing data have recently been thoroughly reviewed for PFCAs and PFSAs, and some precursors (EFSA, 2020, Fenton et al., 2021, ATSDR, 2021, Pizzurro et al., 2019), and for PFECAs (Rice et al., 2021) and is summarised below. Also, updated literature searches for these compounds as well as for PFASs not included in the scopes of these reviews have been performed and additional ADME data has been identified. Inter-species differences in toxicokinetics, in particular tissue distribution and elimination, should be taken into account when extrapolating animal data to human health (Pizzurro et al., 2019).
B.5.1.1. Absorption
EFSA (2020) and ATSDR (2021) have concluded that, based on both experimental animal studies and human studies, a range of PFASs and in particular PFCAs and PFSAs are readily absorbed upon oral exposure. PFASs are also absorbed via inhalation and dermal contact, but no quantitative estimates are currently available (ATSDR, 2021).
Experimental animals
Data on absorption after oral exposure in rats, mice and monkeys are available for several PFASs, e.g., PFCAs (PFBA, PFHxA, PFHpA, PFOA, PFNA, PFDA, PFUnDA, PFDoDA, PFTrDA and PFTeDA), for some PFSAs (PFBS, PFHxS, PFOS), for two PFECAs (HFPO-DA, ADONA). Fractional absorption ranges from >50% for PFBS to >95% for PFHxS, PFOA, PFBA, PFNA, PFDA, PFUnA, and PFDoDA (ATSDR, 2021). PFPAs and PFPiAs are also absorbed into the bloodstream of rats, even high molecular weight compounds such as C6/C12 PFPiA and
23 RAC (2020): Committee for Risk Assessment (RAC) Opinion proposing harmonised classification and labelling at EU level of Perfluoroheptanoic acid; tridecafluoroheptanoic acid. ECHA/RAC/DOC No CLH-O-0000006908-60-01/F
24 Opinion (adopted 26 November 2021) not yet published on ECHA website

P.O. Box 400, FI-00121 Helsinki, Finland | Tel. +358 9 686180 | echa.europa.eu
183
C8/C10 PFPiA (1002 amu) (D'Eon and Mabury, 2010, Joudan et al., 2017). Absorption half-lives were 2.7±0.5 h for C6/C8 PFPiA, 2.1±1.2 h for C8 PFPA, and 1.3±0.4 h for C8/C8 PFPiA (Joudan et al., 2017). The fluorotelomer alcohol 8:2 FTOH is rapidly absorbed at rates of 27-57% in rats (EFSA, 2020). Also for Noviflumuron (a complex ether-based PFAS) high absorption rates of 74-93% of the orally administered dose have been reported in rats (TERC, 2003).
PFASs can also be absorbed via inhalation (evidence for PFOA in rats) or dermal contact (evidence for PFBA, PFOA, and PFOS in rabbits and rodents), but no quantitative estimates on the fractional absorption in animals were identified (ATSDR, 2021, Weatherly et al., 2021).
Humans
EFSA (2020) concluded that based on observations of elevated levels of PFCAs and PFSAs in humans exposed to contaminated water the gastrointestinal absorption of these PFASs occurs to a significant degree. For example, adults exposed to specific PFASs via contaminated drinking water in Italy and Sweden, had elevated serum concentrations of PFOA, PFOS and PFHxA when compared to the general population (Ingelido et al., 2018, Shi et al., 2016). Further, elevated concentrations of 6:2 Cl-PFESA and 8:2 Cl-PFESA were observed in high fish consumers from China, indicating high oral absorption also of these two replacement PFASs (Shi et al., 2016), demonstrating similarities to already restricted PFASs such as PFOA and PFOS.
Absorption by inhalation and dermal contact is also based on indirect evidence. For example, in adults occupationally exposed to PFASs during fluorochemical production (primarily exposure via inhalation), elevated blood concentrations were observed, with median PFOA, PFOS and PFHxS concentrations in the range 500-7000 ng/mL (Fromme et al., 2009, Olsen, 2015). Also, studies on professional ski waxers reported elevated blood concentrations of a range of PFCAs (Nilsson et al., 2013b, Nilsson et al., 2010b, Freberg et al., 2010), probably due to inhalation of very high levels of PFASs measured in air in waxing cabins (Nilsson et al., 2010a).
F-gases are absorbed via inhalation at low rates. For HFCs, HFC-134a, HFC-143a, HFC-152a, HFC-145fa (Ernstgård et al., 2009, Ernstgård et al., 2012, Gunnare et al., 2006, Gunnare et al., 2007) absorption rates from these studies have been summarized to be <4% (Ernstgard et al., 2012).
B.5.1.2. Distribution
As concluded by EFSA (2020) and ATSDR (2021), and based on data from both animal and human studies, PFCAs and PFSAs are distributed widely in the body and the highest concentrations have been observed in the protein-rich tissues liver, kidneys, and blood. Similar distribution patterns have been reported for some other PFASs, while different patterns have also been shown for certain PFASs.
PFAS protein binding in different animal species is detailed in B.4.3. PFCAs and PFSAs bind in particular to serum albumin and some intracellular proteins including liver fatty acid binding protein (L-FABP) with implications for blood and tissue distribution.
Experimental animals
For ADONA (Rice et al., 2021), PFPAs and PFPiAs (D'Eon and Mabury, 2010, Joudan et al., 2017), similar distribution patterns as for PFCAs and PFSAs (EFSA, 2020, ATSDR, 2021) have been observed. 8:2 FTOH distributes rapidly to blood and tissues in rats with highest levels of 8:2 FTOH in fat, liver, thyroid and adrenals (EFSA, 2020, Fasano et al., 2006). Noviflumuron (a complex ether-based PFAS) is distributed to organs in the order of fat >>

P.O. Box 400, FI-00121 Helsinki, Finland | Tel. +358 9 686180 | echa.europa.eu
184
adrenal = skin > ovaries followed by spleen and liver (TERC, 2004). For Noviflumuron, there was only limited transplacental transfer in rats (TERC, 2005).
6:2 FTSA, but not 6:2 FTCA, was detected at high levels in serum and liver following repeat dose exposure (Sheng et al., 2017), whereas 6:2 Cl-PFESA has been shown to distribute to serum, gut (Pan et al., 2019b) and liver (Pan et al., 2021). Similarly, sodium ρ-perfluorous nonenoxybenzene sulfonate (OBS) distribute to mouse liver, but also to the gut (colon, ileum). At the highest dose, OBS was also detected in serum, kidney and faeces (Wang et al., 2019a).
In addition to organ distribution, PFCAs and PFSAs can be distributed to breast milk and cross the placenta and can thus be transferred from the dams to the foetus, resulting in maternal excretion of these compounds (see B.5.1.4) and exposure of the foetus/infant (ATSDR, 2021, EFSA, 2020, Bartels et al., 2020).
Humans
In humans, very few studies on organ distribution have been published, likely due to limited sample availability. Levels of PFASs measured in human organs and other human samples relevant for distribution are presented in section B.9.7. on human biomonitoring.
In three studies of PFASs in human liver tissues PFOS was the most abundant PFAS at mean levels ranging from 14-27 ng/g (Maestri et al., 2006, Karrman et al., 2010, Olsen et al., 2003). PFBA detected at high levels in lung autopsy tissue in Spain by (Perez et al., 2013) can likely be ascribed to analytical problems, since it was recently refuted by Abraham et al. (2021). Abraham et al. (2021) found low or non-detectable levels in lung autopsies from France. This is more in line with what is expected based on low bioaccumulation potential and short biological half-life of PFBA.
A study by (Wang et al., 2018) demonstrated that several PFASs can cross the cerebrospinal fluid barrier. Detectable levels were observed in more than half of the cerebrospinal fluid samples for PFOA, PFNA, PFDA, PFHxS, PFOS and 6:2 Cl-PFESA. These compounds were also the most prominent compounds in the serum samples. This study supports a previous study (Fujii et al., 2015) that show the presence of PFASs in cerebrospinal fluid, but at significantly lower concentrations than in serum presumably due to the blood brain barrier in adults.
PFASs can cross the blood-follicle barrier and the resulting concentration in follicular fluid indicates exposure to maturing oocytes that grow in the ovarian follicle. The median blood-follicle transfer efficiencies (ratio of follicular fluid:serum) of PFAAs measured in four different studies ranged from 0.47 (PFDoDA) to 1.04 (PFHxS) (Kang et al., 2020, Heffernan et al., 2018, McCoy et al., 2017, Hallberg et al., 2021). The follicle transfer efficiencies for Cl-PFESAs have been reported to be 0.73, 0.75 and 0.91 for 4:2 Cl-PFESA, 6:2 Cl-PFESA and 8:2 Cl-PFESA, respectively, demonstrating similar properties for replacement PFASs as for already restricted PFASs such as PFOS and PFOA (Kang et al., 2020). Other investigated PFASs, e.g, 4:4 C8 PFESA, 4:4 C8 PFECA, C8 Polyether PFECA as well as 9Cl-PF3ONS (CAS 756426-58-1), PFECHS (CAS 646-83-3) also had blood-follicle transfer efficiencies in the range from 0.72 to 0.94 (Hallberg et al., 2021, Kang et al., 2020). Strong correlations between PFASs in serum/plasma and follicular fluid indicate that serum/plasma is a good proxy for determining the oocyte exposure levels.
PFCAs and PFSAs as well as replacement PFASs such as 6:2 Cl-PFESA and 8:2 Cl-PFESA, can readily cross the placenta and thus be transferred to the foetus (see section B.9.7. on human biomonitoring). A recent study on human embryonic and foetal organs found that concentrations in embryo/foetal tissue were lower than maternal serum and similar to placenta levels. The concentration of the sum of five PFASs (PFOS, PFOA, PFNA, PFDA and PFUnDA) was highest in lung and liver tissue and lowest in CNS samples (Mamsen et al.,

P.O. Box 400, FI-00121 Helsinki, Finland | Tel. +358 9 686180 | echa.europa.eu
185
2019).
B.5.1.3. Metabolism
Several PFASs have been shown to be excreted untransformed, i.e. without forming any metabolites or conjugates while others are readily metabolised, often to arrowhead PFASs and will thus contribute to exposure to these compounds (ATSDR, 2021, EFSA, 2020).
Experimental animals
No metabolism has been observed or is expected for PFCAs and PFSAs (ATSDR, 2021, EFSA, 2020). Similarly, no metabolism has been reported for PFPAs (Joudan et al., 2017) and 6:2 Cl-PFESA (Wang et al., 2013), as well as for PFECAs HFPO-DA, ADONA, and EEA (Rice et al., 2021). These substances are thus considered metabolically inert and stable end-stage products. In contrast, studies on experimental animals have demonstrated that other PFAS groups such as FTOHs, PAPs and FASAs are transformed to the arrowhead groups PFCAs and PFSAs (EFSA, 2020). 6:2 FTOH is also shown to be metabolized in rats, the primary stable metabolite being 5:3 fluorotelomer carboxylic acid (5:3 FTCA), but also PFCAs, such as PFBA, PFPeA, PFHxA and PFHpA (Ruan et al., 2014, Kabadi et al., 2018, Kabadi et al., 2020). In addition fluoride appears to be released during the metabolism (Mukerji et al., 2015). 8:2 FTOH metabolises to glucuronide and glutathione conjugates of the parent compound, oxidised and reduced intermediates and PFOA, PFNA, PFHpA and PFHxA (EFSA, 2020). In rats, PFPiAs are extensively metabolized by cleavage of one C–P bond yielding the corresponding PFPA and 1H-perfluoroalkanes (Joudan et al., 2017).
In a mouse study with exposure to aqueous film-forming foam (AFFF) PFAS mixture of C6 and C7 perfluoroalkyl sulfonates (PFSAs) were enriched in mouse serum, suggesting in vivo transformation of sulfonamide precursors. Some substituted C8 PFSAs [keto-perfluorooctane sulfonate (PFOS), hydrogen-PFOS, and unsaturated PFOS] appeared to be more bioaccumulative than linear PFOS, or were formed in vivo from unidentified precursors. Sulfonimide dimers were detected in serum that may have been a minor component of the AFFF or formed via metabolism (McDonough et al., 2020a).
Some metabolism was reported for Noviflumuron in rats (>5% of administered dose): urinary metabolites included a glucuronide, sulphate conjugates of hexafluoroalkoxy-fluorodichloroaniline and a mercapturic acid conjugate of parent compound, but 84-100% was parent test material (TERC, 2003).
Exposure to HFO-1234yf led to low extent (< 0.1% of dose received) of biotransformation in rabbits (Schuster et al., 2010). Urinary metabolites included N-acetyl-S-(3,3,3-trifluoro-2-hydroxypropanyl)-l-cysteine (predominant metabolite), S-(3,3,3-Trifluoro-2-hydroxypropanyl)mercaptolactic acid, 3,3,3-trifluoro-1,2-dihydroxypropane, 3,3,3-trifluoro-2-propanol, and inorganic fluoride (Schuster et al., 2010).
Humans
Similar to experimental animals, no metabolism has been observed for PFCAs and PFSAs (EFSA, 2020), and this is likely also the case for other PFASs that are not metabolised in experimental animals. It is shown that humans are able to transform precursors to PFCAs and PFSAs, similar to experimental animals (EFSA, 2020). For example, 8:2 FTOH is transformed to FTCAs and FTUCAs and further to PFOA and PFNA (Nilsson et al., 2013a, EFSA, 2020).
For HFCs, no urinary metabolites were detected after exposure to HFC-134a (Gunnare et al., 2006), HFC-143a (Gunnare et al., 2007), HFC152a (Ernstgård et al., 2012), or HFC-245fa (Ernstgård et al., 2009), summarized by (Ernstgard et al., 2012).

P.O. Box 400, FI-00121 Helsinki, Finland | Tel. +358 9 686180 | echa.europa.eu
186
B.5.1.4. Excretion
As summarised by (EFSA, 2020) and (ATSDR, 2021) a range of PFASs, and in particular PFCAs and PFSASs, are eliminated both through urine and via faeces. In addition, excretion through transplacental transfer, menstruation and breastfeeding has been demonstrated. In humans, long elimination half-lives have been observed for several PFASs, while other PFASs are excreted faster and do thus have shorter elimination half-lives.
Experimental animals
Urine is the main excretion route for PFCAs with less than 10 carbon atoms (C < 10) (EFSA, 2020), while for PFCAs with 10 or more carbon atoms, biliary excretion and subsequent excretion via faeces is the main elimination route (EFSA, 2020). Elimination of PFCAs in rats is faster in females than in males (EFSA, 2020). PFSAs (only data available for C ≤ 8) are primarily eliminated in urine, and to a lesser extent in faeces (EFSA, 2020). In rats, 8:2 FTOH is mainly eliminated via faces (70%), to a lesser extent through biliary excretion (20-45%), and by less than 4% via urine (EFSA, 2020). For Noviflumuron (complex ether-based PFAS), 63% of the dose was eliminated via faeces (cumulatively) in rats and 53 - 90 % of the was recovered in the faeces within 72 h (TERC, 2002) (TERC, 2004). Urine is considered a minor excretion route for Noviflumuron, as only 0.7 - 5.0 % was recovered in the urine independent of the dose (TERC, 2002) and the total cumulative urinary elimination was about 12 % of the dose (TERC, 2004). Breast milk also represents a significant route of excretion for Noviflumuron in rats (TERC, 2005).
For F-gases, metabolites of HFO-1234yf were mostly excreted in urine within 12 h after the end of exposure in rabbits (t1/2 of ca. 9.5(Schuster et al., 2010).
Serum half-lives of several PFCAs and PFSAs in experimental animals have been summarised by EFSA (2020), ATSDR (2021) and Fenton et al. (2021). In rats, serum half-lives from less than an hour or few hours for PFHxA and PFBS up to more than 100 days for PFDA and one of the isomers of PFOS (1m-PFOS) have been reported. In mice, half-lives between 3 hours (PFBA, females) and 228 days (PFNA, males) have been reported (EFSA, 2020). In male rats, the blood half-life was 0.95 h for C8 PFPA and 2.8 h for C8/C8 PFPiA (Joudan et al., 2017). A recent study on CD-1 mice reported serum half-lives of PFBS of 5.8 (M) and 4.5 (F) h, respectively (Lau et al., 2020). Large sex differences in elimination half-lives have been observed in rats, while the differences are smaller in mice (EFSA, 2020, ATSDR, 2021, Fenton et al., 2021). The 6:2 FTOH metabolite, 5:3 FTCA is estimated to have plasma half-lives of 64 (m) – 67 (f) days in rats, and under conditions of repeated oral 6:2 FTOH exposure it would take approximately one year for the 5:3 FTCA to reach steady state (Kabadi et al., 2020). Half-life of 8:2 FTOH was 7-9 days in rats (EFSA, 2020, Fasano et al., 2006).
Humans
In humans, short-chain PFCAs, are mostly excreted in urine, whereas PFNA and longer chain PFASs are preferentially eliminated through the bile (EFSA, 2020). 6:2 Cl-PFESA and 8:2 Cl-PFESA have also been detected in urine, demonstrating urinary excretion (Shi et al., 2016). 6:2 Cl-PFESA was not detected in urine from USA (Calafat et al., 2019, Kato et al., 2018), likely due to low human exposure to these compounds.
Breast milk also represents a significant route of excretion for PFCAs, and PFSAs (ATSDR, 2021, EFSA, 2020). Replacement PFASs such as 6:2 Cl-PFESA and 8:2 Cl-PFESA have also been detected in relatively high concentrations in breast milk in China, indicating similarities with restricted PFASs such as PFOS and PFOA (Awad et al., 2020, Jin et al., 2020a) . In contrast, 6:2 Cl-PFESA and 8:2 Cl-PFESA were not detected in breast milk from Sweden and Czech Republic (Awad et al., 2020, Cerna et al., 2020), likely due to low human exposure to these compounds.

P.O. Box 400, FI-00121 Helsinki, Finland | Tel. +358 9 686180 | echa.europa.eu
187
Other routes of elimination are transplacental transfer and blood loss during menstruation as summarised for PFCAs and PFSAs by EFSA (2020) and ATSDR (2021). Median ratios between fetal:maternal blood are in the range of 0.36 - 0.74 for PFHxS, PFOS, PFOA, PFNA and 6:2 Cl-PFESA (Chen et al., 2017, EFSA, 2020). The transfer rates probably depend on the structure of the compound, where longer fluoroalkyl chain length and a terminal sulfonate group are associated with a lower fetal:maternal blood ratio (EFSA, 2020). Transplacental transfer, menstruation and breastfeeding may at least partly explain gender differences in levels of PFASs between men and women (EFSA, 2020). For 6:2 Cl-PFESA and 8:2 Cl-PFESA transplacental transfer has also been demonstrated, and both compounds were detected both in placenta samples as well as in cord blood (Cai et al., 2020, Chen et al., 2017, Gao et al., 2019, Lu et al., 2021). Again, this shows similarities between these replacement PFASs and the restricted PFASs such as PFOS and PFOA.
Total elimination half-lives of PFCAs and PFSAs in humans, range from a few days (PFBA) to several years (for example PFOS, PFOA and PFHxS) (EFSA, 2020, ATSDR, 2021, Fenton et al., 2021). In a study by Li et al. (2018b), marked sex differences in elimination half-lives were observed for PFHxS and PFOS, with more rapid elimination in women compared to men, while the difference between sexes was only marginal for PFOA (Li et al., 2018b). The long human elimination half‐lives of long‐chain PFASs are mainly attributed to active renal and intestinal reabsorption via organic anion transporters (OATs) (EFSA, 2020, Fenton et al., 2021, Ducatman et al., 2021). PFOA and PFOS have been shown to have a high affinity for human transport proteins such as OAT1, OAT3 and urate transporter URAT1 (EFSA, 2020), contributing to their long half-lives in humans.
Differences in renal reabsorption is considered a main reason for variability in the half-lives of PFASs between species. Serum albumin binding is also important for the long half-life of many PFASs as it limits renal excretion due to less free PFAS in the circulation (Fenton et al., 2021). In a study including individuals with high exposure to 6:2 Cl-PFESA a median elimination half-life of 15.3 years was reported, again indicating similarities between these replacement PFASs and the restricted PFASs such as PFOS and PFOA (Shi et al., 2016). It may be suspected that PFPA and PFPiA have longer half-lives in humans than in rats, though predictions are complicated by the metabolism of PFPiAs (Joudan et al., 2017).
B.5.1.5. Toxicokinetics/ADME of polymeric PFASs
With reference to the REACH definition of a polymer (regulation EC No 1907/2006), the dossier submitter identified diverse groups of polymeric PFASs (e.g. side-chain fluorinated polymers, fluoropolymers, incl. fluoroelastomers, and perfluoropolyethers).
Different grades of polymeric PFASs, such as fluids, gels, solid polymers, elastomers (rubber-like), resins, powders of diverse particle sizes, and granular, etc. are known.
In general, polymeric PFASs of low (e.g., PCTFE-oils, micro-powder PTFE) and high molecular weight (e.g., PTFE granular, fine powder, dispersion) are known (Ebnesajjad and Morgan, 2019).
Sizes of polymeric PFASs vary very strongly. Exemplarily for PTFE they can be in the range of nanoscale (e.g. nano-powder, average particle size: ~1.0 µm and smaller), microscale (e.g. fine- or micropowder, particle size > 1µm) and macroscale (e.g. granules, membranes, plastics, etc.) (Fuzhou Topda New material Co., Ltd. (website, latest products posts from 28.6.2021)25; (Henry et al., 2018, Lohmann et al., 2020)). Furthermore, the size of pellets, e.g. from other fluoropolymers, such as ETFE, FEP, PFA, were reported in
25 https://www.fluorochemie.com

P.O. Box 400, FI-00121 Helsinki, Finland | Tel. +358 9 686180 | echa.europa.eu
188
the range of 2 to 4 mm (Henry et al., 2018).
However, it is known that polymeric PFASs are not a composition of molecules of one homogenous size and shape, but of low and high molecular fractions (with average molecular weight in the order of thousands to millions), and molecules small enough to be diffusible from the plastic or resin (Zapp, 1962).
Most polymers get their specific properties due to further derivation or additives. Besides, certain types/forms of fluoropolymers can be produced without processing aids, such as PTFE granules. Nevertheless, especially the bioavailable fraction is expected to be of high and polymer-specific chemical diversity (e.g. monomers, oligomers, decomposition and combustion products, PFAA/PFEA polymerization aids (e.g., Gen-X, Adona), additives, unintentional PFAS by-products, impurities, etc.) and it is expected to be the relevant driver for hazards (Plastic Europe RMOA, 2021)26. This is confirmed, e.g. by (Zapp, 1962) on the basis of the results from PTFE pyrolysis experiments with mice, rats, rabbits and guinea pigs. Zapp concluded that the purity of the processing aid tetrafluoroethylene monomer (TFE) has a significant influence in the temperature at which the processed PTFE polymer pyrolysis products develop and appear to be toxic (mortality rate). The author compared PTFEs from differently improved polymer production processing techniques (around the 1950/1960s).
In a report by BIO by Deloitte (2014) it is stated that the level of concern of a polymer in general is not only dependent on the number-average molecular weight of polymers, but also on further criteria, such as, oligomer content, amount of reactive functional groups, polarity/water solubility, and polymer class (e.g. being a polyester or not).
Exemplarily, (Henry et al., 2018) stated, that due to their size of mainly 50-250 µm, particles in fluoropolymer powders are often considered to be not absorbed and grouping as polymers of low concern has been proposed. However, Lohmann et al. (2020) argue that mass-based cut-off for fluoropolymers, as suggested by Henry et al. (2018) is not supported by the scientific literature related to bioavailability of similarly sized micro- and nanoplastics of fluorine free polymers.
Thus, the assessment of human health hazard on the basis of the high molecular weight fraction of a polymeric PFAS alone may lead to an underestimation of the hazard, because it will adress the non-bioavailable/inert fraction of the whole polymer and not the bioavailable fraction of individual polymeric PFASs, which is expected to be low.
Besides, it is expected that non-bioavailable polymeric PFASs, such as fluoropolymers/fluoroplastics, may end up in bioavailable particles or chemicals at the end of their life cycle. This is in alignment, on one hand with e.g., (Lohmann et al., 2020) who expect, that at any point in their lifecycle fluoropolymers may generate PFAAs at end-of-life, and as such contribute to the overall exposure to and risks of PFAAs. And on the other hand with a paper from (Kik et al., 2020) on polystyrene, where the authors state that non-bioavailable solid plastics may be degraded into micro-particles <5µm in diameter, and further into nanoparticles <100 nm in diameter.
It can be expected that low molecular weight polymeric PFASs, such as trimers and tetramers of PCTFE (polymers with 3 and 4 repeat units, respectively) used as base oils in lubricants (Rudnick, 2020), have different exposure routes and ADME characteristics compared to high molecular weight polymers with >10 000 monomer repeat units of PTFE,
26 https://fluoropolymers.plasticseurope.org/application/files/9916/3671/0265/Fluoropolymers_Product_Group_-_RMOA_September_2021.pdf

P.O. Box 400, FI-00121 Helsinki, Finland | Tel. +358 9 686180 | echa.europa.eu
189
e.g. used in membranes or coatings of non-sticking kitchen ware.
(Lohmann et al., 2020) also state that fluoropolymer particles of PTFE powders vary in size, and that polymers contain high and low molecular weight fractions, which may contain residual monomers and oligomers. Different grades of PTFE are described by ((Henry et al., 2018, Lohmann et al., 2020); Fuzhou Topda New material Co., Ltd. (website, latest products posts from 28.6.2021)27.
In an in vitro study of the deposition of Teflon particles of 3.8 and 12 µm in geometric diameter (no further details on the fluoropolymer characteristics given) on the inner surface of the lung, the studied Teflon particles were shown to immerse and submerse on the hamster alveoli site (Gaspar et al., 2018, Geiser et al., 2003). Also other non-fluoropolymer nano- and micro particles have been demonstrated to penetrate cell membranes, e.g. in hamster lung cells (particles up to 6 µm diameter (Geiser et al., 2003), in oyster gills, and HP cells (non-fluoropolymer particles up to 50 nm) (Gaspar et al., 2018), which may also apply to other fluoropolymers (Lohmann et al., 2020). Additionally, cellular uptake of particles up to 350 nm (clathrin-mediated endocytosis) is known (Augustine et al., 2020).
Furthermore, with chemotherapeutic drugs to cancer cells which have been developed to enter cells, it has been shown that substances with molecular weights between 12 000 – 21 000 Da, have the potential to penetrate cells (Kroger and Paulusse, 2018). For comparison, the average particle size of PTFE nanopowder (molecular size of 10 000 – 30 000 Da; produced by Fuzhou Topda New Material Co., Ltd (website, latest products posts from 28.6.2021))28, was described with ~1.0 µm. Particle sizes of side-chain fluorinated polymers in the formulation of a fluorotelomer-based acrylate polymer (Russell et al., 2008) and of a fluorotelomer-based urethane polymer (Russell et al., 2010) were described to be in the range of 100 to 300 nm, while the molecular weights were 40 000 Da29 and 3 500 Da30, respectively. Polymers defined in the EU as such, can consist of fewer than 10 monomers, which are likely to be small and bioavailable molecules (Kwiatkowski et al., 2020). The authors state further, that high molecular weight PFASs can be relatively small molecules due to the weight of fluorine, which is 19 times higher than that of hydrogen. Thus, on the basis of the before mentioned information, a cellular uptake of the exemplarily listed polymeric PFASs and of at least in the molecular size comparable polymeric PFASs is expected.
In addition, (Groh et al., 2017) state in their review the existence of large human population subgroups (e.g. infants and elderly people) with an increased intestinal permeability. The authors conclude that this may lead to higher uptake of not only low (< 1 000 Da) but also high (> 1 000 Da) molecular weight compounds.
Also particles of PTFE, e.g. in the range of <1 up to 22 μm, were shown to be able to be absorbed by lung tissues and found in personal samples after long-term occupational
27 https://www.fluorochemie.com
28 https://www.fluorochemie.com
29 number-average molecular weight (Mn), which is defined as the total weight of the molecules divided by the total number of molecules
30 the authors used a weight-average molecular weight, which depends not only on the number of molecules present, but also on the weight of each molecule. It can be calculated as ∑wiMi, where wi is the weight fraction of polymer with molecular weight Mi. The weight-average molecular weight is larger than or equal to the number-average molecular weight

P.O. Box 400, FI-00121 Helsinki, Finland | Tel. +358 9 686180 | echa.europa.eu
190
exposure (Choi et al., 2014, Lee et al., 2018).
Thermal degradation of fluoropolymers (e.g. due to processing, incineration, smoking, accident, fail use, etc.) may result, depending on the properties (e.g. melting point of PVDF = 160°C, PTFE = 340°C), in the generation of toxic gases and particulate fume, which can be absorbed due to inhalation. Thus, absorption of fluoropolymers and/or of their PFASs residues in humans cannot be excluded.
Polakoff et al. (1974) investigated urinary levels of fluoride from 77 workers from a small PTFE fabricant plant. Fume exposures of PTFE happened mainly in the general molding area across ovens (321-376°C). The urinary fluoride levels for the workers in this plant ranged from 0.098 to 2.19 mg/L (converted values).
Additionally, polymeric PFASs may have reactive functional groups of concern, and they may undergo degradation as well as contain low molecular weight PFASs (besides residual monomers and oligomer content) and are therefore potential sources of leachable PFASs (Lohmann et al., 2020). Also in the environment side-chain fluorinated polymers can potentially degrade to PFASs (e.g. fluorotelomer alcohols and PFCAs), as a result of degradation before and after disposal (Wood, 2020, OECD, 2021, Washington et al., 2019). (Balan et al., 2021) reported that PFPEs are less likely to degrade to PFAAs, except perhaps during combustion, while fluoropolymers do not degrade to PFAAs under typical environmental conditions, unless they will be heated to temperatures between 180°C and 800°C, were they were observed to release PFCAs. Some PFPEs (e.g., Krytox 157FS from DuPont with molecular weight range from 7000 - 7500 for FSH and down to 2 500 for FSL (Product information DuPont™ Krytox® 157 FS31)) contain a terminal PFCA-group and have a molecular weight of only several thousand grams per mole and are thus potentially bioavailable (Kwiatkowski et al., 2020). In kidney and urine extracts the formation of a possible kidney metabolite of a low molecular weight fluoropolymer (PCTFE 3.1 oil) has been observed (Kinkead et al., 1989). No further information on the degradation of polymeric PFASs in biofluids is known.
Blood and liver concentrations of PCTFE trimer and tetramer oligomers in monkeys were reported, e.g., after 15-day repeated oral administration of PCTFE Halocarbon oil (3.1) (no further details on the composition) (Jones et al., 1991). 15-days repeated exposure to the polymeric PFAS resulted in steady state concentrations of PCTFE trimers and tetramers in liver of 70 and 100 mg/L, and in kidney of 1.8 and 2 mg/L, respectively. Liver concentrations of PCTFE pure trimer, pure tetramers as well as two different Halocarbon 3.1 oils, with different compositions of C6:C8 oligomers, were reported by DelRaso et al., 1991. Oil A was composed of 55% trimer and 45% tetramers. Oil B was composed of 95% trimer and 5% tetramers. After 14 days of exposure, detected liver concentrations were found in the range of approximately 4000 – 7500 ng/g in the following order: oil B < oil A < pure trimer < pure tetramer.
Also for nebulised low molecular weight PCTFE in rats, blood and further tissue concentrations were reported, e.g., after repeated inhalation (Kinkead et al., 1989). Immediately and by day one after repeated exposure (90-d), 5.9 mg/L and 2.6 mg/L (converted from ng/mL) of total PCTFE oligomers were detected in blood. Comparing the tissue concentrations, highest mean concentrations in ng/g of total PCTFE (trimer + tetramer) (day 0-1 after exposure period) were detected in the following order: fat (1 614 457 ng/g tissue) >>kidney (60 442 ng/g tissue) >lung/liver (~50 000 ng/g tissue)>brain/testes (~25 000 ng/g tissue) >>blood (5 890 ng/g tissue). PCTFE concentration in feces was also measured, but it was too low for useful information. Furthermore, inorganic fluorine concentrations were measured and found to be significantly
31 https://samaro.fr/pdf/FT/KRYTOX_FT_157-FS-series___EN_.pdf

P.O. Box 400, FI-00121 Helsinki, Finland | Tel. +358 9 686180 | echa.europa.eu
191
increased in urine (up to 42 days after exposure) and in bones (up to 48 h after exposure) compared to controls. This indicates absorption after inhalation exposure as well as after systemic distribution of polymeric PFASs with low molecular weight in animals.
However, due to very individual processing procedures - each individually influencing the properties of each single manufactured polymeric PFAS and/or polymeric PFAS product an in-depth assessment of the toxicokinetics of polymeric PFASs is not possible. Another problem is that the majority of available experimental studies only show data of a few polymeric PFASs at specific size, since they may provide well suitability for animal studies.
B.5.2. Evidence from animal data
B.5.2.1. Repeated dose toxicity (animal data)
With respect to the large array of potential health effects and the vast number of different PFASs, this section focuses on the most prominent adverse effects that occur most consistently across different groups of PFASs. These are effects on liver, kidney, thyroid, immune system, and serum lipids. Toxicity to reproduction is covered in a separate section (B.5.2.2.).
B.5.2.1.1. Liver effects in experimental animals
Various reports and reviews demonstrate that the liver is a sensitive and one of the most consistently affected targets of PFAS toxicity in experimental animals (EFSA, 2020, ATSDR, 2021, Fenton et al., 2021). A recent review (Fenton et al., 2021) summarised liver effects for humans and animal studies and concluded that the liver is a primary target organ of PFASs, in particular PFCAs with C≥8 and PFSAs with C≥6. Effects on the liver include specific P450 (CYP) pathway induction, significantly increased liver weight, hepatic steatosis, apoptosis, hepatocellular adenomas and carcinomas, and disrupted fatty acid metabolism that can be peroxisome proliferator–activated receptor alpha (PPARα)–dependent or –independent and present across species (Maestri et al., 2006, Cui et al., 2009, Wan et al., 2012, Perez et al., 2013, Filgo et al., 2015, Xu et al., 2016, Xu et al., 2020b, Yao et al., 2016, Zhang et al., 2016b, Hui et al., 2017, Li et al., 2017, Huang et al., 2013, NTP, 2019c). This section summarises the evidence from animal experiments. Epidemiological evidence for liver toxicity was discussed by EFSA (2020) and an update to EFSA (2020) is provided in section Error! Reference source not found.. Non-polymeric PFASs
Among all studied non-polymeric PFASs, the most consistent effect in the available animal studies is a dose-dependent increase in liver weight, mostly accompanied with hepatocellular hypertrophy and increases in liver enzymes (ALT, AST, ALP) indicative for liver cell dysfunction, for example in rodent models repeatedly exposed to
PFCAs, PFSAs (numerous studies reviewed by (EFSA, 2020, NTP, 2019a, NTP, 2019b, ATSDR, 2021),
TFA (Blake, 1970, Just et al., 1989, CropScience, 2007), Perfluamine (Triskelion, 2019b), PFECAs
o HFPO-DA (e.g., (WIL, 2008b, WIL, 2008a, WIL, 2009, Rushing et al., 2017)), o ADONA (e.g., (NOTOX, 2007a, Gordon, 2011)) o Mv31 K+ salt (Aventis Pharma Deutschland GmbH, 2002), o F-DIOX (Research Toxicology Centre, 2013),
PFESAs o 6:2 Cl-PFESA (Zhang et al., 2018a) o PFESA-BP2 (Lang et al., 2020)
PFE alkenes

P.O. Box 400, FI-00121 Helsinki, Finland | Tel. +358 9 686180 | echa.europa.eu
192
o PMVE (WIL, 2016a), o Mv31 (NOTOX, 2007b),
complex ether-based PFASs, e.g., o Tetraconazole (Huntingdon, N/A-b, Huntingdon, N/A-c), o Noviflumuron (Dow AgroSciences, 2002a), o Ccp-30cf3 (Hita, 2001);
Fluorotelomers o 8:2 FTOH ((Ladics et al., 2008, Wang et al., 2019b), reviewed by (EFSA,
2020)) o EtFOSE ((Xie et al., 2009), reviewed by (EFSA, 2020)) o 6:2 FTSA (6: 2 fluorotelomer sulfonic acid (Sheng et al., 2017)
HFCs o HFC-134a (ICI, 1979, Zeneca, 1993) o HFC-245fa (Frauenhofer Institut für Toxikologie und experim. Medizin,
2005), o HFC-365mfc (TNO, N/A), o HFC-4310mee (Vertrel XF) (Haskell, 1996b, DuPont Haskell, 2007b), o HFC-52-13 (Hita, 1994), o HFC-76-13 (Hita, 2007a), o HFCPA (Huntingdon, 1998a, Huntingdon, 1998d, Huntingdon, 1998c),
HFOs o HFO-1234yf (Tveit et al., 2013), o HFO-1234ze(E) (TNO, 2006), o HFO-1336mzz(Z) (DuPont Haskell, 2014), o HFO-1132a (Litton Bionetics, 1984),
HFEs o HFE-7100 (Huntingdon, 1996b, Huntingdon, 1996a, Huntingdon, 1995), o HFE-7200 (Huntingdon, 1997), o HFE-7300 (Hita, 2004, Charles River, 2019), o HFE-7500 (3M, 1998), o HFE-356pcf3 (DuPont Haskell, 2009, DuPont Haskell, 2011).
Moreover, there are indications for hepatocellular necrosis from experimental rodent models after repeated exposure (28 or 90 days) to for
most PFCAs and PFSAs, except PFBS and PFHxDA (ATSDR, 2021, EFSA, 2020). several PFECAs, e.g.,
o HFPO-DA (DuPont Haskell, 2008a, Haskell, 2010, WIL, 2008a, WIL, 2010a, WIL, 2011a, MPI Research Inc., 2013, Caverly Rae et al., 2015, Wang et al., 2017a, Sheng et al., 2018, Blake et al., 2020),
o HFPO-TA (Sheng et al., 2018), o EEA-NH4 (Hita, 2006), o F-DIOX (Research Toxicology Centre, 2010, Research Toxicology Centre,
2011, Research Toxicology Centre, 2012), PFESAs, e.g.,
o 6:2 Cl-PFESA (Zhang et al., 2018a), complex ether-based PFASs, e.g.,
o Tetraconazole (Huntingdon, N/A-d), o Noviflumuron (Dow AgroSciences, 2002b),
Fluorotelomers, e.g., o 6:2 FTOH (WIL, 2005, Hita, 2007b, Serex et al., 2014, Mukerji et al., 2015,
Rice et al., 2020), o 8:2 FTOH (Ladics et al., 2008), and o 6:2 FTSA (Sheng et al., 2017), and

P.O. Box 400, FI-00121 Helsinki, Finland | Tel. +358 9 686180 | echa.europa.eu
193
HFE-7300 (Hita, 2004). Examples of PFASs that did not induce hepatotoxicity in animal studies are several perfluoroether-alkenes and -alkanes as well as some complex perfluoroether alkylic substances. Within F-gases, hydrofluoroethers generally show typical increased liver weight and hepatocellular hypertrophy, but most hydrofluorocarbons and hydrofluoroolefins only increased liver weights, mainly without histopathological changes, e.g., HFC-134a (ICI, 1979), HFC-52-13 (Hita, 1994), HFO-1234yf (Tveit et al., 2013). For PFASs of different groups (PFCAs, PFSAs, PFECAs) it has been demonstrated that potency differences for liver effects are largely determined by kinetics (serum half-lives) (Gomis et al., 2018). The mechanisms underlying PFAS-induced hepatotoxicity has been extensively studied. As reviewed by EFSA (2020), ATSDR (2021), and Fenton et al. (2021), several PFASs lead to a transcriptional activation of mouse and human PPARα‐related genes in liver in adult‐exposed models. Additionally, activation of other nuclear receptors such as PPARγ, constitutive androstane receptor (CAR), and pregnane X‐receptor (PXR) has also been reported. These nuclear receptors regulate lipid and glucose metabolism and transport as well as inflammation and some nuclear receptor, including PPARα, are considered more responsive in tissues of rodents than in humans (Wolf et al., 2012, Rosen et al., 2017b, Fenton et al., 2021). However, ATSDR (2021) concluded that hepatic effects of PFCAs and PFSAs in rodents likely result from a combination of PPARα-dependent and independent changes, which is in line with a CLH RAC opinion for PFOA (RAC, 2011), demonstrating that human relevance of such effects should be expected.
Polymeric PFASs
The majority of the scarce experimental studies show effects of a few polymeric PFASs at specific size. Thus, shown liver effects of polymeric PFASs give only an exemplary insight into possible health impact and do not allow for a systematic hazard assessment.
Polymeric PFASs were studied within repeated dosed inhalation, dermal and oral toxicity studies. Since the dermal exposure of humans with polymeric PFASs is not relevant for the environmental exposure scenario of this dossier, these data were not considered further.
For lower molecular weight substances of the fluoropolymer PCTFE (CAS-no.: 9002-83-9), liver related effects were reported in rats exposed to PCTFE oils, such as Halocarbon S-27 oil (Kinkead et al., 1990a), Halocarbon 3.1 oils of different compositions (Safetol®3.1/ MLO-87-124, composition 70% C6 : 30% C8) (Kinkead et al., 1989, Kinkead et al., 1990b), 3.1 oil- 55% C6 : 45% C8 (DelRaso et al., 1991), 3.1 oil- 95% C6 : 5% C8 (DelRaso et al., 1991)) as well as pure trimers and pure tetramers (DelRaso et al., 1991, Kinkead et al., 1991). On the basis of the 5 repeated dose oral toxicity studies (DelRaso et al., 1991, Kinkead et al., 1991, Kinkead et al., 1989, Kinkead et al., 1990a, Kinkead et al., 1990b) common hepatotoxic findings in rats were increased relative liver weights, hepatocellular cytomegaly, as well as increased rates of liver fatty acid ß-oxidation. Effects observed in oral studies (Kinkead et al., 1989) were very similar to those reported for repeated inhalation studies (Kinkead et al., 1990b). Also Jones et al. (1991) observed increased rates of liver fatty acid ß-oxidation in rhesus monkeys exposed to Halocarbon oil (3.1) (composition unknown), but effects were not significant. Additional liver effects in rats associated with PCTFE oligomers (pure trimers, pure tetramers or mixture of both in different compositions) differing between studies were, e.g. altered hepatocellular architecture, elevated serum liver-associated enzymes, hepatocytic eosinophilic granular cytoplasm and loss of hepatocytic cytoplasmic basophilia (DelRaso et al., 1991, Kinkead et al., 1991). Kinkead et al. (1990a) concluded on the basis of further observations that the liver was probably the primary target organ. For PCTFE in rats, repeated orally administered tetramers were observed to be more hepatotoxic than trimers (Kinkead et al., 1991).

P.O. Box 400, FI-00121 Helsinki, Finland | Tel. +358 9 686180 | echa.europa.eu
194
For PTFE, the only available information was a very old study from (Zapp, 1962). In this publication it was stated that a laboratory study with rats, fed with a diet of 25% finely ground Teflon TFE resins (composition unknown) for 90 days, showed no signs of toxic effects and no pathological changes detectable by gross or microscopic examination of the tissues. However, insufficiently reported study details (e.g., no information on control group, dose, chemical/polymer characteristics, study design, etc.) weaken the power of the available information. Hence, further studies are needed to be able to assess the potential of liver effects of finely ground Teflon TFE resins.
For side-chain fluorinated polymers (SCFPs) it is known that the PFAS moieties on the side chains can separate from the carbon backbone of at least some commercial SCFPs over time, and may further degrade to PFCAs and PFSAs in the environment and biota (OECD, 2021). Since most PFCAs and PFSAs were shown to cause adverse liver effects in humans and animals, it can be concluded that SCFPs contribute to adverse health effects, e.g. in organs such as liver after repeated exposure. No further toxicity data.
For one perfluoropolyether (PFPE) surfactant, Johnston et al. (1996b) communicated concerns in a letter to the editor, indicating that - based on unpublished data by DuPont Haskell Laboratory - the product (a PFPE trimer) cannot be assumed biologically inert because it caused an increase in liver weight in rats. The authors state that DuPont Haskell Laboratory used a PFPE surfactant, which was similar to the PFPE trimer used by Johnston et al. (1996a) (CF3O(CF2CF(CF3)O)3CF2-COO-NH4+), with an average molecular weight of 740. DelRaso (1996) cited a publication on PFPE Krytox fluorinated oil inhalation toxicity study, but with limited data, and summarized mild toxicity, but without liver effects (such as liver weight, liver enzyme, peroxisomal ß-oxidation or histopathologic examination). However, insufficiently reported study details (e.g., no information on control group, chemical/polymer characteristics, study design, etc.) weaken the power of the available information. Further studies are needed to be able to assess the potential of liver effects, e.g., for this PFPE Krytox oil.
In summary, there are indications that polymeric PFASs can cause adverse liver effects, which is generally in line with the typical effects observed for non-polymeric PFASs. Clarity on liver effects of the highly diverse group cannot be given on the basis of available data.
B.5.2.1.2. Serum lipids in experimental animals
Most animal studies addressing serum cholesterol have been conducted at much higher PFAS exposure levels than human studies (Fragki et al., 2021, EFSA, 2020). In general, studies with experimental animals mainly measured serum total cholesterol which is rather reduced in rodents than increased as observed in epidemiological studies. For instance, total serum cholesterol was reduced after repeated doses for 28 or 90 days in male rodents by PFSAs: PFBS, PFHxS, and PFOS (NTP, 2019b); PFCAs: PFBA (Butenhoff et al., 2012a), PFHxA (Chengelis et al., 2009), PFOA (e.g. (Loveless et al., 2006)), PFNA, PFDA (NTP, 2019a), PFDoDA (Kato et al., 2015), PFODA (Hirata-Koizumi et al., 2012). For PFECAs, HFPO-DA (WIL, 2009, Conley et al., 2019, Conley et al., 2021, DuPont Haskell, 2008b, Sheng et al., 2018), EEA-NH4 (Hita, 2006), and F-DIOX (Research Toxicology Centre, 2013) reduced total cholesterol.
However, some studies report increases in serum cholesterol in mice exposed to human relevant PFOA-levels in combination with high fat or westernized diet (Rebholz et al., 2016, Schlezinger et al., 2020) suggesting that both exposure concentration, diet and sex may influence the effect of PFASs on lipid metabolism. Increases of total cholesterol were reported for HFPO-DA (Blake et al., 2020) and F-DIOX (Research Toxicology Centre, 2011).
An increase in total serum cholesterol was also reported for 6:2 Cl-PFESA (Zhang et al., 2018a), Tetraconazole (Huntingdon, N/A-g, Huntingdon, N/A-b) and Noviflumoron (Dow AgroSciences, 2002a, Dow AgroSciences, 2002b, Dow AgroSciences, 2005b).

P.O. Box 400, FI-00121 Helsinki, Finland | Tel. +358 9 686180 | echa.europa.eu
195
Two hydroflurooethers (F-gases) induced a decrease in total serum cholesterol in rats after repeated exposure to HFE-7100 for 28 days (Anonymous, 1995) or HFE-7500 for 5 days (3M, 1998).
Animal studies show a clear association of PFASs with changes in lipid metabolism. However, due to significant species difference affecting both lipid metabolism and PFAS toxicokinetics (Fragki et al., 2021) and often large differences in exposure levels, the animal experiments have not been able to elucidate the causality of the PFAS – serum cholesterol association demonstrated in epidemiological studies.
Serum triglycerides are mostly reduced in experimental animals (rodents) after repeated exposure to
PFCAs: o PFHxA (Klaunig et al., 2015), o PFOA (DeWitt et al., 2009, Loveless et al., 2006, Qazi et al., 2010, Wu et
al., 2018, Xie et al., 2003), o PFNA (Wang et al., 2015b, NTP, 2019a), o PFDA (NTP, 2019a), o PFTeDA (Hirata-Koizumi et al., 2015), o PFODA (Hirata-Koizumi et al., 2012);
PFSAs: o PFBS (Bijland et al., 2011), o PFOS (Lai et al., 2018);
PFECAs: o HFPO-DA (Blake et al., 2020, Conley et al., 2021, Conley et al., 2019,
DuPont Haskell, 2008b), o HFPO-TA (Sheng et al., 2018), o mv31 K+-salt (Aventis Pharma Deutschland GmbH, 2002), o F-DIOX (Research Toxicology Centre, 2013);
other ether PFASs: o PEVE (Haskell, 1997), o ccp-30cf3 CAS No. 133937-72-1 (Hita, 2001);
and some HFCs/HFOs: o HFC-236fa (Haskell, 1996a), o HFO-1336mzz(Z) (DuPont Haskell, 2010a).
However, similar to cholesterol effects, also considerable increases in serum triglycerides are reported in some rodent studies for
PFHpA (Anonymous, 2017), PFOA (Loveless et al., 2006, Minata et al., 2010), PFDoDA (Zhang et al., 2008), PFOS (Huck et al., 2018, Su et al., 2019), 6:2 Cl-PFESA (Zhang et al., 2018a), HFPO-DA (Conley et al., 2021), F-DIOX (Research Toxicology Centre, 2011), or HFCPA (Huntingdon, 1998d, Huntingdon, 1998c).
In monkeys, repeated oral exposure to PCTFE also led to increased serum triglycerides (Jones et al., 1991).
Serum bile acids are consistently increased in experimental animals after repeated exposure to some PFASs, e.g., PFCAs (NTP, 2019a) or PFSAs (NTP, 2019b). (EFSA, 2020) concluded that such an increase in serum bile acids indicates cholestasis. Increased serum

P.O. Box 400, FI-00121 Helsinki, Finland | Tel. +358 9 686180 | echa.europa.eu
196
bilirubin as another indicator for cholestasis was also evident for some PFCAs (NTP, 2019a) and PFSAs (NTP, 2019b).
B.5.2.1.3. Kidney effects in experimental animals
Non-polymeric PFASs
In experimental animal models (mainly in rats, sometimes mice), kidney weights relative to body mass were increased for some PFAAs, PFECAs, perfluoroether alkenes, complex other ether-based PFASs, and a variety of F-gases (HFCs including HFOs, and HFEs), underlining the variety of chemical structures of PFASs that can induce changes on kidney physiology. Epidemiological evidence for effects on the kidney are summarized by EFSA (2020) and updated in Error! Reference source not found..
Among substances that induced increases in relative kidney weights in rodents are
PFCAs: o PFHxA (NTP, 2019a, Chengelis et al., 2009, Loveless et al., 2009), o PFOA (NTP, 2019a, Griffith and Long, 1980, Butenhoff et al., 2004, Loveless
et al., 2006, Loveless et al., 2008, Cui et al., 2009), o PFNA (NTP, 2019a), o PFDA (NTP, 2019a, Frawley et al., 2018), o PFDoDA (Kato et al., 2015),
PFSAs: o PFBS (NTP, 2019b);
PFECAs: o HFPO-DA (Caverly Rae et al., 2015, DuPont Haskell, 2008b, MPI Research
Inc., 2013, WIL, 2008b, WIL, 2009, WIL, 2010b, WIL, 2010a, Blake et al., 2020),
o EEA-NH4 (Hita, 2006, WIL, 2011b), o F-DIOX (Research Toxicology Centre, 2013, Research Toxicology Centre,
2011); PFE alkenes:
o PMVE (WIL, 2016b, DuPont Haskell, 2007a), o PEVE (Haskell, 1997);
other ether-based PFAS: o Tetraconazole (Huntingdon, N/A-e, Huntingdon, N/A-g, Huntingdon, N/A-b,
Huntingdon, N/A-f), o Noviflumuron (Dow AgroSciences, 2002a, Dow AgroSciences, 2002b, Dow
AgroSciences, 2005a, Dow AgroSciences, 2005b); FTOHs:
o 6:2 FTOH (Hita, 2007b, Kirkpatrick, 2005, Mukerji et al., 2015, Rice et al., 2020, Serex et al., 2014, WIL, 2005)
HFCs: o HFC-134a (ICI, 1979), o HFC-236fa (Haskell, 1996a), o HFC-365mfc (TNO, N/A), o HFC-76-13 (Hita, 2007a), o HFCPA (ZEORORA) (Huntingdon, 1998a);
HFEs: o HFE-7100 (Huntingdon, 1996b), o HFE, 7200 (Mitsubishi, 1996), o HFE-7300 (Hita, 2004), and o HFE-365pcf3 (DuPont Haskell, 2011, DuPont Haskell, 2009).

P.O. Box 400, FI-00121 Helsinki, Finland | Tel. +358 9 686180 | echa.europa.eu
197
For several of these substances, increased kidney weights were accompanied by histopathological changes in the kidneys. For example, minor microscopic findings, tubular epithelial hypertrophy or degeneration were found for
PFCA o PFHxA (Klaunig et al., 2015, WIL, 2005);
PFSA o PFBS (Lieder et al., 2009);
PFECAs: o HFPO-DA (Haskell, 2010, MPI Research Inc., 2013, Caverly Rae et al., 2015,
WIL, 2010b, WIL, 2010a), o ADONA (Charles River Laboratories, 2007a), o EEA-NH4 (Hita, 2006), o F-DIOX (Toxicology Centre S.p.A., 2011);
PFE alkenes: o PMVE (DuPont Haskell, 2007a), o PPVE (Charles River Laboratories, 2017), o PEVE (Haskell, 1997);
other ether-based PFASs: o Tetraconazole (Huntingdon, N/A-f) o Noviflumuron (Dow AgroSciences, 2005b);
fluorotelomer alcohols o 6:2 FTOH (Kirkpatrick, 2005, Rice et al., 2020, Serex et al., 2014, WIL,
2005) HFCs:
o HFC-245fa (Frauenhofer Institut für Toxikologie und experim. Medizin, 2005),
o HFC-76-13 (Hita, 2007a), HFOs:
o HFO-1216 (Haskell, 1989), HFEs:
o HFE-7300 (Hita, 2004), o HFE-356pcf3 (DuPont Haskell, 2011), o Sevoflurane (Gonsowski et al., 1994a, Gonsowski et al., 1994b).
For some substances from different PFAS categories, necrotic effects were reported (PFHxA, HFPO-DA, ADONA, PEVE, HFE-7300, Sevoflurane, HFO-1216). For some other PFASs, including PFOA, PFOS, PFHxS, PFDA, PFUnA, PFBA, and PFDoDA, animal studies did not indicate impaired renal function or morphological damage (ATSDR, 2021).
Polymeric PFASs
In this section, in contrast to the above given arguments against it (details in B.5.1.5.), it will be focussed on the assessment of the hazards regarding the basic polymer component of polymeric PFASs, such as the PCTFE-body. However, due to very individual processing procedures - each individually influencing the properties of each single manufactured polymeric PFAS or polymeric PFAS product an in-depth assessment of the human health hazards of polymeric PFASs is not possible. Another problem is that the majority of the very scarce experimental studies only show effects of a few polymeric PFASs at specific size, since they may provide well suitability for animal studies. Thus, summarised kidney effects of polymeric PFASs give only an exemplary insight into possible health impact and do not allow for a systematic hazard assessment.
Polymeric PFASs were studied within repeated dosed inhalation, dermal and oral toxicity studies. Since the dermal exposure of humans with polymeric PFASs is not relevant for the

P.O. Box 400, FI-00121 Helsinki, Finland | Tel. +358 9 686180 | echa.europa.eu
198
environmental exposure scenario of this dossier, these data were not considered further.
For lower molecular weight substances of the fluoropolymer PCTFE (CAS-no.: 9002-83-9), kidney related effects, such as increases of relative kidney weights, and histologic alterations, were reported in rats exposed to PCTFE oils, such as Halocarbon S-27 oil (Kinkead et al., 1990a), Halocarbon 3.1 oils of different compositions (Safetol®3.1/ MLO-87-124, composition 70% C6 : 30% C8) (Kinkead et al., 1989, Kinkead et al., 1990b)) as well as pure trimers and pure tetramers (Kinkead et al., 1991).
Pronounced increases in blood urea nitrogen (BUN) in rats were reported either after inhalation of PCTFE 3.1 oil (Safetol®3.1/ MLO-87-124, composition 70% C6: 30% C8 (Kinkead et al., 1989, Kinkead et al., 1990b) or after oral administration of PCTFE pure trimers and PCTFE pure tetramers (Kinkead et al., 1991)) as well as PCTFE oils, such as (P)CTFE 3.1 oil (Safetol®3.1) and Halocarbon series 27 oil (HC 27-S with C8-C10 chain length) (Kinkead et al., 1990a). Also Jones et al. (1991) observed increased BUN in 4 rhesus monkeys (15-d, oral) exposed to PCTFE Halocarbon 3.1 oil (C6:C8 composition).
Thus, oligomers of the fluoropolymer PCTFE were demonstrated to cause pronounced kidney effects. Clarity on kidney effects of the highly diverse group of fluoropolymers cannot be given on the basis of available data.
For side-chain fluorinated polymers (SCFPs) it is known that the PFAS moieties on the side chains can separate from the carbon backbone of at least some commercial SCFPs over time, and may further degrade to PFCAs and PFSAs in the environment and biota (OECD, 2021). Since PFCAs and PFSAs were shown to cause adverse kidney effects in humans and animals, it can be concluded that SCFPs contribute to adverse health effects, e.g. in organs such as kidney after repeated exposure. No further toxicity data.
For poly- and perfluoropolyethers (PFPEs), one study was available. In a limit test with rats (1 group, 5/sex) exposed to 1000 mg/kg bw/d of PFPE Fomblin HC/25 product (Mn = 3200, content of low molecular weight <1000 less than 0.1%), compared to controls three of five males (no females) showed significantly increased (localized) basophilia, but no further effects on kidney (Malinverno et al., 1996). Also from the non-polymeric PFAS PFOA, it is known that female rats show less sensitivity compared to male rats, related to lower serum levels in female rats (EFSA, 2020).
B.5.2.1.4. Thyroid effects in experimental animals
Non-polymeric PFASs
In experimental animal models, several PFASs can increase thyroid weight, induce follicular hypertrophy and decrease serum T3 and T4, but only some PFASs induce all of these effects combined in rats (PFBA, PFOA, PFNA, PFDA, PFHxDA, PFHxS, (e.g., NTP, 2019a, NTP, 2019b, MPI Research Inc., 2013, Butenhoff et al., 2012a, Hirata-Koizumi et al., 2015, Ramhoj et al., 2020, Ramhoj et al., 2018).
For several other PFASs (especially PFAAs, including some PFEASs), an indication for thyroid effects is available. Thyroid hormones were reduced without changes in thyroid weight or histopathological changes in rats (and one mouse study for PFHpA) after repeated exposure to:
PFCA: o PFHxA (NTP, 2019a), o PFHpA (Anonymous, 2017);
PFSA: o PFBS (NTP, 2019b, Feng et al., 2017),

P.O. Box 400, FI-00121 Helsinki, Finland | Tel. +358 9 686180 | echa.europa.eu
199
o PFOS (NTP, 2019b); PFECA:
o HFPO-DA (Conley et al., 2019, Conley et al., 2021); PFESA:
o 6:2 Cl-PFESA (Hong et al., 2020); HFEs:
o HFE-7300 (Charles River, 2019).
In contrast, for TFA and HFCs or HFOs there are almost no indications for thyroid effects which may partially be explained by the limited available data.
US EPA used perturbation of thyroid hormone levels as the critical effect to derive a subchronic and chronic reference dose for PFBS. It was acknowledged that there is uncertainty with regard to the potential for adverse developmental effects due to the lack of studies investigating neurodevelopmental effects. Nevertheless, taking all available data together, US EPA concluded that the evidence in animals for thyroid effects supports a hazard (EPA-US, 2021).
With respect to the mode of action, PFASs can interfere with thyroid metabolism on several levels in thyroid hormone biogenesis, distribution and receptor binding (Köhrle, 2008, EFSA, 2020). On the level of biogenesis, PFASs can potentially disturb sodium iodide symporters, hamoprotein thyroperoxidase, iodinases, or deiodinases (EFSA, 2020). On the level of distribution, there is evidence for competitive binding of PFAS to thyroid hormone binding proteins (transtyhretin and thyroxine-binding globulin), but at lower affinities than thyroid hormones (Ren et al., 2016b, Weiss et al., 2009b, Berg et al., 2015, Zhang et al., 2016a, Behnisch et al., 2021, EFSA, 2020, Fenton et al., 2021). Binding of PFCAs and PFSAs to thyroid receptors was shown for PFBA, PFHxA, PFHpA, PFOA, PFNA, PFDA, PFUnDA, PFDoDA, PFTrDA, PFTeDA, PFBS, PFHxS, and PFOS, but not for FTOH (8:2) (Ren et al., 2015). Coperchini et al. (2019) concluded in their review that available evidence, mainly provided by in vitro studies and in animal models, support a thyroid-disrupting effect of the exposure to both old- and new-generation PFASs, while stating that epidemiological data provided contrasting results.
B.5.2.1.5. Immune effects in experimental animals
Strong evidence demonstrates that exposure to several PFASs modifies the immune response, with inhibition/suppression of the immune response as most consistent immunotoxic effect relevant for human health (DeWitt et al., 2019, Fenton et al., 2021, Zeng et al., 2021, NTP, 2016b). In the most recent EFSA opinion on PFASs (EFSA, 2020), effects on the immune system were considered the most critical effects and the risk assessment was based on reduction in vaccine antibody response in children allowing to derive a tolerable weekly intake (TWI) of 4.4 ng/kg bw per week for the sum of four PFASs (PFOS, PFHxS, PFNA, and PFOA). Recent epidemiological literature not included in EFSA (2020) is summarised in section B.5.3.1.1.
In support of the epidemiological evidence, immunotoxic effects have been observed in animal studies for a variety of different PFASs. The following effects have been reported for PFASs across many PFAS subgroups, such as PFAAs, PFEASs, and some F-gases. Reduction of lymphoid organ weights was observed for, e.g., PFHxA (Loveless et al., 2009), PFOA, PFNA, PFDA (NTP, 2019a), F-DIOX (Research Toxicology Centre, 2011), CAS No. 524709-77-1 (Non-Clinical Saftey, 2017). Changes in lymphocyte counts or proliferation was observed for, e.g.,
TFA (BayerCropScience, 2014), PFOA and PFOS (Vetvicka and Vetvickova, 2013), PFDoDA (Kato et al., 2015), HFPO-DA (WIL, 2008a),

P.O. Box 400, FI-00121 Helsinki, Finland | Tel. +358 9 686180 | echa.europa.eu
200
F-DIOX (Research Toxicology Centre, 2013), PMVE (DuPont Haskell, 2007a), Tetraconazole (Huntingdon, N/A-b), HFC-236fa (Haskell, 1996a), HFC-365mfc (Huntingdon, N/A-a), HFO-1216 (Triskelion, 2019a).
Whereas most immunotoxic effects are reported in response to higher PFAS doses, reductions in T-cell-dependent antibody responses (TDAR) are observed also at non-toxic doses of PFOA and PFOS in mice (DeWitt et al., 2009, DeWitt et al., 2008, DeWitt et al., 2016, Dong et al., 2009, EFSA, 2020, Peden-Adams et al., 2008, Zheng et al., 2009, Dong et al., 2011). The TDAR is a measure of functional immune response and has only been performed for a few PFASs. Serum antibody levels were reduced after exposure to PFOA (e.g., DeWitt et al., 2009, DeWitt et al., 2008, DeWitt et al., 2016), PFOS (e.g., Suo et al., 2017, Zheng et al., 2009, Zheng et al., 2011, Peden-Adams et al., 2008, Dong et al., 2009), and histological alterations in immune organs were observed after exposure to, e.g., PFHxA (WIL, 2005), PFOS (Wang et al., 2011a), F-DIOX (Research Toxicology Centre, 2011), PMVE (WIL, 2016b). The most common immunotoxic observations in animal studies are effects on spleen weight followed by thymus weight (reduction in most cases). A recent study in mice exposed to three different perfluoroalkylether carboxylic acids (PFECAs) demonstrated that perfluoro-2-methoxypropanoic acid (PFMOPrA) induced changes in splenic cellularity and perfluoro-4-methoxybutanioc acid (PFMOBA) decreased numbers of B and natural killer (NK) cells (Woodlief et al., 2021). Significant changes in NK cell cytotoxicity or T cell-dependent antibody responses were not observed in this study (Woodlief et al., 2021).
While the immunotoxic effects of some PFASs are well established, the mechanisms leading to the effects are still unclear (ATSDR, 2021, Beans, 2021, EFSA, 2020).
As detailed in Section B.5.1.1, PFAS surfactants may increase the intestinal permeability, as demonstrated in vitro for PFOS, which may contribute to effects on the human immune system (Groh et al., 2017).
B.5.2.1.6. Other effects in experimental animals
Non-polymeric PFASs
For a specific group of compounds, the n:2 fluorortelomer alcohols, another adverse effect finding has been consistently reported in the performed animal studies. Adverse effects on teeth and bone, consistent with fluoride toxicosis, have been seen with increasing doses of 6:2 FTOH (Kirkpatrick, 2005, Rice et al., 2020, Serex et al., 2014, Hita, 2007b, Mukerji et al., 2015, WIL, 2005). Likewise, (Serex et al., 2014) report that similar effects have been seen for 8:2 FTOH exposed animals. The observed effects include: discolouration of the incisors, irregular ameloblast alignment and pigmentation, missing/broken/misaligned incisors, degeneration and atrophy of ameloblastic epithelium, accentuation of the normal laminar pattern of dentin and an increase in incomplete decalcification of enamel. Also incomplete decalcification of nasal bones and long bones (tibia and femur) has also been observed. The animal groups that show adverse effects on teeth and bone have been shown to have statistically significant increases in fluoride concentrations in serum and urine (Serex et al., 2014, Rice et al., 2020).
Polymeric PFASs
Polymeric PFASs were studied within repeated dosed inhalation, dermal and oral toxicity studies. Since the dermal exposure of humans with polymeric PFASs is not relevant for the environmental exposure scenario of this dossier, these data were not considered further. Reports for the fluoropolymers PCTFE and PTFE were available.

P.O. Box 400, FI-00121 Helsinki, Finland | Tel. +358 9 686180 | echa.europa.eu
201
Regarding inhalation toxicity it was shown that, polymeric PFASs, such as PTFE and PCTFE, heated to temperatures above thermostability, may emit toxic decomposition products, such as tetrafluoroethylene (TFE) (Huber et al., 2009). TFE is harmonized classified in STOT RE (ECHA database, last update 04/07/2021) and was reported to be probably carcinogenic to humans (IARC, 2014). Major hazards from incomplete overheating are particulate fumes.
For human inhalation following occupational exposure to PTFE fumes, influenza-like syndrome (polymer fume fever) or severe toxic effects like pulmonary edema and pneumonitis in humans are described (Johnson and Zhu, 2018). PTFE is self-classified as STOT RE 1 (respiratory system/ inhalation) by one notifier (ECHA data base, C&L inventory from 06.10.2021).
Excessive inhalation of aerosolized fluoropolymer-containing waterproofing agents, sealants and ski wax as well as inhalation of pyrolysis products of fluoropolymers (e.g. during manufacture or use) is reported to cause respiratory illness, such as acute chemical pneumonitis, and reactive airway dysfunction syndrome, occasionally accompanied by non-specific systemic symptoms, such as fever, chills, malaise, arthralgias, and nausea (Hays and Spiller, 2014, Johnson, 2018a, Johnson, 2018b, Johnson and Zhu, 2018, Strøm and Alexandersen, 1990). These effects are of unclear etiology but demonstrate a toxicological relevance of polymeric PFASs and their degradation products in acute inhalation exposure scenarios.
Furthermore, occupational long-term exposure (for 28 years) to PTFE spraying can cause granulomatous lung lesions such as pneumoconiosis (Lee et al., 2018). The authors conclude, such lesions appear to be caused not by the degradation products of PTFE from high temperatures but by spraying the particles of PTFE. Scanning electron microscopic (SEM) features of the lesion revealing fluorine elements show multiple round to oval granular material measuring 2–6 μm. Further results in comparison with standard PTFE and PTFE spray solution as used in the factory showed the presence of PTFE in the lung tissue. The particles found in the personal samples measured 1–22 µm by SEM, but particles smaller than 1 μm were also found. Choi et al. (2014) also report three cases of small airway-centered granulomatous lesions in workers employed at facilities that apply coatings to pans and other utensils. The workers were repeatedly exposed (inhalational PTFE exposure was between 7 and 20 years) to PTFE particles that were probably generated by the drying process when PTFE coatings are dried in a convection oven at high temperatures (380-420°C).
In a very old study from 1954, fluorocarbon vapour animal experiments with PTFE, PCTFE and PCTFE including plasticizer of unknown compositions (continuous inhalation exposure of mice to concentrations greater than 10 ppm; 1h/d, 28-d and 1h/d, 2-wk) resulted in death (Hagemeyer and Stubblebine, 1954). Daily exposures appeared to have a cumulative effect, particularly in the region of 10 ppm. Autopsies showed inflammation and destruction of the tissues, edema of the lungs, and enlargement of the heart. However, insufficiently reported study details (e.g., no information on control group, chemical/polymer characteristics, study design, etc.) weaken the power of the available information. However, there is insufficient evidence to suggest that exposure to the basic polymer component body may cause the adverse effects.
Besides, significant loss of body weight below the initial weight (manifested at day 7) during a 14-d repeated oral exposure of adult rats with pure PCTFE tetramers as well as with PCTFE Halocarbon oil (3.1 oil-C6:C8) (composed of 55% trimer and 45% tetramer oligomers) was observed for example by (DelRaso et al., 1991). Furthermore, compared to controls, significantly decreased body weights and body weight gains of adult rats exposed to low molecular weight PCTFE were reported for either the oral route (pure trimers, pure tetramers, PCTFE Halocarbon 27-S oil, and Safetol®3.1 oil (compositions of the oils unknown) ((DelRaso et al., 1991, Hagemeyer and Stubblebine, 1954, Kinkead et

P.O. Box 400, FI-00121 Helsinki, Finland | Tel. +358 9 686180 | echa.europa.eu
202
al., 1991, Kinkead et al., 1990a, Kinkead et al., 1990b, Kinkead et al., 1989) or for the inhalational route (Safetol®3.1 oil (70% trimer: 30% tetramer; Kinkead et al., 1989; Kinkead et al., 1990a). Also for PFPE surfactant, (Johnston et al., 1996b) reported increased body weights of rats, found in unpublished data (data not available). Affected body weights in adult rodents are also observed for non-polymeric PFASs, such as PFHxA, PFNA, PFOS (EFSA, 2020).
B.5.2.2. Toxicity to reproduction (animal data)
In a recent review, Fenton and colleagues concluded on reproductive toxicity that exposure to PFASs has adverse effects on conception, pregnancy, and foetal development. The underlying birth weight data are largely supportive, while the literature on growth and obesity is inconclusive (Fenton et al., 2021).
B.5.2.2.1. Developmental effects in experimental animals
Adverse effects on reproduction in experimental animal models, such as total litter loss and perinatal/postnatal mortality, have been observed for a variety of PFASs with different chemical structures. (Total) Litter loss was observed in experimental animal models after exposure to
TFA (Covance Laboratories, 2020a), as well as after exposure to PFCAs of various chain lengths:
o PFBA (Das et al., 2008), o PFOA (Abbott et al., 2007), o PFNA (Singh and Singh, 2019a, Das et al., 2015, Wolf et al., 2010), o PFDA (Harris and Birnbaum, 1989), o PFODA (Hirata-Koizumi et al., 2012)
PFECA o F-DIOX (Research Toxicology Centre, 2011).
Neonatal/Postnatal mortality was observed in experimental animal models for exposures to
some PFCAs and PFSAs: o PFHxA (Iwai and Hoberman, 2014), o PFOA (Lau et al., 2006, Yahia et al., 2010, Abbott et al., 2007, Song et al.,
2018), o PFNA (Das et al., 2015, Wolf et al., 2010), o PFODA (Hirata-Koizumi et al., 2012), and o PFOS (Lau et al., 2003, Luebker et al., 2005a, Luebker et al., 2005b, Yahia
et al., 2008). Furthermore, PFECAs:
o HFPO-DA (Conley et al., 2021), o ADONA (Charles River Laboratories, 2007b), o EEA-NH4 (WIL, 2011b).
Complex ether-based PFAS o Noviflumuron also resulted in postnatal mortality (Dow AgroSciences, 2004).
FTOHs o 6:2 FTOH has also been shown to increase pup mortality (O'Connor et al.,
2014, Kirkpatrick, 2005, WIL, 2005).
Reduction of offspring body weight and/or reduced body weight gain is also one of the more consistent developmental effects throughout different PFAS groups in experimental animal models. It can be a secondary effect of maternal toxicity (or influenced by it),

P.O. Box 400, FI-00121 Helsinki, Finland | Tel. +358 9 686180 | echa.europa.eu
203
caused by prenatal exposure or by exposure through lactation (also see B.5.1.2 and B.5.1.4). Reduced offspring body weight (gain) was detected for all of the above-mentioned substances (except PFBA) and in addition for
PFUnDA (Takahashi et al., 2014), PFTeDA (Hirata-Koizumi et al., 2015), PFBS (Feng et al., 2017), and Perfluamine/PTPA (Charles River Laboratories, 2019).
A variety of F-gases (HFCs and HFOs) also caused reduced pup body weight (gain):
HFC-245fa (Frauenhofer Institut für Toxikologie und experim. Medizin, 2005), HFC-4310mee (Vertrel XF) (Haskell, 1994), HFCPA (ZEORORA) (Huntingdon, 1998b), HFO-1336mzz(Z) (DuPont Haskell, 2010b, DuPont Haskell, 2014, WIL, 2014), HFO-1336mzz(E) (Triskelion, 2016), HFO-1216 (Triskelion, 2019a).
Decreased pup body weight was also seen after 6:2 FTOH and 8:2 FTOH exposure (Mylchreest et al., 2005, O'Connor et al., 2014, Mukerji et al., 2015, Kirkpatrick, 2005, WIL, 2005).
Other effects indicating toxicity to reproduction were only evident for single substances or single groups of PFASs. Those effects include the impaired development of mammary glands which is to date only investigated for PFOA exposure (Macon et al., 2011, Tucker et al., 2015, White et al., 2011).
Delayed ossification during development occurred in several PFAS groups (various PFAAs, HFPO-DA, several F-gases, 6:2 FTOH as well as 8:2 FTOH) in experimental animal models (e.g., Lau et al., 2006, WIL, 2010a, Tveit et al., 2013, O'Connor et al., 2014, Mylchreest et al., 2005). Delayed ossification is often a secondary effect due to reduced pup weight or maternal toxicity. Still, there is emerging evidence that bone mineralization may be affected by PFASs also in human children (see epidemiological data above) (Fenton et al., 2021, Cluett et al., 2019). Some PFASs caused developmental malformations in offspring of experimental animal models: TFA (Covance Laboratories, 2020b), PFOA (Lau et al., 2006), and HFC-125. However, for the latter the effect was only found in few pups at higher concentrations (Huntingdon (1992)).
B.5.2.2.2. Fertility effects in experimental animals
Reduced weight of reproductive organs might further affect fertility and is a consistent effect across various PFASs and various PFAS classes:
PFCAs o TFA (Covance Laboratories, 2020b), o PFNA (NTP, 2019a), o PFDA (NTP, 2019a), o PFDoDA (Kato et al., 2015, Chen et al., 2019),
PFSAs o PFBS (Feng et al., 2017), o PFOS (Lee et al., 2015),
PFECAs o HFPO-DA (WIL, 2008a, WIL, 2010b, WIL, 2010a, Haskell, 2010, Conley et
al., 2019), o EEA-NH4 (WIL, 2011b), o F-DIOX (Research Toxicology Centre, 2011),

P.O. Box 400, FI-00121 Helsinki, Finland | Tel. +358 9 686180 | echa.europa.eu
204
o 6:2 Cl-PFESA (Zhou et al., 2018), Other ether-based PFASs
o Move3 (Triskelion, 2017), o Noviflumuron (Dow AgroSciences, 2002a),
HFCs o HFC-134a (ICI, 1979), o HFCPA (ZEORORA) (Huntingdon, 1998b),
FTOHs o 6:2 FTOH (O'Connor et al., 2014, Mukerji et al., 2015), and
the TFA-precursor 2,2,2-Trifluoroethanol (Wilkenfeld RM, 1981).
Several different PFASs from different PFAS groups impaired sperm quality in experimental animal models after exposure to PFNA (Singh and Singh, 2019a, Singh and Singh, 2019b), PFDA (NTP, 2019a), and PFDoDA (Kato et al., 2015), as well as PFOS (Zhang et al., 2019a). Moreover, sperm quality was diminished in animal experiments by 6:2 Cl-PFESA (Zhou et al., 2018) as well as the F-gas HFC-245fa (Frauenhofer Institut für Toxikologie und experim. Medizin, 2005) and the TFA precursor 2,2,2-Trifluoroethanol (Wilkenfeld RM, 1981).
Further, a reduction of sex hormones (estradiol and/or testosterone) was measured in parental animals after exposures to different PFAAs: PFNA (NTP, 2019a, Feng et al., 2010, Feng et al., 2009, Singh and Singh, 2019a), PFDA (NTP, 2019a), PFDoDA (Shi et al., 2009, Shi et al., 2007), and PFBS (Cao et al., 2020), PFOS (Zhang et al., 2020c). Impairment of oestrus cyclicity was observed in rodents after exposure to PFDoDA (Kato et al., 2015), PFBS (Feng et al., 2017)(also in pup oestrus cycle), PFOS (NTP, 2019b, Du et al., 2019), and HFPO-DA (WIL, 2008a) and 6:2 FTOH (Mukerji et al., 2015).
Reduced fertility indices were observed in experimental animal models for Noviflumuron (Dow AgroSciences, 2004), for the F-gas HFC-4310mee (Vertrel-XF) (DuPont Haskell, 2007b), and the TFA precursor 2,2,2-Trifluorethanol (Wilkenfeld RM, 1981). Infertility was associated with PFOA and PFHxS in humans (Fei et al., 2009, Fenton et al., 2021).
B.5.2.2.3. Effects on or via lactation in experimental animals
Reduced pup weight gain during the lactation period was observed after exposures to TFA (Covance Laboratories, 2020a), PFHxA (Iwai and Hoberman, 2014), F-DIOX (Research Toxicology Centre, 2012) and Noviflumuron (Dow AgroSciences, 2004). However, reduced pup weight during lactation can have multiple reasons and only cross-fostering experiments with lactation exposure excluding prenatal exposure can clearly indicate lactational effects. For example, PFOA induced impairment of mammary gland development only via lactation without prenatal exposure (White et al. 2009, EFSA, 2020). For Noviflumuron, data from a cross-fostering study “indicate that the exposure of the test material to foetuses through the placenta is limited and the majority of exposure occurs postnatally through nursing.” (TERC, 2005) (also see B.5.1.2).
B.5.2.3. Carcinogenicity (animal data)
Several PFASs have recently been classified as possibly or probably carcinogenic to humans. The International Agency for Research on Cancer (IARC) classified PFOA as possibly carcinogenic (Group 2B; (IARC, 2017)). The U.S. Environmental Protection Agency (EPA) found that there is suggestive evidence that PFOA (EPA-US, 2016b), PFOS (EPA-US, 2016a), and HFPO-DA (EPA-US, 2018) may cause cancer. The EFSA Contam Panel concluded in 2018 that there is insufficient support for carcinogenicity of PFOS and PFOA in humans from epidemiological studies but that both compounds induced tumours in rats (EFSA, 2018). According to the CLP Regulation in the EU, 17 PFASs currently exhibit a harmonised classification as carcinogenic (Carc. 2 or Carc. 1B; e.g., PFOA and its ammonium salt, PFNA and its sodium and ammonium salts, PFDA and its sodium and

P.O. Box 400, FI-00121 Helsinki, Finland | Tel. +358 9 686180 | echa.europa.eu
205
ammonium salts, PFOS and it ammonium, lithium and potassium salts, trifluralin). Additionally, amongst the PFASs registered in the EU, 82 PFASs are self-classified by registrants as Carc. 1A/B or Carc. 2.
For PFOA (3M, 1983, Biegel et al., 2001, NTP, 2019a, Kamendulis et al., 2022), PFOS (Butenhoff et al., 2012b), HFPO-DA (EPA-US, 2018, MPI Research Inc., 2013), Tetraconazole (Huntingdon, N/A-f), Noviflumuron (Dow AgroSciences, 2005b), and HFC-134a (Collins et al., 1995) there is evidence for carcinogenic effects from animal studies (e.g., Leydig cell adenoma, hepatocellular adenoma and carcinoma, acinar cell adenoma and adenocarcinomas, follicular adenomas and carcinomas of the thyroid, renal tubule adenoma or carcinoma). For the observed carcinogenic effects, the available information is not sufficient to rule out human relevance of the underlying mode of action (ATSDR, 2021). For the vast majority of PFASs, long-term toxicity or carcinogenicity studies as well as epidemiological studies informative on potential carcinogenic effects are not available and thus, human relevance of carcinogenicity of most PFASs is unclear.
B.5.3. Evidence from epidemiological studies
For a review of epidemiological data in firefighters due to PFAS-exposure, see section B.9.3.5.
B.5.4. Combined toxicity
Due to their persistence, mobility, bioaccumulation potential and thus tendency for long-range transport, PFASs are ubiquitously dispersed in the environment. Therefore, many different PFASs are co-occurring in the environment, drinking water, and food, resulting in a combined exposure to multiple PFASs that, based on the available data on some groups of PFASs, show similarity of effects. Accordingly, an assessment of hazards and risks taking into account such combined exposure would reflect exposure conditions more realistically than single compound assessments.
A precise modelling of combined effects of all PFASs in the scope of this restriction is realistically not achievable due to lack of data on toxicokinetics, toxicodynamics, slope of dose response curves as well as limited knowledge of the mode-of action (Borgert et al., 2004). For most PFASs, no data on effects are available. However, the lack of data should not preclude to consider the risks and hazards from combined exposure to different PFASs because of the following:
Firstly, it has been demonstrated in multiple studies that concentration addition may give a realistic worst-case estimation of combined toxicities for risk assessment procedures even if similarity of components is unknown (Backhaus et al., 2000, Martin et al., 2021). Therefore, Backhaus and Faust (2012) suggested to apply concentration addition as a precautious first tier, irrespective of the modes/mechanisms of action of the mixture components. Dose addition has also been adopted as the default assessment approach in EFSA’s “Guidance on harmonised methodologies for human health, animal health and ecological risk assessment of combined exposure to multiple chemicals” (EFSA, 2019). In recent studies, it has been demonstrated that cytotoxicity results of mixtures of PFASs were approximately additive (Hoover et al., 2019) or even more than additive (Ojo et al., 2021). Given similar effect patterns for many PFASs in animal studies, such as effects on liver, thyroid hormone system, and immune system, additive effects may be considered as realistic worst-case estimation.
Secondly, a common mode of action is not a prerequisite for grouping chemicals for a combined exposure assessment and thus evidence for the same target organ is considered sufficient (EFSA, 2019). It has been demonstrated in vitro that very diverse chemical classes with different molecular mechanisms can act in a concentration additive manner if triggering a similar adverse outcome (Stalter et al., 2020).

P.O. Box 400, FI-00121 Helsinki, Finland | Tel. +358 9 686180 | echa.europa.eu
206
Thirdly, even low or insignificantly toxic concentrations of the individual components can add up to observable combined effects (Altenburger et al., 2013). This something-from-“nothing” phenomenon has been first observed for endocrine disrupting compounds (Silva et al., 2002) but applies also to other mechanisms of action (Versieren et al., 2016).
Combined exposure to multiple PFASs is documented in an increasing number of epidemiological studies, many of which demonstrate an association between increased exposure to PFAS mixtures and increased incidences of various health outcomes, such as immunotoxicity, metabolic effects, developmental toxicity, thyroid hormone effects, and others (see B.5.3.). As concluded by Rosato et al. (2022), specific guidelines and tools for the assessment of mixture observational studies are warranted.
In vivo studies on effects of PFAS mixtures are scarce. Recently Marques et al. (2021) demonstrated cumulative mixture effects of PFOA, PFOS, and PFHxS on metabolic endpoints in mice.
Combined effects of various PFASs have been suggested before for the endpoint immunotoxicity (McDonough et al., 2020b).
For liver effects, a risk assessment of mixtures of 16 PFASs has been applied by Bil et al. (2021) by use of a relative potency approach (RIVM et al., 2018). In this study, the authors derived relative potency factors (RPFs) for 14 PFAAs and 2 PFAA precursors taking into account potency for liver effects relative to PFOA. Based on the RPFs and the combined PFAS exposure in two separate exposure scenarios (drinking water ingestion and fish consumption), total PFOA equivalents did not exceed the drinking water limit for PFOA in The Netherlands of 87.5 ng/L, whereas the total PFOA equivalents resulting from fish consumption did exceed the fish consumption limit for PFOA in The Netherlands of 1.5 ng/g wet weight. This example demonstrates the high relevance of combined exposure assessments of PFASs. It can be expected that more limit values are exceeded in other exposure scenarios and when other endpoints are considered, in particular when more PFASs are taken into account.
In an earlier study, a cumulative health risk assessment of 17 PFASs has been applied by use of the Hazard Index (HI) approach (Borg et al., 2013). The risk characterization showed a concern for hepatotoxicity and reproductive toxicity in a subpopulation eating PFOS-contaminated fish, illustrating that high local exposure may be of concern. For the occupationally exposed there was concern for hepatotoxicity by PFOA and all congeners in combination as well as for reproductive toxicity by all congeners in combination.
The immense number of PFASs in addition to the fact that appropriate toxicological data are not available for the vast majority of them, renders approaches for combined risk assessments unattainable for all the PFASs within the scope of this restriction. Additionally, a large fraction of total organic fluorine from various exposure scenarios cannot be accounted for by commonly analysed PFASs indicating the co-occurrence of unidentified PFASs (Borg and Ivarsson, 2017). In conclusion, it is emphasized that combined exposure to different PFASs affecting the same target organs may result in combined additive effects, rendering exceedance of effect thresholds or limit values more likely than single compound assessments.
B.5.5. Derivation of DNEL(s)/DMEL(s)
Derivation of DNELs/DMELs is not considered relevant for this dossier since PFASs should be treated as non-threshold substances for the purposes of risk assessment. Any release of PFASs to the environment (see Annex B.9) can be regarded as an unacceptable risk to the environment and human health (similar to PBT/vPvB substances under the REACH

P.O. Box 400, FI-00121 Helsinki, Finland | Tel. +358 9 686180 | echa.europa.eu
207
regulation). Since the non-threshold approach requires minimisation of exposures/releases, there is no need to compare in quantitative way exposure levels with effects thresholds (i.e. DNEL or DMEL values)(Wilkenfeld RM, 1981).
Moreover, in view of the large number of substances covered comprising to a large extent yet insufficiently investigated substances in terms of human toxicity it is considered impossible to establish a safe level for individual PFASs, let alone for the group in total. Considering the increasing lines of evidences for effects of well-studied PFASs occurring at lower levels than previously anticipated (e.g., EFSA, 2020), the exposure to these few PFASs already exceed the existing limit values. Hence, any additional exposure to other PFASs will result in more severe effects and/or a larger part of the population exceeding the limit values. Exposure therefore needs to be minimised, as per non-threshold approach.
B.6. Human health hazard assessment of physicochemical properties
Not assessed in detail, see explanation in B.5.
B.7. Environmental hazard assessment
B.7.1. Ecotoxicity
B.7.1.1. Notes on the procedure
PFASs represent one of the most rapidly increasing study fields in ecotoxicology, contributing with several hundred new scientific publications in each of the recent years. To get an overview over the scientific literature, investigating ecotoxicological effects of PFASs, an initial literature search was performed by using the search term PFAS* and effect* in isi web of knowledge (www.isiwebofknowledge.com). The initial search was restricted to review papers. Further refinement of the search results was performed by screening titles and abstract. The initial literature search resulted in a list of 76 papers. After screening the titles for relevance, 20 papers remained. Two of these were only available in Chinese and were excluded. The remaining 18 review papers were downloaded in full text and their relevance for the present review work was assessed. Relevant information is summarized in the paragraph “Ecotoxicology of PFAS”. Not all of the 18 review papers were considered useful and those are consequently not mentioned in this chapter. The collection of studies from the initial search was complemented non-systematically by other studies that came up during the process of writing.
The PFASTox Database (https://pfastoxdatabase.org/, date of access 07.10.2021) was used to get an overview over the ecotoxicological threshold values which are being reported by scientific literature. Functional details, as well as information on quality assurance for the data compiled in that database are provided by (Pelch et al., 2019). All entries for in vitro and in vivo studies except those of the effect category “endocrine disruption” (those are already included in section B.7.4) were downloaded as a study list generated from the database. The full study list was filtered to exclude entries with a focus on human health (e.g. studies with human cell lines, rats or mice) as the effects of PFASs on human health are already assessed in section B.5. The abstract entries of all references in the filtered study list were screened for threshold values which were then collected in a separate table (see Table B.34).
In a recently published review paper from (Ankley et al., 2020), Ankley and colleagues summarized the information on ecological effects of PFASs from the US EPAs ECOTOX Knowledgebase (https://www.epa.gov/chemical-research/ecotoxicology-database) according to environmental compartments as well as different species with environmental relevance. The main findings from that compilation will be presented below together with complementary data from other studies not mentioned in the review from Ankley and

P.O. Box 400, FI-00121 Helsinki, Finland | Tel. +358 9 686180 | echa.europa.eu
208
colleagues.
B.7.1.2. Aquatic invertebrates
According to (Ankley et al., 2020), from the group of aquatic invertebrates crustaceans are most often the organisms which are most sensitive to effects from PFASs. Furthermore, they observed, that “toxicity in the same PFAS class tends to increase with increased fluorocarbon chain length”. Other authors (Barmentlo et al., 2015a, Barmentlo et al., 2015b) observed a similar pattern in their investigation of the effects of PFBA, PFHxA and PFOA on Daphnia magna. (Ankley et al., 2020) found, that toxicity values (e.g. ECX) from chronic exposure were mostly within the same order of magnitude as values from acute exposure for the same species. Effects on the development of invertebrates occur at lower levels than effects on growth and reproduction.
Studies with saltwater organisms are rare, compared to studies with freshwater organisms. (Ankley et al., 2020) drew the conclusion that “marine invertebrates tend to show a higher sensitivity to PFOA and PFOS” compared to freshwater species. However, they highlighted that the data at hand is limited and that the conclusion is subject to a high degree of uncertainty. In contrast, (Mhadhbi et al., 2012) reported in their study on the effects of PFOA and PFOS on marine species from different trophic levels, that effects occurred in marine species at higher concentrations compared to freshwater species suggesting that marine species are less sensitive.
B.7.1.3. Terrestrial invertebrates
(Ankley et al., 2020) observed, that ecotoxicological studies on the effects of PFASs with terrestrial invertebrates are scarce, compared to the amount of studies with aquatic invertebrates. Thus, firm conclusions regarding the differences of the ecotoxicological effects of different PFAS groups in terrestrial invertebrates are not possible. The same applies for interspecies differences. However, Ankley and colleagues could conclude, that developmental toxicity in terrestrial invertebrates increases with carbon chain length within the same PFAS group. Additionally, they observed a trend regarding the toxicity of different PFAS groups which they described as perfluoroalkane sulfonamides (FASAs) > Perfluoro sulfonic acids (PFSAs) > Perfluoro carboxylic acids (PFCAs) > fluorotelomer alcohols (FTOHs).
Ankley and colleagues suggested a few different mechanisms through which PFASs exert their toxic effects in invertebrates (terrestrial as well as aquatic): oxidative stress which affects the antioxidative defense systems; genotoxic effects such as DNA strand breaks, chromosomal breaks or apoptosis; neurotoxic effects expressed e.g. via altered brain morphology; metabolic effects e.g. fat accumulation due to alternations of different regulating pathways (e.g. PPAR interaction); effects on the immune system via adversely affecting immune-related cell viability.
B.7.1.4. Fish
Most of the available literature (90 %), that was evaluated by Ankley and colleagues regarding the effects of PFASs on fish, focuses on PFCAs and PFSAs. Similar to aquatic invertebrates, most studies were performed with freshwater species (95 % of the evaluated studies) while studies investigating the effects of PFAS on marine fish are rare (5 %). Regarding acute toxicity, Ankley and colleagues observed a lower acute toxicity of PFASs compared to invertebrates. Based on the order of magnitude of ecotoxicological threshold values, short-chain (≤ C6) PFAAs appear to be less acutely toxic than longer chain (≥ C6) PFAAs. A similar trend could be observed for the chronic toxicity. Additionally, Ankley and colleagues concluded that “within the same chain length (C8), sulfonates are typically more toxic than carboxylates”. Similar results, regarding the relation of toxicity and chain length as well as a higher toxicity for sulfonic PFAAs were also reported in an earlier study by (Ulhaq et al., 2013). They investigated the effects of 7 PFASs (TFA, PFBA, PFOA, PFNA, PFDA, PFBS, PFOS) on zebrafish. (Rericha et al., 2021) investigated behavioral effects of

P.O. Box 400, FI-00121 Helsinki, Finland | Tel. +358 9 686180 | echa.europa.eu
209
58 different PFASs on early life stage zebrafish as means to assess their developmental toxicity. They observed that at least 2 substances each from the groups of PFCAs, PFSAs, phosphate ethers and phosphinic acids “induced larval behavior effects”. Regarding chain lengths of the investigated compounds they reported, that “PFCAs and PFSAs associated with abnormal larval behavior had 3−17 and 3−8 continuously fluorinated carbons (CFCs), respectively”. PFASs with unsaturated C-F chains did not cause behavioral effects in this study. Mortality was also not observed within the tests performed by Rericha and colleagues. PFOA and PFNA were the only two, of the 58 PFASs tested, that cause morphological effects.
In relation to chronic effects, Ankley and colleagues concluded, that NOEC or LOEC values for effects on reproduction were lower than values for effects on growth (based on data for PFOA and PFOS from studies with Cyprinids only). Regarding the mechanisms of toxicity, it was concluded, that “different PFAS have been shown to elicit oxidative stress and apoptosis in fish both in vitro and in vivo”. Other than that, Ankley and colleagues mentioned that different PFASs act toxic via an activation of nuclear receptors involved in lipid metabolism e.g. PPARs which is associated with an increased liver lipid content and steatosis (fatty liver) in mammals, but hepatic effects from PFOS exposure have also been observed in zebrafish.
B.7.1.5. Amphibians
According to (Ankley et al., 2020), studies investigating effects of PFASs on amphibians are only available for 9 different PFASs (PFOA, PFNA, PFDA, PFUnA, PFOS, PFHxS, 6:2 FTS, 10:2 FTCA, 10:2 FTUCA) and the majority of the studies investigated the effects of PFOS and PFOA. Similar to other species, toxicity of PFAS towards amphibians is influenced by the carbon chain length, as well as the functional group of the individual PFASs. However, the data at hand was not sufficient to derive trends. Ankley and colleagues describe that effects from PFASs on growth and development in early live stages have been reported for several species.
B.7.1.6. Birds
From the limited data available (acute and chronic toxicity on birds has only been investigated for PFOS, PFBS, PFHxS and PFOA) Ankley and colleagues drew the conclusion, that results from acute toxicity studies with birds are comparable to those from studies with rodents: PFASs with C8 carbon chains are more toxic, than short-chain PFASs and within substances with the same chain length, sulfonates are more toxic than carboxylates. Results from different studies with PFOS indicate, that bird species show different sensitivities to the same substance, but results are within the same order of magnitude. In two recent studies (Dennis et al., 2022) and (Dennis et al., 2021), Dennis and colleagues investigated the liver and eggs of northern bobwhite quail (Colinus virginianus) individuals that were chronically exposed to PFASs (PFHxA, PFOS, or PFHxS or a mixture of PFHxA and PFOS or PFHxS and PFOS). From the residue values from the most sensitive subgroup they derived chronic toxicity values (CTVs) and found them to be lower than similar values reported for birds from earlier studies. The reported values are in the < 50 ng/g ww range. Additionally, Dennis and colleagues observed that “PFOS and PFHxS were more bioaccumulative than PFHxA in avian tissues, but PFHxA was more toxic to reproducing birds than either PFOS or a PFOS:PFHxS mixture”.
B.7.1.7. Reptiles
(Ankley et al., 2020) compiled 5 studies that investigated the effects of PFASs (namely PFOS and PFHxS) in reptiles. Effects from those studies encompass decreased growth of juveniles and decreased egg viability.
B.7.1.8. Mammals & Wildlife
Laboratory experiments with mammals and “wildlife” species (i.e. species not commonly

P.O. Box 400, FI-00121 Helsinki, Finland | Tel. +358 9 686180 | echa.europa.eu
210
used for ecotoxicological tests) examined the effects of PFASs on different endpoints, including immunological, neurological, and histopathological endpoints. (Ankley et al., 2020) collated studies with polar bears, sled dogs, marine mammals, which in total investigated the effects of 9 PFCAs, 3 PFSAs, 3 FTOHs, and 3 “novel” PFASs (HFPO-DA, ADONA and 6:2 Cl-PFAES (major component of F-53B)). On the basis of this data, Ankley and colleagues concluded that “PFOS followed by PFOA has the greatest amount of toxicological data”. Regarding the toxicity of different PFASs groups, the data compiled for effects on wildlife animals shows similar patterns as the data from e.g. fish: PFCAs with chain lengths ≤ C6 appear to be less toxic than PFCAs with chain lengths from C8 – C12 (while PFTrDA (C14-PFCA) again was considered less toxic). Within the group of sulfonic acids, Ankley and colleagues also observed a trend in toxicity according to chain length: PFOS (C8; most toxic) < PFHxS (C6) < PFBS (C4; least toxic). Data for 6:2 FTOH and 8:2 FTOH suggests, that these compounds exert “less toxicity than other C6 PFAS compounds”
Interspecies differences, e.g. regarding sensitivity, are difficult to evaluate in this context due to limited data. Ankley and colleagues made an attempt considering only data for PFOS and concluded “Based on body weight/body weight gain effects, there were no discernible differences between species exposed to PFOS during gestation. Even when reproductive effects such as pup viability and/or weight gain are considered, PFOS effect levels between species were typically 10‐fold or less based on dose”
Several of the studies, compiled by Ankley and colleagues, measured tissue concentrations of PFASs in different wild living animals that were exposed to PFASs (and other contaminants) in the field. Subsequently, these studies tried to link the measured tissue concentrations to adverse effects. The findings of Ankley and colleagues regarding the effects of PFASs in wild living animals, as well as complementary results from other studies, are discussed in more detail in chapter B.4.2.4.
B.7.1.9. Other species
As reviewed by (Li et al., 2022) occurrence of PFASs rarely lead to obvious phenotypic/physiological damages in plants, but markedly perturb some biological activities at biochemical and molecular scales. PFAS exposure induces the over-generated reactive oxygen species and further damages plant cell structure and organelle functions. A number of biochemical activities in plant cells are perturbed, such as photosynthesis, gene expression, protein synthesis, carbon and nitrogen metabolisms by (Li et al., 2022).
A review by (Krafft and Riess, 2015) observed that PFAAs with shorter chain lengths exert a lower toxicity, which concurs with observations from the studies mentioned previously. Additionally, they mentioned that “PFAS exposure has been consistently associated with lipid and carbohydrate metabolism disorders”, based on studies with exposed humans, which is in line with the observations from (Ankley et al., 2020) regarding metabolism disorders in mammals. Accordingly, (Krafft and Riess, 2015) stated, that, concerning the toxicity of PFAAs, “the liver has been identified as a specific target organ.” but confined that these findings are “highly dependent on PFAS, dose, species, strain and gender”. Furthermore, Krafft and colleagues described effects of PFASs on the immune system as well as developmental effects e.g. a reduced antibody response and IgM antibody production in mice exposed to PFOS or PFOA, or developmental toxicity observed in adult rodents exposed in utero to PFOS, PFHxS or PFOA. Similar effects have been reported in the review form Ankley and colleagues for various species (see above).
B.7.1.10. PFASTox Database
The filtered study list from the PFASTox Database (see “Notes on the procedure” at the beginning of this chapter) comprised 167 entries. Only 23 entries reported threshold values in the abstract. These are listed in Table B.34. Several studies reported threshold values for more than one PFAS thus the table contains more than 23 entries.

P.O. Box 400, FI-00121 Helsinki, Finland | Tel. +358 9 686180 | echa.europa.eu
211
Table B.34. Ecotoxicological threshold values for different PFASs from scientific literature recorded in the PFASTox database. Additional information (Endpoint, species / cell line) are included to allow for a superficial classification of the threshold values. Substance
Study type
Effect value
Effect Endpoint
Species / Cell line Reference
PFHxS in vivo 2 µM
morphometric effects in the larvae, specifically increased length and yolk sac area LOEC Danio rerio
(Annunziato et al., 2019)
6:2 FTOH* in vivo 2 µM
Behavioral endpoints: distance traveled & mean velocity LOEC Danio rerio
(Annunziato et al., 2019)
PFHxA in vivo 0,2 µM
reduction in the overall length and yolk sac size (however not observed at higher doses) LOEC Danio rerio
(Annunziato et al., 2019)
6:2 Cl-PFESA in ovo
150 ng/g (egg w) lower heart rate LOEC
Chicken (Gallus gallus domesticus)
(Briels et al., 2018b)
6:2 Cl-PFESA in ovo
1500 ng/g (egg w) enlarged liver (8%) LOEC
Chicken (Gallus gallus domesticus)
(Briels et al., 2018b, Briels et al., 2018a)
PFHxS in ovo 38.000 ng/g (egg w)
decreased tarsus length and embryo mass LOEC
Chicken (Gallus gallus domesticus)
(Cassone et al., 2012)
PFOS in vivo
1.4 µM (95 % CI, Range 1.1 - 1.6 µM) mortality LC50
Nematode (Caenorhabditis elegans)
PFBS in vivo
794 µM (95 % CI, Range 624-1009 µM) mortality LC50
Nematode (Caenorhabditis elegans)
(Chen et al., 2018a)
PFDA in vitro 7.8 µM oocyte viability LC50 Oocyte cells from pigs
PFDA in vitro 3.8 µM maturation IM50 Oocyte cells from pigs (Domínguez et al., 2019)
PFDoA, PFNA, PFOA in vitro 107-647 µM cytotoxicity EC50
human placental choriocarcinoma cell line JEG-3
PFOS, PFOA, in vitro 57 - 80 µM aromatase inhibition IC50
human placental choriocarcinoma cell line
(Gorrochategui et al., 2014)

P.O. Box 400, FI-00121 Helsinki, Finland | Tel. +358 9 686180 | echa.europa.eu
212
PFBS JEG-3
PFDOA in vivo 1.2 mg/L level of dopamine was upregulated significantly LOEC Danio rerio
PFNA in vitro 10 µg/L negative effect on blastocyst formation LOEC Oocyte cells from cows
PFNA in vitro 0.1 µg/L lipid droplet distribution significantly altered LOEC Oocyte cells from cows
Hallberg, 2019 #11}
PFBS, PFHxS, PFNA, PFHpA in vivo
100000 µg/kg dw increased mortality LOEC Eisenia fetida
PFNA, PFHpA in vivo
100000 µg/kg dw significant weight loss LOEC Eisenia fetida
(Karnjanapiboonwong et al., 2018)
PFOS in vivo
33 µg/L (95 % CI, Range 29 - 37 µg/L)
genotoxicity (DNA strand breaks and fragmentation, chromosomal breaks and apoptosis) EC50 Marine mussel (Perna viridis)
PFOA in vivo
594 µg/L (95 % CI, Range 341-1063 µg/L)
genotoxicity (DNA strand breaks and fragmentation, chromosomal breaks and apoptosis) EC50 Marine mussel (Perna viridis) (Liu et al., 2014)
PFNA in vivo
195 µg/L (95 % CI, Range 144 - 265 µg/L)
genotoxicity (DNA strand breaks and fragmentation, chromosomal breaks and apoptosis) EC50 Marine mussel (Perna viridis) (Liu et al., 2014)
PFDA in vivo
78 µg/L (95 % CI, Range 73 - 84 µg/L)
genotoxicity (DNA strand breaks and fragmentation, chromosomal breaks and apoptosis) EC50 Marine mussel (Perna viridis) (Liu et al., 2014)
PFOS, PFOA, PFBS in vivo 10 µg/L reduced growth
LOEC (only one concentration tested) Chironomus riparius
PFOS in vivo 29.8+/-4.1 µM
behavior: prolonged backward swimming (indicating modified cellular EC50 Paramecium caudatum

P.O. Box 400, FI-00121 Helsinki, Finland | Tel. +358 9 686180 | echa.europa.eu
213
cadmium conductance)
PFOA in vivo 424.1+/-124.0 µM
behavior: prolonged backward swimming (indicating modified cellular cadmium conductance) EC50 Paramecium caudatum
(Matsubara et al., 2006)
FOSAPrTMA in vivo
19.1+/-17.3 µM
behavior: shortened backward swimming (indicating modified cellular cadmium conductance) EC50 Paramecium caudatum
(Matsubara et al., 2006)
PFNA in vivo 98.7+/-20.1 µM
behavior: prolonged backward swimming (indicating modified cellular cadmium conductance) EC50 Paramecium caudatum
(Matsubara et al., 2006)
PFDA in vivo 60.4+/-10.1 µM
behavior: prolonged backward swimming (indicating modified cellular cadmium conductance) EC50 Paramecium caudatum
(Matsubara et al., 2006)
6:2 Cl-PFESA in vivo 6 mg/L decreased survival LOEC Danio rerio 6:2 Cl-PFESA in vivo 5 µg/L decreased liver triglyceride levels LOEC Danio rerio
PFNA in vitro 4.8 µM inhibition of p-glycoprotein (p-gp) cellular efflux transporter IC50
gill cells from marine mussel (Mytilus californianus)
PFDA in vitro 7.1 µM inhibition of p-glycoprotein (p-gp) cellular efflux transporter IC50
gill cells from marine mussel (Mytilus californianus)
(Stevenson et al., 2006)
TFA in vivo
700 mg/L (95 % CI, Range 460-1000 mg/L)
sublethal endpoints (edema, malformations, non-hatched eggs, lack of circulation, reduced pigmentation, spinal curvature) EC50 Danio rerio
(Ulhaq et al., 2013)
PFBA in vivo
2200 mg/L (95 % CI, Range 1200-2200 mg/L)
sublethal endpoints (edema, malformations, non-hatched eggs, lack of circulation, reduced pigmentation, spinal curvature) EC50 Danio rerio
(Ulhaq et al., 2013)
PFOA in vivo
350 mg/L (95 % CI, Range 290-430 mg/L)
sublethal endpoints (edema, malformations, non-hatched eggs, lack of circulation, reduced pigmentation, spinal curvature) EC50 Danio rerio
(Ulhaq et al., 2013)
PFNA in vivo 16 mg/L (95 % CI,
sublethal endpoints (edema, malformations, non-hatched eggs, lack EC50 Danio rerio
(Ulhaq et al., 2013)

P.O. Box 400, FI-00121 Helsinki, Finland | Tel. +358 9 686180 | echa.europa.eu
214
Range 7.7-450 mg/L)
of circulation, reduced pigmentation, spinal curvature)
PFDA in vivo
5.0 mg/L (95 % CI, Range 3.8-6.6 mg/L)
sublethal endpoints (edema, malformations, non-hatched eggs, lack of circulation, reduced pigmentation, spinal curvature) EC50 Danio rerio
(Ulhaq et al., 2013)
PFBS in vivo
450 mg/L (95 % CI, Range 350-600 mg/L)
sublethal endpoints (edema, malformations, non-hatched eggs, lack of circulation, reduced pigmentation, spinal curvature) EC50 Danio rerio
(Ulhaq et al., 2013)
PFOS in vivo
1.5 mg/L (95 % CI, Range 1.1.-1.9 mg/L)
sublethal endpoints (edema, malformations, non-hatched eggs, lack of circulation, reduced pigmentation, spinal curvature) EC50 Danio rerio
(Ulhaq et al., 2013)
TFA, PFBA in vivo >3000 mg/L mortality LC50 Danio rerio
(Ulhaq et al., 2013)
PFOA in vivo
430 mg/L (95 % CI, Range 290-710 mg/L) mortality LC50 Danio rerio
(Ulhaq et al., 2013)
PFNA in vivo >10 mg/L mortality LC50 Danio rerio (Ulhaq et al., 2013)
PFDA in vivo
8.4 mg/L (95 % CI, Range 5.3-15 mg/L) mortality LC50 Danio rerio
(Ulhaq et al., 2013)
PFBS in vivo
1500 mg/L (95 % CI, Range 1100-1900 mg/L) mortality LC50 Danio rerio
(Ulhaq et al., 2013)
PFOS in vivo <10 mg/L mortality LC50 Danio rerio (Ulhaq et al., 2013)
6:2 Cl-PFESA in vivo 15.5 mg/L mortality LC50 Danio rerio TFA in vivo 70 mg/L mortality LC50 Brachionus calyciflorus

P.O. Box 400, FI-00121 Helsinki, Finland | Tel. +358 9 686180 | echa.europa.eu
215
PFPrA in vivo 80 mg/L mortality LC50 Brachionus calyciflorus (Wang et al., 2014)
PFBA in vivo 110 mg/L mortality LC50 Brachionus calyciflorus (Wang et al., 2014)
PFPeA in vivo 130 mg/L mortality LC50 Brachionus calyciflorus (Wang et al., 2014)
PFHxA in vivo 140 mg/L mortality LC50 Brachionus calyciflorus (Wang et al., 2014)
PFDoA in vivo
1.2 mg/L, 1.2 mg/L and 6 mg/L respectively
upregulated gene expression levels of thyrotropin-releasing hormone (trh), corticotrophin-releasing hormone (crh) and iodothyronine deiodinases (dio2) LOEC Danio rerio
PFDoA in vivo
1.2 mg/L and 6 mg/L respectively
downregulated gene expression levels of thyroglobulin (tg) and thyroid receptor (trbeta) LOEC Danio rerio
(Zhang et al., 2018b)
*6:2 FTOH has recently been classified via decision of ECHAs Risk Assessment Committee (RAC) as a substance that is very toxic to aquatic life with long lasting effects (Aquatic Chronic 1; H410, M=1) (ECHA News: https://echa.europa.eu/documents/10162/2082415/news_annex_rac_seac_dec_2021_en.pdf/92b14f83-580d-323a-486a-32fade778505?t=1639041622096; RAC protocoll: https://echa.europa.eu/documents/10162/17090/rac59_final+minutes_en.pdf/2f350729-0880-57da-9a1e-b812d24df808?t=1639990293786)

P.O. Box 400, FI-00121 Helsinki, Finland | Tel. +358 9 686180 | echa.europa.eu
216
Ecotoxicological threshold values reported in the PFASTox database differ over several orders of magnitude (ng-scale to mg-scale). A comparison, or averaging of the different values is not feasible due to the large differences between the different studies (e.g. test-design, sensitivity of species, reporting of results). The key message of this compilation-exercise is, that some of the concentration values at which certain PFASs cause ecotoxicological effects (mostly organ specific effects) are within the same order of magnitude at which PFASs have been detected in the environment (see chapter B.4.2.5). The significance of this comparison is of course very limited as it ignores e.g. inter-species differences regarding the sensitivity to PFAS-mediated effects as well as differences between laboratory conditions (under which the above values were derived) and real-world conditions. Still, it underlines the need to minimize emissions of PFASs to the environment. This is without prejudice to the assumption that PFASs are regarded as non-threshold substances from a regulatory perspective, due to their very high persistence.
Additionally, this compilation highlights the large knowledge gap which exists around the study of environmental effects of PFASs. The PFASTox Database, at the time of access, contains information for 29 out of potentially > 10.000 individual PFASs. This shows, that the investigation of potential adverse effects of PFASs in the environment has not even begun to comprehensively assess this large class of substances despite severe efforts that have been put into this area of research over the past decades.
Conclusions
Despite the growing amount of studies investigating the ecotoxicity of PFASs, the available data on adverse effects of PFASs in the environment is limited to a small number of substances. Moreover, most studies investigate the aquatic toxicity of PFASs, leaving a huge gap of knowledge regarding the toxicity towards terrestrial organisms. Additionally, conventional ecotoxicological tests may not be suitable to detect long term effects from exposure to PFASs. PFASs can remain in the environment for long time periods (decades-centuries) due to their high persistence but ecotoxicological test systems usually cover only time spans of a few days – weeks.
Yet, for a small subset of PFASs, there is information available that suggests that these substances cause adverse effects in the environment. Some of the PFASs (especially PFOA and PFOS) have be investigated thoroughly and suggestions for possible mechanisms of action have been made. Based mostly on information for PFOS and PFOA, there is “ample basis to suspect that at least a subset of PFASs can be considered persistent, bioaccumulative, and/or toxic” as Ankley and colleagues phrased it in their review paper on the ecological risks of PFASs (Ankley et al., 2020). PFASs may also cause adverse effects, that are relevant for whole populations if they affect endpoints such as reproduction or survival of offspring. Two trends regarding the toxicity of PFASs could be derived from the currently data available:
- Toxicity in the same PFAS class tends to increase with increased C-chain length. - PFAS sulfonates are usually more toxic than carboxylates with the same chain
length (C8) (Ankley et al., 2020).
However, interactions of substances with the environment are complex and depend on various factors. For example, the environmental behavior and fate of PFASs depends both on the inherent physicochemical properties for each respective PFAS and their degradation products, the physicochemical conditions of the abiotic environmental compartments that act as recipient systems (e.g., organic carbon content of sediments, or temperature, salinity, concentration of oxidants in seawater), and the physiological status and conditions of the recipient organisms which may take up and accumulate the given PFAS.
Considering that PFASs are very persistent and mobile, organisms living in different environmental compartments are continuously exposed to PFASs. Without reliable data that is suitable to detect also long-term effects of PFASs (intergenerational effects after intergenerational exposure), it is not possible to demonstrate safe use of PFASs. This warrants for a restriction of the use of PFASs to minimize emissions to the environment.

P.O. Box 400, FI-00121 Helsinki, Finland | Tel. +358 9 686180 | echa.europa.eu
217
At the time notable effects from PFASs exposure occur in the environment it will be difficult, if not impossible, to remove the contamination. Thus, there is a threat of irreversible damage.
B.7.2. Atmospheric compartment – global warming potential
Some PFASs are persistent and volatile and will partition to the atmosphere where they will stay for a very long time. These substances may have a considerable global warming potential which contributes to the greenhouse effect and global warming. In fact, some of the strongest greenhouse gases known are PFASs.
One of the most relevant subclasses of PFASs that contribute to global warming are the perfluorinated gases (F-gases), e.g. hydrofluorocarbons (HFCs) and hydrofluoroethers (HFEs). These are high-volume substances used as refrigerants, blowing agents, and solvents etc. with considerable emissions. Emitted substances evaporate and reside in the atmosphere. The Environmental Coalition on Standards (ECOS) notes in a recent report that even though F-gases ‘only’ account for approximately 2% of the greenhouse gas (GHG) emissions in the European Union by weight, their contribution to the radiative forcing is about 20%, thus being a major contributor to global warming after all (ECOS, 2021). Furthermore, the demand for F-gases is potentially increasing.
In an expert insight paper by Sovacool et al. (2021) it is pointed out that F-gases have been termed “supergreenhouse gases” given their severe and powerful impact on the climate. They are the most potent greenhouse gases known to modern science, with global warming potentials far greater than carbon dioxide, some up to almost 24,000 times more so. At the same time, they are also the fastest growing class of greenhouse gas emissions around the world, especially in developing countries. It is further stressed that research suggests that almost 40% of their emissions by 2050 will fall outside the scope of international agreements such as the Paris Accord, Montreal Protocol and Kigali Amendment.
The global warming potential (GWP) of a substance depends, inter alia, on its lifetime in the atmosphere. Short-lived substances may therefore often have a lower GWP compared to long-lived substances if they otherwise are comparable in their contribution to radiative forcing. The Global Warming Potential over 100 years (GWP-100) is used for countries' greenhouse gas emission inventories reported to the UNFCCC. In this report we simply refer to GWP for GWP-100, unless otherwise stated. GWP is a relative measurement which measures the global warming potential of a substance relative to that of carbon dioxide (CO2) with GWP = 1 by definition.
Radiative forcing is a term that is closely related to GWP, but unlike GWP, it does not have a time horizon. Radiative forcing describes how strongly the radiation balance of the atmosphere is influenced if the concentration of a given gas, chemical, or substance increases. Changes in the Earth's overall radiative forcing can be caused by changes in the concentration of greenhouse gases in the atmosphere, thus leading to global warming. Generally, the more fluorine atoms in a compound, the greater its GWP and radiative forcing (Sovacool et al., 2021).
Atmospheric lifetimes and global warming potential for F-gases may be found in IPCC Assessment Reports. Emissions, up to 2020, are to be reported using the GWP-values from the IPCC fourth Assessment Report, Table 2.14 (page 212). Updated values from the IPCC fifth Assessment Report Table 8.A.1 (page 73) will be used for reporting under the Paris Agreement. A few examples are listed in Table B.35 below for comparison.
Table B.35. GWP-values (GWP-100) collected from the IPCC fourth Assessment Report.
Gas Chemical formula Lifetime GWP
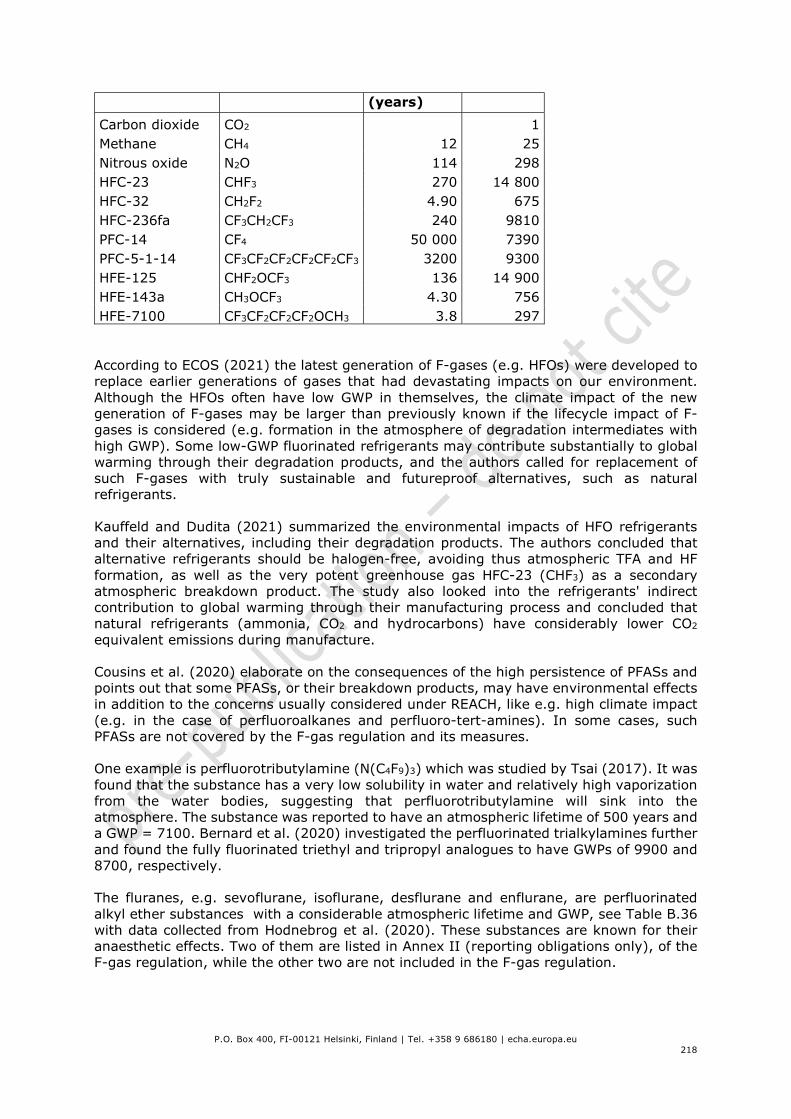
P.O. Box 400, FI-00121 Helsinki, Finland | Tel. +358 9 686180 | echa.europa.eu
218
(years)
Carbon dioxide CO2 1 Methane CH4 12 25 Nitrous oxide N2O 114 298 HFC-23 CHF3 270 14 800 HFC-32 CH2F2 4.90 675 HFC-236fa CF3CH2CF3 240 9810 PFC-14 CF4 50 000 7390 PFC-5-1-14 CF3CF2CF2CF2CF2CF3 3200 9300 HFE-125 CHF2OCF3 136 14 900 HFE-143a CH3OCF3 4.30 756 HFE-7100 CF3CF2CF2CF2OCH3 3.8 297
According to ECOS (2021) the latest generation of F-gases (e.g. HFOs) were developed to replace earlier generations of gases that had devastating impacts on our environment. Although the HFOs often have low GWP in themselves, the climate impact of the new generation of F-gases may be larger than previously known if the lifecycle impact of F-gases is considered (e.g. formation in the atmosphere of degradation intermediates with high GWP). Some low-GWP fluorinated refrigerants may contribute substantially to global warming through their degradation products, and the authors called for replacement of such F-gases with truly sustainable and futureproof alternatives, such as natural refrigerants.
Kauffeld and Dudita (2021) summarized the environmental impacts of HFO refrigerants and their alternatives, including their degradation products. The authors concluded that alternative refrigerants should be halogen-free, avoiding thus atmospheric TFA and HF formation, as well as the very potent greenhouse gas HFC-23 (CHF3) as a secondary atmospheric breakdown product. The study also looked into the refrigerants' indirect contribution to global warming through their manufacturing process and concluded that natural refrigerants (ammonia, CO2 and hydrocarbons) have considerably lower CO2 equivalent emissions during manufacture.
Cousins et al. (2020) elaborate on the consequences of the high persistence of PFASs and points out that some PFASs, or their breakdown products, may have environmental effects in addition to the concerns usually considered under REACH, like e.g. high climate impact (e.g. in the case of perfluoroalkanes and perfluoro-tert-amines). In some cases, such PFASs are not covered by the F-gas regulation and its measures.
One example is perfluorotributylamine (N(C4F9)3) which was studied by Tsai (2017). It was found that the substance has a very low solubility in water and relatively high vaporization from the water bodies, suggesting that perfluorotributylamine will sink into the atmosphere. The substance was reported to have an atmospheric lifetime of 500 years and a GWP = 7100. Bernard et al. (2020) investigated the perfluorinated trialkylamines further and found the fully fluorinated triethyl and tripropyl analogues to have GWPs of 9900 and 8700, respectively.
The fluranes, e.g. sevoflurane, isoflurane, desflurane and enflurane, are perfluorinated alkyl ether substances with a considerable atmospheric lifetime and GWP, see Table B.36 with data collected from Hodnebrog et al. (2020). These substances are known for their anaesthetic effects. Two of them are listed in Annex II (reporting obligations only), of the F-gas regulation, while the other two are not included in the F-gas regulation.

P.O. Box 400, FI-00121 Helsinki, Finland | Tel. +358 9 686180 | echa.europa.eu
219
Table B.36. GWP-values (GWP-100) for selected fluranes.
Gas Chemical formula Lifetime (years) GWP
Sevoflurane, HFE‐347mmz1 (CF3)2CHOCH2F 1.9 205 Isoflurane, HCFE‐235da2 CHF2OCHClCF3 3.5 565 Desflurane, HFE‐236ea2 CHF2OCHFCF3 14.1 2720 Enflurane, HCFE‐235ca2 CHF2OCF2CHFCl 4.4 686
The high climatic effect of fluoroform (HFC-23) is well known and measures to reduce the emissions of the substance has previously been introduced. Stanley et al. (2020) calculated that these measures should have seen global emissions drop by 87% between 2014 and 2017. Instead, atmospheric observations show that emissions of fluoroform (HFC-23) have increased and in 2018 were higher than at any point in history. The authors speculated that the magnitude of the discrepancy between reported emissions reductions and emissions inferred from the atmospheric data could result from developing countries have been unsuccessful in meeting their reported emissions reductions, or that there may be substantial unreported production of HCFC-22 at unknown locations which has been regarded as the main source of fluoroform (HFC-23) emissions. However, atmospheric degradation of HFO's as an unrecognized and secondary source of fluoroform (CHF3) could also contribute to the explanation why atmospheric concentrations are not declining as rapidly as the measures suggest. The discrepancy between the inventory-based emissions estimates of fluoroform (HFC-23) and the emissions based on atmospheric measurements is roughly equivalent to the total green-house gas emissions of Spain in 2017 (Stanley et al., 2020).
A literature survey on the emissions from incineration of fluoropolymer materials performed by the Norwegian Institute for Air Research (NILU) on behalf of the Norwegian Environment Agency disclosed information indicating that incineration of fluoropolymers leads to the formation of substances like CF4 (PFC-14), CHF3 (HFC-23), C2F6 (PFC-116), tetrafluoroethene (TFE) and hexafluoropropene (HFP), some of which are potent greenhouse gases (NILU, 2009). The kind of compounds formed is strongly dependent on the incineration conditions like temperature, moisture, oxygen content, use of catalysts etc. The report concludes that incineration of fluoropolymer containing products has a great potential to contribute considerably to the total greenhouse gas emissions of Norway, but due to the lack of sound data on the fate of fluoropolymers in Norway as well as of the chemical reactions in the different types of waste incineration plants, no exact amounts can be given.
Stoiber et al. (2019) looked further into the disposal of products and materials containing PFASs and concluded that incineration of PFAS wastes can release toxic air pollutants and greenhouse gases, which may represent a cyclical problem as disposal of PFAS-containing wastes creates repeated cycles of contamination. Volatile PFASs may also be emitted into the air from landfills and wastewater treatment plants.
In the Chemicals Strategy for Sustainability the European Commission points out that in a safe and sustainable-by-design approach to chemicals, overall sustainability should be ensured by minimising the environmental footprint of chemicals in particular on climate change, resource use, ecosystems and biodiversity from a lifecycle perspective.
Legislation
Two legislative acts have already been adopted to control emissions from fluorinated greenhouse gases (F-gases), including hydrofluorocarbons (HFCs), in the European Union: the F-gas Regulation and the MAC Directive.

P.O. Box 400, FI-00121 Helsinki, Finland | Tel. +358 9 686180 | echa.europa.eu
220
F-gas Regulation
The current F-gas Regulation (Regulation (EU) No 517/2014), which applies since 1 January 2015, replaces the original F-gas Regulation adopted in 2006. The F-gas regulation has the following ambitions:
Limiting the total amount of the most potent F-gases that can be produced and imported into the EU from 2015 onwards and phasing them down in steps to one-fifth of the level of 2014 in 2030. This will be the main driver of the move towards more climate-friendly technologies;
Banning the use of F-gases (or F-gases with a GWP above a certain threshold) in many new types of equipment where less harmful alternatives are widely available, such as fridges in homes or supermarkets, air conditioning and foams and aerosols;
Preventing emissions of F-gases from existing equipment by requiring leak checks, proper servicing and recovery of the gases at the end of the equipment's life.
Annex I of the regulation lists 27 specific fluorinated greenhouse gases for which the above regulations apply and for which the intentional release into the atmosphere shall be prohibited where the release is not technically necessary for the intended use. Annex II lists 43 additional fluorinated greenhouse gases that are subject to reporting obligations.
The basis for the F-gas regulation is the GWP of the substances in scope and their contribution to global warming, while other concerns are not taken into account, e.g. atmospheric degradation to TFA which precipitates and causes exposure to humans and the environment.
However, when calculating GWP for a substance, the contribution from possible degradation products is not considered. A short-lived F-gas with a low GWP may degrade to long-lived substances with a high GWP and thereby indirectly have a considerable contribution to global warming. A discussion of degradation of some relevant F-gases may be found elsewhere in this dossier. The German Environment Agency (UBA, 2021) recently published a comprehensive investigation of degradation of F-gases: "Persistent degradation products of halogenated refrigerants and blowing agents in the environment: type, environmental concentrations, and fate with particular regard to new halogenated substitutes with low global warming potential".
The F-gas regulation is subject to revision in 2021.
MAC Directive
The Mobile Air-Conditioning (MAC) Directive (Directive 2006/40/EC) prohibits the use of F-gases with a GWP of more than 150 in new types of cars and vans introduced from 2011, and in all new cars and vans produced from 2017.
The traditionally used refrigerant in MAC systems, HFC-134a (CH2FCF3), has a GWP of 1430 and has been phased out for use in air condition equipment in new cars in the EU. The Directive does not specify any particular refrigerant or system, leaving the technical choice on the car manufacturers.
The MAC Directive is limited to the use of F-gases in air-conditioning systems in cars and vans, but not in, but not in buses, trains, ships etc. Air condition equipment is only one of several applications of F-gases.

P.O. Box 400, FI-00121 Helsinki, Finland | Tel. +358 9 686180 | echa.europa.eu
221
B.7.3. Microbiological activity in sewage treatment systems
Not specifically assessed. See section 4.9 on the challenges to remove PFASs in STPs.
B.7.4. Endocrine activity and endocrine disruption
Notes of procedure:
To obtain relevant literature that addresses the endocrine activity (EA) or endocrine disruption (ED) of PFAS in the environment an initial literature research for review papers was performed, using Scopus (www.scopus.com) and PubMed (https://pubmed.ncbi.nlm.nih.gov/). A first screening of the results showed, that there were many overlaps between the results from the two different databases but the research in Scopus produced more relevant results. Thus, only references yielded from Scopus were screened thoroughly. In total 754 titles were screened. After title screening 20 papers were selected for further reading. The results reported in the (mostly review) papers were collected in tabular form. In some cases, they were supplemented with more details from the original references. Furthermore, the literature research was complemented by references compiled in the PFASTox Database (https://pfastoxdatabase.org/). The database was filtered for animal & in-vitro studies on the endocrine system. PFASTox Databases entries were extracted in tabular form and the most important results reported in abstracts were added to the tabular compilation of results. In case of ambiguities or insufficient description of results or methodologies the references were read in more detail. Lastly, it is important to note, that the EA or ED of PFAS which are already restricted (e.g. PFOS, PFOA, C9-C14 PFCAs) were not recorded in the tabular compilation unless for reasons of comparison or to describe trends.
Overview of results & conclusion
The studies that were assessed in the course of this research reported EA / ED for 32 individual PFASs, and different mixtures of these substances. Considering the group of PFASs contains something between 5,000 - 10,000 individual substances this is a rather small dataset. From the present data no trends regarding chain length or functional groups that promote EA / ED could be derived. Thus, it is not possible to focus the assessment on a certain subset of PFASs. Most likely not all relevant studies describing EA or ED of PFASs in the environment were collected. Still, this shows that the overall data on endocrine effects of PFASs in the environment is scarce.
Four studies described adverse effects of different PFASs, evoked by an endocrine mode of action, which are considered relevant on population level (i.e. having the potential to negatively affect a whole population of animals e.g. through reduction of fecundity or fertility of individuals). In particular, 8:2 FTOH, PFBS, 6:2 Cl-PFAES and a PFAS mixture of PFOA, PFOS, PFBS and PFBA were found to cause adverse effects that can be considered relevant on the population level. In total 69 cases of EA / ED of 32 PFASs were recorded (In silico 1, in vitro 51, in vivo 17; incl. the 4 cases with effects relevant on population level). 11 cases with inconclusive results (In vitro 9, in vivo 2) and 12 cases of no EA / ED after exposure to PFASs were reported (In vitro 8, in vivo 4). A tabular overview of the EA / ED of each PFAS together with the respective study type and reference can be found in Table B.37.
A bias in the search results towards studies reporting EA / ED of PFASs has to be assumed due to the fact that the research was designed to discover studies describing such effects. Furthermore, the publication of negative results unfortunately is still not common practice in the scientific community which further strengthens the bias. Still the results of this research provide the insight, that PFAS with heterogenous structures and functional groups (e.g. carboxylic acids, sulfonic acids, telomer alcohols, ether, ester, sulfonamides, or cyclic PFAS) show EA / ED in in silico, in vitro and in vivo tests and cause adverse effects through

P.O. Box 400, FI-00121 Helsinki, Finland | Tel. +358 9 686180 | echa.europa.eu
222
disruption of the hormone system – in some cases with the potential to negatively affect whole populations. Additionally, there is a very large group of PFASs for which no information regarding their EA / ED is available (as this research indicates). Some of these compounds, e.g. those with structural similarities to already known PFASs with properties causing EA / ED, might have the potential to cause adverse effects through interaction with the hormone system of organisms in the environment. To this moment it is however not possible to say with certainty which structural elements of PFASs are responsible for their EA / ED properties.
Table B.37. Overview over EA / ED of different PFASs Substance
(CAS-, EC-No.)
Study Type Endocrine activity / Endorcrine
disruption
Reference
4:2 FTOH
(2043-47-2, 218-050-9)
In vitro + (Rosenmai et al., 2016)
In vitro + (Liu et al., 2007)
6:2 FTOH (647-42-7, 211-477-1)
In vitro 0 (Weiss et al., 2009a)
In vitro + (Rosenmai et al.,
2016)
In vitro + (Ishibashi et al.,
2007)
In vitro + (Liu et al., 2007)
In vitro + (Liu et al., 2009b)
In vitro + (Maras et al., 2006)
In vitro + (Benninghoff et al., 2011)
8:2 FTOH (678-39-7, 211-648-0)
In vitro 0 (Weiss et al., 2009a)
In vitro + (Rosenmai et al.,
2016)
In vitro + (Ishibashi et al., 2007)
In vitro + (Maras et al., 2006)
In vitro + (Benninghoff et al., 2011)
In vivo + (Liu et al., 2010)

P.O. Box 400, FI-00121 Helsinki, Finland | Tel. +358 9 686180 | echa.europa.eu
223
8:2 FTOAcr (27905-45-9, 248-722-
7) In vitro +
(Benninghoff et al., 2011)
8:2 monoPAP (57678-03-2, N.A.) In vitro +
(Rosenmai et al., 2016)
8:2 diPAP (678-41-1, 211-649-6)
In vitro + (Rosenmai et al., 2013)
In vivo - (Rosenmai et al., 2016)
10:2 diPAP (1895-26-7, 217-585-
5) In vitro -
(Rosenmai et al., 2016)
8:2 triPAP (N.A., N.A.) In vitro +
(Rosenmai et al., 2016)
PFBA (375-22-4, 206-786-3)
In vitro 0 (Weiss et al., 2009a)
In vitro + (Rosenmai et al.,
2016)
In vitro + (Behr et al., 2018)
In vitro 0 (Vongphachan et al., 2011b)
In vitro - (Croce et al., 2019)
In vitro + (Ishibashi et al., 2007)
In vivo + (Godfrey et al., 2017)
In vivo + (Godfrey et al., 2019)
PFPeA (2706-90-3, 220-300-
7)
In vitro + (Rosenmai et al., 2016)
In vitro + (Rosenmai et al., 2018)
In vitro - (Wielogorska et al., 2015)
PFHxA (307-24-4, 206-196-6)
In vitro + (Weiss et al., 2009a)
In vitro + (Rosenmai et al., 2016)
In vitro + (Benninghoff et al.,

P.O. Box 400, FI-00121 Helsinki, Finland | Tel. +358 9 686180 | echa.europa.eu
224
2011)
In vitro + (Vongphachan et al., 2011b)
In vitro + (Vongphachan et al., 2011b)
In vitro - (Wielogorska et al., 2015)
In vitro + (Ishibashi et al., 2007)
In vivo - (Cassone et al., 2012)
PFHpA (375-85-9, 206-798-9)
In vitro + (Weiss et al., 2009a)
In vitro + (Rosenmai et al.,
2016)
In vitro + (Benninghoff et al., 2011)
In vitro + (Vongphachan et al., 2011b)
In vitro + (Ishibashi et al., 2007)
In vitro - (Wielogorska et al., 2015)
PFBS (375-73-5, 206-793-1)
In vitro + (Weiss et al., 2009a)
In vitro + (Vongphachan et al.,
2011b)
In vitro + (Behr et al., 2018)
In vitro - (Croce et al., 2019)
In vitro + (Ishibashi et al., 2011)
In vivo - (Newsted et al.,
2008)
In vivo + (Chen et al., 2018b)
In vivo + (Sant et al., 2019)
In vivo + (Lou et al., 2013)

P.O. Box 400, FI-00121 Helsinki, Finland | Tel. +358 9 686180 | echa.europa.eu
225
PFHxS (355-46-4, 206-587-1)
In vitro + (Weiss et al., 2009a)
In vitro + (Watkins et al.,
2015)
In vitro + (Vongphachan et al., 2011b)
In vitro - (Behr et al., 2018)
In vitro + (Ishibashi et al., 2011)
In vitro - (Wielogorska et al., 2015)
In vivo - (Ramhøj et al., 2020)
In vivo + (Cassone et al., 2012)
PFHpS (375-85-9, 206-798-9)
In vitro 0 (Vongphachan et al., 2011b)
In vivo + (Nøst et al., 2012)
PFDS (335-77-3. 206-401-9)
In vitro + (Benninghoff et al., 2011)
In vivo 0 (Benninghoff et al., 2011)
HPFO-DA (13252-13-6, 236-236-
8)
In vitro + (Li et al., 2019)
In vitro + (Coperchini et al., 2020)
In vivo + (Conley Justin et al., 2019)
HPFO-TA (2641-34-1, 220-141-
3) In vitro + (Li et al., 2019)
6:6 PFPiA (70609-44-8, N.A.) In vivo + (Liu et al., 2019)
6:8 PFPiA (610800-34-5, N.A.) In vivo + (Liu et al., 2019)
8:8 PFPiA (500776-69-2, N.A.)
In vivo + (Liu et al., 2019)
In vivo + (Kim et al., 2020b)
PFOSA (754-91-6, 212-046-0) In vitro + (Wågbø et al., 2012)

P.O. Box 400, FI-00121 Helsinki, Finland | Tel. +358 9 686180 | echa.europa.eu
226
PFECHS (646-83-3, N.A.) In vivo + (Houde et al., 2016)
6:2 FTUA (N.A., N.A.) In vitro + (Weiss et al., 2009a)
N-MeFOSE (24448-09-7, 246-262-
1) In vitro 0 (Weiss et al., 2009a)
N-EtFOSE (1691-99-2, 216-887-
4) In vitro 0 (Weiss et al., 2009a)
FOSA (754-91-6, 212-046-0)
In vitro + (Weiss et al., 2009a)
In vitro + (Rosenmai et al., 2018)
N-MeFOSA (31506-32-8, 250-665-
8) In vitro 0 (Weiss et al., 2009a)
N-EtFOSA (4151-50-2, 223-980-
3) In vitro 0 (Weiss et al., 2009a)
F-53B (MIxture of 6:2 Cl-PFAES and 8:2
Cl-PFAES) (73606-19-6, N.A.)
In silico + (Deng et al., 2018)
In vitro + (Deng et al., 2018)
In vivo + (Deng et al., 2018)
6:2 Cl-PFAES (73606-19-6, N.A.)
In vitro + (Li et al., 2018a)
In vivo + (Shi et al., 2018)
In vivo 0 (Zhou et al., 2018)
8:2 Cl-PFAES (N.A., N.A.)
In vitro + (Li et al., 2018a)
PFAS mixture (PFOA, PFOS, PFBS, PFNA)
(N.A., N.A.) In vivo + (Lee et al., 2017)
+ = Activity / effects related to PFAS exposure
- = No activity / effects related to PFAS exposure
0 = inconclusive results
XX = Effects with presumed relevance on population level
N.A. = Not available
Summary of main results from studies

P.O. Box 400, FI-00121 Helsinki, Finland | Tel. +358 9 686180 | echa.europa.eu
227
A short summary and reference for each study which is mentioned in the following paragraphs can be found in Table B.38.
In silico
Two in silico studies show that different PFASs have the theoretical ability to interact with receptors in the endocrine system of different species, or to bind to hormone transporting proteins and thus have the potential to interfere with hormone homeostasis.
In vitro
Different reporter gene assays show that PFASs can interact with hormone receptors from different cell systems incl. estrogen receptors (ER), androgen receptors (AR) or peroxisome proliferator-activated receptors (PPAR). Via these interactions PFASs can evoke (anti) estrogenic or (anti) androgenic activity and influence the steroidogenesis. Examples for effects are an alternation of the receptor activity or an induction of VTG production or cell proliferation. Besides PPAR and relevant receptors from the hypothalamic–pituitary–gonadal (HPG) axis, PFASs have shown to interact with the hypothalamic–pituitary–thyorid (HPT) axis too. In vitro binding to thyroxine transport proteins transthyretin (TTR) and thyroxine-binding-glubolin (TBG) has been reported in different studies. Furthermore, PFASs can alter the expression of thyroid-hormone responsive genes.
Some in vitro studies made an attempt at describing the relation between EA / ED of PFASs and their structure (i.e. chain length or functional group). Binding to the human PPARγ ligand binding domain was reported to increase with increasing chain length of PFCAs until a chain length of 11 carbon atoms. Similarly, PPARα activity in HepG2 cells was observed to increase with chain length up until a chain length of C8. Interestingly, an in vitro study with Baikal seal (Pusa sibirica) PPARα (BS PPARα) made contradictory observations and reported that PFCAs with a chain length > C7 had a negative correlation between chain length and induction potency towards BS PPARα. A test with HEK 293 cells found the activity of PFOA and substitutes towards the PPARγ to increase in the order HFPO-DA < PFOA < HFPO-TA. A radioligand-binding assay testing for binding capacity to human TTR reported a maximum binding potency for PFCAs with a chain length of C8. The authors if this study suggested that the binding potency is directly linked to the number of fluorinated alkyl groups in the carbon-chain. Regarding the influence of functional groups on EA / ED, one in vitro study described the binding affinity towards PPAR to be stronger for PFSAs, compared to their PFCA homologues. Another study however, reported that they found the transactivation potencies of PFCAs to be stronger than the ones of PFSAs with similar chain length. TTR binding potency was observed to be stronger for PFSAs than for PFCAs (at least for C4-C8 PFASs). Especially with regard to the interaction of PFAS with PPAR there is evidence suggesting a relationship between the chain length as well as the head group and the binding affinity of the compounds. Similar indications exist from one study investigating TTR binding potencies of different PFAS. But the results from different studies contradict each other and overall there is not enough information to identify clear trends. Statements like “PFAS above / below a certain chain length or PFAS with / without a certain headgroup have a stronger / weaker endocrine activity” cannot be made on the basis of the data at hand.
In vivo
There is evidence for changes in the gene expression for genes regulated by hormones in fish and crustaceans after in vivo exposure to PFASs (e.g. vtg, a common indicator for (anti)estrogenic MoA). Other in vivo studies report changes in the activity of enzymes that catalyze the biosynthesis of hormones in fish, or birds. Adverse effects observed in in vivo studies after exposure to PFASs include morphological changes in endocrine and other organs in fish (e.g. follicle cell degeneration and atrophy, changes in swim bladder size (an indicator for disruption of HPT-axis as recently summarized by Dang et al 2021)), a

P.O. Box 400, FI-00121 Helsinki, Finland | Tel. +358 9 686180 | echa.europa.eu
228
decreased fecundity in fish, a reduced number of eggs spawned and other adverse effects on the F1 generation of exposed fish (e.g. changes in sex ratio, reduced spermiation) or reduced pipping success (pip = first crack in eggshell) and decreased tarsus length and embryo mass in birds exposed in ovo. All of the aforementioned adverse effects have the potential to negatively affect whole populations.
Additionally, several in vivo studies observed changes in hormone levels in different species after exposure to PFASs. Two studies with fish reported, that changes in hormone levels were transferred to the F1 generation and adverse effects related to hormone level changes were observed in F1 generation even though the F1 generation was not exposed to PFASs. Such cross-generational effects in combination with the high persistence of PFASs can have severe impacts on whole wildlife populations and in the long run also disrupt fragile networks of ecosystems. A positive relationship between changes in hormone levels and PFAS exposure was already observed in wildlife birds. Correlations do not necessarily show a causal relationship but it still raises a concern about effects of PFASs on the endocrine system under real (meaning non-laboratory) conditions.
In summary, the in silico, in vitro and in vivo indications of interactions of PFASs with the endocrine system of environmental species, adverse effects (some occurring cross generational), and first observations of possible influences of PFAS body-burden on hormone levels in wildlife are strong arguments to restrict the use of PFASs. The environmental presence of PFASs and their concentrations in wildlife will increase under continued use due to their high persistence, increasing the probability for adverse and irreversible effects.

P.O. Box 400, FI-00121 Helsinki, Finland | Tel. +358 9 686180 | echa.europa.eu
229
Table B.38. Studies investigating the EA / ED of PFAS Reference Substance Activity/Effect
(in some cases direct quotes from the referenced source are used)
Test System / Methods (in some cases direct quotes from the referenced source are used)
Remark
(Rosenmai et al., 2016)
4:2 FTOH, 6:2 FTOH, 8:2 FTOH, 8:2 diPAPs, 10:2 diPAPs, 8:2 triPAPs, PFBA, PFPeA, PFHxA, PFHpA
4:2 FTOH increased ER-activity (3-4 fold)
6:2 FTOH significantly increased 17β-estradiol levels
and increased ER-activity (1,5-5 fold)
8:2 FTOH increased ER-activity (1.5 fold)
8:2 monoPAPs increased ER-activity (2 fold)
8:2 diPAPs inhibited testosterone synthesis
10:2 diPAPs did not show activity in any of the assasys
8:2 triPAPs decreased ER-activity (0.8 –
In vitro:
ER-reporter gen assay: stably transfected human ovarian adenocarcinoma cell-line (BG1Luc4E2)
AR-reporter gene assay: Chinese hamster ovary cell-line (ATCC) transiently transfected with receptors, pSVAR0 (antagonist mode) or pSVAR13 (toxicity) and the reporter gene, MMTV-LUC
PPARα, PPARγ reporter gene assay: NIH-3T3 cells transiently transfected with plasmids, expressing the ligand-binding domain of murine PPARα or PPARγ as well as a plasmid containing the upstream-activating sequence (UAS)
Steroidogenesis assay: H295R cells from an ex vivo rat fetal testis culture system (FEGA)
6:2 FTOH was recently assessed for it´s endocrine disrupting properties in the course of the substance evaluation (SEv) for 6:2 FTA and 6:2 FTMA. More details are provided below the table*

P.O. Box 400, FI-00121 Helsinki, Finland | Tel. +358 9 686180 | echa.europa.eu
230
0.5 fold)
PFBA increased PPARα-activity
PFPeA, PFHxA and PFHpA increased PPARα- and PPARγ-activity
(Liu et al., 2009a)
6:2 FTOH females:
- the increase of E2 was accompanied by up-regulated hepatic estrogenic receptor a (ERα) and vitellogenin (VTG1 and VTG3) expression
- significantly increased plasma estradiol (E2) and testosterone (T) levels
- reduced ratio of T/E2
males:
- elevation of the T level is consistent with the up-regulation of cytochrome P450 c17-hydroxylase, 17, 20-lase (CYP17) and the down-regulation of cytochrome P450 aromatase A (CYP19A)
- significantly increased plasma estradiol (E2) and testosterone (T) levels
In vivo:
Zebrafish (Danio rerio): 18 weeks old at start of exposure
Exposure to 0, 0.03, 0.3 and 3.0 mg/l 6:2 FTOH for 7 days.
6:2 FTOH was recently assessed for it´s endocrine disrupting properties in the course of the substance evaluation (SEv) for 6:2 FTA and 6:2 FTMA. More details are provided below the table*

P.O. Box 400, FI-00121 Helsinki, Finland | Tel. +358 9 686180 | echa.europa.eu
231
- increased ratio of T/E2
results suggest that FTOHs may disturb fish reproduction through endocrine disrupted activity
(Liu et al., 2010)
8:2 FTOH Females:
- plasma testosterone and estradiol levels were significantly increased
- promotion of oocyte maturation, upregulated follicle-stimulating hormone β (FSHβ) and luteinizing hormone β (LHβ) in the pituitary
- down-regulation of gene transcription of vtg1 and zp2α, associated with decreased fecundity
Males:
- T levels were decreased and E2 levels increased,
- retarded spermiation, - downregulated FSHß and LHß, - Up-regulation of vitellogenin
(VTG1) and zona pellucida protein 2 (ZP2a) gene transcription, indicating estrogenic activity
F1:
In vivo:
Zebrafish (Danio rerio): 16 weeks old at start of exposure
Exposure to 0, 10, 30, 90, 270 µg/L for 4 weeks
Effects with relevance on population level

P.O. Box 400, FI-00121 Helsinki, Finland | Tel. +358 9 686180 | echa.europa.eu
232
- number of eggs spawned and sperm production were reduced
- thinning of eggshell, and reduced protein content and egg diameter
- reduced hatching rates in the offspring
General:
- exposure to 8:2 FTOH caused disruption of sex hormone biosynthesis and impaired reproduction in adult zebrafish, ultimately resulting in decreased hatching rates in the offspring
(Mokra, 2021) (Review)
PFNA, PFHxS, + others
short-chain PFASs, such as PFNA and PFHxS, activated the PPAR transcription factor receptor, which led to increased metabolism of fatty acids, increased apolipoprotein I (apo A1) level (Rosen et al., 2017a)]
PFHxS caused an almost 10-fold stronger expression of the oxidoreductase, one of regulators of lipid metabolism, and stearoyl coenzyme A desaturase (Scd), compared to PFOA, PFOS and PFNA (Watkins et al., 2015)
Many different: in vitro and in vivo test systems (but only in vitro studies mentioned here)
Also of relevance for HH

P.O. Box 400, FI-00121 Helsinki, Finland | Tel. +358 9 686180 | echa.europa.eu
233
the binding affinity of PFASs with the same number of carbon atoms in chain is dependent on terminal groups and decreases as follows: sulfo group > carboxylic acid group > alcohol group (Qiu et al., 2020)
(Coperchini et al., 2021)(Review)
GenX, PFBA, PFBS, 6:6 PFPiA, 6:8 PFPiA, 8:8 PFPiA, PFHxS + others
In vitro:
- short-chain PFAS had no cytotoxic effects on rat thyroid cells and did not interfere with thyroid-stimulating hormone (TSH)-dependent cyclic adenosine monophosphate (cAMP) production (Croce et al., 2019)
- FRTL-5 cells exposed to increasing concentrations of GenX displayed both genotoxic and cytotoxic effects (Coperchini et al., 2020)
In vivo:
- GenX caused a dose-responsive up-regulation of 28 different genes involved in the PPAR signaling pathway (Conley Justin et al., 2019)
- After exposure to 0.5–50 nM of 8:8 PFPiA in zebrafish larvae, an increase of T4 and T3 was observed. In addition, corticotropin-releasing hormone (CRH) and TSHb were down-
Many different: in vitro, in vivo test systems
Also of relevance for HH

P.O. Box 400, FI-00121 Helsinki, Finland | Tel. +358 9 686180 | echa.europa.eu
234
regulated and uridinediphosphate-glucuronosyltransferase (UGT1AB) resulted up-regulated. The authors suggested that this should be regarded as a compensatory response to the hyperthyroid status (Liu et al., 2019)
- Contrary to above study by Kim et al., showed an up- regulation of corticotropin releasing hormone b (CRHB), thyrotropin receptor (TSHR), and thyroid transcription factor-1 (NKX2.1) genes which was suggestive of a negative feedback in response to decreased circulating thyroid hormones (Kim et al., 2020b)
- study performed on dams exposed to PFHxS reported no statistically significant effects on thyroid gland weights and histopathology (Ramhøj et al., 2020)
(Benninghoff et al., 2011)
6:2 FOTH, 8:2 FTOH, 8:2 FtOAcr, PFOA, PFNA, PFDA, PFUnDA, PFPA, PFHxA, PFHpA, PFOS, PFDS, E2 + others
In silico:
- computational model based upon crystal structure from human Erα: PFOA, PFNA, PFDA, and PFOS all efficiently docked with Erα from different species in a similar manner to BPA and nonylphenol
In silico:
- ICM-virtual ligand screening (VLS) procedure (Molsoft ICM v3.5-1p)
- proteins were built based upon 1ERE as the 3Dtemplate with Molsoft ICM v3.5-1p
PFHxA was recently assessed for it´s endocrine disrupting properties in the course of the substance evaluation (SEv) for 6:2 FTA and 6:2 FTMA. More details are provided below

P.O. Box 400, FI-00121 Helsinki, Finland | Tel. +358 9 686180 | echa.europa.eu
235
In vitro:
- PFOA, PFNA, PFDA, PFUnDA, and PFOS significantly enhanced human Erα-dependent transcriptional activation at concentrations ranging from 10–1000 nM
- All PFAAs tested weakly bound to trout liver ER with IC50 values of 15.2–289 mM
In vivo:
- PFOA, PFNA, PFDA, PFUnDA all potent inducers of vtg in vivo (at high concentrations of 50 ppm)
- Structure-activity relationship for PFAAs was observed, where eight to ten fluorinated carbons and a carboxylic acid end group were optimal for maximal vtg induction
In vitro:
- ER saturation binding assays and competitive binding assays with trout liver cells (cytosol fraction of liver homogenate)
- Erα reporter gene assay with HEK-293T cells co-transfected with XTEL luciferase reporter plasmid containing a consensus estrogen-responsive element (ERE) sequence from the Xenopus Vtg promoter human Erα expression vector
In vivo:
- Rainbow trout (Oncorhynchus mykiss): Dietary exposure of juvenile individuals (5 months old for VTG analysis, 11 months old for other) 14 day PFAS mixture exposure (in the ratio of 1:1:1:1, mix A composed of 5 mg/L individual PFAS (PFOA, PFNA, PFDA, PFUnDA), mix B composed of 50 mg/L individual PFAS, mix C composed of 250 mg/L individual PFC)
- For VTG: PFOA and PFDA exposure, 0.026, 0.128, 0.64, 3.2, 16, 80, 400, 2000 mg/L
the table*

P.O. Box 400, FI-00121 Helsinki, Finland | Tel. +358 9 686180 | echa.europa.eu
236
PFOA or PFDA; DMSO vehicle (0.05 mg/L);
(Wågbø et al., 2012)
PFOSA Hepatocellular fatty acids content, gene expression (lipid metabolism, oxidative stress),
In vivo:
Atlantic salmon (Salmo salar) hepatocytes, Static exposure (12 h and 24 h); 0.01% DMSO (solvent control), 2, 20, 50 µM PFOSA
Only abstract available
(Lee et al., 2017)
PFAA mixture (PFOA, PFOS, PFBS, PFNA)
Cellular level changes in the endocrine organs, including follicle cell degeneration in male fish and follicle cell atrophy
significant increase in vtg expression relative to the control in the F2 generation (but not significant for F0, or F1 generation) at 5 µg/L
reduced fecundity: suppression of hatching rate in F1 generation
survival rate of F1 and F2 generation > 80 % for all treatment groups
sex ratio: PFAA high concentration caused the shifting into male portion
In vivo:
Japanese medaka (Oryzias latipes), 238 d exposure at 0.5 and 5 µg/L (nominal) mixture ratio 1:1:1:1
Effects with relevance on population level

P.O. Box 400, FI-00121 Helsinki, Finland | Tel. +358 9 686180 | echa.europa.eu
237
(Ishibashi et al., 2007)
6:2 FTOH, 8:2 FTOH, NFDH, PFOS, PFOA
Treatments with 6:2 FTOH, 8:2 FTOH and NFDH dose-dependently induced hER-mediated transcriptional activity with interaction between the hERα or hERβ ligand binding domain and TIF2
estrogenic effects of FTOHs on hERα were higher than those on hERβ, indicating a differential responsiveness of hERs to FTOHs
estrogenic effects for hERα and hERβ descended in the order of estradiol-17b>>>6:2 FTOH> NFDH>8:2 FTOH
In vitro:
yeast two-hybrid assay: modified by incorporation of hER isoforms (hERα or hERβ)
(Liu et al., 2007)
4:2FTOH, 6:2 FTOH, 8:2 FTOH, PFOS, PFOA
Dose-dependent vtg induction after exposure to 6:2 FTOH but not 4:2 FTOH or 8:2 FTOH
Significant vtg induction after 12 h (6:2 FTOH) exposure, and 72h exposure (4:2 and 8:2 FTOH (but not dose dependent))
Co-exposure with E2 inhibited E2-induced hepatocellular VTG production in a dose-dependent manner except for 4:2 FTOH suggesting an anti-estrogenic activity
In vitro:
non-competitive enzyme-linked immunosorbent assay (ELISA) investigating vtg induction in in primary cultured hepatocytes of freshwater male tilapia (Oreochromis niloticus)

P.O. Box 400, FI-00121 Helsinki, Finland | Tel. +358 9 686180 | echa.europa.eu
238
Co-exposure with known estrogen receptor inhibitor tamixofen inhibited the ability of test compounds to stimulate vitellogenesis: estrogenic effect of PFAS may be mediated by the estrogen receptor pathway
(Newsted et al., 2008)
PFBS No treatment-related mortalities or effects on body weight, weight gain, feed consumption, histopathology measures, or reproductive parameters evaluated in the study when compared to the control group
In vivo:
Northern bobwhite quail (Colinus virginianus) reproduction study: adult quail were exposed to nominal dietary concentrations of 100, 300, or 900 mg PFBS/kg, ww feed for up to 21 weeks
(Weiss et al., 2009a)
PFBA, PFHxA, PFHpA, PFOA, PFNA, PFDcA, PFUnA, PFDoA, PFTeDA, 7H-PFHpA, 6:2 FTUA, PFBS, PFHxS, PFOS, L-PFDS, L-PFOSi, 6:2 FTOH, 8:2 FTOH, N-MeFOSE, N-EtFOSE, FOSA, N,N-ME2FOSA, N-MeFOSA, N-EtFOSA
binding potency decreased in the order: perfluorohexane sulfonate > perfluorooctane sulfonate/perfluorooctanoic acid > perfluoroheptanoic acid > sodium perfluoro-1-octanesulfinate > perfluorononanoic acid
maximum potency at a chain length of eight carbons (PFOA). The binding potency is clearly associated with the degree of fluorination of the alkyl chain
For PFASs with a carbon chain length of four to eight, TTR binding potencies were significantly higher for compounds
In vitro:
radioligand-binding assay testing for binding capacity to human TTR
Modelled binding to human TTR. Of relevance for ENV due to high conservation of HPT axis
PFHxA was recently assessed for it´s endocrine disrupting properties in the course of the substance evaluation (SEv) for 6:2 FTA and 6:2 FTMA. More details are

P.O. Box 400, FI-00121 Helsinki, Finland | Tel. +358 9 686180 | echa.europa.eu
239
containing a sulfonate functional group than for those containing a carboxylic acid functional group
QSAR models indicated the dependence on molecular size and functional groups (but only preliminary result, more detailed description of chemical properties and data for validation needed)
Of the six PFASs with the same fluorinated carbon chain length (C8) but with different sulfate-based functional groups, highest binding potency was observed for the sulfonate (PFOS), followed by the 239ulfonate (perfluorinated octane 239ulfonate) and the sulfonamide (perfluoro-1-octane sulfonamide)
Test compounds with the sulfonamide functional group protected by an alkyl group had no TTR binding potency themselves but seemed to cause a slight increase in T4-TTR binding at high test concentrations
provided below the table*
(Vongphachan et al., 2011a)
PFBA, PFBS, PFHxA, PFHxS, PFHpA, and PFHpS
Chicken:
- PFAS < C8 altered the expression of TH-responsive genes (D2, D3, TTR, and RC3) in chicken
In vitro:
primary cultures of avian neuronal cells of two avian species: the domestic chicken (Gallus domesticus) and
PFHxA was recently assessed for it´s endocrine disrupting properties in the

P.O. Box 400, FI-00121 Helsinki, Finland | Tel. +358 9 686180 | echa.europa.eu
240
embryonic neuronal cells to a greater extent than PFAS > C8
- chicken: D2 upregulated after exposure to PFHxA, PFHpA, and PFNA
- D3 mRNA expression increased twofold to fivefold following exposure to several PFCs (PFBS, PFHxA, and PFHxS)
- PFHxS treatment significantly decreased TTR mRNA expression
- PFHpA exposure increased TTR mRNA levels
- PFBS and PFHxS treatment increased RC3mRNAexpression
- MBP mRNA expression was upregulated at 3 and 10 µM following PFHxA treatment
- no changes to Oct-1 mRNA levels
Herring gull:
- upregulation in RC3 mRNA expression (Fig. 4A) following PFHpA exposure
- RC3 mRNA expression did not change
- increase in Oct-1 mRNA following treatment with PFBS, PFHxA, and PFHxS
General:
- study provided evidence that the brain may be a target organ for
herring gull (Larus argentatus). Measurement of mRNA levels of thyroid hormone (TH)–responsive genes D2, D3, TTR, Oct-1, myelin basic protein and RC3 after exposure to PFBA, PFBS, PFHxA, PFHxS, PFHpA, and PFHpS at five concentrations: 0.01, 0.1, 1, 3, and 10lM
course of the substance evaluation (SEv) for 6:2 FTA and 6:2 FTMA. More details are provided below the table*

P.O. Box 400, FI-00121 Helsinki, Finland | Tel. +358 9 686180 | echa.europa.eu
241
PFAS effects and that these contaminants have the potential to alter TH homeostasis in birds
(Maras et al., 2006)
6:2 FTOH, 8:2 FTOH
6:2 FTOH & 8:2 FTOH induce cell proliferation at 10 μM
small but relevant up-regulation of the estrogen receptor as a consequence of exposures to 6:2 FTOH or 8:2 FTOH.
Up regulated genes: TFF1, PGR, ESR1, PDZK1
Down regulated genes: ERBB2
In vitro:
proliferation-promoting capacity of 6:2 FTOH and 8:2 FTOH with an Escreen assay of MCF-7 cell lines
(Houde et al., 2016)
PFECHS (a cyclic perfluoroalkyl sulfonic acid used as an
erosion inhibitor in aircraft hydraulic fluid)
significant decrease of the transcription of VTG1 in exposed organisms
transcriptomic and cellular results indicated that exposure to PFECHS reduced VTG in D. magna
no effects were observed on the survival, the frequency of molting, the number of neonates produced or the growth of
In vivo:
sublethal exposure (12 d) of Daphnia magna to PFECHS (0.06, 0.6, and 6 mg/L), microarray and quantitative real-time PCR

P.O. Box 400, FI-00121 Helsinki, Finland | Tel. +358 9 686180 | echa.europa.eu
242
exposed organisms
(Lou et al., 2013)
PFOS, PFBS neither PFOS nor PFBS had a significant effect on the survival and growth
caused hepatohistological impairment at higher concentrations (100; 1,000 ug/l)
PFBS had no effect on the sex ratio and gonadal histology.
PFOS and PFBS promoted expression of estrogen receptor (ER) and androgen receptor (AR), but not affected aromatase expression in the brain
In vivo:
growth and sexual development of Xenopus laevis tadpoles
exposure to series of concentrations of PFOS and PFBS (0.1; 1; 100; 1,000 ug/l) as well as 17-beta-estradiol (E2, 100 ng/l) and 5 alpha-androstan-17-beta-ol-3-one (DHT, 100 ng/l) from stage 46/47 to 2 months postmetamorphosis
(Behr et al., 2018)
PFBA, PFHxA, PFOA, PFBS, PFHxS, PFOS
PFOA, PFOS and PMOH enhanced 17beta-estradiol-stimulated estrogen receptor beta activity
PFOS, PMOH, PFHxA and PFBA enhanced dihydrotestosterone-stimulated androgen receptor activity
H295R steroidogenesis assay, PFOA and PFOS slightly enhanced estrone secretion, and progesterone secretion was
In vitro:
Cell Lines: H295R, HEK293T, LNCaP, MCF-7, MDA-kb2
Exposure Duration : 24 h – 6 d
Exposure Range : 0.001 – 500 µM
Types of Endpoints: Androgen related, Cytotoxicity, Estrogen related, Steroidogenesis, Cell proliferation
PFHxA was recently assessed for it´s endocrine disrupting properties in the course of the substance evaluation (SEv) for 6:2 FTA and 6:2 FTMA. More details are provided below the table*

P.O. Box 400, FI-00121 Helsinki, Finland | Tel. +358 9 686180 | echa.europa.eu
243
marginally increased by PFOA.
All effects were only observed at concentrations above 10 µM, and none of the PFAS displayed any effect on any of the molecular endocrine endpoints at concentrations of 10 µM or below
(Cassone et al., 2012)
PFHxA, PFHxS
Pipping success (pip = first break in eggshell) was reduced to 63% at the highest dose of PFHxS;
PFHxS exposure (38,000 ng/g) decreased tarsus length and embryo mass.
PFHxS and PFHxA accumulated in the three tissue compartments analyzed as follows: yolk sac > liver > cerebral cortex.
Type II and type III 5’-deiodinases (D2 and D3) and cytochrome P450 3A37 mRNA levels were induced in liver tissue of chicken embryos exposed to PFHxS
D2, neurogranin (RC3), and octamer motif binding factor 1 mRNA levels were upregulated in cerebral cortex. Plasma TH
In vivo:
Chicken (Gallus gallus domesticus): determined in ovo effects of PFHxS and PFHxA exposure (maximum dose = 38,000 and 9700 ng/g egg, respectively) on embryonic death, developmental endpoints, tissue accumulation, mRNA expression in liver and cerebral cortex, and plasma TH levels
PFHxA was recently assessed for it´s endocrine disrupting properties in the course of the substance evaluation (SEv) for 6:2 FTA and 6:2 FTMA. More details are provided below the table*
In vivo effects of PFHxS but not PFHXA
Effects with relevance on population level

P.O. Box 400, FI-00121 Helsinki, Finland | Tel. +358 9 686180 | echa.europa.eu
244
levels were reduced in a concentration-dependent manner following PFHxS exposure
no effects were observed for PFHxA.
(Chen et al., 2018b)
PFBS PFBS exposure decreased the levels of 3,5,3’-triiodothyronine (T3) in F0 female blood;
increased T3 or thyroxine (T4) levels in F0 brains, in which hyperthyroidism suppressed the local transcription of 5’-deiodinase 2 (Dio2).
Decreased T3 was transferred to F1 eggs, although the parental influences were reversed in F1 larvae.
Delayed hatching was coupled with elevated T3 levels in F1 larvae.
F1 adults showed comparable symptoms of thyroidal disruption with F0 adults.
In vivo:
Exposure of F0 marine medaka (Oryzias melastigma) eggs to PFBS at different concentrations (0, 1.0, 2.9, and 9.5 µg/L) until sexual maturity. The F1 and F2 generations were reared without continued exposure.
Effects with relevance on population level!

P.O. Box 400, FI-00121 Helsinki, Finland | Tel. +358 9 686180 | echa.europa.eu
245
Slight recovery was noted in the F2 generation, although F2 larvae still exhibited thyroid disruption and synthesized excessive T4.
Results suggested that the offspring suffered more severe dysfunction of the thyroidal axis albeit without direct exposure
(Deng et al., 2018)
6:2 chlorinated polyfluorinated ether sulfonate (F-53B) (Chinese (PFOS) substitute)
In silico
- F-53B binds to transthyretin (TTR) by forming hydrogen bonds with Lys123 and Lys115, thereby interfering with thyroid hormone homeostasis
In vitro
- F-53B enhanced cell proliferation in a dose-dependent manner, indicative of thyroid receptor agonistic activity.
In vivo
- In zebrafish larvae, F-53B exposure induced significant developmental inhibition and increased thyroxine (T4) but not 3,5,3’-triiodothyronine (T3) levels accompanied by a decrease in
In silico
- Based on the homology-modeled structure of zebrafish TTR, F-53B was docked automatically into the binding site of zfTTR using AutoDock Vina 1.1.2
In vitro
- Molecular docking study to TTR Cell proliferation assay with GH3 cell line
In vivo
- Zebrafish (Danio rerio) embryos (2 hpf) exposed for 5 days to 0, 0.5, 20 and 200 μg/L F-53B

P.O. Box 400, FI-00121 Helsinki, Finland | Tel. +358 9 686180 | echa.europa.eu
246
thyroglobulin (TG) protein and transcript levels of most genes involved in the hypothalamic-pituitary-thyroid (HPT) axis
followed by depuration in clean water for 5 days
(Godfrey et al., 2017)
PFOA, TBBPA, TDCPP, DOPO, PFBA
Reduced surface area of swim bladder (3 dpf) and significant changes in gene expression patterns (3 dpf)
In vivo:
Zebrafish (Danio rerio) embryos exposed to PFOA, TBBPA, TDCPP, DOPO, PFBA. Sub-chronic (0-6days post fertilization (dpf)) and chronic (0-28dpf) exposures at 1% of LC50
(Godfrey et al., 2019)
TDCCP, PFOA, PFBA
Females displayed significantly larger swim bladders (which are under thyroid hormone control) after exposure to all chemicals with the exception of triiodothyronine, which caused the opposite effect
In vivo:
Japanese Medaka (Oryzias latipes) embryos were exposed to sublethal concentrations of TDCPP, 0.019 mg/L), PFOA, (4.7 mg/L) and PFBA (137 mg/L). Exposure from 0 – 10 dpf
(Ishibashi et al., 2011)
PFBA, PFPeA, PFHxA, PFHpA, PFOA, PFNA, PFDA, PFUnA, PFDoA, PFBS, PFHxS, PFOS
IEFs for the PFAS was as follows: PFOA (IEF: 1)>PFHpA (0.89)>PFNA (0.61)>PFPeA (0.50)>PFHxS (0.41)>PFHxA (0.38) approximately PFDA (0.37)>PFBA (0.26)=PFOS (0.26)>PFUnDA (0.15)>>PFDoDA and PFBuS (not activated).
SAR analysis showed that PFCAs having more than seven perfluorinated carbons had a negative correlation (r=-1.0, p=0.017) between the number of perfluorinated carbons and the IEF of PFCAs, indicating that the number of
In vitro
reporter gene assay
Transactivation of the Baikal seal (Pusa sibirica) peroxisome proliferator-activated receptor alpha (BS PPARα) by PFAS (C4-C12)
estimated the PFOA induction equivalency factors (IEFs), a ratio EC50 of PFOA to the concentration of each compound that can induce the response corresponding to 50% of the maximal response of PFOA
PFHxA was recently assessed for it´s endocrine disrupting properties in the course of the substance evaluation (SEv) for 6:2 FTA and 6:2 FTMA. More details are provided below the table*

P.O. Box 400, FI-00121 Helsinki, Finland | Tel. +358 9 686180 | echa.europa.eu
247
perfluorinated carbon of PFCAs is one of the factors determining the transactivation potencies of the BS PPARα.
PFCAs were more potent than PFSAs with the same number of perfluorinated carbons
(Li et al., 2018a)
6:2 Cl-PFAES and 8:2 Cl-PFAES (PFOS alternatives in China)
6:2 Cl-PFAES and 8:2 Cl-PFAES bound to PPARs with affinity higher than PFOS
showed agonistic activity toward PPARs signaling pathways with potency similar to (6:2 Cl-PFAES) or higher than (8:2 Cl-PFAES) PFOS
Cl-PFAESs fitted into the ligand binding pockets of PPARs with very similar binding mode as PFOS
In vitro:
fluorescence competitive binding assay
luciferase reporter gene transcription assay (Cell Lines Used: 3T3-L1, HEK293T)
(Li et al., 2019)
HFPO-TA, HFPO-DA
receptor binding experiment showed HFPO-TA exhibited 4.8-7.5 folds higher binding affinity with PPARγ than PFOA, whereas HFPO-DA exhibited weaker binding affinity than PFOA.
Agonistic activity toward PPARγ signaling pathway in HEK 293 cells in the order of
In vitro:
investigation of receptor binding, receptor activity, and cell adipogenesis effects (Cell Lines Used: 3T3-L1, HEK293T, Preadipocytes) to compare potential disruption effects of HFPO-TA, HFPO-DA, and PFOA on peroxisome proliferator-activated receptor gamma (PPARγ) via the

P.O. Box 400, FI-00121 Helsinki, Finland | Tel. +358 9 686180 | echa.europa.eu
248
HFPO-TA > PFOA > HFPO-DA.
Molecular docking simulation indicated HFPO-TA formed more hydrogen bonds than PFOA, whereas HFPO-DA formed fewer hydrogen bonds than PFOA.
HFPO-TA promoted adipogenic differentiation and lipid accumulation in both mouse and human preadipocytes with potency higher than PFOA. Adipogenesis in human preadipocytes is a more sensitive end point than mouse preadipocytes
(Nøst et al., 2012)
PFHpS, PFOS, PFNA + others
PFAS dominated the summed HOCs concentrations in both species (77% in kittiwakes and 69% in fulmars).
Positive associations between total thyroxin (TT4) and PFAS (PFHpS, PFOS, PFNA) were reported by the authors for both species. The authors qualify that “Although correlations do not implicate causal relationships per se, the correlations are of concern as disruption of TH homeostasis may cause developmental effects in young birds”
In vivo:
Assessed plasma concentrations of halogenated organic contaminants (HOCs) in chicks of two seabird species: black-legged kittiwake (Rissa tridactyla) and northern fulmar (Fulmarus glacialis) to investigate possible correlations of HOCs with circulating thyroid hormone (TH) concentrations.
Plasma chicks were sampled in Kongsfjorden, Svalbard in 2006.
Samples were analyzed for thyroid hormones and a wide range of HOCs (polychlorinated biphenyls (PCBs),

P.O. Box 400, FI-00121 Helsinki, Finland | Tel. +358 9 686180 | echa.europa.eu
249
hydroxylated (OH-) and methylsulphoned (MeSO-) PCB metabolites, organochlorine pesticides (OCPs), brominated flame retardants (BFRs), and perfluorinated compounds (PFAS)
(Ren et al., 2016a)
6:2 FTOH, 8:2 FTOH, 10:2 FTOH, PFBS, PFHxS, PFOS, PFBA, PFHxA, PFHpA, PFOA, PFNA, PFDA, PFUnA, PFDoA, PFTA, PFTdA,
Most of the tested PFASs bound TTR with relative potency (RP) values of 3 × 10⁻⁴ to 0.24 when compared with that of the natural ligand thyroxine, whereas fluorotelomer alcohols did not bind
Structure-binding analysis revealed that PFASs with a medium chain length and a sulfonate acid group are optimal for TTR binding, and PFASs with lengths longer than 12 carbons are optimal for TBG binding
Molecular docking showed that the PFASs bind to TTR with their acid group forming a hydrogen bond with K15 and the hydrophobic chain towards the interior. PFASs were modeled to bind TBG with their acid group forming a hydrogen bond with R381 and the hydrophobic chain extending towards R378
In vitro:
fluorescence displacement assay was used to determine the binding affinities of 16 PFASs with two major TH transport proteins, transthyretin (TTR) and thyroxine-binding globulin (TBG)
Not included in overview table as no new information regarding substance activity but interesting to describe trends
PFHxA was recently assessed for it´s endocrine disrupting properties in the course of the substance evaluation (SEv) for 6:2 FTA and 6:2 FTMA. More details are provided below the table*
(Rosenmai et al., 2018)
PFBA, PFPeA, PFHxA, PFHpA, PFOA, PFNA, PFDA,
Cellular concentration of PFCAs increased with perfluorocarbon chain length up to PFDoDA. PPARα activity of PFCAs
In vitro:
investigated the relationship between PPARα activity and cellular
Partly included in overview table as no new information

P.O. Box 400, FI-00121 Helsinki, Finland | Tel. +358 9 686180 | echa.europa.eu
250
PFUnDA, PFDoDA, PFTeDA, PFBS, PFHxS, PFOS, FOSA
increased with chain length up to PFOA.
Maximum induction of PPARα activity was similar for short-chain (PFBA and PFPeA) and long-chain PFCAs (PFDoDA and PFTeDA) (approximately twofold).
PPARα activities were induced at lower cellular concentrations for the short-chain homologs compared to the long-chain homologs
concentration in HepG2 cells: Cellular concentrations were determined by high-performance liquid chromatography–tandem mass spectrometry and PPARα activity was determined in transiently transfected cells by reporter gene assay
regarding substance activity but relevant to describe trends
In line with results from Zhang et al 2014
PFHxA was recently assessed for it´s endocrine disrupting properties in the course of the substance evaluation (SEv) for 6:2 FTA and 6:2 FTMA. More details are provided below the table*
(Sant et al., 2019)
PFBS PFBS-exposed embryos had significantly increased caudal fin deformities, delayed swim bladder inflation, and impaired yolk utilization
Incidence of fish with significantly stunted growth and truncated exocrine pancreas length was significantly increased, although these two effects occurred independently.
In vivo:
Dechorionated zebrafish (Danio rerio) embryos from two different transgenic fish lines (Tg[insulin:GFP], Tg[ptf1a:GFP]): exposed to 0 (0.01% DMSO), 16, or 32 µM PFBS daily from 1 – 7 dpf. Were examined using fluorescent microscopy for islet area and morphology, and exocrine pancreas length

P.O. Box 400, FI-00121 Helsinki, Finland | Tel. +358 9 686180 | echa.europa.eu
251
Islet morphology revealed an increased incidence of severely hypomorphic islets (areas lower than the 1st percentile of controls) and an elevated occurrence of fragmented islets.
RNA-Seq data (4 dpf) also identify disruptions in regulation of lipid homeostasis
(Shi et al., 2018)
6:2 Cl-PFESA (F-53B)
F-53B accumulated in the F0 gonads and transferred to the F1 generation via maternal eggs, and even remained in F1 adult fish and their eggs (F2) after 180d depuration
In the F0 generation, F-53B exposure significantly inhibited growth and induced reproductive toxicity, including decreased gonadosomatic index and egg production/female, changes in the histological structure of the gonads, and increased serum testosterone levels
serum estradiol and vitellogenin levels were significantly increased in 5mug/L F-53B-exposed adult males.
In vivo:
Adult zebrafish (Danio rerio) (F0 generation) were chronically exposed to different concentrations of F-53B (0, 5, 50, and 500 µg/L) for 180d using a flow-through exposure system, with F1 and F2 generations reared without exposure. The reproductive toxicity endpoints were assessed in F0 and F1 adult fish
Effects with relevance on population level (Two follow up studies investigated the ED effects further to identify possible MoA (Shi et al 2019a, 2019b; not mentioned here)

P.O. Box 400, FI-00121 Helsinki, Finland | Tel. +358 9 686180 | echa.europa.eu
252
Transcriptional levels of several genes along the hypothalamic-pituitary-gonadal axis were altered in F0 generation fish.
Testis transcriptome analysis revealed that F-53B exposure disrupted spermatogenesis in F0 male zebrafish.
Maternal transfer of F-53B also induced adverse effects on growth and reproduction in the F1 generation.
Higher occurrence of malformation and lower survival in F1 and F2 embryos indicated that parental exposure to F-53B could impair the embryonic development of offspring
(Wielogórska et al., 2015)
PFHxS, PfPeA, PFHxA, PfHpA + others
no estrogenic responses to PFASs In vitro:
MMV-LUC cell line reporter gene assay was used to assess estrogenic activity of PFAs (C6-C12) and other chemicals
PFHxA was recently assessed for it´s endocrine disrupting properties in the course of the substance evaluation (SEv) for 6:2 FTA and 6:2 FTMA. More details are

P.O. Box 400, FI-00121 Helsinki, Finland | Tel. +358 9 686180 | echa.europa.eu
253
provided below the table*
(Zhang et al., 2014a)
6:2 FTOh, 8:2 FTOH, PFBA, PFHxA, PFHpA, PFOA, PFNA, PFDA, PFUnA, PFDoA, PFTeA, PFBS, PFHxS, PFOS
binding affinity was strongly dependent on their carbon number and functional group.
For PFCAs the binding affinity increased with their carbon number from 4 to 11, and then decreased slightly.
For PFSAs binding affinity was stronger than their PFCA counterparts.
No binding was detected for the two fluorotelomer alcohols (FTOHs)
in vitro:
binding of 16 PFASs to human PPARγ ligand binding domain (hPPARγ-LBD) and their activity on the receptor in cells were investigated using HepG2/C3A cells
Partly included in overview table as no new information regarding substance activity but relevant to describe trends
PFHxA was recently assessed for it´s endocrine disrupting properties in the course of the substance evaluation (SEv) for 6:2 FTA and 6:2 FTMA. More details are provided below the table*
(Zhou et al., 2018)
6:2 Cl-PFESA relative epididymis and testis weights decreased in the 1.0 mg/kg/d group compared with the control.
No changes were observed in the serum levels of testosterone, estradiol, follicle-stimulating hormone (FSH), or luteinizing
In vivo:
subchronic exposure study to investigate the reproductive toxicity of 6:2 Cl-PFAES exposure (0, 0.04, 0.2, and 1.0 mg/kg/d body weight, 56 d) in adult male BALB/c mice
Study with higher relevance to HH but interesting to compare to other studies with 6:2 Cl-PFESA

P.O. Box 400, FI-00121 Helsinki, Finland | Tel. +358 9 686180 | echa.europa.eu
254
hormone (LH), nor in the histopathological structure of the epididymis and testis and sperm count.
56 d of consecutive gavage of 1.0 mg/kg/d of 6:2 Cl-PFAES did not affect male mouse fertility.
RNA sequencing showed that no genes were significantly altered in the testes after 6:2 Cl-PFAES exposure
* Preliminary results of a FSDT (OECD TG 234) performed with 6:2 FTOH as one main degradation product of FTA/FTMA in the course of the substance evaluation (SEv) for 6:2 FTA and 6:2 FTMA indicate an estrogenic MoA for the substances: increased VTG levels in male fish as well as changes in the secondary sex characteristics (significant decrease in the number of anal fin papillae in males) were observed. Additionally, there are hints (not statistically significant in the presented study most likely due to discrepancy between nominal and measured concentrations) for an influence of FTOH on the sex ratio. The ED EG supported the conclusion that considering all data available, there is sufficient evidence on the estrogenic modality to identify FTOH as ED for the environment. During the substance evaluation of FTA/FTMA also an AMA (OECD TG 231) assay was performed for PFHxA the other main degradation product of FTA/FTMA. The result of this test clearly shows a thyroid agonistic activity with a dose-dependent acceleration in metamorphosis of the test animals. During the ED EG discussion the view was expressed that the thyroid mediated adversity could already be concluded based on the effects observed in the submitted AMA study. A summary report of the discussion at ED EG 21 can be found here: https://echa.europa.eu/documents/10162/1459379/flashreport_edeg-21_en.pdf/e530deb9-5baf-7fd4-dc35-8a4cd7c73f33?t=1639059043393

P.O. Box 400, FI-00121 Helsinki, Finland | Tel. +358 9 686180 | echa.europa.eu
255
B.8. PBT and vPvB assessment
See section 1.1.4 of the main report. No further assessment carried out.
B.9. Exposure assessment
B.9.1. General discussion on releases and exposure
Section B.9 presents the approach taken for estimating the emissions of PFAS from firefighting foams to the environment for the baseline scenario and the five ROs assessed, broken down by environmental compartment (Section B.9.3). The results of the emission modelling for the baseline are presented in section B.9.3.232. Discussion on the possible uptake by humans via the consumption of food and water (Section B.9.6).
B.9.2. Manufacturing
As discussed previously, this dossier focuses on the use of PFAS in firefighting foams. The manufacturing of PFAS has not been considered. However, emissions from the formulation of PFAS-based firefighting foams are considered within the following section.
B.9.3. Use 1: Firefighting foams
B.9.3.1. General information
The assessment is focused on the estimation of the emissions of PFASs to the environment, broken down by environmental compartment (atmospheric, aquatic and terrestrial) and by type of foam use.
The assessment focused on understanding the emission pattern throughout the life cycle so that releases can be compared across foam products: how much foam is used; how much of it is collected; how much is then incinerated; do the foams contaminate other environmental compartments and if so, how much ends up in each compartment. The emissions of PFASs from PFAS-based firefighting foams have been calculated in accordance with the different ROs which have been assessed.
Therefore, rather than using risk assessment models such as EUSES, a source-flow approach has been applied.
As elaborated in section 1.1.4 and concluded in section 1.1.6 of the main report, the properties of PFASs warrant a non-threshold approach to the risk assessment. For this purpose, releases of PFAS are to be considered a proxy for risk. The assessment focuses on the impact of the different ROs on the emissions of PFASs in the environment compared to the baseline.
The emission estimates that have been developed are intended to provide an illustrative assessment to help better understand the material flow and emissions resulting from the types of uses of the firefighting foams. The findings presented here are not a detailed risk assessment and are not presented within any geographical disaggregation based on identified sites in the European Union.
32 Results of the emission modelling for the five ROs are presented in the impact assessment, section E.5.2.

P.O. Box 400, FI-00121 Helsinki, Finland | Tel. +358 9 686180 | echa.europa.eu
256
B.9.3.2. Approach taken for the emissions model and outcome
The emission model is based on the one developed by (Wood et al., 2020) which builds on ECHA guidance documents, the UNECE inventory guidebook33, and OECD Emission scenario document for AFFF34. The basic source-flow model developed by (Wood et al., 2020) used data from the market analysis and substance identification (as a Microsoft Excel workbook) to calculate emissions per environmental compartment. The model was further refined by Ramboll & Vito (Ramboll and Vito, 2021) to calculate the evolution of the emissions over time under the five ROs assessed. Compared to (Wood et al., 2020) some input parameters were also updated based on stakeholder information (such as annual usage rates of foams) or by using different assumptions. Some default input parameters from the REACH Guidance R.16 were also used, and, if no other data were available, were based on expert judgement.
The assessment presented below focuses on the PFAS foams, However, some high-level information from (Wood et al., 2020) is also presented for non-fluorinated alternatives.
Based on the outputs of the market research (Annex A) and stakeholder engagement, the two substances with the highest reported tonnage were selected to calculate an average partition co-efficient35 (water/sludge) for use in the source-flow model, simulating the fate of a typical PFAS substance across its life cycle (Table B.39).
Table B.39. PFAS-based substances for selection, based on (Wood et al., 2020) Substance CAS number Tonnes per
year[1] Partition co-efficient
(water/sludge) Kd (l/kg)
1-Propanaminium,N-(carboxymethyl)-N,N-dimethyl-3-
[[(3,3,4,4,5,5,6,6,7,7,8,8,8-tridecafluorooctyl)sulfonyl]amino]-
,inner salt
34455-29-3 21.1 1.5
1-Propanaminium, 3-amino-N-(carboxymethyl)-N,N-dimethyl-N-
[[(gamma-omega-perfluoro-C6-C16-alkyl)thio]acetyl] derives., inner salts
80475-32-7 17.2 3.84
[1] Tonnage of fluorosurfactants purchased for the production of firefighting foams by manufacturers participating in the 2018 Eurofeu survey. This does not represent the total tonnage at EU level since not all EU foam manufacturers/importers participated in the survey.
The input values used for the emission model and their justification is summarised in the table in section 3 “Assumptions, uncertainties and sensitivities” of the Annex XV report. A more detailed description of calculations used is available in Appendix 8.
The source-flow model considered the key life-cycle stages and the types of emissions which may occur at each.
Four basic life-cycle stages where it was possible for emissions to occur, or material to flow through into the next life cycle stage were identified:
Formulation of the firefighting foam concentrate. This includes consideration of
33 https://www.eea.europa.eu/themes/air/emep-eea-air-pollutant-emission-inventory-guidebook/emep
34 https://www.oecd.org/env/ehs/risk-assessment/emissionscenariodocuments.htm
35 From the two PFASs known to be used in firefighting foams, an average Kod value of 2.67 was calculated and used in the emission modelling to simulate the fate of a typical PFAS substance throughout its life cycle ((1.5+3.84)/2).

P.O. Box 400, FI-00121 Helsinki, Finland | Tel. +358 9 686180 | echa.europa.eu
257
the PFASs used as surfactants within the foam concentrate. Note, that it was assumed that the life-cycle begins at this stage rather than the manufacture of the surfactants themselves. This distinction is made on the basis that the manufactured surfactants may have multiple applications, not limited to only firefighting foams.
Storage. Storage is considered a key life cycle stage with quantities of foam concentrate possibly reaching expiry before active use36. During storage of foam concentrate it may be possible for leaks or spillages to occur, which directly contribute to environmental emissions. However, for usage sites (airports, refineries, terminals, industrial sites and defence sites), appropriate risk management systems will generally be in place meaning that such leaks/spillages can be contained from direct release and will more likely act as an input to the waste/wastewater system (e.g. sewers). Efficacy and management of materials put to sewer are further managed under waste.
In-use. Active use of firefighting foams is likely the most important life-cycle stage. The model developed defines two types of use. First, ‘training’ exercises and testing, which are assumed to happen within contained conditions (i.e. bunding / capture systems are in place to capture and retain runoff)37; and second, ‘live’ incidents which assumes different levels of containment depending on the sector of use. When the model is used to assess emissions under different ROs, the model takes into account the transitional periods (i.e. the duration of the use) per sector or type of use and the effect of any additional risk management measures proposed.
Waste. The waste cycle includes two key pathways. First, incineration38 of any expired stocks of foam concentrate and, for certain ROs, incineration of remaining foam concentrate stocks at the end of the transitional period (‘early disposal’) and incineration of collected firewater run-off. Second, under the baseline scenario, wastewater treatment works processing of materials from leaks/spillage during storage, plus runoff from training exercises and the collected fraction of runoff during use for fire incidents.
The model calculates annual emissions, cumulative emissions and calculates total avoided emissions figures over the assessment period (30 years) compared to the baseline. It allows the modification of several input parameters including:
annual sales (= tonnes of foam used per year inclusive stock losses);
concentration of PFAS surfactants in foam;
average life span foam, annual usage rate for incidents (compared to stock);
annual usage rate for training and testing (compared to stock);
leakage during storage;
emission factor from formulation to WWTP;
emission factor from formulation to air;
36 BiPRO, 2011, Study on waste related issues of newly listed POPs and candidate POPs – comments that the average lifespan of firefighting foams is 15 years.
37 It is recognised based on the stakeholder engagement that the standard of containment for training run-off has in the past not been optimal. However, because of the concerns raised around substances such as PFOS, it can be expected that the standards in use currently are a significant improvement upon standards from the early 2000s.
38 For the emission modelling, the safe disposal of PFAS foam concentrates and runoff waters has been considered to be implemented by incineration.

P.O. Box 400, FI-00121 Helsinki, Finland | Tel. +358 9 686180 | echa.europa.eu
258
emission factor from formulation to soil;
emission factor from incineration to air;
partitioning coefficient;
effectiveness of WWTP for PFASs;
length of the transitional period per type of use;
share of the market by sector;
percentage of release to surface water, soil and sea during live incidents;
efficacy of bunding / control measures for training and for incidents.
Some of these input parameters have been varied for performing a sensitivity analysis and generate “low” and “high” scenarios. In this section the focus is on the emissions calculated for the baseline. The emissions calculations under the five ROs are described in section E.5.2. However, the model works in the same way and the same input parameters listed in section 3 “Assumptions, uncertainties and sensitivities” of the Annex XV report for the best scenario have been applied, with the exception of the “Effectiveness of additional RMMs imposed by the ROs” parameter which is not relevant under the baseline.
Formulation of the firefighting concentrate
Only quantities manufactured within the European Union are assumed to lead to emissions and exposure from the formulation stage.
It is assumed that imports of firefighting foam concentrate equal the exports and represent 25 % of the total volume of foams formulated (see section E.5.2 and Appendix 8 regarding RO3 for more details on how formulation for export has been taken into account in the emissions calculations).
The PFOA Annex XV restriction dossier assumed default worst case emission rates of 2.5 % w/w to air, 2 % w/w to water (assumed to be wastewater system rather than direct release) and 0.2 % to soil as a direct release from spillages / deposition during formulation. These values have been taken forward in the best estimate emission scenario.
For the simulation of PFAS emissions, it is assumed that the sales and the amount of PFAS foam in the formulation are identical. The data on quantities of PFAS foams sold annually, broken down by sector of use as provided by Eurofeu (Wood et al., 2020) were taken as a basis for the emissions assessment. These values are considered by the Dossier Submitter as more reliable than the estimated volumes of foam concentrates held in stock at EEA level for which no reliable data is available39. The foam stock has been calculated from the sales figures of PFAS foam concentrates, the average annual usage rates indicated by industry stakeholders (see further below) and the storage leakages (see Appendix 8 for details on the calculation used).
During the formulation, direct emissions of PFASs occur to the environmental compartments soil and air, and an indirect emission occurs via WWTP (Figure B.51).
39 Wood et al. 2020 estimated a stock between 210 000 and 435 000 tonnes. The Dossier Submitter of the PFHxA restriction proposal assumed a figure of 62 500 tonnes, which was considered more realistic by industry (e.g. (FFFC, 2020)). However, there does not seem to be accurate data on foam concentrates stocks at EEA level since these are not systematically reported and compiled.

P.O. Box 400, FI-00121 Helsinki, Finland | Tel. +358 9 686180 | echa.europa.eu
259
Formulation
Stock
Waste water treatment
Emission to air
Emission to soil
Figure B.51. Material flow diagram for the formulation phase Storage
Following manufacture and sale, the firefighting foam concentrates will pass into the storage phase of the life cycle. A proportion of the annual sales will also go directly into use (see in-use phase), with the remainder held in store, sometimes for several years. Data on leakage rates / spillages was not identified during the study, and therefore a value based on expert judgement of 1 % of total stocks has been applied.
Figure B.52 shows the material flow diagram for the life cycle stage stock: after formulation, PFAS firefighting foams are collected in the stock; the quantity in stock serves as a supply for the use of PFAS firefighting foams during incidents and training. Emissions occur through incineration of expired PFAS firefighting foams on the one hand (when applicable), and through leakage from the stock to wastewater treatment (WWT) on the other.

P.O. Box 400, FI-00121 Helsinki, Finland | Tel. +358 9 686180 | echa.europa.eu
260
Formulation
Stock
Training
Live incidents
Waste incineration
Waste water treatment
Figure B.52. Material flow diagram for the ‘stock’ life cycle stage In-use phase
Part of the PFAS foam in stock is used during incidents and training activities. Under the baseline scenario, emissions from incidents enter the environment directly via surface water, soil and sea. Emissions from training and testing enter the environment via surface water, sea and indirectly via WWT (Figure B.53).

P.O. Box 400, FI-00121 Helsinki, Finland | Tel. +358 9 686180 | echa.europa.eu
261
Stock
Training
Live incidents
Waste water treatment
Emission to water
Emission to soil
Emission to sea
Figure B.53. Material flow diagram for the training and incidents life cycle stages under the baseline scenario. The “in-use” phase of the model was refined to incorporate different types of use and how these may affect the type of emission and usage rate (i.e. use at airports vs municipal fire brigades) and risk management measures. This included data from Eurofeu (see Annex A) on industry sector splits, and usage information from several stakeholders40.
Eurofeu indicated (Eurofeu, 2021b) that in 2004 no restriction on the use of AFFF were in place and fire trainings were not as restricted as today, hence they were very common and broadly done by all fire brigades. According to Eurofeu, since the first restriction of PFOS the situation changed, foam is only used if ultimately necessary, municipal brigades mostly dealing with a fire incident first with water and only lately with foam, if needed. Trainings on live fires are extremely rare, very expensive and only possible in specific places, most of which in the meantime do not allow using fluorine containing foams. So-called “cold” foam trainings (no fires, foam application training only) are done in the vast majority of cases using “training foams” which are fluorine-free.
Eurofeu reported that users from the petrochemical industry indicate that less than 10% of the foam they have on stock is being used in incidents (fires, precautionary foam application and unintended releases from malfunctions) (Eurofeu, 2021b).
40 (Wood et al., 2020) used annual usage rate data from (Brooke et al., 2004) which highlighted that most of the firefighting foam in the private sector is used for training (93% w/w) and assumed that, for public fire brigades, use will predominantly be focused on live incidents with a smaller quantity used for training, assumed to be 93% on live incidents and 7% on training. (Wood et al., 2020) used for annual foam use rate (compared to annual sales) data from (Bipro, 2011) and (buser et al, 2009) which quote usage rates of between 15% and 20% annually. However, several industry stakeholders provided comments on the PFHxA restriction proposal and during the preparation of the present restriction proposal on firefighting foams that these figures referred to by (Brooke et al., 2004) and (Bipro, 2011) are outdated, especially regarding the fact that the use in training and testing has since then been largely been substituted with fluorine-free alternatives. New estimates based on stakeholders’ feedback have been used in this assessment (see core text of section B.9.3 for more details).
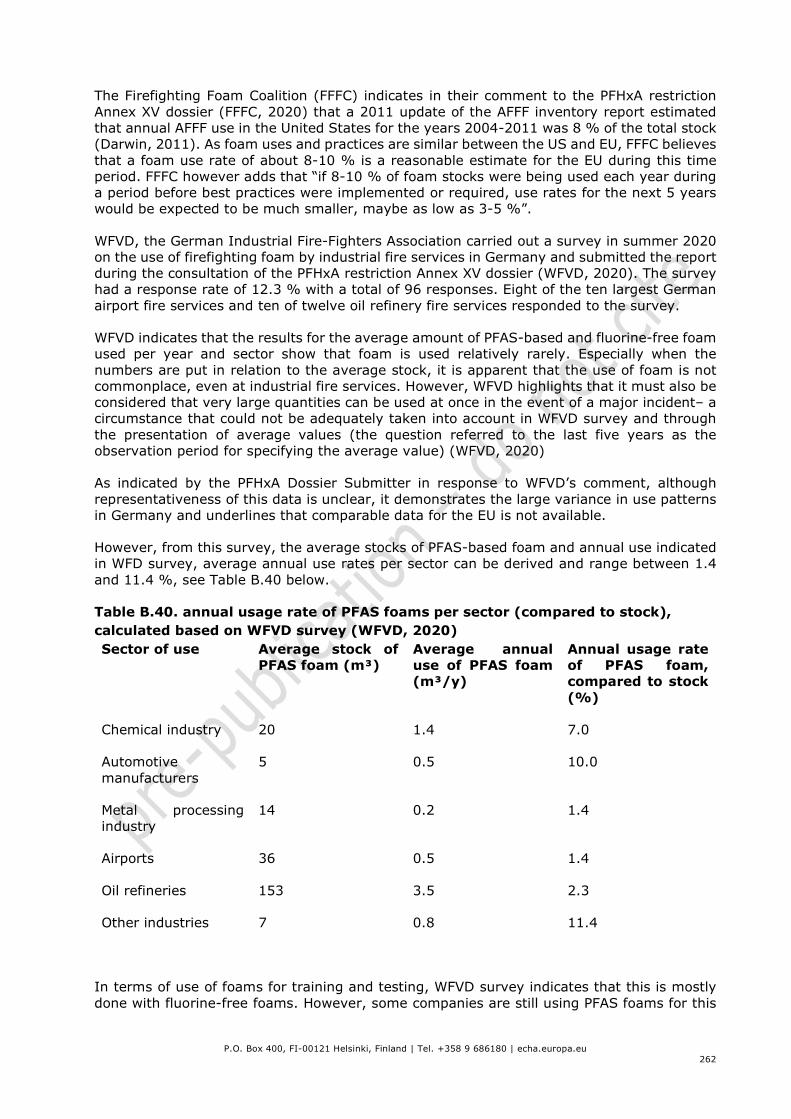
P.O. Box 400, FI-00121 Helsinki, Finland | Tel. +358 9 686180 | echa.europa.eu
262
The Firefighting Foam Coalition (FFFC) indicates in their comment to the PFHxA restriction Annex XV dossier (FFFC, 2020) that a 2011 update of the AFFF inventory report estimated that annual AFFF use in the United States for the years 2004-2011 was 8 % of the total stock (Darwin, 2011). As foam uses and practices are similar between the US and EU, FFFC believes that a foam use rate of about 8-10 % is a reasonable estimate for the EU during this time period. FFFC however adds that “if 8-10 % of foam stocks were being used each year during a period before best practices were implemented or required, use rates for the next 5 years would be expected to be much smaller, maybe as low as 3-5 %”.
WFVD, the German Industrial Fire-Fighters Association carried out a survey in summer 2020 on the use of firefighting foam by industrial fire services in Germany and submitted the report during the consultation of the PFHxA restriction Annex XV dossier (WFVD, 2020). The survey had a response rate of 12.3 % with a total of 96 responses. Eight of the ten largest German airport fire services and ten of twelve oil refinery fire services responded to the survey.
WFVD indicates that the results for the average amount of PFAS-based and fluorine-free foam used per year and sector show that foam is used relatively rarely. Especially when the numbers are put in relation to the average stock, it is apparent that the use of foam is not commonplace, even at industrial fire services. However, WFVD highlights that it must also be considered that very large quantities can be used at once in the event of a major incident– a circumstance that could not be adequately taken into account in WFVD survey and through the presentation of average values (the question referred to the last five years as the observation period for specifying the average value) (WFVD, 2020)
As indicated by the PFHxA Dossier Submitter in response to WFVD’s comment, although representativeness of this data is unclear, it demonstrates the large variance in use patterns in Germany and underlines that comparable data for the EU is not available.
However, from this survey, the average stocks of PFAS-based foam and annual use indicated in WFD survey, average annual use rates per sector can be derived and range between 1.4 and 11.4 %, see Table B.40 below.
Table B.40. annual usage rate of PFAS foams per sector (compared to stock), calculated based on WFVD survey (WFVD, 2020) Sector of use Average stock of
PFAS foam (m³) Average annual use of PFAS foam (m³/y)
Annual usage rate of PFAS foam, compared to stock (%)
Chemical industry 20 1.4 7.0
Automotive manufacturers
5 0.5 10.0
Metal processing industry
14 0.2 1.4
Airports 36 0.5 1.4
Oil refineries 153 3.5 2.3
Other industries 7 0.8 11.4
In terms of use of foams for training and testing, WFVD survey indicates that this is mostly done with fluorine-free foams. However, some companies are still using PFAS foams for this
P.O. Box 400, FI-00121 Helsinki, Finland | Tel. +358 9 686180 | echa.europa.eu
263
purpose (5 over 96 respondents indicated PFAS foams being used for training and 8 over 96 for testing).
Overall, after further consultations of Eurofeu, WFVD and several other foam users across sector, the Dossier Submitter selected for the best estimate emission scenario the following average values of annual usage rates over the assessment period (30 years) for PFAS foams, compared to the PFAS foam concentrate stock41:
10 % for incidents management42, and
2 % for training and testing
Since no reliable information is available regarding the stock of PFAS-containing foam at EU level, it has been calculated as a function of the annual sales and the annual usage rates. Under the best estimate scenario, the value of 148 500 tonnes has been calculated (see Appendix 8 for details on the formula used).
Collection and handling of firewater
In terms of risk management measures already in place to collect firewater run-off, the Dossier Submitter’s stakeholder consultation conduced in spring 2021 showed that several respondents have systems in place to collect the run-off water (essentially in the oil/petrochemical sector). However, only a few respondents provided additional information on how collected firewater is further treated. A number of them indicated that such water is handled as hazardous waste. However, several others send them to on-site or external wastewater treatment plants (municipal or industrial), sometimes with prior treatment such as activated carbon or a hydrocarbon separator. In absence of more specific and representative data, the Dossier Submitter therefore assumes for a conservative assessment that the typical treatment method of collected firewaters containing PFASs is via wastewater treatment plant (see details on the waste phase in the corresponding section below and in Appendix 3). Disposal of PFAS-contaminated fire run off and equipment cleaning water/Background/Fate of fire-run off water).
In the emission model, for training exercises, a factor has been added for the efficacy of bunding / control measures designed to manage run-off of firefighting waters during the training exercise. Extremely limited data was available on these aspects and therefore best estimates have been made based on expert judgement. Efficacy of the bunding for terrestrial applications was estimated to be 97 % (assuming that under the baseline scenario captured waters are passed to sewer / on site wastewater treatment), while for marine applications it is assumed all run-off is permitted to be released directly to sea with no capture and control. For live incidents, under the baseline scenario, the values quoted in the REACH Annex XV dossier for PFOA have been used, which assume a 100 % release (which should be considered a worst-case scenario), split evenly between surface waters and soil43.
41 It should be noted that the annual usage rates for training/testing and incident management for fluorine-free foams is likely to be different from the one of PFAS foams since training and testing activities are increasingly using fluorine-free foams across sectors and PFAS foams reserved for incident control in more critical situations.
42 Including small and rarer large incidents
43 It should be noted that in the present assessment, under the baseline scenario, since it is considered that all collected firewaters are sent to WWTP which are considered under the best estimate scenario to have 0 % effectiveness regarding the full mineralisation of PFAS (see “waste phase” below), even if some firewaters from live incidents are collected and sent to WWTP, the resulting total emissions in the

P.O. Box 400, FI-00121 Helsinki, Finland | Tel. +358 9 686180 | echa.europa.eu
264
Waste phase
All material not lost directly to the environment during use will enter the waste phase through a variety of pathways (i.e. capture of run-off; spillages/leaks during storage entering on-site drains; incineration of unused foam concentrate which has expired or required to be disposed of at the end of the transitional period – assumed here to be incinerated), highlighting this phase’s importance in the overall control and release to environment.
Under the baseline, the supply of PFAS-containing foams to WWTP occurs via formulation, leakage from stock and training and testing activities. Subsequently, the PFASs end up in sludge (soil) and effluent (surface water). Expired PFAS-containing firefighting foams are considered to be incinerated, which leads to PFASs being emitted into the air (see Figure B.54).
Formulation
Stock
Training
Waste incineration
Waste water treatment
Emission to air
Emission to water
Emission to soil
Figure B.54. Material flow diagram for the waste treatment phase. The amount of PFAS-containing firefighting foam in the wastewater treatment is the sum of foam captured during training and testing, leaks and spills from the stock and losses during the formulation phase.
The waste phase of the model aggregates the quantities coming from different pathways to calculate the total quantity within the overall waste phase. This is then assumed to be managed either by incineration (for end-of-life unused stocks and disposal) or wastewater treatment works for retained runoff, losses to sewer from spillage/leakage during storage44. The model then applies two factors, firstly a distribution factor (as the average of the Koc
environment would be the same as if these firewaters would not be collected, i.e. a 100 % release (however, the repartition between the environmental compartments would change).
44 It is assumed that the sites in question will store these materials in secure areas with either bunding or on-site drainage. If there is a spillage/leak it is assumed that it will be contained and enter the waste systems.

P.O. Box 400, FI-00121 Helsinki, Finland | Tel. +358 9 686180 | echa.europa.eu
265
values45 of the two main PFAS substances identified in the market research) taken from
REACH registration dossiers to estimate how the PFASs partition between liquid and sludge phases of the wastewater process. Secondly, an effectiveness factor of the wastewater treatment plant to completely mineralise the PFASs46. For the PFAS-based surfactants used in firefighting foam concentrates the effectiveness of wastewater treatment process is expected to be very low. Under the best estimate scenario, the model assumes an efficacy of zero, with all PFAS substances passing to the environment (an alternative figure has been assumed for sensitivity analysis under the low estimate scenario – see section 3 “Assumptions, uncertainties and sensitivities” of the Annex XV report).
The model assumes all waste sludges are then applied to farmland as a release to soil. Note, that while we recognise that this is a common waste management practice for sewage sludge, this is not the case across the EU (for example the application of sewage sludge to land in Denmark is banned). The model acts as a high-level assessment of which compartments are the most important for emissions and key variables affecting emissions. No geopolitical splits are applied to the data for importance of environmental compartments in different Member States.
Under the baseline scenario, in terms of the proportion of material sent to wastewater treatment works and proportion sent for incineration, only limited information was available. It has been assumed that all retained run-off water, and losses from spillage/leakage to drain on controlled sites are sent to either onsite WWTPs or municipal WWTPs dependent on the site47. The use of incineration would be retained for unused expired firefighting foam concentrate, but on this matter, there is conflicting information. A number of references, e.g. (buser et al, 2009), (Bipro, 2011) suggest usage rates of around 15-20 % of existing stocks per annum, with an AFFF shelf-life of up to 15 years, which would suggest all foam concentrate is used before expiration (on average). Discussions held at the 2018 POPs Review Committee (POPRC) meeting on exemptions for PFOA (its salts and related-compounds), included comments from a number of NGOs that significant quantities of expired foam concentrate was destroyed, particularly from private fire brigades, where live use was much less common.
As indicated in section “In-use phase” above, additional stakeholders consultations conducted in 2020 and 2021 led the Dossier Submitter to assume average usage rates of PFAS foams across sectors to be 10 % for incident management and 2 % for training and testing, compared to the stock. An average foam shelf-life of 15 years was also assumed. With these parameters, the emission model assumes that no foam concentrate is sent for incineration due to having reached expiry date.
Appendices 2 and 3 provide further insight to incineration of PFASs. It is noted that, in general, PFAS emissions from incineration are not well studied. However, the chemistry of PFASs makes it resilient to thermal destruction. The (US-EPA, 2020) comments on studies (from 2004 and 2014) that showed for PFOA temperatures of 1 000° Celsius and residence time of 2 seconds were sufficient to destroy the PFOA. (KEMI, 2016) commented that for PFAS compounds temperatures of at least 1 100° Celsius are needed, and that longer-chain PFAS species are more readily destroyed (potentially breaking down to shorter chain PFAS compounds), with the CF4 species the most resilient. For CF4 chemistry temperatures of
45 Koc = Is a normalised partition coefficient used to calculate how much of a given substance will adsorb to organic matter. It is used as a measure for mobility of a given substance (primarily within terrestrial environments) but can be used as a measure of partitioning between liquid phases and organics within a wastewater treatment works.
46 Complete transformation of PFASs in mineralised chemical species (inorganic fluorine, including HF)
47 See also information collected from stakeholders in Appendix 3.1(c.) Disposal of PFAS-contaminated fire run off and equipment cleaning water/Background/Fate of fire-run off water.

P.O. Box 400, FI-00121 Helsinki, Finland | Tel. +358 9 686180 | echa.europa.eu
266
1 400° Celsius are required, with the breakdown products including carbon dioxide and hydrogen fluoride.
As a side note, the Industrial Emissions Directive (2010/75/EU) requires waste incineration plants to operate at temperatures of at least 850° Celsius with residence times of at least two seconds. This would cover standard municipal waste incineration plants. For elevated temperatures >1 000-1 400 Celsius this is likely to require more specialised commercial hazardous waste incineration, noting that a more limited number of specialised high-temperature operators exist across Europe.
Resulting emissions to soil, surface water, air and sea
The emissions to soil, surface water, air and sea are calculated as the sum of the emissions from the life cycle stages formulation, stock, training and testing, incidents and the waste phase.
Emissions model build-up and equations used
The baseline scenario was first calculated, simulating the flows of the PFAS foams over the different life cycle phases: formulation, stock, use, waste treatment and emissions. To keep the model clearly arranged, this baseline scenario represents a steady state without a percentage growth rate per year or further structural changes over the time horizon under consideration. This means constant annual values for all of the stock and flow figures.
It is assumed that the mass balance must be kept in equilibrium, i.e. that the amount of PFASs that enters a node (life cycle phase) must also come out. The baseline scenario was then used to build a model simulating the emissions resulting from the various ROs (see section E.5.2).
The approach for the calculations in general, and for the different ROs, is further explained in Appendix 8.
Emissions calculated under the baseline scenarios
Under the baseline scenario, a business-as-usual situation is assumed. The annual emissions of PFASs in the environment are assumed to remain stable over the assessment period of 30 years. When using the central scenario (best estimates input parameters), a total annual emission of 470.30 tons of PFASs across the environmental compartments is obtained. This represents a total of 14 109 tonnes of cumulative emissions of PFASs over 30 years. The calculations have been performed as well using the “low” and “high” scenarios values for the selected input parameters as described in section 3 “Assumptions, uncertainties and sensitivities” of the Annex XV report.
The relative contribution of each sector/type of use to these emissions can be visualised in Table B.41 below48.
48 The share of foam used for training/testing for each sector of use has been segregated from the use in live fire incidents to allow the calculations of different transitional periods per type/sector of use under the different ROs.

P.O. Box 400, FI-00121 Helsinki, Finland | Tel. +358 9 686180 | echa.europa.eu
267
Table B.41. yearly PFAS total emissions under the baseline scenarios, broken down by sector/type of use. Annual PFAS total
emission – LOW scenario
(tonnes PFASs)
Annual PFAS total emission – BEST
scenario
(tonnes PFASs)
Annual PFAS total emission – HIGH
scenario
(tonnes PFASs)
Oil/(petro)chemical Seveso (minus training and
testing)
119 227 303
Other industries (minus training and testing)
2 5 6
Civil aviation (minus training and testing)
19 35 47
Defence (minus training and testing)
12 24 31
Municipal Fire Services (minus training and
testing)
27 51 68
Ready-to-use applications 3 5 6
Marine applications (minus training and testing)
25 47 63
Training/testing part of the above sectors
75 78 104
Total 283 470 630
Table B.42. Cumulative PFAS emissions over 30 years under the baseline scenarios, broken down by sector/type of use.
Sector/type of use Cumulative emissions - 30y LOW scenario
Cumulative emissions - 30y BEST scenario
Cumulative emissions - 30y HIGH scenario
Oil/(petro)chemical Seveso (minus training and testing)
3580 6798 9101
Other industries (minus training and testing) 73 139 186
Civil aviation (minus training and testing)
557 1058 1417
Defence (minus training and testing)
372 705 944
Municipal Fire Services (minus training and testing)
805 1528 2046
Ready-to-use applications 86 141 189
Marine applications (minus training and testing) 743 1411 1889

P.O. Box 400, FI-00121 Helsinki, Finland | Tel. +358 9 686180 | echa.europa.eu
268
Training/testing part of the above sectors 2262 2328 3116
Total 8478 14109 18888 Note: in this table the results are not rounded. This should not be interpreted as suggesting accuracy in the results.
B.9.3.3. Wastewater treatment works
Management of fire water runoff during training
For large infrastructure installations (e.g. airports, petrochemical facilities, and firefighter training complexes) the site should be engineered to allow for a high level of capture of materials used in the training activity. Furthermore, for live emergencies at such sites where larger volumes may be used and are expected to be handled, capture of firefighting water should be done as soon as practicable and safe. However, for live incidents releases of firefighting foams are situation and site-specific and it may not be possible to retain all runoff from firefighting.
The specific kind of engineered options (hard surfaces, bunded areas, on-site drainage systems, etc.) will vary from site to site and the specific kind of operation being undertaken. As a further example of the practical application of how a given site may be managed, the UNECE good practice guidelines provide some further insight (UNECE, 2019):
“There are several possible types of systems for the retention of contaminated firefighting water. The systems can be installed permanently (i.e. pre-installed water barriers or permanent retention basins, if necessary with pumping installations) or be provided as mobile facilities (i.e. firefighting water barriers, hoods and sealing pads, mobile storage tanks).”
Firewater run-off can then be pumped into tanks and transported e.g. by trucks to treatment facilities. There are several short case studies of fire incidents with a description of retention and disposal of firewater in Annex 1 of the UNECE good practice guidelines.
One further consideration is the management of firefighting foam or firewater runoff at either on-site wastewater treatment works or municipal wastewater treatment plants. Again, this is likely to vary from site to site and is determined in part by the frequency of training and quantities of material that need to be managed. On-site treatment plants would incur a significant cost in the construction and operational phases, as well as requiring a minimum level of throughput to make operations practical. In some cases (e.g. petrochemical works) it is possible that sites already have on-site WWTPs for other purposes and are able to manage firewater runoff as and when needed. In other cases where training is less frequent (e.g. only quarterly / twice a year) use of municipal waste water treatment plants under environmental permitting is more likely.
However, also note that where firewater runoff enters drains and is sent to municipal wastewater treatment plants, the environmental permits may require some pre-treatment steps. For example, these could include the use of sediment traps to remove solids, an oil/water separator and possibly a granular activated carbon filter before discharge.
As a conclusion a distinction needs to be drawn between uses for training purposes and uses for live incidents, noting the potential for greater control over runoff from training compared to live incidents. A review of the evidence suggests that at national level there are regulations in place in several countries over the design and management of firefighting runoff for training, and best practice guidelines for live incidents. However, further data on how comprehensive the coverage of these measures is across the whole EU and their practical implementation has been more difficult to obtain, and based the evidence analysed, it is not possible to conclude that substantial quantities of runoff could not be released to the environment across Europe, particularly from live incidents.

P.O. Box 400, FI-00121 Helsinki, Finland | Tel. +358 9 686180 | echa.europa.eu
269
Processing of substances in wastewater
Once within the wastewater process two key factors determine how the substances identified are managed. Firstly partitioning (as Koc) and secondly the effectiveness of the works to successfully destroy the chemical before release. The Log Koc values have been used a measure to help understand partitioning. In practice, the lower the Koc Value the more ‘water-loving’ the substance, and the less likely it is to partition into the sludge phase. Table B.43 provides log Koc values for a range of substances to provide an indicative guide. Koc values for various PFASs are provided in section B.4.2. In Annex E.2.4 a similar table is provided for information for non-fluorinated alternatives.
Table B.43. log Koc values for a set of solvents, POPs and PFAS based substances as indicative guide to partitioning against Koc values.
Substance Substance type Log Koc (l/kg) Partitioning
Acetone Solvent 0.24 Hydrophilic
Butanol Solvent 0.84 Hydrophilic
Perfluorobutane sulfonic acid (PFBS)
PFAS 1.0 Hydrophilic
Perfluorooctanoic acid (PFOA)
PFAS / POP 1.3 – 2.4 Hydrophilic
Perfluorohexane sulfonic acid (PFHxS)
PFAS / candidate POP 1.8 Hydrophilic
Perfluorooctanesulfonic acid (PFOS)
PFAS/POP 2.5 - 3.1 Mixed
Endosulfan Pesticide / POP 3.3 Mixed
Endrin Pesticide / POP 4.09 Hydrophobic
Methoxychlor Pesticide / Candidate POP
4.9 Hydrophobic
Polychlorinated biphenyls (PCBs)
POP 5.5 Hydrophobic
Poly aromatic Hydrocarbons (PAHs)
POP 6.2 Hydrophobic
The log Koc values for the two PFAS species considered in the emission modelling are 1.5 and 3.8, which means the partitioning is more mixed, with the CAS 34455-29-3 species having much greater solubility and mobility. This places greater onus on the releases from WWTPs, noting that the efficacy of WWTPs for PFAS based substances is expected to be poor (see details in section B.4.5).
The other major factor is the efficacy of the works itself to irreversibly destroy specific substances. Wastewater treatment efficacy against PFAS substances is expected to be poor with close to zero effectiveness. This makes partitioning particularly important for evaluating final emission of PFAS substances.
B.9.3.4. Conclusions from emission modelling
Under the baseline, for the firefighting foams used for training, the assumption applied is that runoff is largely retained and treated within wastewater treatment works. However, WWTPs

P.O. Box 400, FI-00121 Helsinki, Finland | Tel. +358 9 686180 | echa.europa.eu
270
are considered ineffective at treating PFASs, meaning direct release to surface water / soil depending on the partition coefficient. Waste is thus a key life-cycle stage for emissions of PFASs to the environment.
For live incidents, under the baseline scenario, the values quoted in the REACH Annex XV dossier for PFOA have been used, which assume a 100% release (which should be considered a worst-case scenario), split evenly between surface waters and soil.
Additional emissions from the formulation, storage and waste stage have been taken into account.
Based on the assumptions and input parameters detailed in section 3. “Assumptions, uncertainties and sensitivities” of the main report, under the baseline scenario, a total annual emission of around 470 tons of PFASs across environmental compartments would occur. This represents a total of around 14 100 tonnes of cumulative emissions of PFASs over 30 years.
B.9.3.5. Worker exposure
Firefighters can be significantly exposed to PFHxS and other PFASs from firefighting foam via various occupational mechanisms (Rotander et al., 2015b). These include direct exposure during use, exposure from contaminated personal protective equipment (PPE), handling of contaminated equipment, managing PFAS foam wastes, occupation of contaminated fire stations and consumption of contaminated local water and produce. Cross-contamination and legacy PFAS residues from inadequately decontaminated appliances after transitioning to fluorine-free foam can remain a long-term problem.
This means that - in addition to the firefighters who have used PFOS-containing foams at incidents such as fires or training - the younger firefighters who have never used PFOS-containing foams also can be indirectly exposed to them (Bluteau, 2019). The exposure might have occurred via inhalation, ingestion, or dermal exposure while performing routine equipment maintenance, cleaning out decontamination on-site or at the station and transferring foam concentrate from bulk containers to appliances.
Measured levels of PFASs in firefighters
Reliable information on measured concentration levels of PFASs in European firefighters is not available. One study concerning PFAS exposure of firefighters in Europe has been found (Laitinen et al., 2014) but the results are considered unreliable (actual baseline concentrations are not reported, short follow up, small sample size).
Studies (see details in Table B.44) for American and Australian firefighters indicate that both short-chain and long-chain PFASs have been found in the blood serum of firefighters, as summarised below. However, whether their detection in blood serum is specifically due to exposure to PFAS-containing foams, and no other sources of PFAS exposure, is sometimes unclear.
Levels of short-chain PFASs (PFBS, PFBA, PFPeA, PFHxA) were found mostly to be close to detection limits and comparable to general population in Australian and American firefighters (Rotander et al., 2015b), (Jin et al., 2011), (Barton et al., 2020), (Clarity et al., 2021), (Trowbridge et al., 2020). One study reported that the relative abundance of PFPeS to PFOS was higher in firefighters than in controls (Rotander et al., 2015a); however, no concentration values were reported.

P.O. Box 400, FI-00121 Helsinki, Finland | Tel. +358 9 686180 | echa.europa.eu
271
In contrast, levels of long-chain PFASs have been found mostly elevated in firefighters compared to average concentrations in the general population or a comparison group of non-firefighters (Jin et al., 2011), (Rotander et al., 2015a), (Rotander et al., 2015b), (Khalil et al., 2020), (Leary et al., 2020), (Trowbridge et al., 2020), (Barton et al., 2020), (Shaw et al., 2013), (Dobraca et al., 2015), (Barton et al., 2020), (Graber et al., 2021). The majority of studies show higher mean concentrations for PFHxS, PFOS, PFOA, PDFA and PFNA in the serum of firefighters. As an example, serum levels of PFHxS were in the range of 49–326 ng/mL serum in firefighters, whereas the control group ranged from 0.2–22 ng/mL serum (Rotander et al., 2015a). However, also similar or lower concentrations to a comparison group have been also reported for PFHxS, PFOS, PFDA and PFNA.
Biomarkers of effect and risk of diseases in firefighters related to occupational PFAS exposure
The available epidemiological studies (see details in Table B.44) on PFAS exposure in firefighters indicate varying (lack of) associations between PFAS concentrations and biomarkers of effect. One study found no association of long-chain PFASs (PFOA, PFOS, or PFHxS) to uric acid, cholesterol, high-density lipoprotein (HDL), and low-density lipoprotein (LDL). Another reliable study found significant negative associations (lower values) among firefighters between PFDA and total cholesterol and PFUnDA and interleukin-6. However, the same study found no associations between PFAS exposure and increased cardiometabolic risk as measured by fasting insulin (FI), fasting blood glucose (FBG), low-density lipoprotein cholesterol (LDL-C), high-density lipoprotein cholesterol (HDL-C), total cholesterol (TC), and triglycerides (TG). A third study found no significant association between PFAS exposure and metabolic syndrome (MetS) for PFOA, PFOS, PFNA, and PFHxS, but a significant association of PFOS with DBP may impact the future risk of developing MetS.
The last study observed an association between environmental chemicals and endogenous molecules using Gaussian graphical models (GGMs) it showed that exposures to PFOS and PFHxS, were correlated with certain molecule markers of metabolism (a bile acid, and an inflammatory signaling molecule). This study was a hypothesis generating study and did not report on biomarkers of effect such as lipids or glucose or clinical measures such as blood pressure.
Overall, the available epidemiological studies on PFAS exposure in firefighters does not show statistically significant associations between PFAS concentrations and biomarkers of effect or increased risks of disease. However, the studies have some significant limitations and the number of studies is too few to draw conclusions that there is an absence of an association between PFAS concentrations and biomarkers of effect. Table B.44 below summarises the conditions of the studies and their reliability.

P.O. Box 400, FI-00121 Helsinki, Finland | Tel. +358 9 686180 | echa.europa.eu
272
Table B.44. Information on study population, comparison group, geographic location, kind of study and comments on reliability extracted from the relevant references. NHANES = National Health and Nutrition Examination Survey, WFBC = Woman Firefighting Biomonitoring Collaborative.
# Reference Study
Population1
Comparison
Group
Geographic
Location Monitored PFASs
Time of Sampling
Exposure only (EO) / EPI
Limitation
(as stated by the
author)
Reliability / Plausibility (EPI only)
1 Jin et al. 2021 N = 36, M, Age (mean) = 43.2
Other jobs (N = 5373, M), job not reported (N = 2563, M)
US (Ohio, West Virginia)
PFHxS, PFOA, PFOS, PFNA, PFPeA, PFHxA, PFHpA, PFDA, PFUnA, PFDoA
2005-2006 EO
Small sample size. Rural geographic area (mid-Ohio valley) served primarily by volunteer FF
Reliable
Analytical data are reliable, statistical analysis appropriate and adjusted for age, water district, average household income, and smoking status. Cross-sectional analysis. Firefighters (paid) were part of C8 Health Cohort and may have had PFAS exposure from drinking contaminated water. Results may not be generalizable to volunteer FF. PFOA exposures were significantly decreased in FF when compared to workers in other jobs or job not reported. Use of PPE not reported. Duration of FF not reported.
2 Shaw et al. 2013 N = 12, M/F, Age 32-59
NHANES 2003-2004, M, Age 12+
(Table SI-8)
US (California)
PFBS, PFOS, PFOA, PFNA, PFHxS, PFDA, PFOSA, PFDoDA
2009 EO
Small sample size and
inability to adjust for
confounding factors (age, gender, FF role, use of
PPE)
Reliable with limitations.
Analytical data are reliable. Statistical analysis did not adjust for potential confounders. Cross-sectional analysis. Qualitative comparison to NHANES data from 2003. These data not representative for year of sample collection (2009); however, NHANES concentrations have declined over time and may have been lower in 2009. Duration of FF employment not reported. Use of PPE not reported.
3 Laitinen et al. 2014
N = 8, M, Age (mean) = 44.4
Individual baseline (two weeks before exposure)
EU (Finland)
PFHxS, PFNA, PFOS, PFOA, PFDA, PFHxA, PFHpA, PFUnA, PFDoA, PFTrA, PFTeA, PFHpS, PFDS
2010
EO
Small sample size
Not reliable
PFAS analytical data reliable. Longitudinal analysis. No statistical analysis of PFASs to test accumulation of PFASs. Qualitative (descriptive) analysis only. “Relative increases” in relation to the baseline values

P.O. Box 400, FI-00121 Helsinki, Finland | Tel. +358 9 686180 | echa.europa.eu
273
# Reference Study
Population1
Comparison
Group
Geographic
Location Monitored PFASs
Time of Sampling
Exposure only (EO) / EPI
Limitation
(as stated by the
author)
Reliability / Plausibility (EPI only)
before training are reported. Actual baseline concentrations are not reported. Data indicates, low exposures to begin with, little variability in exposure. Short follow up (3 months) may not be adequate to detect changes in PFAS concentrations above baseline. Variability in relative changes over follow up. Difficult to attribute such small absolute changes to use of AFFF in training.
4 Rotander et al. 2015a N = 20
University students and office workers (N = 19)
Australia
PFPeS, PFOS, PFHxS, PFHpS, PFNS, Cl-PFOS, ketone-PFOS, ether-PFHxS, Cl-PFHxS
2013 (for firefighter)
2011/12 for students and office workers
EO Small sample
size
Not reliable
Targeted PFAS analytical data are reliable. Only ranges (no measure of central tendency) reported for PFOS and PFHxS. Relative abundance of non-targeted PFASs reported in relation to PFOS in FF and comparison group. Novel method to potentially identify known and unknown PFASs in serum needs to be validated. No information on potential confounders.
5 Rotander et al. 2015b
N = 149, M/F
Australian, Canadian population
(also 263 workers at the 3M plant in the US)
Australia
PFBA, PFPeA, PFHxA, 6:2 FTSA, PFBS, PFHxS, PFOS, PFDS, PFHpA, PFOA, PFNA, PFDA,PFUnDA, PFDoDA, PFTrDA
2013 EPI
Unmeasured factors in population may have
associations difficult to
detect
Reliable
PFAS analytical data are reliable. Statistical analysis methods appropriate for aims of study and adjusted for sex, years of foam exposure, age, blood donor. Use of PPE not reported. Cross-sectional analysis.
Epidemiological results are plausible.
6 Dobraca et al. 2015
N = 101, M/F (98% of participants were male), Age (mean) = 42.8
NHANES 2009-2010, M, Age 20+
US (California)
PFBS, PFOS, PFOA, PFHxS, PFNA, PFDA, PFHpA, PFOSA, PFUnDA, PFDoA, Et-PFOSA-AcOH, MeFOSAA
2010 - 2011 EO
Small sample size
Reliable
PFAS analytical data are reliable. Statistical analysis methods appropriate for aims of study and adjusted for age and race. Some PFAS analyses were also adjusted for: use of self-containing breathing apparatus (SCBA)

P.O. Box 400, FI-00121 Helsinki, Finland | Tel. +358 9 686180 | echa.europa.eu
274
# Reference Study
Population1
Comparison
Group
Geographic
Location Monitored PFASs
Time of Sampling
Exposure only (EO) / EPI
Limitation
(as stated by the
author)
Reliability / Plausibility (EPI only)
and/or early removal of SCBA, decontamination of turnout gear, frequency of response to brush fire, hazardous materials, house fires, commercial fires, type of firefighting foam use (all in previous year). Cross-sectional analysis.
7 Barton et al. 2020
N = 17
Population of PFAS-contaminated water district (excluding firefighters, N = 196, M/F)
US (Colorado)
PFHxS, PFOS, PFOA, PFNA, PFHpS, PFDA, Me-FOSAA, PFHxA, PFUndA, PFHpA, PFDoDA, Et-FOSAA, PFBS, HFPO-DA, NADONA, 9CL-PF, PFBA, PFPeA
2018 EO
Duration of exposure is
not considered. Must have
lived in one of the affected communities for at least 2 years during
time of known contamination
Reliable with limitations.
Categorical analysis of ever employed as a firefighter only. No adjustments for potential confounders. Cross-sectional analysis. Duration of FF employment not reported. No socio-economic data. 17 firefighters identified as “ever worked as firefighter” are part the study population exposed to contaminated drinking water in 3 water districts; cannot separate whether firefighters were exposed because of firefighting exposure or from drinking PFAS-contaminated water.
8 Leary et al. 2020
N = 47, M, > 18 -62 y/o, Age (mean) = 41
NHANES 2015-2016
US (Ohio)
21 PFASs, including PFOS, PFOA, PFHxS, PFNA (other PFASs not identified)
Not reported
EPI Limited due to small sample population
Reliable with limitations
Targeted PFAS analytical data are reliable. Appropriate statistical analysis; however, study did not report which variables were adjusted in multivariate analysis of PFASs and risk of MetS. Cross-sectional analysis.
Epidemiological results are plausible.
9 Khalil et al. 2020 N = 38, M, Age 49-54
NHANES 2009-2010, M, Age 49-54 (N = 49)
US (Arizona)
PFBS, PFDA, PFDoA, PFHpA, PFHxS, PFNA, PFOA, PFOS, PFOSA, PFUnDA, Et-PFOSA-AcOH, MeFOSAA
2009 EPI No limitations highlighted
Reliable with limitations.
Targeted PFASs and analytical data are reliable, Appropriate statistical analysis. Carotid intima-medial thickness (CIMT) and PFAS result adjusted for age and cardiometabolic risk factors. Cross-sectional analysis.

P.O. Box 400, FI-00121 Helsinki, Finland | Tel. +358 9 686180 | echa.europa.eu
275
# Reference Study
Population1
Comparison
Group
Geographic
Location Monitored PFASs
Time of Sampling
Exposure only (EO) / EPI
Limitation
(as stated by the
author)
Reliability / Plausibility (EPI only)
Epidemiological results are plausible.
10 Trowbridge et al. 2020
WFBC study, N = 86, F, Age (mean) = 47.5
WFBC, Office worker (N = 84, F, Age (mean) = 48.3)
US (California)
PFBA, PFBS, PFHxS, PFOA, PFOS, PFNA, PFDA, PFUnDA, PFHxA, PFHpA, PFOSA, PFDoA
2014 - 2015 EO
Limited to female
participants49 & small sample
population
Reliable with limitations
Targeted PFAS and analytical data are reliable, statistical analysis adjusted for age, race, education, and dietary factors. Analysis limited to FF evaluated PFAS concentrations in relation to occupational characteristics. Cross-sectional analysis.
Study population is restricted to women and does not represent all FF (only 4% of professional FF are female). Results are not generalizable to male firefighters
11 Grashow et al. 2020
WFBC study (same as in Trowbridge et al. 2020)
WFBC (see Trowbridge et al. 2020)
US (California)
PFOS, PFOSAA, PFOA, 10:2 FTCA, 8:2 FTCA, PFNA, PFHpS-K
2014 - 2015 EO
Limited to all female
participants & small sample
size
Reliable with limitations
Aim of study was to identify novel and non-targeted chemicals in biomonitoring samples. Same population as Trowbridge et al. 2020. Cross-sectional analysis.
12 Clarity et al. 2020
WFBC study (same as in Trowbridge et al. 2020)
WFBC (see Trowbridge et al. 2020)
US (California)
PFBA, PFBS, PFHxS, PFOA, PFOS, PFNA, PFDA, PFUnDA, PFDoA, PFHxA, PFHpA, PFOSA
2014 - 2015 EPI
Limited to all female
participants & small sample
size
Not reliable
Publication has not been peer-reviewed.
13 Graber et al. 2021
N = 135, M/F (92 % male). Age (mean) = 46.6
NHANES 2015-2016/ 2017-2018, M, Age 18-79
US
PFDoA, PFNA, PFDA, PFOS, MeFOSAA, PFHxS, PFOA, PFUnDA
2019 EO
Volunteer firefighters only, may
have higher exposures to PFASs (if PPE not used) or
different exposure
Reliable
Targeted PFAS and analytical data are reliable, statistical analysis adjusted for years of FF, firefighting calls per year, age, sex, race/ethnicity, education. Reporting is appropriate. Strength of study is evaluation of PFASs with years of FF. Cross-sectional
49 According to Graber et al: Significantly more US volunteer firefighters are females: 4% vs. 11%

P.O. Box 400, FI-00121 Helsinki, Finland | Tel. +358 9 686180 | echa.europa.eu
276
# Reference Study
Population1
Comparison
Group
Geographic
Location Monitored PFASs
Time of Sampling
Exposure only (EO) / EPI
Limitation
(as stated by the
author)
Reliability / Plausibility (EPI only)
profile analysis. Use of PPE not reported. Assumes volunteer FF are exposed similarly to PFAS-containing firefighting foams as professional (paid) FF.
14 Bessonneau et al. 2021
WFBC (same as in Trowbridge et al. 2020)
NHANES 2003-2010
US
PFDoA, PFNA, PFDA, PFOS, MeFOSAA
2014 - 2015
EPI
Small sample size. Results for FF limited to correlations between PFASs
and metabolites.
Cross-sectional design. No
health outcomes
measured in FF.
Reliable with limitations
Non-targeted PFASs, analysis of the data (adjustments, statistical, analytical) and reporting. Sample population (all female) does not represent firefighters as only 4% are female in professional FF.
Epidemiological results are plausible, and were used for generating hypotheses. The investigators did not study biomarkers of effect (lipids, glucose) or other clinical parameters in FF in relation to PFAS exposure.
1M = male, F = female

P.O. Box 400, FI-00121 Helsinki, Finland | Tel. +358 9 686180 | echa.europa.eu
277
B.9.4. Other sources (for example natural sources, unintentional releases)
See section B.1.4. for naturally occurring substances.
B.9.5. Overall environmental exposure assessment
As Section B.9.3.
B.9.6. Combined human exposure assessment
B.9.6.1. Further considerations for exposure via uptake from food and drinking water
This sub-section considers the outputs of the emission model (See section B.9.3) to identify the potential human exposure via uptake from food. This section is intended to provide a high-level review. Further work would be needed to assess the risks associated with specific sites or food production pathways, this has not been undertaken here.
The output of the emission model highlighted that the efficacy of bunding/control measures is critical in preventing direct release to the environment. Secondly, the capacity of wastewater treatment plants to successfully remove and/or destroy substances and prevent emission to environment is key to limiting their release to the wider environment.
The review of hazards highlighted that the fluorinated compounds are very persistent. Furthermore, based on feedback from the stakeholders’ workshop, the efficacy of wastewater treatment plants against fluorinated compounds is typically poor (see section B.4.5 for details). Further aspects, such as mobility in water are elaborated in section 1.1.4 of the main report and in section B.4.2. Section B.4.2.4 provides an overview of PFAS contamination of the wider environment.
Further review of the non-fluorinated alternatives highlighted a number of compounds (see Table E.18) that have very low PNEC values for water and soil (albeit higher than their fluorinated counterparts). The efficacy of the non-fluorinated substances as surfactants is typically poorer than fluorinated substances and thus greater concentrations are needed within the firefighting foam concentrate. This means that the potential emissions are higher, particularly where the same substance is used in multiple products by different manufacturers (i.e. in aggregate). Firefighting foams are one contributor to the ambient environmental levels, whereas other major sources also exist (see for indicative information RAC opinion to the restriction proposal of PFHxA, its salts and related substances, (ECHA, 2021a)). The sources of human exposure to PFASs via the environment are wide: PFASs can be already found in drinking water, in edible plants and in fish. Human exposure cannot be avoided. Moreover, it should be mentioned that humans are exposed to a complex mixture of PFASs simultaneously, not only to a single compound. Combined effects are further discussed under section B.5.11.
One further important consideration could be in cases where firefighting foams are used multiple times at the same location. For those substances with particularly low effect threshold valudes and lower biodegradation properties a concern could be that, if the control measures are less effective in some locations, releases could repeatedly ‘shock’ soil microflora and fauna (i.e. the release has toxic effects upon the soil, with secondary or repeated releases before the microflora and fauna communities have a chance to recover). The removal of such biological degradation pathways from the soil could also have knock-on consequences for the biodegradation of the substance itself, meaning that persistence may be greater than the values quoted within Table E.18.

P.O. Box 400, FI-00121 Helsinki, Finland | Tel. +358 9 686180 | echa.europa.eu
278
B.10. Risk characterisation
See section 1.1.6 in the main report.
P.O. Box 400, FI-00121 Helsinki, Finland | Tel. +358 9 686180 | echa.europa.eu
279
Annex C. Justification for action on a Union-wide basis
See section 1.2 of the Annex XV report.

P.O. Box 400, FI-00121 Helsinki, Finland | Tel. +358 9 686180 | echa.europa.eu
280
Annex D. Baseline
See section 1.3 of the Annex XV report.

P.O. Box 400, FI-00121 Helsinki, Finland | Tel. +358 9 686180 | echa.europa.eu
281
Annex E. Impact Assessment
E.1. Risk Management Options
E.1.1. Proposed option(s) for restriction
See Section 2.2.3 of the main report.
Additional details on the five assessed Restriction Options (ROs) are described below.
RO1: Restriction (ban) on the placing on the market of PFAS-based firefighting foams with different transitional periods per type of use. The use of legacy foams, i.e. foams already in stock at producers’ or users’ sites, is still permitted.
Under this RO, the placing on the market of PFAS-based foams would be banned after a specific transition period per type of use or sector, however, the use would still be allowed after these periods until depletion of stock (see applicable transition periods in Table E.1 below).
Table E.1. Transitional periods for placing on the market by sector/type of use
Sector/type of use Transitional period for placing on the
market for the sector/type of use
Seveso establishments 10 years
Other industries 5 years
Civilian aviation 5 years
Defence 5 years
Municipal fire services 18 months
Ready-to-use applications 5 years
Marine applications 3 years
Training and testing 18 months
The main advantage of this RO for foam users is that they can continue using the PFAS foams they have in stock after the ban for placing them on the market until they use up all their stock. From an emissions perspective, emissions of PFASs would continue for several years after the ban on placing on the market, resulting in significant additional emissions in the environment compared to e.g. RO2 or RO3. The substitution transition costs for the foam users would however be lower than in RO2 and RO3 since they would not need to dispose of their remaining PFASs foam stocks at the end of the transitional periods.
Stakeholders pointed out a practicality issue for RO1: when large amounts of foam are used for an incident, foam tanks need to be quickly refilled to allow continued operation, sometimes even during the same incident. However, it is not recommended to mix different foams in the same system (this could affect performance and the new foam would be contaminated with PFASs from the old foam), so refilling during an incident would not be feasible if PFAS foam was used in the equipment. This could potentially lead to end-users building up stocks of PFAS-based foams before the restrictions comes into place, or it could potentially lead to users not replacing foams in their installations to save costs, possibly causing problems during a large incident when a refill during the incident would be needed.

P.O. Box 400, FI-00121 Helsinki, Finland | Tel. +358 9 686180 | echa.europa.eu
282
RO2: Restriction (ban) on the placing on the market of PFAS-based firefighting foams after ten years (longest transitional period for a use) and ban of use with different transitional periods per type/sector of use.
Under RO2, the placing on the market of PFAS-based foams would be banned after ten years whereas the use of these foams would be banned after a specific transition period per type of use or sector. Any remaining stock of PFAS-foams related to a use should be safely disposed of after the end of the corresponding transitional period (see applicable transitional periods in Table E.2 below).
Table E.2. Transitional periods for placing on the market and use by sector/type of use
Sector/type of use or placing on the market Transitional period
Placing on the market 10 years
Seveso establishments 10 years
Other industries 5 years
Civilian aviation 5 years
Defence 5 years
Municipal fire services 18 months
Ready-to-use applications 5 years
Marine applications 3 years
Training and testing 18 months
RO2 ensures that foam users can be supplied by PFAS-based foams during the transitional period applicable to the use. After the transitional period of a given use, this use is banned, resulting in overall lower emissions in the environment compared to RO1.
RO3: Restriction on the export, placing on the market and use of PFAS-based firefighting foams with different transitional periods per type of use.
As indicated above, this restriction option is similar to RO2 with the additional ban of exports of PFAS firefighting foams at the end of the longest transitional period applicable for the placing on the market in the EU (10 years). The transitional periods applicable for the placing on the market and the use for each sector/type of use are the same as in RO2. The ban on export after ten years eliminates the emissions from the foam formulation in the EU.
RO4: Restriction on the use of PFAS-based firefighting foams with different transitional periods per type of use and the provision for a derogation mechanism via the local environmental permit system to which Seveso establishments and defence sites would be eligible.
The Seveso Directive requires an authorisation to deal with hazardous substances or fuels above certain volumes and sets out requirements for detailed risk assessment and risk mitigation measures including but not limited to fire protection.
Establishments covered under the Seveso Directive could apply to their local relevant authorities for a time-limited derogation for the use of PFAS foams as part of their operation permit where the applicant would provide a justification for the need to continue to use PFAS foams, a proof of the presence of firewater retention systems, a clear transition plan towards fluorine-free alternatives, regular reports on uses, replacements and disposal of PFAS foams

P.O. Box 400, FI-00121 Helsinki, Finland | Tel. +358 9 686180 | echa.europa.eu
283
and on substitution efforts and progress50.
RO4 which foresees a derogation for the use of PFAS foams via a permit system could be extended to defence sites in addition to Seveso establishments, for which some Member States claim to encounter issues regarding the transition to alternatives in an average time frame. The request for the operating permit should be submitted to the relevant (local or national) authorities which would assess the risks to human health, the environment and other risks such as fire risks and the efforts made to transition to safer alternatives. On this basis, the local/national authorities would decide whether to grant the temporary derogation of use of PFAS firefighting foams and the conditions linked to it.
The main advantage of RO4 is that it allows taking into account site-specific constraints for implementing the substitution by adapting the derogation period. However, the criteria used by local/national permitting authorities to systematically review permit requests are expected to vary potentially widely among authorities across the EEA unless they are established as part of the conditions of the proposed restriction. The cost of setting up and running a permitting system is unknown but can be assumed to be feasible for the industry as it is proposed by them. There is no information available on the practicality nor costs for the permitting authorities.
In addition, the absence of clearly defined transitional periods at EU level for the Seveso establishments (being the largest user sector) would strongly weaken the incentives for investments and as-quick-as-possible transitions to safer alternatives. Indeed, the derogations for continued use may be renewed several times leading to continued use for an extended period of time with corresponding potential for emissions to the environment. Even if strict risk management measures are implemented (containment and treatment), these are unlikely to be 100 % effective, especially in case of large fire incidents51, therefore possibly resulting in significant emissions to the environment during a derogation. Emissions would also continue to occur at the formulation, storage and disposal stages until all uses have finally ceased. For these reasons, RO4 has not been taken forward as a proposed risk management option. However, the Dossier Submitter evaluated the emissions and costs of RO4 considering the transitional periods described in Table E.3 below.
50 RO4 has been built from a proposal made in Eurofeu that they submitted in their comment to the draft opinion of SEAC on the PFHxA restriction proposal (Eurofeu, 2021a); reproduced in Appendix 7). 51 The report from the European Commission on the implementation of the Seveso Directive reports 442 major accidents over the period 2000-2018, i.e. an average around 25 major accidents per year (European Commission, 2021)

P.O. Box 400, FI-00121 Helsinki, Finland | Tel. +358 9 686180 | echa.europa.eu
284
Table E.3. Transitional periods for placing on the market and use by sector/type of use
Sector/type of use or placing on the market Transitional period
Seveso establishments None – subject to national permit
Other industries 5 years
Civilian aviation 5 years
Defence None – subject to national permit
Municipal fire services 18 months
Ready-to-use applications 5 years
Marine applications 3 years
Training and testing 18 months
RO5: restriction on all the uses of PFAS foams after a transitional period per type of use, unless measures to ensure full containment and safe disposal of all fire run-off waters are implemented.
Under this RO, during the transitional period corresponding to the type of use, the use of PFAS foams would be allowed but subject to the minimisation of emissions to the extent feasible, based on best techniques available for the sector (variable between the sectors). After the transitional period specific to the type of use, the use would be banned, unless the user can demonstrate that all fire run-off waters can be fully collected (also in the case of fire incident management) and disposed of safely (e.g. by incineration in hazardous waste incinerators, in cements kilns or by using other treatment techniques reducing the concentration of PFASs close to zero). Such disposal also applies to foam concentrates which need to be disposed of.
This RO has the advantage of progressively phasing out the uses for which a full containment of the fire run-off waters is not possible (e.g. in case of a fire accident) but allowing the continued use without time limitation for the uses where such a full containment of the fire run-off waters and their safe disposal is possible. During stakeholder consultations most companies in the oil/petrochemical sector argued that adequate risk management measures are already in place at their site through e.g. waterproof grounds, bunded areas, retention basins and treatment of collected fire run-off waters.
However, for other sectors of use, the requirement for a complete collection of fire run-off waters outside the limited areas dedicated to training is most likely not technically or economically implementable in practice in case of small or large fire incident due to the type of terrain and infrastructure. Large sites such as airports (covering all air strips, taxi runways, plane waiting zones, fuel storage sites, etc.), defence training sites (being mostly unpaved, irregular terrains with vegetation and obstacles) or smaller sites such as intervention sites of municipal brigades, marine ships or offshore oil platform all represent types of uses of firefighting foams where a full capture of fire run-off waters in case of a fire incident is simply not possible. Consequently, only sites already having a high level of risk management measures in place or able to enhance them to achieve a full recovery of fire run-off waters (typically the oil and (petro)chemical industry) would be able to possibly benefit from the exemption to the ban after the transitional period, even though even for these sites a full recovery of fire run-off waters during a large fire incident is unlikely. Indeed, the totality of the site surface is usually not equipped with waterproof ground, surrounded by bunds and fitted with retention basins that would be able to store high volumes of fire run-off waters. The risk management settings are usually only available in the most critical areas of a given industrial site. However, a large fire accident can easily spread away from these protected areas. The derogated uses are likely to continue for an extensive period of time due to a much

P.O. Box 400, FI-00121 Helsinki, Finland | Tel. +358 9 686180 | echa.europa.eu
285
weaker incentive for substitution than a clearly defined ban date.
RO5 has been discarded for the reason that, even if strict risk management measures are implemented (containment and treatment), these are unlikely to be 100 % effective for the use of firefighting foams, especially in case of large fire incidents, therefore possibly resulting in significant emissions to the environment. Emissions would also continue to occur at the formulation, storage and disposal stages until all uses have finally ceased.
The Dossier Submitter evaluated the emissions and costs of RO5 considering the transitional periods described in Table E.4 below.
Table E.4. Transitional periods for placing on the market and use by sector/type of use
Sector/type of use or placing on the market Transitional period*
Seveso establishments 10 years
Other industries 5 years
Civilian aviation 5 years
Defence 5 years
Municipal fire services 18 months
Ready-to-use applications 5 years
Marine applications 3 years
Training and testing 18 months * Unless full containment is assumed to take place
In conjunction with a restriction option, a stakeholder proposed to complement the restriction by setting up centrally managed stocks at specific, well-contained sites in large industrial areas that could be made available to potential users in case of emergencies, to control and restrict the use of PFAS-based foams to only the necessary applications during the transition period. This suggestion could help reduce the risk to the environment while allowing a potentially longer period to transition to alternatives, particularly for large industrial sites. The Dossier Submitter considers that the proposal has merit. However, since the implementation of it is site-specific, it is considered to be an industry best practice which firefighting foam users are encouraged to consider and it is not specifically included in the restriction proposal entry.
E.1.2. Discarded restriction options
See section 2.2.4 of the Annex XV report.
E.1.3. Union-wide risk management options other than restriction
Table E.5 below summarises other possible risk management options than restriction which have been considered to address the risk of PFASs in firefighting foams and the reasons for their rejection.

P.O. Box 400, FI-00121 Helsinki, Finland | Tel. +358 9 686180 | echa.europa.eu
286
Table E.5. Other risk management options than restriction considered
Option Reasons for discarding this option
Non-legislative measures
Voluntary industry agreement to restrict the use of PFASs in firefighting foams.
No voluntary industry agreements at EU level have been identified. Section 2.2.2 of the Annex XV report mentions some industry initiatives identified.
Taxation of PFASs placed on the market
It is conceivable that a tax could be levied at EU level per ton of PFASs placed on the market. If this tax was set high enough, it would encourage substitution for uses where feasible alternatives are available. However, levying an EU-wide tax would require unanimity. It is unlikely that all Member States would individually introduce relevant taxes and thereby, not all EU environmental risk would be removed as the taxes would not be harmonised (if levied at all). Furthermore, a relatively high tax would be needed to have an effect on the use of PFAS-based firefighting foams since the PFAS concentration in these foams is relatively low (typically around 2.5 %). It would not be possible to establish the risk reduction capacity of this measure in terms of release reduction upfront when deciding on the level of tax. Furthermore, substantial effort would have to be taken to develop such taxing scheme. Because of these challenges and limitations, an EU-wide or Member States based taxes are not considered an appropriate risk management measure for the use of PFAS-based firefighting foams and is therefore not assessed further.
Legislation other than REACH
Water Framework Directive/Directive on Environmental Quality Standards
The Water Framework Directive (WFD) aims, among other things, to return European surface waters to both a good ecological and a good chemical status. A good chemical status is defined via European quality standards laid out by the Directive on Environmental Quality Standards (EQSD)which in turn are established on biota based on risk to humans from consuming fishery products. Substances for which such standards are established are call priority substances see Annex II to the EQSD. Only PFOS are currently included as priority substances and the Commission is currently evaluating the inclusion of “PFAS total” on the list (SVHC identification under REACH would then enable the establishment of a set of hazardous PFASs). While it will be important to highlight the presence of PFASs in the environment in this way, the WFD and EQSD are themselves nonetheless not able to control the risk posed by PFASs in the environment. In particular PFASs that enter the environment from the use in firefighting foams can best be controlled at source and are not easily removed from wastewater or run-off once contained therein (see also below). A REACH restriction is regarded as the more effective, practicable and enforceable measure.
Groundwater Directive The Groundwater Directive complements the WFD (see above; focus on surface waters) in that it establishes quality standards for groundwater. Currently the Groundwater Directive does not set standards or even concentration limits for PFASs. While the Commission is currently evaluating the inclusion of at least a sub-set of PFASs into the Groundwater Directive, PFASs from firefighting foams are prevented from entering groundwater by controlling emissions at source and a REACH restriction is regarded as the more effective, practicable and enforceable measure.
Drinking Water Directive The Drinking Water Directive (DWD) ensures that drinking water is safe for human consumption. It includes concentration limits for 20 individual PFASs as well as an overall concentration limit for total PFASs. While the DWD thus ensures that drinking water does not contain hazardous concentrations of PFASs in water bodies (groundwater and surface waters) from which drinking water is extracted, it does not prevent emissions of PFASs into the environment per se. A REACH restriction is regarded as the more effective, practicable and enforceable measure.

P.O. Box 400, FI-00121 Helsinki, Finland | Tel. +358 9 686180 | echa.europa.eu
287
Option Reasons for discarding this option
Marine Strategy Framework Directive
The Marine Strategy Framework Directive (MSFD) aims to achieve good environmental status in all four European marine regions (Baltic Sea, North-east Atlantic Ocean, Mediterranean Sea and Black Sea). While good environmental status focuses more on biodiversity and the health of species in the marine environment, it also contains an element of chemical contamination similar to the WFD above. Here the MSFD refers to REACH as a tool to control chemical pollution that may impact the environmental status of marine environments. A REACH restriction is therefore regarded as the appropriate tool to control the risk posed by PFASs in firefighting foams.
Industrial Emissions Directive The Industrial Emissions Directive (IED) and accompanying Best Practice Reference Documents and Best Available Techniques set emission limit values for specific industrial pollutants in specific industrial sectors. While such limits could be established for PFASs, the IED does not cover all uses (i.e. sectors) in which PFAS-containing firefighting foams are used (e.g. municipal firefighting). A REACH restriction is regarded as the more effective, practicable and enforceable measure.
Seveso Directive The Seveso Directive aims to prevent major accidents involving dangerous substances and limiting the consequences to humans and environment in case they do occur. It generally covers establishments at which dangerous substances may be present and thus includes for example the oil and chemical sectors at which many of the known uses of PFAS-containing firefighting foams occur. Establishments are divided into upper and lower tier depending on the amount of dangerous substances present. Upper tier establishments are subject to more stringent requirements such as detailed internal and external emergency plans (among others). Such emergency plans also contain provisions in the event of fires including fire water retention measures (both by on-site and external off-site responders). As such, the Seveso Directive is a possible legislative tool to control the risk of PFASs in firefighting foams, however, the effectiveness of this measure is limited to the scope of the Seveso Directive which does not necessarily address the risk of hazardous substances for the environment and human health in the same way as REACH. A REACH restriction is therefore considered a more effective, practicable and enforceable measure that covers all current uses of PFAS-containing firefighting foams.
Urban Waste Water Directive The objective of this Directive is to protect the environment from the adverse effects of urban wastewater discharges and discharges from certain industrial sectors and concerns the collection, treatment and discharge of domestic, commercial and industrial wastewater.
Increasing the efficiency of wastewater treatment through measures under this Directive could help reduce PFASs reaching surface waters although the removal of PFASs from wastewater is energy intensive, incomplete and results in a proportion of the wastewater requiring further treatment. Control of PFAS emissions at source therefore is a more desirable approach.
POPs Regulation/Stockholm Convention
The POPs Regulation is the EU’s implementing regulation for the Stockholm Convention on POPs. It aims to protect human health and the environment by prohibiting or severely restricting the placing on the market of known POPs. Currently, PFOA are the only PFAS subject to the Stockholm Convention and the POPs Regulation. Members to the Stockholm Convention can only request to add additional chemicals to the Convention by restricting them in their own jurisdiction. The proposal at hand is therefore meant to create the conditions for controlling PFASs via the Stockholm Convention and POPs Regulation in the future.
Other REACH processes
REACH Authorisation process The REACH Authorisation process allows companies to apply for an authorisation to continue or start using and placing substances included in the Authorisation List (Annex XIV of REACH) on the market. Substances included in the Authorisation List need first to be identified as substances of very high concern, included in the Candidate List, recommended for inclusion in the Authorisation List and finally included in the Authorisation List. The PFASs eventually added to the authorisation list would encompass all uses of these PFASs (covered by the Authorisation title), i.e. not only the use in firefighting

P.O. Box 400, FI-00121 Helsinki, Finland | Tel. +358 9 686180 | echa.europa.eu
288
Option Reasons for discarding this option
foams. For the reasons described in section 2.2.4b of the Annex XV report, a restriction under REACH is considered better suited to address the associated risks of PFASs in firefighting foams.
REACH Art. 68.2
REACH Article 68(2) stipulates that substances that are classified as CMR categories 1A or 1B can be subject to a proposal from the Commission to inclusion in Annex XVII for consumer uses without using the procedures in article 69-73 in the REACH Regulation. PFASs are not so harmonised classified as CMRs and this measure is not applicable to them. In addition, there are largely professional and industrial uses of PFASs in firefighting foams and the proposed restriction is therefore better suited to address the associated risks.
E.2. Alternatives
E.2.1. Description of the use and function of the restricted substance(s)
As indicated in Annex A, PFAS-based firefighting foams find application in a broad range of sectors, such as aviation, marine, oil and gas, offshore oil, refineries, chemicals and railways. The main function of PFASs in firefighting foam is to act as a surfactant, that is to form a film over the surface of a burning liquid in order to prevent flammable gases from being released from it as well as reigniting.
This is a particularly relevant feature that enables applications in industrial fires, for example tank fires, where large quantities of flammable liquid are stored. They are used for training purposes and in a variety of fire incidents, from small fires to the above-mentioned large tank fires, and can be applied both with mobile and stationary equipment.
E.2.1.1. Standards
The analysis of alternatives provides a list of specific international compliance standards for commercially available products. Appendix 5 provides more detail on each of these standards.
Foams are developed to meet specific standard requirements and it is important to note that test methods used for standardisation and certification of PFAS-based foams are not necessarily appropriate for fluorine-free foams. Stakeholders highlighted during the September 2019 workshop that current testing protocols have often been designed with PFAS-based foams in mind. These testing protocols may not be adequately tailored to reflect the firefighting ability of fluorine-free foams, because the same application methods may not always be used and read-across between different burning fuels may not be straightforward. Therefore, it is inherently challenging to compare the two types purely based on certification. However, some fluorine-free foams are capable of meeting standard firefighting certifications applicable to PFAS-based foams as demonstrated for some airports and municipal fire brigades.
It should be noted that due to the increased use of fluorine-free foams across several sectors of use and geographical areas (e.g. EEA, US, Australia and New Zealand), the standards for the different types of uses are being or are likely to be revised and updated in the near future.
E.2.2. Substances used in fluorine-free foam concentrates
Due to the regulatory pressure and consumer preferences for fluorine-free replacements, a lot of producers of PFAS-containing foams have introduced fluorine-free alternatives. Most of the foams are advertised as intended for use on class B hydrocarbon fuel fires such as oil, diesel and aviation fuels as well as class A fires such as wood, paper, textiles, etc.

P.O. Box 400, FI-00121 Helsinki, Finland | Tel. +358 9 686180 | echa.europa.eu
289
Various information sources were reviewed to identify relevant alternatives to PFASs in firefighting foams. Many of these sources did not provide chemical names or/and CAS/EC numbers. In many instances (e.g. from NGOs, ECHA and Stockholm Convention documents), only very general information on replacement substances or substance groups were identified, including the following substance groups:
1. Hydrocarbons;
2. Detergents;
3. Siloxanes; and
4. Protein foams.
More specific information on substances in firefighting foams was identified in SDS and/or supplier information, some reports published by national authorities and some peer-reviewed publications. Most relevant information was identified in SDS. As an additional source, patents were considered using the google patent search. The results were in most cases the same as for the SDS.
A report by the Swedish chemicals agency (KEMI) compiles available knowledge about firefighting foams that were available on the Swedish market in 2014, with respect to chemical content, use, handling and disposal (Kemi, 2015). Scientific peer-reviewed publications by Hetzer et al. highlighted various sugar-based siloxanes (Hetzer et al., Hetzer and Kümmerlen, 2016, Hetzer et al., 2014, Hetzer et al., 2015). However, to the Dossier Submitter’s knowledge no CAS-numbers are available for these chemical compounds.
In the following, the identified substances are presented in more detail. In general, AFFF concentrates are principally water-based mixtures with other components such as surfactants, solvents and stabilisers. The lowering of surface tension to allow formation of foam and hence a blanket over the source of fuel, may be accomplished by use of both fluorocarbon and hydrocarbon surfactants. In this context, some of the substances identified are not direct PFAS-replacements i.e. in terms of being a surface active agent52. In the following, only those substances which were identified by their chemical structure as replacements (R) for PFASs are discussed. It is also possible that some of the identified substances may need to be combined with other substances (for example a hydrocarbon in combination with a detergent) to fulfil their capacity as a PFAS-replacement.
Substances have been grouped (based on expert judgement) as follows: hydrocarbons, siloxanes, protein foams and detergents.
E.2.2.1. Hydrocarbons
In terms of hydrocarbons, a variety of different substances/substance groups was found. This included various fatty acids, xanthan gums, sugars, alcohols, PEGs and alkanes. These substances are found in a variety of different products from different manufacturers. More information is provided in Table E.6. The chemical group was assigned by the Dossier Submitter and was not disputed at the September 2019 stakeholders workshop organised by ECHA.
52 Those substances are for example antimicrobial agents that are needed for the biological stability of the foam.
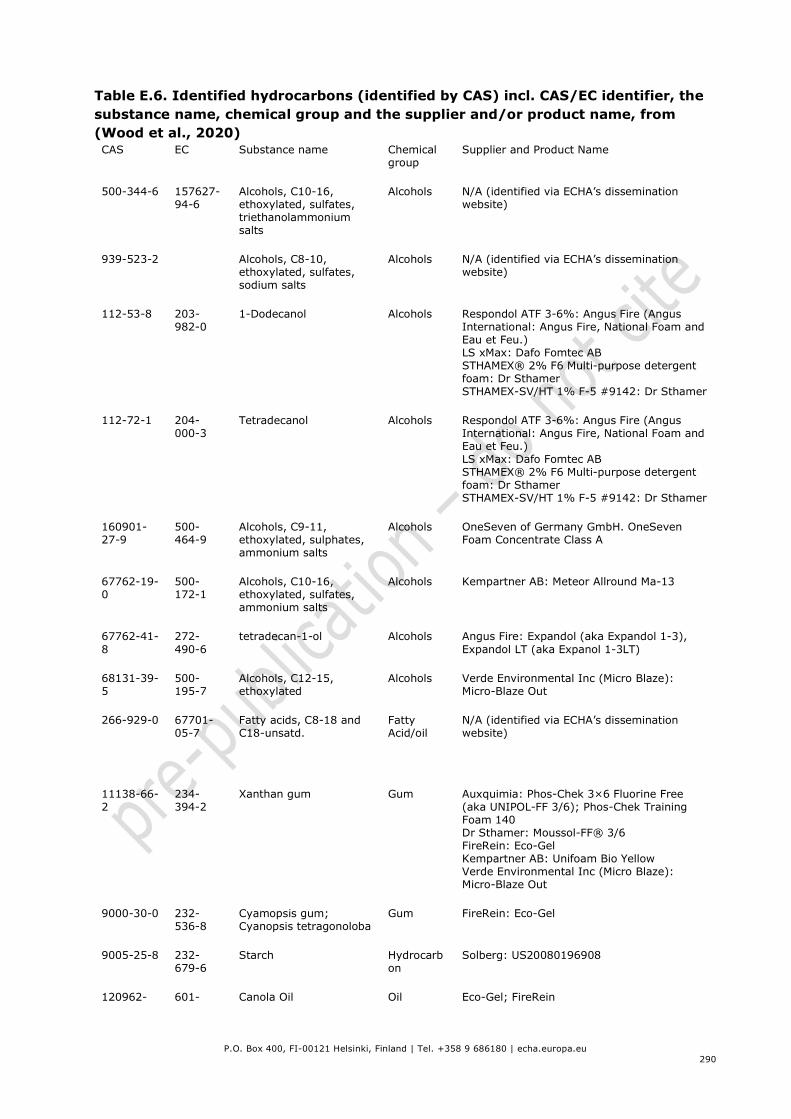
P.O. Box 400, FI-00121 Helsinki, Finland | Tel. +358 9 686180 | echa.europa.eu
290
Table E.6. Identified hydrocarbons (identified by CAS) incl. CAS/EC identifier, the substance name, chemical group and the supplier and/or product name, from (Wood et al., 2020) CAS EC Substance name Chemical
group Supplier and Product Name
500-344-6 157627-94-6
Alcohols, C10-16, ethoxylated, sulfates, triethanolammonium salts
Alcohols N/A (identified via ECHA’s dissemination website)
939-523-2 Alcohols, C8-10, ethoxylated, sulfates, sodium salts
Alcohols N/A (identified via ECHA’s dissemination website)
112-53-8 203-982-0
1-Dodecanol Alcohols Respondol ATF 3-6%: Angus Fire (Angus International: Angus Fire, National Foam and Eau et Feu.) LS xMax: Dafo Fomtec AB STHAMEX® 2% F6 Multi-purpose detergent foam: Dr Sthamer STHAMEX-SV/HT 1% F-5 #9142: Dr Sthamer
112-72-1 204-000-3
Tetradecanol Alcohols Respondol ATF 3-6%: Angus Fire (Angus International: Angus Fire, National Foam and Eau et Feu.) LS xMax: Dafo Fomtec AB STHAMEX® 2% F6 Multi-purpose detergent foam: Dr Sthamer STHAMEX-SV/HT 1% F-5 #9142: Dr Sthamer
160901-27-9
500-464-9
Alcohols, C9-11, ethoxylated, sulphates, ammonium salts
Alcohols OneSeven of Germany GmbH. OneSeven Foam Concentrate Class A
67762-19-0
500-172-1
Alcohols, C10-16, ethoxylated, sulfates, ammonium salts
Alcohols Kempartner AB: Meteor Allround Ma-13
67762-41-8
272-490-6
tetradecan-1-ol Alcohols Angus Fire: Expandol (aka Expandol 1-3), Expandol LT (aka Expanol 1-3LT)
68131-39-5
500-195-7
Alcohols, C12-15, ethoxylated
Alcohols Verde Environmental Inc (Micro Blaze): Micro-Blaze Out
266-929-0 67701-05-7
Fatty acids, C8-18 and C18-unsatd.
Fatty Acid/oil
N/A (identified via ECHA’s dissemination website)
11138-66-2
234-394-2
Xanthan gum Gum Auxquimia: Phos-Chek 3×6 Fluorine Free (aka UNIPOL-FF 3/6); Phos-Chek Training Foam 140 Dr Sthamer: Moussol-FF® 3/6 FireRein: Eco-Gel Kempartner AB: Unifoam Bio Yellow Verde Environmental Inc (Micro Blaze): Micro-Blaze Out
9000-30-0 232-536-8
Cyamopsis gum; Cyanopsis tetragonoloba
Gum FireRein: Eco-Gel
9005-25-8 232-679-6
Starch Hydrocarbon
Solberg: US20080196908
120962- 601- Canola Oil Oil Eco-Gel; FireRein

P.O. Box 400, FI-00121 Helsinki, Finland | Tel. +358 9 686180 | echa.europa.eu
291
CAS EC Substance name Chemical group
Supplier and Product Name
03-0 748-6
25322-68-3
500-038-2
Poly(oxy-1,2-ethanediyl),α-hydro-ω-hydroxy- Ethane-1,2-diol, ethoxylated
Polyethylene glycol
Dafo Fomtec AB: Fomtec AFFF 1% F, Fomtec AFFF 3% S, Fomtec AFFF 3%
27252-80-8
608-068-9
ALLYLOXY(POLYETHYLENE OXIDE), METHYL ETHER (9-12 EO)
Polyethylene glycol
1% AFFF Denko 3% AFFF Denko 6% AFFF Denko Alcohol AFFF 3% - 6% Single or Double Strength Denko
32612-48-9
608-760-0
Poly(oxy-1,2-ethanediyl), α-sulfo-ω-(dodecyloxy)-, ammonium salt (1:1)
P Polyethylene glycol
Orchidee Fire: Orchidex BlueFoam 3x3
73665-22-2
616-006-7
Poly(oxy- 1,2-ethanediyl), .alpha.-sulfo-.omega.-hydroxy-C6-10-alkyl ethers, sodium salts
Polyethylene glycol
Dr Sthamer: STHAMEX® 2% F6 Multi-purpose detergent foam, STHAMEX® 3% F6 Multi-purpose detergent foam, STHAMEX® K 1% F-15 #9143, STHAMEX-SV/HT 1% F-5 #9142, TRAINING FOAM-N 1% F-0 #9141
96130-61-9
619-194-9
Poly(oxy-1,2-ethanediyl), α-sulfo-ω-hydroxy-, C9-11-alkyl ethers, sodium salts
Polyethylene glycol
Dafo Brand AB: ARC Miljö Dafo Fomtec AB: Fomtec AFFF 1% A, Fomtec AFFF 1% F, Fomtec AFFF 1% Plus, Fomtec AFFF 1% Ultra LT, Fomtec AFFF 3%, Fomtec AFFF 3%ICAO, Fomtec AFFF 3% S, Fomtec A-skum
308-766-0 98283-67-1
undecyl glucoside Sugar N/A (identified via ECHA’s dissemination website)
439-070-6 439-070-6
(2R,3R,4S,5S)-2,3,4,5-tetrahydroxyhexanal (2R,3S,4R,5R)-2,3,4,5,6-pentahydroxyhexanal (2S,3S,4S,5R)-2,3,4,5-tetrahydroxy-6-oxohexanoic acid acetic acid calcium dihydride hydrate magnesium dihydride potassium hydride sodium hydride
Sugar N/A (identified via ECHA’s dissemination website)
110615-47-9
600-975-8
Alkylpolyglycoside C10-16
Sugar Orchidee Fire: Orchidex BlueFoam 3x3
54549-25-6
259-218-1
(3R,4S,5S,6R)-2-(decyloxy)-6-(hydroxymethyl)oxane-3,4,5-triol
Sugar Unifoam Bio Yellow
68515-73-1
500-220-1
Alkyl polyglucoside Sugar Dafo Brand AB: ARC Miljö Dafo Fomtec AB: Enviro 3x3 Plus, Enviro 3x3 Ultra, Enviro 3x6 Plus, Environ 6x6 Plus, LS aMax, MB -20, Trainer E-lite, Fomtec AFFF 1% A, Fomtec AFFF 1% F, Fomtec AFFF 1% Plus, Fomtec AFFF 1% Ultra LT, Fomtec AFFF 3% ICAO, Fomtec AFFF 3% S, Fomtec AFFF 3% OneSeven of Germany GmbH: OneSeven ®

P.O. Box 400, FI-00121 Helsinki, Finland | Tel. +358 9 686180 | echa.europa.eu
292
CAS EC Substance name Chemical group
Supplier and Product Name
Foam Concentrate Class B-AFFF vs FOCUM: Silvara APC 3x6
N/a 917-341-4
AAlkyl polyglucoside Sugar Solberg: US20080196908
E.2.2.2. Detergents
Detergents would typically be considered part of the hydrocarbon group. However, for the purposes of this report, this substance group is considered separately. This group is characterised by their amphiphilic nature, being partly hydrophilic (polar) and partly hydrophobic (non-polar). The polar headgroup is needed to ensure their action on surfaces/interfaces (formation of micelles, lowering of the surface tension of water). The substances identified in this group, cover various alkanes that differ in the carbonic chain length (e.g. decyl, lauryl) and the head group (e.g. betaine, sulphates, amido betaines, triethanolamines). A betaine is a quaternary ammonium compound having three methyl groups.
This pattern is to some extent similar to those of the poly- and perfluorinated substances, in which an F-atom replaces the H-atom. In Figure E.1 sodium octyl sulphate is shown, this substance has been identified in at least ten individual products from several suppliers as an alternative to PFAS substances. The polar head group is highlighted in red and the non-polar alkaline chain is highlighted in blue.
It should be noted, that also PFAS-containing AFFF may also contain some of these detergents (for example STHAMEX® -AFFF 3%).
Figure E.1. Chemical structure of sodium octyl sulphate, from (Wood et al., 2020) Table E.7. Identified detergents (identified by CAS) incl. CAS/EC identifier, the substance name, chemical group and the supplier and/or product name, from (Wood et al., 2020) CAS EC Substance name Chemical group Supplier and
Product Name
308062-28-4 608-528-9 / 931-292-6
Amines, C12-14 (even numbered) -alkyldimethyl, N-oxides
Alkylamine Dafo Fomtec AB: Enviro 3% ICAO, Enviro USP Dr Sthamer: vaPUREx LV 1% F-10 #7141
68155-09-9 268-938-5 Amides, coco, N-(3-(dimethylamino)propyl), N-oxides
Alkylamine Angus Fire: Syndura (6% fluorine free foam)

P.O. Box 400, FI-00121 Helsinki, Finland | Tel. +358 9 686180 | echa.europa.eu
293
CAS EC Substance name Chemical group Supplier and Product Name
70592-80-2 274-687-2 Amines, C10-16-alkyldimethyl, N-oxides
Alkylamine Angus Fire: Syndura (6% fluorine free foam)
269-087-2 68187-32-6 l-Glutamic acid, N-coco acyl derivs., monosodium salts
Alkylamine
1469983-49-0 939-455-3 1-Propanaminium, N-(3-aminopropyl)-2-hydroxy-N,N-dimethyl-3-sulfo-, N-(C8-18(even numbered) acyl) derivs., hydroxides, inner salts
Alkylbetaine Dafo Fomtec AB: Enviro 3x3 Plus, Enviro 3x3 Ultra, Enviro 3x6 Plus, Environ 6x6 Plus, LS aMax, Silvara APC 1
147170-44-3 604-575-4 / 931-333-8
1-Propanaminium, 3-amino-N-(carboxymethyl)-N,N-dimethyl-, N-(C8-18(even numbered) and C18 unsaturated acyl) derivs., hydroxides, inner salts
Alkylbetaine Dr Sthamer: MOUSSOL®–FF 3/6 F-15 #7941
61789-40-0 931-296-8 1-Propanaminium, 3-amino-N-(carboxymethyl)-N,N-dimethyl-, N-(C12-18(even numbered) acyl) derivs., hydroxides, inner salts
Alkylbetaine OneSeven of Germany GmbH: OneSeven Foam Concentrate Class A Solberg: Solberg Patent US20080196908
64265-45-8 264-761-2 N-(2-hydroxyethyl)-N-[2-[(1-oxooctyl)amino]ethyl]-β-alanine
Alkylbetaine vs FOCUM: Silvara APC 1, Silvara APC 3x3, Silvara APC 3x6, Silvara ZFK (0.5%)
68139-30-0 268-761-3 Cocamidopropyl hydroxysultaine
Alkylbetaine Solberg: US20080196908
13150-00-0 236-091-0 Sodium 2-[2-[2-(dodecyloxy)ethoxy]ethoxy]ethyl sulphate
Alkylsulfate Kempartner AB: Unifoam Bio Yellow

P.O. Box 400, FI-00121 Helsinki, Finland | Tel. +358 9 686180 | echa.europa.eu
294
CAS EC Substance name Chemical group Supplier and Product Name
139-96-8 205-388-7 2-[bis(2-hydroxyethyl)amino]ethanol; dodecyl hydrogen sulfate
Alkylsulfate Dr Sthamer: Sthamex SVM Dr Sthamer: Moussol-FF® 3/6 Kempartner AB: Unifoam S Kempartner AB: Unifoam OneSeven of Germany GmbH: OneSeven ® Foam Concentrate Class B-AFFF vs FOCUM: Silvara 1 (1%) vs FOCUM: Silvara APC 1 vs FOCUM: Silvara APC 3x3 vs FOCUM: Silvara ZFK (0.5%)
142-31-4 205-535-5 Sodium octyl sulphate
Alkylsulfate Angus Fire (Angus International: Angus Fire, National Foam and Eau et Feu.) : Syndura (6% fluorine free foam) Chemguard: 3% AFFF Foam Concentrate (C303) Chemguard: 3% Low Temp AFFF (C3LT) Dafo Brand AB: AFFF 3-6% Fire Services Plus: FireAde Fire Services Plus: FireAde AR AFFF OneSeven of Germany GmbH: OneSeven ® Foam Concentrate Class B-AFFF OneSeven of Germany GmbH: OneSeven ® Foam Concentrate Class B-AFFF-AR Solberg: Solberg Patent US20080196908 Dr Sthamer: TRAINING FOAM-N 1% F-0 #9141 vs FOCUM: Silvara ZFK (0.5%)

P.O. Box 400, FI-00121 Helsinki, Finland | Tel. +358 9 686180 | echa.europa.eu
295
CAS EC Substance name Chemical group Supplier and Product Name
142-87-0 205-568-5 Sodium decyl sulfate
Alkylsulfate Chemguard: 3% AFFF Foam Concentrate (C303) Chemguard: 3% Low Temp AFFF (C3LT) Chemguard: 6% AFFF Foam Concentrate (C603) Chemguard: 6% Low Temp AFFF (C6LT) Dafo Brand AB: AFFF 3-6% Dafo Fomtec AB: LS xMax Dafo Fomtec AB: MB -20 Solberg: Solberg Patent US20080196908 Dr Sthamer: TRAINING FOAM-N 1% F-0 #9141 vs FOCUM: Silvara 1 (1%) Solberg: Solberg Patent US20080196908
143-00-0 205-577-4 Dodecyl hydrogen sulfate;2-(2-hydroxyethylamino)ethanol
Alkylsulfate Solberg: US20080196908
151-21-3 205-788-1 Sodium dodecyl sulphate
Alkylsulfate Fire Services Plus: FireAde; FireAde AR AFFF
2235-54-3 218-793-9 Ammonium alkyl ether sulphate
Alkylsulfate Kempartner AB: Unifoam, Unifoam S
25882-44-4 247-310-4 disodium;4-[2-(dodecanoylamino)ethoxy]-4-oxo-3-sulfonatobutanoate
Alkylsulfate Angus Fire (Angus International: Angus Fire, National Foam and Eau et Feu.): Expandol (aka Expandol 1-3), Expandol LT (aka Expanol 1-3LT)
273-257-1 68955-19-1 Sulfuric acid, mono-C12-18-alkyl esters, sodium salts
Alkylsulfate N/A (identified via ECHA’s dissemination website)
287-809-4 85586-07-8 Sulfuric acid, mono-C12-14-alkyl esters, sodium salts
Alkylsulfate N/A (identified via ECHA’s dissemination website)

P.O. Box 400, FI-00121 Helsinki, Finland | Tel. +358 9 686180 | echa.europa.eu
296
CAS EC Substance name Chemical group Supplier and Product Name
3088-31-1 221-416-0 Sodium 2-(2-dodecyloxyethoxy)ethyl sulphate
Alkylsulfate Buckeye Fire Equipment Company: Buckeye High Expansion Foam (BFC-HX) (aka Hi-Ex 2.2)
577-11-7 209-406-4 1,4-bis(2-ethylhexoxy)-1,4-dioxobutane
Alkylsulfate Dr Sthamer: STHAMEX® K 1% F-15 #9143
68081-96-9 268-364-5 Sulfuric acid, mono-C10-16-alkyl esters, ammonium salts
Alkylsulfate Orchidee Fire: Orchidex BlueFoam 3x3 Verde Environmental Inc (Micro Blaze): Micro-Blaze Out
68439-57-6 931-534-0, 270-407-8
Sulfonic acids, C14-16-alkane hydroxy and C14-16-alkene, sodium salts
Alkylsulfate Dafo Fomtec AB: Enviro 3x3 Plus, Enviro 3x6 Plus, Environ 6x6 Plus Dr Sthamer: STHAMEX® 3% F6 Multi-purpose detergent foam, STHAMEX® K 1% F-15 #9143 vaPUREx LV 1% F-10 #7141
68877-55-4 272-563-2 Sodium 3-[2-(2-heptyl-4,5-dihydro-1H-imidazol-1-yl)ethoxy] propionate
Alkylsulfate OneSeven of Germany GmbH: OneSeven ® Foam Concentrate Class B-AFFF, OneSeven ® Foam Concentrate Class B-AFFF-AR
68877-55-4 272-563-2 Sodium 3-[2-(2-heptyl-4,5-dihydro-1H-imidazol-1-yl)ethoxy] propionate
Alkylsulfate OneSeven of Germany GmbH: OneSeven ® Foam Concentrate Class B-AFFF, OneSeven ® Foam Concentrate Class B-AFFF-AR
68891-38-3 500-234-8 Sodium laureth sulfate
Alkylsulfate Angus Fire: Expandol (aka Expandol 1-3), Expandol LT (aka Expanol 1-3LT), Respondol ATF 3-6% Dafo Fomtec AB: Enviro 3% ICAO, Enviro USP, LS xMax, Trainer E-lite

P.O. Box 400, FI-00121 Helsinki, Finland | Tel. +358 9 686180 | echa.europa.eu
297
CAS EC Substance name Chemical group Supplier and Product Name
85338-42-7 286-718-7, 939-332-4
Sulfuric acid, mono-C8-10 (even numbered)-alkyl esters, sodium salts
Alkylsulfate Angus Fire: Respondol ATF 3-6% Dafo Fomtec AB: Enviro 3x3 Ultra, LS aMax
85665-45-8 939-262-4 Sulfuric acid, mono-C8-14 (even numbered)-alkyl esters, compds. with triethanolamine
Alkylsulfate Dr Sthamer: MOUSSOL®–FF 3/6 F-15 #7941, MOUSSOL®–FF 3/6 F-5 #7942, STHAMEX® 2% F6 Multi-purpose detergent foam, STHAMEX-SV/HT 1% F-5 #9142, TRAINING FOAM-N 1% F-0 #9141
90583-18-9 939-265-0, 292-216-9
Sulfuric acid, C12-14 (even numbered)-alkyl-esters, compds. with triethanolamine
Alkylsulfate Dafo Fomtec AB: Enviro 3% ICAO, Enviro USP OneSeven of Germany GmbH: OneSeven Foam Concentrate Class A vs FOCUM: Silvara APC 3x6 Unifoam Bio Yellow
90583-25-8 292-224-2 Sulfuric acid, mono-C6-12-alkyl esters, sodium salts
Alkylsulfate
N/a 919-131-8 Fatty alcohol polyglycol ether sulfate, sodium salt
Alkylsulfate BASF: Emulphor® FAS 30
N/a 944-611-9 Reaction mass of C-isodecyl and C-isoundecyl sulphonatosuccinate
Alkylsulfate Respondol ATF 3-6%
4292-10-8 224-292-6 (carboxymethyl)dimethyl-3-[(1-oxododecyl)amino]propylammonium hydroxide
Detergent vs FOCUM: Silvara 1 (1%), Silvara ZFK (0.5%)
E.2.2.3. Siloxanes
A limited number of siloxanes were identified, potentially because the usage of these substances is still in the phase of development. Only one substance belonging to siloxanes could be identified by CAS number. This substance is a mixture of siloxanes and silicones (CAS 117272-76-1). It was found in products by Denko, namely: 1% AFFF; 3% AFFF; 6% AFFF; Alcohol AFFF 3% - 6% Single or Double Strength. Based on the name, it could be that these substances were used in combination with fluorinated substances. However, for the sake of completeness the substance is named although it is not used as a PFAS-replacement. This information is shown in the table below, where also the chemical structure is shown.
Table E.8. Siloxanes (identified by CAS) incl. CAS/EC identifier, the substance name, chemical group and the supplier and/or product name, from (Wood et al.,

P.O. Box 400, FI-00121 Helsinki, Finland | Tel. +358 9 686180 | echa.europa.eu
298
2020) CAS EC Substance name Chemical
group Supplier & Product Name
Chemical structure
117272-76-1
601-468-4 Siloxanes and Silicones, 3-hydroxypropyl Me, ethers with polyethylene glycol mono-Me ether
Siloxanes 1% AFFF Denko 3% AFFF Denko 6% AFFF Denko Alcohol AFFF 3% - 6% Single or Double Strength Denko
In addition, publications by Hetzer et al. presented various sugar-based siloxanes for which CAS-numbers are not available. For a better understanding, in Table E.8 a sugar-based siloxane, as presented by Hetzer et al., is shown. It is important to note that these substances are used without further addition of PFAS substances. The most recent publication by these researchers states that siloxane-based firefighting foam concentrate shows an extinguishing performance which significantly surpasses the commercial PFAS-free foams (whereby the actual product is not named) and nearly meets the performance of the PFAS-containing AFFF in fire suppression tests based on the NATO standard fuel F-34 (class B fire). However, no commercial product containing these substances was identified.
Certain siloxanes are identified as SVHC based on their PBT and/or vPvB properties (cyclic D4, D5, D6) and others (linear siloxanes) are currently undergoing PBT-assessment (e.g. octamethyltrisiloxane). Furthermore, D4, D5, D6 are subject to an ongoing restriction process that would not allow their use in firefighting foams if adopted. The restriction is subject to decision making.
Figure E.2. Sugar-based siloxane as described by Hetzer et al., from (Wood et al., 2020) For more information on these substances please refer to the individual publications (Hetzer et al., Hetzer and Kümmerlen, 2016, Hetzer et al., 2014, Hetzer et al., 2015).
E.2.2.4. Proteins
Regarding protein-based foams also only one substance with a CAS number could be identified. This belongs to silk-based protein hydrolysate (CAS 306-235-8). However, the associated product/foam manufacturer was not identified. Some SDS mention proteins from horn and hoof (National Foam) or hydrolysed protein (Gepro Group PROFOAM 806G). In these cases, no CAS number was given. The sources mentioning horn- and hoof-based proteins also recommended that these should not be used because of the risk of epizootic diseases.
Conclusion on substance identity used in fluorine-free firefighting foams
The identified fluorine-free PFAS-replacements can be grouped into four classes: hydrocarbons, detergents, siloxanes and proteins. For the latter two classes, relatively little information was gathered. In the case of the siloxanes, the usage of these substances in firefighting foams is still under development. In contrast, a variety of alternative hydrocarbons (around 24) and detergents (33) was identified.

P.O. Box 400, FI-00121 Helsinki, Finland | Tel. +358 9 686180 | echa.europa.eu
299
E.2.3. Identification of alternative foam concentrates and techniques
A list of the most common alternative fluorine-free products that are widely used in the EU has been complied. These provide a starting point which can be compared to the risk, performance and cost of PFAS-based products.
Alternative techniques could be changes in demand for flammable fuels which would reduce the need for PFAS foams. Application of e.g. electric aircraft and phase out of hydrocarbon fuels for vehicles would reduce the needs for PFAS foams but are not considered feasible alternative solutions in the short term.
The selection of fluorine-free products for further analysis was based on the following criteria:
Use – The use of the products has been reported by several stakeholders, ensuring that the products analysed are commonly used in the EU as alternatives for PFAS-containing foams;
Chemical group – The products represent different chemical groups according to the grouping in the substance identification, i.e. hydrocarbons, detergents, siloxanes and proteins. Some products may contain a combination of substances from these groups;
Technical feasibility – The performance of the product is sufficient that it can be considered as an alternative to PFAS-containing foams, including in critical situations (e.g. large fires). The technical feasibility criterium also considers the combination of the foam concentrate, the application system and the application rate. Case studies of critical applications serve as a starting point for successful replacement of PFAS-containing foams with fluorine-free alternatives. Training foams have been excluded as they are already available and widely used in all sectors;
Manufacturers – The products originate from different manufacturers;
Availability – The products are known to be on the market in the EU and are available without further R&D delays or costs; and
Complementarity – The products cover jointly all major applications of PFAS-containing foams and can be used in different conditions.
An initial shortlist with 30 products from 8 manufacturers was presented at the September 2019 stakeholders workshop organised by ECHA (see Annex G for more details on the workshop), and participants were asked which were the most commonly used and viable. On the basis of the workshop feedback, further review and responses from stakeholders, a list of products for further analysis was generated. This is shown in Table E.9 along with a justification of why these specific products have been chosen.
For each of the manufacturers, one or two products in the product range was selected for more detailed assessment, principally based on the suitability for use at airports and in the petrochemical sector. The information provided in Table E.9 is supplemented with two representative case studies in section E.2.4.
The remaining products on the shortlist presented at the workshop were produced by Auxquimia (EE-3 Newtonian Training foam, and Unipol-FF), Fomtec (the Enviro product range) and the 3F Company (Freedol SF). None of the companies responded to the stakeholder consultation and only limited information on the feasibility has been obtained. These products were not included in Table E.9, but this does not indicate that these products are considered less efficient alternatives to the PFAS-based foams, merely that less information on the feasibility of using these foams was available for the assessment. Seven products were selected in order to strike a balance between ensuring variety in coverage of alternatives and

P.O. Box 400, FI-00121 Helsinki, Finland | Tel. +358 9 686180 | echa.europa.eu
300
depth of analysis that is possible.
Siloxane-based alternatives, despite being reported in the literature, do not appear to be in commercial use and there are concerns in relation to PBT and/or vBvP properties of some siloxanes. Therefore, these products were not selected for detailed analysis.
One protein-based product, PROFOAM 806G (produced by Gepro) was mentioned to be in use during the stakeholder consultation. However, specific data on users, application or feasibility was not provided in the stakeholder consultation and the manufacturer and products cannot be identified. Protein-bases foams are marketed by Profoam srl (PROVEX AR 6-6), Angus PFAS-based foams (TF 3 and TF90 for training purposes) and Dr Stahmer (Foamousse® product range). No information on these products was provided for the stakeholder consultation but one product from the Foamousse® product range has been added to Table E.9.
Table E.9. Shortlist of fluorine-free alternative products for assessment, from (Wood et al., 2020) Product name
Manufacturer Chemical group(s)
Current use sector of the product where PFAS-based products are currently used
Reason for shortlisting
Other marketed fluorine- free products from the manufacturer for hydrocarbon fires
Respondol ATF 3-6%
Angus fire Hydrocarbons and detergents
Petrochemicals -processing, storage and transport of hydrocarbons and polar solvents
Applicable for all types of flammable liquid fires
JetFoam ICAO-C (aviation)
JetFoam ICAO-b (aviation)
Syndura (aviation, forestry)
Re-Healing Foam RF1 1%
Solberg Hydrocarbons and detergents
Petrochemicals - offshore oil installations and onshore terminals and refineries
Widely used - detailed information on the feasibility of using the substances as alternatives for PFAS-based products in the petrochemical sector provided in Case 2
8 other products in the Re-Healing Foam RF product range
Re-Healing Foam RF3x6 ATC
Solberg Hydrocarbons and detergents
Aviation Widely used - detailed information on the feasibility of using the substances as alternatives for PPFAS-based products in the aviation sector provided in

P.O. Box 400, FI-00121 Helsinki, Finland | Tel. +358 9 686180 | echa.europa.eu
301
Product name
Manufacturer Chemical group(s)
Current use sector of the product where PFAS-based products are currently used
Reason for shortlisting
Other marketed fluorine- free products from the manufacturer for hydrocarbon fires
Case 1
Moussol FF 3x6
Dr. Sthamer Hydrocarbons and detergents
Aviation
Petrochemicals
Widely used in several major EU airports
A number of products in the Sthamex® product range (municipal fire services, aviation, training foams)
Training foam N (training)
vaPUREx® LV 1% F10 (extensive fires of non-polar liquids)
vaPUREx® LV ICAO B 3% F-10 (aviation)
Foammousse 3% F-14
Dr. Sthamer Protein According to manufacturer: Petroleum industry and on oil tankers
Best available example of protein-based products
Ecopol Premium
Bioex Hydrocarbons and detergents
Aviation Mentioned by manufacturer and other stakeholders, as applicable for hydrocarbon fires, all types of flammable polar solvent liquids and applicable for tank fire fighting
BIO FOR
BIO FOAM 5 and 15 (storage facilities, marine)
BIO T3 and BIO T6 (training foams)
Ecopol F3 HC, Ecopol A
Orchidex BlueFoam 3x3
Orchidee Hydrocarbons and detergents
Aviation Has according to stakeholder response substituted for AFFF for one of the biggest airports in Germany
Other products in the Orchidex Bluefoam product range
E.2.4. Risk reduction, technical and economic feasibility, and availability of alternatives
Additional information on the technical and economic feasibility and availability of shortlisted products was collected through literature review and follow-up with stakeholders. The properties of the shortlisted products are listed in the following tables and are further used in

P.O. Box 400, FI-00121 Helsinki, Finland | Tel. +358 9 686180 | echa.europa.eu
302
the impact assessment in subsequent sections.
The full chemical composition of the products is in general not available. The following tables indicate the substances listed in the safety data sheets i.e. the constituents classified as hazardous. It should be noted that not all human health or environmental hazard endpoints (e.g. endocrine disrupting effects) have necessarily been assessed in detail for each component by the foam manufacturers. Therefore, it should be kept in mind that the conclusion on risks in the tables below are based on the information provided in the product safety data sheets and hence other hazards may become evident in the future. A comprehensive list of substances identified in alternatives is provided in section B.1. A detailed risk assessment of the use of the alternatives has not been undertaken. The assessment instead mostly focused on listing the hazardous properties identified based on publicly available information.
Table E.10. Assessment of Respondol ATF 3-6%, from (Wood et al., 2020)
Product name Respondol ATF 3-6%
Manufacturer Angus Fire
Chemical group Hydrocarbons and detergents.
Chemical composition Substances listed in safety data sheet:
1-dodecanol
1-tetradecanol
propylene glycol monobutyl ether
disodium isodecyl sulfosuccinate
sulfuric acid, mono-C8-10-alkyl esters, sodium salts
reaction mass of C-isodecyl and C-isoundecyl sulphonatosuccinate.
Proposed PFAS foam substitution (as specified by manufacturer)
Replacing traditional AFFF and FFFP foam concentrates as well as fluoroprotein foam.
Technical feasibility
Applications areas (as specified in technical specification)
Class B hydrocarbon fuels at 3% and polar solvent fuels at 6%. Class A fuels (as wetting agent).
Used in high-risk situations where hydrocarbons (such as oils, gasoline, diesel fuel, and aviation kerosene) are stored, processed, or transported and/or polar solvents (such as alcohols, ketones, esters, and ethers) are stored, processed, or transported.
Compliance with international performance standards
EN 1568 Part 3 and 4; Highest approval rating on all fuels using all waters; 1A/1A – 1A/1A – 1A/1A. (see Appendix 5)
Examples of use experience and performance compared to PFAS-containing foams
Used within the petroleum industry. No further details available.
Marketed for use in Power and Industry (other than petrochemical), municipal fire brigades and forestry
Critical uses/applications where product do not meet (fully or partially) the required performance
The product is not intended for the aviation sector for which the manufacturer markets other products (JetFoam and Syndura product

P.O. Box 400, FI-00121 Helsinki, Finland | Tel. +358 9 686180 | echa.europa.eu
303
Product name Respondol ATF 3-6%
standard and why ranges)
The corresponding 3-3% product has passed Lastfire test in fresh water and sea water. Stakeholders have indicated that fires in very large tanks are still challenging
Need for changes in equipment In general, no need for replacement of equipment, but adjustment and in some case change of components
Economic feasibility:
Unit price No data
Unit price as compared with PFAS-containing foam for same application
No data
Relative volume required to achieve comparable/best possible performance
No data
Storage, shelf-life Max. continuous storage temperature 49 C° (no performance loss after thawing), min. 10 years.
Frequency of foam replacement Depending on application and difficult to compare with the PFAS-containing. Commonly, the foam is used continuously for training and system testing as well, thus not requiring replacement.
Availability:
Volume manufactured, sold and used in the EU
No data
Production capacity in the EU No data
Risks:
CMR properties Substances in the product do not meet the CMR criteria
Other potential human health concern
Hazard classification of some constituents:
H315 - Causes skin irritation.
H319 - Causes serious eye irritation.
H302 - Harmful if swallowed
No other health concern identified
PBT or vPvB properties The product does not meet the PBT or vPvB criteria.
Other environmental risk concern Hazard classification of some constituents:
-dodecanol (EC No 203-982-0; CAS No 112-53-8): H400 - Very toxic to aquatic life
-tetradecanol (EC No 204-000-3; CAS No 112-72-1):

P.O. Box 400, FI-00121 Helsinki, Finland | Tel. +358 9 686180 | echa.europa.eu
304
Product name Respondol ATF 3-6%
H410 - Very toxic to aquatic life with long-lasting effects
-dodecanol (EC No 203-982-0; CAS No 112-53-8): H411 - Toxic to aquatic life with long-lasting effects
Sodium laureth sulphate (EC No 500-234-8; CAS No 68891-38-3): H412 - Harmful to aquatic life with long-lasting effects
GreenScreen® level Level bronze[1]. Level Bronze Screening Requirements are[2]
1. Each intentionally added chemical compound present above 0% by weight (>0 ppm) and each impurity present at or above 0.01% by weight (100 ppm) in the product is screened with GreenScreen® List Translator™.
2. Each screened chemical compound in the Product Inventory has a GreenScreen® List Translator TM score of LT-P1, LT-UNK, and/or NoGSLT. No LT-1 scores are permitted in certified products.
3. Product-level acute aquatic toxicity testing results in LC50 and/or EC50 values >10 mg/l for each of the following groups of organisms: fish, aquatic and invertebrates, and algae.
Conclusion on risks As the substances are not classified with CMR properties and do not meet the PBT/vPvB criteria, the overall risks are considered to be likely lower than the risks of PFAS-based products. Some constituents are classified toxic or very toxic to aquatic life, for one constituent with long-lasting effects.
References: [1] https://www.greenscreenchemicals.org/certified/products [2] https://www.greenscreenchemicals.org/images/ee_images/uploads/resources/GSCFirefightingFoamStandardV1.0_FINAL.pdf?cachebuster:38
Table E.11. Assessment of Re-Healing Foam RF3x6 ATC, from (Wood et al., 2020)
Product name Re-Healing Foam RF3x6 ATC
Manufacturer Solberg
Chemical group Hydrocarbons and detergents
Chemical composition Substances listed in safety data sheet:
2-(2-butoxyethoxy)ethanol
starch
sucrose
1-propanaminium, N-(3-aminopropyl)-2-hydroxy-N,N-dimethyl-3-sulfo-, N-coco acylderivs., hydroxides, innersalts

P.O. Box 400, FI-00121 Helsinki, Finland | Tel. +358 9 686180 | echa.europa.eu
305
Product name Re-Healing Foam RF3x6 ATC
Proposed PFAS foam substitution (as specified by manufacturer)
Replacing traditional AFFF and FFFP foam concentrates as well as fluoroprotein foams
Technical feasibility
Applications areas (as specified in technical specification)
Class B hydrocarbon fuels at 3% and polar solvent fuels at 6%
Class A fuels
Equipment Aspirating or non-aspirating devices
Compliance with international performance standards
EN 1568 Part 3 and 4; levels not indicated
ICAO Levels B and C (see Appendix 5)
Examples of use experience and performance compared to PFAS-containing foams
Airport Fire Service, both airport rescue firefighting and training.
Examples: Used at Copenhagen Airport. Fulfilling the need of an alcohol resistant foam. Also used by the Melbourne Metropolitan Fire Brigade (MFB) on class B fires; Based on MFB’s experience, Solberg RF3x6 foam concentrate performs just as well as the previously used fluorinated AFFF concentrate (IPEN 2019).
Critical uses/applications where product do not meet (fully or partially) the required performance standard and why
None identified within aviation.
Several stakeholders indicate that the performance standards required by the ICAO were developed for PFAS-based foams, are outdated and/or are not covering the multiple applications within the aviation sector. For this reason(s), several airports conducted internal testing schemes before implementation of PFAS-free foams.
Need for changes in equipment No identified. In the case of Copenhagen Airport, the investment in fire trucks was not strictly conditioned by the foam replacement, but the coincident introduction of new trucks and foam was seen as a cumulative benefit.
Economic feasibility:
Unit price Appr. €5/l
Unit price as compared with PFAS-containing foam for same application
Range from similar to +20%.
Relative volume required to achieve comparable/best possible performance
No difference or differences/larger volumes depending on application. In certain applications, a 6% foam (ICAO Level C) has been found to work better than a 3% mixture (ICAO Level B).
Storage, shelf-life 1.7 to 49 C° (no quality loss after thawing), 20 years
Frequency of foam replacement Depending on application. Commonly, the foam is used continuously for training and system testing as well, thus not requiring replacement.

P.O. Box 400, FI-00121 Helsinki, Finland | Tel. +358 9 686180 | echa.europa.eu
306
Product name Re-Healing Foam RF3x6 ATC
Availability:
Volume manufactured, sold and used in the EU
Produced in Norway and Spain
Production capacity in the EU
No data
Risks:
CMR properties Substances in the product do not meet the CMR criteria
Other potential human health concern
Hazard classification of one constituent: H319 - Causes serious eye irritation.
PBT or vPvB properties According to SDS, due to insufficient data no statement can be made whether the components fulfil the criteria of PBT (vPvB criteria not addressed)
Other environmental risk concern Hazard classification of one constituent:
1-propanaminium, N-(3-aminopropyl)-2-hydroxy-N,N-dimethyl-3-sulfo-, N-coco acylderivs., hydroxides, innersalts (EC No 268-761-3; CAS No 68139-30-0):
H411 - Toxic to aquatic life with long-lasting effects
Conclusion on risks Substances in the product do not meet the CMR criteria. No statement can be made on whether the components fulfil the PBT criteria. One constituent is toxic to aquatic life with long-lasting effects.
Table E.12. Assessment of Re-Healing Foam RF1 1%, from (Wood et al., 2020)
Product name Re-Healing Foam RF1 1%
Manufacturer Solberg
Chemical group Hydrocarbons and detergents
Chemical composition (according to SDS) Substances listed in safety data sheet:
d-glucopyranose, oligomers, decyl octyl glycosides
sodium octyl sulphate

P.O. Box 400, FI-00121 Helsinki, Finland | Tel. +358 9 686180 | echa.europa.eu
307
Product name Re-Healing Foam RF1 1%
sodium decyl sulphate
alpha-sulfo-omega-hydroxy-poly(oxy-1,2-ethanediyl),
C9-11 alkyl ethers, sodium salts
1-propanaminium, N-(3-aminopropyl)-2-hydroxy-N,N-dimethyl-3-sulfo-, N-coco acyl derivs., hydroxides, inner salt
amides, coco, N-[3-(dimethylamino)propyl]
1-propanaminium, 3-amino-N-(carboxymethyl)-N,N-dimethyl-,N-coco acyl derivs., hydroxides, inner salts
amides, coco, N-[3-(dimethylamino)propyl], N-oxides
sucrose
2-(2-butoxyethoxy)ethanolsulfuric acid, mono-C12-14-alkyl esters, compound with triethanolamin
Proposed PFAS foam substitution (as specified by manufacturer)
Replacing traditional AFFF and FFFP foam concentrates as well as fluoroprotein foams
Technical feasibility
Applications areas (as specified in technical specification)
Petrochemicals sector - offshore oil installations and onshore terminals and refineries
Class B hydrocarbon fuels (not intended for polar solvent fuels)
Class A fuels
Compliance with international performance standards
EN 1568 Part 3 (see Appendix 5)
Examples of use experience and performance compared to PFAS-containing foams
Used at offshore facilities in Norway. Partially implemented at onshore facilities as well
Critical uses/applications where product do not meet (fully or partially) the required performance standard and why
According to data sheet, the product is not intended for use on Class B polar solvents fuels.
Diverging opinions among stakeholders: Specific applications related to large storage tanks in the petroleum industry (e.g. terminals and oil refineries) may require PFAS-based foams. However, the use of PFAS-free foams has also been assessed as safe for sub-ground large storage tanks.
One stakeholder noted that testing and qualification of non-PFAS foams and obtaining the necessary defence approvals for use in all vessels / firefighting systems will take many years, and the associated costs will be very high.
Need for changes in equipment The experience with the case from the Norwegian offshore sector (Equinor, case 2) is that at a few facilities, adjustment of equipment was necessary, but usually, the same equipment was used and additional costs for new equipment were not necessary. Furthermore, substitution was done in relation to scheduled

P.O. Box 400, FI-00121 Helsinki, Finland | Tel. +358 9 686180 | echa.europa.eu
308
Product name Re-Healing Foam RF1 1%
maintenance stops, turnarounds or during upgrades, thus not imposing further additional costs to the company.
Economic feasibility:
Unit price Approx. €5.0-5.5/l
Unit price as compared with PFAS-containing foam for same application
Case 2 indicates approx. 30% more expensive than PFAS products
Relative volume required to achieve comparable/best possible performance
Same volumes, no difference to PFAS foams
Storage, shelf-life -10 to 50 C° (no quality loss after thawing), 20 years
Frequency of foam replacement Depending on application. Commonly, the foam is used continuously for training and system testing as well, thus not requiring replacement.
Availability:
Volume manufactured, sold and used in the EU
Available in EU (tonnage not known)
Production capacity in the EU Manufactured in the EU: no data
Sold in the EU: no data
Used in the EU: no data
Risks:
CMR properties Substances in the product do not meet the CMR criteria
Other potential human health concern
Hazard classification of product:
H315 - Causes skin irritation
H318 - Causes serious eye damage.
Hazard classification of some constituents:
H302 - Harmful if swallowed
H314 - Causes severe skin burns and eye damage
PBT of vPvB properties According to SDS, due to insufficient data no statement can be made whether the components fulfil the criteria of PBT and vPvB
Other environmental risk concern Hazard classification of one constituent:
amides, coco, N-[3-(dimethylamino)propyl] ( - ) (EC No 268-771-8;

P.O. Box 400, FI-00121 Helsinki, Finland | Tel. +358 9 686180 | echa.europa.eu
309
Product name Re-Healing Foam RF1 1%
CAS No 68140-01-2):
OH400: Very toxic to aquatic life
Conclusion on risks The constituents of the product do not meet the CMR criteria. Due to insufficient data no statement can be made on whether the constituents fulfil the PBT and vPvB criteria. One constituent is very toxic to aquatic life.
Table E.13. Assessment of Moussol FF 3x6 (F-15), from (Wood et al., 2020)
Product name Moussol FF 3x6 (F-15)
Manufacturer Dr. Sthamer
Chemical group Hydrocarbons and detergents
Chemical composition Substances listed in safety data sheet:
1,2-ethandiol
2-(2-butoxyethoxy)ethanol
triethanolammonium-laurylsulfate
alkylamidobetaine
Proposed PFAS foam substitution (as specified by manufacturer)
Replacing alcohol-resistant AFFF.
Technical feasibility
Applications areas (as specified in technical specification)
Polar (water-miscible) and non-polar hydrocarbons as well
as mixtures of the two (class A and B fires).
Can be used as a low, medium and high expansion foam.
Compliance with international performance standards
DIN EN 1568: Part 3 (Heptane): IIIB/IIID, Part 1: Medium ex. - Part 2: High ex.
ICAO Low expansion foam - Level B
DIN EN 3 21A
(see Appendix 5)
Examples of use experience and performance compared to PFAS-containing foams
Used within aviation, for example in Sweden, by Swedavia, and in the UK at Heathrow Airport.
Swedavia is a state-owned company that owns, operates and develops Sweden’s national basic infrastructure of airports. The product is used at all Swedish airports as well as for all aircraft applications at Heathrow airport including training.
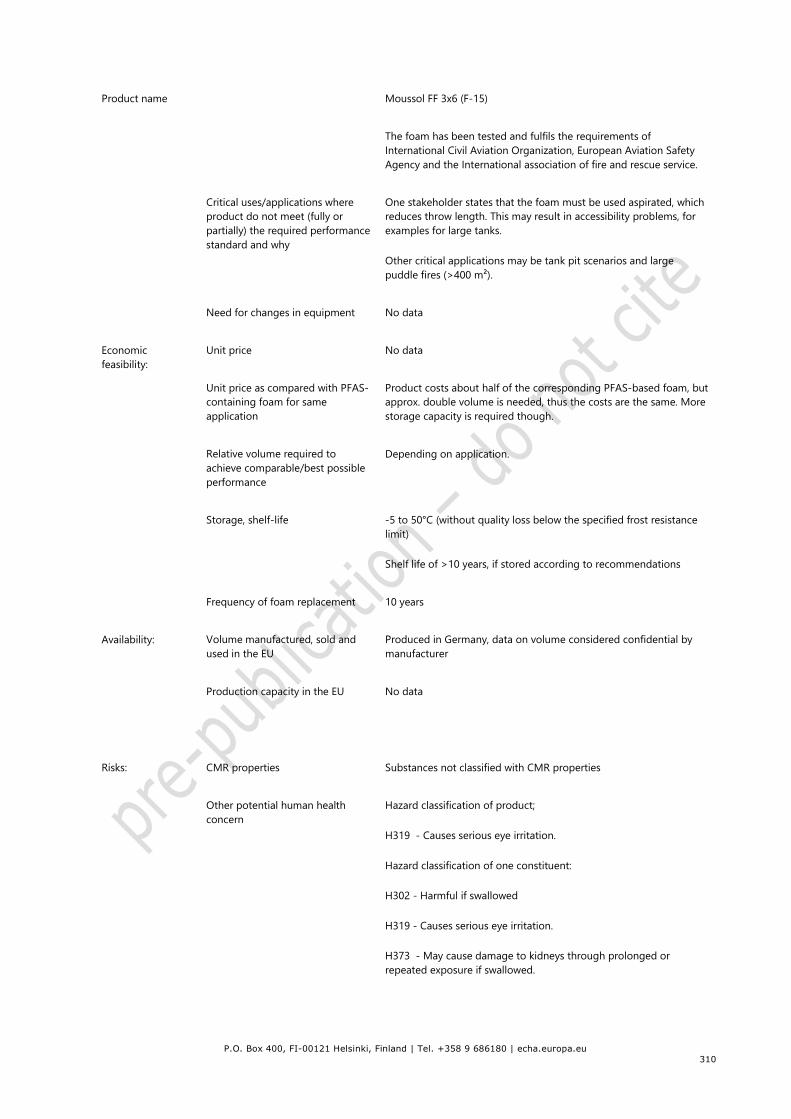
P.O. Box 400, FI-00121 Helsinki, Finland | Tel. +358 9 686180 | echa.europa.eu
310
Product name Moussol FF 3x6 (F-15)
The foam has been tested and fulfils the requirements of International Civil Aviation Organization, European Aviation Safety Agency and the International association of fire and rescue service.
Critical uses/applications where product do not meet (fully or partially) the required performance standard and why
One stakeholder states that the foam must be used aspirated, which reduces throw length. This may result in accessibility problems, for examples for large tanks.
Other critical applications may be tank pit scenarios and large puddle fires (>400 m²).
Need for changes in equipment No data
Economic feasibility:
Unit price No data
Unit price as compared with PFAS-containing foam for same application
Product costs about half of the corresponding PFAS-based foam, but approx. double volume is needed, thus the costs are the same. More storage capacity is required though.
Relative volume required to achieve comparable/best possible performance
Depending on application.
Storage, shelf-life -5 to 50°C (without quality loss below the specified frost resistance limit)
Shelf life of >10 years, if stored according to recommendations
Frequency of foam replacement 10 years
Availability:
Volume manufactured, sold and used in the EU
Produced in Germany, data on volume considered confidential by manufacturer
Production capacity in the EU No data
Risks:
CMR properties Substances not classified with CMR properties
Other potential human health concern
Hazard classification of product;
H319 - Causes serious eye irritation.
Hazard classification of one constituent:
H302 - Harmful if swallowed
H319 - Causes serious eye irritation.
H373 - May cause damage to kidneys through prolonged or repeated exposure if swallowed.

P.O. Box 400, FI-00121 Helsinki, Finland | Tel. +358 9 686180 | echa.europa.eu
311
Product name Moussol FF 3x6 (F-15)
PBT of vPvB properties Substances in the product do not meet the PBT/vPvB criteria
Other environmental risk concern Hazard classification of one constituent:
Triethanolammonium laurylsulfate (EC No 288-134-8; CAS No 85665-45-8):
412: Harmful to aquatic life with long-lasting effects C
Conclusion on risks As the constituents are not classified with CMR properties and do not meet the PBT/vPvB criteria, the overall risks are considered to be likely lower than the risks of PFAS-based products. One constituent is classified harmful to aquatic life with long-lasting effects.
Table E.14. Assessment of FOAMOUSSE® 3% F-15, from (Wood et al., 2020)
Product name FOAMOUSSE® 3% F-15
Manufacturer Dr. Sthamer
Chemical group Protein
Chemical composition Is a low expansion protein foaming agent based on natural
re-growing protein carriers, foam stabilisers and antifreezing compounds.
Substances listed in safety data sheet:
iron-(ii)-sulfate-7-hydrate
ammoniumchloride
Proposed PFAS foam substitution (as specified by manufacturer)
Not specified
Technical feasibility
Applications areas Typically used in non-polar hydrocarbon fires in the petroleum industry and on oil tankers
In particular used in the marine sector. Has the advantage that the product is compatible with black steel and does not require equipment made from stainless steel or plastics (same for other protein-based products). Has been in use for many years and not developed as an alternative to the PFAS-containing foams.
Designed for the use with all mobile and stationary low
expansion foam equipment and systems for fighting fires of class A + B.
Compliance with international performance standards
EN 1568 part 3 (heptane)

P.O. Box 400, FI-00121 Helsinki, Finland | Tel. +358 9 686180 | echa.europa.eu
312
Product name FOAMOUSSE® 3% F-15
Examples of use experience and performance compared to PFAS-containing foams
Mainly used in the marine sector
Critical uses/applications where product do not meet (fully or partially) the required performance standard and why
Only applicable for smaller fires and not applicable for e.g. the aviation sector and other sectors with higher requirements.
Need for changes in equipment No data
Economic feasibility:
Unit price Not specified but the price is indicated as relatively low
Unit price as compared with PFAS-containing foam for same application
Lower
Relative volume required to achieve comparable/best possible performance
No data
Storage, shelf-life A shelf life of >10 years, if stored according to the manufacturer’s recommendations
Frequency of foam replacement No data
Availability:
Volume manufactured, sold and used in the EU
Produced in Germany, data on volume considered confidential by manufacturer
Production capacity in the EU No data
Risks:
CMR properties Substances in the product do not meet the PBT/vPvB criteria
Other potential human health concern
Hazard classification of some constituents:
H302 - Harmful if swallowed
H315 - Causes skin irritation
H319 - Causes serious eye irritation
PBT of vPvB properties Substances do not meet the PBT/vPvB criteria of REACH
Other environmental risk concern None of the constituents have hazard classification for environmental effects
Conclusion on risks As the constituents are not classified with CMR properties and do not meet the PBT/vPvB criteria, the overall risks are considered to be likely lower than the risks of PFAS-based products.

P.O. Box 400, FI-00121 Helsinki, Finland | Tel. +358 9 686180 | echa.europa.eu
313
Product name FOAMOUSSE® 3% F-15
The product is particularly applied in the marine sector, where volumes used for training are discharged directly to the sea. None of the constituents have hazard classification for environmental effects.
Table E.15. Assessment of Ecopol Premium, from (Wood et al., 2020)
Product name Ecopol Premium
Manufacturer BIOex SAS
Chemical group Hydrocarbons and detergents
Chemical composition Substances listed in safety data sheet:
2-(2-butoxyethoxy)ethanol
Ethandiol
Alkyl Sulfate
Sodium octyl sulphate
Proposed PFAS foam substitution (as specified by manufacturer)
Equivalent to AFFF (certified 1A / 1A - EN 1568-3) and burn back resistance equal to fluoroprotein foams
ECOPOL PREMIUM can substitute for FILMOPOL range from same company (other products from the company can substitute for other PFAS-based products)
Technical feasibility
Applications areas (as specified in technical specification)
Industrial fires: landfills, plastics, tyres, etc.
Hydrocarbon fires: fuel, diesel oil, petrol, kerosene, etc.
Polar solvent fires: alcohols, ketones, ethers, etc.
Urban fires: waste bins, furniture, textiles, etc.
Effective at Low, Medium and High Expansion
Compliance with international performance standards
EN 1568 - 1: Conforms
EN 1568 - 2: Conforms
EN 1568 - 3: 1A / 1A (highest level)
EN 1568 - 4: 1A / 1A (highest level)
Oil industry: LASTFIRE
Forest fire standards: CEREN Certificate
Certification in progress : UL 162 / GESIP

P.O. Box 400, FI-00121 Helsinki, Finland | Tel. +358 9 686180 | echa.europa.eu
314
Product name Ecopol Premium
(see Appendix 5)
Examples of use experience and performance compared to PFAS-containing foams
According to producer’s datasheet is used in the oil and chemical industry, pharmaceutical industry, aviation, marine, and fire and rescue service.
Used in industrial uses for tank fire fighting. Further details not available.
Critical uses/applications where product do not meet (fully or partially) the required performance standard and why
Diverging opinions among stakeholders.
One stakeholder notes that the product is not technically feasible for large scale tank fire fighting, high-hazard industry manufacturing, oil tankers fire suppression systems, large spillage of flammable liquids
Need for changes in equipment One stakeholder indicated that re-building of firefighting or fire protection systems would be very costly, but no detailed information is provided.
Economic feasibility:
Unit price 3.5 EUR/l
Unit price as compared with PFAS-containing foam for same application
Approximately the same effective price
Relative volume required to achieve comparable/best possible performance
One stakeholder responds 30 – 50% more volume needed.
Storage, shelf-life -30°C to 60°C, 10 years warranty
Frequency of foam replacement Depending on application. Commonly, the foam is used continuously for training and system testing as well, thus not requiring replacement.
Availability:
Volume manufactured, sold and used in the EU
Production in EU: 700,000 l/year; Sale in EU: 500,000 l/year
Production capacity in the EU No data
Risks:
CMR properties Substances not classified for CMR properties
Other potential human health concern
Hazard classification of one constituent:
H318 - Causes serious eye damage.
PBT of vPvB properties No PBT or vPvB properties identified
Other environmental risk concern None of the constituents are classified with regard the

P.O. Box 400, FI-00121 Helsinki, Finland | Tel. +358 9 686180 | echa.europa.eu
315
Product name Ecopol Premium
environmental hazards.
GreenScreen® level Level Bronze.
Level Bronze Screening Requirements are
1. Each intentionally added chemical compound present above 0% by weight (>0 ppm) and each impurity present at or above 0.01% by weight (100 ppm) in the product is screened with GreenScreen® List Translator™.
2. Each screened chemical compound in the Product Inventory has a GreenScreen® List Translator TM score of LT-P1, LT-UNK, and/or NoGSLT. No LT-1 scores are permitted in certified products.
3. Product-level acute aquatic toxicity testing results in LC50 and/or EC50 values >10 mg/l for each of the following groups of organisms: fish, aquatic and invertebrates, and algae.
Conclusion on risks As the constituents are not classified with CMR properties and it does not meet the PBT/vPvB criteria, the overall risks are considered to be likely lower than the risks of PFAS-based products
Table E.16. Assessment of Orchidex BlueFoam 3x3, from (Wood et al., 2020)
Product name Orchidex BlueFoam 3x3
Manufacturer Orchidee
Chemical group Hydrocarbons and detergents
Chemical composition Substances listed in safety data sheet:
L2-(2-butoxyethoxy)ethanol, diethylene glycol monobutyl ether
ethanediol, ethylene glycol
alcohols, C10-16,ethoxylated, sulfates,ammonium salts
D-glucopyranose oligomeric C10-16-alkyl glycosides
ammonium lauryl sulfate
alcohols, C10-16,ethoxylated
dodecanol -1
Proposed PFAS foam substitution (as specified by supplier)
Products can be seen as 1:1 replacement on Sthamex AFFF and Moussol Products or other AR or usual AFFF products. Appropriate foaming is needed – as for all PFAS-free products - which can usually be realised with the equipment to hand. On systems the nozzles/sprinklers needs changing. Main strength on non-polar liquids.
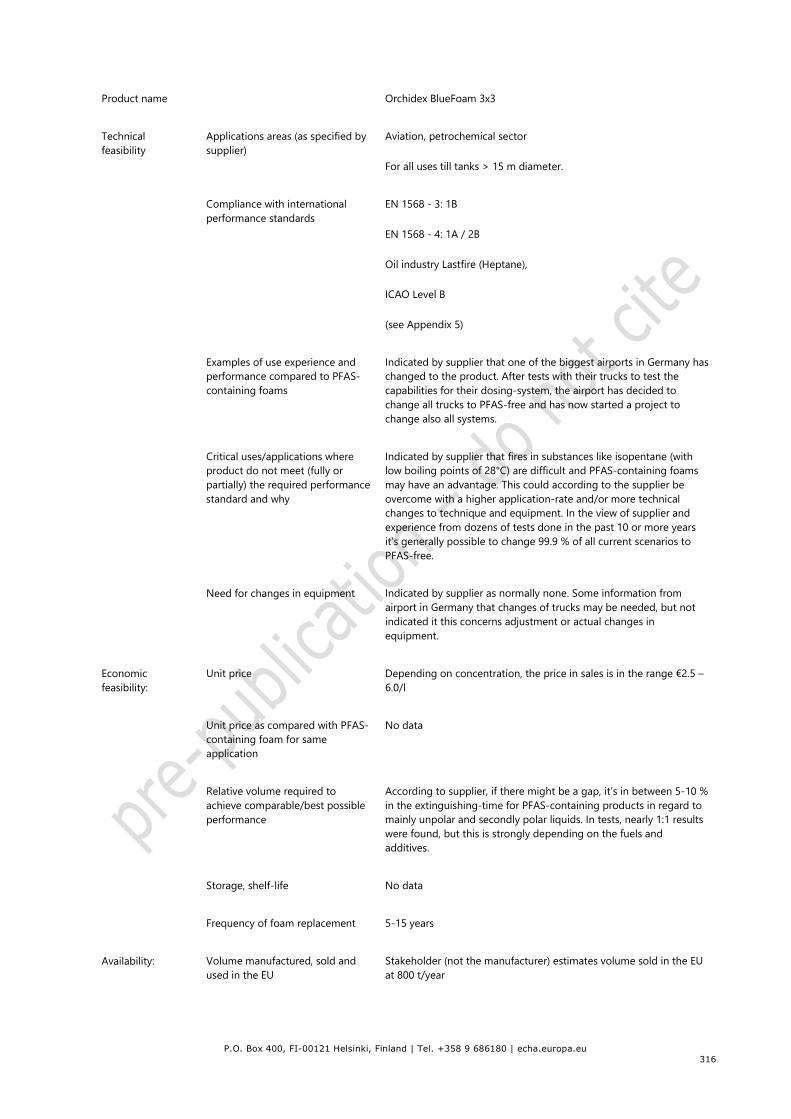
P.O. Box 400, FI-00121 Helsinki, Finland | Tel. +358 9 686180 | echa.europa.eu
316
Product name Orchidex BlueFoam 3x3
Technical feasibility
Applications areas (as specified by supplier)
Aviation, petrochemical sector
For all uses till tanks > 15 m diameter.
Compliance with international performance standards
EN 1568 - 3: 1B
EN 1568 - 4: 1A / 2B
Oil industry Lastfire (Heptane),
ICAO Level B
(see Appendix 5)
Examples of use experience and performance compared to PFAS-containing foams
Indicated by supplier that one of the biggest airports in Germany has changed to the product. After tests with their trucks to test the capabilities for their dosing-system, the airport has decided to change all trucks to PFAS-free and has now started a project to change also all systems.
Critical uses/applications where product do not meet (fully or partially) the required performance standard and why
Indicated by supplier that fires in substances like isopentane (with low boiling points of 28°C) are difficult and PFAS-containing foams may have an advantage. This could according to the supplier be overcome with a higher application-rate and/or more technical changes to technique and equipment. In the view of supplier and experience from dozens of tests done in the past 10 or more years it’s generally possible to change 99.9 % of all current scenarios to PFAS-free.
Need for changes in equipment Indicated by supplier as normally none. Some information from airport in Germany that changes of trucks may be needed, but not indicated it this concerns adjustment or actual changes in equipment.
Economic feasibility:
Unit price Depending on concentration, the price in sales is in the range €2.5 – 6.0/l
Unit price as compared with PFAS-containing foam for same application
No data
Relative volume required to achieve comparable/best possible performance
According to supplier, if there might be a gap, it’s in between 5-10 % in the extinguishing-time for PFAS-containing products in regard to mainly unpolar and secondly polar liquids. In tests, nearly 1:1 results were found, but this is strongly depending on the fuels and additives.
Storage, shelf-life No data
Frequency of foam replacement 5-15 years
Availability: Volume manufactured, sold and used in the EU
Stakeholder (not the manufacturer) estimates volume sold in the EU at 800 t/year

P.O. Box 400, FI-00121 Helsinki, Finland | Tel. +358 9 686180 | echa.europa.eu
317
Product name Orchidex BlueFoam 3x3
Production capacity in the EU No data
Risks:
CMR properties Substances not classified with CMR properties
Other potential human health concern
Hazard classification of several constituents:
H302 - Harmful if swallowed
H318 - Causes serious eye damage H319 - Causes serious eye irritation
H315 - Causes skin irritation
PBT of vPvB properties Product has not been tested according to SDS
Other environmental risk concern Hazard classification of one constituent:
Ammonium lauryl sulfate (EC No 218-793-9; CAS No 2235-54-3):
H412 - Harmful to aquatic life with long-lasting effects.
Conclusion on risks None of the constituents are classified with CMR properties. Due to lack of information it cannot be concluded if the constituents fulfil the PBT and vPvB criteria. One constituent is harmful to aquatic life with long-lasting effects.
Fate of non-fluorinated substances during use
Wood et al. 2020 modelled potential emissions of non-fluorinated alternatives to the environment using different assumptions to those taken in this Annex XV dossier. These are not reproduced here but Table E.17 illustrates values of log Koc values for some non-fluorinated substances which range from 1.8 to 4.5, except for 1,2 ethanediol which has a Koc value of zero. This means that while these substances are soluble, for many of them there is a greater tendency to partition to the sludge phase during wastewater treatment.
In addition to the partitioning coefficient, the other major factor for the WWTP effectiveness is the efficacy of the works itself to irreversibly destroy (i.e. mineralise) specific substances. For the hydrocarbon-based alternatives, wastewater treatment works could be expected to have a high level of efficiency, particularly against substances like 1,2 ethanediol which will readily disassociate. For detergent-based alternatives the efficacy may be less than for hydrocarbons, although overall efficiency is expected to be high (≥70%). By contrast, wastewater treatment efficiency for PFAS substances is expected to be poor with close to zero effectiveness.
Table E.17. log Koc values for non-fluorinated substances included in Wood’s assessment (Wood et al., 2020)
Substance CAS number Log Koc (l/kg) Partitioning

P.O. Box 400, FI-00121 Helsinki, Finland | Tel. +358 9 686180 | echa.europa.eu
318
1,2-ETHANDIOL 107-21-1 0.0 Hydrophilic
Triethanol Ammonium-Laurylsulfate
85665-45-8 1.88 Hydrophilic
sodium decyl sulphate ( - ) 142-87-0 2.09 Mixed
Sodium laureth sulphate 68891-38-3 2.20 Mixed
Alkylamidobetaine 147170-44-3 2.81 Mixed
sulfuric acid, mono-C12-14-alkyl esters, compds. with
triethanolamine ( - )
90583-18-9 3.19 Hydrophobic
1-dodecanol 112-53-8 3.30 Hydrophobic
amides, coco, N-[3-(dimethylamino)propyl] ( -
)
68140-01-2 3.82 Hydrophobic
amides, coco, N-[3-(dimethylamino)propyl], N-
oxides ( - )sucrose ( - )
68155-09-9 3.82 Hydrophobic
1-tetradecanol 112-72-1 4.53 Hydrophobic
E.2.4.1. Human health risks and risk to the environment of selected fluorine-free alternatives firefighting foams
The risks assessment of fluorine-free alternative firefighting foams focuses on the hazard assessment of their components. A detailed risk assessment to human health and the environment has not been undertaken.
The hazards of the identified fluorine-free alternative substances have been assessed based on their PNEC (Predicted No Effect Concentration). As highlighted in ECHA´s guidance document on information requirements and chemical safety assessment (Chapter R.10: Characterisation of dose [concentration]-response for environment)53, the PNEC represents “the concentration of the substance below which adverse effects in the environmental sphere of concern are not expected to occur”.
Mostly, PNEC values are derived from acute and chronic toxicity single-species or multi-species data. To extrapolate from this data, an empirical assessment factor is necessary to make assumptions for the entire ecosystem. In combination with predicted environmental concentration (PEC) values PNECs are used to calculate a risk characterisation ratio. For this the PEC is divided by the PNEC, thus if the PNEC exceeds the PEC, it can be concluded that there is no environmental risk based on the concentration of the observed substance. However, for a comparison with PFAS substances, the sole consideration of a PNEC value is not advisable, based on the uniqueness of PFAS substances. In an ecotoxicological assessment, this uniqueness is for example expressed by the fact that they are not biodegradable. ECHA’s guidance document highlights that the “degradation of organic substances in the environment influences exposure and, hence, it is a key parameter for estimating the risk of long-term adverse effects on biota”54. Thus, in the following not only
53 https://echa.europa.eu/documents/10162/13632/information_requirements_r10_en.pdf
54 https://echa.europa.eu/documents/10162/13632/information_requirements_r7b_en.pdf

P.O. Box 400, FI-00121 Helsinki, Finland | Tel. +358 9 686180 | echa.europa.eu
319
PNECs but also data on biodegradation and bioaccumulation is considered.
The following considerations are not intended as a risk assessment. Rather they are an indicative comparison of the identified substances among each other and against PFASs.
Based on their REACH registration dossiers it was possible to identify most of the PNECs, biodegradation and bioaccumulation data of the fluorine-free alternative substances and the selected fluorinated substances. In the following table an overview of the substances, their respective products, CAS numbers, PNECs, bioconcentration factors (BCFs), and biodegradation assessments are given. PNECs for freshwater and soil were considered.
Table E.18. Overview of substances used in fluorine-free firefighting foams and one substance used in a fluorinated foam. Shown are the product, CAS/EC, PNECs, and the used reference. The respective lowest PNECs are highlighted in bold. (Wood et al., 2020) Substance Product CAS PNEC aqua
(freshwater) mg/L
PNEC soil
(mg/kg soil dw)
Bio-degradation (… biodegradable in water)
Bio-accumulation (BCF)
Reference
1-dodecanol Respondol ATF 3/6
112-53-8
0.001 0.132 Readily 750 ECHA RD
1-tetradecanol Respondol ATF 3/6
112-72-1
0.0063 0.428 Readily 1000* ECHA RD
Sodium laureth sulphate
Respondol ATF 3/6
68891-38-3
0.24 0.0917 Readily waived ECHA RD
Alkylamidobetaine
Moussol FF 3x6
Re-Healing Foam RF1 1%
61789-40-0
0.0032 0.0419 Readily 71* ECHA RD
1,2-ethandiol Moussol FF 3x6
Orchidex BlueFoam 3x4
107-21-1
10 1.53 Readily waived ECHA RD
Triethanolammonium-laurylsulfate
Moussol FF 3x6
85665-45-8
0.017 0.042 Readily waived ECHA RD
sodium decyl sulphate ( - )
Re-Healing Foam RF1 1%
142-87-0
0.095 0.2445 Readily waived ECHA RD
amides, coco, N-[3-(dimethylamino)propyl] ( - )
Re-Healing Foam RF1 1%
68140-01-2
No data
amides, coco, N-[3-(dimethylamino)propyl], N- oxides ( -
Re-Healing Foam RF1 1%
68155-09-9
0.0059 3.68 Readily No data ECHA RD

P.O. Box 400, FI-00121 Helsinki, Finland | Tel. +358 9 686180 | echa.europa.eu
320
Substance Product CAS PNEC aqua
(freshwater) mg/L
PNEC soil
(mg/kg soil dw)
Bio-degradation (… biodegradable in water)
Bio-accumulation (BCF)
Reference
)sucrose ( - )
sulfuric acid, mono-C12-14-alkyl esters, compds. with triethanolamine ( - )
Re-Healing Foam RF1 1%
90583-18-9
0.012 0.083 Readily No data ECHA RD
1-Propanaminium,N-(carboxymethyl)-N,N-dimethyl-3-[[(3,3,4,4,5,5,6,6,7,7,8,8,8-tridecafluorooctyl)sulfonyl]amino]-,inner salt
AFFF 34455-29-3
0.0326 0.00133 Not readily 450 ECHA RD
1-Propanaminium, 3-amino-N-(carboxymethyl)-N,N-dimethyl-N-[[(gamma-omega-perfluoro-C6-C16-alkyl)thio]acetyl] derives., inner salts
AFFF 80475-32-7
0.009 1.17 Not readily No data ECHA RD
Explanatory note: Waived means, that the test was not required due to the results of other tests. “ECHA RD” means ECHA registration dossier. *An asterisk means, that this value was extrapolated based on calculations.
In comparison with the non-fluorinated substances, it is observable that the two fluorinated substances (CAS 34455-29-3 and 80475-32-7) are the only substances that are “not readily biodegradable in water” (data on biodegradation in soil is not available in the registration dossier)55. In addition, the substance with CAS 34455-29-3 also has the lowest PNEC for soil, meaning that, at concentrations higher than 1.33 µg/kg (ppb) a risk cannot be excluded. The combination of this value and with its relatively low PNEC for freshwater (0.0326 mg/l), shows, that this substance exhibits more hazard to the environment than any of the non-fluorinated substances. This finding is also supported by the fact that the treatment at WWTPs is ineffective (as shown in the previous subchapter). In terms of partitioning, the fluorinated substance CAS 34455-29-3 has a log Koc of 1.5, suggesting strong partitioning to treated effluent within WWTPs and release to surface water. Use during live incidents is assumed to be released equally to surface water and soil.
Some of the alternatives have relatively low PNECs but are readily biodegradable. This is true for two alcohols (1-dodecanol and 1-tetradecanol). However, in comparison to the two fluorinated substances, both of the non-fluorinated substances are readily biodegradable. That means that, even if the substance is emitted to the environment in the context of a release from WWTPs or live incidents, it will be biodegraded rapidly. Furthermore, as highlighted in the previous section, based on these properties it could be expected that wastewater treatment plants would have a high level of efficacy for the destruction of these substances.
Taken together, this review of hazards indicates that the two fluorinated substances should be considered of greater hazard compared to the non-fluorinated substances. This is due to
55 https://echa.europa.eu/de/registration-dossier/-/registered-dossier/17549/1

P.O. Box 400, FI-00121 Helsinki, Finland | Tel. +358 9 686180 | echa.europa.eu
321
the PFASs being both non-biodegradable and having relatively low PNECs for water and soil. Some of the alternative substances exhibit low PNECs, however, this needs to be considered in the context of their ready biodegradation.
As regards to the assessed shortlisted fluorine-free firefighting foams, none of the components included in the Safety Data Sheets is classified with CMR properties. For most of the products, the Safety Data Sheets indicate that the products or components do not meet the PBT/vPvB criteria of REACH. For two products, it is reported in the Safety Data Sheet that sufficient data are available for assessing whether the components fulfil the PBT and vPvB criteria. None of the products, however, include substances demonstrated to be PBT or vPvB substances. The classification of the components of assessed alternatives indicates that other classified effects are “Causes skin irritation” (H302), “Causes serious eye irritation” (H319) and “Causes skin irritation” (H315). Many of the products do not include substances classified with environmental effects whereas others include one or more substances classified “Harmful to aquatic life with long-lasting effect” (H412). It should be recognised however that not all human health or environmental hazard endpoints have necessarily been assessed in detail for each component by the foam manufacturers (for example, endocrine disrupting effects).
Table E.19 provides an overview of the hazards of the shortlisted alternatives based on information from the foam Safety Data Sheets (SDS). None of the components included in the Safety Data Sheets is classified with CMR properties. In terms of PBT/vPvB properties, whilst none of the alternatives include substances demonstrated to be PBT or vPvB substances, for two products insufficient data are available and tests had not been concluded for a third.
Table E.19. Overview of key hazards of fluorine-free alternatives based on information from SDS. (Wood et al., 2020) CMR Properties PBT or vBvP
Criteria? Other HH concerns indicated in SDS
Other Env concerns indicated in SDS
Respondol ATF 3-6%
No No Skin and serious eye irritation (H315, H319)
None
Re-Healing Foam RF3x6 ATC
No Uncertain (insufficient data on SDS)
Serious eye irritation (H319)
None
Re-Healing Foam RF1 1%
No Uncertain (insufficient data on SDS)
Skin irritation and eye damage (H315, H318)
Aquatic Acute 1 (H400)
Moussol FF 3x6 (F-15)
No No Serious eye irritation (H319); damage to kidneys if swallowed (H373)
Can harm aquatic fauna, can harm bacteria population in WWT plants
FOAMOUSSE® 3% F-15
No No Harmful if swallowed (H302), skin irritation and serious eye irritation (H315, H319)
None
Ecopol Premium
No No Serious eye damage (H318)
None
Orchidex BlueFoam 3x3
No Not tested Harmful if swallowed (H302) and serious eye irritation (H319)
Harmful to aquatic life with long lasting effects (H412).
One stakeholder mentioned the consequence to marine life and firefighters of an important fire which took place in 2018 in Footscray, Australia where fluorine-free firefighting foam was used (Willson Consulting, 2021a). However, the role of the firefighting foam itself on the reported effects is unclear. The fire waters are usually a complex mixture of the flammable liquid itself which can be highly hazardous, the soot, water, dirt and the firefighting foam.
It is important to underline that, as indicated in a report from the Queensland Government in Australia (State of Queensland, 2016), all firefighting foams (whether PFAS-based or fluorine-free) can have adverse environmental impacts. There is no foam that is completely

P.O. Box 400, FI-00121 Helsinki, Finland | Tel. +358 9 686180 | echa.europa.eu
322
environmentally benign, and each foam product should be assessed for its human health and environmental hazard and risk. The primary environmental impact concerns for any foam, including fluorine-free foams, are their high biological oxygen demand (BOD) when released to bodies of water and groundwater and their short-term acute toxicity, primarily due to the synthetic detergents and solvents in their composition.
In the US, the Clean Production Action organisation developed hazard assessment standards for firefighting foams under the GreenScreen® methodology56 and several foam products assessed have been attributed bronze and silver level scores57.
In terms of magnitude of the emission of non-fluorinated surfactants used in firefighting foams in comparison to PFAS surfactants, the following can be noted:
Firstly, the PFAS-based surfactants are effective at low concentrations within the firefighting concentrate (≤3% w/w based on data from the stakeholder engagement), while the hydrocarbon/detergent alternatives are potentially less effective, meaning greater concentrations are needed within the concentrate product (aggregate of all substances within a given product equates to 10-20% w/w). Secondly, for the non-fluorinated alternatives a combination of substances is needed together to be effective.
Based on the market analysis and stakeholder engagement, a small set of substances is used across multiple different manufacturers. This means that while the non-fluorinated firefighting foams make up approximately one third of the market, the volumes of alternative surfactants can be greater than their PFAS counterparts because of the greater concentration of these surfactants in the foam concentrate.
E.2.4.2. Technical feasibility of fluorine-free firefighting foams
The technical feasibility of alternatives is based on three elements.
1. Capability to extinguish fires;
2. Fire suppression speed (i.e. is more time needed to be able to extinguish the fire relative to PFAS foams considering that greater volumes of alternative foams may need to be delivered);
3. Adherence with relevant standards.
Several performance quality standards exist for firefighting foams, issued by different bodies, some targeting specific uses, e.g. the European Standard EN 1568, the ICAO standard issued by the International Civil Aviation Organization, the IMO standard issued by the International Maritime Organization, the US Defense Specification (MIL), the NFPA standard issued by the US National Fire Protection Agency (see Appendix 5 for a description of the main standards and section E.2.5 for further details on their application under different sectors of use). When purchasing a foam concentrate, the buyer selects a product which meets the most appropriate standard depending on the sector and type of use. However, it should be noted that several users do not only rely on the attained standards stated by the foam manufacturers for a given product but also run their own performance tests.
Table E.20 provides a summary of the fire safety performance of alternative firefighting foams. Performance is quantified where possible and described qualitatively where not. The assessment focusses on the seven illustrative products identified above but refers to additional evidence were relevant.
56 https://www.greenscreenchemicals.org/certified/fff-standard
57 https://www.greenscreenchemicals.org/certified/products

P.O. Box 400, FI-00121 Helsinki, Finland | Tel. +358 9 686180 | echa.europa.eu
323
Table E.20. Effectiveness of alternatives – summary, from (Wood et al., 2020) Alternative Attained
performance standards
Information from ‘real world’ use
Additional stakeholder information
Respondol ARF 3-6%
Yes: 2
(EN 1568 Parts 3 and 4)
None Identified Can be used for use in ‘all types of flammable liquid fires’.
RE-healing foam RF3X6 ATC
Yes: 4
(EN 1568 Parts 1 and 2, and ICAO Levels B and C))
Yes – Copenhagen Airport & Norwegian Offshore oil sector and Melbourne Fire Brigade.
Has been in used in municipal fire brigade applications – both in training and operational fires.
RE-healing foam RF1-1%
Yes: 1
(EN 1568 Part 3)
Yes – Norwegian Offshore oil sector.
Consultees state this alternative can be used at offshore oil installations and onshore terminals and refinery.
Moussol FF 3X6 (F-15)
Yes: 5
(DIN EN 1568: Part 3 (Heptane): IIIB/IIID, Part 1: Medium ex. - Part 2: High ex.
ICAO Low expansion foam - Level B
DIN EN 3 21A).
Yes –Swedavia, London Heathrow Airport (UK), Norwegian Petrochemical sector.
Has been in use at London Heathrow Airport (UK) since 2012. See case study.
Foam Mousse 3% F-15
Yes (1) (EN 1568 Part 3 heptane)
None identified (but consultation has confirmed this is in use)
Consultees state this alternative is largely used in marine applications and is only used for smaller fires (unsuitable for aviation, for example).
Epocol Premium Yes: 6 and 1 in progress.
EN 1568 - 1: Conform
EN 1568 - 2: Conform
EN 1568 - 3: 1A / 1A
EN 1568 - 4: 1A / 1A
Oil industry: LASTFIRE
Forest fire standards: CEREN Certificate
Certification in progress : UL 162 / GESIP).
None identified (but consultation has confirmed this is in use)
Manufacturer states this alternative can be used in all sectors: airports, marine, defence, chemicals, oil and gas, municipal fire fighters and from fixed mobile and CAFs.
Hydrocarbon fires, all types of flammable polar solvent liquids
Consultees indicated this as a possible substitute for large tank fires, but further testing was necessary.

P.O. Box 400, FI-00121 Helsinki, Finland | Tel. +358 9 686180 | echa.europa.eu
324
Orchidex Blue Foam 3x3
Yes: 4
(EN 1568 Parts 3 and 4, Oil industry: LASTFIRE, ICAO Level B))
Yes – German airport are reported to be using the product.
Consultees indicated potential for additional volumes and/or time to suppress fires may occur for some fuel types, but for others, the performance is the same as for PFAS foams.
E.2.4.3. Specific conditions on use required for alternative firefighting foams to achieve acceptable performance
This section discusses the impacts associated with the specific conditions of use required for alternative firefighting foams and includes: (a) the quantity of alternative foams needed to achieve either comparable performance or performance that is acceptable from the standpoint of safety to PFAS foams, (b) different specific application methods and equipment used.
a) Quantity of foams needed to achieve comparable/best possible performance
The available evidence does not permit a quantitative estimate for the comparative volumes of fluorine-free foams required, for each application and with each specific foams. However, the consultation allows a range to be specified. The same approach is used for the availability assessment. Based on the available data collected by Wood from stakeholders on the short-listed alternatives, the range specified was between no change in volume and up to a maximum of 100% additional foam required. The above range does not necessarily apply to liquid fuel fires of large atmospheric storage tanks/large scale tank fires for which large scale testing is still needed to confirm performance.
The details collected on specific shortlisted products – which are known to be in use within the EU (based on stakeholder consultation) – are set out below.
Table E.21. Use patterns of alternatives – summary, from (Wood et al., 2020) Alternative Comparative volumes required vs PFAS-containing foam
Respondol ARF 3-6% No specific data has been supplied, despite attempts to obtain this via consultation.
RE-healing foam RF3X6 ATC
Variable depending on application (“drop-in” replacement, with no additional volumes required in offshore oil installations, onshore terminals and refinery).
RE-healing foam RF1-1% No difference to PFAS-based foams (evidence available for some applications only).
Moussol FF 3X6 (F-15) Volumes vary depending on application. From no difference to up to c. double the volume required in some applications.
FOAMMOUSSE 3% F-15 No information available.
Epocol Premium Range depending on application. Whilst stakeholder data is limited and relates to just one consultee, the potential ranges specified were between 30 - 50% greater volumes required. It is not clear whether the latter figure is only in exceptional circumstances.
Orchidex BlueFoam 3x3 Consultation data unclear – potential need for up to 10% additional volumes.
b) Specific application method for the foams or equipment used (if different for alternatives compared to PFAS-based foams)
Several respondents report that for fluorine-free foams to be used in sprinkler applications, special sprinkler nozzles have to be installed, which included “special low expansion nozzles”. For extinguishers, consultees noted that greater expansion is required for fluorine-free foams. Therefore, depending on the extinguisher, pressure may need to be increased and different nozzles required.

P.O. Box 400, FI-00121 Helsinki, Finland | Tel. +358 9 686180 | echa.europa.eu
325
Respondents also referred to challenges associated with temperature tolerance and viscosity of alternative foams although these appeared to have been satisfactorily resolved in several cases (see e.g. the Equinor substitution case in section E.2.6.2). Another noted that, as the chemical nature of the fuel varies, more than one firefighting foam agent may need to be stocked by users so that they may be able to deal with fires of different types on any one site. This was reported to be a reflection of a lower level of “flexibility” in fluorine-free foams. This has logistical, training and safety implications for users. The correct foam agents will need to be stocked, in appropriate locations, with ease of access along with processes and training to ensure users cannot use incorrect foam agents, particularly in fast moving emergency situations.
E.2.4.4. Summary on economic feasibility assessed fluorine-free alternatives firefighting foams
Section E.2.3.1 describes the costs related to the assessed fluorine-free alternatives. Regarding the effective price of alternatives, three interviewed manufacturers of PFAS-based foams and alternatives consider that the effective price is more or less the same and within +/- 20%. In accordance with this, additional recurrent costs for alternatives used in the aviation sector, stakeholders have reported that the effective price of the alternatives (taking efficiency of alternative into account) is effectively the same as the price of the PFAS foams used before the transition. The case from the offshore sector reports extra costs varying between +5% and +30% depending on application with total extra costs slightly below +30% as compared with the PFAS foams used before. This may reflect the more diverse scenarios in the offshore petroleum sector.
When transitioning to fluorine-free alternatives, one-off costs would be incurred by the users. These are described in section E.4.
E.2.4.5. Availability of fluorine-free alternatives firefighting foams
A large number of alternatives is available from at least eight manufacturers. Most of these manufacturers also manufacture PFAS foams and the alternative product range is often designed to match the product range of PFAS foams. As demonstrated with the successful transition in many airports, products from several manufacturers are applicable for replacing the AFFF for the same application. Only limited information on actual production volumes for the individual products has been available from manufacturers because this information is generally considered confidential. The PFAS-free alternatives currently represent around 32% of the market and this share is growing.
Based on interviews with three manufacturers of firefighting foams in Europe, it can be concluded that there is currently overcapacity in Europe e.g. one of the manufacturers indicated they are running at 10-20% of their capacity. One manufacturer indicated that they have also extra capacity for emergency situations. All three manufacturers estimated that the necessary volumes of alternatives could be supplied within a short time (one to a few years). All EU manufacturers are also formulators and the alternative products are formulated from common bulk raw materials for cleaning and washing agents, food products, etc. and not specifically produced for the alternative firefighting foams. The manufacturers indicated that raw materials are available in sufficient quantities. According to the manufacturers and other information from stakeholders, the main challenge in the transition would not be to meet the demand for those alternatives already on the market, but to develop alternatives for application areas where replacement is still challenging.
The supply-demand balance associated with a restriction on PFAS firefighting foams has been assessed. All ROs will require a full or partial transition to alternatives – the difference is the speed at which this will be necessary. RO1 will result in a slower increase in demand of alternatives as PFAS foam stocks are used in training and or incidents (or reach the end of their useful life) and are then replaced with fluorine-free alternatives. The other ROs (especially RO2 and RO3) will result a quicker increase in demand of alternatives as the

P.O. Box 400, FI-00121 Helsinki, Finland | Tel. +358 9 686180 | echa.europa.eu
326
different sectors of use will - at the latest at the end of the corresponding transitional period - dispose of and replace their existing stocks with fluorine-free alternatives and then require replacement stock. Under RO4 and RO5, the transition to fluorine-free alternatives of the Seveso establishments and the defence sector (RO4) is expected to take place gradually over a much longer period.
In addition, and over and above the replacement demand, it can be assumed all ROs will result in an increased demand for testing of fluorine-free alternatives. Again, the increase in demand would take place earlier in RO2 and RO3 given the accelerated transition.
The economic and logistical challenges of managing the transition – avoiding contamination in storage tanks and the requirements for disposal, for example – are discussed elsewhere in the socio-economic analysis. Information on the specific shortlisted substances in the analysis of alternatives is summarised below – quantitative information is limited. These substances are, however, illustrative and a subset of a larger range of alternative foams that are commercially available and currently in use.
Table E.22. Availability of alternatives – summary, from (Wood et al., 2020) Alternative Produced in the EU Currently commercially
available Information on production volumes
Respondol ARF 3-6%
Unknown Yes Not available. Stakeholders have indicated that they would not have a problem meeting increased demand in general terms.
RE-healing foam RF3X6 ATC
Yes Yes As above.
RE-healing foam RF1-1%
Yes Yes As above.
Moussol FF 3X6 (F-15)
Yes Yes As above.
FoamMousse 3% F-15
Yes Yes As above.
Epocol Premium Yes Yes 700 tonnes (production and import), 500 sold in EU.
Orchidex BlueFoam (3x3)
Yes Yes Stakeholder (not manufacturer estimates at c.800 t/yr)
Source: Market assessment, desktop research and stakeholder consultation. Stakeholder consultation has provided limited information on production and use volumes of specific foams but the market assessment indicated current supply is in the region of 7 000 to 9 000 tonnes. Anecdotal information from stakeholder consultation notes that “adequate” supply exists and no consultees noted that they had experienced supply constraints in any application. Further discussions with three suppliers indicated current excess production capacity alongside additional capacity for emergencies (not quantified). The consultees noted no constraints with raw material supply.
Production and sales data on one shortlisted product, Epocol, was provided. This data indicated total production and import capacity of 700 tonnes, with sales of 500 tonnes. Quantitative information was provided on a small number of other specific products. These are not listed above but were stated by consultees as appropriate for use in several applications, including municipal firefighting, storage facilities and marine applications. For these, total volumes produced and imported into the EU totalled a further 550 tonnes, with sales of 380 tonnes. Qualitative information on the availability alternatives was provided via

P.O. Box 400, FI-00121 Helsinki, Finland | Tel. +358 9 686180 | echa.europa.eu
327
stakeholder consultation on a wider range of products. A total of 22 were stated as being produced in the EU and all of these were commercially available (either in the EU, globally or both). Note that the substance identification and market assessment identified a larger number of products – in the order of 160 - but more detailed information on only a subset of these was obtained via the consultation and the assessment has focused on products for which stakeholders have indicated actual use is taking place.
Stakeholders indicated that spare foam production capacity exists and that users had not experienced a shortfall in supply. Since under all ROs the transition to alternatives will be gradual, no shortage of fluorine-free alternatives is expected.
Overall, the available evidence clearly indicates a range of alternative foams are currently available on a commercial basis. Moreover, data obtained from stakeholder consultation suggests that in purely quantitative terms existing production capacities can accommodate some increase in demand. It has not been possible, despite further consultation attempts, to obtain quantitative information on the supply of specific products used in all applications, so whilst it is possible that a shortfall may arise for a specific market segment, the available evidence does not suggest this would be likely.
As the largest single use, and with comparatively low current fluorine-free sales volumes, the risks of supply constraints may be greater in the oil, chemicals and petrochemical sectors (because this is the sector with greatest use). However, the longer transitional period for this sector (Seveso establishments) should eliminate the risk of fluorine-free alternative supply shortages.
Whilst there would be costs associated with increasing supply, the market assessment and economic feasibility sections noted above indicated that, on average, the costs for fluorine-free foam, on a unit basis, are comparable to those for PFAS based foams. It appears reasonable that manufacturers could continue to increase supply without significant costs having to be passed to downstream users. The range of suppliers and the number of fluorine-free products that currently exist on the market would also serve to limit scope for significant price increases.
E.2.5. Technical feasibility of alternatives for specific sectors of use
This section describes in more detail the specificities of the main sectors of use of firefighting foams and the suitability of fluorine-free alternatives.
E.2.5.1. Aviation
Alternatives have successfully replaced the PFAS-containing foams in a number of airports. Based on the 2019 stakeholder consultation undertaken by Wood (Wood et al., 2020), three different products from three manufacturers have been reported to have replaced applications of AFFF in airports in Denmark (Copenhagen, Re-healing foam RF3x6 ATC), Germany ("one of the biggest airports", Orchidex BlueFoam 3x3, Sweden (Arlanda and other airports, Moussol 3/6-FF), and the UK (London Heathrow, Moussol FF 3x6). The alternatives are used for all applications. According to the IPEN report "Fluorine-free firefighting foams (3F) viable alternatives to fluorinated aqueous film-forming foams", all of the 27 major Australian hub airports have transitioned to fluorine-free firefighting (F3) foams, as have the following major hub airports: Dubai, Dortmund, Stuttgart, London Heathrow, Manchester, Copenhagen and Auckland (IPEN, 2018). Schiphol airport in the Netherlands completed a transition to fluorine-free alternatives at the end of 2020 in less than three years (Bruinstroop, 2021).
A case study from Copenhagen Airport demonstrates that some testing, modification of equipment and training is typically required during transition. The entire transition period was 6 years. Investment in new fire trucks took place at the same time, but this was not directly required due to the foam replacement.

P.O. Box 400, FI-00121 Helsinki, Finland | Tel. +358 9 686180 | echa.europa.eu
328
Some airports voiced concerns on the effectiveness of fluorine-free foams and the necessary changes of equipment. However, the same certification tests apply for all airports in Europe and the successful transition in several airports, including some of the largest, indicates that it should be possible for others. Some alternatives comply with the highest ratings of N 1568,1A/1A for both Part 3 and 4. One stakeholder claims that high ambient temperatures can influence the performance of fluorine-free foams, referring to a fire incident in Dubai where the full extinguishment with a fluorine-free foam took as long as 16 hours (Willson consulting, 2020). However, as mentioned above all 27 major Australian hub airports have transitioned to fluorine-free firefighting (F3) foam indicating that PFAS-free foams are considered to be applicable at high ambient temperatures.
The same stakeholder argues that the International Civil Aviation Organisation (ICAO) Level B and C fire tests, under which most European airports are mandated, were weakened in 2014, by extending fire test extinguishment time from previously 60 seconds to 120 seconds. According to this stakeholder, this would have allowed lower quality AFFFs and F3s to pass, which may have compromised passenger safety within the EU, particularly where F3s are in use at some of Europe’s busiest airports like London Heathrow, Schiphol (Amsterdam), Stuttgart, Copenhagen and Paris Charles de Gaulle (Willson Consulting, 2021b). The Dossier Submitter notes that any revisions to ICAO standards are assumed to ensure the continued safety of passengers.
The US Federal Aviation Administration issued a note in 2021 (FAA, 2021) indicating that their interim research on fluorine-free alternatives “identified safety concerns with candidate fluorine-free products that must be fully evaluated, mitigated, and/or improved before FAA can adopt an alternative foam that adequately protects the flying public. The safety concerns FAA has documented include:
- Notable increase in extinguishment time; - Issues with fire reigniting (failure to maintain fire suppression); and - Possible incompatibility with other firefighting agents, existing firefighting equipment,
and aircraft rescue training and firefighting strategy that exists today at Part 139 air carrier airports.”
In contrast, one stakeholder (a supplier of AFFF and alternatives) with experience in transition in a German airport states that that experience from a large number of tests done in the past 10 or so years indicates it is possible to change 99.9% of all current scenarios to PFAS-free products.
From the above, it appears that not all fluorine-free firefighting foams would be suitable alternatives to PFAS-based foams for use in aviation. However, the fact that a large number of major airports in the EU, UK, Australia and Dubai have transitioned to fluorine-free alternatives several years ago already indicates that some alternatives have been considered suitable for use in civil aviation.
E.2.5.2. Off-shore oil extraction
A stakeholder voiced concern about the applicability of fluorine-free foams in off-shore oil extraction, including in low winter temperatures (Oil Technics, 2021). However, Equinor, the largest oil extraction operator on the Norwegian continental shelf, has successfully replaced AFFF in about 40 offshore installations and five onshore facilities within 8 years. At a few facilities, adjustment of equipment was necessary, but usually the same equipment was used and new equipment was not necessary.
At one installation, the pumps were not compatible with the alternative. The company had some challenges with the density and viscosity of the alternative foams initially used compared to the traditionally used AFFF, e.g. by lower ambient temperatures. This was solved by modifications of the alternative product. The shift took approximately eight years from the

P.O. Box 400, FI-00121 Helsinki, Finland | Tel. +358 9 686180 | echa.europa.eu
329
first tests to when the modified alternative was introduced on all installations (Wood et al., 2020).
E.2.5.3. Municipal fire services
PFAS-free alternatives are readily available for this sector.
According to the stakeholder surveys, a large part of municipal fire brigades have already transitioned to fluorine-free alternatives and no particular issue is expected for a full transition. Based on sales figures from Eurofeu (see section A), 44% of fluorine-free foams are sold to municipal fire brigades (as opposed to 13% of PFAS-based foams).
According to Eurofeu (Eurofeu, 2020b), municipal fire brigades (i.e. local authority fire and rescue services) do not necessarily need fluorine‐containing firefighting foams as they mostly deal with either Class A fires or spill fires of Class B fuels. The typical fire scenarios for municipal fire brigades include road traffic collisions, house fires, bush fires, burning bins, etc.). Incidents are generally limited in size, involve a variety of fuels and are frequent. In some areas in Europe, so‐called Regional Fire Brigades are responsible for any fire hazard including also industrial fires such as in oil and gas industry. Those fire brigades today typically hold one agent on stock, which is capable to deal with all fire scenarios the fire brigade might face58, with the method of attack and application rate adjusted for each pre‐identified risk scenario.
According to Eurofeu, a transition to fully fluorine-free foam agents for municipal fire risks would require an assessment of the compatibility of existing hardware (pumps, proportioners, trucks, etc.) with the fluorine free foam concentrate. In addition, the application of fluorine free agents may require a more in-depth training. Nevertheless, as far as the foam agents themselves are concerned, there are no technical obstacles for an immediate transition.
E.2.5.4. Ready for use agents
Ready for use applications include ready for use firefighting agents which are predominantly used in handheld portable extinguishers but also, to a much lower extent, as pre-fill of so-called “wet systems” (firefighting systems where the pipework from the extinguishing agent feed stock to the actual applicator is pre-filled with an extinguishant). According to Eurofeu, ready for use agent can be used in fixed firefighting systems but this application is extremely rare compared to the use of these agents in mobile applications such as e.g. hand-held portable extinguishers (Eurofeu, 2021d).
According to the EN3-7 standard, a portable fire extinguisher is defined as a fire extinguisher which is designed to be carried and operated by hand and which in working order has a mass of not more than 20 kg. The different types of portable extinguishers for class B fires are available on the market, based either on foam or other fire-suppressing agents such as water mist, powder or carbon dioxide59.
(Wood et al., 2020) indicated that ready for use applications have a high substitution potential as extinguishers are rarely required to deal with large flammable liquid fires or use high performance foams. However, this conclusion has been partly challenged by some stakeholders, as described below.
58 including different types of fire classes, i.e. the use of PFAS foam might not be limited to Class B fires in these fire brigades.
59 See description of fire extinguisher types e.g. at https://www.firesafe.org.uk/portable-fire-extinguisher-general/ ; https://www.extinguisheradvice.org.uk/types-of-fire-extinguisher.php

P.O. Box 400, FI-00121 Helsinki, Finland | Tel. +358 9 686180 | echa.europa.eu
330
In their comments on the PFHxA restriction proposal, Eurofeu indicated that no universal solution to PFAS-based fire extinguishers is available yet and that a transitional period of less than five years would be insufficient for developing suitable alternatives (Eurofeu, 2020a).
Eurofeu had previously described in more detail how portable fire extinguishers are used and the challenges linked to the transition to fluorine-free alternatives, some elements are summarised below (Eurofeu, 2019a):
A fire extinguisher can be used by any person, even untrained, and accordingly the efficiency of the product is maximised, so as to give the best chance to stop the fire. To maximize the chances to successfully extinguish a starting fire with the small and finite quantity of extinguishing agent contained in a fire extinguisher, the firefighting efficiency per litre of the PFAS based agent contained in fire extinguishers is significantly greater (4 to 5 times) in comparison to the firefighting efficiency of the foams used by fire brigades and fixed firefighting installations (EN 3-7 vs EN 1568 performances).
Compared to fire extinguishers using powder, the ease of use (and accordingly the chances of successfully extinguishing a starting fire) of a water-based fire extinguisher for untrained persons is clearly higher.
To date, no fully approved fire extinguisher using fluorine free agent is able to achieve the EN3-7 minimum class B fire rating requirement for the 9 liter fire extinguisher. No replacement is currently available for such an extinguisher size.
Fire extinguishers are products designed and manufactured against European technical standards. They are subject to both European and National regulation and approved by various bodies. These approvals (CE, MED, EN3-7 where required) take time from the manufacturers, from the labs and from the approval bodies, with relating costs. The estimated time for EN3-7 approval for one fire extinguisher model (or family of models) is between 1 to 4 years, depending on the charge and the capacity of the labs/approval bodies.
Eurofeu further clarified that beyond the fact that a 5-year transition period would be necessary to achieve the expected minimum performance levels on the various types of fire extinguishers, this time frame would also be necessary for the fire extinguisher manufacturers to be able to supply the required quantities across the whole market. Indeed, the European industrial fire extinguisher manufacturing capacity is organised according to the regular replacement schedule of fire extinguishers60 and is not in a position to face a punctual increase within a very short-term of fire extinguisher replacement (Eurofeu, 2021e).
In their comments to the SEAC draft opinion on the PFHxA restriction proposal, the UK Fire Industry Association indicated that there are no fluorine-free alternatives which can currently meet the fire performance requirements of EN3 or the long-term storage requirements at elevated temperatures (UK FIA, 2021).
On the same SEAC draft opinion, the Australian Fire Protection Association indicted that the foam in portable fire extinguishers is replaced annually in Australia. Given the relatively inexpensive cost of these extinguishers, they believe industry will simply remove them from service and replace them with specific fluorine-free foam extinguishers (FPA-AUS, 2021).
E.2.5.5. Marine applications
According to Eurofeu (Eurofeu, 2020b), tankers, ferries, tugboats and other commercial vessels represent the majority of the fire risks in this sector. A typical fire scenario includes a minor hydrocarbon or solvent spill on deck, alternatively fire in the engine room or cargo bay.
60 According to Eurofeu, in the EU, the fire extinguishers are typically serviced annually, the foam usually replaced every 3 to 5 years (never each year). The life duration of a fire extinguisher is typically from 5 to 20 years.

P.O. Box 400, FI-00121 Helsinki, Finland | Tel. +358 9 686180 | echa.europa.eu
331
Fixed systems are predominately used in addition to portable units. Changes of the system require off‐time period at port and complete revision/approval of operating permits from approving class. In general MED/IMO61 certified products will be required from class62, which are available today on the market as fluorine‐free alternatives. According to Eurofeu, the challenge will be to verify that alternative product meets the proportioning requirements and other system requirements. There is already an increased interest from end‐users of this segment to change over to fluorine-free alternatives. Still according to Eurofeu, the engineering challenges associated with a transition away from fluorine‐containing foam agents are no more complex compared to other areas of use of fixed installed systems. However, the marine sector is unique in that the vessel with the onboard fire protection system moves daily and down times in harbours are extremely costly. Additionally, a reasonable number of vessels may not even accommodate a change of the system to the degree needed since it is so deeply embedded into the overall structure of the vessel.
Little feedback to the stakeholder surveys was received from users in the civil marine sector. However, a wide range of PFAS-free foams are marketed for civil marine applications and it has not been indicated by stakeholders that there are particular challenges in changing to PFAS-free foams apart from the general need for testing the effectiveness of the alternative foams and the adjustment and testing of the equipment. One of the example products is a low expansion protein-based foam which is typically used in non-polar hydrocarbon fires in the petroleum industry and on oil tankers. It has the advantage that the product is compatible with black steel and does not require equipment made from stainless steel or plastics (and the same is the case for other protein-based products). It is designed for use with all mobile and stationary low expansion foam equipment and systems for fighting fires of classes A and B (see section E.2.2).
In the 2021 stakeholders survey run by the Dossier Submitter, Intertanko (the International Association of Independent Tanker Owners) indicated that a ban on the use of the fluorinated firefighting foams would have economic and operational implications63 until the relevant replacement is completed, however, noting that the ban may improve every company's environmental footprint. Intertanko underlines the need to determine the suitability of the alternative foams on products conducted on ships. According to Intertanko, actual tests and assessments should be conducted and not only relying on certifications based on standards. The new foam type should be in line with the Fire Safety Systems code requirements applicable to the marine sector, adhere to requirements set by the foam system manufacturers as well as the ship’s Flag Administration. Still according to Intertanko, there is also a need for the ISO to review the relevant applicable standards with regards to the equivalent non-fluorinated foam type.
A marine shipment company for gas and chemicals in liquefied and gaseous stated in their reply to the spring 2021 survey that their AFFF foam is stored in canisters of 20 litres and are replaced on 3-year basis, the situation being different with fixed installation, but concluded that a 3-year transition period should be realistic.
Another marine shipment company for natural gas indicated that the transition duration was expected to be about 2 years subject to the availability of fluorine free foams on a worldwide basis.
61 MED: Directive 2014/90/EU on marine equipment; IMO: International Maritime Organization
62 “Class” is a third party approval body assigning an operation permit to a vessel
63 One Intertanko member estimated a cost of USD 40 000 per ship without factoring in the associated logistics costs.

P.O. Box 400, FI-00121 Helsinki, Finland | Tel. +358 9 686180 | echa.europa.eu
332
E.2.5.6. Defence applications
Alternatives are less well established in the defence sector and the situation varies considerably between countries. It has been indicated by some stakeholders that alternatives are feasible, although not many have yet been certified or implemented by users. For certain aspects, the defence applications are similar to those seen in airports and municipal fire brigades and the foams used are, after the necessary testing and adjustment of equipment, considered to be useful for defence applications as well. As an example, the IPEN publication (IPEN, 2018) states that the Danish and Norwegian armed forces have moved to PFAS-free foams. The specific foams used have not been identified, but these are thought to be foams from major producers. As mentioned before, one stakeholder noted that testing and certification of PFAS-free foams and obtaining the necessary defence approvals for use in all vessels / firefighting systems will take many years, and the associated costs will be very high.
However, some specificities apply to the defence sector as the possible presence of flammable liquids, ammunitions, high explosives, pressurized gases and people in proximity, which requires a particularly quick fire control to avoid incident escalation.
A questionnaire from the European Defence Agency sent to their affiliated Ministries of Defence (MoDs) in 2020-21 provided the following high-level conclusions:
The majority of responders are knowledgeable about uses and potential problems related to PFAS-based firefighting foams;
Only a few have transitioned, in some applications, to fluorine-free foams (e.g. transitions in Navy vessels are scarce (only one MoDs reported (not full) transition, and another one reported ongoing tests)64;
Ongoing activities are taking place in several MoDs aiming at transitioning to fluorine-free foams65;
There is very limited feedback on fluorine-free foam performance in real-event accidents/incidents;
Different challenges with transition to fluorine-free foams have been identified by different MoDs66.
In their comment on the SEAC draft opinion on the PFHxA restriction proposal, the German MoD indicated that the firefighting foams that meet civil requirements do not necessarily meet defence requirements and require the highest level of efficiency when extinguishing and preventing reignition. Here, firefighting must be highly efficient and reliable, so that the firefighting personnel can quickly withdraw, especially when firefighting under hostile threats. According to them, a major shortcoming of the currently known PFAS-free firefighting foams is their insufficient effectiveness over a large temperature range, especially under the extreme climatic conditions prevailing in military operations. They also highlighted the particular issue
64 10 MoDs reported no transition with fluorine/PFAS free alternatives in any defence application, six MoDs reported transition to fluorine-free foams (F3) in some applications with different F3 products, one MoD transitioned to F3 already in firefighting rescue vehicles and reported being conducting tests in the Navy (ships).
65 11 MoDs are planning to or currently conducting substitution activities, six are not.
66 Seven MoDs did not report challenges, whereas six did and mentioned the following: lack of information if products contains PFASs or not; lower performances of PFAS-free alternatives; lack of data on long-term storage of the PFAS free alternatives; lack of data on functioning of alternatives under cold temperatures (operating temperature) and performance in high temperatures fires; high viscosity of alternatives compared to the AFFF which is not compatible with existing firefighting rescue vehicles design.

P.O. Box 400, FI-00121 Helsinki, Finland | Tel. +358 9 686180 | echa.europa.eu
333
related to highly complex (weapon) systems, e.g. vessels of the German Navy where the close interlinking with other elements (supply lines, energy supply, data lines) of the system architecture would lead to particularly challenging systems refit (if at all technically and economically feasible) and years of equipment decommissioning. They furthermore pointed the lack of operational capability, putting into question the operability of the German defence to joint operations based on Alliances commitments. On this basis, the German MoD requested that in-service naval vessels should be continued to be allowed to use the currently-approved foaming agents (DE-MoD, 2021).
Another survey initiated by the Dossier Submitter in spring 2021 to which eleven MoDs responded provided the following outcome:
In relation with defence maritime operations, one MoD indicated that the authorisation to participate in the international maritime traffic is based, among other things, on qualified firefighting capabilities, which can currently only be accomplished on defence ships under their special operating conditions with the help of AFFF and that a correspondingly effective fluorine-free substitute fire extinguishing agent that is compatible with the permanently installed fire extinguishing systems is not in sight, despite years of research67. They indicated that the use of fluorine-free foams is not compatible with the design of their ships currently in use and would require major refit which might not be even possible to implement. As an example, they consider that the volume of alternatives foam needed to control a fire can be twice the volume of PFAS foams, which would require an increased storage space and instal a system to pump the increased amount of fire run-off waters out of the ship. The availability of space and the ship weight capacity for integrating new equipment combined with the complexity of warships (having a high density of integrated equipment and hazardous substances) makes the refit extremely difficult. However, they indicated that new ships could be designed to allow the use of fluorine-free foams. Also, they underlined that the firefighting approach in their navy relies also extensively on portable PFAS-foam extinguishers since the fixed systems can be easily damaged during combat. Navies from other countries might use different firefighting systems such as high fog/mist systems (water mist under high pressure) allowing for a transition to fluorine-free foams.
For transitioning in their navy applications, a MoD will prioritise helicopter decks, which are open, then will look for alternatives to be used in engine room, which have to have excellent properties to stick to the floor of a moving ship as well to cover bilge water containing flammable liquid present under the floor of the engine room.
Another MoD reported that at their navy ships, PFAS foams are used only in real event incidents. For training/exercise at navy ships, fluorine-free foams are used. Hence, navy ships can be equipped with both PFAS foams as well as fluorine-free foams (for training). Moreover, fixed firefighting systems in buildings/hangars use mainly fluorine-free foams as well as all training activities.
A MoD highlighted that the mobilisation of men in combat is sometimes not suitable with a long period of fire extinction. According to them, the separation film between the oxidizer and the fuel is less reliable with fluorine-free foam, which can be problematic, requiring constant monitoring until complete cooling. They also reported that fires involving aircrafts on the ground are handled differently than in civil aviation, often requiring firefighters to enter the fuel spill covered with foam. The film-forming capability is therefore key in avoiding a fuel re-ignition when the fuel spill is entered, which could only be met with AFFF (risk of physical breaking of the foam layer in case fluorine-free foam is used).
67 Also indicating that eight alternatives described in Wood et al. (2020) have been tested but that none of them were able to meet the ICAO B and C standards.

P.O. Box 400, FI-00121 Helsinki, Finland | Tel. +358 9 686180 | echa.europa.eu
334
Another MoD indicated their recent transition to fluorine-free foams for oil wharfs and a planned transition for aerodrome hangar when PFAS foams reach end of life.
According to a MoD, their Airforce and Army should be able to transition more quickly than their Navy but less quickly than civil airport. Compared to civil aviation, their Airforce has stricter standards for fire extinguishing time due to the presence of ammunitions and explosives.
Another MoD indicated that they intend to switch to fluorine-free foams by end of 2023, considering therefore that these alternatives are suitable for their purposes.
To support their transition to fluorine-free alternatives, the Swedish Defence (the Swedish Armed Forces, the Swedish Defence Materiel Administration and the Swedish Fortifications Agency) set up a five-years research project in 2020 with the Research Institute of Sweden (RISE) called Testbed PFAS to test alternative PFAS-free fire extinguishing agents and methods68.
From their part, the Norwegian defence has already initiated its transition to fluorine-free foams (NO-MoD, 2021):
The Defence Material Agency has recently sent a letter to the Norwegian Navy asking them to fully transition to PFAS-free foams within the next 2-3 years. The agency chose the low-viscosity fluorine-free foam (mixable with sea water) which has been successfully implemented by the State-owned oil extraction company Equinor in their off-shore platforms. The agency relies on the EN standard that the foam meets and on the several tests performed by Equinor years ago. They do not expect any issues with the transition, which has already been initiated by the Navy.
The Norwegian navy essentially uses diesel and their helicopters a similar fuel, for which the fluorine-free foam performs well. According to the agency gasoline and alcohol-containing fuels are tricker to tackle and another type of foam or additional foam quantities might be needed. However, this is not a concern for the Norwegian navy since they do not have these liquids in large quantities on board. Minimal adaptation of the installed systems is therefore expected: essentially the cleaning of the firefighting equipment and the use of foam canons for helicopter decks (for a quick coverage of the flammable liquid spill). Still according to the agency, the fluorine-free foams stick more to the walls, which can be an advantage compared to AFFF for engine room fires (the foam doesn’t glide so much in the room when the boat is moving). Overall, no major equipment adaptations nor significant loss of performance such as speed of fire suppression is expected for the transition to fluorine-free foams in the Norwegian navy.
From their part, the Norwegian Air forces have transitioned already to fluorine-free alternatives in 2012-2014. Minor adjustments of the fire trucks were needed: cleaning with hot water, change of foam pumps and ejection systems. Other types of fluorine-free foams than the navy are used, more suitable to gasoline and alcohol-containing fuels. For airplane hangars they use high-expansion fluorine-free foams.
It should be noted that in the US, the Fiscal Year 2020 National Defense Authorization Act (NDAA) enacted the phase out of the US Department of Defense’s use of PFAS-containing firefighting foam by October 2024 (with an exception for shipboard use). However, the Secretary of Defense may waive the prohibition for one year (renewable once for another year until 2026) if duly justified, such as the protection of life and safety or because no agent or equipment solutions are available that meet the military specifications. The NDAA also immediately prohibits the uncontrolled release of aqueous film-forming foam (AFFF) in testing
68 See https://www.ri.se/en/what-we-do/projects/testbed-pfas

P.O. Box 400, FI-00121 Helsinki, Finland | Tel. +358 9 686180 | echa.europa.eu
335
and training, but allows emergency use or non-emergency use if completely contained69.
In Australia, the Aircraft Rescue & Firefighting (ARFF) foam transition project is being implemented to transition all Army, Air Force and Broad-spectrum firefighting vehicles to a suitable Fluorine Free Foam (F3) product (DoD-AUS, 2020), see also project description in Appendix 1 “Cleaning protocol by the Australian DoD”). Foam performance check relies on third party certification with a 10-year warranty for operations at 40°C and 95% humidity. In 2021, most fire trucks had been cleaned and set to use fluorine-free foams. The replacement of hand extinguishers has also been mostly completed. Adaptation of the fixed systems (monitors and sprinklers) in new hangars is considered not to cause particular issues but might be for older ones which might require a more extensive refit (AU-DoD, 2021).
In conclusion, it appears from the stakeholders’ information that the acceptance of fluorine-free alternatives as technically suitable alternatives to PFAS-based foams - and therefore their readiness to transition to these alternatives- vary greatly among countries. This is due to the fact that each country has its own specificities in terms of how their military equipment are designed, their approaches to fight a fire and the performance standards they want the foam to meet. Therefore, a direct comparison of the situation between the defence sector in different countries is subject to caution.
The concerns expressed by some MoDs on the lack of performance of fluorine-free foams for a quick and reliable control of a fire in various conditions do not seem to be shared by all countries.
E.2.5.7. Petrochemical processing and large tank farms
Use areas where PFAS-free alternatives have not been fully tested are large scale, is in the downstream petrochemical sector (refineries and steam crackers) and large storage tank facilities. In particular, for large storage tank fires, combatting these fires requires foams capable of flowing on large burning liquid surfaces and sealing against hot metal surfaces to prevent reignition. The development of suitable test criteria for large storage tanks and fluorine-free foams is ongoing under the LASTFIRE project70. Several of the shortlisted products in this report have been tested and reported to be in compliance with the LASTFIRE criteria. According to a presentation by Nigel Ramsden, LASTFIRE, at the stakeholder workshop of September 2019, it has been shown that PFAS-free foams can provide equivalent performance to C6 foams and provide appropriate performance for hydrocarbon fires in a number of test conditions:
When used with NFPA application rates for the following applications:
Tank fires approximately 15m+ diameter (no reason to doubt results can be extrapolated to >25m+):
o Conventional pourer standard application rates;
o Aspirating monitor71; and
o “Non aspirating” monitor with appropriate foam characteristics.
69 https://www.congress.gov/bill/116th-congress/senate-bill/1790/text 70 LASTFIRE (Large Atmospheric Storage Tanks): project initiated by oil and petrochemical industries to study the fire hazards associated with large diameter, open top floating roof tanks. See http://www.lastfire.co.uk
71 Fire fighting monitors are a controllable high-capacity water jet used for manual or automatic fire fighting

P.O. Box 400, FI-00121 Helsinki, Finland | Tel. +358 9 686180 | echa.europa.eu
336
Tank fires approximately 60m+ diameter (No reason to doubt results can be extrapolated to >80m +) or bund fires:
o Foam pourer.
When used at lower rates than NFPA using CAF72 application:
Tank fires approximately 15m+ diameter (no reason to doubt results can be extrapolated to >25m+):
o Monitor application.
Tank fires approximately 80m+ diameter (no reason to doubt results can be extrapolated to >100m +) or bund fires:
o Foam pourer.
It was stated in this presentation from that test results for some conditions are still missing and LASTFIRE is going to work on these issues: specifically, polar solvent tests – foam application from longer distances, other foams/combinations of foam/application methods, tactics for life safety situations and optimising properties.
Additional large-scale tests have been conducted in spring 2021, including on a 50m x 6m pit with “deep” fuel depths of 150mm, using gasoline as test fuel, five fluorine-free foams and six application techniques. These tests showed satisfactory results which were presented at the Lastfire Foam Summit in September 2021. As already demonstrated previously, not only the foam concentrate is important but also the application devices and methods used. As an example, the use of compressed air foam (CAF) systems enhances the performance of the foams (and especially fluorine-free foams), “hybrid monitors” have been shown to improve the performance of two tested foams. For very large tanks (beyond 60m of diameter), the combination of rim surface foam pourers and devices able to project the foam to the centre of the tank surface are expected to allow the quick coverage of the full tank surface by the foam. Additional tests with different conditions are planned to take place in a near future (Ramsden Niall, 2021).
It can be concluded that even in large tanks alternatives can be applied, but the safety margin may currently be lower than for the PFAS-based foams. According to stakeholders, the largest risks are associated with fires in large tanks of crude oil because of the higher risk of boil-over. One stakeholder mentioned that fires in large tanks of ~40m are however very rare in the EU and they could not identify any such fires in Europe in the last 10 years.
A study issued in January 2020 by the Fire Protection Research Foundation (USA) determined the fire extinguishment and burnback times for five fluorine-free foams (FFF) and one short chain C6 Aqueous Film Forming Foam formulation (AFFF) as a function of application rate and foam discharge density for a range of test parameters including foam quality/aspiration, fuel type, water type and fuel temperature. In summary, the authors conclude that PFAS-free foams have come a long way but there is still a lot more to learn about their capabilities and limitations. Furthermore, they conclude: "As of today, FFFs are not a “drop in” replacement for AFFF. However, some can be made to perform effectively as an AFFF alternative with proper testing and design (i.e., with higher application rates/densities)." (FPRF, 2020)
No specific cases with successful 100% transition in installations with large tanks have been identified. According to stakeholders some examples exist where PFAS-free foams are used for the majority of applications but PFAS-based foams are still stored for use in emergency situations with large tank fires. A reported challenge in petrochemical processing and storage tank farms is the presence of tanks with different liquids that may require different
72 CAF: compressed air foam system

P.O. Box 400, FI-00121 Helsinki, Finland | Tel. +358 9 686180 | echa.europa.eu
337
alternatives because one alternative cannot be used for all the liquids. One supplier indicated that in some instances in the petrochemical industry two different alternatives could be required whereas another manufacturer indicated that even more than two may be required if many different liquids are stored.
Most of the foam manufacturers provide PFAS-free training foams that mimic the AFFF and which are used for training. One manufacturer indicated that the PFAS-free training foams were not used in live-fire training ("hot training"). As indicated in the market analysis, PFAS-free alternatives account for 19% of the volume used in the chemical/petrochemical sector, but a major part of this is likely to be for training purposes.
However, the US Fire Protection Research Foundation concludes on their January 2020 study that after a comparative testing of both types of foams: “The AR‐AFFF performed well against all test fuels included in this assessment (IPA73, Heptane, and Gasoline (MILSPEC and E10). The F3s74 did well against heptane but struggled against some of the scenarios conducted with IPA and gasoline (both MILSPEC and E10), especially when the foam was discharged with a lower foam quality/aspiration. The F3s required between 2-4 times both the rates and the densities of the AR‐AFFF to produce similar results against the IPA fires conducted in with the Type II test configuration. During the Type III tests, the F3s required between 3-4 times the extinguishment density75 of the AR‐AFFF for the tests conducted with MILSPEC gasoline and between 6‐7 times the density of the AR‐AFFF for the tests conducted with E10 gasoline. From an application rate perspective, the F3s typically required between 1.5 to 3 times the application rates to produce comparable performance as the baseline AFFF for the range of parameters included in this assessment.” (FPRF, 2020) Referring to this study, Eurofeu indicated (Eurofeu, 2020a) that this has significant implications for users:
Increased storage volume of foam concentrate;
Bund areas in tank farms may need to be retrofitted to cover a significantly higher volume of liquids, associated with an emergency response action;
Significantly increased firewater retention capacity is required, which can cause reasonable difficulties in retrofitting operating sites to the new demand;
Cut‐back on tank storage capacity to leave sufficient space for additional firefighting agent application: Tank owners may have to reduce the maximum stored volume in tanks to leave enough space for containment of an increased amount of firefighting foam;
Studies of the US Naval Research labs clearly indicate that F3 require significantly higher application rates (Naval Research Laboratory, 2019).
Some stakeholders have indicated that PFAS firefighting foams are more “forgiving” than fluorine-free alternatives in terms of application conditions, i.e. PFAS foams remain effective despite some variations with the ideal application parameters (e.g. water/PFAS surfactant proportion, application rate and strength, water quality), which would be less true for fluorine-free foams, considered more sensitive to differences to the ideal use parameters (e.g. (FPRF, 2020), (Eurofeu, 2019b).
According to a chemical company having commented the PFHxA restriction proposal on
73 IPA: Isopropyl Alcohol
74 F3: fluorine-free foam
75 The authors describe the “extinguishment density” as the total amount of foam needed to extinguish a fire of a given size.

P.O. Box 400, FI-00121 Helsinki, Finland | Tel. +358 9 686180 | echa.europa.eu
338
26/06/2020, to their knowledge, there has not been any major Class B fire (e. g. in a tank farm of a processing plant in chemical industry) that was extinguished using PFAS-free foams yet (Unnamed, 2020). They further indicated that there has been a very limited number of larger-scale tests made by LASTFIRE since 2018, so there is not enough evidence on transferability of small-scale test results for Class B fires to large-scale Class B fires. This poses the risk that a given Class B fire cannot be controlled using fluorine-free foam and the tank needs to be burnt down with all socioeconomic consequences including loss of reputation which both need to be prevented. The company raised also the following issues:
- Fixed and semi-fixed extinguishing systems e. g. for tank farms and tank pits might require a general overhaul when switching to fluorine-free foams.
- Fluorine-free foams require significantly higher application rates which cannot easily be achieved in existing installations. This can result in the need to partial or complete exchange of foam extinguishing systems with large capital invest.
- Increased fire knock-down times and application rates will also lead to insufficiently dimensioned firewater retention systems, such as diked areas around tank farms or processing plants configured for AFFF-AR76 use. Diked areas usually cannot be heightened in existing structures due to technical constraints. If constructional changes are possible at all, they usually require disproportionate financial efforts.
- Increased firewater demand might require infrastructural changes throughout chemical sites that cannot be realized due to disproportionate financial efforts.
- If changes need to be made to semi-fixed, fixed and mobile equipment, at least a decade will be needed for planning, budgeting and execution of the resulting projects.
- Processing plants and warehouses pose similar risks as tank farms, as they can contain large quantities of flammable liquids potentially spreading to the plant pit or within the warehouse with surface area > 500 m²
The Dossier Submitter notes that other stakeholders of the same sector did not report the need for such large infrastructure overhaul to transition to fluorine-fee alternatives. However, it is most likely that at least certain equipment adaptations or replacement might be needed for several sites.
E.2.6. Representative case studies where fluorine-free alternatives are already in use in the EU
An important issue in identifying the feasibility of alternatives is the consideration of the process that is involved in adopting the alternative, including systems that need to be changed and considerations such as additional training of users. Substitution examples from companies that are already using alternatives therefore act as a key starting point or proof of principle that a transition is (or is not) possible and the main costs and benefits from real world examples. In order to better understand the options and challenges of replacing PFAS firefighting foams, two cases where such foams have been successfully replaced are described in more detail in the following case study examples.
E.2.6.1. Case 1 Aviation sector - Copenhagen Airport in Denmark77
Foam used
In general, the majority of firefighting foam is used for testing and training at airports. Only
76 AFFF-AR: Alcohol-resistant aqueous film forming foam
77 Case description is based on the following sources: (IPEN, 2018); (IPEN, 2019); (Olsen, 2017); Personal communication with Kim T. Olsen, 2019

P.O. Box 400, FI-00121 Helsinki, Finland | Tel. +358 9 686180 | echa.europa.eu
339
a very small percentage is used operationally for emergency response at live events. At Copenhagen airport, the same fluorine-free foam (Solberg Re-healing foam RF3x6 ATC fluorine-free foam) is used for training and emergency response.
Timeline in the shift from PFAS foams to fluorine-free foams
In 2003, the airport recognised PFASs in the run-off firewater from the airport's training area and its burn pit. This resulted in restrictions on use of PFAS-containing firefighting foams and later, in 2006, all training with PFAS foams stopped;
In 2008, testing with fluorine-free foams was started. Re-Healing foams from Solberg were identified as suitable alternatives; and
In 2009, the airport conducted additional tests required by the ICAO ARRF working group. All tests (ICAO foam test and test according to the US Mil-Spec protocol, including the NFPA 403), were passed by the fluorine-free foam carrying airport crash tenders. The results from the UK CAA/ICAO tests also showed that CAFS (Compressed Air Foam System; application of foam with non-aspirating turret)78 were about 40 % more efficient in fire extinction compared to aspirated foams. CAFS with PFASs and PFAS-free foams were both shown to be efficient. The PFAS-free foam was implemented jointly with three new airport crash tenders (specialised firefighting trucks designed for use in aircraft rescue and firefighting at aerodromes) with CAFS on all low-pressure outlets.
Challenges
Along with the implementation of the new firefighting trucks, the training of the firefighters with the new equipment and foams was a crucial issue and initial testing and training caused additional costs (exact cost estimates are unknown). Also, the different viscosity of the PFAS-free foam caused some initial challenges, which were later solved by the adjustment of equipment; and
Some of the old trucks continued to be in use and, even though the tanks were cleaned thoroughly, a contamination of the PFAS-free foam with PFASs occurred initially.
Costs of replacement
Upon implementation of the new fluorine-free alternative, testing and training required ~5 000 litres foam/year. However, with some modifications to the equipment and training, the volume has now been reduced to 3 000 litres foam/year. Optimal efficiency was found at a 6 % foam concentration (ICAO Level C) instead of 3 % (ICAO Level B), thus larger foam volumes may still be used in certain situations;
Costs incurred in the replacement comprised mainly costs for destruction of PFAS-containing foams and additional training and testing. More specific cost estimates were not available in this case. However, it should be noted that the foam supplier also had an interest in supporting the implementation of the PFAS-free foam and carried out some of the foam testing and covered the additional costs; and
The investment in new airport crash tenders (specialised fire engines designed for use in aircraft rescue and firefighting) was not strictly linked to the foam replacement, but the coincident introduction of new trucks and foam was seen as having a cumulative benefit.
78 The difference between aspirating and non-aspirating equipment is that the aspirating device mixes air in the foam/water solution within the nozzle or foam maker, whereas non-aspirating devices do not. Typical examples of non-aspirating devices are water/fog nozzles, water spray heads and conventional sprinkler heads (Johnson Control - Ansul, 2020).
P.O. Box 400, FI-00121 Helsinki, Finland | Tel. +358 9 686180 | echa.europa.eu
340
Benefits
Copenhagen Airport is still working on the remediation of previous pollution from PFAS foams. In 2014, works on clean-up, containment and reconstruction of the fire training area were started and required an initial investment of more than €15 million. Currently, the maintenance of the drainage system around the fire training ground costs more than €1.5 million per year and this expenditure is expected to continue for at least the next 80 years.
The biggest benefit of switching to a fluorine-free alternative foam is that rainwater and firewater runoff can be discharged though the normal sewer system to the municipality's wastewater treatment, thus avoiding long-term clean-up issues and remediation costs in the future.
E.2.6.2. Case 2 Offshore oil production in Norway79
Foams used
Equinor, representing 80 % of all oil production on the Norwegian Continental Shelf and equivalent to 50 % of total production for the North Sea, have managed to substitute PFAS-containing foams with PFAS-free foams at almost all installations. The substitution is close to completion for ~40 offshore installations and is ongoing for five onshore facilities (terminals and an oil refinery). Firefighting foams at offshore installations are used for multiple applications including training, system testing and emergency response of live events.
At most facilities, Re-healing RF1, 1 % foam from Solberg is used, while some older facilities use Re-healing RF1 3 % foam. For a few installations (where there is risk of methanol fire), alcohol resistant foam was used. The 1 % and 3 % foam products are used for petroleum fires and were chosen because they are regarded as a drop-in replacement for fluorinated AFFF. For methanol fires specifically, Solberg Re-Healing Foam RF3x6 ATC (alcohol resistant foam) is used.
Basically, all foam is used for training and systems testing as emergency responses are seldom (have not occurred since the implementation of the substitution). Environmental discharges may also occur due to accidental spills.
The crude oil and products are stored in caverns i.e. underground storage tanks. The typical size is 50 000 – 280 000 m3 for crude oils and 10 000 – 50 000 m3 for products. The caverns are filled up with fluids to prevent them from catching fire.
Timeline in the shift from PFAS foams to fluorine-free foams
In 2010-2012, development and testing of a 1 % fluorine-free firefighting foam was carried out as a collaborative project between Solberg Scandinavian and Equinor (named Statoil at that time). The driver for the replacement was concern of the environmental consequences of PFAS-containing firefighting foam released to the sea;
In December 2012, the Re-healing RF1, 1 % foam (RF1) was first used successfully on the offshore installation Kvitebjørn;
In 2013, the RF1 foam was technologically approved for use by Statoil after an approval and verification process;
In 2014, approval for starting the multi-use transition project was obtained, with the aim
79 Case description based on the following sources: (IPEN, 2019) and personal communication with Lars Ystanes, Equinor, 2019

P.O. Box 400, FI-00121 Helsinki, Finland | Tel. +358 9 686180 | echa.europa.eu
341
of implementing the new foams at all Norwegian operated installations with 1 % foam systems;
By September 2016, 30 of 31 Equinor assets had successfully implemented use of RF1 foam; and
In 2018, Solberg launched a modified 1 % RF1, with lower viscosity at low temperatures and with a yellow environmental classification (compared to red classification for RF1)80 called RF1-AG. This product went into operational use in 2018 on all new offshore installations.
Challenges
During the substitution implementation, several technical issues occurred which had to be resolved using additional testing by Equinor:
During full-scale testing with RF1, a break-down of the foam proportioner occurred which was initially linked to corrosion related to the use of the RF1 foam. Further investigation identified another reason for the break-down and it was concluded that RF1 had no influence on the foam proportioners;
RF1 has a higher density and viscosity compared to the previously used AFFF. Higher density may be a problem for installations with substandard foam pumps. However, most Equinor installations were able to handle the increased viscosity and density with only minor system adjustments. At one installation, the pumps were not able to handle RF1 and the solution for this installation is still under evaluation; and
Initial uncertainties related to the temperature tolerance of the foam have been removed. The products currently used have a freezing tolerance down to -19°C and acceptable low viscosity at ambient temperature.
Costs of replacement
For Equinor, the total costs of substitution of PFAS-containing foams at about 40 offshore installations and five onshore facilities has been estimated to be approximately €7 million. This estimate does not include costs related to R&D, and regulatory approval costs, which were undertaken in this case by the foam supplier (Solberg). At a few facilities, adjustment of equipment was necessary, but usually, the same equipment was used and new equipment (and associated cots) was not necessary. These total headline costs can be broken down further to include the following:
The cost for support in the multi-use phase has been estimated at 2 500 working hours in the period from August 2013 to September 2016, corresponding to a total cost of approx. NOK 3.5 million (approx. €360 000). This included activities such as planning of implementation together with the supplier, preparation of information letters, support team, follow up on technical issues, etc;
The cost related to replacement of foam in storage ranges from €50 000 to €500 000 for the biggest oil installations, corresponding to tank storages of 20 – 120 m3. In total, approximately 1 100 m3 of foam was replaced over a 3-year period, resulting in a rough
80 Environmental colour marking system in Denmark and Norway of The Harmonised Offshore Chemical Notification Format under the OSPAR Convention 1992 indicating substances that should be considered candidates for substitution. "Red" substances may only be used in limited amounts and shall be substituted.
P.O. Box 400, FI-00121 Helsinki, Finland | Tel. +358 9 686180 | echa.europa.eu
342
cost estimate of 1 100 000 litres * €5 /litre = €5.5 million. Substitution has always been done in relation to scheduled maintenance stops, turnarounds or during establishing new equipment, thus not imposing further additional costs to Equinor. Note that replacement costs listed here are not due to a higher price of alternative, but due to the costs of replacing the PFAS-based foams in storage (costs of alternatives as compared to the PFAS-based foams);
Additionally, the cost related to destruction/incineration of old the PFAS-based foam contributed a further approx. €1 million to the transition costs (approximately 1 000 000 litres * €1 /litre); and
Costs of decontamination of equipment were not significant and no firefighting equipment or storage tanks were replaced as part of the decontamination process. The storage tanks were drained empty to >99 % and the PFAS-based foams handled as waste (destruction/incineration as indicated above). Washing water containing low levels of PFASs was discharged to the sea or wastewater treatment plants. Compared to continuous use of PFASs, it was considered that the small discharges of washing water were insignificant.
Costs of alternatives
The costs of the new foams as compared the PFAS-based foams used before varied between +5 % to +30 %, depending on foam type/application. For the majority of the foams, the costs increased by +30 % and the overall costs increase was slightly below +30 %.
Benefits
At onshore installations, PFAS foams have either been released during operations at the harbour or collected as hazardous wastewater at the process plants. The disposal of hazardous wastewater, consisting of appr. 1% foam and 99% water meant a significant cost item before the substitution. Wastewater containing fluorine-free foams is treated at the biological wastewater treatment plants of the onshore installations;
Before the substitution, PFAS-containing AFFF were always discharged to the sea during training and system test at Equinor’s offshore installations. The use of PFAS-free foams now means a significantly reduced environmental impact. The annual discharge of PFAS-based foams to the sea was reduced from 3-4 tonnes to (almost) zero;
In 2014, Norwegian authorities required standard environmental documentation for all firefighting foam used in high volumes. Since Equinor have been successful in transitioning to PFAS-free foams, there is now a general pressure driving the Norwegian market towards the use of PFAS-free foams; and
Equinor recognise the substitution as a good investment to be in position for future regulatory changes, but they also see value in reducing their chemical footprint and strengthening their market position as substitution leaders.
E.2.7. Summary comparison across sectors of use
E.2.7.1. Technical feasibility of alternative foams
The central finding, based on evidence from the analysis of alternatives, the stakeholder consultation and the workshop is that from a technical standpoint, no stakeholder concluded

P.O. Box 400, FI-00121 Helsinki, Finland | Tel. +358 9 686180 | echa.europa.eu
343
that alternatives are not technically feasible, at least for the majority of uses. However, as indicated above, a transition period is required to adapt and test the alternative firefighting foam with the firefighting equipment and the firefighters to get trained with them. Also, some adaptation of the equipment might be needed. This is particularly true for the oil, petrochemical and chemical sector which can face fire scenarios for which the alternatives have not yet been proven to be fully effective in real large fire incidents.
As regards to the defence sector, a few Ministries of defence also claim that, due to the presence of explosive and ammunitions and the general need to extinguish fires very quickly, additional testing of alternatives is also required to ensure the safety during their operations. However, considering the fact that in the aviation sector where quick extinguishment is also required has already largely transitioned to fluorine-free alternatives, it is considered that the transition in the defence sector should generally be feasible within a similar average time frame. Exceptions might be needed for very specific cases which do not appear to be common across all Member States and for which national defence exemption under Article 2(3) of REACH could be invoked.
In the aviation sector, several airports have successfully transitioned, as have municipal fire brigades and companies active in offshore oil and gas operations and the marine sector. Evidence indicates that one segment - liquid fuel fires of large atmospheric storage tanks – is a concern for consultees. Large scale tests for fluorine-free foams are ongoing and not yet complete, partly because the scale and cost of these tests. In some tests performed by LASTFIRE, PFAS-free foams have provided equivalent performance to C6 foams during hydrocarbon tank fires of 15, 60 and 80m diameter. Performance depends on application rate and equipment, but one stakeholder suggested that there is no real reason why these results cannot be extrapolated to bigger tanks (100m) or bund fires. However, the stakeholders consulted generally agreed that more testing is required for such large fires to prove performance of alternatives under some conditions. To date, no real-world examples of a successful transition in installations with large tanks are identified. Consultation has noted that, as such, PFAS foams are still used when large fuel areas need to be extinguished quickly or in sprinkler systems.
Similar concerns have been raised for sites using different types of flammable liquids. In their comparative tests of PFAS foams and fluorine-free foams, the US Fire Protection Research Foundation indicated that the performance of the fluorine-free foams on certain types of fuels could be inferior to PFAS foams (higher application rates needed) (FPRF, 2020). Therefore, further research and testing in this area is likely needed to ensure an appropriate effectiveness of the use of fluorine-free foams under these specific applications.
In terms of speed of fire suppression and additional volume of foam require one respondent highlighted there could be a 5-10% gap in the extinguishing time, but that this “mainly” concerned polar liquids. Other consultees noted that equivalent volumes were required and these yielded equivalent performances, but this was not consistently reported. Others noted additional volumes of fluorine-free foams, compared to PFAS-based products in at least some applications. Some consultees highlighted that this was a particular concern with small extinguishers. Whilst one respondent noted that, in general, fluorine-free foams are less flexible for users, because they have less margin for error in the proportioning (i.e. volumes required), in their application type and of ease of use. However, other consultees provided feedback of use in specific applications (aviation), including an example of where a fluorine-free foam worked satisfactorily despite deliberate inappropriate application methods as part of testing procedures.
The available evidence suggests that, for most types of use, technically feasible fluorine free foams have been developed, are commercially available and have been used to the satisfaction of users.
However, further testing of the alternatives, the equipment and the application methods are necessary to ensure that challenging fire scenarios such as the ones potentially faced by establishments covered by the Seveso Directive can be addressed safely.
P.O. Box 400, FI-00121 Helsinki, Finland | Tel. +358 9 686180 | echa.europa.eu
344
These transitions implemented so far have not occurred without some technical challenges (and cost) and has required testing in each users’ system. Additional volumes of foam, compared to PFAS-based products, have been necessary, but not uniformly. Several users have identified – and overcome – technical issues. These related to temperature tolerance of alternatives and the viscosity of foams. Some changes to foam delivery systems, nozzles and some additional storage capacity has been required.
E.2.7.2. Economic feasibility and availability of alternative foams
The effective price of fluorine-free foams has been reported to be more or less the same as the PFAS-based foams within +/- 20% (-10% to +25% used in the sensitivity calculations). When transitioning to fluorine-free alternatives, one-off costs would be incurred by the users, these are described in section E.4.
In terms of availability, based on the feedback from manufacturers, no shortage of fluorine-free foams is expected to take place when the market will be transitioning to those. However, regarding the portable fire extinguishers, in addition to the necessity to have time to develop and certify suitable alternatives, sufficient time would also be needed to manufacture and deploy the extinguishers using PFAS-free alternatives since the current EU production would not be able to supply the whole EU market within a very short time.
Table E.23 below provides an overview comparison of the use of fluorine-free alternatives in the main sectors of use:

P.O. Box 400, FI-00121 Helsinki, Finland | Tel. +358 9 686180 | echa.europa.eu
345
Table E.23. comparison of the use of fluorine-free alternatives in key sectors of use – based on (Wood et al., 2020)
Parameter Questions Airports Off-shore facilities
Petrochemical industry and large tank farms
Municipal fire brigades
Marine applications
Defence sector
Technical feasibility
Can alternatives perform the same functions as the PFAS-based foams for same application
Training: Yes
Actual fires: Yes
Training: Yes
Actual fires: Yes
Training: Yes
Large-scale fires: Not demonstrated for high risk situations such as large tanks and fires with different types of flammable liquids
Training: Yes
Actual fires: Yes
Training: Yes
Actual fires: Yes
Training: Yes
Actual fires: Not demonstrated for some specific situations/countries’ requirements
Will it require changes (in processes, equipment, storage facilities, training, etc.)?
Adjustment of equipment, tests, training required. In some instances there may be a need for new equipment and increased storage capacity of foam concentrates and collected firewaters
Availability
Current and
future availability
Timeframe
Is it available in the required tonnage / amount in the EU / worldwide?
Yes Yes Yes for most training
No - further tests of alternatives required for actual emergency situations in large tank farms and some other installations
Yes Yes Yes
How fast could enterprises make the
Meeting market requirements not
Meeting market
No challenge for Meeting market
Meeting market
Depending on the country and the

P.O. Box 400, FI-00121 Helsinki, Finland | Tel. +358 9 686180 | echa.europa.eu
346
switch? What would be the downtime, if any?
considered a challenge as transition is expected to take some years
requirements not considered a challenge as transition is expected to take some years
training foams
Further development required for large tank farms and sites handling different types of flammable liquids
requirements not considered a challenge as transition is expected to take some years
requirements not considered a challenge as transition is expected to take some years
type of application, the transition can take a couple of years till several years.
Risks
Human health Information on the hazards: properties causing the concern for the substance to be restricted / other properties.
None of the constituents of the alternatives meet the CMR criteria. Classification of constituents of alternatives does not point to any significant health concern. This assessment is based on hazard information identified in safety data sheets for relevant products. The safety data sheets include constituents with a hazard classification, and the conclusion that the alternatives do not meet the CMR criteria are considered robust for the foams evaluated in more detail. However, there was insufficient information to conclude whether the underlying test/endpoint data was equivalent for these substances and the alternative products compared to the PFAS-based products
Some constituents are classified with hazard phrases such as harmful if swallowed and causes serious eye irritation and occupational exposure should be reduced by use of adequate protective equipment, but this would likely apply to any firefighting foam.
Information on risks related to properties causing the concern for the substance to be restricted / other properties. Information on other risks related to the alternatives.
PFASs are very persistent with a potential for exposure of humans via the environment. Short‑chain PFASs accumulate in edible parts of plants and the accumulation in food chains is unknown (Brendel et al. 2018). In general, there is a high level of uncertainty as to whether the ongoing exposure to low concentrations of short-chain PFASs may cause adverse effects in organisms. It is therefore very difficult to estimate long‑term adverse effects in organisms.
The constituents of alternatives are in general not persistent, and exposure via the environment is not considered to be of concern based on data currently available. For some alternatives, data are not sufficient to conclude that they do not include persistent constituents.
Risk to the environment
Information on the hazards: properties causing the concern for the substance to be restricted / other
Alternatives do not generally meet the PBT or vPvB criteria. For some of the alternatives, data were not sufficient to determine whether some constituents are persistent. Many of the alternatives include constituents classified as toxic or very toxic to aquatic life.

P.O. Box 400, FI-00121 Helsinki, Finland | Tel. +358 9 686180 | echa.europa.eu
347
properties.
Information on risks related to properties causing the concern for the substance to be restricted / other properties. Information on other risks related to the alternatives.
Short-chain PFASs are very persistent with high mobility in environmental media and high potential for long-range transport.
The constituents of the alternatives are in general not identified as persistent or of having a high potential for long-range transport and for accumulating in the environment. However, there was insufficient information available to conclude whether the underlying test/endpoint data was equivalent for these substances and the alternative products, compared to the PFAS-based products.
Assessment
of net risk
Would the alternative result in a sufficient reduction in the net risk? Are there new risks associated with the alternative?
In general, alternatives do not contain very persistent substances and are considered likely to provide a reduction in the net risk. The main constituents of alternatives are typically used in cleaning and washing agents, food, etc. Overall, no significant new risks have been identified based on the available information. However, not all human health or environmental hazard endpoints have necessarily been assessed in detail for each component by the foam manufacturers (e.g. endocrine disrupting effects). Additionally, the level of information available on the risk posed by some alternatives is insufficient to conclude whether the underlying test/endpoint data was equivalent compared to the PFAS-based products.
Economic feasibility
Net costs
Net compliance and other costs (taking into account both increases and decreases in costs) faced by actors in each link of the supply chain.
One-off costs: The main costs of transition are reported to be costs of technical changes needed to use alternative foams and cleaning of equipment.
Recurrent costs: Extra costs of foams are reported to be in the range of 0 to +30%. For sensitivity calculations the average prices of both PFASs and alternative foams (€3000/tonne) is varied with -10% and +25%.
Economic feasibility of the alternatives.
Alternatives have successfully been implemented by many users
Alternatives have successfully been implemented by some users
Alternatives have successfully been implemented for training purposes; have not proven yet technically feasible for high
Alternatives have successfully been implemented by many users
Alternatives have successfully been implemented by many users
Alternatives have successfully been implemented for training purposes by several users; for specific applications /countries alternatives have not proven yet

P.O. Box 400, FI-00121 Helsinki, Finland | Tel. +358 9 686180 | echa.europa.eu
348
fire risk scenarios
technically feasible
Ability of the different actors to pass costs down the supply chain.
High (no competition with competitors outside the EU)
Medium (some competition with competitors outside the EU)
Medium (some competition with competitors outside the EU)
High (no competition with competitors outside the EU)
Lower (significant competition with competitors outside the EU)
Not applicable
Trade and wider economic and employment effects.
No effect expected No significant effect expected
No significant effect expected
No effect expected
No significant effect expected
Not applicable
Uncertainties. What is the level of uncertainty in the assessment of the feasibility, risks and economic viability of alternatives?
High certainty High certainty Medium certainty - many different and complex scenarios
High certainty High certainty Medium certainty - different situations among countries and applications

P.O. Box 400, FI-00121 Helsinki, Finland | Tel. +358 9 686180 | echa.europa.eu
349
In conclusion, alternatives are generally considered to be technically feasible in most applications. Further testing is required to confirm the technical feasibility of alternatives for specific applications, particularly in the oil and chemical sector with installations with large atmospheric storage tanks and sites using multiple types of flammable liquids. The speed of fire suppression may be slower and application of foams may be less flexible and less easy to use (e.g. different foams may be needed for different flammable liquids), in some cases.
E.3. Response to restriction scenario(s)
See section 2.3 of the Annex XV report.
E.4. Economic impacts
Section 2.3 of the Annex XV report summarises the main effects (i.e. the anticipated responses from the supply chains along with the associated impacts) resulting from the different ROs and it identifies the impacts to be assessed, whilst section 2.4 summarises the main results of the quantitative cost assessment. This section provides a more detailed description of the underlying calculations and results, and further describes the assessment of each cost category covered in the quantitative cost assessment.
E.4.1. Cost calculations
E.4.1.1. Introduction
Estimates are provided for the cost of transitioning to fluorine-free firefighting foams over an assessment period of 30 years. This period is the same as for the estimation of emissions of PFASs to the environment. The results are estimated with and without additional RMMs to promote safe use of PFAS-containing foams during the transition periods.
Five restriction options are considered:
RO1: ban on placing on the market but use allowed until depletion of stocks
RO2: ban on placing on the market, use allowed only during the transitional periods
RO3: same as RO2, but there is a ban on the export of PFAS-containing firefighting foams starting 10 years after entry into force.
RO4: same as RO2 but with progressive decline of oil/chemical and military uses after the end of their transitional period
RO5: uses banned unless releases fully contained and adequately treated after a transitional period
The transition costs comprise the following categories, which are either additional costs (i.e. they have a positive algebraic sign) or cost savings (i.e. they have a negative algebraic sign).
Transition costs or cost savings that are relevant (i.e. different from the baseline scenario and thus different from zero) for all of the five ROs under consideration:
Cleaning of equipment to comply with the concentration limit
Technical changes needed to use alternative foams

P.O. Box 400, FI-00121 Helsinki, Finland | Tel. +358 9 686180 | echa.europa.eu
350
Additional cost of using alternative foams (price difference per litre and volumes needed to achieve the same level of fire protection)
Savings resulting from avoided clean-up of contaminated sites (where relevant)
Costs of additional RMMs (two optional cost categories):
Costs of technical means to contain releases and dispose of PFAS-contaminated water from the fire-water run-off related to testing/training
Costs of technical means to contain releases and dispose of PFAS-contaminated water from the fire-water run-off related to incidents
Additional transition costs or cost savings that are relevant (i.e. different from zero) for ROs 2, 3, 4 and 5, i.e. all ROs except RO1, due to use ban:
Premature disposal (incineration) of foams
Depreciation of stocks
Additional transition costs or cost savings that are relevant (i.e. different from zero) only for RO3 due to exports being affected by the ban:
Changes in producer surplus related to export
Additional transition costs or cost savings that are relevant (i.e. different from zero) only for RO5:
Cost of full containment of the fire-water run-off at Seveso sites after a transitional period
The costs of setting up and running a permit system are not quantified. This cost would be relevant only for RO4. It should be noted that the respective restriction option is not considered practical.
The lengths of transitional periods for the respective sectors are the same as for the estimation of emissions, so these assumptions are corresponding to section 3 of the Annex XV report. Since the transition periods are set to achieve the same level of fire protection as with PFAS-containing foams, results have not been calculated for different transition periods. Where applicable, the cost estimations follow the same structure as implemented for the calculation of emissions.
The main input parameters are described in section 3 of the Annex XV report. In addition, a social discount rate of 4 % as recommended in the Better Regulation guidance was used to calculate the net present value (NPV) of impact incurred over different years of the assessment period. For the purpose of sensitivity analysis this input parameter can be changed in the spreadsheets.
The net present values (NPV) for all cost categories and the sums have been calculated and converted to the corresponding annuity factors. The NPV refers to a baseline year (year zero). The total assessment period covers 30 years, which is twice the shelf-life of both PFAS-containing and PFAS-free foams. This provides that more than 15 years are covered after the last foreseen transition period has ended.
The total assessment period is also the basis for the annuity factor to be calculated by the standard formula:

P.O. Box 400, FI-00121 Helsinki, Finland | Tel. +358 9 686180 | echa.europa.eu
351
𝑎(𝑟, 𝑛) = 𝑟 × (1 + 𝑟)
(1 + 𝑟) − 1
with r being the interest rate (assumed to be 4 % as a default) and n denoting the number of years.
E.4.1.2. Calculation of current situation (baseline scenario)
The cost calculations follow the same approach as implemented for the estimated emissions in terms of the four lifecycle stages identified (formulation of the firefighting foam concentrate, storage, use and waste). There is no market trend assumed, i.e., in the baseline scenario both annual emissions and annual costs remain constant over time. Since the baseline scenario is the reference for the analysis of ROs, costs are equal to zero as long as there are no additional costs or cost savings compared to the baseline scenario.
E.4.1.3. Calculation of RO1 scenario
Foams are no longer available on the EU market after the transition period but uses continue and gradually decline for 15 years (assumed service life of existing foams).
The following describes the approach for the assessment of costs in this RO:
- Cost of using alternative foams (foam replacement costs): The purchase costs (after the end of the respective transition period) are a differential which depends on the reduction of the PFAS-containing foam stock compared to the year before, the price difference per tonne of fluorine-free foam versus PFAS-based foam, and the additional volumes required as a percentage increase over PFAS-based foam (“effective price of alternatives”).
- Early replacement of foams would not occur in RO1 because the use of existing foams is still allowed after the transition period. Thus, depreciation is only applicable in case of expiration, which is the same as in the baseline scenario. Therefore, incineration or disposal costs for unused foam is supposed to be the same as in the baseline scenario.
- During the development and calculation of the ROs, another cost category was considered which constitutes cost savings due to less costly disposal of expired foams. After the end of the transition period cost savings were expected because there is no longer a need for disposal of PFAS foams by incineration, contrary to the baseline scenario (fluorine-free foams are assumed to be disposable by sending to WWTP). However, in the emission calculation it was found that in the "best" estimate (and also in the “low” estimate) emission scenario the model suggests that all stocks are exhausted within 15 years after formulation and there is no expired stock left to be incinerated; quantities of expired stock would only occur in the “high” emission scenario. Since the “best” emission scenario is taken forward as input for all cost scenarios, incineration of expired stocks is not applicable. Thus, the model does not suggest savings incurred in this RO that would be related to less costly disposal compared to the steady state.
- Savings from avoided clean-up: (Wood et al., 2020) state (p. 156): “In the absence of more specific data, for illustration of the potential order of magnitude of savings: Assuming several tens of incidents per year using PFAS-based foams where clean-up is required and could be avoided if fluorine-free foams were used, the savings would be in the order of several millions to several tens of millions of Euros.” Based on this, it is assumed that savings from avoiding clean-up costs gradually increase to €10 million per year (in the “best” scenario) when all PFAS-based foam stocks have expired or been used.

P.O. Box 400, FI-00121 Helsinki, Finland | Tel. +358 9 686180 | echa.europa.eu
352
Therefore, the cost categories that are relevant for RO1, i.e. those that differ from the baseline scenario, are the following:
• Costs for cleaning equipment to comply with the concentration limit • Cost for technical changes needed to alternative foams • Additional cost of using alternative foams • Savings from avoided clean-up • Costs due to additional risk management measures for training/testing • Costs due to additional risk management measures for incidents
E.4.1.4. Calculation of RO2 scenario
Foams are no longer available on the EU market and can no longer be used after the transition period. For this RO, a substantial peak in costs is assumed to take place in the year after the end of the transition period. This refers in particular to the cost of both disposal and depreciation of PFAS-containing foams replaced early and entirely, and the purchase costs of fluorine-free foams. In the following years cost savings are higher than additional costs.
Therefore, the cost categories relevant for RO2, i.e. those that differ from the baseline scenario, comprise the two additional categories of incineration and depreciation compared to RO1:
• Costs for cleaning of equipment to comply with the concentration limit • Cost for technical changes needed to alternative foams • Additional cost of using alternative foams • Savings from avoided clean-up • Costs due to additional risk management measures for training/testing • Costs due to additional risk management measures for incidents • Premature disposal (incineration) of foams • Depreciation of stocks
E.4.1.5. Calculation of RO3 scenario
For RO3, the same conditions as in RO2 apply. In addition, in RO3, exports of PFAS-containing foams to non-EEA countries are proposed to be banned.
For the purpose of assessing the costs related to this RO, the Dossier Submitter assumed that the profit margin of foam manufacturers is 10 % of the sales value, and additional profits for two years following the end of the transition period are counted. This assumption about profits approximates the changes in producer surplus over the entire assessment period of 30 years, see the approach of SEAC (ECHA, 2021b). The time frame is varied with 1 year of profit for the low-cost scenario and 5 years of profits for the high-cost scenario.
Therefore, the cost categories relevant for RO3 comprise all cost categories of RO2 plus one additional category for profits from exports:
• Costs for cleaning of equipment to comply with the concentration limit • Cost for technical changes needed to alternative foams • Additional cost of using alternative foams • Savings from avoided clean-up • Costs due to additional risk management measures for training/testing • Costs due to additional risk management measures for incidents • Premature disposal (incineration) of foams because of the requirement of RO3 for all

P.O. Box 400, FI-00121 Helsinki, Finland | Tel. +358 9 686180 | echa.europa.eu
353
sectors • Depreciation of stocks • Changes in producer surplus related to exports
E.4.1.6. Calculation of RO4 scenario
For RO4, in principle the same conditions as in RO2 apply. For Seveso sites and military uses, however, a permit system would be installed allowing continued use at authorised sites. It is assumed that the use in sectors covered by the permit system will linearly decrease to zero over the following 20 years.
Therefore, the cost categories relevant for RO4 comprise all cost categories of RO2. The derogation system for specific sectors will generate no additional (monetised) cost category but affects the calculation and timing of costs:
• Costs for cleaning of equipment to comply with the concentration limit • Cost for technical changes needed to alternative foams • Additional cost of using alternative foams • Savings from avoided clean-up • Costs due to additional risk management measures for training/testing • Costs due to additional risk management measures for incidents • Premature disposal (incineration) of foams because of the requirement of RO4 for all
sectors • Depreciation of stocks
The cost of setting up and running a permit system has not been estimated as this restriction option was not considered to be practical by the Dossier Submitter.
E.4.1.7. Calculation of RO5 scenario
For RO5, in principle the same conditions as for RO2 apply. For Seveso sites it is assumed in the calculations that the criterion of strict containment and treatment would be met, but not for other sectors81. Therefore, the use is assumed to remain allowed without a limit. Since at the current stage only critical areas are covered by measures for full containment, not the whole site, there will be incremental costs for this sector from implementing measures providing full containment.
Therefore, the cost categories relevant for RO5 comprise all cost categories of RO2 plus one additional cost category applicable to the Seveso sector only for additional RMMs to meet full containment:
• Costs for cleaning of equipment to comply with the concentration limit • Cost for technical changes needed to alternative foams • Additional cost of using alternative foams • Savings from avoided clean-up • Costs due to additional risk management measures for training/testing • Costs due to additional risk management measures for incidents • Premature disposal (incineration) of foams because of the requirement of RO2 for all
sectors • Depreciation of stocks • Costs for the implementation of RMMs to meet full containment across the entire site
(Seveso sector only)
81 In practice, the possibility for full containment is not clear for Seveso sites and therefore the Dossier Submitter does not consider this restriction option practical.

P.O. Box 400, FI-00121 Helsinki, Finland | Tel. +358 9 686180 | echa.europa.eu
354
For the Seveso sector, however, all other cost categories (apart from those related to RMMs during and after the transition periods) become zero under RO5, because they are all determined by the switch from PFAS-based to fluorine-free foams, which would not take place in the Seveso sector.
E.4.1.8. Cost categories included in quantitative terms
Cost categories can represent either one-off costs or annually reoccurring costs that might either stay constant, increase or decrease over the following years. It is assumed that one-off costs in general occur in the year following the end of the transition period.
For the sake of traceability, Table E.24 details the calculations made by the Dossier Submitter, e.g. which costs elements are taken into account for the five ROs and the timing of impact. Below the table, additional information on some of the cost categories is provided. First, cost categories calculated for all RO scenarios are explained, and below that the additional cost category is given for RO3 (export related impacts), the deviating calculations for the Seveso and military sectors in RO4 (linear decline of chemical, petrochemical and military uses), and the additional cost category of RMM implementation to meet full containment in the Seveso sector, as well as the cost categories that do not arise for the Seveso sector in RO5 (continued use for Seveso share of chemical/petrochemical sector). This enables the reader to trace back the calculations more easily and to understand what assumptions were made by the Dossier Submitter in the assessment.

P.O. Box 400, FI-00121 Helsinki, Finland | Tel. +358 9 686180 | echa.europa.eu
355
Table E.24. Categories of costs and cost savings in ROs, parameters used and mode of calculation
Cost Mode of calculation in RO1 scenario
Mode of calculation in ROs 2, 3, 4 and 5 scenarios (apart from exceptions for certain sectors in RO4 and RO5 described at the end of this table)
Comments and explanations
Cleaning of equipment
Cleaning costs per site * number of sites per sector s * (PFAS stock in year i-1 – PFAS stock in year i) / initial PFAS stock
(sector-specific calculation with index s for sector, weighted over years by the share of PFASs replaced in each year)
Cleaning costs per site * number of site per sector s (only once in year 1 after transition period)
(sector-specific calculation with index s for sector)
s = index for sectors categories covered
Cleaning refers to equipment, systems, installations or trucks.
Cost of technical changes
needed
Cost of technical change per site * number of sites per sector (assumed as undertaken only once in year 1 after transition period)
(sector-specific calculation with index s for sector)
Cost of technical change per site * number of sites per sector (assumed as undertaken only once in year 1 after transition period)
(sector-specific calculation with index s for sector)
s = index for sectors categories covered. It is assumed technical changes take all place in year 1 after the transition period.
Number of changes implemented in each sector is assumed as number of sites per sector.
Early disposal of legacy
foams when replaced
Not applicable with the assumptions made / zero (no difference to the baseline)
Incineration costs per tonne of foam * stock (tonnes foam) (only once in year 1 after transition period)
No incineration due to expiration after 15 years assumed, since all foams are used before they expire
Depreciation of stocks to
be disposed of
Not applicable / zero (no difference to the baseline)
Average price €/tonne of PFAS-based foam * stock (tonnes foam) / 2 (only once in year 1 after transition period)
Depreciation in year 1 after transition period amounts to ½ of purchase value; residual value of ½ is assumed in the average of stocks of different ages
Additional costs of
alternative foams due to
price and/or volume
differences
Proportional to stock change in year 1 after transition period, using price differences and additional volumes required
(PFAS stock in year i-1 – PFAS stock in year i) / concentration of PFAS surfactants in foam * (((1 + Additional volumes required % increase over PFAS based foams) * Average price €/tonne of fluorine-free foam) - Average price €/tonne of PFAS-based foam)
In the following years, the quantity to be replaced each year in functional terms and thus the additional costs relative to the baseline scenario stay the same although the share of PFAS-free foams increases.
In year 1 after transition period:
Stock (tonnes foam) * (((1 + Additional volumes required % increase over PFAS based foams) * Average price €/tonne of fluorine-free foam) - Average price €/tonne of PFAS-based foam) (only once in year 1 after transition period)
From year 2 after transition period on:
Amount per sector (tonnes foam) * (((1 + Additional volumes required % increase over PFAS based foams) * Average price €/tonne of fluorine-free foam) - Average price €/tonne of PFAS-based foam)
Additional costs consist of three components:
- Additional costs when replacing PFAS-based foams
- Additional costs when replacing used and leaked fluorine-free stocks
- Additional costs when replacing expired fluorine-free stocks (not assumed to take place)
In Scenario RO1 the costs of the sum of these components stays the same from year 2 after transition period, since the quantity of fluorine-free foams to be needed does not change.
In ROs 2, 3, 4 and 5 there is one peak in year 1 after transition period, then only the annual amount of foams has to be replaced
Clean-up (after use,
training, leakage, spill)
cost savings
Annual savings as maximum annual clean-up cost savings of PFAS-based foams in use * (share of PFAS-based
After the respective transition period of each sector: Annual savings as maximum annual clean-
Be aware that costs have a positive sign (+) and cost savings a negative one (-).

P.O. Box 400, FI-00121 Helsinki, Finland | Tel. +358 9 686180 | echa.europa.eu
356
foams already replaced in the respective sector and year of RO1 compared to total annual usages in the baseline level)
up cost savings of PFAS-based foams in use * (share of PFAS-based foams already replaced in the respective sector compared to total annual usage in the baseline level)
These savings increase gradually to an estimated annual maximum, which is reached when all PFAS-based foams in all sectors have been replaced.
Cost of additional RMMs
for training/testing and
incidents
Costs of technical means to contain releases and disposal of PFAS-contaminated water * tons of foam disposed of from training/testing release
Costs of technical means to contain releases and disposal of PFAS-contaminated water * tons of foam disposed of from training/testing release
The incineration costs are used as a proxy in the best scenario, assumed to cover also any other costs related to collection of firewater run-off. The amount of foams used is considered to represent the quantity incinerated as the fire water can be concentrated before the disposal.
Cost / cost saving Mode of calculation in RO3 scenario Comments and explanations
Changes in producer
surplus due to export ban
For two years (alternatively one or five years) after transition period:
- Tonnes of foam used per year * average price €/tonne of PFAS-based foam * profit margin
It is assumed that the profit margin of foam manufacturers is 10 % of the sales value. The calculation is based on the methodology described by SEAC (ECHA, 2021b).
Cost Mode of calculation in RO4 scenario for the Seveso sector and military sector (differing from calculation for other sectors as described above)
Comments and explanations
Cleaning of equipment Cleaning costs per site * number of sites per sector s * (PFAS stock in year i-1 – PFAS stock in year i) / initial PFAS stock
Calculation as in RO1, since PFAS-based foams are replaced gradually and not in one year
Cost of technical changes
needed
After the end of the transition period:
Cost of technical change per site * number of sites per sector / number of years with linearly decreasing use and formulation (assumed as undertaken with constant magnitude each year after transition period)
(sector-specific calculation with index s for sector)
It is assumed technical changes are evenly spread over 20 years after the transition period in the Seveso and military sector, because PFAS-based foams are substituted gradually and progressively over this time (linear decline).
Early disposal of legacy
foams when replaced /
Depreciation of stocks to
be disposed of
Not applicable / zero (no difference to the baseline)
Due to continued (declining) use up to year 30 no need for early disposal in the Seveso and military sectors
Additional costs of
alternative foams due to
price and/or volume
differences
Linearly increasing from year 1 after transition period, using price differences and additional volumes required
Amount per sector (tonnes foam) * (PFAS stock in year i-1 – PFAS stock in year i) / concentration of PFAS surfactants in foam * (((1 + Additional volumes required % increase over PFAS based foams) * Average price €/tonne of fluorine-free foam) - Average price €/tonne of PFAS-based foam) * (actual year – year of transition period) / number of years with linearly decreasing use and formulation
It is assumed that the quantity to be replaced each year in functional terms and thus the additional costs relative to the baseline scenario increase linearly each year after the transition period.
Clean-up (after use,
training, leakage, spill)
cost savings
After the respective transition period:
Annual savings as maximum annual clean-up cost savings of PFAS-based foams in use * (share of PFAS-based foams already replaced in the respective sector and year compared to total annual usage in the baseline level)
As in RO1, according to the use of PFAS stock in year I / concentration of PFAS surfactants in foam, these savings increase gradually to an estimated annual maximum. This maximum is reached here only in year 30 when all PFAS-based foams in all sectors have been

P.O. Box 400, FI-00121 Helsinki, Finland | Tel. +358 9 686180 | echa.europa.eu
357
replaced.
Cost Mode of calculation in RO5 scenario for the Seveso sector (differing from calculation described above)
Comments and explanations
Cost of implementation of
RMMs to meet full
containment
Costs per site for implementation of RMMs to meet full containment * number of sites per Seveso sector (s = 1) (only once in year 1 after transition period)
Cleaning of equipment /
Cost of technical changes
needed / Early disposal of
legacy foams when
replaced / Depreciation of
stocks to be disposed of /
Additional costs of
alternative foams due to
price and/or volume
differences / Clean-up
(after use, training,
leakage, spill) cost
savings
Not applicable / zero (no difference to the baseline for the Seveso sector because PFAS-based foams are used up to year 30 to the same extent as before)
Other cost categories refer to the differences between using PFAS-based and fluorine-free foams, so they do not occur in the Seveso sector
E.4.2. Results
The cost calculations were made for:
all five ROs; “best”, “low” and “high” scenarios; additional versus no additional risk management measures for training and testing
(reported only for RO1); additional versus no additional risk management measures for incidents.
The results in the following tables are based on spreadsheet calculations and not rounded. This should not be interpreted as suggesting accuracy in the results. In some cases, the accuracy is necessary to show the difference in costs.
E.4.2.1. RO1
The total costs for a period of 30 years resulting from RO1 compared to the baseline scenario are shown in Table E.25. When RMMs are applied to both training and incidents, costs increase by €2.64 billion (“Low” cost estimate scenario), €5.88 billion (“Best” cost estimate scenario), and €15.60 billion (“High” cost estimate scenario), respectively. The "High" cost estimate scenario combines all “high” parameter estimates as indicated in section 3 of the Annex XV report.
Table E.25. Incremental total costs (Net present values in €) for the ‘Low’, ‘Best’ and ‘High’ RO1 scenario with and without RMM for training and incidents (together and separately) during a period of 30 years
Incremental costs (NPV)
without RMM with RMM training and incidents
with RMM training
with RMM incidents
Low-cost scenario*
2 581 374 336 € 2 637 877 714 € 2 589 798 164 € 2 629 453 886 €

P.O. Box 400, FI-00121 Helsinki, Finland | Tel. +358 9 686180 | echa.europa.eu
358
Best scenario*
5 763 958 518 € 5 876 965 275 € 5 780 806 175 € 5 855 100 515 €
High-cost scenario*
15 333 467 306 € 15 559 480 819 € 15 367 162 618 € 15 525 785 506 €
* Outcome of all "low / central / high values" for incremental costs together
Table E.25 shows a high variation between the low, best and high scenarios, which is a factor of around 2.2 between low and best scenario, a factor of 2.6 between best and high scenario and a factor of around 6 between low and high scenario.
The different cost categories are shown in Table E.26. RMM for incidents have a greater impact on additional costs than RMM for training. However, the additional costs of both RMM for incidents and training (highlighted in italics) are in the range of €57 million (“low” cost estimate scenario), €113 million (“Best” cost estimate scenario), and €226 million (“High” estimate scenario). This amounts to only 1.5% (high), 2.0% (best) and 2.2% (low) of the incremental costs without RMM in the respective scenario. However, these relatively cheap measures can generate a high share of additional emission reduction.
Table E.26. Incremental total costs (Net present values in €) for the ‘Low’, ‘Best’ and ‘High’ RO1 scenario in € during a period of 30 years per cost categories relevant for RO1
Cost category / NPV Low scenario Central scenario (best estimate)
High scenario
Cleaning of equipment 1 015 838 203 € 2 031 676 406 € 4 063 352 813 €
Technical changes needed
1 774 817 302 € 3 549 634 605 € 10 648 903 814 €
Additional volumes of alternative foams
-63 841 798 € 255 367 193 € 657 570 522 €
Clean-up cost savings -145 439 371 € -72 719 686 € -36 359 843 €
Cost of additional RMMS for training/testing
8 423 828 € 16 847 656 € 33 695 312 €
Cost off additional RMMS for incidents
48 079 550 € 96 159 100 € 192 318 201 €
Sum 2 637 877 714 € 5 876 965 275 € 15 559 480 819 €
Technical changes needed have the highest share of total costs (60.4% to 68.4%); their estimates also show the highest relative range of uncertainty. Equipment cleaning costs have a percentage of 26.1% to 38.5% of total costs, whereas the other cost categories only show a minor contribution. This also pertains to the additional RMM for incidents (1.2% to 1.8%) and for training and testing (0.2% to 0.3%).

P.O. Box 400, FI-00121 Helsinki, Finland | Tel. +358 9 686180 | echa.europa.eu
359
In the low-cost scenario, the additional volumes of alternative, i.e. fluorine-free, foams lead to cost savings. This is due to the assumption that the price of PFAS-based foams is higher than the price of PFAS-free foams; this effect overcompensates the higher quantity of fluorine-free foams needed. Even if there is some evidence on possibly lower costs of alternatives (see e.g. Annex E.2.4.4), this is not considered plausible description of the overall situation by the Dossier Submitter.
Table E.27 shows how the costs are distributed among the different sectors using PFAS-based foams. The chemical/petrochemical (Seveso) sector bears the highest share of the restriction-induced costs (76-80%). 14% to 17% of the costs accrue at the municipal fire services, 4% to 5% in marine applications. Other sectors contribute to less than 1% each. In the low-cost scenario, some sectors may even benefit from net cost savings. This is due to the combination of assumptions under this scenario as the savings due to avoided clean-up costs and the savings due to using alternative foams which are assumed to be cheaper than PFAS-based foams are outweigh the other cost categories.
Table E.27. Incremental total costs (Net present values in €) for the ‘Low’, ‘Best’ and ‘High’ RO1 scenario in € during a period of 30 years per sector
Low scenario Central
scenario (best estimate)
High scenario
Chemical/petrochemical Seveso
2 116 928 774 € 4 476 242 741 € 12 301 877 916 €
Other industries 6 380 006 € 19 897 944 € 46 754 019 €
Civil aviation -8 071 657 € 38 298 544 € 101 113 039 €
Military -5 891 038 € 24 512 497 € 65 257 000 €
Municipal fire services 456 248 415 € 980 227 883 € 2 221 403 970 €
Ready-to-use applications -2 388 100 € 2 482 714 € 8 022 945 €
Marine applications 108 542 678 € 299 886 074 € 698 816 544 €
Training and testing -33 871 363 € 35 416 878 € 116 235 387 €
Sum 2 637 877 714
€ 5 876 965 275
€ 15 559 480 819
€
E.4.2.2. RO2
Table E.28 shows the total restriction costs over an analytical period of 30 years resulting from scenario RO2 compared to the baseline scenario. For RO2 to RO5 there is no visible impact of the RMMs for training/testing, as these RMMs have been assumed to start in the beginning of the second year, while the transition period for training and testing (1.5 years) has been set to ensure that emissions from this use cease at the beginning of the second year and the remaining stock is incinerated. This is different from the assumptions of RO1 where RMMs are undertaken as long as PFAS-based foams are still in use.
Table E.28. Incremental total costs (+) / cost savings (-) for the ‘Low’, ‘Best’ and ‘High’ RO2 scenario with and without RMM for training and incidents (together and

P.O. Box 400, FI-00121 Helsinki, Finland | Tel. +358 9 686180 | echa.europa.eu
360
separately) in € during a period of 30 years
Incremental costs
without RMM with RMM
training and incidents
with RMM
training
with RMM
incidents
Low-cost scenario*
2 987 170 780 € 3 016 679 034 € 2 987 170 780 € 3 016 679 034 €
Best scenario*
6 712 391 757 € 6 771 408 265 € 6 712 391 757 € 6 771 408 265 €
High-cost scenario*
17 160 089 438 € 17 278 122 452 € 17 160 089 438 € 17 278 122 452 €
* Outcome of all "low / central / high values" for incremental costs together
Compared to the results of RO1 (Table E.25), costs are higher for all scenarios: by 11%-12% in the high scenario, 15%-16% in the best scenario and 14%-16% in the low scenario.
In RO2, with RMMs applied for incidents, costs increase by €3.02 billion (low-cost scenario), €6.77 billion (best scenario), and €17.27 billion (high-cost scenario).
The different cost categories are shown in Table E.29. The additional costs for RMMs (highlighted in italics) are in the range of €30 million (low), €60 million (best) or €118 million (high scenario), which amounts to 0.7% (high), 0.9% (best) and 1.0% (low) of the incremental costs without RMM in the respective scenario. Thus, the contribution of RMM to costs is much smaller than in RO1. This is due to the difference that in RO2 there is no need any longer for RMMs after the end of the transition period, whereas in RO1 the RMMs have to continue as long as PFAS-based foams are still allowed to be used.
Table E.29. Incremental total costs (Net present values in €) for the ‘Low’, ‘Best’ and ‘High’ RO2 scenario in € during a period of 30 years per cost categories relevant for RO1
Cost category / NPV Low scenario Central scenario (best estimate)
High scenario
Cleaning of equipment 1 260 627 844 € 2 521 255 689 € 5 042 511 378 €
Technical changes needed
1 774 817 302 € 3 549 634 605 € 10 648 903 814 €
Disposal / incineration of expired foams
102 328 599 € 113 698 443 € 142 123 054 €
Depreciation of stocks disposed
213 184 581 € 170 547 665 € 153 492 899 €
Additional volumes of alternative foams
-119 810 918 € 479 243 670 € 1 234 052 451 €
Clean-up cost savings -243 976 629 € -121 988 315 € -60 994 157 €
Cost of additional RMMS for incidents
29 508 254 € 59 016 507 € 118 033 014 €

P.O. Box 400, FI-00121 Helsinki, Finland | Tel. +358 9 686180 | echa.europa.eu
361
Cost category / NPV Low scenario Central scenario (best estimate) High scenario
Sum 3 016 679 034 € 6 771 408 265 € 17 278 122 452 €
Due to the ban of use after the end of the transition period, there are two cost categories additional to those in RO1, taking place in the year following the transition period: the incineration of PFAS-based foams that are not allowed for use anymore, and the depreciation of these disposed stocks. As for the depreciation of stock values, it is assumed that the average residual value is half of the original price.
Technical changes needed have the highest share of total costs in RO2 as well (52.4% to 61.6%), with the highest relative range of uncertainty. Equipment cleaning costs have a percentage of 29.2% to 41.8% of total costs, whereas the other cost categories only show a minor contribution. This also pertains to the additional RMM for incidents (0.7% to 1.0%).
The additional category of disposal/incineration correspond to 0.8% to 3.4% (best estimate: 1.7%) of total costs, while the depreciation of stocks disposed correspond to 0.9% to 7.0% (best estimate: 2.5%) of total costs. Costs due to depreciation are highest in the low-cost scenario and lowest in the high-cost scenario because the price of PFAS-based foams is assumed to be 3 750 €/tonne in the low-cost scenario and 2 750 €/tonne in the high-cost scenario (inverse to the price of fluorine-free foams). As in RO1, in the low-cost scenario the additional volumes of alternative foams lead to cost savings due to a lower price per tonne.
Table E.30 shows how the costs are distributed among the different sectors using PFAS-based foams. The relative shares are similar to those in RO1: The chemical/petrochemical (Seveso) sector bears 71.8% to 76.1% of the total costs, 15.9% to 18.8% of the costs accrue at the municipal fire services, 5.1% to 5.8% in marine applications. The share of costs for training and testing is (apart from the low scenario showing cost savings) with 1.8% to 2.0% higher than in RO1. Other sectors contribute to less than 1% each. As in RO1, in the low-cost scenario some sectors benefit from cost savings in total. Cost savings due to avoided clean-up costs and use of alternative foams that are less costly than PFAS-based foams outweigh the other cost categories.
Table E.30. Incremental total costs (Net present values in €) for the ‘Low’, ‘Best’ and ‘High’ RO2 scenario in € during a period of 30 years per sector
Low scenario Central scenario (best estimate) High scenario
Chemical/petrochemical Seveso
2 296 426 424 € 4 854 869 937 € 13 016 359 765 €
Other industries 9 465 189 € 26 593 866 € 59 098 441 €
Civil aviation 5 559 531 € 69 569 394 € 155 665 933 €
Military 3 090 567 € 45 148 023 € 101 202 180 €
Municipal fire services 566 896 417 € 1 242 561 460 € 2 745 841 425 €
Ready-to-use applications -564 729 € 6 663 919 € 15 320 180 €
Marine applications 152 485 179 € 393 697 771 € 874 974 957 €

P.O. Box 400, FI-00121 Helsinki, Finland | Tel. +358 9 686180 | echa.europa.eu
362
Training and testing -16 679 544 € 132 303 895 € 309 659 571 €
Sum 3 016 679 034 € 6 771 408 265 € 17 278 122 452
€
As the requirements of RO2, including the ban of use, constitute a stronger restriction than those of RO1, the incremental effect of RO2 compared to RO1 can be analysed separately. This is done in section E.8.1 (cost-effectiveness analysis).
E.4.2.3. RO3
For the assessment of RO3 (RO2 + export ban 10 years after entry into force), EEA producers are considered to stop producing PFAS-based foams for export to non-EEA countries, resulting in the loss of the export market with corresponding profits (assumed as 10 % of revenues).
The approach of SEAC (ECHA, 2021b) to estimating changes in producer surplus is used in the cost calculations with 1, 2 (central estimate) and 5 years of profit loss used as a proxy of the impacts. The Dossier Submitter considers this approach appropriate as:
Producers and formulators know about and anticipate the forthcoming ban and can adapt to it in time so that they can deliver increased demand for PFAS-free foams without delay.
They already have experience in producing and formulating PFAS-free foams. Producers may face additional investment costs to retrofit their capacity of production
lines to PFAS-free foams. The share of exports to non-EEA countries may be reduced because customers in non-
EEA countries are allowed to use PFAS-based foams and, therefore, might not see a need to replace them by PFAS-free foams. (Alternatively, they might opt for the PFAS-free foams produced by their current suppliers.)
The quantities of fluorine-free foams required are (in the best scenario) estimated to be 50% higher than for PFAS-based foams, which tends to increase the revenues and profits of the producers. The total costs for a period of 30 years resulting from the scenario with export ban compared to the baseline scenario are shown in Table E.31.
Table E.31. Incremental total costs for the ‘Low’, ‘Best’ and ‘High’ RO3 scenario with RMM for training and incidents in € during a period of 30 years
Incremental costs with RMM for training and incidents
Low-cost scenario*
3 020 400 074 €
Best scenario*
6 779 518 224 €
High-cost scenario*
17 302 050 265 €
* Outcome of all "low / central / high values" for incremental costs together

P.O. Box 400, FI-00121 Helsinki, Finland | Tel. +358 9 686180 | echa.europa.eu
363
Compared to the results of RO2, costs are slightly higher: €4 million in the low-cost, €8 million in the central and €24 million in the high-cost scenario (NPV over 30 years). The additional costs for RMMs are not affected by changes in exports because they only refer to the domestic use of foams. Thus, the contribution of RMMs to costs is approximately the same as in RO2.
Apart from the new cost category describing changes in producer surplus related to exports, all other cost categories are unaffected compared to RO2. The producer surplus due to exports accounts for about 0.1% of the total costs in each scenario. This means that technical changes and cleaning costs are also for RO3 the most important cost components.
Since it is assumed that the export share of 25% of produced foams pertains to all sectors, costs across all sectors and scenarios are slightly higher than in RO2.
E.4.2.4. RO4
The total costs for a period of 30 years resulting from scenario RO4 compared to the baseline scenario are shown in Table E.32. The ban of PFASs for training and testing applications after the transition period of 1.5 years also applies to the training and testing in the Seveso and military sectors.
Table E.32. Incremental total costs (+) / cost savings (-) for the ‘Low’, ‘Best’ and ‘High’ RO4 scenario with and without RMM for training and incidents (together and separately) in € during a period of 30 years
Incremental costs without RMM with RMM for training/testing and
incidents
Low-cost scenario*
2 266 543 073 € 2 318 792 982 €
Best cost scenario*
5 121 335 508 € 5 225 835 326 €
High-cost scenario*
13 021 252 069 € 13 230 251 706 €
* Outcome of all "low / central / high values" for incremental costs together
The different cost categories are shown in Table E.33. Compared to the results of RO2, costs are lower by around 23% (with RMMs) and by 24% (without RMMs). The additional costs for RMMs (highlighted in italics) are significantly higher than in RO2: under RO4 these account for €52 million (low-cost scenario), €104 million (best scenario) and €209 million (high-cost scenario). In the Seveso and military sectors, the RMMs have to be sustained until the end of the 30-year period because PFAS-based foams are still used up to year 30. Thus, the contribution of RMMs to costs is higher than in RO2 (2.3% in the low-cost scenario, 2.0% in the best scenario, and 1.6% in the high scenario).
Table E.33. Incremental total costs (Net present values in €) for the ‘Low’, ‘Best’ and ‘High’ RO4 scenario in € during a period of 30 years per cost categories

P.O. Box 400, FI-00121 Helsinki, Finland | Tel. +358 9 686180 | echa.europa.eu
364
relevant for RO4
Cost category / NPV Low scenario Central scenario (best estimate)
High scenario
Cleaning of equipment 1 064 270 760 € 2 128 541 520 € 4 257 083 040 €
Technical changes needed
1 298 309 237 € 2 596 618 474 € 7 789 855 422 €
Disposal / incineration of expired foams
55 216 243 € 61 351 381 € 76 689 226 €
Depreciation of stocks disposed
115 033 839 € 92 027 071 € 82 824 364 €
Additional volumes of alternative foams
-83 542 348 € 334 169 391 € 860 486 181 €
Clean-up cost savings -182 744 658 € -91 372 329 € -45 686 165 €
Cost off additional RMMS for incidents
52 249 909 € 104 499 819 € 208 999 637 €
Sum 2 318 792 982 € 5 225 835 326 € 13 230 251 706 €
As mentioned, the additional RMMs for incidents are higher in RO4; clean-up cost savings are lower in RO4 than in RO2 because less fluorine-free foams are used in the Seveso and military sectors. All other cost categories are, however, lower than in RO2. This is because in the Seveso and military sectors costs do not occur right after the transition period but only gradually up to the year 30.
Technical changes and cleaning costs are the most important components of total costs in RO4; however, they are significantly lower than in RO2. This is mainly a discounting effect – cleaning and technical changes occur gradually over 20 years after the end of the foreseen transition period of 10 years.
Table E.34 shows how the costs are distributed among the different sectors using PFAS-based foams. A comparison with RO2 shows that differences only affect the Seveso and military sectors, which is obvious due to the different assumptions for these sectors. Compared to RO2, the Seveso sector would benefit under RO4 from a total cost reduction of 30.3% (low-cost scenario) up to 31.2% (best scenario), the military sector from a cost reduction of 63.8% (high cost scenario) up to 87.4% (low cost scenario). Since the other sectors bear the same absolute costs as in RO2, their relative burden of the cost increases.
Table E.34. Incremental total costs (Net present values in €) for the ‘Low’, ‘Best’ and ‘High’ RO4 scenario in € during a period of 30 years per sector
Low scenario Central scenario (best estimate)
High scenario
Chemical/petrochemical Seveso
1 601 240 997 € 3 339 451 742 € 9 033 048 121 €
Other industries 9 465 189 € 26 593 866 € 59 098 441 €

P.O. Box 400, FI-00121 Helsinki, Finland | Tel. +358 9 686180 | echa.europa.eu
365
Civil aviation 5 559 531 € 69 569 394 € 155 665 933 €
Military 389 942 € 14 993 279 € 36 643 078 €
Municipal fire services 566 896 417 € 1 242 561 460 € 2 745 841 425 €
Ready-to-use applications -564 729 € 6 663 919 € 15 320 180 €
Marine applications 152 485 179 € 393 697 771 € 874 974 957 €
Training and testing -16 679 544 € 132 303 895 € 309 659 571 €
Sum 2 318 792 982 € 5 225 835 326 € 13 230 251 706 €
E.4.2.5. RO5
Table E.35 shows the total costs over a period of 30 years resulting from RO5 compared to the baseline scenario. It should be emphasised that “incremental costs without RMM” are in this case a hypothetical, non-realistic value. The RMMs to meet full containment allow a continuous use of PFAS-based foams in the Seveso sector. Therefore, all other cost categories (apart from those for RMMs for incidents during the transition period) are not existent anymore for the Seveso sector, because they are all attributed to the differences between the use of PFAS-based foams and fluorine-free foams. Without additional RMMs, the costs would in fact have the same components and the same amount as in RO2. However, it shows that in RO5 other costs than the costs due to the RMMs to meet full containment have only a very low share of the total costs.
Table E.35. Incremental total costs (+) / cost savings (-) for the ‘Low’, ‘Best’ and ‘High’ RO2 scenario with and without RMM for training and incidents (together and separately) in € during a period of 30 years
Incremental costs
without RMM with RMM for incidents and to meet full containment (Seveso sector)
with RMM to meet full containment (Seveso sector)
with RMM incidents
Low-cost scenario*
718 311 358 € 7 243 628 927 € 7 214 120 673 €
747 819 611 €
Best cost scenario*
1 912 655 823 €
14 963 290 962 €
14 904 274 454 €
1 971 672 330 €
High-cost scenario*
4 253 997 678 €
43 346 886 587 €
43 228 853 572 €
4 372 030 693 €
* Outcome of all "low / central / high values" for incremental costs together

P.O. Box 400, FI-00121 Helsinki, Finland | Tel. +358 9 686180 | echa.europa.eu
366
The different cost categories are shown in Table E.36. Compared to RO2, costs (including all RMMs) are 121% higher in the best scenario, 140 % higher in the low-cost scenario and 151 % higher in the high-cost scenario. The additional costs for the (less strict) RMMs during the transition time are assumed to be the same as in RO2. Thus, the relative contribution of these RMM to the total costs is much smaller than in the other scenarios.
Table E.36. Incremental total costs (Net present values in €) for the ‘Low’, ‘Best’ and ‘High’ in € during a period of 30 years per cost categories relevant for RO5
Cost category / NPV Low scenario Central scenario (best estimate)
High scenario
Cleaning of equipment 611 046 913 € 1 222 093 826 € 2 444 187 651 €
Technical changes needed
150 864 973 € 301 729 947 € 905 189 840 €
Disposal / incineration of expired foams
60 497 520 € 67 219 466 € 84 024 333 €
Depreciation of stocks disposed
126 036 499 € 100 829 199 € 90 746 279 €
Additional volumes of alternative foams
-74 633 480 € 298 533 919 € 768 724 842 €
Clean-up cost savings -155 501 067 € -77 750 534 € -38 875 267 €
Costs for implementation of RMMs to meet full containment
6 495 809 316 € 12 991 618 631 € 38 974 855 894 €
Cost off additional RMMs for incidents
29 508 254 € 59 016 507 € 118 033 014 €
Sum 7 243 628 927 € 14 963 290 962 € 43 346 886 587 €
Table E.36 shows that the costs for implementing RMMs to meet full containment have by far the highest share of total costs (86.7% in the best scenario, 89.7% in the low-cost scenario and 89.9% in the high-cost scenario. Other costs (apart from the RMMs for incidents during the transition period) have decreased substantially because they have become obsolete in the Seveso sector, which dominates all costs.
Table E.37 shows that – according to the assumptions of RO5 – only the Seveso sector is affected by additional measures. Costs increase for this sector to 269% (best scenario), 284% (low-cost scenario) or 300% (high-cost scenario) of the level in RO2. All other sectors bear the same level of costs as in RO2.
Table E.37. Incremental total costs (Net present values in €) for the ‘Low’, ‘Best’ and ‘High’ RO5 scenario in € during a period of 30 years per sector
Low scenario Central scenario (best estimate) High scenario
Chemical/petrochemical 6 523 376 317 13 046 752 634 39 085 123 899

P.O. Box 400, FI-00121 Helsinki, Finland | Tel. +358 9 686180 | echa.europa.eu
367
Seveso € € €
Other industries 9 465 189 € 26 593 866 € 59 098 441 €
Civil aviation 5 559 531 € 69 569 394 € 155 665 933 €
Military 3 090 567 € 45 148 023 € 101 202 180 €
Municipal fire services 566 896 417 €
1 242 561 460 €
2 745 841 425 €
Ready-to-use applications -564 729 € 6 663 919 € 15 320 180 €
Marine applications 152 485 179 € 393 697 771 € 874 974 957 €
Training and testing -16 679 544 € 132 303 895 € 309 659 571 €
Sum 7 243 628 927
€ 14 963 290
962 € 43 346 886
587 €
It should be highlighted that the increased costs of RO5 compared to RO2 do not lead to a further reduction of emissions – due to the continued use of PFAS-based foams at the same level as before in the Seveso sector the reduction of emissions is smaller compared to RO2. Therefore, the incremental effect of RO5 compared to RO2 is not presented here.
E.4.3. Additional information on cost categories
E.4.3.1. Cost of technical changes needed
From the initial survey of Wood, no consultees indicated that a transition from PFAS foams to fluorine-free required investment in entirely new foam delivery systems. However, problems have been encountered in specific components: such as proportioner pumps, jets and nozzles for discharge, including the need for replacement nozzles; including low expansion nozzles. These challenges appear to have been caused by differences in foam viscosity. Typical costs for a range of firefighting nozzles are within an approximate range of between €5 or less per piece for simple foam nozzle devices, to c. €30 and up to c. €60 for marine firefighting nozzles or “heavy duty applicators” and up to c €200 for more specialist equipment82. Mobile foam units are in the region of €2 700.83
It has been raised also during subsequent interviews, that minor modifications to existing fire protection systems are commonly required with foam replacements to ensure appropriate
82 Costs derived from search of widely available commercial products. See: https://www.made-in-china.com/products-search/hot-china-products/Water_Foam_Nozzle_Price.html See also https://www.orbitalfasteners.co.uk/products/heavy-duty-foam-dispenser-gun See also: https://www.dortechdirect.co.uk/heavy-duty-pu-applicator-gun-for-expanding-foam.html?gclid=EAIaIQobChMIudKHq9GP5gIVSbDtCh31AATEEAQYASABEgL5S_D_BwE See: https://www.safetyshop.com/lever-operated-nozzle-for-fire-hose.html?gclid=EAIaIQobChMI6cKnwNmP5gIVAuDtCh2KMwErEAQYAiABEgL91PD_BwE&gclsrc=aw.ds See: https://www.fireprotectiononline.co.uk/hv-series-low-expansion-foam-branch-pipes.html?gclid=EAIaIQobChMItqqg_NmP5gIViLbtCh0ImgYXEAQYByABEgIFdvD_BwE
83 https://simplyextinguishers.co.uk/df130-mobile-foam-units.html?gclid=EAIaIQobChMIn4yv79yP5gIVgpOzCh1-PQghEAkYBiABEgKsIfD_BwE

P.O. Box 400, FI-00121 Helsinki, Finland | Tel. +358 9 686180 | echa.europa.eu
368
standards for proportioning and flow requirements are achieved, and often to maintain accreditation for insurance coverage (Cornelsen-Interview, 2021); (Equinor-Ystanes-Interview, 2021); (JOIFFF, 2020). To ensure proper performance, it is now common practice for existing foam proportioners to be replaced with units tested and accredited with the replacement foam. For most cases, performance requirements cannot be achieved without the tested and certified proportioner. Foam application rate and discharge duration are often impacted by the differing physiochemical properties of the replacement foam. One example is kinematic viscosity, which will affect the performance of pumps and storage volumes of concentrate. The switch to aspirated discharge devices typically increases replacement foam performance and reduces the need for more extensive system modifications (Ramboll, 2021). However, concerning large user sites like oil refineries, Eurofeu and the Firefighting Foam Coalition indicated in one of their comments on the PFHxA Annex XV restriction report “the cost for handling, cleaning and retrofitting can ramp up to 15-20 Mio € for a single one of Europe’s biggest chemical sites. On average a site operating 20-40 storage tanks require 2‐5 Mio. € for retrofitting. Tankterminal.com lists 1,166 tank terminal facilities in Europe operating in total 30,982 tanks. This is per site on average 27 tanks having a total storage capacity of 215,000 m3. It also needs to be considered that any change to the system of a site also triggers additional testing and calibration costs to ensure full functionality.” (Eurofeu, 2020a); (FFFC, 2020).
From Eurofeu’s contribution the costs of technical changes can be imputable to elements such as the need for increased storage volume of foam concentrate and for the need to retrofit the bund areas in some tank farms to cover a significantly higher volume of liquids, associated with an emergency response action.
Also the German mineral oil industry association Mineralölwirtschaftsverband eV – MWV indicates transition cost in the order of €300 million for 12 of their refineries (MWV, 2021).
Based on this information, in the quantitative assessment of this report, the cost of technical changes is assumed to be €500 000 per site for the Seveso sector and €5 000 per site for other sectors. The sensitivity scenarios are calculated for -50% (low-cost scenario) and +200% (high-cost scenario) of that.
E.4.3.2. Early disposal of legacy foams when replaced
The costs of destruction of PFAS-based foams are estimated to be about €1/litre (a more detailed description of destruction costs is provided in Appendix 2). In the past, the PFAS-based foams were also used for training which meant that stocks were used before they reached the end of their shelf life. The assumptions made on the quantities sold and used annually in this report would not suggest that foams expire before their use. Consequently, no cost or saving estimate is derived for this cost category.
In a scenario where PFAS-based foams would expire, a cost of about €1/litre for destruction of the PFAS-based foams by the end of their service life should be expected.
E.4.3.3. Depreciation of stocks to be disposed of
In RO2, RO3 and certain users under RO4 and RO5, users would no longer be able to use the foam stocks they have purchased. The costs for this stock will have to be written off and disposed of. In the baseline, foam stocks would also have to be replaced once they are used or expired, so the restriction on use would bring the replacement costs forward. To reflect this, the value of the depreciation of stocks at the point of replacement due to the restriction is also considered. Assuming an even age distribution of stocks of PFAS-based foam and a linear depreciation of foams over their lifetime, the restriction would cut the life of the foams in half on average, and so half of their original purchase value would already have depreciated and should not be considered as a cost of the restriction.

P.O. Box 400, FI-00121 Helsinki, Finland | Tel. +358 9 686180 | echa.europa.eu
369
E.4.3.4. Incineration/disposal costs of PFAS-containing foams (these may be both costs and cost savings)
The techniques and cost of safe disposal of PFAS-containing firefighting foams are discussed in detail Appendix 2. Only additional elements of transportation, storage and labour costs are discussed below, as well illustrative example of potential savings from avoided disposal.
E.4.3.4.1. Costs of early disposal of legacy foams
Costs occur from the disposal process itself, as well as from transportation to disposal facilities and the storage of PFAS-foams. Costs of disposal are not considered to be incurred in RO1, unless ‘transitional wastage’ occurs, where the disposal of some PFAS-containing foam must happen to enable a switch to an alternative. Information and data is unavailable to accurately quantify the amount of ‘transitional wastage’. The quantitative analysis therefore focuses on costs associated with RO2-RO5. Costs associated with transportation to incinerators, labour costs and the potential costs of storage are qualitatively discussed below.
Transportation costs
Stakeholder responses did not identify transportation costs in relation to the costs of disposal. However, it is possible that transportation costs may occur where PFAS-containing firefighting foams need to be transported to incinerators off-site. These may include the costs associated with vehicle operation such as fuel costs (which will likely vary across the EU and be dependent on fuel prices) and distance covered between the pick-up point for PFAS and the site for incineration. However, without detailed information concerning the location of PFAS foam users and manufacturers, it is not feasible to derive accurate transportation costs associated with disposal.
Storage costs
Stakeholder responses referred to storage costs within the context of requiring multiple foams to be stocked, particularly during a transition to PFAS-free foam, rather than within the context of disposal. This cost could be mitigated through phased transition. These costs have not been quantified in this report.
Labour costs
Labour costs may be incurred during the collection of PFAS-containing firefighting foams as well as during their transportation to incineration facilities. Stakeholder consultation did not provide any responses relating to labour costs for the disposal of PFAS and these would likely form part of the overall incineration costs.
E.4.3.4.2. Costs savings from avoided disposal of expired foams
Firefighting foams need to be disposed of when not used at the time of their expiry date. Incineration is considered the most appropriate disposal option for PFAS-based foams. The disposal method for fluorine-free foam would depend on the hazards of the specific foam.
The assumptions used in this report suggest all foam concentrate is used before expiration, while other sources suggest that significant quantities of expired foam concentrate is indeed destroyed. If the usage rate of 15-20% per annum of existing stocks is an average across all sectors of use, there will be some installations with potentially far lower usage rates annually that will likely have some foams that reach expiry before use. In the absence of specific data, below the potential cost savings are shown for 1%, 5% and 20% of annual foam purchases

P.O. Box 400, FI-00121 Helsinki, Finland | Tel. +358 9 686180 | echa.europa.eu
370
replacing foams that have reached their expiry date84. These figures are hypothetical and are shown to illustrate the potential order of magnitude only.
Table E.38. potential cost savings from avoided disposal of expired foams Total foam purchased per year (tonnes)
% of annually purchased foam replacing foams not used (hypothetical)
Foam to be disposed of per year (tonnes)
Cost of disposal (€): based on best estimate of disposal costs of €1.0/l
14 000 (low) 1% (low) 140 140 000
18 000 (average) 5% (central) 900 900 000
20 000 (high) 20% (high) 4 000 4 000 000
Sources: Wood (2020). Based on the total foam purchased per year, foam disposal costs per litre on 1€/litre, and hypothetical shares of foams not used per year, it is estimated that the annual savings from PFAS-based foam disposal could be between some €1 million to €4 million per year. If the cost of disposal is higher, the savings would be higher as well.
Other potential benefits of using alternative foams noted by consultees include emerging concerns over corporate reputation from continued use of PFAS foams and savings from avoided cross contamination of other waste streams, from monitoring, environmental permitting requirements, controls and personal protective equipment.
Despite additional stakeholder consultation, and some specific examples of savings, it has not been possible to provide an overall estimate of these savings for the market or average firm. The savings were however noted as “significant” by several consultees.
E.4.3.5. Remediation and clean-up
This section defines the remediation and clean-up and discusses the economic implications in terms of reduced need for them potentially resulting from a restriction on the use of PFAS-based firefighting foams.
The remediation costs are not included as cost savings in the assessment of economic impacts, as they are considered to be covered by the quantitative estimate for reduced releases which is used as proxy of human health and environmental impacts. Otherwise, this benefit element would be double counted. However, clean-up costs are included even if they could also be seen to be covered by the release estimate.
E.4.3.5.1. Definition of “remediation” versus “clean-up”
Remediation
Remediation pertains to legacy contamination that historically occurred from firefighting or training activities using PFAS-based products. Remediation in this sense would only include PFAS-impacted sites because remediation cannot be anticipated at this point for replacement substances (e.g. fluorine-free foams). It is assumed that substances that are of concern for human health and the environment, based on toxicology, fate and transport, or other legal/relevant drivers, will not be used in alternative fluorine-free foam products (noting that
84 It is also assumed that all PFAS-based foams are incinerated, although it should be noted that not all PFAS-based foams are currently incinerated when they reach their expiry date (e.g. some of them are used for training).

P.O. Box 400, FI-00121 Helsinki, Finland | Tel. +358 9 686180 | echa.europa.eu
371
siloxane-based alternatives might be of concern, some siloxanes having been identified as having PBT properties85). As described in this report, the substances contained in fluorine-free alternatives exhibit lower concern than PFASs used in firefighting foams, due to their lower hazards and rapid biodegradation. Should fluorine-free foams become a burden in the future, and themselves require soil and/or groundwater remediation beyond the constituents of the fuels that have been extinguished, an evaluation needs to be conducted then. So far, no cases have been identified where remediation has been required due to contamination from fluorine-free alternatives.
In the use scenarios considered in this assessment, typically remediation sites include a soil source zone where the actual firefighting activity has been carried out. PFAS compounds present in shallow soils tend to leach with infiltrating precipitation to greater depth in the soil column eventually reaching groundwater. Mobility in soil varies depending on the PFASs (see further details in section B.4.2). Once groundwater has been impacted, very large dilute plumes tend to form. Groundwater plumes are large because PFAS compounds are mostly mobile in the porewater and groundwater . Contaminated groundwater is in itself a concern since groundwater is a sensitive and important receptor. The critical use of groundwater can include groundwater extraction for drinking water for human consumption, for agricultural irrigation of crops, or for watering of farm animals. Groundwater can also become – directly or indirectly – surface water by extraction and surface discharge or by groundwater/surface water interaction in rivers, streams or lakes.
Typically, remedial activities are driven by regulatory processes and include the use of remediation target levels or follow a risk-based approach. The number of PFAS compounds that currently “drive the market” are few in comparison to the number of potential PFAS compounds known and likely present at a remediation site.
Clean-up
Clean-up relates to new incidents or accidents such as planned training activities or emergency response actions, respectively. Currently, it should be assumed that training activities with PFAS-containing foams are largely conducted at contained training facilities so that firefighting water can to a large extent be captured and sent for treatment. However, there might be exceptions where release to the environment from training occurs, and there are still emergency responses where PFAS-based foams are used. Clean-up of an emergency response site would need to happen as soon as possible after the fire is controlled and the site is safe to enter to reduce the potential or the amount of PFAS able to infiltrate into the soil matrix. Environmental sampling from affected soil and/or water (surface water and/or groundwater) might need to occur to determine follow-on actions to remove unacceptable concentrations.
The potential processes and technologies used for remediation and clean-up are discussed further in (Wood et al., 2020)86.
85 E.g. Octamethylcyclotetrasiloxane (D4) EC: 209-136-7; Decamethylcyclopentasiloxane (D5) EC: 208-764-9 and Dodecamethylcyclohexasiloxane (D6) EC: 208-762-8 are included on the REACH Candidate List for Authorisation based on their PBT and vPvB properties. See https://www.echa.europa.eu/candidate-list-table
86 See section “Step 5 - Treatment technologies and treatment scenarios – soil and water” in (Wood et al., 2020)

P.O. Box 400, FI-00121 Helsinki, Finland | Tel. +358 9 686180 | echa.europa.eu
372
Figure E.3. Overview of “Remediation” vs. “Clean-up” E.4.3.5.2. Drivers for active measures – why is clean-up / remediation required?
For PFAS-containing foams, specifically at legacy sites with historical releases/impacts, remediation is warranted and likely required by regulatory agencies when sensitive receptors (including groundwater) are threatened or already impacted. Guidance levels for up to a dozen or so individually identified PFAS compounds (including PFOS, PFOA, PFHxS, etc.) have been developed in various European countries (Concawe, 2016) and parameters for the sum of certain listed PFASs (0.1 μg/l) for the totality of PFASs (0.5 μg/l, once technical guidelines for monitoring this parameter are developed) have been developed for the Drinking Water Directive. For legacy sites in various European countries a risk-based remediation approach would be implemented by describing the risk to relevant receptors based on analytical data collected from environmental media such as soil, surface water and/or groundwater. In some instances, animal/fish or vegetation samples are collected and analysed to evaluate PFAS migration in the food chain at different trophic levels. If a risk to a receptor is not acceptable, active measures would need to be initiated. The level of effort related to an active measure and the measure or combination of measures itself is highly site specific and depends on the level of impact to the site and the sensitivity of the impacted or threatened receptor, amongst other drivers. Case studies on “contamination from use of aqueous film-forming foams” are presented in the report of Nordic Council of Ministers (NordicCouncil, 2019) and summarised in the table below.
Table E.39. Nordic Council report case studies of PFAS contamination from AFFF use, from (Wood et al., 2020) Site Contamination Contamination source Remediation cost Kallinge-Ronneby Military and Civilian Airbase, Sweden
Detected PFAS contamination in the outgoing water from one of two municipal waterworks which supplied water to around 5 000 people. PFHxS, PFOA and PFOS were sometimes 100–300 higher in the contaminated water source (e.g. up to 8 000 ng/l for PFOS). Blood samples showed significant human exposure via drinking water.
The source of the contamination was identified as the fire drill site located in the nearby defence airport where AFFF containing PFOS had been used since the 1980s, then other PFAS-based AFFF since 2003 and fluorine-free foams since 2011.
The cost of changing the water supply from Brantafors to Karlsnäs is estimated SEK 60 million (EUR 5.8 million). The additional annual cost for monitoring is calculated to around SEK 50 000 (EUR 4 800). Significant water resources remain unusable for an unforeseeable future due to PFAS contamination. The loss of these valuable resources has not been monetised.
Jersey Civilian Airport, Channel Islands
78 properties were within the plume area. Groundwater in 36 of these properties tested positive for PFOS. Although at some of the sites, concentrations of PFOS have
The airport’s fire-training site was identified as the origin of the contamination. In 1991, the fire training site started using AFFFs to
Long-term remediation works began in 2002 and finished in 2004 with the aim of addressing the current contamination and preventing future
REMEDIATION Resulting from historical activities; Legacy site/area; Large groundwater plume; Additionally impacted receptors; Multi-year site activities; Can include remediation
infrastructure and O&M programme; Very expensive; and Technologies used and costs highly
site specific.
CLEAN-UP Resulting from recent activities; Often still operating site; Impact initially “only“ surficial; Contaminants geographically
confined; Can be accomplished in short
timeframe; Engineered systems/facilities
possible, mobile equipment possible; Reasonable costs (much lower than
remediation costs); Technologies used and costs more
plannable; and Costs fuel and foam driven.

P.O. Box 400, FI-00121 Helsinki, Finland | Tel. +358 9 686180 | echa.europa.eu
373
Site Contamination Contamination source Remediation cost shown signs of decline, they have remained at high levels for seven years in private wells (up to 98 000 ng/l).
meet the requirements of UK Airport Fire Services. The foam used at the site during training exercises was discharged regularly without monitoring, dissolving into the ground and rainwaters. Contamination subsequently found its way into the aquifer and bay.
problems. The total cost was GBP 7.4 million (EUR 10.6 million).
Schiphol Airport, The Netherlands
In July 2008, an error in the sprinkler-system at a hangar released 10 000 litres of AFFF, containing 143 kg of PFOS, into the surrounding environment. This fed into a larger reserve of waste water (100 million litres) kept in five reserve reservoirs, several of which leaked and caused substantial contamination of the soil and surface water. The water resources were found to contain over 12 times the average amount of PFOS otherwise found in several reference sites in the Netherlands.
Contaminated soil from this incident also resulted in delays of over a year to a project to build a new bus lane in Schiphol-Oost in 2017. Over 50 000 m3 of the soil dug up was found to be contaminated and thus difficult to dispose. The cost of the remediation is estimated at EUR 30–40 million.
Source: Nordic Council of Ministers, The Cost of Inaction – A socioeconomic analysis of environmental and health impacts linked to exposure to PFASs, 2019. In 2019, reports for the Norwegian Environment Agency’s on the PFAS contamination at Avinor’s airports were published (Norconsult, 2019). The study included 39 airports with a total of 59 sites examined for PFASs at these airports. PFOS was detected at almost all airport fire training sites. A total of 32 sites have a calculated amount of PFOS in the ground ranging from 0.5 to 81 kg per site. The total calculated volume of PFOS for these 32 sites is approximately 314 kg (estimated range between 130 kg to 800 kg). Environmental risk assessment has been performed based on the risk associated with the calculated leaching of PFOS/∑PFASs from contaminated sites/fire training sites, and the existing load in the biota (biota surveys). Vulnerability was assessed as the likelihood of the contamination (PFOS/∑PFASs) reaching registered drinking water sources, vulnerable nature, or areas for recreation and business interests. Based on this assessment, certain sites have been remediated with techniques depending on the site conditions. Measured concentrations of ∑PFASs in groundwater varied between 275 ng/L and 1 450 000 ng/L depending on the site and time of sampling. The sites with the lowest cost per kg of PFOS/ΣPFAS removed, was calculated at 7.3 MNOK, with a cost per kg ΣPFAS removed of NOK 357 000. Another site with the largest volume of PFOS/ΣPFAS removed (96 kg) of all, and due to a relatively large volume of masses (22 000 m3) the total cost of remedial action was 51 MNOK, with a calculated cost per kg of the sum of PFASs removed at NOK 533 000.
In the U.S., 75% of all the AFFF is used by the defence sector and there are approximately 190 sites in 40 states currently known to be contaminated with PFASs with more testing and analysis underway. Training and emergency responses are major sources of groundwater PFAS contamination on defence bases. There are concerns that PFAS-contaminated ground water on defence bases may be affecting water quality in the surrounding areas, with the water in and around 126 defence installations containing potentially harmful levels of PFASs (NYSPPI, 2019).
Clean-up is driven to a large degree by the flammable liquid itself, the soot, water and “dirt” in general terms that contribute to the firefighting water runoff and its potential to impact the environment. The foam used might just be another component that will need to be captured and treated, specifically under the scenario of a fluorine-free foam use. As discussed above, it is assumed that fluorine-free foams will not be persistent, mobile and toxic at levels that will require remediation (e.g. legacy site) when they enter the environment. For training activities facilities including the associated water treatment works should be engineered to account for 100% collection of all fluids including fuel and foams that the fire training water can be cleaned and treated accordingly before releasing treated waters back to the larger

P.O. Box 400, FI-00121 Helsinki, Finland | Tel. +358 9 686180 | echa.europa.eu
374
environment. Should a fire have been extinguished during training or a live event using PFAS-based foam then it is advisable to clean-up the firefighting water promptly after the incident. Depending on the location of a live fire and the foam used, soil samples should be collected from areas where fire water runoff could have percolated into the subsurface to evaluate the presence or absence of PFAS compounds and their concentrations. Depending on the soil analytical results a need for soil exchange might be indicated. After a live fire event, regulatory communication and agreement is required for subsequent steps in the clean-up procedure to reach acceptable site conditions that will not create or leave a risk to human health or the environment.
One stakeholder shared a scenario where clean-up seemed to be challenging. Firefighting activities in close vicinity to open water bodies (such as sea or lake) make it close to impossible to recover firefighting water runoff discharged into the sea or lake. To avoid runoff entering the sea, engineering solutions would be required as much as that is possible. For facilities in close proximity to large water bodies, one could possibly design berms and a drainage system to recover firefighting water in case a fire should truly occur.
E.4.3.5.3. Cost of remediation
(Wood et al., 2020) assessed the typical costs of remediation of PFAS contamination resulting from the use of firefighting foams. The results are summarised in the table below. This shows that the typical costs per site can range from around half a million Euros (only soil remediation required, lower estimate) to just over €100 million (sum of soil excavation and incineration, groundwater pump and treat and drinking water reverse osmosis, higher estimates).87
Table E.40. Typical cost per site of remediation of PFAS contamination resulting from the use of firefighting foams Compartment Technique Cost
Soil Excavation and off-site disposal € 0.5 – 18 million
Excavation and incineration € 2.5 – 38 million
Capping € 0.42 - 4.3 million
Groundwater Pump and treat €1.2 – 30.3 million
Drinking water Reverse osmosis €2.9 – 39.8 million
Source: (Wood et al., 2020) It is noted that the cost of changing to another drinking water resource as a possible consequence of PFAS contamination (see Table E.39) is not considered as a remediation technique and therefore not included in the table.
Section B.9. has shown that the substances contained in fluorine-free alternatives exhibit lower concern than PFASs used in firefighting foams, due to their lower hazards and more rapid biodegradation. On this basis, Wood (Wood et al., 2020) has concluded that it is currently not predicted as likely that remediation will be required as a result of the use of fluorine-free alternatives. Therefore, no remediation costs are expected to be incurred from the use of fluorine-free alternatives, implying potential savings from substitution of PFAS-based foams.
It is important to note that the costs refer to the remediation of legacy contamination that occurred from historical firefighting and/or training activities.
87 Please note remediation costs are highly site-specific and in certain cases can exceed the ranges provided. The estimates should therefore be considered order-of-magnitude cost ranges.

P.O. Box 400, FI-00121 Helsinki, Finland | Tel. +358 9 686180 | echa.europa.eu
375
Firefighting activities typically require more immediate clean-up (discussed further in the next paragraph) rather than long-term PFAS remediation. On this basis, it seems unlikely that the current use of PFAS-containing firefighting foams would lead to the same remediation costs as presented for legacy contamination above. In conclusion, the restriction scenarios could eliminate the potential risk of PFAS contamination which could cause costs of up to around €100 million per site.
For European sites the Nordic Council of Ministers report (NordicCouncil, 2019) describes remediation costs associated with contamination from PFASs ranging from several hundred thousand up to €40 million with one high-cost example for the Dusseldorf Airport, Germany estimating a total remediation cost of up to €100 million. In comparison to the costs provided in this report with the Nordic report remediation costs for PFAS-impacted sites (such as airports) will total from the single digit € millions to the lower double-digit € millions. For Schiphol Airport 50 000 m³ of impacted soil were removed at a cost of €600-800/m³.
As described in previous sections there is a variability in costs for soil remediation depending on factors such as amount of PFASs spilled, presence of other contaminants, the volume of soil that has been contaminated, the type of soil, the environmental setting of the impacted site, and the receptors impacted or threatened.
In the Nordic report cost ranges are given for three airports where costs were modelled. The modelled costs included both water and soil remediation using different methods and different levels of allowable remaining concentrations. The modelled cost ranges spanned from €2.1-24 million (Kristiansand Airport) over €0.4-7.1 million (Harstad/Narvik Airport) to €0.41-8.1 million (Svalbard Longyearbyen). While the remediation technologies were not reflected in the Nordic report those costs are consistent with the estimated cost range as developed in this report
There are large uncertainties in the numbers of sites that may require remediation and remediation costs are very case-specific and would differ significantly across these sites, so the following estimate of total remediation costs caused by the use of PFAS-based firefighting foams is indicative only:
The market analysis (see Annex A) estimated that there are likely to be several tens or potentially hundreds of thousands of sites that use or at least possess firefighting foams;
If all of these would require remediation (costing some €10s of million per site), the costs of cleaning could be at most in the region of trillions of Euros (based on an assumed 100 000 sites needing remediation);
However, in reality only a much smaller number of these sites would use PFAS-based foams in sufficient quantities and without adequate containment and immediate clean-up to require large scale remediation. More information on the total number of sites, real-world use of PFASs per site as well as implementation and effectiveness of best practices in terms of containment and immediate clean-up would be required to assess to which extent remediation is likely to be required in the future as a result of current use of PFAS-based firefighting foams; and
Therefore, realistically avoided remediation costs are more likely in the order of magnitude of hundreds of millions of Euros (assuming tens of sites requiring remediation at tens of millions of Euros per site) to billions of Euros (assuming hundreds of sites requiring remediation at tens of millions of Euros per site).
In addition to remediation of contaminated sites, it should also be considered that in some local areas the contamination by PFASs from firefighting foam use may lead to a need of changing of the drinking water reservoir (see Table E.39) or to interim alternative drinking water supply (Australia, several sites) (Department of Defence, 2022).

P.O. Box 400, FI-00121 Helsinki, Finland | Tel. +358 9 686180 | echa.europa.eu
376
E.4.3.5.4. Cost of clean-up
In addition to remediation which is driven by long-term accumulated contamination from historical releases, releases to the environment in the short-term require “clean-up”. According to the stakeholder consultation, there is local or national-level regulation governing the containment or prevention of release of firefighting foam or firewater runoff to the environment88. One exception that has been identified is firefighting activities in close vicinity to open water bodies (sea, lake), where it is very difficult to recover firefighting water runoff discharged into the sea or lake. In the case of the lake, this could lead to remediation being required. This would relate to very specific sites in specific locations, so it would not be appropriate to estimate ‘typical’ remediation or clean-up costs. In the case of the sea (particularly relevant for marine and offshore applications), remediation or clean-up would likely not be feasible, which raises particular concerns over the environmental impact of using PFAS-based firefighting foams in these applications.
Treatment costs for run-off can vary depending on the firefighting foam used, as described by (Wood et al., 2020):
Several stakeholders that have transitioned to fluorine-free foam reported that when fluorine-free foam was used, run-off was sent to water treatment, either though the normal sewer system to the municipal WWTPs; directly to on-site wastewater treatment; to other biological/chemical/mechanical treatment plants; or even drained directly to sea. One stakeholder reported that all PFAS-containing run off must be treated as a regulated waste which they do using high-temperature incineration;
Stakeholders did not provide information on the cost of wastewater treatment. These can vary significantly, depending on the contamination of the run-off from the flammable liquid itself, the soot and other contaminants from the fire site. For instance, (UNECE, 2019) reports a cost of €1 million for disposal of 2 000 m³ of firewater contaminated with chemicals in a sewage treatment plant and several chemicals waste disposal facilities, resulting from a fire in a factory in Germany in 2005. This is equivalent to €0.5 per litre, or €0.64 per litre in 2019 prices89. Typical costs for regular municipal wastewater treatment are much lower, for instance reported in the range of €0.0002 to €0.0005 per litre by (Moral Pajares et al., 2019) for various municipalities in Southern Europe. Hence, treatment costs for run-off for fluorine-free foam are likely between €0.0002 per litre and around €0.64 per litre. €0.3 per litre is assumed as an average for the purpose of the approximate estimation below;
Assuming that PFAS-containing run-off would be incinerated (in contrast to the baseline assumption for emissions), and assuming similar incineration costs as reported for the disposal of firefighting foams, the costs for treatment of PFAS-containing fire-water run-off could be around €1 per litre (range reported by (Wood et al., 2020) €0.3 to €11 per litre). Hence, treatment costs for run-off of fluorine-free foams could be around €0.7 per litre (range ca €0-
88 This was confirmed by stakeholders at least for England/Wales (The Environmental Permitting (England and Wales) Regulations 2010 (EPR 2010)), Sweden (local authority requirements for applications for new operation licenses), France (no details provided), Netherlands (no details provided), Germany (“Löschwasser-Rückhalte-Richtlinie” and the more detailed Bavarian “Guideline foam” which is legally binding in Bavaria and but also applied elsewhere).
89 2005 value converted to 2019 prices using Eurostat: HICP (2015 = 100) - annual data (average index and rate of change) (prc_hicp_aind).

P.O. Box 400, FI-00121 Helsinki, Finland | Tel. +358 9 686180 | echa.europa.eu
377
€11) lower compared to PFAS-based foams90; and
Data on the total amount of fire-water run-off containing firefighting foam per year in the EU was not available, but for illustration an example of costs per incident can be calculated. (UNECE, 2019) reports five major fire-incidents in which volumes of firewater used ranged between 2 200 and 38 000 m3. For incidents of this size, the difference in run-off treatment cost would be around €1.5-27 million (range €0-418 million) per incident91.
In cases where firewater run-off is not contained and further clean-up is possible (i.e. run-off was not discharged to sea), there may be savings from using fluorine-free foams in terms of reduced clean-up costs as described in (Wood et al., 2020):
When PFAS-based foam is used and contamination of the soil and water occurs, then very persistent chemicals are involved, which is not necessarily the case with fluorine-free foams. Stakeholders suggested in the consultation that clean-up and complex treatment is not always necessary after the use of fluorine-free foams. This could lead to potential cost savings in some cases;
However, (Wood et al., 2020) (Section 6) indicated that clean-up is driven to a large degree by the flammable liquid itself, the soot, water and “dirt” in general terms that contribute to the firefighting water runoff, rather than the firefighting foams. Therefore, a significant difference in clean-up costs between the different types of foam used is difficult to estimate, because the incremental costs of addressing PFAS contamination is difficult to separate from the wider clean-up costs; and
Clean-up costs are generally expected to be lower than remediation costs. Based on the estimates of remediation cost per site presented above, as a worst-case scenario, clean-up costs can be expected to be a few hundred thousand to a few million Euros per incident. In the absence of more specific data, for illustration of the potential order of magnitude of savings: assuming several tens of incidents per year using PFAS-based foams where clean-up is required and could be avoided if fluorine-free foams were used, the savings would be in the order of several millions to several tens of millions of Euros.
As it is not clear to what extent clean-up costs are affected by the use of PFAS firefighting foams, in the quantitative assessment of this report, savings from avoided clean-up are
90 Calculated as:
Central estimate: €1/l cost of incineration of PFAS-based foams minus €0.3/l cost of waste water treatment for fluorine-free alternatives = €0.7/l cost saving;
Low estimate: Waste water treatment could in some cases be more expensive (up to €0.64/l) than incineration (from €0.3/l). In these cases it is assumed that the less expensive option would be chosen and there would not be a saving of using fluorine-free foams compared to PFAS-based foams; and
High estimate: The maximum possible difference is in case of the upper end of the range of incineration costs for PFAS-based foams (€11/l) minus the lower end of the range of waste water treatment costs for fluorine-free alternatives (€0.0002/l) ≈ €11/l cost saving.
91 Calculated as: 2 200 m3 volume of fire-water run-off * €0.7/l treatment cost difference= €1.54 million.38 000 m3 volume of fire-water run-off * €0.7/l treatment cost difference= €26.6 million. These figures are rounded to two significant figures. For the wider range, instead of €0.7l treatment cost difference, €0/l (lower) and €11/l (higher) have been applied.

P.O. Box 400, FI-00121 Helsinki, Finland | Tel. +358 9 686180 | echa.europa.eu
378
assumed to increase to €10 million per year after all PFAS foams are replaced (i.e. during steady state). The sensitivity scenarios are calculated for +100% (low-cost scenario) and -50% (high-cost scenario) of that.
E.4.3.6. Cost of cleaning firefighting equipment to comply with the proposed concentration threshold
E.4.3.6.1. Description of the problem
When the replacement of PFAS foam concentrates with fluorine-free alternatives takes place, cleaning or replacement of (part of) the firefighting equipment will be needed to avoid contamination of the new foam concentrate with remaining PFASs, which could lead to exceed the concentration threshold specified in the legislation.
During the storage of PFAS-containing foams, fluorinated surfactants settle on the walls of the tanks as well as in pipe and hose lines of firefighting equipment. These would leach into any new foams filled into the equipment and therefore contaminate the new fluorine-free foams with PFASs, leading to continued PFAS emissions (LFV-Bayern, 2019); (JOIFFF, 2020). Therefore, before using any stationary or mobile equipment, that has already been used for the PFAS foam, it is necessary to clean or dispose and replace the equipment that cannot be cleaned (JOIFFF, 2020).
According to Arcadis, there is a common misconception that repeat washing of fire suppression systems with water can effectively remove PFASs, as for example after a few rinses, less PFOS may be detected in rinse water. However, PFASs can form a waterproof coating on surfaces, so PFAS concentration in the rinse water will not be representative of that still remaining entrained within fire suppression systems (JOIFFF, 2020). According to Arcadis, fluorine-free foams (F3) foams used to replace C8/C6 foams become contaminated with PFASs over time. After years of holding PFAS foam concentrates, the surfaces of piping system components including pipe, fittings, valves, and tanks are coated with PFASs which slowly dissolve into the replacement F3 foam.
This sub-section discusses the feasibility of achieving certain remaining concentrations of PFASs through the cleaning of equipment, with a focus on the associated cost. The analysis of alternatives has concluded that currently available cases of transformation to fluorine-free foams do not indicate significant costs of decontamination of equipment (including disposal of the liquid used for cleaning), with relatively simple methods being applied. However, the costs of cleaning of equipment will depend on the contamination thresholds requirements and the cleaning techniques used (some of them being significantly more expensive – see below). According to information from manufacturers, it may in some instances be less expensive to change part of the equipment than to clean it, especially for stationary equipment, so this is also discussed below.
The stakeholder’s consultation conducted by (Wood et al., 2020) on cleaning techniques and concentration thresholds provided the below information.
Several stakeholders commented on the feasibility of cleaning techniques to remove PFAS-containing foams from equipment. One stakeholder considered achieving PFAS contamination levels below 100 ppb to be unrealistic in most cases (from the September 2019 stakeholder workshop) and one stakeholder considered it to be almost impossible to achieve a contamination level of zero in a one-digit ppb framework with another stakeholder also commenting that the cleaning of systems and equipment is unlikely to bring the level of residual PFASs to zero. One stakeholder that has transitioned to fluorine-free foams (in the petrochemicals sector) reported that they had aimed for and achieved a level of 0.001% (10 000 ppb). To put this into context, the average concentration of PFASs in PFAS-based firefighting foams is some 2-3% (20-30 million ppb). One stakeholder commented that the level of cleanliness achieved by cleaning techniques would vary depending on the equipment

P.O. Box 400, FI-00121 Helsinki, Finland | Tel. +358 9 686180 | echa.europa.eu
379
and material being cleaned. The need to accommodate an allowance for residual legacy PFASs even after equipment has been cleaned was also discussed.
Stakeholders also commented on how cleaning techniques and costs may be impacted by different PFAS contamination thresholds. Where contamination threshold levels are set high, following the cleaning of equipment, a higher level of residual PFAS-containing foam would be allowed to remain (compared to if a lower threshold limit were set). One stakeholder therefore considered the implementation of a high contamination threshold to be “pointless”, due to its reduced effectiveness in eliminating PFAS emissions. With a low contamination threshold level, a lower level of residual PFAS-containing foam will be allowed to remain in equipment following cleaning and cleaning will be more costly than if a higher threshold level were set. Also, where contamination levels cannot be achieved through cleaning, equipment will need to be replaced at a cost. Equipment replacement is more likely to occur where threshold levels are set low.
Regulation in Queensland, Australia, allows for threshold concentrations for replacement foam stocks to be 10ppm (mg/l) for PFOA/PFHxS and 50ppm (mg/l) for PFOA92. Additionally, one stakeholder commented that newer C6 foams are purer and have lower concentrations of impurities than older C6 foams and suggested that different threshold levels for different PFAS-containing foams may be required.
For confirmation that threshold levels have been achieved, cleaning techniques may need to be professionally endorsed or, following cleaning, the presence and concentration of remaining PFASs tested. Stakeholder responses reported some concern over the suitability of existing methods to measure and detect the presence and concentration of remaining PFASs. One stakeholder reported that measuring very low concentrations e.g. at ppb-concentration was not possible. One stakeholder suggested that following cleaning, an assessment should be undertaken at an accredited laboratory for verification that threshold levels have been achieved. Stakeholder responses suggested that laboratories are able to analyse down to a level of 30-150 ppb. In the REACH restriction on PFOA, a concentration limit of 25 ppb of PFOA including its salts or 1 000 ppb of one or a combination of PFOA-related substances was adopted, based on the capabilities of analytical methods, according to the RAC’s opinion on the restriction dossier. Information on the cost of analysis was not provided. A cost analysis concerning the measurement of cleaning success could therefore be done as part of this analysis.
Where threshold limits cannot be achieved through cleaning techniques or where cleaning techniques are too difficult or too costly to achieve, the replacement of equipment is likely to be required. The cost of replacing equipment will vary across industries and appliances.
Overall, stakeholders considered the cleaning of equipment to be potentially a costly operation, but little quantification of costs was provided in the consultation, making it difficult to undertake a cost analysis. Several users have already transitioned from using PFAS-containing firefighting foams to PFAS-free firefighting foams. Several consultees report there to be no significant costs associated with new equipment required. Although some stakeholders also report the replacement of fire-extinguishing systems and the cleaning of equipment to be costly. The cost of cleaning existing equipment will depend upon how effective cleaning techniques are for each appliance, as well as on the threshold contamination levels set. Where equipment cannot be sufficiently cleaned to meet threshold contamination levels, replacement will be required.
E.4.3.6.2. Techniques to clean equipment and associated costs
An additional stakeholders survey and literature search was conducted by Ramboll in 2021
92 Obtained from stakeholder consultation. Also available online here: https://www.qld.gov.au/environment/pollution/management/disasters/investigation-pfas/firefighting-foam/policy-overview

P.O. Box 400, FI-00121 Helsinki, Finland | Tel. +358 9 686180 | echa.europa.eu
380
(Ramboll, 2021) to collect more information on the methods and costs of equipment cleaning. The outcome summary is presented below and a more extended description of the cleaning techniques is presented in Appendix 1.
Different institutions (manufacturers, remediation companies, public authorities) define guidelines and instructions for the cleaning process, which fire departments and companies can make use of. Based on current literature and stakeholder input, the following passages encompasses current go-to techniques. In some cases, the described techniques are the same as for the disposal of PFAS-contaminated fire run-off or cleaning water described in section E.4.3.7. Here, only information to the cleaning of equipment is highlighted. “Non cleaning”
Based on the information collected, there seems to be no official guideline that lays out the practical details of the transition from PFAS-based foam to fluorine free foam, describing for example cleaning procedures and accepted remaining levels. Thus, companies and fire brigades have developed their own replacement strategy. Based on the input of stakeholders, this included, in comparison to “cleaning techniques”, no washing steps with water. One stakeholder from Germany shared their experiences after transition from C8 PFAS-based foam (3M Lightwater which is supposed to be based on PFOS) to C6 PFAS-based foam without a cleaning procedure. After the replacement, the C6-based foam was tested for its PFAS content and high concentrations of PFOS were found. In the end, this observation led to the development of a cleaning procedure specialized on foam concentrate tank located at industrial fire brigades. This procedure is explained in detail in Appendix 1.
Another stakeholder from Norway stated that when a first round of replacement of PFASs to non-fluorine foam took place, no official cleaning protocol was used. The PFAS-foam was simply drained and new foam (fluorine-free) was filled in. However, follow-up measurements then showed that PFASs were still detectable.
In terms of replacement procedure, according to one stakeholder, the PFAS-foam was simply drained and new foam (fluorine-free) was filled in. No more information available.
The remaining PFAS concentrations from legacy C8 PFAS contamination levels as measured by the PFOS concentration were reported to be 28 000 µg/kg (which is higher than the threshold of 10 000 μg/kg according to the POP-regulation (10 ppm)). The stakeholder from Norway used a limit of 0.001% (10 ppm) PFASs and had to refill tanks twice in a couple of cases to get below this limit. No information on costs of the actual replacement strategy was available. Secondary costs are due to the incineration of the replaced foam.
As highlighted above, both stakeholders have been faced with contamination of the new foams with legacy PFAS substances, like PFOS. Based on this contamination both stakeholders decided to develop cleaning strategies and had to start the process again.
Cleaning techniques
Several equipment cleaning techniques are described in detail in Appendix 1. Table E.41 below provides a summary with associated costs.

P.O. Box 400, FI-00121 Helsinki, Finland | Tel. +358 9 686180 | echa.europa.eu
381
Table E.41. Comparison between equipment cleaning procedures Cleaning
Procedure
BIOEX
Cleaning Procedure
AngusFire
Cleaning Procedure
Arcadis
Cleaning Procedure
PerfluorAd
Cleaning Procedure
LfU
Cleaning Procedure
FRV
Cleaning Procedure
FPA AUS
Cleaning Procedure
DoD AUS
Cleaning Procedure
WFVD
Party Foam manufacturer
Foam manufacturer
Consultancy Company Authority Fire brigade and workers association
Authority Department of Defence Australia
Association
Background Cleanout protocol is recommended in case downstream users don’t want to replace pump and storage tank.
Cleanout protocol is recommended when foams should be replaced. It is not a decontamination strategy.
Protocol uses specialized biodegradable cleaning agents such as V171
Protocol uses specialized cleaning agent (PerfluorAd).
Cleaning instructions of equipment when transitioning to fluorine-free foam extinguishing agents
Cleaning procedure developed a decontaminate procedure for appliances (fire trucks).
Fire Rescue Victoria and the United Firefighters Union developed a decontaminate procedure for appliances (fire trucks).
Transition of all Army, Air Force and Broadspectrum firefighting vehicles to a suitable Fluorine Free Foam (F3) product
Foam concentrate tank cleaning procedure, that cleans the tanks accordingly and transition to fluorine free foam
Cleaning procedure (short)
Simple replacement including scrubbing and hot water rinsing
Simple replacement including water rinsing
Cleanout protocol uses a sequential series of aqueous rinses, high- pH flushes and application of the cleaning agent.
Cleanout protocol uses flushing with PerfluorAd Agent.
Simple replacement including water rinsing until no foam is detectable
32-stage deconta-mination process including exhaustive water rinsing
Simple replacement including water rinsing
Detailed deconta-mination process including exhaustive water rinsing
Simple replacement including water (hot) rinsing
Equipment Tanks Tanks Fire brigade vehicles and for stationary fire extinguishing system
Fire brigade vehicles and for stationary fire extinguishing system
Tanks Fire brigade vehicles
Tanks Fire brigade vehicles
Fire brigade vehicles
Final disposal addressed?
Yes, but only for the foam.
Yes, high temperature incineration
Yes, high temperature incineration
Yes, high temperature incineration
Yes, high temperature incineration
Yes, high temperature incineration
Yes, high temperature incineration
Yes, according to local regulation
Yes, high temperature incineration
Remaining PFASs concentration
No information
No information Final water flush/rinse contained around 0.1 µg/l PFASs as measured for the sum of 28
Final rinse with fresh water contained less than 1.0 µg/l total PFASs, very often
Final rinse with water contained 10 ng/l (10 ppt) of each of the 13 standard PFASs
Final rinse with water contained 70 ppt as measured by sum of PFOA and sum of PFHxS and PFOS
Final rinse with water contained 70 ppt as measured by sum of PFOA and sum of
No information Final rinse with water contained around low µg/l of each of the 13 standard

P.O. Box 400, FI-00121 Helsinki, Finland | Tel. +358 9 686180 | echa.europa.eu
382
PFASs (according to TOP 4 µg/l)
less than 0.3 µg/l to 0.0 µg/l can be achieved.
(according to German DIN standard).
PFHxS and PFOS
PFASs (according to German DIN standard)
Costs No information
No information No information €20 000-€25 000 per vehicle (incl. wastewater handling)
€100 000 -€200 000 per vehicle (permanently installed tank in the vehicle is cleaned)
No information No information No information Around €4 000 per vehicle
Additional information
No information
No information Limited case studies, information by provider.
Procedure should be followed by GAC or incineration of water. Accreditation by German authorities.
Used in Bavaria (Germany) for several municipal fire brigades.
Over 145 FRV and firefighting appliances and over 150 km firefighting hoses have been decontaminated
No information No information No information

P.O. Box 400, FI-00121 Helsinki, Finland | Tel. +358 9 686180 | echa.europa.eu
383
E.4.3.6.3. Conclusion on available cleaning procedures for firefighting equipment
The following conclusions can be made for available cleaning procedures for firefighting equipment:
The procedures described in this report were authored by regional (Germany) and national (Australia) authorities, private companies (PerfluorAd & Arcadis), associations and lastly by manufacturers of foams (BioEx).
All of them use extensive cleaning steps with (sometimes hot) water, which can also soak in overnight
The commercial technique uses also cleaning agents which precipitate the PFASs
In some, a replacement of highly contaminated material is suggested to avoid high remaining PFAS-concentrations
The success (remaining PFAS concentration) is measured using a variety of analytical techniques and respective PFAS-species.
Most of the procedures identified are for fire brigade vehicles and/or tanks. Cleaning costs are reported to be between €4 000 and €200 000 per vehicle. The highest costs are reported when using the LfU-Guideline. In this case, costs of €100 000-€200 000 and remaining PFAS levels in the range of 10 ppt are cited. When using the PerfluorAd cleaning procedure, costs between €20 000 and €25 000 per vehicle and a remaining PFAS level of 0.001 µg/l (0,001 ppm) are reported. Around €4 000 are reported by the WFVD (in this case no costs for employees is considered as is foreseen that the firefighters will clean the tanks). The achievable concentration is reported with 57 µg/L (0.057 ppm).
Two procedures are also claimed to be suitable for installed firefighting systems (sprinklers). However, in this case, only very limited data is available. According to a stakeholder from Germany -Mr. Cornelsen - the PFAS-concentrates normally are contained in the tank, tank to mixer pipes, and finally the mixer (if there has been no incidents/training with PFAS-containing firefighting foam).
A large company in the chemical sector indicated that there would be costs of around €1 500 000 per installed system. However, in this case, no remaining PFAS-concentration was indicated.
According to Eurofeu, the transition from fluorine-containing foam agents to fluorine free ones in fixed installed systems, trucks and storage facilities requires a much more in-depth cleaning compared to a like-for-like foam agent exchange. This factor particularly heavily depends on the thresholds to achieve. However, the cost for cleaning including disposal cost for foam agents and cleaning residues as well as replacement of systems or parts thereof are considered to be very high and have a high potential to grow exponentially depending on the conditions to reach (Eurofeu, 2020b).
In most cases, incineration of the cleaning water is recommended
Only very limited data for long-term success of cleaning procedures
Based on this information, the dossier submitter assumes that the cost of reaching the proposed 1 000 ppb level varies between €20 000 and 200 000 per site depending on the sector of use (see section on concentration limits in the main report). This estimate accounts for the need to clean-up several equipment/systems per site, and also the possibility that

P.O. Box 400, FI-00121 Helsinki, Finland | Tel. +358 9 686180 | echa.europa.eu
384
higher impurity levels in the foam are reached during their storage. This could happen due to remaining PFASs, adhering to surface of the equipment, being released in the foam over time. For lower thresholds the costs could be significantly higher.
E.4.3.7. Disposal of PFAS-contaminated fire run off and equipment cleaning water
A stakeholder survey and literature search performed in 2021 by Ramboll (Ramboll, 2021) provided the below information on the available techniques and costs for disposal of run-off waters contaminated with PFASs. Table E.42 below summarises and compares the disposal techniques for PFAS firefighting foam concentrate, fire run-off and equipment cleaning water. Some techniques are suitable for handling these three types of PFAS waste, some are only applicable to fire run-off and equipment cleaning water.
All the ROs include the requirement to minimise releases of PFASs to environmental compartments as far as technically and practically possible and excluding any wastewater treatment, irrespective of any pre-treatment. Possible disposal techniques are e.g. hazardous waste incinerators or cement kilns. Collected firewater run-off could therefore for instance be entirely sent to hazardous waste incinerators or first sent to a pre-treatment step able to concentrate the PFASs in one medium which would be sent for destruction (HWI, cement kiln or other technique with equivalent performance) and the cleaned water (below the PFAS threshold mentioned in the restriction entry) sent to a wastewater treatment plant.
Collecting the PFAS waste, including the firewater run-off in case of fire incidents is recognised to particularly challenging (if ever possible) for most of the sectors, with the probable exception of Seveso establishments which already have secondary containment in place. For this reason, it is proposed that this emission minimisation is made by applying sector best practices or to the extent technically and economically feasible. It is not possible to propose in this restriction proposal the techniques which should be used for the collection of the firewater run-off and the minimum efficiency they have to reach. These elements are specific to the sector, user, site and fire scenario. For the same reason, the costs of such collection techniques have not been estimated directly but instead, the overall cost of collection systems and disposal of the firewater run-off has been approximated with the cost of incineration of the firewater run-off in hazardous waste incinerators (€1000 per tonne of foam). The sensitivity scenarios are calculated for -50% (low-cost scenario) and +100% (high-cost scenario) of that.

P.O. Box 400, FI-00121 Helsinki, Finland | Tel. +358 9 686180 | echa.europa.eu
385
Table E.42. Comparison of disposal techniques for PFAS-contaminated water (fire run-off and equipment cleaning), PFAS-based firefighting foams in hazardous waste incinerators (HWI) and cement kilns
Granulated Active Carbon (GAC)
Ion exchange (IX) Precipitation agent PerfluorAd®
Foam fractionation and ozofractionation
Incineration (HWI and cement kilns)
Background The treatment of PFAS-contaminated water (or PFAS-containing AFFF) with activated carbon is based on the adsorption of a molecule on the surface of the activated carbon. This is facilitated by van-der-Waals interactions between the activated carbon and the target molecule. As these interactions can occur between any two molecules a broad variety of compounds may be adsorbed, including some PFASs.
According to ITRC, IX is an effective sorbent for other contaminants and has historically been used for a variety of water treatment applications (for example, nitrate, perchlorate, arsenic). To date, IX for PFAS removal from water is limited to ex situ applications.
PerfluorAd changes the solution equilibrium of PFASs in water. The reaction modes are precipitation and flocculation, mainly based on ionic interaction.
The process selectively separates PFASs from water by injecting compressed air (foam fractionation) or ozone (ozone fractionation) into the water in the form of air bubbles. PFAS surfactants adhere to the bubble walls and are thus transported to the surface. The PFAS-enriched foam is collected at the water surface for further destruction-based treatment. The treated water typically goes through a further treatment step (e.g. GAC)
HWI: literature indicates that hazardous waste incinerators at temperatures of 1 100 °C are able to destroy PFASs at more than 99%.
Cement kilns: the co-incineration of PFAS waste in cement kilns is a viable option as they reach temperatures of up to 1 800 °C with residence times of ~20 seconds.
Technical performance
GAC removal capacity for PFOS is greater than for PFOA, but both can be effectively removed. In general, short- chain PFASs have lower GAC loading capacities and faster breakthrough times but could be effectively treated if changeout frequency is increased. There are currently no published studies on the effectiveness of GAC in removing cationic, zwitterionic, and anionic precursor compounds.
Various anion exchangers have been identified with a higher adsorption capacity towards PFASs than activated carbons. Similar to the adsorption onto activated carbon, the affinity of per- and polyfluoroalkyl sulfonates (PFSA) to ion exchangers is higher than those of per- and polyfluoroalkyl carboxylates s (PFCA), and long-chain PFASs are sorbed preferably compared to short-chain PFASs.
The removal efficiency of PerfluorAd depends on the chain length and the polarity of the PFASs. The long-chain sulfonic acids (PFSAs) show the best removal efficacy. PerfluorAd is used as the first PFAS treatment step within a treatment train (followed by GAC and/or IX).
No selectivity for PFAS-sub species reported. The process is not only suitable for the treatment of water, but also for sludge with a solids content of up to 20 %. Ozonofraction is also used as the first PFAS treatment step within a treatment train (followed by GAC and/or IX).
HWI: according to current knowledge high temperature incineration in HWIs is an adequate technique to dispose, as PFASs are mineralised to more than 99%.
Cement kilns: data from Australia and the US seem to indicate that PFASs can be effectively mineralized in cement kilns.
Remaining PFAS concentration
Proposed EU drinking water threshold of 0.1 µg/L for individual PFAS components (0.5 µg/L for total PFASs) are achievable by activated carbon treatment, but may require the use of several beds in series
Proposed EU drinking water threshold of 0.1 µg/L for individual PFAS components (0.5 µg/L for total PFASs) are achievable using ion exchange resins.
Designed for highly contaminated water with PFAS concentrations greater 0.3 µg/L. PerfluorAd is used as the first treatment step within a treatment train. Thus, this process is not intended to achieve final target threshold values (e. g. 0.1 µg/L) as it is recognised that a further treatment step is required.
For PFAS concentration levels below 0.3 µg/L, high elimination down to a few ng/L could still be achieved
HWI: remaining PFAS levels in bottom ash are very low. PFAS levels in exhaust air are unknown.
Cement kilns: data from Australia indicate no contamination of the cement and very high PFAS destruction efficiencies
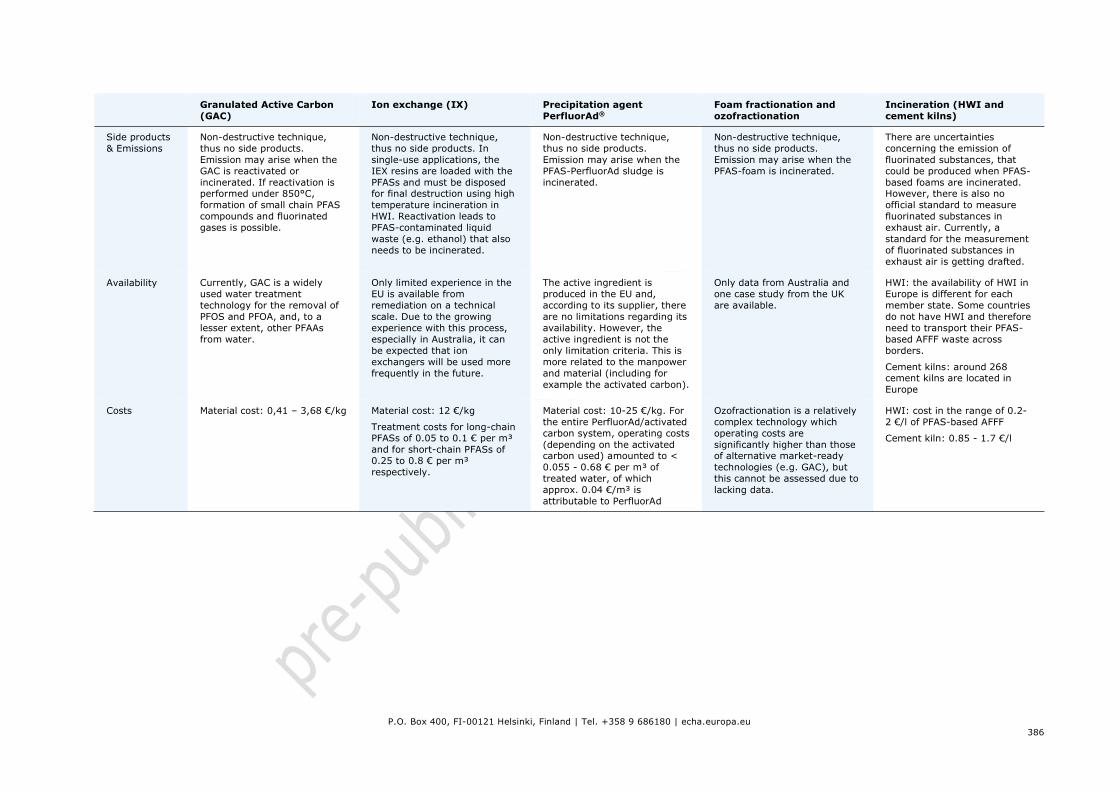
P.O. Box 400, FI-00121 Helsinki, Finland | Tel. +358 9 686180 | echa.europa.eu
386
Granulated Active Carbon (GAC)
Ion exchange (IX) Precipitation agent PerfluorAd®
Foam fractionation and ozofractionation
Incineration (HWI and cement kilns)
Side products & Emissions
Non-destructive technique, thus no side products. Emission may arise when the GAC is reactivated or incinerated. If reactivation is performed under 850°C, formation of small chain PFAS compounds and fluorinated gases is possible.
Non-destructive technique, thus no side products. In single-use applications, the IEX resins are loaded with the PFASs and must be disposed for final destruction using high temperature incineration in HWI. Reactivation leads to PFAS-contaminated liquid waste (e.g. ethanol) that also needs to be incinerated.
Non-destructive technique, thus no side products. Emission may arise when the PFAS-PerfluorAd sludge is incinerated.
Non-destructive technique, thus no side products. Emission may arise when the PFAS-foam is incinerated.
There are uncertainties concerning the emission of fluorinated substances, that could be produced when PFAS-based foams are incinerated. However, there is also no official standard to measure fluorinated substances in exhaust air. Currently, a standard for the measurement of fluorinated substances in exhaust air is getting drafted.
Availability Currently, GAC is a widely used water treatment technology for the removal of PFOS and PFOA, and, to a lesser extent, other PFAAs from water.
Only limited experience in the EU is available from remediation on a technical scale. Due to the growing experience with this process, especially in Australia, it can be expected that ion exchangers will be used more frequently in the future.
The active ingredient is produced in the EU and, according to its supplier, there are no limitations regarding its availability. However, the active ingredient is not the only limitation criteria. This is more related to the manpower and material (including for example the activated carbon).
Only data from Australia and one case study from the UK are available.
HWI: the availability of HWI in Europe is different for each member state. Some countries do not have HWI and therefore need to transport their PFAS-based AFFF waste across borders.
Cement kilns: around 268 cement kilns are located in Europe
Costs Material cost: 0,41 – 3,68 €/kg Material cost: 12 €/kg
Treatment costs for long-chain PFASs of 0.05 to 0.1 € per m³ and for short-chain PFASs of 0.25 to 0.8 € per m³ respectively.
Material cost: 10-25 €/kg. For the entire PerfluorAd/activated carbon system, operating costs (depending on the activated carbon used) amounted to < 0.055 - 0.68 € per m³ of treated water, of which approx. 0.04 €/m³ is attributable to PerfluorAd
Ozofractionation is a relatively complex technology which operating costs are significantly higher than those of alternative market-ready technologies (e.g. GAC), but this cannot be assessed due to lacking data.
HWI: cost in the range of 0.2-2 €/l of PFAS-based AFFF
Cement kiln: 0.85 - 1.7 €/l

P.O. Box 400, FI-00121 Helsinki, Finland | Tel. +358 9 686180 | echa.europa.eu
387
E.4.4. Other economic impacts
The cost elements monetised in this report do not directly cover all costs of adopting alternatives. However, all the additional transitional costs described below could be considered to be covered by the cost of using alternative foams or cost of technical changes. It has not been possible, despite attempts to obtain further quantitative information on them. However, several consultees noted that whilst additional costs were incurred, these were not significant and had proved manageable. Available quantitative information is summarised below. Further information is also presented in the case studies.
Table E.43. Additional quantitative data on economic costs Testing costs Storage costs Other costs including
regulatory approvals
No quantitative data has been obtained via stakeholder consultation, despite several requests for such information.
Testing would be associated with costs for sample volumes of foam (likely several different products) and with staff time and training.
Experience in the Norwegian petrochemical sector (Equinor) included additional costs related to purchasing additional volumes of foam and to replace the previous PFAS containing foams. No information was provided on whether there were costs implications related to the need for additional storage space.
Experience in the Norwegian petrochemical sector (Equinor) indicates costs (labour time) in the region of €360 000 for a range of support in their transition at a total of 45 sites (so in the order of c. €10 000 per site). This would therefore appear to be an upper bound cost for a company transitioning.
E.4.4.1. Regulatory approvals
Other economic impacts could include regulatory approvals and those associated with bringing new products to market. Given that the market assessment noted at least some current use of fluorine-free products in all sectors, further adopting fluorine-free foams would appear to be a continuity of an existing transition – so a lot of the initial costs associated with new products development will have already been incurred.
E.4.4.2. Testing and training costs
Whilst there are several categories of foam designed to address fires from specific fuels, consultation stressed that there are many more different types of overall fire systems, each with slightly different requirements. There is evidence that several downstream users are currently testing fluorine-free firefighting foams, and that several others have now successfully transitioned. All stressed the importance of testing the foam compounds. This imposes costs in purchasing (possibly several different types of products), along with storage, training of personnel, performance monitoring and evaluation, disposal and clean-up. Consultees also noted costs from periodic testing of the fluorine-free products once in storage, to ensure that performance is not degraded; this was in the context of some initial uncertainty over shelf life for some products, which now appears to have been addressed. Whilst these costs were acknowledged, the evidence indicates they are one-off, comparatively small and were absorbed by the downstream users.
E.4.4.3. Storage costs (including storage during transition)
Whilst technical performance of alternatives was concluded to be acceptable in most cases, some noted a “higher sensitivity” of fluorine-free foam, compared to PFAS foams; i.e. they allow for less flexibility in use, requiring multiple types of foam to be stocked. Additional storage costs could occur during a transition when both PFASs and fluorine-free may have to

P.O. Box 400, FI-00121 Helsinki, Finland | Tel. +358 9 686180 | echa.europa.eu
388
be stored. Where evidence has been provided in the stakeholder consultation, it was noted that these costs were manageable and could be mitigated via phased transition. It was acknowledged these costs are generally greater for fixed than for mobile applications, and where larger volume are used and stored.
Labelling cost
The proposed restriction requires to label the packaging of firefighting foams containing PFASs. This is to ensure the proper handling of these foams throughout all lifecycle stages. The economic impact is considered insignificant in comparison to other economic impacts, as producers know the content of their foams and labelling is always done. This requirement also ensure that users know the content of foam concentrates and can label any collected fire water run-off and other PFAS waste resulting from use of the foams.
E.5. Human health and environmental impacts
The human health and environmental impacts are discussed in the section 2.5 of the main report. More detailed information on changes in emissions is provided below.
E.5.1. Human health impacts
See section 2.5 in the main report.
E.5.2. Environmental impacts
E.5.2.1. Approaches taken for the emissions calculations under the five ROs
Below is a brief description of the approach used to calculate emissions (and costs) for the different ROs:
• RO1, consisting of a ban on placing on the market, but use is allowed until depletion of stocks
• RO2, comprising a ban on placing on the market and use. This means that the use is allowed only during the use/sector-specific transitional periods.
• RO3 is similar to RO2 but considers an additional reduction of emissions from the ban on a formulation for export. Exports would be allowed for a transitional period of ten years, then banned, with reduced emissions for formulation.
RO4 applies a ban on use, similar to RO2, but with a derogation system for Seveso establishments and defence uses. Seveso establishments (assuming here that they represent 98% of the volume of PFAS foams sold to the oil/(petro)chemical sector) and the defence uses would be eligible for a permit system allowing continued use under certain conditions. The emissions calculations for this scenario are based on RO2 but where the oil/(petro)chemical and defence sectors would be assumed to continue using the same amounts of PFAS foams during ten years and then a continuous linear decline would take place due to the progressive substitution during the next 20 years till 0 (i.e. a total timeline of 30 years to reach 0 use for these sectors). This continued use does not apply for training and testing under these sectors since they are still banned for all sectors 18 months after entry into force of the restriction.
RO5 is similar to RO2, but use remains allowed after the respective transitional periods if strict containment and safe disposal is in place. This means a restriction on the placing on the market for all uses, unless the releases are fully contained and disposed of safely. In practice it is assumed that only the Seveso establishments portion (assumed to represent 98 % of the sales of PFAS foams of the oil/(petro)chemical sector) could meet this criterion, i.e. that all uses except this sector would be banned after the transitional periods referred above. The ”lighter” risk management measures

P.O. Box 400, FI-00121 Helsinki, Finland | Tel. +358 9 686180 | echa.europa.eu
389
(RMMs) for training/testing and incidents used under the other ROs during the transitional periods (collection as much as practically and economically feasible followed by safe disposal) are also applicable here for all sectors. The stricter RMMs (“full containment” and safe disposal) would in practice apply only to the Seveso portion of the Oil/(petro)chemical sector after ten years. This continued use does not apply for training and testing, which will still be banned for all sectors 18 months after entry into force of the restriction. To calculate the emissions over the assessment period, the Dossier Submitter assumes that the use of PFAS foams by the Seveso establishments would remain constant over the whole period (i.e. no substitution to fluorine-free alternatives).
Additional risk management measures imposed by the ROs
Compared to the baseline, additional risk management measures are proposed in the five ROs to reduce the emissions of PFASs from the continued used during the transitional periods.
Among them, all ROs foresee the collection of all PFAS releases, especially originating from the use of the firefighting foam in training, testing and live incidents to the extent technically and economically feasible, followed by safe disposal. RO5 foresees even stricter RMMs after the sector/use-specific transitional period with a requirement for minimisation (full containment) of all the releases, i.e. even in case of large fire incident. The appropriate disposal of remaining stock of firefighting foam concentrates after the end of the transitional periods is also foreseen under certain ROs.
The same emissions model used to calculate the baseline was used to calculate the emissions under the five ROs. The model takes into account the risk management measures (RMMs) proposed in the ROs to estimate their impact on the emissions of PFASs in the environment, assuming that the collected PFASs are sent to incineration.
As regard to training/testing, the baseline scenario considers that all firewater run-offs are collected but sent to WWTP, whereas under the five ROs, it is assumed that firefighting foams run-off waters from training/testing which are collected are incinerated instead of being discharged to the WWTP. As regard to the use of foams for live incidents, a percentage of firewater runoffs is assumed to be collected and sent to incineration (see assumptions taken for the input parameters in section 3 “Assumptions, uncertainties and sensitivities” of the main report). The emissions from the in-use phase under the five ROs can be schematically described as in Figure E.4 below.

P.O. Box 400, FI-00121 Helsinki, Finland | Tel. +358 9 686180 | echa.europa.eu
390
Training
Live incidents
Waste incineration
Emission to air
Emission to water
Emission to soil
Emission to sea
Figure E.4. Material flow diagram for the life cycle stages training and incidents, including RMMs as foreseen in all the ROs. As regards to the waste phase, the model aggregates the quantities coming from the different pathways and assumed to be all managed by incineration (end-of-life unused stocks and disposal of remaining stocks at the end of the transitional period, where applicable according to the ROs).
The assumptions taken for the annual usage rate under the best scenario imply that the foams are fully used before their expiry date, however, the sensitivity analysis calculated the emissions with lower foam annual usage rates (see “high scenario”), which results in quantities of foam not being used before having reached their expiry date and consequently disposed of by incineration.
Summary of assumptions applied in the model
Three different scenarios have been calculated to simulate the emissions resulting from the annual amount of PFASs used in firefighting foam, namely “Low”, “Best” and “High” estimates (sensitivity analysis). These scenarios are used in the model for simulating the emissions in the five ROs. All these parameters can be easily adjusted in the Excel sheets so that - if needed - additional scenarios can be simulated.
Under the “low” scenario, all input parameters have been set at the values indicated in the low scenario column described in section 3 “Assumptions, uncertainties and sensitivities” of the main report. The same applies to the “high” scenario where all input parameters have been set at the values indicated in the high scenario column. It should be highlighted that, due to the interlink between some input parameters or other values used in the model (e.g. annual usage rate for training/incident and stock of foam, the latter having an impact on the amount of emissions due to stock leakage), varying one input parameter can have various impacts on the overall calculated emissions (see Appendix 8 sensitivity analyses for additional details).

P.O. Box 400, FI-00121 Helsinki, Finland | Tel. +358 9 686180 | echa.europa.eu
391
Some input parameters can affect the overall emission reduction in different directions depending on the scenario assessed (e.g. with or without RMMs), therefore, the low (high) emission scenario presented above is not necessarily the ones leading to an absolute minimum (maximum) of avoided emissions. Nevertheless, these are considered to provide a useful indication of the estimated impact of a variation of several input parameters on the avoided emissions due to the ROs, and to represent a meaningful range of results.
In the avoided emissions tables below for each ROs, the cumulative emissions over 30 years under a certain scenario (low, best or high) have been compared with the corresponding scenario of the baseline (i.e. the cumulative emissions from the RO1 “low” scenario was compared with the baseline scenario using the “low” scenario input parameters; RO1 “best” scenario compared with baseline best scenario and RO1 “high” compared with baseline high scenario).
The approach for the calculations in general, and for the different ROs specifically, is further explained in Appendix 8. The input data for the model are given in the table in section 3 “Assumptions, uncertainties and sensitivities” of the Annex XV report and are based on expert judgement, literature and a stakeholders’ consultation.
The description of the calculations made and the results of those for each RO are presented in more details in Appendix 8. A summary of it is provided here below with the main results.
To illustrate the impact on emissions reduction due to the risk management measures (collection as technically and economically feasible for training/testing and incidents), the calculations have been done with and without RMMs for each RO. It should be highlighted that for RO2 to RO5 there is no visible impact of the RMMs for training in the calculations. This is because the RMMs have been calculated as starting in beginning of year 2, while the proposed transition period for training and testing (1.5 years) has been calculated in a way that the emissions from this use are already over at the beginning of year 2 and the remaining stock incinerated93. However, in practice the RMMs applicable from six months after the entry into force for both training/testing and incidents will also have an effect for training/testing and reduce further the emissions (even though not visible in the calculations performed in this report).
RO1
Under RO1, during the transition period a BAU scenario is assumed with constant stock, use and emissions, resulting in a flat emission line. After the transition period, a decrease in use and stock is assumed.
In the first year after the transition period, emissions decrease because:
1) the formulation corresponding to the concerned use stops,
2) the stock decreases and consequently the leakage of the stock decreases, and
3) the use decreases and consequently, the emissions from the use of the foams also decrease.
In the following years, stock and use will continue to decrease, resulting in linearly decreasing emissions. The stronger decrease during the first year after the transition period is caused by
93 The restriction proposal suggests the RMMs to be mandatory from 6 months after entry into force, however, for the simulation in Excel, since it is built per year, for simplicity these RMMs were considered as starting to take place one year after entry into force (i.e. at the start of year 2).

P.O. Box 400, FI-00121 Helsinki, Finland | Tel. +358 9 686180 | echa.europa.eu
392
the formulation stop.
The table below describe the total avoided emissions and the evolution of emissions over time under different scenarios (with and without RMMs).
Table E.44. Avoided emissions for the ‘Low’, ‘Best’ and ‘High’ RO1 scenario with and without RMM for training and incidents in t PFASs after a period of 30 years
t PFASs without RMM with RMM
training and incidents
Low emission scenario*
5 328 7 603
Best emission Scenario*
7 867 11 812
High emission Scenario*
10 514 14 055
* Outcome of all "low / central / high values" for avoided emissions together, compared to the baseline scenario using all "low / central / high values" respectively
When RMMs are applied to both training and incidents, emissions can be reduced by around 12 000 tonnes PFASs under the best estimate scenario. When the RO1 low scenario is compared with the baseline low scenario values and the RO1 high scenario is compared with the baseline high scenario values, the highest reduction is observed for the "High" emissions estimate scenario, followed by the "Best" and "Low" emissions estimate scenarios. The highest emission reduction is obtained for the “High” emissions estimate scenario, which combines all "high parameter" estimates as indicated in the table in section 3 “Assumptions, uncertainties and sensitivities” of the main report.
The figures below describe the evolution of emissions over time (cumulative and yearly emissions) for RO1 under the best scenario value (with and without RMMs).
Figure E.5 shows, as an example, the cumulative total emissions for the scenario RO1 with and without RMM (“Best estimate scenario”). The figure clearly shows that cumulative emissions are lower when RMMs are applied. For Seveso establishments for example, applying RMM reduces emissions by a factor of about 5 and for training and testing it reduces emissions by a factor of 3.

P.O. Box 400, FI-00121 Helsinki, Finland | Tel. +358 9 686180 | echa.europa.eu
393
Figure E.5. Cumulative total emission (t PFASs) for scenario RO1 with and without RMM (all sectors, “Best” estimate scenario).

P.O. Box 400, FI-00121 Helsinki, Finland | Tel. +358 9 686180 | echa.europa.eu
394
Figure E.6. Yearly total emissions (t PFASs) with and without RMMs for scenario RO1 (all sectors, “Best” estimate scenario). Additional illustrations of the evolution of the emissions per sector and environmental compartments are provided in Appendix 8.
RO2
In RO2 a business as usual scenario with constant stock, use and emissions during the transition period is assumed, this results in a flat emission line.
In the first year after the sector/use-specific transition period, the stock will be incinerated. All other emission sources for this sector/use due to formulation, use, leakage and expiration of stock will stop. This results in a lower emission than during the transition period because it is assumed that only 1% will be emitted to air during incineration.
In the second year after the sector/use-specific transition period, there will be no more emissions.

P.O. Box 400, FI-00121 Helsinki, Finland | Tel. +358 9 686180 | echa.europa.eu
395
The tables and figures below describe the total avoided emissions and the evolution of emissions over time (with and without RMMs).
Table E.45. Avoided emissions for the ‘Low’, ‘Best’ and ‘High’ emission estimate RO2 scenario with RMM for training and incidents in t PFASs after a period of 30 years
T PFASs without RMM with RMM
training and incidents
Low emission scenario*
6 911 8 016
Best emission Scenario*
11 195 13 031
High emission Scenario*
14 939 16 620
* Outcome of all "low / central / high values" for avoided emissions together, compared to the baseline scenario using all "low / central / high values"
Under RO2, when RMMs are applied to both training and incidents, emissions can be reduced over a period of 30 years by around 13 000 tonnes compared to the baseline best scenario When the RO2 low scenario is compared with the baseline low scenario values and the RO2 high scenario is compared with the baseline high scenario values, the highest reduction is observed for the "High" emissions estimate scenario, followed by the "Best" and "Low" emissions estimate scenarios. The highest emission reduction is obtained for the “High” emissions estimate scenario, which combines all "high parameter" estimates as indicated in the table in section 3 “Assumptions, uncertainties and sensitivities” of the main report.
A comparison of the avoided emissions from RO1 and RO2 shows that the amount of avoided emissions is higher for RO2 for all scenarios.
The figures below describe the evolution of emissions over time (cumulative and yearly emissions) for RO2 under the best scenario (with and without RMMs).

P.O. Box 400, FI-00121 Helsinki, Finland | Tel. +358 9 686180 | echa.europa.eu
396
Figure E.7. Cumulative total emission (t PFASs) for scenario RO2 with and without RMM (all sectors, “Best” estimate scenario).
Figure E.7 shows the cumulative total emissions for the scenario RO2 with and without RMM (“Best scenario”). The figure clearly shows that cumulative emissions are lower for a number of sectors when RMMs are applied. For Seveso, for example, applying RMM reduces emissions by a factor of about 4.

P.O. Box 400, FI-00121 Helsinki, Finland | Tel. +358 9 686180 | echa.europa.eu
397
Figure E.8. Total emission (t PFASs) with and without RMMs for scenario RO2 (all sectors, “Best” estimate scenario). Figure E.8 shows that the total emissions as of year 2 (the year the RMM have been computed94) for the RO2 scenario with and without the RMM are different (in year 1 both are still identical) for sectors with a transition period longer than 1.5 year (except marine applications, for which no RMM were defined). During the transition period, emissions remain constant and are the same as in the RO1 scenario. Thereafter, they differ from the emissions according to the RO1 scenario in that the first year after the transition period the stock is incinerated, leading to emissions to air; other emissions to soil, water and sea have already dropped to zero. From year 2 after the (sector-specific) transition period, emissions to air also stop.
Additional illustrations of the evolution of the emissions per sector and environmental compartments are provided in Appendix 8.
94 There is no visible impact of the RMM for training in RO2 in the calculations as in the model the RMMs have been calculated as starting in beginning of year 2, while the transition period for training and testing (1.5 years) has been calculated in a way that the emissions from this use are already over at the beginning of year 2 and the remaining stock incinerated.

P.O. Box 400, FI-00121 Helsinki, Finland | Tel. +358 9 686180 | echa.europa.eu
398
RO3
The pattern of emissions would be similar to RO2, except that the formulation from export would stop after ten years after the entry force of the restriction, resulting in around 120 tonnes of cumulative emissions further reduced compared to RO2 under the best scenario, i.e. a total of around 13 150 tonnes of cumulative emissions of PFASs avoided due to RO3 with an export ban after a 10-years transitional period (see Appendix 8 for more details).
Table E.46. Avoided emissions for the ‘Low’, ‘Best’ and ‘High’ emission estimate RO3 (with export ban) scenario with RMM for training and incidents in t PFASs after a period of 30 years and based on the parameters in section 3 “Assumptions, uncertainties and sensitivities” of the Annex XV report.
T PFASs without RMM with RMM
training and incidents
Low emission scenario*
6 950 8 055
Best emission Scenario*
11 317 13 152
High emission Scenario*
15 101 16 782
* Outcome of all "low / central / high values" for avoided emissions together, compared to the baseline scenario using all "low / central / high values"
Graphs of evolution of emissions over time are not shown here but display a similar pattern as for RO2. In Appendix 8, graphs illustrate the contribution of the emissions from formulation from export.
RO4
The emissions simulation for RO4 is similar to RO2, but it is assumed that, thanks to the permit system they can use, after the transition period the oil/(petro)chemical (Seveso share) and defence sectors would be continue using the same amounts of PFAS foams during ten years and are assumed to only progressively switch to alternatives after this period (when alternatives would be considered feasible to implement), leading to a continuous linear decline in use, stock and formulation of PFAS-based foams during the next 20 years till 0. After year 27 formulation already stops as enough stock is available for use until year 30. In year 30, there is still some use and the small amount of remaining foams is incinerated. In year 31 the emission is zero.
The tables and figures below describe the total avoided emissions and the evolution of emissions over time (with and without RMMs).
As for RO2 and RO3, there is no visible impact of the RMM for training in RO4 in the calculations, as the RMMs have been calculated as starting in beginning of year 2, while the transition period for training and testing (1.5 years) has been calculated in a way that the emissions from this use are already over at the beginning of year 2 and the remaining stock incinerated.
Table E.47. Avoided emissions for the ‘Low’, ‘Best’ and ‘High’ emission estimate RO4 scenario with RMM for training and incidents in t PFASs after a period of 30

P.O. Box 400, FI-00121 Helsinki, Finland | Tel. +358 9 686180 | echa.europa.eu
399
years
t PFASs without RMM with RMM
training and incidents
Low emission scenario*
5 528 7 919
Best emission Scenario*
8 756 12 578
High emission Scenario*
12 463 15 457
* Outcome of all "low / central / high values" for avoided emissions together, compared to the baseline scenario using all "low / central / high values"
Under RO4, when RMMs are applied to both training and incidents, emissions can be reduced over a period of 30 years by around 13 000 tonnes compared to the baseline best scenario When the RO4 low scenario is compared with the baseline low scenario values and the RO4 high scenario is compared with the baseline high scenario values, the highest reduction is observed for the "High" emissions estimate scenario, followed by the "Best" and "Low" emissions estimate scenarios. The highest emission reduction is obtained for the “High” emissions estimate scenario, which combines all "high parameter" estimates as indicated in the table in section 3 “Assumptions, uncertainties and sensitivities” of the Annex XV report.
The figures below describe the evolution of emissions over time (cumulative and yearly emissions) for RO4 under the best scenario (with and without RMMs).

P.O. Box 400, FI-00121 Helsinki, Finland | Tel. +358 9 686180 | echa.europa.eu
400
Figure E.9. Cumulative total emission (t PFASs) for scenario RO4 with and without RMMs (all sectors, “Best” estimate scenario). Figure 21 shows the cumulative total emissions for the scenario RO4 with and without RMM (“Best scenario”). During the transition period, total emissions are the same as in RO2 for all sectors; during the years after the transition period, total emissions in scenario RO4 differ from scenario RO2 only for the oil/chemical Seveso and defence sector as in these sectors use is expected to continue beyond the transitional periods foreseen in RO2. A continuous linear decline in use, stock and formulation during the 20 years after 10 years of entry into force of the restriction is assumed, till 0. This is reflected in the gently bending curve reaching a near-plateau stage in year 30. The use of RMM during the period of continued use has an impact on the emissions during this continued use (the curve is less steep).
Figure E.10 shows that yearly total emissions during the transition period are the same as for RO2. The first year after the transition periods, the stock is incinerated as in RO2 for all sector/uses, except for the oil/(pertro)chemical Seveso and defence sectors. In that year and also thereafter, emissions from use by these two sectors continue but declines to zero at the end of year 30. The remaining stock that is incinerated in year 30 is very small.

P.O. Box 400, FI-00121 Helsinki, Finland | Tel. +358 9 686180 | echa.europa.eu
401
Figure E.10. Total emission (t PFASs) with RMM for scenario RO4 (all sectors, “Best” estimate scenario).
Additional illustrations of the evolution of the emissions per sector and environmental compartments are provided in Appendix 8.
RO5
RO5 is similar to RO2 but the use remains allowed after the transitional periods if a full containment (emissions minimisation) can be ensured. For the emissions calculation under RO5 it has been assumed that only the Seveso establishments would be able to comply with the minimisation requirement after the transitional periods. The emissions calculation therefore assumes a stop of the use of all sectors after their respective transitional periods except for the oil/(petro)chemical - Seveso sector for which the use would continue unaffected over the assessment period. Full containment being in practice unlikely even for the Seveso establishments, emission factors have been taken into account, which results in continuous emissions of PFASs in the environment from this sector of use. The ”lighter” RMMs for training/testing and incidents (minimisation as far as practically and economically feasible) are applicable for all sectors during the transition period. Under this scenario, the use by oil/(petro)chemical (Seveso share) sector has been considered to be ‘endless’, i.e. no substitution to alternatives, therefore, no remaining stock incineration is considered in year 30. For this sector, there is still a complete stock left that is not incinerated in year 30, while in the other ROs no stock is left at the end of year 30.
As for RO2, RO3 and RO4, there is no visible impact of the RMM for training in RO5 in the calculations, as the RMMs have been calculated as starting in beginning of year 2, while the transition period for training and testing (1.5 years) has been calculated in a way that the emissions from this use are already over at the beginning of year 2 and the remaining stock incinerated.
The table below describe the total avoided emissions over 30 years (with and without RMMs).
Table E.48. Avoided emissions for the ‘Low’, ‘Best’ and ‘High’ emission estimate RO5 scenario with RMM for training and incidents in t PFASs after a period of 30 years
t PFASs without RMM with RMM

P.O. Box 400, FI-00121 Helsinki, Finland | Tel. +358 9 686180 | echa.europa.eu
402
training and incidents
Low emission scenario*
4 531 7 886
Best emission Scenario*
6 681 12 452
High emission Scenario*
8 919 14 416
* Outcome of all "low / central / high values" for avoided emissions together, compared to the baseline scenario using all "low / central / high values"
Under RO5, when RMMs are applied to both training and incidents, emissions can be reduced over a period of 30 years by around 12 000 tonnes compared to the baseline best scenario When the RO5 low scenario is compared with the baseline low scenario values and the RO5 high scenario is compared with the baseline high scenario values, the highest reduction is observed for the "High" emissions estimate scenario, followed by the "Best" and "Low" emissions estimate scenarios. The highest emission reduction is obtained for the “High” emissions estimate scenario, which combines all "high parameter" estimates as indicated in the table in section 3 “Assumptions, uncertainties and sensitivities” of the main report.
The figures below describe the evolution of emissions over time (cumulative and yearly emissions) for RO5 under the best scenario (with and without RMMs).
Figure E.11 shows the cumulative total emissions for the scenario RO5 with and without RMM (“Best scenario”). During the transition periods, total emissions are the same as in RO2 for all sectors; during the years after the transition periods, total emissions in scenario RO5 differ from scenario RO2 only for the oil/(petro)chemical Seveso sector, as this sector is assumed to continue using PFAS foams after the transition period, while use stops in scenario RO2 after the transition period for all other uses. The curve of continuous linear increase in emissions is a slightly less steep after the transition period because during that period stricter RMMs apply. In the year after the transition period there is no steep increase in air emission for the part of the oil/(petro)chemical Seveso sector as there is no stock incinerated. In year 30 the stock is still there, while in scenario RO2 there isn’t any stock left.

P.O. Box 400, FI-00121 Helsinki, Finland | Tel. +358 9 686180 | echa.europa.eu
403
Figure E.11. Total emission (t PFASs) with and without RMM for scenario RO5 (all sectors, “Best” estimate scenario). Figure E.12 shows that yearly total emissions during the transition periods are the same as for RO2. After the transition periods, the emissions from incidents in the oil/(petro)chemical Seveso sector remain at the same level without RMMs and at a lower but also constant level with stricter RMMs. No remaining stock is considered to be incinerated in year 30.

P.O. Box 400, FI-00121 Helsinki, Finland | Tel. +358 9 686180 | echa.europa.eu
404
Figure E.12. Total yearly emission (t PFASs) with and without RMMs for scenario RO5 (all sectors, “Best” estimate scenario).
Additional illustrations of the evolution of the emissions per sector and environmental compartments are provided in Appendix 8.
E.5.3. Changes in emission, exposure and risk
The below table lists the avoided emissions over 30 years per sector/use for the five ROs with RMMs for the best scenario.
Table E.49. avoided emissions of PFASs over 30 years per sector/use for the five ROs with RMMs under the best scenario
Sector/type of use
RO1 (tonnes over
30 years)
RO2 (tonnes over
30 years)
RO3 (tonnes over
30 years)
RO4 (tonnes over
30 years)
RO5 (tonnes over
30 years)
Seveso establishments 6087 6232 6281 5966 5653 Other industries 128 131 132 131 131 Civil aviation 810 940 950 940 940
Defence 540 627 633 440 627
Municipal fire services 1095 1473 1489 1473 1473
Ready-to-use applications 84 117 118 117 117
Marine applications 939 1266 1280 1266 1266
Training and testing 2129 2244 2269 2244 2244 All sectors 11812 13031 13152 12578 12452
Note: the results are not rounded to show the difference in the risk reduction capacity of different restriction options (i.e. avoided emissions). This should not be interpreted as suggesting accuracy in the results.

P.O. Box 400, FI-00121 Helsinki, Finland | Tel. +358 9 686180 | echa.europa.eu
405
All ROs analysed would lead to significant reductions of emissions of PFASs in the environment. The proposed risk management measures (collection and safe disposal of foams and run-off waters) would help reducing the emissions while the PFAS-foams are still in use during the sector/use-specific transitional periods. The more restrictive RM: RO3 (ban on placing on the market, use and export after a transitional period) - would achieve the highest and quickest reduction of cumulative emissions (around 13 200 t), followed by RO2 (export not banned; around 13 000t), RO4 (permit system for Seveso and defence; 12 600), RO5 (continued use allowed if full containment is ensured; 12 500t) and finally RO1 (ban on placing on the market but use allowed until depletion of stocks; 11 800t).
The proposed restriction would lead to increases in emissions of greenhouse gases and other air pollutants (possibly including undestroyed PFAS substances) in case the incineration method is chosen for the early disposal of foam concentrates, collected fire water run-off and other PFAS waste, and increased transportation of foams. It is however expected that users will concentrate the PFASs from the collected fire water run-off and PFAS waste (when feasible and appropriate) to reduce the volumes required to be incinerated. These emissions of air pollutants have not been further analysed in this report.
The use of fluorine-free alternatives is expected to lead to a lower overall risk to human health and the environment, especially considering their biodegradability potential (see section E.2.4.1). However, it should be highlighted that a large number of substances are used in the various formulations of fluorine-free foams and that these substances are not necessarily hazard- or risk-free. Is it absolutely essential that formulators of fluorine-free foams consider the hazard of the substances they use and related risks. In this regard, third party certification can help identifying the foam formulations with the best hazard profiles.
E.6. Other impacts
Other impacts briefly considered in this section include the potential for impacts on employment, international trade and economic competitiveness. Most (if not all) manufacturers in the EU are involved in both PFASs and fluorine-free foam manufacturing.
E.6.1. Social impacts
No significant social impacts have been identified. Regarding employment, there is no information available on the number of people employed in manufacturing of PFAS-containing firefighting foam in comparison to manufacturing fluorine-free firefighting foam. Overall, effects on employment would be neutral or positive, as higher quantities of fluorine-free foams are needed.
E.6.2. Wider economic impacts
No significant wider economic impacts have been identified. The timing of the substitution depends on the RO and the length of the transition period. However, as most (if not all) manufacturers in the EU are involved in both PFAS and fluorine-free foam manufacturing, it is unlikely that there will be any substantial impacts on trade and competitiveness inside the EEA. There is no information available either suggesting that EEA based foam manufacturers would gain or lose markets globally due to switch to the alternatives.
Under RO3, also the export of foams would be restricted. However, as the proposed restriction allows to export foams until suitable alternatives have been developed, the available information does not suggest significant impacts on trade.
E.6.3. Distributional impacts
No significant distributional impacts have been identified. The use of PFAS-containing foams

P.O. Box 400, FI-00121 Helsinki, Finland | Tel. +358 9 686180 | echa.europa.eu
406
is still higher in some EU Member States which would be more impacted by the proposed restriction. There is no quantitative information available for a more detailed and Member State specific analysis.
E.7. Practicality and monitorability
Analytical methods
In terms of PFAS concentration in PFAS-based firefighting foams, safety data sheets often indicate a content of <5 % for fluorosurfactants. According to (Wood et al., 2020) this number can be further narrowed to a concentration range of 2-3%. In order to be used (for training, testing or to handle an incident), the foam concentrates get further diluted with water in concentrations between 1 and 6% (mostly in 1%, 3%, and 6% proportions).
In terms of analytical methods for PFASs, ECHA’s laboratory survey on PFHxA, its salts and related substances (ECHA, 2020) mentions the following results:
Most of these laboratories use pre-concentration steps of samples, one mentioned also to apply direct injection. Only one of the surveyed laboratories carries out suspect screening/non-target screening and another laboratory is developing extractable/adsorbable organofluorine (OF/AOF) analysis using combustion ion chromatography (CIC). Four laboratories are conducting total oxidisable precursor assays (TOPA or TOP assay) while three additional laboratories are currently developing or have the intention to develop TOP assay analysis.
The results seem to reflect closely the availability of analytical methods as summarised in the (EC, 2020). Target analysis is well established and largely available in commercial contract laboratories. According to the surveyed laboratories, TOP assays are increasingly more popular, and they are linked to target analysis. Some commercial offers are available. In contrast to that, a lot of development is ongoing on organofluorine analysis, suspect screening and non-target screening and there are still limitations to broad commercial availability of these methods. More technical details on the different analytical methods can be found in the publications by (EC, 2020) and (Koch et al., 2020). A brief overview of analytical methods has been included in Appendix of (ECHA, 2020).
For firefighting foams, limits of quantifications (LoQs) indicated by the responding laboratories ranged from 20 to 50 µg/kg, depending on the analytical method used and the PFAS substances analysed.
Prices for these analyses vary widely, depending on the laboratory itself, the detection limits, the amount of analytes targeted, the method used and the choice of matrices. For example, for analysing 32 PFAS compounds in water with low reporting limits (range from 0.0003 μg/l up to 0.002 μg/l) the price is 3 675 SEK/sample, approximately equal to €350/sample, whereas the price for higher reporting limits (range from 0.01 μg/l up to 0.050 μg/l) is 2 940 SEK/sample, approximately equal to €280/sample (currency exchange rate 29/05/2020) (ALS Sweden, 2020).
In publications by Cornelsen on PFAS contamination in water (Cornelsen, 2020) it is stated, that for waters with an undefined PFAS composition, as is to be assumed especially when using current AFFF foaming agents, an evaluation of the water load as well as the achievable cleaning results is not possible if only the quantifiable individual PFASs are evaluated. (Held and Reinhard, 2016) assume that AFFF foaming agents contain hundreds of precursor substances which include approximately 40 PFAS classes (Barzen-Hanson et al., 2017) and are highly complex and difficult to determine by classical analytical methods (Held and Reinhard, 2016). However, the precursors in such complex mixtures can be assessed by the

P.O. Box 400, FI-00121 Helsinki, Finland | Tel. +358 9 686180 | echa.europa.eu
407
Total Oxidisable Precursor (TOP) Assay (Mumtaz et al., 2019). In the same publication (Cornelsen, 2020), the composition of fire extinguishing water has been analysed using an exemplary product (not further specified) and various PFAS quantification techniques. In Figure E.13 the results of this analysis are shown.
Figure E.13. PFAS-contents of a 1% AFFF Premix, measured using different analytical techniques. As shown in Figure E.13, based on the analysis of 23 individual PFAS substances, as can be determined from parameter lists currently available on the market95, the foam had a total content of only 1.7 mg/liter PFASs. It should be noted that precursor substances such as Capstone A and Capstone B96 are not yet included as parameters in the standard lists of environmental laboratories. In the example shown, these PFASs, which are often not yet quantifiable by measurement technology, have a concentration of 59 mg/liter alone, i.e. these substances are almost 35 times higher in concentration than the individual PFAS compounds that are quantified by PFAS standard analysis in laboratories. To address the total content of fluorine-organic substances in complex contaminated waters, the organically bound fluorine was therefore used as an additional parameter for PFAS-contaminated waters due to exposure to AFFF foams. In the example in Figure E.13, the concentration of organically bound fluorine is 100 mg/liter. Assuming that the average chain length and structure of the PFAS structures contained in current AFFF foams are significantly similar to the structure of the 6:2 FTS (H4PFOS), a hypothetical total PFAS concentration of 173 mg/liter can be calculated. The hypothetical total concentration of PFAS leads, on the basis of the example shown to the conclusion, that the fluoro-organic substances in the water that cannot be detected as PFAS single substances can be a factor of 100 higher (or more) than actually measured PFASs by single substance analysis. This knowledge leads to the need to evaluate PFASs that are not known or quantifiable as single substances by sum parameters. However, according to Cornelsen, there is currently no normative standard for this (Cornelsen et al., 2021). The above described results by (Cornelsen, 2020) show, that there is remaining uncertainty about PFAS-substances in firefighting foams. According to the input by stakeholders, PFAS substances based on <C6-chemistry have never been used as an active ingredient for firefighting foams, as the chemistry is not suitable and PFAS <C6 are unintended by-products

P.O. Box 400, FI-00121 Helsinki, Finland | Tel. +358 9 686180 | echa.europa.eu
408
of the synthesis process (telomerization process) (FFFC-Interview, 2021).
A study performed in 2021 for the Swedish Defence Materiel Administration (FMV) assessed the TOP-oxidation methodology for its adequacy in evaluating the presence of PFASs in allegedly PFAS-free foam concentrates (F3-concentrates). According to the study, the TOP-methodology has the advantage of being able to transform hidden PFASs, i.e., PFAS homologues that are currently not part of a conventional HPLC-MS/MS method, to known PFASs for which there are HPLC-MS/MS methods. The methodology of TOP benefits from the high general accuracy, sensitivity and selectivity provided by the LC-MS/MS instrumentation while the oxidation step itself does not require any expensive laboratory utensils or chemicals, in contrast to for instance the EOF/CIC97-methodology. In the context of firefighting foams, PFASs and their perfluoralkyl acids (PFCA)precursors aggregate to several thousand different molecules, potentially added to the foam concentrate to increase the film-forming potential. Executing the TOP-oxidation assay will reveal a large extent of those hidden PFASs but no information will be retrieved as to the chemical identity of the PFCA precursors. According to this study, overall, the results when comparing CIC/EOF and TOP indicate that the two analytical methods may be complimentary and are measuring organic fluorine using different rulers where the TOP-method seem more suitable to provide high precision for the lower to medium PFAS concentration range and the CIC/EOF may provide good precision for very high PFAS concentration ranges. The study concluded that the TOP-oxidation assay is suitable to verify claims regarding “PFAS-free” firefighting foams (FMV-Intersolia, 2021).
According to ECHA’s opinion on the PFHxA restriction proposal, analytical methods with low detection limits applied to previously regulated PFASs can also be applied to analyse PFHxA, its salts and related substances. There is ongoing environmental monitoring and biomonitoring (e.g. HBM4EU) that can be used for the purpose of monitoring the effects of the restriction. Due to the extreme persistence of PFHxA, and the formation of PFHxA from PFHxA-related substances, decreasing levels may, however, take a long time to detect in some matrices (ECHA, 2021a). The Dossier Submitter considers that this conclusion could be extended to all the PFAS contained in firefighting foams, especially considering the ongoing development of analytical techniques and the concentration threshold proposed in the restriction entry.
E.8. Proportionality (comparison of options)
E.8.1. Cost-effectiveness
Following SEAC’s approach to the “Evaluation of restriction reports and applications for authorisation for PBT and vPvB substances in SEAC” (ECHA, 2016a), the cost per unit (e.g. kilogram) of emission reduced are presented in the following to provide a starting point for the assessment of proportionality. Both the socio-economic costs and the emission reduction of a potential restriction of PFASs in firefighting foams are associated with significant uncertainties and not all socio-economic impacts (costs or benefits) could be quantified. As a result, the cost effectiveness will be subject to the same uncertainties.
The estimations of the emissions are combined with the estimation of the costs to derive C-E ratios. Only the central estimate (best estimate of emission and cost parameters) and the range between the two extreme combinations of all high emission reduction/low cost parameters and low emission reduction/high cost parameters on both ends. Thus, the uncertainty range for cost-efficiency is higher than the uncertainty range of emission estimates alone and uncertainty range of cost estimates alone.
97 CIC: Combustion ion chromatography (CIC) which is used for bulk organo-fluorine measurement. EOF: extractable organic fluorine

P.O. Box 400, FI-00121 Helsinki, Finland | Tel. +358 9 686180 | echa.europa.eu
409
RO1: Ban on the placing on the market, with “Low”, “Best” and “High” estimates of €/t PFASs reduced
The results of the cost-effectiveness analysis are shown for RO1 in Table E.50 (with RMM) and Table E.51 (without RMM).
Table E.50. Cost-effectiveness analysis for RO1 with RMM for training and incidents
With RMM for training/testing and incidents
Avoided emissions in t PFASs
Incremental costs in Mio. €
Cost-efficiency in €/t PFASs reduced
High C-E scenario 14 055 2 638 187 682
Best estimate scenario 11 812 5 876 497 550
Low C-E scenario emissions 7 603 15 559 2 046 525
Table E.51. Cost-effectiveness analysis for RO1 without RMM for training and incidents
Without RMM for training/testing and incidents
Avoided emissions in t PFASs
Incremental costs in Mio. €
Cost-efficiency in €/t PFASs reduced
High C-E scenario 10 514 2 581 245 482
Best estimate scenario 7 867 5 764 732 721
Low C-E scenario 5 328 15 333 2 877 815
In the calculations of high and low C-E scenario, the interdependency of some scenario parameters has been neglected. The sensitivity analysis showed that a few parameters attributed to the emission modelling have been identified that also have slight effects on the cost side. This approximation is, however, of a minor effect compared to the uncertainties of the assumptions in total.
A comparison of results with and without RMMs further shows that adding RMMs reduces the costs per ton of PFASs avoided significantly for all scenario combinations. This can also be displayed when the incremental cost-effectiveness of the RMMs as (theoretically) isolated measures on top of the restriction are calculated separately. This is shown in Table E.52.
Table E.52. Cost-effectiveness analysis of RMM for training and incidents as separate isolated measures for RO1
Cost-efficiency of additional RMMs
Avoided emissions
Costs Cost-efficiency
(tonnes) (€ million) (€/t)
High C-E scenario 3 541 57 16 097

P.O. Box 400, FI-00121 Helsinki, Finland | Tel. +358 9 686180 | echa.europa.eu
410
Best estimate scenario 3 945 112 28 390
Low C-E scenario 2 275 226 99 341
RO2: Ban on the placing on the market and use, with “Low”, “Best” and “High” estimates of €/t PFASs reduced
The results of the cost-effectiveness analysis are shown for RO2 in Table E.53 (with RMM) and Table E.54 (without RMM).
Table E.53. Cost-effectiveness analysis for RO2 with RMM for training and incidents
With RMM for training/testing and incidents
Avoided emissions in t PFASs
Incremental costs in Mio. €
Cost-efficiency in €/t PFASs reduced
High C-E scenario 16 620 3 016 181 507
Best estimate scenario 13 031 6 771 519 641
Low C-E scenario 8 016 17 278 2 155 505
Table E.54. Cost-effectiveness analysis for RO2 without RMM for training and incidents
Without RMM for training/testing and incidents
Avoided emissions in t PFASs
Incremental costs in Mio. €
Cost-efficiency in €/t PFASs reduced
High C-E scenario 14 939 2 987 199 946
Best estimate scenario 11 195 6 712 599 563
Low C-E scenario 6 911 17 160 2 482 998
In all the scenarios, costs per ton of PFASs avoided are slightly higher for RO2 than in RO1. Adding RMMs (here only related to incidents) reduces the costs per ton of PFASs avoided significantly. This can also be displayed when the incremental cost-effectiveness of the RMMs as (theoretically) isolated measures on top of the restriction are calculated separately. The result of this consideration is shown in Table E.55.
Table E.55. Cost-effectiveness analysis of RMM for incidents as separate isolated measures
Cost-efficiency of additional RMMs
Avoided emissions Costs Incremental cost-efficiency
(tonnes) (€ million) (€/t)
High C-E scenario 1 681 29 17 252

P.O. Box 400, FI-00121 Helsinki, Finland | Tel. +358 9 686180 | echa.europa.eu
411
Best estimate scenario 1 836 59 32 135
Low C-E scenario emissions 1 105 118 106 787
The requirements of RO2, including the ban of use, constitute a stronger restriction on top of the one of RO1 on placing on the market. Thus, the incremental effect of RO2 compared to RO1 can be analysed separately. The result of this is shown in Table E.56.
Table E.56. Incremental cost-effectiveness in €/t emissions avoided of RO2 compared to RO1 with RMMs
Cost-efficiency of banning the use
Incremental avoided emissions
Incremental costs
Incremental cost-efficiency
(tonnes) (€ million) (€/t)
High C-E scenario 2 565 378 147 368
Best estimate scenario 1 219 895 734 208
Low C-E scenario emissions
413 1 719 4 162 228
Introduction of a ban on use after the respective transition periods has the additional reduction of emission as an effect. This incremental reduction from banning the use (RO2) is estimated to be “more expensive” per kg reduced than banning the placing on the market (RO1) with RMMs (the proposed restriction). Without RMMs, the results are different. This is because without RMMs use ban leads to clearly higher emission reduction with relatively low costs.
RO3: same as RO2 but considering elimination of emissions from the formulation for export, with “Low”, “Best” and “High” estimates of €/t PFASs reduced
Since the RMMs show the same contributions to both emissions and costs in RO3 as in RO2, the results of the cost-effectiveness analysis are shown for RO3 with RMMs only (Table E.57).
Table E.57. Cost-effectiveness analysis for RO3 with RMM for training and incidents
With RMM for training/testing and incidents
Avoided emissions in t PFASs
Incremental costs in Mio. €
Cost-efficiency in €/t PFASs reduced
High C-E scenario 16 782 3 020 179 981
Best estimate scenario 13 152 6 780 515 469
Low C-E scenario emissions 8 055 17 302 2 148 100
The incremental effect of RO3 compared to RO2 can also be analysed separately. The result of this is shown in Table E.58.
Table E.58. Incremental cost-effectiveness in €/t emissions avoided of RO3

P.O. Box 400, FI-00121 Helsinki, Finland | Tel. +358 9 686180 | echa.europa.eu
412
compared to RO2
Cost-efficiency of banning the export
Avoided emissions Costs Incremental cost-efficiency
(tonnes) (€ million) (€/t)
High C-E scenario 162 4 24 756
Best estimate scenario 121 8 66 016
Low C-E scenario emissions
39 24 619 044
A switch from RO2 (exports of PFAS-based foams excluded from the ban) to RO3 (ban also covers production for export), has only a relatively small effect both on emission reduction and costs. However, the incremental reduction of emission is rather cheap in the best and high cost-effectiveness scenarios. Only the low cost-effectiveness scenario shows slightly higher costs per kg.
RO4: same as RO2 but with progressive decline of oil/chemical and military uses - “Low”, “Best” and “High” estimates of €/t PFASs reduced
The results of the cost-effectiveness analysis are shown for RO4 with RMMs only (Table E.59).
Table E.59. Cost-effectiveness analysis for RO4 with RMM for training and incidents
With RMM for training/testing and incidents
Avoided emissions in t PFASs
Incremental costs in Mio. €
Cost-efficiency in €/t PFASs reduced
High C-E scenario 15 457 2 318 150 013
Best estimate scenario 12 578 5 226 415 474
Low C-E scenario 7 919 13 230 1 670 648
With regard to cost-efficiency, the cost per tonne of emissions avoided are lower in RO4 than in RO2 for all scenarios. This is because RO4 shows the lowest costs of all scenarios, whereas the difference in emission reduction (which is slightly lower in RO4 than in RO2) is smaller. Further analysis between RO4 and other ROs is not carried out as RO4 is not considered practical.
RO5: uses banned unless releases fully contained and adequately treated - “Low”, “Best” and “High” estimates of €/t PFASs reduced
For RO5, the RMMs for all sectors where applicable during the transition period show the same results as for RO2 and RO3. Therefore, the results of the cost-effectiveness analysis are shown for RO5 with RMMs only (Table E.60).
Table E.60. Cost-effectiveness analysis for RO5 with RMM for training and incidents
With RMM for training/testing and incidents
Avoided emissions
Incremental costs in
Cost-efficiency in

P.O. Box 400, FI-00121 Helsinki, Finland | Tel. +358 9 686180 | echa.europa.eu
413
in t PFASs
Mio. € €/t PFASs reduced
High C-E scenario 14 416 7 244 502 460
Best estimate scenario 12 452 14 963 1 201 665
Low C-E scenario 7 886 43 347 5 496 503
With regard to cost-efficiency, the cost per tonne of emissions avoided are more than double as high compared to all other scenarios. This is because of high costs assumed for full containment of releases. Further analysis between RO5 and other ROs is not carried out as RO5 is not considered practical.
E.8.2. Stakeholder input on transition periods
Several users have provided input on manageable transition periods:
Most of stakeholders from the O&G / petrochemicals sector claimed that a transition time of 10 to 12 years would be needed for completing the transition. Another stakeholder from the same sector cited 5-10 years, in order to minimise and spread the costs to change foam and re-build, or re-place fire extinguishing systems or equipment, but they would like to keep PFAS stocks in case of a big fire incident. As reported in the case study in Section E.2.5, Equinor took around 8 years to transition to fluorine-free foams.
An industrial end user under consideration of discussions with some representatives from aviation industry groups and municipal users has developed a detailed draft proposed timeline covering a range of tasks required for a full transition to fluorine-free foams (across all sectors). The full timeline is provided in Appendix 4, but key milestones suggested are (years from formal start of transition and introduction of legislation):
No more PFAS foam use in training: Immediately
No more PFAS foam use in systems testing: 4 years
No more PFAS foams used for small incidents: 4 years
Completion of transition: 10 years. The additional 6 years from the previous steps is largely driven by further replacement and disposal of stocks of legacy foam98, as well as the need for further development of fluorine-free foams by manufacturers.
As regard to the defence sector the stakeholder consultations showed a wide variety of readiness to transition to fluorine-free alternatives. A few countries from the EEA have already implemented the substitution (partly or fully), others are planning to so in 3 to 6 years’ time and others called for longer transition periods from 6 to 12 years or even calling for an exemption (in particular for already built ships or ships under construction). These discrepancies are due to the differences in military equipment used by each country, in performance standards used and in the approaches taken for fighting a fire. According to some Ministries of Defence, the naval applications are the most challenging for a substitution, whereas the Air Forces and land-based operations
98 Note that this does not necessarily imply that no more PFAS-based foams are purchased during that period.

P.O. Box 400, FI-00121 Helsinki, Finland | Tel. +358 9 686180 | echa.europa.eu
414
should be able to transition more easily. Some stakeholders suggested that the system change to enable the use of non-PFAS foam could be introduced at time of major refit, which typically occurs every 6-12 years. On the other hand, the US Fiscal Year 2020 National Defense Authorization Act (NDAA) requires a phase-out of PFAS-containing firefighting foam in the US defence (except on ships) by October 2024, i.e. within 4 years (with two one-year possible extensions, i.e. until 2026).
Several stakeholders across different sectors stated at the September 2019 workshop or in response to the written consultation undertaken by Wood that 3-6 years may be sufficient (Wood et al., 2020).
One stakeholder suggested different transition periods for different uses. They explained municipal fire brigades should be able to transition quicker than operators of fixed installations for example. They argued that the use of fluorine- free foam for tank fire fighting needs further testing and therefore more time.
Eurofeu indicated a period of 5 years for transitioning to alternatives in portable fire extinguishers
The PFHxA proposed restriction foresees the following transition periods: Concentrated firefighting foam mixtures placed on the market until 18 months after the entry into force of the restrictions can be used in the production of other firefighting foam mixtures until 5 years after the entry into force, except for use of firefighting foam for training and (if not 100% contained) testing. There is also an exception proposed for concentrated firefighting foam mixtures for certain defence applications until a successful transition to alternatives can be achieved, and for concentrated firefighting foam mixtures for cases of class B fires in storage tanks with a surface area above 500 m2 until 12 years after the entry into force99. The opinion of ECHA’s Risk Assessment Committee and Committee for Socio-economic Analysis on this restriction proposal is expected to be adopted in December 2021.
Conclusions from this input are drawn in Section 2.8.2 of the Annex XV report.
E.8.3. Stakeholder input on concentration thresholds
In the stakeholders survey performed by (Wood et al., 2020) the following thresholds were considered feasible by consulted stakeholders (all have been converted to ppb):
Regulation in Queensland (Australia) allows up to 10 000 ppb for PFOA/PFHxS and 50 000 ppb for PFOA and PFOA related precursors and higher homologues. One stakeholder recommended these to be adopted in the EU as well.
One stakeholder that has transitioned to fluorine-free foams (in the petrochemicals sector) reported that they had aimed for and achieved a level of 0.001% (10 000 ppb).
One stakeholder reported experience with a relatively simple cleaning process (emptied tank, flushed two times with warm water) which can lead to very low remaining PFAS contamination (both when tested immediately and after a few years), but cautions a threshold below 100 ppb would be unrealistic.
Some stakeholders suggested 1 ppb as the lowest achievable concentration in
99 Note that these transition periods and exemptions may change when (and if) the proposal is taken forward.

P.O. Box 400, FI-00121 Helsinki, Finland | Tel. +358 9 686180 | echa.europa.eu
415
most cases. One of them linked this to a 32-stage legacy foam decontamination process costing €12 300 per appliance. In one-third of appliances this process can yield concentrations even lower (below 0.07 ppb).
In terms of the lowest detectable concentrations, one stakeholder suggested laboratories are reported to be able to analyse down to a level of 30-150 ppb. This is contradicted by other stakeholders that cite lower concentrations having been achieved and tested (see above). In the REACH restriction on PFOA, a concentration limit of 25 ppb of PFOA including its salts or 1 000 ppb of one or a combination of PFOA-related substances was adopted, based on the capabilities of analytical methods according to the RAC’s opinion on the restriction dossier.
Conclusions from this input are drawn in Section 2.8.3 of the Annex XV report.
These findings are in line with the ones reported by (Ramboll, 2021) on the equipment cleaning techniques (see Appendix 1)
E.8.4. Comparison of Restriction Options
See Section 2. of the Annex XV report.
E.8.5. Comparison of costs and benefits
See Section 2.8. of the Annex XV report.

P.O. Box 400, FI-00121 Helsinki, Finland | Tel. +358 9 686180 | echa.europa.eu
416
Annex F. Assumptions, uncertainties and sensitivities
See Section 3 in the Annex XV report. Additional sensitivity scenarios on emissions, costs and cost-effectiveness are presented in this Annex under relevant headings and in Appendix 8 and 9.

P.O. Box 400, FI-00121 Helsinki, Finland | Tel. +358 9 686180 | echa.europa.eu
417
Annex G. Stakeholder information
G.1. Introduction
Effective engagement with key stakeholders from across the firefighting foam sector, particularly the manufacturers and users of the foams, was considered to be critically important in the data collection process.
Several stakeholder consultations by the Dossier Submitter or by its contracted consultants have been made during the preparation of this report. These consultations aimed at covering all the relevant sectors and backgrounds across the firefighting foam supply chain, as well as regulators, researchers and special interest groups. The consultation therefore aimed to target the following stakeholders:
Foam manufacturers/suppliers;
Users of foams in major sectors (including airports, oil and gas, chemical plants, ports, railways);
Key trade associations;
International organisations;
National-level authorities and agencies;
Academics and R&D (especially those involved in developing alternative foam products); and
Key NGOs and interest groups.
The consultants Wood, Ramboll and COWI mapped stakeholders identified so far, indicating the best means of consulting each one of them: e.g. advisory group, questionnaire, one-to-one consultation, workshop, etc. and agreed on a way forward with the Dossier Submitter. The Dossier Submitter also performed stakeholders’ consultations on its own initiative.
G.2. Approach
The main stakeholders’ consultations conducted were the following:
1. Consultations in 2019 by the consultants Wood, Ramboll and COWI
In the context of the study contracted by the European Commission and ECHA (see details of the stakeholders’ consultation process in section “Part 1 –Joint consultation” in (Wood et al., 2020)) the consultants performed the following consultations:
Scoping interviews (Eurofeu, Fire Fighting Foams Coalition, Copenhagen Airport, Heathrow Airport, LASTFIRE, IPEN);
Targeted stakeholders written questionnaire, based on information needs and additional stakeholders identified during the scoping interviews (see questionnaire in Appendix 1 of (Wood et al., 2020));
Stakeholder workshop in Helsinki on 24 September 2019, to validate and seek feedback on the preliminary project findings; gather views on possible risk management options and explore the feasibility of replacing PFAS-based foams with fluorine-free alternatives. The workshop was attended by a total of 36 participants, including manufacturers, users from different sectors (airports, chemical plants, oil and gas), researchers, NGOs, national authorities, and remediation experts (see workshop report in Appendix 2 of (Wood et al., 2020)).
Additional direct consultations to gain further information on specific issues.

P.O. Box 400, FI-00121 Helsinki, Finland | Tel. +358 9 686180 | echa.europa.eu
418
2. Consultations in 2021 by the consultant Ramboll
The consultant contacted several stakeholders in the context of the additional studies contracted by the Dossier Submitter. The studies related to the assessment of workers exposure and epidemiological studies on PFASs in firefighters; manufacture and export; and techniques for PFAS-waste disposal and equipment cleaning. The stakeholders were mainly contacted in relation with the disposal and cleaning techniques, the outcome of this latter consultation is reported in Appendix 1 and in the other relevant parts of this report.
3. Consultations in 2021 by the Dossier Submitter
The Dossier Submitter further consulted several stakeholders including Eurofeu (association of foam manufacturers) and representatives of foam users across different types of sectors (airports, civil marine, defence, oil and (petro)chemicals, aerospace, municipal and industrial fire services, car manufacture) through a questionnaire or direct contact. The purpose of these consultations was to gain more precise information mainly regarding the use rates of PFAS-based and fluorine-free firefighting foams and stocks held, readiness of substitution to fluorine-free alternatives, risk management measures already in place and possible improvements including their cost implications. The outcome of these consultations is reported across the report, where relevant.
G.3. Outcome and conclusions
Since the transition to fluorine-free alternatives to PFAS-based foams started several years ago and is a rapidly evolving field, also considering the several types and sectors of use of firefighting foams for class B fires, the various consultations were key in gaining up-to-date information on several issues. The outcome of these consultations is reported across the report. Nevertheless, several pieces of information were not possible to obtain, or not with a sufficient level of accuracy or representativeness at EU level (e.g. annual foam use rate, foam stocks, identity of PFAS substances used in foams, and types of risk management measures in place). Therefore, several assumptions have been taken by the Dossier Submitter to alleviate these data gaps and perform its assessment (see section 3. Assumptions, uncertainties and sensitivities in the main report).

P.O. Box 400, FI-00121 Helsinki, Finland | Tel. +358 9 686180 | echa.europa.eu
419
References
3M 1983. TWO YEAR ORAL (DIET) TOXICITY / CARCINOGENICITY STUDY OF FLUOROCHEMICAL FC-143 IN RATS. St. Paul, MN, USA: Pathology and Toxicology, Riker Laboratories, Inc.
3M 1998. 5-day Inhalation Toxicity Screen of HFE(s): s-702 (T-6933), s-602 (T-6934), and HFPD-C2H5 (T-6935). 3M Strategic Alternative Toxicology Laboratory.
-IRIS, E. 2021. https://www.epa.gov/iris.
ABBOTT, B. D., WOLF, C. J., SCHMID, J. E., DAS, K. P., ZEHR, R. D., HELFANT, L., NAKAYAMA, S., LINDSTROM, A. B., STRYNAR, M. J. & LAU, C. 2007. Perfluorooctanoic acid-induced developmental toxicity in the mouse is dependent on expression of peroxisome proliferator-activated receptor-alpha. Toxicological Sciences, 98, 571-581.
ABRAHAM, K., EL-KHATIB, A. H., SCHWERDTLE, T. & MONIEN, B. H. 2021. Perfluorobutanoic acid (PFBA): No high-level accumulation in human lung and kidney tissue. Int J Hyg Environ Health, 237, 113830.
ABRAHAM, K., MIELKE, H., FROMME, H., VOLKEL, W., MENZEL, J., PEISER, M., ZEPP, F., WILLICH, S. N. & WEIKERT, C. 2020. Internal exposure to perfluoroalkyl substances (PFASs) and biological markers in 101 healthy 1-year-old children: associations between levels of perfluorooctanoic acid (PFOA) and vaccine response. Archives of Toxicology, 94, 2131-2147.
AGIER, L., BASAGANA, X., MAITRE, L., GRANUM, B., BIRD, P. K., CASAS, M., OFTEDAL, B., WRIGHT, J., ANDRUSAITYTE, S., DE CASTRO, M., CEQUIER, E., CHATZI, L., DONAIRE-GONZALEZ, D., GRAZULEVICIENE, R., HAUG, L. S., SAKHI, A. K., LEVENTAKOU, V., MCEACHAN, R., NIEUWENHUIJSEN, M., PETRAVICIENE, I., ROBINSON, O., ROUMELIOTAKI, T., SUNYER, J., TAMAYO-URIA, I., THOMSEN, C., URQUIZA, J., VALENTIN, A., SLAMA, R., VRIJHEID, M. & SIROUX, V. 2019. Early-life exposome and lung function in children in Europe: an analysis of data from the longitudinal, population-based HELIX cohort. Lancet Planet Health.
AHRENS, L. 2011. Polyfluoroalkyl compounds in the aquatic environment: A review of their occurrence and fate. Journal of Environmental Monitoring, 13, 20-31.
AHRENS, L., GERWINSKI, W., THEOBALD, N. & EBINGHAUS, R. 2010a. Sources of polyfluoroalkyl compounds in the North Sea, Baltic Sea and Norwegian Sea: Evidence from their spatial distribution in surface water. Mar. Pollut. Bull., 60, 255.
AHRENS, L., TANIYASU, S., YEUNG, L. W., YAMASHITA, N., LAM, P. K. & EBINGHAUS, R. 2010b. Distribution of polyfluoroalkyl compounds in water, suspended particulate matter and sediment from Tokyo Bay, Japan. Chemosphere, 79, 266-72.
AHRENS, L., XIE, Z. & EBINGHAUS, R. 2010c. Distribution of perfluoroalkyl compounds in seawater from Northern Europe, Atlantic Ocean, and Southern Ocean. Chemosphere, 78, 1011-1016.
AIMUZI, R., LUO, K., HUANG, R., HUO, X., NIAN, M., OUYANG, F., DU, Y., FENG, L., WANG, W., ZHANG, J. & SHANGHAI BIRTH COHORT, S. 2020. Perfluoroalkyl and polyfluroalkyl substances and maternal thyroid hormones in early pregnancy. Environmental Pollution, 264, 114557.

P.O. Box 400, FI-00121 Helsinki, Finland | Tel. +358 9 686180 | echa.europa.eu
420
ALEXANDRINO, D. A., RIBEIRO, I., PINTO, L. M., CAMBRA, R., OLIVEIRA, R. S., PEREIRA, F. & CARVALHO, M. F. 2018. Biodegradation of mono-, di-and trifluoroacetate by microbial cultures with different origins. New biotechnology, 43, 23-29.
ALS SWEDEN 2020. Analytical packages. https://www.alsglobal.se/sok-analys?selected-matrix=&selected-sub-matrix=&selected-area=&selected-sub-area=&q=pfos.
ALTENBURGER, R., BACKHAUS, T., BOEDEKER, W., FAUST, M. & SCHOLZE, M. 2013. Simplifying complexity: Mixture toxicity assessment in the last 20 years. Environmental Toxicology and Chemistry, 32, 1685-1687.
ANGUS-INTERVIEW 2021. Interview with David Plant by Ramboll under ECHA FWC: PFAS in AFFF/Interviewer: Miriam Schöpel.
ANKLEY, G. T., CURETON, P., HOKE, R. A., HOUDE, M., KUMAR, A., KURIAS, J., LANNO, R., MCCARTHY, C., NEWSTED, J., SALICE, C. J., SAMPLE, B. E., SEPÚLVEDA, M. S., STEEVENS, J. & VALSECCHI, S. 2020. Assessing the Ecological Risks of Per- and Polyfluoroalkyl Substances: Current State-of-the Science and a Proposed Path Forward. Environmental Toxicology and Chemistry, 40, 564-605.
ANNUNZIATO, K. M., JANTZEN, C. E., GRONSKE, M. C. & COOPER, K. R. 2019. Subtle morphometric, behavioral and gene expression effects in larval zebrafish exposed to PFHxA, PFHxS and 6:2 FTOH. Aquat Toxicol, 208, 126-137.
ANONYMOUS 1995. T-6334 28-Day Repeat Dose Inhalation Toxicity Study in Rats. study report; Testing facility: Huntingdon Life Sciences Ltd., P.O. Box 2, Huntingdon, Cambridgeshire, PE19 6ES ENGLAND; Report no.: MIN 181/952688; Study sponsor: 3M; Study no.: T-6334; Report date: 1995-04-0.
ANONYMOUS 2017. Combined 90-day repeated dose toxicity study with reproduction/developmental toxicity screening (OECD TG 408 and 422) of sodium perfluoroheptanoate
ARBUCKLE, T. E., MACPHERSON, S., FOSTER, W. G., SATHYANARAYANA, S., FISHER, M., MONNIER, P., LANPHEAR, B., MUCKLE, G. & FRASER, W. D. 2020. Prenatal perfluoroalkyl substances and newborn anogenital distance in a Canadian cohort. Reproductive Toxicology, 94, 31-39.
ARMITAGE, J., COUSINS, I. T., BUCK, R. C., PREVEDOUROS, K., RUSSELL, M. H., MACLEOD, M. & KORZENIOWSKI, S. H. 2006. Modeling global-scale fate and transport of perfluorooctanoate emitted from direct sources. Environ. Sci. Technol., 40, 6969.
ARP, H. & SLINDE, G. 2018. PFBS in the Environment: Monitoring and Physical-Chemical Data Related to the Environmental Distribution of Perfluorobutanesulfonic Acid. Norwegian Environmental Agency Report M-1122| 2018.
ARP, H. P. F. H., S.E. 2019. REACH: Improvement of guidance and methods for the identification and assessment of PM/PMT substances. UBA Texte 126/2019. Project number: FKZ 3716 67 416 0. ISSN: 1862-4804. German Environmental Agency (UBA), Dessau-Rosslau, Germany. 129 p. https://www.umweltbundesamt.de/sites/default/files/medien/1410/publikationen/2019-11-29_texte_126-2019_reach-pmt.pdf. .
ARVANITI, O. S., ANDERSEN, H. R., THOMAIDIS, N. S. & STASINAKIS, A. S. 2014. Sorption of Perfluorinated Compounds onto different types of sewage sludge and assessment of its importance during wastewater treatment. Chemosphere, 111, 405-411.

P.O. Box 400, FI-00121 Helsinki, Finland | Tel. +358 9 686180 | echa.europa.eu
421
ASSESSMENT, C. F. R. 2021. ECHA's Committee for Risk Assessment (RAC). Opinion on an Annex XV dossier proposing restrictions on undecafluorohexanoic acid (PFHxA), its salts and related substances ECHA/RAC/RES-O-0000006976-57-01/F . Adopted 3 June 2021.
ATSDR 2021. Toxicological Profile for Perfluoroalkyls. In: REGISTRY, A. F. T. S. A. D. (ed.). Atlanta, GA, USA: Agency for Toxic Substances and Disease Registry.
ATTANASIO, R. 2019. Sex differences in the association between perfluoroalkyl acids and liver function in US adolescents: Analyses of NHANES 2013-2016. Environmental Pollution, 254, 113061.
AU-DOD 2021. Interview of Tom Calthorpe (Australian Department of Defence) by the Dossier Submitter.
AUGUSTINE, R., HASAN, A., PRIMAVERA, R., WILSON, R. J., THAKOR, A. S. & KEVADIYA, B. D. 2020. Cellular uptake and retention of nanoparticles: Insights on particle properties and interaction with cellular components. Materials Today Communications, 25, 19.
AVENTIS PHARMA DEUTSCHLAND GMBH 2002. MV31 K-Salz; (T-7684.9) 4-Week Repeat Dose Gavage Study, with a 28-Day Recovery Period, on Sprague Dawley Rats Aventis Pharma Deutschland GmbH, ProTox, Mainzer Landstr. 500, D-65795 Hattersheim.
AVERINA, M., BROX, J., HUBER, S. & FURBERG, A. S. 2021. Exposure to perfluoroalkyl substances (PFAS) and dyslipidemia, hypertension and obesity in adolescents. The Fit Futures study. Environmental Research, 195, 110740.
AVERINA, M., BROX, J., HUBER, S., FURBERG, A. S. & SORENSEN, M. 2018. Serum perfluoroalkyl substances (PFAS) and risk of asthma and various allergies in adolescents. The Tromso study Fit Futures in Northern Norway. Environ Res, 169, 114-121.
AWAD, R., ZHOU, Y. H., NYBERG, E., NAMAZKAR, S., WU, Y. N., XIAO, Q. F., SUN, Y. J., ZHU, Z. L., BERGMAN, A. & BENSKIN, J. P. 2020. Emerging per- and polyfluoroalkyl substances (PFAS) in human milk from Sweden and China. Environmental Science-Processes & Impacts, 22, 2023-2030.
BACKHAUS, T., ALTENBURGER, R., BOEDEKER, W., FAUST, M., SCHOLZE, M. & GRIMME, L. H. 2000. Predictability of the toxicity of a multiple mixture of dissimilarly acting chemicals to Vibrio fischeri. Environmental Toxicology and Chemistry, 19, 2348-2356.
BACKHAUS, T. & FAUST, M. 2012. Predictive Environmental Risk Assessment of Chemical Mixtures: A Conceptual Framework. Environmental Science & Technology, 46, 2564-2573.
BADUEL, C., MUELLER, J. F., ROTANDER, A., CORFIELD, J. & GOMEZ-RAMOS, M. J. 2017. Discovery of novel per- and polyfluoroalkyl substances (PFASs) at a fire fighting training ground and preliminary investigation of their fate and mobility. Chemosphere, 185, 1030-1038.
BALAN, S. A., MATHRANI, V. C., GUO, D. F. M. & ALGAZI, A. M. 2021. Regulating PFAS as a Chemical Class under the California Safer Consumer Products Program. Environmental Health Perspectives, 129.
BARMENTLO, S. H., STEL, J. M., VAN DOORN, M., ESCHAUZIER, C., DE VOOGT, P. &

P.O. Box 400, FI-00121 Helsinki, Finland | Tel. +358 9 686180 | echa.europa.eu
422
KRAAK, M. H. S. 2015a. Acute and chronic toxicity of short chained perfluoroalkyl substances to Daphnia magna. Environmental Pollution, 198, 47-53.
BARMENTLO, S. H., STEL, J. M., VAN DOORN, M., ESCHAUZIER, C., DE VOOGT, P. & KRAAK, M. H. S. 2015b. Acute and chronic toxicity of short chained perfluoroalkyl substances to Daphnia magna. Environmental Pollution, 198, 47-53.
BARTELS, J. L., FERNANDEZ, S. R., AWEDA, T. A., ALFORD, A., PEASLEE, G. F., GARBOW, J. R. & LAPI, S. E. 2020. Comparative Uptake and Biological Distribution of [18F]-Labeled C6 and C8 Perfluorinated Alkyl Substances in Pregnant Mice via Different Routes of Administration. Environmental Science & Technology Letters, 7, 665-671.
BARTON, C. A., KAISER, M. A. & RUSSELL, M. H. 2007. Partitioning and removal of perfluorooctanoate during rain events: The importance of physical-chemical properties. Journal of Environmental Monitoring, 9, 839-846.
BARTON, K. E., STARLING, A. P., HIGGINS, C. P., MCDONOUGH, C. A., CALAFAT, A. M. & ADGATE, J. L. 2020. Sociodemographic and behavioral determinants of serum concentrations of per-and polyfluoroalkyl substances in a community highly exposed to aqueous film-forming foam contaminants in drinking water. International journal of hygiene and environmental health, 223, 256-266.
BARZEN-HANSON, K. A. & FIELD, J. A. 2015. Discovery and Implications of C2 and C3 Perfluoroalkyl Sulfonates in Aqueous Film-Forming Foams and Groundwater. Environmental Science & Technology Letters, 2, 95-99.
BARZEN-HANSON, K. A., ROBERTS, S. C., CHOYKE, S., OETJEN, K., MCALEES, A., RIDDELL, N., MCCRINDLE, R., FERGUSON, P. L., HIGGINS, C. P. & FIELD, J. A. 2017. Discovery of 40 Classes of Per- and Polyfluoroalkyl Substances in Historical Aqueous Film-Forming Foams (AFFFs) and AFFF-Impacted Groundwater. Environmental Science & Technology, 51, 2047-2057.
BAYERCROPSCIENCE 2014. Summary of the toxicological and metabolism studies for Flurtamone. https://www.cropscience.bayer.com/sites/cropscience/files/inline-files/M-482296-01-5.PDF.
BEANS, C. 2021. News Feature: How “forever chemicals” might impair the immune system. Proceedings of the National Academy of Sciences, 118, e2105018118.
BECK, I. H., TIMMERMANN, C. A. G., NIELSEN, F., SCHOETERS, G., JOHNK, C., KYHL, H. B., HOST, A. & JENSEN, T. K. 2019. Association between prenatal exposure to perfluoroalkyl substances and asthma in 5-year-old children in the Odense Child Cohort. Environmental Health: A Global Access Science Source, 18, 97.
BEHNISCH, P. A., BESSELINK, H., WEBER, R., WILLAND, W., HUANG, J. & BROUWER, A. 2021. Developing potency factors for thyroid hormone disruption by PFASs using TTR-TR beta CALUX (R) bioassay and assessment of PFASs mixtures in technical products. Environment International, 157.
BEHR, A.-C., LICHTENSTEIN, D., BRAEUNING, A., LAMPEN, A. & BUHRKE, T. 2018. Perfluoroalkylated substances (PFAS) affect neither estrogen and androgen receptor activity nor steroidogenesis in human cells in vitro. Toxicology Letters, 291, 51-60.
BENGTSON NASH, S., RINTOUL, S. R., KAWAGUCHI, S., STANILAND, I., HOFF, J. V. D., TIERNEY, M. & BOSSI, R. 2010. Perfluorinated compounds in the Antarctic region: Ocean circulation provides prolonged protection from distant sources. Environmental Pollution, 158, 2985-2991.

P.O. Box 400, FI-00121 Helsinki, Finland | Tel. +358 9 686180 | echa.europa.eu
423
BENNINGHOFF, A. D., BISSON, W. H., KOCH, D. C., EHRESMAN, D. J., KOLLURI, S. K. & WILLIAMS, D. E. 2011. Estrogen-like activity of perfluoroalkyl acids in vivo and interaction with human and rainbow trout estrogen receptors in vitro. Toxicol Sci, 120, 42-58.
BERG, V., NOST, T. H., HANSEN, S., ELVERLAND, A., VEYHE, A. S., JORDE, R., ODLAND, J. O. & SANDANGER, T. M. 2015. Assessing the relationship between perfluoroalkyl substances, thyroid hormones and binding proteins in pregnant women; a longitudinal mixed effects approach. Environ Int, 77, 63-9.
BERNARD, F., PAPANASTASIOU, D. K., PORTMANN, R. W., PAPADIMITRIOU, V. C. & BURKHOLDER, J. B. 2020. Atmospheric lifetimes and global warming potentials of atmospherically persistent N (CxF2x+ 1) 3, x= 2–4, perfluoroamines. Chemical Physics Letters, 744, 137089.
BIEGEL, L. B., HURTT, M. E., FRAME, S. R., O'CONNOR, J. C. & COOK, J. C. 2001. Mechanisms of extrahepatic tumor induction by peroxisome proliferators in male CD rats. Toxicol Sci, 60, 44-55.
BIJLAND, S., RENSEN, P. C. N., PIETERMAN, E. J., MAAS, A. C. E., VAN DER HOORN, J. W., VAN ERK, M. J., HAVEKES, L. M., VAN DIJK, K. W., CHANG, S. C., EHRESMAN, D. J., BUTENHOFF, J. L. & PRINCEN, H. M. G. 2011. Perfluoroalkyl Sulfonates Cause Alkyl Chain Length-Dependent Hepatic Steatosis and Hypolipidemia Mainly by Impairing Lipoprotein Production in APOE*3-Leiden CETP Mice. Toxicological Sciences, 123, 290-303.
BIL, W., ZEILMAKER, M., FRAGKI, S., LIJZEN, J., VERBRUGGEN, E. & BOKKERS, B. 2021. Risk Assessment of Per- and Polyfluoroalkyl Substance Mixtures: A Relative Potency Factor Approach. Environ Toxicol Chem, 40, 859-870.
BIO BY DELOITTE 2014. Technical assistance related to the review of REACH with regard to the registration requirements on polymers – Final report prepared for the European Commission (DG ENV), in collaboration with PIEP. . https://ec.europa.eu/environment/chemicals/reach/pdf/FINAL%20REPORT%20POLYMER%20SI671025.pdf.
BIPRO 2011. Study on waste related issues of newly listed POPs and candidate POPs, retreived from https://op.europa.eu/en/publication-detail/-/publication/ad438122-39ee-49d3-a771-a98cad48a20a.
BISCHEL, H. N., MACMANUS-SPENCER, L. A., ZHANG, C. & LUTHY, R. G. 2011. Strong associations of short-chain perfluoroalkyl acids with serum albumin and investigation of binding mechanisms. Environ Toxicol Chem, 30, 2423-30.
BIZKARGUENAGA, E., ZABALETA, I., PRIETO, A., FERNÁNDEZ, L. A. & ZULOAGA, O. 2016. Uptake of 8:2 perfluoroalkyl phosphate diester and its degradation products by carrot and lettuce from compost-amended soil. Chemosphere, 152, 309-317.
BLAINE, A. C., RICH, C. D., HUNDAL, L. S., LAU, C., MILLS, M. A., HARRIS, K. M. & HIGGINS, C. P. 2013. Uptake of perfluoroalkyl acids into edible crops via land applied biosolids: field and greenhouse studies. Environ Sci Technol, 47, 14062-9.
BLAINE, A. C., RICH, C. D., SEDLACKO, E. M., HUNDAL, L. S., KUMAR, K., LAU, C., MILLS, M. A., HARRIS, K. M. & HIGGINS, C. P. 2014a. Perfluoroalkyl acid distribution in various plant compartments of edible crops grown in biosolids-amended soils. Environmental Science and Technology, 48, 7858-7865.
BLAINE, A. C., RICH, C. D., SEDLACKO, E. M., HUNDAL, L. S., KUMAR, K., LAU, C., MILLS,
P.O. Box 400, FI-00121 Helsinki, Finland | Tel. +358 9 686180 | echa.europa.eu
424
M. A., HARRIS, K. M. & HIGGINS, C. P. 2014b. Perfluoroalkyl acid distribution in various plant compartments of edible crops grown in biosolids-amended soils. Environ Sci Technol, 48, 7858-65.
BLAINE, A. C., RICH, C. D., SEDLACKO, E. M., HYLAND, K. C., STUSHNOFF, C., DICKENSON, E. R. & HIGGINS, C. P. 2014c. Perfluoroalkyl acid uptake in lettuce (Lactuca sativa) and strawberry (Fragaria ananassa) irrigated with reclaimed water. Environ Sci Technol, 48, 14361-8.
BLAKE, B. E., COPE, H. A., HALL, S. M., KEYS, R. D., MAHLER, B. W., MCCORD, J., SCOTT, B., STAPLETON, H. M., STRYNAR, M. J., ELMORE, S. A. & FENTON, S. E. 2020. Evaluation of Maternal, Embryo, and Placental Effects in CD-1 Mice following Gestational Exposure to Perfluorooctanoic Acid (PFOA) or Hexafluoropropylene Oxide Dimer Acid (HFPO-DA or GenX). Environmental Health Perspectives, 128.
BLAKE, B. E., PINNEY, S. M., HINES, E. P., FENTON, S. E. & FERGUSON, K. K. 2018. Associations between longitudinal serum perfluoroalkyl substance (PFAS) levels and measures of thyroid hormone, kidney function, and body mass index in the Fernald Community Cohort. Environmental Pollution, 242, 894-904.
BLAKE, D. A. 1970. A note on the effect of trifluoroacetate on the growth of rat liver - Short Communication. Naunyn-Schmiedebergs Archiv für Pharmakologie, 265, 474-475.
BLOMBERG, A. J., SHIH, Y. H., MESSERLIAN, C., JORGENSEN, L. H., WEIHE, P. & GRANDJEAN, P. 2021. Early-life associations between per- and polyfluoroalkyl substances and serum lipids in a longitudinal birth cohort. Environmental Research, 200, 111400.
BLUTEAU, T., CORNELSEN, M., HOLMES, N.J.C., KLEIN, R.A., MCDOWALL, J.G., SHAEFER, T.H., TISBURY, M., WHITEHEAD, K. 2019. PERFLUOROHEXANE SULFONATE (PFHxS)—SOCIO-ECONOMIC IMPACT, EXPOSURE, AND THE PRECAUTIONARY PRINCIPLE. IPEN Expert Panel. https://ipen.org/sites/default/files/documents/pfhxs_socio-economic_impact_final_oct.2019.pdf.
BORG, D. & IVARSSON, J. 2017. Analysis of PFASs and TOF in Products. Copenhagen, DK: Nordic Council of Ministers.
BORG, D., LUND, B. O., LINDQUIST, N. G. & HAKANSSON, H. 2013. Cumulative health risk assessment of 17 perfluoroalkylated and polyfluoroalkylated substances (PFASs) in the Swedish population. Environment International, 59, 112-123.
BORGERT, C. J., QUILL, T. F., MCCARTY, L. S. & MASON, A. M. 2004. Can mode of action predict mixture toxicity for risk assessment? Toxicology and Applied Pharmacology, 201, 85-96.
BRADRY, N. C. W., R.R. 2010. Elements of the Nature and Properties of Soils, 3rd Ed. Pearsons Education Limited, Harlow, UK.
BRAMBILLA, G., D'HOLLANDER, W., OLIAEI, F., STAHL, T. & WEBER, R. 2015. Pathways and factors for food safety and food security at PFOS contaminated sites within a problem based learning approach. Chemosphere, 129, 192-202.
BRANDSMA, S. H., KOEKKOEK, J. C., VAN VELZEN, M. J. M. & DE BOER, J. 2019. The PFOA substitute GenX detected in the environment near a fluoropolymer manufacturing plant in the Netherlands. Chemosphere, 220, 493-500.
BRIELS, N., CIESIELSKI, T. M., HERZKE, D. & JASPERS, V. L. B. 2018a. Developmental

P.O. Box 400, FI-00121 Helsinki, Finland | Tel. +358 9 686180 | echa.europa.eu
425
Toxicity of Perfluorooctanesulfonate (PFOS) and Its Chlorinated Polyfluoroalkyl Ether Sulfonate Alternative F-53B in the Domestic Chicken. Environ Sci Technol, 52, 12859-12867.
BRIELS, N., CIESIELSKI, T. M., HERZKE, D. & JASPERS, V. L. B. 2018b. Developmental Toxicity of Perfluorooctanesulfonate (PFOS) and Its Chlorinated Polyfluoroalkyl Ether Sulfonate Alternative F-53B in the Domestic Chicken. Environ. Sci. Technol., 52, 12859.
BROOKE, D., FOOTITT, A. & NWAOGU, T. 2004. Environmental risk evaluation report: Perfluorooctanesulphonate (PFOS).
BROWN, J. B., CONDER, J. M., ARBLASTER, J. A. & HIGGINS, C. P. 2020. Assessing Human Health Risks from Per- And Polyfluoroalkyl Substance (PFAS)-Impacted Vegetable Consumption: A Tiered Modeling Approach. Environmental Science and Technology, 54, 15202-15214.
BRUINSTROOP, A. 2021. From C6 to fluorine free foam (Schiphol airport). Presentation at the September 2021 Lastfire Foam Summit.
BRUSSEAU, M. L. 2018. Assessing the potential contributions of additional retention processes to PFAS retardation in the subsurface. Science of the Total Environment, 613-614, 176-185.
BUCK, R. C., FRANKLIN, J., BERGER, U., CONDER, J. M., COUSINS, I. T., DE VOOGT, P., JENSEN, A. A., KANNAN, K., MABURY, S. A. & VAN LEEUWEN, S. P. 2011. Perfluoroalkyl and polyfluoroalkyl substances in the environment: terminology, classification, and origins. Integrated environmental assessment and management, 7, 513-541.
BULKA, C. M., AVULA, V. & FRY, R. C. 2021. Associations of exposure to perfluoroalkyl substances individually and in mixtures with persistent infections: Recent findings from NHANES 1999-2016. Environmental Pollution, 275, 116619.
BUSER ET AL 2009. ‘Substance flow analysis of PFOS and PFOA in Switzerland. Environmental Studies 0922. Federal Office for the Environment, Bern, retreived from https://www.bafu.admin.ch/bafu/en/home/topics/chemicals/publications-studies/publications/substance-flow-analysis.html.
BUTENHOFF, J. L., BJORK, J. A., CHANG, S. C., EHRESMAN, D. J., PARKER, G. A., DAS, K., LAU, C., LIEDER, P. H., VAN OTTERDIJK, F. M. & WALLACE, K. B. 2012a. Toxicological evaluation of ammonium perfluorobutyrate in rats: Twenty-eight-day and ninety-day oral gavage studies. Reproductive Toxicology, 33, 513-530.
BUTENHOFF, J. L., CHANG, S. C., OLSEN, G. W. & THOMFORD, P. J. 2012b. Chronic dietary toxicity and carcinogenicity study with potassium perfluorooctanesulfonate in Sprague Dawley rats. Toxicology, 293, 1-15.
BUTENHOFF, J. L., KENNEDY, G. L., JR., FRAME, S. R., O'CONNOR, J. C. & YORK, R. G. 2004. The reproductive toxicology of ammonium perfluorooctanoate (APFO) in the rat. Toxicology, 196, 95-116.
BUTT, C. M., YOUNG, C. J., MABURY, S. A., HURLEY, M. D. & WALLINGTON, T. J. 2009. Atmospheric chemistry of 4:2 fluorotelomer acrylate [C4F9CH2CH2OC(O)CH=CH2]: kinetics, mechanisms, and products of chlorine-atom- and OH-radical-initiated oxidation. J Phys Chem A, 113, 3155-61.
CAI, D., LI, Q. Q., CHU, C., WANG, S. Z., TANG, Y. T., APPLETON, A. A., QIU, R. L., YANG,

P.O. Box 400, FI-00121 Helsinki, Finland | Tel. +358 9 686180 | echa.europa.eu
426
B. Y., HU, L. W., DONG, G. H. & ZENG, X. W. 2020. High trans-placental transfer of perfluoroalkyl substances alternatives in the matched maternal-cord blood serum: Evidence from a birth cohort study. Sci Total Environ, 705, 135885.
CAI, M., ZHAO, Z., YANG, H., YIN, Z., HONG, Q., STURM, R., EBINGHAUS, R., AHRENS, L., CAI, M., HE, J. & XIE, Z. 2012. Spatial distribution of per- and polyfluoroalkyl compounds in coastal waters from the East to South China Sea. Environmental Pollution, 161, 162-169.
CALAFAT, A. M., KATO, K., HUBBARD, K., JIA, T., BOTELHO, J. C. & WONG, L. Y. 2019. Legacy and alternative per- and polyfluoroalkyl substances in the U.S. general population: Paired serum-urine data from the 2013-2014 National Health and Nutrition Examination Survey. Environ Int, 131, 105048.
CAMPOS PEREIRA, H., ULLBERG, M., KLEJA, D. B., GUSTAFSSON, J. P. & AHRENS, L. 2018. Sorption of perfluoroalkyl substances (PFASs) to an organic soil horizon – Effect of cation composition and pH. Chemosphere, 207, 183-191.
CANOVA, C., BARBIERI, G., ZARE JEDDI, M., GION, M., FABRICIO, A., DAPRA, F., RUSSO, F., FLETCHER, T. & PITTER, G. 2020. Associations between perfluoroalkyl substances and lipid profile in a highly exposed young adult population in the Veneto Region. Environment International, 145, 106117.
CAO, X. Y., LIU, J., ZHANG, Y. J., WANG, Y., XIONG, J. W., WU, J. & CHEN, L. 2020. Exposure of adult mice to perfluorobutanesulfonate impacts ovarian functions through hypothyroxinemia leading to down-regulation of Akt-mTOR signaling. Chemosphere, 244.
CARDENAS, A., HIVERT, M. F., GOLD, D. R., HAUSER, R., KLEINMAN, K. P., LIN, P. D., FLEISCH, A. F., CALAFAT, A. M., YE, X., WEBSTER, T. F., HORTON, E. S. & OKEN, E. 2019. Associations of Perfluoroalkyl and Polyfluoroalkyl Substances With Incident Diabetes and Microvascular Disease. Diabetes Care, 42, 1824-1832.
CARWILE, J. L., SESHASAYEE, S. M., ARIS, I. M., RIFAS-SHIMAN, S. L., CLAUS HENN, B., CALAFAT, A. M., SAGIV, S. K., OKEN, E. & FLEISCH, A. F. 2021. Prospective associations of mid-childhood plasma per- and polyfluoroalkyl substances and pubertal timing. Environment International, 156, 106729.
CASAS, G., MARTÍNEZ-VARELA, A., ROSCALES, J. L., VILA-COSTA, M., DACHS, J. & JIMÉNEZ, B. 2020. Enrichment of perfluoroalkyl substances in the sea-surface microlayer and sea-spray aerosols in the Southern Ocean. Environmental Pollution, 267.
CASSONE, C. G., VONGPHACHAN, V., CHIU, S., WILLIAMS, K. L., LETCHER, R. J., PELLETIER, E., CRUMP, D. & KENNEDY, S. W. 2012. In Ovo Effects of Perfluorohexane Sulfonate and Perfluorohexanoate on Pipping Success, Development, mRNA Expression, and Thyroid Hormone Levels in Chicken Embryos. Toxicological Sciences, 127, 216-224.
CAVERLY RAE, J. M., CRAIG, L., SLONE, T. W., FRAME, S. R., BUXTON, L. W. & KENNEDY, G. L. 2015. Evaluation of chronic toxicity and carcinogenicity of ammonium 2,3,3,3-tetrafluoro-2-(heptafluoropropoxy)-propanoate in Sprague-Dawley rats. Toxicol Rep, 2, 939-949.
CERNA, M., GRAFNETTEROVA, A. P., DVORAKOVA, D., PULKRABOVA, J., MALY, M., JANOS, T., VODRAZKOVA, N., TUPA, Z. & PUKLOVA, V. 2020. Biomonitoring of PFOA, PFOS and PFNA in human milk from Czech Republic, time trends and estimation of infant's daily intake. Environ Res, 188, 109763.

P.O. Box 400, FI-00121 Helsinki, Finland | Tel. +358 9 686180 | echa.europa.eu
427
CHARLES, D., BERG, V., NOST, T. H., HUBER, S., SANDANGER, T. M. & RYLANDER, C. 2020. Pre- and post-diagnostic blood profiles of perfluoroalkyl acids in type 2 diabetes mellitus cases and controls. Environment International, 145, 106095.
CHARLES RIVER 2019. A Whole Body Inhalation Reproduction/Developmental Toxicity Screening Study of MTDID 665 in Rats. Charles River Laboratories Ashland, LLC 1407 George Road Ashland, OH 44805 United States.
CHARLES RIVER LABORATORIES 2007a. A 5-Day Repeat Dose Oral Toxicity Screening Study in Rats with a 7-Day Recovery Period with MTDID 6675, 7280, 7254 and 8799. Charles River Laboratories Preclinical Services 640 North Elizabeth Street Spencerville, OH 45887.
CHARLES RIVER LABORATORIES 2007b. Oral (Gavage) Developmental Toxicity Screening Study of MTDID 6675 in Rats Charles River Laboratories Preclinical Services 905 Sheely Drive, Building A Horsham, PA 19044.
CHARLES RIVER LABORATORIES 2017. A Combined 28-Day Whole Body Inhalation Toxicity Study with the Reproduction/Developmental Toxicity Screening Test of PPVE with a 14-Day Recovery in Rats Charles River Laboratories Ashland, LLC 1407 George Road Ashland, OH 44805 United States.
CHARLES RIVER LABORATORIES 2019. Reproduction/Developmental Toxicity Screening Test of MTDID 42916 by Oral Gavage in Rat. Testing facility: Charles River Laboratories Den Bosch BV Hambakenwetering 7 5231 DD ‘s-Hertogenbosch, The Netherlands; Report no.: 20164070; Study sponsor: 3M Company; Study no.: 18-298; Report date: 2019-07-09, UUID (study): e7d3f096-6d51-4992-bbaa-e180443c7e14.
CHEN, C., WANG, J., LI, L., XU, W. & LIU, J. 2020a. Comparison of fluorotelomer alcohol emissions from wastewater treatment plants into atmospheric and aquatic environments. Environment International, 139.
CHEN, F., WEI, C., CHEN, Q., ZHANG, J., WANG, L., ZHOU, Z., CHEN, M. & LIANG, Y. 2018a. Internal concentrations of perfluorobutane sulfonate (PFBS) comparable to those of perfluorooctane sulfonate (PFOS) induce reproductive toxicity in Caenorhabditis elegans. Ecotoxicol Environ Saf, 158, 223-229.
CHEN, F., YIN, S., KELLY, B. C. & LIU, W. 2017. Chlorinated Polyfluoroalkyl Ether Sulfonic Acids in Matched Maternal, Cord, and Placenta Samples: A Study of Transplacental Transfer. Environ Sci Technol, 51, 6387-6394.
CHEN, L., HU, C., TSUI, M. M. P., WAN, T., PETERSON, D. R., SHI, Q., LAM, P. K. S., AU, D. W. T., LAM, J. C. W. & ZHOU, B. 2018b. Multigenerational Disruption of the Thyroid Endocrine System in Marine Medaka after a Life-Cycle Exposure to Perfluorobutanesulfonate. Environmental Science & Technology, 52, 4432-4439.
CHEN, L., TONG, C., HUO, X., ZHANG, J., TIAN, Y. & SHANGHAI BIRTH, C. 2021. Prenatal exposure to perfluoroalkyl and polyfluoroalkyl substances and birth outcomes: A longitudinal cohort with repeated measurements. Chemosphere, 267, 128899.
CHEN, Y., LI, H., MO, J., CHEN, X., WU, K., GE, F., MA, L., LI, X., GUO, X., ZHAO, J. & GE, R. S. 2019. Perfluorododecanoic Acid Blocks Rat Leydig Cell Development during Prepuberty. Chem Res Toxicol, 32, 146-155.
CHEN, Z., YANG, T., WALKER, D. I., THOMAS, D. C., QIU, C., CHATZI, L., ALDERETE, T. L., KIM, J. S., CONTI, D. V., BRETON, C. V., LIANG, D., HAUSER, E. R., JONES, D. P. & GILLILAND, F. D. 2020b. Dysregulated lipid and fatty acid metabolism link perfluoroalkyl substances exposure and impaired glucose metabolism in young

P.O. Box 400, FI-00121 Helsinki, Finland | Tel. +358 9 686180 | echa.europa.eu
428
adults. Environment International, 145, 106091.
CHENGELIS, C. P., KIRKPATRICK, J. B., RADOVSKY, A. & SHINOHARA, M. 2009. A 90-day repeated dose oral (gavage) toxicity study of perfluorohexanoic acid (PFHxA) in rats (with functional observational battery and motor activity determinations). Reproductive Toxicology, 27, 342-351.
CHOI, W. I., JUNG, H. R., SHEHU, E., RHO, B. H., LEE, M. Y. & KWON, K. Y. 2014. Small Airway-Centered Granulomatosis Caused by Long-term Exposure to Polytetrafluoroethylene. Chest, 145, 1397-1402.
CHRISTENSEN, J. V. R., BANGASH, K. K., WEIHE, P., GRANDJEAN, P., NIELSEN, F., JENSEN, T. K. & PETERSEN, M. S. 2021. Maternal exposure to perfluoroalkyl chemicals and anogenital distance in the offspring: A Faroese cohort study. Reproductive Toxicology, 104, 52-57.
CHU, C., ZHOU, Y., LI, Q. Q., BLOOM, M. S., LIN, S., YU, Y. J., CHEN, D., YU, H. Y., HU, L. W., YANG, B. Y., ZENG, X. W. & DONG, G. H. 2020. Are perfluorooctane sulfonate alternatives safer? New insights from a birth cohort study. Environment International, 135, 105365.
CLARITY, C., TROWBRIDGE, J., GERONA, R., ONA, K., MCMASTER, M., BESSONNEAU, V., RUDEL, R., BUREN, H. & MORELLO-FROSCH, R. 2021. Associations between polyfluoroalkyl substance and organophosphate flame retardant exposures and telomere length in a cohort of women firefighters and office workers in San Francisco. Environmental Health, 20, 1-14.
CLUETT, R., SESHASAYEE, S. M., ROKOFF, L. B., RIFAS-SHIMAN, S. L., YE, X. Y., CALAFAT, A. M., GOLD, D. R., COULL, B., GORDON, C. M., ROSEN, C. J., OKEN, E., SAGIV, S. K. & FLEISCH, A. F. 2019. Per- and Polyfluoroalkyl Substance Plasma Concentrations and Bone Mineral Density in Midchildhood: A Cross-Sectional Study (Project Viva, United States). Environmental Health Perspectives, 127.
COHN, B. A., LA MERRILL, M. A., KRIGBAUM, N. Y., WANG, M., PARK, J. S., PETREAS, M., YEH, G., HOVEY, R. C., ZIMMERMANN, L. & CIRILLO, P. M. 2020. In utero exposure to poly- and perfluoroalkyl substances (PFASs) and subsequent breast cancer. Reproductive Toxicology, 92, 112-119.
COLLINS, C. D. & FINNEGAN, E. 2010. Modeling the Plant Uptake of Organic Chemicals, Including the Soil−Air−Plant Pathway. Environmental Science & Technology, 44, 998-1003.
COLLINS, M. A., RUSCH, G. M., SATO, F., HEXT, P. M. & MILLISCHER, R.-J. 1995. 1,1,1,2-Tetrafluoroethane: Repeat Exposure Inhalation Toxicity in the Rat, Developmental Toxicity in the Rabbit, and Genotoxicity in Vitro and in Vivo. Fundamental and Applied Toxicology, 25, 271-280.
COMMITEE, M. S. 2019. ECHA'S MEMBER STATE COMMITTEE SUPPORT DOCUMENT FOR IDENTIFICATION OF PERFLUOROBUTANE SULFONIC ACID AND ITS SALTS AS SUBSTANCES OF VERY HIGH CONCERN BECAUSE OF THEIR HAZARDOUS PROPERTIES WHICH CAUSE PROBABLE SERIOUS EFFECTS TO HUMAN HEALTH AND THE ENVIRONMENT WHICH GIVE RISE TO AN EQUIVALENT LEVEL OF CONCERN TO THOSE OF CMR1 AND PBT/vPvB2 SUBSTANCES (ARTICLE 57F). Adopted on 11 December 2019.
CONCAWE 2016. Concawe Report, Environmental fate and effects of poly- and perfluoroalkyl substances (PFAS), June 2016, retreived from https://www.concawe.eu/wp-content/uploads/2016/06/Rpt_16-8.pdf.

P.O. Box 400, FI-00121 Helsinki, Finland | Tel. +358 9 686180 | echa.europa.eu
429
CONG, J., CHU, C., LI, Q. Q., ZHOU, Y., MIN QIAN, Z., DEE GEIGER, S., VAUGHN, M. G., ZENG, X. W., LIU, R. Q., HU, L. W., YANG, B. Y., CHEN, G., ZEESHAN, M., SUN, X., XIANG, M. & DONG, G. H. 2021. Associations of perfluorooctane sulfonate alternatives and serum lipids in Chinese adults. Environment International, 155, 106596.
CONLEY, J. M., LAMBRIGHT, C. S., EVANS, N., MCCORD, J., STRYNAR, M. J., HILL, D., MEDLOCK-KAKALEY, E., WILSON, V. S. & GRAY, L. E., JR. 2021. Hexafluoropropylene oxide-dimer acid (HFPO-DA or GenX) alters maternal and fetal glucose and lipid metabolism and produces neonatal mortality, low birthweight, and hepatomegaly in the Sprague-Dawley rat. Environmental International, 146.
CONLEY, J. M., LAMBRIGHT, C. S., EVANS, N., STRYNAR, M. J., MCCORD, J., MCINTYRE, B. S., TRAVLOS, G. S., CARDON, M. C., MEDLOCK-KAKALEY, E., HARTIG, P. C., WILSON, V. S. & GRAY, L. E., JR. 2019. Adverse Maternal, Fetal, and Postnatal Effects of Hexafluoropropylene Oxide Dimer Acid (GenX) from Oral Gestational Exposure in Sprague-Dawley Rats. Environmental health perspectives, 127, 37008.
CONLEY JUSTIN, M., LAMBRIGHT CHRISTY, S., EVANS, N., STRYNAR MARK, J., MCCORD, J., MCINTYRE BARRY, S., TRAVLOS GREGORY, S., CARDON MARY, C., MEDLOCK-KAKALEY, E., HARTIG PHILLIP, C., WILSON VICKIE, S. & GRAY, L. E. 2019. Adverse Maternal, Fetal, and Postnatal Effects of Hexafluoropropylene Oxide Dimer Acid (GenX) from Oral Gestational Exposure in Sprague-Dawley Rats. Environmental Health Perspectives, 127, 037008.
COPERCHINI, F., CROCE, L., DENEGRI, M., PIGNATTI, P., AGOZZINO, M., NETTI, G. S., IMBRIANI, M., ROTONDI, M. & CHIOVATO, L. 2020. Adverse effects of in vitro GenX exposure on rat thyroid cell viability, DNA integrity and thyroid-related genes expression. Environmental Pollution, 264, 114778.
COPERCHINI, F., CROCE, L., RICCI, G., MAGRI, F., ROTONDI, M., IMBRIANI, M. & CHIOVATO, L. 2021. Thyroid Disrupting Effects of Old and New Generation PFAS. Frontiers in Endocrinology, 11, 1077.
CORNELSEN-INTERVIEW 2021. Interview with Martin Cornelesen concerning ECHA FWC: PFAS in AFFF, SR 4 waste disposal, and cleaning techniques. . In: SCHÖPEL, M. (ed.).
CORNELSEN 2020. Purification of Highly Contaminated Fire Fighting Water and Decontamination of Fire Vehicles from PFAS in the Transition Process to Fluorine Free Foams. LASTFIRE Webinar. Cornelsen Umwelttechnologie GmbH.
CORNELSEN, M., WEBER, R. & PANGLISCH, S. 2021. Minimizing the environmental impact of PFAS by using specialized coagulants for the treatment of PFAS polluted waters and for the decontamination of firefighting equipment. Emerging Contaminants, 7, 63-76.
COSTELLO, M. C. S. & LEE, L. S. 2020. Sources, Fate, and Plant Uptake in Agricultural Systems of Per- and Polyfluoroalkyl Substances. Current Pollution Reports.
COUSINS, I. T., DEWITT, J. C., GLÜGE, J., GOLDENMAN, G., HERZKE, D., LOHMANN, R., MILLER, M., NG, C. A., SCHERINGER, M. & VIERKE, L. 2020a. Strategies for grouping per-and polyfluoroalkyl substances (PFAS) to protect human and environmental health. Environmental Science: Processes & Impacts, 22, 1444-1460.
COUSINS, I. T., DEWITT, J. C., GLÜGE, J., GOLDENMAN, G., HERZKE, D., LOHMANN, R., NG, C. A., SCHERINGER, M. & WANG, Z. 2020b. The high persistence of PFAS is sufficient for their management as a chemical class. Environmental Science:

P.O. Box 400, FI-00121 Helsinki, Finland | Tel. +358 9 686180 | echa.europa.eu
430
Processes & Impacts, 22, 2307-2312.
COUSINS, I. T., VESTERGREN, R., WANG, Z., SCHERINGER, M. & MCLACHLAN, M. S. 2016. The precautionary principle and chemicals management: The example of perfluoroalkyl acids in groundwater. Environment International, 94, 331-340.
COVANCE LABORATORIES 2020a. Sodium Trifluoroacetate: Preliminary Study for Effects on Embryo-Fetal Development in the New Zealand White Rabbit by Oral Gavage Administration. Covance Laboratories Limited, Eye Suffolk, IP23 7PX UK
COVANCE LABORATORIES 2020b. Sodium Trifluoroacetate: Study for Effects on Embryo-Fetal Development in the New Zealand White Rabbit by Oral Gavage Administration. Covance Laboratories Limited, Eye Suffolk, IP23 7PX UK
CROCE, L., COPERCHINI, F., TONACCHERA, M., IMBRIANI, M., ROTONDI, M. & CHIOVATO, L. 2019. Effect of long- and short-chain perfluorinated compounds on cultured thyroid cells viability and response to TSH. Journal of Endocrinological Investigation, 42, 1329-1335.
CROPSCIENCE, B. 2007. Sodium Trifluoroacetate (TFA) 90-day toxicity study in the rat by dietary administration. Bayer CropScience, 355 Rue Dostoievski, BP 153, 06903 Sophia Antipolis Cedex, France
CUI, L., ZHOU, Q. F., LIAO, C. Y., FU, J. J. & JIANG, G. B. 2009. Studies on the toxicological effects of PFOA and PFOS on rats using histological observation and chemical analysis. Arch Environ Contam Toxicol, 56, 338-49.
CUI, S., ZHAO, X., CHU, X., ZHANG, S., GU, Q. & XU, C. 2021. Effect of polyfluoroalkyl chemicals on the occurrence of urge urinary incontinence: a population-based study. Therapeutic Advances in Urology, 13, 17562872211029799.
D'EON, J. C. & MABURY, S. A. 2010. Uptake and elimination of perfluorinated phosphonic acids in the rat. Environ Toxicol Chem, 29, 1319-29.
DAL FERRO, N., PELLIZZARO, A., FANT, M., ZERLOTTIN, M. & BORIN, M. 2021. Uptake and translocation of perfluoroalkyl acids by hydroponically grown lettuce and spinach exposed to spiked solution and treated wastewaters. Science of The Total Environment, 772, 145523.
DALLA ZUANNA, T., SAVITZ, D. A., BARBIERI, G., PITTER, G., ZARE JEDDI, M., DAPRA, F., FABRICIO, A. S. C., RUSSO, F., FLETCHER, T. & CANOVA, C. 2021. The association between perfluoroalkyl substances and lipid profile in exposed pregnant women in the Veneto region, Italy. Ecotoxicology & Environmental Safety, 209, 111805.
DALSAGER, L., CHRISTENSEN, N., HALEKOH, U., TIMMERMANN, C. A. G., NIELSEN, F., KYHL, H. B., HUSBY, S., GRANDJEAN, P., JENSEN, T. K. & ANDERSEN, H. R. 2021. Exposure to perfluoroalkyl substances during fetal life and hospitalization for infectious disease in childhood: A study among 1,503 children from the Odense Child Cohort. Environment International, 149, 106395.
DARWIN, R. L. 2011. Estimated Inventory Of PFOS-based Aqueous Film Forming Foam (AFFF), retreived from https://www.informea.org/sites/default/files/imported-documents/UNEP-POPS-POPRC13FU-SUBM-PFOA-FFFC-3-20180112.En.pdf.
DAS, K. P., GREY, B. E., ROSEN, M. B., WOOD, C. R., TATUM-GIBBS, K. R., ZEHR, R. D., STRYNAR, M. J., LINDSTROM, A. B. & LAU, C. 2015. Developmental toxicity of perfluorononanoic acid in mice. Reprod Toxicol, 51, 133-44.

P.O. Box 400, FI-00121 Helsinki, Finland | Tel. +358 9 686180 | echa.europa.eu
431
DAS, K. P., GREY, B. E., ZEHR, R. D., WOOD, C. R., BUTENHOFF, J. L., CHANG, S. C., EHRESMAN, D. J., TAN, Y. M. & LAU, C. 2008. Effects of perfluorobutyrate exposure during pregnancy in the mouse. Toxicological Sciences, 105, 173-181.
DE-MOD 2021. Comment #839 on the SEAC draft opinion on the PFHxA restriction, available in ORCOM Part 1 at https://echa.europa.eu/registry-of-restriction-intentions/-/dislist/details/0b0236e18323a25d.
DELRASO, N. J. 1996. Toxicity of Perfluoro Polyethers in vitro. UNITED STATES AIRFORCE ARMSTRONG LABORATORY, Occupational and Environmental Health Directorate Toxicology Division »2856GStreet" Wright-Patterson AFBOH45433-7400.
DELRASO, N. J., GODIN, C. S., JONES, C. E., WALL, H. G., MATTIE, D. R. & FLEMMING, C. D. 1991. Comparative hepatotoxicity of two polychlorotrifluoroethylenes (3.1 oils) and two chlorotrifluoroethylene (CTFE) oligomers in male Fischer 344 rats. Fundam Appl Toxicol, 17, 550-62.
DENG, M., WU, Y., XU, C., JIN, Y., HE, X., WAN, J., YU, X., RAO, H. & TU, W. 2018. Multiple approaches to assess the effects of F-53B, a Chinese PFOS alternative, on thyroid endocrine disruption at environmentally relevant concentrations. Science of The Total Environment, 624, 215-224.
DENNIS, N. M., HOSSAIN, F., SUBBIAH, S., KARNJANAPIBOONWONG, A., DENNIS, M. L., MCCARTHY, C., JACKSON, W. A., CRAGO, J. P., SALICE, C. J. & ANDERSON, T. A. 2022. Species- and Tissue-Specific Chronic Toxicity Values for Northern Bobwhite Quail (Colinus virginianus) Exposed to Perfluorohexane Sulfonic Acid and a Binary Mixture of Perfluorooctane Sulfonic Acid and Perfluorohexane Sulfonic Acid. Environ Toxicol Chem, 41, 219-229.
DENNIS, N. M., SUBBIAH, S., KARNJANAPIBOONWONG, A., DENNIS, M. L., MCCARTHY, C., SALICE, C. J. & ANDERSON, T. A. 2021. Species- and Tissue-Specific Avian Chronic Toxicity Values for Perfluorooctane Sulfonate (PFOS) and a Binary Mixture of PFOS and Perfluorohexane Sulfonate. Environmental Toxicology and Chemistry, 40, 899-909.
DEPARTMENT OF DEFENCE 2022. PFAS environmental investigation. Support pages for drinking water, https://defence.gov.au/Environment/PFAS/support.asp.
DEWITT, J. C., BLOSSOM, S. J. & SCHAIDER, L. A. 2019. Exposure to per-fluoroalkyl and polyfluoroalkyl substances leads to immunotoxicity: epidemiological and toxicological evidence. Journal of Exposure Science and Environmental Epidemiology, 29, 148-156.
DEWITT, J. C., COPELAND, C. B. & LUEBKE, R. W. 2009. Suppression of Humoral Immunity by Perfluorooctanoic Acid is Independent of Elevated Serum Corticosterone Concentration in Mice. Toxicological Sciences, 109, 106-112.
DEWITT, J. C., COPELAND, C. B., STRYNAR, M. J. & LUEBKE, R. W. 2008. Perfluorooctanoic acid-induced immunomodulation in adult C57BL/6J or C57BL/6N female mice. Environ Health Perspect, 116, 644-50.
DEWITT, J. C., WILLIAMS, W. C., CREECH, N. J. & LUEBKE, R. W. 2016. Suppression of antigen-specific antibody responses in mice exposed to perfluorooctanoic acid: Role of PPARalpha and T- and B-cell targeting. J Immunotoxicol, 13, 38-45.
DING, N., HARLOW, S. D., RANDOLPH, J. F., CALAFAT, A. M., MUKHERJEE, B., BATTERMAN, S., GOLD, E. B. & PARK, S. K. 2020. Associations of Perfluoroalkyl Substances with Incident Natural Menopause: The Study of Women's Health Across the Nation.

P.O. Box 400, FI-00121 Helsinki, Finland | Tel. +358 9 686180 | echa.europa.eu
432
Journal of Clinical Endocrinology & Metabolism, 105, 01.
DING, N., KARVONEN-GUTIERREZ, C. A., HERMAN, W. H., CALAFAT, A. M., MUKHERJEE, B. & PARK, S. K. 2021. Perfluoroalkyl and polyfluoroalkyl substances and body size and composition trajectories in midlife women: the study of women's health across the nation 1999-2018. International Journal of Obesity, 45, 1937-1948.
DOBRACA, D., ISRAEL, L., MCNEEL, S., VOSS, R., WANG, M., GAJEK, R., PARK, J.-S., HARWANI, S., BARLEY, F. & SHE, J. 2015. Biomonitoring in California firefighters: metals and perfluorinated chemicals. Journal of occupational and environmental medicine, 57, 88.
DOD-AUS 2020. Firefighting vehicle cleaning procedure.
DOMAZET, S. L., JENSEN, T. K., WEDDERKOPP, N., NIELSEN, F., ANDERSEN, L. B. & GRONTVED, A. 2020. Exposure to perfluoroalkylated substances (PFAS) in relation to fitness, physical activity, and adipokine levels in childhood: The european youth heart study. Environmental Research, 191, 110110.
DOMÍNGUEZ, A., SALAZAR, Z., BETANCOURT, M., DUCOLOMB, Y., CASAS, E., FERNÁNDEZ, F., BAHENA, I., SALOMÓN, A., TETELTITLA, M., MARTÍNEZ, R., CHAPARRO, A., CUAPIO, P., SALAZAR-LÓPEZ, C. & BONILLA, E. 2019. Effect of perfluorodecanoic acid on pig oocyte viability, intracellular calcium levels and gap junction intercellular communication during oocyte maturation in vitro. Toxicol In Vitro, 58, 224-229.
DONG, G. H., LIU, M. M., WANG, D., ZHENG, L., LIANG, Z. F. & JIN, Y. H. 2011. Sub-chronic effect of perfluorooctanesulfonate (PFOS) on the balance of type 1 and type 2 cytokine in adult C57BL6 mice. Arch Toxicol, 85, 1235-44.
DONG, G. H., ZHANG, Y. H., ZHENG, L., LIU, W., JIN, Y. H. & HE, Q. C. 2009. Chronic effects of perfluorooctanesulfonate exposure on immunotoxicity in adult male C57BL/6 mice. Archives of Toxicology, 83, 805-815.
DONLEY, G. M., TAYLOR, E., JEDDY, Z., NAMULANDA, G. & HARTMAN, T. J. 2019. Association between in utero perfluoroalkyl substance exposure and anti-Mullerian hormone levels in adolescent females in a British cohort. Environmental Research, 177, 108585.
DOW AGROSCIENCES 2002a. XDE-007: 13-Week Dietary Toxicity with 4-Week Recovery Study in Fischer 344 Rats Toxicology & Environmental Research and Consulting, The Dow Chemical; Company, Midland, Michigan 48674.
DOW AGROSCIENCES 2002b. XDE-007: 90-Day Dietary Toxicity Study in CD-1 Mice Toxicology & Environmental Research and Consulting, The Dow Chemical; Company, Midland, Michigan 48675.
DOW AGROSCIENCES 2004. XDE-007: Two-generation dietary reproduction toxicity study in CD rats Toxicology & Environmental Research and Consulting, The Dow Chemical; Company, Midland, Michigan 48679.
DOW AGROSCIENCES 2005a. XDE-007: 18-months oncogenicity study in CD-1 mice Toxicology & Environmental Research and Consulting, The Dow Chemical; Company, Midland, Michigan 48676.
DOW AGROSCIENCES 2005b. XDE-007: Two-Year Dietary Chronic Toxicity/Oncogenicity and Chronic Neurotoxicity Study in Fischer 344 Rats Toxicology & Environmental Research and Consulting, The Dow Chemical; Company, Midland, Michigan 48677

P.O. Box 400, FI-00121 Helsinki, Finland | Tel. +358 9 686180 | echa.europa.eu
433
DREYER, A., WEINBERG, I., TEMME, C. & EBINGHAUS, R. 2009. Polyfluorinated compounds in the atmosphere of the Atlantic and Southern Oceans: Evidence for a global distribution. Environmental Science and Technology, 43, 6507-6514.
DROGE, S. T. J. & GOSS, K. U. 2013. Sorption of organic cations to phyllosilicate clay minerals: CEC-normalization, salt dependency, and the role of electrostatic and hydrophobic effects. Environmental Science and Technology, 47, 14224-14232.
DU, G., HU, J., HUANG, Z., YU, M., LU, C., WANG, X. & WU, D. 2019. Neonatal and juvenile exposure to perfluorooctanoate (PFOA) and perfluorooctane sulfonate (PFOS): Advance puberty onset and kisspeptin system disturbance in female rats. Ecotoxicology and Environmental Safety, 167, 412-421.
DUAN, Y., SUN, H., YAO, Y., LI, Y., MENG, Y., LU, Y., HAN, L. & CHEN, L. 2021. Serum concentrations of per-/polyfluoroalkyl substances and risk of type 2 diabetes: A case-control study. Science of the Total Environment, 787, 147476.
DUAN, Y., SUN, H., YAO, Y., MENG, Y. & LI, Y. 2020. Distribution of novel and legacy per-/polyfluoroalkyl substances in serum and its associations with two glycemic biomarkers among Chinese adult men and women with normal blood glucose levels. Environment International, 134, 105295.
DUCATMAN, A., LUSTER, M. & FLETCHER, T. 2021. Perfluoroalkyl substance excretion: Effects of organic anion-inhibiting and resin-binding drugs in a community setting. Environ Toxicol Pharmacol, 85, 103650.
DUPONT HASKELL 2007a. Combined dose-toxicity study with a reproduction/developmental toxicity screening test (OECD 422). DuPont Haskell Global Centers for Health & Environmental Sciences
DUPONT HASKELL 2007b. H-27450: One-Generation Reproduction Study in Rats. DuPont Haskell Global Centers for Health & Environmental Sciences.
DUPONT HASKELL 2008a. Repeated Dose Oral Toxicity 7-Day Gavage Study in Male Mice. DuPont Haskell Global Centers for Health & Environmental Sciences.
DUPONT HASKELL 2008b. Repeated Dose Oral Toxicity 7-Day Gavage Study in Rats. DuPont Haskell Global Centers for Health & Environmental Sciences.
DUPONT HASKELL 2009. H-29007: Repeated-Dose Oral Toxicity 28-Day Gavage Study in Rats. DuPont Haskell Global Centers for Health & Environmental Sciences
DUPONT HASKELL 2010a. FEA-1100: 90-Day Inhalation Toxicity Study in Rats. DuPont Haskell Global Centers for Health & Environmental Sciences.
DUPONT HASKELL 2010b. FEA-1100: Inhalation Main Developmental Toxicity Study in Rats. DuPont Haskell Global Centers for Health & Environmental Sciences.
DUPONT HASKELL 2011. H-29477: Subchronic Toxicity 90-Day Gavage Study in Rats. DuPont Haskell Global Centers for Health & Environmental Sciences
DUPONT HASKELL 2014. H-30380: Multi-Generation Reproduction Study in Rats (OECD Guideline 416 (Two-Generation Reproduction Toxicity Study). DuPont Haskell Global Centers for Health & Environmental Sciences; Histo-Scientific Research Laboratories, Inc., Virginia, U.S.A.
EBNESAJJAD, S. & MORGAN, R. 2019. Fluoropolymer Additives.

P.O. Box 400, FI-00121 Helsinki, Finland | Tel. +358 9 686180 | echa.europa.eu
434
EC 2020. Final Workshop Report. PFAS Monitoring. https://circabc.europa.eu/ui/group/65764c73-4a57-45dc-8199-473014cf65bf/library/7de3e45b-2a99-481d-b9e6-48d7cea1602c/details.
ECHA 2012a. Member State Committee support document for identification of henicosafluoroundecanoic acid as a substance of very high concern because of its vPvB properties. https://echa.europa.eu/candidate-list-table/- /dislist/details/0b0236e1807dd43c.
ECHA 2012b. Member State Committee support document for identification of heptacosafluorotetradecanoic acid as a substance of very high concern because of its vPvB properties. https://echa.europa.eu/candidate-list-table/- /dislist/details/0b0236e1807dd647.
ECHA 2012c. Member State Committee support document for identification of pentacosafluorotridecanoic acid as a substance of very high concern because of its vPvB properties. https://echa.europa.eu/candidate-list-table/- /dislist/details/0b0236e1807dd5ad.
ECHA 2012d. Member State Committee support document for identification of tricosafluorododecanoic acid as a substance of very high concern because of its vPvB properties. https://echa.europa.eu/candidate-list-table/- /dislist/details/0b0236e1807dd4ef.
ECHA 2013. Member State Committee support document for identification of pentadecafluorooctanoic acid (PFOA) as a substance of very high concern because of its CMR and PBT properties. https://echa.europa.eu/candidate-list-table/-/dislist/details/0b0236e1807db2ba.
ECHA 2015. Member State Committee support document for identification of perfluorononan-1-oic acid and its sodium and ammoinium salts as a substance of very high concern because of its toxic for reproduction, PBT properties.
https://echa.europa.eu/candidate-list-table/-/dislist/details/0b0236e1808db499.
ECHA 2016a. Evaluation of restriction reports and applications for authorisation for PBT and vPvB substances in SEAC. Helsinki: European Chemicals Agency (ECHA).
ECHA 2016b. Guidance on information requirements and Chemical Safety Assessment Chapter R.16: Environmental exposure assessment. European Chemicals Agency.
ECHA 2016c. Member State Committee support document for identification of nonadecafluorodecanoic acid and its sodium and ammoinium salts as a substance of very high concern because of its toxic for reproduction, PBT properties.
https://echa.europa.eu/de/candidate-list-table/-/dislist/details/0b0236e180e22a1a.
ECHA 2017a. Guidance on Information Requirements and Chemical Safety Assessment Chapter R.11: PBT/vPvB assessment. https://echa.europa.eu/documents/10162/13632/information_requirements_r11_ en.pdf.
ECHA 2017b. Member State Committee Support Document for the Identification of Perfluorohexane-1-sulphonic Acid and its Salts as Substances of Very High Concern Because of Their vPvB (Article 57e) Properties. https://echa.europa.eu/candidatelist-table/-/dislist/details/0b0236e18184a0e1.
ECHA 2018a. RAC and SEAC Background document to the Opinion on the Annex XV dossier

P.O. Box 400, FI-00121 Helsinki, Finland | Tel. +358 9 686180 | echa.europa.eu
435
proposing restrictions on C9-C14 PFCAs including their salts and precursors. https://echa.europa.eu/documents/10162/02d5672d-9123-8a8c-5898-ac68f81e5a72.
ECHA 2018b. RAC and SEAC Background document to the Opinion on the Annex XV dossier proposing restrictions on perfluorooctanoic acid (PFOA), PFOA salts and PFOA-related substances. https://echa.europa.eu/documents/10162/e40425c6-590f-8df7-2cd9-0eef79527685.
ECHA 2019a. Annex XV report on Perfluorohexane sulfonic acid (PFHxS), its salts and PFHxS-related substances; retreived from https://echa.europa.eu/documents/10162/a22da803-0749-81d8-bc6d-ef551fc24e19.
ECHA 2019b. European Chemicals Agency. Annex XV report for public consultation on the proposal for identification of 2,3,3,3-tetrafluoro-2-(heptafluoropropoxy)propanoic acid, its salts and its acyl halides (covering any of their individual isomers and combinations thereof) as a substance of very high concern on the basis of the criteria set out in REACH article 57. https://echa.europa.eu/documents/10162/41086906-eeb6-a963-f0b9-af1d0e27efc2
ECHA 2019c. European Chemicals Agency. Annex XV report for public consultation on the proposal for identification of 2,3,3,3-tetrafluoro-2-(heptafluoropropoxy)propanoic acid, its salts and its acyl halides (covering any of their individual isomers and combinations thereof) as a substance of very high concern on the basis of the criteria set out in REACH article 57.
https://echa.europa.eu/documents/10162/41086906-eeb6-a963-f0b9-af1d0e27efc2
ECHA 2019d. Member State Committee Support Document for identification of 2,3,3,3-tetrafluoro-2-(heptafluoropropoxy)propionic acid, its salts and its acyl halidesas substances of very high concern because of their hazardous properties which cause probable serious effects to human health and the environment which give rise to an equivalent level of concern to those of CMR and PBT/vPvB substances (Article 57f). https://www.echa.europa.eu/documents/10162/53fa6a5b-e95f-3128-ea9d-fa27f43b18bc.
ECHA 2019e. Member State Committee Support Document for identification of Perfluorobutane sulfonic acid and its salts as substances of very high concern because of their hazardous properties which cause probable serious effects to human health and the environment which give rise to an equivalent level of concern to those of CMR and PBT/vPvB substances (Article 57f). https://www.echa.europa.eu/documents/10162/891ab33d-d263-cc4b-0f2d-d84cfb7f424a.
ECHA 2020. Comment #3115 to the PFHxA restriction Annex XV report; available in RCOM Part 3 at https://echa.europa.eu/restrictions-under-consideration/-/substance-rev/51401/term.
ECHA 2021a. Background document to the Opinion on the Annex XV dossier proposing a restriction on undecafluorohexanoic acid (PFHxA), its salts and related substances. Retreived from https://echa.europa.eu/documents/10162/7830b3db-f564-5f15-3507-e326168fccdd.

P.O. Box 400, FI-00121 Helsinki, Finland | Tel. +358 9 686180 | echa.europa.eu
436
ECHA 2021b. SEAC's approach to assessing changes in producer surplus. Agreed at SEAC-52 on 15 September 2021. Helsinki: European Chemicals Agency.
EFSA 2018. EFSA Panel on Contaminants in the Food Chain: Risk to human health related to the presence of perfluorooctane sulfonic acid and perfluorooctanoic acid in food. EFSA Journal, 16, e05194.
EFSA 2019. Guidance on harmonised methodologies for human health,animal health and ecological risk assessment of combined exposure to multiple chemicals. European Food Safety Authority; EFSA Journal, 17(3):5634; doi: 10.2903/j.efsa.2019.5634.
EFSA 2020. Risk to human health related to the presence of perfluoroalkyl substances in food. EFSA Journal, 18(9):6223.
ELLIS, D. A., HANSON, M. L., SIBLEY, P. K., SHAHID, T., FINEBERG, N. A., SOLOMON, K. R., MUIR, D. C. & MABURY, S. A. 2001. The fate and persistence of trifluoroacetic and chloroacetic acids in pond waters. Chemosphere, 42, 309-318.
ELLIS, D. A., MARTIN, J. W., DE SILVA, A. O., MABURY, S. A., HURLEY, M. D., SULBAEK ANDERSEN, M. P. & WALLINGTON, T. J. 2004. Degradation of fluorotelomer alcohols: A likely atmospheric source of perfluorinated carboxylic acids. Environmental Science and Technology, 38, 3316-3321.
ELMOZNINO, J., VLAHOS, P. & WHITNEY, M. 2018. Occurrence and partitioning behavior of perfluoroalkyl acids in wastewater effluent discharging into the Long Island Sound. Environmental Pollution, 243, 453-461.
EMELÉUS, H. & SMITH, J. 1959. 67. The heptafluoropropyliodophosphines and their derivatives. Journal of the Chemical Society (Resumed), 375-381.
EPA-US 2016a. Health Effects Support Document for Perfluorooctane Sulfonate (PFOS). U.S. Environmental Protection Agency, Office of Water (4304T) Health and Ecological Criteria Division, Washington, DC 20460, EPA Document Number: 822-R-16-002, May 2016.
EPA-US 2016b. Health Effects Support Document for Perfluorooctanoic Acid (PFOA). U.S. Environmental Protection Agency Office of Water (4304T), Health and Ecological Criteria Division, Washington, DC 20460, EPA Document Number: 822-R-16-003, May 2016.
EPA-US 2018. Human Health Toxicity Values for Hexafluoropropylene Oxide (HFPO) Dimer Acid and Its Ammonium Salt (CASRN 13252-13-6 and CASRN 62037-80-3), also known as “GenX Chemicals”. U.S. Environmental Protection Agency, Office of Water (4304T) Health and Ecological Criteria Division, Washington, DC 20460, EPA Document Number: 823-P-18-001, NOVEMBER 2018.
EPA-US 2021. Human Health Toxicity Values for Perfluorobutane Sulfonic Acid and Related Compound Potassium Perfluorobutane Sulfonate. U.S. Environmental Protection Agency, Washington, DC, EPA/600/R-20/345F, 2021, https://cfpub.epa.gov/ncea/risk/recordisplay.cfm?deid=350888.
EQUINOR-YSTANES-INTERVIEW 2021. Interview with Lars Ystanes concerningECHA FWC: PFAS in AFFF, SR 4 waste disposal, and cleaning techniques. . In: SCHÖPEL, M. (ed.).
ERNSTGÅRD, L., ANDERSEN, M., DEKANT, W., SJÖGREN, B. & JOHANSON, G. 2009. Experimental Exposure to 1,1,1,3,3-Pentafluoropropane (HFC-245fa): Uptake and Disposition in Humans. Toxicological Sciences, 113, 326-336.

P.O. Box 400, FI-00121 Helsinki, Finland | Tel. +358 9 686180 | echa.europa.eu
437
ERNSTGÅRD, L., SJÖGREN, B., DEKANT, W., SCHMIDT, T. & JOHANSON, G. 2012. Uptake and disposition of 1,1-difluoroethane (HFC-152a) in humans. Toxicology Letters, 209, 21-29.
ERNSTGARD, L., SJOGREN, B. & JOHANSON, G. 2012. Toxicokinetics in humans of hydrofluorocarbons (HFCs) used as refrigerants. Toxicology Letters, 211, S139-S139.
EUROFEU 2019a. Eurofeu internal position paper 2019_01 Portable fire extinguishers - If fire extinguishers should fight fires without using PFAS based agents - Facts.
EUROFEU 2019b. Position Paper on Fluorine containing firefighting Foams ‐ Responsible Use of AFFF and the likes, retreived from https://www.eurofeu.org/files/Publikationen/PositionPaper/eurofeu-Pos-FFA_2019-01__01__web.pdf.
EUROFEU 2020a. Comment #2983 to the PFHxA restriction Annex XV report; available in RCOM Part 2 at https://echa.europa.eu/registry-of-restriction-intentions/-/dislist/details/0b0236e18323a25d.
EUROFEU 2020b. Position Paper on Phase out scenarios for Fluorinecontaining foams.
EUROFEU 2021a. Comment #889 on the SEAC draft opinion on the PFHxA restriction, available in ORCOM Part 2 at https://echa.europa.eu/registry-of-restriction-intentions/-/dislist/details/0b0236e18323a25d.
EUROFEU 2021b. Eurofeu consultation by ECHA, February 2021 document named " PFASinAFFF_AllQuestions-revEUROFEU_20210319_redacted.pdf".
EUROFEU 2021c. Input to the study on "REACH restriction support – PFAS in firefighting foams (part 4)” - Provide a report on the manufacture, import and export of firefighting foams in the EEA.
EUROFEU 2021d. personal communication between ECHA and Eurofeu.
EUROFEU 2021e. personal communication between ECHA and Eurofeu on fire extinguishers.
EUROPEAN CHEMICALS AGENCY 2012a. Member State Committee support document for identification of henicosafluoroundecanoic acid as a substance of very high concern because of its vPvB properties.
EUROPEAN CHEMICALS AGENCY 2012b. Member State Committee support document for identification of heptacosafluorotetradecanoic acid as a substance of very high concern because of its vPvB properties.
EUROPEAN CHEMICALS AGENCY 2012c. Member State Committee support document for identification of pentacosafluorotridecanoic acid as a substance of very high concern because of its vPvB properties.
EUROPEAN CHEMICALS AGENCY 2012d. Member State Committee support document for identification of tricosafluorododecanoic acid as a substance of very high concern because of its vPvB properties.
EUROPEAN CHEMICALS AGENCY 2013. Member State Committee support document for identification of pentadecafluorooctanoic acid (PFOA) as a substance of very high concern because of its CMR and PBT properties.
EUROPEAN CHEMICALS AGENCY 2015. Member State Committee support document for identification of perfluorononan-1-oic acid and its sodium and ammoinium salts as a

P.O. Box 400, FI-00121 Helsinki, Finland | Tel. +358 9 686180 | echa.europa.eu
438
substance of very high concern because of its toxic for reproduction, PBT properties.
EUROPEAN CHEMICALS AGENCY 2016a. Guidance on information requirements and Chemical Safety Assessment Chapter R.16: Environmental exposure assessment.
EUROPEAN CHEMICALS AGENCY 2016b. Member State Committee support document for identification of nonadecafluorodecanoic acid and its sodium and ammoinium salts as a substance of very high concern because of its toxic for reproduction, PBT properties.
EUROPEAN CHEMICALS AGENCY 2019. Annex XV report for public consultation on the proposal for identification of 2,3,3,3-tetrafluoro-2-(heptafluoropropoxy)propanoic acid, its salts and its acyl halides (covering any of their individual isomers and combinations thereof) as a substance of very high concern on the basis of the criteria set out in REACH article 57. https://echa.europa.eu/documents/10162/41086906-eeb6-a963-f0b9-af1d0e27efc2.
EUROPEAN COMMISSION 2016. Synthesis Report on the Quality of Drinking Water in the Union examining Member States' reports for the 2011-2013 period, foreseen under Article 13(5) of Directive 98/83/EC. Brussels: European Commission.
EUROPEAN COMMISSION 2021. Report from the Commission to the European Parliament and the Council on the implementation and efficient functioning of Directive 2012/18/EU on the control of major-accident hazards involving dangerous substances for the period 2015-2018. Retreived from https://ec.europa.eu/environment/pdf/industrial-accidents/seveso_implementation_report.pdf.
FAA 2021. Federal Aviation Administration National Part 139 Cert Alert No. 21-05; retreived from https://www.faa.gov/airports/airport_safety/certalerts/media/part-139-cert-alert-21-05-Extinguishing-Agent-Requirements.pdf.
FASANO, W. J., CARPENTER, S. C., GANNON, S. A., SNOW, T. A., STADLER, J. C., KENNEDY, G. L., BUCK, R. C., KORZENIOWSKI, S. H., HINDERLITER, P. M. & KEMPER, R. A. 2006. Absorption, distribution, metabolism, and elimination of 8-2 fluorotelomer alcohol in the rat. Toxicol Sci, 91, 341-55.
FEI, C., MCLAUGHLIN, J. K., LIPWORTH, L. & OLSEN, J. 2009. Maternal levels of perfluorinated chemicals and subfecundity. Hum Reprod, 24, 1200-5.
FELIZETER, S., JÜRLING, H., KOTTHOFF, M., DE VOOGT, P. & MCLACHLAN, M. S. 2021. Uptake of perfluorinated alkyl acids by crops: results from a field study. Environmental Science: Processes & Impacts.
FELIZETER, S., MCLACHLAN, M. S. & DE VOOGT, P. 2012. Uptake of perfluorinated alkyl acids by hydroponically grown lettuce (Lactuca sativa). Environ Sci Technol, 46, 11735-43.
FELIZETER, S., MCLACHLAN, M. S. & DE VOOGT, P. 2014. Root uptake and translocation of perfluorinated alkyl acids by three hydroponically grown crops. J Agric Food Chem, 62, 3334-42.
FENG, X. J., CAO, X. Y., ZHAO, S. S., WANG, X. L., HUA, X., CHEN, L. & CHEN, L. 2017. Exposure of pregnant mice to perfluorobutanesulfonate causes hypothyroxinemia and developmental abnormalities in female offspring. Toxicological Sciences, 155, 409-419.
FENG, Y., FANG, X., SHI, Z., XU, M. & DAI, J. 2010. Effects of PFNA exposure on expression

P.O. Box 400, FI-00121 Helsinki, Finland | Tel. +358 9 686180 | echa.europa.eu
439
of junction-associated molecules and secretory function in rat Sertoli cells. Reprod Toxicol, 30, 429-37.
FENG, Y., SHI, Z., FANG, X., XU, M. & DAI, J. 2009. Perfluorononanoic acid induces apoptosis involving the Fas death receptor signaling pathway in rat testis. Toxicol Lett, 190, 224-30.
FENTON, S. E., DUCATMAN, A., BOOBIS, A., DEWITT, J. C., LAU, C., NG, C., SMITH, J. S. & ROBERTS, S. M. 2021. Per- and Polyfluoroalkyl Substance Toxicity and Human Health Review: Current State of Knowledge and Strategies for Informing Future Research. Environ Toxicol Chem, 40, 606-630.
FFFC-INTERVIEW 2021. Interview with Tom Cortina; John Olav Ottesen, Dafo Fomtec AB; Gregg Ublacker, Johnson Controls (GU) and Mitch Hubert, Perimeter Solutions (MH)concerning ECHA FWC: PFAS in AFFF, SR 5 market data. In: SCHÖPEL, M. (ed.).
FFFC 2020. Comment #3010 on the Annex XV report on PFHxA, retreived from RCOM Part 2 available at https://echa.europa.eu/registry-of-restriction-intentions/-/dislist/details/0b0236e18323a25d.
FILGO, A. J., QUIST, E. M., HOENERHOFF, M. J., BRIX, A. E., KISSLING, G. E. & FENTON, S. E. 2015. Perfluorooctanoic Acid (PFOA)-induced Liver Lesions in Two Strains of Mice Following Developmental Exposures: PPARα Is Not Required. Toxicol Pathol, 43, 558-68.
FMV-INTERSOLIA 2021. Validation of the TOP-methodology for purpose of quantification of PreFAS in fluorine-free fire-fighting foams. Available in comment #944 on the SEAC draft opinion on the PFHxA restriction, available in ORCOM Part 2 at https://echa.europa.eu/registry-of-restriction-intentions/-/dislist/details/0b0236e18323a25d.
FPA-AUS 2021. Comment #911 on the SEAC draft opinion on the PFHxA restriction, available in ORCOM Part 2 at https://echa.europa.eu/registry-of-restriction-intentions/-/dislist/details/0b0236e18323a25d.
FPRF 2020. Evaluation of the fire protection effectiveness of fluorine free firefighting foams, retreived from https://www.nfpa.org/News-and-Research/Data-research-and-tools/Suppression/Evaluation-of-the-fire-protection-effectiveness-of-fluorine-free-firefighting-foams.
FRAGKI, S., DIRVEN, H., FLETCHER, T., GRASL-KRAUPP, B., BJERVE GÜTZKOW, K., HOOGENBOOM, R., KERSTEN, S., LINDEMAN, B., LOUISSE, J., PEIJNENBURG, A., PIERSMA, A. H., PRINCEN, H. M. G., UHL, M., WESTERHOUT, J., ZEILMAKER, M. J. & LUIJTEN, M. 2021. Systemic PFOS and PFOA exposure and disturbed lipid homeostasis in humans: what do we know and what not? Critical Reviews in Toxicology, 51, 141-164.
FRAUENHOFER INSTITUT FÜR TOXIKOLOGIE UND EXPERIM. MEDIZIN 2005. Two Generation Inhalation Reproduction Study with HFC-245fa in Sprague Dawley Rats. Frauenhofer Institut fuer Toxicology und Experim. Medizin, 30625 Hannover
FRAWLEY, R. P., SMITH, M., CESTA, M. F., HAYES-BOUKNIGHT, S., BLYSTONE, C., KISSLING, G. E., HARRIS, S. & GERMOLEC, D. 2018. Immunotoxic and hepatotoxic effects of perfluoro-n-decanoic acid (PFDA) on female Harlan Sprague-Dawley rats and B6C3F1/N mice when administered by oral gavage for 28 days. J Immunotoxicol, 15, 41-52.
FREBERG, B. I., HAUG, L. S., OLSEN, R., DAAE, H. L., HERSSON, M., THOMSEN, C.,

P.O. Box 400, FI-00121 Helsinki, Finland | Tel. +358 9 686180 | echa.europa.eu
440
THORUD, S., BECHER, G., MOLANDER, P. & ELLINGSEN, D. G. 2010. Occupational exposure to airborne perfluorinated compounds during professional ski waxing. Environ Sci Technol, 44, 7723-8.
FROMME, H., TITTLEMIER, S. A., VOLKEL, W., WILHELM, M. & TWARDELLA, D. 2009. Perfluorinated compounds--exposure assessment for the general population in Western countries. Int J Hyg Environ Health, 212, 239-70.
FUJII, Y., NIISOE, T., HARADA, K. H., UEMOTO, S., OGURA, Y., TAKENAKA, K. & KOIZUMI, A. 2015. Toxicokinetics of perfluoroalkyl carboxylic acids with different carbon chain lengths in mice and humans. Journal of Occupational Health, 57, 1-12.
GALLO, E., BARBIELLINI AMIDEI, C., BARBIERI, G., FABRICIO, A. S. C., GION, M., PITTER, G., DAPRA, F., RUSSO, F., GREGORI, D., FLETCHER, T. & CANOVA, C. 2021. Perfluoroalkyl substances and thyroid stimulating hormone levels in a highly exposed population in the Veneto Region. Environmental Research, 203, 111794.
GAO, K., ZHUANG, T., LIU, X., FU, J., ZHANG, J., FU, J., WANG, L., ZHANG, A., LIANG, Y., SONG, M. & JIANG, G. 2019. Prenatal Exposure to Per- and Polyfluoroalkyl Substances (PFASs) and Association between the Placental Transfer Efficiencies and Dissociation Constant of Serum Proteins-PFAS Complexes. Environ Sci Technol, 53, 6529-6538.
GAO, K. Z., T.; LIU, X.; FU, J.; ZHANG, J.; FU, J.; WANG, L.; ZHANG, A.; LIANG, Y.; SONG, M.; JIANG, G. 2019. Prenatal Exposure to Per- and Polyfluoroalkyl Substances (PFASs) and Association between the
Placental Transfer Efficiencies and Dissociation Constant of Serum Proteins−PFAS Complexes. Environ. Sci. Technol., 53, 6529-6538.
GARCIA-VALCARCEL, A. I., MOLERO, E., ESCORIAL, M. C., CHUECA, M. C. & TADEO, J. L. 2014. Uptake of perfluorinated compounds by plants grown in nutrient solution. Sci Total Environ, 472, 20-6.
GASPAR, T. R., CHI, R. J., PARROW, M. W. & RINGWOOD, A. H. 2018. Cellular Bioreactivity of Micro- and Nano-Plastic Particles in Oysters. Frontiers in Marine Science, 5.
GAYLORD, A., BERGER, K. I., NAIDU, M., ATTINA, T. M., GILBERT, J., KOSHY, T. T., HAN, X., MARMOR, M., SHAO, Y., GIUSTI, R., GOLDRING, R. M., KANNAN, K. & TRASANDE, L. 2019. Serum perfluoroalkyl substances and lung function in adolescents exposed to the World Trade Center disaster. Environmental Research, 172, 266-272.
GEISER, M., SCHURCH, S. & GEHR, P. 2003. Influence of surface chemistry and topography of particles on their immersion into the lung's surface-lining layer. J Appl Physiol (1985), 94, 1793-801.
GHISI, R., VAMERALI, T. & MANZETTI, S. 2019. Accumulation of perfluorinated alkyl substances (PFAS) in agricultural plants: A review. Environmental Research, 169, 326-341.
GODFREY, A., HOOSER, B., ABDELMONEIM, A., HORZMANN, K. A., FREEMANC, J. L. & SEPÚLVEDA, M. S. 2017. Thyroid disrupting effects of halogenated and next generation chemicals on the swim bladder development of zebrafish. Aquatic Toxicology, 193, 228-235.
GODFREY, A., HOOSER, B., ABDELMONEIM, A. & SEPÚLVEDA, M. S. 2019. Sex-specific endocrine-disrupting effects of three halogenated chemicals in Japanese medaka.

P.O. Box 400, FI-00121 Helsinki, Finland | Tel. +358 9 686180 | echa.europa.eu
441
Journal of Applied Toxicology, 39, 1215-1223.
GOMIS, M. I., VESTERGREN, R., BORG, D. & COUSINS, I. T. 2018. Comparing the toxic potency in vivo of long-chain perfluoroalkyl acids and fluorinated alternatives. Environment International, 113, 1-9.
GONSOWSKI, C. T., LASTER, M. J., EGER, E. I., FERRELL, L. D. & KERSCHMANN, R. L. 1994a. Toxicity of Compound-a in Rats - Effect of a 3-Hour Administration. Anesthesiology, 80, 556-565.
GONSOWSKI, C. T., LASTER, M. J., EGER, E. I., FERRELL, L. D. & KERSCHMANN, R. L. 1994b. Toxicity of Compound-a in Rats - Effect of Increasing Duration of Administration. Anesthesiology, 80, 566-573.
GORDON, S. C. 2011. Toxicological evaluation of ammonium 4,8-dioxa-3H-perfluorononanoate, a new emulsifier to replace ammonium perfluorooctanoate in fluoropolymer manufacturing. Regul Toxicol Pharmacol, 59, 64-80.
GORROCHATEGUI, E., PEREZ-ALBALADEJO, E., CASAS, J., LACORTE, S. & PORTE, C. 2014. Perfluorinated chemicals: differential toxicity, inhibition of aromatase activity and alteration of cellular lipids in human placental cells. Toxicol Appl Pharmacol, 277, 124-30.
GOUDARZI, H., MIYASHITA, C., OKADA, E., KASHINO, I., CHEN, C. J., ITO, S., ARAKI, A., KOBAYASHI, S., MATSUURA, H. & KISHI, R. 2017. Prenatal exposure to perfluoroalkyl acids and prevalence of infectious diseases up to 4years of age. Environ Int, 104, 132-138.
GRABER, J. M., BLACK, T. M., SHAH, N. N., CABAN-MARTINEZ, A. J., LU, S.-E., BRANCARD, T., YU, C. H., TURYK, M. E., BLACK, K. & STEINBERG, M. B. 2021. Prevalence and predictors of per-and polyfluoroalkyl substances (PFAS) serum levels among members of a suburban us volunteer fire department. International journal of environmental research and public health, 18, 3730.
GRANUM, B., HAUG, L. S., NAMORK, E., STOLEVIK, S. B., THOMSEN, C., AABERGE, I. S., VAN LOVEREN, H., LOVIK, M. & NYGAARD, U. C. 2013. Pre-natal exposure to perfluoroalkyl substances may be associated with altered vaccine antibody levels and immune-related health outcomes in early childhood. J Immunotoxicol, 10, 373-9.
GRIFFITH, F. D. & LONG, J. E. 1980. Animal toxicity studies with ammonium perfluorooctanoate. Am Ind Hyg Assoc J, 41, 576-83.
GROH, K. J., GEUEKE, B. & MUNCKE, J. 2017. Food contact materials and gut health: Implications for toxicity assessment and relevance of high molecular weight migrants. Food and Chemical Toxicology, 109, 1-18.
GUNNARE, S., ERNSTGÅRD, L., SJÖGREN, B. & JOHANSON, G. 2006. Toxicokinetics of 1,1,1,2-tetrafluoroethane (HFC-134a) in male volunteers after experimental exposure. Toxicology Letters, 167, 54-65.
GUNNARE, S., ERNSTGÅRD, L., SJÖGREN, B. & JOHANSON, G. 2007. Experimental exposure to 1,1,1-trifluoroethane (HFC-143a): Uptake, disposition and acute effects in male volunteers. Toxicology Letters, 172, 120-130.
GUO, J., ZHANG, J., WANG, Z., ZHANG, L., QI, X., ZHANG, Y., CHANG, X., WU, C. & ZHOU, Z. 2021. Umbilical cord serum perfluoroalkyl substance mixtures in relation to thyroid function of newborns: Findings from Sheyang Mini Birth Cohort Study. Chemosphere, 273, 129664.
P.O. Box 400, FI-00121 Helsinki, Finland | Tel. +358 9 686180 | echa.europa.eu
442
HAGEMEYER, D. R. & STUBBLEBINE, W. 1954. Physiological activity of Fluorocarbon Polymers. Modern Plastics, 31, 136-141, 219.
HALLBERG, I., PLASSMANN, M., OLOVSSON, M., HOLTE, J., DAMDIMOPOULOU, P., SJUNNESSON, Y. C. B., BENSKIN, J. P. & PERSSON, S. 2021. Suspect and non-target screening of ovarian follicular fluid and serum - identification of anthropogenic chemicals and investigation of their association to fertility. Environ Sci Process Impacts, 23, 1578-1588.
HAMMARSTRAND, S., JAKOBSSON, K., ANDERSSON, E., XU, Y., LI, Y., OLOVSSON, M. & ANDERSSON, E. M. 2021. Perfluoroalkyl substances (PFAS) in drinking water and risk for polycystic ovarian syndrome, uterine leiomyoma, and endometriosis: A Swedish cohort study. Environment International, 157, 106819.
HAN, X., MENG, L., ZHANG, G., LI, Y., SHI, Y., ZHANG, Q. & JIANG, G. 2021. Exposure to novel and legacy per- and polyfluoroalkyl substances (PFASs) and associations with type 2 diabetes: A case-control study in East China. Environment International, 156, 106637.
HARLOW, S. D., HOOD, M. M., DING, N., MUKHERJEE, B., CALAFAT, A. M., RANDOLPH, J. F., GOLD, E. B. & PARK, S. K. 2021. Per- and Polyfluoroalkyl Substances (PFAS) and Hormone Levels during the Menopausal Transition. Journal of Clinical Endocrinology & Metabolism, 28, 28.
HARRIS, M. H., OKEN, E., RIFAS-SHIMAN, S. L., CALAFAT, A. M., BELLINGER, D. C., WEBSTER, T. F., WHITE, R. F. & SAGIV, S. K. 2021. Prenatal and childhood exposure to per- and polyfluoroalkyl substances (PFAS) and child executive function and behavioral problems. Environmental Research, 202, 111621.
HARRIS, M. W. & BIRNBAUM, L. S. 1989. Developmental toxicity of perfluorodecanoic acid in C57BL/6N mice. Fundam Appl Toxicol, 12, 442-8.
HASKELL 1994. Developmental Toxicity Study of H-20255 in Rats. Haskell Laboratory for Toxicology and Industrial Medicine.
HASKELL 1996a. 90-Day Inhalation Toxicity Study with HFC-236fa in Rats. Laboratory for Toxicology and Industrial Medicine.
HASKELL 1996b. Subchronic Inhalation Toxicity: 90-Day Study with H-20255 Inhalation Study in Rats. Haskell Laboratory for Toxicology and Industrial Medicine.
HASKELL 1997. Four-Week Inhalation Toxicity Study with PEVE in Rats. E.I. du Pont de Nemours and Company, Haskell Laboratory for Toxicology and Industrial Medicine, Elkton Road, P.O. Box 50, Newark, Delaware 19714.
HASKELL 2010. H-28548: Subchronic Toxicity 90-Day Gavage Study in Mice DuPont Haskell Global Centers for Health & Environmental Sciences.
HAYS, H. L. & SPILLER, H. 2014. Fluoropolymer-associated illness. Clin Toxicol (Phila), 52, 848-55.
HEFFERNAN, A. L., CUNNINGHAM, T. K., DRAGE, D. S., AYLWARD, L. L., THOMPSON, K., VIJAYASARATHY, S., MUELLER, J. F., ATKIN, S. L. & SATHYAPALAN, T. 2018. Perfluorinated alkyl acids in the serum and follicular fluid of UK women with and without polycystic ovarian syndrome undergoing fertility treatment and associations with hormonal and metabolic parameters. Int J Hyg Environ Health, 221, 1068-1075.
HELD & REINHARD 2016. [GERMAN] Analysierte PFAS – die Spitze des Eisbergs? ( Analyzed

P.O. Box 400, FI-00121 Helsinki, Finland | Tel. +358 9 686180 | echa.europa.eu
443
PFAS – The Tip of the Iceberg?). Altlastenspektrum.
HELLSING, M. S., JOSEFSSON, S., HUGHES, A. V. & AHRENS, L. 2016. Sorption of perfluoroalkyl substances to two types of minerals. Chemosphere, 159, 385-91.
HELMICK, L. S. & JONES JR, W. R. 1990. Determination of the thermal stability of perfluoroalkylethers.
HENDERSON, W. M. & SMITH, M. A. 2007. Perfluorooctanoic acid and perfluorononanoic acid in fetal and neonatal mice following in utero exposure to 8-2 fluorotelomer alcohol. Toxicol Sci, 95, 452-61.
HENRY, B. J., CARLIN, J. P., HAMMERSCHMIDT, J. A., BUCK, R. C., BUXTON, L. W., FIEDLER, H., SEED, J. & HERNANDEZ, O. 2018. A critical review of the application of polymer of low concern and regulatory criteria to fluoropolymers. Integr Environ Assess Manag, 14, 316-334.
HETZER, R., KÜMMERLEN, F. & BLUNK, D. Auf dem Weg vom Siloxantensid zum fluorfreien AFFF.
HETZER, R., KÜMMERLEN, F., WIRZ, K. & BLUNK, D. 2014. Fire testing a new fluorine-free AFFF based on a novel class of environmentally sound high performance siloxane surfactants. Fire Safety Science, 11, 1261-1270.
HETZER, R. H. & KÜMMERLEN, F. 2016. The Extinguishing Performance of Experimental Siloxane-Based AFFF.
HETZER, R. H., KÜMMERLEN, F. & BLUNK, D. Fire Testing of Experimental Siloxane-Based AFFF: Results from New Experiments. Conference Paper, Suppression, Detection and Signaling Research and Applications Symposium (SUPDET 2015), Orlando (Florida, USA), 2015.
HIGGINS, C. P. & LUTHY, R. G. 2006a. Sorption of perfluorinated surfactants on sediments. Environmental Science and Technology, 40, 7251-7256.
HIGGINS, C. P. & LUTHY, R. G. 2006b. Sorption of perfluorinated surfactants on sediments. Environ.Sci Technol., 40, 7251-7256.
HIRATA-KOIZUMI, M., FUJII, S., FURUKAWA, M., ONO, A. & HIROSE, A. 2012. Repeated dose and reproductive/developmental toxicity of perfluorooctadecanoic acid in rats. J Toxicol Sci, 37, 63-79.
HIRATA-KOIZUMI, M., FUJII, S., HINA, K., MATSUMOTO, M., TAKAHASHI, M., ONO, A. & HIROSE, A. 2015. Repeated dose and reproductive/developmental toxicity of long-chain perfluoroalkyl carboxylic acids in rats: perfluorohexadecanoic acid and perfluorotetradecanoic acid. Fundamental Toxicological Sciences, 2, 177-190.
HITA 1994. Twenty-eight-day repeated-dose oral toxicity study of C6H in rats. Hita Research Laboratories, Chemical Biotesting Center, Chemicals Inspection and Testing Institute (Japan)
HITA 2001. 28-day repeated dose oral toxicity study of CCP-30CF3 in rats. Hita Laboratory Chemicals Evaluation and Research Institute Japan.
HITA 2004. Twenty-Eight-Day Repeated-Dose Oral Toxicity Study of T-7869 in Rats. Hita Laboratory Chemicals Evaluation and Research Institute Japan.
HITA 2006. Twenty-eight-day repeated-dose oral toxicity study of EEA-NH4 in rats. Hita

P.O. Box 400, FI-00121 Helsinki, Finland | Tel. +358 9 686180 | echa.europa.eu
444
Laboratory, Chemicals Evaluation and research Institute, 822, 3-chome, Ishii-machi, Hita, oita 877-0061, Japan.
HITA 2007a. Twenty-eight-day repeated-dose oral toxicity study of C6-ethane in rats. Hita Laboratory, Chemicals Evaluation and Research Institute, 822, 3-chome, Ishii-machi, Hita, Oita 877-0061, Japan.
HITA 2007b. Twenty-eight Day Repeated Dose Oral Toxicity Study of the 13F-EtOH in Rats. https://www.daikinchemicals.com/library/pb_common/pdf/sustainability/C6-2Alcohol/28_C6-2Alcohol_E.pdf,#B11-0839. Hita Laboratory, Japan.
HONG, S. H., LEE, S. H., YANG, J. Y., LEE, J. H., JUNG, K. K., SEOK, J. H., KIM, S. H., NAM, K. T., JEONG, J., LEE, J. K. & OH, J. H. 2020. Orally administered 6:2 chlorinated polyfluorinated ether sulfonate (f-53b) causes thyroid dysfunction in rats. Toxics, 8, 1-10.
HOOVER, G., KAR, S., GUFFEY, S., LESZCZYNSKI, J. & SEPULVEDA, M. S. 2019. In vitro and in silico modeling of perfluoroalkyl substances mixture toxicity in an amphibian fibroblast cell line. Chemosphere, 233, 25-33.
HORI, H., MURAYAMA, M. & KUTSUNA, S. 2009. Oxygen-induced efficient mineralization of perfluoroalkylether sulfonates in subcritical water. Chemosphere, 77, 1400-1405.
HOUDE, M., DOUVILLE, M., GIRAUDO, M., JEAN, K., LÉPINE, M., SPENCER, C. & DE SILVA, A. O. 2016. Endocrine-disruption potential of perfluoroethylcyclohexane sulfonate (PFECHS) in chronically exposed Daphnia magna. Environmental Pollution, 218, 950-956.
HU, Y., LIU, G., ROOD, J., LIANG, L., BRAY, G. A., DE JONGE, L., COULL, B., FURTADO, J. D., QI, L., GRANDJEAN, P. & SUN, Q. 2019. Perfluoroalkyl substances and changes in bone mineral density: A prospective analysis in the POUNDS-LOST study. Environmental Research, 179, 108775.
HUANG, H., YU, K., ZENG, X., CHEN, Q., LIU, Q., ZHAO, Y., ZHANG, J., ZHANG, X. & HUANG, L. 2020. Association between prenatal exposure to perfluoroalkyl substances and respiratory tract infections in preschool children. Environmental Research, 191, 110156.
HUANG, M., JIAO, J., ZHUANG, P., CHEN, X., WANG, J. & ZHANG, Y. 2018. Serum polyfluoroalkyl chemicals are associated with risk of cardiovascular diseases in national US population. Environment International, 119, 37-46.
HUANG, Q. Y., ZHANG, J., MARTIN, F. L., PENG, S. Y., TIAN, M. P., MU, X. L. & SHEN, H. Q. 2013. Perfluorooctanoic acid induces apoptosis through the p53-dependent mitochondrial pathway in human hepatic cells: A proteomic study. Toxicology Letters, 223, 211-220.
HUBER, S., MOE, M. K., SCHMIDBAUER, N., HANSEN, G. H. & HERZKE, D. 2009. Emissions from incineration of fluoropolymer materials A literature survey. Norwegian Institute for Air Research (NILU).
HUCK, I., BEGGS, K. & APTE, U. 2018. Paradoxical Protective Effect of Perfluorooctanesulfonic Acid Against High-Fat Diet-Induced Hepatic Steatosis in Mice. International Journal of Toxicology, 37, 383-392.
HUFF, D. K., MORRIS, L. A., SUTTER, L., COSTANZA, J. & PENNELL, K. D. 2020. Accumulation of six PFAS compounds by woody and herbaceous plants: potential for phytoextraction. International Journal of Phytoremediation, 22, 1538-1550.

P.O. Box 400, FI-00121 Helsinki, Finland | Tel. +358 9 686180 | echa.europa.eu
445
HUI, Z. G., LI, R. J. & CHEN, L. 2017. The impact of exposure to environmental contaminant on hepatocellular lipid metabolism. Gene, 622, 67-71.
HUNTINGDON 1992. READ ACROSS: T-5333: 90-Day Inhalation Study in Rats Huntingdon Research Centre Ltd., P.O. Box 2, Huntingdon, Cambridgeshire, PE18 6ES, England.
HUNTINGDON 1995. T-6334 28-Day Repeat Dose Inhalation Toxicity Study in Rats. study report; Testing facility: Huntingdon Life Sciences Ltd., P.O. Box 2, Huntingdon, Cambrigeshire, PE19 6ES ENGLAND; Report no.: MIN 181/952688; Study sponsor: 3M; Study no.: T-6334; Report date: 1995-04-02.
HUNTINGDON 1996a. 28-Day Repeat Dose Inhalation Toxicity Study in Rats. Huntingdon Life Sciences Ltd., P.O. Box 2, Huntingdon Cambridgeshire PE18 6ES, ENGLAND.
HUNTINGDON 1996b. T-6334 13-Week Repeat Dose Inhalation Toxicity Study in Rats. Huntingdon Life Sciences Ltd., P.O. Box 2, Huntingdon, Cambrigeshire, PE19 6ES ENGLAND
HUNTINGDON 1997. T-6333 28-Day Repeat Dose Inhalation Toxicity Study in Rats; Testing facility: Huntingdon Life Sciences Ltd., P.O. Box 2, Huntingdon Cambridgeshire PE18 6ES, ENGLAND; Report date: 1997-07-20; Report number: MIN 23/963537; Study sponsor: 3M; Study number: T-6333.
HUNTINGDON 1998a. HFCPA 90 days repeat dose inhalation toxicity study in rats (snout only exposure). Huntingdon Life Sciences Ltd, PO Box 2, Huntingdon, Cambridgeshire, PE186ES, England.
HUNTINGDON 1998b. HFCPA a study for effects on embryofetal development by inhalation administration in the rat (whole body exposure). Huntingdon Life Sciences Ltd, PO Box 2, Huntingdon, Cambridgeshire, PE186ES, England.
HUNTINGDON 1998c. HFCPA Additional histopathology investigations to a toxicity study by oral administration to CD rats for 4 weeks followed by a 2 week recovery period. Huntingdon Life Sciences Ltd, PO Box 2, Huntingdon, Cambridgeshire, PE186ES, England
HUNTINGDON 1998d. HFCPA Toxicity study by oral administration to CD rats for 4 weeks followed by a 2 week recovery period. Huntingdon Life Sciences Ltd, Eye, Suffolk IP23 7PX, England
HUNTINGDON N/A-a. N/A (HFC-365mfc-28-d-inhalation-rat). Huntingdon Life Sciences Ltd. Huntingdon, Cambridgeshire PE18 6ES.
HUNTINGDON N/A-b. N/A (Tetraconazole-2-yr-oral-rat). Huntingdon Research Centre Ltd., P.O. Box 2, Huntingdon, Cambridgeshire, PE18 6ES, England.
HUNTINGDON N/A-c. N/A (Tetraconazole-28-d-oral-rat). Huntingdon Research Centre Ltd., P.O. Box 2, Huntingdon, Cambridgeshire, PE18 6ES, England.
HUNTINGDON N/A-d. N/A (Tetraconazole-28-d-oral-rat)-2. Huntingdon Research Centre Ltd., P.O. Box 2, Huntingdon, Cambridgeshire, PE18 6ES, England, UUID: SNIF-a6f48776-2365-3273-be21-77d8a0cf9fc3.
HUNTINGDON N/A-e. N/A (Tetraconazole-28-d(2)-oral-rat). Huntingdon Research Centre Ltd., P.O. Box 2, Huntingdon, Cambridgeshire, PE18 6ES, England.
HUNTINGDON N/A-f. N/A (Tetraconazole-80-wk-oral-mouse). Huntingdon Research Centre
P.O. Box 400, FI-00121 Helsinki, Finland | Tel. +358 9 686180 | echa.europa.eu
446
Ltd., P.O. Box 2, Huntingdon, Cambridgeshire, PE18 6ES, England.
HUNTINGDON N/A-g. N/A (Tetraconazole-90-d-oral-rat). Huntingdon Research Centre Ltd., P.O. Box 2, Huntingdon, Cambridgeshire, PE18 6ES, England.
HURLEY, M., SULBAEK ANDERSEN, M., WALLINGTON, T., ELLIS, D., MARTIN, J. & MABURY, S. 2004. Atmospheric chemistry of perfluorinated carboxylic acids: reaction with OH radicals and atmospheric lifetimes. The Journal of Physical Chemistry A, 108, 615-620.
IARC 2014. Trichloroethylene, Tetrachloroethylene, and Some Other Chlorinated Agents . IARC Monographs on the Evaluation of Carcinogenic Risks to Humans Volume 106.
IARC 2017. Some chemicals used as solvents and in polymer manufacture. IARC monographs on the evaluation of carcinogenic risks to humans. International Agency for Research on Cancer.
ICI 1979. Arcton 134a: subacute toxicity to the rat by inhalation. ICI Central Toxicology Laboratory, Alderley Park, Macclesfield, Cheshire, UK
IMPINEN, A., LONGNECKER, M. P., NYGAARD, U. C., LONDON, S. J., FERGUSON, K. K., HAUG, L. S. & GRANUM, B. 2019. Maternal levels of perfluoroalkyl substances (PFASs) during pregnancy and childhood allergy and asthma related outcomes and infections in the Norwegian Mother and Child (MoBa) cohort. Environ Int, 124, 462-472.
IMPINEN, A., NYGAARD, U. C., LODRUP CARLSEN, K. C., MOWINCKEL, P., CARLSEN, K. H., HAUG, L. S. & GRANUM, B. 2018. Prenatal exposure to perfluoralkyl substances (PFASs) associated with respiratory tract infections but not allergy- and asthma-related health outcomes in childhood. Environ Res, 160, 518-523.
INGELIDO, A. M., ABBALLE, A., GEMMA, S., DELLATTE, E., IACOVELLA, N., DE ANGELIS, G., ZAMPAGLIONI, F., MARRA, V., MINIERO, R., VALENTINI, S., RUSSO, F., VAZZOLER, M., TESTAI, E. & DE FELIP, E. 2018. Biomonitoring of perfluorinated compounds in adults exposed to contaminated drinking water in the Veneto Region, Italy. Environ Int, 110, 149-159.
INOUE, K., RITZ, B., ANDERSEN, S. L., RAMLAU-HANSEN, C. H., HOYER, B. B., BECH, B. H., HENRIKSEN, T. B., BONEFELD-JORGENSEN, E. C., OLSEN, J. & LIEW, Z. 2019. Perfluoroalkyl Substances and Maternal Thyroid Hormones in Early Pregnancy; Findings in the Danish National Birth Cohort. Environmental Health Perspectives, 127, 117002.
IPEN 2018. Fluorine-free firefighting foams (3F) viable alternatives to fluorinated aqueous film-forming foams (AFFF), retreived from https://ipen.org/sites/default/files/documents/IPEN_F3_Position_Paper_POPRC-14_12September2018d.pdf.
IPEN 2019. The global pfas problem: fluorine-free alternatives as solutions - Firefighting foams and other sources — going fluorine-free; retreived from https://ipen.org/sites/default/files/documents/the_global_pfas_problem-v1_5_final_18_april.pdf.
ISHIBASHI, H., ISHIDA, H., MATSUOKA, M., TOMINAGA, N. & ARIZONO, K. 2007. Estrogenic effects of fluorotelomer alcohols for human estrogen receptor isoforms alpha and beta in vitro. Biol.Pharm.Bull., 30, 1358-1359.
ISHIBASHI, H., KIM, E. Y. & IWATA, H. 2011. Transactivation potencies of the Baikal seal

P.O. Box 400, FI-00121 Helsinki, Finland | Tel. +358 9 686180 | echa.europa.eu
447
(Pusa sibirica) peroxisome proliferator-activated receptor alpha by perfluoroalkyl carboxylates and sulfonates: estimation of PFOA induction equivalency factors. Environ Sci Technol, 45, 3123-30.
ITOH, H., HARADA, K. H., KASUGA, Y., YOKOYAMA, S., ONUMA, H., NISHIMURA, H., KUSAMA, R., YOKOYAMA, K., ZHU, J., HARADA SASSA, M., TSUGANE, S. & IWASAKI, M. 2021. Serum perfluoroalkyl substances and breast cancer risk in Japanese women: A case-control study. Science of the Total Environment, 800, 149316.
ITOH, S., ARAKI, A., MIYASHITA, C., YAMAZAKI, K., GOUDARZI, H., MINATOYA, M., AIT BAMAI, Y., KOBAYASHI, S., OKADA, E., KASHINO, I., YUASA, M., BABA, T. & KISHI, R. 2019. Association between perfluoroalkyl substance exposure and thyroid hormone/thyroid antibody levels in maternal and cord blood: The Hokkaido Study. Environment International, 133, 105139.
IWAI, H. & HOBERMAN, A. M. 2014. Oral (Gavage) Combined Developmental and Perinatal/Postnatal Reproduction Toxicity Study of Ammonium Salt of Perfluorinated Hexanoic Acid in Mice. Int J Toxicol, 33, 219-237.
JACKSON-BROWNE, M. S., ELIOT, M., PATTI, M., SPANIER, A. J. & BRAUN, J. M. 2020. PFAS (per- and polyfluoroalkyl substances) and asthma in young children: NHANES 2013-2014. International Journal of Hygiene & Environmental Health, 229, 113565.
JEDYNAK, P., MAITRE, L., GUXENS, M., GUTZKOW, K. B., JULVEZ, J., LOPEZ-VICENTE, M., SUNYER, J., CASAS, M., CHATZI, L., GRAZULEVICIENE, R., KAMPOURI, M., MCEACHAN, R., MON-WILLIAMS, M., TAMAYO, I., THOMSEN, C., URQUIZA, J., VAFEIADI, M., WRIGHT, J., BASAGANA, X., VRIJHEID, M. & PHILIPPAT, C. 2021. Prenatal exposure to a wide range of environmental chemicals and child behaviour between 3 and 7 years of age - An exposome-based approach in 5 European cohorts. Science of the Total Environment, 763, 144115.
JENSEN, R. C., ANDERSEN, M. S., LARSEN, P. V., GLINTBORG, D., DALGARD, C., TIMMERMANN, C. A. G., NIELSEN, F., SANDBERG, M. B., ANDERSEN, H. R., CHRISTESEN, H. T., GRANDJEAN, P. & JENSEN, T. K. 2020a. Prenatal Exposures to Perfluoroalkyl Acids and Associations with Markers of Adiposity and Plasma Lipids in Infancy: An Odense Child Cohort Study. Environmental Health Perspectives, 128, 77001.
JENSEN, R. C., GLINTBORG, D., GADE TIMMERMANN, C. A., NIELSEN, F., KYHL, H. B., FREDERIKSEN, H., ANDERSSON, A. M., JUUL, A., SIDELMANN, J. J., ANDERSEN, H. R., GRANDJEAN, P., ANDERSEN, M. S. & JENSEN, T. K. 2020b. Prenatal exposure to perfluorodecanoic acid is associated with lower circulating concentration of adrenal steroid metabolites during mini puberty in human female infants. The Odense Child Cohort. Environmental Research, 182, 109101.
JI, J., SONG, L., WANG, J., YANG, Z., YAN, H., LI, T., YU, L., JIAN, L., JIANG, F., LI, J., ZHENG, J. & LI, K. 2021. Association between urinary per- and poly-fluoroalkyl substances and COVID-19 susceptibility. Environment International, 153, 106524.
JIAO, X., SHI, Q. & GAN, J. 2020a. Uptake, accumulation and metabolism of PFASs in plants and health perspectives: A critical review. Critical Reviews in Environmental Science and Technology.
JIAO, X., SHI, Q. & GAN, J. 2020b. Uptake, accumulation and metabolism of PFASs in plants and health perspectives: A critical review. Critical Reviews in Environmental Science and Technology, 1-32.
JIN, C., SUN, Y., ISLAM, A., QIAN, Y. & DUCATMAN, A. 2011. Perfluoroalkyl acids including

P.O. Box 400, FI-00121 Helsinki, Finland | Tel. +358 9 686180 | echa.europa.eu
448
perfluorooctane sulfonate and perfluorohexane sulfonate in firefighters. Journal of occupational and environmental medicine, 53, 324-328.
JIN, H. B., MAO, L. L., XIE, J. H., ZHAO, M. R., BAI, X. X., WEN, J., SHEN, T. & WU, P. F. 2020a. Poly- and perfluoroalkyl substance concentrations in human breast milk and their associations with postnatal infant growth. Science of the Total Environment, 713, 9.
JIN, R., MCCONNELL, R., CATHERINE, C., XU, S., WALKER, D. I., STRATAKIS, N., JONES, D. P., MILLER, G. W., PENG, C., CONTI, D. V., VOS, M. B. & CHATZI, L. 2020b. Perfluoroalkyl substances and severity of nonalcoholic fatty liver in Children: An untargeted metabolomics approach. Environment International, 134, 105220.
JOHANSSON, J. H., SALTER, M. E., ACOSTA NAVARRO, J. C., LECK, C., NILSSON, E. D. & COUSINS, I. T. 2019. Global transport of perfluoroalkyl acids via sea spray aerosol. Environmental Science: Processes & Impacts, 21, 635-649.
JOHNSON CONTROL - ANSUL 2020. Aqueous Film-Forming Foam (AFFF) Concentrates Aspirated Versus Nonaspirated AFFF; retreived from https://www.ansul.com/en/us/DocMedia/F-83115.pdf.
JOHNSON, W. 2018a. Safety Assessment of Fluoropolymers as Used in Cosmetics - Draft Report for Panel Review. Cosmetic Ingredient Review Expert Panel (CIR).
JOHNSON, W. 2018b. Safety Assessment of Fluoropolymers as Used in Cosmetics - Scientific Literature Review for Public Comment. Cosmetic Ingredient Review Expert Panel (CIR).
JOHNSON, W. & ZHU, J. 2018. Safety Assessment of Fluoropolymers as Used in Cosmetics - Final Report. Cosmetic Ingredient Review Expert Panel (CIR).
JOHNSTON, K. P., HARRISON, K. L., CLARKE, M. J., HOWDLE, S. M., HEITZ, M. P., BRIGHT, F. V., CARLIER, C. & RANDOLPH, T. W. 1996a. Water in carbon dioxide microemulsions: An environment for hydrophiles including proteins. Science, 271, 624-626.
JOHNSTON, K. P., RANDOLPH, T., BRIGHT, F. & HOWDLE, S. 1996b. Toxicology of a PFPE surfactant. Science, 272, 1726-1726.
JOIFFF 2020. Foam transition: Is it as simple as "Foam out/ Foam in".
JONES, C. E., BALLINGER, M. B., MATTIE, D. R., DELRASO, N. J., SECKEL, C. & VINEGAR, A. 1991. Effects of short-term oral dosing of polychlorotrifluoroethylene (polyCTFE) on the rhesus monkey. J Appl Toxicol, 11, 51-60.
JOUDAN, S., YEUNG, L. W. Y. & MABURY, S. A. 2017. Biological Cleavage of the C-P Bond in Perfluoroalkyl Phosphinic Acids in Male Sprague-Dawley Rats and the Formation of Persistent and Reactive Metabolites. Environ Health Perspect, 125, 117001.
JUST, W. W., GORGAS, K., HARTL, F. U., HEINEMANN, P., SALZER, M. & SCHIMASSEK, H. 1989. BIOCHEMICAL EFFECTS AND ZONAL HETEROGENEITY OF PEROXISOME PROLIFERATION INDUCED BY PERFLUOROCARBOXYLIC ACIDS IN RAT-LIVER. Hepatology, 9, 570-581.
KABADI, S. V., FISHER, J., AUNGST, J. & RICE, P. 2018. Internal exposure-based pharmacokinetic evaluation of potential for biopersistence of 6:2 fluorotelomer alcohol (FTOH) and its metabolites. Food and Chemical Toxicology, 112, 375-382.

P.O. Box 400, FI-00121 Helsinki, Finland | Tel. +358 9 686180 | echa.europa.eu
449
KABADI, S. V., FISHER, J. W., DOERGE, D. R., MEHTA, D., AUNGST, J. & RICE, P. 2020. Characterizing biopersistence potential of the metabolite 5:3 fluorotelomer carboxylic acid after repeated oral exposure to the 6:2 fluorotelomer alcohol. Toxicology and Applied Pharmacology, 388.
KABORÉ, H. A., VO DUY, S., MUNOZ, G., MÉITÉ, L., DESROSIERS, M., LIU, J., SORY, T. K. & SAUVÉ, S. 2018. Worldwide drinking water occurrence and levels of newly-identified perfluoroalkyl and polyfluoroalkyl substances. Science of the Total Environment, 616-617, 1089-1100.
KAISER, M. A., LARSEN, B. S., KAO, C.-P. C. & BUCK, R. C. 2005. Vapor Pressures of Perfluorooctanoic, -nonanoic, -decanoic, -undecanoic, and -dodecanoic Acids. Journal of Chemical & Engineering Data, 50, 1841-1843.
KAMENDULIS, L. M., HOCEVAR, J. M., STEPHENS, M., SANDUSKY, G. E. & HOCEVAR, B. A. 2022. Exposure to perfluorooctanoic acid leads to promotion of pancreatic cancer. Carcinogenesis.
KANG, Q., GAO, F., ZHANG, X., WANG, L., LIU, J., FU, M., ZHANG, S., WAN, Y., SHEN, H. & HU, J. 2020. Nontargeted identification of per- and polyfluoroalkyl substances in human follicular fluid and their blood-follicle transfer. Environ Int, 139, 105686.
KANNAN, K. 2011. Perfluoroalkyl and polyfluoroalkyl substances: current and future perspectives. Environmental Chemistry, 8, 333.
KARNJANAPIBOONWONG, A., DEB, S. K., SUBBIAH, S., WANG, D. & ANDERSON, T. A. 2018. Perfluoroalkylsulfonic and carboxylic acids in earthworms (Eisenia fetida): Accumulation and effects results from spiked soils at PFAS concentrations bracketing environmental relevance. Chemosphere, 199, 168-173.
KARRMAN, A., DOMINGO, J. L., LLEBARIA, X., NADAL, M., BIGAS, E., VAN BAVEL, B. & LINDSTROM, G. 2010. Biomonitoring perfluorinated compounds in Catalonia, Spain: concentrations and trends in human liver and milk samples. Environ Sci Pollut Res Int, 17, 750-8.
KASHINO, I., SASAKI, S., OKADA, E., MATSUURA, H., GOUDARZI, H., MIYASHITA, C., OKADA, E., ITO, Y. M., ARAKI, A. & KISHI, R. 2020. Prenatal exposure to 11 perfluoroalkyl substances and fetal growth: A large-scale, prospective birth cohort study. Environment International, 136, 105355.
KATO, H., FUJII, S., TAKAHASHI, M., MATSUMOTO, M., HIRATA-KOIZUMI, M., ONO, A. & HIROSE, A. 2015. Repeated dose and reproductive/developmental toxicity of perfluorododecanoic acid in rats. Environ Toxicol, 30, 1244-63.
KATO, K., KALATHIL, A. A., PATEL, A. M., YE, X. & CALAFAT, A. M. 2018. Per- and polyfluoroalkyl substances and fluorinated alternatives in urine and serum by on-line solid phase extraction-liquid chromatography-tandem mass spectrometry. Chemosphere, 209, 338-345.
KEMI 2015. Survey of fire-fighting foam, PM 5/15. Retreived from https://www.kemi.se/download/18.6df1d3df171c243fb23960dc/1591097411648/pm-5-15-survey-of-fire-fighting-foam.pdf.
KEMI 2016. Strategy for reducing the use of highly fluorinated substances, PFASs. Swedish Chemicals Agency.
KEY, B. D., HOWELL, R. D. & CRIDDLE, C. S. 1998. Defluorination of organofluorine sulfur compounds by Pseudomonas sp. strain D2. Environmental science & technology, 32,

P.O. Box 400, FI-00121 Helsinki, Finland | Tel. +358 9 686180 | echa.europa.eu
450
2283-2287.
KHALIL, N., DUCATMAN, A. M., SINARI, S., BILLHEIMER, D., HU, C., LITTAU, S. & BURGESS, J. L. 2020. Per-and polyfluoroalkyl substance and cardio metabolic markers in firefighters. Journal of occupational and environmental medicine, 62, 1076-1081.
KIK, K., BUKOWSKA, B. & SICINSKA, P. 2020. Polystyrene nanoparticles: Sources, occurrence in the environment, distribution in tissues, accumulation and toxicity to various organisms. Environmental Pollution, 262, 9.
KIM, B., SUIDAN, M., WALLINGTON, T. & DU, X. 2000. Biodegradability of trifluoroacetic acid. Environmental engineering science, 17, 337-342.
KIM, H. Y., KIM, K. N., SHIN, C. H., LIM, Y. H., KIM, J. I., KIM, B. N., HONG, Y. C. & LEE, Y. A. 2020a. The Relationship Between Perfluoroalkyl Substances Concentrations and Thyroid Function in Early Childhood: A Prospective Cohort Study. Thyroid, 30, 1556-1565.
KIM, S., STROSKI, K. M., KILLEEN, G., SMITHERMAN, C., SIMCIK, M. F. & BROOKS, B. W. 2020b. 8:8 Perfluoroalkyl phosphinic acid affects neurobehavioral development, thyroid disruption, and DNA methylation in developing zebrafish. Science of The Total Environment, 736, 139600.
KINKEAD, E. R., BUNGER, S. K., WOLFE, R. E., FLEMMING, C. D., WHITMIRE, R. E. & WALL, H. G. 1991. Repeated-dose gavage studies on polychlorotrifluoroethylene acids. Toxicol Ind Health, 7, 295-307.
KINKEAD, E. R., CULPEPPER, B. T., HENRY, S. S., MOROUGHAN, V. L., KIMMEL, E. C., POLLARD, D. L., FLEMMING, C. D., WALL, H. G., KUTZMAN, R. S., CONOLLY, R. B. & VINEGAR, A. 1989. Subchronic Studies of Chlorotrifluoroethylene. HARRY G. ARMSTRONG AEROSPACE MEDICAL RESEARCH LABORATORY HUMAN SYSTEMS DIVISION AIR FORCE SYSTEMS COMMAND WRIGHT-PATTERSON AIR FORCE BASE, OHIO 45433, NSI TECHNOLOGY SERVICES CORPORATION ELECTE101 WOODMAN DRIVE, SUITE 12 NOV'27.1989DAYTON, OH 45431, (https://apps.dtic.mil/sti/pdfs/ADA214619.pdf).
KINKEAD, E. R., CULPEPPER, B. T., HENRY, S. S., SZOTAK, P. S., FLEMMING, C. D., KUTZMAN, R. S., BRUNER, R. H., WYMAN, J. F. & MATTIE, D. R. 1990a. The determination of the repeated oral toxicity of halocarbon oil, series 27-S. Toxicol Ind Health, 6, 17-32.
KINKEAD, E. R., KIMMEL, E. C., WALL, H. C., CONOLLY, R. B., KUTZMAN, R. S., WHITMIRE, R. E. & MATTIE, D. R. 1990b. Subchronic Inhalation Studies on Polychlorotrifluoroethylene (3.1 Oil). Inhalation Toxicology, 2, 433-451.
KIRKPATRICK, J. B. 2005. A combined 28-day repeated dose oral toxicity study with the reproduction/developmental toxicity screening test of perfluorhexanoic acid and 1H,1H,2H,2H-tridecafluoro-1-octanol in rats, with recovery. WIL Research Laboratories.
KISSA, E. 2001. Fluorinated surfactants and repellents, CRC Press.
KLAUNIG, J. E., SHINOHARA, M., IWAI, H., CHENGELIS, C. P., KIRKPATRICK, J. B., WANG, Z. M. & BRUNER, R. H. 2015. Evaluation of the Chronic Toxicity and Carcinogenicity of Perfluorohexanoic Acid (PFHxA) in Sprague-Dawley Rats. Toxicologic Pathology, 43, 209-220.

P.O. Box 400, FI-00121 Helsinki, Finland | Tel. +358 9 686180 | echa.europa.eu
451
KOCH, A., ARO, R., WANG, T. & YEUNG, L. W. 2020. Towards a comprehensive analytical workflow for the chemical characterisation of organofluorine in consumer products and environmental samples. TrAC Trends in Analytical Chemistry, 123, 115423.
KÖHRLE, J. 2008. Environment and endocrinology: the case of thyroidology. Ann Endocrinol (Paris), 69, 116-22.
KRAFFT, M. P. & RIESS, J. G. 2015. Per- and polyfluorinated substances (PFASs): Environmental challenges. Current Opinion in Colloid & Interface Science, 20, 192-212.
KRIPPNER, J., BRUNN, H., FALK, S., GEORGII, S., SCHUBERT, S. & STAHL, T. 2014. Effects of chain length and pH on the uptake and distribution of perfluoroalkyl substances in maize (Zea mays). Chemosphere, 94, 85-90.
KRIPPNER, J., FALK, S., BRUNN, H., GEORGII, S., SCHUBERT, S. & STAHL, T. 2015. Accumulation Potentials of Perfluoroalkyl Carboxylic Acids (PFCAs) and Perfluoroalkyl Sulfonic Acids (PFSAs) in Maize (Zea mays). J Agric Food Chem, 63, 3646-53.
KROGER, A. P. P. & PAULUSSE, J. M. J. 2018. Single-chain polymer nanoparticles in controlled drug delivery and targeted imaging. Journal of Controlled Release, 286, 326-347.
KUNG, Y. P., LIN, C. C., CHEN, M. H., TSAI, M. S., HSIEH, W. S. & CHEN, P. C. 2021. Intrauterine exposure to per- and polyfluoroalkyl substances may harm children's lung function development. Environmental Research, 192, 110178.
KVALEM, H. E., NYGAARD, U. C., LODRUP CARLSEN, K. C., CARLSEN, K. H., HAUG, L. S. & GRANUM, B. 2020. Perfluoroalkyl substances, airways infections, allergy and asthma related health outcomes - implications of gender, exposure period and study design. Environment International, 134, 105259.
KWIATKOWSKI, C. F., ANDREWS, D. Q., BIRNBAUM, L. S., BRUTON, T. A., DEWITT, J. C., KNAPPE, D. R. U., MAFFINI, M. V., MILLER, M. F., PELCH, K. E., READE, A., SOEHL, A., TRIER, X., VENIER, M., WAGNER, C. C., WANG, Z. Y. & BLUM, A. 2020. Scientific Basis for Managing PFAS as a Chemical Class. Environmental Science & Technology Letters, 7, 532-543.
LADICS, G. S., KENNEDY, G. L., O'CONNOR, J., EVERDS, N., MALLEY, L. A., FRAME, S. R., GANNON, S., JUNG, R., ROTH, T., IWAI, H. & SHIN-YA, S. 2008. 90-day oral gavage toxicity study of 8-2 fluorotelomer alcohol in rats. Drug Chem Toxicol, 31, 189-216.
LAI, K. P., NG, A. H., WAN, H. T., WONG, A. Y., LEUNG, C. C., LI, R. & WONG, C. K. 2018. Dietary Exposure to the Environmental Chemical, PFOS on the Diversity of Gut Microbiota, Associated With the Development of Metabolic Syndrome. Front Microbiol, 9, 2552.
LAITINEN, J. A., KOPONEN, J., KOIKKALAINEN, J. & KIVIRANTA, H. 2014. Firefighters’ exposure to perfluoroalkyl acids and 2-butoxyethanol present in firefighting foams. Toxicology letters, 231, 227-232.
LAN, Z., ZHOU, M., YAO, Y. & SUN, H. 2018. Plant uptake and translocation of perfluoroalkyl acids in a wheat–soil system. Environmental Science and Pollution Research, 25, 30907-30916.
LANG, J. R., STRYNAR, M. J., LINDSTROM, A. B., FARTHING, A., HUANG, H., SCHMID, J., HILL, D. & CHERNOFF, N. 2020. Toxicity of Balb-c mice exposed to recently identified 1,1,2,2-tetrafluoro-2- 1,1,1,2,3,3-hexafluoro-3-(1,1,2,2-tetrafluoroetho xy)propan-
P.O. Box 400, FI-00121 Helsinki, Finland | Tel. +358 9 686180 | echa.europa.eu
452
2-yl oxyethane-1-sulfonic acid (PFESA-BP2). Toxicology, 441, 7.
LAU, C., RUMPLER, J., DAS, K. P., WOOD, C. R., SCHMID, J. E., STRYNAR, M. J. & WAMBAUGH, J. F. 2020. Pharmacokinetic profile of Perfluorobutane Sulfonate and activation of hepatic nuclear receptor target genes in mice. Toxicology, 441, 152522.
LAU, C., THIBODEAUX, J. R., HANSON, R. G., NAROTSKY, M. G., ROGERS, J. M., LINDSTROM, A. B. & STRYNAR, M. J. 2006. Effects of perfluorooctanoic acid exposure during pregnancy in the mouse. Toxicol Sci, 90, 510-8.
LAU, C., THIBODEAUX, J. R., HANSON, R. G., ROGERS, J. M., GREY, B. E., STANTON, M. E., BUTENHOFF, J. L. & STEVENSON, L. A. 2003. Exposure to perfluorooctane sulfonate during pregnancy in rat and mouse. II: postnatal evaluation. Toxicol Sci, 74, 382-92.
LEARY, D. B., TAKAZAWA, M., KANNAN, K. & KHALIL, N. 2020. Perfluoroalkyl substances and metabolic syndrome in firefighters: a pilot study. Journal of occupational and environmental medicine, 62, 52-57.
LEBEAUX, R. M., DOHERTY, B. T., GALLAGHER, L. G., ZOELLER, R. T., HOOFNAGLE, A. N., CALAFAT, A. M., KARAGAS, M. R., YOLTON, K., CHEN, A., LANPHEAR, B. P., BRAUN, J. M. & ROMANO, M. E. 2020. Maternal serum perfluoroalkyl substance mixtures and thyroid hormone concentrations in maternal and cord sera: The HOME Study. Environmental Research, 185, 109395.
LEE, H. & MABURY, S. A. 2017. Sorption of Perfluoroalkyl Phosphonates and Perfluoroalkyl Phosphinates in Soils. Environ Sci Technol, 51, 3197-3205.
LEE, H., TEVLIN, A. G., MABURY, S. A. & MABURY, S. A. 2014. Fate of polyfluoroalkyl phosphate diesters and their metabolites in biosolids-applied soil: biodegradation and plant uptake in greenhouse and field experiments. Environ Sci Technol, 48, 340-9.
LEE, J. W., LEE, J.-W., SHIN, Y.-J., KIM, J.-E., RYU, T.-K., RYU, J., LEE, J., KIM, P., CHOI, K. & PARK, K. 2017. Multi-generational xenoestrogenic effects of Perfluoroalkyl acids (PFAAs) mixture on Oryzias latipes using a flow-through exposure system. Chemosphere, 169, 212-223.
LEE, N., BAEK, K., PARK, S., HWANG, I., CHUNG, I., CHOI, W., JUNG, H., LEE, M. & YANG, S. 2018. Pneumoconiosis in a polytetrafluoroethylene (PTFE) spray worker: a case report with an occupational hygiene study. Annals of Occupational and Environmental Medicine, 30, 7.
LEE, S. H., TSENG, W. C., DU, Z. Y., LIN, W. Y., CHEN, M. H., LIN, C. C., LIEN, G. W., LIANG, H. J., WEN, H. J., GUO, Y. L., CHEN, P. C. & LIN, C. Y. 2021. Lipid responses to environmental perfluoroalkyl substance exposure in a Taiwanese Child cohort. Environmental Pollution, 283, 117007.
LEE, Y. Y., WONG, C. K., OGER, C., DURAND, T., GALANO, J. M. & LEE, J. C. 2015. Prenatal exposure to the contaminant perfluorooctane sulfonate elevates lipid peroxidation during mouse fetal development but not in the pregnant dam. Free Radic Res, 49, 1015-25.
LESMEISTER, L., LANGE, F. T., BREUER, J., BIEGEL-ENGLER, A., GIESE, E. & SCHEURER, M. 2021. Extending the knowledge about PFAS bioaccumulation factors for agricultural plants – A review. Science of The Total Environment, 766, 142640.
LEWIS, M., KIM, M. H., LIU, E. J., WANG, N. & CHU, K.-H. 2016. Biotransformation of 6:2 polyfluoroalkyl phosphates (6:2 PAPs): Effects of degradative bacteria and co-

P.O. Box 400, FI-00121 Helsinki, Finland | Tel. +358 9 686180 | echa.europa.eu
453
substrates. Journal of Hazardous Materials, 320, 479-486.
LFV-BAYERN 2019. Bavarian Ministry of the Interior, Sport and Integration, and Bavarian Ministry of the Environment and Consumer Protection: Environmentally friendly use of fire-fighting foams (Umweltschonender Einsatz von Feuerlöschschäumen) [in German]; accesible at shorturl.at/osyG1 or via https://www.bestellen.bayern.de.
LI, C.-H., REN, X.-M., RUAN, T., CAO, L.-Y., XIN, Y., GUO, L.-H. & JIANG, G. 2018a. Chlorinated Polyfluorinated Ether Sulfonates Exhibit Higher Activity toward Peroxisome Proliferator-Activated Receptors Signaling Pathways than Perfluorooctanesulfonate. Environmental Science & Technology, 52, 3232-3239.
LI, F., DUAN, J., TIAN, S., JI, H., ZHU, Y., WEI, Z. & ZHAO, D. 2020. Short-chain per- and polyfluoroalkyl substances in aquatic systems: Occurrence, impacts and treatment. Chemical Engineering Journal, 380.
LI, F., SUN, H., HAO, Z., HE, N., ZHAO, L., ZHANG, T. & SUN, T. 2011. Perfluorinated compounds in Haihe River and Dagu Drainage Canal in Tianjin, China. Chemosphere, 84, 265-71.
LI, J., SUN, J. & LI, P. 2022. Exposure routes, bioaccumulation and toxic effects of per- and polyfluoroalkyl substances (PFASs) on plants: A critical review. Environment International, 158, 106891.
LI, K., GAO, P., XIANG, P., ZHANG, X., CUI, X. & MA, L. Q. 2017. Molecular mechanisms of PFOA-induced toxicity in animals and humans: Implications for health risks. Environment International, 99, 43-54.
LI, N., LIU, Y., PAPANDONATOS, G. D., CALAFAT, A. M., EATON, C. B., KELSEY, K. T., CECIL, K. M., KALKWARF, H. J., YOLTON, K., LANPHEAR, B. P., CHEN, A. & BRAUN, J. M. 2021a. Gestational and childhood exposure to per- and polyfluoroalkyl substances and cardiometabolic risk at age 12 years. Environment International, 147, 106344.
LI, Y., FLETCHER, T., MUCS, D., SCOTT, K., LINDH, C. H., TALLVING, P. & JAKOBSSON, K. 2018b. Half-lives of PFOS, PFHxS and PFOA after end of exposure to contaminated drinking water. Occup Environ Med, 75, 46-51.
LI, Y., LI, J., ZHANG, L., HUANG, Z., LIU, Y., WU, N., HE, J., ZHANG, Z., ZHANG, Y. & NIU, Z. 2019. Perfluoroalkyl acids in drinking water of China in 2017: Distribution characteristics, influencing factors and potential risks. Environment International, 123, 87-95.
LI, Y., XU, Y., FLETCHER, T., SCOTT, K., NIELSEN, C., PINEDA, D., LINDH, C. H., OLSSON, D. S., ANDERSSON, E. M. & JAKOBSSON, K. 2021b. Associations between perfluoroalkyl substances and thyroid hormones after high exposure through drinking water. Environmental Research, 194, 110647.
LIANG, H., WANG, Z., MIAO, M., TIAN, Y., ZHOU, Y., WEN, S., CHEN, Y., SUN, X. & YUAN, W. 2020. Prenatal exposure to perfluoroalkyl substances and thyroid hormone concentrations in cord plasma in a Chinese birth cohort. Environmental Health: A Global Access Science Source, 19, 127.
LIAO, S., YAO, W., CHEANG, I., TANG, X., YIN, T., LU, X., ZHOU, Y., ZHANG, H. & LI, X. 2020. Association between perfluoroalkyl acids and the prevalence of hypertension among US adults. Ecotoxicology & Environmental Safety, 196, 110589.
LIEDER, P. H., CHANG, S. C., YORK, R. G. & BUTENHOFF, J. L. 2009. Toxicological

P.O. Box 400, FI-00121 Helsinki, Finland | Tel. +358 9 686180 | echa.europa.eu
454
evaluation of potassium perfluorobutanesulfonate in a 90-day oral gavage study with Sprague-Dawley rats. Toxicology, 255, 45-52.
LIEW, Z., LUO, J., NOHR, E. A., BECH, B. H., BOSSI, R., ARAH, O. A. & OLSEN, J. 2020. Maternal Plasma Perfluoroalkyl Substances and Miscarriage: A Nested Case-Control Study in the Danish National Birth Cohort. Environmental Health Perspectives, 128, 47007.
LIN, C. Y., LEE, H. L., HWANG, Y. T. & SU, T. C. 2020a. The association between total serum isomers of per- and polyfluoroalkyl substances, lipid profiles, and the DNA oxidative/nitrative stress biomarkers in middle-aged Taiwanese adults. Environmental Research, 182, 109064.
LIN, P. D., CARDENAS, A., HAUSER, R., GOLD, D. R., KLEINMAN, K. P., HIVERT, M. F., CALAFAT, A. M., WEBSTER, T. F., HORTON, E. S. & OKEN, E. 2021. Per- and polyfluoroalkyl substances and kidney function: Follow-up results from the Diabetes Prevention Program trial. Environment International, 148, 106375.
LIN, Q., ZHOU, C., CHEN, L., LI, Y., HUANG, X., WANG, S., QIU, R. & TANG, C. 2020b. Accumulation and associated phytotoxicity of novel chlorinated polyfluorinated ether sulfonate in wheat seedlings. Chemosphere, 249, 126447.
LIN, T. W., CHEN, M. K., LIN, C. C., CHEN, M. H., TSAI, M. S., CHAN, D. C., HUNG, K. Y. & CHEN, P. C. 2020c. Association between exposure to perfluoroalkyl substances and metabolic syndrome and related outcomes among older residents living near a Science Park in Taiwan. International Journal of Hygiene & Environmental Health, 230, 113607.
LIOU, J.-C., SZOSTEK, B., DERITO, C. & MADSEN, E. 2010. Investigating the biodegradability of perfluorooctanoic acid. Chemosphere, 80, 176-183.
LIOU, L. & KAPTOGE, S. 2020. Association of small, dense LDL-cholesterol concentration and lipoprotein particle characteristics with coronary heart disease: A systematic review and meta-analysis. PLoS One, 15, e0241993.
LITTON BIONETICS 1984. Thirteen-week subchronic study in F344 rats - Vinylidene fluoride - Final report. Litton Bionetics, Inc.
LIU, C., CHANG, V. W., GIN, K. Y. & NGUYEN, V. T. 2014. Genotoxicity of perfluorinated chemicals (PFCs) to the green mussel (Perna viridis). Sci Total Environ, 487, 117-22.
LIU, C., DENG, J., YU, L., RAMESH, M. & ZHOU, B. 2010. Endocrine disruption and reproductive impairment in zebrafish by exposure to 8:2 fluorotelomer alcohol. Aquat Toxicol, 96, 70-6.
LIU, C., DU, Y. & ZHOU, B. 2007. Evaluation of estrogenic activities and mechanism of action of perfluorinated chemicals determined by vitellogenin induction in primary cultured tilapia hepatocytes. Aquat.Toxicol., 85, 267-277.
LIU, C., YU, L., DENG, J., LAM, P. K., WU, R. S. & ZHOU, B. 2009a. Waterborne exposure to fluorotelomer alcohol 6:2 FTOH alters plasma sex hormone and gene transcription in the hypothalamic-pituitary-gonadal (HPG) axis of zebrafish. Aquat Toxicol, 93, 131-7.
LIU, C., YU, L., DENG, J., LAM, P. K. S., WU, R. S. S. & ZHOU, B. 2009b. Waterborne exposure to fluorotelomer alcohol 6:2 FTOH alters plasma sex hormone and gene transcription in the hypothalamic–pituitary–gonadal (HPG) axis of zebrafish. Aquatic Toxicology, 93, 131-137.

P.O. Box 400, FI-00121 Helsinki, Finland | Tel. +358 9 686180 | echa.europa.eu
455
LIU, G., ZHANG, B., HU, Y., ROOD, J., LIANG, L., QI, L., BRAY, G. A., DEJONGE, L., COULL, B., GRANDJEAN, P., FURTADO, J. D. & SUN, Q. 2020a. Associations of Perfluoroalkyl substances with blood lipids and Apolipoproteins in lipoprotein subspecies: the POUNDS-lost study. Environmental Health: A Global Access Science Source, 19, 5.
LIU, H., PAN, Y., JIN, S., SUN, X., JIANG, Y., WANG, Y., GHASSABIAN, A., LI, Y., XIA, W., CUI, Q., ZHANG, B., ZHOU, A., DAI, J. & XU, S. 2021. Associations between six common per- and polyfluoroalkyl substances and estrogens in neonates of China. Journal of Hazardous Materials, 407, 124378.
LIU, M., YI, S., CHEN, P., CHEN, M., ZHONG, W., YANG, J., SUN, B. & ZHU, L. 2019. Thyroid endocrine disruption effects of perfluoroalkyl phosphinic acids on zebrafish at early development. Science of The Total Environment, 676, 290-297.
LIU, X., CHEN, D., WANG, B., XU, F., PANG, Y., ZHANG, L., ZHANG, Y., JIN, L., LI, Z. & REN, A. 2020b. Does Low Maternal Exposure to Per- and Polyfluoroalkyl Substances Elevate the Risk of Spontaneous Preterm Birth? A Nested Case-Control Study in China. Environmental Science & Technology, 54, 8259-8268.
LLORCA-CASAMAYOR, M. 2012. Analysis of perfluoroalkyl substances in food and evironmental matrices. PhD, 423.
LOHMANN, R., COUSINS, I. T., DEWITT, J. C., GLÜGE, J., GOLDENMAN, G., HERZKE, D., LINDSTROM, A. B., MILLER, M. F., NG, C. A., PATTON, S., SCHERINGER, M., TRIER, X. & WANG, Z. 2020. Are Fluoropolymers Really of Low Concern for Human and Environmental Health and Separate from Other PFAS? Environmental Science & Technology, 54, 12820-12828.
LOHMANN, R., JURADO, E., DIJKSTRA, H. A. & DACHS, J. 2013. Vertical eddy diffusion as a key mechanism for removing perfluorooctanoic acid (PFOA) from the global surface oceans. Environ. Pollut., 179, 88.
LÓPEZ-FONTÁN, J. L., SARMIENTO, F. & SCHULZ, P. C. 2005. The aggregation of sodium perfluorooctanoate in water. Colloid and Polymer Science, 283, 862-871.
LOU, Q. Q., ZHANG, Y. F., ZHOU, Z., SHI, Y. L., GE, Y. N., REN, D. K., XU, H. M., ZHAO, Y. X., WEI, W. J. & QIN, Z. F. 2013. Effects of perfluorooctanesulfonate and perfluorobutanesulfonate on the growth and sexual development of Xenopus laevis. Ecotoxicology, 22, 1133-44.
LOVELESS, S. E., FINLAY, C., EVERDS, N. E., FRAME, S. R., GILLIES, P. J., O'CONNOR, J. C., POWLEY, C. R. & KENNEDY, G. L. 2006. Comparative responses of rats and mice exposed to linear/branched, linear, or branched ammonium perfluorooctanoate (APFO). Toxicology, 220, 203-17.
LOVELESS, S. E., HOBAN, D., SYKES, G., FRAME, S. R. & EVERDS, N. E. 2008. Evaluation of the immune system in rats and mice administered linear ammonium perfluorooctanoate. Toxicol Sci, 105, 86-96.
LOVELESS, S. E., SLEZAK, B., SEREX, T., LEWIS, J., MUKERJI, P., O'CONNOR, J. C., DONNER, E. M., FRAME, S. R., KORZENIOWSKI, S. H. & BUCK, R. C. 2009. Toxicological evaluation of sodium perfluorohexanoate. Toxicology, 264, 32-44.
LOWE, A. J., DHARMAGE, S. C., ABRAMSON, M. J., VIJAYASARATHY, S., ERBAS, B., MUELLER, J. F. & LODGE, C. J. 2019. Cord-serum per- and poly-fluoroalkyl substances and atopy and eczema at 12-months. Allergy, 74, 812-815.
LU, Y., MENG, L. Y., MA, D. H., CAO, H. M., LIANG, Y., LIU, H. W., WANG, Y. W. & JIANG, G.

P.O. Box 400, FI-00121 Helsinki, Finland | Tel. +358 9 686180 | echa.europa.eu
456
B. 2021. The occurrence of PFAS in human placenta and their binding abilities to human serum albumin and organic anion transporter 4. Environmental Pollution, 273.
LUEBKER, D. J., CASE, M. T., YORK, R. G., MOORE, J. A., HANSEN, K. J. & BUTENHOFF, J. L. 2005a. Two-generation reproduction and cross-foster studies of perfluorooctanesulfonate (PFOS) in rats. Toxicology, 215, 126-148.
LUEBKER, D. J., YORK, R. G., HANSEN, K. J., MOORE, J. A. & BUTENHOFF, J. L. 2005b. Neonatal mortality from in utero exposure to perfluorooctanesulfonate (PFOS) in Sprague-Dawley rats: Dose-response, and biochemical and pharamacokinetic parameters. Toxicology, 215, 149-169.
LUO, K., LIU, X., NIAN, M., WANG, Y., QIU, J., YU, H., CHEN, X., ZHANG, J. & SHANGHAI BIRTH, C. 2021. Environmental exposure to per- and polyfluoroalkyl substances mixture and male reproductive hormones. Environment International, 152, 106496.
MA, X., CUI, L., CHEN, L., ZHANG, J., ZHANG, X., KANG, Q., JIN, F. & YE, Y. 2021. Parental plasma concentrations of perfluoroalkyl substances and In Vitro fertilization outcomes. Environmental Pollution, 269, 116159.
MACON, M. B., VILLANUEVA, L. R., TATUM-GIBBS, K., ZEHR, R. D., STRYNAR, M. J., STANKO, J. P., WHITE, S. S., HELFANT, L. & FENTON, S. E. 2011. Prenatal perfluorooctanoic acid exposure in CD-1 mice: low-dose developmental effects and internal dosimetry. Toxicol Sci, 122, 134-45.
MAESTRI, L., NEGRI, S., FERRARI, M., GHITTORI, S., FABRIS, F., DANESINO, P. & IMBRIANI, M. 2006. Determination of perfluorooctanoic acid and perfluorooctanesulfonate in human tissues by liquid chromatography/single quadrupole mass spectrometry. Rapid Commun Mass Spectrom, 20, 2728-34.
MAHMOODI & SHREEVE 1986. New perfluoroalkylphosphonic and bis(perfluoroalkyl)phosphinic acids and their precursors. Inorganic Chemistry, 25, 3128–3131.
MALINVERNO, G., PANTINI, G. & BOOTMAN, J. 1996. Safety evaluation of perfluoropolyethers, liquid polymers used in barrier creams and other skin-care products. Food and Chemical Toxicology, 34, 639-650.
MAŁOSZEWSKI, P. & ZUBER, A. 1982. Determining the turnover time of groundwater systems with the aid of environmental tracers. 1. Models and their applicability. Journal of Hydrology, 57, 207-231.
MAMSEN, L. S., BJORVANG, R. D., MUCS, D., VINNARS, M. T., PAPADOGIANNAKIS, N., LINDH, C. H., ANDERSEN, C. Y. & DAMDIMOPOULOU, P. 2019. Concentrations of perfluoroalkyl substances (PFASs) in human embryonic and fetal organs from first, second, and third trimester pregnancies. Environ Int, 124, 482-492.
MANCINI, F. R., CANO-SANCHO, G., GAMBARETTI, J., MARCHAND, P., BOUTRON-RUAULT, M. C., SEVERI, G., ARVEUX, P., ANTIGNAC, J. P. & KVASKOFF, M. 2020. Perfluorinated alkylated substances serum concentration and breast cancer risk: Evidence from a nested case-control study in the French E3N cohort. International Journal of Cancer, 146, 917-928.
MANZANO-SALGADO, C. B., GRANUM, B., LOPEZ-ESPINOSA, M. J., BALLESTER, F., INIGUEZ, C., GASCON, M., MARTINEZ, D., GUXENS, M., BASTERRETXEA, M., ZABALETA, C., SCHETTGEN, T., SUNYER, J., VRIJHEID, M. & CASAS, M. 2019. Prenatal exposure to perfluoroalkyl substances, immune-related outcomes, and lung

P.O. Box 400, FI-00121 Helsinki, Finland | Tel. +358 9 686180 | echa.europa.eu
457
function in children from a Spanish birth cohort study. Int J Hyg Environ Health, 222, 945-954.
MAO, W., HU, Q., CHEN, S., CHEN, Y., LUO, M., ZHANG, Z., GENG, J., WU, J., XU, B. & CHEN, M. 2021. Polyfluoroalkyl chemicals and the risk of kidney stones in US adults: A population-based study. Ecotoxicology & Environmental Safety, 208, 111497.
MARAS, M., VANPARYS, C., MUYLLE, F., ROBBENS, J., BERGER, U., BARBER, J. L., BLUST, R. & DE, C. W. 2006. Estrogen-like properties of fluorotelomer alcohols as revealed by mcf-7 breast cancer cell proliferation. Environ.Health Perspect., 114, 100-105.
MARQUES, E. S., AGUDELO, J., KAYE, E. M., MODARESI, S. M. S., PFOHL, M., BECANOVA, J., WEI, W., POLUNAS, M., GOEDKEN, M. & SLITT, A. L. 2021. The role of maternal high fat diet on mouse pup metabolic endpoints following perinatal PFAS and PFAS mixture exposure. Toxicology, 462.
MARTIN, J. W., ELLIS, D. A., MABURY, S. A., HURLEY, M. D. & WALLINGTON, T. J. 2006. Atmospheric chemistry of perfluoroalkanesulfonamides: Kinetic and product studies of the OH radical and Cl atom initiated oxidation of N-ethyl perfluorobutanesulfonamide. Environmental Science and Technology, 40, 864-872.
MARTIN, O., SCHOLZE, M., ERMLER, S., MCPHIE, J., BOPP, S. K., KIENZLER, A., PARISSIS, N. & KORTENKAMP, A. 2021. Ten years of research on synergisms and antagonisms in chemical mixtures: A systematic review and quantitative reappraisal of mixture studies. Environment International, 146, 17.
MARTINSSON, M., NIELSEN, C., BJORK, J., RYLANDER, L., MALMQVIST, E., LINDH, C. & RIGNELL-HYDBOM, A. 2020. Intrauterine exposure to perfluorinated compounds and overweight at age 4: A case-control study. PLoS ONE [Electronic Resource], 15, e0230137.
MATSUBARA, E., HARADA, K., INOUE, K. & KOIZUMI, A. 2006. Effects of perfluorinated amphiphiles on backward swimming in Paramecium caudatum. Biochem.Biophys.Res.Commun., 339, 554-561.
MCCOY, J. A., BANGMA, J. T., REINER, J. L., BOWDEN, J. A., SCHNORR, J., SLOWEY, M., O'LEARY, T., GUILLETTE, L. J., JR. & PARROTT, B. B. 2017. Associations between perfluorinated alkyl acids in blood and ovarian follicular fluid and ovarian function in women undergoing assisted reproductive treatment. Sci Total Environ, 605-606, 9-17.
MCDONOUGH, A. M., BIRD, A. W., FREEMAN, L. M., LUCIANI, M. A. & TODD, A. K. 2021. Fate and budget of poly- and perfluoroalkyl substances in three common garden plants after experimental additions with contaminated river water. Environmental Pollution, 285, 117115.
MCDONOUGH, C. A., CHOYKE, S., FERGUSON, P. L., DEWITT, J. C. & HIGGINS, C. P. 2020a. Bioaccumulation of Novel Per- and Polyfluoroalkyl Substances in Mice Dosed with an Aqueous Film-Forming Foam. Environmental Science & Technology, 54, 5700-5709.
MCDONOUGH, C. A., WARD, C., HU, Q., VANCE, S., HIGGINS, C. P. & DEWITT, J. C. 2020b. Immunotoxicity of an Electrochemically Fluorinated Aqueous Film-Forming Foam. Toxicological Sciences, 178, 104-114.
MCGUIRE, K. J., MCDONNELL, J. J., WEILER, M., KENDALL, C., MCGLYNN, B. L., WELKER, J. M. & SEIBERT, J. 2005. The role of topography on catchment-scale water residence time. Water Resources Research, 41, 1-14.

P.O. Box 400, FI-00121 Helsinki, Finland | Tel. +358 9 686180 | echa.europa.eu
458
MEI, W., SUN, H., SONG, M., JIANG, L., LI, Y., LU, W., YING, G.-G., LUO, C. & ZHANG, G. 2021. Per- and polyfluoroalkyl substances (PFASs) in the soil–plant system: Sorption, root uptake, and translocation. Environment International, 156, 106642.
MENZEL, J., ABRAHAM, K., DIETRICH, S., FROMME, H., VOLKEL, W., SCHWERDTLE, T. & WEIKERT, C. 2021. Internal exposure to perfluoroalkyl substances (PFAS) in vegans and omnivores. International Journal of Hygiene & Environmental Health, 237, 113808.
MHADHBI, L., RIAL, D., PÉREZ, S. & BEIRAS, R. 2012. Ecological risk assessment of perfluorooctanoic acid (PFOA) and perfluorooctanesulfonic acid (PFOS) in marine environment using Isochrysis galbana, Paracentrotus lividus, Siriella armata and Psetta maxima. Journal of Environmental Monitoring, 14, 1375-1382.
MILINOVIC, J., LACORTE, S., VIDAL, M. & RIGOL, A. 2015. Sorption behaviour of perfluoroalkyl substances in soils. Science of the Total Environment, 511, 63-71.
MINATA, M., HARADA, K. H., KARRMAN, A., HITOMI, T., HIROSAWA, M., MURATA, M., GONZALEZ, F. J. & KOIZUMI, A. 2010. Role of Peroxisome Proliferator-activated Receptor-alpha in Hepatobiliary Injury Induced by Ammonium Perfluorooctanoate in Mouse Liver. Industrial Health, 48, 96-107.
MITRO, S. D., SAGIV, S. K., FLEISCH, A. F., JAACKS, L. M., WILLIAMS, P. L., RIFAS-SHIMAN, S. L., CALAFAT, A. M., HIVERT, M. F., OKEN, E. & JAMES-TODD, T. M. 2020a. Pregnancy Per- and Polyfluoroalkyl Substance Concentrations and Postpartum Health in Project Viva: A Prospective Cohort. Journal of Clinical Endocrinology & Metabolism, 105, 01.
MITRO, S. D., SAGIV, S. K., RIFAS-SHIMAN, S. L., CALAFAT, A. M., FLEISCH, A. F., JAACKS, L. M., WILLIAMS, P. L., OKEN, E. & JAMES-TODD, T. M. 2020b. Per- and Polyfluoroalkyl Substance Exposure, Gestational Weight Gain, and Postpartum Weight Changes in Project Viva. Obesity, 28, 1984-1992.
MITSUBISHI 1996. Toxicity Study of T-6333 by Oral Administration to Rats for 28 Days. Mitsubishi Chemical Safety Institute Ltd., Kashima Laboratory 14 Sunayama, Hasaki-machi, Kshima-fun, Ibaraki, Japan.
MOKRA, K. 2021. Endocrine Disruptor Potential of Short- and Long-Chain Perfluoroalkyl Substances (PFASs)—A Synthesis of Current Knowledge with Proposal of Molecular Mechanism. International Journal of Molecular Sciences, 22.
MOON, J. 2021. Perfluoroalkyl substances (PFASs) exposure and kidney damage: Causal interpretation using the US 2003-2018 National Health and Nutrition Examination Survey (NHANES) datasets. Environmental Pollution, 288, 117707.
MORA, A. M., FLEISCH, A. F., RIFAS-SHIMAN, S. L., WOO BAIDAL, J. A., PARDO, L., WEBSTER, T. F., CALAFAT, A. M., YE, X., OKEN, E. & SAGIV, S. K. 2018. Early life exposure to per- and polyfluoroalkyl substances and mid-childhood lipid and alanine aminotransferase levels. Environment International, 111, 1-13.
MORAL PAJARES, E., GALLEGO VALERO, L. & ROMÁN SÁNCHEZ, I. M. 2019. Cost of urban wastewater treatment and ecotaxes: Evidence from municipalities in southern Europe. Water, 11, 423.
MOROI, Y., YANO, H., SHIBATA, O. & YONEMITSU, T. 2001. Determination of acidity constants of perfluoroalkanoic acids. Bulletin of the Chemical Society of Japan, 74, 667-672.

P.O. Box 400, FI-00121 Helsinki, Finland | Tel. +358 9 686180 | echa.europa.eu
459
MPI RESEARCH INC. 2013. H:28548: Combined Chronic Toxicity/Oncogenicity Study 2-Year Oral Gavage Study in Rats MPI Research, Inc., Michigan, USA.
MUIR, D., BOSSI, R., CARLSSON, P., EVANS, M., DE SILVA, A., HALSALL, C., RAUERT, C., HERZKE, D., HUNG, H., LETCHER, R., RIGÉT, F. & ROOS, A. 2019. Levels and trends of poly- and perfluoroalkyl substances in the Arctic environment – An update. Emerging Contaminants, 5, 240-271.
MUKERJI, P., RAE, J. C., BUCK, R. C. & O'CONNOR, J. C. 2015. Oral repeated-dose systemic and reproductive toxicity of 6:2 fluorotelomer alcohol in mice. Toxicology Reports, 2, 130-143.
MÜLLER, C. E., LEFEVRE, G. H., TIMOFTE, A. E., HUSSAIN, F. A., SATTELY, E. S. & LUTHY, R. G. 2016. Competing mechanisms for perfluoroalkyl acid accumulation in plants revealed using an Arabidopsis model system. Environmental Toxicology and Chemistry, 35, 1138-1147.
MUMTAZ, M., BAO, Y., LIU, L., HUANG, J., CAGNETTA, G. & YU, G. 2019. Per- and Polyfluoroalkyl Substances in Representative Fluorocarbon Surfactants Used in Chinese Film-Forming Foams: Levels, Profile Shift, and Environmental Implications. Environmental Science & Technology Letters, 6, 259-264.
MWV 2021. Restriction of Perfluorohexanoic acid: MWV position to SEAC draft opinion, comment #850 to the SEAC draft opinion on the PFHxA restriction, available in ORCOM Part 1 at https://echa.europa.eu/registry-of-restriction-intentions/-/dislist/details/0b0236e18323a25d.
MYLCHREEST, E., MUNLEY, S. M. & KENNEDY, G. L., JR. 2005. Evaluation of the developmental toxicity of 8-2 telomer B alcohol. Drug Chem Toxicol, 28, 315-28.
NAVAL RESEARCH LABORATORY 2019. Fuel for Firefighting Foam Evaluations: Gasoline vs Heptane, retreived from , https://apps.dtic.mil/dtic/tr/fulltext/u2/1076690.pdf.
NAVARRO, I., DE LA TORRE, A., SANZ, P., PORCEL, M. A., PRO, J., CARBONELL, G. & MARTINEZ, M. L. 2017. Uptake of perfluoroalkyl substances and halogenated flame retardants by crop plants grown in biosolids-amended soils. Environ Res, 152, 199-206.
NEWSTED, J. L., BEACH, S. A., GALLAGHER, S. P. & GIESY, J. P. 2008. Acute and chronic effects of perfluorobutane sulfonate (PFBS) on the mallard and northern bobwhite quail. Arch Environ Contam Toxicol, 54, 535-45.
NGUYEN, H. T., KASERZON, S. L., THAI, P. K., VIJAYASARATHY, S., BRÄUNIG, J., CROSBIE, N. D., BIGNERT, A. & MUELLER, J. F. 2019. Temporal trends of per- and polyfluoroalkyl substances (PFAS) in the influent of two of the largest wastewater treatment plants in Australia. Emerging Contaminants, 5, 211-218.
NIELSEN, C. & JÖUD, A. 2021. Susceptibility to COVID-19 after High Exposure to Perfluoroalkyl Substances from Contaminated Drinking Water: An Ecological Study from Ronneby, Sweden. Int J Environ Res Public Health, 18.
NILSSON, H., KARRMAN, A., ROTANDER, A., VAN BAVEL, B., LINDSTROM, G. & WESTBERG, H. 2010a. Inhalation exposure to fluorotelomer alcohols yield perfluorocarboxylates in human blood? Environ Sci Technol, 44, 7717-22.
NILSSON, H., KARRMAN, A., ROTANDER, A., VAN BAVEL, B., LINDSTROM, G. & WESTBERG, H. 2013a. Biotransformation of fluorotelomer compound to perfluorocarboxylates in humans. Environ Int, 51, 8-12.

P.O. Box 400, FI-00121 Helsinki, Finland | Tel. +358 9 686180 | echa.europa.eu
460
NILSSON, H., KARRMAN, A., ROTANDER, A., VAN BAVEL, B., LINDSTROM, G. & WESTBERG, H. 2013b. Professional ski waxers' exposure to PFAS and aerosol concentrations in gas phase and different particle size fractions. Environmental Science-Processes & Impacts, 15, 814-822.
NILSSON, H., KÄRRMAN, A., WESTBERG, H., ROTANDER, A., VAN BAVEL, B. & LINDSTRÖM, G. 2010b. A time trend study of significantly elevated perfluorocarboxylate levels in humans after using fluorinated ski wax. Environ Sci Technol, 44, 2150-5.
NO-MOD 2021. Interview of the Norwegian Defence Material Agency by the Dossier Submitter.
NON-CLINICAL SAFTEY 2017. 4 week oral toxicity study in rats plus a 2 week treatment-free recovery period. Non-Clinical Saftey, Merck KGaA, Darmstadt, Germany.
NORCONSULT 2019. Reporting for Part 1 and Part 2 of the Norwegian Environment Agency’s orders: “Overall assessment of PFAS contamination at Avinor’s airports”, Norconsult, 2019, available at: https://avinor.no/globalassets/_konsern/miljo-og-samfunn/pfos/rapporter/reporting-for-part-1-and-part-2_overall-assessment_including-appendices.pdf and Reporting for Part 3 of the Norwegian Environment Agency’s orders: “Overall assessment of PFAS contamination at Avinor’s airports”, Norconsult, 2019, available at: https://avinor.no/globalassets/_konsern/miljo-og-samfunn/pfos/rapporter/reporting-for-part-3_assessment-of-local-impacts.pdf (source: https://avinor.no/en/corporate/community-and-environment/pfos-i-fokus/samlede-vurderinger).
NORDICCOUNCIL 2019. The cost of inaction: A socioeconomic analysis of environmental and health impacts linked to exposure to PFAS.
NØST, T. H., HELGASON, L. B., HARJU, M., HEIMSTAD, E. S., GABRIELSEN, G. W. & JENSSEN, B. M. 2012. Halogenated organic contaminants and their correlations with circulating thyroid hormones in developing Arctic seabirds. Science of The Total Environment, 414, 248-256.
NOTOX 2007a. Repeated Dose 28-Day Oral Toxicity Study with MTDID 6675 by Daily Gavage in the Rat NOTOX B.V. Hambakenwetering 7 5231 DD's-Hertogenbosch The Netherlands.
NOTOX 2007b. Repeated Dose 28-Day Oral Toxicity Study with MTDID 9580 by Daily Gavage in the Rat 06-332 479857. NOTOX B.V. Hambakenwetering 7 5231 DD's-Hertogenbosch The Netherlands.
NTP 2016a. CASRN Index in MS Excel. Report on carcinogens, Fourteenth Edition. Research Triangle Park, NC: U.S. Department of Health and Human Services, Public Health Service, National Toxicology Program.
NTP 2016b. Monograph on immunotoxicity associated with exposure to perfluorooctanoic acid (PFOA) and perfluorooctane sulfonate (PFOS). In: PROGRAM, N. T. (ed.) Completed Reports. Research Triangle Park, NC, USA: National Toxicology Program (NTP).
NTP 2019a. NTP Technical Report on the Toxicity Studies of Perfluoroalkyl Carboxylates (Perfluorohexanoic Acid, Perfluorooctanoic Acid, Perfluorononanoic Acid, and Perfluorodecanoic Acid) Administered by Gavage to Sprague Dawley (Hsd:Sprague Dawley SD) Rats. Toxicity Report 97. Research Triangle Park, North Carolina, USA: National Toxicology Program, Public Health Service, U.S. Department of Health and Human Services.

P.O. Box 400, FI-00121 Helsinki, Finland | Tel. +358 9 686180 | echa.europa.eu
461
NTP 2019b. NTP Technical Report on the Toxicity Studies of Perfluoroalkyl Sulfonates (Perfluorobutane Sulfonic Acid, Perfluorohexane Sulfonate Potassium Salt, and Perfluorooctane Sulfonic Acid) Administered by Gavage to Sprague Dawley (Hsd:Sprague Dawley SD) Rats. Research Triangle Park, North Carolina, USA: National Toxicology Program, Public Health Service, U.S. Department of Health and Human Services.
NTP 2019c. NTP Technical Report on the Toxicology and Carcinogenesis Studies of Perfluorooctanoic Acid (CAS No. 335-67-1) Administered in Feed to Sprague Dawley (Hsd:Sprague Dawley® SD®) Rats. National Toxicology Program, Public Health Service, U.S. Department of Health and Human Services, ISSN: 2473-4756, Technical Report 598.
NYSPPI 2019. New York State Pollution Prevention Institute - Rochester Institute of Technology – “Per- and Polyfluorinated Substances in Firefighting Foam”, April 2019, available at http://www.theic2.org/article/download-pdf/file_name/Per_and_Polyfluorinated_Substances_in_Firefighting_Foam_040919.pdf.
O'CONNOR, J. C., MUNLEY, S. M., SEREX, T. L. & BUCK, R. C. 2014. Evaluation of the reproductive and developmental toxicity of 6:2 fluorotelomer alcohol in rats. Toxicology, 317, 6-16.
O'HAGAN, D. 2008. Understanding organofluorine chemistry. An introduction to the C–F bond. Chemical Society Reviews, 37, 308-319.
OECD 2021. Draft OECD Synthesis Report on Understanding Side-Chain Fluorinated Polymers and Their Life Cycle (v.3, from 9.12.2021).
OECD/UNEP GLOBAL PFC GROUP 2013. Synthesis paper on per- and polyfluorinated chemicals (PFCs). http://www.oecd.org/chemicalsafety/risk-management/synthesis-paper-on-per-and-polyfluorinated-chemicals.htm.
OH, J., BENNETT, D. H., CALAFAT, A. M., TANCREDI, D., ROA, D. L., SCHMIDT, R. J., HERTZ-PICCIOTTO, I. & SHIN, H. M. 2021a. Prenatal exposure to per- and polyfluoroalkyl substances in association with autism spectrum disorder in the MARBLES study. Environment International, 147, 106328.
OH, J., SCHMIDT, R. J., TANCREDI, D., CALAFAT, A. M., ROA, D. L., HERTZ-PICCIOTTO, I. & SHIN, H. M. 2021b. Prenatal exposure to per- and polyfluoroalkyl substances and cognitive development in infancy and toddlerhood. Environmental Research, 196, 110939.
OIL TECHNICS 2021. Comment #858 on the SEAC draft opinion on the PFHxA restriction, available in ORCOM Part 1 at https://echa.europa.eu/registry-of-restriction-intentions/-/dislist/details/0b0236e18323a25d.
OJO, A. F., PENG, C. & NG, J. C. 2021. Assessing the human health risks of per- and polyfluoroalkyl substances: A need for greater focus on their interactions as mixtures. Journal of Hazardous Materials, 407, 14.
OKADA, E., SASAKI, S., KASHINO, I., MATSUURA, H., MIYASHITA, C., KOBAYASHI, S., ITOH, K., IKENO, T., TAMAKOSHI, A. & KISHI, R. 2014. Prenatal exposure to perfluoroalkyl acids and allergic diseases in early childhood. Environ Int, 65, 127-34.
OKADA, E., SASAKI, S., SAIJO, Y., WASHINO, N., MIYASHITA, C., KOBAYASHI, S., KONISHI, K., ITO, Y. M., ITO, R., NAKATA, A., IWASAKI, Y., SAITO, K., NAKAZAWA, H. & KISHI, R. 2012. Prenatal exposure to perfluorinated chemicals and relationship

P.O. Box 400, FI-00121 Helsinki, Finland | Tel. +358 9 686180 | echa.europa.eu
462
with allergies and infectious diseases in infants. Environ Res, 112, 118-25.
OLSEN, G. W. 2015. PFAS Biomonitoring in Higher Exposed Populations. Toxicological Effects of Perfluoroalkyl and Polyfluoroalkyl Substances, 77-125.
OLSEN, G. W., HANSEN, K. J., STEVENSON, L. A., BURRIS, J. M. & MANDEL, J. H. 2003. Human donor liver and serum concentrations of perfluorooctanesulfonate and other perfluorochemicals. Environ Sci Technol, 37, 888-91.
OLSEN, K. T. 2017. Crashtender med skumkanoner; retreived from https://beros.dk/skum/Kim_Thorbjoern_Olsen_CPH.pdf.
OMOIKE, O. E., PACK, R. P., MAMUDU, H. M., LIU, Y. & WANG, L. 2021. A cross-sectional study of the association between perfluorinated chemical exposure and cancers related to deregulation of estrogen receptors. Environmental Research, 196, 110329.
OU, Y., ZENG, X., LIN, S., BLOOM, M. S., HAN, F., XIAO, X., WANG, H., MATALA, R., LI, X., QU, Y., NIE, Z., DONG, G. & LIU, X. 2021. Gestational exposure to perfluoroalkyl substances and congenital heart defects: A nested case-control pilot study. Environment International, 154, 106567.
PAN, Y., CUI, Q., WANG, J., SHENG, N., JING, J., YAO, B. & DAI, J. 2019a. Profiles of Emerging and Legacy Per-/Polyfluoroalkyl Substances in Matched Serum and Semen Samples: New Implications for Human Semen Quality. Environmental Health Perspectives, 127, 127005.
PAN, Y., ZHANG, H., CUI, Q., SHENG, N., YEUNG, L. W., SUN, Y., GUO, Y. & DAI, J. 2018. Worldwide distribution of novel perfluoroether carboxylic and sulfonic acids in surface water. Environmental science & technology, 52, 7621-7629.
PAN, Z., MIAO, W., WANG, C., TU, W., JIN, C. & JIN, Y. 2021. 6:2 Cl-PFESA has the potential to cause liver damage and induce lipid metabolism disorders in female mice through the action of PPAR-γ. Environ Pollut, 287, 117329.
PAN, Z., YUAN, X., TU, W., FU, Z. & JIN, Y. 2019b. Subchronic exposure of environmentally relevant concentrations of F-53B in mice resulted in gut barrier dysfunction and colonic inflammation in a sex-independent manner. Environ Pollut, 253, 268-277.
PARSONS, J. R., SÁEZ, M., DOLFING, J. & VOOGT, P. D. 2008. Biodegradation of perfluorinated compounds. Reviews of Environmental Contamination and Toxicology Vol 196, 53-71.
PATERSON, S., MACKAY, D. & MCFARLANE, C. 1994. A Model of Organic Chemical Uptake by Plants from Soil and the Atmosphere. Environmental Science & Technology, 28, 2259-2266.
PAUL, A. G., JONES, K. C. & SWEETMAN, A. J. 2009. A first global production, emission, and environmental inventory for perfluorooctane sulfonate. Environmental Science and Technology, 43, 386-392.
PEDEN-ADAMS, M. M., KELLER, J. M., EUDALY, J. G., BERGER, J., GILKESON, G. S. & KEIL, D. E. 2008. Suppression of humoral immunity in mice following exposure to perfluorooctane sulfonate. Toxicol Sci, 104, 144-54.
PELCH, K. E., READE, A., WOLFFE, T. A. M. & KWIATKOWSKI, C. F. 2019. PFAS health effects database: Protocol for a systematic evidence map. Environment International, 130, 104851.

P.O. Box 400, FI-00121 Helsinki, Finland | Tel. +358 9 686180 | echa.europa.eu
463
PÉREZ, F., LLORCA, M., KÖCK-SCHULMEYER, M., ŠKRBIĆ, B., SILVA, L. F. O., DA BOIT MARTINELLO, K., AL-DHABI, N. A., ANTIĆ, I., FARRÉ, M. & BARCELÓ, D. 2014. Assessment of perfluoroalkyl substances in food items at global scale. Environmental Research, 135, 181-189.
PEREZ, F., NADAL, M., NAVARRO-ORTEGA, A., FABREGA, F., DOMINGO, J. L., BARCELO, D. & FARRE, M. 2013. Accumulation of perfluoroalkyl substances in human tissues. Environment International, 59, 354-362.
PFAS-TOX-DATABASE. 2021. PFAS-Tox-Database [Online]. Available: https://pfastoxdatabase.org/ [Accessed 2021-08-12].
PI, N., NG, J. Z. & KELLY, B. C. 2017. Uptake and elimination kinetics of perfluoroalkyl substances in submerged and free-floating aquatic macrophytes: Results of mesocosm experiments with Echinodorus horemanii and Eichhornia crassipes. Water Research, 117, 167-174.
PINNEY, S. M., WINDHAM, G. C., XIE, C., HERRICK, R. L., CALAFAT, A. M., MCWHORTER, K., FASSLER, C. S., HIATT, R. A., KUSHI, L. H., BIRO, F. M., BREAST, C. & THE ENVIRONMENT RESEARCH, P. 2019. Perfluorooctanoate and changes in anthropometric parameters with age in young girls in the Greater Cincinnati and San Francisco Bay Area. International Journal of Hygiene & Environmental Health, 222, 1038-1046.
PITTER, G., ZARE JEDDI, M., BARBIERI, G., GION, M., FABRICIO, A. S. C., DAPRA, F., RUSSO, F., FLETCHER, T. & CANOVA, C. 2020. Perfluoroalkyl substances are associated with elevated blood pressure and hypertension in highly exposed young adults. Environmental Health: A Global Access Science Source, 19, 102.
PIZZURRO, D. M., SEELEY, M., KERPER, L. E. & BECK, B. D. 2019. Interspecies differences in perfluoroalkyl substances (PFAS)toxicokinetics and application to health-based criteria. Regulatory Toxicology and Pharmacology, 106, 239-250.
POLAKOFF, P. L., BUSCH, K. A. & OKAWA, M. T. 1974. Urinary Fluoride Levels in Polytetrafluoroethylene Fabricators. American Industrial Hygiene Association Journal, 35, 99-106.
PRESTON, E. V., RIFAS-SHIMAN, S. L., HIVERT, M. F., ZOTA, A. R., SAGIV, S. K., CALAFAT, A. M., OKEN, E. & JAMES-TODD, T. 2020a. Associations of Per- and Polyfluoroalkyl Substances (PFAS) With Glucose Tolerance During Pregnancy in Project Viva. Journal of Clinical Endocrinology & Metabolism, 105, 01.
PRESTON, E. V., WEBSTER, T. F., CLAUS HENN, B., MCCLEAN, M. D., GENNINGS, C., OKEN, E., RIFAS-SHIMAN, S. L., PEARCE, E. N., CALAFAT, A. M., FLEISCH, A. F. & SAGIV, S. K. 2020b. Prenatal exposure to per- and polyfluoroalkyl substances and maternal and neonatal thyroid function in the Project Viva Cohort: A mixtures approach. Environment International, 139, 105728.
PRESTON, E. V., WEBSTER, T. F., OKEN, E., CLAUS HENN, B., MCCLEAN, M. D., RIFAS-SHIMAN, S. L., PEARCE, E. N., BRAVERMAN, L. E., CALAFAT, A. M., YE, X. & SAGIV, S. K. 2018. Maternal Plasma per- and Polyfluoroalkyl Substance Concentrations in Early Pregnancy and Maternal and Neonatal Thyroid Function in a Prospective Birth Cohort: Project Viva (USA). Environmental Health Perspectives, 126, 027013.
PREVEDOUROS, K., COUSINS, I. T., BUCK, R. C. & KORZENIOWSKI, S. H. 2006. Sources, fate and transport of perfluorocarboxylates. Environmental science & technology, 40, 32-44.

P.O. Box 400, FI-00121 Helsinki, Finland | Tel. +358 9 686180 | echa.europa.eu
464
QAZI, M. R., ABEDI, M. R., NELSON, B. D., DEPIERRE, J. W. & ABEDI-VALUGERDI, M. 2010. Dietary exposure to perfluorooctanoate or perfluorooctane sulfonate induces hypertrophy in centrilobular hepatocytes and alters the hepatic immune status in mice. Int Immunopharmacol, 10, 1420-7.
QIU, Z., QU, K., LUAN, F., LIU, Y., ZHU, Y., YUAN, Y., LI, H., ZHANG, H., HAI, Y. & ZHAO, C. 2020. Binding specificities of estrogen receptor with perfluorinated compounds: A cross species comparison. Environment International, 134, 105284.
QU, R., LIU, J., LI, C., WANG, L., WANG, Z. & WU, J. 2016. Experimental and theoretical insights into the photochemical decomposition of environmentally persistent perfluorocarboxylic acids. Water Research, 104, 34-43.
RAC 2011. Committee for Risk Assessment (RAC) Opinion proposing harmonised classification and labelling at Community level of Perfluorooctanoic acid (PFOA). ECHA/RAC/DOC No CLH-O-0000002227-78-01/F.
RAHMAN, M. L., ZHANG, C., SMARR, M. M., LEE, S., HONDA, M., KANNAN, K., TEKOLA-AYELE, F. & BUCK LOUIS, G. M. 2019. Persistent organic pollutants and gestational diabetes: A multi-center prospective cohort study of healthy US women. Environment International, 124, 249-258.
RAMBOLL 2021. ECHA FWC: PFAS in firefighting foams, SR 4 PFAS waste disposal methods and equipment cleaning methods, unpublished.
RAMBOLL AND VITO 2021. SC3 (ECHA/2020/875) and SC14 (ECHA/2021/330) - emissions and costs over time.
RAMHOJ, L., HASS, U., BOBERG, J., SCHOLZE, M., CHRISTIANSEN, S., NIELSEN, F. & AXELSTAD, M. 2018. Perfluorohexane Sulfonate (PFHxS) and a Mixture of Endocrine Disrupters Reduce Thyroxine Levels and Cause Antiandrogenic Effects in Rats. Toxicol Sci, 163, 579-591.
RAMHOJ, L., HASS, U., GILBERT, M. E., WOOD, C., SVINGEN, T., USAI, D., VINGGAARD, A. M., MANDRUP, K. & AXELSTAD, M. 2020. Evaluating thyroid hormone disruption: investigations of long-term neurodevelopmental effects in rats after perinatal exposure to perfluorohexane sulfonate (PFHxS). Scientific Reports, 10.
RAMHØJ, L., HASS, U., GILBERT, M. E., WOOD, C., SVINGEN, T., USAI, D., VINGGAARD, A. M., MANDRUP, K. & AXELSTAD, M. 2020. Evaluating thyroid hormone disruption: investigations of long-term neurodevelopmental effects in rats after perinatal exposure to perfluorohexane sulfonate (PFHxS). Scientific Reports, 10, 2672.
RAMSDEN NIALL 2021. Testing programme summary - Presentation at the Lastfire Foam Summit September 2021 - http://www.lastfire.co.uk/.
RAVISHANKARA, A., SOLOMON, S., TURNIPSEED, A. A. & WARREN, R. 1993. Atmospheric lifetimes of long-lived halogenated species. Science, 259, 194-199.
REBHOLZ, S. L., JONES, T., HERRICK, R. L., XIE, C., CALAFAT, A. M., PINNEY, S. M. & WOOLLETT, L. A. 2016. Hypercholesterolemia with consumption of PFOA-laced Western diets is dependent on strain and sex of mice. Toxicology Reports, 3, 46-54.
REEMTSMA, T., BERGER, U., ARP, H. P. H., GALLARD, H., KNEPPER, T. P., NEUMANN, M., QUINTANA, J. B. & VOOGT, P. D. 2016. Mind the Gap: Persistent and Mobile Organic Compounds - Water Contaminants That Slip Through. Environmental Science and Technology, 50, 10308-10315.

P.O. Box 400, FI-00121 Helsinki, Finland | Tel. +358 9 686180 | echa.europa.eu
465
REN, X.-M., QIN, W.-P., CAO, L.-Y., ZHANG, J., YANG, Y., WAN, B. & GUO, L.-H. 2016a. Binding interactions of perfluoroalkyl substances with thyroid hormone transport proteins and potential toxicological implications. Toxicology, 366-367, 32-42.
REN, X. M., QIN, W. P., CAO, L. Y., ZHANG, J., YANG, Y., WAN, B. & GUO, L. H. 2016b. Binding interactions of perfluoroalkyl substances with thyroid hormone transport proteins and potential toxicological implications. Toxicology, 366, 32-42.
REN, X. M., ZHANG, Y. F., GUO, L. H., QIN, Z. F., LV, Q. Y. & ZHANG, L. Y. 2015. Structure-activity relations in binding of perfluoroalkyl compounds to human thyroid hormone T3 receptor. Archives of Toxicology, 89, 233-242.
REN, Y., JIN, L., YANG, F., LIANG, H., ZHANG, Z., DU, J., SONG, X., MIAO, M. & YUAN, W. 2020. Concentrations of perfluoroalkyl and polyfluoroalkyl substances and blood glucose in pregnant women. Environmental Health: A Global Access Science Source, 19, 88.
RERICHA, Y., CAO, D., TRUONG, L., SIMONICH, M., FIELD, J. A. & TANGUAY, R. L. 2021. Behavior Effects of Structurally Diverse Per- and Polyfluoroalkyl Substances in Zebrafish. Chemical Research in Toxicology, 34, 1409-1416.
RESEARCH TOXICOLOGY CENTRE 2010. C6O4 cyclic: 7-day preliminary oral toxicity study in rats. Research Toxicology Centre S.p.A., Via Tito Speri, 12/14, 00040 Pomezia (Roma), Italy.
RESEARCH TOXICOLOGY CENTRE 2011. cC6O4 4 week oral toxicity study in rats followed by a 4 week recovery period. Research Toxicology Centre S.p.A., Via Tito Speri, 12/14, 00040 Pomezia (Roma), Italy.
RESEARCH TOXICOLOGY CENTRE 2012. cC6O4 Reproduction/Develeopment toxicity screening test in rats. Research Toxicology Centre S.p.A. - Via Tito Speri 12/14 00040 Pomezia RM Italy.
RESEARCH TOXICOLOGY CENTRE 2013. cC604 13 week oral toxicity study in rats followed by a 6-week recovery period. Research Toxicology Centre S.p.A., Via Tito Speri, 12/14, 00040 Pomezia (Roma), Italy.
RICE, P. A., AUNGST, J., COOPER, J., BANDELE, O. & KABADI, S. V. 2020. Comparative analysis of the toxicological databases for 6:2 fluorotelomer alcohol (6:2 FTOH) and perfluorohexanoic acid (PFHxA). Food and Chemical Toxicology, 138.
RICE, P. A., COOPER, J., KOH-FALLET, S. E. & KABADI, S. V. 2021. Comparative analysis of the physicochemical, toxicokinetic, and toxicological properties of ether-PFAS. Toxicol Appl Pharmacol, 422, 115531.
RIVM, ZEILMAKER, M. J., FRAGKI, S., VERBRUGGEN, E. M. J., BOKKERS, B. G. H. & LIJZEN, J. P. A. 2018. Mixture exposure to PFAS: A relative potency factor approach. In: PFAS, H. (ed.). Bilthoven, Netherlands: National Institute for Public Health and the Environment (RIVM)
Ministry of Health, Welfare and Sport.
ROSATO, I., JEDDI, M. Z., LEDDA, C., GALLO, E., FLETCHER, T., PITTER, G., BATZELLA, E. & CANOVA, C. 2022. How to investigate human health effects related to exposure to mixtures of per- and polyfluoroalkyl substances: A systematic review of statistical methods. Environmental Research, 205, 9.
ROSEN, M. B., DAS, K. P., ROONEY, J., ABBOTT, B., CHRISTOPHER LAU & CORTON, J. C.

P.O. Box 400, FI-00121 Helsinki, Finland | Tel. +358 9 686180 | echa.europa.eu
466
2017a. PPARα-independent transcriptional targets of perfluoroalkyl acids revealed by transcript profiling. Toxicology, 387, 95-107.
ROSEN, M. B., DAS, K. P., ROONEY, J., ABBOTT, B., LAU, C. & CORTON, J. C. 2017b. PPARalpha-independent transcriptional targets of perfluoroalkyl acids revealed by transcript profiling. Toxicology, 387, 95-107.
ROSENMAI, A. K., AHRENS, L., LE GODEC, T., LUNDQVIST, J. & OSKARSSON, A. 2018. Relationship between peroxisome proliferator-activated receptor alpha activity and cellular concentration of 14 perfluoroalkyl substances in HepG2 cells. Journal of Applied Toxicology, 38, 219-226.
ROSENMAI, A. K., NIELSEN, F. K., PEDERSEN, M., HADRUP, N., TRIER, X., CHRISTENSEN, J. H. & VINGGAARD, A. M. 2013. Fluorochemicals used in food packaging inhibit male sex hormone synthesis. Toxicol Appl Pharmacol, 266, 132-42.
ROSENMAI, A. K., TAXVIG, C., SVINGEN, T., TRIER, X., VAN VUGT-LUSSENBURG, B. M. A., PEDERSEN, M., LESNÉ, L., JÉGOU, B. & VINGGAARD, A. M. 2016. Fluorinated alkyl substances and technical mixtures used in food paper-packaging exhibit endocrine-related activity in vitro. Andrology, 4, 662-672.
ROTANDER, A., KÄRRMAN, A., TOMS, L.-M. L., KAY, M., MUELLER, J. F. & GÓMEZ RAMOS, M. A. J. 2015a. Novel fluorinated surfactants tentatively identified in firefighters using liquid chromatography quadrupole time-of-flight tandem mass spectrometry and a case-control approach. Environmental science & technology, 49, 2434-2442.
ROTANDER, A., TOMS, L.-M. L., AYLWARD, L., KAY, M. & MUELLER, J. F. 2015b. Elevated levels of PFOS and PFHxS in firefighters exposed to aqueous film forming foam (AFFF). Environment international, 82, 28-34.
RUAN, T., SULECKI, L. M., WOLSTENHOLME, B. W., JIANG, G. B., WANG, N. & BUCK, R. C. 2014. 6:2 Fluorotelomer iodide in vitro metabolism by rat liver microsomes: Comparison with 1,2-C-14 6:2 fluorotelomer alcohol. Chemosphere, 112, 34-41.
RÜDEL, H., KÖRNER, W., LETZEL, T., NEUMANN, M., NÖDLER, K. & REEMTSMA, T. 2020. Persistent, mobile and toxic substances in the environment: a spotlight on current research and regulatory activities. Environmental Sciences Europe, 32.
RUDNICK, L. R. 2020. Synthetics, Mineral Oils, and Bio-Based Lubricants: Chemistry and Technology, 3rd Edition.
RUSHING, B. R., HU, Q., FRANKLIN, J. N., MCMAHEN, R., DAGNINO, S., HIGGINS, C. P., STRYNAR, M. J. & DEWITT, J. C. 2017. Evaluation of the immunomodulatory effects of 2,3,3,3-tetrafluoro-2-(heptafluoropropoxy)-propanoate in C57BL/6 mice. Toxicol Sci.
RUSSELL, M. H., BERTI, W. R., SZOSTEK, B. & BUCK, R. C. 2008. Investigation of the biodegradation potential of a fluoroacrylate polymer product in aerobic soils. Environ Sci Technol, 42, 800-7.
RUSSELL, M. H., BERTI, W. R., SZOSTEK, B., WANG, N. & BUCK, R. C. 2010. Evaluation of PFO formation from the biodegradation of a fluorotelomer-based urethane polymer product in aerobic soils. Polymer Degradation and Stability, 95, 79-85.
RYLANDER, L., LINDH, C. H., HANSSON, S. R., BROBERG, K. & KALLEN, K. 2020. Per- and Polyfluoroalkyl Substances in Early Pregnancy and Risk for Preeclampsia: A Case-Control Study in Southern Sweden. Toxics, 8, 16.

P.O. Box 400, FI-00121 Helsinki, Finland | Tel. +358 9 686180 | echa.europa.eu
467
SÁEZ, M., DE VOOGT, P. & PARSONS, J. R. 2008. Persistence of perfluoroalkylated substances in closed bottle tests with municipal sewage sludge. Environmental Science and Pollution Research, 15, 472-477.
SANT, K. E., VENEZIA, O. L., SINNO, P. P. & TIMME-LARAGY, A. R. 2019. Perfluorobutanesulfonic Acid Disrupts Pancreatic Organogenesis and Regulation of Lipid Metabolism in the Zebrafish, Danio rerio. Toxicological sciences : an official journal of the Society of Toxicology, 167, 258-268.
SARZO, B., BALLESTEROS, V., INIGUEZ, C., MANZANO-SALGADO, C. B., CASAS, M., LLOP, S., MURCIA, M., GUXENS, M., VRIJHEID, M., MARINA, L. S., SCHETTGEN, T., ESPADA, M., IRIZAR, A., FERNANDEZ-JIMENEZ, N., BALLESTER, F. & LOPEZ-ESPINOSA, M. J. 2021. Maternal Perfluoroalkyl Substances, Thyroid Hormones, and DIO Genes: A Spanish Cross-sectional Study. Environmental Science & Technology, 27, 27.
SAVU, P. M. 2000. Fluorinated Higher Carboxylic Acids. Kirk-Othmer Encyclopedia of Chemical Technology. John Wiley & Sons, Inc.
SAY, D., MANNING, A. J., WESTERN, L. M., YOUNG, D., WISHER, A., RIGBY, M., REIMANN, S., VOLLMER, M. K., MAIONE, M. & ARDUINI, J. 2021. Global trends and European emissions of tetrafluoromethane (CF 4), hexafluoroethane (C 2 F 6) and octafluoropropane (C 3 F 8). Atmospheric Chemistry and Physics, 21, 2149-2164.
SCHENKER, U., SCHERINGER, M., MACLEOD, M., MARTIN, J. W., COUSINS, I. T. & HUNGERBÜHLER, K. 2008. Contribution of volatile precursor substances to the flux of perfluorooctanoate to the arctic. Environmental Science and Technology, 42, 3710-3716.
SCHEURER, M., NÖDLER, K., FREELING, F., JANDA, J., HAPPEL, O., RIEGEL, M., MÜLLER, U., STORCK, F. R., FLEIG, M. & LANGE, F. T. 2017. Small, mobile, persistent: Trifluoroacetate in the water cycle–Overlooked sources, pathways, and consequences for drinking water supply. Water research, 126, 460-471.
SCHILLEMANS, T., SHI, L., DONAT-VARGAS, C., HANHINEVA, K., TORNEVI, A., JOHANSSON, I., KOPONEN, J., KIVIRANTA, H., ROLANDSSON, O., BERGDAHL, I. A., LANDBERG, R., AKESSON, A. & BRUNIUS, C. 2021. Plasma metabolites associated with exposure to perfluoroalkyl substances and risk of type 2 diabetes - A nested case-control study. Environment International, 146, 106180.
SCHLEZINGER, J. J., PUCKETT, H., OLIVER, J., NIELSEN, G., HEIGER-BERNAYS, W. & WEBSTER, T. F. 2020. Perfluorooctanoic acid activates multiple nuclear receptor pathways and skews expression of genes regulating cholesterol homeostasis in liver of humanized PPARα mice fed an American diet. Toxicology and Applied Pharmacology, 405.
SCHUSTER, P., BERTERMANN, R., RUSCH, G. M. & DEKANT, W. 2010. Biotransformation of 2,3,3,3-tetrafluoropropene (HFO-1234yf) in rabbits. Toxicol Appl Pharmacol, 244, 247-53.
SCINICARIELLO, F., BUSER, M. C., BALLUZ, L., GEHLE, K., MURRAY, H. E., ABADIN, H. G. & ATTANASIO, R. 2020. Perfluoroalkyl acids, hyperuricemia and gout in adults: Analyses of NHANES 2009-2014. Chemosphere, 259, 127446.
SEPULVADO, J. G., BLAINE, A. C., HUNDAL, L. S. & HIGGINS, C. P. 2011. Occurrence and fate of perfluorochemicals in soil following the land application of municipal biosolids. Environ Sci Technol, 45, 8106-12.

P.O. Box 400, FI-00121 Helsinki, Finland | Tel. +358 9 686180 | echa.europa.eu
468
SEREX, T., ANAND, S., MUNLEY, S., DONNER, E. M., FRAME, S. R., BUCK, R. C. & LOVELESS, S. E. 2014. Toxicological evaluation of 6:2 fluorotelomer alcohol. Toxicology, 319, 1-9.
SHA, B., JOHANSSON, J. H., TUNVED, P., BOHLIN-NIZZETTO, P., COUSINS, I. T. & SALTER, M. E. 2022. Sea Spray Aerosol (SSA) as a Source of Perfluoroalkyl Acids (PFAAs) to the Atmosphere: Field Evidence from Long-Term Air Monitoring. Environmental Science & Technology, 56, 228-238.
SHAW, S. D., BERGER, M. L., HARRIS, J. H., YUN, S. H., WU, Q., LIAO, C., BLUM, A., STEFANI, A. & KANNAN, K. 2013. Persistent organic pollutants including polychlorinated and polybrominated dibenzo-p-dioxins and dibenzofurans in firefighters from Northern California. Chemosphere, 91, 1386-1394.
SHEN, M., XIAO, Y., HUANG, Y., JING, D., SU, J., LUO, D., DUAN, Y., XIAO, S., LI, J. & CHEN, X. 2022. Perfluoroalkyl substances are linked to incident chronic spontaneous urticaria: A nested case-control study. Chemosphere, 287, 132358.
SHENG, N., PAN, Y., GUO, Y., SUN, Y. & DAI, J. 2018. Hepatotoxic Effects of Hexafluoropropylene Oxide Trimer Acid (HFPO-TA), A Novel Perfluorooctanoic Acid (PFOA) Alternative, on Mice. Environmental Science and Technology, 52, 8005-8015.
SHENG, N., ZHOU, X. J., ZHENG, F., PAN, Y. T., GUO, X. J., GUO, Y., SUN, Y. & DAI, J. Y. 2017. Comparative hepatotoxicity of 6: 2 fluorotelomer carboxylic acid and 6: 2 fluorotelomer sulfonic acid, two fluorinated alternatives to long-chain perfluoroalkyl acids, on adult male mice. Archives of Toxicology, 91, 2909-2919.
SHI, G., GUO, H., SHENG, N., CUI, Q., PAN, Y., WANG, J., GUO, Y. & DAI, J. 2018. Two-generational reproductive toxicity assessment of 6:2 chlorinated polyfluorinated ether sulfonate (F-53B, a novel alternative to perfluorooctane sulfonate) in zebrafish. Environmental Pollution, 243, 1517-1527.
SHI, Y., VESTERGREN, R., XU, L., ZHOU, Z., LI, C., LIANG, Y. & CAI, Y. 2016. Human Exposure and Elimination Kinetics of Chlorinated Polyfluoroalkyl Ether Sulfonic Acids (Cl-PFESAs). Environ Sci Technol, 50, 2396-404.
SHI, Z., DING, L., ZHANG, H., FENG, Y., XU, M. & DAI, J. 2009. Chronic exposure to perfluorododecanoic acid disrupts testicular steroidogenesis and the expression of related genes in male rats. Toxicol Lett, 188, 192-200.
SHI, Z. M., ZHANG, H. X., LIU, Y., XU, M. & DAI, J. Y. 2007. Alterations in gene expression and testosterone synthesis in the testes of male rats exposed to perfluorododecanoic acid. Toxicological Sciences, 98, 206-215.
SHIH, Y. H., BLOMBERG, A. J., BIND, M. A., HOLM, D., NIELSEN, F., HEILMANN, C., WEIHE, P. & GRANDJEAN, P. 2021a. Serum vaccine antibody concentrations in adults exposed to per- and polyfluoroalkyl substances: A birth cohort in the Faroe Islands. Journal of Immunotoxicology, 18, 85-92.
SHIH, Y. H., BLOMBERG, A. J., JORGENSEN, L. H., WEIHE, P. & GRANDJEAN, P. 2021b. Early-life exposure to perfluoroalkyl substances in relation to serum adipokines in a longitudinal birth cohort. Environmental Research, 204, 111905.
SHIN, H. M., BENNETT, D. H., CALAFAT, A. M., TANCREDI, D. & HERTZ-PICCIOTTO, I. 2020. Modeled prenatal exposure to per- and polyfluoroalkyl substances in association with child autism spectrum disorder: A case-control study. Environmental Research, 186, 109514.

P.O. Box 400, FI-00121 Helsinki, Finland | Tel. +358 9 686180 | echa.europa.eu
469
SIEGEMUND, G., SCHWERTFEGER, W., FEIRING, A., SMART, B., BEHR, F., VOGEL, H., MCKUSICK, B. & KIRSCH, P. 2012. Fluorine compounds, organic. Ullmann’s encyclopedia of industrial chemistry, 15, 443-494.
SILVA, E., RAJAPAKSE, N. & KORTENKAMP, A. 2002. Something from "nothing" - Eight weak estrogenic chemicals combined at concentrations below NOECs produce significant mixture effects. Environmental Science & Technology, 36, 1751-1756.
SIMA, M. W. & JAFFÉ, P. R. 2021. A critical review of modeling Poly- and Perfluoroalkyl Substances (PFAS) in the soil-water environment. Science of The Total Environment, 757, 143793.
SINGH, S. & SINGH, S. K. 2019a. Chronic exposure to perfluorononanoic acid impairs spermatogenesis, steroidogenesis and fertility in male mice. J Appl Toxicol, 39, 420-431.
SINGH, S. & SINGH, S. K. 2019b. Prepubertal exposure to perfluorononanoic acid interferes with spermatogenesis and steroidogenesis in male mice. Ecotoxicol Environ Saf, 170, 590-599.
SKOGHEIM, T. S., VILLANGER, G. D., WEYDE, K. V. F., ENGEL, S. M., SUREN, P., OIE, M. G., SKOGAN, A. H., BIELE, G., ZEINER, P., OVERGAARD, K. R., HAUG, L. S., SABAREDZOVIC, A. & AASE, H. 2020. Prenatal exposure to perfluoroalkyl substances and associations with symptoms of attention-deficit/hyperactivity disorder and cognitive functions in preschool children. International Journal of Hygiene & Environmental Health, 223, 80-92.
SKOGHEIM, T. S., WEYDE, K. V. F., AASE, H., ENGEL, S. M., SUREN, P., OIE, M. G., BIELE, G., REICHBORN-KJENNERUD, T., BRANTSAETER, A. L., HAUG, L. S., SABAREDZOVIC, A., AUYEUNG, B. & VILLANGER, G. D. 2021. Prenatal exposure to per- and polyfluoroalkyl substances (PFAS) and associations with attention-deficit/hyperactivity disorder and autism spectrum disorder in children. Environmental Research, 202.
SMIT, L. A., LENTERS, V., HOYER, B. B., LINDH, C. H., PEDERSEN, H. S., LIERMONTOVA, I., JONSSON, B. A., PIERSMA, A. H., BONDE, J. P., TOFT, G., VERMEULEN, R. & HEEDERIK, D. 2015. Prenatal exposure to environmental chemical contaminants and asthma and eczema in school-age children. Allergy, 70, 653-60.
SOLOMON, S. 1999. Stratospheric ozone depletion: A review of concepts and history. Reviews of Geophysics, 37, 275-316.
SONG, P., LI, D., WANG, X. & ZHONG, X. 2018. Effects of perfluorooctanoic acid exposure during pregnancy on the reproduction and development of male offspring mice. Andrologia, 50, e13059.
SOUZA, M. C. O., SARAIVA, M. C. P., HONDA, M., BARBIERI, M. A., BETTIOL, H., BARBOSA, F. & KANNAN, K. 2020. Exposure to per- and polyfluorinated alkyl substances in pregnant Brazilian women and its association with fetal growth. Environmental Research, 187, 109585.
SPRATLEN, M. J., PERERA, F. P., LEDERMAN, S. A., ROBINSON, M., KANNAN, K., HERBSTMAN, J. & TRASANDE, L. 2020. The Association Between Perfluoroalkyl Substances and Lipids in Cord Blood. Journal of Clinical Endocrinology & Metabolism, 105, 01.
STALTER, D., O'MALLEY, E., VON GUNTEN, U. & ESCHER, B. I. 2020. Mixture effects of drinking water disinfection by-products: implications for risk assessment.
P.O. Box 400, FI-00121 Helsinki, Finland | Tel. +358 9 686180 | echa.europa.eu
470
Environmental Science-Water Research & Technology, 6, 2341-2351.
STARLING, A. P., ADGATE, J. L., HAMMAN, R. F., KECHRIS, K., CALAFAT, A. M. & DABELEA, D. 2019. Prenatal exposure to per- and polyfluoroalkyl substances and infant growth and adiposity: the Healthy Start Study. Environment International, 131, 104983.
STATE OF QUEENSLAND 2016. Environmental Management of Firefighting Foam Policy Explanatory Notes - Revision 2; retreived from https://environment.des.qld.gov.au/__data/assets/pdf_file/0022/89140/firefighting-foam-policy-notes.pdf.
STEIN, C. R., MCGOVERN, K. J., PAJAK, A. M., MAGLIONE, P. J. & WOLFF, M. S. 2016. Perfluoroalkyl and polyfluoroalkyl substances and indicators of immune function in children aged 12-19 y: National Health and Nutrition Examination Survey. Pediatr Res, 79, 348-57.
STEMMLER, I. & LAMMEL, G. 2010. Pathways of PFOA to the Arctic: variabilities and contributions of oceanic currents and atmospheric transport and chemistry sources. Atmos. Chem. Phys., 10, 9965.
STEVENSON, C. N., MANUS-SPENCER, L. A., LUCKENBACH, T., LUTHY, R. G. & EPEL, D. 2006. New perspectives on perfluorochemical ecotoxicology: inhibition and induction of an efflux transporter in the marine mussel, Mytilus californianus. Environ Sci Technol, 40, 5580-5585.
STRØM, E. & ALEXANDERSEN, O. 1990. [Pulmonary damage caused by ski waxing]. Tidsskr Nor Laegeforen, 110, 3614-6.
SU, M., LIANG, X. L., XU, X. X., WU, X. M. & YANG, B. 2019. Hepatoprotective benefits of vitamin C against perfluorooctane sulfonate-induced liver damage in mice through suppressing inflammatory reaction and ER stress. Environmental Toxicology and Pharmacology, 65, 60-65.
SUO, C., FAN, Z., ZHOU, L. & QIU, J. 2017. Perfluorooctane sulfonate affects intestinal immunity against bacterial infection. Sci Rep, 7, 5166.
TAKAHASHI, M., ISHIDA, S., HIRATA-KOIZUMI, M., ONO, A. & HIROSE, A. 2014. Repeated dose and reproductive/developmental toxicity of perfluoroundecanoic acid in rats. J Toxicol Sci, 39, 97-108.
TANIYASU, S., YAMASHITA, N., YAMAZAKI, E., PETRICK, G. & KANNAN, K. 2013. The environmental photolysis of perfluorooctanesulfonate, perfluorooctanoate, and related fluorochemicals. Chemosphere, 90, 1686-1692.
TERC 2002. XDE-007: Limited Pharmacokinetics and Metabolism of 14C-Labelled XDE-007 Following a Single Oral Administration in Fischer 344 Rats. Toxicology & Environmental Research and Consulting, The Dow Chemical Company, Midland, Michigan 48674.
TERC 2003. XDE-007: Pharmacokinetics and Metabolism in Fischer 344 Rats (Part A). Toxicology & Environmental Research and Consulting, The Dow Chemical Company, Midland, Michigan 48674.
TERC 2004. XDE-007: Pharmacokinetics and metabolism in Fischer 344 rats (Part B). Toxicology & Environmental Research and Consulting, The Dow Chemical Company, Midland, Michigan 48674.
TERC 2005. XDE-007: Mechanistic Study to Evaluate Possible Cause of Toxicity Differences

P.O. Box 400, FI-00121 Helsinki, Finland | Tel. +358 9 686180 | echa.europa.eu
471
Among Species. Toxicology & Environmental Research and Consulting, The Dow Chemical Company, Midland, Michigan 48674.
THOMSEN, M. L., HENRIKSEN, L. S., TINGGAARD, J., NIELSEN, F., JENSEN, T. K. & MAIN, K. M. 2021. Associations between exposure to perfluoroalkyl substances and body fat evaluated by DXA and MRI in 109 adolescent boys. Environmental Health: A Global Access Science Source, 20, 73.
TIAN, Y., MIAO, M., JI, H., ZHANG, X., CHEN, A., WANG, Z., YUAN, W. & LIANG, H. 2021. Prenatal exposure to perfluoroalkyl substances and cord plasma lipid concentrations. Environmental Pollution, 268, 115426.
TIAN, Y., YAO, Y., CHANG, S., ZHAO, Z., ZHAO, Y., YUAN, X., WU, F. & SUN, H. 2018. Occurrence and Phase Distribution of Neutral and Ionizable Per- and Polyfluoroalkyl Substances (PFASs) in the Atmosphere and Plant Leaves around Landfills: A Case Study in Tianjin, China. Environ. Sci. Technol., 52, 1301.
TIMMERMANN, C. A. G., JENSEN, K. J., NIELSEN, F., BUDTZ-JORGENSEN, E., VAN DER KLIS, F., BENN, C. S., GRANDJEAN, P. & FISKER, A. B. 2020. Serum Perfluoroalkyl Substances, Vaccine Responses, and Morbidity in a Cohort of Guinea-Bissau Children. Environmental Health Perspectives, 128, 87002.
TIMMERMANN, C. A. G., PEDERSEN, H. S., WEIHE, P., BJERREGAARD, P., NIELSEN, F., HEILMANN, C. & GRANDJEAN, P. 2021. Concentrations of tetanus and diphtheria antibodies in vaccinated Greenlandic children aged 7-12 years exposed to marine pollutants, a cross sectional study. Environmental Research, 203, 111712.
TNO 2006. Sub-acute (2 week) inhalation toxicity study HFO-1234ze in rats. TNO.
TNO N/A. N/A (HDC-365mfc-90-d-inhalation-rat). TNO Civo Institutes 3700 AJ Zeist
TOXICOLOGY CENTRE S.P.A. 2011. cC6O4 4 week oral toxicity study in rats followed by a 4 week recovery period.
TRISKELION 2016. Inhalation prenatal developmental toxicity study with HFO-1336mzz-E in rats. Triskelion, P.O. Box 844, 3700 AV Zeist, The Netherlands.
TRISKELION 2017. Combined repeated dose inhalation toxicity study and reproduction/developmental toxicity screening test in rats with MOVE 3. Triskelion B.V.
TRISKELION 2019a. Inhalation extended one generation reproduction toxicity study with hexafluoropropene (hexafluoropropylene) (HFP) in rats Triskelion B.V., Utrechtseweg 48, 3704 HE Zeist, The Netherlands
TRISKELION 2019b. Sub-chronic (13-week) oral gavage study including a recovery study with MTDID 42916 in rats. Testing facility: Triskelion B.V. Utrechtseweg 48, 3704 HE Zeist P.O. Box 844, 3700 Zeist The Netherlands; Report no.: 21160/02; Study sponsor: 3M Company; Study no.: 18-041; Report date: 2019-02-19.
TROWBRIDGE, J., GERONA, R. R., LIN, T., RUDEL, R. A., BESSONNEAU, V., BUREN, H. & MORELLO-FROSCH, R. 2020. Exposure to perfluoroalkyl substances in a cohort of women firefighters and office workers in San Francisco. Environmental science & technology, 54, 3363-3374.
TSAI, M. S., CHANG, S. H., KUO, W. H., KUO, C. H., LI, S. Y., WANG, M. Y., CHANG, D. Y., LU, Y. S., HUANG, C. S., CHENG, A. L., LIN, C. H. & CHEN, P. C. 2020. A case-control study of perfluoroalkyl substances and the risk of breast cancer in Taiwanese

P.O. Box 400, FI-00121 Helsinki, Finland | Tel. +358 9 686180 | echa.europa.eu
472
women. Environment International, 142, 105850.
TUCKER, D. K., MACON, M. B., STRYNAR, M. J., DAGNINO, S., ANDERSEN, E. & FENTON, S. E. 2015. The mammary gland is a sensitive pubertal target in CD-1 and C57Bl/6 mice following perinatal perfluorooctanoic acid (PFOA) exposure. Reproductive Toxicology, 54, 26-36.
TVEIT, A., RUSCH, G. M., MUIJSER, H. & TEGELENBOSCH-SCHOUTEN, M. M. 2013. The acute, developmental, genetic and inhalation toxicology of 2,3,3,3-tetrafluoropropene (HFO-1234yf). Drug Chem Toxicol, 36, 412-20.
UK FIA 2021. Comment #831 on the SEAC draft opinion on the PFHxA restriction, available in ORCOM Part 1 at https://echa.europa.eu/registry-of-restriction-intentions/-/dislist/details/0b0236e18323a25d.
ULHAQ, M., CARLSSON, G., ORN, S. & NORRGREN, L. 2013. Comparison of developmental toxicity of seven perfluoroalkyl acids to zebrafish embryos. Environ Toxicol Pharmacol, 36, 423-6.
UNECE 2019. Safety guidelines and good practices for the management and retention of firefighting water; retreived from https://unece.org/sites/default/files/2020-12/ece_mp.wat_58_ENG.pdf.
UNNAMED 2020. Comment #3046 to the Annex XV restriction report , available in “RCOM Part 3” at https://echa.europa.eu/registry-of-restriction-intentions/-/dislist/details/0b0236e18323a25d.
US-EPA 2020. Per- and Polyfluoroalkyl Substances (PFAS): Incineration to Manage PFAS Waste Streams.
VERSIEREN, L., EVERS, S., DE SCHAMPHELAERE, K., BLUST, R. & SMOLDERS, E. 2016. Mixture toxicity and interactions of copper, nickel, cadmium, and zinc to barley at low effect levels: Something from nothing? Environmental Toxicology and Chemistry, 35, 2483-2492.
VETVICKA, V. & VETVICKOVA, J. 2013. Reversal of perfluorooctanesulfonate-induced immunotoxicity by a glucan-resveratrol-vitamin C combination. Oriental Pharmacy and Experimental Medicine, 13, 77-84.
VIERKE, L. 2014. Environmental Mobility of Short Chain Perfluoroalkyl Carboxylic Acids-Partition Behaviour and Resulting Environmental Concern. Universitätsbibliothek der Leuphana Universität Lüneburg.
VIERKE, L., BERGER, U. & COUSINS, I. T. 2013. Estimation of the acid dissociation constant of perfluoroalkyl carboxylic acids through an experimental investigation of their water-to-air transport. Environ Sci Technol, 47, 11032-9.
VISSCHER, P. T., CULBERTSON, C. W. & OREMLAND, R. S. 1994. Degradation of trifluoroacetate in oxic and anoxic sediments. Nature, 369, 729-731.
VONGPHACHAN, V., CASSONE, C. G., WU, D., CHIU, S., CRUMP, D. & KENNEDY, S. W. 2011a. Effects of perfluoroalkyl compounds on mRNA expression levels of thyroid hormone-responsive genes in primary cultures of avian neuronal cells. Toxicological Sciences, 120, 392-402.
VONGPHACHAN, V., CASSONE, C. G., WU, D., CHIU, S., CRUMP, D. & KENNEDY, S. W. 2011b. Effects of perfluoroalkyl compounds on mRNA expression levels of thyroid hormone-responsive genes in primary cultures of avian neuronal cells. Toxicol Sci,

P.O. Box 400, FI-00121 Helsinki, Finland | Tel. +358 9 686180 | echa.europa.eu
473
120, 392-402.
VUONG, A. M., WEBSTER, G. M., YOLTON, K., CALAFAT, A. M., MUCKLE, G., LANPHEAR, B. P. & CHEN, A. 2021a. Prenatal exposure to per- and polyfluoroalkyl substances (PFAS) and neurobehavior in US children through 8 years of age: The HOME study. Environ Res, 195, 110825.
VUONG, A. M., YOLTON, K., XIE, C., DIETRICH, K. N., BRAUN, J. M., WEBSTER, G. M., CALAFAT, A. M., LANPHEAR, B. P. & CHEN, A. 2019. Prenatal and childhood exposure to poly- and perfluoroalkyl substances (PFAS) and cognitive development in children at age 8 years. Environmental Research, 172, 242-248.
VUONG, A. M., YOLTON, K., XIE, C., DIETRICH, K. N., BRAUN, J. M., WEBSTER, G. M., CALAFAT, A. M., LANPHEAR, B. P. & CHEN, A. 2021b. Childhood exposure to per- and polyfluoroalkyl substances (PFAS) and neurobehavioral domains in children at age 8 years. Neurotoxicology & Teratology, 88, 107022.
WÅGBØ, A. M., CANGIALOSI, M. V., CICERO, N., LETCHER, R. J. & ARUKWE, A. 2012. Perfluorooctane Sulfonamide-Mediated Modulation of Hepatocellular Lipid Homeostasis and Oxidative Stress Responses in Atlantic Salmon Hepatocytes. Chemical Research in Toxicology, 25, 1253-1264.
WAN, H. T., ZHAO, Y. G., WEI, X., HUI, K. Y., GIESY, J. P. & WONG, C. K. 2012. PFOS-induced hepatic steatosis, the mechanistic actions on beta-oxidation and lipid transport. Biochim Biophys Acta, 1820, 1092-101.
WANG, B., FU, J., GAO, K., LIU, Q., ZHUANG, L., ZHANG, G., LONG, M., NA, J., REN, M., WANG, A., LIANG, R., SHEN, G., LI, Z. & LU, Q. 2021. Early pregnancy loss: DoPer- and polyfluoroalkyl substances matter? Environment International, 157, 106837.
WANG, C., ZHANG, Y., DENG, M., WANG, X., TU, W., FU, Z. & JIN, Y. 2019a. Bioaccumulation in the gut and liver causes gut barrier dysfunction and hepatic metabolism disorder in mice after exposure to low doses of OBS. Environ Int, 129, 279-290.
WANG, I. J., HSIEH, W. S., CHEN, C. Y., FLETCHER, T., LIEN, G. W., CHIANG, H. L., CHIANG, C. F., WU, T. N. & CHEN, P. C. 2011a. The effect of prenatal perfluorinated chemicals exposures on pediatric atopy. Environ Res, 111, 785-91.
WANG, J., PAN, Y., CUI, Q., YAO, B., WANG, J. & DAI, J. 2018. Penetration of PFASs Across the Blood Cerebrospinal Fluid Barrier and Its Determinants in Humans. Environ Sci Technol, 52, 13553-13561.
WANG, J. S., WANG, X. Y., SHENG, N., ZHOU, X. J., CUI, R. N., ZHANG, H. X. & DAI, J. Y. 2017a. RNA-sequencing analysis reveals the hepatotoxic mechanism of perfluoroalkyl alternatives, HFPO2 and HFPO4, following exposure in mice. Journal of Applied Toxicology, 37, 436-444.
WANG, S., HUANG, J., YANG, Y., HUI, Y., GE, Y., LARSSEN, T., YU, G., DENG, S., WANG, B. & HARMAN, C. 2013. First report of a Chinese PFOS alternative overlooked for 30 years: its toxicity, persistence, and presence in the environment. Environ Sci Technol, 47, 10163-70.
WANG, W., RHODES, G., GE, J., YU, X. & LI, H. 2020a. Uptake and accumulation of per- and polyfluoroalkyl substances in plants. Chemosphere, 261.
WANG, W., RHODES, G., GE, J., YU, X. & LI, H. 2020b. Uptake and accumulation of per- and polyfluoroalkyl substances in plants. Chemosphere, 261, 127584.

P.O. Box 400, FI-00121 Helsinki, Finland | Tel. +358 9 686180 | echa.europa.eu
474
WANG, X., KONG, B., HE, B., WEI, L., ZHU, J., JIN, Y., SHAN, Y., WANG, W., PAN, C. & FU, Z. 2019b. 8:2 Fluorotelomer alcohol causes immunotoxicity and liver injury in adult male C57BL/6 mice. Environ Toxicol, 34, 141-149.
WANG, Y., CHANG, W., WANG, L., ZHANG, Y., ZHANG, Y., WANG, M., WANG, Y. & LI, P. 2019c. A review of sources, multimedia distribution and health risks of novel fluorinated alternatives. Ecotoxicology and Environmental Safety, 182.
WANG, Y., NIU, J., ZHANG, L. & SHI, J. 2014. Toxicity assessment of perfluorinated carboxylic acids (PFCAs) towards the rotifer Brachionus calyciflorus. Science of the Total Environment, 491-492, 266-270.
WANG, Z., COUSINS, I. T., BERGER, U., HUNGERBÜHLER, K. & SCHERINGER, M. 2016. Comparative assessment of the environmental hazards of and exposure to perfluoroalkyl phosphonic and phosphinic acids (PFPAs and PFPiAs): current knowledge, gaps, challenges and research needs. Environment international, 89, 235-247.
WANG, Z., COUSINS, I. T. & SCHERINGER, M. 2015a. Comment on “The environmental photolysis of perfluorooctanesulfonate, perfluorooctanoate, and related fluorochemicals”. Chemosphere, 122, 301-303.
WANG, Z., COUSINS, I. T., SCHERINGER, M. & HUNGERBUEHLER, K. 2015b. Hazard assessment of fluorinated alternatives to long-chain perfluoroalkyl acids (PFAAs) and their precursors: status quo, ongoing challenges and possible solutions. Environ Int, 75, 172-9.
WANG, Z., DEWITT, J. C., HIGGINS, C. P. & COUSINS, I. T. 2017b. A never-ending story of per-and polyfluoroalkyl substances (PFASs)? : ACS Publications.
WANG, Z., MACLEOD, M., COUSINS, I. T., SCHERINGER, M. & HUNGERBÜHLER, K. 2011b. Using COSMOtherm to predict physicochemical properties of poly- and perfluorinated alkyl substances (PFASs). Environmental Chemistry, 8, 389-398.
WANG, Z., SHI, R., DING, G., YAO, Q., PAN, C., GAO, Y. & TIAN, Y. 2022. Association between maternal serum concentration of perfluoroalkyl substances (PFASs) at delivery and acute infectious diseases in infancy. Chemosphere, 289, 133235.
WANIA, F. 2007. A global mass balance analysis of the source of perfluorocarboxylic acids in the Arctic Ocean. Environ. Sci. Technol., 41, 4529.
WASHINGTON, J. W., RANKIN, K., LIBELO, E. L., LYNCH, D. G. & CYTERSKI, M. 2019. Determining global background soil PFAS loads and the fluorotelomer-based polymer degradation rates that can account for these loads. Science of the Total Environment, 651, 2444-2449.
WATKINS, A. M., WOOD, C. R., LIN, M. T. & ABBOTT, B. D. 2015. The effects of perfluorinated chemicals on adipocyte differentiation in vitro. Molecular and Cellular Endocrinology, 400, 90-101.
WEATHERLY, L. M., SHANE, H. L., LUKOMSKA, E., BAUR, R. & ANDERSON, S. E. 2021. Systemic toxicity induced by topical application of heptafluorobutyric acid (PFBA) in a murine model. Food and Chemical Toxicology, 156.
WEISS, J. M., ANDERSSON, P. L., LAMOREE, M. H., LEONARDS, P. E., VAN LEEUWEN, S. P. & HAMERS, T. 2009a. Competitive binding of poly- and perfluorinated compounds to the thyroid hormone transport protein transthyretin. Toxicol Sci, 109, 206-16.

P.O. Box 400, FI-00121 Helsinki, Finland | Tel. +358 9 686180 | echa.europa.eu
475
WEISS, J. M., ANDERSSON, P. L., LAMOREE, M. H., LEONARDS, P. E. G., VAN LEEUWEN, S. P. J. & HAMERS, T. 2009b. Competitive Binding of Poly- and Perfluorinated Compounds to the Thyroid Hormone Transport Protein Transthyretin. Toxicological Sciences, 109, 206-216.
WEN, B., LI, L., ZHANG, H., MA, Y., SHAN, X. Q. & ZHANG, S. 2014. Field study on the uptake and translocation of perfluoroalkyl acids (PFAAs) by wheat (Triticum aestivum L.) grown in biosolids-amended soils. Environ Pollut, 184, 547-54.
WEN, H. J., WANG, S. L., CHUANG, Y. C., CHEN, P. C. & GUO, Y. L. 2019. Prenatal perfluorooctanoic acid exposure is associated with early onset atopic dermatitis in 5-year-old children. Chemosphere, 231, 25-31.
WFVD 2020. Comment #3158 to the Annex XV report on PFHxA, retreived from RCOM Part 2 available at https://echa.europa.eu/registry-of-restriction-intentions/-/dislist/details/0b0236e18323a25d.
WHITE, S. S., STANKO, J. P., KATO, K., CALAFAT, A. M., HINES, E. P. & FENTON, S. E. 2011. Gestational and chronic low-dose PFOA exposures and mammary gland growth and differentiation in three generations of CD-1 mice. Environ Health Perspect, 119, 1070-6.
WHO 2016. Keeping our water clean: the case of water contamination in the Veneto Region, Italy, 2016, retreived from https://www.euro.who.int/__data/assets/pdf_file/0018/340704/FINAL_pfas-report-20170530-h1200.pdf.
WIELOGORSKA, E., ELLIOTT, C. T., DANAHER, M. & CONNOLLY, L. 2015. Endocrine disruptor activity of multiple environmental food chain contaminants. Toxicol In Vitro, 29, 211-20.
WIELOGÓRSKA, E., ELLIOTT, C. T., DANAHER, M. & CONNOLLY, L. 2015. Endocrine disruptor activity of multiple environmental food chain contaminants. Toxicology in Vitro, 29, 211-220.
WIKSTROM, S., LIN, P. I., LINDH, C. H., SHU, H. & BORNEHAG, C. G. 2020. Maternal serum levels of perfluoroalkyl substances in early pregnancy and offspring birth weight. Pediatric Research, 87, 1093-1099.
WIL 2005. A combined 28-day repeated dose oral toxicity study with the reproduction/developmental toxicity screening test of perfluorohexanoic acid and 1H, 1H, 2H, 2H tridecafluoro-1-octanol in rats, with recovery. In: WIL-534001, W. R. L. S. N. (ed.).
WIL 2008a. A 28-day Oral (Gavage) Toxicity Study of H-28397 in Mice with a 28-day Recovery. WIL Research Laboratories, LLC,Ashland, OH.
WIL 2008b. A 28-day Oral (Gavage) Toxicity Study of H-28397 in Rats with a 28-day Recovery. WIL Research Laboratories, LLC,Ashland, OH.
WIL 2009. A 90-Day Oral (Gavage) Toxicity Study of H-28548 in Rats with a 28-Day Recovery. WIL Research Laboratories, LLC,Ashland, OH, 2008.
WIL 2010a. An Oral (Gavage) Prenatal Developmental Toxicity Study of H-28548 in Rats. WIL Research Laboratories, LLC,Ashland, OH, 2008.
WIL 2010b. An Oral (Gavage) Reproduction/Developmental Toxicity Screening Study of H-28548 in Mice WIL Research Laboratories, LLC,Ashland, OH, 2008.

P.O. Box 400, FI-00121 Helsinki, Finland | Tel. +358 9 686180 | echa.europa.eu
476
WIL 2011a. H-28548: Follow-Up Developmental Toxicity Study in Rats. DuPont Haskell Global Centers for Health & Environmental Sciences.
WIL 2011b. An Oral (Gavage) Reproduction/Developmental Toxicity Screening Study of EEA-NH4 in Rats. WIL Research Laboratories, LLC,Ashland, OH, 2008.
WIL 2014. A Whole-Body Inhalation Prenatal Developmental Toxicity Study of H-30380 in Rabbits. WIL Research OH., U.S.A. .
WIL 2016a. A 13-Week Inhalation Toxicity Study of Trifluoro(trifluoromethoxy)ethylene (PMVE) in Sprague Dawley Rats.
WIL 2016b. Inhalation Toxicity Study of Trifluoro(trifluoromethoxy)ethylene (PMVE) in Sprague Dawley Rats. WIL Research Laboratories, LLC,Ashland, OH, 2008.
WILKENFELD RM. 1981. The effects of 2,2,2-Trifluoroethanol on the testis of the Rat. Department of Radiation Biology and Biophysics, University of Rochester, school of Medicine and Dentistry, New-York, USA.
WILLSON CONSULTING 2020. Two-tier fire protection: Are we facing a false sense of security? in International Airport Review - Issue 6 December 2020, retreived from https://www.internationalairportreview.com/article/146720/two-tier-fire-protection-are-we-facing-a-false-sense-of-security/.
WILLSON CONSULTING 2021a. Factors to consider before any C8 firefighting foam transition - Asia Pacific Fire July 2021 issue pp. 56-58, retreived from https://edition.pagesuite.com/html5/reader/production/default.aspx?pubname=&edid=78a5a249-2c43-46d4-9db4-7d5d07f255d0.
WILLSON CONSULTING 2021b. Submission on Amending Annex IV and V of EU Regulation 2019/1021 on Persistent Organic Pollutants (POPs) Waste (specifically PFOA). Personal communication, unpublished.
WOLF, C. J., SCHMID, J. E., LAU, C. & ABBOTT, B. D. 2012. Activation of mouse and human peroxisome proliferator-activated receptor-alpha (PPAR alpha) by perfluoroalkyl acids (PFAAs): Further investigation of C4-C12 compounds. Reproductive Toxicology, 33, 546-551.
WOLF, C. J., ZEHR, R. D., SCHMID, J. E., LAU, C. & ABBOTT, B. D. 2010. Developmental effects of perfluorononanoic Acid in the mouse are dependent on peroxisome proliferator-activated receptor-alpha. PPAR research, 2010, 282896.
WONG, F., SHOEIB, M., KATSOYIANNIS, A., ECKHARDT, S., STOHL, A., BOHLIN-NIZZETTO, P., LI, H., FELLIN, P., SU, Y. & HUNG, H. 2018. Assessing temporal trends and source regions of per- and polyfluoroalkyl substances (PFASs) in air under the Arctic Monitoring and Assessment Programme (AMAP). Atmospheric Environment, 172, 65-73.
WOOD 2020. The use of PFAS and fluorine-free alternatives in textiles, upholstery, carpets, leather and apparel. Wednesday 15th January 2020 at the European Commission, Brussels: Wood Environment & Infrastructure Solutions UK Limited,.
WOOD, RAMBOLL & COWI 2020. The use of PFAS and fluorine-free alternatives in fire-fighting foams.
WOOD E&I SOLUTIONS 2017. in Wood, Ramboll and COWI (2020).
WOODLIEF, T., VANCE, S., HU, Q. & DEWITT, J. 2021. Immunotoxicity of Per- and

P.O. Box 400, FI-00121 Helsinki, Finland | Tel. +358 9 686180 | echa.europa.eu
477
Polyfluoroalkyl Substances: Insights into Short-Chain PFAS Exposure. Toxics, 9.
WU, X. M., XIE, G. J., XU, X. X., WU, W. & YANG, B. 2018. Adverse bioeffect of perfluorooctanoic acid on liver metabolic function in mice. Environmental Science and Pollution Research, 25, 4787-4793.
XIAO, C., GRANDJEAN, P., VALVI, D., NIELSEN, F., JENSEN, T. K., WEIHE, P. & OULHOTE, Y. 2020. Associations of Exposure to Perfluoroalkyl Substances With Thyroid Hormone Concentrations and Birth Size. Journal of Clinical Endocrinology & Metabolism, 105, 01.
XIAO, F. 2017. Emerging poly- and perfluoroalkyl substances in the aquatic environment: A review of current literature. Water Research, 124, 482-495.
XIE, W., WU, Q., KANIA-KORWEL, I., THARAPPEL, J. C., TELU, S., COLEMAN, M. C., GLAUERT, H. P., KANNAN, K., MARIAPPAN, S. V., SPITZ, D. R., WEYDERT, J. & LEHMLER, H. J. 2009. Subacute exposure to N-ethyl perfluorooctanesulfonamidoethanol results in the formation of perfluorooctanesulfonate and alters superoxide dismutase activity in female rats. Arch Toxicol, 83, 909-24.
XIE, Y., YANG, Q., NELSON, B. D. & DEPIERRE, J. W. 2003. The relationship between liver peroxisome proliferation and adipose tissue atrophy induced by peroxisome proliferator exposure and withdrawal in mice. Biochemical Pharmacology, 66, 749-756.
XU, H., ZHOU, Q., ZHANG, J., CHEN, X., ZHAO, H., LU, H., MA, B., WANG, Z., WU, C., YING, C., XIONG, Y., ZHOU, Z. & LI, X. 2020a. Exposure to elevated per- and polyfluoroalkyl substances in early pregnancy is related to increased risk of gestational diabetes mellitus: A nested case-control study in Shanghai, China. Environment International, 143, 105952.
XU, J., SHIMPI, P., ARMSTRONG, L., SALTER, D. & SLITT, A. L. 2016. PFOS induces adipogenesis and glucose uptake in association with activation of Nrf2 signaling pathway. Toxicol Appl Pharmacol, 290, 21-30.
XU, M., LIU, G., LI, M., HUO, M., ZONG, W. & LIU, R. 2020b. Probing the Cell Apoptosis Pathway Induced by Perfluorooctanoic Acid and Perfluorooctane Sulfonate at the Subcellular and Molecular Levels. Journal of Agricultural and Food Chemistry, 68, 633-641.
YAHIA, D., EL-NASSER, M. A., ABEDEL-LATIF, M., TSUKUBA, C., YOSHIDA, M., SATO, I. & TSUDA, S. 2010. Effects of perfluorooctanoic acid (PFOA) exposure to pregnant mice on reproduction. J Toxicol Sci, 35, 527-33.
YAHIA, D., TSUKUBA, C., YOSHIDA, M., SATO, I. & TSUDA, S. 2008. Neonatal death of mice treated with perfluorooctane sulfonate. J Toxicol Sci, 33, 219-26.
YAMASHITA, N., YEUNG, L. W. Y., TANIYASU, S., KWOK, K. Y., PETRICK, G., GAMO, T., GURUGE, K. S., LAM, P. K. S. & LOGANATHAN, B. G. 2011. Global distribution of PFOS and related chemicals. Global Contamination Trends of Persistent Organic Chemicals.
YANG, J., WANG, H., DU, H., FANG, H., HAN, M., XU, L., LIU, S., YI, J., CHEN, Y., JIANG, Q. & HE, G. 2021. Serum perfluoroalkyl substances in relation to lipid metabolism in Chinese pregnant women. Chemosphere, 273, 128566.
YANG, Q., GUO, X., CHEN, Y., ZHANG, W., REN, J., WANG, J., TANG, N. & GAO, A. 2020.

P.O. Box 400, FI-00121 Helsinki, Finland | Tel. +358 9 686180 | echa.europa.eu
478
Blood levels of perfluoroalkyl substances (PFASs), elements and their associations with metabolic syndrome (MetS) in Chinese male adults mediated by metabolic-related risk factors. Science of the Total Environment, 742, 140595.
YAO, X., SHA, S., WANG, Y., SUN, X., CAO, J., KANG, J., JIANG, L., CHEN, M. & MA, Y. 2016. Perfluorooctane Sulfonate Induces Autophagy-Dependent Apoptosis through Spinster 1-Mediated lysosomal-Mitochondrial Axis and Impaired Mitophagy. Toxicol Sci, 153, 198-211.
YE, W. L., CHEN, Z. X., XIE, Y. Q., KONG, M. L., LI, Q. Q., YU, S., CHU, C., DONG, G. H. & ZENG, X. W. 2021. Associations between serum isomers of perfluoroalkyl acids and metabolic syndrome in adults: Isomers of C8 Health Project in China. Environmental Research, 196, 110430.
YEUNG, L. W. Y., DASSUNCAO, C., MABURY, S., SUNDERLAND, E. M., ZHANG, X. & LOHMANN, R. 2017. Vertical profiles, sources, and transport of PFASs in the Arctic Ocean. Environ. Sci. Technol., 51, 6735.
YI, L., CHAI, L., XIE, Y., PENG, Q. & PENG, Q. 2016. Isolation, identification, and degradation performance of a PFOA-degrading strain. Genet. Mol. Res, 15, 235-246.
YOO, H., WASHINGTON, J. W., JENKINS, T. M. & ELLINGTON, J. J. 2011. Quantitative determination of perfluorochemicals and fluorotelomer alcohols in plants from biosolid-amended fields using LC/MS/MS and GC/MS. Environ Sci Technol, 45, 7985-90.
YU, G., JIN, M., HUANG, Y., AIMUZI, R., ZHENG, T., NIAN, M., TIAN, Y., WANG, W., LUO, Z., SHEN, L., WANG, X., DU, Q., XU, W., ZHANG, J. & SHANGHAI BIRTH COHORT, S. 2021a. Environmental exposure to perfluoroalkyl substances in early pregnancy, maternal glucose homeostasis and the risk of gestational diabetes: A prospective cohort study. Environment International, 156, 106621.
YU, G., LUO, F., NIAN, M., LI, S., LIU, B., FENG, L. & ZHANG, J. 2021b. Exposure to Perfluoroalkyl Substances During Pregnancy and Fetal BDNF Level: A Prospective Cohort Study. Frontiers in Endocrinology, 12, 653095.
YU, S., FENG, W. R., LIANG, Z. M., ZENG, X. Y., BLOOM, M. S., HU, G. C., ZHOU, Y., OU, Y. Q., CHU, C., LI, Q. Q., YU, Y., ZENG, X. W. & DONG, G. H. 2021c. Perfluorooctane sulfonate alternatives and metabolic syndrome in adults: New evidence from the Isomers of C8 Health Project in China. Environmental Pollution, 283, 117078.
ZAPP, J. A., JR. 1962. Toxic and health effects of plastics and resins. Arch Environ Health, 4, 335-46.
ZARE JEDDI, M., DALLA ZUANNA, T., BARBIERI, G., FABRICIO, A. S. C., DAPRA, F., FLETCHER, T., RUSSO, F., PITTER, G. & CANOVA, C. 2021. Associations of Perfluoroalkyl Substances with Prevalence of Metabolic Syndrome in Highly Exposed Young Adult Community Residents-A Cross-Sectional Study in Veneto Region, Italy. International Journal of Environmental Research & Public Health [Electronic Resource], 18, 29.
ZEESHAN, M., ZHANG, Y. T., YU, S., HUANG, W. Z., ZHOU, Y., VINOTHKUMAR, R., CHU, C., LI, Q. Q., WU, Q. Z., YE, W. L., ZHOU, P., DONG, P., ZENG, X. W., HU, L. W., YANG, B. Y., SHEN, X., ZHOU, Y. & DONG, G. H. 2021. Exposure to isomers of per- and polyfluoroalkyl substances increases the risk of diabetes and impairs glucose-homeostasis in Chinese adults: Isomers of C8 health project. Chemosphere, 278, 130486.

P.O. Box 400, FI-00121 Helsinki, Finland | Tel. +358 9 686180 | echa.europa.eu
479
ZENECA 1993. HFC 134a: 2 year inhalation study in the rat. Zeneca Central Toxicology Laboratory, Alderley Park, Macclesfield, Cheshire, UK
ZENG, X., CHEN, Q., ZHANG, X., LI, H., LIU, Q., LI, C., MA, M., ZHANG, J., ZHANG, W., ZHANG, J. & HUANG, L. 2019a. Association between prenatal exposure to perfluoroalkyl substances and asthma-related diseases in preschool children. Environmental Science & Pollution Research, 26, 29639-29648.
ZENG, X. W., LI, Q. Q., CHU, C., YE, W. L., YU, S., MA, H., ZENG, X. Y., ZHOU, Y., YU, H. Y., HU, L. W., YANG, B. Y. & DONG, G. H. 2020. Alternatives of perfluoroalkyl acids and hepatitis B virus surface antibody in adults: Isomers of C8 Health Project in China. Environmental Pollution, 259, 113857.
ZENG, X. W., LODGE, C. J., DHARMAGE, S. C., BLOOM, M. S., YU, Y., YANG, M., CHU, C., LI, Q. Q., HU, L. W., LIU, K. K., YANG, B. Y. & DONG, G. H. 2019b. Isomers of per- and polyfluoroalkyl substances and uric acid in adults: Isomers of C8 Health Project in China. Environment International, 133, 105160.
ZENG, Z. J., NGAI, S., WANG, Q. H., LIANG, W. T. & HUO, X. 2021. Early-life exposure to widespread environmental toxicants and children's health risks: A focus on the post-vaccination antibody potency or immunoglobulin levels. Science of the Total Environment, 781, 14.
ZHANG, C., SUNDARAM, R., MAISOG, J., CALAFAT, A. M., BARR, D. B. & BUCK LOUIS, G. M. 2015. A prospective study of prepregnancy serum concentrations of perfluorochemicals and the risk of gestational diabetes. Fertility & Sterility, 103, 184-9.
ZHANG, D. Q., WANG, M., HE, Q., NIU, X. & LIANG, Y. 2020a. Distribution of perfluoroalkyl substances (PFASs) in aquatic plant-based systems: From soil adsorption and plant uptake to effects on microbial community. Environmental Pollution, 257.
ZHANG, D. Q., WANG, M., HE, Q., NIU, X. & LIANG, Y. 2020b. Distribution of perfluoroalkyl substances (PFASs) in aquatic plant-based systems: From soil adsorption and plant uptake to effects on microbial community. Environmental Pollution, 257, 113575.
ZHANG, D. Y., XU, X. L., RUAN, Q., SHEN, X. Y. & LU, Y. 2019a. Subchronic effects of perfluorooctane sulphonate on the testicular morphology and spermatogenesis in mice. Pakistan Journal of Zoology, 51, 2217-2223.
ZHANG, H., LU, H., CHEN, P., CHEN, X., SUN, C., GE, R. S., SU, Z. & YE, L. 2020c. Effects of gestational Perfluorooctane Sulfonate exposure on the developments of fetal and adult Leydig cells in F1 males. Environ Pollut, 262, 114241.
ZHANG, H., SHI, Z., LIU, Y., WEI, Y. & DAI, J. 2008. Lipid homeostasis and oxidative stress in the liver of male rats exposed to perfluorododecanoic acid. Toxicology and Applied Pharmacology, 227, 16-25.
ZHANG, H., ZHOU, X., SHENG, N., CUI, R., CUI, Q., GUO, H., GUO, Y., SUN, Y. & DAI, J. 2018a. Subchronic Hepatotoxicity Effects of 6:2 Chlorinated Polyfluorinated Ether Sulfonate (6:2 Cl-PFESA), a Novel Perfluorooctanesulfonate (PFOS) Alternative, on Adult Male Mice. Environmental Science and Technology, 52, 12809-12818.
ZHANG, J., BEGUM, A., BRÄNNSTRÖM, K., GRUNDSTRÖM, C., IAKOVLEVA, I., OLOFSSON, A., SAUER-ERIKSSON, A. E. & ANDERSSON, P. L. 2016a. Structure-Based Virtual Screening Protocol for in Silico Identification of Potential Thyroid Disrupting Chemicals Targeting Transthyretin. Environmental Science & Technology, 50, 11984-11993.

P.O. Box 400, FI-00121 Helsinki, Finland | Tel. +358 9 686180 | echa.europa.eu
480
ZHANG, L., KRISHNAN, P., EHRESMAN, D. J., SMITH, P. B., DUTTA, M., BAGLEY, B. D., CHANG, S. C., BUTENHOFF, J. L., PATTERSON, A. D. & PETERS, J. M. 2016b. Editor's Highlight: Perfluorooctane Sulfonate-Choline Ion Pair Formation: A Potential Mechanism Modulating Hepatic Steatosis and Oxidative Stress in Mice. Toxicol Sci, 153, 186-97.
ZHANG, L., REN, X.-M., WAN, B. & GUO, L.-H. 2014a. Structure-dependent binding and activation of perfluorinated compounds on human peroxisome proliferator-activated receptor γ. Toxicology and Applied Pharmacology, 279, 275-283.
ZHANG, L., REN, X. M., WAN, B. & GUO, L. H. 2014b. Structure-dependent binding and activation of perfluorinated compounds on human peroxisome proliferator-activated receptor γ. Toxicology and Applied Pharmacology, 279, 275-283.
ZHANG, L., SUN, H., WANG, Q., CHEN, H., YAO, Y., ZHAO, Z. & ALDER, A. C. 2019b. Uptake mechanisms of perfluoroalkyl acids with different carbon chain lengths (C2-C8) by wheat (Triticum acstivnm L.). Science of The Total Environment, 654, 19-27.
ZHANG, W., CAO, H. & LIANG, Y. 2021a. Plant uptake and soil fractionation of five ether-PFAS in plant-soil systems. Science of The Total Environment, 771, 144805.
ZHANG, W., CAO, H. & LIANG, Y. 2021b. Plant uptake and soil fractionation of five ether-PFAS in plant-soil systems. Science of the Total Environment, 771.
ZHANG, W., ZHANG, Y., TANIYASU, S., YEUNG, L. W. Y., LAM, P. K. S., WANG, J., LI, X., YAMASHITA, N. & DAI, J. 2013. Distribution and fate of perfluoroalkyl substances in municipal wastewater treatment plants in economically developed areas of China. Environmental Pollution, 176, 10-17.
ZHANG, Z., SONG, N., PENG, Y., FAN, Z., HAN, M., ZHAO, M., DONG, T. & LIU, S. 2018b. Evironmental pollutant perfluorodecanoic acid upregulates cIAP2 to suppress gastric cell senescence. Oncol Rep, 41, 981-988.
ZHAO, L., BIAN, J., ZHANG, Y., ZHU, L. & LIU, Z. 2014. Comparison of the sorption behaviors and mechanisms of perfluorosulfonates and perfluorocarboxylic acids on three kinds of clay minerals. Chemosphere, 114, 51-58.
ZHAO, L., ZHU, L., YANG, L., LIU, Z. & ZHANG, Y. 2012. Distribution and desorption of perfluorinated compounds in fractionated sediments. Chemosphere, 88, 1390-1397.
ZHAO, S., LIANG, T., ZHOU, T., LI, D., WANG, B., ZHAN, J. & LIU, L. 2018. Biotransformation and responses of antioxidant enzymes in hydroponically cultured soybean and pumpkin exposed to perfluorooctane sulfonamide (FOSA). Ecotoxicology and Environmental Safety, 161, 669-675.
ZHAO, S., LIANG, T., ZHU, L., YANG, L., LIU, T., FU, J., WANG, B., ZHAN, J. & LIU, L. 2019. Fate of 6:2 fluorotelomer sulfonic acid in pumpkin (Cucurbita maxima L.) based on hydroponic culture: Uptake, translocation and biotransformation. Environmental Pollution, 252, 804-812.
ZHENG, L., DONG, G. H., JIN, Y. H. & HE, Q. C. 2009. Immunotoxic changes associated with a 7-day oral exposure to perfluorooctanesulfonate (PFOS) in adult male C57BL/6 mice. Arch Toxicol, 83, 679-89.
ZHENG, L., DONG, G. H., ZHANG, Y. H., LIANG, Z. F., JIN, Y. H. & HE, Q. C. 2011. Type 1 and Type 2 cytokines imbalance in adult male C57BL/6 mice following a 7-day oral exposure to perfluorooctanesulfonate (PFOS). J Immunotoxicol, 8, 30-8.

P.O. Box 400, FI-00121 Helsinki, Finland | Tel. +358 9 686180 | echa.europa.eu
481
ZHOU, J., LI, M., LI, J., SHAO, Z., LIU, Y., WANG, T. & ZHU, L. 2020. Bioavailability and Bioaccumulation of 6:2 Fluorotelomer Sulfonate, 6:2 Chlorinated Polyfluoroalkyl Ether Sulfonates, and Perfluorophosphinates in a Soil–Plant System. Journal of Agricultural and Food Chemistry, 68, 4325-4334.
ZHOU, Q., DENG, S., YU, Q., ZHANG, Q., YU, G., HUANG, J. & HE, H. 2010. Sorption of perfluorooctane sulfonate on organo-montmorillonites. Chemosphere, 78, 688-694.
ZHOU, X., WANG, J., SHENG, N., CUI, R., DENG, Y. & DAI, J. 2018. Subchronic reproductive effects of 6:2 chlorinated polyfluorinated ether sulfonate (6:2 Cl-PFAES), an alternative to PFOS, on adult male mice. Journal of Hazardous Materials, 358, 256-264.
ZHOU, Y., ZHOU, Z., LIAN, Y., SUN, X., WU, Y., QIAO, L. & WANG, M. 2021. Source, transportation, bioaccumulation, distribution and food risk assessment of perfluorinated alkyl substances in vegetables: A review. Food Chemistry, 349, 129137.