EU Risk Assessment Report - ECHA
302
European Chemicals Bureau Assessment Report European Union Risk DINP PL-2 35 CA EC: S: 68515-48-0, 28553-12 271-090-9, 249-079-5 -0 Institute for Health and Consumer Protection European Chemicals Bureau Existing Substances 2 nd Priority List Volume: 35 European Union Risk Assessment Report CAS Nos: 68515-48-0 28553-12-0 EINECS Nos: 271-090-9 249-079-5 1,2-benzenedicarboxylic acid, di-C8-10- branched alkyl esters, C9-rich and di-“isononyl” phthalate (DINP) O O O O O O O O EUROPEAN COMMISSION JOINT RESEARCH CENTRE EUR 20784 EN
-
Upload
khangminh22 -
Category
Documents
-
view
2 -
download
0
Transcript of EU Risk Assessment Report - ECHA

European C
hemicals B
ureau
Assessm
ent Report
European Union R
isk D
INP
C
AEC
: S:68515-48-0, 28553-12271-090-9, 249-079-5 -0
Institute for Health and Consumer Protection
European Chemicals Bureau Existing Substances
2nd Priority List Volume: 35
European Union Risk Assessment Report
1,2-benzenedicarboxylic acid, di-C8-10-branched alkyl esters, C9-rich and
di-“isononyl” phthalate (DINP)
O
O
O
O
O
O
O
O
EUROPEAN COMMISSION
JOINT RESEARCH CENTRE
EUR 20784 EN
PL-2 35
EINECS Nos: 271-090-9 249-079-5
CAS Nos: 68515-48-028553-12-0


European Union Risk Assessment Report
1,2-BENZENEDICARBOXYLIC ACID, DI-C8-10-BRANCHED ALKYL ESTERS, C9-RICH
AND
DI-“ISONONYL” PHTHALATE
(DINP)
CAS Nos: 68515-48-0 and 28553-12-0
EINECS Nos: 271-090-9 and 249-079-5
RISK ASSESSMENT

LEGAL NOTICE Neither the European Commission nor any person
acting on behalf of the Commission is responsible for the use which might be made of the following information
A great deal of additional information on the European Union
is available on the Internet. It can be accessed through the Europa Server
(http://europa.eu.int).
Cataloguing data can be found at the end of this publication
Luxembourg: Office for Official Publications of the European Communities, 2003
© European Communities, 2003 Reproduction is authorised provided the source is acknowledged.
Printed in Italy

1,2-BENZENEDICARBOXYLIC ACID, DI-C8-10-BRANCHED ALKYL ESTERS, C9-RICH
AND
DI-“ISONONYL” PHTHALATE
(DINP)
CAS Nos: 68515-48-0 and 28553-12-0
EINECS Nos: 271-090-9 and 249-079-5
RISK ASSESSMENT
Final Report, 2003
France
The French rapporteur for the risk evaluation of 1,2-Benzenedicarboxylic acid, di-C8-10-branched alkyl esters, C9-rich and di-“isononyl” phthalate, is the Ministry of the Environment and the Ministry of Employment and Solidarity.
The scientific work on this report has been prepared by:
Institut National de Recherche et de Sécurité (INRS) Département Risques chimiques et biologiques 30, rue Olivier Noyer 75680 Paris Cedex 14 France
INERIS Direction des Risques Chroniques Parc Technologique ALATA - BP n° 2 60550 Verneuil-en-Halatte France
Centre Anti-poison de Lille 5, avenue Oscart Lambret 59037 Lille Cedex France

Date of Last Literature Search: 2001 Review of report by MS Technical Experts finalised: 2001 Final report: 2003

V
Foreword
We are pleased to present this Risk Assessment Report which is the result of in-depth work carried out by experts in one Member State, working in co-operation with their counterparts in the other Member States, the Commission Services, Industry and public interest groups. The Risk Assessment was carried out in accordance with Council Regulation (EEC) 793/931 on the evaluation and control of the risks of “existing” substances. “Existing” substances are chemical substances in use within the European Community before September 1981 and listed in the European Inventory of Existing Commercial Chemical Substances. Regulation 793/93 provides a systematic framework for the evaluation of the risks to human health and the environment of these substances if they are produced or imported into the Community in volumes above 10 tonnes per year. There are four overall stages in the Regulation for reducing the risks: data collection, priority setting, risk assessment and risk reduction. Data provided by Industry are used by Member States and the Commission services to determine the priority of the substances which need to be assessed. For each substance on a priority list, a Member State volunteers to act as “Rapporteur”, undertaking the in-depth Risk Assessment and recommending a strategy to limit the risks of exposure to the substance, if necessary. The methods for carrying out an in-depth Risk Assessment at Community level are laid down in Commission Regulation (EC) 1488/942, which is supported by a technical guidance document3. Normally, the “Rapporteur” and individual companies producing, importing and/or using the chemicals work closely together to develop a draft Risk Assessment Report, which is then presented at a Meeting of Member State technical experts for endorsement. The Risk Assessment Report is then peer-reviewed by the Scientific Committee on Toxicity, Ecotoxicity and the Environment (CSTEE) which gives its opinion to the European Commission on the quality of the risk assessment. If a Risk Assessment Report concludes that measures to reduce the risks of exposure to the substances are needed, beyond any measures which may already be in place, the next step in the process is for the “Rapporteur” to develop a proposal for a strategy to limit those risks. The Risk Assessment Report is also presented to the Organisation for Economic Co-operation and Development as a contribution to the Chapter 19, Agenda 21 goals for evaluating chemicals, agreed at the United Nations Conference on Environment and Development, held in Rio de Janeiro in 1992. This Risk Assessment improves our knowledge about the risks to human health and the environment from exposure to chemicals. We hope you will agree that the results of this in-depth study and intensive co-operation will make a worthwhile contribution to the Community objective of reducing the overall risks from exposure to chemicals.
1 O.J. No L 084, 05/04/199 p.0001 – 0075 2 O.J. No L 161, 29/06/1994 p. 0003 – 0011 3 Technical Guidance Document, Part I – V, ISBN 92-827-801 [1234]


VII
Explanatory note: 3 DINPs, one risk assessment report
There are 3 different DINPs. DINP 1 (CAS 68515-48-0) is manufactured by the “Polygas” process. DINP 2 (CAS 28553-12-0) is n-butene based. DINP 3 (also CAS 28553-12-0) is n- and iso-butene based (see Figure 1.1). Chemical structures consequently differ. Thus, these 3 DINPs could have different physico-chemical and toxicological properties, and should be dealt with separately. However it was not possible to separate for the following reasons:
Firstly, the manufacture of DINP 3 was stopped in 1995. A risk assessment for this substance is therefore not justified. Relevant data are however presented in this report when it helps to better understand some aspects of physico-chemical or toxicological properties.
Secondly, before 1995, the 3 DINPs have been submitted to different physico-chemical and toxicological tests, but detailed sample compositions were not always available and references sometimes vague (such as “DINP”) or provided only under coded references (e.g. MRD 94-996, R 1218), rarely traceable to well-defined samples. Even when a CAS number was indicated for the sample being tested, sample composition may not be warranted, since DINP 2 and DINP 3, although different, were attributed the same CAS number. In addition, some DINPs seem to have been produced by specific processes and may be still different although having the same CAS number (e.g. Hoechst's Genomoll 150, CAS 28553-12-0, which contains di-(3,5,5-trimethylhexyl)-phthalate as a main constituent; Hoechst (1973)).
Thirdly, a “pure” DINP sample is a rather complex mixture, and its physico-chemical properties may be more or less well characterised. Moreover, the 3 DINPs may share common constituents. They cannot be differentiated through their physico-chemical properties.
It is concluded that only one risk assessment report may usefully be presented. Proper identification of the sample being dealt with (mentioning, in decreasing order of preference: DINP 1, 2 or 3; CAS number; sample code; “DINP” or other denominations or attributes, as indicated in the report) has been made inasmuch as possible.


IX
0 OVERALL RESULTS OF THE RISK ASSESSMENT
CAS-Nos: 68515-48-0 and 28553-12-0 EINECS-Nos: 271-090-9 and 249-079-5 IUPAC name: 1,2-Benzenedicarboxilic acid, di-C8-10-branched alkyl esters, C9 rich
and di-“isononyl” phthalate
Environment
Conclusion (ii) There is at present no need for further information or testing or risk reduction measures beyond those which are being applied already.
This conclusion is reached for the aquatic compartment, the terrestrial compartment, the atmosphere, microorganisms in the sewage treatment plant as well as for secondary poisoning.
Human health
Human health (toxicity)
Workers
Conclusion (ii) There is at present no need for further information or testing or risk reduction measures beyond those which are being applied already.
Consumers
Conclusion (ii) There is at present no need for further information or testing or risk reduction measures beyond those which are being applied already.
Humans exposed via the environment
Conclusion (ii) There is at present no need for further information or testing or risk reduction measures beyond those which are being applied already.
Combined exposure
Conclusion (ii) There is at present no need for further information or testing or risk reduction measures beyond those which are being applied already.
Human health (risks from physico-chemical properties)
Conclusion (ii) There is at present no need for further information or testing or risk reduction measures beyond those which are being applied already.


1
CONTENTS
1 GENERAL SUBSTANCE INFORMATION................................................................................................ 9
1.1 IDENTIFICATION OF THE SUBSTANCES ..................................................................................... 9
1.2 PURITY/IMPURITIES, ADDITIVES.................................................................................................. 11
1.3 PHYSICO-CHEMICAL PROPERTIES .............................................................................................. 13 1.3.1 Physical state ................................................................................................................................. 13 1.3.2 Melting point ................................................................................................................................. 13 1.3.3 Boiling point .................................................................................................................................. 14 1.3.4 Density........................................................................................................................................... 14 1.3.5 Vapour pressure............................................................................................................................. 15 1.3.6 Surface tension .............................................................................................................................. 18 1.3.7 Water solubility ............................................................................................................................. 18 1.3.8 Henry’s law constant ..................................................................................................................... 21 1.3.9 Partition coefficient n-octanol/water ............................................................................................. 21 1.3.10 Flash point ..................................................................................................................................... 23 1.3.11 Auto flammability.......................................................................................................................... 23 1.3.12 Viscosity ........................................................................................................................................ 23 1.3.13 DINP type can not be warranted from physico-chemical properties ............................................. 24 1.3.14 Summary of physico-chemical properties ..................................................................................... 24
1.4 CLASSIFICATION ................................................................................................................................ 24
2 GENERAL INFORMATION ON EXPOSURE........................................................................................... 25
2.1 PRODUCTION PROCESS.................................................................................................................... 25
2.2 PRODUCTION, IMPORT, EXPORT AND CONSUMPTION VOLUMES .................................... 25
2.3 USES ........................................................................................................................................................ 26
3 ENVIRONMENT ............................................................................................................................................ 29
3.1 ENVIRONMENTAL EXPOSURE ....................................................................................................... 29 3.1.1 Environmental fate ........................................................................................................................ 29
3.1.1.1 Degradation ..................................................................................................................... 29 3.1.1.2 Distribution...................................................................................................................... 32 3.1.1.3 Bioaccumulation.............................................................................................................. 33
3.1.2 Aquatic compartment..................................................................................................................... 39 3.1.2.1 Releases to surface water................................................................................................. 40 3.1.2.2 Estimation of local aquatic concentrations ...................................................................... 60
3.1.3 Atmosphere.................................................................................................................................... 68 3.1.3.1 Releases to the atmosphere.............................................................................................. 68 3.1.3.2 Estimation of local air concentrations and deposition rates............................................. 75
3.1.4 Terrestrial compartment................................................................................................................. 78 3.1.4.1 Releases to soil and estimation of local soil concentrations ............................................ 78
3.1.4.1.1 Agricultural soil .............................................................................................. 78 3.1.4.1.2 Industrial / urban soil ...................................................................................... 80
3.1.5 Secondary poisoning...................................................................................................................... 81 3.1.6 Regional and continental concentrations ....................................................................................... 82 3.1.7 Monitoring data ............................................................................................................................. 82
3.1.7.1 Wastewater ...................................................................................................................... 83 3.1.7.2 Surface water ................................................................................................................... 85 3.1.7.3 Suspended matter and sediment....................................................................................... 88 3.1.7.4 Sewage sludge ................................................................................................................. 94

2
3.1.7.5 Soil................................................................................................................................... 96 3.1.7.6 Deposition........................................................................................................................ 98 3.1.7.7 Biota ................................................................................................................................ 99
3.1.8 Overall accumulation of DINP ...................................................................................................... 101
3.2 EFFECTS ASSESSMENT: HAZARD IDENTIFICATION AND DOSE (CONCENTRATION) - RESPONSE (EFFECT) ASSESSMENT............................................................................................... 103 3.2.1 Aquatic compartment..................................................................................................................... 103
3.2.1.1 Toxicity test results.......................................................................................................... 103 3.2.1.1.1 Fish ................................................................................................................. 103 3.2.1.1.2 Invertebrates ................................................................................................... 109 3.2.1.1.3 Aquatic plants ................................................................................................. 110 3.2.1.1.4 Microorganisms .............................................................................................. 110 3.2.1.1.5 Potential for endocrine disruption .................................................................. 111 3.2.1.1.6 Sediment dwellers........................................................................................... 112
3.2.1.2 Calculation of PNEC ....................................................................................................... 112 3.2.2 Atmosphere.................................................................................................................................... 113 3.2.3 Terrestrial compartment................................................................................................................. 113 3.2.4 Secondary poisoning...................................................................................................................... 114
3.3 RISK CHARACTERISATION ............................................................................................................. 115 3.3.1 Aquatic compartment (incl. sediment)........................................................................................... 115 3.3.2 Atmosphere.................................................................................................................................... 116 3.3.3 Terrestrial compartment................................................................................................................. 117 3.3.4 Secondary poisoning...................................................................................................................... 117
4 HUMAN HEALTH ......................................................................................................................................... 118
4.1 HUMAN HEALTH (TOXICITY) ......................................................................................................... 118 4.1.1 Exposure assessment ..................................................................................................................... 118
4.1.1.1 General discussion........................................................................................................... 118 4.1.1.2 Occupational exposure .................................................................................................... 118
4.1.1.2.1 Dermal exposure............................................................................................. 119 4.1.1.2.2 Inhalation exposure......................................................................................... 120 4.1.1.2.3 Conclusion of occupational exposure............................................................. 126
4.1.1.3 Consumer exposure ......................................................................................................... 127 4.1.1.3.1 General introduction ....................................................................................... 127 4.1.1.3.2 Scenario 1: Toys and baby equipment............................................................ 129 4.1.1.3.3 Scenario 2: Food and food-related uses.......................................................... 132 4.1.1.3.4 Scenario 3: Building materials and furniture .................................................. 134 4.1.1.3.5 Scenario 4: Car and public transport interior.................................................. 136 4.1.1.3.6 Scenario 5: Clothing, gloves and footwear..................................................... 137 4.1.1.3.7 Conclusion of consumer exposure.................................................................. 137
4.1.1.4 Humans exposed via the environment............................................................................. 138 4.1.1.5 Combined exposure ......................................................................................................... 141
4.1.2 Effect Assessment: Hazard identification and dose (concentration)-response (effect) assessment ..................................................................................................................................... 142 4.1.2.1 Toxicokinetics, metabolism and distribution................................................................... 142
4.1.2.1.1 Oral exposure.................................................................................................. 142 4.1.2.1.2 Dermal exposure............................................................................................. 145 4.1.2.1.3 Summary of toxicokinetics, metabolism and distribution............................... 151
4.1.2.2 Acute toxicity .................................................................................................................. 151 4.1.2.2.1 Oral exposure.................................................................................................. 151 4.1.2.2.2 Dermal exposure............................................................................................. 153 4.1.2.2.3 Inhalation exposure......................................................................................... 153 4.1.2.2.4 Other routes of exposure................................................................................. 154 4.1.2.2.5 Summary of acute toxicity.............................................................................. 154

3
4.1.2.3 Irritation........................................................................................................................... 155 4.1.2.3.1 Studies in animals ........................................................................................... 155 4.1.2.3.2 Studies in humans ........................................................................................... 157 4.1.2.3.3 Summary of irritation ..................................................................................... 157
4.1.2.4 Corrosivity....................................................................................................................... 157 4.1.2.5 Sensitisation..................................................................................................................... 158
4.1.2.5.1 Studies in animals ........................................................................................... 158 4.1.2.5.2 Studies in humans ........................................................................................... 158 4.1.2.5.3 Summary of sensitisation................................................................................ 159
4.1.2.6 Repeated dose toxicity..................................................................................................... 160 4.1.2.6.1 Oral exposure.................................................................................................. 160 4.1.2.6.2 Dermal exposure............................................................................................. 187 4.1.2.6.3 Studies specifically designed to assess peroxisomal proliferation.................. 187 4.1.2.6.4 Summary of repeated dose toxicity ................................................................ 198
4.1.2.7 Mutagenicity.................................................................................................................... 202 4.1.2.7.1 In vitro studies ................................................................................................ 202 4.1.2.7.2 In vivo studies ................................................................................................. 205 4.1.2.7.3 Summary of mutagenicity............................................................................... 205
4.1.2.8 Carcinogenicity................................................................................................................ 207 4.1.2.8.1 Cell transformation assays .............................................................................. 207 4.1.2.8.2 Studies in animals ........................................................................................... 209 4.1.2.8.3 Summary of carcinogenicity studies............................................................... 222 4.1.2.8.4 Other data ....................................................................................................... 223 4.1.2.8.5 Summary of carcinogenicity........................................................................... 224
4.1.2.9 Toxicity for reproduction ................................................................................................ 225 4.1.2.9.1 Developmental toxicity and fertility ............................................................... 225 4.1.2.9.2 Developmental toxicity studies....................................................................... 230 4.1.2.9.3 Summary of developmental studies ................................................................ 236 4.1.2.9.4 Summary of toxicity for reproduction ............................................................ 238
4.1.2.10 Additional studies ............................................................................................................ 239 4.1.2.10.1 Examination of the in vitro and in vivo estrogenic activities .......................... 239
4.1.3 Risk characterisation...................................................................................................................... 242 4.1.3.1 General aspects ................................................................................................................ 242 4.1.3.2 Workers ........................................................................................................................... 245 4.1.3.3 Consumers ....................................................................................................................... 249
4.1.3.3.1 Adults and 3-15 years old children................................................................. 250 4.1.3.3.2 Infants ............................................................................................................. 251 4.1.3.3.3 Newborns........................................................................................................ 252 4.1.3.3.4 Summary of the risk characterisation for consumers...................................... 253
4.1.3.4 Humans exposed via the environment............................................................................. 253 4.1.3.4.1 Repeated dose toxicity.................................................................................... 253 4.1.3.4.2 Toxicity for reproduction................................................................................ 254 4.1.3.4.3 Summary of the risk characterisation for humans exposed via the
environment .................................................................................................... 255 4.1.3.5 Combined exposure ......................................................................................................... 255
4.2 HUMAN HEALTH (PHYSICO-CHEMICAL PROPERTIES) ......................................................... 258 4.2.1 Exposure assessment ..................................................................................................................... 258 4.2.2 Effects assessment: Hazard identification ..................................................................................... 258 4.2.3 Risk characterisation...................................................................................................................... 258

4
5 RESULTS......................................................................................................................................................... 259
5.1 ENVIRONMENT.................................................................................................................................... 259
5.2 HUMAN HEALTH................................................................................................................................. 259 5.2.1 Human health (Toxicity)................................................................................................................ 259
5.2.1.1 Workers ........................................................................................................................... 259 5.2.1.2 Consumers ....................................................................................................................... 259 5.2.1.3 Humans exposed via the environment............................................................................. 259 5.2.1.4 Combined exposure ......................................................................................................... 259
5.2.2 Human health (risks from physico-chemical properties)............................................................... 259
6 REFERENCES ................................................................................................................................................ 260
ABBREVIATIONS ............................................................................................................................................... 277
Appendix A Hypothesis of replacement of DEHP by DINP in food contact materials (exposure assessment) . 283 Appendix B Hypothesis of replacement of DEHP by DINP in food contact material (risk characterisation).... 285 Appendix C EUSES Modelling .......................................................................................................................... 288
Euses Calculations can be viewed as part of the report at the website of the European Chemicals Bureau: http://ecb.jrc.it

5
TABLES
Table 1.1 Main identification parameters of DINPs ........................................................................................... 9 Table 1.2 DINPs producers per DINP type and tentative identification of commercial denominations............. 11 Table 1.3 Retention times (RT, minutes) and area percentages of the main (> 5%) gas chromatography
peaks from DINP and DIDP samples analysed in the same conditions (from the integrator output) . 12 Table 1.4 Best estimate in content (%) of the different chain structures of the DINPs....................................... 13 Table 1.5 Impurities of DINP according to manufacturers ................................................................................. 13 Table 1.6 Melting point (MP) of DINPs ............................................................................................................. 13 Table 1.7 Boiling point of DINPs ....................................................................................................................... 14 Table 1.8 Density of DINP at 20°C..................................................................................................................... 15 Table 1.9 Coefficients of the Antoine equation for DINP vapour pressures with temperature ranges of the
measurements, and extrapolation at 20°C (VP, Pa) ............................................................................ 16 Table 1.10 Re-analysis of industry data using the Kirchhoff equation ................................................................. 17 Table 1.11 Summary of DINPs vapour pressure estimates at 20°C (VP, Pa), using measurements at,
or reported near, room temperature..................................................................................................... 17 Table 1.12 DINP water solubility (Sw) estimations.............................................................................................. 18 Table 1.13 Experimental precautions taken to measure the true aqueous solubility of DINP (and DIDP) .......... 19 Table 1.14 Flash points of DINPs ......................................................................................................................... 23 Table 1.15 Selected values of viscosity of DINPs at 20°C ................................................................................... 23 Table 1.16 Summary of physico-chemical properties that could seem best to use to attribute a DINP type
to a DINP sample ................................................................................................................................ 24 Table 1.17 Summary of physico-chemical properties ........................................................................................... 24 Table 2.1 List of producers/importers having submitted a HEDSET diskette .................................................... 25 Table 2.2 Estimated amount of DINP used in various PVC and non-PVC applications .................................... 26 Table 2.3 PVC end use split for all phthalates and estimation for DINP ............................................................ 27 Table 2.4 Volumes of DEHP and DINP in different applications of PVC-products and their respective
lifetimes............................................................................................................................................... 28 Table 3.1 Phthalate concentrations in cultured soils in Denmark ....................................................................... 31 Table 3.2 Estimation of biodegradation rate constants in the different compartments ....................................... 32 Table 3.3 Estimation of removal of DINP in a STP according to SIMPLETREAT ........................................... 32 Table 3.4 Partition coefficients between different compartments ....................................................................... 33 Table 3.5 Level of residues in fish after 56 days of exposure in a flow-through study ...................................... 35 Table 3.6 Bioaccumulation factors after 56 days ................................................................................................ 35 Table 3.7 Bioaccumulation factors in plants for DEHP ...................................................................................... 37 Table 3.8 Bioaccumulation factors in plants ....................................................................................................... 38 Table 3.9 Continental release of DINP to the environment during processing with release factors ................... 45 Table 3.10 Continental and regional release of DINP to wastewater during processing of PVC polymers ......... 46 Table 3.11 Total release of DINP during processing with release factors ............................................................ 46 Table 3.12 Surface correction factor (SCF), technical lifetimes and consumed volumes on main groups of
outdoor use types (polymer end products) .......................................................................................... 53 Table 3.13 Summary of total releases from outdoor use of PVC end products .................................................... 53 Table 3.14 Outdoor use: Calculation of emission of DINP from waste remaining in the environment................ 58 Table 3.15 Environmental distributions of DINP released from waste remaining in the environment................. 58 Table 3.16 Total releases to wastewater and surface water................................................................................... 60 Table 3.17 90 Percentile consumption of DINP per site according to application................................................ 62 Table 3.18 Continental and regional release of DINP to wastewater during processing of PVC polymers ......... 69 Table 3.19 Surface Correction factor (SCF), technical lifetimes and consumed volumes on main groups of
outdoor use types (polymer end products) .......................................................................................... 71 Table 3.20 Summary of total releases from outdoor use of PVC end products to air ........................................... 72 Table 3.21 Total releases to air ............................................................................................................................. 75 Table 3.22 Local concentrations in soil................................................................................................................. 79 Table 3.23 Local concentrations in groundwater .................................................................................................. 79 Table 3.24 Estimated diffuse DINP-releases to industrial / urban soil ................................................................ 80 Table 3.25 % DEHP loss from cable material after 32 months in soil (Georgia sites, original conc. 37.2%) ...... 81 Table 3.26 Exposure of top predators through food.............................................................................................. 82 Table 3.27 Comparison of DINP and DEHP concentrations measured at the same locations.............................. 83

6
Table 3.28 Monitoring of DEHP in wastewater.................................................................................................... 84 Table 3.29 Monitoring of DEHP in surface water ................................................................................................ 86 Table 3.30 Monitoring of DEHP in suspended matter of surface water ............................................................... 88 Table 3.31 Monitoring of DINP in sediment samples in the Netherlands............................................................. 89 Table 3.32 Monitoring of DEHP in sediment ....................................................................................................... 91 Table 3.33 Determination of DnNP and diisononyl phthalate were determined in applied fertilisers in
Denmark.............................................................................................................................................. 94 Table 3.34 Monitoring of DEHP in municipal STP sludge................................................................................... 95 Table 3.35 Determination of di-n-nonyl phthalate and diisononyl phthalate in soils in Denmark........................ 96 Table 3.36 Monitoring data of DEHP in soil ........................................................................................................ 98 Table 3.37 Monitoring of DEHP in biota.............................................................................................................. 99 Table 3.38 Fish toxicity experiments with DINP.................................................................................................. 103 Table 3.39 Summary of chronic aquatic toxicity tests for C6 - C11 phthalate esters ........................................... 105 Table 3.40 Summary of aquatic toxicity data for di-n-octyl phthalate (DOP) and diisononyl phthalate
(DINP1)............................................................................................................................................... 108 Table 3.41 Toxicity experiments to invertebrates with DINP............................................................................... 109 Table 3.42 Chronic toxicity experiments to invertebrates with DINP .................................................................. 110 Table 3.43 Toxicity experiments to aquatic plants with DINP ............................................................................. 110 Table 3.44 Toxicity experiments to microorganisms with DINP.......................................................................... 111 Table 3.45 Toxicity experiments to sediment dwellers with DINP....................................................................... 112 Table 3.46 Soil toxicity experiments with DINP 1 ............................................................................................... 114 Table 3.47 PEClocal for the aquatic compartment................................................................................................ 115 Table 3.48 PEClocal for the sediment................................................................................................................... 116 Table 3.49 PEC/PNEC ratios for agricultural soil................................................................................................. 117 Table 3.50 PEC/PNEC ratios for predators........................................................................................................... 117 Table 4.1 Exposure to phthalate esters during manufacture................................................................................ 121 Table 4.2 Mean concentrations and range of DEHP in ambient air as determined by personal air
samplings............................................................................................................................................. 123 Table 4.3 Exposure to phthalates during PVC processing in UK factories......................................................... 123 Table 4.4 DEHP Exposure data during processing of polymers ......................................................................... 124 Table 4.5 Diisooctyl phthalate exposure data...................................................................................................... 124 Table 4.6 Samplings and percentiles of workplace exposure to DEHP collected from 1991 to 1995................ 125 Table 4.7 Dioctyl phthalate exposure measurements recorded from 1987 to 1996in the COLCHIC
database ............................................................................................................................................... 125 Table 4.8 Dioctyl phthalate exposure measurements recorded from 1987 to 1996 in the COLCHIC
database ............................................................................................................................................... 126 Table 4.9 Conclusion of inhalation occupational exposure................................................................................. 127 Table 4.10 End products containing DINP, sources of exposure and categories of consumers exposed ............. 128 Table 4.11 Oral daily intake estimation from toys ................................................................................................ 131 Table 4.12 Infant and newborn exposure to DINP in infant formulae depending on ages ................................... 133 Table 4.13 Conclusion of consumer exposure ...................................................................................................... 138 Table 4.14 Total daily intake of adults due to local environmental exposures ..................................................... 139 Table 4.15 Infant characteristics for input in EUSES calculation......................................................................... 140 Table 4.16 Total daily intake for infants due to local environmental exposures................................................... 140 Table 4.17 Combined exposure............................................................................................................................. 141 Table 4.18 Recovery of radioactivity following dermal application of [14C]-diisononyl phthalate in
male Fischer 344 rats........................................................................................................................... 147 Table 4.19 Skin penetration properties of dimethyl- (DMP), diethyl- (DEP) and dibutyl- (DBP) phthalates ...... 148 Table 4.20 Skin penetration properties of DEHP in other publications ................................................................ 149 Table 4.21 Percentage of dose ([14C] equivalents) found in the tissues and the plastic cap that covered the
area of application at 7 days following a single application of various phthalate esters to the back skin of male F-344 rats ............................................................................................................................... 150
Table 4.22 Summary of acute toxicity studies ...................................................................................................... 155 Table 4.23 Summary of irritation studies .............................................................................................................. 157 Table 4.24 Sensitisation studies with DINP.......................................................................................................... 159 Table 4.25 Survival of F344 rats: numbers/group................................................................................................. 169 Table 4.26 Mean absolute (g) and relative (%) organ weights at study termination (significant changes) ......... 170 Table 4.27 Incidence of non-neoplastic liver lesions in rats fed DINP for 2 years............................................... 172

7
Table 4.28 Study design ........................................................................................................................................ 175 Table 4.29 Study design ........................................................................................................................................ 181 Table 4.30 Comparison between three DINPs (Jayflex - Palatinol N and Vestinol 9) and DEHP.
Results of a 14-day study with assessment of peroxisomal proliferation properties........................... . 191 Table 4.31 Comparative results of peroxisome proliferation parameters with 1.2% of DEHP, DINP and DIDP 194 Table 4.32 Comparative table: hepatic catalase and CAT activities in F344 rats in a 28-day feeding study
with 2 DINPs (R-1286 and R-1268) and DEHP (R-1287) ................................................................. 196 Table 4.33 Summary of repeated dose toxicity studies ......................................................................................... 198 Table 4.34 Gene mutation and cytogenetic assays in vitro ................................................................................... 206 Table 4.35 In vivo studies...................................................................................................................................... 206 Table 4.36 Cell transformation assays................................................................................................................... 209 Table 4.37 Most common causes of death and/or morbidity in rats fed DINP for 2 years ................................... 211 Table 4.38 Incidence of MNCL in terminal sacrificed animals fed DINP for 2 years.......................................... 211 Table 4.39 Incidence of selected neoplastic and preneoplastic lesions in rats fed DINP for 2 years.................... 212 Table 4.40 Hepatocellular neoplasms ................................................................................................................... 216 Table 4.41 Kidney findings................................................................................................................................... 217 Table 4.42 Mononuclear cell leukemias................................................................................................................ 218 Table 4.43 Mononuclear cell leukemia frequency, historical data........................................................................ 218 Table 4.44 Survival data and common cause of death .......................................................................................... 219 Table 4.45 Hepatocellular neoplasia ..................................................................................................................... 221 Table 4.46 Summary of carcinogenicity studies ................................................................................................... 222 Table 4.47 Actual dose related to concentration in diet ........................................................................................ 225 Table 4.48 Actual dose related to concentration in diet ........................................................................................ 228 Table 4.49 Summary of developmental studies..................................................................................................... 236 Table 4.50 Effects of phthalate esters on uterine weight in ovariectomised Sprague-Dawley rats....................... 240 Table 4.51 Studies showing the critical end points............................................................................................... 245 Table 4.52 Worst-case occupational exposure summary ...................................................................................... 246 Table 4.53 MOS calculated for each scenario and for each RDT critical effect ................................................... 247 Table 4.54 MOSs calculated for each scenario and for fertility .................................................................................... 248 Table 4.55 MOS calculated for each scenario and for each developmental effect................................................ 248 Table 4.56 MOSs calculated for adults exposed to DINP from various matrixes and by multiple pathways....... 250 Table 4.57 MOSs calculated for infants exposed to DINP from various matrixes and by multiple pathways:
without toys......................................................................................................................................... 251 Table 4.58 MOSs calculated for infants exposed to DINP from various matrixes and by multiple pathways:
with toys .............................................................................................................................................. 251 Table 4.59 MOSs calculated for newborns exposed to DINP from various matrixes and by multiple pathways:
without toys......................................................................................................................................... 252 Table 4.60 MOSs calculated for newborns exposed to DINP from various matrixes and by multiple pathways:
with toys .............................................................................................................................................. 252 Table 4.61 MOS calculated for adults for repeated dose toxicity ......................................................................... 253 Table 4.62 MOS calculated for infants for repeated dose toxicity........................................................................ 254 Table 4.63 MOS calculated for adults for fertility (testicular effects) and decrease in live birth and survival
indices ................................................................................................................................................. 254 Table 4.64 MOS calculated for adults for each developmental effect .................................................................. 254 Table 4.65 MOSs calculated for infants for fertility (testicular effects)................................................................ 255 Table 4.66 MOSs calculated for adults for combined exposure with occupational exposure............................... 256 Table 4.67 MOSs calculated for adults for combined exposure without occupational exposure.......................... 256 Table 4.68 MOSs calculated for children for combined exposure ........................................................................ 256 Table 4.69 MOSs calculated for infants for combined exposure (with toys)........................................................ 257 Table A.1 Sum of exposures in case of replacement of DEHP by DINP in food contact materials .................... 284 Table B.1 MOSs calculated for adults from various matrixes and by multiple pathways................................... 285 Table B.2 MOSs calculated for infants from various matrixes and by multiple pathways: without toys ........... 285 Table B.3 MOSs calculated for infants from various matrixes and by multiple pathways: with toys ................ 286 Table B.4 MOSs calculated for newborns exposed to DINP from various matrixes and by multiple pathways:
without toys......................................................................................................................................... 286 Table B.5 MOSs calculated for newborns exposed to DINP from various matrixes and by multiple pathways:
with toys .............................................................................................................................................. 287


9
1 GENERAL SUBSTANCE INFORMATION
1.1 IDENTIFICATION OF THE SUBSTANCES
The following data have been gathered from IUCLID and specific industry information on their products.
Table 1.1 Main identification parameters of DINPs
CAS Nr 68515-48-0 28553-12-0
EINECS Nr 271-090-9 249-079-5
Substance name (IUPAC) 1,2-Benzenedicarboxylic acid, di-C8-10 branched alkylesters, C9 rich
Di-'iso'nonyl phthalate
Molecular formula C8+2xH6+4xO4 with x = 8 to 10 (x = 9 as main constituent), average C26H42O4
Molecular weight Average 420.6
Structural formula (conventional)
C-O-C x 2x +1
O
H
C-O-C x 2x +1
O
H
Note: the conventional formula (Di-isononyl phthalate in the IUPAC meaning) for the lateral alkyl chain would be written: -(CH2)6-CH(CH3)2.
In fact, there have been 3 different DINPs. DINP 1 (CAS 68515-48-0) is manufactured by the “Polygas” process. DINP 2 (CAS 28553-12-0) is n-butene based. DINP 3 (also CAS 28552-12-0) was n- and iso-butene based (Figure 1.1). These different brands of DINPs have been produced at different times by different producers, in varying quantities (Table 1.2). DINP 3 was produced by a specific process (co-dimer butene); it has been manufactured until 1995.
Although these substances can all be named, from the industry point of view, di-“iso”nonyl phthalates, their contents in chemical structures differ (Table 1.4). As Exxon emphasises (HEDSET data sheet for DIDP (Di-isodecyl phthalate), 1996): “In the “OXO” industry, the term “iso” denotes a mixture of isomers and does not refer to the IUPAC definition”.

EU RISK ASSESSMENT REPORT – DINP FINAL REPORT, 2003
Figure 1.1 Summary of production process for DINPs (ECPI, 1997b)
DISTILLATION
HYDROGENATION
DISTILLATION
ESTERIFICATION (+PHTHALIC ANHYDRIDE)
DIDP CAS 68515-49-1
(And 26761-40-0)
DINP 1 (Polygas based)
CAS 60515-48-0
Viscosity (mPa.s) 20°C 100 165 80
Aldehydes C n + 1
Propylene and butenes
n-Butene Isobutene
n-Butene
Oligomerisation process
Nonene CAS 97593-01-6
Octene CAS 97593-05-5
Codimer butylene
Iso-octene CAS 11071-47-9 (and 68526-54-5)
Isodecyl alcohol CAS 93821-11-5
Isononyl alcohol CAS 68526-84-1
Dimerisation process
Isononyl alcohol CAS 27458-94-2
OXONATION PROCESS (+ CO + H 2 )
DINP 3 (n- & iso- butene based)
CAS 28553-12-0 (ex BASF palatinol DN;
Hüls Vestinol N)
DINP 2 (n-butene based) CAS 28553-12-0
(ex BASF palatinol N; Hüls vestinol 9)
10

CHAPTER 1. GENERAL SUBSTANCE INFORMATION
Table 1.2 DINPs producers per DINP type and tentative identification of commercial denominations (ECPI, 1997b)
Producer DINP 1 DINP 2 DINP 3
Polygas based n-Butene based n- and iso- Butene based
68515-48-0 28553-12-0 28553-12-0
BASF No production Palatinol N Palatinol DN (Palatinol DINP) 1) Production stopped in 1995
Hüls No production Vestinol 9 Vestinol N Production stopped in 1986
Exxon Jayflex DINP 2) Jayflex DINP-S 3) Production stopped in 1992
No production
ICI Emkarate 9120 4) Production stopped in 1995
No production No production
Neste No production Production stopped in 1991 No information on commercial name
No production
Alusuisse/ Lonza
Production but no information on commercial name
No production No production
CEPSA / PDL Minor production stopped in 1992 No information on commercial name
No production No production
1) Tentative identification deduced from information on viscosity (BASF, 1982a) 2) Exxon chemical (1995) 3) Exxon chemical Europe (1996a) 4) ICI (1994)
1.2 PURITY/IMPURITIES, ADDITIVES
DINP is not a pure substance, but a complex mixture containing mainly C9-branched isomers, with mean formula C26H42O4 and mean molecular weight M=20.6 g.mol-1.
The report from Exxon Biomedical Sciences (1996a), studying water solubility of DINP (very probably DINP 1) and DIDP, confirms that these phthalates contain a number of constituents, of which many might be common to both (gas chromatography retention times 13.5 to 16.5 minutes for DINP and 14 to 18 minutes for DIDP). The reconstituted chromatogram for a DINP sample extracted from water shows ca. 29 different peaks.
An analysis by BASF (1992a) of a DINP sample (named “di(isononyl) phthalate 3”; Proben-Nr. 18620, probably DINP 3) gave a purity of > 99.5%, but gas chromatography revealed “at least 24 components” (visual inspection of the chromatogram reveals some 38 to 40 peaks). Five components may be considered as main constituents (perhaps between 10 and 20% each). The CAS number is indicated.
Another good quality chromatogram has been furnished (BASF, 1987a). In this report, up to 40 peaks are attributed to DINP 2 (37 after partial distillation). Here again, 5 constituents may be considered as principal (from ca. 6 to ca. 20%).
Howard et al. (1985) studied by gas chromatography the composition of a DINP sample provided by the Chemicals Manufacturers' Association (CMA), with no clear indication on its identity. They found three compounds with 18 carbon atoms, with percentages of, respectively 26, 8 and 28% and a mixture of unresolved compounds (38% with 18 - 19 alkyl chain length).
11

EU RISK ASSESSMENT REPORT – DINP FINAL REPORT, 2003
Rastogi (1998) analysed the phthalate esters present in plastic toys, and presented gas chromatograms of DINP and DIDP provided as reference samples and analysed by Fluka. Both are complex mixtures and may have common constituents (retention times from 22.9 to 25.7 minutes for DINP, and from 25.2 to 27.0 for DIDP). In the Fluka 1997/98 catalogue, di-“isononyl” phthalate is mentioned as a mixture, the main component of which being bis(3,5,5-trimethylhexyl) phthalate.
These data have been completed by a personal communication from the author, summarised in Table 1.3.
Table 1.3 Retention times (RT, minutes) and area percentages of the main (> 5%) gas chromatography peaks from DINP and DIDP samples analysed in the same conditions (from the integrator output)
DINP RT 24.195 24.295 24.551 24.640 24.741 24.904 25.007
(22 peaks) % 8.17 9.89 9.83 12.30 6.89 7.13 9.22
DIDP RT 25.289 25.474 25.715 26.119 26.127 26.275 26.532
(18 peaks) % 5.95 5.31 14.60 8.61 10.10 7.01 9.23
In the present situation, the possible presence of common constituents, and insufficient chromatographic separation characteristics, do not warrant an unambiguous identification of the tested sample.
The following molecular structures are recovered when searching under the used CAS numbers.
CAS: 68515-48-0
O
O
O
O
CAS No: 28553-12-0
O
O
O
O
The correct structures can only be estimated. Using data on the repartition of alcohols used for the manufacture of the DINPs, ECPI has made an estimation of the different chain structures that may be present in DINPs (Table 1.4).
12

CHAPTER 1. GENERAL SUBSTANCE INFORMATION
Table 1.4 Best estimate in content (%) of the different chain structures of the DINPs (ECPI, 1997b)
DINP 1 DINP 2 DINP 3
Methyl ethyl hexanols 5 - 10 5 - 10 65 - 70 Dimethyl heptanols 45 - 55 40 - 45 20 - 25 Methyl octanols 5 - 20 35 - 40 - n-Nonanol 0 - 1 0 - 10 - Isodecanol 15 - 25 - -
Phthalates are produced with a high degree of purity (> 99.5%), in terms of ester content. Trace impurities have been summarised from producers' data in Table 1.5.
Table 1.5 Impurities of DINP according to manufacturers
i-nonanol ca. 0.04%
isononylbenzoate ca. 0.03%
n-butylisononyl phthalate ca. 0.1%
Water 0.02 - 0.03%
DINP 99.8%
Bisphenol-A may be included upon request by customer
1.3 PHYSICO-CHEMICAL PROPERTIES
1.3.1 Physical state
DINPs are oily, viscous liquids at normal temperature and pressure.
1.3.2 Melting point
Representative data have been collected in Table 1.6.
Table 1.6 Melting point (MP) of DINPs
Sample reference MP (°C) Method References
DINP 1 - 48 ASTM D 97 (pour point) Exxon Chemical Europe (1994). “Typical value”
DINP 1 -44 - ICI (1994)
DINP 2 -54 ASTM D 97 (pour point) Exxon Chemical Europe (1992a). “Typical value”
DINP 2 ca. -54 DIN 51 583 Hüls (1986)
DINP 2 -42 DIN 53 372 (pour point) BASF (1996a)
DINP 2 -49 DIN-ISO 3016 BASF (1987b; 1994a)
DINP 3 -46 DIN-ISO 3016 (pour point) BASF (1994b)
Table 1.6 continued overleaf
13
EU RISK ASSESSMENT REPORT – DINP FINAL REPORT, 2003
Table 1.6 continued Melting point (MP) of DINPs
Sample reference MP (°C) Method References
Palatinol DINP, (DINP 3 ?) -41 DIN ISO 3016 (pour point) BASF (1992b)
Genomoll 160 ca. -45 DIN-ISO 3016 Hoechst (1990)
Genomoll 150 -40 DIN 51 583 (Stockpunkt) Hoechst (1973), Main constituent: di-(3,5,5-trimethylhexyl)-phthalate
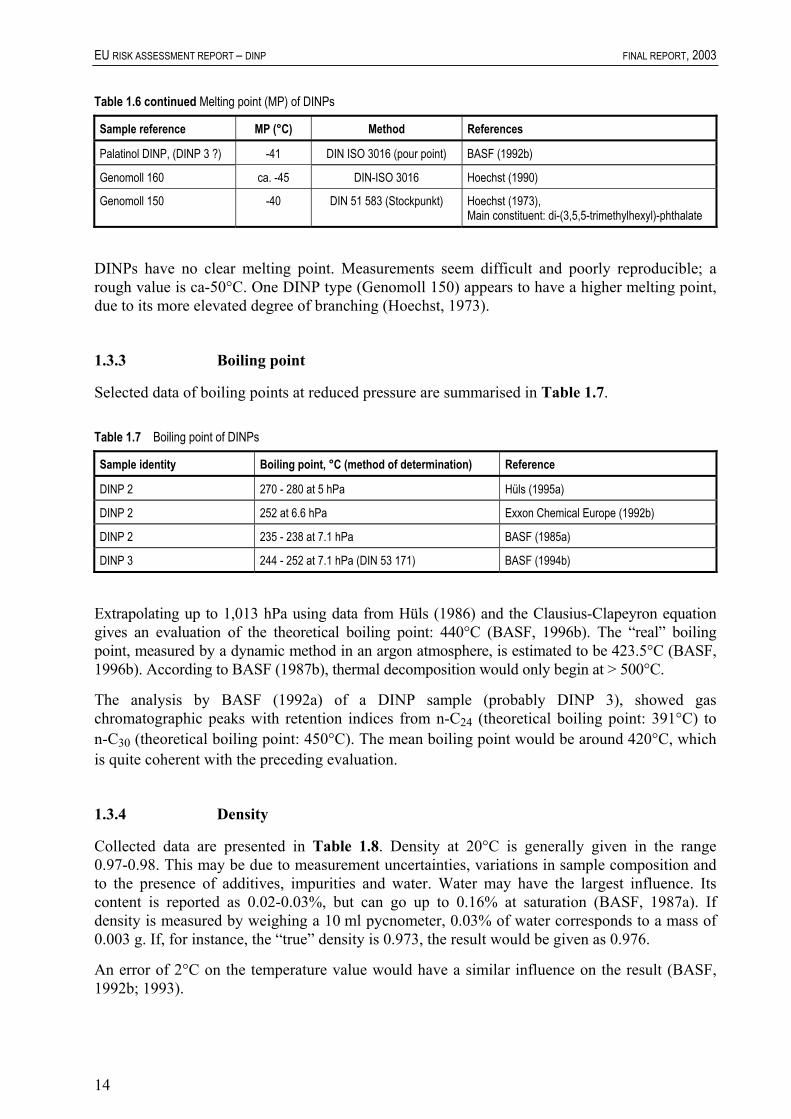
DINPs have no clear melting point. Measurements seem difficult and poorly reproducible; a rough value is ca-50°C. One DINP type (Genomoll 150) appears to have a higher melting point, due to its more elevated degree of branching (Hoechst, 1973).
1.3.3 Boiling point
Selected data of boiling points at reduced pressure are summarised in Table 1.7.
Table 1.7 Boiling point of DINPs
Sample identity Boiling point, °C (method of determination) Reference
DINP 2 270 - 280 at 5 hPa Hüls (1995a)
DINP 2 252 at 6.6 hPa Exxon Chemical Europe (1992b)
DINP 2 235 - 238 at 7.1 hPa BASF (1985a)
DINP 3 244 - 252 at 7.1 hPa (DIN 53 171) BASF (1994b)
Extrapolating up to 1,013 hPa using data from Hüls (1986) and the Clausius-Clapeyron equation gives an evaluation of the theoretical boiling point: 440°C (BASF, 1996b). The “real” boiling point, measured by a dynamic method in an argon atmosphere, is estimated to be 423.5°C (BASF, 1996b). According to BASF (1987b), thermal decomposition would only begin at > 500°C.
The analysis by BASF (1992a) of a DINP sample (probably DINP 3), showed gas chromatographic peaks with retention indices from n-C24 (theoretical boiling point: 391°C) to n-C30 (theoretical boiling point: 450°C). The mean boiling point would be around 420°C, which is quite coherent with the preceding evaluation.
1.3.4 Density
Collected data are presented in Table 1.8. Density at 20°C is generally given in the range 0.97-0.98. This may be due to measurement uncertainties, variations in sample composition and to the presence of additives, impurities and water. Water may have the largest influence. Its content is reported as 0.02-0.03%, but can go up to 0.16% at saturation (BASF, 1987a). If density is measured by weighing a 10 ml pycnometer, 0.03% of water corresponds to a mass of 0.003 g. If, for instance, the “true” density is 0.973, the result would be given as 0.976.
An error of 2°C on the temperature value would have a similar influence on the result (BASF, 1992b; 1993).
14

CHAPTER 1. GENERAL SUBSTANCE INFORMATION
Table 1.8 Density of DINP at 20°C
Sample identity Density (g/cm3) Method Reference
DINP 1 ≥ 0.970, ≤ 0.974 ASTM D 4052 Exxon Chemical Europe (1994)
DINP 1 0.972 Not specified Exxon Chemical Europe (1996c)
DINP 1 0.975 Not specified ICI (1994)
DINP 2 ≥ 0.970, ≤ 0.975 ASTM D 1045 Exxon Chemical Europe (1992a)
DINP 2 0.973 - 0.977 DIN 51 757 BASF (1994a)
DINP 2 0.972 - 0.977 DIN 51 757 Hüls (1986)
DINP 3 0.977 - 0.983 DIN 51 757 BASF (1994b)
Palatinol DINP (DINP 3 ?)
0.970 - 0.980 (0.9781, meas.)
DIN 51 757 BASF (1992b)
Palatinol DINP (DINP 3 ?)
0.9792 (calc.) Continuous measure-ments from -40°C to 160°C and interpolation
BASF (1993)
1.3.5 Vapour pressure
Evaluations using extrapolation
Data provided by industry
For DINPs, there are a lot of data on vapour pressure (VP) measurements at elevated temperature ranges, reported in the form of coefficients of the Antoine equation. The later relates log VP to temperature using three parameters:
tCBALnVP+
+=
A, B and C values are summarised as they have been reported (i.e. with P in bar and t in °C) in Table 1.9.
These data show that extrapolations over a wide temperature range (in most cases, on ca. 150°C), even starting from good experimental work, give widely scattered results. (Note that BASF only uses the formula for interpolation). Vapour pressures calculated at 20°C differ by 2 orders of magnitude (3.1.10-8 to 3.8.10-6 Pa at 20°C; mean value 4.3.10-6 Pa; median value 1.7.10-7 Pa). This is not really surprising, since the Antoine equation is a semi-empirical equation derived from the Clausius-Clapeyron equation after integration, assuming that measurements are made far from the critical point, that the perfect gas law applies to vapours, and that the latent heat of vaporisation does not vary with temperature. This last hypothesis is the least acceptable, and is reconsidered in the following sub-section.
If one considers these tests as globally equivalent, because performed in the same ranges of elevated temperatures on similar samples, one can have an idea of the uncertainties on the three parameters (variations range from 22% for A to more than 71% for C), and see how important the uncertainties on values extrapolated at 20°C may be.
15

EU RISK ASSESSMENT REPORT – DINP FINAL REPORT, 2003
Table 1.9 Coefficients of the Antoine equation for DINP vapour pressures with temperature ranges of the measurements, and extrapolation at 20°C (VP, Pa)
A B C Temperature range, °C
Reference Sample VP
10.1673 -5,674.06 125.99 166.8 - 220.0 BASF (1985b) 1)
DINP 1 3.5.10-8
11.8738 -6,877.86 156.38 196.8 - 279.4 BASF (1987c) DINP 2
1.7.10-7
14.2574 -8,900.64 212.55 194.4 - 288.5 BASF (1987d) 2) DINP 3
3.8.10-6
9.9413 -5,592.17 124.23 167.9 - 221.8 BASF (1985b) DINP 3
3.1.10-8
12.1323 -7,054.37 161.91 179.6 - 304.3 BASF (1983) DINP 3
2.7.10-7
1) Measurements made on a sample from Esso 2) These measurements are in better agreement with those reported by BASF in 1983. Measurements made in 1985
(BASF, 1985b) gave indications around 1 K lower (BASF, 1987e).
Re-analyses of the data using the Clausius-Clapeyron equation
The Clausius-Clapeyron equation is:
2)(RT
HvLnVPdTd ∆
=
Where ∆Hv is the latent heat of vaporisation. If the latter is supposed to vary with temperature according to the relationship:
∆Hv = ∆Ho + αT
Integration gives (A' is an integration constant):
LnTRRT
HoALnVP α+
∆−= '
This may be written as follows:
LnTCTBALnVP ⋅++= '''
The data referred to above have been re-analysed using this equation (known as the Kirchhoff equation), that uses the same number of parameters and presents a better fit to actual data. Parameters are observed to vary less widely (less than 5% for B', the most variable) and extrapolations at 20°C converge quite well (8.2.10-5 to 10.10-5 Pa), which gives more confidence in the extrapolated value (mean 9.1.10-5 Pa).
16

CHAPTER 1. GENERAL SUBSTANCE INFORMATION
Table 1.10 Re-analysis of industry data using the Kirchhoff equation
Sample A' B' C' VP
DINP 1 (BASF, 1985b) -93.73 -4049 17.3 9.3.10-5
DINP 2 (BASF, 1987c) -93.18 -4049 17.2 9.1.10-5
DINP 3 (BASF, 1987d) -92.83 -4011 17.1 8.2.10-5
DINP 3 (BASF, 1985b) -93.04 -3885 17.1 1.0.10-4
DINP 3 (BASF, 1983) -92.91 -3971 17.1 8.8.10-5
DINP vapour pressures (VP, Pa) extrapolated at 20°C, with calculated coefficients of equation
Evaluations using measurements at moderate temperatures
Hüls (1996a) made “better measurements” (Hüls, 1996b) of vapour pressure on a DINP 2 sample, from 30°C (2.10-4 Pa) up to 190°C (65 Pa). Extrapolation to 20°C, in these conditions, is made on a very limited range, and gives ca. 7.10-5 Pa (linear extrapolation, proposed by Hüls, using the nearest points). This last value, however, still depends on the way for extrapolating. Using the preceding equation, one obtains: A'=-92.1, B' =-4,672, C'=17.3, and an extrapolated value of VP at 20°C of 5.1.10-5 Pa, a similar and probably slightly better approximation.
Howard et al. (1985) measured DINP (unidentified sample) vapour pressure by the gas saturation method. They found 7.2(±0.9).10-5 Pa at 25°C. The method, however, may suffer from limitations with heavy compounds: there is no indication that saturation really occurs during the experiment. If there is no real saturation, an underestimation results.
If one applies to their data on a series of phthalates (excluding BBP, butylbenzyl phthalate, a non homologous substance in their series) the regression line linking log VP to MW, a value of 1.9.10-4 Pa at 20°C is found. There seems to be a relatively high uncertainty on this estimation, due to graphical dispersion resulting from uncertainties on measurements for the phthalates considered.
Table 1.11 Summary of DINPs vapour pressure estimates at 20°C (VP, Pa), using measurements at, or reported near, room temperature
Result from Sample Value Temperature VP
Howard et al. (1985) “DINP” 7.2.10-5 25°C 5.10-5
Hüls (1996a) 1) DINP 2 2.10-4 30°C 7.10-5
Hüls (1996a) 2) DINP 2 2.10-4 30°C 5.1.10-5
Log VP vs. MW Homologues 1.9.10-4 20°C 1.9.10-4
1) Linear extrapolation using only the low temperature measurements 2) Clausius Clapeyron extrapolation using all data points
Conclusions on vapour pressure
The estimations presented in Table 1.11 are within a factor of 4, which is quite reasonable. One should be aware, at this level, of the measurement difficulties associated with very low VPs: the lower the temperature, the more difficult the measurement, the higher the uncertainty. The first three evaluations are estimated the most reliable; their mean is 6.10-5 Pa.
17

EU RISK ASSESSMENT REPORT – DINP FINAL REPORT, 2003
Evaluation of the vapour pressure at 100°C can be best made using the Clausius-Clapeyron equation. The mean is estimated as 0.11 Pa with little dispersion between estimations (0.10-0.12 Pa). It may be of interest to note that these data do not contradict an old relationship proposed by Small et al. (1948) for a series of normal straight-chain alkyl (from dimethyl to di-n-hexyl) phthalates, that would give through extrapolation a value of 0.03 Pa at 100°C for di-n-nonyl phthalate. The authors comment: “as expected, esters containing branched alkyl chains give rather higher values for VP than those calculated from this relation, which was deduced for normal straight-chain esters”.
1.3.6 Surface tension
No data on surface tension is available. Given the very low water solubility of the substance (see below), a test was not required.
1.3.7 Water solubility
Measurement of water solubility of DINP is very difficult, due to its strongly hydrophobic character. Measured or calculated values are widely scattered, though often mentioned as < 100 µg.l-1.
“Older” evaluations of DINP water solubility
BASF (1987a) made measurements of DINP 2 Sw from 20 to 90°C, using nephelometry, and found a value (at saturation) of “0.0106% (g/g)” at 20°C with an incertitude estimated as 6.5%. So Sw would be around 100 mg.l-1. This result is situated in a series of homogeneous measurements made at different temperatures. No more detail is indicated.
Howard et al. (1985) measured water solubility using a procedure recommended in 1979 by the US Environmental Protection Agency (US EPA). “DINP” was shaken with water, and then centrifuged at 29,000 g for 60 minutes at controlled temperature. After sampling and diluting with an equal volume of acetonitrile, the solutions were analysed in duplicate by HPLC (high performance liquid chromatography). Sampling of the aqueous solution without contamination by the residual ester floating on the surface was quite difficult. Such a problem may lead to overestimate the true water solubility. This seems evident for some other phthalates they have examined (e.g. DIDP, 1.19 ± 0.19 mg.l-1; DUP, 1.11 ± 0.28 mg.l-1, to be compared with DIOP (Di-isooctyl phthalate), 0.09 ± 0.01 mg.l-1). They indicate a value of 200 µg.l-1 at 25°C, with a high uncertainty (0.2 ± 0.1 mg l-1).
Indirect estimations were obtained by Scherf (1995). The latter introduced the partition coefficient measured using HPLC (see Section 1.3.8) in solubility / partition coefficient models taken from three independent literature sources.
Table 1.12 DINP water solubility (Sw) estimations (Scherf, 1995)
Model (with Sw in Mol.l-1) log Kow range Sw (µg.l-1)
log Sw = -1.339.log Kow + 0.978 0.16 - 4.73 0.0014
log Sw = -1.16.log Kow + 0.79 0.14 - 4.93 0.042
log Sw = -1.26.log Kow - 0.0054. (MP - 25) + 1 1) -0.34 - 8.26 0.008
1) If MP < 25°C, then MP = 25°C
18

CHAPTER 1. GENERAL SUBSTANCE INFORMATION
These values are confirmed by the (Q)SAR estimations proposed by SRC (1994), based on logKow, melting point and molecular weight. A value of 0.120 µg/l is proposed.
“Newer studies”
Exxon Biomedical Sciences (1996a) evaluated DINP 1 aqueous solubility as 0.61 ± 0.031 µg.l-1. Due to a number of experimental precautions (see Table 1.13), the ECPI (1998a) believes “that the Exxon study provides the most reliable experimental measurement of the true (thermodynamic) water solubility of DINP”.
Table 1.13 Experimental precautions taken to measure the true aqueous solubility of DINP (and DIDP) (Exxon Biomedical Sciences, 1996a)
Problems in previous studies ECPI comments and Exxon's precautions
Vigorous mixing during equilibration of the test material with the aqueous phase
This produces quasi-stable emulsions of free product micro-droplets. A slow-stir procedure was used as proposed by the US EPA.
A pipette is passed through the air-water interface where the phthalate ester floats (contamination problems)
Samples were withdrawn by gravity from a port at the bottom of an all-glass test system.
Analytical quantification relied upon non-specific techniques
Trace amounts of water-soluble impurities (e.g. unreacted alcohols) that are present in commercial products could confound the interpretation of experiments that relied upon radiotracer or nephelometric methods for analytical quantification. GC-MS in selected ion mode was employed.
The third point is not considered as really decisive, in view of the high purity of commercial phthalates (in terms of ester content): impurities are all claimed to be < 0.1%. A 100 µg.l-1 solution of DINP containing 0.1% of a totally water-soluble impurity would contain only 0.1 µg.l-1 of this impurity, which cannot explain the majority of published results, reporting solubility’s around (or more than) a thousand times higher.
Several difficulties may cast doubts on the validity of the evaluation made by Exxon Biomedical Sciences.
1. strong adsorption of the dissolved phthalate on glass walls. “High molecular weight phthalate acid esters are known to adsorb strongly to sediment, glass surfaces and dust particles, which complicates analysis of the compounds” (HSDB, 1997). Williams et al. (1995) measured an adsorption of 92.0% to glass vessels at 7 days for DIDP, in the absence of sediment. In the Exxon experiment “the entire test systems were glass”, and “samples were collected directly in the all-glass extraction disk apparatus” (Exxon Biomedical Sciences, 1996a). Furtmann (1994) asserts there is no adsorption problem when rinsing glass surfaces with 2,2,4-trimethylpentane immediately before use. The Exxon report does mention such precautionary steps; the delay between rinsing and the beginning of the test is however unknown. ECPI (1998a) indicates that “a loading of 1 mg.l-1 was used to ensure that excess undissolved test material was present to maintain a saturated aqueous phase.” However, due to initially spurious results, the report mentions that “it was suspected that small amounts of undissolved test substance had adsorbed to the bottom of the aspirator bottles” (Exxon Biomedical Sciences, 1996a). This suggests that the sought glass passivation was not effective.
2. possibly poor retention of the dissolved DINP on the solid-phase extraction cartridge in the presence of a large excess of water (3 litre water samples were extracted using C18 extraction disks). Hendriks et al. (1994) state that very lipophilic organics (log Kow > 5) are not
19

EU RISK ASSESSMENT REPORT – DINP FINAL REPORT, 2003
extracted from water by XAD (see also Sherma et al., 1986). Furtmann (1994) uses 250 mg of an octadecyl phase, too, but estimates recovery as 91-108%. He selects the quantity of water to be treated (250 ml) to avoid phthalate losses (a breakthrough of DMP (dimethyl phthalate) is observed after 400 ml of test sample, but no breakthrough is observed for other phthalates - up to DOP (Di-octyl phthalate) - within 1,000 ml). Exxon does not report having checked the possibility of breakthrough after 3 litre samples. The ECPI (1998a) asserts “excellent recoveries using this extraction procedure”, but does not give any hint on this possible breakthrough problem.
The reported extraction efficiency (mean recovery 94%) is in fact highly variable (range 67-137% on 3 samples, standard deviation 38%). It was measured on a sample spiked at 0.68 µg.l-1, i.e. at the maximum solubility reported. Time elapsed between spiking and extraction is not stated, but is probably much shorter than for samples (3 to 9 days). Extraction efficiency could be very different in these conditions, since adsorption and biodegradation can occur relatively quickly during storage at room temperature (Furtmann, 1994; Schouten et al., 1979).
3. above data are indicative of a strong dependency of Sw on water quality (hardness, pH, presence of sediments; Sullivan et al., 1982), which is not surprising with a strongly hydrophobic substance. Exxon did not use distilled water, but “unbuffered carbon treated water”. pH has been noted as 8.07 (day 9).
The HSDB (1997) mentions that important mechanisms of transport in the aquatic environment “are adsorption onto suspended solids and particulate matter and complexation with natural organic substances, such as fulvic acid, to form water-soluble complexes or emulsions”. These phenomena could strongly influence the apparent water-solubility of DINP in natural media, compared to distilled water. ECPI (1998a) states, however, that “the carbon-treated well water used in this study [selected because it provided a lower background signal] possesses a very low total organic carbon (TOC) of < 1 mg.l-1. Consequently, DINP complexation to TOC is not expected to be significant.”
Further studies confirmed the results by Exxon Biomedical Sciences (1996a).
Letinski et al. (1999) studied the water solubility of DINP and DnNP (di-n-nonyl phthalate) in a slow-stir apparatus. The loading of the substances was 1 mg/l. Test vessels were stirred at 20-22°C in a manner that prevented the formation of a vortex in the water column. The equilibration period lasted up to 16 days. Samples were taken in triplicate from the bottom port of the vessels and extracted using an all glass extraction-filtering apparatus (HPLC mobile phase filter flask) fitted with an extraction disk. The solubility was found to be 0.11 and 0.13 µg.l-1 for DINP and DnNP, respectively.
The solubility of Di-n-decyl phthalate (DnDP) was determined by Ellington (1999) in a slow-stir apparatus. 100 µl of DnDP was added to the surface of 6 litres of water and the stirring rate was adjusted to move the droplet of phthalate on the surface of the water at approximately 10 cm/min. 0.5 l samples were extracted at different time intervals for analysis. Equilibrium was established within the first 18 hours of stirring and little change was observed at sampling times 120, 150 and 753 hours. The mean result of 4 measurements was 0.22 µg/l. Furthermore, “No-stirring” water solubility experiments were conducted in a manner identical to the “slow-stirring” experiments except the stirrer motor remained “off”. Equilibrium was attained within 353 hours. The mean water solubility was determined to be 0.16 µg/l.
20

CHAPTER 1. GENERAL SUBSTANCE INFORMATION
Conclusions on water solubility
Based upon the above results, it can be considered that the “true” water solubility of DINP is approximately 0.6 µg/l. This value will be used in the risk assessment.
Nevertheless, it has to be kept in mind that the substance forms stable emulsions and that apparent water solubility’s up to a maximum of 1 mg/l can be observed. This explains the diverging results found in the “older” studies and also how many of the aquatic toxicity tests could be performed.
1.3.8 Henry’s law constant
A Henry’s law constant of 1.4-2.0 Pa.m3/mole (at 25°C) has been calculated with the (Q)SAR programme (Quantitative Structure-Activity Relationship), developed at the Syracuse Research Corporation (SRC, 1994). According to the Technical Guidance Document (EC, 1996), hereafter referred to as TGD, this (Q)SAR method only applies to highly soluble substances.
Therefore, the Henry’s law constant (H) is estimated as follows (TGD):
H = (vapour pressure.molecular weight)/solubility
The Henry’s constant for DINP is approximately 41.4 Pa.m3/mol and the deduced log H=1.6 will be used in the risk assessment.
1.3.9 Partition coefficient n-octanol/water
Scherf (1995) measured DINP log Kow from HPLC retention times. The sample studied, referred to as “Palatinol N”, is in principle DINP 2, but not formally identified later on. It is very probably the one identified in his following tables as “C8/C10-phthalate”, with a log Kow of 9.30, outside the range within which the method has been proved reliable (i.e. log Kow from 0 to 6). The graphs accompanying the report show a strong linearity of log Kow vs. molecular weight in the phthalate series (Figure 1.2).
Data by Scherf (1995)
y = 0,0405x - 7,7638 R 2 = 0,9617
5
6
7
8
9
10
11
12
13
14
15
300 400 500
log Kow Linear (log Kow)
Figure 1.2 Relationship between molecular weight vs. log Kow, using data from Scherf (1995)
21

EU RISK ASSESSMENT REPORT – DINP FINAL REPORT, 2003
Using Scherf's (1995) reported data; the following relationship is obtained (using Excel 5TM):
logKow = 0.0405.MW - 7.7638 (R2 = 0.9617)
which gives a value of 9.27 for DINP.
The Kow of Di-n-decyl phthalate (DnDP) was determined in a slow-stir apparatus (Ellington, 1999). DnDP was dissolved in 50 ml of octanol at a concentration of 35-75 mg/ml and added to the surface of 10 litres of water. The stirring rate was adjusted to create a vortex of approximately 1 cm at the octanol/water interface. 1 l water samples were extracted at different time intervals for analysis. Equilibrium was established within the first 20 hours of stirring and little change was observed at different sampling times up to 336 hours. The mean result of 4 measurements is logKow=8.83. Furthermore, “No-stirring” water solubility experiments were conducted in a manner identical to the “slow-stirring” experiments except the stirrer motor remained “off”. Equilibrium was attained within 39 hours. Measurement continued up to 263 hours. The mean logKow was determined to be 9.27 µg/l. After the 263 hours, the “slow-stirring” was started and continued for 118 hours. The aqueous layer was sampled 1 hour after stirring was stopped and a logKow of 8.45 was determined. The aqueous layer was sampled again at 24 and 144 hours and logKow-values of 8.92 and 8.93 were determined, respectively.
The logKow value of the main components of DINP 1, 2 and 3 can also be estimated by (Q)SAR methods, e.g. SRC (1994):
Chain structure logKow
- Trimethylhexyl 9.08 - Dimethylhexyl 9.23 - Methyloctyl 9.37 - Methylethylhexyl 9.23
The measured value is outside the validation range of the method used. The measurement of partition coefficients of highly lipophilic substances is problematic and the currently available OECD methods are not adapted for such compounds. The result from the “slow-stir” method is therefore to be preferred. As can be seen in the above table, the chain structure has an influence on the result. The expected Kow-value for DINP is therefore probably lower than for DnDP. For risk assessment purposes, the measured value of log Kow=8.8 will be used in the risk assessment.
More specific data are nevertheless available for estimating the environmental partitioning behaviour and these will be used preferentially (cf. Section 3.1.1).
22

CHAPTER 1. GENERAL SUBSTANCE INFORMATION
1.3.10 Flash point
Table 1.14 Flash points of DINPs
Sample Data (°C) Method Reference
DINP 1 > 200 ASTM D 93 Exxon Chemical Europe (1994)
DINP 1 213 - Exxon Chemical (1995)
DINP 1 236 (open cup) 221 (closed cup)
- ICI (1994)
DINP 2 > 200 ASTM D 93 Exxon Chemical Europe (1992a)
DINP 2 240 DIN-ISO 2592 BASF (1994b)
DINP 2 ca. 200 DIN 51 758 Hüls (1986)
DINP 3 238 DIN-ISO 2592 BASF (1994a)
Palatinol DINP (DINP 3 ?) 232 (open cup) DIN ISO 2592 BASF (1992b)
Palatinol DINP (DINP 3 ?) 200 DIN ISO 2592 BASF (1982a)
Genomoll 150 ca. 230 DIN 51 584 Hoechst (1973)
Flash point measurement may strongly depend on the presence of lighter components, the proportion of which may vary between 1.5% (BASF, 1983) and 6% (BASF, 1987a).
1.3.11 Auto flammability
Auto-flammability temperatures have been measured in the range from 305°C (BASF, 1987b) to ca. 400°C (Hüls, 1986). A representative value is ca. 380°C.
1.3.12 Viscosity
Selected values are indicated in the following table.
Table 1.15 Selected values of viscosity of DINPs at 20°C
Sample identity Value (mPa.s) Method Reference
DINP 1 ≥ 100, ≤ 110 ASTM D 445 Exxon Chemical Europe (1994)
DINP 2 ≥ 72, ≤ 82 ASTM D 445 Exxon Chemical Europe (1992a)
DINP 2 100 - 110 DIN 51562 BASF (1996a)
DINP 3 150 - 175 DIN 51562 BASF (1994b)
Palatinol DINP (DINP 3 ?) 100 – 110 (106, measured)
DIN 51 562 BASF (1992b)
Viscosity decreases strongly with increasing temperatures (ca. 7.6 mPa.s.K-1: an error of only 1°C on temperature around 20°C makes an error of around 8 mPa.s on viscosity; BASF, 1992b). It is also very sensitive to the presence of impurities. This may explain the scattered results observed.
23

EU RISK ASSESSMENT REPORT – DINP FINAL REPORT, 2003
1.3.13 DINP type can not be warranted from physico-chemical properties
At first sight, because of the wide ranges of values generally reported, most of the physico-chemical data cannot be used to identify the type of DINP being examined. The properties that seem least unexplainable for such identification would be melting point, density, and viscosity, whose typical values and ranges are summarised in Table 1.16.
Table 1.16 Summary of physico-chemical properties that could seem best to use to attribute a DINP type to a DINP sample
Sample type MP (°C) Typical value (range)
Density (g.cm-3) Typical value (range)
Viscosity (mPa.s) Typical value (range)
DINP 1 -46 (-48, -44) 0.973 (0.970 - 0.974) 100 (100 - 110)
DINP 2 -50 (-54, -42) 0.975 (0.970 - 0.977) 80 (72 - 110)
DINP 3 -43 (-46, -40) 0.978 (0.970 - 0.983) 165 (100 - 175)
This table shows that none of these properties can be used to place with certainty a DINP sample in a given category (DINP 1, 2 or 3). The most reliable data would be viscosity, for which typical values were indicated by DINP producers (Figure 1.1). The ranges of reported values, however, especially in the case of DINP 3 samples, render even this parameter unusable.
1.3.14 Summary of physico-chemical properties
Table 1.17 Summary of physico-chemical properties
Property Value
Melting point ca. -50°C
Boiling point > 400°C
Density ca. 0.975 at 20°C
Vapour pressure 6.10-5 Pa at 20°C
Water solubility 0.6 µg/l at 20°C
Henry’s law constant 41.4 Pa.m3/mol
Log Kow 8.8
Flash point > 200°C
Autoflammability ca. 380°C
Viscosity ca. 100-150 mPa.s
1.4 CLASSIFICATION
Classification according to Annex I of Directive 67/548/EC: Not classified.
24

25
2 GENERAL INFORMATION ON EXPOSURE
2.1 PRODUCTION PROCESS
DINP is produced by esterification of phthalic anhydride with isononyl alcohol in a closed system. Isononyl alcohol used in the synthesis of DINP is produced via either the dimerization of butene or the oligomerization of propylene/butene (cf. Figure 1.1). The reaction rate is accelerated by elevated temperatures (140-250°C) and catalyst. Following virtually complete esterification, excess alcohol is removed under reduced pressure and the product is then typically neutralised, water washed and filtered.
2.2 PRODUCTION, IMPORT, EXPORT AND CONSUMPTION VOLUMES
Data from producers/importers are included in the IUCLID-database. These are listed in Table 2.1.
Table 2.1 List of producers/importers having submitted a HEDSET diskette
BASF AG, Germany
Hüls AG, Germany
Exxon Chemical, The Netherlands
ICI C&P, France
Lonza/Alusuisse/Enichem, Italy
Minor producers were identified. The different DINP-types produced by the different manufacturers are summarised in Table 1.2 in Section 1.1. ICI C&P in France has stopped production in 1995.
According to the data provided by the producers (ECPI, 1997a), the total production volume in the EU was 185,200 t/a as of 1994. An estimated import volume of 5,400 t/a was obtained from existing inventories from the previous year and approximately 83,400 t/a were exported outside the EU. Consequently, the estimated consumption volume in 1994 is ca. 107,200 t/a. This value is in reasonable agreement with the estimated mean consumption of DINP in Western Europe from 1990-1995 of ca. 121,000 t/a (Legrand, 1996).
Based on estimations by the producers, the evolution of the consumption volumes of DINP (t/a) in Western Europe over the last decades is (Exxon Chemical Europe, 1999):
Year: 1964 1970 1975 1980 1985 1990 1994 Volume (t/a): 30,000 40,000 50,000 70,000 80,000 100,000 107,000
A further increase of the consumption of DINP is to be expected over the following years.

EU RISK ASSESSMENT REPORT – DINP FINAL REPORT, 2003
2.3 USES
According to ECPI (1997a), approximately 95% of DINP is used in PVC applications. The remaining 5% is used in non-PVC applications. More than half of the DINP used in non-PVC applications involves polymer related-uses (e.g. rubbers). The remaining DINP is used in non-polymer applications including inks and pigments, adhesives, sealants, paints and lacquers and lubricants.
This is confirmed by the Swedish, Danish and French product registers. In 1994 and 1995, approximately 550-700 tonnes of DINP were included in preparations in the Swedish market (KEMI, 1997). The indicated non-PVC uses are: adhesives and glues (mainly for the industry for transport equipment as well as the industry for wood and wood products), dyestuffs and pigments, paints and varnishes (printing industry and metal coating industry) as well as sealing compounds (industry of transport equipment and construction industry). None of these products were accessible to consumers. Among the 450 tonnes of DINP in preparations in the Danish market in 1996, most are included in adhesives and printing inks (Arbejdstilsynet, 1996).
In the absence of more precise quantitative assignment of use categories, it will be assumed that for non-polymer related uses; the quantities are evenly distributed among adhesives, glues and sealing compounds, inks as well as paints. Taking into account these assumptions, the amounts of DINP used in various applications in Western Europe are listed in Table 2.2.
Table 2.2 Estimated amount of DINP used in various PVC and non-PVC applications
Application Industry category Amount (t/a)
PVC end uses Polymer industry (IC = 11) 101,500
Non-PVC end uses 5,500
Polymer related Polymer industry (IC = 11) 2,750
Non-polymer related adhesives, glues and sealing compounds inks paints
Engineering industry (IC = 16) Pulp, paper and board industry (IC = 12) Paints and varnishes industry (IC = 14)
2,750 915 915 915
Total consumption 107,000
The appropriate use category is softeners (UC=47).
The PVC end use split for all phthalates according to Cadogan et al. (1994) as well as an estimation for DINP is shown in Table 2.3.
26

CHAPTER 2. GENERAL INFORMATION ON EXPOSURE
Table 2.3 PVC end use split for all phthalates and estimation for DINP Cadogan et al. (1994)
Application * Consumption of phthalates [t/a]
Consumption of DINP [t/a]
Percentage
Total consumption in PVC 877,000 101,500
Calendering Film, sheet and coated products 138,000 15,936 15.7 Flooring, roofing, wall covering 31,000 3,552 3.5
Total 19,488
Extrusion Hose and profile 47,000 5,379 5.3 Wire and cable 251,800 29,020 28.7 Clear, medical, film 62,400 7,125 7.1
Total 41,524
Injection moulding Footwear and miscellaneous 72,800 8,313 8.3
Plastisol spread Coating Flooring 92,000 10,658 10.5 General (coated fabric, wall covering, etc.) 100,000 11,571 11.4
Total 22,230
Other plastisol applications Car undercoating and sealants 67,000 7,714 7.6 Slush/rotational moulding etc. 17,000 1,929 1.9
Total 9,643
Type of PVC products and lifetimes
For the estimation of the releases to the environment through articles containing DINP, it is necessary to estimate the amount of substance included in articles being used outdoors or indoors. Based on the values reported in Table 2.3, some products can be recognised for outdoor or indoor use. The flooring is supposed to be used indoors. Car undercoating (7,714 t/a) is used outdoors. Footwear and miscellaneous (8,313 t/a) are assumed to be used outdoors. The use of wires and cables is supposed to be distributed evenly to outdoor (14,510 t/a) and indoor (14,510 t/a) use. For the other types of products, an industry survey for DEHP (di-ethylhexyl phthalate) was performed. 78% of the phthalate containing PVC-products are used in indoor applications and the remaining 22% in outdoor applications (BASF, 1999a). The approximate amounts of DEHP used in PVC for different outdoor applications are found in Table 2.4, based on figures provided by BASF (1999a). The respective amounts of DINP can be estimated based on phthalate-market shares of 51% for DEHP and 12% for DINP (Cadogan et al., 1994).
The Danish EPA (Miljöstyrelsen, 1996) reported technical lifetimes for different product groups. For PVC in cars the lifetime was estimated to be 16 years, for different building materials 10-20 years, and for roof coating 20 years. For roofing material BASF (1999a) gives a lifetime of 20 years. For coil coating 10 years is used (ECPI, 1998b). In this assessment 25 years is used for both roof and wall coating. For cables and wires the lifetime was estimated to be 10-50 years. In this assessment the average, 30 years, is selected. The technical lifetime for a building is assumed to be 100 years (no reference). No lifetime is available for fabric coating. However, it is assumed to be 10 years. According to ECPI (1998b), the lifetime for flooring is 10 years. However, according to a producer (Tarkett-Sommer, 1999) is 20 years a more realistic lifetime.
27

EU RISK ASSESSMENT REPORT – DINP FINAL REPORT, 2003
The different lifetimes reported and the values used in this risk assessment are summarised in Table 2.4.
Table 2.4 Volumes of DEHP and DINP in different applications of PVC-products and their respective lifetimes
Technical lifetime Application Tonnage DEHP t/a
Tonnage DINP t/a
ECPI (1996)
BASF
(1999a) Miljöstyrelsen
(1996) Other Used in the
RAR
Indoor application Coated products 7 - - - 7 Film & sheet 7 - 1-5 2) - 7 Wires & cables 14,510 10-30 30-50 - 30 Hoses & Profiles 10 1) - 1-10 20 3) 20 Floor 10,658 10 - - 20 3) 20
Outdoor application Roofing material 1,000 230 4) - 20 - - 20 Roofing (coil coating) 5,000 1,150 4) - 10 - - 10 Wires & cables 14,510 - 10-30 30-50 - 30 Coated fabric 21,000 4,850 4) - 10 - - 10 Hoses & Profiles 6,000 1,380 4) - 10 - - 10 Car under-coating 7,714 - 12 16 - 14 Shoe soles 8,313 - 5 - - 5 Sealings 915 20 Paints & lacquers 915 7
1) Assumed to be the same as for flooring 2) PVC-foils 3) Tarkett-Sommer (1999) 4) Estimated from DEHP, based on market shares
28

29
3 ENVIRONMENT
3.1 ENVIRONMENTAL EXPOSURE
3.1.1 Environmental fate
As DINP is an isomeric mixture, the fate and behaviour of the substance cannot be determined with accuracy. Each component of the mixture would tend to have different characteristics concerning its fate and behaviour in the environment. Nevertheless, an overall picture can be drawn, as presented below. As has been shown above with e.g. the estimations of the Kow, the differences in behaviour between the different components should be rather limited and it can therefore be considered that it is possible to perform a risk assessment by using overall average properties of the substance.
Based on the physical chemical properties of DINP, the preferred target compartments in the environment at equilibrium are soil and sediment.
3.1.1.1 Degradation
Hydrolysis
No experimental data on hydrolysis are available. Due to the low solubility of DINP a test on hydrolysis is not feasible. Based on results with other phthalate esters, it can be concluded though that hydrolysis is not a significant transformation process in the environment (Staples et al., 1997).
Photodegradation in air
Indirect photolysis takes part in the atmospheric removal of DINP. No experimental value is available for DINP products. A specific degradation rate constant with OH radicals (concentration of 5.105 molecules.cm-3) can be calculated with the Atmospheric Oxidation Program (AOP, version 1.5, SRC, 1994), to 2.3.10-11 cm3/(molecule.s). The half-life is estimated to be 0.7 day.
With this result the following first order rate constant for photodegradation in air can be calculated:
kdeg air = 0.99 d-1
Biodegradation
Several results from standard test systems, where mineralisation is determined, are available:
• A recent manometric respiratory study (OECD guideline 301 F) realised in 1995 with DINP 1 shows ready biodegradability: 70.5% degradation after 28 days. The 10-day window criterion was achieved (Exxon Biomedical Sciences, 1995).
• In a modified Sturm test (OECD guideline 301 B) with DINP 1, the pass criterion was barely missed: 57% degradation after 28 days (Exxon Biomedical Sciences, 1996b).

EU RISK ASSESSMENT REPORT – DINP FINAL REPORT, 2003
• For DINP 2, a positive result was obtained in a modified Sturm test: 81% degradation after 28 days. The 10-day criterion has been reached in only one of the two test series, but also based on the mean results of the two test series (Hüls, 1995b).
Furthermore:
• O’Grady et al. (1985) also tested DINP (equal proportion blend of DINP supplied by different US manufacturers) for inherent biodegradation in a Semi-Continuous Activated Sludge test (SCAS). 68% were degraded after 24 hours. These results were achieved after a 21-day draw and fill procedure.
• 62% degradation of DINP (equal proportion blend of DINP supplied by different US manufacturers) was achieved after 28 days in a shake-flask test with adapted inoculum (Suggat et al., 1984).
• In treated wastewater, di-n-nonyl phthalate was degraded at 91% after 7 days. The initial concentration was 3 µg/l. The DT50 was < 1 day and the DT90 was < 3 days. The test was performed at 25°C. Only the disappearance of the parent compound was determined and the degradation products were unknown (Furtmann, 1993).
• In Rhine water di-n-nonyl phthalate was totally degraded after 7 days. The initial concentration was 0.2 µg/l related to the test substance. The DT50 was < 1 day and the DT90 was < 3 days. The test was performed at 25°C. Only the disappearance of the test compound was determined and the degradation products are unknown (Furtmann, 1993).
• One negative result was found in a sediment water study (water / sediment ratio: 9/1) by Johnson et al. (1984). Only 1% degradation was recorded after 28 days.
Based on the results from the tests on ready biodegradation (2 positive results out of 3), it can be concluded that DINP is readily biodegradable.
Based on the fact that DINP is an isomeric mixture, it could be argued that there are some components of DINP that are resistant to biodegradation. Especially the result in the modified Sturm test (81% biodegradation after 28 days) would indicate that this is not the case. The measured parameter for biodegradation is production of CO2, and as the substance is the only source of carbon, some carbon is integrated into the biomass and not available for CO2 production. Therefore, the probability that some components of DINP are resistant to biodegradation is very low. This is further confirmed by the results obtained with the corresponding isomeric alcohols. Exxon Biomedical Sciences (1997a;b) performed biodegradation tests with isomeric C8-alcohols (CAS 91994-92-2) and C10-alcohols (CAS 93821-11-5) in the manometric respirometry test (OECD guideline 301F). The degradation of the C8-alcohol reached 82% after 28 days and the C10-alcohol reached 71% after 28 days. While the degradation-curve for the C8-alcohol had reached a plateau, the curve for the C10-alcohol was still on the upward trend.
Based on the results with DEHP (EC, 2001), it can be assumed that the most relevant intermediate metabolite is monoisononyl phthalate. As this compound is less hydrophobic and therefore more bioavailable than the parent compound, it would be important to consider it in the risk assessment. But, as no effect data are available, it can only indirectly be taken into consideration. The assessment will therefore be performed with the parent compound. The biodegradation rates are derived for mineralization, thereby including the degradation of the
30

CHAPTER 3. ENVIRONMENT
mono-ester. For bioaccumulation, special care is taken to include if possible the monoester in the estimations.
According to the TGD, based on the OECD screening tests, a rate constant of 1 h-1 can be extrapolated for sewage treatment plants (STP).
For surface water, a half-life of 15 days could be extrapolated. The negative result in the presence of sediment can be explained by the reduced availability due to adsorption.
The simulation test on biodegradation of DINP in surface water of Furtmann (1993) cannot be considered in this risk assessment as the test was performed at 25°C and only primary biodegradation was determined. A realistic biodegradation rate constant for surface water cannot be deduced from this test result. The results indicate though that the substance continues to degrade at low i.e. environmentally relevant concentrations. Based on a limited amount of results from surface water simulation tests, a mineralization half-life of 50 days was derived for DEHP taking account of temperature adjustment (EC, 2001). In a first approach, the same half-life in surface water of 50 days will be used for DINP.
For soil and sediment, no results are available. For soil, the extensive database from DEHP could be used to extrapolate a biodegradation rate constant for DINP. A realistic worst-case half-life for mineralization of 300 days can be derived for DEHP (EC, 2001).
This very conservative value is furthermore confirmed by a study available for DINP. Seven cultured soils from the area of Roskilde in Denmark were investigated for phthalate concentrations (Vikelsoe et al., 1999). At each location two soil cores 50 cm in depth were taken, each profile being divided into 5 sub samples of each 10 cm. One location, which was heavily amended with sewage sludge, was sampled two years after the first analysis. No sludge had been used on this site in the meantime. Di-n-nonyl phthalate as well as diisononyl phthalate was determined:
Table 3.1 Phthalate concentrations in cultured soils in Denmark
Depth (cm) DnNP (µg/kg dw) DINP (µg/kg dw)
Sludge amended with high amounts for 25 years, changed to artificial fertiliser 6 years before sampling, cattle grazing
0-10 10-20 20-30 30-40 40-50
160 200 200 180 120
130 220 200 96 93
Same location sampled 2 years later 0-10 10-20 20-30 30-40 40-50 50-60
120 160 210 290 210 84
410 540 670 910 280 63
No significant decrease in the concentrations could be observed. The same trend was observed for DEHP which was also included in this study. This could be explained by a non-homogeneous distribution of the substances in the soil. Furthermore, it is possible that a high proportion of the phthalates is present in the form of PVC particles (see Section 3.1.2.1 on waste remaining in the environment) and that further leaching out of these particles maintains a high level of extractable compounds in soil over a longer period of time. Other factors may influence the availability of
31

EU RISK ASSESSMENT REPORT – DINP FINAL REPORT, 2003
the compounds to biodegradation though. In a first approach, it is therefore proposed to use the same half-life of 300 days in soil for DINP in this risk assessment.
The same half-life can be used for aerobic sediment. For anaerobic sediment a degradation rate constant of 0 d-1 will be used. This is confirmed by the findings of Furtmann (1993) in datable sediment profiles suggesting that DEHP is only broken down very slowly in an anaerobically sealed stratified sediment and that high levels are still detectable years later.
A total half-life of 3,000 days (i.e. ksed=0.00023 d-1) can therefore be derived for DINP in the whole sediment column.
The following biodegradation rates can be deduced:
Table 3.2 Estimation of biodegradation rate constants in the different compartments
Compartment / medium Biodegradation rate Half-lives [day]
Surface water ksw = 0.014 d-1 50
Sediment ksed = 0.00023 d-1 3,000
Soil ksoil = 0.0023 d-1 300
Elimination in sewage treatment plants (STPs)
Based on the above cited physico-chemical properties (log H=1.6, log Kow=8.8, Koc=286,000 l/kg, see below) as well as the biodegradation rate of 1 h-1 in a STP, the elimination through biodegradation and distribution can be estimated with the model SIMPLETREAT included in the program EUSES:
Table 3.3 Estimation of removal of DINP in a STP according to SIMPLETREAT
% to air 1
% to water 7
% to sludge 82
% degraded 10
% removal 93
These values are retained for the calculation of PEClocal in water and soil through sludge application, as no simulation test and no monitoring data in STPs are available.
3.1.1.2 Distribution
Adsorption-Accumulation in soil
No soil accumulation test has been performed with DINP. One test has been performed for DIDP in sediment though (Williams et al., 1995). The experimental conditions have been described in detail. A Koc value of 286,000 l/kg is the mean obtained from experiments with three different sediments and radiolabeled 14C-DIDP.
32

CHAPTER 3. ENVIRONMENT
The three sediment types are the following:
OC Sand Silt Clay CEC pH Koc [l/kg] [%] [%] [%] [%] [meq/100g] EPA 8 0.15 82.4 6.8 10.7 3.72 8.32 111,000 EPA 18 0.66 34.6 39.5 25.8 15.43 7.76 601,000 EPA 21 1.88 50.2 7.1 42.7 8.33 7.60 145,000
The lowest result was obtained with a low organic carbon content (the OECD Guideline 106 suggests an organic carbon content of 0.6-3.5%). However the mean value of 286,000 l/kg provides a reasonable estimate for DIDP. As very similar results have been found in this study for DEHP, this value can be used for the estimation of the behaviour of DINP in soil and sediment.
For the different media, using the standard organic carbon contents proposed in the TGD, the water-solids and total compartments-water partition coefficient can be estimated. The results are presented in the following table.
Table 3.4 Partition coefficients between different compartments
Compartments OC content (%) of solid phase
Solid water partition coefficient
Total compartment - water part. coefficient
Soil-water 2 Kp_soil = 5,720 l/kg Ksoil_water = 8,580 m3/m3
Sediment - water 5 Kp_sed = 14,300 l/kg Ksed_water = 7,150 m3/m3
Suspended matter - water 10 Kp_susp = 28,600 l/kg Ksusp_water = 7,150 m3/m3
3.1.1.3 Bioaccumulation
Bioaccumulation in aquatic organisms
Very few data are available regarding the bioaccumulation of DINP in biota. The relevant results obtained with DIDP and DEHP are therefore also taken into consideration.
One study is available characterising the bioconcentration of 14C labeled DINP in the mussel Arca zebra. A BCF of 680 has been determined after 24 hours. A steady-state BCF (mussel) was estimated to be 1,844 assuming first order kinetics. However a mixture of two substances has been evaluated the interaction between these two substances is not known.
One test has been performed involving non-radio labeled DIDP (CITI, 1992). A BCF of < 14.4 for fish (Cyprinus carpio) has been determined according to the OECD guideline 305 C. In the same test system, a BCF of 1.3-29.7 was determined for DEHP. Much higher BCFs have been determined with DEHP in fish in other assays (cf. EC, 2001). A BCF of 840 for fish was retained in the risk assessment for DEHP (cf. also below).
In a preliminary monitoring study in the Seine estuary in France, water samples and mussel samples were analysed from the same locations (Elf Atochem, 1997). At one location, the content of DINP could be quantified simultaneously in water and mussels at respectively 1.1 µg/l and 75 µg/kg wwt. This would indicate a BAF of 68. As only one sample was taken per location, it is not possible to determine whether these values are representative over a longer period of time.
33

EU RISK ASSESSMENT REPORT – DINP FINAL REPORT, 2003
BCF values of 90 to 147 in daphnids have been measured by Brown and Thompson (1982a) with DIDP based on total radioactivity. The concentration in the water phase (mean values of 2.9, 9.6, 32.5 and 100.3 µg/l) was also determined by measuring radioactivity.
In mussels (Mytilus edulis), high BCF values of 3,000-4,000 were measured with DIDP by Brown and Thompson (1982b) in a flow-through system over 28 days. Steady state concentrations were achieved after 14 days. The concentration in the water phase (4.4 and 41.7 µg/l) as well as in mussels were determined by measuring total radioactivity.
As the exposure concentrations were clearly above water solubility, the organisms were probably simultaneously exposed through the water phase as well as through undissolved particles of DIDP and DIDP adsorbed to algae which were added as food to the test system.
In a different test system, a BCF=0.6 was determined for DINP in sediment organisms, also based on total radioactivity (Brown et al., 1996). This value is not comparable to the above results though, as the BCF is related to the total sediment concentration and because the concentration in midges was determined in the emerging animals (the concentration in the shells was therefore not taken into consideration).
The use of BCF values based on total radioactivity may give an overestimation of the BCF due to the fact that the metabolism of DINP was not taken into account as both 14C-DINP and any 14C-labeled metabolites of DINP were measured (including 14C built into the tissue of the organism in e.g. fatty acids). On the other hand, in the test system with mussels reported above, the concentration in the water phase was also determined by radioactivity. As the measured concentrations were far above the water solubility, the bioavailability of the compound in the test system may have been much lower and therefore the bioaccumulation might be underestimated.
Furthermore, it has to be recognised, that by basing the results on the respective concentration of the parent compound, the major metabolite, i.e. the mono-ester MINP, is neglected. A BCF that would include the mono-ester could be somewhat higher, but could be expected to be lower than the BCF values measured with 14C-labeled material.
One bioaccumulation study is available with DEHP, in which also the metabolites were determined. The bioaccumulation of carbonyl-14C-labeled DEHP in adult fathead minnows (Pimephales promelas, mean fwt 1.24±0.31 g) was investigated in a flow-through study (Mehrle and Mayer, 1976; Mayer, 1977). Test concentrations of DEHP were 1.9, 2.5, 4.6, 8.1, 14, 30 and 62 µg/l (mean measured). The fish were exposed to DEHP for 56 days at 25°C, followed by a depuration phase of 28 days.
Besides the parent compound, the major metabolite found in the fish tissues was MEHP, accounting for 12-50% of the recovered residues after the exposure period. The proportion of MEHP increased with the exposure concentration. The data presented in Table 3.5 represent the level of residues in fish after 56 days of exposure in a flow-through study. The composition of residues in water was not reported in the study, since the concentrations were measured radiometrically only.
34

CHAPTER 3. ENVIRONMENT
Table 3.5 Level of residues in fish after 56 days of exposure in a flow-through study
Residue composition in fish after 56 days (% of total recovered)
Conc. in water (µg/l)
DEHP MEHP Phthalic acid MEHP conjugate
Phtalic acid conjugate
Other
1.9 79 12 2.5 4.1 1.2 1.2
2.5 70 24 1.7 2.2 1.1 1.0
4.6 69 23 4.1 1.2 0.6 2.1
8.1 70 21 5.4 1.0 1.2 1.4
14 60 30 3.6 0.6 5.1 0.7
30 42 40 11 0.4 6.6 0.3
62 33 50 5.7 0.4 9.8 1.1
Bioaccumulation factors based on total residues, DEHP+MEHP, and DEHP in fish, respectively, with exposure concentration in the water given as total 14C are given in Table 3.6.
Table 3.6 Bioaccumulation factors after 56 days
Mean exposure conc. (µg/l) BCF total 14C BCF DEHP+MEHP BCF DEHP
1.9 737 670 582
2.5 880 827 616
4.6 891 820 614
8.1 444 404 311
14 357 321 214
30 287 235 121
62 155 129 51
At concentrations higher than ca. 5 µg/l, the BCF was inversely correlated with the test concentrations. However, in the two highest test concentrations, steady state does not seem to have been reached during the 56 days of exposure.
As can be seen from the above results, the BCF based on 14C and the BCF based on total DEHP + MEHP concentrations are not significantly different.
Conclusion
As shown above, the results based on total radioactivity can be used to determine a BCF of DIDP in aquatic organisms. The BCF value for DIDP for mussels of 4,000 based on 14C measurements can therefore be used in the risk assessment for secondary poisoning of DINP.
For indirect exposure to humans via the environment, the assessment should preferably be based on a BCF for fish as the latter is more representative regarding the food consumption in the EU. In a first approach, the BCF for fish of 840 retained for the risk assessment for DEHP will be used for the assessment of the exposure of humans via the environment.
35

EU RISK ASSESSMENT REPORT – DINP FINAL REPORT, 2003
Bioaccumulation in soil organisms
Very low bioaccumulation was also observed with earthworms (Eisenia Foetida). A BCF of ca. 0.01-0.02 was observed in a 14-day toxicity test (Exxon Biomedical Sciences, 1996c). But the test concentrations in soil were very high (up to 10,000 mg/kg) and it is not clear whether a steady state was achieved.
In a further test with DEHP a low bioaccumulation factor was also observed with Eisenia foetida in a 14-day test. Based on dry weights, the highest measured BCF was 0.2 (Hüls, 1998). Assuming a typical dry to wet weight conversion factor of 0.15 for earthworms and of 0.88 for soil, a BCF of 0.034 based on wet weights can be derived. In this second test the concentration in soil was somewhat lower (1,000 mg/kg) than in the test with DINP, but also in this test it is not clear whether a steady state was achieved.
A very low depuration rate of DEHP from earthworms of 0.04 d-1 has indeed been reported by Staples et al. (1997). Based on this first order depuration rate, it would appear that approximately 50% of the steady state tissue concentration is achieved in this time period. EUSES calculates a BCF worm of 25.1 kg/kg. As there is a difference of about three orders of magnitude between the measured and the estimated BCF value, it appears that the higher value is clearly an overestimation. In a first approach, based on the experimental results and the low measured depuration rate, a reasonable worst-case BCF of 1 will be used in the risk assessment.
Bioaccumulation in plants
No results are available regarding bioaccumulation of DINP or DIDP in plants. According to the TGD, a plant-water partition coefficient can estimated with:
Kplant-water = Fwaterplant + Flipidplant.Kowb
with: Fwaterplant volume fraction water in plant tissue 0.65 m3/m3 Flipidplant volume fraction lipids in plant tissue 0.01 m3/m3
b correction for differences between plant lipids and octanol
0.95
i.e. Kplant-water = 2.3.106 (mg/mplant3)/(mg/mwater
3).
Several studies were performed with other long-chain phthalate esters.
Overcash et al. (1986) studied the uptake of DEHP and Di-n-octyl phthalate (DOP) in fescue, corn, soybeans and wheat under greenhouse conditions. Plants were grown at different substance concentrations ranging between 0.044 and 4.4 ppm for DEHP, respectively 0.022 and 2.2 ppm for DOP. The uptake was monitored by measuring 14C in the plants, assuming that the 14C detected is the parent compound. The highest uptake was recorded with fescue and corn harvested, respectively 34 and 17 days after planting while lower uptake were observed in mature wheat and soybeans. The final soil concentration of DEHP was on average 25% of the initial applied concentration. The geometric mean between initial and final soil concentration could be used to derive a BCF. The highest uptakes were recorded for the highest soil concentrations.
Based on dry weights, the accumulation with DEHP is shown in Table 3.7.
36

CHAPTER 3. ENVIRONMENT
Table 3.7 Bioaccumulation factors in plants for DEHP Overcash et al. (1986)
Plant Initial soil conc. (mg/kg dw)
Final soil conc. (mg/kg dw)
Average soil conc. (mg/kg dw) *
Final plant conc. (mg/kg dw)
BCF
Fescue 0.044 ca. 0.011 ca. 0.022 0.028 1.3
Fescue 0.44 ca. 0.11 ca. 0.22 0.27 1.2
Fescue 4.4 ca.1.1 ca.2.2 3.2 1.4
Corn 0.044 ca. 0.011 ca. 0.022 0.009 0.4
Corn 0.44 ca. 0.11 ca. 0.22 0.022 0.1
Corn 4.4 ca.1.1 ca.2.2 4.6 2.1
Soybean 0.044 ca. 0.011 ca. 0.022 0.0 0
Soybean 0.44 ca. 0.11 ca. 0.22 0.012 0.05
Soybean 4.4 ca.1.1 ca.2.2 0.011 0.005
Wheat 0.044 ca. 0.011 ca. 0.022 0.0046 0.21
Wheat 0.44 ca. 0.11 ca. 0.22 0.030 0.14
Wheat 4.4 ca.1.1 ca.2.2 0.315 0.14
* Geometric mean
The uptake for DOP was ca. 1 to 2 orders of magnitude lower.
Aranda et al. (1989) also tested the uptake of DEHP under greenhouse conditions in lettuce, carrot, chilli pepper and fescue using 14C labeled DEHP. Four soil treatments with initial DEHP concentration in soil between 2.65 and 14.02 mg/kg dw were used. Approximatively 32% of the radioactivity initially applied remained in the soil 115 days after planting. Based on dry weight and initial soil concentrations, the average BCFs for lettuce, carrot tops, roots, chilli plants, chilli fruit and fescue were 0.47, 0.28, 0.13, 0.15, 0.08 and 0.24, respectively. Assuming an average decrease of 68% in soil over the uptake period, BCFs based on average soil concentrations would be approximately increased by a factor of 2 i.e. BCF=0.16-0.94. The parent DEHP was also measured in plant tissue and not detected. The measured 14C is therefore mainly to be attributed to metabolites and the estimated BCFs represent certainly an overestimation of the bioaccumulation for DEHP.
Schmitzer et al. (1988) studied the uptake of DEHP in barley and potatoes in outdoor experiments. As DEHP had completely disappeared from soil in the barley experiment, the results could not be used to derive a BCF. The initial and final soil concentrations were 1 mg/kg dw and 0.033 mg/kg dw, respectively, based on 14C measurements. The vegetation period was 111 days. For assessment purposes, an average concentration (geometric mean) of 0.18 mg/kg dw can be used for the BCF estimation, as shown in Table 3.8.
37

EU RISK ASSESSMENT REPORT – DINP FINAL REPORT, 2003
Table 3.8 Bioaccumulation factors in plants Schmitzer et al. (1988)
Sample Average soil conc. (mg/kg dw)
Plant conc. (mg/kg fresh w.)
Plant conc. (mg/kg dw.)*
BCF
Potatoes, peeled 0.18 0.077 1.08 6.0
Peel 0.18 0.032 0.45 2.5
Shoots 0.18 0.119 1.67 9.2
Roots 0.18 0.160 2.24 12.4
Plant total 0.18 0.076 1.06 5.9
* calculated based on TGD defaults These results are also based on 14C measurements, assuming that the 14C detected is the parent compound. The parent DEHP was also measured in plant tissue and not detected. The measured 14C is therefore mainly to be attributed to metabolites and the estimated BCFs represent certainly an overestimation of the bioaccumulation for DEHP. Laboratory experiments performed in parallel have shown that most of the radioactivity detected in shoots is due to 14CO2 uptake. It can therefore be considered that the BCF values for shoots are even more overestimated.
Kirchmann and Tengsved (1991) measured the concentration of DEHP in barley grains grown on sludge amended soil. The application rate of sludge was 5 tons dw/ha. The DEHP concentration in sludge was 116 mg/kg dw, and the resulting concentration in grains was 530 µg/kg dw. The DEHP found in the grain amounted to 0.22% of the dose from the sludge. The barley grown on N-fertiliser or pig slurry amended soil also contained DEHP at concentrations of 89-110 µg/kg, while no DEHP was detected in the fertiliser. The experimental area was not exposed for sludge before the experiment. This would indicate that a large portion of the DEHP in grains is due to air deposition (direct uptake and/or via the soil).
Discussion
Due to its high affinity to organic matter only a limited bioaccumulation of DEHP in plants is expected. The experimental studies confirm this with BCFs ranging between 0.005 and 12. The highest BCFs were observed on barley, corn and potatoes. Lower BCF values were obtained for lettuce, carrot (top), chilli plant, soybeans and wheat.
The study on potatoes (Schmitzer et al., 1988) shows similar BCF values in the whole plant. This indicates that DEHP was easily distributed from the root to the shoot. Since BCF in this case is based on 14C the relatively high BCF in shoots may be a result of a transport of degradation products.
The EUSES model calculates separate BCF for roots and leaves for DIDP. The BCF was calculated to 650 in plant roots and 10-4 in plant leaves. The model assumes that most of DIDP is physically adsorbed to the root and only to a minor part be transported to the leaves (based on Koc =286,000 l/kg and logKow=8.8). A comparison with experimental results indicates that this calculation is an underestimation of the BCF for the leaves and an overestimation of the BCF for the root. The experimentally derived results are rather uneven. It is therefore difficult to select a single value for the model. The highest value of 12 will therefore be used. Considering that the results are based on 14C-distribution considerably overestimates the real BCF as metabolisation is not taken into account.
38

CHAPTER 3. ENVIRONMENT
Using Kpsoil and an average bulk density of plant tissue RHOplant of 0.7 kg/l, a Kplant-water value can be estimated:
Kplant-water=BCF.RHOplant.Kpsoil.CFdry-wet=12.0.7.5,720.0.07=3,432 with CFdry-wet being the plant dry to wet weight conversion factor.
This value will be used for the indirect exposure of humans via the environment
3.1.2 Aquatic compartment
The environmental exposure assessment of DINP will be based on the expected releases of the substance during the following life cycle steps:
I. Production II. Distribution IIIa. Processing in PVC polymers IIIb. Processing in non-PVC polymers IIIc Additive for adhesives, glues and sealing compounds A/ formulation B/ application IIId Additive for inks (pulp and paper) A/ formulation B/ application IIIe Additive in paints A/ formulation B/ application IVa Exterior and interior use of DINP-containing PVC-products IVb Use of non-PVC polymers containing DINP IVc Applied adhesives, glues and sealing containing DINP IVd Paper recycling IVe Applied paints containing DINP V Disposal of endproducts
For life cycle stages I and III site-specific and/or generic emission scenarios are used for calculating the predicted environmental concentrations (PEC) values in the various compartments.
Stages II, IV and V can be regarded as diffuse sources of DINP. The emissions will be considered in PECregional calculations.
Site-specific scenarios are based on actual data from industry on emission patterns etc. whereas generic scenarios are fully based on model calculations for a realistic worst-case situation.
The exposure assessment is based on the TGD (EC, 1996). Regional concentrations are evaluated with the model SIMPLEBOX included in the program EUSES.
39

EU RISK ASSESSMENT REPORT – DINP FINAL REPORT, 2003
3.1.2.1 Releases to surface water
The following release estimates are based on emissions reported by the producers or estimated with emission factors given in the draft Use Category Document on Plastic Additives, hereafter referred to as UCD (BRE, 1998).
For every life stage the input in raw wastewater and a connection rate to wastewater treatment plants will be estimated. The removal will be considered for the continental, regional and local input in the water compartment. At the same time, the indirect input to air and sludge via the depuration step will be calculated and presented.
Production (life cycle step I)
In Section 2.1, it is mentioned that there are only 4 companies still producing DINP within the EU. For three producers (three production sites) specific production volumes and emission data were submitted to the rapporteur.
For the producers not having submitted releases to the surface water, the releases have been calculated with default values given in the TGD (0.3%).
A C D E
Release [t/a] 0.3 0.06 29 * 11 *
* No data received: releases are based on 0.3% emission factor Considering the 4 EU producers, the sum of the estimated and reported releases is considered as the continental release. As the number of production sites is very low, the regional releases due to production are supposed equal to the highest local release.
Input continental [t/a] Input regional [t/a]
Raw wastewater 41 29
Most producers indicated that sludge from the STP at the production site is incinerated. Therefore no soil contamination through sludge application for agricultural purposes is considered.
Distribution (life cycle step II)
The next step to consider in the life cycle of DINP is the distribution (e.g. road transport) of this substance.
Almost all DINP consumed in the EU is distributed via road tankers or by ship (Cadogan et al., 1994). In the estimate it was considered that 15% of the consumed phthalates are transported by ship and 85% by tank movement, the majority of which are supplied with sophisticated tank cleaning facilities.
Every roadload transports around 20 tonnes, and it was estimated that during one roadload 1 kg is lost (Cadogan et al., 1994). Considering these values for DINP transport of 107,000 t/a, there will be 90,950 tonnes transported by road in 4,550 hauliers, therefore 4.6 t/a will be emitted to the water compartment due to cleaning.
40

CHAPTER 3. ENVIRONMENT
16,050 t/a are estimated to be transported by ship. The chemical shipping industry is similar to the trucking industry in that it has very modern equipment and is well regulated. Product losses are estimated to be close to 0.3% (residues on tank walls, in lines and pumps etc.) (Cadogan et al., 1994). These residues are removed by cleaning with water and at most only 10% of them are emitted to the environment:
16,050.0.1.0.003=4.8 t/a.
The total DINP emission during distribution is 9.4 t/a due to transport. According to the TGD, it is assumed that 10% of the continental production and uses take place in a “regional” area.
Input continental [t/a] Input regional [t/a]
Raw wastewater 8.5 0.94
Processing in PVC (life cycle step IIIa)
As mentioned above, 101,500 t/a of DINP is used in PVC. In this context, a generic exposure scenario has been carried out with default values of the Use Category Document on Plastic Additives (BRE, 1998).
The initial losses will be to air inside the processing facilities; however subsequent condensation will result in losses to liquid waste. Neither BRE (1998), nor industry information specifies the partition to the different environmental compartments. In a first approach, the releases will be evenly distributed to air and wastewater.
The air treatment (percentages per processing step are documented in ECPI, 1996) will conduct to a lower emission of DINP into the environment; this will be taken into account in the estimation of the emission factor.
The basic processes used by the PVC industry are distinguished. Local emissions will be calculated for PEClocal estimations.
A: Raw materials handling
The handling of raw material from their arrival on site to their addition to polymers is undertaken by a variety of means. These include manual handling of bags and sacks, conveyor belts, etc.
DINP products are not notably volatile at room temperature, and thus no evaporation should be expected from ambient temperature handling. Minimal loss can therefore be assumed, this being most likely during transfer (e.g. splashing or accidental spillage).
The estimated release is 0.01% (on the basis of incidental losses), of which 50% are supposed to be released to wastewater:
Input continental [t/a] Input regional [t/a]
Raw wastewater 4.6 0.5
41

EU RISK ASSESSMENT REPORT – DINP FINAL REPORT, 2003
B: Compounding
Two general methods are used to prepare for the convenient processing of PVC. Dryblending, a process unique to PVC technology is used to prepare blends for extrusion, injection moulding and sometimes calendering. Plastisol blending is used to prepare plastisols, (approximately 30-35% of all plasticisers in PVC is applied in plastisol applications). A third route, rather obsolete but occasionally associated is Banbury mixing.
• Dryblending This method is based on suspension of mass grade PVC and typically consists of mixing all ingredients with a high speed rotating agitator which heats the material by friction. Temperatures of 100-200°C (max.) are reached and the liquid plasticiser is completely absorbed by the fine PVC powder grain. Gelling is carefully avoided by keeping the temperature at this level, so that a free flowing powder results. Residence times in the lidded blender are in the order of fifteen minutes and the hot blend is dropped in a cooling blender (also lidded) for rapid cooling to avoid lumping. During the last minutes the temperature rises fairly rapidly so that the period of temperatures over 100°C only covers a short time span, carefully controlled to conserve a free flowing sandy dry-blend. During dryblending the exposure of hot material to open air is small. On a total charge of typically 150 kg including, say, 50 kg plasticiser and free air space of 100 litres, at 100°C the saturation concentration of DINP (vapour pressure at 100°C=0.11 Pa) is 14 mg/m3. Assuming one air exchange per run, the amount of emitted plasticiser is 0.007%.
• Plastisol blending Plastisol blending takes place in stirred vessels at ambient temperatures. To avoid the development of high viscosities by swelling of the PVC particles due to plasticiser uptake, the vessels have to be cooled to remove the heat of friction. Any significant emission of plasticisers at ambient temperatures is excluded (emission=0%).
• Banbury mixing Banbury mixing are lidded vessels with a small open vent to the air. The mixing process is a batch process, starting with the raw materials at ambient temperatures and going up to a maximum temperature of 120-140°C. Emissions are comparable to those in dry blending (i.e. 0.007%).
The plastisol route for DINP is used for spread coating and car undercoating and sealings as for slush/rotational moulding. This corresponds to 31.4% (See Section 2.1).
The dryblend route is applied therefore for 68.6% of the total DINP consumption of 101,500 t/a, which is 69,629 t/a, to which an emission factor of 0.007% applies. 50% of the releases are supposed to end up in wastewater:
Input continental [t/a] Input regional [t/a]
Raw wastewater 2.2 0.24
42

CHAPTER 3. ENVIRONMENT
C: Conversion
PVC is processed in many ways:
1. calendering, 2. extrusion, 3. injection moulding, 4. several plastisol applications including spread coating (with oven fusion / gelation),
rotational moulding, spray coating (with closed tunnel ovens) and miscellaneous small to very small applications.
• Calendering The output of a typical calendering line is 1,000 kg/h (BRE, 1998). The majority of calendered products are relatively inflexible (e.g. stationary products, furniture veneer), consequently the average plasticiser content is relatively low, ca. 25%, and the plasticiser consumption of such a line is 250 kg/h. The rate of air extraction for such a line is typically 25,000 m3/h. Assuming that this extracted air contains a mixture of air from the area over the hot calender bowls containing 14 mg/m3, this results in an emission of plasticiser of 350 g/h or 0.14% of the plasticiser consumption.
However it is more and more common to have air purification equipment in place. For calendering, this is mostly, reducing the concentration to approximately 0. As reasonable worst-case, an emission of 0.05% is suggested.
The DINP consumption in calendering is 19,488 t/a. 50% of the emissions will end up in the wastewater:
Input continental [t/a] Input regional [t/a]
Raw wastewater 4.4 0.49
• Extrusion Major different product types of plasticised PVC extrusion are “profiles” such as wire, cable and hose, and blow moulded film. Profiles are the largest outlet of the two types and at the same time give rise to the least emission. There is no exposure resulting from the extruder itself, it is only for moments after leaving the die, that a short exposure of the hot material takes place. In addition the surface to volume factor is much lower than calendering. An emission factor of 0.01% is proposed (BRE, 1998).
For blown film there is somewhat more evaporation potential since the film bubble has a fairly large surface area and is subject to air currents. The situation is comparable to calendering and the same estimate of 0.05% can be assumed.
As no distinction can be made how much of DINP is used in extrusion processes for blown film and how much in solid articles, the worst-case emission of 0.05% applies to the entire tonnage used in this processing step.
43

EU RISK ASSESSMENT REPORT – DINP FINAL REPORT, 2003
With a DINP consumption in extrusion of 41,524 t/a (See Section 2.1), the following emissions can be calculated, assuming that 50% of the total emissions are directed to wastewater:
Input continental [t/a] Input regional [t/a]
Raw wastewater 9.3 1
• Injection molding Injection moulding is comparable to extrusion except that even the cooling process takes place in a closed space (mould). It appears that there is practically no potential for evaporation, but a similar factor to that for extrusion (0.01%) could be used (BRE, 1998).
Approximately 8,313 t/a of DINP (see Section 2.1) is used in this processing step. Assuming 50% distribution to wastewater, the estimated releases to wastewater would be:
Input continental [t/a] Input regional [t/a]
Raw wastewater 0.37 0.04
• Plastisol-spread coating Spread coated products like cushioned flooring, wall covering, tarpaulins etc. are “fused” (gelled) in tunnel ovens heated with a hot air about 180°C. It can be shown that the amount of air used, is 15-25 m3/kg plasticiser consumed. This figure is remarkably constant and is independent of the type of product being manufactured. It provides therefore a useful means of calculating the total emission of plasticiser to the environment from the whole range of spread coating activities. The extracted air contains typically 200-1,000 mg/m3 (average 500 mg/m3) of a plasticiser. Taking the average air consumption to be 20 m3/kg plasticiser, the total loss from the process is 20.500 mg/kg plasticiser used or 10 g/kg (1%). This figure is in close agreement with data based on laboratory experiments (BRE, 1998).
Even if there were no treatment of the purged air, not all of this would reach the environment since abundant condensation would take place in cooler pipes, ducts and stacks.
Already by 1989, 75% of all plasticisers in spread coating applications was used in production lines with air treatment (53% with filters, 25% with incineration). This proportion has certainly increased since then and is probably approaching 100% under the influence of national and European regulations. Air filtration removes at least 95% of the fumes, whilst incineration leaves no plasticiser behind. The conclusion is that, depending on the presence of air treatment equipment (75% of all consumption) the emission may fluctuate between 0-0.05% and 0.5% (plant without air treatment).
DINP consumption is 22,230 t/a. Taking into account an air treatment of 75% (emission 0.05%) and no air treatment (emission 0.5%) an emission factor of 0.1625% can be calculated. The following emissions are estimated to take place, assuming 50% release to wastewater:
Input continental [t/a] Input regional [t/a]
Raw wastewater 16.2 1.8
44

CHAPTER 3. ENVIRONMENT
• Other plastisol processes The processes concern car underbody coating and sealing, rotational coating, dipping and slush moulding. Of these, car underbody coating and sealing is by far the largest volume application. In this process the sprayed coating is “dried” in long air-heated tunnel ovens at relatively low temperatures (130-160°C). The ovens in this industry invariably have integrated their air incinerators since at the same time paint coats containing solvents are dried. The result is practically zero organic output to the environment.
DINP consumption is 7,714 t/a for car undercoating, for which no emission will be considered.
1,929 t/a are used in slush, rotational moulding. In taking into account an air treatment of 32% (emission 0.05%) and no air treatment (emission 0.5%) an emission factor of 0.356% is applied. The following emissions can be calculated, assuming 50% release to wastewater:
Input continental [t/a]
Raw wastewater 3.1 0.35
Table 3.9 summarises the different total emissions into the environment during the processing of DINP.
Table 3.9 Continental release of DINP to the environment during processing with release factors (BRE, 1998)
Application Release
[%]
Continental release
[t/a]
Regional release
[t/a]
Raw materials handling 0.01 9.2 1
Compounding: Plastisol route 0 0 0 Dry blending 0.007 4.4 0.5
Of the other processes mentioned above, dip coating and slush moulding (both small volume) are comparable to spread coating in terms of process loss; the presence or absence of air treatment really defines the emission of plasticiser (0.05% or 0.5%). In rotational moulding, final fusion takes place in closed moulds with practically no loss of plasticiser.
Input regional [t/a]
Consumption of DINP [t/a]
31,872 69,629
Calendering 19,488 0.05 8.8 0.97 Extrusion 41,524 0.05 18.6 2.1 Injection moulding 8,313 0.01 0.74 0.08 Plastisol spread coating 22,230 0.1625 32.4 3.6 Other plastisol applications:
7,714 0 0 0 Slush/rotational moulding etc. 1,929 0.356 6.3 0.7
Total 80.4 8.95
Car undercoating and sealants
The releases to wastewater assuming even distribution to air and wastewater are shown in Table 3.10.
45

EU RISK ASSESSMENT REPORT – DINP FINAL REPORT, 2003
Table 3.10 Continental and regional release of DINP to wastewater during processing of PVC polymers
Application Continental release [t/a]
Regional release [t/a]
Raw materials handling 4.6 0.5
Compounding: Plastisol route 0 0 Dry blending 2.2 0.24
Calendering 4.4 0.49 Extrusion 9.3 1 Injection Moulding 0.37 0.04 Plastisol spread coating 16.2 1.8 Other plastisol applications Car undercoating and sealants 0 0 Slush/rotational moulding etc. 3.1 0.35
Total 40.2 4.4
Another approach has been published by Cadogan et al. (1994). In order to estimate plasticiser emission it has been assumed that all phthalates have the same volatility as DEHP. This assumption is conservative since approximately 50% of all the phthalate plasticisers used is DEHP, whilst the remainder is predominantly the less volatile higher molecular weight phthalates such as DINP and DIDP.
Table 3.11 Total release of DINP during processing with release factors Cadogan et al. (1994)
Application Consumption DINP [t/a]
Release [%]
Total release [t/a]
Total 101,500
Calendering : Film, sheet and coated products 15,936 0.2 32 Flooring 3,552 0.03 1
Spread Coating Flooring 10,658 0.25 27 General (coated fabric, wall covering, etc.) 11,571 0.25 29
Other plastisol applications Car undercoating and sealants 7,714 0 - Slush/rotational moulding etc. 1,929 0.3 5.8
Hose and Profile 5,379 0.02 1
Wire and Cable 20,706 0.02 4
Other 23,751 0.02 4.8
Total estimated emission [t/a] 105
In the approach by Cadogan et al. (1994) compounding and raw handling have not been taken into account. The estimated tonnage into the environment according to the emission factors given in BRE (1998) is lower than those in the approach by Cadogan et al. (1994), except for extrusion.
In this approach the releases estimated according to BRE (1998) will be considered. During the whole processing step of DINP in PVC, the following emissions into wastewater have been calculated:
46

CHAPTER 3. ENVIRONMENT
Input continental [t/a] Input regional [t/a]
Raw wastewater 40.4 4.74
Processing in non-PVC polymers (life cycle step IIIb)
DINP is used in non-PVC polymer applications (e.g. rubbers) at a tonnage of approximately 2,750 t/a (see Section 2). As there are no specific emission data on non-PVC polymer processing, and no more specific break down data have been provided on non-PVC polymer processing, the same emission factors as for the PVC processing techniques are taken. As this is the same branch of use for DINP as a plasticiser, the companies are supposed to be equipped with the same elimination facilities, i.e. air treatment, as reported in ECPI (1996).
A: Raw materials handling
The estimated release is 0.01% (on the basis of incidental losses). The following emissions can be calculated, assuming an even distribution between air and wastewater:
Input continental [t/a] Input regional [t/a]
Raw wastewater 0.12 0.01
B. Compounding
As a breakdown between the different compounding methods cannot be made, the highest emission factor of 0.007% (as for PVC spread coating) applies to the whole quantity processed. The following emissions can be calculated, assuming an even distribution between air and wastewater:
Input continental [t/a] Input regional [t/a]
Raw wastewater 0.08 0.01
C. Conversion
For PVC the highest emission factor was estimated for other plastisol processes and especially the slush/rotational moulding with an emission factor of 0.356%. The same emission factor is applied here. The following emissions to wastewater are estimated, assuming an even distribution between air and wastewater:
Input continental [t/a] Input regional [t/a]
Raw wastewater 4.4 0.49
47

EU RISK ASSESSMENT REPORT – DINP FINAL REPORT, 2003
In conclusion, it is estimated that during the whole stage of DINP processing in non-PVC polymers the emissions to wastewater are:
Input continental [t/a] Input regional [t/a]
Raw wastewater 4.6 0.51
Use as additive in adhesives, glues and sealing compounds (life cycle step IIIc)
A/ Formulation
It has been estimated that 915 t/a are used in adhesives, glues and sealing compounds.
For the formulation of these compounds, the same release factor of 1% as for paint could be used for sealing compounds, as the processes are similar (cf Section below). A total emission of 9.15 t/a to the wastewater is calculated.
Input continental [t/a] Input regional [t/a]
Raw wastewater 8.2 0.915
B/ Application
The application will be mostly at construction sites and therefore the releases would be mainly to solid waste. The releases to wastewater can probably be neglected.
Use as an additive in inks for paper (life cycle step IIId)
A/ Formulation
It is assumed that 915 t/a DINP are used in inks for paper. For the formulation of these compounds, the same release factor of 1% as for paint could be used for inks, as the processes are similar (cf Section below). An emission of 9.15 t/a into the raw wastewater is calculated:
Input continental [t/a] Input regional [t/a]
Raw wastewater 8.2 0.915
B/ Application
As no details on the nature of DINP containing inks and their use in paper are reported, the emission value of 0.05% of the general Table A.3.12 (TGD) proposed for solvents is used i.e. 0.45 t/a.
48

CHAPTER 3. ENVIRONMENT
The following emissions on a continental and regional level due to processing of DINP in paper inks can be estimated:
Input continental [t/a] Input regional [t/a]
Raw wastewater 0.4 0.045
Use as an additive in paints (life cycle step IIIe)
A/ Formulation
It has been estimated that 915 t/a are used in paints. To estimate emissions from this use default values in the TGD (IC 14) are employed.
In comparison with Tables 3.1-3.20 of the release category document IC 14 for paints (Annex I of the TGD), it can be estimated that 1% is released to wastewater during the formulation of paints. A total emission of 9.15 t/a is calculated.
Input continental [t/a] Input regional [t/a]
Raw wastewater 8.2 0.91
B/ Processing
Assuming the solvent based processing as most realistic due to the hydrophobicity of DINP, the default release factor for processing is 0.1% according to the TGD, Annex I, Table A3.15. A total emission of 0.9 t/a is calculated:
Input continental [t/a] Input regional [t/a]
Raw wastewater 0.8 0.09
Exterior and interior use of DINP containing PVC products (life cycle step IVa)
A) Emissions during interior end use of PVC products
DINP may be lost through extraction by soapy water during cleaning of flooring. Leached amount has been estimated in two different ways.
1) Apply a general emission factor on an unspecified total volume of DINP (Method 1) 2) Apply a leaching rate/area on the total area of PVC floor (Method 2). Method 1: A dissipation rate (evaporation + leaching + abrasion) of 0.3%/year is available from a long-term outdoor study (roofing material, see outdoor use). The studied roofing material was 1.5 mm. A normal floor thickness is about 2 mm. A correction of the emission factor is therefore needed and is calculated to be 0.22%/year (0.3.(1.5/2)). With a consumption volume for floor of 14,210 t/a (10,658 t/a by spread coating and 3,552 t/a by calendering, see Table 3.11) and a technical lifetime of 20 years (Table 2.4) the loss by leaching will be:
49

EU RISK ASSESSMENT REPORT – DINP FINAL REPORT, 2003
14,210.(0.22 / 100).20 = 625 t/a
Method 2: The annual tonnage for release from washing of polymer floors is based on a Swedish experimental study (Forshaga, 1996). A release of 5 µg/dm2 per cleaning was measured (cleaning interval of 10 days). It should be noted that the experimental design only covers emission by diffusion. Emission by abrasion is not included. The total area for PVC-flooring is estimated to be 2.3.109 m2 (ECPI, 1998a). This is based on an assumed lifetime of 10 years. However, according to a producer (Tarkett-Sommer, 1999) is 20 years a more realistic lifetime. This gives a doubling of the area to 4.6.109 m2. About 12% of this area is assumed to containing DINP, i.e. 0.55.109 m2. One cleaning per week is assumed. This will give:
0.55.109.52.5 = 14.3 t/a
Discussion: The two methods show considerable different emissions. It is difficult to decide which method is the most realistic. Method 1 is based on a long-term study on roofing materials where the reduction of the phthalate content was measured after several years of outdoor condition. The question is whether the outdoor condition differs considerably from the indoor washing condition. Method 2 instead is based on a short-term study on new floors. One important difference is that Method 2 does not simulate the influence of dirt on the migration rate. It is known that organic material in contact with the PVC surface may increase the diffusion of DINP out from the polymer material (see Section “outdoor use” below).
Further, Method 2 does not cover the release caused by abrasion of the surface which is expected to be extensive in places as offices and schools. The abrasion can be estimated by assuming a total loss during the whole lifetime. According to a standard test for abrasion about 0.1-0.15 mm (average 0.125) will be lost during a lifetime (Tarkett-Sommer, 1999). With a thickness of 2 mm (Tarkett-Sommer, 1999) this will give 6.25% per 20 years or 0.312%/year. This abrasion is expected to occur on surfaces exposed to frequent walk here assumed to be half of the area. Based on these assumptions 444 t/a (0.5.14,210.[0.312/100].20) will be released as small particles. The distribution of this is unknown. Wastewater (wet cleaning) and landfill (via e.g. dry cleaner) are realistic recipients. Before cleaning some of the particles may be distributed into the air as an object for human exposure. Assuming 50% loss to wastewater will give 222 t/a (0.5.444).
Conclusion: Method 1 is not a realistic substitute for indoor leaching. However, it indicates that method 2 may underestimate the leaching rate. To cover both leaching and abrasion the result from Method 2 (14.36 t/a) is added to the amount released by abrasion: 14.3 + 222=236.3 t/a. It can be questioned to add particles to leached amount since they occur in different forms. However, the particle size can be expected to be very small and is here assumed to behave in the same way as DINP.
In summary:
Input continental [t/a] Input regional [t/a]
Raw wastewater 212.7 23.6
50

CHAPTER 3. ENVIRONMENT
B) Emissions during exterior end use of PVC products
The following end products are identified as important sources for emissions during use:
1) car undercoating, 2) roofing material, 3) coil coating, 4) fabric coating, 5) cables and wires, 6) hoses and profiles, 7) shoe soles.
Volumes and technical lifetimes for these groups are presented in Table 2.4.
Emissions can be divided into two periods. Firstly during the technical lifetime of the product and secondly during the waste lifetime period. The emission from waste is assessed separately (“waste remaining in the environment” see Section below).
In BRE (1998) general emissions factors for outdoor use are recommended. These are, however, too general to fit the calculations needed for DINP. Firstly they are not considering the influence of volume/area relationship on the emission rate. Secondly, the leaching rate proposed in BRE (1998) is not correctly derived from the cited study. Some recalculations of the leaching rate are therefore needed.
Recalculations: the annual emission by leaching in outdoor use is estimated from studies on roofing material made by Pastuska et al. (1988) and Pastuska and Just (1990). In open air exposure 0.16%/year was released. For surface covered with gravel 0.35%/year was released (the authors show that dirt strongly increases the emission rate). These figures are derived from PVC with a phthalate mix that contains normal C8-C10 and iso-C10 (no more details in the original report). The results can be considered representative for DINP.
It should be noted that this emission rate refers to a thickness of 1.5 mm where the emission is limited to one side of the sheet (roofing material). This rate will change according to the area/volume relationship. The emission/volume then will increase for thinner dimensions (e.g. coil coating) and decrease for thicker dimensions (e.g. shoe soles). Furthermore the emission/volume will be doubled if both sides of the emitting material are exposed to the environment. Since the emission depends on the surface and not the content of DINP, the emission rate/area is calculated from the study on roofing material.
The volume of 1 m2 roofing material (thickness 1.5mm) is 1,000.1,000.1.5 = 1.5.106 mm3. With a density of 1.406 mg/mm3 (65%) for PVC (ref. Sax) and 0.97 mg/mm3 for DINP (35%) this corresponds to: [(0.65.1.406)+(0.35.0.97)].1.5.106 = 1.88.106 mg = 1,880 g. With a starting concentration of 35 weight% DINP and a reduction of 0.16 weight%/year for the open-air exposure the annual emission rate will be: 0.16/100.35/100.1,880 = 1.05 g for 1 m2 (emission only from one side) 1.05 g/m2 for open air exposure. The annual emission rate for gravelled surface will then be 2.3 g/m2.
Used emission factors (water and soil): the annual emission rate derived from roofing material, 1.05 g/m2 for open air exposure and 2.3 g/m2 for gravelled surface will be used for all products except for soil buried cable. According to BRE (1998) the leached part is assumed to be equally distributed to soil and surface water.
51

EU RISK ASSESSMENT REPORT – DINP FINAL REPORT, 2003
For emissions from end products the emission rates for “open air” is selected except for shoe soles for which the rates from “dirty area” is used. Special emission rates will be used for buried cable.
In summary:
Surface water: open air: 0.525 g/m2 dirty area (gravelled): 1.15 g/m2
Knowing the emitting surface area for the other product groups the total emission can be calculated. This can be estimated by a “surface correction factor” (SCF) which is here defined as the relative change in emitting surface area compared to the roofing material. A factor of 10 gives 10 times larger emitting surface area. In Table 3.12 SCFs for the different products are estimated.
The leaching rates from PVC-coated roofing material has been estimated by the recalculation presented above. Since the roofing material is the base for the surface correction factor the SCF will be 1.
The emissions from car undercoating are due to evaporation and leaching. Only the releases due to leaching are taken into account to estimate the releases to water. Vikelsoe et al. (1998) measured the releases from cars to washwater in car wash centres. Phthalate concentrations were determined in wash water from two car wash stations in Denmark in 1996 and 1997. The samples were taken at the car wash station in the well collecting the washing water in the washing room. 26 Samples were taken, each from the wash water of a different car. Di-n-nonyl phthalate (DnNP) as well as DINP were determined.
DnNP was analysed in all 25 samples. The concentrations varied from <1 to 55 µg/l (mean: 11.1 µg/l). The corresponding emissions per single wash varied from <0.1 to 8 mg/wash (mean 1.5 mg/wash). DINP was analysed in 13 samples. The concentrations varied from <50 to 510 µg/l (mean: 284 µg/l). The corresponding emissions per single wash varied from <7 to 71 mg/wash (mean: 38 mg/wash).
Assuming approximately 120.106 cars in Western Europe and two car washes per month and an average release per wash of 38 mg, the release would amount to 109 t/a. Further release would also occur during normal use e.g. driving on wet roads etc. The releases during car washing can nevertheless be considered as worst-case conditions, so that it can be assumed that the additional releases do not exceed those during car washing. The total losses due to leaching to soil and surface water can therefore be approximated at 218 t/a. The primary recipients for the releases is assumed to be soil (50%) and the surface water (50%) (no reference).
In a monitoring study by Alcontrol (1999), samples in the vicinity of motorways (3-20 m distance), no DINP could be detected at a detection limit of 25 µg/kg dw. The release during driving on wet roads might therefore be overestimated.
No emission data are available for emissions from coil coated sheets. The thickness of coil coating is about 10 times thinner than that of roofing material (0.1-0.18 mm compared to 1.5 mm in the roofing material, Meki, 1999). A correction of the emission factor for the relatively larger surface area is therefore needed. This gives an SCF of 10.
No data are available for emissions from PVC-coated fabric material. However, this material is assumed to be similar to roofing material except that emission will be possible from two sides. This will give an SCF of 2.
52

CHAPTER 3. ENVIRONMENT
No emission data are available for emissions from hoses and profiles. However, this material is assumed to be twice as thick as the roofing material, consequently the surface area is reduced to the half. This will give an SCF of 0.5.
Emissions from cables and wires are expected as evaporation and leaching. The emission rate and recipient are assumed to be different for above-ground use compared to below-ground use. About 20% is estimated to be above-ground (i.e. 2,900 t/a) and 80% is then below-ground use (ECPI, 1999). For both above- and below-ground use the same dimension as for roofing material is assumed. This will give an SCF of 1. For soil buried cable and wires the emission is expected to be to the soil compartment only.
No emission data are available for emissions from shoe soles. However, this material is assumed to be similar to the roofing material except that the material is thicker. No thickness data are available, however, a thickness of 10 mm is assumed. This will give an SCF of 0.15 (1.5/10).
Technical lifetimes and emission factors for polymer end products are also summarised in Table 3.12. The primary recipients for the leached amount is assumed to be soil (50%) and the surface water (50%) (no reference) except for polymers buried deep in the soil (100% to soil). The releases to different environmental compartments from outdoor uses are summarised in Table 3.13.
Table 3.12 Surface correction factor (SCF), technical lifetimes and consumed volumes on main groups of outdoor use types (polymer end products)
Type Average thickness (mm)
Emission sides 1)
SCF Volumes (t/a)
Emitting surface area 4)
(m2) Technical lifetime
(years)
Roofing material 2) 1.5 single 1 230 122,360 20 Coil coating 0.15 single 10 1,150 6,118,000 10 Fabric coating 1.5 double 2 4,850 5,160,400 10 Wires and cables 3) 1.5 single 1 2,900 1,542,800 30 Hoses and profiles 3 single 0.5 1,380 367,080 10 Shoe soles 10 single 0.15 8,313 663,380 5
1) polymer applied on a non-diffusible material will only release DINP from one side 2) field study available 3) above-ground use only 4) [DINP volume of the end product].[the area of 1 tonne roofing material = 532 m2].SCF
Table 3.13 Summary of total releases from outdoor use of PVC end products
Scenario Emission to surface water [t/a]
Car undercoating 109 Roofing material 1.3 Coil coating 32.1
Fabric coating 27.1 Wires and cables 24.3 Hoses and profiles 1.9 Shoe soles 3.8 Total 199.5 Continental 179.6 Regional 19.9
53

EU RISK ASSESSMENT REPORT – DINP FINAL REPORT, 2003
In summary, the releases to wastewater and surface water from interior and exterior use of PVC-products are:
Input continental [t/a] Input regional [t/a]
Raw wastewater 212.7 23.6
Surface water 179.6 19.9
Use of DINP containing non-PVC polymers (life cycle step IVb)
In taking into account the same assumptions and breakdown for exterior and interior use of PVC polymers, DINP loss can be summarised as follows:
Input continental [t/a] Input regional [t/a]
Raw wastewater 5.8 0.64
Surface water 4.87 0.54
Applied sealings containing DINP (life cycle step IVc)
For sealings, the same approach as for PVC roofing material (see above) can be used. With a use volume of 915 t/a, a release factor to surface water of 0.525 g/m2 due to leaching, an SCF of 1 and a lifetime of 20 years, the release would be:
Input continental [t/a] Input regional [t/a]
Surface water 4.57 0.51
Paper recycling(life cycle step IVd)
913 t/a of DINP are used in printing inks. It is not clear for which type of inks DINP is used. According to the release category document in the TGD, between 6 and 90% of the ink can be washed to wastewater during recycling. Given the hydrophobic nature of DINP, the lower value of 6% would appear to be most appropriate. Furthermore, during primary treatment, a removal rate of 90% is estimated for insoluble substances. The paper recycling rate is assumed to be 50%.
Because of the low hydrophobicity of DINP, the substance would have a tendency to remain on the fibres and to be present in recycled paper. The total amount of DINP in paper can therefore be assumed to be higher than the amount added with inks. To take account of this “retention” of the substance in paper, a correction factor of 2 will be used for assessment purposes to estimate the releases during recycling. The total release to wastewater would be:
Input continental [t/a] Input regional [t/a]
Raw wastewater 5 0.55
54

CHAPTER 3. ENVIRONMENT
Applied paints containing DINP (life cycle step IVe)
For paints, the same approach as for PVC coil coating (see above) can be used. With a use volume of 915 t/a, a release factor to surface water of 0.525 g/m2 due to leaching, an SCF of 10 and a lifetime of 7 years, the release would be:
Input continental [t/a] Input regional [t/a]
Surface water 16.1 1.8
Disposal of end products (life cycle step V)
Due to lack of information on non-polymer end products the emission scenarios are limited to polymer end products. Four emission sources are identified for the disposal life cycle step:
• car shredding sites, • municipal incineration stations, • municipal landfills, • waste remaining in the environment.
It is known that the waste management strategies vary considerable between different EU countries. However, the total volume is assumed to be equal to the total consumed volume (107,000 t/a). The incineration releases are based on estimations from an average incineration rate within the EU and the municipal landfill releases are based on estimation from UK (ECPI 1996). Releases from waste remaining in the environment are based on the total EU volumes and specific emission factors.
Car shredder waste
Based on data from BASF AG (1999a) shredding of disposed vehicles is defined to be a potential source for release of DINP (from car-undercoating and cables). This is carried out to separate the non-ferrous from the ferrous metals for recycling purpose. A by-product is the so-called light shredder fraction, which contains most of the rigid, flexible and foamed plastics, elastomers, wood, glass and dirt. This light shredder is landfilled within the EU. The process of dry shredding is the most practised system in Europe. Old cars enter the shredding process after removal of fluids, batteries and converter radiators. The shredding itself takes place through hammering on the scrap until the granulation of the scrap is small enough to be pushed through the gates. The light fraction is separated through an aspiration system. During the shredder process a normal temperature was measured ranging between 30 and 45°C, with exceptionally higher temperature occurring only temporary at compact and large individual items (e.g. crank shafts).
Release to water is not expected from the dry processing. However, some processing sites separate metals by water flotation. The frequency is however, assumed to be low. Uncontrolled releases of particles is also expected to occur to the surroundings, however, this will be included under “waste remaining in the environment” (see Section below).
Incineration of waste
No data regarding the release of DINP from incinerators due to the incineration of DINP-containing products are available. An estimation of the releases of DEHP from incinerators has
55

EU RISK ASSESSMENT REPORT – DINP FINAL REPORT, 2003
been performed in the corresponding risk assessment (EC, 2001), based on measurements in smoke, ash and wastewater at one incineration station in Denmark (Miljöstyrelsen, 1996). It was found that 9% of the emissions are directed to the atmosphere, while 91% remain in the slags and the fly ash, which are landfilled. No releases to wastewater occur.
Disposal to landfills
Landfills are identified to emit phthalates mainly through the leakage water (ECPI, 1996). Some information on releases are available for DEHP. Based on measured data from the UK (ECPI, 1996), a total leached amount of 15 t/a (related to DEHP) can be estimated for the EU.
On the other hand, studies have been performed regarding the loss of DIDP from plasticised PVC products under soil-buried and landfill conditions (Mersiowsky et al., 1999). Landfill conditions were simulated in lysimeters containing genuine household waste or model waste mixtures. Elution and biodegradation processes were accelerated by leachate recirculation. The landfill simulation reactors were operated for several years and the corresponding period of time in a landfill was estimated to be approximately one decade. Two lysimeters were spiked with sheets of green cable insulation containing an average of 11% DIDP. The loss of DIDP after 28 months of incubation was negligible.
It is not clear whether the results from DIDP can be extrapolated to DINP. As DINP has a higher water solubility and a higher vapour pressure than DIDP, its leaching potential might be higher than that of DIDP.
In a first approach, the results available with DEHP will therefore be used for DINP as well:
Input continental [t/a] Input regional [t/a]
Raw wastewater 13.5 1.5
Waste remaining in the environment
As well as volatilisation and leaching losses of DINP from products/articles, DINP may also enter into the environment as a result of “waste” from the products themselves during their useful lifetime and disposal. Such waste could include erosion/particulate losses of polymeric products, paints and sealants as a result of exposure to wind and rain or may occur as a result of their mode of use (e.g. wear on conveyor belts, flooring etc.). Similarly, when products/articles are dismantled or disposed of at the end of their useful life there is again a potential for this type of particulate release. In either case the end result is that polymeric particles containing DINP could enter into the environment. As these releases of DINP are essentially bound within a polymer matrix, the actual bioavailability and environmental behaviour of DINP is unknown. There are no agreed methods available in the current TGD for dealing with these types of releases in the risk assessment.
Below, a first attempt is made to estimate the releases from waste remaining in the environment. End products used for outdoor purpose is the most obvious source for this waste formation. For this use some data are available to estimate this release. However, for the indoor use (ca. 78% of DINP) data are missing.
56

CHAPTER 3. ENVIRONMENT
• Outdoor use Among outdoor use of end products, the following are expected to form waste during use and disposal:
1. car undercoating, 2. roofing material, 3. coil coating, 4. fabric coating, 5. cables and wires, 6. hoses and profiles, 7. shoe soles.
To estimate the emissions from these types of wastes, the waste formation rate (release of PVC+DINP) from both use and disposal need to be estimated:
1. Car undercoating: Approx. 10% is expected to be released as waste due to abrasions during the technical lifetime period (no reference). For the remaining 90% the release during disposal is assumed to be 2% (no reference), or 1.8% of the total amount. Releases are in particular to be expected from car shredder facilities.
2. Roofing material: No data are available on the losses during its technical lifetime and during disposal. A maximum of 5% is however assumed to be released during the technical lifetime period (no reference). For the remaining 95% the release during disposal is assumed to be 2% (no reference), or 1.9% of the total amount.
3. Coil coating: Losses during their technical lifetime has been estimated in a survey on a number of buildings with PVC coil coated roofs in Stockholm in 1998 (Rathleff-Nielsen, 1999; Skog, 1999). This study estimates that about 50% of the coatings were lost after 10 years of use. The same loss is used in this assessment. The recipients for this waste loss are assumed to be soil and surface water. For the remaining 50%, the release during disposal is assumed to be 10% (no reference), or 5% of the total amount.
4. Fabric coating: No data are available on the losses during their technical lifetimes and during disposal. Due to its more pliable use coated fabric is assumed to form relatively more waste during use than roofing material. Here a double waste formation rate compared to roofing material during use due to abrasions is assumed i.e. 4% (no reference). For the remaining 96%, the release during disposal is assumed to be 2% or 1.92% of the total amount (no reference).
5. Cables and wires: No data are available on the losses during their technical lifetimes and during disposal. For above-ground applications, a loss of 2% is assumed (no reference). For the remaining 98% the release during disposal is assumed to be 2% (no data, worst-case assumption) or 1.96% of the total amount of the above-ground use.
For below-ground applications a loss of 2% is assumed. For the remaining 98% the release during disposal is assumed to be 80% (no data, worst-case assumption) or 78.4% (0.8.98) of the total amount of the over-ground used. These releases are to be treated specifically, as they are to soil only.
6. Hoses and profiles: No data are available on the losses during their technical lifetime and during disposal. A maximum of 2% is however assumed to be released during the technical lifetime period (no reference). For the remaining 98% the release during disposal is assumed to be 2% (no reference), or 1.96% of the total amount.
57

EU RISK ASSESSMENT REPORT – DINP FINAL REPORT, 2003
7. Shoe soles: No data are available on the losses during their technical lifetime and during disposal. 10% is however assumed to be released during the technical lifetime period (no reference). For the remaining 90% the release during disposal is assumed to be 1% (no reference), or 0.9% of the total amount.
In Table 3.14 the releases from different kinds of waste remaining in the environment is calculated. It is assumed that all DINP remaining in the waste will be released at steady state.
Table 3.14 Outdoor use: Calculation of emission of DINP from waste remaining in the environment
Cable and wire Hose and profile
Emission sources
Car under-coating
Roofing material
Coil coating
Fabric coating
above ground
below ground
shoe soles
Annual volume for application 1 7,714 230 1,150 4,850 7,255 7,255 1,380 8,313
Technical lifetime (year) 1) 14 20 10 10 30 30 10 5
Waste formed during use (%) 10 5 50 4 2 2 2 10
Waste formed during disposal (%) 1.8 1.9 5 1.92 1.96 78.4 1.96 0.9
Total waste fraction (%) 11.8 6.9 55 5.9 4.0 80.4 4.0 10.9
Volume DINP in waste = annual release rate (t/a)
910 16 632 286 290 5,833 55 906
Total (t/a) 8,929
Total (t/a) (without release from below-ground use of cables and wires)
3,096
1) See Table 2.4 There are no data available about the recipient of these emissions. However, since the polymers occur as solids they will end up in the soil and sediment environment. Smaller fractions can be expected to be transported by wind and water to sediments while larger pieces remain in the soil.
Compared to the releases from product use the emission to air and water is expected to decrease and the release to soil increase. In this assessment the release to air and water are assumed to be 0.1% and 25%, respectively and the release to soil is assumed to be to 75% (see Table 3.15).
Table 3.15 Environmental distributions of DINP released from waste remaining in the environment
Primary Environmental distribution
Recipient
From waste remaining in the environment
From soil buried cable(use and waste)
(%) (%)
Air 0.1 0
Water 25 0
Soil 75 100
The calculations in Table 3.14 show that the annual releases from different waste types vary between 16 to 5,833 t/a. The contribution from soil buried cables are special. Since this release occurs deep in the ground it cannot be added together with the other more surface oriented
58

CHAPTER 3. ENVIRONMENT
releases. In the TGD the urban/industrial soil depth is only 5 cm. The PEC calculations are therefore not able to cover this release. Development of new distribution models is therefore needed (with focus on groundwater exposure). Until better models will be available the contribution from soil buried cables are excluded from the PEC calculations.
The annual releases from the other waste types vary between 16 and 910 t/a. Coil coating and shoe soles are the dominating sources.
The uncertainty of these figures is high (several simplifications). The assumption that the emission is constant during the whole waste lifetime can be questioned. The emission rate will probably decrease when the concentration in PVC passes the “glass point”. Furthermore, it is unclear when the steady state will be reached for the different waste groups. The waste type with smallest particles will probably reach steady state fastest (e.g. shoe soles).
• Indoor use Indoor use of polymer end products will most probably also cause waste that will remain in the environment. The abrasion from the floor is already included in the section for end products use. One other obvious scenario is demolishing of buildings that contain products like electrical cable, hose profiles, polymer wall paper and floor (Sten, 1998). Since such demolishing material may be used for landfilling groundwater can be assumed to be the primary recipient. More data and/or new calculation methods are, however, needed before such a scenario can be introduced in the assessment.
For surface water, the total releases from disposal of end products would therefore be:
Input continental [t/a] Input regional [t/a]
Surface water 710 78.9
In order to generate these figures, a large number of “worst-case” assumptions have had to be made. This leads to a large uncertainty in the figures obtained, and the approach taken may grossly overestimate the actual releases.
Summary of the releases to wastewater and surface water
Based on the estimations performed above, the overall releases to wastewater and surface water are summarised in the Table 3.16.
59

EU RISK ASSESSMENT REPORT – DINP FINAL REPORT, 2003
Table 3.16 Total releases to wastewater and surface water
Life cycle step Wastewater (t/a) Surface water (t/a)
Continental Regional Continental Regional
I:Production 41 29 - -
II: Distribution 8.5 0.94 - -
IIIa: Processing in PVC 40.2 4.4
IIIb: Processing in non-PVC polymers 4.6 0.51
IIIc: Use as additive in adhesives, glues and sealing compounds Formulation Application
8.2 -
0.91 -
- -
IIId: Use in inks for paper Formulation Application
8.2 0.4
0.91 0.045
- -
IIIe: Use as an additive in paints Formulation Application
8.2 0.8
0.91 0.09
- -
IVa: Exterior and interior use of DINP-containing PVC-products
212.7 23.6 179.6 19.9
IVb: Use of DINP-containing non-PVC products 5.8 0.64 4.87 0.54
IVc: Applied sealings containing DINP - - 4.57 0.51
IVd: Paper recycling 5 0.55 - -
IVe: Applied paints containing DINP - - 16.1 1.8
V: Disposal of end products - - 710 78.9
Total 343 62.5 915 102
3.1.2.2 Estimation of local aquatic concentrations
Production (life cycle step I)
Daily releases have been obtained by dividing the reported amounts of emission to water with the number of working days (300 days in continuous working systems). The concentration of DINP in the influent of the STP is calculated in taking the following formula:
Clocalinf = Elocalwater.106 EFFLUENTstp
Explanation of symbols: Elocalwater local emission rate to (waste) water during emission period [kg/d] EFFLUENTstp effluent discharge of the STP [l/d] Clocalinf concentration in untreated water [mg/l]
60

CHAPTER 3. ENVIRONMENT
The concentration of DINP in the effluent (Clocaleff) of a STP is calculated with the formula:
Clocaleff = Clocalinf .% not removed STP (7%)
From the effluent concentration in the STP, the local concentration in the receiving surface water can be calculated with the equation:
Clocalwater = Clocaleff / [(1 + Kp_susp.SUSP.10-6).D]
Where Kp_susp = 28,600 l/kg (see above) SUSP = 15 mg/l (concentration of suspended matter in river) D = dilution factor
The default values have been taken from the TGD.
A C D E
Number of operation days [d/a] 300 300 300 300
Release to water [%] 0.3 0.3
Amounts released to STP [kg/d] 1 0.2 97 37
Dilution 156 2 2,593 * 2,593 *
Influent STP Clocalinf [mg/l] 0.0025 0.057 48.5 18.5
Effluent STP Clocaleff [µg/l] 0.17 4 3,395 1,295
Clocalwater [µg/l] 0.008 1.5 0.9 0.4
* based on a default river flow of 60 m3/s
Monitoring results are available for site C. The concentration of DINP upstream and downstream was determined to be < 50 µg/l. The estimated results will be used for the risk characterisation.
The concentration in freshly deposited sediment is taken as the PEC for sediment; therefore, the properties of suspended matter are used:
Clocalsediment = Ksuspwater/RHOsusp.Clocalaqua.1,000 (wet weight)
The following Clocalsediment can be derived:
A C D E
Clocalsed wet weight [µg/kg] 5 9,090 5,696 2,172
Clocalsed dry weight [µg/kg] 13 23,630 14,810 5,650
Monitoring results in sediment are available for sites C and E. At site C, concentrations upstream from the factory outlet (2 locations, 2 samples each) were < 40 µg/kg. Downstream from the factory outlet (2 locations, 2 samples each), concentrations between 700 and 2,000 µg/kg dw were measured. The value of 2,000 µg/kg dw will be used in the risk characterisation. At site E, both concentrations upstream and downstream were below 300 µg/kg dw. This value will be used in the risk characterisation.
61

EU RISK ASSESSMENT REPORT – DINP FINAL REPORT, 2003
Processing in PVC (life cycle step IIIa)
Emissions for each processing step have been estimated. For the local scale, each processing technique is considered to take place in a separate factory. This is confirmed by a proprietary market analysis performed by the main producers (Parkerton and Bowes, 1999). Of the 230 processing sites included in the survey, only two sites were identified that had more than one business segment at the same site. Local emissions due to raw material handling and compounding are included with the releases from conversion. Different generic scenarios based on the conversion technique have been derived from the quantities given in ECPI (1996)
Parkerton and Bowes (1999) could establish the consumption of DINP at processing sites throughout Western Europe. The study covered 95% of the consumption of DINP in Western Europe. Based on a summary statistical evaluation the 90 percentile consumption of DINP per site for different business segments could be derived, as presented in the Table 3.17.
Table 3.17 90 Percentile consumption of DINP per site according to application
Application Conversion technique DINP consumption (90%ile) [t/a]
Wire and Cable Extrusion 4,600 *
Film and Sheet Calendering 1,110
Underbody Coating, Sealants, Mastics Plastisol application 3,965
Coated Fabric Plastisol spread coating 1,305
Floor and Wall Covering Plastisol spread coating 1,270
Compounding - 1,500
Other - 1,800 **
* Maximum as less than 9 sites involved ** Maximum, 90 percentile not determined The data from Table 3.17 are considered to be realistic worst-case values and will be used for the Clocal derivation. In the absence of a DINP consumption value for injection moulding, a consumption of 1,800 t/a per site will be used. For “other plastisol applications”, no distinction is made between car underbody processes and slush or rotational moulding. While no releases occur during car underbody coating, this is by far the largest volume application. Higher releases have been estimated for slush or rotational moulding, but this application concerns only 1,929 t/a of DINP. Even the average consumption of 1,467 t/a is still unrealistic, and therefore a value derived from the TGD should be used. Assuming a mean content of 40% DINP in the final product, a fraction of main source of 0.15, applied to the total consumption can be used i.e. the per site consumption would become 290 t/a.
62

CHAPTER 3. ENVIRONMENT
Calendering Extrusion Injection moulding
Plastisol spread coating
Other Plastisol applications *
DINP consumption per site [t/a] 1,110 4,600 1,800 1,305 290
Release% raw handling 0.005 0.005 0.005 0.005 0.005
Release% compounding 0.0035 0.0035 0.0035 0 0
Release% conversion 0.025 0.0025 0.005 0.0812 0.178
Release% [total] 0.033 0.011 0.0135 0.0862 0.183
Release [t/a] 0.37 0.51 0.243 1.12 0.53
Number of days 300 300 300 300 300
Local release to water [kg/d] 1.22 1.69 0.81 3.7 1.8
Influent STP Clocalinf [mg/l] 0.61 0.84 0.40 1.9 0.88
Effluent STP Clocaleff [µg/l] 42.7 59 28 131 62
Clocal [µg/l] 3.0 4.1 2.0 9 4.3
* Slush or rotational moulding only as the releases are negligible for car underbody coating
For the sediment the following results are obtained:
Calendering Extrusion Injection moulding
Plastisol spread coating
Other Plastisol applications *
Clocalsediment wet weight [µg/kg] 18,600 25,700 12,300 57,100 26,900
Clocalsediment dry weight [µg/kg] 48,300 66,800 32,100 148,500 70,000
* Slush or rotational moulding only as the releases are negligible for car underbody coating
Processing in non-PVC polymers (life cycle step IIIb)
The study by Parkerton and Bowes (1999) includes data on the size of processing sites of DINP in non-PVC polymers in France. The largest consumption at one site was found to be 180 t/a. A 90-percentile value could not be determined, as less than 9 sites were identified. The maximum value will therefore be used for the derivation of the Clocal. Assuming that for processing in non-PVC polymers exactly the same emission factors as for processing in PVC polymers applies, the following PEClocal estimations can be carried out:
63

EU RISK ASSESSMENT REPORT – DINP FINAL REPORT, 2003
Tonnage DINP per site [t/a] 180
Release% raw handling 0.005
Release% compounding 0.0035
Release% conversion 0.178
Release% [total] 0.1865
Local release to water [t/a] 0.33
Number of days 300
Release to water [kg/d] 1.12
Water flow [m3/d] 2,000
Dilution 10
Influent STP Clocalinf [mg/l] 0.56
Effluent STP Clocaleff [µg/l] 39
Clocal [µg/l] 2.7
For the sediment the following result is obtained:
Non PVC-Processing
Clocalsediment wet weight [µg/kg] 17,000
Clocalsediment dry weight [µg/kg] 44,300
Use in adhesives, glues and sealing compounds (life cycle step IIIc)
As described above, 915 t/a DINP are used as adhesives, glues and sealing compounds. In a market study performed by Parkerton and Bowes (1999), up to 67 non-PVC processing sites were identified in Western Europe. It can therefore be assumed that the 10% rule applies.
Formulation
Tonnage DINP [t/a] 915
Release% [total] 1
Regional release to water [t/a] 0.915
Fraction of main source (table B2.3) 1
Number of days 300
Local release to water [kg/d] 3.05
Water flow [m3/d] 2,000
Dilution 10
Influent STP Clocalinf [mg/l] 1.53
Effluent STP Clocaleff [µg/l] 106
Clocal [µg/l] 7.4
64

CHAPTER 3. ENVIRONMENT
For the sediment the following result is obtained:
Formulation
Clocalsediment wet weight [µg/kg] 50,400
Clocalsediment dry weight [µg/kg] 131,000
As seen above, the release to wastewater during use of sealing compounds is considered to be negligible.
Use in inks for paper (life cycle step IIId)
A 1 emission is estimated for the formulation step for use in inks for paper. As above, the 10%-rule is applied.
Formulation
Tonnage DINP [t/a] 915
Release% [total] 1
Regional release to water [t/a] 0.915
Fraction of main source (table B2.3) 1
Number of days 300
Local release to water [kg/d] 3.05
Water flow [m3/d] 2,000
Dilution 10
Influent STP Clocalinf [mg/l] 1.53
Effluent STP Clocaleff [µg/l] 106
Clocal [µg/l] 7.4
For the sediment the following result is obtained:
Formulation
Clocalsediment wet weight [µg/kg] 50,400
Clocalsediment dry weight [µg/kg] 131,000
For the application of printing ink on paper, an emission factor of 0.05% (TGD, Appendix I, Table A3.12), a fraction of main source of 0.33 (estimated according to Table B3.10 of the TGD, Appendix I) and 64 working days are estimated.
65

EU RISK ASSESSMENT REPORT – DINP FINAL REPORT, 2003
Processing
Tonnage [t/a] 915
Release% 0.05
Regional release to water [t/a] 0.045
Fraction of main source 0.33
Number of days 64
Local release to water [kg/d] 0.25
Water flow [m3/d] 2,000
Dilution 10
Influent STP Clocalinf [mg/l] 0.124
Effluent STP Clocaleff [µg/l] 8.5
Clocal [µg/l] 0.6
For the sediment the following result is obtained:
Processing
Clocalsediment wet weight [µg/kg] 3,730
Clocalsediment dry weight [µg/kg] 9,700
Use in paints (life cycle step IIIe)
With an emission factor of 1% during formulation and in considering a formulated quantity of 3,500 – 10,000 t/a (TGD, Appendix I, Table B2.10) the following PEClocal calculation can be performed in regard to the formulation step (as above, the 10%-rule is applied):
Formulation
Tonnage [t/a] 915
Release% 1
Regional release to water [t/a] 0.91
Fraction of main source 1*
Number of days 300*
Local release to water [kg/d] 3
Water flow [m3/d] 2,000
Dilution 10
Influent STP Clocalinf [mg/l] 1.53
Effluent STP Clocaleff [µg/l] 106
Clocal [µg/l] 7.4
* Estimated according to TGD, Appendix I, Table B2.10
66

CHAPTER 3. ENVIRONMENT
For the sediment the following result is obtained:
Formulation
Clocalsediment wet weight [µg/kg] 50,300
Clocalsediment dry weight [µg/kg] 131,000
In regard to the industrial application of the paints, an emission factor of 0.1% (TGD, Appendix I, Table A3.15), a fraction of main source of 0.3 (estimated according to TGD, Appendix I, Table B3.13 for a quantity of 5,000 – 25,000 t/a) and 92 working days are estimated.
Processing
Tonnage [t/a] 915
Release% 0.1
Regional release to water [t/a] 0.09
Fraction of main source 0.3
Number of days 92
Local release to water [kg/d] 0.3
Water flow [m3/d] 2,000
Dilution 10
Influent STP Clocalinf [mg/l] 0.147
Effluent STP Clocaleff [µg/l] 10.2
Clocal [µg/l] 0.7
For the sediment the following result is obtained:
Processing
Clocalsediment wet weight [µg/kg] 4,350
Clocalsediment dry weight [µg/kg] 11,300
Other life cycle steps
No local estimations are performed for life cycles IVa, IVb, IVc and V as these are diffuse emissions, which are taken into account in the regional model. Only for paper recycling a local scenario can be derived. Due to the diffuse nature of the use and especially because of the retention of DINP on the recycled fibres inducing a high “dilution” of the retained substance in the marketed recycled paper, the 10%-rule can be applied and the regional release quantities will be used in the local scenario:
67

EU RISK ASSESSMENT REPORT – DINP FINAL REPORT, 2003
Paper recycling
Regional release to water [t/a] 0.55
Fraction of main source 0.1
Number of days 250
Local release to water [kg/d] 0.22
Water flow [m3/d] 2,000
Dilution 10
Influent STP Clocalinf [mg/l] 0.11
Effluent STP Clocaleff [µg/l] 7.6
Clocal [µg/l] 0.5
For the sediment the following result is obtained:
Paper recycling
Clocalsediment wet weight [µg/kg] 3,100
Clocalsediment dry weight [µg/kg] 8,100
3.1.3 Atmosphere
3.1.3.1 Releases to the atmosphere
Production (life cycle step I)
The TGD gives an emission factor of 0. Direct deposition fluxes through atmosphere can be neglected as they may not be important at all.
Distribution (life cycle step II)
Only DINP release to liquid waste due to cleaning of transport facilities is considered in this risk assessment.
Processing in PVC polymers (life cycle step IIIa)
As described in Section 3.1.2.1, the releases estimated during processing of DINP in PVC polymers are assumed to be equally distributed to air and wastewater. The total releases to air are therefore:
68

CHAPTER 3. ENVIRONMENT
Table 3.18 Continental and regional release of DINP to wastewater during processing of PVC polymers
Application Continental release [t/a] Regional release [t/a]
Raw materials handling 4.6 0.5
Compounding: Plastisol route 0 0 Dry blending 2.2 0.24
Calendering: 4.4 0.49 Extrusion 9.3 1 Injection moulding 0.37 0.04 Plastisol spread coating 16.2 1.8 Other plastisol applications Car undercoating and sealants 0 0 Slush/rotational moulding etc. 3.1 0.35
Total 40.2 4.4
Processing in non-PVC polymers (life cycle step IIIb)
As for DINP in PVC polymers it is estimated that emissions are equally distributed to air and wastewater. The total releases to air are therefore:
Input continental [t/a] Input regional [t/a]
Air 4.6 0.51
Use as an additive in adhesives, glues and sealing compounds (life cycle step IIIc)
According to the TGD, IC 16, air emission takes place during formulation (TGD, Appendix I, Table A1.2: MC3) the proposed release factor is 0.25%. It is assumed that 915 t/a DINP are used in these compounds. Therefore:
Input continental [t/a] Input regional [t/a]
Air 2.1 0.23
At the application step, the releases are estimated to be 0.01% (TGD, Appendix I, Table A3.16: MC2). Therefore:
Input continental [t/a] Input regional [t/a]
Air 0.08 0.01
Use as an additive in inks for paper (life cycle step IIId)
It is assumed that 915 t/a DINP are used for inks in paper. The TGD proposes an emission factor of 0.0025 (MC=3) for formulation (Table A1.2). No air emission is considered at the application step (Table A3.12). The total emission will be:
69

EU RISK ASSESSMENT REPORT – DINP FINAL REPORT, 2003
Input continental [t/a] Input regional [t/a]
Air 2.1 0.23
Use as an additive in paints (life cycle step IIIe)
The TGD proposes an emission factor of 0.0025 (MC=3) for formulation (TGD, Appendix I, Table A2.1). No air emission is considered at the application step (TGD, Appendix I, Table A3.15). The total emission will be:
Input continental [t/a] Input regional [t/a]
Air 2.1 0.23
Exterior and interior use of DINP containing PVC products (life cycle step IVa)
A) Emissions during interior end use of PVC products
The majority of flexible PVC is used indoors in applications such as floorings, wall coverings, upholstery, wires and cables etc. The total volume for interior use of DINP in polymer products is approximately 79,200 t/a (78% of the total consumption, BASF (1999)).
There are two ways to estimate the evaporated amount:
1. Apply a general emission factor to an unspecified total volume of DINP (Method 1). This gives 39.6 t/a (see Section below).
2. Apply an evaporation rate/m2 to the emitting area of different articles (Method 2). This gives 24.6 t/a (see Section below).
The more detailed Method 2 should be preferred. However, the data on the different uses of the products indoor are not detailed enough to calculate the emission from each product group and to summarise the total emission. Until more detailed information will be available (e.g. better estimate of surface areas for hoses and profiles) Method 1 is decided to represent a realistic worst-case scenario. Thus, 39.6 t/a of DINP is expected to evaporate from indoor use of products containing DINP.
Method 1: a general yearly emission factor of 0.05% is proposed in BRE (1998). The total emission from indoor PVC products would then be 39.6 t/a.
Method 2: if the surface area of the products is known, an emission factor of 5.7-9.5 mg/m2/a can be used as determined for DEHP (Environ Corporation, 1988).
The total area of PVC flooring in Western Europe is estimated to be 2.3.108 m2 (ECPI, 1998a). With a technical lifetime of 20 years, the total area will be 4.6.109. With a market share of 12% of total phthalates for DINP, the release would be 5.2 t/a.
Vinyl wall covering is a typical product for which statistics are available. The total production in Western Europe in 1988 is estimated to be approx. 400.106 m2 (Cadogan et al., 1994). With a market share of 12% of total phthalates for DINP, and assuming that the life of this product is 7 years, the release would be 3.2 t/a.
70

CHAPTER 3. ENVIRONMENT
Western European statistics for coated products, film and sheet, such as upholstery, packaging, stationary products, luggage, clothing etc. are not available. Cadogan et al., (1994) propose a worst-case release for phthalates of 40 t/a (assuming a product lifetime of 7 years). With a market share of 12% of total phthalates for DINP, the release would be 4.8 t/a.
About 50% of the DINP-containing cables and wires are used indoors (ECPI, 1999). Based on the release rates determined by Environ Corporation (1988), a release rate of 86.5 t/a for all phthalates was derived by ECPI (1999). This would correspond to a release of DINP of 10.4 t/a.
Assuming that hose and profile (DINP consumption 5,379 t/a, technical lifetime 10 years) has a similar surface to volume ratio and conditions of use to flooring (DINP consumption 14,201 t/a), the DINP emissions from these products are estimated to be 1 t/a.
B) Emissions during exterior end use of PVC products
The same lifetimes and break-up of the different products as described in Section 3.2.1 are used to estimate the releases into air.
In BRE (1998) 0.05% is assumed to be evaporated for outdoor use products during its whole lifetime. There is no information on the dimension and technical lifetime lying behind this value. It is therefore not possible to recalculate this figure to emission/area. Instead the emission rate used for indoor use, 9.5 mg/m2/a (see Section above) is used. The same specific surfaces as for leaching to surface water and soil is used for the estimation of the evaporation to air.
Technical lifetimes and emission factors for polymer end products are summarised in Table 3.19. The releases to air from outdoor uses are summarised in Table 3.20.
Table 3.19 Surface Correction factor (SCF), technical lifetimes and consumed volumes on main groups of outdoor use types (polymer end products)
Type Average thickness
(mm)
Emission sides 1)
SCF Volumes
(t/a)
Emitting surface area 3)
(m2)
Technical lifetime
(years)
Car under-coating 1.5 single 1 7,714 4,103,750 14
Roofing material 1.5 single 1 230 122,360 20
Coil coating 0.15 single 10 1,150 6,118,000 10
Fabric coating 1.5 double 2 4,850 4,160,400 10
Wires and cables 2 1.5 single 1 2,900 1,542,800 30
Hoses and profiles 3 single 0.5 1,380 367,100 10
Shoe soles 10 single 0.15 8,313 663,400 5
1) Polymer applied on a non-diffusible material will only release DINP from one side 2) Above-ground use only 3) [ DINP volume of the end product].[the area of 1 ton roofing material = 532 m2].SCF
71

EU RISK ASSESSMENT REPORT – DINP FINAL REPORT, 2003
Table 3.20 Summary of total releases from outdoor use of PVC end products to air
Scenario Emission to air t/a
Car undercoating 0.54
Roofing material 0.02
Coil coating 0.58
Fabric coating 0.49
Wires and cables 0.44
Hoses and profiles 0.03
Shoe soles 0.03
Total 2.14
In summary, the total release to air from indoor and outdoor use of PVC products is 39.6 + 2.14= 41.7 t/a i.e.:
Input continental [t/a] Input regional [t/a]
Air 37.6 4.2
Use of DINP-containing non-PVC polymers (life cycle step IVb)
In taking into account the same assumptions and breakdown for exterior and interior use of PVC polymers, DINP loss to air can be estimated as reported in the following table.
Input continental [t/a] Input regional [t/a]
Air 1.0 0.11
Release from applied sealings containing DINP (life cycle step IVc)
For sealings, the same approach as for PVC roofing material (see above) can be used. With a use volume of 915 t/a, a release factor to air of 9.5 mg/m2 due to evaporation, an SCF of 1 and a lifetime of 20 years, the release would be:
Input continental [t/a] Input regional [t/a]
Air 0.08 0.01
Paper recycling (life cycle step IVd)
No air emission is assumed to take place (TGD, Appendix I, Table A5.2).
72

CHAPTER 3. ENVIRONMENT
Release from applied paints containing DINP (life cycle step IVe)
For paints, the same approach as for PVC coil coating (see above) can be used. With a use volume of 915 t/a, a release factor to air of 9.5 mg/m2 due to evaporation, an SCF of 10 and a lifetime of 7 years, the release would be:
Input continental [t/a] Input regional [t/a]
Air 0.30 0.03
Disposal of end products (life cycle step V)
Due to lack of information on non-polymer end products the emission scenarios are limited to polymer end products. Four emission sources are identified for the disposal life cycle step:
• car shredding sites, • municipal incineration stations, • municipal landfills, • waste remaining in the environment.
Car shredder waste
Based on data from BASF (1999a) shredding of disposed vehicles is defined to be a potential source for release of DINP (from car-undercoating and cables). This is carried out to separate the non-ferrous from the ferrous metals for recycling purposes. A by-product is the so-called light shredder fraction, which contains most of the rigid, flexible and foamed plastics, elastomers, wood, glass and dirt. This light shredder is landfilled within the EU. The process of dry shredding is the most practised system in Europe. Old cars enter the shredding process after removal of fluids, batteries and converter radiators. The shredding itself takes place through hammering on the scraps until the granulation of the scraps is small enough to be pushed through the gates. The light fraction is separated through an aspiration system. During the shredder process a normal temperature was measured ranging between 30 and 45°C, with exceptionally higher temperature occurring only temporary at compact and large individual items (e.g. crank shafts).
Releases will be mainly to air. The following calculation for the dry process can be made (BASF, 1999a):
Car processed in Denmark and Germany: 3.850,000 Shredder sites in EU: 252 Car processed in EU: 10,600,000 PVC per car: 16 kg (source APME) Plasticiser per car: 5.4 kg (average of 35% soft PVC) (ECPI) DINP per car: 0.65 kg (market share of 12% for DINP) Total EU input of DINP in shredder: 6,900 t/a
73

EU RISK ASSESSMENT REPORT – DINP FINAL REPORT, 2003
As a worst-case emission factor for the air the same release factors for “plastisol processing”, i.e. 0.356% was assumed:
Total release of DINP into air 6,900.0.00356=24.6 t/a
Input continental [t/a] Input regional [t/a]
Air 22 2.5
Incineration of waste
No data regarding the release of DINP from incinerators due to the incineration of DINP containing products are available. An estimation of the releases of DEHP from incinerators has been performed in the corresponding risk assessment (EC, 2001), based on measurements in smoke, ash and wastewater at one incineration station in Denmark (Miljöstyrelsen, 1996). It was found that 9% of the emissions are directed to the atmosphere, while 91% remain in the slags and the fly ash, which are landfilled. The total releases to the atmosphere for DEHP are estimated to be 5.7 t/a. In a first approach the same releases will be assumed for DINP:
Input continental [t/a] Input regional [t/a]
Air 5.1 0.57
Disposal to landfills
Landfills are identified to emit phthalates mainly through the leakage water (ECPI, 1996). It is assumed that no emissions occur to the atmosphere.
Waste remaining in the environment
As presented in Section 3.1.2.1, releases due to waste remaining in the environment are possible. The total release of DINP was estimated to be 3,096 t/a. The fraction released to air is approximated at 0.1%. The releases would be:
Input continental [t/a] Input regional [t/a]
Air 2.8 0.3
The total releases to air due to disposal of end products are therefore:
Input continental [t/a] Input regional [t/a]
Air 29.9 3.4
74

CHAPTER 3. ENVIRONMENT
Summary of releases to air
Based on the estimations performed above, the overall releases to air are summarised in Table 3.21.
Table 3.21 Total releases to air
Life cycle step Air (t/a)
Continental Regional
I: Production - -
II: Distribution - -
IIIa: Processing in PVC 40.4 4.74
IIIb: Processing in non-PVC polymers 4.6 0.51
IIIc: Use as an additive in adhesives, glues and sealing compounds Formulation Application
2.1 0.08
0.23 0.01
IIId: Use as an additive in inks for paper Formulation Application
2.1 -
0.23
-
IIIe: Use as an additive in paints Formulation Application
2.1 -
0.23
-
IVa: Exterior and interior use of DINP-containing PVC-products 37.6 4.2
IVb: Use of DINP-containing non-PVC products 1.0 0.11
IVc: Applied sealings containing DINP 0.08 0.01
IVd: Paper recycling - -
IVe: Applied paint containing DINP 0.3 0.03
V: Disposal of end products 29.9 3.4
Total 120 13.5
3.1.3.2 Estimation of local air concentrations and deposition rates
The concentration in air at 100 m from a point source can be estimated as follows:
Clocalair (mg/m3)=Elocalair.Cstdair
where Elocalair (kg/d)=local (max) emission rate to air Cstdair=standard concentration in air at source strength of 1 kg/d =2.78.10-4 mg/m3.
75

EU RISK ASSESSMENT REPORT – DINP FINAL REPORT, 2003
Based on its vapour pressure and - 2 < log HENRY < 2, the annual deposition over a radius of 1,000 m around the source can be estimated as:
DEPtotalann=(Elocalair + Estpair).(Fassaer.DEPstdaer + (1-Fassaer).DEPstdgas
where:
Estpair (kg/d) = local indirect emission to air from the STP
DEPstdgas = deposition flux of gaseous compounds (- 2 < log HENRY < 2) at source strength of 1 kg/d=4.10-4 mg/m2/d.
Fassaer = fraction of the chemical bound to aerosol=1 (measurements at the workplace have shown that 100% of the substance is bound to the aerosol)
DEPstdaer = standard deposition flux of aerosol-bound compounds at a source strength of 1 kg/d=1.10-2 mg/m2/d.
Production (life cycle step I)
Emission to air is negligible according to the TGD. Therefore, no local concentrations are estimated.
Processing in PVC polymers (life cycle step IIIa)
The same assumption as for the aquatic environment is taken. The same release fractions as for wastewater are assumed.
Details of Clocalair formula see Section above.
Calendering Extrusion Injection
moulding Plastisol spread
coating Other Plastisol applications *
DINP-consumption per site [t/a] 1,110 4,600 1,800 1,305 290
Release% raw handling 0.005 0.005 0.005 0.005 0.005
Release% compounding 0.0035 0.0035 0.0035 0 0
Release% conversion 0.025 0.0025 0.005 0.0812 0.178
Release% [total] 0.033 0.011 0.0135 0.0862 0.183
Release [t/a] 0.37 0.51 0.243 1.12 0.53
Number of days 300 300 300 300 300
Local release to air [kg/d] 1.22 1.69 0.81 3.7 1.8
Local release to air indirect [kg/d] 0.012 0.017 0.008 0.037 0.018
DEPtotalann [mg/m² x d] 0.012 0.017 0.008 0.037 0.018
Clocal [µg/ m3] 0.34 0.47 0.22 1.03 0.50
* Slush or rotational moulding only as the releases are negligible for car underbody coating
Processing in non-PVC polymers (life cycle step IIIb)
As for the water emission scenario, the same emission factor as for PVC applications is taken for non-PVC polymer applications.
76

CHAPTER 3. ENVIRONMENT
Tonnage DINP per site 180
Number of days 300
Emission factor% 0.1865
Local release to air, direct [kg/d] 1.12
Local release to air, indirect [kg/d] 0.01
DEPtotalann [mg/m². d] 0.01
Clocal [µg/m3] 0.31
Use in adhesives, glues and sealing compounds (life cycle step IIIc)
The following local PEC can be calculated taking into account the emission factors of 0.25% (TGD, Appendix I, Table A1.2) for formulation and 0.01% (TGD, Appendix I, Tables A3.16) for the application step.
Formulation Application
Regional release [t/a] 0.23 0.01
Number of days 300 29
Fraction of main source 1 0.8
Local release to air, direct [kg/d] 0.77 0.25
Local release to air, indirect [kg/d] 0.03 0
DEPtotalann [mg/m².d] 0.008 0.0025
Clocal [µg/m3] 0.21 0.07
Use in inks for paper (life cycle step IIId)
During formulation an emission factor of 0.0025 (MC 3) applies.
In regard to application of DINP containing inks, no direct emission takes place and an indirect air emission of 0.0024 kg/d is considered negligible to derive a deposition rate.
Formulation
regional release [t/a] 0.23
number of days 300
fraction of main source 1
Local release to air, direct [kg/d] 0.77
Local release to air, indirect [kg/d] 0.03
DEPtotalann [mg/m².d] 0.008
Clocal [µg/m3] 0.21
77

EU RISK ASSESSMENT REPORT – DINP FINAL REPORT, 2003
Use in paints (life cycle step IIIe)
During formulation, the emission factor of 0.0025 (TGD, Appendix I, Table A2.1, MC3) is employed. In regard to the application step, no direct air emission is assumed (TGD, Appendix I, Table A3.15). The indirect air emission (0.003 kg/d) via the STP is considered negligible.
Formulation
Regional release [t/a] 0.23
Number of days 300
Fraction of main source 1
Local release to air, direct [kg/d] 0.77
Local release to air, indirect [kg/d] 0.03
DEPtotal [mg/m².d] 0.008
Clocal [µg/m3] 0.21
Other life cycle steps
No local estimations are performed for life cycles IVa, IVb, IVc, IVd and V as these are diffuse emissions, which are taken into account in the regional model.
3.1.4 Terrestrial compartment
3.1.4.1 Releases to soil and estimation of local soil concentrations
3.1.4.1.1 Agricultural soil
DINP can reach agricultural soil through two exposure routes:
• application of sewage sludge in agriculture, • dry and wet deposition from the atmosphere.
For the calculation of the regional and continental concentrations, the total release through sludge application needs to be determined. The fraction of the DINP in the STP influent being adsorbed onto sewage sludge is 82%. A connection rate of 70% to a STP is considered for all other life cycle steps.
The contributions from production have been neglected as most producers have indicated that the sludge from their on-site STP is incinerated. Deposition rates from air have not been calculated as emission due to production is considered to be negligible.
The resulting local concentrations in soil at the different life stages are summarised in the following table. The intermediate calculation results are listed in the EUSES calculations.
78

CHAPTER 3. ENVIRONMENT
Table 3.22 Local concentrations in soil
Life cycle Clocal_soil [µg/kg dw]
180-d average soil porewater conc. [µg/l]
Processing in PVC (life cycle step IIIa) (highest release) 10,900 1.6
Processing in non-PVC polymers (life cycle step IIIb) 3,290 0.5
Formulation of sealing compounds(life cycle step IIIc) 8,950 1.3
Use of sealing compounds (life cycle step IIIc) negligible negligible
Formulation of printing inks (life cycle step IIId) 8,950 1.32
Use of printing inks (life cycle step IIId) 723 0.1
Formulation of paints (life cycle step IIIe) 8,940 1.3
Use of paints (life cycle step IIIf) 860 0.13
Paper recycling (life cycle step IVd) 643 0.09
Diffuse releases are taken into consideration for estimating the concentration in urban / industrial soil (see Section below)
It should be noted that in most of the PEC calculations, the porewater concentration is higher than the water solubility of the substance (0.6 µg/l). This throws some doubt over the estimation methods used. The soil porewater concentration is used for the estimation of the exposure of man via the environment, particularly from root crops. For assessment purposes, the soil porewater concentration is set equal to the water solubility of the substances.
Groundwater
Given the high adsorption potential of DINP, it could be argued that the substance does not leach though the soil column and that the concentration in groundwater would be negligible. Nevertheless, DINP has been detected in agricultural soil, heavily amended with sewage sludge for 25 years, down to a depth of 60 cm in a monitoring study by Vikelsoe et al. (1999). Di-n-nonyl phthalate (DnNP) as well as diisononyl phthalate were determined:
Table 3.23 Local concentrations in groundwater
Depth (cm) DnNP (µg/kg dw) DINP (µg/kg dw)
Agricultural soil, amended with 0-10 160 130 high amounts of sewage sludge 10-20 200 220 for 25 years, changed to 20-30 200 200 artificial fertiliser 6 years 30-40 180 96 before sampling, cattle grazing 40-50 120 93
Same location, sampled 2 years later 0-10 120 410 10-20 160 540 20-30 210 670 30-40 290 910 40-50 210 280 50-60 84 63
79

EU RISK ASSESSMENT REPORT – DINP FINAL REPORT, 2003
These results would indicate that DINP can migrate to deeper soil layers. This phenomenon might be explained by leaching of particulate matter.
In a first approach, the results obtained with EUSES for soil porewater concentration will be used as groundwater concentrations (corrected for water solubility if necessary).
3.1.4.1.2 Industrial / urban soil
In addition to the releases to agricultural soil due to sludge application and atmospheric deposition, diffuse releases to urban and industrial soil occur. In Table 3.24, the estimated DINP releases to urban / industrial soil are summarised, based on the overall releases as estimated in Section 3.1.2.1.
Table 3.24 Estimated diffuse DINP-releases to industrial / urban soil
Life cycle step Emission [t/a]
Exterior and interior use of DINP-containing PVC-products1) (life cycle step IVa) car undercoating roofing material coil coating coated fabric cables and wires shoes soles
total continental regional
109 1.3 32.1 27.1 24.3 3.8
199.5 179.6 19.9
Use of DINP-containing non-PVC polymers 2) (life cycle step IVb) total continental regional
5.4 4.87 0.54
Disposal of end products 3) (life cycle step V) total continental regional
2,322 2,090 232
total continental regional
2,527 2,274 253
1) It is assumed that the amount released through leaching is equally distributed to urban/industrial soil and surface water (see Section 3.1.2.1) 2) With the same assumptions and breakdown for exterior and interior use of PVC-products 3) The fraction released to soil is approximated at 75% (see Section 3.1.2.1)
These releases contribute to the regional concentrations. No local concentrations are derived.
The releases from under-ground use of cables and wire need to be considered separately. Field studies are available for the leaching of DEHP (De Coste, 1968; 1971). The techniques used and locations are almost identical in the two studies. 0.76 mm sheet samples where buried in soil in Georgia, US (humid climate, pH 5.2) at two different depths mounted on polyethene tubes. After 32 or 48 months the concentration of DEHP in the exposed PVC sheets was measured.
80

CHAPTER 3. ENVIRONMENT
The following decreases in concentration were observed:
Table 3.25 % DEHP loss from cable material after 32 months in soil (Georgia sites, original conc. 37.2%)
Study I Study II
Exposure duration 48-month 32-month
Original conc. DEHP 30.6% 37.2%
Soil depth 15 cm 45 cm average 25 cm 60 cm average
Total % DEHP loss 4.7 3.1 3.9 0.90 2.50 1.70
% loss / year 1.18 0.78 0.98 0.34 0.94 0.64
These studies did not show any clear correlation between emission rate and depth. The observed variation may depend on uncertainty in the chemical analysis. However, it may also depend on heterogeneity in the soil compartment. The relative low pH in the studied soil should be considered. It is unclear if pH influences the emission/degradation of DEHP. An identical study was also carried out in another region (Study I, New Mexico) with higher pH (8.2). The dissipation of phthalates was not measured in this study. However, the change in mechanical properties (tensile stress) of the plastics was measured. Since elongation for this type of materials is sensitive to small changes in plasticiser concentration (according to the author) this parameter can be used as an indication of phthalate dissipation. By comparing the changes in elongation it clearly indicates that the phthalate dissipation is higher in the basic soil. The level of dissipation of DEHP in Table 3.25 may therefore be underestimated compared to neutral and basic soils. Due to these uncertainties the highest estimated emission rate in Table 3.25, i.e. 1.2%, is assumed in this RAR (worst-case assumption). The primary recipient is assumed to be 100% to the soil environment.
A hypothesis proposed by the industry is that all DEHP diffused to the surface of PVC will directly be degraded by microorganisms. This is based on landfill studies (Mersiowsky et al., 1999) in which the authors suggest that the microorganisms by degrading DEHP on the surface of PVC increase the diffusion of new DEHP to the surface. However, a laboratory study has shown that dirt abiotically very effectively increases the diffusion of DEHP to the surface (Pastuska et al., 1988). Further, the environmental conditions in a landfill are considerably different from a mineral soil. Also the microorganism metabolisation/adaptation capacity probably differs between these two environments.
The contribution from soil buried cables is special though. Since this release occurs deep in the ground it cannot be added together with the other more surface oriented releases. In the TGD the urban/industrial soil depth is only 5 cm. The PEC calculations are therefore not able to cover this release. Development of new distribution models is therefore needed (with focus on groundwater exposure). Until better model will be available the contribution from soil buried cables are excluded from the PEC calculations.
3.1.5 Secondary poisoning
As described in Section 3.1.1, the bioaccumulation potential of DINP is difficult to interpret. For secondary poisoning, BCF values of 4,000 for aquatic organisms and 1 for terrestrial organisms have been chosen. In Table 3.26, the exposure to predators through aquatic organisms and earthworms is presented.
81

EU RISK ASSESSMENT REPORT – DINP FINAL REPORT, 2003
Table 3.26 Exposure of top predators through food
Life cycle PECoralaquatic [mg/kg ww] *
PECoralworm [mg/kg ww]
Production (life cycle step I) 4.62 0.01
Processing in PVC (life cycle step IIIa) (highest release) 17.9 4.1
Processing in non-PVC polymers (life cycle step IIIb) 7.6 1.2
Formulation of adhesives, glues and sealing compounds (life cycle step IIIc) 14.9 3.35
Use of sealing compounds (life cycle step IIIc) 2.7 0.009
Formulation of printing inks (life cycle step IIId) 14.9 3.35
Use of printing inks (life cycle step IIId) 2.93 0.28
Formulation of paints (life cycle step IIIe) 14.9 3.35
Use of paints (life cycle step IIIf) 3.1 0.33
Paper recycling (life cycle step IVd) 3.49 0.25
* Values corrected for a higher BCF value compared to the EUSES results, based on BCF for fish only
3.1.6 Regional and continental concentrations
The calculations of PECs at a regional and continental scale were carried out using the SIMPLEBOX model, integrated in EUSES.
The resulting regional concentrations PEC regional are (see EUSES calculations):
Surface water: 0.70 µg/l Sediment: 17.8 mg/kg dw Air: 0.0004 µg/m3 Agricultural soil: 0.019 mg/kg dw Urban / industrial soil 1 mg/kg dw Groundwater: 0.003 µg/l
3.1.7 Monitoring data
The amount of measured concentrations in the environment for DINP is very limited. A comparison with estimated PEC is therefore not opportune. A comparison can nevertheless be performed with the large amount of monitoring data available for di(2-ethylhexyl) phthalate (DEHP). The quantities of DEHP used in Western Europe are more than twice the amount of DINP used. Furthermore, DEHP is more volatile, so that a higher release to the environment has to be expected.
An indicative comparison can be made by comparing the DINP concentrations with the DEHP concentrations measured in the same studies (Table 3.27).
82

CHAPTER 3. ENVIRONMENT
Table 3.27 Comparison of DINP and DEHP concentrations measured at the same locations
Compartment DINP DEHP Reference
Surface water [µg/l] 1.08, 1.09 0.68, 0.66 Elf Atochem (1997)
Surface water [µg/l] <0.1, <0.1, <0.1, <0.1 0.14, 0.12, 0.73, 0.19 Vikelsoe et al. (1998)
Sediment [µg/kg dw] <100, 250, 110, 230 365, 560, 865, 570 Elf Atochem (1997)
Sediment [µg/kg dw] < 25 - 6161 (median: 161) < 25 - 2089 (median: 150) ALcontrol (1999)
Mussels [µg/kg dw] 640, < 500, 810 1500, 1390, 1850 Elf Atochem (1997)
Algae [µg/kg dw] <100 650 Elf Atochem (1997)
Sewage sludge [µg/kg dw]
13,800, 12,900, 6,670, 7,340, 4,760
18,300, 17,500, 14,500, 13,400, 17,900 Kolb et al. (1997)
Sewage sludge [µg/kg dw]
110, 4, 6,700, 5,600, 2,100, 2,100, 3,400, 1,500, 370, 2,400, 1,500, 3,100, 410, 5,500, 23,000, 5,400
1,100, 30, 29,000, 25,000, 8,700, 9,400, 15,000, 6,500, 3,100, 5,900, 8,200, 20,000, 4,200, 14,000, 117,000, 15,000
Vikelsoe et al. (1999)
Soil [µg/kg dw] 17, 7, 5, 3, 18, 4, 15, 34, 26, 13, 3, 4, 8, 7, 35, 5, 4, 8, 34, 16, 8, 3, 16, 1 4, 3, 4, 3, 9, 130, 220, 200, 96, 93, 410, 540, 670, 910, 280, 63, 110, 16, 5, 7, 1,
8, 6, 27, 4, 16, 15, 32, 14, 20, 16, 18, 8, 18, 1, 9, 12, 9, 15, 20, 18, 13, 9, 6, 15, 22, 18, 17, 23, 21, 990, 1,700, 1,400, 880, 590, 1,400, 1,700, 1,800, 3,400, 1,200, 550 670, 76, 9, 26, 5,
Vikelsoe et al. (1999)
Soil [µg/kg dw] < 25 (n = 34) < 25 - 205 (median: 110) ALcontrol (1999)
These very limited data would suggest that the environmental concentrations of DINP is of the same order of magnitude or lower than those of DEHP.
The monitoring data of DEHP could therefore be used along those of DINP in this risk assessment.
3.1.7.1 Wastewater
Phthalate concentrations were determined in wash water from two car wash stations in Denmark in 1996 and 1997 (Vikelsoe et al., 1998). The samples were taken at the car wash station in the well collecting the washing water in the washing room. 26 Samples were taken, each from the wash water of a different car. Di-n-nonyl phthalate (DnNP) as well as DINP were determined.
DnNP was analysed in all 25 samples. The concentrations varied from <1 to 55 µg/l (mean: 11.1 µg/l). The corresponding emissions per single wash varied from <0.1 to 8 mg/wash (mean 1.5 mg/wash). DINP was analysed in 13 samples. The concentrations varied from <50 to 510 µg/l (mean: 284 µg/l). The corresponding emissions per single wash varied from <7 to 71 mg/wash (mean: 40 mg/wash).
Phthalate concentrations were determined in wastewater from several possible sources of phthalates in Denmark in 1996 and 1997:
- A municipal hospital: one sampling site was located near the main medical treatment building complex at the X-ray department; the other samples were taken at the physicians building and at a parking lot; 2 samples were taken at each site. DINP was not detected at a limit of
83

EU RISK ASSESSMENT REPORT – DINP FINAL REPORT, 2003
determination of 50 µg/l. DnNP was detected in 2 out of six samples at concentrations of 1.5 and 2.1µg/l.
- A kindergarten; two samples were taken in a sewer well outside the building collecting the wastewater from the whole institution. DINP was not detected at a limit of determination of 20,000 µg/l. DnNP was detected at a concentration of 280 µg/l.
- An industrial laundry. DINP was not detected at a limit of determination of 50 µg/l. DnNP was detected in 1 out of 2 samples at a concentration of 8.3 µg/l.
- A manufacturer of glue and sealants; one sample was taken during normal operating conditions; another was taken during a simulated spilling episode when cleaning a process tank (normally the washing water from tank cleaning is recycled). Neither DINP nor DnNP were detected at limits of determination of respectively 20,000 and 80 µg/l.
In Table 3.28, the most relevant monitoring data for DEHP in wastewater are presented, as reported in the EU risk assessment for DEHP (EC, 2001):
Table 3.28 Monitoring of DEHP in wastewater
Location Conc. (µg/L) Influent Effluent
Year Remarks and References *
Municipal
Sweden, Stockholm (Henriksdal)
weekdays: 6-11
weekend: 4 - 6
weekdays: <1
weekend: <1
1989 Stockholm vatten (1990) Samples from 2 inlet tubes, 24-hour mixing samples
Sweden, Stockholm (Henriksdal)
w: 39 and 47 we: 34 and 46
w: 28 we: 15
1991 Stockholm vatten (1991a) Samples from 2 inlet tubes
Sweden, Stockholm (Bromma) Three different influent streams to the same STP
23, 34, 38 mean 31.6
1.8 1990 Stockholm vatten (1991b)
Denmark, (Skaevinge). Low industrial load 247 5,2 1992 Grüttner and Jacobsen (1994) 33
14 4 4
1995 Grüttner et al. (1995) Two different laboratories
Denmark, (Avedøre). Significant ind. load 122 23 1992 Grüttner and Jacobsen 1994 49
35 28 10
1995 Grüttner et al. (1995) Two different laboratories
Denmark, (Marselisborg). Significant ind. load 223 12 1992 Grüttner and Jacobsen 1994 39
26 28
0.5 <2.5 <7
Grüttner et al. (1995) Three different laboratories
Denmark, Søholt Viby
Mean 33.3 (n=3)
Mean 35 (n=3)
Mean 2.4 (n=3)
Mean 1 (n=3)
Boutrup et al. (1998)
Table 3.28 continued overleaf
1995
1996
84

CHAPTER 3. ENVIRONMENT
Table 3.28 continued Monitoring of DEHP in wastewater
Location CONC. (µg/L) Influent Effluent
Year Remarks and References *
Denmark, Wastewater from car wash sites Wastewater from a hospital Wastewater from and industrial laundry Wastewater from a kindergarten Wastewater from an adhesives Manufacturer
11 - 260 (n= 26)
mean: 112 <3 - 35 (n = 6)
mean: 15.2 91 / 130
< 600 (n = 1) < 600 (n = 2)
1996/97 Vikelsoe et al. (1998)
Norway, Bekkelaget, Oslo Fugelvik VEAS, Slemmestad, Oslo
6.3 12.8 15.0
0.075 0.127 0.068
1996 Braaten (1996) PVC foil producer in the area
Germany, sewage treatment plant Mainly house hold influent
25 0.54 1992 Furtmann (1996)
Germany, sewage treatment plant Mainly industrial influent
- 71
0.70 0.90
Industrial
Sweden, Neste Oxo 57 1990 Källqvist et al. (1991)
Sweden, Neste Oxo 0.08 1997 Solyom and Ekengren (1997)
Sweden, Stockholm. (Bromma). Wastewater from three industrial areas
1,800, 28, 55 - 1990 Stockholm vatten (1991b)
Canada, Ontario, organic chemical industry (9 sites)
- 0.4 - 19 1989 / 1990
OAEI (1996)
Canada, Ontario, inorganic chemical industry - 0.22 – 65.1 1989 / 1991
Canada, Ontario, Petroleum refining (7 refineries)
1.4 – 11 mean: 1.9
1988 / 1989
* Full references are found in EC (2001) Summary
In monitoring studies on different municipal STPs in Sweden, Denmark, Norway, and Germany, measured concentrations in untreated wastewater (influent) varied between 4-250 µg/l. The variation may depend on different contributions from household and industrial wastewater, different methods of analysis and possibly many other factors.
In the treated wastewater (effluent) the DEHP concentrations varies between 0.07 and 28 µg/l.
There are very few data on concentrations of DEHP in purely industrial wastewater. There is one example of very high DEHP concentrations (1,800 µg/l) in a tube that connects wastewater from an industrial area to the main inlet tube to a Swedish municipal STP. In effluent wastewater from industries and industrial areas, measured concentrations varied between 0.08 and 65 µg/l.
3.1.7.2 Surface water
Ground- and drinking water samples from three Japanese cities were analysed in 1993-1994 and DINP was not detected in any samples (detection limit = 5 µg/l, n = 9).
85

EU RISK ASSESSMENT REPORT – DINP FINAL REPORT, 2003
Surface water samples collected from four Japanese rivers and two coastal locations were analysed in 1994. DINP was not detected in any sample (detection limit 5 µg/l, n = 14) (Association of Plasticiser Industry, 1994).
DINP and di-n-nonyl phthalate were measured in two small rivers in Denmark in 1996/1997. DnNP was detected in 2 out of 4 samples at 0.02 and 0.068 µg/l, while DINP was not detected at a limit of determination of 0.1 µg/l (Vikelsoe et al., 1998).
Positive measurements of DINP in surface water are reported by Elf Atochem (1997). Six locations in the Seine estuary in France were sampled and analysed at a detection limit of 0.5 µg/l. Only two samples were positive at concentrations around 1 µg/l.
Fawell et al. (2001) analysed DINP in 12 samples from 7 locations on the Trent river in the UK. At a detection limit of 0.2 µg/l, DINP was detected in 1 sample at a concentration of 0.3 µg/l.
In Table 3.29, the most relevant monitoring data for DEHP in inland surface water are presented, as reported in EC (2001).
Table 3.29 Monitoring of DEHP in surface water
Location Pollution status Date of sampling
n Concentration (µg/l Remarks and references *
Riverwater
The Netherlands, Rhine and Meuse. Sample every month in three years.
Not specified 1988 –1990 36 36
Rhine: <0.1-1.0 Meuse: <0.1-4.2
Random peak values. DetectionLimit: 0.1 µg/l Bodar (1996)
Germany, Rhine: Bad Honnef Village, industrial region 1991-1992 21 0.14-10.27 (mean: 1.54)
Furtmann, 1993
Germany, Rhine: Dusseldorf-Flehe Town, industrial region 1991-1992 20 0.11-3.12 (mean: 0.55)
Germany, Rhine: Götterswickerhamm Town, industrial region 1991-1992 21 0.23-3.10 (mean: 0.61)
Germany, Ruhr, Frödenberg Town, industrial region 1991-1992 8 0.21-0.49 (mean: 0.33)
Germany, Rhine: Kleve Bimmen Industrial region 1991-1992 21 0.14-1.94 (mean: 0.64)
Germany, Sieg, at the mouth to the river Rhine
Industrial region 1991-1992 21 0.08-1.03 (mean: 0.40)
Germany, Wupper, at the mouth to the river Rhine
Industrial region 1991-1992 21 0.16-6.54 (mean: 0.96)
Germany, Erft, mouth to the river Rhine Industrial region 1991-1992 20 0.15-1.06 (mean: 0.36)
Germany, Ruhr, at the mouth to the river Rhine
Industrial region 1991-1992 21 0.18-1.12 (mean: 0.60)
Germany, Emsher, at the mouth to the river Rhine
Industrial region 1991-1992 21 0.57-9.58 (mean: 2.36)
Germany, Lippe, at the mouth to the river Rhine
Industrial region 1991-1992 21 0.151-1.8 (mean: 0.67)
Sweden, River Fyrisån, Uppsala Town Apr 1996 3 0.120, 0.133, 0.326 Parkman and Remberger
Sweden, River Motala ström, Norrköping Town, down-stream municipal STP.
Mar 1996 3 0.006, 0.011, 0.037 (1996)
Sweden, River Svartån, Örebro Town Mar 1996 1 0.022
Table 3.29 continued overleaf
86

CHAPTER 3. ENVIRONMENT
Table 3.29 continued Monitoring of DEHP in surface water
Location Pollution status Date of sampling
n Concentration (µg/l) Remarks and references *
Denmark. Giber Å ”spildevandsbelastet” 1998 1 serie
1
<0.2 <0.2
increased flow 0.55
Boutrup et al (1998)
Denmark. Möddebro baek. ”spildevandsbelastet” 1998 1 serie
1
<0.2 <0.2
increased flow 0.87
Denmark, Hove Å Maglemose Å
1996/1997 2 2
0.14, 0.12 0.73, 0.19
Vikelsoe et al. (1998)
UK River Humber, Ouse Largely agricultural 1995/1996 4 0.74 / 0.90 / 21 / 8.57 Long et al. (1998)
UK River Humber, Aire Urban and industrial 4 0.36 / 0.43 / 21 / 13
UK River Humber, Swale Upland agricultural 3 1.02 / 1.24 / 3.55
UK River Humber, Calder Urban and industrial 4 0.84 / 0.63 / 4.26 / 5.38
UK River Humber, Don Urban and industrial 4 1.36 / 1.30 / 8.38 / 8.85
UK River Humber, Trent Urban and industrial 3 0.74 / 15 / 18
Lake water
Sweden, Lake Riddarfjärden, Stockholm Town Apr 1996 1 under ice 0.015 icebreak 0.072
Parkman and Remberger (1996)
Sweden, Lake Orrholmsviken, Karlstad Town Mar 1996 3 0.051, 0.061, 0.114
Sweden, Lake Härsvatten, SW. Unpolluted area Mar 1996 3 0.010, 0.011, 0.013
Sweden, Lake Fräcksjön, SW. Unpolluted area Mar 1996 3 0, 0.008, 0.012
Norway, Lake Femunden. Non-polluted area 1996 1 <0.060 Braaten et al (1996)
Norway, Lake Heddalsvatn Industry and dense population nearby.
1 <0.060
Norway, Hamar, Lake Mjösa. Industry and dense population nearby.
1 0
Norway, Furnesfj., Lake Mjösa. Industry and dense population nearby.
1 <0.060
Norway, Gjövik, Lake Mjösa. Industry and dense population nearby.
1 0.182
Norway, Lake Lundevatn. ”Effected by long range pollution”.
1 0.144
* Full references are found in EC (2001)
Summary and comparison with estimated concentrations
Most measured DEHP-levels in surface water over the last 10 years are below 1 µg/l. Peak values reach up to 10 µg/l in German rivers. Consistently higher values were measured in rivers in the UK with average concentrations of ca. 6 µg/l and peak values up to 21 µg/l. The only measured results for DINP lie around 0.3-1 µg/l.
Most estimated local concentrations are between 1 and 10 µg/l with peak values at 18 µg/l. The regional concentration reaches 0.22 µg/l.
87

EU RISK ASSESSMENT REPORT – DINP FINAL REPORT, 2003
It can be concluded that the measured and estimated concentrations fully correlate. The estimated concentrations are therefore used in the risk characterisation.
3.1.7.3 Suspended matter and sediment
No results regarding the presence of DINP in suspended matter could be found.
In Table 3.30, the most relevant monitoring data for DEHP in suspended matter are presented, as reported in EC (2001):
Table 3.30 Monitoring of DEHP in suspended matter of surface water
Location Pollution status Year n Conc. (mg/kg dw) Reference *
Germany, Rhine: Bad Honnef Village, industrial region 1991-1992 14 2.9-83.0 (mean: 29.6) Furtmann (1993)
Germany, Rhine: Dusseldorf-Flehe Town, industrial region 1991-1992 14 3.6-36.1 (mean: 14.3)
Germany, Rhine: Götterswickerhamm Town, industrial region 1991-1992 14 2.4-35.8 (mean: 16.7)
Germany, Rhine: Kleve Bimmen Town, industrial region 1991-1992 14 10.8-37.1 (mean: 18.4)
Germany, Sieg, at the mouth to the river Rhine
Industrial region 1991-1992 12 8.2-56.7 (mean: 23.1)
Germany, Wupper, at the mouth to the river Rhine
Industrial region 1991-1992 12 18.8-155.0 (mean: 57.0)
Germany, Erft, mouth to the river Rhine Industrial region 1991-1992 14 2.8-60.0 (mean: 21.6)
Germany, Ruhr, at the mouth to the river Rhine
Industrial region 1991-1992 13 4.4-73.4 (mean: 33.2)
Germany, Ruhr, Frödenberg Industrial region 1991-1992 7 0.0-89.2 (mean: 26.1)
Germany, Emsher, at the mouth to the river Rhine
Industrial region 1991-1992 14 48.1-175.0 (mean: 101.3
Germany, Lippe, at the mouth to the river Rhine
Industrial region 1991-1992 14 4.8-281.8 (mean: 75.6)
UK, Humber rivers, Ouse Largely agricultural 1995-1996 4 22.8 / 22.6 / 21.7 / 3.81 Long et al. (1998)
UK, Humber rivers, Aire Urban and industrial 4 115 / 15.3 / 20.4 / 13.8
UK, Humber rivers, Swale Upland agricultural 4 69.7 / 102 / 27.3 / 29.3
UK, Humber rivers, Calder Urban and industrial 4 32.3 / 32.3 / 39.1 / 55.4
UK, Humber rivers, Don Urban and industrial 4 17.7 / 18.1 / 18.1 / 47.2
* Full references are found in EC (2001)
Sediments were also sampled for DINP analysis from the same locations in the Seine estuaries as described above. 3 samples contained DINP concentrations above detection limit (0.1 mg/kg dw) at 0.25, 0.11 and 0.23 mg/kg dw.
A further study reported measured DINP concentrations in sediments (Parkman and Remberger, 1995). A problem to overcome in phthalate analysis is a contamination by these substances in laboratory material. This was carefully avoided. Sediments from 8 lakes in Sweden and 10 sample locations in Swedish river systems, which provided a gradient of anthropogenic influence, were analysed for DINP in 1994. A total of 54 sediment analyses were performed. DINP was not detected in any sample (detection limit: 0.01 mg/kg dw; Remberger (2000)).
88

CHAPTER 3. ENVIRONMENT
In the same study sediment samples were collected downstream of two point source discharges (processing sites) in 1994. DINP was only found below one point source: 150 mg/kg dw (sd ± 124). This means 3,700 (sd ± 3,472) mg per kg of organic matter in sediment (dw).
Sediments from drainage channels next to motorways in the Netherlands were sampled in 1992-1993. DINP concentrations ranged from < 0.1-0.8 mg/kg dw near new/ quiet roads (n=7). The concentration in one sample collected near an old/busy road was 6.7 mg/kg dw (n=1) (Slooff, 1993).
Sediment samples near a point source were also analysed in the Netherlands where DINP concentrations were below detection limit (< 0.1 mg/kg dw), n=11) (Slooff, 1993).
Sediments were collected from 4 sites on the Rhine River and 3 sites on the Neckar river in Germany. DINP concentrations for the Rhine and Neckar rivers ranged from 0.03-1.46 and from 0.43-1.05 mg/kg dw, respectively (Malisch et al., 1981).
Phthalates were monitored in sediment samples from the Netherlands in 1999 (ALcontrol, 1999). 30 samples from 21 locations were analysed. 60% of the samples revealed DINP concentrations above the limit of determination of 0.025 mg/kg dw. The median value was 0.16 mg/kg dw and the maximum measured concentration was 6.16 mg/kg dw. The detailed results are described in Table 3.31.
Table 3.3 Monitoring of DINP in sediment samples in the Netherlands 1
Sample code
Description of site sampled % Dry matter
% Organic carbon
% Mineral
particles
DINP (µg/kg dw)
1 Opeinder canal, no known point sources nearby, regional 77.6 1.9 7.5 150
2 Hantummervaart canal, no known point sources nearby, regional 64.6 2 19 93
3 Ool, River Maas, highly industrialised area, uncertain if represents local or regional
56.4 5.1 21 1,135
4 " 58.7 5.4 19 1,152
5 Landgraaf, stagnant pond next to castle, sample contains leaf material, no known point source inputs, regional
62.6 4.3 12 <25
6 Landgraaf, another pond used soley for fishing, no point source inputs, regional
73.3 2.5 6.5 234
7 Assendelft, small river, no known point sources, regional 41.7 8.3 26 <25
8 Wormerveer, small river, phthalate processing plant nearby, local
42.2 14 8.8 6,161
9 Alkmaar, Hoornse/Hoevaart canal with heavy boating activity, no know point source inputs, regional
39.8 6.1 25 1,046
10 " 58.3 5 26 <25
11 Alkmaar, Noord-Hollands canal with heavy boating activity, no know point source inputs, regional
78.5 0.5 2.2 73
12 " 79.8 0.5 2 <25
13 Haarlem, canal, no known point source inputs, regional 73.2 1.9 2.9 <25
Table 3.31 continued overleaf
89

EU RISK ASSESSMENT REPORT – DINP FINAL REPORT, 2003
Table 3.31 continued Monitoring of DINP in sediment samples in the Netherlands
Sample code
Description of site sampled % Dry matter
% Organic carbon
% Mineral
particles
DINP (µg/kg dw)
14 " 75.4 1.4 3.1 237
15 Noordwijk, canal, sample taken near location where pesticides are heavily used, no known point inputs, regional
74.1 0.8 1.7 <25
16 Leidse, canal, no known point inputs, regional 78.4 0.9 2.7 107
17 Apledoorns, canal, residential neighborhood in the Heerde district, no known point inputs, regional
40.8 7.7 16 2566
18 Enschede, stagnant pond near city centre used by fishing club, no known point inputs, regional
66.2 9.1 7.6 <25
19 Doetchem, river IJssel, harbor used by small boats, no known point inputs, regional
62.3 5.3 10 <25
20 Oud-beijerland, stagnant pond near center of small town, no known point inputs, regional
75.5 <0.5 3.3 <25
21 Hendrik Ido Ambacht, used by fishing club, no known point inputs, regional
73.7 6.9 11 214
22 Vught, river Dommel,, slow moving river, sample taken at crossing of major Dutch motorway (A2), no known point inputs, regional
49.2 7 428 12
23 Rosmalen, small stream, no known point inputs, regional 73.9 0.8 4.5 <25
24 " 74.9 1 3 <25
Woudenberg, small pond, no known point inputs, regional 41 5.2 16 331
26 " 48.2 5.4 17 273
27 Almere, small stream flowing through densely populated city, uncertain if represents local or regional
67.5 6.3 17 173
28 " 51.7 4.6 14 263
29 Voorschoten, small stream, no known point inputs, regional 77.9 0.8 3.8 43 30 " 78.3 0.6 3.5
25
<25
In Table 3.32, the most relevant monitoring data for DEHP in sediment are presented, as reported in EC (2001).
90

CHAPTER 3. ENVIRONMENT
Table 3.3 Monitoring of DEHP in sediment 2
Location Pollution status Sediment layer (cm)
Date of sampling
n Concentration (mg/kg dw)
Reference *
River sediment
Germany, Rhine, 13 sites
Industrial region - 1991 13 8.9 / 9.2 / 18.3 / 13.8 / 6.8 / 7.8 / 1.8 / 5.0 / 2.2 / 20.8 / 0.35 / 2.5
/ 3.0
Furtmann (1993)
Germany, Weser, 5 sites Industrial region - 1992 5 4.9-8.9
Germany, Diemel, mouth of Weser Industrial region - 1992 1 1.3
Germany, Aller, mouth of Weser Industrial region - 1992 1 2.7
Germany, Lower Weser, 3 sites Industrial region - 1992 3 0.1-6.3
Germany, Dortmund-Ems canal, 3 sites
Industrial region - 1991 3 0.22 / 1.1 / 0.48
Germany, 4 canals, 9 sites Limited discharges anticipated
- 1991 9 0.95 / 0.15 / 2.5 / 2.5 / 1.8 / 0.28 / 3.4 /
0.85 / 2.4
Sweden, Svartån Near DEHP processing, (PVC flooring)
0-5 cm 0-2 cm
1983 1994
2 3
1480 47
Thurén (1986); Parkman and Remberger (1995)
Sweden, Ronnebyån Near DEHP processing, (PVC flooring)
0-5 cm 0-2 cm
1983 1994
2 3
628 33
Sweden, Gullspångsälven-Göta älv river system
Ten sampling sites in lakes, rivers and archipelago of Göteborg
0-2 cm 1994 1-3 0.071-0.79 Parkman and Remberger (1995)
Sweden. River Motala ström, Norrköping
Town, downstream municipal STP
0-2 cm 14-16 cm
Mar 1996 3 1.22 1.59
Parkman and Remberger (1996)
Sweden. River Svartån, Örebro. Town 0-2 cm 6-8 cm
Mar 1996 3 0.95 0.31
Sweden. River Fyrisån, Uppsala. Town, downstream municipal STP
0-2 cm 8-10 cm
Apr 1996 3 0.65 0.25
Denmark Downstream STPs 0-2 cm 1997 / 1998 18 5
>10
6.5 6.9 1.1
Boutrup et al. (1998)
Agricultural area 5 0.063
>10 0.075
The Netherlands. Small rivers. Unknown pollution status _ 1992 10 <0.5-0.5 Bodar (1996)
The Netherlands. Large rivers. _ 199.2/1993 5 1-4 (mean 2.2)
The Netherlands. Rivers. _ 1992 5 3-4 (mean 3.7)
The Netherlands Unknown pollution status 1999 30 < 0.025 - 2.09 (median: 0.15)
ALcontrol (1999)
UK, Humber rivers, Ouse Largely agricultural 1995 / 1996 4 3.58/ 2.30 / 6.49 / 6.08
Long et al. (1998)
UK, Humber rivers, Aire Urban and industrial 4 10.3/ 7.89 / 13.5 / 16.7
UK, Humber rivers, Swale Upland agricultural 4 6.47/ 0.23 / 17.9 / 5.72
Table 3.32 continued overleaf
91

EU RISK ASSESSMENT REPORT – DINP FINAL REPORT, 2003
Table 3.32 continued Monitoring of DEHP in sediment
Location Pollution status Sediment layer (cm)
Date of sampling
n Concentration (mg/kg dw)
Reference *
UK, Humber rivers, Calder Urban and industrial 4 5.73/ 5.73 / 4.26 / 19.4
UK, Humber rivers, Don Urban and industrial 3 3.43 / 3.43 / 3.97
UK, Humber rivers, Trent Urban and industrial 3 0.84 / 1.91 / 12.0
Lake sediment
Sweden. Lake Härsvatten. Stratified sample.
Non-polluted area 0-1 cm 1-2 cm 2-3 cm 3-4 cm 5-6 cm 7-8 cm 9-10 cm 12-13 cm
15-15.5 cm
Sep 1994 1 0.599 0.394 0.157 0.147 0.083 0.067 0.046 0.083 0.177
1 cm appr. 10 years of deposition - highest conc. during the last 20 years. Higher levels in the deepest layers probably due to contamination of samples (Parkman and Remberger (1995)
Sweden. Lake Riddarfjärden, Stockholm.
Town 0-2 cm 1994 3 2.49 Parkman and Remberger (1995 and 1996)
Sweden. Lake Riddarfjärden, Stockholm
Town. 0-2 cm 14-16 cm
Apr 1996 3 0.76 N.D.
Sweden. Lake Orrholmsviken, Karlstad
Town. 0-2 cm 8-10 cm
Mar 1996 3 0.28 0.002
Sweden. Lake Härsvatten Non-polluted area. 0-2 cm 12-13 cm
Sep 1994 0.39 0.08
Sweden. Lake Härsvatten Non-polluted area. 0-2 cm 14-16 cm
Mar 1996 0.102 N.D.
Sweden. Lake Fräcksjön. Non-polluted area 0-2 cm Sep 1994 0.37
Sweden. Lake Fräcksjön. Non-polluted area 0-2 cm 14-16 cm
Mar 1996 0.065 0.004
Abiskojaure Non-polluted area 0-2 cm Sep 1994 3 0.008
Jutsajaure Non-polluted area 0-2 cm Sep 1994 3 0.118
Stensjön Non-polluted area 0-2 cm Sep 1994 3 0.059
Brunnsjön Non-polluted area 0-2 cm Sep 1994 3 0.168
Krageholmssjön Non-polluted area 0-2 cm Sep 1994 3 0.208
Denmark. Braband Sö Near STP. 0-2 cm 1996 12 2.2 Boutrup et al. (1998)
Denmark. Agri Sö Agricultural area 0-2 cm 1996 12 0.64
Denmark. Almind Sö Rural area 0-2 cm 1997 12 0.31
Denmark. Silkeborg Langsö 500 m downstream STP of paper industry. 100 m downstream municipal STP
0-2 cm 1998 4 4
2.5
1.8
Table 3.32 continued overleaf
92

CHAPTER 3. ENVIRONMENT
Table 3.32 continued Monitoring of DEHP in sediment
Location Pollution status Sediment layer (cm)
Date of sampling
n CONC. (mg/kg dw)
Reference *
Norway, Lake Femunden. Non-polluted area 0-2 cm 18-20 cm
Feb 1996 1 0.050 0.042
Ice cover at sampling time (Braaten et al., 1996)
Norway, Lake Heddalsvatn Industry and dense population nearby.
0-2 cm 18-20 cm
May 1996 1 0.080 0.038
Norway, Hamar, Lake Mjösa. Industry and dense population nearby.
0-2 cm 18-20 cm
Feb-Mar 1996
1 0.042 N.D.
Norway, Furnesfj., Lake Mjösa. Industry and dense population nearby.
0-2 cm 18-20 cm
Feb-Mar 1996
1 0.080 N.D.
Norway, Gjövik, Lake Mjösa. Industry and dense population nearby.
0-2 cm 18-20 cm
Feb-Mar 1996
1 0.085 0.128
Norway, Lake Lundevatn. ”Effected by long range pollution”.
0-2 cm 18-20 cm
May 1996 1 0.800 0.058
* Full references are found in EC (2001)
Summary and comparison with estimated concentrations
Average DEHP concentrations measured in suspended matter in highly industrialised areas vary from 14.3 to 101.3 mg/kg dw. Peak values up to 282 mg/kg dw have been measured.
The highest DEHP concentrations in sediment have been measured in 1983 downstream of DEHP processing sites (628-1,488 mg/kg dw). By 1994, these concentrations were reduced to 33-47 mg/kg dw due to emission reduction measures. In highly industrialised regions, concentrations are usually above 1 mg/kg dw. Concentrations above 10 mg/kg dw were rarely measured in the river Rhine in Germany and in the Humber rivers in the UK. The highest measured value not related directly to a point source amounts to 20.8 mg/kg dw. The concentrations in unpolluted lakes are significantly below 1 mg/kg dw.
The measured DINP concentrations are consistent with those for DEHP. Only one higher concentration, downstream from a processing site of 150 mg/kg dw has been measured.
Most estimated local concentrations are between 15 and 150 mg/kg dw with peak values at 290 mg/kg dw. The estimated regional concentration reaches 17.8 mg/kg dw.
It can be concluded that the measured and estimated local concentrations fully correlate. The estimated local concentrations are therefore used in the risk characterisation.
As results from samples out of rivers from heavily industrialised areas are available, a realistic worst-case concentration can be estimated for the regional situation based on the monitoring results with DINP. As all measured DINP concentrations not directly related to a point source are below 2.6 mg/kg dw, a value of 2.6 mg/kg dw can be used to override the calculated regional concentration of 17.8 mg/kg dw:
PECregionalsed=2,600 µg/kg dw
Higher values of up to 6.7 mg/kg have been measured in road ditches. These high concentrations can be attributed to releases from car underbody coatings and can therefore be related to some kind of “local” release.
93

EU RISK ASSESSMENT REPORT – DINP FINAL REPORT, 2003
3.1.7.4 Sewage sludge
Samples of digested sludge from 5 sewage treatment plants in Germany were analysed for DINP (Kolb et al., 1997). All samples contained DINP between 4.7 and 13.8 mg/kg dw.
Somewhat higher concentrations were measured in raw and digested sewage sludge from STPs in Germany (Weisser, 1992). DINP was measured in sewage sludge of 10 sewage treatment plants between 1987 and 1990. Furthermore, the influence of an aerobic pre-treatment of the raw sewage sludge was investigated in one of the STPs. 80 treatment cycles were sampled over 7 days and daily mixing samples were established. The influence of anaerobic fermentation was also investigated on another one of the STPs. 118 treatment cycles were sampled over 70 days. 24 3-day mixing samples were established.
Di-n-nonyl phthalate (DnNP) as well as diisononyl phthalate were determined, see Table 3.33.
3
The concentrations in sewage sludge were between 11 and 72 mg/kg dw (average 27 mg/kg dw). The concentrations in the sludge undergoing aerobic pre-treatment were 15-18 mg/kg dw in raw sludge and 15-17 mg/kg dw in treated sludge. The concentrations from sludge undergoing anaerobic fermentation were 31-43 mg/kg dw in raw sewage and 49-58 mg/kg dw treated sludge.
Primary sludge samples from four municipal wastewater treatment plants were analysed in the Netherlands (1992-1993). DINP concentrations from two plants located in the rural areas were < 2 and 41 µg/l (approximately < 1 mg/kg dw and 21 mg/kg dw). The DINP concentrations at two plants located in urban areas were< 2 and 6.2 µg/l (approximately 2 mg/kg dw and 7.8 mg/kg dw), respectively (Slooff, 1993).
To verify the sources of the concentrations of phthalates measured in agricultural soils in Denmark (see Section below), Vikelsoe et al. (1999) measured the concentrations in the applied fertilisers.
Table 3.3 Determination of DnNP and diisononyl phthalate were determined in applied fertilisers in Denmark
Sampled at Sample DnNP (mg/kg dw)
DINP (mg/kg dw)
Jyllinge STP Fresh sludge 0.19 6.7
Bjergmark. STP Fresh sludge 0.21 5.6
Bjergmark. STP Stored sludge 0.05 2.1
Bistrup Dry Store 1 Stored sludge (0-1 dm) 0.08 2.1
Bistrup Dry Store 1 Stored sludge (1-2 dm) 0.13 3.4
Bistrup Dry Store 1 Stored sludge (2-3 dm) 0.06 1.5
Bistrup Dry Store 1 Stored sludge (3-4 dm) 0.12 0.37
Bistrup Dry Store 1 Stored sludge (4-5 dm) 0.48 2.4
Bistrup Dry Store 2 Stored sludge (0-1 dm) 0.08 1.5
Bistrup Dry Store 2 Stored sludge (1-2 dm) 0.12 3.1
Bistrup Dry Store 2 Stored sludge (2-3 dm) 0.04 0.41
Bistrup Dry Store 2 Stored sludge (3-4 dm)
Bistrup Dry Store 2 Stored sludge (4-5 dm)
Table 3.33 continued overleaf
94

CHAPTER 3. ENVIRONMENT
Table 3.33 continued Determination of DnNP and diisononyl phthalate were determined in applied fertilisers in Denmark
Sampled at Sample DnNP (mg/kg dw)
DINP (mg/kg dw)
Bistrup Dry Store Pool Stored sludge 0.31 5.5
Bistrup Wet Store 1 Stored sludge (0-1 dm) 2.0 23
Bistrup Wet Store 2 Stored sludge (0-1 dm) 1.5 5.4
Further results are available with DEHP (Table 3.34), as reported in EC (2001):
Table 3.3 Monitoring of DEHP in municipal STP sludge 4
Location Concentration (mg/kg dw) Year Remarks and reference*
Sweden, 8 different sites 74 – 661 mean: 247 1987 Swedish EPA (1988)
Sweden, 6 different sites.
Sweden, 11 different sites.
76-285 mean: 144 25-462 mean: 174
1988 1989-91
Swedish EPA (1992)
Sweden, Stockholm (Henriksdal) 67 1989 Stockholm vatten (1990)
Sweden, Stockholm (Henriksdal) 93 1991 Stockholm vatten (1991a)
Sweden, Stockholm (Bromma) 116 1991 Stockholm vatten (1991b)
Sweden, Malmö (Klagshamn) 0 – 240 mean: 105 18 –116 mean: 49
1991-1996 1991-1996
Henriksson (1997) Two different laboratories
Denmark Avedøre (significant industrial load) Skaevinge (low industrial load) Marselisborg (significant industrial load)
48 45 47
1992 Grüttner and Vikelsøe (1996)
Denmark Avedøre Skaevinge Marselisborg
2.347 and 0.9 43, 1.7 and 189
1995 Grüttner et al. (1995) Same sample two different labs. Same sample two different labs. Same sample three different labs.
Denmark, Herning Skaevinge Marselisborg
Winter Summer 120 38 17 18 41 37
1994 Kjølholt et al. (1995)
Denmark, 2 sites 23 / 14 1995 Krogh et al. (1996)
Denmark, 19 different sites 3.9 - 170 mean: 37.8 median: 24.5
1994 Kristensen et al. (1996)
Denmark, 6 different sites 9 – 49 mean: 25 1996-1997 Boutrup et. al. (1998)
Denmark, 5 different sites 0.003 - 117 mean: 18.9 1996-1997 Vikelsoe et al. (1999)
Norway, 3 different sites, dry sludge 96.0 / 113.0 / 78.5 1996 Braaten (1996)
Netherlands, 5 different STP, primary sludge Range: <5 to 185 1992-1993 Bodar (1997)
Table 3.34 continued overleaf
95

EU RISK ASSESSMENT REPORT – DINP FINAL REPORT, 2003
Table 3.34 continued Monitoring of DEHP in municipal STP-sludge
Location Concentration (mg/kg dw) Year Remarks and reference*
Germany, predominantly industrial effluent Germany, predominantly household effluent
Fresh Activated Dewatered 40 21 85 225 163 - Raw Processed Dewatered 194 153 74
1992 1992
1992
Furtmann (1996)
13.4 - 1 8.3 mean: 16.3 1997 Kolb et al. (1997)
Canada Winnipeg, digested sludge Winnipeg, raw sludge Hamilton, digested sludge Hamilton, raw sludge
21 – 176 mean: 89 (n = 4) 3 and 29 68 26 - 137 mean: 85 (n=3)
1981 – 85
1981 Dec 1981 1982 – 83
Webber and Lesage (1989)
15 different sites incl. Winnipeg and Hamilton 3 – 215 median: 80 1980 - 85 Detected in 93% of samples
Canada, 11 different sites 33 – 440 mean: 163 1993 – 94 Webber and Nicols (1995)
Germany, 5 different sites
* Full references are found in EC (2001)
Summary
Consistently high values of up to 661 mg/kg dw have been measured for DEHP. Many mean or median values vary around 100 and up to 200 mg/kg dw. Measured concentrations of DINP do not exceed 23 mg/kg dw.
3.1.7.5 Soil
Phthalates were monitored in soil samples from the Netherlands in 1999 (ALcontrol, 1999). 35 samples from 19 locations were analysed. None of the samples revealed DINP concentrations above the limit of determination of 25 µg/kg dw.
Seven cultured soils from the area of Roskilde in Denmark were investigated for phthalate concentrations (Vikelsoe et al., 1999). At each location two soil cores 50 cm in depth were taken, each profile being divided into 5 subsamples of each 10 cm. The samples were extracted in dichloromethane and analysed by gas chromatography / high-resolution mass spectrometry. Di-n-nonyl phthalate as well as diisononyl phthalate was determined, see Table 3.35.
Table 3.3 Determination of di-n-nonyl phthalate and diisononyl phthalate in soils in Denmark 5
Depth (cm) DnNP (µg/kg dw) DiNP (µg/kg dw)
Location 1 0-10 0.2 17 Preserved natural area not 10-20 7 cultured for 50-100 years 20-30 5 30-40 3 40-50 6
Location 2 0-10 1.6 18 Ecologically cultured for 40 years 10-20 0.2 4 20-30 15 30-40 0.3 34 40-50 0.7 26
Table 3.35 continued overleaf
96

CHAPTER 3. ENVIRONMENT
Table 3.35 continued Determination of Di-n-nonyl phthalate and diisononyl phthalate in soils in Denmark
Depth (cm) DnNP (µg/kg dw) DiNP (µg/kg dw)
0-10 0.7 13 Manured sustainable in 10-20 3 ecological culture for 5 years, 20-30 4 formerly conventionally 30-40 8 cultured 40-50 1.7 7
Location 4 0-10 35 Conventionally cultured using 10-20 0.1 5 artificial fertiliser 20-30 0.1 4 30-40 0.3 8 40-50 0.2 34
Location 5 0-10 0.6 16 8
amounts, cultured 20-30 3 30-40 16 40-50 1
0-10 0.7 4 10-20 0.7 3
cultured 20-30 0.5 4 30-40 0.1 3 40-50 0.2 9
Location 7 0-10 160 130 Sludge amended with high 10-20 200 220 amounts for 25 years, changed 20-30 200 200 to artificial fertiliser 6 years 30-40 180 96 before sampling, cattle grazing 40-50 120 93
Location 7 0-10 120 410 (sampled 2 years later) 10-20 160 540 20-30 210 670 30-40 290 910 40-50 210 280 50-60 84 63
Location 8 0-10 30 110 Meadow in run-off zone from 10-20 5 16 sludge storage, cattle grazing 20-30 5 30-40 7 40-50 1
Location 3
Sludge amended, medium 10-20
Location 6 Sludge amended, low amounts,
In Table 3.36, the most relevant monitoring data for DEHP in soil are presented, as reported in EC (2001).
97

EU RISK ASSESSMENT REPORT – DINP FINAL REPORT, 2003
Table 3.36 Monitoring data of DEHP in soil
Description Concentration (µg/kg dw) Year Reference *
Agricultural soils
Agricultural land (Switzerland), After sludge application.
Direct after appl.: 120-190 After 1 month: N:D: (<0.02)
≤1987 Bergkvist and Kirchmann (1989); Naturvårdsverket (1992)
Agricultural soil, Canada, 10 soils. Range: 80-2,700 Mean: 420 *
Nov. 1992
0-15 cm soil depth. From national benchmark sites. (Webber and Wang 1995)
1986 Kampe (1987) cited in Bergkvist and Kirchmann (1989)
1996 Vikelsoe et al. (1999) - preserved, uncultivated for more than 50 years 8, 6, 27, 4, 0 - ecologically cultured for 40 years 16, 15, 32, 14, 20 - manured for 5 years, cultured 16, 18, 8, 18, 1
9, 12, 9, 15, 20 - sludge amended, medium amounts, cultivated 18, 13, 9, 6, 15 - sludge amended, low amounts, cultivated 22, 18, 17, 23, 21 - heavily amended with sludge (17 t/ha/y), changed
to artificial fertiliser 6 y before sampling 990, 1,700, 1,400, 880, 590
- same as above, sampled 2 years later 1,400, 1,700, 1,800, 3,400, 1,200
- meadow in run-off zone from sludge storage 670, 76, 9, 26, 5
Other
The Netherlands < 25 - 205 (median: 110) 1999 ALcontrol (1999)
Agricultural soil, High dose of STP application. West Germany.
Slightly more than 5,000 Background: 24 Dose: 333 tonnes dw /annum:
Agricultural soils in Denmark (at 5 depth 0-50 cm)
- conventionally cultured, artificially fertilised
* Full references are found in EC (2001)
Summary and comparison with estimated concentrations
Consistently high concentrations have been found where agricultural soil was amended with high amounts of sewage sludge (up to 5,000 µg/kg dw). With medium amended soils, the concentrations drop to a maximum of 23 µg/kg d. The measured DINP concentrations are consistent with that profile.
Most estimated local DINP-concentrations are between 1,000 and 10,000 µg/kg dw with peak values around 19,000 µg/kg dw. The regional concentration reaches 13 µg/kg dw.
Comparable measured and estimated concentrations have only been found in heavily sludge-amended soils. On the other hand, it cannot be assured that the available data are representative for local emission situations. The estimated regional concentration is clearly verified by measurements though.
3.1.7.6 Deposition
The wet deposition of Di-n-nonyl phthalate as well as Diisononyl phthalate was determined by analysing the rainwater in Lille Valby in Denmark (Vikelsoe et al., 1999). The average wet deposition rate for DnNP and DINP was determined to be, respectively 2.6-5.1 µg/m2/a and 17-33 µg/m2/a.
98

CHAPTER 3. ENVIRONMENT
3.1.7.7 Biota
In a study by Elf Atochem (1997), DINP was measured in 3 mussel samples and 1 algae sample. The detection limit varied between 100 and 500 µg/kg dw. DINP was detected in two mussel samples at 640 and 810 µg/kg dw but not in the algae sample.
Research Institute for Chromatography (2001) also measured the concentration of DINP in vegetation. 48 Samples of mainly mixed grass, sugar beet leaves, curly kale and Brussels sprout leaves were collected in 1999 in the Netherlands. At a detection limit of 100 µg/kg wet weight, DINP was detected in 4 samples at concentrations of 312-528 µg/kg ww. The authors recommend though that the presence of DINP is confirmed by further GC-MS/MS or LC-MS/MS analysis to ensure that the results are not due to matrix interferences. The remaining sample amounts were not sufficient to perform such a confirmation analysis.
Location n
In a further limited study by the Research Institute for Chromatography (2001), 3 samples of molluscs from 3 locations in the Netherlands showed concentrations of a maximum of 0.012 mg/kg ww.
In a more extensive study by the Research Institute for Chromatography (2001), 25 fish samples from 23 locations in the Netherlands were analysed. Collected fish were bream and roach with fat contents of 0.2–5.1%. No DINP was detected at a detection limit of 10 µg/kg wet fish.
For DEHP, predominantly older data from the seventies and eighties are available. In Table 3.37, the most relevant monitoring data for DEHP in biota are presented, as reported in EC (2001).
Table 3.37 Monitoring of DEHP in biota
Organism Concentration (µg/kg dw) *
Year Reference *
Plants Enteromorpha sp, green algae, Seine estuary, France 650 1997 Elf Atochem (1997) Plankton Japan 63,000 (dw?) <1981 Environment Agency, Japan
(1981) Plankton Industrialised area, Finland 0 ≤1978 Persson et al. (1978) Reed: ”above ground”-parts straw leaves
River Elbe Germany 6 2,300-7,500 2,800 11,300
1986 Jacobs and Mofid (1988)
Grass 4 7,100-10,200 Grass 5 3,200-5,500 Grass Niedersachsen, Germany 1,200-2,500 ca. 1985 Umweltbundesamt (1987) Invertebrates Aquatic Dragonfly larvae (naiads) Iowa, USA, fish hatchery 1 200 (dw?) ca. 1971 Mayer et al. (1972) Arthropods, freshwater Finland, industrial area 100 ≤1978 Persson et al. (1978) Various aquatic invertebrates Ronnebyån river, Sweden, 310-14,000 (ww) 1986 Thurén (1986) Svartå river, Sweden, 110-5,300 (ww) Gammarids River Elbe, Germany, 2 sites 2 300 (ww) 1986 Jacobs and Mofid (1988) 6 800-1,100 (ww) Molluscs, freshwater Finland, industrial area 100 ≤1978 Persson et al. (1978) Molluscs River Elbe, Germany 2 2,300 and 4,300 (ww) 1986 Jacobs and Mofid (1988) Molluscs, digestive gland, 2 species River Crouch, Essex, UK 9.2-214 (ww) ≤1983 Waldock (1983) Mussels River Seine estuary, France 3 1,390-1,850 ≤1997 Elf Atochem (1997)
Table 3.37 continued overleaf
99

EU RISK ASSESSMENT REPORT – DINP FINAL REPORT, 2003
Table 3.37 continued Monitoring of DEHP in biota
Organism Location n Concentration (µg/kg dw) *
Year Reference *
Tubifids River Elbe, Germany, 2 sites 2 200 and 300 (ww) 1986 Jacobs and Mofid (1988) 4 500-900 (ww) Terrestrial Soil arthropods Finland, industrial area 2,800 ≤1978 Persson et al. (1978) Vertebrates
Tadpole Iowa, USA, fish hatchery 1 300 (dw?) ca 1971 Mayer et al. (1972) Fish Walleye Black Bay, Lake Superior, CDN 800 (dw?) ca 1971 Mayer et al. (1972) Channel Catfish Mississippi, Arkansas; USA 3,200 (dw?) ca 1971 Channel Catfish, Iowa, USA, fish hatchery 400 (dw?) ca 1971
Canada 104 (ww) ca 1972 Williams (1973) Atlantic salmon, juvenile Canada, fish hatchery 2 12,900 and 16,400 (lw) ≤1973 Zitko (1973) Various fish species Lake Michigan, USA nd-1,300 (dw?) ≤1974 Schacht (1974) Various species of biota, mainly fish
Gulf of Mexico, USA 1-135 (ww) average 4.5
≤1975 Giam et al. (1978)
Various fish species Japan 70-450 (dw?) ≤1974 Kodama and Takai (1974) Various fish species Japan, various cities 40-720 (dw?) 1974 Goto (1979)
Japan 100-19,000 (dw?) (mean 290)
ca 1977 Kubota (1979); Tomita et al. (1979); Env. Agency, Japan (1981)
Various fish species Japan <50-1,800 (dw?) ≤1978 Kamata et al. (1978) Fry and sticklebacks Finland, industrial area 100 ≤1978 Persson et al. (1978) Pearch 100 Bream 500 Roach, muscle 1,100 Pike, liver 2,300 Shark max. 7,100 <1980 Sittig (1980) Plaice, muscle Gulf of St.Lawrence, Can <1 (ww) <1980 Burns et al. (1981) Redfish, muscle <1 (ww) Mackerel, muscle 6,500 (ww) Cod, muscle 5,200 (ww) Herring, muscle 4,700 (ww) Herring, muscle Bay of Fundy, Canada 7,200 (ww) Eel Canada 220 and 370 (ww) Dab, plaice and whiting, liver Tees Bay, UK 43-85.9 (ww) ≤1983 Waldock (1983) Dab, plaice and whiting, muscle 13-51.3 (ww) Dab, liver Crouch estuary, Essex, UK 2.0-2.4 (ww) Dab, muscle 13.8 (ww) Pike-perch, roach, perch, bream, eel
Rees, Niederrhein, River Rhein, Germany
9 17-70 (ww) <1981 Malisch (1981)
Bream Hueckenlock, Süderelbe, River Elbe, Germany
5+5 300 and 500 (ww) average
1986 Jacobs and Mofid (1988)
Coalfish, ”rotbarsch”, cod, herring, mackerel, ”flounder”
Germany <500 (ww) (mixed samples)
1987 Anon. (1987)
Carp, rainbow trout, brown trout, char, eel
Austria, 58 locations 180 max. 2,600 (ww) 8 fish > 1,000 (ww)
1997 Pfannhauser et al. (1997)
Mammals Canada 10,600 (lw) <1973 Zitko (1973)
Aquatic
Eel
Various fish species
Common seal (Phoca vitulina), pup, blubber
* Full references are found in EC (2001)
100

CHAPTER 3. ENVIRONMENT
Summary
Measurements of DEHP in plants in the eighties revealed high concentrations up to 11,300 µg/kg dw. Concentrations in plankton are difficult to interpret and vary in single measurements from 0 to 63,000 µg/kg (dw?).
In aquatic invertebrates, consistent concentrations above 1,000 µg/kg ww, up to 14,000 µg/kg (ww) were measured.
For fish, the most relevant study has been performed in Austria in 1997. A total of 180 fish were collected at 58 locations (Pfannhauser et al., 1997). Samples of dorsal muscle free of skin and bones were taken for the determinations. DEHP was found in 71 samples. The highest level of DEHP found was 2,600 µg/kg (ww) in carp. At five sites, DEHP levels in a total of eight fish samples exceeded 1,000 µg/kg (ww).
For DINP, the measured concentrations in fish in a more limited study (25 samples from 21 locations) were below the detection limit of 10 µg/kg ww.
Most estimated local DINP-concentrations in fish are between 1,000 and 15,000 µg/kg ww with peak values around 30,000 µg/kg ww.
It can be concluded that the measured concentrations are consistently one or several orders of magnitude below the estimated concentrations. It cannot be assured though that the available data are representative for local emission situations. The results would suggest though, that the bioaccumulation potential of DINP is lower than initially assumed. This will be taken into consideration in the risk characterisation.
For vegetation, some positive measurements (4 samples out of 48) in the Netherlands with concentrations of 312-911 µg/kg ww are available. These results are clearly in opposition with the estimated concentrations in grass and plant leaves of at most 14.3.10-3 µg/kg ww (see EUSES output in Appendix C). As the authors recommend that the presence of DINP should be confirmed by further GC-MS/MS or LC-MS/MS analysis to ensure that the results are not due to matrix interferences, these results should be treated with caution and are not used in this risk assessment.
3.1.8 Overall accumulation of DINP
Large amounts of DINP in polymers can build up in:
• end products with long technical lifetimes (e.g. building material), • landfills, • waste remaining in the environment (pieces of polymer).
Large amount of polymer end products can accumulate in landfills. The content of DINP will sooner or later emit from the polymer matrix. Emitted DINP may then be degraded in the landfill or leave it. The amount of DINP released from a landfill today is assumed to be small (Mersiowsky et al., 1999).
Compared to landfills DINP in “waste remaining in the environment” is much more out of technical control. Due to persistency of the DINP/polymer complex this amount could also be expected to still increase in the technosphere. Some polymer end products with technical lifetimes of several decades still in use are also accumulating in the technosphere.
101

EU RISK ASSESSMENT REPORT – DINP FINAL REPORT, 2003
As a consequence the amount of DINP in the technosphere (incl. the waste) is still increasing. Increasing amounts may also cause increasing emissions. With constant consumption and waste management the DINP levels (and emissions) will after a while reach steady state (when consumed amount = emitted amount + incinerated amount + amount degraded in landfills).
The emissions calculated in this assessment are in some cases dominated by emitting materials with long lifetimes. This means that estimated PECs that are dominated by such diffuse sources may to some extent reflect a future hypothetical emission. In other words, the emissions we can expect in the future if we continue to handle DINP in the same ways as today. This future perspective may cause difficulties in comparing generated diffuse emissions (regional PEC values) with monitoring data.
On the other hand, the estimated PECregional, which already reflects a steady state, is very consistent with the measured values. For sediment, where the highest discrepancies between measured and estimated values are observed, the chosen PECregional based on monitoring data is less than one order of magnitude lower than the estimated PECregional. Given the fact that the estimated releases, especially from ”waste remaining in the environment” might be grossly overestimated, the estimated results would suggest that a major increase of concentrations of DINP in the environment is not to be expected over the coming years if the consumption volume and use pattern stay stable.
102

CHAPTER 3. ENVIRONMENT
3.2 EFFECTS ASSESSMENT: HAZARD IDENTIFICATION AND DOSE (CONCENTRATION) - RESPONSE (EFFECT) ASSESSMENT
3.2.1 Aquatic compartment
Results have been obtained with various fish species. In general, DINP toxicity measurements are limited by low solubility of this product. Analytical monitoring has been usually carried out and if not, it is indicated.
3.2.1.1 Toxicity test results
3.2.1.1.1 Fish
Acute toxicity
No acute study is revealing a definite LC50 value for DINP, only limit values could be determined. No effect was demonstrated at these values in Table 3.38.
Table 3.3 Fish toxicity experiments with DINP 8
Species LC50 (96 h) Remarks Reference
Pimephales promelas ≥ 0.14 mg/l static, direct addition of tests substance to test system, mixed for 2 minutes with homogeniser, measured concentrations 1)
CMA (1983a)
≥ 0.19 mg/l flow through, stock solution of maximum test concentration prepared by mixing and ultrasonification and pumped to predilution chamber, presence of undissolved particles, measured concentrations 1)
CMA (1983b)
Lepomis macrochirus ≥ 0.17 mg/l static, direct addition of tests substance to test system, mixed for 2 minutes with homogeniser, measured concentrations 1)
CMA (1983c)
Cyprinodon variegatus ≥ 0.52 mg/l flow through, stock solution of maximum test concentration prepared by mixing and pumped to predilution chamber, presence of undissolved particles, measured concentrations 1)
CMA (1984a)
Oncorhynchus mykiss ≥ 0.16 mg/l flow through, stock solution of maximum test concentration prepared by mixing and ultrasonification and pumped to predilution chamber, presence of undissolved particles, measured concentrations 1)
CMA (1983d)
≥ 100 mg/l Hüls (1995c)
≥ 500 mg/l static, DINP 2, nominal concentration, no solubiliser used
Brachydanio rerio semi-static, DINP 2, preparation of test concentration with emulsifier, measured concentration
Leuciscus idus BASF (1982b)
1) Test substance used: equal proportion blend of DINP supplied by different US manufacturers
103

EU RISK ASSESSMENT REPORT – DINP FINAL REPORT, 2003
In summary, no acute effects have been reported in fish with DINP at its limit of solubility and above in the test system.
Chronic toxicity
A two-generation feeding study has been carried out with Oryzias latipes (Patyna et al., 1999). DINP 1 was added to dry flake food at 20 mg/kg. DINP, control (no treatment) and acetone control were divided into five replicate tanks (N=50) per treatment. In the F0 generation 14-day old fish were fed at 5% body weight per day. The F0 adults were terminated at day 123. There were no statistically significant changes in mortality or fecundity between the treatment groups. There was no reduced egg production. There was a slight but statistically insignificant increase in egg viability in the DINP treated group when compared to the no treatment control. Evaluation of F1 and F2 embryos showed normal development except for a transient decrease in red blood cell pigmentation. This effect was observed in both the DINP treatment and the acetone control group. The only histopathological change observed in the F0 adults was a minor alteration in hepatocellular staining around the central vein. The male to female ratios (3:1) in all groups were similar. Phenotypic gender classification of male and female fish were histopathologically confirmed to be 100% correct. Ale somatic gonadal index and liver somatic index were not significantly different in any group.
One study has been performed on chronic effects on fish for DINP 1 through the aqueous phase, which is however of poor quality (see below). Therefore, the large body of existing literature for closely related phthalates are used as read across data for DINP. Several individual chronic fish toxicity tests are available (see Table 3.39).
These studies include data for C6 to C11 dialkyl phthalate esters across nine fish species. It is important to note that even longer chain phthalates than DINP do not reveal any chronic toxicity.
Collectively, these studies indicate no effect at the maximum concentration that could be maintained as a stable emulsion in the test system employed.
104

CHAPTER 3. ENVIRONMENT
105
Table 3.39 Summary of chronic aquatic toxicity tests for C6 - C11 phthalate esters
Species Phthalate ester Measured/Nominal?
Exposure duration (days)
End points considered LOEC (µg/l)
NOEC (µg/l)
Reference
Rainbow Trout (Oncorhynchus mykiss)
DHP [Dihexyl phthalate] M 143 Egg hatchability and survival; Fry growth and survival
---- 220 * Rhodes et al. (1995)
DEHP [Di-2-ethylhexylphthalate]
M 34100
Sac fry mortality Fry growth
14 ----
5 54 *
Mayer et al. (1977); Mehrle and Mayer (1976)
DEHP M 90 Egg hatchability and survival; Fry growth and survival
---- 502 * De Foe et al. (1990)
410 * 711P [di(heptyl,nonyl,undecyl phthalate]
M 152 Egg hatchability and survival; Fry growth and survival
---- Rhodes et al. (1995)
DUP [Diundecyl phthalate] ---- M 155 Egg hatchability and survival; Fry growth and survival
300 * Rhodes et al. (1995)
Brook Trout (Salvelinus fontinalis)
DEHP M 150 Adult growth ---- 52 * Mayer et al. (1977)
DEHP M 229 Embryo survival; survival and growth of sac fry and yearlings
---- 3,730 * Cary et al. (1976)
Fathead Minnow (Pimephales promelas)
DEHP M? 127 Fry growth ---- 100 * Mayer et al. (1977)
DEHP M 56 Adult growth and survival ---- 62 * Mehrle and Mayer (1976)
DEHP M 32 Fry growth and survival 42,400 23,800 Horne et al. (1983)
DOP [Di-n-octyl phthalate] M 28 Embryo hatching and survival; Fry survival
10,000* 3,200 McCarthy and Whitmore (1989)
Bluegill Sunfish (Lepomis macrochirus)
DEHP M 371 Embryo survival; growth and survival of fry and adults
---- 1,920 * Cary et al. (1976)
Table 3.39 continued overleaf

EU RISK ASSESSMENT REPORT – DINP
FINAL REPORT, 2003 106
Exposure duration (Days)
Table 3.39 continued Summary of chronic aquatic toxicity tests for C6 - C11 phthalate esters
Species Phthalate ester Measured/Nominal
End points considered LOEC (µg/l)
NOEC (µg/l)
Reference
Japanese Medaka (Oryzias latipes)
DEHP M 168 Egg hatchability and survival; Fry growth and survival
554* ---- De Foe et al. (1990)
DEHP N 28 Egg survival and development; Fry survival, growth and behaviour
---- 320 * Van den Dikkenberg et al. (1990)
Zebrafish (Branchydanio rerio)
DEHP N 28 Egg survival and development; Fry survival, growth and behaviour
---- 320 * Van den Dikkenberg et al. (1990)
Stickleback (Gasterosteus aculeatus)
DEHP N 28 Egg survival and development; Fry survival, growth and behaviour
---- 320 * Van den Dikkenberg et al. (1990)
Flagfish (Jordanella floridae)
DEHP ----- N 28 Egg survival and development; Fry survival, growth and behaviour
320 * Van den Dikkenberg et al. (1990)
Guppy (Poecilia reticulata)
DEHP N 28 Egg survival and development; Fry survival, growth and behaviour
---- 320 * Van den Dikkenberg et al. (1990)
Channel Catfish Ictalurus punctatus
DINP [Di-isononyl phthalate]
N 7 Mortality at post-hatching ---- 30 *** Birge et al. (1978)
Redear Sunfish Lepomis microlophus :
DINP N 8 Mortality at post-hatching ---- 300 *** Birge et al. (1978)
Fowler’s Toad Bufo fowleri**
DINP N 8 Mortality at post-hatching ---- 300 *** Birge et al. (1978)
Leopard Frog Rana pipiens**
DINP N 8 Mortality at post-hatching ---- 300 *** Birge et al. (1978)
Table 3.39 continued overleaf

CHAPTER 3. ENVIRONMENT
107
Table 3.39 continued Summary of chronic aquatic toxicity tests for C6 - C11 phthalate esters
Species Phthalate ester Measured/Nominal?
Exposure duration (days)
End points considered LOEC (µg/l)
NOEC (µg/l) Reference
Channel Catfish Ictalurus punctatus
DOP N 7 Mortality at post-hatching ---- 300 *** Birge et al. (1978)
Redear Sunfish Lepomis microlophus :
DOP 8 300 *** N Mortality at post-hatching ---- Birge et al. (1978)
Fowler’s Toad Bufo fowleri**
DOP N 8 Mortality at post-hatching ---- 300 *** Birge et al. (1978)
Leopard Frog Rana pipiens**
DOP ---- N 8 Mortality at post-hatching 300*** Birge et al. (1978)
Largemouth Bass Micropterus salmoides
DOP M 8 Mortality at post-hatching at two water hardnesses: 50 et 200 mg/l
---- 3,730 and 3,260 ***
Birge et al. (1978)
Rainbow Trout Salmo gairdneri
DOP M 63,070 and 4,950 ***
26 Mortality at post-hatching at two water hardnesses: 50 et 200 mg/l
---- Birge et al. (1978)
* Highest concentration (emulsion) tested ** Amphibians *** NOEC values for the fish and amphibian species have been determined from the concentration-effect values given in the publications. The NOEC value was derived from the geometric mean
calculated from the concentration demonstrating a deviation of less than 10% of the control and the first above concentration demonstrating a deviation of more than 10%. For example, if at a concentration of 0.01 mg/l a survival of 98% and at a concentration of 0.1 mg/l a survival of 82% were determined, the derived NOEC corresponds to the geometric mean of 0.03 mg/l.

EU RISK ASSESSMENT REPORT – DINP FINAL REPORT, 2003
One early study by Mehrle and Mayer (1976) reported an increase in sac-fry mortality at a concentration of 14 µg/l. This study is considered not valid due to the test conditions employed. Radiolabeled DEHP dissolved in acetone was firstly used to determine the bioaccumulation potential in eggs, which was used afterwards for the hatchability and sac fry mortality study. DEHP exposure did not cause egg mortality and did not alter hatchability.
A NOEC of 0.03 mg/l has been determined in a dose effect curve (Birge et al., 1978). However, results are based on nominal concentrations and the exposure period is only 7 to 8 days (the embryos were exposed for 3-4 days until hatching after which larvae were exposed for another 4 days post-hatch). The experiences were conducted in static renewal tests for both diisononyl phthalate (DINP) and dioctyl phthalate (DOP) performed for two species of fish and amphibians. Flow through species were also performed with two fish species (different species than in the static renewal tests) with DOP. Analytical confirmation of test concentration was only performed in the flow through tests with DOP. A comparison of the results is shown in Table 3.40.
Table 3.4 Summary of aquatic toxicity data for di-n-octyl phthalate (DOP) and diisononyl phthalate (DINP1) 0 Birge et al. (1978)
Species Analytical monitoring
Exposure protocol
Exposure duration (d)
DOP LC50 [mg/l]
DINP LC50 [mg/l]
Channel Catfish Ictalurus punctatus
No Static Renewal 3 7 *
1.21 0.69
0.87 0.42
Redear Sunfish Lepomis microlophus:
No Static Renewal 3-4 8 *
77.2 6.18
71.85 4.67
Fowler’s Toad Bufo fowleri **
No Static Renewal 3-4 8 *
44.14 3.88
23.51 2.95
Leopard Frog Rana pipiens **
No Static Renewal 3-4 8 *
5.52 4.44
4.94 3.63
Largemouth Bass Micropterus salmoides
Yes Flow-through 3-4 8 *
63.9 42.1
NT NT
Rainbow Trout Salmo gairdneri
Yes Flow-through 22 26 *
139.1 139.5
NT NT
* 4 days post-hatch, **Amphibians, NT = Not Tested
In most experiments five treatment concentrations ranging by a factor of ten from 0.01 to 100 mg/l were targeted. The analytical monitoring in the flow through experiments for DOP was in poor agreement with nominal values. For example, in the largemouth bass test at the nominal treatment concentration of 1 mg/l, mean measured DOP concentrations of 46.3 and 35.5 mg/l were reported at a water hardness of 50 and 200 mg/l, respectively. The inability to confirm nominal concentrations with analytical measurements in flow through tests with DOP causes serious doubts on the validity of toxicity results reported for the static renewal tests. The NOECs derived for DOP in flow through tests are exceeding 3,730 µg/l and are in agreement with the values reported in chronic fish studies for DEHP by Cary et al. (1976) and Horne et al. (1983) (see Table 3.39). These concentrations are grossly in excess of water solubility and the effects are most likely attributable to physical influence of the undissolved test substance. This is supported by the observation made by Birge et al. (1978) that larval mortality occurred in the first few days after post-hatch and did not continue after long exposure periods. If chemical toxicity mechanisms were involved, cumulative toxicity would be expected. Moreover, the LC50 for rainbow trout which was based on a much longer test exposure (due to the longer hatching
108

CHAPTER 3. ENVIRONMENT
time for this species) was higher than the LC50 for largemouth bass which was based on only a 7-8 day test duration (see Table 3.40).
The chronic fish NOEC for high molecular weight phthalates ranges from 30 to 63,070 µg/l. Not taking into account the results of the Mehrle and Mayer, (1977), and the Birge et al. (1978), studies, the NOEC ranges from 320-23,800 µg/l. The large discrepancies in reported NOEC values between studies reflect the different experimental techniques that were used to obtain maximum exposure concentrations (i.e. emulsions).
Lowest observed effect concentrations (LOECs) were obtained in three studies and range from 554 to 42,400 µg/l (Table 3.39).
The lowest LOEC of 554 µg/l for DEHP was reported to cause a 13% reduction in Oryzias latipes growth after a 168-day exposure (De Foe et al., 1990). In the same study, no statistically significant effects on rainbow trout growth were observed at 502 µg/l after 90 days. In another study, no effects were observed in Oryzias latipes on egg survival and development and fry survival, growth and behaviour up to a concentration of 320 µg/l (Van den Dikkenberg et al., 1990). Since a clear concentration-response was lacking in these studies, it is difficult to determine if the observed effects are artifactual (e.g., physical effects of undissolved test chemical) due to testing at such unrealistically high aqueous concentrations.
Conclusion
In none of the valid tests, a chemical toxic effect could be attributed to the substances tested. Furthermore, a two-generation test with Oryzias latipes showed that oral intake of 20 mg/kg had no adverse effect upon reproduction and growth. It can therefore be concluded that based on the available data, DINP has no adverse effects upon fish and that a NOEC cannot be determined.
3.2.1.1.2 Invertebrates
Acute toxicity
Several studies have been performed determining acute effects on daphnids.
Table 3.41 Toxicity experiments to invertebrates with DINP
Species EC50 (48 h) Remarks Reference
Daphnia magna ≥ 0.086 mg/l Test solutions prepared by mixing for 1 h, standing for 24h and siphoned off from the bottom, measured concentrations. Equal proportion blend of DINP supplied by different US manufacturers
CMA (1984b)
≥ 1 mg/l DINP 1, No analytical monitoring; solubiliser: Castor oil ethoxylate Brown and Williams (1995)
> 74 mg/l DINP 2, solubiliser: Castor oil ethoxylate Huels (1995d)
≥ 500 mg/l No analytical monitoring; solubiliser Tween 80
BASF (1988)
Paratanytarsus parthenogenetica
≥ 0.12 mg/l Stock solution prepared with homogeniser for 2 minutes, measured concentrations. Equal proportion blend of DINP supplied by different US manufacturers
CMA (1984c)
Mysidopsis bahia ≥ 0.77 mg/l Stock solution prepared by stirring for 1 hour followed by 0.5 hour no-stirring, measured concentrations. Equal proportion blend of DINP supplied by different US manufacturers
CMA (1984d)
109

EU RISK ASSESSMENT REPORT – DINP FINAL REPORT, 2003
No effect was demonstrated at the limit of solubility.
Chronic toxicity
Several studies have been performed determining long-term effects on daphnids.
Table 3.4 Chronic toxicity experiments to invertebrates with DINP 2
Species NOEC (21 d) Remarks Reference
Daphnia magna 0.034 mg/l Equal proportion blend of DINP supplied by different US manufac-turers, physical entrapment
CMA (1984a); Rhodes et al. (1995)
≥ 1 mg/l DINP 2, solubiliser: castor oil ethoxylate Croudace et al. (1995)
> 1 mg/l DINP 1, GLP: yes, no analytical monitoring; solubiliser: castor oil ethoxylate
Brown and Williams (1994)
In one study a definite NOEC value of 0.034 mg/l (CMA, 1984a; recalculation by Rhodes et al. (1995)) was obtained. It is however assumed by the authors of this publication that this low effect is due to physical entrapment of daphnids at the surface.
Physical entrapment is not considered as a toxic effect in this risk assessment, (a higher non limit value is obtained with a solubiliser), therefore the concentration of 0.034 mg/l is not taken into account in the effect assessment.
In conclusion, no chemical toxic effects of DINP towards invertebrates could be observed in any of the performed long-term tests and therefore no NOEC can be derived.
3.2.1.1.3 Aquatic plants
Table 3.43 Toxicity experiments to aquatic plants with DINP
Species Effects [mg/l] Remarks Reference
Selenastrum capricornutum 120 h EC50 > 2.8 120 h NOEC ≥ 2.8
Test solution prepared by sonication for 1 minute and settling for 4 hours, measured concentration; equal proportion blend of DINP supplied by different US manufacturers
CMA (1984e)
Scenedesmus subspicatus 72 h EC50 > 500 72 h EC20 > 500
Solubiliser RH Cremophor was used; no analytical monitoring BASF (1988)
Scenedesmus subspicatus 72 h EC50 >100 72 h NOEC ≥ 100
DINP 2, castor oil ethoxylate served as solubiliser Huels (1995e)
No effect was demonstrated at these limit values. In conclusion, no chemical toxic effects of DINP towards algae could be observed in any of the performed long-term tests and therefore no NOEC can be derived.
3.2.1.1.4 Microorganisms
Two studies concerning toxicity to microorganisms have been carried out.
110

CHAPTER 3. ENVIRONMENT
Table 3.44 Toxicity experiments to microorganisms with DINP
Species EC 0 Remarks Reference
Activated sludge of predominantly domestic sewage
> 83 mg/l DINP 1, exposure period 3 h; limit test; analytical monitoring of nominal concentration of 100 mg/l;
Exxon Biomedical Sciences (1997c)
Photobacterium phosphoreum > 100 mg/l DINP 1, exposure period 15 min; limit test; analytical monitoring of nominal concentration of 100 mg/l;
Exxon Biomedical Sciences (1997c)
No effect was seen at these limit values. Solution of DINP was achieved by using a solvent (Tween 20). As analytical monitoring was performed, these results are considered as valid.
In a further study with Tetrahymena pyriformis (Yoshizawa et al., 1977), no effect on cell division could be observed over 24 hours at concentrations of 1, 10, 25, 50, 100 or 200 mg/l.
In conclusion, no chemical toxic effects of DINP towards microorganisms could be observed in any of the performed long-term tests and therefore no NOEC can be derived.
3.2.1.1.5 Potential for endocrine disruption
Several results from in vitro and in vivo assays to determine the potential of phthalate esters are described in Section 4.
The interaction of selected xenobiotics with testosterone-binding sites was also assessed using citosol prepared from whole brain homogenates from rainbow trout (Oncorhynchus mykiss), while the assessment of interactions with estrogen and corticosteroid binding was evaluated using liver cytosol. Aliquots of cytosol were incubated in triplicate together with labeled steroid estradiol, cortisol or testosterone, together with an increasing concentration of competitor, in both the presence (non-specific binding) and absence (total binding) of a 1,000-fold excess of inert steroid, for 4 hours at 4°C. Dinonyl phthalate (no indication about exact identity) displaced estradiol from the estradiol receptor, but a concentration of approximately 2.105-fold greater than that of estradiol was required to produce an equivalent 10-25% displacement of specifically bound estradiol.
Regarding the effects upon ecosystems, the most relevant test result is from the multigeneration study with Oryzias latipes by Patyna et al. (1999) as described above.
DINP 1 was added to dry flake food at 20 mg/kg. There were no statistically significant changes in mortality or fecundity between the treatment groups. There was no reduced egg production. There was a slight but statistically insignificant increase in egg viability in the DINP treated group when compared to the no treatment control. Evaluation of F1 and F2 embryos showed normal development except for a transient decrease in red blood cell pigmentation. This effect was observed in both the DINP treatment and the acetone control group. The male to female ratios (3:1) in all groups were similar. Phenotypic gender classification of male and female fish was histopathologically confirmed to be 100% correct. Ale somatic gonadal index and liver somatic index were not significantly different in any group.
Based on these data there there is apparently no impact on any population parameter from chronic exposure to DINP on fish.
111

EU RISK ASSESSMENT REPORT – DINP FINAL REPORT, 2003
3.2.1.1.6 Sediment dwellers
Several recent studies have been carried out for different sediment dwellers.
Table 3.45 Toxicity experiments to sediment dwellers with DINP
Test organism Test duration (Days)
Test end points NOEC (mg/kg dw)
Reference
Midge (Chironomus tentans)
10 Survival, growth ≥3,000 * Call et al. (1997)
Amphipod (Hyalella azteca)
10 Survival, growth ≥3,000 * Call et al. (1997)
Moorfrog (Rana arvalis)
26 Egg hatching, tadpole survival and malformation
≥710-1,010 * Solyom et al. (2000)
*Highest concentration tested
No effect was observed at the highest concentrations tested.
The test with frog eggs (Rana arvalis) was performed in parallel with coarse and fine sediment. 7,000 fertilised frog eggs from at least 10 females were collected. None of the examined eggs had reached the gastrula stage. DINP was dissolved in acetone and mixed with air-dried sediment. After evaporation, the sediment was mixed with fresh test sediment slowly agitated until equilibrium (up to 20 days). The test was performed at 10 C. The nominal test concentrations were 100, 300 and 1,000 mg/kg dw. A control as well as an acetone control was also performed. The average measured test concentrations were 113, 245 and 1,010 mg/kg dw for fine sediment and 120, 295 and 710 mg/kg dw for coarse sediment. The porewater concentrations and overlying water concentrations were not determined (Solyom et al., 2000). No significant effects were observed on hatching success as well as mortality and deformation of hatched tadpoles.
Furthermore, a 28-day study with Chironomus riparius revealed no effects upon adult emergence, time to emergence and sex ratio with either DIDP or DINP up to a concentration of 10,000 mg/kg dw (Brown et al., 1996).
3.2.1.2 Calculation of PNEC
Determination of PNECaqua
No chemical toxic effects of DINP towards fish, invertebrates or algae could be observed in any of the performed long-term tests. No NOECs could be derived. The assessment scheme proposed in EC (1996) can therefore not be used to derive a PNEC for the aquatic compartment. As furthermore, a two-generation study in fish exposed orally was performed, showing no impact on any population parameter, it can tentatively be concluded that DINP does not cause adverse chemical effects towards the aquatic ecosystem.
Determination of PNECmicroorganisms
Reliable results obtained recently Exxon Biomedical Sciences (1997c) in a test of respiratory inhibition of activated sludge (OECD Guideline 209). No effect was observed at a measured
112

CHAPTER 3. ENVIRONMENT
limit concentration of 83 mg/l. It can be concluded that the substance does not have any effects upon microorganisms at or above water solubility and that no PNEC can be derived. This would also be supported by the available biodegradability test results.
Determination of PNECsediment
A long-term test has been performed with vertebrates (moorfrog) and a read-across from long-term tests performed with DEHP and DIDP on invertebrates (midge) can be performed. In none of the test systems could any effects be observed. No NOECs could be derived. The equilibrium partitioning model described in the TGD cannot be used to estimate a PNECsediment as no aquatic PNEC could be derived due to the lack of identified adverse effects. It can therefore tentatively be concluded, that this compound has no adverse effects towards benthic organisms.
3.2.2 Atmosphere
Some phthalates, especially dibutyl phthalate (DBP) have shown to be toxic to plants via the atmosphere (EC, 1999). No results are available with DINP.
Hannay and Millar (1986) exposed radish seedlings to an air stream passing over PVC rods plastified with DBP or DIDP. While the growth was inhibited in the experiments involving DBP-plastified PVC, no effects were seen in those involving DIDP-plastified PVC. The concentrations of DBP or DIDP were not measured though; no conclusion can unfortunately be drawn from this experiment. As DIDP is much less volatile than DBP, the concentration of DIDP in the “contaminated” air was certainly much lower than the concentration of DBP.
Hardwick et al. (1984) grew cabbage seedlings in a cuvette bioassay in the presence of strips of plastic plasticised with DBP, DEHP or DIDP. Effects were observed with plastics treated with DBP. No effects were observed with DEHP-plasticised strips. No effects were observed with small samples of DIDP-plasticised strips. Effects were observed with larger samples of DIDP plasticised strips, but residual concentrations of DBP were measured in the air while no DIDP was detected (limit of determination not indicated).
These experiments do not allow concluding an absence of toxicity of DINP to plants via the gas phase. No PNEC can be determined.
3.2.3 Terrestrial compartment
A summary of recent soil toxicity experiments for DINP 1 are summarised in Table 3.46.
113

EU RISK ASSESSMENT REPORT – DINP FINAL REPORT, 2003
Table 3.46 Soil toxicity experiments with DINP 1
Test organism Test duration (days)
Test end points NOEC (mg/kg dw)
Reference
Earthworm (Eisenia foetida)
14 Mortality ≥10,000 * Exxon Biomedical Sciences (1996c)
Rye grass (Lolium sp.)
5 Seed germination ≥10,000 * Exxon Biomedical Sciences (1996d)
Lettuce (Lactuca sativa)
5 Seed germination 1,000 (LOEC = 3,000 EC50 > 10,000)
Exxon Biomedical Sciences (1996e)
Lettuce (Lactuca sativa)
28 Seed germination and growth
≥ 1,500 * Exxon Biomedical Sciences (1999a)
Soil microorganisms
33 Degradation of glucose
≥10,000 * Exxon Biomedical Sciences (1999b)
* Highest concentration tested
Effects were only observed with Lactuca sativa in a germination test: 16 and 33% inhibition at 3,000 and 10,000 mg/kg dw, respectively. In a long-term germination and growth test, no inhibition up to a concentration of 1,500 mg/kg dw were observed
Determination of PNECsoil
Long-term test results are available with species from two trophic levels. A result regarding inhibition of germination was not confirmed in a second test. The NOEC of 1,500 mg/kg will therefore be used with an assessment factor of 50:
PNECsoil = 1,500/50 = 30 mg/kg (dry weight) = 30,000 µg/kg
3.2.4 Secondary poisoning
The lowest overall NOAEL of 88 mg/kg bw/d has been determined in a two-year repeated dose study with rats. This corresponded to a food concentration of 1,500 mg/kg. Using an assessment factor of 10, a PNECoral of 150 mg/kg can be estimated for top predators.
114

CHAPTER 3. ENVIRONMENT
3.3 RISK CHARACTERISATION
3.3.1 Aquatic compartment (incl. sediment)
Sewage treatment plants
The highest value estimated for a STP outlet is 3.4 mg/l (production site D, worst-case scenario with default values). No PNEC could be derived as no effects at the limit of water solubility could be observed. Conclusion (ii).
Surface waters
In Table 3.47 the total calculated surface water concentration for the different exposure scenarios is presented.
Table 3.4 PEClocal for the aquatic compartment 7
Life cycle step PEClocalwater = Clocalwater + PECregionalwater [µg/l]
Production (life cycle I) A 0.0008 + 0.7 C 1.5 + 0.7 D 0.9 + 0.7 E 0.4 + 0.7
Processing in PVC (life cycle IIIa) 1 3.0 + 0.7 2 4.1+ 0.7 3 2.0 + 0.7 4 9 + 0.7 5 4.3 + 0.7
Processing in non-PVC (life cycle IIIb) 2.7 + 0.7
Use in adhesives, glues and sealing compounds (life cycle IIIc) I* 7.4 + 0.7
Use in inks for paper (life cycle IIId) I 7.4 + 0.7 II** 0.6 + 0.7
Use in paints (life cycle IIIe) I 7.4 + 0.7 II 0.7 + 0.7
Paper recycling (life cycle IVd) 0.5 + 0.7
* Formulation ** Processing No chemical toxic effects of DINP towards fish, invertebrates or algae could be observed in any of the performed long-term tests. No NOECs could be derived. The assessment scheme proposed in EC (1996) can therefore not be used to derive a PNEC for the aquatic compartment. As furthermore, a two-generation study in fish exposed orally was performed, showing no impact on any population parameter, it can tentatively be concluded that DINP does not cause adverse chemical effects towards the aquatic ecosystem. Conclusion (ii).
115

EU RISK ASSESSMENT REPORT – DINP FINAL REPORT, 2003
Sediment
In Table 3.48 the estimated calculated sediment concentrations for the different exposure scenarios are presented.
Table 3.48 PEClocal for the sediment
Life cycle step PEClocalsed = Clocalsed + PECregionalsed [µg/kg dw]
Production (life cycle I) A 13 + 2,600 C 2,000 D 14,810 + 2,600 E 300
Processing in PVC (life cycle IIIa) 1 48,300 + 2,600 2 66,800 + 2,600 3 32,100 + 2,600 4 148,500 + 2,600 5 70,000 + 2,600
Processing in non-PVC (life cycle IIIb) 44,300 + 2,600
Use in adhesives, glues and sealing compounds (life cycle IIIc) I* 131,000 + 2,600
Use in inks for paper (life cycle IIId) I 131,000 + 2,600 II** 9,700 + 2,600
Use in paints (life cycle IIIe) I 131,000 + 2,600 II 11,300 + 2,600
Paper recycling (life cycle IVd) 8,100 + 2,600
* Formulation ** Processing
A long-term test has been performed with vertebrates (moorfrog) and a read-across from long-term tests performed with DEHP and DIDP on invertebrates (midge) can be performed. No effects could be observed in any of the test systems. No NOECs could be derived. The equilibrium partitioning model described in the TGD cannot be used to estimate a PNECsediment as no aquatic PNEC could be derived due to the lack of identified adverse effects. It can therefore tentatively be concluded, that this compound has no adverse effects towards benthic organisms. Conclusion (ii).
3.3.2 Atmosphere
It is so far not possible to realise a biotic assessment in the same way as described for other compartments. No results are available with DINP. No PNEC could be derived from the results available for analogues e.g. DIDP, as no dose response relationship could be established. The absence of adverse effects in the test systems does not give rise for immediate concern though. Conclusion (ii).
116

CHAPTER 3. ENVIRONMENT
3.3.3 Terrestrial compartment
In Table 3.49, the ratios PEC/PNECsoil are shown. Local PECsoil for production sites have not been calculated as most producers dispose of their sewage sludge either through incineration or landfilling.
Table 3.49 PEC/PNEC ratios for agricultural soil
Life cycle step PEClocalsoil = Clocalsoil + PECregionalsoil [µg/kg dw]]
PEC/PNEC
Processing in PVC (life cycle IIIa) (highest release) 10,900 + 19 0.30 Processing in non-PVC (life cycle IIIb) 3,290 + 19 0.11
Use in adhesives, glues and sealing compounds (life cycle IIIc) I* 8,950 + 19 0.30 II** negligible
Use in inks for paper (life cycle IIId) I 8,950 + 19 0.30 II 723 + 19 0.02
Use in paints (life cycle IIIe) I 8,940 + 19 0.30 II 860 + 19 0.03 Paper recycling (life cycle IVd) 643 + 19 0.02
* Formulation, ** Processing As all calculated PEC/PNEC ratios are below 1, it can be concluded that there is no risk to terrestrial organisms through DINP. Conclusion (ii).
3.3.4 Secondary poisoning
In Table3.50 the PEC/PNEC ratios for top predators are presented.
Table 3.50 PEC/PNEC ratios for predators
Life cycle step PECoralaquatic [mg/kg ww]
PECoralworm [mg/kg ww]
PEC/PNEC fish / worm
Production (life cycle step I) 4.62 0.01 0.03 / 0.00007 Processing in PVC (life cycle step IIIa) (highest release) 17.9 4.1 0.12 / 0.03 Processing in non-PVC polymers (life cycle step IIIb) 7.6 1.2 0.05 / 0.01 Formulation of adhesives, glues and sealing compounds (life cycle step IIIc)
14.9 3.35 0.10 / 0.02
Use of sealing compounds (life cycle step IIIc) 2.7 0.009 0.02 / 0.00004 Formulation of printing inks (life cycle step IIId) 14.9 3.35 0.10 / 0.02 Use of printing inks (life cycle step IIId) 2.93 0.28 0.03 / 0.0003 Formulation of paints (life cycle step IIIe) 14.9 3.35 0.10 / 0.02 Use of paints (life cycle step IIIf) 3.1 0.33 0.02 / 0.002 Paper recycling (life cycle step IVd) 3.49 0.25 0.02 / 0.0002
As all PEC/PNEC ratios are below 1, it can be concluded that there is no risk towards top predators from DINP. Conclusion (ii).
117

118
4 HUMAN HEALTH
4.1 HUMAN HEALTH (TOXICITY)
4.1.1 Exposure assessment
4.1.1.1 General discussion
Exposure to DINP may occur at each stage of its life cycle, from production to waste disposal, including the manufacture or the use of end products containing DINP. The human populations that may be exposed are:
• workers, • consumers, • humans through the environment.
Routes of exposure may be:
• direct skin contact (e.g. manufacture, formulation of products, contact with end products containing DINP),
• inhalation (e.g. manufacture, processing or use at high temperature of products containing DINP, aerosol forming activities),
• oral (e.g. toys end use, via food contact materials).
DINP vapour pressure being so low that it is difficult to measure, its vapour phase concentrations remain always low, even at temperatures used in some industrial conditions (e.g. processing, mixing, calendering). However, in many circumstances aerosols are formed and become a potentially important source of exposure. Pulmonary penetration may be significant if droplets are in the respirable range (e.g. less than 5 µm), as occurs after recondensation. Pulmonary penetration also occurs when vapours condensate on existing respirable airborne particles, as may be the case in the environmental context.
4.1.1.2 Occupational exposure
Occupational exposure to DINP may occur: 1) by skin contact with pure DINP, or mixtures (formulations) or end products containing it 2) by inhalation (vapours and aerosols). Oral exposure is not considered to be a significant route of exposure under normal working practices.
Few countries have defined Occupational Exposure Limits for DINP. In the UK, the HSE (1997a) indicates an occupational exposure standard (8-hour TWA) of 5 mg/m3 for DINP (CAS 28553-12-0). In Sweden, KEMI (1997) indicates a “level limit value” of 3 mg/m3 and a “short-term value” of 5 mg/m3 which apply to phthalates such as DINP for which no specific limit values have been defined.
Workers may be exposed to DINP at different representative stages of its life cycle. The following exposure scenarios are considered:

CHAPTER 4. HUMAN HEALTH
1. manufacture of DINP (reactor opening, drumming, pumping into tanks, cleaning, maintenance, etc),
2. manufacture of products containing DINP as plasticisers or solvents (adding, mixing, processing e.g. calendering, extruding, injection moulding, etc)
3. use of end products containing DINP (use of e.g. coatings, adhesives or inks).
In PVC formulations, the typical amount of DINP is about 20-40% but may go up to 55%. In end products, the amount varies greatly from less than 1% to more than 50% (INRS, 1998).
The use of personal protective equipment is not taken into account in this assessment. Moreover its effectiveness is difficult to estimate in real conditions of use.
4.1.1.2.1 Dermal exposure
Direct or indirect (via contaminated clothes or gloves) skin contact with pure DINP refers only to some activities during manufacture (drumming, cleaning, maintenance) and handling it at the first step of its industrial use (pumping, emptying containers). Contact is also possible with formulations or end products containing DINP, especially in the liquid or paste form (e.g. application of coatings, adhesives or inks). Dermal exposure during use of solid finished products is considered to be low because of incorporation of the substance in the polymer matrix.
No measured data are available for dermal exposure.
Exposure assessment does not normally include absorption consideration. However it is useful to discuss the skin penetration of DINP before proposing predictive external exposure.
Skin absorption of chemicals can be described using a simple model which depends only upon the size of the permeant and its octanol/water partition coefficient (Potts and Guy, 1992). The maximum penetrant flux decreases very rapidly for log P values greater than 2 (Guy and Hadgraft, 1988). The molecular weight is generally considered as presenting less influence (although there was very limited experience with high molecular weight substances), the diffusion coefficient being theoretically inversely proportional to the cube root of molecular weight (ECETOC, 1993). With its very marked lipophilicity and high molecular weight, DINP may be inferred to have a very low skin penetration. A comprehensive set of experimental data about dermal absorption properties of phthalates presented in Section 4.1.2.1. confirms that skin penetration of DINP is very low.
Although the potential dermal exposure may change across a wide variety of circumstances encountered in workplaces, it is proposed as a first worst-case approach to use a maximum external exposure in order to calculate the maximum dermal uptake whatever the scenario is.
The maximum daily external exposure is assumed to be 10 mg/cm2. This value is clearly a maximum because:
• it is qualified as “intermittent contact during wide dispersive use and direct handling” (1-5 mg/cm2/d) by the EASE model and exposure may be much lower in many circumstances,
• experience with dermato-pharmaceuticals has shown that the skin area-dose during therapeutic use is 2 to 4 mg preparation per cm2. It was found that the cutaneous penetration rates increased as the dose was increased up to 5 mg/cm2 of skin, and then remained
119

EU RISK ASSESSMENT REPORT – DINP FINAL REPORT, 2003
constant at skin area doses equal to and higher than 5 mg/cm2. Experience has also shown that in vivo the maximum amount of a compound which can be retained on human skin is around 5 µl/cm2 of a liquid (ECETOC, 1993).
• DINP is not always used as a neat substance. Exposure during the use of a formulation is tempered by the percentage of DINP in the formulation.
4.1.1.2.2 Inhalation exposure
Due to its extremely low vapour pressure, DINP vapour phase concentrations may not attain high levels, even at the high temperatures used in some industrial conditions (e.g. processing, mixing, calendering). At 20°C, DINP has a vapour pressure of 6.10-5 Pa (best estimated value) and a calculated satured vapour concentration of 10 µg/m3. If vapours are inhaled up to a temperature of around 35°C (where maximum vapour pressure would be around 2.10-4 Pa and prolonged inhalation unlikely), the satured vapour concentration is ca. 115 µg.m-3. Occupational exposure to vapour will actually be far below these values.
Nielsen et al. (1985) sampled phthalic acid esters (PAEs; mainly DEHP, DIDP and BBP) on glass fiber filters and checked that no vapour passed through the filter. They did not study the aerosol particle size, but estimated it should be in the respirable range, owing to its mechanism of formation. Dirven et al. (1993) also checked that no DEHP was lost when drawing air through mixed cellulose ester membranes spiked with 30 µg DEHP. Recovery was greater than 97%. These data are an experimental confirmation that heavy phthalates have negligible vapour concentrations at ordinary temperature and pressure and that the main source of inhalation exposure originates from aerosol formation.
At high temperatures and mechanical pressures, aerosol formation is observed with DINP like with other phthalates. Exposure to aerosol is therefore possible in any situation where pure DINP is heated or materials containing DINP are heated and under influence of mechanical pressure. This is also the case when mixtures containing DINP are sprayed.
Few measured data are available for DINP inhalation exposure. However a significant amount of data is available for other phthalates.
Due to similar physico-chemical mechanisms of aerosol formation, similar aerosol concentrations are likely to be observed with heavy phthalates in similar conditions of use. Phthalates considered should not differ too much in molecular weight (hence, in volatility, boiling point, vapour pressure). This allows to consider data available for other phthalates, especially DEHP and heavier phthalates, as a source of information to estimate potential exposure concentrations to DINP aerosols.
The measured data mentioned in this report are not always presented with sufficient detail to judge their relevance (e.g. no precise information regarding processes, control measures, sampling procedure), some are relatively old and may be associated with less advanced controls than would be expected today. However the total number of measurements is large and most activities that are suspected to lead to relatively high exposure levels are included. Moreover the evolution of controls is not always as fast as expected, especially in small undertakings.
Comparison with modelled data seems difficult. The EASE model is not suitable for substances with very low vapour pressure. Its application is limited to substances with vapour pressures higher than 1 Pa (DINP vapour pressure is much lower) and estimation of exposure to aerosols is problematic.
120

CHAPTER 4. HUMAN HEALTH
Therefore for the initial assessment, it is proposed to derive the exposure levels from the available measured data on DINP and homologous phthalates. Further data would certainly be very useful to refine the assessment.
Scenario 1. Manufacture of DINP
Table 4.1 Exposure to phthalate esters during manufacture
There are at least five production sites in the EU. “The manufacturing process for DINP is within a closed system under vacuum. There is little potential for exposure” (ECPI, 1997a), except when the lid is opened, at the end of each batch, and fumes are emitted. Other exceptions are cleaning, maintenance work, filling of tanks and drums. Most of the fumes or vapours are generally removed by local exhaust ventilation.
Literature data
Peak values from < 1 mg/m3 up to as high as 60 mg/m3 have been reported for production workers, although with little detail on measurement conditions (Gilioli et al., 1978); time-weighted average is reported to be 5 mg/m3. Liss et al. (1985) presented data on 50 personal exposure measurements (with sampling on 37 mm diameter filter cassettes at 1 l/min) to DEHP for the duration of the workshift; 6 only showed levels above the analytical limit of detection. The maximum measured concentration was 4.1 mg/m3.
Unpublished data
"Limited monitoring data collected over several years to assess occupational exposure of process operations and maintenance technicians at a plasticiser plant indicate DINP concentrations in air of less than 2 mg/m3" (ECPI, 1997a). KEMI (1997) indicates that exposure is 0.1 mg/m3 during manufacture (closed process). This reflects well controlled procedures, but higher exposures may occur.
King (1996) reported data from different producers and from the HSE (Table 4.1). Sampling times are not indicated.
King, 1996)
Producer/Source Esters Personal sample number Average, mg/m3 Range, mg/m3
Producer 1 (EU) Various DEHP
14 1
0.77 < 0.1
0.2 - 2.3 < 0.1
Producer 2 (EU) DEHP 4 (production) 2 (tanker filling) 1 (drumming)
< 1.09 < 0.11 0.14
< 0.016 - 4.3 < 0.013 - 0.09
-
Producer 3 (USA) Producer 3 (EU)
Various DINP/DIDP/DIHP Various
12 18 (tanker filling)
?
?
< 0.01 - 0.31 <0.05 1)
< 2.0 2)
Producer 4 (EU) DEHP 28 3) 0.36 0.03 - 1.56
C8 - C13 C9 - C11
10 11
< 0.25 < 0.25
HSE data (from ACTS, 1984)
Table 4.1 continued overleaf
121

EU RISK ASSESSMENT REPORT – DINP FINAL REPORT, 2003
Table 4.1 continued Exposure to phthalate esters during manufacture
Producer/Source Esters Personal sample number Average, mg/m3 Range, mg/m3
Industry data (from ACTS, 1984) DIOP DIDP DEHP
86 32
77 4)
< 5.0 < 5.0 < 5.0
1) Less than the analytical limit of detection. Area monitoring was also performed: of the 29 samples, only 4 taken on top of tank cars exceeded the analytical limit of detection (0.27 mg/m3 DINP, 0.21 mg/m3 DIHP, 64.16 mg/m3 DHP, 53.32 mg/m3 DIDP). The representative area readings were all < 0.07 mg/m3 for the phthalates investigated.
2) Limited data: less than the analytical limit of detection. 3) Area measurements - "No cause for concern thus no need for personal monitoring". 4) Of the 77 measurements made, 87% were less than 0.5 mg/m3, 95% were less than 2 mg/m3. Similar results are given for DIDP and DIOP.
Exposure to DINP has been estimated in 1996 through measurements of DEHP, when this substance was produced, in a large-scale chemical industry. Of 38 determinations, a median value of 0.18 mg/m3 appears for routine determinations (meaning on a 8-hour shift duration), with one outlier at 2.8 mg/m3. Of 12 short-term measurements, the median is 0.6 mg/m3.
Considering all the data available for this scenario, a reasonable worst-case exposure is estimated at 5 mg/m3 (8-hour TWA). The typical concentration will be less than 2 mg/m3, and often still less, DINP is in general not detected when no aerosol is formed.
Scenario 2. Manufacture of products containing DINP
Following manufacture, DINP is incorporated to a polymer (PVC compounding, PVC processing) or to other mixtures (production of inks, adhesives, pigments dispersions…). Highest exposure will occur during processing or mixing operations at high temperatures. DINP being used in PVC formulations at concentrations that may go up to 55% by weight, it may be emitted in sizeable quantities in the course of calendering, extruding, injection moulding.
Literature data
In a study on the health status of workers exposed to phthalate plasticisers in the manufacture of artificial leather and films based on PVC resins, Milkov et al. (1973) reported “ambiant levels of vapors or aerosols of the plasticisers (mixed esters) at the working zone of the primers ranging from 10 to 66 mg/m3. Similar results were obtained at the workstations of the mill operators and calender operators. In the mixture preparation section, the plasticiser level was found to be 1.7-40 mg/m3”. The most used phthalates were DBP and higher alkyl phthalates (DAP-789). This paper does not give any indication on measurement conditions (duration, personal or static sampling, sampling technique, method of analysis, specificity).
Nielsen et al. (1985) measured exposure to phthalic acid esters (mainly DEHP, DIDP and BBP) in a PVC processing industry (2 hour sampling times) and found atmospheric concentrations ranging from 0.01 to 2.8 mg/m3.
Hagmar et al. (1990) give results of the same order of magnitude (0.5 to 3 mg/m3 among 'highly' exposed workers (calendering, mainly exposed to DEHP, DIDP and BBP). They give no detail, however, on sampling techniques.
Vainiotalo and Pfäffli (1990) measured exposures (static, not personal samplings) to DEHP in 9 plants in the range < 0.02 to 1.1 mg/m3 (this highest single value was measured during
122

CHAPTER 4. HUMAN HEALTH
calendering). They sampled on Florisil adsorption tubes at a flow rate of 0.5 l/min, and analysed by HPLC on a reversed phase C18 column with a 95:5 acetonitrile-water eluent.
Dirven et al. (1993) measured DEHP concentrations in the ambient air of PVC-processing industries (Table 4.2). Two-hour samplings were performed on mixed cellulose ester membranes at 1 l/min. After extraction, analysis was performed with a gas chromatograph.
Table 4.2 Mean concentrations and range of DEHP in ambient air as determined by personal air samplings (Dirven et al., 1993)
Plant Mixing mg/m3
Extruder mg/m3
Boot 0.26 (0.1 - 1.22), n = 16 * 0.12 (0.05 - 0.28), n = 11 *
Cable 0.18 (0.009 - 0.81), n = 8 * 0.24 (0.01 - 1.27), n = 13 *
* n: sample number
Unpublished data
King (1996) reported data collected in UK by the HSE and by industry. They are of particular interest since they include an idea of data repartition (Table 4.3).
Table 4.3 Exposure to phthalates during PVC processing in UK factories King (1996)
Cumulative% results less than (mg/m3) Process Esters n
0.25 0.5 1.0 2.0 5.0 10.0
Manufacture of pigment dispersions DEHP+ DIAP (total)
8 100
Recovery of filter DEHP residues DEHP 11 - 45 100
Manufacture of floor tiles DEHP 8 - 100
Manufacture of flexible floor covering DEHP BBP
12 100 100
Manufacture of rubber gloves BBP D79P
18 100 -
-
100
Manufacture of PVC DEHP DIDP
7 100 100
Manufacture of PVC DIOP 8 - - - 100
Manufacture of shoes (PVC binding) DIOP 9 - - 34 44 67 89
Manufacture of PVC* Mixed (total) 143 - - 56 74 93 100
Manufacture of cables* Mixed (total) 25 - - 40 80 92 100
* HSE results, with the exception of the 2 last lines industry data, from ACTS, 1984
RIVM (1997) collected exposure data to various phthalates during processing of polymers. Table 4.4 summarises the data after selection of phthalates heavier than DBP or BBP (and excluding data already cited from King (1996)). Sampling times are generally not provided.
123

EU RISK ASSESSMENT REPORT – DINP FINAL REPORT, 2003
Table 4.4 DEHP Exposure data during processing of polymers (RIVM, 1997)
Industrial sector n Range, mg/m3
Comments, source
Extrusion, injection, moulding, calendering compounding
34 0.02 - 0.5 At different processing temperatures (120 - 200 C). Personal communication from TNO (1996)
Calendering 3 1.46 - 1.95 BG Chemie (1994)
Calendering 6 0.3 - 2 BG Chemie (1994)
Waste processing 1 1.23 BG Chemie (1994)
KEMI (1997) indicates that exposure to phthalates is in the range of 0.1-0.3 mg/m3 (8 hours) during manufacture of flooring material (mixture of DEHP, BBP and DIDP) and up to 2 mg/m3 during calendering of PVC film.
Other data have been collected from databases in the UK (Table 4.5), Germany (Table 4.6) and France (Table 4.7). These data must be interpreted with care as there are a number of possible source of bias, in particular measurements have often been performed in workplaces selected in order to check compliance with occupational exposure standards giving preferential consideration to high levels of exposure.
Table 4.5 Diisooctyl phthalate exposure data (HSE, 1997b)
Plastics processing
a b c
In primary form SL 1 0.01
Milling, mixing or coating SL PL
2 1
< 0.5 0.1
Machine operator PL or PS 5 < 0.5
Treatment and coating of metals
a b c
Operator (general) PL 3 0.01
PL 1 0.46
PL 1 0.63
Packing and background PL SL
2 5 1 1
0.01 0.01 0.02 0.85
a: sampling type (SL: static, long duration; PL: personal, long duration) b: number of measurements c: results, in mg/m3
124

CHAPTER 4. HUMAN HEALTH
Table 4.6 Samplings and percentiles of workplace exposure to DEHP collected from 1991 to 1995 (BGAA, 1997)
Industrial activity Nb. of facilities n 50th percentile 90th percentile 95th percentile
Transforming: - Without control measures - With control measures
85 32 53
31 14 21
0.08 0.03 0.15
2.45 0.44 3.65
5.93 0.57 7.00
(in mg/m3)
These measurements were performed on membrane filters for 1 hour at least and analysed by high-pressure liquid chromatography.
Table 4.7 Dioctyl phthalate exposure measurements recorded from 1987 to 1996in the COLCHIC database (INRS, 1997)
Industrial sector n Global results, mg/m3 Remarks
Rubber (calendering) 25 Range: 0.04 - 26.7 Mean: 2.48, sd. 5.98
Highest values (with their sampling times, min): 11.7 (60), 2.62 (165), 26.7 (180), 7.77 (197), 2.6 (309), 2.4 (317)
Pharmaceuticals 10 Range: 0.03 - 1.55, Mean: 0.28, sd. 0.54
Metallic hoses 8 Range: 0.0007 - 0.07 Mean: 0.016, sd. 0.023
n: sample number sd: standard deviation
Samplings have been performed principally on filters (81.8%) for “dioctyl phthalate” (very probably DEHP). Analysis is most generally practiced by gas chromatography, sometimes by liquid chromatography.
The very high results found in the COLCHIC database in the rubber industry apply to calendering a rubber containing 4-8% dioctyl phthalate at more than 200°C, at a speed of 12 m.min-1. They have been obtained in ambient atmospheres, in places where workers were only present in case of problems or to check processing conditions. The highest measured concentration is referred to a sampling time of 3 hours. The 8-hour TWA is in this case 10 mg/m3, if there is no complementary exposure, and if there is actual personal exposure during this time. These data indicate, however, that short-term concentrations could be as high as 30 mg/m3 or sometimes even more, as already mentioned (Milkov, 1973).
Considering all the data available for this scenario, a reasonable worst-case exposure is estimated to be 10 mg/m3 (8-hour TWA). There are wide variations amongst exposure measurements, depending on circumstances and representativeness of samplings (site, personal or area sampling, duration). The typical concentration would be around 3 mg/m3.
Scenario 3: Use of end products containing DINP
DINP may be included in PVC or non-PVC products, such as coatings, rubbers, latexes, mastics and sealants, inks, dyestuffs, lubricants,... Other uses indicated are in acrylic resins (most often polymethylmethacrylate), pressure-sensitive adhesives, and creak indicating agents.
125

EU RISK ASSESSMENT REPORT – DINP FINAL REPORT, 2003
Use of end products can be distinguished in aerosol non-forming and aerosol-forming activities. During non aerosol-forming activities (e.g. normal use of paint, adhesive, ink…), inhalation exposure will be negligible because of the low vapour pressure of DINP. Significant exposures can occur during aerosol-forming activities when the use of the products involves elevated temperature or spraying technique (e.g. application of hot-melt adhesives, coating using a bath, spray painting or printing, textile spread coating, car underbody spray coating). Actual phthalate concentrations may however be limited due to their low vapour pressure, the range of particle sizes generated (they may not be respirable if not formed by a recondensation mechanism), or their percentage in formulations.
Data collected in the French database COLCHIC are presented in Table 4.8.
Table 4.8 Dioctyl phthalate exposure measurements recorded from 1987 to 1996 in the COLCHIC database (INRS,1997)
Industrial sector n Global results, mg/m3
Inks and office equipment 4 Undetected
Commercial vehicles 5 All < 0.1
Boiler making 2 0.083 and 0.046
Carpets 1 < 0.1
n: sample number
Industry (King, 1996) reported some measurements made in 1995 on exposure to DEHP and DINP during spray coating or spread coating in an automobile factory. Atmospheric concentrations were in the range 0-0.11 mg/m3.
There are very few exposure data available for this scenario. Although exposure is likely to be very low in many circumstances, there is no clear evidence that worst-case exposure during aerosol forming activities would be lower than for the previous scenario. Therefore, an exposure of 10 mg/m3 (8-hour TWA) is assumed for this scenario. The typical concentration would be around 1.5 mg/m3.
4.1.1.2.3 Conclusion of occupational exposure
Dermal
In view of the very low absorption of DINP by dermal route, a maximum dermal exposure of 5 mg/cm2 is intentionally assumed for all scenarios. Actual levels of dermal exposure are much lower in most occupational circumstances.
126

CHAPTER 4. HUMAN HEALTH
Inhalation
Table 4.9 Conclusion of inhalation occupational exposure
Estimated inhalation exposure level (mg/m3 8-hour TWA) Scenario Worst-case Typical
5 2
2- Manufacture of products containing DINP 10 3
3- Use of end products containing DINP 10 1.5
1- Production of DINP
4.1.1.3 Consumer exposure
4.1.1.3.1 General introduction
DINP is a plasticiser now frequently used as a substitute of DEHP.
The main difficulty in assessing the level of consumer exposure to DINP is the ubiquity of this compound. As DINP is not chemically bound to PVC, it can be released during the entire cycle of life of end products that are used by consumers. In addition, the release intensity is not expected to be linear over time. New products would be expected to give a higher exposure than products in which DINP has reached a steady-state release from product matrix to medium. DINP is not available to consumers as such.
The consumers may be exposed to DINP in two ways:
• use of end products, • via food and food-related products.
End products containing DINP which are used outdoors do not lead to significant exposure; they are:
• building materials: insulation materials, roof coatings, • car undercoating.
End products containing DINP which lead to consumer exposure are:
• building materials: flexible floor covering, wallpapers, windows frames, cables, paints, varnishes, epoxy and vinyl glues, joints and other materials used during the do-it-yourself,
• car and public transport interior, • clothes especially rainwear and clothes in artificial leather or in fleecy materials, • gloves, • shoes in synthetic leather, • seats and furniture covered with artificial leather, • handbags, school bags in artificial leather, • coated fabrics.
According to data provided by Exxon Chemicals, DINP does not seem to be used in cosmetics or for medical devices or dentistry.
For children 0-3 years old, PVC toys and teething rings are an additional source of DINP.
127

EU RISK ASSESSMENT REPORT – DINP FINAL REPORT, 2003
Consumer exposure may also occur through food and drinking because of contamination from packaging and processing equipment containing DINP.
Food and drink may also be contaminated via the environment. An assessment of indirect exposure of humans via the environment (including food) is presented in Section 4.1.1.4.
Three categories of consumers have been distinguished:
• adults corresponding to adults and children 3-15 years old, • infants 6 months to 3 years old as for this population the exposure via toys leaching adds to
the exposures to which adults and older children are submitted, • newborns (0 to 6 months old) will require special attention as their diet is quite different
(milk based).
For exposure scenarios, newborn babies and infants (young children) were grouped except for food as the diet is different for newborn babies and infants.
Table 4.1 End products containing DINP, sources of exposure and categories of consumers exposed 0
Routes of exposure End products/sources
Inhalation Dermal exposure Ingestion
Building materials and furniture A-I-N I-N I-N
Car and public transport interior A-I-N A-I-N
Clothes A-I-N A-I-N
A-I
Gloves A-I-N A
Toys and baby equipment A-I-N I-N I-N
Food and food related uses A-I-N
Shoes A-I-N
A: Adult I: Infants (6 months to 3 years old) N: Newborn babies (0 to 6 months old)
All interior end use emissions to the air compartment are via volatilisation mechanisms, except for flooring where abrasion may occur (Exxon, 1997).
The following data are used for assessment of DINP consumer exposure:
• actual exposure data (food), • results of migration tests from toys (ingestion),
Five exposure scenarios are considered referring to the above-mentioned uses of DINP:
3. building materials and furniture, for adults and young children via inhalation,
• results of dermal experiments in rats (dermal exposure), • results of a mathematical model (inhalation).
1. toys and baby equipment, for young children (infants and newborns) via the oral and dermal routes,
2. food and food-related uses, for adults and young children via ingestion,
4. car and public transport interior, for adults and young children via inhalation, 5. clothing, gloves and footwear, for adults via skin contact.
128

CHAPTER 4. HUMAN HEALTH
Other scenarios, for instance dermal exposure from building materials and furniture may theoretically occur but cannot be easily estimated.
Human internal exposures were calculated taking into account the following bioavailability factors as well as differences in oral and inhalation uptake between children and adults:
• Oral internal exposure: 50% for adults derived from toxicokinetic data in rats (see Section 4.1.2.1 Toxicokinetics, metabolism and distribution), 100% for newborns and infants based on a study from Sjoberg et al. (1985) which seemed to show a greater absorption by oral route of an other phthalate DEHP in young Sprague Dawley rats than in older ones. The 100% bioavailability was also assumed by the CSTEE for calculation of oral exposure in children.
• Inhalation internal exposure: 75% for inhalation exposure in adults by analogy with DIDP (see DIDP risk assessment report, Section 4.1.2.1 Toxicokinetics, metabolism and distribution), 100% assumed for newborns and infants, considered to be in any case a vulnerable sub-population.
Dermal internal exposure is derived from an experiment in rats designed to model the dermal exposure and absorption through direct contact with a plastic film containing DEHP (Deisinger et al., 1998). This study is considered more appropriate for consumer exposure than the dermal absorption study performed with application of the substance as such (Midland Research Institute, 1983). For consumers, no correction factor is used to extrapolate from rats to humans. As it has been showed that DIDP is 10 times less absorbed through the skin than DEHP (Elsisi et al., 1989) and because of the physico-chemical similarities between DIDP and DINP, a factor of 10 is also assumed to extrapolate from DEHP to DINP.
4.1.1.3.2 Scenario 1: Toys and baby equipment
DINP is the major replacement product of DEHP in PVC toys and baby equipment. Two routes of exposure are mainly of concern with those PVC toys: the dermal route during the handling of toys by babies and the oral route during their chewing and biting.
Oral exposure
A few tests of migration of DINP to saliva or simulant have been realised. Methods used are quite different:
• various simulants, • various extraction methods from the toy and from the solution obtained, • various methods of dosage: GC/MS or HPLC/UV.
So it seems difficult to compare results.
Four methods are available in details: STEINER et al. (1998), RIVM (1998), LGC (1998), CPSC (1998).
In Steiner et al. (1998), most of experiments were made on PVC teethers containing about 36% DINP. The purpose of this study was to determine the release of DINP from PVC sheets and PVC toys into saliva in practical experiments by using voluntary test persons and in experiments using a saliva simulant.
129

EU RISK ASSESSMENT REPORT – DINP FINAL REPORT, 2003
The average value of migration from toy to saliva during a one-hour sucking test was 830 µg/dm2 (13.8 µg/dm2/min).
In experiments where the toy was shaken during 3 hours in a simulant with an ultrasonic bath, the mean value of migration was about 830 µg/dm2 (607-1162 µg/dm2) corresponding to 4.6 µg/dm2/min.
In RIVM (1998), the following experiments have been carried out:
• a human volunteer study to assess release rates of DINP from PVC samples to saliva (DINP concentration in PVC sheets is about 38%; DINP concentration in toys sampled is 43%),
• a child observation study to determine the oral contact time of young children with baby toys,
• an in vitro study with a simulant of saliva to develop a routine laboratory method to determine the release rate of DINP from soft PVC baby toys.
The study by LGC (1998) is an in vitro study based on agitation of a piece of PVC toys (containing 40% DINP) in a saliva simulant solution. The mean DINP migration values ranges from 0.08 to 0.11 µg/min.
In the volunteers study, the average levels of release of the three toys tested were: 1.4 µg/min, 2.4 µg/min and 1.6 µg/min, respectively (ranging from 0.3 to 8.3 µg/min; from 0.9 to 8.9 µg/min and from 0.9 to 5.7 µg/min, respectively).
In the in vitro study, two specimens were tested. With the chosen conditions, the average release rate is 3 ± 1 µg/min and is of the same order of magnitude as in the human volunteers experiment (1.4 ± 1.2 µg/min and 1.6 ± 1.0 µg/min, respectively).
Studies performed by the RIVM have been conducted according to the ICH guidelines for good clinical practices.
CPSC (1998) conducted studies with adult volunteers and in vitro studies with simulants of saliva to compare the migration rate measured in vivo and those measured by impaction methods. Toys which were tested contained 15 to 54% DINP. DINP migration rates by the impaction method with saliva simulant ranged from 1.0 to 48.4 µg/h for an area of 11 cm2. Migration rates were not correlated with the DINP content. There was no correlation between the migration rate and the manufacturing process or the sample thickness. Studies with human subjects were performed using disks with a surface area of approximately 10.3 cm2. The ratio between the in vivo and impaction methods measured migration rates averaged 39.5 with a range of 22.9 to 72.6. Estimated oral exposures were calculated from the migration rate, body weight and mouthing duration. Data from the RIVM study were used to estimate the duration of mouthing activity in young children. The estimated exposure of children to DINP in teethers, rattles and toys is 50.1-225.6 µg/kg/day in children 3 to 12 months old and 4.4-16.2 µg/kg/day in children 13 to 26 months old.
Since the weight of children increases and the mouthing time decreases with increasing age, the exposure (expressed as mg/kg bw/day) is highest for young children aged 3-12 months and is considerably lower for 3 years old children.
Three studies concerning the release of DINP from toys are used in this assessment as they were performed on human saliva: Steiner (1998), RIVM (1998) and CPSC (1998). The exposure is estimated using the following calculation:
130

CHAPTER 4. HUMAN HEALTH
release of DINP from toys.leaching time daily intake = bodyweight
and the assumption that young children put a product surface area of 10 cm2 area in the mouth (LGC, 1998), a daily leaching time of 3 hours and a mean bodyweight of 8 kg. The criteria used for calculation are those suggested by the CSTEE (1998).
Table 4.1 Oral daily intake estimation from toys 1
Study Release of DINP by toys (µg/10 cm2/min)
Bodyweight (kg) Leaching time Daily intake (µg/kg bw/d)
STEINER et al. (1998) 1.38 1) 8 3 h 31
RIVM (1998) 8.9 2) 8 3 h 200
CPSC (1998) 225.6 3)
1) average 2) highest value 3) calculated by CPSC (1998) Data from the RIVM (1998) are consistent with those of CPSC (1998) and may be more representative of the european market of toys and baby equipment. So, for the exposure assessment, we will use the data from the RIVM (1998), this leads to a daily ingestion of 200 µg/kg/day. Given the 100% bioavailability assumed by oral route for young children, an internal oral exposure of 200 µg/kg bw/day is retained for risk assessment.
As the major source of exposure is toys (about 80% of the whole exposure for infants and newborns, see Section 4.1.1.3.7, Conclusion of consumer exposure), it would be of interest to have validated analytical methods to check exposure from toys for those populations.
Dermal exposure
The dermal route of exposure is linked to absorption through the skin of the hands and through the lips of the child. DINP is partially dissolved in the saliva present on the hands and the mouth which can increase the amount of phthalate available for dermal absorption.
The amount of DINP a child is exposed to, is function of the area of skin in contact with the product, the duration of the contact, the surface availability of DINP from the product and the penetration of DINP through the skin.
A study was performed by Deisinger et al. (1998). It investigated the migration of DEHP contained as a plasticiser in PVC from plastic film and its absorption through rat skin in vivo. Sheets of PVC film (15 cm2) plasticised with DEHP were applied to the shaved backs of 8 male rats in two separate experiments. According to this study, dermal absorption of DEHP in rats is 0.24 µg/cm2/h. As it has been shown that DIDP is 10 times less absorbed through the skin than DEHP (Elsisi et al., 1989) and because of the physico-chemical similarities between DIDP and DINP, a factor of 10 is assumed to extrapolate from DEHP to DINP. For consumers no correction factor is used to extrapolate from rats to humans.
For a child weighing 8 kg, handling the toy during 3 hours a day (CSTEE, 1998), if the contact surface is 100 cm2, the skin penetration of DINP would be:
0.24.100.3=1 µg/kg bw/d
131

EU RISK ASSESSMENT REPORT – DINP FINAL REPORT, 2003
8.10 A maximum internal dermal exposure to DINP in toys of 1 µg/kg bw/d will be retained for the risk assessment.
4.1.1.3.3 Scenario 2: Food and food-related uses
Phthalates can occur as a contaminant of food via food packaging and food processing. They are used as plasticisers in printing inks for flexible food packaging. A study from MAFF (1995) evidenced that phthalates present in papers and board packaging for food are essentially DBP and DEHP. They were found in bakery products and snacks, confectionery, meat and fish products, fats, pasta and cereals, dried fruits, flour and sugar, cheese, miscellaneous.
In France, DINP is authorised for food packaging if the release does not exceed 1.8 mg/kg (CAS 28553-12-0) (Journal officiel, 1994). Phthalates are fat soluble and they can migrate in milk products: cheese, butter (MAFF, 1996a).
Few measurements of phthalates in food have been reported which are used in this section to tentatively assess consumer exposure from food. Three groups of consumers will be considered:
• Adults (adults and children 3-15 years old), • newborns, • infants as infant formulae are surveyed for phthalates contamination because of the fatty
content of milk.
Adults
Sharman et al. (1994) determined the level of total phthalates in dairy products from 3 European countries (Norway, Spain and United Kingdom). In Norway, concentrations of DEHP and total phthalates in milk and cream samples were obtained at different stages in the collection, processing and distribution chain from a Norwegian dairy. In the United Kingdom, retail milk, cream, cheese, butter and margarine samples were analysed for DEHP and total phthalates. In Spain, retail milk and cream samples were tested. DEHP concentration ranges from less than 0.01 to 0.55 mg/kg in milk; from 0.20 to 2.7 mg/kg in cream 356% fat; from 0.2 to 16.8 mg/kg in retail cheese; from 2.5 to 7.4 mg/kg in butter. Total phthalate concentration expressed as DEHP ranges from less than 0.04 to 3.23 mg/kg in milk; from 0.72 to 19 mg/kg in cream 356% fat; from 2,4 to 114.4 mg/kg in retail cheese; from 4.8 to 55.6 mg/kg in butter. The ratio DEHP/total phthalates concentrations were calculated and ranged from 1 to 120%. DINP was not searched in this study.
In 1996, MAFF's Food Safety Directorate carried out a survey of the levels of DEHP and total phthalates in samples of composite fatty foods. Samples consisted of retail food products including: carcass meat, meat products, offal, poultry, eggs, fish, fats and oils, milk and milk products. The study was carried out using stored samples of food that had been collected in 1993. Estimates of high level (97.5th percentile) dietary intakes of total phthalates ranged from 0.4 to 1.6 mg/person/day expressed as dimethyl phthalate. The dietary intakes of DEHP were estimated to 0.30 mg/person/day, i.e 5 µg/kg bw/d for an adult.
DINP was not detected in the conditions of analysis (limit of detection = 0.01 mg/kg of food). Considering the detection limit, if we assume a food intake per day of 1 kg for an adult of 60 kg, the daily intake of DINP from food would be < 0.17 µg/kg bw/d. In the Sharman study, samples
132

CHAPTER 4. HUMAN HEALTH
consisted only in products derived from milk and are not so various as in the MAFF study. Therefore, the value of 0.2 µg/kg bw/d derived upon the detection limit of the MAFF study will be used as the adult daily intake from food. A bioavailability of 50% has been considered for oral exposure in adults so an internal exposure of 0.1 µg/kg bw/d will be put forward to the risk characterisation.
Newborns and infants
A recent MAFF survey estimated the intakes of individual phthalates and total phthalates by infants from infant formulae (MAFF, 1996b). A total of 59 individual samples of 15 different brands were analysed. In a more recent MAFF study (MAFF, 1998) a total of 39 individual samples of 14 different infant formulae were analysed.
In these studies (MAFF, 1996b, 1998), MAFF has confirmed that DINP was not detected with a detection limit of 0.1 mg/kg dry powder.
The exposure to DINP through infant formulae at different ages is shown in Table 4.12. The daily intake of the infant formulae is based on the recommendations given in the package of the product and information on the declared weight of the formulae per scoop. MAFF (personal communication, 2000) provided manufacturer's feeding guides on the packaging of the infant formulae products. The one used to estimate dietary exposure was chosen based on the proper schedule of ages, with declared weight of scoop of 4.4 g powder. Comparable approach than in DEHP risk assessment report was adopted.
Table 4.1 Infant and newborn exposure to DINP in infant formulae depending on ages 2
Age DINP conc. (mg/kg dry weight
powder) *
Bw (kg) Daily intake of formulae (g)
Total volume of water used to make up the
formulae (ml)
Exposure to DINP (mg/kg/d)
0-1 week 0.1 3 79 510 0.0026
1-4 weeks 0.1 3.5 88 575 0.0025
1-2 months 0.1 4.5 110 700 0.0024
3 months 0.1 5.5 132 850 0.0024
4 months 0.1 6.5 154 1,000 0.0024
5-6 months 0.1 7.5 176 1,125 0.0023
0.1 8 141 900 0.0018
0-6 months ** 0.1 5.5 131 894 0.0024
> 6 months
* 0.1mg/kg dry weight powder: detection limit, used as recommended ** mean for 0-6 months.
For newborns (0-6 months) and for infants (>6 months), the exposure to DINP derived from infant formulae consumption corresponds, respectively to 0.0024 mg/kg/d and 0.0018 mg/kg/d, both will be used for risk assessment as mentioned below.
Newborns
For newborns, considering the detection limit of 0.1 mg/kg dry powder, assuming a food intake per day of 0.131 kg of powder of infant formulae each day (MAFF data) by a newborn weighing
133

EU RISK ASSESSMENT REPORT – DINP FINAL REPORT, 2003
5.5 kg, the value of 2.4 µg/kg/day can be used as the newborn daily intake from food. A bioavailability of 100% has been considered for oral exposure in newborns so an internal exposure of 2.4 µg/kg bw/d will be put forward to the risk characterisation.
Infants
As for newborns the same estimation based on the detection limit of 0.1 mg/kg dry powder in the MAFF studies (MAFF, 1996b, 1998) can be proposed for infant daily intake calculation. Assuming a food intake per day of 0.141 kg powder from infant formulae (see Table 4.12) by an infant weighing 8 kg, the value of 1.8 µg/kg/day can be used as the infant daily intake from infant formulae.
Infants are in a phase of diversification of their diet. In complement of infant formulae, an infant eats the same type of food as an adult but in a smaller quantity. Assuming that an infant may eat three times less than an adult, taking into account that the DINP contribution for an adult from food was 0.2 µg/kg/day e.g. 12 µg/day, an infant will ingest:
12 3.8
0.5 µg/kg bw/day
So the total contribution of food to the oral exposure in infants is 2.3 µg/kg bw/d. Assuming a bioavailability of 100% for oral exposure in infants, an internal exposure of 2.3 µg/kg bw/d for the total contribution of food will be put forward to the risk characterisation.
Conclusion for food and food related-uses
For the risk assessment, the values based on DINP concentrations under the detection limit will be used:
Adults and children 3-15 years old 0.1 µg/kg bw/day Newborns (0-6 months old) 2.4 µg/kg bw/day Infants (6 months to 3 years old) 2.3 µg/kg bw/day
Food habits of consumers can vary greatly from a country to another and from a social category of consumers to another, leading to the consumption of few or many food packaged in plastic materials with various methods of cooking. So, it could also be of interest to perform further measurements of DINP in various foodstuffs, including infant formulas, and to relate the results with food habits in Europe to assess the real exposure to DINP via food.
As DINP has been widely used as a substitute for DEHP, in particular in toys, it may be hypothesised that the same scenario is likely to occur in food packaging. Therefore an hypothetical scenario for replacement of DEHP by DINP in food contact materials has been included in Appendix A for the three categories of consumers.
Other data on the contamination of food by phthalates are mentioned in the “humans exposed via the environment” part.
4.1.1.3.4 Scenario 3: Building materials and furniture
The use of phthalates in the manufacture of building materials and furniture can lead to consumer indoor exposure.
134

CHAPTER 4. HUMAN HEALTH
The level of exposure will depend on many parameters:
• the surface of the rooms covered with PVC materials plasticised by DINP, • the total volume of the rooms.
Furthermore, it is not possible to evaluate the quantity of DINP released by end use products present indoor containing DINP (furniture, seats, clothes, handbags, shoes...). The estimation of exposures should also reflect living conditions in countries of North and South Europe, where climates are quite different with highest temperatures in South Europe.
In a 1996 study, air concentrations of DINP in a laboratory with coatings containing DINP were determined to be 0.66 µg/m3 (Menzel, 1996).
In a more recent survey, few indoor air samples (n = 23) from Belgium were collected and analysed for selected phthalates (Research Institute for Chromatography, 2000). The indoor locations investigated included a sports hall (n = 5), a kindergarten classroom (n = 4), a residential home containing PVC flooring (n = 2), a retail carpet and flooring store (n = 1), a laboratory (n = 5), a greenhouse (n = 1) and an underground park (n = 5). The DINP concentrations vary from 7 to < 36 ng/m3. The validation of the sampling method and analysis was described by Tienpont et al. (2000). Only a summary of the results was provided, more information about temperature conditions in the rooms and features of these rooms (amount of PVC end products) are necessary to assess the relevance of the results.
There is no other study measuring the indoor exposure to DINP.
A study conducted to determine the amount of DEHP bound particles in residential air in Norway has been reported (Oie, 1997). The vapour phase exposure was not measured but reference to calculate exposure was made. Based upon vapour phase exposure and their measurements, the authors tentatively suggested that exposure via the particulate phase is 1-3 fold greater than exposure from the vapour phase. This is supported by the findings that: • DEHP can migrate from and into different matrices, • substances with a low vapour pressure are readily absorbed to particles, • total air concentrations of DEHP has been shown to exceed the saturated vapour pressure by
100-fold (Wams, 1987). Given the limited measured data, a worst-case exposure can be calculated using DINP saturated vapour pressure at 20°C: 10 µg/m3 (cf Section 4.1.1.2.). As suggested for DEHP, the amount of DINP associated with particles may be estimated three times higher than the amount of DINP present as vapour in the air (i.e. 40 µg/m3). Therefore, it may be assumed that the human indoor exposure represents the vapour exposure in air and three times this value for DINP bound to dust particles. Based upon a daily inhalation volume for adults of 20 m3 (Vi), the assumption that 20 (ti) of 24 hours are spent indoors daily (IPCS, 1997), and a mean body weight (W) of 60 kg for an adult, the daily intake by this source of exposure can be estimated to be:
135

EU RISK ASSESSMENT REPORT – DINP FINAL REPORT, 2003
10.Vi.ti 10.20.20.4
24.W 24.60 11.1 µg/kg/day
10.Vi.ti
Considering 75% bioavailability for adults, the internal exposure would be: 11.1.0.75 = 8.3 µg/kg bw/day. This value will be used for risk assessment.
As young children crawl, they are nearer the floor and so they are nearer the source of emission of DINP in case of PVC floor-coating. So, for estimation of the quantity of DINP inhaled daily, the same model as for adults can be used but considering that the child spends 22 h/day indoor as a conservative hypothesis. The mean weight of a 0-3 years old child is 8 kg (W), the mean daily inhalation volume for infants is 9.3 m3 (Vi) (IPCS, 1997). So, the daily intake by this source of exposure can be estimated to be:
10.9.3.22.4 24.W 24.8
42.6 µg/kg/day
A bioavailability of 100% has been considered for inhalation exposure in children so an internal exposure of 42.6 µg/kg bw/d for indoor exposure will be put forward to the risk characterisation.
For young children, PVC exposure can occur via the contact with the floor as they get down crawling. Young children also lean against the wallpapers. In young children who frequently put the hand in the mouth, saliva will increase the release of DINP from all PVC object in contact with hands. So, building materials can be involved in a dermal and an oral absorption for this category of consumers.
DINP can also be absorbed through the skin of the hands and of the forearms when adults are washing the floor: the dirty water contains DINP that has been released by the PVC floor during the washing.
4.1.1.3.5 Scenario 4: Car and public transport interior
DINP can be released during fogging (when sheets of PVC as dashboard, doors trim, seats are heated by the sun).
Limited measured data are available from a recent survey (Research Institute for Chromatography, 2000). Few inside car samples (n = 3) were collected and analysed for selected phthalates. The concentration of DINP did not exceed 20 ng/m3. There is no other measured data about DINP concentration in the air of public transport or cars.
Given the limited measured data, a worst-case exposure can be calculated using DINP saturated vapour pressure at 20°C: 10 µg/m3 (cf. Section 4.1.1.2). Release is dependent on the temperature inside the car and can be greatly higher in countries of the South Europe during the summer period when the car is parked in the sunlight. It will be multiplied by 4 to include particulate-bound DINP (i.e. 40 µg/m3) (cf. Section 4.1.1.3.4).
Based upon a daily inhalation volume for adults of 20 m3 (Vi), the assumption that 4 (ti) of 24 hours are spent in public transport or cars daily and a mean body weight (W) of 60 kg for an adult, the daily intake by this source of exposure can be estimated to be:
136

CHAPTER 4. HUMAN HEALTH
10.Vi.ti 10.20.4.4 24.W
2.2 µg/kg/day 24.60
Considering 75% bioavailability, the adult internal exposure would be: 2.2.0.75 = 1.7 µg/kg/day. This value will be used for risk assessment.
Based upon a daily inhalation volume for children of 9.3 m3 (Vi), the assumption that 2 (ti) of 24 hours are spent in public transport or cars daily and a mean body weight (W) of 8 kg, the daily intake by this source of exposure can be estimated to be:
10.Vi.ti 10.9.3.2.4 24.W 24.8
3.9 µg/kg/day
A bioavailability of 100% has been considered for inhalation exposure in children so an internal exposure of 3.9 µg/kg bw/d for indoor exposure will be put forward to the risk characterisation.
4.1.1.3.6 Scenario 5: Clothing, gloves and footwear
DINP is used in a variety of products which are in contact with human skin. These products include articles made of fabric coated by flexible PVC containing DINP (clothing as rain wear, rainwear, clothes in artificial leather or in fleecy materials, plastic gloves, footwear as high boots and shoes in synthetic leather). The quantity of human exposure to DINP is function of the skin area in contact with the product, the duration of the contact, the surface availability of DINP from the product and the percutaneous absorption of DINP through the skin.
An estimation can be performed for PVC gloves used by adults with the same model as for dermal exposure to toys.
According to the study of Deisinger et al. (1998), for an adult weighing 60 kg, wearing the gloves during 2 hours a day, assuming a contact surface of 840 cm2 (two hands), the skin penetration of DINP would be:
0.24.840.2 60.10 = 0.7 µg/kg/day
The value of 0.7 µg/kg/day will be used for the risk assessment.
4.1.1.3.7 Conclusion of consumer exposure
Combined exposure of adult, infant and newborn consumers by multiple sources is possible. For adults, it seems realistic to keep only the combined exposure to all identified sources for risk characterisation purposes. For infants and newborns, two possibilities have been assumed, one without toys and the other one with toys (dermal and ingestion) in order to assess the part the toys can play in child exposure.
It should be noted that the duration of exposure assumed for the scenario “building materials and furniture” and “car and public transport interior” are very conservative: they imply that an adult or a child is either in a building or in a car, never outdoor.
137

EU RISK ASSESSMENT REPORT – DINP FINAL REPORT, 2003
Routes of exposure to DINP are various because the use of PVC is ubiquitous. It is difficult to assess which is the percentage of this plasticiser in all PVC compounds as it can be used in mixtures with other phthalates. So, the risk assessment will have to consider if effects of these phthalates are additive or if a synergetic effect is able to occur when phthalates are in mixture.
3Table 4.1 Conclusion of consumer exposure
Sources External and internal exposure
Adults Newborns 0 – 6 months old Infants 6 months - 3 years old
External exposure
Internal exposure (µg/kg/d)
External Exposure
Internal exposure (µg/kg/d)
External Exposure
Internal exposure (µg/kg/d)
Building materials and furniture 40 µg/m3 * 8.3 a) 40 µg/m3 * 42.6 c) 42.6 c) 40 µg/m3 *
Car and public transport interiors 40 µg/m3 * 1.7 a) 40 µg/m3 * 3.9 c) 40 µg/m3 * 3.9 c)
Clothing, gloves and footwear 0.7 Not estimated
0.2 µg/kg/d 0.1 b) 2.4 µg/kg/d 2.3
Total without toys 10.8 48.9 48.8
Toys and teething rings: oral exposure dermal exposure
200
200 c)
1
200
200 c)
1
Total with toys 249.9
Food and food-related uses 2.4 2.3 µg/kg /d
249.8
a) A bioavailability of 75% is considered for the inhalation route in adults b) A bioavailability of 50% is considered for the oral route in adults c) A bioavailability of 100% is considered for infants 6 months to 3 years old and for newborns 0 to 6 months old for oral and respiratory routes * Concentration in air
4.1.1.4 Humans exposed via the environment
Adults exposure (corresponding to adults and children 3-15 years)
The estimation of the indirect exposure of humans via the environment is presented in the EUSES calculations. It should be noted that in most of the PEC calculations, the porewater concentration is higher than the water solubility of the substance (cf. Table 3.22). This throws some doubt over the estimation methods used. The soil porewater concentration is used for the estimation of the exposure of man via the environment, particularly from root crops. One approach to this problem is to limit the soil porewater concentration to the water solubility of the substance.
The total daily intake based on the local environmental concentrations due to the different uses is presented in Table 4.14.
138

CHAPTER 4. HUMAN HEALTH
Table 4.14 Total daily intake of adults due to local environmental exposures
Life cycle step DOSEtot (mg/kg bw/d)
Production 0.002
Use in PVC 0.028
Use in non-PVC polymers 0.018
Formulation of sealing compounds 0.026
Use of sealing compounds 0.001
Formulation of paper inks 0.026
Processing of paper inks 0.004
Paper recycling 0.004
Formulation of paints 0.026
Processing of paints 0.005
Based on the regional concentrations, the total daily intake for humans is 0.001 mg/kg bw/d.
The local exposure is approximately equal for the use in polymers, the formulation of sealing compounds, paper inks and paints. The highest intake is expected through root crops, followed by fish (cf. EUSES calculations).
As shown in Section 4.1.1.3.3, results from monitoring studies in carcass meat, meat products, offal, poultry, eggs, fish, fats and oils, milk and milk products can be used to estimate a maximum exposure of 0.0002 mg/kg bw/d, based on the detection limit for DINP. This is very much lower than the estimated daily doses based on local exposure but very close to the estimated regional exposure. On the other hand, no monitoring data are available for root crops, which according to the exposure models is the main source of DINP to humans exposed via the environment. The estimated maximum total daily intake of 0.028 mg/kg bw/d will therefore also be used in the risk characterisation.
Infants exposure (0.5-3 years old)
As for DEHP an increased sensitivity and bioavailability are likely to occur in young animals, it appears necessary to estimate the specific exposure to children via the environment.
Children are exposed by multiple pathways. For example, consumer’s children are exposed to different sources (e.g. toys, indoor air, and car interiors) by different routes and extents of exposure. Therefore to determine the combined exposure, it is necessary to separately determine the extent of exposure via the environment.
The assessment of the exposure to newborns (0-6 months) is probably not relevant, as their diet consists mainly of milk. The contribution through milk in the overall exposure is very low compared to other routes, as shown above for adults. The assessment for children will therefore focus on 0.5-3 year old children who have a more varied diet.
In Table 4.15 the proposed infant characterisation (0.5-3 years old), with regard to food intake, for the estimation of the exposure via the environment is presented (EC, 2001). These values are clearly worst-case values for each food type. The overall food basket is clearly not realistic. But as seen for adults, the exposure is mainly due to one or two exposure routes and therefore a preliminary exposure assessment can be performed with the food basket below.
139

EU RISK ASSESSMENT REPORT – DINP FINAL REPORT, 2003
Table 4.15 Infant characteristics for input in EUSES calculation
Adult % of adult Child
Daily intake of drinking water 2 l/d 50% 1.0 l/d
Daily intake of fish 0.115 kg/d 73% 0.084 kg/d
Daily intake of leaf crops 1.2 kg/d 50% 0.60 kg/d
Daily intake of root crops 0.384 kg/d 50% 0.192 kg/d
Daily intake of meat 0.301 kg/d 76% 0.229 kg/d
1.333 kg/d 126% 1.68 kg/d
Inhalation rate 20 m3/d 46.5% 1) 9.3 m3/d
Body weight 70 kg 11.4% 8.0 kg
Daily intake of dairy products
1) Respiratory volume: 0.5- <3 years human=168 L/h; Times light activity factor for male=2.3; 2.3.1.68.24=9.3 m3/d
Table 4.16 Total daily intake for infants due to local environmental exposures
Life cycle step
Based on the food basket proposed above, the exposure to infants for the different exposure scenarios is summarised in Table 4.16.
DOSEtot (mg/kg bw/d)
Production 0.013
Use in PVC 0.156
Use in non-PVC polymers 0.087
Formulation of sealing compounds 0.141
Use of sealing compounds 0.006
Formulation of paper inks 0.141
Processing of paper inks 0.020
Paper recycling 0.021
Formulation of paints 0.141
Processing of paints 0.024
Based on the regional concentrations, the total daily intake for infants is 0.0065 mg/kg bw/d.
The exposure is almost exclusively due to intake of fish and root crops. The other routes are almost negligible.
As shown in Section 4.1.1.3.3, results from monitoring studies in carcass meat, meat products, offal, poultry, eggs, fish, fats and oils, milk and milk products can be used to estimate a maximum exposure of 0.0069 mg/kg bw/d, based on the detection limit for DINP. This is very much lower than the estimated daily doses based on local exposure but very close to the estimated regional exposure. On the other hand, no monitoring data are available for root crops, which according to the exposure models is the main source of DINP to humans exposed via the environment. The estimated maximum total daily intake of 0.156 mg/kg bw/d will therefore also be used in the risk characterisation.
140

CHAPTER 4. HUMAN HEALTH
4.1.1.5 Combined exposure
Combined exposure of different populations may occur. The worst cases combined exposure would be:
• an adult (from 16 years old) exposed from occupational and consumer sources and indirectly via environment,
• a child (3-15 years old) exposed from consumer sources and indirectly via environment, • an infant (0.5 to 3 years old) exposed from consumer sources (including toys) and indirectly
via environment.
The newborn (0-6 months) combined exposure is not assessed, because this population is only considered in the consumer part.
The total exposure is the sum of all specific exposures from all sources by all routes.
Table 4.17 Combined exposure
Internal exposure (mg/kg bw/d) Sources of exposure
Adults Children Infants
Occupational sources 1.10
Consumer sources (with toys for infants)
0.01 0.01 0.25
Via the environment 0.01 0.01 0.16
0.02 0.41 Total 1.12
The total combined exposure may be higher because all sources of human exposure have not been quantified. For adults, it should be noted that the exposure durations used for exposure estimation are not always consistent (8 hours for occupational exposure, 20 hours for building and furniture, 2 hours for gloves…) but it is not recognised as a concern because adult combined exposure results mainly from occupational exposure.
141

EU RISK ASSESSMENT REPORT – DINP FINAL REPORT, 2003
4.1.2 Effect Assessment: Hazard identification and dose (concentration)-response (effect) assessment
Good Laboratory Practices (GLP) statements were checked for all studies. When available, the information has been provided. Otherwise, no comment is made.
4.1.2.1 Toxicokinetics, metabolism and distribution
During the six-day period, all the animals exhibited a normal behaviour. All animals gained weight during the five-day period when they were given the cold compound. During the 72 hours after the administration of the "hot" compound, one test animal and one control animal lost weight, and the test animals consumed more food and excreted more feces than the controls, but the controls excreted more urine than the test animals.
4.1.2.1.1 Oral exposure
Metabolism study (Hazleton, 1972)
This study was designed to assess the extent of gastrointestinal absorption, the distribution in selected tissues, and the rate and routes of excretion of [14C] DINP (CAS 68515-48-0) following oral administration to male albino rats weighing approximately 200 grams each (4 treated rats, 2 controls). Four animals received 0.5 ml of "cold" compound daily for five days and on the sixth day, they were dosed via oral intubation with 0.5 ml of "hot" compound (about 2,500 mg/kg/d). Expired gases, fecal and urinary excreta were collected separately, at 12 hours intervals, during the entire study period (72 hours). Recordings were made of animal appearance and behaviour, body weights, volumes of urine excreted, weights of feces excreted, and amounts of food consumed. Seventy-two hours after intubation, the animals were sacrificed and gross pathological observations were made. Blood and urine remaining in the bladder were collected. The hearts, livers, kidneys, intestines, stomachs and aliquots of fat and muscle were removed and weighed. The contents of the intestines and stomach were separated from their respective walls. The remaining viscera and carcass from each animal were combined and weighed.
The amount of compound excreted in the urine within 72 hours ranged from 8% to 18.34% of the administered dose. The majority of the radioactivity found was excreted in the first collection (12 hours). Thereafter, the amount of radioactivity found fell off rapidly so that by the 72-hour collection period less than 0.1% of the dose was found in all animals except in one animal.
Over 80% of the administered dose was excreted in the feces and most of the radioactivity was excreted within 24-hours after dosing. Between the 60- and 72-hour postdosage period no animal excreted over 0.2% of the administered dose.
At sacrifice the tissues and organs of all animals appeared normal when examined for gross pathological conditions. No tissue studied had over 0.001% per gram of the administered dose. On a total sample basis, residual amounts of radioactivity were found in the gastrointestinal tract of each animal. Of the selected organs, the liver contained the most radioactivity (i.e. 0.010% mean). Most of the radioactivity retained by the animals was found in the carcass and remaining viscera (i.e. 0.060% of the administered dose).
No expired [14C] DINP was detected.
142

CHAPTER 4. HUMAN HEALTH
In male albino rats, a part of the given DINP is absorbed in GIT. However, considering the high level of dosing (2,500 mg/kg/d) and the high level of radiaoctivity recovered in feces, the absorption process was probably saturated. Less than 0.5 was retained after 72 hours in the carcass, viscera and different tissues. Radioactivity was mainly recovered in GIT and liver. Orally administered [14C] DINP is rapidly excreted. The major route of excretion was via the feces with an average of 84.55% of the administered dose recovered over a 72-hour period. In urine, the average amount of radioactivity excreted was 12.05% (large interindividual variations). No expired [14C] DINP was detected.
Pharmacokinetic and metabolic behaviour (Midwest Research Institute, 1983a)
The pharmacokinetic and metabolic behaviour of [14C]-diisononyl phthalate (DINP CAS 68515-48-0, 97-98% pure) were investigated in male and female Fischer 344 rats treated with a single oral dose of 50 or 500 mg/kg, and in male rats treated with five daily oral doses of 50, 150 and 500 mg/kg. Elimination of radioactivity in urine and feces was examined for up to 72 hours after the last dose. Blood and tissue levels of radioactivity were determined in male rats sacrificed at 1, 4, 8, 24 and 72 hours and in females sacrificed at 24 hours. Liver tissues were subjected to subcellular fractionation and [14C] contents in selected tissues (liver, testes and fat) were examined by HPLC.
In male rats receiving a single dose of [14C]-DINP, levels of radioactivity in blood and most tissues were highest at 1 hour following administration of both doses. The highest levels were demonstrated in liver (4.7 ± 0.07% of administered dose ∼53 µg Equiv/g), followed by kidneys (0.31 ± 0.03% ∼13µg Equiv./g), then blood (1.62 ± 0.07% ∼11.6 µg Equiv./g). At all times examined, most of the blood radioactivity was recovered in the plasma, in liver radioactivity was localised primarily in the cytosol. Radioactivity rapidly disappeared from blood, liver and kidney, reaching low levels at 72 hours (less than 0.05% of administered dose in the liver). Rates of disappearance from other tissues were slower. The levels in tissues were generally similar in the males and females treated at either dose level. For the high dose, a lower percentage of recovery in liver concurrently with a higher recovery in other tissues and a lower liver/blood ratio could be indicative of a limited or saturated liver uptake.
In male and female rats, the entire administered radioactivity was essentially eliminated in urine (~ 49% at low dose, ~ 39% at high dose) and feces (~ 51% at either dose) within 72 hours after dosing; the major portions were eliminated within the first 24 hours. After the low dose, excretion in urine was initially higher than in feces, but by 72 hours, equal amounts were recovered in each. Following the high dose, elimination in urine and feces was initially equal (~ 38% at 24 hours), but excretion in feces at 72-hours exceeded that in urine (~ 52% and ~ 39%, respectively). In female rats, urinary and fecal excretion following the low or high doses was similar to that demonstrated for male rats.
HPLC analyses of urine collected from male rats between 0-8 hours following a single dose of [14C]-DINP showed a major portion of the radioactivity (up to 28%) corresponding to phthalic acid and a minor amount (up to 7%) eluting at the origin of the chromatogram (polar component 4). Most of the radioactivity recovered (58-83%) eluted as a broad peak more polar than the monoester (monoisononyl phthalate, MINP). This peak, tentatively identified as side
4 The identity of the polar component has not been resolved. No changes in profiles after an incubation of urine
with ß-glucoronidase and aryl sulfatase demonstrated that this substance is probably not a glucuronide or sulfate. This component coeluted with 14C-sodium carbonate. Generation of carbon dioxide from phthalic acid seems unlikely but could be explained by bacterial oxidation occuring during urinary storage or analysis.
143

EU RISK ASSESSMENT REPORT – DINP FINAL REPORT, 2003
chain oxidation products of MINP (MINPox), was present in higher amounts in urine collected between 8 and 24 hours (there was a decrease of the amount of Phthalic Acid (PA) recovered and levels equivalent for polar component). Elimination of phthalic acid was dose-dependent and decreased in urine of rats treated with the high dose. Urine collected from female rats showed similar profiles to those of males. In all urine samples, the monoester and diester were absent or present only in trace amounts.
In feces, 8 and 41% of the radioactivity was associated with the diester following treatment with the single low and high dose, respectively. The remainder eluted in the areas of the MINP and MINPox; phthalic acid was absent (high dose) or present in small amounts (low dose). No radioactivity was associated with the polar component. Fecal samples collected from female rats treated with the low dose showed minor quantitative differences from those of male rats, but following the high dose, the feces of female rats showed higher amounts of the parent compound and lower amounts of the oxidative metabolites. A quite similar distribution of the metabolites was observed in the GI tract, 83% of the radioactivity was associated with MINPox following a low dose of DINP administered (small quantities of DINP, MINP and PA were also recovered). For the high dose, more DINP and less MINPox were recovered in the GI tract.
In the liver, the major metabolites were MINP and MINPox whichever the dose administered. For the lower dose, a small amount of PA was recovered too. From 1 hour to 72 hours post exposure, progressive decrease of MINP and PA was observed concurrently with an increase of MINPox. For the higher dose, small amounts of DINP were recovered between 1-4 hours interval and only 1% of PA was recovered at 1 hour.
The major metabolites recovered in the testes of rats receiving one dose of [14C]-DINP include the monoester, its oxidation products, and the acid; small amounts of the polar component were also present. Slightly higher amounts of the monoester and lower amounts of the acid were recovered in testes of rats receiving the high dose. The parent compound was not detected from either dose level.
Fat collected from rats receiving a single low dose showed peaks corresponding to the monoester, its oxidation products, and traces of the polar component. The diester was detected only in fat collected from rats receiving the high dose.
Concentrations of radioactivity in blood and most tissues of rats sacrificed after 5 daily doses were highest at 1 hour following the last dose. The highest levels were demonstrated in liver followed by kidney, blood, then skin. Recovery of radioactivity in liver was higher for the lower doses, indicative of a limited absorption or a saturated liver uptake. Almost all of the administered radioactivity was recovered in urine and feces within 72 hours following the last dose; the major portions were eliminated within the first 48 hours. Excretion in urine was higher than in feces at the three dose levels. Studies on DINP metabolic profiles in feces indicated that fecal excretion represents a balance of unabsorbed DINP and the metabolites eliminated in bile.
In the urine, the major portions of radioactivity (79 to 91%) eluted as a broad peak corresponding to MINPox. The quantities of this metabolite in urine collected between 0 and 8 hours, or 8 and 24 hours, were similar, but were slightly higher in urine of rats receiving the high dose. Smaller amounts (up to 13%) of phthalic acid were recovered in urine; its excretion following repeated dosing showed no dose-dependence. The polar component was recovered in trace amounts following the high-dose level but represented up to 6% of urinary radioactivity following the low dose. The diester and the monoester were absent or present only in trace amounts at any dose.
144

CHAPTER 4. HUMAN HEALTH
The fecal radioactivity was divided between the diester, monoester, and the oxidation products; higher amounts of the diester were recovered following the high dose. Only trace amounts of phthalic acid and the polar component were recovered. A similar distribution was observed in the GI tract.
The livers contained major amounts of the monoester and its oxidation products. At later sacrifice times, most liver radioactivity (71 to 90%) corresponded to oxidation products. Only small amounts of phthalic acid and the polar component were detected, while the diester was absent or present only in trace amounts. The metabolic profiles in the liver were similar irrespective of dose.
The profiles from testes showed primarily oxidation products present in amounts up to 89% of the radioactivity following the high dose; small amounts of the monoester and phthalic acid were recovered. The diester and the polar component were absent or only occasionally present.
Fat from rats treated with five doses contained major amounts of the monoester and its oxidation products, and minor amounts of the diester; phthalic acid and the polar component were only occasionally detected.
Conclusion
In conclusion, these data indicate that a single low dose of [14C]-DINP administered orally to rats was readily absorbed (at least 49%), since metabolites recovered in faeces are the result of bile elimination, and distributed to major tissues, particularly the liver. Absorption was incomplete following a high dose of [14C]-DINP, and after repeated dosing of the compound at all dose levels. DINP metabolites were excreted in urine and to a lesser extent in feces. DINP was de-esterified to the monoester which was further metabolised by side-chain oxidation of the ester group or by hydrolysis to phthalic acid; the formation of oxidation products appeared to increase following the high dose, while hydrolysis to phthalic acid decreased. DINP metabolites reached testes at high dose and were detected in fat. Repeated dosing caused no accumulation of DINP and/or its metabolites in blood and tissue, but resulted in increased formation and elimination of the monoester-oxidation products.
4.1.2.1.2 Dermal exposure
In vivo
A dermal disposition study (Midwest Research Institute, 1983b) was performed to assess the absorption, tissue distribution and elimination of Diisononyl (Carboxyl-[14C]) phthalate (CAS 68515-48-0) applied dermally to adult male Fischer 344 rats. The [14C] labeled compound was applied as a neat material on the shaved backs of 3 groups of rats on a 3.4 cm area:
• the first group (non conditioned, 6 rats) received a single dermal application of [14C] DINP (0.2 ml/rat; ~ 1.2 ml/kg) which remained on the skin for the duration of the study,
• the second group (6 rats) was "conditioned" by pre-treatment with a dermal dose of non-labeled DINP (0.2 ml/rat; ~ 1.2 ml/kg), kept on the skin for 3 days then blotted off prior to application of the [14C] DINP (0.2 ml/rat; ~ 1.2 ml/kg),
• the third group (non-conditioned, 3 rats) received a single lower dermal application of [14C] DINP (0.1 ml/rat; ~ 0.6 ml/kg).
145

EU RISK ASSESSMENT REPORT – DINP FINAL REPORT, 2003
Following application, the back of each rat was fitted with a styrofoam cup lined with aluminium foil and secured in place with adhesive place for 1, 3 or 7 days depending on the time for sacrifice of rats.
Urine and feces were collected between 0–1, 1–2, 2–3, and 3–7 days following single-application treatment. After each collection, cages were rinsed and cage washings were measured. Two rats from each group receiving the 0.2 ml dose and one rat from the group receiving the 0.1 ml dose were sacrificed at 1, 3 and 7 days following single-application treatment. Levels of radioactivity were determined in excreta, gastrointestinal tracts, blood, skin from non-treated areas (i.e., ears), areas of skin application (and covers) and selected tissues (liver, kidneys, testes, fat and muscle). This study was carried out in compliance with GLP.
Absorption of [14C] DINP was slow as indicated by the recovery of only ca. 0.3% of applied dose in urine, feces, GI tract, and tissue at 24 hr following treatment. The rates of absorption increased slightly between 3 and 7 days following treatment, but total absorption at 7 days did not exceed 4% of the administered doses in rats receiving the high dose.
Most of the applied radioactivity was recovered from the application areas (92-103%). Blood and tissues contained low levels of radioactivity. Skin from non-application areas demonstrated the highest levels of radioactivity, compared to other tissues: from 0.06 to 0.78% of radioactivity higher than liver (0.01%), muscle (from 0.02 to 0.25%) or fat (0.02%).
No major differences were demonstrated in tissue levels or excretion rates of [14C] DINP in treated animals (conditioned or not). Under all treatment conditions used, the total amounts absorbed at the end of the study ranged from 2 to 4% of the applied dose. These amounts of radioactivity absorbed were lower than demonstrated for rats used in the preliminary studies where the total amounts absorbed i.e. recovered in the tissues, excreta and GI tracts ranged from 4.12 to 7.38% of the applied dose. In this preliminary study, the rat treated with the neat material (0.5 ml/kg) demonstrated higher recoveries in tissues and excreta than the other two rats treated with [14C] DINP dissolved in corn oil. The reasons for the higher absorption demonstrated in the preliminary studies are unknown.
Qualitatively, the results are very similar to those obtained for DIDP by Elsisi et al. (1989), but with recoveries compatible with the requirements of the OECD (1996) draft guideline (100% ± 10%).
Although it is possible that DINP applied to the skin was hydrolysed enzymatically or non-enzymatically to the monoester (and the acid), that was not examined in this study.
Dermal absorption of DINP (CAS 68515-48-0) in adult male Fischer 344 rats is slow. Under all treatment conditions, most of the applied radioactivity was recovered from the application areas (92-103%) and the total amount absorbed is low, during the 7-day period ranged from 2 to 4% of the applied doses. The demonstrated radioactivity in feces and GI tract suggests excretion of the absorbed radioactivity by the biliary route.
146

CHAPTER 4. HUMAN HEALTH
Table 4.18 Recovery of radioactivity following dermal application of [14C]-diisononyl phthalate in male Fischer 344 rats
Percent of Applied Dose
Conditioned ~ 1.2 ml/kg a) Non-conditioned ~ 1.2 ml/kg a) Non-conditioned ~ 0.6 ml/kg b)
1 day 3 days 7 days 1 day 3 days 7 days 1 day 3 days 7 days
Urine 0.07 0.58 1.94 0.09 1.46 1.06 0.09 0.50 1.11
Feces 0.02 0.25 1.10 0.03 0.83 0.54 0.01 0.16 0.91
GI tract 0.07 0.41 0.13 0.09 0.15 0.10 0.05 0.05 0.13
Blood 0.00 0.00 0.01 0.00 0.01 0.01 0.00 0.00 0.00
0.17 0.36 0.54 0.10 0.75 0.35 0.19 0.33 0.89
- Liver c) 0.00 0.02 0.01 0.00 0.02 0.01 0.00 0.01 0.01 - Kidney c) 0.00 0.00 0.00 0.00 0.00 0.00 0.00 0.00 0.01 - Testes c) 0.00 0.00 0.00 0.00 0.00 0.00 0.00 0.00 0.00 - Muscle c) 0.10 0.05 0.25 0.03 0.06 0.02 0.04 0.03 0.09 - Fat c) 0.01 0.01 0.03 0.00 0.01 0.05 0.02 0.02 0.02 - Skin c)d) 0.06 0.28 0.25 0.06 0.66 0.27 0.12 0.26 0.78 Total absorbed 0.33 1.60 3.71 0.31 3.20 2.07 0.35 1.04 3.06
Application area e)
99.12 99.67 94.04 96.25 98.33 100.94 95.98 92.74 93.50
Recovery 99.45 101.27 97.75 96.56 101.54 102.99 96.33 93.78 96.55
Tissue
a) Average of two rats per sacrifice period. b) One rat per sacrifice period. c) Percent of dose calculations are based on 7%, 40%, 7% and 16% of body weight for blood, muscle, fat and skin, respectively. d) Skin from non-treated areas (e.g. ear) e) Application area, which includes skin and cover, represents non-absorbed radioactivity.
14C-Carbonyl DEHP plasticised PVC (3.5 cm corresponding to about 400 mg DEHP) was held in close contact (24-hour exposure) with the clipped dorsal skin of male Fisher 344 rats (Deisinger et al., 1998). Two studies were realised in order to assess the long-term absorption, short-term absorption and effect of washing skin after exposure. The first study consisted in a 24-hour exposure followed by 6 days of sample collection. The second study consisted in a 24-hour exposure followed by immediate sacrifice of the rats. In this study, dermal exposure area was washed and rinsed 3 times with 40% aqueous solutions of pHistoderm.
For Study 1, total migrated DEHP was 0.06%. Total DEHP absorbed was 0.01% corresponding to urinary elimination (0.003%), fecal elimination (0.002%), cage wash (0.004% assumed to be urinary elimination) and carcass (0.002%). The systemic fraction absorbed from the total DEHP migrated represented 16%. The mean dermal absorption rate was calculated: 0.24 µg/cm2/hr.
For Study 2, total migrated DEHP was 0.13%. Total DEHP absorbed was 0.005% corresponding to urinary elimination (0.0004%), fecal elimination (0.0002%), cage wash (traces) and carcass (0.004%). The systemic fraction absorbed from the total DEHP migrated represented 3%. The mean dermal absorption rate was calculated: 0.24 µg/cm2/hr.
An overview of data available about phthalate skin penetration, in vitro or in vivo, in animals or in humans, has been deemed useful to draw the general tendency for the different phthalates in spite of different study protocols.
147

EU RISK ASSESSMENT REPORT – DINP FINAL REPORT, 2003
In vitro
Scott et al. (1987) measured in vitro absorption of some o-phthalate diesters (DMP to DEHP) through human abdominal and dorsal rat (Wistar-derived species) skin. In this in vitro technique, absorption is directly through the epidermis. The esters were applied directly (0.5 ml; 50 µl for [14C] DEHP) to the epidermal membranes (the epidermis was peeled away from the dermis) as neat liquids, in diffusion cells (of unspecified contact surface) whose donor surface was open to atmosphere. The receptor fluid was 50% aqueous ethanol, and contact time was 30 hours (72 for DEHP). Skin temperature was 30°C. In these conditions, they measured the steady state absorption rate of DEHP (the heaviest phthalate they tested) in human skin (epidermal membranes) as 5.59 ± 1.18 µg/cm2/h. This study may not be selected as a basis to evaluate the quantity of DINP that could be absorbed through the skin, because the receptor fluid was 50% v/v aqueous ethanol, which strongly increases the penetration rate, as was shown by Pelling et al. (1998).
Other in vitro results obtained in well-defined conditions have been presented in more recent papers by Mint and co-workers (Mint and Hotchkiss, 1993 and Mint et al., 1994). Neat phthalates were applied in a diffusion cell (contact surface 0.32 cm2) at doses around 20 mg/cm2, using either full thickness human breast skin or full thickness male F 344 rat dorsal skin, obtained by surgical separation. The receptor fluid was Hepes (11.9 g) + Hank’s balanced salt solution (19.6 g) with additives in order to maintain skin viability; sodium carbonate was also added to obtain a pH of 7.4. Temperature was 32°C, contact time 72 hours, and there was no significant difference between occluded or unoccluded conditions, for human as well as for rat skin. Seven diffusion cells were run concurrently for one single donor, generally 4 occluded and 3 unoccluded. Results are summarised in Table 4.19.
Table 4.1 Skin penetration properties of dimethyl- (DMP), diethyl- (DEP) and dibutyl- (DBP) phthalates 9(Mint and Hotchkiss, 1993; Mint et al., 1994)
Recovery (% of applied dose) S.SAR. Lag time
Receptor fluid Skin surface Within skin µg/cm2/h h
Hmn Rat Hmn Rat Hmn Rat Hmn Rat Hmn Rat
DMP 3.0 20.8 52.4 27.5 4.9 30.5 9.4 66.8 4 4
DEP 4.3 37.0 44.9 19.6 10.8 36.6 12.3 97.9 10 8
DBP 0.6 11.3 54.1 42.4 8 4.1 20.7 1.8 40.9 0
SSAR: steady state absorption rate; Hmn: human. Total recoveries (i.e. including diffusion cell and teflon cap) range from 97.3% to 106.5%.
Barber et al. (1992) studied in vitro percutaneous absorption of eight chemicals, of which DEHP, using full thickness abdominal Sprague-Dawley or F-344 rat skin, and human stratum corneum isolated after treating skin samples with warm water (60°C for 45-60 s). [14C]DEHP was tested undiluted (300 µl on a 0.636 or 1.02 cm2 contact area), contact time was 32 hours and skin temperature 30 C. The receptor fluid was of a physiological type (Dulbecco phosphate-buffered isotonic saline with antibiotics and 60 g/l of a polyethoxyoleate). Measured absorption rates for DEHP were 0.42 ± 0.13 µg/cm2/h (rat skin, n = 11) and 0.10 ± 0.02 µg/cm2/h (human skin, n = 4). The ratio of these rates is only 4.2, which may be explained by the fact that the comparison is between full thickness rat skin and stratum corneum only. The high concentration of a surface-active agent may also have modified skin penetration rates.
Other studies are summarised in Table 4.20.
148

CHAPTER 4. HUMAN HEALTH
Table 4.2 Skin penetration properties of DEHP in other publications 0
Authors Experiment type
Main experimental conditions (Note) and main results
Melnick et al. (1987) In vivo male F-344 rats clipped back skin
30 mg/kg [14C] DBP in ethanol was applied on a 1.33 cm2 area. After the ethanol evaporated, a perforated plastic cap was glued over the site of application. Urine and feces were collected every 24 hours up to 5 days. Body organs and the skin in the application site were also collected and analysed.
At day 5, the cumulated dose recovered was about 3% in the urine, 2% in the feces (93-95% from the application site). The dermal absorption of DEHP was slightly greater than that of DIDP and much less than that of DMP, DEP, DBP, DIBP, BBP or DNHP.
Ng et al. (1992) in vitro - Hairless guinea pig 200 µm thickness skin (dermatome), Membrane integrity assessed with tritiated water
Bronaugh diffusion cell, Receptor fluid: Hepes-buffered Hank’s balanced salt solution containing 4% bovine serum albumin, 24 hours contact time, [14C] DEHP applied in acetone, Skin temperature 37 C.
1) 6, 2.4 and 2.5% of the dose permeated into the receptor fluid (low, medium and high-dose groups, respectively). Calculated Ar = 0.27
in vivo: female hairless guinea pigs. Dorsal skin
[14C] DEHP applied in acetone on a 4 cm2 area (34 nmol/cm2) + protective non-occlusive pad (24 hours contact time), 6 animals were given 53 µg DEHP, urine and feces were collected for 7 days.
7-day (corrected) cumulative excreta 53.1%, skin wash 30.8%; skin stripping 11.3%. Low recoveries (78 - 90%) may be partly attributed to volatilisation
Pelling et al. (1998) in vitro - Male Ola:S-D rats dorsal epidermal membrane and residual dermis (NaBr treatment), Membrane integrity assessed with tritiated water
Bronaugh diffusion cell with perforated PTFE supports for membranes. [14C] DEHP applied in acetone. Contact area 0.64 cm2, Skin temperature 31.5°C, Receptor fluids: phosphate buffered saline or 50% aqueous ethanol.
2) Kp = 1.3.10-5 (epidermis); 4.76.10-5 (dermis) Less than 1% of the dose was absorbed in 24 hours for both membranes (PBS receptor fluid), Kp = 9.46.10-4 (epidermis); 9.83.10-5 (dermis) (50% ethanol receptor fluid).
Kp Permeation constant (cm/h); Ar: absorption rate µg/cm2/h. 1) Data for 7-day cumulative excreta have been corrected for incomplete excretion by the data obtained from the intramuscular mode.
Uncorrected data are: 3% (resp. 21%) of the dermally administered dose was absorbed in vivo and excreted in 24 hours (resp. 7 days). Note the very limited quantity of substance applied.
2) The skin pre-treatment modified dermis appearance. The epidermis had lost his folded appearance. The appreciably lower results obtained by Scott et al. (1987) are likely due to differences in technique. The use of a non-physiological receptor fluid may alter the permeability of rat skin strata.
Other studies (NIEHS, 1988; Elsisi et al., 1989) involved dermal absorption of phthalate diesters (DMP to DIDP) in F 344 rats, in vivo. These data are of particular interest because DIDP (a phthalate very similar to DINP) and DEHP (also used as a reference substance in other publications) are included in a series of phthalates, with application of the same protocols. The dose applied to the skin was around 5-8 mg/cm2. The ring-labeled phthalates were applied dissolved in absolute ethanol, with in situ evaporation. The dosed back skin was covered by a circular plastic cap perforated with needle holes. Total excretion was measured at different times. Rats were kept in metal metabolism cages that allowed urine and feces to be collected separately every 24 hours up to 7 days. Results are summarised in Table 4.21. This study shows that DIDP is markedly (ca. 10 times, when comparing fecal + urinary excretions at day 7) well less absorbed by this route than DEHP.
For DEHP, recovery at 7 days was 86% at the site of application, for a total recovery of 105%. After 5 days, cumulative excretion data indicate that 5% of the dose was recovered.
For DIDP, recovery was 75% at the site of application, for a total recovery of 82% after 7 days. After the first 24 hours 0.04% of the dose was recovered in feces, and cumulative excretion data
149

EU RISK ASSESSMENT REPORT – DINP FINAL REPORT, 2003
after 7 days indicated that 0.5% of the dose was recovered only in feces. No radioactivity was recovered in urine. It is noticeable that only fecal elimination was indicated, implying a preferency for biliary excretion when the length of the side chain increases (as hypothesised by the author). This is not in line with observations made for the two other routes. High differences in total recovery hinder a quantitative comparison of data. Muscle, adipose tissue and skin contained most of the dose remaining in the body. The total absorbed dose after 7 days can be estimated to be 1%, however this value is possibly underestimated because of the low recovery.
The skin application site was apparently not washed before evaluating DIDP residue. In all cases, dermal uptake decreased when the side chain length increased beyond four carbons. Skin absorption appeared to decrease with branched alkyl side chains.
Table 4.2 Percentage of dose ([14C] equivalents) found in the tissues and the plastic cap that covered the area of application at 7 days following a single application of various phthalate esters to the back skin of male F-344 rats
1
Percentage dose (X ± SD)
Tissue DMP DEP DBP DEHP DIDP
Adipose tissue Muscle Skin 1) Skin of appl. 2) Other tissues Plastic cap
0.3 ± 0.3 0.6 ± 0.7 0.4 ± 0.4 19 ± 23
< 0.5 5 ± 0.3
0.03 ± 0.03 0.14 ± 0.07 0.06 ±0.02
34 ± 24 < 0.5
4.8 ± 3.2
0.41 ± 0.07 1.1 ± 0.2 1.4 ± 1.0 33 ± 2 < 0.5
2.2 ± 2
0.06 ± 0.02 1.17 ± 0.22 0.3 ± 0.3 86 ± 17
< 0.5 12 ± 3
0.14 ± 0.03 0.33 ± 0.05 0.10 ± 0.04
75 ± 1 < 0.5
5.5 ± 2.7
Total recovery 66 ± 26 74 ± 21 100 ± 3 105 ± 16 82 ± 12
Total recovery represents the sum of the percentage dose found in urine, feces, tissues and plastic cap in 7 days. 1) Control skin sample removed from a front leg. 2) The skin area of application was digested and analyzed, without mention of prior blotting the residual phthalate off the skin surface.
Discussion
The various conditions in which skin penetration properties of different phthalates have been studied make a general evaluation difficult, especially for estimating representative values of the different parameters (e.g. percutaneous absorption Kp, absorption rate Ar, phthalate residues at different sites like skin surface, within skin, diffusion cell, excreta, etc.). This is the reason why studies on homologous phthalate series in the same conditions by the same workers have been emphazised. The comparisons made allow the following general conclusions (Scott et al., 1987; Elsisi et al., 1989):
• human skin is markedly (i.e. 4 to 30 times) less permeable than rat skin; this relationship had already been demonstrated (Bartek et al., 1972) or has been confirmed since for a range of phthalates (Barber et al., 1992);
• skin penetration decreases with increasing molecular weight (at least starting from DBP);
• there is a lag time tending to increase with molecular weight, although this relationship was not absolute.
No precise estimate of skin penetration parameters seems possible because no standardised procedure was applied. However it can be concluded that there is very little penetration of DINP through intact human skin.
In vivo human data about toxicokinetics, metabolism and distribution are not available.
150

CHAPTER 4. HUMAN HEALTH
4.1.2.1.3 Summary of toxicokinetics, metabolism and distribution
Via GIT, absorption of DINP decreases as dose increases (49% at the low dose of 50 mg/kg and 39% at the high dose of 500 mg/kg eliminated in urine) leading to an estimated absorption of at least 50%. In addition, absorption of the substance seems to be of saturable mechanism, with increasing dose an increasing amount of unabsorbed compound is eliminated (fecal radioactivity associated with parent compound increased from 8% to 41% from the single low to the high dose).
Dermal absorption is very low in rats, most of the unabsorbed dose remained at the skin area at day 7. The maximum percentage of the applied substance being absorbed in 7 days is less than 4%. In humans skin absorption is still lower than in rat as indicated by in vitro comparative studies, when SSARs (steady state absorption rates) were compared (Mint and Hotchkiss, 1993).
Via inhalation, a bioavailability of 75% may be assumed by analogy with DIDP.
In tissues, DINP is mainly recovered in GIT, liver and kidney by oral route whereas following dermal exposure, liver, muscle and adipose tissue contain most of the dose remaining in the body.
DINP metabolites were excreted in urine and to a lesser extent in feces. DINP was de-esterified to the monoester which was further metabolised by side-chain oxidation of the ester group or by hydrolysis to phthalic acid; the formation of oxidation products appeared to increase following the high dose, while hydrolysis to phthalic acid decreased. Repeated dosing caused no accumulation of DINP and/or its metabolites in blood and tissue, but resulted in increased formation and elimination of the monoester-oxidation products. Small amounts of the major metabolites were also recovered in the testes and fat.
DINP is rapidly eliminated, less than 0.1% of the radioactivity was recovered in tissues after 72 hours. By oral and dermal routes, excretion is shared between urine and faeces. By dermal exposure, biliary excretion is shown.
A transfer through the milk at a low level may be anticipated by analogy with DIDP, for which cross fostering and switch diet studies were conducted in the two-generation study (Exxon, 1997).
4.1.2.2 Acute toxicity
4.1.2.2.1 Oral exposure
LD50 > 10,000 mg/kg (Hazleton, 1968c)
DINP (MRD 68-28, CAS 68515-48-0) was administered by gastric intubation to thirty male Sprague Dawley albino rats at dose levels of 34.6 – 120 – 417 - 1,450 - 5,000 - 10,000 mg/kg. No deaths occurred at any of the levels tested. Depression laboured respiration and oily-appearing fur from 5,000 mg/kg. Recovery occurred within three to seven days. Weight loss was observed at 10,000 mg/kg. No major necropsy findings were observed at any dose levels. Only a short summary is available.
LD50 > 9,800 mg/kg (BASF, 1961)
To determine the approximate mean lethal dose (7 days - ALD 50) DINP (Palatinol DN CAS 28553-12-0) was administered perorally to rats (sex and number not provided) in olive oil at a
151

EU RISK ASSESSMENT REPORT – DINP FINAL REPORT, 2003
dose level of 10 ml/kg. No death and no particular findings were reported during the 7-day observation period and upon post-mortem examination.
LD50 > 10,000 mg/kg (BASF, 1981d)
No death and no abnormalities observed upon terminal necropsy at a dose level of 10,000 mg/kg Palatinol CE 5250 (CAS 28553-12-0, DINP2) administered undiluted by gavage to ten Sprague-Dawley rats (5 males and 5 females). The observation period was 14 days. Dyspnea, apathy, spastic gait, piloerection, alopecia and poor general state were observed. No information is provided on the time of symptom appearance.
LD50 > 10,000 mg/kg (Hüls 1985a)
In an acute oral toxicity test on male and female, Bor: WISW rats, it was found that the LD50 value of Vestinol 9 (DINP 2, CAS 28553-12-0) was greater than 10,000 mg/kg of body weight. The only symptoms shown by the test animals were, during the day of administration, substance-specific symptoms in the form of more frequent diuresis and a shaggy and greasy coat, and a non-specific odour due to the substance. There was no effect on change in body weight. Dissection at the end of the test revealed no gross special findings, which could be assigned to the test substance.
The test was carried out with the undiluted substance and in accordance with the guidelines for testing of chemicals (OECD Guideline 401).
LD50 > 40,000 mg/kg (Midwest Research Institute, 1981b)
DINP (R-1268 and R-1286, CAS No 28553-12-0) were administered by gavage as single undiluted doses to groups of 10 Fischer 344 albino rats (five males and five females) at dose levels of 5–10-20 and 40 g/kg. Observations common to most of the animals were: rough coat, decreased activity, and the posterior area appeared wet. The rats showed normal weight gain (R-1268 and R-1286). No abnormalities were noted at gross necropsy. One female rat at the 20 g/kg dose level of compound R-1268 was found dead on day 6 of the study. On day 5 of the study this animal was observed as appearing normal (no toxic signs), and upon gross necropsy no lesions were observed; therefore, this death is considered by the laboratory as being not related to compound R-1268. This study was carried out in compliance with Good Laboratory Practices.
LD50 > 50,000 mg/kg (Hazleton, 1980b)
DINP (CAS No not indicated) was administered by gavage as single doses to groups of 20 Sprague Dawley rats (10 males and 10 females) at dose levels of 5,000 - 15,000 - 30,000 - 35,000 - 50,000 mg/kg. One male per dose level at 30,000 and 35,000 mg/kg and four males and four females at 50,000 mg/kg were found dead during the study. The acute oral LD50 in males and females was estimated to be greater than 50,000 mg/kg. Clinical observations consisted of soft feces, rough coat and urine stains from 5,000 mg/kg; alopecia, red stains on nose and/or eyes and hunching from 15,000 mg/kg; thinness from 30,000 mg/kg; tremors at 15,000 - 30,000 and 50,000 mg/kg; laboured respiration at 15,000 - 30,000 and 35,000 mg/kg; lacrimation at 30,000 mg/kg; salivation at 50,000 mg/kg. Gross pathology consisted of discoloration of the lungs, liver, spleen, and stomach; distension of the stomach and intestines; discoloured fluid or material in the stomach and/or intestines, thoracic cavity, and abdominal cavity; thick or thin walls in the stomach.
152

CHAPTER 4. HUMAN HEALTH
4.1.2.2.2 Dermal exposure
LD50 > 3,160 mg/kg (Hazleton, 1968a)
DINP (MRD 68-28, CAS 68515-48-0) was applied to the closely clipped abraded abdominal skin of albino rabbit. Four groups of four rabbits each were dosed at 50 – 200 – 794 - 3,160 mg/kg. The trunk of each animal was then wrapped with gauze and adhesive tape, the exposure period was 24 hours. No deaths occurred at any level, no evidence of systemic toxicity was observed. Moderate erythema was observed at 24 hours which decreased and completely subsided at all levels by day 6 and also a slight desquamation in two to four animals at each level which disappeared by day 12. Gross findings were not remarkable and were essentially those associated with incidental disease. No more information is available.
4.1.2.2.3 Inhalation exposure
LC50 > 0.067 mg/l (Industrial Bio-test Laboratories, 1975a, 1975b, 1975c)
No deaths, no observable reactions, no body weight gain changes or pathologic alterations were observed at a vapour nominal concentration of 0.067 mg/l (MRD-ECH-75-2, CAS 68515-48-0) administered to ten albino rats, mice, guinea pigs (5 males and 5 females) during 6 hours. The observation period was 14 days. No justification on the choice of the concentrations tested (only 0.067 mg/l) and no information on analytical concentration were given. In the test conditions and in view of the very low vapour pressure of DINP (see Section 1.3.5); the test substance was probably administered as an aerosol rather than as a vapour. Only a brief summary was available.
LC50 > 0.07 mg/l (BASF, 1981a)
No death, no clinical signs, no abnormalities were observed upon terminal necropsy at a mean vapour concentration of 0.07 mg/l DINP (Palatinol CE 5250 CAS 28553-12-0) administered to six Sprague-Dawley rats (3 males and 3 females) during 7 hours. The observation period was 14 days. Two experiments were conducted. No justification was given on the choice of the tested concentrations (only 0.07 mg/l), and the nominal concentration was likely not reached. Moreover no information on analytical concentration was provided. In the test conditions, the test substance was probably administered as an aerosol rather than as a vapour.
LC50 > 4.4 mg/l (analytical concentration) (Hazleton, 1980a)
DINP (no information on the CAS number) was administered as an aerosol to ten Sprague-Dawley rats (5 males and 5 females) at a nominal concentration of 5-5.5 mg/l of air during 4 hours corresponding to a mean analytical concentration of 4.4 mg/l. A control group of ten Sprague-Dawley rats (5 males and 5 females) received air. The observation period was 14 days. All treated animals were observed to have slight tearing of the eyes and slight clear nasal discharge starting 40 minutes after exposure was initiated. One male was observed to have blood around both eyes on day 4 and a slight brownish discharge around both eyes on days 5 to 10; from day 8 to 10, this animal had developed an opaque spot on one eye. All other animals exhibited normal behaviour and appearance throughout the exposure period. No animal died during this study, no definite compound-related changes of body weight, no consistent compound-related gross lesions, no compound-related microscopic alterations of lungs, liver and kidneys in the treated animals were observed.
153

EU RISK ASSESSMENT REPORT – DINP FINAL REPORT, 2003
4.1.2.2.4 Other routes of exposure
Intraperitoneal route
DINP (Palatinol DN, CAS 28553-12-0) was administered via intraperitoneal route to mice (number and sex of animals not available) for determination of the approximate mean lethal dose (7 days - ALD50). A total dose of 10 ml undiluted DINP (9,800 mg/kg) was tolerated without symptoms, there were no particular post-mortem findings (BASF, 1961).
Intravenous route
Four, two and two rabbits were dosed via intravenous route with undiluted DINP (Palatinol DN, CAS 28553-12-0) at different doses: 0.5-0.8 and 1.6 ml/kg, respectively, (490 mg/kg – 784 mg/kg - 1,568 mg/kg) (BASF, 1961). Lethality was reported: 2/4-1/2 and 2/2, respectively. Animals died within a few minutes to a few hours after administration of the high dose. At the lower doses the animals did not die until 2-3 days later. Tonoclonic convulsions and laboured breathing were observed for higher doses. Post mortem examination indicated oedema or haemorrhagic engorgement (more or less pronounced) of the lung. The same effects were observed with olive oil controls and paraffin oil controls.
4.1.2.2.5 Summary of acute toxicity
Most of the animal studies on acute toxicity were either not available for detailed study or performed prior to establishment of OECD or EU guidelines. However given the consistency of the results for oral, dermal and inhalation exposure, it can be considered that DINP has a low acute oral, dermal and inhalation toxicity. No LD50/LC50 was reported from acute exposure by those routes of exposure. Findings consisted of poor state, respiratory difficulties (laboured respiration, dyspnea) and altered appearance, following oral administration, even at very high level (up to 40,000 mg/kg). Acute inhalation studies, although poorly documented, did not report any body weight changes, any gross lesions or microscopic alterations of lungs, only slight tearing of the eye and slight clear nasal discharge following aerosol exposure of 4.4 mg/l of air during four hours.
Therefore, no classification is indicated according to the EU criteria for acute toxicity.
154

CHAPTER 4. HUMAN HEALTH
Table 4.2 Summary of acute toxicity studies 2
Species Acute toxicity Results LD50 / LC50 Validity Test substance References
Oral rat > 10,000 mg/kg yes DINP 68515-48-0 MRD 68-28
Hazleton (1968c)
Oral rat > 40,000 mg/kg yes DINP 28553-12-0 R1268 (E 208-89) R1286 (E 208-125-1)
Midwest Research Institute (1981b)
Oral rat > 9,800 mg/kg/d no DINP 28553-12-0 Palatinol
BASF (1961)
Oral rat >10,000 mg/kg yes
DINP 28553-12-0 Palatinol CE 5250 DINP 2 No 80/266
BASF (1981d)
Oral rat >10,000 mg/kg yes with limitations
DINP 28553-12-0 Vestinol ® 9 DINP 2
Hüls (1985a)
Oral rat > 50,000 mg/kg yes DINP CAS not determined
Hazleton (1980b)
Inhalation rat mouse
guinea-pig
> 0.067 mg/l no DINP68515-48-0 MRD-ECH-75-2
Industrial Bio-test Laboratories (1975a; b; c)
Inhalation rat > 0.07 mg/l no DINP 28553-12-0 Palatinol CE 5250 DINP 2 No 80/266
BASF (1981a)
Inhalation rat > 4.4 mg/l yes DINP CAS not determined
Hazleton (1980a)
Dermal rabbit >3,160 mg/kg yes with limitations
DINP 68515-48-0 MRD 68-28
Hazleton (1968a)
>9,800 mg/kg DINP 28553-12-0 Palatinol DN
BASF (1961)
Intravenous rabbit 490 mg/kg, 784 mg/kg, 1,568 mg/kg
2/4 - 1/2 -2/2 animals died, respectively
BASF (1961) no DINP 28553-12-0 Palatinol DN
Other routes of exposure
Intra- peritoneal
mice no
FIFRA: Federal Insecticide, Fungicide and Rodenticide Act
4.1.2.3 Irritation
4.1.2.3.1 Studies in animals
Skin
MRD-95-389 (CAS 68515-48-0) was applied undiluted (0.5 ml) for 4-hours to the clipped intact skin of 6 males New Zealand white rabbits with a semi-occlusive dressing and was followed by an observation period of 72 hours (Exxon Biomedical Sciences, 1996f). Very slight erythema
155

EU RISK ASSESSMENT REPORT – DINP FINAL REPORT, 2003
(score 1) was observed in one animal at 1 hour and in another animal at 24 hours. All animals were free of erythema, oedema, or other supplemental dermal findings during the remainder of the study. Clinical signs were not observed during the test period. This study was carried out in compliance with GLP procedures.
Palatinol CE 5250 (CAS 28553-12-0, DINP2) was applied undiluted (0.5 ml) for 24 hours under an occlusive dressing to intact or abraded skin of 6 White Vienna rabbits (5 females and 1 male) and followed by an observation period of 8 days with readings at 15-30 minutes after removal of the test patches and 48 hours, 72 hours and 8 days after the beginning of application (BASF, 1981b). Slight erythema was observed at 48 and 72 hours on intact skin (mean score 1.3 and 0.5, respectively) and on abraded skin (mean score 1.7 and 0.8, respectively). Slight oedema was only observed at 48 hours with a mean score of 0.5 and 1.0 on intact or abraded skin, respectively. All the effects were reversible at day 8.
To test the dermal irritation potential of DINP, 0.5 ml of Vestinol 9 (CAS 28553-12-0, DINP 2) was administered undiluted on the clipped dorsal skin of 6 (3 males and 3 females) small white Russian (Chbb-SPF) rabbits, in accordance with the OECD method 404 (Hüls, 1985b). A protective gauze pad covered with a polyethylene film protected the site of application. After an exposure time of 4 hours, the protective dressing was removed and the site of application carefully washed off with warm water. The skin reactions were evaluated 1, 24, 48 and 72 hours after this removal, and until disappearance of the symptoms (in this case, after 5 and 7 days). The mean erythema was scored at 0.39 (maximum value 4.0) and the mean œdema at 0.06 (maximum value 4.0).
Eye
A single application of 0.1 ml of undiluted DINP (MRD 68-28, CAS 68515-48-0) was made into the conjunctival sac of the left eye of each of albino rabbits (6 males and 6 females) followed by observations at one, four, 24, 48 and 72 hours and at 4 and 7 days (Hazleton, 1968b). Irritation was confined to the conjunctivae and generally consisted of marked redness and slight discharge at one and four hours (score of 3), and slight redness (moderate in one eye) only at 24 hours (score of 1). By 48 or 72 hours, the irritation completely subsided in all eyes.
Single ocular application of 0.1 ml of Palatinol CE 5250 (CAS 28553-12-0, DINP2) to White Vienna rabbit (2 males and 4 females) caused slight conjunctival redness (mean score 0.83) at 24 hours only and slight corneal opacity (mean score 0.5) at 72 hour only. Iris was unaffected (BASF, 1981c). The reversibility of the corneal effects was not determined.
The irritant effect of DINP on eyes was examined by applying 0.1 ml of pure Vestinol 9 (CAS 28553-12-0, DINP 2) to the lid sac of the right eye of 6 (3 males and 3 females) small white Russian (Chbb-SPF) rabbits, the left eye serving as control (Hüls, 1985c). The test was carried out in accordance with the OECD guideline 405. There was no effect on the cornea and the iris but, at 1-hour post exposure, slight to medium redness was noted for the conjunctiva, accompanied by some discharge. The absolute score was 4.33 at this time, but returned to 0.33 at 24 hours and 0 at later times. The irritation index was calculated as 1.17/110.
Respiratory tract
Based on slight effects (clear nasal discharge) or no effect, together with the fact that DINP exhibits unreactive nature across the different routes of exposure, it may be presumed that DINP does not induce respiratory irritation.
156

CHAPTER 4. HUMAN HEALTH
4.1.2.3.2 Studies in humans
Skin
MRD 95-140 (CAS 68515-48-0) was applied undiluted (0.2 ml) for 24 hours to human volunteers (fourteen female and one male subject) using an occluded patch applied to specific skin sites of the paraspinal region of the back, and was followed by an observation period of 24 hours (Hill Top Research, 1995a). Two controls were also tested: a positive irritant control of 0.5% sodium lauryl sulphate in distilled water and a negative control of 0.89% NaCl in distilled water. No responses were observed. Mild to moderate erythema were observed with the positive irritant control at the 30-minute or 24 hour evaluation.
4.1.2.3.3 Summary of irritation
On the whole, DINP may be considered as a very slight skin and eyes irritant, with effects reversible in short time. Thus no classification is indicated according to the EU criteria for those different end points.
Table 4.2 Summary of irritation studies 3
Results Species strain
Protocol Validity Test substance References
Dermal irritation
Rabbit NZW
OECD 404 slightly irritating very slight erythema (score 1) in 2 animals, one at 1 h, the other at 24 h
yes DINP 68515-48-0 MRD-95-389
Exxon Biomedical Sciences (1996f)
Rabbit White Vienna
Draize test slightly irritating slight erythema (mean score 1.3 and 0.5 at 48 h and 72 h) and slight oedema (0.5 or 1.0 at 48 h)
yes with limitations
DINP 28553-12-0 Palatinol CE 5250 No 80/266
BASF (1981b)
Rabbit white russian
OECD 404 not irritating mean erythema and oedema scores 0.39 and 0.06
yes DINP 28553-12-0 Vestinol ® 9
Hüls (1985b)
Human not irritating yes DINP 68515-48-0 MRD 95-140
Hill Top Research (1995a)
Rabbit NZW
other slightly irritating redness of the conjonctivae at 1 or 4 h, subsided by 72 h
yes DINP 68515-48-0 MRD 68-28
Hazleton (1968b)
Rabbit white russian
OECD 405 not irritating irritation index 1.17/110
yes DINP 28553-12-0 Vestinol ® 9
Hüls (1985c)
Rabbit White Vienna
Draize test slightly irritating conjunctival redness and slight corneal opacity (mean scores 0.83 and 0.5)
yes with limitations
DINP 28553-12-0 Palatinol CE 5250 No 80/266
BASF (1981c)
Eye irritation
4.1.2.4 Corrosivity
From the studies presented in Section 4.1.2.3, it can be concluded that DINP is not corrosive.
157

EU RISK ASSESSMENT REPORT – DINP FINAL REPORT, 2003
4.1.2.5 Sensitisation
4.1.2.5.1 Studies in animals
A Buehler test (Exxon Biomedical Sciences, 1992) was carried out in forty female Guinea pigs (20 control and 20 treated) with MRD 92-257 (DINP, CAS 68515-48-0). The substance was administered neat (0.4 ml) at day 0, 7, 14 during 6 hours under occlusive bandaging, followed by a challenge application of DINP at 5% in peanut oil at day 28 and by a re-challenge at the same concentration at day 35.
A primary irritation test had been conducted first to determine the appropriate concentration of the test material to be used in the two phases of dosing. As a result, the non-irritating concentration of 5.0% (w/w) was applied topically to the clipped area. Topical application of DINP during the induction of the treated group animals produced erythema ranging from very slight to well-defined in all twenty animals. Oedema was also noted during induction in all treated animals and ranged from very slight to slight oedema. No erythema or œdema was observed at the first challenge in the treated (20 animals) or negative control (10 animals) group. Positive response was observed at the re-challenge in the treated group (20 animals): erythema was observed at day 36 on 10 treated animals (score 1) and at day 37 on 4 animals (score 1) and 3 animals (score 2); œdema was noted at day 37 in 1 of the reactive animals (score 1). Positive response (erythema score 1) was also observed at day 37 in 4 animals among 10 control animals. When the response seen in the treated animals is compared with the control response, DINP might be considered as having a potential for sensitisation (regarding score 2 observed in 3/20 animals on day 37).
A Buehler test (Huntingdon Research Centre, 1994) was carried out in forty female Guinea pigs (20 control and 20 treated animals) with Jayflex DINP (CAS 68515-48-0). The substance was applied neat (0.5 ml) for induction at day 1-8-15 during 6 hours under occlusive bandaging and for challenge at day 29. No evidence of skin sensitisation was observed in any of the treated animals. This test was conducted in conformity with GLP procedures and with EEC Method B6.
4.1.2.5.2 Studies in humans
A RIPT (Repeated Insult Patch Test) (Hill Top Research, 1995b) was carried out with 28 subjects in the pilot study and 76 subjects in the definitive study with MRD 95-140 (DINP, CAS 68515-48-0). The substance was administered neat (0.2 ml). Induction applications were made three times per week for three successive weeks. A challenge application was made after a 10 to 17-day rest period. No evidence of clinical sensitisation or irritation was observed.
Dermal reactions with DINP (Brodell and Torrence, 1992), as a component of the core material in a child's toy, Sqwish Ball, have been reported (Brodell and Torrence, 1992). A 10-year-old white girl had opened a Sqwish Ball. The material inside was very sticky and she had difficulties to remove it with soap and water and finally succeeded to do it by using a soft abrasive cleanser (Soft Scrub). The next morning, she awoke and noticed redness, itching, and burning of her hands (12 hours after exposure). Physical examination showed tiny erythematous papules and papulovesicles on the back of her hands and to a lesser extant on the palms. Slight scaling was noted. Treatment consisted of the application of a corticoid cream twice daily, and the eruption cleared in 5 days.
158

CHAPTER 4. HUMAN HEALTH
A communication from CAP toys reported 5 case of dermatitis after the opening of Sqwish Ball (Eight million units have been sold in the US before). DINP is one of the ingredients of the ball core material. Relationship between these cases and DINP was no established; dermatitis might be due to other components or to the detergent used to remove sticky material. No patch test was performed to clarify the hypothesis.
Respiratory sensitisation
Pulmonary sensitising properties have not been demonstrated with any of the phthalates and particularly with DEHP and DINP. Therefore a low potential can be anticipated.
4.1.2.5.3 Summary of sensitisation
One study conducted according to Buehler gives a positive response after re-challenge, which could lead to a classification according to the EU criteria. Another study conducted according to Buehler (one challenge), gives negative results. The Sqwish Ball producer reported 5 cases of dermatitis related to misuse of this material, but none of these cases was related directly to DINP. Overall, this provides weak evidence that DINP may cause sensitisation in human.
No positive reactions were reported in a RIPT conducted in humans.
Sensitising properties have not been demonstrated with any of the phthalates and particularly with DEHP and DBP. Therefore a low sensitising potential can be anticipated.
Overall, according to the EU criteria a classification for sensitization properties is not justified with DINP.
It should be noted that no experimental data are available for DINP 2 (CAS 28553-12-0). However the same result can be anticipated for both DINP.
Table 4.24 Sensitisation studies with DINP
Test method Species Protocol Results Validity Test substance References
Buehler test Guinea pig Hartley albino
other weak sensitiser yes MRD 92-257 CAS 68515-48-0
Exxon Biomedical Sciences (1992)
Buehler test Guinea pig Dunkin Hartley
Directive 84/449EEC, B.6
not sensitising yes Jayfex DINP CAS 68515-48-0
Huntingdon (1994)
Dermatitis Human no dermatitis with child toy
no DINP Brodell and Torrence (1992)
RIPT Human other not sensitising yes with limitation
MRD 95-140 CAS 68515-48-0
Hill Top Research (1995b)
159

EU RISK ASSESSMENT REPORT – DINP FINAL REPORT, 2003
4.1.2.6 Repeated dose toxicity
4.1.2.6.1 Oral exposure
Rats
One-week prechronic oral feeding study (Bio/dynamics, 1982a)
Groups of 8 male Fischer 344 rats (153-172 g at initiation of the study) were fed diets containing 0-2% MRD 82-41 (DINP, CAS 68515-48-0) which corresponds approximately to 1,700 mg/kg/day. A further group was fed 2% DEHP. Clinical chemistry parameters were measured on blood samples from fasted and non-fasted animals. This study was conducted in compliance with GLP procedures.
No deaths and no significant toxicological observations were recorded. Slight decrease of the food consumption and body weight is observed in treated groups but non-statistically significant. No clinical or statistical differences were noted in any of the hematology parameters examined.
Statistically significant increase of the absolute (8.49 g DINP treated animals vs. 5.72 g in control group) and relative liver weight was observed at 2% with DINP and DEHP treatment without microscopic changes associated. Slight liver congestion was observed at necropsy in few DINP treated animals. Cholesterol levels were moderately suppressed (statistically and clinically significant) in non-fasted DINP (22.7 mg/dl in DINP treated animals vs. 64.4 mg/dl in control group) and DEHP treated animals and were slightly increased in fasted animals. Triglycerides levels were severely suppressed in non-fasted treated DINP (14.2 mg/dl in DINP treated animals vs. 140 mg/dl) and DEHP treated animals. In fasted animals, a slight decrease was only detected. A slight decrease of glucose level and alkaline phosphatase was noted in fasted treated animals. Aspartate aminotransferase (AST) and Alanine aminotransfertase ALT were not affected.
A statistically significant increase in the absolute and relative kidney weights was observed at 2% with DINP and DEHP treatment without microscopic changes associated. There was a slight decrease (statistically significant) of the total protein levels in fasted DINP treated animals and a slight increase of the albumin levels in fasted DEHP treated animals.
The relative testes weights were increased at 2% in DINP treated animals. No treatment related microscopic changes (including stages of spermatogenesis) were seen histologically on testes preserved in 10% neutral buffered formalin and stained with haematoxylin eosin with DINP and DEHP.
In this one-week study, no NOAEL is identified but a LOAEL of 2% (about 1,700 mg/kg/d) is set up based on the increase of kidney and liver weights, macroscopic liver observations and biochemical changes (namely cholesterol and triglycerides).
3-month feeding study, (Hazleton, 1971b)
MRD 70-46 (DINP, CAS 68515-48-0) was administered at dietary levels of 50 – 50 - 500 mg/kg/day to 10 rats of each sex during three months. Observations and records were performed daily for mortality and signs of systemic toxicity and weekly for individual body weight, food consumption and behaviour. Clinical laboratory studies were performed on five rats of each sex from the control and each test group.
160

CHAPTER 4. HUMAN HEALTH
At month 1 and month 3, haematology assessment was performed and consisted of hematocrit and hemoglobin determinations, erythrocyte count, total and differential leukocyte count. Clinical biochemistry investigations were carried out at month 1 and month 3 with fasting blood sugar, blood urea nitrogen, total serum protein, total serum bilirubin, serum glutamic-pyruvic transaminase, serum alkaline phosphatase measures and serum electrophoresis. At month 3 serum albumin, serum sodium, serum potassium, serum chloride, carbon dioxide, serum calcium and serum glutamic-oxaloacetic transaminase measures were performed. Urine analysis at month 1 and month 3 consisted of specific gravity, pH, ketone bodies, total protein bilirubin assessment and microscopic examination of the sediment.
Necropsy was performed on the only rat which died during the study. At termination, all the other animals were sacrificed, and necropsies were led for gross observations and histopathological examinations. The following tissues from each animal were preserved in 10% neutral buffer formalin: brain, pituitary, thoracic spinal cord, eye, thyroid, lung, heart, liver, spleen, kidney, adrenal, stomach, pancreas, small and large intestines, mesenteric lymph node, urinary bladder, testis with epididymis, seminal vesicle, ovary, uterus, skin, rib junction, bone marrow, nerve with muscle and unusual lesions. Some tissues were examined microscopically from 5 males and 5 females in the control and 500 mg/kg/d-MRD 70-46 groups: pituitary, thyroid, heart, liver, spleen, kidney, adrenal, stomach, pancreas, small and large intestines, mesenteric lymph node, urinary bladder, testis, seminal vesicle, ovary, bone marrow and unusual lesions. In addition, sections of liver kidneys and unusual lesions were examined from 5 males and 5 females in each of the remaining group.
Body weight gains in male from 50 mg/kg/day were slightly lower than, but not statistically different from those for the control groups. Food consumption was comparable among the control and treated groups. One male died at 50 mg/kg/day. Eye lesions occurred in few animals as well as alopecia in several rats in various test groups and broken nose in two rats during the study.
At 500 mg/kg/day, a statistically significant increase of absolute and relative liver weights is observed when compared to control animals in males (16.06 vs. 12.4 g; 3.54 vs. 2.60%) and in females (9.19 vs. 7.32 g; 3.42 vs. 2.64%) with hepatocytic hypertrophy in males (minimal to moderate in 5/5 males) and in females (minimal to slight in 2/5 females). No remarkable biochemical changes were observed.
At 500 mg/kg/day, a statistically significant increase of absolute and relative kidney weights is observed in females (2.2 vs. 1.87 g and 0.818 vs. 0.652%) and males (3.64 vs. 3.33g and 0.8 vs. 0.699%) but not statistically significant. Neither remarkable biochemical changes nor microscopically compound related changes were observed.
The absolute and relative testis weights were comparable among control and treated groups.
No remarkable microscopic changes were observed in ovaries and testes preserved in 10% neutral buffered formalin.
It can be assumed from this 3-month study that the NOAEL is 150 mg/kg/day based on the increase of kidney and liver weights associated with hepatocytic hypertrophy observed at 500 mg/kg/day.
161

EU RISK ASSESSMENT REPORT – DINP FINAL REPORT, 2003
13-week feeding study (bio/dynamics, 1982b)
Groups of 15 Fischer 344 rats of each sex were fed diets containing 0 - 0.1 - 0.3 - 0.6 - 1.0 - 2.0% MRD 82-41 (DINP, CAS 68515-48-0) which corresponds approximately to 77 – 227 – 460 – 767 - 1,554 mg/kg/day as quoted in the HEDSET provided by industry.
No deaths were observed. Ocular discharges, urine and ano-genital staining were the most frequently noted observations. A statistically significant decrease of the body weight gain (271.4 vs. 323.6 g in controls for males and 164.2 vs. 184.1 g in controls for females at termination) and food consumption was observed at 2%.
A slight increase statistically significant of ALT was observed in males at 2% (54 vs. 39 IU/l in controls). Statistically significant increase of alkaline phosphatase was observed from 1% in males (177 and 207 IU/l at 1 and 2% vs. 139 IU/l in controls) and at 2% in females (229 IU/l vs. 135 IU/l in controls). A statistically significant decrease of the cholesterol level from 0.3% in females (49.4 mg/dl at 2% vs. 76.4 mg/dl in the control group) and of the triglyceride levels from 0.6% in both sexes (29.5 mg/dl at 2% vs. 133.8 mg/dl in the males control group) with a clear dose related response was observed. A statistically significant dose-related increase of absolute liver weights were observed from 0.6% in both sexes when compared to control animals (14.1, 15.8, 18.2 g vs. 11.5 g for males and 7.5, 8.6, 11.0 g vs. 6.2 g for females at 0.6, 1.0 and 2%, respectively) and of the relative liver weights from 0.3% in males and from 0.6% in females. Brown mottling of the livers was noted in few animals from 1%. No histological data are provided.
A slight increase (statistically significant) of the platelet count was detected in males from 1%.
A slight, statistically significant, increase of albumin level was detected in males from 1% (respectively at 1% and 2%, 4.3 and 4.7 vs. 3.6 g/dl in controls). At termination (week 13), urine chemistry values indicated in males: increases in volume from 0.3% but only statistically significant at 1% (12 ml vs. 9 ml in controls) and in glucose, statistically and clinically significant from 0.3% (4.4, 5.0, 5.4, and 4.9 mg/16H at 0.3, 0.6, 1, and 2% vs. 3.4 mg/16H in controls), extreme increase in renal epithelial cells from 0.3%, and significant decrease of urine osmolarity values from 0.6% (1,852, 1,606 and 1,912 mOsm/l at 0.6, 1 and 2% vs. 2,214 mOsm/l in controls). Urine protein values were increased statistically and clinically in females at 2% (2.1 mg/16H vs. 1.1 mg/16H in controls), and in males at 1% (20.9 mg/16H vs. 16.0 mg/16H in controls). A slightly more acid pH was shown at 2% in both sexes. Occult blood was present in some males at 2% on week 4. Ketone bodies were observed in all groups on week 13. A statistically significant increase of relative and absolute kidney weights was observed from 0.3% in females (relative kidney weights 0.89% vs. 0.73% in controls and absolute kidney weights 1.47 g vs. 1.34 g in controls at 2% DINP) and statistically significant increase of relative kidney weights from 1% in males (0.81 and 0.90% at 1 and 2% DINP vs. 0.72% in controls), whereas absolute kidney weights were only increased at 1% (2.55 g vs. 2.33 g in controls). Dark brown discoloration was observed from 0.6% with a clear dose related response. Kidneys were also discoloured dark brown red or pale green. No histological data are provided.
A slight, statistically significant, increase of relative testis weights was noted at 2%. However, this increase is associated with a slight decrease of the absolute testis weights and a decrease of the body weight. No histological data are provided.
It can be assumed from this 13-week study that the NOAEL is 0.1% (77 mg/kg/d) based on the increase of kidney and liver weights and the decrease of the cholesterol level noted at 0.3% (227 mg/kg/d).
162

CHAPTER 4. HUMAN HEALTH
13-week feeding study (bio/dynamics, 1982c)
Groups of 15 Sprague Dawley rats of each sex were fed diets containing 0-0.3-1.0% MRD 82-41 (DINP, CAS 68515-48-0) which correspond, respectively to 201-690 mg/kg/day in males and to 251-880 mg/kg/day in females.
There was one death at 1% during the final week of the study. Few in-life observations were noted during the study. Mean body weights and food consumption showed normal patterns in all groups until week 12 of the study. At this time, treated animals showed a sharp decrease in body weight means, statistically significant. This might be related to a watering system uncoupling during last week 12.
Hematology data (slight decrease of red blood cells, haemoglobin and hematocrit) suggested a mild anemia from 0.3%.
In this 13-week study, no NOAEL is identified. The LOAEL is 0.3% (201–251 mg/kg/d) based on the increase of liver weight associated with a decrease of the triglycerides levels and the increase of kidney weight associated with urine chemistry changes observed at this dose.
A moderate to severe decrease of the triglycerides levels was observed from 0.3% in both sexes (43 mg/dl at 1% in males vs. 167 mg/dl in control group) with a clear dose related response whereas cholesterol levels were not clinically different from the control group. At 1%, there was a statistically increase of alkaline phosphatase in both sexes (in males 223 UI/l vs. 146 UI/l in controls and in females 159 UI/l vs. 107 UI/l in controls) and a slight increase, statistically significant, of Alanine Aminotransferase (ALT) in males only (47 UI/l vs. 36 UI/l in controls). These biochemical changes were associated with a statistically significant increase of relative liver weights from 0.3% in males and females and increase of absolute liver weights at 1% only in males (23.0 g vs. 19.2 g in controls) and from 0.3% in females (, respectively 11.2 and 12.7 g at 0.3 and 1% vs. 9.8 g in controls).
Differences in urine chemistry values were only observed in males. At week 4, there were increases in glucose with a clear dose-related response and in volume, extreme increase in renal epithelial cells and statistically significant decrease of urine osmolarity values. In females from 0.3%, urine protein values were increased. At week 8 in males, urine osmolarity was moderately lower than control and the extreme increase in renal epithelial cells was still observed from 0.3%. Finally, at week 13, in males urine volume and glucose concentration were moderately higher than controls (statistically and clinically different) at 1%, respectively 20 ml vs. 14 ml in controls and 5.7 ml/16H vs. 3.7 ml/16H in controls; urine protein was moderately lower, statistically and clinically different, than controls at 0.3% without dose-response relationship (9.9, and 18.1 mg/16H at 0.3 and 1% vs. 24.9 mg/16H in controls). These urine chemistry changes were associated with a statistically significant increase of relative kidney weight from 0.3% in both sexes and of the absolute kidney weight from 0.3% in females (2.15 and 2.23 g at 0.3 and 1% vs. 1.87 g in controls) and at 1% in males (3.95 g vs. 3.44 g in controls). Discoloration, scattered tan foci, and dilatation of the renal pelvis were observed in few treated animals at the necropsy. No histological data are provided.
A slight, statistically significant, increase of relative testis weights was noted at 1% associated with a slight increase (not statistically significant) of the absolute testis weights. No histological data are provided.
163

EU RISK ASSESSMENT REPORT – DINP FINAL REPORT, 2003
13-week feeding study (BASF, 1987f)
Groups of ten Wistar rats of each sex were fed diets containing 0 - 3,000 - 10,000 - 30,000 ppm Palatinol N (DINP2, CAS 28553-12-0, purity greater than 99%) which correspond respectively to 333 - 1,101 - 3,074 mg/kg/day at day 7 and to 152 – 512 - 1,543 mg/kg/day at day 91 for the males and to 379 - 1,214 - 3,224 mg/kg/day at day 7 and to 200 – 666 - 2,049 mg/kg/day at day 91 for the females. This study was carried out following the OECD guideline 408 and in conformity with GLP. The test substance preparations were prepared every 4 weeks since stability in the feed was demonstrated over a period of 32 days. No study of reversibility was carried out.
No adverse effect on the general state of the animals was reported; only in 30,000 ppm was an orange-brown discoloration of the fur observed in the genital region of both sexes. One male at 10,000 ppm died at day 60. However, a relation to the test substance is considered as hardly probable.
Feed consumption was reduced at 30,000 ppm in males in the first and last week of the study (13%) and in females in the first week of the study (17%).
On account of increased drinking water consumption detected visually, the drinking water consumption was determined from the 7th week (day 47) up to 13th week (day 89). In females at 3,000 ppm, drinking water was first higher than in the control (about 26%), the water consumption was 29.5 g vs. 23.4 g at day 47 and 27.8 g vs. 22.3 g in controls at day 54, but it became almost the same as that of the control in the further course of the study except at days 68, 75 and 82 where a slight increase is still observed. At the end of the study, no difference was detected any longer. In the two upper dose groups (10,000 and 30,000 ppm), however, a clearly increase (19 to 54% above that of the control) was observed during the period of observation (day 47 to day 89).
A trend towards a decreasing body weight from 3,000 ppm was observed in males and confirmed at 30,000 ppm with a statistically decreased of the body weight compared with the control groups (males up to 18% and females up to 11%).
At the opthalmoscopic examination, no adverse effect on the refracting media was shown. An increase of the residues of the pupillary membrane was reported in males at 30,000 ppm (6 animals/10 at 30,000 ppm vs. 2/10 in the control group at the 7th week and 8 animals/10 at 30,000 ppm vs. 4/10 in the control group at the end of the study).
Palatinol N led to statistically significant reduced values of haemoglobin, mean corpuscular volume and mean corpuscular haemoglobin in each sex at 30,000 ppm. A statistically significant decrease of the hematocrit and slightly increased polychromasia and anisocytosis were also observed at 30,000 ppm in females. Moreover, reduced mean corpuscular haemoglobin was detected in the blood of the males at 10,000 ppm. The changes in the red blood count are probably due to a marginal anemic process. The microcytic, hypochromic appearance of this anemic process might indicate an iron deficiency or a disturbance in iron utilisation.
Clinical chemistry changes, which were regarded as being related to hepatotoxicity were predominant among the biochemical findings.
A statistically significant reduction of the triglyceride concentrations was detected in both sexes from 10,000 ppm and as a trend also at 3,000 ppm in both sexes. The lowering of the triglyceride level was particularly pronounced at 30,000 ppm with a reduction by 75% in the males and by about 64% in the females as compared with the controls. This pronounced triglyceride lowering
164

CHAPTER 4. HUMAN HEALTH
is probably due to an increased fatty acid catabolism in the liver as a result of an increased peroxisomal β-oxidation. There was however, no clear effect on the cholesterol level.
A slight increase in the alanine aminotransferase (ALT) activities statistically significant was detected in the serum of the males and females from 10,000 ppm and is also regarded as being related to the liver changes.
A statistically significant increase in the alkaline phosphatase (ALP) activity was observed in the males at 30,000 ppm and in the females from 10,000 ppm. A trend to an increasing bilirubin concentration in the females was observed from 10,000 ppm confirmed at 30,000 ppm by a statistically significant increase in females and by a slight increase in males. These effects are probably also of hepatotoxic genesis.
Moreover, a statistically significant increase of absolute and relative liver weights in males and females was observed from 10,000 ppm. At 30,000 ppm, the increase was about 30% in males and 69% in females (absolute liver weights) and about 59% in males and 89% in females (relative liver weights) and the colour of the liver was darker than in the control group. Hypertrophy of hepatocytes was detected at 10,000 ppm (10 of 20 animals) and 30,000 ppm (17 of 20 animals). Its incidence in females (3 of 10 animals) was lower than in males at 10,000 ppm. A centrolobular degenerative fatty infiltration of hepatocytes with pyknosis was also observed from 10,000 ppm in males only, which is regarded as substance-induced damage to the parenchyma. In addition to this degenerative fatty infiltration, peripheral to intermediary alimentary fat deposits were found particularly in the ORO (Oil-Red-O) stain. A substantial or complete absence of peripheral fat deposits in the hepatocytes was observed from 10,000 ppm and a clear decrease was obvious even at 3,000 ppm in both sexes. This latter effect might explain the discoloration observed macroscopically at 30,000 ppm and might be due to a change of the fat metabolism caused by the test substance and is probably due to a substance-induced increase of the peroxisomes.
Some males at 30,000 ppm showed increased urea and creatinine values. These increases might indicate a disturbance in the kidney function. Moreover, one of these males showed markedly low sodium and chloride concentrations, increased total protein and albumin values and at the autopsy, the surface of the kidneys was clearly granular, consistent with tubulopathy. A statistically significant increase in total protein values was only observed at 10,000 ppm in males and in albumin values from 10,000 ppm in males with a dose-response relationship.
A statistically significant increase of relative kidney weight was observed in both sexes from 10,000 ppm and of the absolute kidney weight at 10,000 ppm in males. Although the absolute kidney weight showed no statistical change at 30,000 ppm, the increase observed at 10,000 ppm was considered as an effect of the test substance, this effect being masked at 30,000 ppm by the considerably reduced body weight. Damage to the tubular epithelial cells in the cortex was found as a substance-induced change in all males at 30,000 ppm. This tubulopathy was characterised by the following changes: the cytoplasm of the epithelial cells showed a vacuolate or vesicular structure and was partly stained basophilically and partly brightly translucent. Some of the nuclei showed hyperchromasia of the nuclear membrane. One male at 3,000 and 10,000 ppm also had tubulopathy, but only to a minimal extent without dose-response relationship and therefore, is not regarded as an effect of the test substance.
Absolute adrenal weight was reduced at 30,000 ppm in females but this effects is not regarded as an effect of the test substance but is probably rather due to the reduced body weight. The increase of the relative testis weight observed at 30,000 ppm is also not regarded as substance-induced but regarded as the result of the clear body weight decrease. Moreover, no increase of
165

EU RISK ASSESSMENT REPORT – DINP FINAL REPORT, 2003
the absolute testis weight was detected. The histopathological examination of the testes and ovaries does not show any adverse effect. However, it should be noted that the testes were fixed in 4% formaldehyde and not with Bouin fixative and that the determination of the uterus weight was not carried out.
In this 13-week study, a NOAEL is not identified. The LOAEL is 3,000 ppm (152 mg/kg/d) based on the trend towards a lowering triglyceride level and the decrease of alimentary peripheral fat deposits in hepatocytes observed at this dose.
13-week feeding study (Hazleton, 1991a)
DINP (CAS 28553-12-0) was administered over a 13-week period in the diet of 4 groups of 10 male and female Fischer 344 rats at dose levels of 2,500 - 5,000 - 10,000 - 20,000 ppm (about 176 – 354 – 719 - 1,545 mg/kg/d in males and 218 – 438 – 823 - 1,687 mg/kg/d in females). A fifth group served as control and received the basal diet only. Rats were examined daily for mortality and clinical signs, food consumption and body weight gain were evaluated weekly, common biochemical and haematological parameters were measured on week 13. An opthalmoscopic examination was performed on week 13 before termination of the study. After sacrifice, brain, kidneys, liver, lung, spleen, testes and uterus were weighed. These organs and others (commonly examined in 13-week studies) were preserved in 10% neutral buffered formalin before histological examination.
Body weight gain of males and females treated with 20,000 ppm was significantly lower than controls. Except minor time dependant variations, food consumption was quietly similar in all the groups.
Signs of anemia were observed (decrease of mean erythrocyte count, decrease of mean hematocrit, decrease of mean haemoglobin) in males at doses from 5,000 to 20,000 ppm and in females at doses of 10,000 and 20,000 ppm.
In males, a slight increase of blood urea nitrogen was observed at doses up to 10,000 ppm, whereas, in females, it was observed at 20,000 ppm only. Urines were stained from 2,500 in females (1/10 - 1/10 - 6/10 and 9/10 for 2,500 - 5,000 - 10,000 and 20,000 ppm, respectively) and at 20,000 ppm (1/10) in males. There was a slight increase of specific gravity in 20,000 ppm animals with an increase of the proteins, leukocytes and amorphous materials. These findings were also observed in males at 10,000 ppm. There was an increase of the absolute kidneys weight in males from 5,000 and in females from 2,500 ppm and an increase of the relative kidney weight from 2,500 ppm in males and 5,000 ppm in females. There was a dose-related increase of granular casts and higher severity of regenerative/basophilic tubules from 5,000 to 20,000 ppm in males.
There was a decrease in globulin concentrations from 5,000 ppm in males and 10,000 ppm in females. Concurrently, an increase of albumin and A/G ratio was observed from 10,000 ppm in males and only at 10,000 ppm in females. In two males of the highest dosed group, enlarged and dark liver was observed at necropsy. There was an increase of the absolute liver weight in males from 5,000 and in females from 2,500 ppm and an increase of the relative liver weight from 2,500 ppm in males and 5,000 ppm in females. Histopathologic examinations showed hepatocellular enlargement in the 20,000 ppm group, periportal in males and centrolobular in females.
166

CHAPTER 4. HUMAN HEALTH
There was a decrease of the absolute and relative weight of the uterus at 20,000 ppm and an increase of the relative testes/epidydimides weight at 10,000 ppm and higher. No gross or microscopic observations were associated with these organ weight changes.
Dark areas of the non-glandular stomach were observed in 3 males and 3 females of the highest dose group and in one female at 2,500 ppm. Vesiculation and increase severity of acute inflammation were present in the stratified squamous epithelium of the non-glandular stomach in male and female rats from 10,000 ppm and higher.
This study was performed according to GLP procedures and according to EPA guidelines.
In this 13-week study no NOAEL is identified. The LOAEL is 2,500 ppm (176 mg/kg/d) based on the increases of liver and kidney weights in males and females observed at this dose level.
13-week feeding study (Hazleton, 1981a)
DINP (CAS not specified) was administered over a 13-week period in the diet of 3 groups of 20 male and female Sprague-Dawley rats at dose levels of 1,000 - 3,000 and 10,000 ppm (about 60 - 180 and 600 mg/kg/d). A fourth group served as control and received the basal diet only. Rats were examined daily for mortality and clinical signs, each week food consumption and body weight gain were evaluated. At week 4 and 13, common biochemical and haematological parameters were measured. An opthalmoscopic examination was also performed at week 13. At termination of the study, brain, heart, liver, kidneys, testes and ovaries were weighed. These organs and others (commonly examined in 13-week studies) were preserved in 10% formalin and stained with hematoxylin and eosin before histological examination.
Mean body weight of females treated with 10,000 ppm was slightly lower than controls (not statistically significant). A focal retinal dystrophy was observed in 4 males (2 at 3,000 ppm and 2 at 10,000 ppm), this finding was considered to be not treatment related. Slight signs of anemia (decrease of HCT, HGB and RBC) were observed up to 3,000 in males and at 10,000 in females.
For biochemical parameters, only a slight decrease of globulin in females at doses up to 3,000 ppm, a decrease of total bilirubin and an increase of blood urea nitrogen in males dosed with 10,000 ppm were observed.
There was an increase of the relative liver weight in females treated with 3,000 ppm DINP and an increase of the absolute and relative liver weight in males and females treated with 10,000 ppm. For kidneys, an increase of the absolute and relative weight was observed at 10,000 in males and of the relative weight only in females.
There were histopathological lesions only in kidneys. At 1,000 ppm, an increased incidence of focal mononuclear cell infiltration and mineralisation was observed in males. At 3,000 the same lesions with an increased incidence of regenerative epithelium was observed in males. At 10,000, there was an increase of proteinaceous casts in males with the lesions described before.
No effect was observed on reproductive organs (macro and microscopic examination). Regarding effects on kidneys only observed in males, no NOAEL can be derived from this study, only a LOAEL of 1,000 ppm (60 mg/kg/d) can be defined. For other effects a NOAEL of 1,000 ppm can be assumed.
167

EU RISK ASSESSMENT REPORT – DINP FINAL REPORT, 2003
Combined chronic/carcinogenicity study (Exxon Biochemical Sciences 1986; Hazleton, 1986a; Lington et al., 1987; Lington et al., 1997), according to GLP
Experimental procedure and non-neoplastic findings are described in this section.
• Experimental procedure Groups of 220 (110/sex) Fischer 344 rats, (6 weeks of age at initiation of dosing) were administered dietary concentration of 0 - 0.03 - 0.3 - 0.6% (w/w) DINP (MRD 83-260, CAS 68515-48-0, assumed to be 100% pure for purpose of dosing5) for a period up to 2 years. The mean daily intakes of DINP over 2 years (Lington et al., 1997) were 15, 152 and 307 mg/kg/day for male rats corresponding to dose levels of 0.03 - 0.3 and 0.6%, respectively and 18, 184 and 375 mg/kg/day for female rats, respectively. Preselected subgroups of 10 rats/sex/dose level were scheduled for interim sacrifice after 6, 12 and 18 months and remaining rats were sacrificed at 24 months.
The animals were observed twice daily for viability. Clinical examinations (nature, onset and duration of signs, palpable tissue masses), body weight and food consumption were recorded weekly. Hematological, clinico-chemical and urinalysis were determined in rats sacrificed at the 6, 12 and 18-month intervals and in 20 rats/sex/dose level at study termination.
Hematological (RBC count, Hct, Hb, total and differential WBC count, MCV, MCH, MCHC, platelet, reticulocyte counts), clinico-chemical parameters (total protein, albumin, globulin, BUN, cholesterol, triglycerides, creatinine, glucose, alkaline phosphatase, AST, ALT, total bilirubin, calcium, sodium, potassium, chloride, serum osmolarity) and urinalysis (pH, specific gravity, ketones, bilirubin, occult blood, volume, glucose, proteins, creatinine, sodium, potassium, osmolarity, renal epithelial count) were determined in rats sacrificed at the 6, 12 and 18-month intervals and in 20 rats/sex/dose level at study termination. It should be noted that gamma glutamyl transpeptidase and ornithine decarboxylase was not performed.
Complete gross necropsy was conducted in all animals sacrificed at 6, 12, 18 months and all survivors at study termination, and also on moribund sacrificed rats in which organ weights were not determined. Selected organs (adrenals, brain, heart, kidney, liver, ovaries, spleen, testes and thyroid/parathyroids) were weighed and tissues were preserved in 10% neutral buffered formalin and processed (paraffin technique) for light microscopic examination.
The morphological examination of the liver was conducted on livers of two rats/sex/group by electron microscopy for evidence of peroxisome proliferation induction at study termination. Liver specimens from the right lobe were excised, minced and rapidly fixed by immersion with Karnofsky fixative and then prepared for microscopy evaluation (Lington et al., 1997).
Histopathological examinations were conducted on all gross lesions, all tissue masses, epididymides, kidneys, liver, lungs, ovaries, pituitary, spleen, testes and thyroid in rats sacrificed at the 6,12 and 18-month intervals; on gross lesions, tissues masses kidney, liver from rats of the low and mid-dose group sacrificed at study termination; and on adrenals, aorta (abdominal), brain, epididymides, esophagus, eyes with optic nerve, femoris muscle with sciatic nerve, harderian glands, heart, kidneys, large intestine (colon, cecum), liver, lungs, mammary glands, 5 Stability of test material was checked prior the study; analysis of test material in each test diet, which were
conducted every time a new batch was prepared, confirmed that actual concentrations were within 10% of targeted concentration; homogeneity of the mixing procedure was adequate (none of the batches examined on week-1, -2 –27 and 53 of the study, exhibited greater than 10% deviation in concentration from the target value. Exceptions to the test diet analytical and homogeneity acceptance criteria occurred during the first 2 weeks and were therefore not considered to adversely impact the outcome of the study)
168

CHAPTER 4. HUMAN HEALTH
mesenteric lymph nodes, nasal turbinates/cavity, ovaries, pancreas, pituitary, prostate, rectum, salivary glands, seminal vesicles, skin, small intestines (duodenum, jejunum, ileum), spinal cord (cervical, midthoracic, lumbar), spleen, sternum with marrow, stomach, testes, thymus, thyroids/parathyroids, trachea, urinary bladder, uterus, vagina, all gross lesions and all tissue masses from all control and high-dose rats.
• Results Survival was greater than 60% in all groups at study termination (Table 4.25). A slight decrease in overall survival was indicated in the mid- and high-dose groups of either sex compared to controls, depending on the statistical method: No significant difference was obtained using the Weibull technique which is sensitive to model parameters; the Cox and generalised Kruskall-Wallis tests indicated a significant difference in survival in mid- and high-dose female rats.
Clinical in-life observations: the incidence of clinical in-life observations was relatively low throughout the 24-month test period. With the possible exception of a low incidence of urinary staining noted for the treated females, mainly during the first year of study, there were no in-life findings that appeared indicative of treatment related toxicity (palpable masses which were mainly subcutaneous, ocular changes were the most common findings observed at a similar incidence in treated and control rats).
Food consumption: slight and sporadic but in many cases statistically significant changes in weekly food consumption values occurred in both sexes during the study; overall consistent changes consisted of a significant reduction of food consumption in the high-dose males during the last 12 months of the study and of a slight increase of food consumption in the mid and high-dose females during the first 12 months of the study.
Table 4.2 Survival of F344 rats: numbers/group 5 (Hazleton, 1986a; Lington et al., 1997)
Interim sacrifice Dose level (wt%) Initial n° Sex
6 months 12 months 18 months Terminal sacrifice Unscheduled deaths
110 M 10 10 9 61 (75%) 20 (18%) 0
110 F 10 10 10 65 (80%) 16 (15%)
110 M 10 10 10 55 (69%) 25 (23%) 0.03
110 F 10 10 9 57 (70%) 24 (22%)
110 M 10 10 10 50 (62%) 30 (27%) 0.3
110 F 10 10 10 49 (61%)* 31 (28%)
110 M 10 10 10 51 (64%) 29 (26%) 0.6
110 F 10 10 10 54 (68%)** 26 (24%)
* statistically significant at 1% level (Kruskall Wallis andCox’s tests, but not significant by the Weibull test) ** statistically significant at 5% level (Kruskall Wallis and Cox’s tests)
Body weight changes: when compared with controls, the high-dose males exhibited a statistically significant, dose-related decrease in body weight beginning at 12 months of treatment and persisting until termination (4 to 7% reduction in body weight compared to the control group). There were not statistically significant changes of bw in females which exhibited small, but in some cases statistically significant differences, compared to controls: treated
169

EU RISK ASSESSMENT REPORT – DINP FINAL REPORT, 2003
females weighed slightly more than controls until the last 6 months of the study when the displayed slight decreases in bw.
Organ weights: both males and females from the mid and high-dose groups exhibited a statistically significant, dose-related increase in relative kidney and liver weights throughout most of the treatment period; the absolute liver and kidney weights demonstrated a similar trend. At termination in the high-dose level absolute liver and kidney weights were increased, respectively in males by 20% and 8% (liver and kidney weights were 13.94 and 3.19 g vs. 11.63 and 2.95 g) and in females by 27.3 and 9% (liver and kidney weights were 10.25 and 2.30 g vs. 8.27 and 2.10 g). Those changes in organ weights were correlated to histopathological findings at the 18-month sacrifice (Lington et al., 1997).
At study termination, the mid- and high-dose males exhibited a statistically significant, but not dose-related, increase in absolute and relative spleen weights and the high-dose females a statistically significant increase in relative spleen weight. Relative, but not absolute adrenal weights were slightly, but significantly increased in both sexes.
No treatment-related changes were observed in the absolute or relative organ weights for ovaries, brain, heart, or thyroid/parathyroid (the most significant changes are shown in the summary Table 4.26).
At study termination, a statistically significant increase in relative testis weights was observed at the high dose associated with a slight, not statistically significant, increase of 13% in absolute testis weight (6.22 g vs. 5.48 g in the control group).
Table 4.2 Mean absolute (g) and relative (%) organ weights at study termination (significant changes) 6
Doses (wt%) Controls 0.03 0.3 0.6
Sex M F M F M F M F
Absolute Weights (g)
Adrenal - - - - - - - -
Kidney 2.95 2.11 - - 3.12 ** 2.36 ** 3.19 ** 2.3 **
Liver 11.63 8.09 - - 13.43 ** 9.66 ** 13.94 ** 10.25 **
Spleen 1.68 - - - 2.53 * - 2.4 * -
Relative Weights (%)
Adrenal 0.017 0.024 - - 0.023 ** - 0.020 ** 0.026 **
Kidney 0.81 0.81 - - 0.80 ** 0.87 ** 0.97 ** 0.80 **
Liver 3.2 3.1 - - 3.8 ** 3.6 ** 4.2 ** 4.0 **
Spleen 0.46 0.42 - - 0.74 ** - 0.74 ** 0.66 **
* p < 0.05 ** p< 0.01 Hematology: in general, the mean hematologic values were within normal limits for both sexes at 6, 12 and 18 months (few slight but statistically significant differences were seen in males for Hb, MCH and MCHC values and in females for MCV, MCHC and platelets values, all of which were within biological limits and thus not considered as treatment related.
170

CHAPTER 4. HUMAN HEALTH
At study termination, some possible treatment related effects on hematologic values were observed. In the mid and high-dose males, there was a dose dependent increase, possibly treatment related although not statistically significant compared to controls, of white blood cell count (WBC). There were two animals at the 0.3% level that had extremely elevated WBC's and the occurrence of abnormally high WBC's increased with dose. The mid-dose females also exhibited a statistically significant increase in mean WBC count as compared to controls. The red blood cell count, hemoglobin and hematocrit mean values were slightly lower for mid- and high-dose males compared to control values and only statistically significant at the high-dose level. The high-dose males and females also exhibited an increased frequency of occurrence of nucleated RBC, polychromatophilic red cells, and reticulocytes when compared with control animals.
Serum chemistry: no remarkable findings at 6, 12 and 18 months. Some parameters were statistically increased (BUN, A/G ratio, creatinine) but were judged unlikely to be of biological significance due to a lack of dose response and thus considered as not treatment related. On the other hand, parameters usually associated with liver function (Alkaline phosphatase, AST, ALT) were weakly, but generally at statistical significance, increased in the mid and high-dose males at all study intervals; however, at study termination, considerable variations were seen in individual values of liver enzymes suggesting that these changes may be not related to treatment. In addition, the serum chemistry profile in females did not reveal significant changes in liver function parameters.
Urine chemistry: statistically significant changes in some of the urinary parameters were seen in males throughout the study, especially in high-dose males which exhibited increased urine volumes at all time intervals; potassium and glucose levels were increased in mid and high-dose males at the 6, 12 and 18-month intervals but not at study termination. An increase in excretion of renal epithelial cells was also noted from 0.3% in males at 6 months but not at later treatment periods.
Gross effects at necropsy (Lington et al., 1997): no grossly observable and treatment-related abnormalities were apparent at any of the interim sacrifices. At study termination, however, mid and high-dose males and high-dose females exhibited an increased incidence of splenic enlargement when compared with control animals.
Histopathological findings: Ultrastructural examination of liver specimens from representative rats of each sex from the four groups did not reveal any treatment-related peroxisome proliferation.
Lesions were observed in the liver and kidney of high-dose rats (minimal to slight centrilobular to midzonal hepatocellular enlargement in high-dose rats; minimal increase in tubular cell pigment was noted in the renal tubular epithelium in high-dose male).
Pertaining to liver findings, an increased incidence of spongiosis hepatis was noted in males given 0.3 and 0.6% DINP (respectively 51 and 62 treated animals vs. 24 controls), and of hepatocellular enlargement in both sexes at the high dose (9 in males and 11 in females vs. 1 in controls of both sexes). Focal necrosis was increased in both sexes from 0.3% DINP, but was only significant in males of the high-dose group (26 in treated animals vs. 10 in controls). Hepatopathy associated with leukaemia was also increased in mid and high-dose groups, but only significantly from 0.3% in males (34 and 33 in treated animals vs. 22 in controls) and at 0.6% in females (33 in treated animals vs. in 16 controls). In addition at 24 months, lesions in the liver consisting of slight centrilobular to midzonal hepatocellular enlargement in a small number of rats were comparable to the findings at the 18-month sacrifice.
171

EU RISK ASSESSMENT REPORT – DINP FINAL REPORT, 2003
A histopathology peer review and pathology working group review (Experimental Pathology Laboratories, 1999) were conducted on selected lesions of the liver observed in the two chronic/carcinogenicity studies with Fischer 344 rats with DINP (Exxon Biomedical Sciences, 1986; Covance, 1998) and confirmed the previous conclusions concerning liver histopathological findings.
In kidneys, a minimal increase in tubular cell pigment was noted in the tubular epithelium of high-dose male rats, sacrificed after 6, 12 and 18 -month treatment. At 24 months, histopathology examinations revealed an increased severity of tubular cell pigmentation in animals with advanced leukaemia (see Table 4.27).
Concerning kidney findings in male rats, a retrospective evaluation of archived tissue was conducted by immunohistochemical techniques (Caldwell et al., 1999b) and allowed to measure the accumulation of α2u-globulin in male rat kidneys. Using archived tissue obtained at 12-month interim sacrifice, a dose-dependant increase of α2u-globulin was identified by immunohistochemical staining techniques (IHC) in specfic region of male kidneys only. An increase in cell proliferation was confirmed by immunohistochemical detection of proliferating-cell nuclear antigen (PCNA) and located especially in the areas of α2u-globulin accumulation. Hematoxyllin and eosin-stained sections revealed tubular epithelial hypertrophy and regeneration consistent with the immunohistopathological findings. These findings were related to the α2u-globulin mechanism of male rat specific nephropathy which is not regarded as relevant to humans.
Table 4.27 Incidence of non-neoplastic liver lesions in rats fed DINP for 2 years
Sex Males Females Dose groups 0 0.03% 0.3% 0.6% 0% 0.03% 0.3% 0.6%
Mean daily intakes in mg/kg/d 0 15 152 307 0 18 184 375 Number examined 81 80 80 80 81 81 80 80
Focal necrosis 10 9 16 26 13 11 19 21
Spongiosis hepatis 24 24 51 62 4 1 3 4
Sinusoid ectasia 16 16 24 33 9 4 6 10
Hepatopathy associated with leukemia 22 17 34 33 16 18 24 33
Hepatocellular enlargement 1 1 1 9 1 0 0 11
Foci of vacuolated hepatocytes 15 14 1 0 17 16 8 5
Diffuse fatty changes 12 4 4 0 10 9 3 3
Cholangiectasis 52 25 16 20 10 6 3 5
Regenerative nodules 3 3 6 6 5 7 10 9
Based on slight decreased survival data in females, liver findings in males (increased incidence of spongiosis hepatis and increased serum levels of usual liver parameters), increase of absolute and relative liver and kidney weights in both sexes and other findings (e.g. increase of relative and absolute spleen weights in males) from 0.3% a NOAEL for chronic hepatic and renal effects of 0.03% might be considered which corresponds approximately to 15 and 18 mg/kg/day for males and females, respectively.
172

CHAPTER 4. HUMAN HEALTH
Chronic/carcinogenicity feeding study (Bio/dynamics, 1986)
The study was conducted in groups of Sprague Dawley CD rats (70/sex/dose level) to assess the long-term toxicity and carcinogenicity of Santicizer 900. DINP CAS number was not provided in the study. However, it was reported as 71549-78-5 in a risk assessment report of the US Consumer Product safety Commission and introduced as never produced commercially (Babich, 1998). Nevertheless, it is now described to enrich risk assessment data.
DINP (CAS not available, 99.9% active ingredient) was administered orally, via dietary admixture, at dose levels of 0 (standard diet) – 500 - 5,000 - 10,000 ppm for a period of 24 months The mean daily intakes (and ranges) of Sancitizer 900 were 27 (19 - 61), 271 (183 - 611) and 553 (383 - 1,194) mg/kg/day for male rats and 33 (22 - 59), 331 (218 - 579) and 672 (439 - 1,128) mg/kg/day for female rats corresponding to dose levels of 500 - 5,000 - 10,000 ppm, respectively.
Samples of each dietary levels were analyzed for homogeneity prior to study initiation and duplicate samples were taken for each dose level at weeks 1-4, months 2, 3, 6, 9, 12 15, 18, 21 and 24 for dose verification.
• Experimental procedure Clinical examination for mortality and signs of toxicity was performed twice daily; ophthalmologic examinations were conducted before the test period and at months 6, 12, 18 and 24. Detailed physical examination was conducted at weekly intervals; body weight and food consumption measurements were performed before the test period and weekly through 14 weeks, twice a week from week 19 through week 26 and monthly thereafter. Hematology (Hb, Hct, RBC count and morphology, total and differential leukocytes count), clinical chemistry (SGOT, SGPT, Alkaline phosphatase, BUN, glucose, cholesterol, triglycerides, total protein, albumin, globulin, sodium, potassium, calcium) and urine analyses (appearance, gravity, pH, protein, glucose, ketones, bilirubin, ocult blood, urobilinogen) were performed pretest on 20 rats/sex and on 10 animals/sex/group at selected intervals (months 6, 12, 18 and 24). After 12 months, 10 animals/sex/group were sacrificed and remaining survivors were sacrifice after 24 months. Complete gross post-mortem examinations were conducted on all animals. Selected organs (adrenals, brain, heart, kidneys, pituitary, testes with epididymides, thyroid/parathyroid, liver, ovaries) were weighed and organ/body weight ratios calculated. Histopathological evaluation was performed on selected tissues, which were preserved in 10% neutral buffered formalin and stained with hematoxylin eosin, and conducted on all animals of the control and high-dose groups and on livers only for all animals at 500 and 5,000 ppm dose levels.
• Results This study also concerns carcinogenicity section (cf. Section 4.1.2.8.1) but significant non-neoplastic findings, which allowed the determination of the NOAEL for chronic effects are hereafter reported.
Body weight changes: mean female body weights were lower than control at 10,000 ppm during the whole study (difference from control reached a maximum of 11.8%) and mean food consumption was greater than control from week 10 to the end.
Organ weight changes: high-dose males exhibited increased relative and absolute kidneys and liver weights at month 12 interim and at terminal sacrifice, similar increases in relative and absolute kidney weights were noted in high-dose females at month 12 and in mid and high-dose females at termination; increased relative and absolute liver weights were noted in mid and high-dose females at months 12 and 24. Relative and absolute thyroid weights were elevated in all treated rats (both sexes) at the 12-month interim sacrifice only. Increases noted in liver, kidney
173

EU RISK ASSESSMENT REPORT – DINP FINAL REPORT, 2003
and thyroid relative and absolute weights were for the most part statistically significant and were attributed to the administration of Santicizer 900.
Serum chemistry: Mean SGOT and SGPT levels were increased in males from 5,000 ppm dose at months 6, 12 and 18 and at 10,000 ppm dose level at month 24. Mean SGPT values were also increased in the mid and high-dose males at 6 and 12 months, in all treated males at 18 months and in the high-dose males at 24 months. Increased mean alkaline phosphatase levels were noted in mid and high-dose males at months 6 and 12 only. Although not statistically significantly different from controls in most instances, these findings were considered treatment-related due to the consistency with which they were noted in the treated males at most bleeding intervals.
Morphological change, both grossly and microscopically consisted of:
• a higher incidence of spongiosis hepatis in the mid and high-dose males and the high-dose females when compared to their respective controls,
• incidence of small foci of hepatocellular necrosis, frequently hemorrhagic, which were minimal to mild in severity was increased in treated males compared to their controls,
• increased incidence of testicular interstitial cell hyperplasia in high-dose males when compared to controls under study and historical range,
• slightly increased incidences of pancreatic islet cell tumours and parathyroid gland hyperplasia were observed in high-dose males and endometrial hyperplasia in high-dose females the significance of these findings being of uncertain significance,
• renal medullary mineral deposit in high-dose males.
Liver changes in treated males (foci of hepatocellular necrosis) allow deriving a LOAEL of 500 ppm (27 mg/kg/d) for chronic systemic effects although the absence of detailed histological data limits interpretation of findings.
2-year dietary oral toxicity study in rats
The study was carried out (Aristech, 1994 and 1995b; Butala et al., 1996; Covance, 1998). This study was complied with US EPA, 40 CFR Part 798.3300 guidelines and US EPA 40 CFR Part 792 GLP.
• Experimental procedure: Groups of 70-85 F-344 rats/sex were administered 0 - 500 - 1,500 - 6,000 - 12,000 ppm DINP (CAS not specified, purity > 99%) in the diet for 104 weeks. A recovery high-dose group of 55 rats/sex, was administered 12,000 ppm DINP for 78 weeks, followed by a 26-week recovery period during which untreated diet was given. A positive control group of 15 male rats was given 1,000 ppm of WY 14,643 ([4-chloro-6-(2,3 xylidino)-2-pyrimidinylthio]acetic acid > 98% purity) in the diet for 13 weeks. Hepatocellular proliferation rates and biochemical analyses (protein concentration, cyanide insensitive palmitoyl-CoA oxidation and DNA concentration) were performed on 5-15 rats/sex sacrificed at selected intervals i.e. w-1, w-2, w-13, w-79 and/or w104 (Table 4.28).
174

CHAPTER 4. HUMAN HEALTH
Table 4.2 Study design 8
Dietary levels (ppm) Sacrifices intervals Total n°
w – 1 w- 2 w-13 w-79 w-104-106
a) a) a) b) c) a) b)
0 5m + 5f 5m + 5f 5m + 5f 0 55m + 55f 85m + 85f
500 5m + 5f 5m + 5f 5m + 5f 0 55m + 55f 70m + 70 f
1,500 and 6,000 5m + 5f 5m + 5f 5m + 5f 15m + 15f 55m + 55f 70m + 70 f
12,000 5m + 5f 5m + 5f 5m + 5f 15m + 15 f 55m + 55f 85m + 85f
12,000 (w-78) 0 0 0 0 55m + 55f 55m + 55f
Positive controls 5m 5m 5m 0 0 15 m
a) Measurement of hepatocellular proliferation rates and biochemical analyses on 5 rats/sex from the 0 -500 - 1,500 - 6,000 - 12,000 ppm andpositive control groups during w-1, w-2 and w-13 and on 5 rats/sex from the 0 - 6,000 and 12,000 ppm groups during w-104
b) Implantation of osmotic mini-pumps, sacrifice and tissue collection for hepatocellular proliferation and biochemical analyses on 5 rats/sex c) Histomorphological evaluation on 10 rats/sex
For weeks 1 through 104, the average daily consumed doses of DINP was 29.2 - 88.3 - 358.7 and 733.2 mg/kg/day in males and 36.4 - 108.6 - 442.2 and 885.4 mg/kg/day in females of the 500 - 1,500 - 6,000 and 12,000 ppm groups, respectively. For weeks 1 through 76 in the recovery group, the consumed doses were 637.3 and 773.6 mg/kg/d in the males and females, respectively. Homogeneity analyses indicated that the test article was homogeneously mixed; formulations were stable for 14 days at room temperature and their concentrations were within 15% of the nominal.
Mortality and clinical signs of toxicity were recorded twice daily; detailed clinical examinations were performed weekly; body weights and food consumption were recorded prior study initiation, at weekly intervals from w-1 to w-17 and at monthly intervals thereafter.
Laboratory analyses were carried out in 10 rats/sex/group during w-26, w-52, w-78 and w-104. Hematology parameters included absolute reticulocyte counts, platelet, leukocyte and erythrocyte counts, MCH, MCHC, MCV, Hct, Hb, and myeloid/erythroid ratio at necropsy). Serum chemistry parameters included albumin, albumin/globulin ratio, calcium, chloride, creatinine, GGT, globulin, glucose, inorganic phosphorus, potassium, ASAT, ALAT, total bilirubin, total protein, BUN). Urinalyses included volume, osmolarity, sodium, potassium, chloride, calcium, phosphorus, creatinine, creatinine clearance, bilirubin, glucose, ketones, occult blood, pH, protein, specific gravity, urobilinogen and microscopic examination of the sediment).
All rats found dead or sacrificed in moribund condition and all survivors at end of the study were subjected to a gross examination. Organ weights were determined at w-79 and at terminal sacrifice (brain, testes with epididymides, spleen, kidneys, liver, lung, and uterus). All tissues from the controls, the high-dose group and from animals dying or sacrificed moribund during the study as well as all gross lesions from all animals were examined microscopically. Tissues were preserved in 10% neutral buffered formalin, embedded in paraffin and stained with hematoxylin and eosin. The tissue samples from the three liver lobes and the duodenum were processed for evaluation of protein concentration, cyanide-insensitive palmitoyl-CoA oxidation and DNA.
175

EU RISK ASSESSMENT REPORT – DINP FINAL REPORT, 2003
• Results This study also concerns the carcinogenicity section (cf. Section 4.1.2.8.1) but significant non-neoplastic findings, which allowed the determination of the NOAEL for chronic effects are reported.
Survival: In both sexes, survival was unaffected by treatment through week 78 and exceeded 93%; however, at week 104, a dose related decrease of survivorship was observed in both sexes of the 6,000 and 12,000 ppm groups (including the recovery group), with a statistically significant decrease in the 12,000 ppm male group (percent of survivors was 74%, 71%, 78%, 66%, 54% and 58% in the males and 76%, 80%, 80%, 71%, 66% and 70% in the females of the control – 500 - 1,500 - 6,000 - 12,000 and 12,000 recovery groups, respectively.
Clinical in-life observations and food consumption: treatment-related clinical abnormalities (urine stains, hunched posture, entire body pale, thin, hypoactive, few or no feces) were observed in both sexes of the mid-high, high and high recovery dose groups. There were no treatment related effects on food consumption, although the high-dose females exhibited significantly lower values than controls (these findings were considered as spurious since no similar decrease was seen in the high recovery dose females during the same time period).
Body weight: treatment related reductions of body weight gain occurred in both sexes of the mid-high, the high and high recovery dose groups, although a recovery was seen during the recovery phase (week 79 - 104): the respective mean total body weight gain from weeks 1 to 104 were 2.7%, 10.2% and 5.8% lower in treated males, and 6.5%, 14.9% and 9.1% lower in treated females, compared to the mean controls values.
Hematology: slight but significant changes in hematology parameters included decreased erythrocyte count at week 26, and hematocrit value at week 26 and 52 in female rats at 1,500 ppm. However blood effects were small and generally within the reference values for the laboratory. It was also observed mild decreases in the erythrocyte mass (erythrocyte count, hematocrite value and hemoglobin) which occurred in both sexes among the mid high, the high and high recovery dose groups at most intervals. They seemed reversible, as values were not longer significantly different from controls in the high recovery dose groups at week 104.
Biochemical findings: treatment related clinico-chemical findings were observed in the mid-high and high-dose groups and included increased mean values of serum urea nitrogen (increases being within 32% and 50% of the control values in both sexes of the mid-high and high-dose groups and values remaining elevated only in the males of the high-recovery dose group) at all intervals (weeks 26, 52, 78 and 104), that was correlated with histologic evidence of kidney toxicity.
Increased aspartate aminotransferase (AST) and alanine aminotransferase (ALT) were observed from the mid low-dose in females at week 78 and in both sexes of the mid high and high-dose groups, at the week 52, 78 and 104 sampling intervals, with no indication of reversibility in the high recovery dose groups. Those changes were associated with histological evidence of liver toxicity.
With respect to previous results liver and kidney were target organs.
Liver: In both sexes of rats of the mid high and high-dose groups, enlargement and/or granular/pitted/rough changes were observed (unscheduled deaths, killed at week 79 and at study termination) as well as, statistically significant increases in mean absolute and/or relative liver weights at weeks 1, 2, 13, 79 and at study termination. Indeed, relative liver weights of males
176

CHAPTER 4. HUMAN HEALTH
were increased at 6,000 and 12,000 ppm at all interim sacrifices and at termination, whilst absolute weights were only increased at 12,000 ppm at all interim sacrifices and from 6,000 ppm at termination (13.09 and 15.02 vs. 10.24 in controls at respectively 6,000 and 12,000 ppm).
Females exhibited increased absolute and relative liver weights at 6,000 and 12,000 ppm at all interim sacrifices and at termination (at termination in the mid and high-dose groups absolute liver weights were 8.56 and 10.91 g vs. 6.97 in controls).
However, the liver enlargement appeared to be reversible and absolute and relative liver weights in the high recovery dose group were comparable to control values (10.73 g vs. 10.24 g in males and 7.17 g vs. 6.97 g in females).
After 1 week of treatment, significant increases of the numbers of mitotic cells, of mean labelling index for hepatocytes and of the palmitoyl-CoA oxidase activity were observed in the livers of all 5 males and 5 females of the high-dose group. After 2, 13 and 79 weeks, only diffuse hepatocellular enlargement and significantly increased palmitoyl-CoA oxidase of activity were evident in all high-dose males and females killed at this time interval (number mitotic cells and labelling index were no longer increased compared to controls, indicating that peroxisome proliferation but not cell proliferation was still occurring in both sexes of the high-dose group). At study termination (week 104), diffuse hepatocellular enlargement was observed only in high-dose males (14/32, mean severity=0.9) and females (27/37; mean severity=1.5) and palmitoyl-CoA oxidase activity was again significantly elevated in this group, but also in mid high-dose females. Palmitoyl-CoA oxidase activity was not evaluated in the high recovery dose group, making the evaluation of reversibility not assessable. Indeed, large increases were observed in the positive control animals at week 1, but questionable responses were observed at week 2 and 13. Those results showed evidence of peroxisome proliferation associated with cell proliferation at week-1 only, but absence of "reliable" positive control group may limit conclusion.
Other effects detected in liver were:
• increased cytoplasmic eosinophilia, observed in both sexes, at the high-dose e.g. 26/32 males and 30/37 females;
• increased pigment in Kupffer cell/bile canaliculi (first detected at week-79 in 5/10 males and seen at study termination in 1/41, 0/36, 5/32 and 2/29 males and in 5/42, 5/38, 14/37 and 9/34 females of the control -6,000 -12,000 and 12,000 recovery groups, respectively).
A histopathology peer review and pathology working group review (Experimental Pathology Laboratories, 1999) were conducted on selected lesions of the liver observed in the two chronic/carcinogenicity studies with Fischer 344 rats with DINP (Exxon Biomedical Sciences, 1986; Covance, 1998). They have confirmed the previous conclusions concerning liver toxicity and further indicated that there was a treatment related increased incidence of spongiosis hepatisis in male rats only at 6,000 ppm and 12,000 ppm.
Kidney: At necropsy, it was reported dark appearance in both sexes of the mid and high-dose groups. In these groups from week 79 up to termination, absolute/relative kidney weights were increased. In the high-dose group, at week 79 and at termination absolute kidney weights of males were, respectively 2.96 and 2.99 g vs. 2.60 and 2.59 g, those of females were, respectively 2.05 and 2.03 g vs. 1.74 and 1.84 g. Nevertheless, this increased appeared reversible, since in the high recovery dose groups, kidney weights were comparable to control values (2.69 g vs. 2.60 g in males and 1.88 g vs. 1.84 in females).
177

EU RISK ASSESSMENT REPORT – DINP FINAL REPORT, 2003
At week 79, compound-related histopathological alterations of the kidneys occurred in females at 12,000 ppm as increased pigment in renal tubules and in males from 6,000 ppm as mineralisation of the renal papilla and increased pigment in renal tubules. Kidney changes at 104 weeks consisted of mineralization of the renal papilla in the mid, high and high recovery -dose males and of increased pigment tubule cell at 6,000 and 12,000 ppm in both sexes.
Carcinogenic effects of DINP, only suggested in the text are thoroughly reported in the carcinogenicity section (cf. Section 4.1.2.8.1).
Pertaining to non-neoplasic findings, liver and kidney were target organs. The increase of liver weights (absolute and relative) and liver biochemical parmaters (increased ALT and AST) in both sexes from the mid-high dose of 6,000 ppm associated with histopathological evidence of liver toxicity led to set up a NOAEL of 1,500 ppm (88-108 mg/kg/d). The same NOAEL value was assumed for kidney effects, based on increased absolute/relative weights in both sexes from the mid-high dose of 6,000 ppm, from week 79 up to termination.
Feeding study (BASF, 1960 a;b)
A feeding study was carried out in 1957 on DINP (CAS 28553-12-0, DINP3) using a small number of animals (10 Sprague Dawley rats/sex/group) which were given daily administration of pelleted feed containing of 0.5% at the beginning of the exposure period and 0.4% at the end of the first year. Study duration was about 1,000 days. No influence of treatment was found on growth and survival rates. Given the limitation of reporting, the small number of animals, this study has to be disregarded.
Mice
4-week feeding study (Hazleton, 1991b)
DINP was administered over a 4-week period in the diet of 4 groups (group 2-3-4 and 5) of 10 male and female B6C3F1 mice at dose levels of 3,000-6,000-12,500 and 25,000 ppm (about 635-1,377-2,689 and 6,518 mg/kg/d in males and 780-1,671-3,287 and 6,920 mg/kg/d in females). A fifth group (group 1) served as control and received the basal diet only. Mice were examined daily for mortality and clinical signs, food consumption and body weight were recorded weekly, common biochemical and haematological parameters were measured at the end of the study. Regarding the small size of the mice of this study, the required serum volume to evaluate all parameters could not be obtained, in many cases, less than half of the animals in each group were used in statistical analyses, thus making it difficult to interpret the data and weakening the significance of these values. Bone marrow smears were prepared at the time of necropsy for the evaluation of myeloid/erythroid ratio (M/E). Liver with gallbladder, kidneys and testes with epididymides were weighed. Most of organs were fixed, stained, examined microscopically and conserved after necropsy. Tissues were preserved in 10% neural buffered formalin and embedded in paraffin.
Reduced weight gain was observed in animals treated with 25,000 ppm all over the observation period. There was a significant decrease in food consumption in group 5 females only. Food efficiency was negative in group 5 animals. Regarding haematological parameters, there were decreases of White Blood Cells (WBC) and Corrected WBC (COR WBC) in males at 25,000 ppm and increase of lymphocytes in females at doses up to 12,500 ppm. All other findings could be considered incidentals. There were increases in aminotransferase levels in
178

CHAPTER 4. HUMAN HEALTH
animals treated with 25,000 ppm and also a slight increase of blood urea nitrogen in males at this dose level.
Gross pathologies observed were primarily in liver: enlarged and dark and/or pale areas.
There were decreases of the absolute and relative kidney weights in males from 6,000 and higher (except for relative kidneys weight of animals at 25,000 due to the decrease of the body weight at this dose level). There was an increase of absolute and relative liver weight in all the males and in females from 6,000 and higher. In males there was a decrease of the relative and absolute testes weight at doses from 6,000 and higher. Although there were no microscopic findings in the testis, an increased amount of cellular debris was present in the tail of the epididymis of all the group 5 animals.
Histologically, hepatocytomegaly was observed in all treated males and in females from 6,000 ppm, other liver findings were necrosis, focal chronicle inflammation and were observed in group 5 males and in group 4 and 5 females. There were some cases of spleenic atrophy and tubular necrosis of the kidneys in group 5 animals. For the thymus, there was necrosis or depletion of the lymphocytes in group 4 and 5 males but sporadic incidences were noted in all of the female groups (including controls). All group 5 animal ovaries appeared smaller in section and the main histologic feature was the complete absence of corpora lutea (normal follicles were plentiful but the lack of luteinization would suggest an arrest of ovulation). Uteri of all group 5 females were also smaller than normal in cross sectioned areas and the endometrium was devoid of glands.
This test was performed according to GLP procedures and according to EPA guidelines.
In this 4-week study, no NOAEL could be determined, only a LOAEL of 3,000 ppm (635 mg/kg/d in males and 780 mg/kg/d in females) can be determined regarding liver effects at these dose levels. A NOAEL of 3,000 ppm can be derived for testicular effects based on relative and absolute testis weight decrease from 6,000 ppm. This study served as a range-finding study for the following one.
In a comparable study performed on DEHP results were quite similar. B6C3F1 mice were fed with 0 - 1,000 - 5,000 - 10,000 or 25,000 ppm in the diet for 4 weeks (Eastman Kodak 1992). Increase in liver weight was observed from 5,000 ppm and hepatocellular hypertrophy was confirmed histopathologically at 25,000 ppm. Kidney weights decreased from 5,000 ppm and testicular atrophy was observed at 25,000 ppm. Absence of corpora lutea in ovaries at 25,000 ppm was also observed.
13-week feeding study (Hazleton, 1992)
DINP (CAS 28553-12-0) was administered to B6C3F1 mice in the diet for 13 weeks. Ten mice/sex/group received test material at dose levels of 1,500 - 4,000 - 10,000 and 20,000 ppm (about 365 - 972 - 2,600 - 5,770 mg/kg/d) (groups 2 to 5, respectively). An additional group of 10 mice/sex/group received the basal diet only and served as negative control group (group 1). To evaluate the hepatocellular proliferation and peroxisomal proliferation, additional corresponding groups of 15 mice/sex/group at each dose level (groups 1 to 5) plus a positive control (WY 14,463)(group 6) of 15 mice/sex/group were evaluated 3, 30 and 90 days after study. Criteria evaluated in treated animals included survival, food consumption, body weight, ophtalmology, clinical pathology, organ weight, gross pathology and microscopic pathology. Tissues were preserved in 10% neural buffered formalin and embedded in paraffin. Assessment
179

EU RISK ASSESSMENT REPORT – DINP FINAL REPORT, 2003
of peroxisomal potential was also made in additional animals (biochemical parameters and microscopy).
There was no treatment-related effect on survival at any of the tested doses in the main study. Hunched posture and hypoactivity were observed in a group 5 female which was found dead. In the satellite animals, hunched posture, ataxia, hypoactivity, tremors, dyspnea, polypnea, sores, low body temperature were observed in group 5 and 6 animals, especially in those that were found dead or sacrificed in extremis. In the main and in the satellite studies, there was a dose-related decrease in body weight and body weight gain (significant at 20,000 ppm and in positive controls). In the main study, mean total food consumption was significantly increased in males from group 4 and 5 and in group 4 females. In the satellite study, the food consumption of positive control was decreased during the whole period of the study.
In the main study, there were no ophtalmology findings. There were slight changes in haematology but not dose-effect and without any changes in the erythrocyte parameters (considered to be not treatment-related). As related in the preliminary 4-week study, low volumes of serum samples affected the statistical analysis of many biochemical parameters. Increases of transaminases (ALT and AST) were observed in 20,000 ppm males. There were significant decreases in the urinary values of sodium, chlorides and creatinine in group 5 animals, along with a slight increase of the volume and a lower specific gravity in males.
Enlarged livers were observed from 4,000 ppm and higher in males and from 10,000 ppm in females. Pale areas were sometimes seen in males from 10,000 ppm and in females at 20,000 ppm. Granular/pitted/rough kidneys were noted in some group 5 animals. Small uterus was observed in group 5 females and thickening of the wall was noted in 1/10 female at 1,500 and 2/8 at 10,000 ppm. In the satellite study, the same liver findings were observed in groups 3 through 5 animals and in positive controls and only one small uterus was noted for one positive control female.
In the main study, absolute and relative weight of the uterus was decreased in group 5 females. There were an increase of the relative and absolute liver weights from 4,000 ppm in males and females and a decrease of the absolute and relative kidney weight in males at the same dose levels. Absolute testis/epididymis weights were decreased from 10,000 ppm and higher. In the satellite study, mean absolute liver weight was increased, in males, in groups 3 and 6 and, in males and females, in groups 4 and 5. Mean relative liver weight was increased in all animals above 4,000 ppm (except females of group 6).
In the main study, moderate to moderately severe diffuse hepatocellular enlargement, pigments in Kupffer cells and bile canaliculi, and liver degeneration/necrosis (minimal or slight) were observed in animals treated with 20,000 ppm DINP. At 10,000 ppm, there was only hepatocellular enlargement (centrilobular to midzonal). Other changes at 20,000 ppm were tubular nephrosis in the kidneys, immature/abnormal sperm forms in the epididymis, lymphoid depletion in the spleen and thymus, hypoplasia in the uterus and absence of corpora lutea in the ovaries. In the satellite study, compound related lesions were observed in the liver after 3, 30 or 90 days of administration of 10,000 ppm DINP or 1,000 ppm WY 14,463 (hepatocyte enlargement, degeneration/necrosis and pigmented cells).
Satellite group was assessed for cell proliferation and peroxisome proliferation. Group 4 (10,000 ppm) and negative controls did not shown any increase in cell proliferation even though a large increase in palmitoyl-CoA oxidase was observed in treated animals. Positive controls demonstrated important cell proliferation properties and large increases in palmitoyl-CoA oxidation.
180

CHAPTER 4. HUMAN HEALTH
This study was performed according to GLP procedures and according to EPA guidelines.
A NOAEL of 1,500 ppm (about 365 mg/kg/d) could be determined for this 13-week study, regarding effect on the liver at 4,000 ppm (enlarged liver and increases of absolute and relative liver weight). A NOAEL of 4,000 ppm can be derived for reproductive organs based on decrease in absolute testis/epididymis weights from 10,000 ppm.
104-week feeding study (Aristech Chemical Corporation, 1995c; Butala et al., 1997)
Groups of 70 B6C3F1/Crl BR mice /sex were administered daily for at least 104 weeks 0 – 500 – 1,500 – 4,000 and 8,000 ppm DINP (CAS not specified > 99% purity) in the diet (70/sex/group) (groups 1 to 5, respectively) corresponding to 0 – 90.3 – 275.6 – 741.8 and 1,560.2 mg/kg in males and 112 – 335.6 – 910.3 and 1,887.6 mg/kg in female. A recovery high-dose group of 55 mice/sex was also given 8,000 ppm DINP in the diet for 78 weeks, followed by a 26-week recovery period (Table 4.29).
This study which was conducted in accordance with EPA guidelines, 40 CFR Part 798.3300, complied with EPA GLP Standards 40 CFR, Part 792. It was designed to assess the oncogenic potential of DINP when administered in the diet and to provide its ability to cause hepatocellular proliferation and peroxisomal proliferation.
Homogeneity of test article in diet was determined prior to study initiation for the low and high-dose level: batches prepared weekly were homogeneous (relative sd < 3%); stability vas checked at room temperature for 7 and 14 days (all 7 and 14 days values were within 12% of the initial concentration); concentrations of test article, determined at all dietary levels at weeks 1, 13, 26, 52, 78 and 104 by HPLC were within the acceptable range of nominals (92 to 112%).
Findings and observations reported in this section only concerned chronic effects induced by DINP, but as the study was designed to assess oncogenicity of DINP in mice, further results on neoplasic findings are reported in the carcinogenicity section.
• Experimental procedure
Table 4.29 Study design
Sacrifice schedule Dose groups Dietary levels (ppm) Total n° of mice Week 79
1) 2) Week 105-106
1) 2)
Controls 0 70 m + 70 f 15 m + 15 f 55 m + 55 f
Low 500 70 m + 70 f 15 m + 15 f 55 m + 55 f
Mid low 1,500 70 m + 70 f 15 m + 15 f 55 m + 55 f
Mid high 4,000 70 m + 70 f 15 m + 15 f 55 m + 55 f
High 8,000 70 m + 70 f 15 m + 15 f 55 m + 55 f
Recovery high 3) 8,000 55 m + 55 f 0 55 m + 55 f
1) Determination of hepatocellular rates and biochemical parameters (protein, palmitoyl-CoA oxidation and DNA) 2) 5 mice/sex sacrificed and their tissues were processed for hepatocellular proliferation and biochemical analyses (week 105-105 only for
recovery high group) 3) 78 weeks of treatment followed by 26-week recovery with basal diet
181

EU RISK ASSESSMENT REPORT – DINP FINAL REPORT, 2003
Mortality and clinical signs of toxicity were recorded twice daily; detailed clinical examinations were performed weekly; body weights and food consumption were recorded prior to study initiation, at weekly intervals from w-1 to w-17 and at monthly intervals thereafter.
Laboratory analysies were carried out on 10 mice/sex/group during w-26, w-52, w-78 and w-104; hematology parameters included absolute reticulocyte count, platelet, leukocyte and erythrocyte counts, MCH, MCHC, MCV, Hct, Hb, and myeloid/erythroid ratio at necropsy; serum chemistry parameters included albumin, albumin/globulin ratio, calcium, chloride, creatinine, GGT, globulin, glucose, inorganic phosphorus, potassium, ASAT, ALAT, total bilirubin, total protein, BUN; urinalyses included volume, osmolarity, sodium, potassium, chloride, calcium, phosphorus, creatinine, creatinine clearance, bilirubin, glucose, ketones, occult blood, pH, protein, specific gravity, urobilinogen and microscopic examination of the sediment.
All mice found dead or sacrificed in moribund condition and all survivors at end of the study were subjected to a gross examination; organ weights were determined at w-79 and at terminal sacrifice (brain, spleen, kidneys, testes with epididymides, lung, liver, uterus); all tissues from the controls, the high-dose group and from animals dying or sacrificed moribund during the study as well as all gross lesions from all animals were examined microscopically (adrenal glands, all gross lesions, aorta, brain, oesophagus, eyes, femur, heart, kidney, large intestine, liver, lung, lymph nodes, mammary region, ovaries, pancreas, sciatic nerve, pituitary, prostate, salivary glands, seminal vesicles, skeletal muscle, small intestine, spinal cord, spleen, stomach, testes with epididymides, thymus, thyroid with parathyroids, trachea, urinary bladder, uterus with vagina and cervix).
Samples from the three liver lobes and the duodenum from 5 mice/sex/group in control group and high- dose group at week 79 and at week 104 were processed for evaluation of protein concentration, cyanide-insensitive palmitoyl-CoA oxidation, and DNA concentration. Animals with leukemia and hepatopathy were not analyzed for cell proliferation.
• Results Survival: adjusted mean survival rate (excluding interim sacrifice, accidental deaths and mice removed from the study) was significantly decreased for the high-dose males compared to the controls (calculated values were 87, 87, 76, 79, 63 and 81% for males and 81, 79, 81, 62, 77 and 75% for females from the control, low, mid-low, mid-high, high and recovery high-dose groups, respectively).
Clinical in-life observations: treatment-related clinical findings were signs of poor health/ or ante-mortem condition (hunched posture, hypoactivity, few feces and urine stains which predominated in the high-dose animals) and swelling in the ventral-abdominal region, in which the notably increased incidence in the mid-high-dose males and the high-dose females appeared to correlate with the incidence of the animals found to have liver masses at necropsy.
Food consumption: total mean food consumption values were generally comparable between groups, with the exception of the significantly increased values noted at weeks 78-104 for mid-high and high-dose males.
For weeks 1 - 104, the mean daily test article consumption was 0 – 90.3 – 275.6 – 741.8 and 1,560.2 mg/kg in males and 112 – 335.6 – 910.3 and 1,887.6 mg/kg in females.
182

CHAPTER 4. HUMAN HEALTH
Body weight: significantly decreased body weight means were noted at several time intervals in the mid-high, high-dose mice of both sexes and recovery high-dose males; total body weight gains were decreased for the mid-high and high-dose males for weeks 79 - 104 (but increased in the recovery high-dose males) and were decreased in the mid-low, mid-high and high-dose females for weeks 1 - 78 (but increased in the recovery high-dose females for weeks 79 - 104). A termination final body weights of male mice were significantly decreased by 10 and 17.4%, respectively in the mid-high and high-dose (29 and 26.6 g vs. 32.2 g in controls), whereas body weight of females was comparable to controls at any dose level.
Clinical findings: the most substantial clinical pathology findings were decreased leukocytes, lymphocytes and/or segmented neutrophil counts in high and recovery high-dose mice of both sexes (no significant changes were noted in the myeloid/erythroid ratios among groups), increased total proteins, albumin and globulins in high-dose males, increased ALAT and ASAT in high-dose males and recovery high-dose males and females and higher urine volumes concurrently with a lower osmolarity (with lower concentrations of sodium, potassium and chlorides) in high-dose and recovery high-dose mice of both sexes.
Organ weight changes: At interim sacrifice (week 79) and at termination, mean absolute kidney weights were significantly decreased in mid low, mid-high and high-dose males (decrease of 11.4, 24.3 and 27%, respectively at the mid-low, mid-high and high-dose) and relative kidney weights were also decreased in mid-high and high-dose males. At interim sacrifice, absolute and relative liver weights were significantly increased in high-dose mice of both sexes (only relative liver weights significantly increased in the mid-high-dose group). At termination, statistically significant increase of mean absolute and relative liver weights of males was observed in the mid-high and high-dose groups and absolute liver weights were increased, respectively by 13.2 and 32% (mean liver weights were 1.80 and 2.11 g in the mid-high and high-dose groups vs. 1.59 in controls). For livers of females, from mid low-dose, mean absolute and relative weights were increased but differences were not statistically significant and increase unsteady. However, absolute liver weights were increased by 23.4, 18 and 35% when compared to controls respectively in the mid-low and mid-high and high-dose (1.79, 1.71 and 1.96 g vs. 1.45 g). At termination, in mid-high, high- and recovery high-dose males, absolute and relative (to brain weight) testis weights were also decreased, (respectively by 11.1, 20.2 11.8%) but with no histological corroborate.
Histopathology: the most remarkable gross pathology findings at week 79 interim sacrifice was an increased incidence of liver masses in the mid-low, mid-high and high-dose males and high-dose females, enlarged liver in high-dose females and distended urinary bladder in high-dose 5 males. At study termination, the most substantial gross changes were lung masses in all groups (primarily in males), liver masses (most frequently seen in mid-high, high and recovery-high-dose groups), enlarged spleen (all groups, predominantly in females; due to increased extramedullary hematopoiesis or to involvement by hemangioma and/or hemangiosarcoma or hematopoietic neoplasia), granular pitted/rough kidneys in high-dose females (corresponding to increased incidence/severity of treatment-related nephropathy) and distended urinary bladder most frequently seen in mid-high and high-dose males, with no histological corrolate. Histological examinations revealed an increased incidence of cytoplasmic eosinophilia, diffuse hepatocellular enlargement, and pigment in high-dose males and females, in addition to neoplastic changes consisting mainly of hepatocellular neoplasia (see Section 4.1.2.8, carcinogenicity).
Administration of the test substance did not induce significant increases in the mean labelling index for livers of high-dose mice compared to controls. At week 78, the mean labelling index in
183

EU RISK ASSESSMENT REPORT – DINP FINAL REPORT, 2003
liver for control and high-dose groups was 1.24 and 0.59% in the males and 0.30 and 0.12% in the females, respectively. After 104 weeks of treatment, the mean labelling index in the liver for control and high-dose groups was 0.59 and 1.90% in the males and 0.41 and 1.44% in the females, respectively. There was no evidence of cell proliferation in the livers of male or female mice up to 8,000 ppm group compared to controls.
Peroxisome proliferation findings: after 78 weeks of treatment, the mean liver palmitoyl-CoA oxidase activity was significantly increased in all animals treated with 8,000 ppm compared to controls (36.07 and 37.09 NADH/minute/mg of protein in high-dose males and females respectively versus 3.75 and 2.25 NADH/minute/mg of protein in corresponding controls). Comparable results were noted after 104 weeks of treatment: 53.79 and 52.82 NADH/minute/mg of protein in treated males and females versus 6.7 and 6.54 NADH/minute/mg of protein in respective controls. At the dose of 8,000 ppm, DINP causes a great level of peroxisome proliferation.
Analyses of liver DNA concentration did not detect any biologically relevant differences in mean values between control and high-dose males or females after 78 or 104 weeks of DINP administration. Conversely, liver mean protein concentration was significantly increased in the high-dose mice compared to controls (At 78 weeks, 156.2 and 153 mg/g liver in males and females versus 132.7 and 126 mg/g liver in respective controls and at 104 weeks: 179.8 and 149.2 mg/g liver in treated males and females versus 151.5 and 126.8 mg/g liver in respective controls). Only the summary report was available for the assessment.
It should be noted that analyses were only performed in high-dose group at weeks 78 and 104.
Based on decrease of kidney weights (absolute and relative) throughout the study, increased incidence of liver masses in males and increased absolute liver weights (by 23.4% at termination) and decreased body weight gains of females from the mid-low-doses, a NOAEL of 500 ppm may be assumed for chronic systemic toxicity.
Rabbits
DINP (CAS 28553-12-0) was administered in 10.5% solution in olive oil to 16 rabbits (8 males and 8 females) (BASF, 1961). Duration of the trial was variable and depended on mortality and tolerance of animals. Three animals were dosed with 1,960 mg/kg DINP in olive oil (2, 5 and 14 administrations), 5 animals with 980 mg/kg DINP (3, 3, 8, 8 and 26 administrations), 4 animals with 490 mg/kg DINP (5, 7, 50 and 50 administrations) and 4 animals with 196 mg/kg DINP (3, 29, 50 and 50 administrations). Two control animals were dosed with 2 ml/kg olive oil and two other with 1 ml/kg.
Results in olive oil controls were quite similar to those of treated rabbits: death, pathological changes in urine (protein, red blood cells, leukocytes and epithelial cells), strong anaemia, pneumonia and necrosis of the liver.
Kidney damages were only mentioned in some treated rabbits and were not found in controls and there was an increase in disturbed liver functions compared to controls.
No firm conclusion can be drawn from this study.
Cats
A similar sub-acute toxicity test was also performed on cat (BASF, 1961). Three animals were dosed with 2 ml/kg of 50% DINP (CAS 28553-12-0) in olive oil (980 mg/kg). Six control
184

CHAPTER 4. HUMAN HEALTH
animals were administered 2 ml/kg olive oil (2 animals), 4 ml/kg olive oil (2 cats) and a mixture of 2 ml/kg of olive oil with 2 ml/kg of paraffin oil. Each animal received 60 doses.
All cats survived the 3-month treatment. Palatinol DN induced loss of appetite, vomiting, diarrhoea, loss of body weight and bronchitis but this was also observed in solvent controls.
No firm conclusion can be drawn from this study.
Dogs
In a 13-week feeding study (Hazleton, 1971a), groups of 4 beagle dogs of each sex were fed diets containing 0 - 0.125 - 0.5 - 2% (approximately 37-160-2,000 mg/kg/day as quoted in IUCLID) of MRD 70-46 (DINP, CAS 68515-48-0). Dosage level of 2% was increased to 4% from weeks 9 to 13.
Incidence of terminal body weight losses of 11% or more for the control and test groups were as follow: one female of the low-dose group, 2 males and one female of the mid-dose groups and 6 animals (3 males and 3 females) of the high-dose groups. The remaining control and test animals at week 13 exhibited either the same weight gain, maintained the same body weight or showed weight loss but within 10%. Decrease of food consumption was observed for males and females of the high-dose groups, when at week 9 dietary level increased from 2% to 4%. The authors hypothesised that the decrease in food consumption was probably due to the unpalatability of the test diets, and the body weight losses observed probably due to the decreases in food consumption.
Hematological values were generally comparable between control and test groups and no compound-related trends were observed.
A trend toward slightly to moderately elevated SGOT (ALT) was observed at week 4 from 0.125% in both sexes (by 37% in males and 48% in females) with a dose-related relationship in females (by 48% - 74% - 107% at 0.125%, 0.5% and 2% compared to control females) at week 13 from 0.125% in males (by 47% - 32% - 60% at 0.125%, 0.5% and 2% compared to control males) and at 2% (by 72% compared to control females) only in females. These biochemical changes were associated with an increase of absolute and relative liver weights from 0.5% in males and at 2% in females when compared to control animals. At 2%, the absolute liver weight was 339 g vs. 242 g in males and 347 g vs. 221 g in females. The microscopic examination revealed at 2% in both sexes hepatocytic hypertrophy associated by decreased prominence of hepatic sinusoids. Appearance of the hepatocytic cytoplasm varied from fine granular to vacuolated in appearance. In addition, demonstrable changes also consisted of bile retention accompanied by pronounced papillary infoldings of the gallbladder mucosa at 2% in both sexes. Slightly low calcium values were detected in both sexes at 2%. The results of urine analysis were comparable between the control and test groups.
At 2%, the absolute and relative kidney weights were increased in few animals and hypertrophy of kidney tubular epithelial cells. Kidney discolorations (pale to dark/brown, red/purple) were observed in treated females.
The absolute and relative spleen weights were decreased in males at 2% without prominent changes in the spleen ratio. This effect might be due to the decrease in body weights. An increase of pigment in spleen was noted from 0.5% in females only.
Testes weights were generally comparable between control and test group and no treatment related effects were seen histologically on testes (preserved in Bouin's fixative) or on ovaries.
185

EU RISK ASSESSMENT REPORT – DINP FINAL REPORT, 2003
In this study, no NOAEL is identified. The LOAEL is 0.125% (37 mg/kg/d) based on the increase of SGOT (ALT) activity observed from 0.125%. The absence of statistical data and the fact that there was some inconsistency occurred between text and tables weaken the relevance of the study.
Monkeys
In a marmoset monkey study (16-25 months old) performed by Huntingdon Life Sciences (1998), four groups of four marmosets/sex/group were administered DINP (CAS number not specified, purity 99.2%) daily by gavage at dose levels of 0 - 100 - 500 - 2,500 mg/kg/d for a period of 13 weeks after 3-week acclimatisation period. An additional group was treated with 500 mg/kg/d clofibrate to act as a reference control. This study was performed according to OECD TG and conducted in accordance with GLP.
Animals were examined daily for clinical symptoms and food consumption and weighed weekly. An ophtalmoscopic examination was performed before the treatment and at week 12. Blood samples were obtained and analysed before treatment and during week 6 and 13 (17 parameters for hematology and 18 parameters for biochemistry). Additional blood sample was obtained before the study and at week 12 for assessing hormonal parameters: oestradiol and testosterone. Overnight urine was collected and analysed before the study and during week 5 and week 12 of the treatment. At the end of the treatment period, animals were sacrificed and examined for gross pathologies, organs were weighed, liver samples (minimum 5 g) were obtained as soon as possible after weighing, frozen immediately in liquid nitrogen and embedded in paraffin wax. Most tissues were preserved in 10% neutral buffered formalin except eyes (preserved in Davinson's fluid), testes and epididymides (preserved in Bouin's fluid).
In order to assess an eventual peroxisome proliferation, frozen liver samples were also included for the following analysis:
• liver weight, • 3,00 g supernatant and microsomal protein concentrations, • cyanide insensitive palmitoyl CoA oxidase activity (measured in the 3,00 g supernatant), • cytochrome P450 concentration (measured in the microsomes), • lauric acid hydroxylase activity (measured in the microsomes).
Body weight losses or low body weight gains were observed for males and females at 2,500 mg/kg/d DINP. There were no treatment-related changes in biochemical parameters (including triglycerides and cholesterol) or in hormonal concentrations assessed. No histological findings were considered to be treatment-related. Any change in weights or macroscopic / microscopic findings were not observed for testes.
For peroxisomal parameters assessed, clofibrate treatment led to a statistically increases in females only of microsomal protein and of cytochrome P450 concentrations and in palmitoyl CoA oxidase (2-fold increase in both sexes) and lauric acid hydroxylase activities (2-fold increase in males when expressed as nmoles/min/mg protein and significant increase of 58% in females only when expressed as nmoles/min/g liver). In comparison for 2,500 mg/kg/d DINP, the following changes were mentioned in the report:
• a slight increase in palmitoyl CoA oxidase activity (11% in males and 19% in females when expressed per gram of liver);
186

CHAPTER 4. HUMAN HEALTH
• a slight increase in lauric acid 11-hydroxylase (27% in males and 19% in females when expressed per mg of microsomal protein) and a slight increase in lauric acid 12-hydroxylase (29% in males and 35% in females when expressed per mg of microsomal protein). This trend was not seen when the results were expressed per gram of liver.
However, considering the absence of statistical significance, the wide range of individual variations within each group, and the absence of change in liver weights, those findings are not considered biologically significant.
In conclusion, at the high dose of 2,500 mg/kg/d DINP, only minor changes were observed: decreases of body weight and body weight gain. Therefore a conservative NOAEL of 500 mg/kg/d can be assumed for systemic toxicity.
4.1.2.6.2 Dermal exposure
Rabbits
In a 6-week dermal study (Hazleton, 1969), groups of 4 New Zealand White rabbits each received doses of 0.5 ml and 2.5 ml/kg of body weight MRD 69-4 (DINP 68515-48-0). A control group received applications of mineral oil (2.5 ml/kg of body weight). Applications were made once daily for 24 hours on abraded and intact skin, five days a week, for a total of 30 exposures. Criteria used to evaluate compound effect were physical appearance, behaviour, body weight, survival, dermal irritation, clinical laboratory studies (hematology, urine analyses) and gross and microscopic (liver, kidney and skin) pathology.
DINP effect was confined to gross alterations of the skin. At the 0.5 ml/kg level, mild dermal irritation occurred which was slightly more severe than irritation produced by mineral oil in the control group. At the higher level (2.5 ml/kg), slight or moderate (abraded skin only) erythema and slight desquamation were noted through the fifth week of application. Acanthosis, hyperkeratosis, and dermatosis of comparable severity were observed in both the control and treated animals but incidence of these effects was difficult to assess.
Histologically, MRD 69-4 failed to cause compound-related changes in kidney and liver tissues, hepatic lesions consistent with a diagnosis of hepatic coccidiosis were noted in both control and treated animals associated with the death of two control animals and one treated animal (2.5 ml/kg).
In this study, the NOAEL for systemic toxicity is 0.5 ml/kg (about 500 mg/kg). A mild dermal irritation is observed at this dose level.
4.1.2.6.3 Studies specifically designed to assess peroxisomal proliferation
Rats
14-day oral toxicity study (Hüls, 1992)
In a 14-day oral toxicity study (Hüls, 1992), DINP diluted in corn oil, was administered by gavage to female Fischer 344 rats (5/group) at doses of 25 - 75 - 150 - 1,500 mg/kg/d. In order to compare different toxic properties of phthalates, three different DINP were administered: Jayflex (DINP1) - CAS 68515-48-0 (99.6% pure), Palatinol N (DINP2) - CAS 28553-12-0 (99.9% pure)
187

EU RISK ASSESSMENT REPORT – DINP FINAL REPORT, 2003
and Vestinol 9 (DINP3) - CAS 28553-12-0 (99.7% pure). Concurrently, positive DEHP controls (1,500 mg/kg/d) and corn oil negative controls were tested.
Body weight gain and food consumption were assessed weekly, clinical symptoms and mortality were checked twice daily, current clinical hematology and chemistry analysis were carried out, absolute and relative weight of livers and kidneys were determined and the following tissues of control and 1,500 mg/kg/d groups were preserved in 10% formalin: skin, liver, kidneys, adrenals, spleen, heart and thyroid.
A biochemical examination of the liver has been performed. Microsomal and cytosolic fractions of liver samples were obtained by differential centrifugation. Protein and total cytochrome P450 (microsomal fraction only) content in each fraction were determined. In the microsomal fractions the activities of ethoxyresorufin O-desalkylase (EROD) as a biological marker for the isozyme P450IA1 and IA2, pentoxyresorufin O-desalkylase (PROD) as a biochemical marker for the isozyme of the P450IIB subfamily, p-nitrophenol hydroxylase (pNP) as a biochemical marker for the isozyme P450IIE1 and dodecanoic acid 12-hydroxylase (DOS) (also known as lauric acid hydroylase) as a biochemical marker for the isozymes of the P450IVA subfamily6 were determined. In the cytosolic fractions the activity of the lauryl-CoA oxidase (LCoA) as a biochemical marker for peroxisomal ß-oxidation was determined.
In order to determine the NOELs regarding the DOS activities, the microsomal fractions of the liver samples of the individual animals of the lower dosage groups (25 and 75 mg/kg/d) and the negative control group were analysed and a statistical evaluation was performed.
• Results For DINP1: a slight decrease of body weight gain and food consumption was observed in all dosed groups compared to controls (no dose-effect and not statistically significant).
A slight increase (statistically significant) of the relative and absolute liver weight was observed at the highest dose group (1,500 mg/kg/d).
Decreases of the albumin and total protein concentrations were observed at all doses (statistically significant). Regarding very high values found in controls (more than 1.5-fold physiological values) these increases could be considered as normal, except for the high-dose group (values were high in comparison to the normal range). For cholesterol, control values were also very high, however, comparing concentrations with physiological values, a slight decrease of cholesterol concentration had been noticed for the highest tested dose.
A slight decrease in TG values was noted for the 1,500 mg/kg/d group. This is consistent with hypolipidemic activity of phthalates.
Slight changes in hematology were observed at doses up to 150 mg/kg/d (decrease in RBC at 1,500 mg/kg/d (statistically significant) and 150 mg/kg/d (not statistically significant), decreased Hb at 1,500 mg/kg/d, decreased hematocrit statistically significant up to 150 mg/kg/d and in 1 animal at 75 mg/kg/d).
Except an hepatic nodule seen in one animal of the highest dose, no gross pathology had been noticed at necropsy. This nodule was supposed to be a herniation of liver but no histological examination was performed.
6 Inducible by molecules acting as peroxisome proliferators.
188

CHAPTER 4. HUMAN HEALTH
There was no effect on EROD and pNP activities, the PROD activity was enhanced fourfold in the highest dosage group, the LCoA activity was increased by a factor of 5.8 in the highest dosage group and the DOS activity was increased by a dose-effect manner from the lowest dose tested (very slight increase) to the highest dose tested (2.8-fold higher than the negative controls). Compared with DEHP positive control, effects were quite similar, there were no effects on pND and EROD activities and increases of LCoA, DOS and PROD activities were 4.4-fold, 4-fold and 8.3-fold higher than controls, respectively. However, the threshold level for induction of peroxisome proliferation in term of LCoA induction appears to be somewhat lower for DEHP (about 50 mg/kg/d) compared to the NOEL of the DINP in this study (150 mg/kg/d). Only LOAELs can be derived regarding the DOS activity for the DINPs under the conditions of this study, the results indicated that the threshold level for induction of DOS activity also may be lower for DEHP (approximately 10 mg/kg/d) compared to the DINPs.
The statistical assessment performed on the DOS activities at the lowest doses showed that no NOAEL was calculable for DOS activity of Jayflex (DINP1), only a LOAEL of 25 mg/kg/d can be derived for DOS activity.
For DINP2: a slight decrease of body weight gain was observed in all dosed groups compared to controls (no dose-effect and none statistically significant). A slight decrease in food consumption was also observed only at doses of 75 and 150 mg/kg/d.
A slight increase statistically significant of the relative and absolute liver weight was observed at the highest dose (1,500 mg/kg/d).
Decreases of the albumin and total protein concentrations were observed at all doses (statistically significant). Regarding very high values found in controls (more than 1.5-fold physiological values) these increases could be considered as normal, except for the high-dose group value of total protein concentration and except for the two highest doses groups values of albumin concentrations (values slightly more important that physiological standards). For cholesterol, control values were also very high, however, comparing concentrations with physiological values, a slight decrease of cholesterol concentration had been noticed for the higher tested dose.
Slight decrease in TG values was noted for 1,500 mg/kg/d group. This is consistent with hypolipidemic activity of phthalates.
Slight increase in PAL was observed at dose of 1,500 mg/kg/d.
For hematology, a slight decrease of monocyte percentages was observed for all doses except 150 mg/kg/d. This finding was certainly due to the high value of the controls.
No gross pathology had been noticed in necropsy.
There were no effects on pNP activity, the EROD activity was increased by a factor of 1.8 in the highest dosage group, the PROD activity was enhanced by a factor of 6.3 in the highest dosage group, the LCoA activity was increased by a factor of 5.4 in the highest dosage group and the DOS activity was increased by a dose-effect manner from the lowest tested dose (very slight increase) to the highest tested dose (two-fold higher than the negative controls). Compared with DEHP positive control, effects were quite similar, there were no effects on pND and EROD activities and increases of LCoA, DOS and PROD activities were 4.4-fold, 4-fold and 8.3-fold higher than negative controls, respectively. However, the threshold level for induction of peroxisome proliferation in term of LCoA induction appear to be somewhat lower for DEHP (about 50 mg/kg/d) compared to the NOEL of the DINP in this study (150 mg/kg/d). Only LOAELs can be derived regarding the DOS activity for DINPs under the conditions of this
189

EU RISK ASSESSMENT REPORT – DINP FINAL REPORT, 2003
study, the results indicated that the threshold level for induction of DOS activity also may be lower for DEHP (approximately 10 mg/kg) compared to DINPs.
The statistical assessment performed on the DOS activities at the lowest doses showed that a NOAEL of 25 mg/kg can be derived for the DOS activity for Palatinol N (DINP2).
For DINP 3: a slight decrease in food consumption was observed in 25-75 and 150 dosed groups compared to controls (no dose-effect and not statistically significant).
A slight increase statistically significant of the relative and absolute liver weight was observed at the highest dose (1,500 mg/kg/d).
A slight increase (statistically significant) of the kidney weight was observed at the highest dose (1,500 mg/kg/d). But all the individual values were in the limits of physiological values.
Decreases of the albumin and total protein concentrations were observed at all doses (statistically significant). Regarding very high values found in controls (more than 1.5-fold physiological values) these increases could be considered as normal, except for albumin concentrations in the two highest dose groups (values slightly more important that physiological standards). For cholesterol, control values were also very high, however, comparing concentrations with physiological values, a slight decrease of cholesterol concentration had been noticed for the higher tested dose.
A slight decrease in TG values was noted for the 1,500 mg/kg/d group. This is consistent with hypolipidemic activity of phthalates.
BUN was decreased at all concentrations (except 75 mg/kg/d) but was within the physiological standard range.
Except an hepatic nodule seen in two animals at doses of 25 and 75 mg/kg/d, no gross pathology had been noticed in necropsy. These nodules were supposed to be a herniation of liver but no histological examination was performed.
There were no effects on pNP and EROD activities, the PROD activity was enhanced by a factor of 3.7 in the highest dosage group, the LCoA activity was increased by a factor of 6.1 in the highest dosage group and the DOS activity was increased by a dose-effect manner from the lowest dose tested (very slight increase) to the highest dose tested (twofold higher than the negative controls). Compared with DEHP positive control, effects were quite similar, there were no effects on pND and EROD activities and increases of LCoA, DOS and PROD activities were 4.4-fold, 4-fold and 8.3-fold higher than the negative controls, respectively. However, the threshold level for induction of peroxisome proliferation in term of LCoA induction appears to be somewhat lower for DEHP (about 50 mg/kg/d) compared to the NOEL of the DINP in this study (150 mg/kg/d). Only LOAELs can be derived regarding the DOS activity for the DINPs under the conditions of this study, the results indicated that the threshold level for induction of DOS activity also may be lower for DEHP (approximately 10 mg/kg/d) compared to the DINPs.
The statistical assessment performed on the DOS activities at the lowest doses showed that a NOAEL of 25 mg/kg/d can be derived for the DOS activity for Vestinol 9 (DINP3).
190

CHAPTER 4. HUMAN HEALTH
Table 4.3 Comparison between three DINPs (Jayflex - Palatinol N and Vestinol 9) and DEHP. Results of a 14-day study with assessment of peroxisomal proliferation properties.
0
Symptoms weight variations
Non-specific biochemical parameter variations
Macroscopic and histologic findings
Specific enzyme (EROD-pNP-PROD-LCoA-DOS) variations
DINP 1 Jayflex
↓ body weight and food consumption at all doses
↓ alb - tot prot - chol and TG at 1,500 ↓ RBC and Hb at 1,500 ↓ hematocrit at 150
↑ liver weight (absolute and relative) at 1,500
↑DOS at 25 ↑LCoA at 1,500 ↑PROD at 1,500
DINP 2 Palatinol N
↓ body weight at all doses ↓ food consumption from 75
↓ alb at 150 and 1,500 ↓ tot prot - chol and TG at 1,500 ↑ PAL at 1,500
↑ liver weight (absolute and relative) at 1,500
↑DOS at 75 ↑LCoA at 1,500 ↑PROD at 1,500 ↑EROD at 1,500
↓ alb at 150 and 1,500 ↓ tot prot - chol and TG at 1,500
DEHP 1,500 mg/kg/d
↓ body weight and ↓ food consumption
↓ alb - tot prot - chol and TG ↓ RBC and Hb
↑ liver weight (absolute and relative) ↑ kidney weight (slight and within historical controls)
↑DOS ↑LCoA ↑PROD
DINP 3 Vestinol 9
↑ liver weight (absolute and relative) at 1,500 ↑ kidney weight (slight and within historical controls) at 1,500
↑DOS at 75 ↑LCoA at 1,500 ↑PROD at 1,500
Treatment of rats with three different types of DINP resulted in similar organ and serum effects. At a dose level of 1,500 mg/kg/d, increased liver weight, both absolute and relative to body weight, increased serum albumin and a decrease of serum triglycerides were observed. Minor changes were observed in the groups receiving 150 mg/kg/d, i.e. decreased hematocrit (DINP1), slight increase in serum albumin (DINP2 and DINP3). At equivalent dosage (1,500 mg/kg/d), DINP and DEHP treatment did not result in major differences with regard to target organs and serum parameters.
Similar effects on the hepatic enzyme activities studied were also observed. The LCoA activity was increased after treatment with either DINP in the highest dosage group leading to a NOAEL of 150 mg/kg/d. Whereas the NOEL for DEHP was 50 mg/kg/d (CEFIC 1982). Potency was considered equivalent for DEHP and DINPs.
In regard with DOS activity, no significant effect was observed for DINP2 and DINP3 at the dose of 25 mg/kg/d whereas DINP1 induced a significant increase of this activity at this dose level. This difference between the three DINP was established on two samples of livers and was only significant for one statistical study. Overall, it could be considered that the NOEL is close to 25 mg/kg/d for the DINP. In comparison, NOAEL established for DEHP for this activity was 10 mg/kg/d (Short et al., 1987) but the potency of peroxisomal proliferation properties was considered equivalent.
191

EU RISK ASSESSMENT REPORT – DINP FINAL REPORT, 2003
21-day feeding study (BIBRA, 1985)
In a 21-day feeding study groups of 5 young Fischer 344 rats (41-44 days old) of each sex were fed diets containing 0 - 0.6 - 1.2 - 2.5% DINP (CAS 68515-48-0) which correspond, respectively to 639 - 1,192 - 2,195 mg/kg/day in males and to 607 - 1,193 - 2,289 mg/kg/day in females. A further group was fed 1.2% di-(2-ethylhexyl)phthalate (DEHP) as a study control. The objective of this study was to establish dose-response relationships for the peroxisomal and related effects of DINP. This study was carried out in compliance with GLP procedures.
No treatment related clinical signs were observed. Both sexes of rats given 2.5% DINP lost weight during the first three days of treatment and remained statistically lighter than controls (88 - 72% of the control values). Animals given 1.2% DINP were significantly lighter on days 7 and 10 in the females (93 - 95% of the control body weights) and from day 7 to the end of treatment in the males (88 - 96% of control body weights). Females of the 0.6% DINP dose group were lighter than controls significantly from day 14 (91 - 97% of control weights). There was a statistically significant reduction of food intakes in both sexes at 2.5% DINP diet, but those of males remained significantly lighter than the controls (65 - 81%), unlike those of the females, which returned to normal as the study progressed. Males given 1.2% DINP consumed less food than controls throughout the study (86 - 92%) whereas in females after a slight initial reduction to 88% of the control value, food consumption by females given 1.2% DINP were then little affected. At 0.6% diet, no difference was observable in both sexes.
A statistically significant increase of the absolute and relative liver weight was observed from the lowest tested dose 0.6%. In the males, the absolute and relative liver weights were increased by respectively 136, 150, 165% and 136, 173, 232% when compared to control values, from 0.6% to 2.5% DINP diet. The females showed increases of absolute liver weights by 124, 164, 198% and of relative liver weights by 131, 175, 231%, respectively at 0.6, 1.2 and 2.5% DINP. In this way, at 2.5%, the absolute liver weight was in males 10.82 g vs. 6.56 g in control group and in females 8.33 g vs. 4.21 g and the relative liver weight 7.54% vs. 3.25% in males and 8.33% vs. 2.99% in females. Histologically, a reduction in hepatocyte cytoplasmic basophilia was detected from 1.2% associated at 2.5% with an increase in eosinophilia. Lower periportal lipid levels were seen in all treated animals without a dose-related response.
Serum triglyceride levels were reduced (0.50 mmol/l at 2.5% vs. 0.97 in control group) in all treated males with a clear dose-related response. In the female treated groups serum triglycerides were raised. Cholesterol concentrations were significantly reduced in all treated groups but without apparent dose relationship. In the DEHP treated group, serum cholesterol levels were significantly decreased in both sexes and triglyceride levels were reduced in males only (0.48 mmol/l vs. 0.97 in control group) and non-significantly increased in females.
There was a dose-related increase in cyanide-insensitive palmitoyl Co-A oxidation in both sexes, and the difference became significant in both sexes of rat given 1.2% DINP. Increases were of 452% in males and 376% in females given 1.2% DINP and 1,035% in males and 1,104% in females given 2.5% DINP. Males were more sensitive to the increase in lauric acid 11- and 12-hydroxylase activities. This was significantly different at all dose levels in males, but in females, only those given the highest dose. Total hepatic protein levels were increased in both sexes from the lowest tested dose. Microsomal protein levels were significantly increased in females given DINP at 0.6 and 1.2% (117% of control in both cases) but no dose relation could be seen. Electron microscopic examination showed that DINP at 2.5% produced a very marked increase in peroxisomes in males and a marked increase in females. Since rats responded in the
192
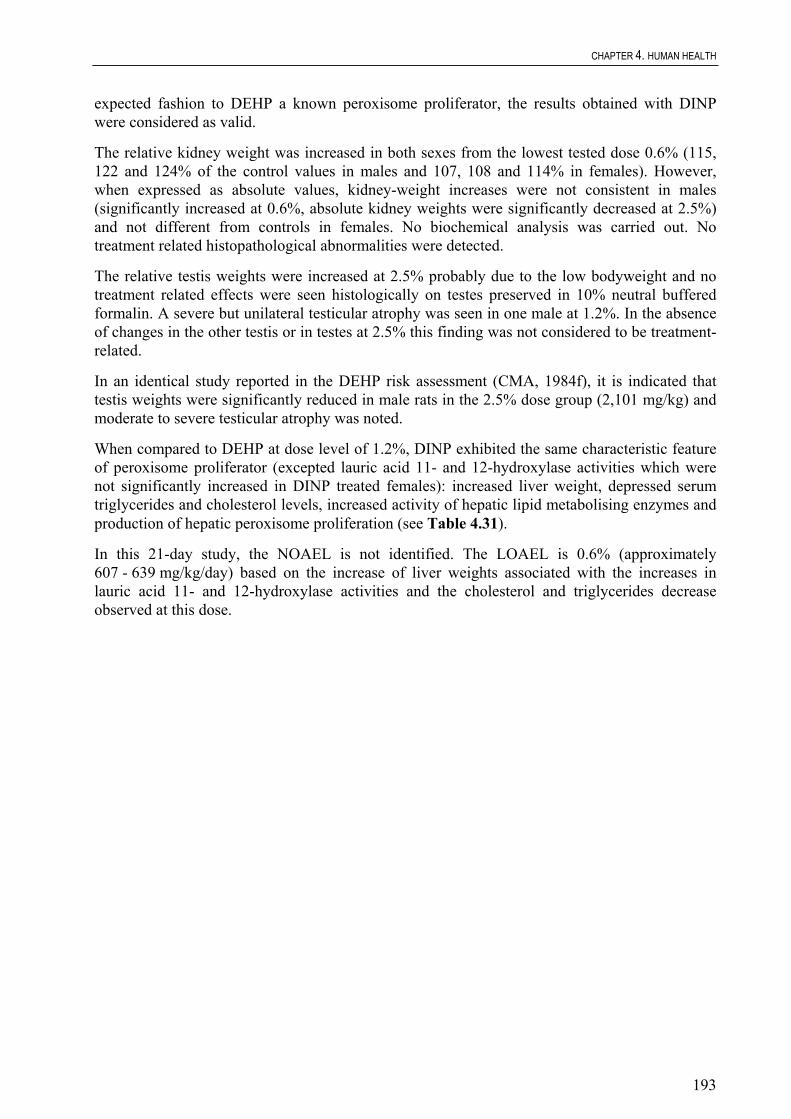
CHAPTER 4. HUMAN HEALTH
expected fashion to DEHP a known peroxisome proliferator, the results obtained with DINP were considered as valid.
The relative kidney weight was increased in both sexes from the lowest tested dose 0.6% (115, 122 and 124% of the control values in males and 107, 108 and 114% in females). However, when expressed as absolute values, kidney-weight increases were not consistent in males (significantly increased at 0.6%, absolute kidney weights were significantly decreased at 2.5%) and not different from controls in females. No biochemical analysis was carried out. No treatment related histopathological abnormalities were detected.
The relative testis weights were increased at 2.5% probably due to the low bodyweight and no treatment related effects were seen histologically on testes preserved in 10% neutral buffered formalin. A severe but unilateral testicular atrophy was seen in one male at 1.2%. In the absence of changes in the other testis or in testes at 2.5% this finding was not considered to be treatment-related.
In an identical study reported in the DEHP risk assessment (CMA, 1984f), it is indicated that testis weights were significantly reduced in male rats in the 2.5% dose group (2,101 mg/kg) and moderate to severe testicular atrophy was noted.
When compared to DEHP at dose level of 1.2%, DINP exhibited the same characteristic feature of peroxisome proliferator (excepted lauric acid 11- and 12-hydroxylase activities which were not significantly increased in DINP treated females): increased liver weight, depressed serum triglycerides and cholesterol levels, increased activity of hepatic lipid metabolising enzymes and production of hepatic peroxisome proliferation (see Table 4.31).
In this 21-day study, the NOAEL is not identified. The LOAEL is 0.6% (approximately 607 - 639 mg/kg/day) based on the increase of liver weights associated with the increases in lauric acid 11- and 12-hydroxylase activities and the cholesterol and triglycerides decrease observed at this dose.
193

EU RISK ASSESSMENT REPORT – DINP FINAL REPORT, 2003
Table 4.31 Comparative results of peroxisome proliferation parameters with 1.2% of DEHP, DINP and DIDP BIBRA study (1986)
Control group DEHP 1,2% DINP 1,2% DIDP 1,2% Effects
1) 2) 1) 2)
Male 6.56 (3.25)
6.64 (3.17)
12.73 ∗∗∗ (6.88)
13.10 ∗∗∗ (6.86)
9.84 ∗∗∗ (5.63)
12.38 ∗∗∗ (6.37)
Liver weights absolute (relative)
Female 4.21 (2.99)
4.35 (3.12)
7.26 ∗∗∗ (5.62)
7.41 ∗∗∗ (5.88)
6.89 ∗∗∗ (5.22)
6.94 ∗∗∗ (5.48)
Male 0.97 0.83 0.48 ∗ 0.50* 0.56 ∗∗∗ 0.55* Serum triglycerides (mmole/l)
Female 0.35 0.47 0.46 0.52 0.43 ∗ 0.50
Male 1.96 1.77 1.41 ∗∗∗ 1.44 ∗ 1.34 ∗∗∗ 1.32* Serum cholesterol (mmole/l)
Female 2.29 2.16 1.94 ∗ 2.08 1.94 ∗ 1.90
Male 6 5.1 41 ∗∗∗ 51 ∗∗∗ 27 ∗∗∗ 51.7 ∗∗∗ Cyanide – insensitive-palmitoyl-CoA oxidation (nmole/min/mg homogenate protein) Female 7 6 37.8 ∗∗ 33 ∗∗ 26.3 ∗∗∗ 44.9 ∗∗∗
Male 0.8 0.64 3.1 ∗∗ 2.15 ∗∗ 2.2 ∗∗∗ 2.12 ∗∗∗ Lauric acid 11 hydroxylase activity (nmole/min/mg)
Female 0.5 0.53 1.8 ∗∗ 1.35 ∗∗ 0.9 0.79
Male 1 0.84 12.4 ∗∗∗ 10.38 ∗∗ 7.6 ∗∗∗ 9.13 ∗∗∗ Lauric acid 12 hydroxylase activity (nmole/min/mg)
Female 0.8 0.81 6.2 ∗∗ 4.21∗∗ 1.3 1.33
Male 207 217 236 ∗∗∗ 239 ∗ 228 ∗ 258 ∗∗∗ Total protein (mg/g liver)
Female 198 224 237 ∗∗ 279 ∗∗ 238 ∗∗∗ 268 ∗∗∗
Male 25 26.3 25.1 25.6 26 27.6 Microsomal protein (mg/g liver)
Female 20 21.7 25 ∗ 21.6 23.6 ∗ 23.4
Male No No Yes Yes Yes Yes Reduction cytoplasmic basophilia
Female No No Yes Yes Yes Yes
Male No No No No No No
Histological finding: liver
Increased cytoplasmic eosinophilia
Female No No No No No No
Male + ++++ ++++ ++++ Centrilobular
Female + ++++ / +++ ++++ +++++
Male + ++++ +++++ ++++ Periportal
Female + ++++ / +++ ++++ +++++
Peroxisome proliferation (electron microscopic) 3)
1) Control values for DINP 2) Control values for DIDP 3) DINP-DIDP 2.5% (no evaluation at 1.2%) + few +++ moderate increase ++++ marked increase +++++ very marked increase Differ significantly from the control: * (P< 0.05) - ** (P < 0.01) - *** (P < 0.001)
194

CHAPTER 4. HUMAN HEALTH
Similar studies (Lin 1986; 1987)
Similar studies were performed in the same conditions on F-344 rats with 8 phthalate esters (BBP, DBP, 610 P, 711 P, DEHP, DINP, DIDP, DUP) and DEHA, each time with a control group fed 1.2% DEHP. For DINP, 5 males and 5 females per group were fed 0, 0.3, 1.2, and 2.5%, respectively. The effects on hepatic peroxisome proliferation were examined in a total of 132 animals: 2 animals of each sex per group were randomly selected in 33 groups (7 high-dose groups, the 9 negative control groups, the nine 1.2% DEHP control groups, and 4 groups in each DEHP and DEHA). Several end points were selected, the most important of which being the electron microscopy examination of liver centrilobular and periportal peroxisome proliferation. Histological abnormality in the kidneys and testes was not studied.
A peroxisome proliferator index (PPI) was constructed from a linear combination of all usable parameters that yield the best geometric separation among the 3 peroxisome conditions (low, moderate, and high). It is a weighted average of those parameters that best predict the outcome of the electron microscopic evaluation. It was found by linear discriminant analysis that the best predictive end point is the PCoA (correlation coefficient 0.867), with the relative liver weight performing nearly as well (correlation coefficient 0.861). The analysis also confirmed that females have less peroxisome proliferation than males (p < 0.001) after adjusting for body weight.
A ranking of the studied plasticisers was made according to this PPI. This ranking depends on the dosage, the most useful being considered as the one in the low-dose region. So, the statistically predicted dosages that would not induce peroxisome proliferation in 99% of rats were found to be: DEHP (8.8 mg.d-1), DINP (22.9), DIDP (35.8), DBP (43.7), 610 P (64.5), DUP (57.1), BBP (79.2), 711 P (72.8), and DEHA (140.5). Note that the numbers between brackets should be multiplied by a factor of 5 for a 200 g rat to express the result in mg/kg/d.
Short-term hepatic effects of DINP in rats (Smith et al., 1999; 2000)
The short-term hepatic effects of DINP in rats at tumorigenic and non-tumorigenic doses were evaluated for comparison with chronic studies and with data for other structurally similar dialkyl phthalate esters ranging from C7 to C11. Groups of male F344 rats were fed diets with DINP (CAS 68515-48-0) at concentrations of 0-1,000 or 12,000 ppm. After 2 or 4 weeks of treatment, changes in liver weight, replicative DNA synthesis, peroxisomal beta-oxidation (PBOx) and inhibition of gap junction intercellular communication (GJIC) were examined. In addition, hepatic concentrations of the parent compound and major metabolites were determined. Relative to controls, increased liver weight and PBOx at the high dose were consistent with peroxisomal proliferation. Hepatic GJIC was inhibited and DNA synthesis was increased at the high dose, which is also consistent with the tumorigenic response in rats at these doses. These hepatic effects were not observed at the low doses. Similarly, no liver tumours were observed in rats treated with low doses in chronic studies.
28-day feeding study (Shellenberg et al., 1983; Midwest Research Institute, 1981a)
DINP (R1268-R1286, CAS might be 28553-12-0) was administered at dietary levels of 0 - 0.2 - 0.67 - 2% to Fischer 344 rats (5 animals/dose/sex) (about 150 – 500 – 1,500 mg/kg/d for males and 125 – 420 – 1,300 mg/kg/d for females). DEHP and 711 phthalate were also tested in this study. Body weights and feed consumption were measured weekly. All animals were observed twice daily. Current clinical hematology and chemistry analysis were carried out. Special liver biochemical analyses: catalase and carnitine acetyltransferase (CAT) activities (peroxisome proliferator markers) were conducted. The following tissues: liver, kidneys, brain, adrenals,
195

EU RISK ASSESSMENT REPORT – DINP FINAL REPORT, 2003
spleen and testes or ovaries were weighed and preserved in neutral buffered for formalin for histopathology.
With R-1286, feed consumption at 2% was significantly lower at the end of the first week in the female groups but body weights of males and females treated with R-1286 were not significantly different from controls. With R-1268, feed consumption of males and females was also reduced significantly during the first 1 to 2 weeks respectively and body weights in both sexes were consistently lower than controls but the difference was not significant.
DINP produced significant dose-dependent increases in absolute and relative liver weights from 0.67% in both sexes when compared to control animals without associated histopathological changes. At 2%, the absolute liver weight was in males 12.8 g with R-1286 vs. 7.5 g and 14.4 g with R-1268 vs. 8.4 g. Serum triglycerides levels were reduced significantly in males from 0.67% with R-1268. No significant increases in SGOT or SGPT were detected. Hepatic catalase activity in both sexes was significantly increased in all treated groups. CAT activities were increased from 0.2% and this increase was more pronounced than catalase activity increase.
Table 4.3 Comparative table: hepatic catalase and CAT activities in F344 rats in a 28-day feeding study with 2 DINPs (R-1286 and R-1268) and DEHP (R-1287)
2
Enzyme Activities (units/mg protein) a)
Males b) Females Chemical Name
Dose level (%)
Catalase Cat Catalase Cat
R-1287 0.2 79.9 (82.3%)
0.1386 (2,038.2%) (2,038.2%)
69.3 (118.2%) (118.2%)
0.2451 (1,914.8%) (1,914.8%)
R-1286 0.2 223.8 (120%) (120%)
0.0749 (2,582.7%) (2,582.7%)
179.3 (305.9%) (305.9%)
0.0818 (1,460.7%) (1,460.7%)
R-1268 0.2 135.7 (126.9%) (126.9%)
0.1765 (3,922.2%) (3,922.2%)
138.6 (183.3%) (183.3%)
0.1634 (1,667.3%) (1,667.3%)
a) Average +/- standard error b) Five animals / group except as indicated in parentheses
Mean absolute and relative kidney weights were statistically significantly increased at 2% in males with R-1268 without associated histopathological changes.
A slight increase, statistically significant, of the relative testis weights was observed at 2% with R-1286 without associated significant decrease of the absolute weights compared to control groups. A slight decrease, statistically significant, of the relative and absolute ovaries weights was noted at 2% with R-1268 but the significance of this finding was considered by the laboratory as unknown. No histopathological changes were observed.
At 2% in males with R-1268, a statistically significant decrease of the absolute and relative spleen weights was noted with a dose-related relationship. However, this finding was considered by the laboratory as probably incidental to the chemical treatment and no histopathological changes were reported.
Total protein levels, albumin and globulin levels and some erythrocyte indices were affected. However, the lack of a consistent trend between the various phthalate esters suggests that the responses might be incidental.
196

CHAPTER 4. HUMAN HEALTH
No discernible lesions were noted in adrenal, heart and brain at the histopathological examination.
In this 28-day study no NOAEL is identified. The LOAEL is 0.2% (125 mg/kg/d) based on the increase of catalase and carnitine acetyltransferase activities observed from this dose.
Mice
The short-term hepatic effects of DINP in mice at tumorigenic and non-tumorigenic doses were evaluated for comparison with chronic studies and with data for other structurally similar dialkyl phthalate esters ranging from C7 to C11 (Smith et al., 1999; 2000). Groups of male B6C3F1 mice were fed diets with DINP at concentrations of 0 - 500 or 6,000 ppm. After 2 or 4 weeks of treatment, changes in liver weight, replicative DNA synthesis, peroxisomal beta-oxidation (PBOx) and inhibition of gap junction intercellular communication (GJIC) were examined. In addition, hepatic concentrations of the parent compound and major metabolites were determined. Relative to controls, increased liver weight and PBOx at the high dose were consistent with peroxisomal proliferation. Hepatic GJIC was inhibited and DNA synthesis was increased at the high dose, which is also consistent with the tumorigenic response in mice at these doses. These hepatic effects were not observed at the low doses. Similarly, no liver tumours were observed in mice treated with low doses in chronic studies. Compared with rats in the same study, the monoester metabolite (MINP) was detected in the liver at greater levels in mice than rats. This result is also consistent with the dose-response observations in rat and mouse chronic studies. Similar responses were observed for DEHP and other C7-C11 dialkyl phthalate esters. Collectively, these data indicate that in rats and mice, DINP and other C1-C11 phthalates exhibit a threshold for inducing cellular events which correlated with the tumorigenic response of these compounds in chronic feeding studies.
Monkeys
To evaluate the human relevance of liver effects observed in rats and mice, high doses of peroxisome proliferators were given by gavage in 0.5% methyl cellulose (10 ml/kg) to groups of four adult male cynomolgus monkeys for 14 days (Pugh et al., 1999; 2000). In comparison to vehicle control, DINP (CAS number not specified, 500 mg/kg/d), DEHP (500 mg/kg/d) and clofibrate (250 mg/kg/d) produced no statistically significant changes in body weight, organ weights, urinalysis, hematology, clinical chemistry, or other signs of toxicity. In contrast, related studies showed that lower daily doses of these chemicals produce changes in the livers of rats and mice within this time frame. In the monkeys that were evaluated by HandE staining, no signs of inflammation or necrosis were observed in the liver, kidney or testes. Treatment with DINP, DEHP and clofibrate produced no change in hepatic peroxisomal β-oxidation or replicative DNA synthesis. DINP, DEHP and clofibrate did not inhibit hepatic gap junction intercellular communication (GJIC) in fresh liver slices from treated monkeys using incision loading dye transfer and direct measurement of dye flow (Lucifer yellow). In monkeys, liver analyses indicated that phthalate parent and monoester metabolites were present at much lower levels than in rodents. This study indicated that the hepatic effects produced by high doses of phthalates in rats and mice do not occur in monkeys when monkeys are treated up to 14 days.
A NOEL of 500 mg/kg/d can be assumed for this 14-day study in Cynomolgus Monkeys.
No more information is available from this study only an abstract has been provided by Exxon.
197

EU RISK ASSESSMENT REPORT – DINP FINAL REPORT, 2003
4.1.2.6.4 Summary of repeated dose toxicity
Table 4.33 Summary of repeated dose toxicity studies
Test Species Protocol NOAEL LOAEL and Effects observed References
Oral
One-week prechronic oral study
rat Fischer 344
CAS 68515-48-0 0-2% in diet
2% (1,700 mg/kg) increased kidney, liver weights, macroscopic liver changes decreased cholesterol, triglycerides at 2%
Bio/dynamics (1982a)
25 mg/kg DOS activity (peroxisome proliferation)
2-week study
rat Fischer 344 females
CAS 68515-48-0 25-75-150-1,500 mg/kg/d gavage
1,500 mg/kg liver weight increased
Hüls (1992)
2-week study
rat Fischer 344 females
CAS 28553-12-0 25 - 75 - 150 - 1,500 mg/kg/d gavage
25 mg/kg/d DOS activity
75 mg/kg/d DOS activity peroxisome proliferation 1,500 mg/kg/d increased liver weights
Hüls (1992)
2-week or 4-week studies
male Fischer 344 rats;
CAS not specified 0-1,000 -12,000 ppm (rat) in diet
1,000 ppm in rats 12,000 ppm increased in liver weight, PBOx, DNA synthesis. Inhibition GJIC
Smith et al. (1999; 2000)
rat Fischer 344
CAS 68515-48-0 0-0.6-1.2-2.5% in diet
0.6% (607-639 mg/kg/d) increased liver weights, lauric acid 11 and 12-hydroxylase, decreased cholesterol, triglycerides
Bibra (1985)
4-week study
rat Fischer 344
CAS 28553-12-0 0.2-0.67-2% in diet
0.2% (125 mg/kg/d) increased catalase at 0.2% increased CAT activity at 0.2%
Midwest Res. Inst. (1981a)
13-week study
rat CAS 68515-48-0 0-50-150-500 mg/kg/d in diet
150 mg/kg/d 500 mg/kg/d increased kidney, liver weights with hepatocytic hypertrophy
Hazleton (1971b)
rat Fischer 344
CAS 68515-48-0 0-0.1-0.3-0.6-1-2% in diet
0.1% (77 mg/kg/d) 227 mg/kg/d increased kidney, liver weights decreased cholesterol levels from 0.3%
Bio/dynamics (1982b)
rat Sprague Dawley
CAS 68515-48-0 0-0.3-1% diet
0,3% (201 – 251 mg/kg/d) increased kidney, liver weights, decreased triglycerides and urine chemistry changes
Bio/dynamics (1982c)
13-week study
Rat Wistar CAS 28553-12-0 OECD n°408 0-3,000- 10,000-30,000 ppm in diet
152 – 200 mg/kg/d decreased triglyceride levels at 3,000 decreased alimentary peripheral fat deposits in hepatocytes at 3,000 ppm
BASF (1987f)
rat Fischer 344
CAS 28553-12-0 EPA 0-2,500-5,000-10,000-20,000 ppm in diet
176-218 mg/kg/d increased liver and kidney weight at 2,500 ppm
Hazleton (1991a)
3-week study
Table 4.33 continued overleaf
198

CHAPTER 4. HUMAN HEALTH
Table 4.33 continued Summary of repeated dose toxicity studies
Test Species Protocol NOAEL LOAEL Effects observed
References
13-week study
rat Sprague Dawley
CAS not specified 1,000-3,000-10,000 ppm in the diet
1,000 ppm (60 mg/kg/d)
1,000 ppm (60 mg/kg/d) increased incidence of mononuclear cell infiltration and mineralisation of the kidneys in male 3,000 ppm (180 mg/kg/d) slight signs of anemia in males, increased relative kidney weight and slight slight decreased of globulin in females
Hazleton (1981a)
Chronic toxicity 2-year study
rat Fischer 344
CAS 68515-48-0 0-0.03-0.3-0.6% in diet
0.03% (15-18 mg/kg/d)
0.3% (152-184 mg/kg/d) increased liver and kidney weights increased incidence of non-neoplasic changes
Exxon Biomedical Sciences (1986)
2-year study
rat Fischer 344
CAS 68515-48-0 0-500-1,500-6,000-12,000 ppm in diet
1,500 ppm (88-103 mg/kg/d
6,000 ppm (358-442mg/kg/d) increased kidney weights in both sexes; histopathological findings in males; liver toxicity (increased ALT, AST values, liver weights and histopathological findings)
Covance (1998) Aristech Chemical Corporation (1995b) Aristech Chemical Corporation (1994)
2-year study
rat Sprague Dawley
CAS 71549-78-5 0-500-5,000-10,000 ppm in diet
500 ppm (27-33 mg/kg/d) minimal to slight focal hepatocellular necrosis in treated males.
Bio/dynamics (1986)
2-week or 4-week studies
male B6C3F1 mice
CAS not specified 0-500-6,000 ppm in diet
500 ppm 6,000 ppm hepatic changes increased in liver weight, PBOx, DNA synthesis; Inhibition GJIC
Smith et al. (1999; 2000)
4-week study
mouse B6C3F1
CAS 28553-12-0 EPA 0-3,000-6,000-12,000-25,000 ppm in diet
3,000 ppm (635 mg/kg/d)
635-780 mg/kg/d increased liver weight (absolute and relative) at all doses 6,000 ppm (1,300 mg/kg/d) decreased absolute/relative testes weight
Hazleton (1991b)
13-week study
mouse B6C3F1
CAS 28553-12-0 EPA 0-1,500-4,000-10,000-20,000 ppm in diet
for liver effect 1,500 ppm (365 mg/kg/d) 4,000 ppm (972 mg/kg/d)
4,000 ppm (972 mg/kg/d). Enlarged liver increased absolute and relative liver weight 10,000 ppm (2,600 mg/kg/d) decreased (absolute) epididymis and testes weight
Hazleton (1992)
2-year study
B6C3F1 mice
CAS 68515-48-0 0-500-1,500-4,000-8,000 ppm in diet
500 ppm (90.3 mg/kg/d) 1500 ppm (276 mg/kg/d)
1,500 ppm (275-335 mg/kg/d) increased kidney and liver weights 4,000 ppm (742 mg/kg/d) decreased absolute and relative (to brain weight) testis weight
Aristech Chemical Corporation (1995c) Covance (1998)
13-week study
dog beagle
CAS 68515-48-0 0.125-0.5-2% (37-160-2,000 mg/kg/d)in diet
37 mg/kg/d increased AST in females. increased liver weight.
Hazleton (1971a)
Table 4.33 continued overleaf
199

EU RISK ASSESSMENT REPORT – DINP FINAL REPORT, 2003
Table 4.33 continued Summary of repeated dose toxicity studies
NOAEL Test Species Protocol LOAEL Effects observed
References
2-week study
adult male cynomolgus monkeys
CAS not specified gavage 0-500 mg/kg/d
500 mg/kg/day. No changes in body weight, organ weights, urinalysis, hematology, clinical chemistry, no inflammation or necrosis in the liver, kidney and testes, no change in hepatic peroxisomal β oxidation or replicative DNA synthesis. No effect on GIJC in vitro.
Pugh et al. (1999; 2000)
13-week study
marmoset monkeys (16-25-month old)
CAS not specified 0-100-500-2,500 mg/kg/d
500 mg/kg/d 2,500 mg/kg/d minor changes: decreased body weight, decreased body weight gain.
Huntington Life Sciences (1998)
dermal:
6-week study
rabbit New Zealand White
CAS 68515-48-0 0-0.5-2.5 ml/kg body weight
0.5 ml/kg (500 mg/kg)
2.5 ml/kg/d slight or moderate erythema and slight desquamation.
Hazleton (1969)
* Dose level of 2% was administered during 8 weeks and increased to 4% for weeks 9 to 13.
The liver is a target for chronic toxicity. Repeated-dose studies performed to assess the peroxisomal proliferation potential of DINP, reveal that DINP acts as a peroxisomal proliferator in rodents as well as DEHP or DIDP.
It is now well-accepted that peroxisome proliferation is specific to rodents and in the monkey study (Huntington Life Science, 1998) the data obtained following oral administration of DINP for 13 weeks provide no evidence that the compound caused induction of peroxisome proliferator. The NOAEL of 500 mg/kg/d from the marmoset and cynomolgus monkey studies clearly indicates that monkeys and subsequently probably men are far less sensitive than rodents to peroxisome proliferation and its relative liver effects.
Indeed, it has been established that peroxisome proliferators exhibit their pleitropic effects due to activation of PPARα and that PPPARα is expressed only at low level in humans, explaining the absence of significant response of humans to the action of peroxisome proliferators.
Nevertheless, for liver effects, a NOAEL of 88 mg/kg/d was assumed from a well-conducted chronic / carcinogenicity rat study according to GLP (Aristech, 1994), based on liver toxicity at higher doses consisting of hepatic biochemical changes (increased ALT, AST), of liver weight increase in both sexes concurrently with histopathological findings. This NOAEL defined in rats for chronic toxicity on liver may be used for risk characterisation since based on liver changes unrelated to specific peroxisome proliferation effects.
For kidney effects a NOAEL of 88 mg/kg/d, derived from the above study (Aristech, 1994) and based on increased kidney weights in both sexes, is used for the risk characterisation. Effects on the rat kidneys were described in the majority of the rat studies as slight to moderate changes in the kidney weight with sometimes modifications of the physiological parameters more marked in males (increases of blood urea and/or blood creatinine concentrations, proteins in urine and decrease of the specific gravity). Histologically, there was an increase in frequency/severity of chronic progressive nephropathy at quite low doses, but specifically in males. Histological features are consistent with the specific male rat nephropathy irrelevant to humans, namely alpha 2u globulin nephropathy, also hypothesised in the DIDP risk assessment where in some repeated dose studies, mineralisation of the renal papilla (Aristech, 1994), or sporadic kidney neoplasms
200

CHAPTER 4. HUMAN HEALTH
(Lington, 1997) are observed in male rats. It is assumed that accumulation of protein droplets occurs rapidly, whereas continued chemical treatment results in additional histological changes in male rats: papillary mineralisation and atypical hyperplasia, leading to renal adenomas or carinomas on prolonged exposure. Moreover Caldwell (Caldwell et al., 1999b) demonstrated by immunohistochemical techniques that exposure to DINP results in a dose-dependent alpha 2u-globulin accumulation in male rat kidneys (Exxon, 1986) and is likely the mechanism for kidney tumours seen only in male rats administered high dietary levels (1.2%) of DINP (Aristech, 1994).
In mice, there was also progressive nephropathy observed at tremendous doses: tubular nephrosis at 20,000 ppm (5,700 mg/kg/d) in a 13-week study (Hazleton, 1992) and granular pitted/rough kidneys in female mice at 8,000 ppm (1,900 mg/kg/d) in a chronic/carcinogenicity study (Aristech, 1995). In dogs renal effect was observed at the high dose of 2% (2,000 mg/kg/d), and consisted of hypertrophy of kidney tubular epithelial cells in few animals in the 13-week study (Hazleton, 1971). No kidney effects were reported in monkeys up to 2,500 mg/kg/d in a 13-week study (Huntington life Sciences, 1998).
Haematological effects: in rats, in some studies, slight anemia was described but this finding was not clearly treatment-related. In other studies, there were slight increases of leukocytes, as previously, this effect was not clearly treatment-related.
Concerning effects on reproductive organs in adult rats, in the 2-year study with Fischer 344 rats (Exxon, 1986) there was a statistically significant increase in relative testis weights at the high dose of 0.6% (307 mg/kg/d in males) associated with a slight, but not statistically significant, increase (13%) of absolute testis weight. In some sub-acute and sub-chronic studies with Fischer 344 rats (Bio/dynamics 1982a; b; c; Hazleton, 1991a) relative testis weights were statistically significantly increased with or without concurrent increase of absolute testis weights and decrease of body weights at quite high doses (about 1,500 mg/kg/d in one week study, about 700 mg/kg/d in 13-week studies).
In mice, a NOAEL of 1,500 ppm (276 mg/kg/d) can be derived from a 104-week study (Aristech, 1995c) based on testicular weight decrease observed from 4,000 ppm (742 mg/kg/d) and is used for the risk characterisation. In addition, in 4-week and a 13-week repeated-dose mouse studies, slight decreases of testis weight were observed accompanied by the presence of abnormal / immature sperm forms in the epididymes at doses of 6,500 mg/kg/d and 5,700 mg/kg/d, respectively (25,000 and 20,000 ppm). In those mouse studies (4-week and 13-week) effects were noted in uterus (hypoplasia and absence of endometrial glands) and in ovaries (absence of corpora lutea suggesting an arrest of ovulation) at doses of 20,000 ppm and 25,000 ppm.
It should be noted that in the 13-week study in monkeys (Huntingdon Life Sciences, 1998) no changes were reported in testis weight and testis microscopic examination. In addition, there were no treatment-related changes in estradiol and testosterone concentrations assessed.
In conclusion, for effects on the liver and kidneys, a NOAEL of 88 mg/kg/d is determined in rats regarding results found in a chronic / carcinogenic study (Aristech, 1994). For reproductive organs, a NOAEL of 276 mg/kg/d can be derived from a mouse study. These NOAELs will be used for the risk characterisation.
The effects seen in the repeated dose toxicity tests do not justify classification Xn R48 according to the EU classification criteria.
201

EU RISK ASSESSMENT REPORT – DINP FINAL REPORT, 2003
4.1.2.7 Mutagenicity
4.1.2.7.1 In vitro studies
Bacteria
DINP (MRD 95-389, CAS 68515-48-0) was tested in Salmonella typhimurium (TA 98, TA100, TA1535, TA1537, TA1538) in the presence and absence of an exogenous metabolic system from Aroclor 1254 induced Sprague Dawley rat-liver S9 at concentrations from 0.5 to 5,000 µg/plate (in acetone) in the initial assay and from 250 to 5,000 µg/plate in the repeated assay (Exxon Biomedical Sciences, 1996g). All dose levels of test article, vehicle and positive controls were plated in triplicate. Beading of the test substance was observed from 250 µg/plate with and without metabolic activation but no appreciable toxicity was observed. No positive responses were observed with any of the tester strains in the presence and absence of metabolic activation. This study was performed according to GLP procedures.
DINP (R1218, CAS 28553-12-0) was tested in Salmonella typhimurium (TA 98, TA100, TA1535, TA1537, TA1538) in the presence and absence of an exogenous metabolic system from Aroclor 1254 induced male Sprague Dawley rat liver microsomes at concentrations from 0.1 to 10 µl/plate (EGandG Mason Research Institute, 1980). All dose levels of test article and vehicle controls were plated in duplicate and positive controls in triplicate. No positive responses were observed with any of the tester strains in the presence and absence of metabolic activation. No appreciable toxicity was observed. The test was not duplicated. This study was performed according to GLP procedures.
DINP (IGS 21002, CAS 28553-12-0) was tested in Salmonella typhimurium (TA98, TA100, TA1535, TA1537) in the presence and absence of a metabolic system from Aroclor 1254 induced male Sprague-Dawley rat liver S9 mix at concentrations from 20 to 5000 µg/plate in DMSO (BASF, 1995c). Two independent experiments were carried out, one according to Ames and the other according to Yahagi et al. (preincubation method). All dose levels of test article, vehicle controls and positive controls were plated in triplicate. No positive responses were observed with any of the tester strains in the presence and absence of metabolic activation. No bacteriotoxic effect was observed. A precipitation of the test substance was found from about 500 µg/plate onward.
DINP (CAS 28553-12-0) was tested in Salmonella typhimurium (TA98, TA100, TA1535, TA1537) in the presence and absence of an exogenous metabolic activation system from Aroclor 1254 induced male Sprague Dawley rat liver and Syrian hamster liver at concentrations from 100 to 10,000 µg/plate (Zeiger et al., 1985; NTP, 1983). Two independant experiments were carried out, according to a preincubation modified method of the Ames test. All dose levels of test article, vehicle controls and positive controls were plated in triplicate. No positive responses were observed with any of the tester strains in the presence or absence of metabolic activation. No bacteriotoxic effect was observed.
Zeiger et al. (1985) and NTP (1983) briefly reported a study performed in the eighties by SRI laboratories. This study was a part of the NCI/NTP program to test DEHP and other phthalates for mutagenicity.
DINP (Palatinol N, CAS 28553-12-0) was tested in Salmonella typhimurium (TA98, TA100, TA1535, TA1537) in the presence and absence of a metabolic system from Aroclor 1254
202

CHAPTER 4. HUMAN HEALTH
induced male Sprague-Dawley rat liver S9 mix at concentrations from 20 to 5,000 µg/plate in DMSO (BASF, 1986a). Two independant experiments were carried out according to Ames, all dose levels of test article, vehicle controls and positive controls were plated in triplicate. No positive responses were observed with any of the tester strains in the presence and absence of metabolic activation. No bacteriotoxic effect was observed.
Mammalian cells
Clastogenic activity (Exxon Biomedical Sciences, 1996h)
DINP (MRD 95-389, CAS 68515-48-0) was tested for clastogenic activity in cultured Chinese hamster ovary (CHO) cells at concentrations of 5, 10, 20, 40, 80 and 160 µg/ml (in acetone) in the presence or absence of an exogenous metabolic system from Aroclor induced Sprague Dawley rat livers. The cofactor mix was composed of NADP and DL-Isocitric acid in water. The study consisted of two phases: an initial 20-hour harvesting chromosomal aberration assay (with a 3 hour exposure with and without metabolic activation) and a repeat assay with both 20- and 44-hour cell harvest times (with a 3-hour exposure with metabolic activation and 20-hour exposure without metabolic activation). Debris was observed in the 20-hour cultures only at 160 µg/ml (+S9) in the initial assay and from 40 µg/ml (-S9) and 80 µg/ml (+S9) in the repeat assay. Although it could not be determined, the debris was most likely test substance precipitation due to its low solubility. There is a statistically trend in the percent aberrant cells without metabolic activation 20 hour harvest in the repeat assay but the response observed at the high dose (160 µg/ml) is not extreme (4% of aberrant cells versus 1% in the control group (p<0.05)) and is within the normal range of the vehicle control without a dose related relationship. In addition, percentage aberrant cells did not exceed 5%, which is used in the study as threshold for a tested substance to be considered as inducing a positive result when compared to the vehicle control and no notable decrease in mitotic index was observed with or without metabolic activation in the toxicity pre-test up to 160 µg/ml. DMBA (7, 12-Dimethylbenz[a]anthracene, at the concentration of 10 µg/ml) used as positive control with metabolic activation and MNNG (N-methyl-N-Nitro-Nitrosoguanidine, at the concentration of 0.6 µg/ml) used as positive control without metabolic activation produced statistically significant increases in the % of aberrant cells (respectively 63% versus 1.5% in controls and 8% versus 1% in controls). The vehicle control also satisfied criteria for a valid assay (% aberrant cells remained below 5%). Therefore, under the conditions of this study performed according to GLP procedures, DINP did not induce chromosomal aberrations in CHO cells.
Mouse lymphoma forward mutation assay (Hazleton, 1986b)
In a mouse lymphoma forward mutation assay, cell lines L5178Y TK +/- were exposed for 4 hours to DINP (1J, CAS 68515-48-0) solutions in acetone. The test material was not completely soluble and formed oily droplets at all concentrations. Expression time was two days. Under non-activation conditions, six concentrations of test material, ranging from 1,500 to 8,000 nl/ml, were analysed for mutant induction, moderate to high toxicity was induced. A white precipitate was observed on day 1 at concentrations above 3,000 nl/ml indicating that the washings after the 4-hour treatment period did not completely eliminate the test material from the cultures. In the presence of an exogenous metabolic activation system (Aroclor induced male Sprague Dawley rat liver with cofactors (CORE)), treatments ranging from 500 to 6,000 nl/ml were assessed for mutant induction, these concentrations produced moderate to very high toxicity. In the conditions of the test, DINP induced no increases in mutant frequency at any
203

EU RISK ASSESSMENT REPORT – DINP FINAL REPORT, 2003
dose, in the presence and absence of metabolic activation. This study was performed according to GLP procedures.
Mouse lymphoma forward mutation assay (EG&G Mason Research Institute, 1981)
DINP (R-1218, CAS 28553-12-0) was tested in a mouse lymphoma forward mutation assay. Cell lines L5178Y TK +/- were exposed to concentrations ranging from 7.5 µl/ml to 100 µl/ml for 4 hours, with and without metabolic activation (Aroclor induced rat liver S9). Only slight toxicity was noted for the highest doses tested both with and without activation. No increases in mutant frequency were observed in the presence and absence of metabolic activation. However, the immiscibility of the test article in aqueous tissue culture media limited the amount of the test article which was accessible to the target cells. That this is probably the case is evidenced by the lack of demonstrable dose response and the inability to achieve a high degree of toxicity. This fact weakens the significance of this test. This study was performed according to GLP procedures.
Mouse lymphoma toxicity assay (Litton Bionetics, 1985a)
DINP (1J, CAS 28553-12-0) was tested in a mouse lymphoma toxicity assay. Cell line L5178Y TK +/- was exposed to test article solutions (in acetone) ranging from 9,77 nl/ml to 5,000 nl/ml, with and without exogenous metabolic activation system. All dose levels of the test article were tested in duplicate, controls were tested in triplicates. After a 4-hour incubation time with the various concentrations of DINP, cells were washed and incubated in a new media for 48 hours. Cells were counted at 24 and 48 hours (approximately) after exposure to the test substance.
Under non-activation conditions, the test material was soluble from 9.77 nl/ml to 313 nl/ml but higher concentrations contained very small oil droplets. At 24 hours after treatment, the 5,000 nl/ml contained a white precipitate. Treatment with 2,500 and 5,000 nl/ml of DINP approached high toxicity (Relative Suspension Growths (RSG): 20% to 30% of controls) and the 1,250 nl/ml were moderately toxic (RSG: 41,9% of controls). Low to non-detectable toxicity was observed for concentrations from 625 to 9.77 nl/ml. In the presence of metabolic activation, the test material appeared soluble up to 5,000 nl/ml. DINP appeared slightly more toxic with activation: treatment with 5,000 and 2,500 nl/ml were very highly toxic (3.3 to 10.7% RSG) and doses of 1,250 and 625 nl/ml were highly toxic (between 8.2 and 25.4% RSG). Treatments from 313 nl/ml to 9.77 nl/ml induced moderately high to non-detectable toxicities. This study was performed according to GLP procedures.
Cytotoxicity assessment (BASF, 1986b)
A cytotoxicity assessment in CHO cells has been performed by BASF with Palatinol N (CAS 28553-12-0 purity > 99%). CHO-K1 cells were treated in the presence and in the absence of exogenous metabolic activation (S-9 Mix) with Palatinol N (concentration ranged from 10-7 to 10 mg/ml for the first experience and 1 to 14.1 mg/ml for the second experience) during 4 and 24 hours (first experience) and 4 and 16 hours (second experience) in Hams F 12 medium. Fetal calf serum was used during the 16 and 24-hour exposure period but not during the 4-hour exposure, thus the cytotoxicity was tested on growing as well as on resting cells. The parameter used for cytotoxicity assessment was the cloning efficiency of the cells.
After the treatment, there was no reduction of the cloning efficiency up to concentration of 1 mg/ml. Cytotoxicity was noted in the first experience at the dose of 10 mg/ml with and without metabolic activity but this result was not confirmed in the second study at doses up to 14.1 mg/ml.
204

CHAPTER 4. HUMAN HEALTH
Primary rat hepatocyte unscheduled DNA synthesis assay (Litton Bionetics, 1981a)
DINP (R-1218, CAS 28553-12-0) was tested in the primary rat hepatocyte unscheduled DNA synthesis assay at concentrations from 0.625 to 10 µl/ml in DMSO, without metabolic activation. Negative control (DMSO) and positive control (2-AAF) were also tested. Concentrations above 5 µl/ml DINP caused very slight toxicity to the cells (92.7% and 92.9% of survival at 26-28 hours for 5 and 10 µl/ml, respectively). No increases of net nuclear grain count were observed at any of the tested doses, so the conclusion of this test was that DINP was considered to be inactive in the Primary Rat Hepatocyte Assay.
4.1.2.7.2 In vivo studies
In an in vivo cytogenetic assay, DINP (R-1218, CAS 28553-12-0) was administered orally to 3 groups of Fisher 344 rat at doses of 5-1.7-0.5 ml/kg/d, diluted in corn oil, during 5 days (Microbiological Associates, 1981d). Samples of femoral bone marrow were analysed for chromosomal aberrations after the treatment period. Concurrent olive oil and triethylenemelamine dosed animals served as negative and positive controls, respectively. In a preliminary range finding study, no toxic effects were detected at levels up to 10 ml/kg DINP. There were no changes in the mitotic index at any dose tested. No changes were observed (only one animal had chromosomal abnormality at dose of 1.7 mg/kg/d (chromatid breaks) and the test was considered to be negative. However, cytogenetic analysis has been performed on only 50 cells/animal and mitotic index calculated by observation of 100 cells only, such values are low and can weaken the significance of the test.
4.1.2.7.3 Summary of mutagenicity
DINP is not mutagenic in vitro in bacterial mutation assays or mammalian gene mutation assay (with and without metabolic activation) and is not clastogenic in one cytogenetic assay in vitro on CHO cells and in one in vivo assay on bone marrow cell of Fisher 344 rats. This suggests that DINP is not genotoxic in vivo or in vitro.
205

EU RISK ASSESSMENT REPORT – DINP FINAL REPORT, 2003
Table 4.3 Gene mutation and cytogenetic assays in vitro 4
Genetic toxicity tests Test system Protocol/ doses Results References
Bacterial test (gene mutation) CAS 28553-12-0
S typhimurium TA 98-100-1535-1537-1538
Ames test From 0.1 to 10 µl/plate +/- S9
negative EGandG Mason research institute (1980)
Bacterial test (gene mutation) CAS 28553-12-0
S typhimurium TA 98-100-1535-1537
Ames test From 20 to 5,000 µg/plate in DMSO +/- S9 standard and preincubation method
negative BASF (1995c)
Bacterial test (gene mutation) CAS 28553-12-0
S typhimurium TA 98-100-1535-1537
Ames test From 100 to 10,000 µg/plate +/- S9 (SD rat liver and Syrian Hamster liver)
negative Zeiger (1985)
Bacterial test (gene mutation) CAS 28553-12-0
S typhimurium TA 98-100-1535-1537
Ames test From 20 to 5,000 µg/plate in DMSO +/- S9
negative BASF (1986a)
Bacterial test (gene mutation) CAS 68515-48-0
S typhimurium TA 98-100-1535-1537-1538
Ames test From 0.5 to 5,000 µg/plate +/- S9
negative Exxon Biomedical Sciences (1996g)
Mammalian test (gene mutation) CAS 28553-12-0
L5178Y TK +/- Mouse lymphoma assay (forward mutation) From 7.5 to 100 µl/ml with and without metabolic activation
negative EGandG Mason Research Institute (1981)
Mammalian test (toxicity assay) CAS 28553-12-0
L5178Y TK +/- Mouse lymphoma assay (toxicity study) From 9.77 nl/ml to 5,000 nl/ml with and without metabolic activation
Moderately high to not toxic from 313 nl/ml to 9.77 nl/ml
Litton bionetics (1985a)
Mouse lymphoma assay CAS 68515-48-0
L5178Y TK +/- Mouse lymphoma forward mutation assay from 1,500 to 8,000 nl/ml without metabolic activation and from 500 to 6,000 nl/ml with metabolic activation
negative Hazleton (1986b)
Mammalian test (toxicity assay) CAS 28553-12-0
CHO-K1 CHO cytotoxicity assay with and without metabolic activation. 2 tests, 1 from 10-7 to 10 mg/ml and 2 from 1 to 14.1 mg/ml. The cytotoxicity noted in the 1st assay at 10 mg/ml but not confirmed in the 2nd assay up to 14.1 mg/ml
BASF (1986b)
Cytogenetic assay in vitro CAS 68515-48-0
CHO cells 5, 10, 20, 40, 80 and 160 µg /ml +/- S9
+/- Exxon Biomedical Sciences (1996h)
Mammalian test (Unscheduled DNA synthesis assay) CAS 28553-12-0
Rat hepatocytes UDS in rat hepatocytes From 0.625 to 10 µl/ml
negative Litton Bionetics (1981a)
Table 4.3 In vivo studies 5
Genetic toxicity tests Species Protocol/ doses Results References
Cytogenetic assay Fisher 344 rat Cytogenetic assay on bone marrow cells 5-1.7 and 0.5 mg/kg/d during 5 days via oral route
Negative Microbiological Associates (1981d)
206

CHAPTER 4. HUMAN HEALTH
4.1.2.8 Carcinogenicity
4.1.2.8.1 Cell transformation assays
(Litton Bionetics, 1985b)
In an in vitro transformation assay, DINP diluted in culture medium was tested on clone 1-13 of Balb/c-3T3 A31 mouse cells. Exposure period was 72 hours and incubation was continued for approximately four weeks. Tested doses ranged from 0.49 nl/ml to 8,000 nl/ml in a preliminary toxicity assay, slight signs of toxicity were observed at concentrations above 250 nl/ml. According to these results, five concentrations were chosen for the main assay (transformation and toxicity assay), ranging from 125 nl/ml to 3,750 nl/ml. Concomitant negative controls (culture medium) and positive controls (MCA and MNNG) were assessed in the same conditions. In the main study, the relative survival percentage varied from 87% at 125 nl/ml DINP to 22.3% at 3,750 nl/ml DINP. At all tested doses, there were no statistically significant increases in transformation activity. In the conditions of this test, DINP was considered inactive. This study was performed according to GLP procedures.
(Litton Bionetics, 1981b)
In an in vitro transformation assay, DINP diluted in acetone was tested on Balb/c-3T3 mouse cells. Tested doses ranged from 0.20 µg/ml to 3,285 µg/ml in a preliminary toxicity assay and concentrations ranging from 2.5 µg/ml to 254.5 µg/ml were finally chosen for the main assay (transformation and toxicity assay). Concomitant negative controls (culture medium) and positive controls (MCA) were assessed in the same conditions. In the main study, the relative survival percentage varied from 20% at 254.5 µg/ml DINP to 90% at 2.5 µg/ml DINP. At all tested doses, there were no statistically significant increases in transformation activity. In the conditions of this test, DINP was considered non-transforming. For this study, only summary and conclusions of the laboratory were available, detailed data and method were not provided.
This study was performed according to GLP procedures.
(Litton Bionetics, 1981c)
DINP diluted in vehicle was tested on clone 1-13 of Balb/c-3T3 mouse cells. Two preliminary toxicity tests had been performed to assess cytotoxicity of DINP in solution in different solvents. Solutions of test substance was prepared in DMSO and acetone and then tested at concentrations ranging from 0.2 µg/ml to 3.26 mg/ml. Survival rates were identical whichever the solvent chosen: 30.5% at 3.26 mg/ml to 100% for 0.025-0.0002 mg/ml interval and 37,1% at 3.26 mg/ml to 100% for 0.025-0.0002 mg/ml interval, for DMSO and acetone, respectively. This absence of difference between the solvents demonstrated that the test material activity in the cytotoxicity assay was not solvent-mediated. Regarding these preliminary tests, concentrations ranging from 3.26 mg/ml to 0.033 mg/ml were chosen for the main study (transformation study). Negative controls (DMSO) and positive controls (MCA) gave expected results and DINP at all concentrations tested was clearly non-transforming. This study was performed according to GLP procedures.
207

EU RISK ASSESSMENT REPORT – DINP FINAL REPORT, 2003
(Microbiological Associates, 1982)
DINP (99,9% pure) diluted in acetone was tested on clone A31 of Balb/3T3 mouse cell line. Exposure period was 48 hours and incubation was continued for approximately four to six weeks. The test material was relatively non-toxic at treatment doses of 1-0.3-0.1-0.03 µl/ml (survival rate was 75.7%-86.5%-92.4%-95.3%, respectively). After incubation, one type II foci was found for 0.3 and 0.1 µl/ml DINP (0 for acetone negative control and 3 for MNNG positive control). Two type III foci were found for dose of 1 µl/ml (0 for acetone negative control and 11 for MNNG positive control). These slight increases were not dose-related for type II transforming and not statistically significant for type II and type III transforming. Results are doubtful and the conclusion is that DINP induces a level of transforming activity in 3T3 cell, which is not statistically significant.
(Microbiological Associates, 1981a)
In an in vitro transformation assay, DINP diluted in acetone was tested on clone 1-13 of Balb/c-3T3 A31 mouse cells in the presence of an exogenous metabolic activation system (S-9 and NADPH-generating system). Exposure period was 2 hours and incubation was continued for approximately four to six weeks. According to preliminary toxicity test results, three concentrations were chosen for the main assay (transformation and toxicity assay: 1-0.3 and 0.1 µl/ml. Concomitant negative controls (acetone) and positive controls (BaP) were assessed in the same conditions. DINP exhibited no signs of cytotoxicity at all the tested doses. One type II foci transformant was observed in acetone control, in BaP control, in the 1 µl/ml and in the 0.1 µl/ml dose group. No type III foci transformation was induced in controls but transformations were observed in the treated groups: 1-2 and 4 for 1-0.3 and 0.1 µl/ml, respectively (6 for the BaP control). This data suggest that DINP induce a level of transforming activity in 3T3 cells in the presence of metabolic activation, which is not statistically significant.
(Microbiological Associates, 1981b)
DINP (> 98% pure) diluted in acetone was tested on clone A31 of Balb/3T3 mouse cell line. Exposure period was 20-24 hours and incubation was continued for approximately 4 to 3 weeks. The test material exhibited slight to no cytotoxicity at treatment doses of 1-0.1- 0.01 µl/ml (survival rate was 70.4%-89.5%- 8%, respectively). After incubation, one type II foci was found for 0.01 µl/ml DINP and two for 0.1 µl/ml DINP (1 for acetone negative control and 7 for MNNG positive control). One type III foci were found for dose of 0.01 µl/ml (0 for acetone negative control and 7 for MNNG positive control). These slight increases were not dose-related and not statistically significant for type II and type III transforming. Results are doubtful and the conclusion is that DINP induces a level of transforming activity in 3T3 cell, which is not statistically significant.
(Microbiological Associates, 1981c)
DINP (99.85% pure) diluted in acetone was tested on clone A31 of Balb/3T3 mouse cell line. Exposure period was 20-24 hours and incubation was continued for approximately 4 to 3 weeks. The test material exhibited slight to very slight cytotoxicity at treatment doses of 1-0.3-0.1-0.03 µl/ml (survival rate was 71%-84.8%-84.1%-92.4%, respectively). After incubation, three, two and three type II foci were found for 0.3-0.1 and 0.03 µl/ml DINP, respectively (1 for acetone negative control and 6 for MNNG positive control). Twelve, eight, six and three type III foci were found for dose of 1-0.3-0.1 and 0.03 µl/ml DINP, respectively (0 for acetone negative
208

CHAPTER 4. HUMAN HEALTH
control and 43 for MNNG positive control). These slight increases were not dose-related for type II transforming and statistically significant and dose-dependant for type III transforming. Results are positive and the conclusion is that DINP induces transforming activity in 3T3 cell.
Table 4.3 Cell transformation assays 6
Genetic toxicity tests Species Protocol/ doses Results References
Cell transformation Balb/c-3T3 A31 mouse cells (clone 1-13)
Cell transformation assay From 125 nl/ml to 3,750 nl/ml Without metabolic activation
Negative Litton Bionetics (1985b)
Cell transformation Balb/c-3T3 A31 mouse cells Cell transformation assay From 2.5 µg/ml to 254.5 µg /ml Without metabolic activation
Negative Litton Bionetics (1981b)
Cell transformation Balb/c-3T3 A31 mouse cells (clone 1-13)
Cell transformation assay From 0.2 µg/ml to 3.26 mg /ml Without metabolic activation
Negative Litton Bionetics (1981c)
Cell transformation Balb/c-3T3 A31 mouse cells (clone 1-13)
Cell transformation assay From 0.03 to 1 µl/ml Without metabolic activation
Doubtful Transforming activity not statistically significant
Microbiological Associates (1982)
Cell transformation Balb/c-3T3 A31 mouse cells (clone 1-13)
Cell transformation assay From 0.1 to 1 µl/ml With metabolic activation.
Doubtful Transforming activity not statistically significant
Microbiological Associates (1981a)
Cell transformation Balb/c-3T3 A31 mouse cells (clone 1-13)
Cell transformation assay From 0.1 to 1 µl/ml Without metabolic activation
Doubtful Transforming activity not statistically significant
Microbiological Associates (1981b)
Cell transformation Balb/c-3T3 A31 mouse cells (clone 1-13)
Cell transformation assay From 0.03 to 1 µl/ml Without metabolic activation
Positive Microbiological Associates (1981c)
4.1.2.8.2 Studies in animals
Rats
Combined chronic / carcinogenicity study (Exxon Biomedical Sciences, 1986; Hazleton, 1986; Lington et al., 1997)
The study was carried out in compliance with GLP procedures. The protocol complied with OECD or EU guidelines.
• Experimental procedure Groups of 220 (110/sex) Fischer 344 rats, (6 weeks of age at initiation of dosing) were administered dietary concentration of 0 - 0.03 - 0.3 - 0.6% (w/w) DINP (MRD 83-260, CAS 68515-48-0, assumed to be 100% pure for purpose of dosing) for a period up to 2 years. The mean daily intakes of DINP over 2 years (Lington et al., 1997) were 15, 152 and 307 mg/kg/day for male rats corresponding to dose levels of 0.03 - 0.3 and 0.6%, respectively and 18, 184 and 375 mg/kg/day for female rats, respectively. Preselected subgroups of 10 rats/sex/dose level
209

EU RISK ASSESSMENT REPORT – DINP FINAL REPORT, 2003
were scheduled for interim sacrifice after 6, 12 and 18-months and remaining rats were sacrificed at 24-months.
The animals were observed twice daily for viability. Clinical examinations (nature, onset and duration of signs, palpable tissue masses), body weight and food consumption were recorded weekly. Hematological, clinico-chemical and urinalysis were determined on rats sacrificed at the 6, 12 and 18-month intervals and on 20 rats/sex/dose level at study termination.
The experimental procedure, results of hematology, biochemical and urinary analysis and non-neoplasic findings had been thoroughly detailed in repeated dose section. Results reported below only concerned neoplasic findings.
Liver sections were taken from 1 animal/sex/group/room for possible future electron microscope examination.
• Results The survival was greater than 60% in all groups at study termination (see Table 4.25) and the incidence of clinical inlife observation was low throughout the 24-month test period. The significant changes in food consumption consisted of a significant reduction of food consumption in the high-dose males during the last 12-months of the study and of a slight increase of food consumption in the mid and high-dose females during the first 12 months of the study. Concerning body weight changes, when compared with controls, the high-dose males exhibited a statistically significant, dose-related decrease in body weight beginning at 12 months of treatment and persisting until termination (4 to 7% reduction in body weight compared to the control group). There were not statistically significant changes of bw in females. In addition, males and females from the mid and high-dose groups exhibited a statistically significant, dose-related increase in relative kidney and liver weights throughout most of the treatment period; the absolute liver and kidney weights demonstrated a similar trend. The other statistically significant changes in organ weights consisted of dose-related, increase in absolute and relative spleen weights of high-dose males, increase in relative spleen weights of high-dose females and relative increase in adrenal weights in both sexes as well as relative increase of testes weights in high-dose males. No treatment-related changes were observed in the absolute or relative organ weights for ovaries, brain, heart, or thyroid/parathyroid (the most significant changes are shown in summary Table 4.26). Ultrastructural examination of liver specimens from representative rats of each sex from the four groups did not reveal any treatment-related peroxisome proliferation.
Gross effects at necropsy (Lington et al., 1997): No grossly observable and treatment-related abnormalities were apparent at any of the interim sacrifices. At study termination, however, mid and high-dose males and high-dose females exhibited an increased incidence of splenic enlargement when compared with control animals.
Histopathology (Lington et al., 1997; Caldwell et al., 1999b): After 6 and 12 months of treatment, no treatment-related effects on tissues were observed in rats sacrificed. At the 18-month sacrifice, there were no treatment-related neoplastic lesions but non-neoplastic lesions were observed in the liver and kidney of high-dose rats (minimal to slight centrilobular to midzonal hepatocellular enlargement in 9/10 male and 10/10 female rats; minimal increase in tubular cell pigment was noted in the renal tubular epithelium in high-dose male).
At 24 months, non-neoplastic lesions in the liver consisting of slight centrilobular to midzonal hepatocellular enlargement in a small number of rats were comparable to the findings at the 18-month sacrifice. No treatment-related preneoplastic or neoplastic lesions of the liver were observed (Table 4.39).
210

CHAPTER 4. HUMAN HEALTH
The most common causes of the unscheduled deaths and/or morbidity were mononuclear cell leukemia (MNCL) and to a lesser extent, pituitary neoplasia (see Table 4.37). Tubular cell pigmentation in the kidney was increased in severity in animals with advanced MNCL. Increased mortality in mid and high-dose rats of both sexes was principally due to MNCL; in addition to cases, in which MNCL was the primary cause of death, MNCL, was also diagnosed in 5 males (3 mid-dose; 2 high-dose) and in 6 females (1 control; 2 mid-dose and 3 high-dose) dying from other causes.
Statistically significant increased incidence of MNCL was observed in the mid and high-dose groups (both sexes) and with a significantly increasing trend over time (cf. Table 4.38). In many of the rats, the MNCL was very early and limited to an increase in mononuclear cells in hepatic sinusoids. The MNCL was associated with a variety of hepatic alterations (non-neoplastic lesions), which included regenerative nodules, focal necrosis, spongiosis hepatis and “hepatopathy associated with leukaemia”. It should be noted that a high and variable spontaneous occurrence of monocytic leukemia was observed in the ageing Fischer rat strain.
Table 4.3 Most common causes of death and/or morbidity in rats fed DINP for 2 years 7 (Hazleton, 1986)
Males Sex Females
Dose groups 0 0.03% 0.3% 0.6% 0% 0.03% 0.3% 0.6%
Monocytic leukemia 12 8 19 21 6 10 14 18
Pituitary neoplasm 1 4 5 0 6 6 6 4
Total 13 12 24 21 12 16 20 22
Unscheduled deaths 20 25 31 30 29 16 24 26
Table 4.38 Incidence of MNCL in terminal sacrificed animals fed DINP for 2 years (Hazleton, 1986)
Sex Males Females
Dose groups 0 0.03% 0.3% 0.6% 0% 0.03% 0.3% 0.6%
61 55 51 65 57 49 54
Monocytic leukemia 21 20 26 28 15 22 10 14
Percent with leukemia 34 36 52 55 23 18 29 41
Number examined 50
Chronic progressive nephropathy was seen in most of the rats, and not related to treatment for severity grade. Renal neoplasms were seen in 3 mid-dose and 2 high-dose male rats (Table 4.39): in the mid-dose rats, the neoplasms were transitional cell carcinomas arising from the urothelium, of which 1 was highly anaplasic with metastasis, whereas the 2 others were small and were scored as incidental lesions in moribund rats exhibiting advanced monocytic leukemia; in 2 high-dose male rats, neoplasm originated from renal tubule and 1 was a large metastazing neoplasm which resulted in death of the rat. None of these tumour types was statistically significantly in excess when compared to controls and there was no evidence of any treatment-related preneoplastic renal lesions.
Pertaining to kidney findings in male rats at the high dose, a retrospective evaluation of archived tissue was conducted by immunohistochemical techniques (Caldwell et al., 1999b) and allowed to measure the accumulation of α2u-globulin in male rat kidneys. Using archived tissue obtained
211

EU RISK ASSESSMENT REPORT – DINP FINAL REPORT, 2003
at 12-month interim sacrifice, a dose-dependant increase of α2u-globulin was identified in specfic region of male kidneys only, by immunohistochemical staining techniques (IHC). An increase in cell proliferation was confirmed by immunohistochemical detection of proliferating-cell nuclear antigen (PCNA) and located especially in the areas of α2u-globulin accumulation. Hematoxyllin and eosin-stained sections revealed tubular epithelial hypertrophy and regeneration consistent with the immunohistopathological findings. These findings were related to the α2u-globulin mechanism of tumorigenesis in male rat kidneys which is not regarded as relevant to humans.
No significant excess of testicular bilateral interstitial cell tumours was observed in treated rats compared to the controls (interstitial cell hyperplasia and interstitial cell tumours, often bilateral were seen in nearly all rats) (Table 4.39).
Primary brain neoplasms (astrocytoma/oligodendroglioma) were observed in 2 high-dose male and in 2 mid-dose female rats among those found dead or sacrificed-moribunds versus none in controls.
Table 4.3 Incidence of selected neoplastic and preneoplastic lesions in rats fed DINP for 2 years 9
Females Sex Males
Dose groups 0 0.03% 0.03% 0.3% 0.3% 0.6% 0% 0.6%
Number examined 81 80 80 80 81 81 80 80
Liver
Neoplastic nodules (1) 3 1 1 1 0 2 0 1
Hepatocellular cancer (2) 0 0 0 3 1 0 0 1
Combined (1 and 2) 3 1 1 4 1 2 0 2
Basophilic foci 53 62 48 42 72 64 64 54
Eosinophilic foci 58 50 45 51 59 45 42 32
Kidney
0 0 3 0 0 0 0 0
Transitional cell adenoma 0 0 0 0 0 0 0 0
Tubular cell carcinoma 0 1 0 2 0 0 0 0
Tubular cell adenoma 0 0 0 0 0 0 0 0
Hyperplasia of transitional cell epithelium
21 23 31 25 32 39 34 32
Testes bilateral interstitial cell tumours
71 64 70 72 - - - -
48 51 a) c) 22 20 30 c) 43 a) b) c)
Transitional cell carcinoma
Hematopoietic system mononuclear cell leukemia.
33 28
a) statistically significant, p < 0.01 (Fisher exact test) b) statistically significant, p < 0.05 (incidental tumour test) c) statistically significant, p < 0.05 (life table test) No treatment-related preneoplastic and no neoplastic lesions of the liver were observed. There was an increase of MNCL from 0.3% as well as an earlier onset. However, it should be noted that MNCL is a common neoplasm in the Fischer 344 rats and the increased incidence after
212

CHAPTER 4. HUMAN HEALTH
chronic exposure to some substances is likely a strain specific effect with little relevance for humans. Of interest, the IARC categorised MNCL as "an unclassified leukemia with no known human counterpart" (IARC, 1990).
Feeding study (BASF, 1960 a,b)
A feeding study was carried out in 1957, on diisononyl phthalate (CAS 28553-12-0, DINP3) using a small number of animals (10 Sprague Dawley rats/sex/group) which were given daily administration of pelleted feed containing of 0.5% at the beginning of the exposure period and 0.4% at the end of the first year. The study duration was about 1,000 days. No influence of treatment was found on growth or survival rates. No malignant tumours were observed; only 2 pituitary adenomas and unrelated-treatment findings (i.e. abscesses, infections, etc.) were reported. Given the limitation of reporting, the small number of animals, this study has to be disregarded.
Chronic / carcinogenicity feeding study (Bio/Ddynamics, 1986)
The study was conducted on groups of Sprague Dawley CD rats (70/sex/dose level) to assess the long-term toxicity and carcinogenicity of Santicizer 900. DINP CAS number was not provided in the study. However, it was reported as 71549-78-5 in a risk assessment report of the US Consumer Product safety Commission and introduced as never produced commercially (Babich, 1998). Nevertheless, it is now described to enrich risk assessment data. DINP (99.9% active ingredient) was administered orally, via dietary admixture, at dose levels of 0 (standard diet) –500 - 5,000 - 10,000 ppm for a period of 24 months. The mean daily intakes (and ranges) of Sancitizer 900 were 27 (19 - 61), 271 (183 - 611) and 553 (383 – 1,194) mg/kg/day for male rats and 33 (22 - 59), 331 (218 - 579) and 672 (439 – 1,128) mg/kg/day for female rats corresponding to dose levels of 500 - 5,000 - 10,000 ppm, respectively.
Samples of each dietary levels were analyzed for homogeneity prior study initiation, and duplicate samples were taken for each dose level at weeks 1-4, months 2, 3, 6, 9, 12 15, 18, 21 and 24 for dose verification.
Experimental procedure, results of serum chemistry, urine chemistry, haematology analysis, as well as body weight and organ weight changes, clinical in-life observations and food consumption had been thoroughly described in repeated dose section. Results reported below only concerned neoplasic findings.
The animals necropsied at month 12 did not exhibit any detectable compound related morphologic change, either grossly or microscopically. Concerning neoplasic findings, microscopic evaluation of the liver in all treated groups and other preserved tissues in the high-dose indicated:
• a higher incidence of neoplastic liver nodules in treated rats than in control rats (males and females) which was however within the historical range,
• hepatocellular carcinomas in both sexes of the mid and high-dose groups exceeding historical laboratory incidence,
• increased incidence of testicular interstitial cell hyperplasia in high-dose males when compared to controls under study and historical range,
213

EU RISK ASSESSMENT REPORT – DINP FINAL REPORT, 2003
• a slightly higher incidence of interstitial cell tumours in high-dose males which was however lower than in the historical controls and therefore, considered as having uncertain significance,
• slightly increased incidences of pancreatic islet cell tumours and parathyroid gland hyperplasia were observed in high-dose males and endometrial hyperplasia in high-dose females the significance of these findings being of uncertain significance.
Increased incidence of hepatocellular carcinomas in both sexes leads to a NOAEL of 500 ppm (27 - 33 mg/kg/d), although the absence of histological data limits interpretation of results.
2-year dietary study (Artisyech 19994 and 1995: Butala et al., 1996; Covance, 1998)
Oncogenic potential and ability of DINP to cause hepatocellular proliferation and peroxisomal proliferation was assessed in a 2-year dietary study in CDF(F-344) CrlBR rats - Figures, tables, appendices not provided). This study complied with US EPA, 40 CFR Part 798.3300 guidelines and US EPA 40 CFR Part 792 GLP.
• Experimental procedure Groups of 70-85 F-344 rats/sex were administered 0 - 500 - 1,500 - 6,000 - 12,000 ppm DINP (CAS 68515-48-0, purity > 99%) in the diet for 104 weeks. A recovery high-dose group of 55 rats/sex, was administered 12,000 ppm DINP for 78 weeks, followed by a 26 week recovery period during which untreated diet was given. A positive control group of 15 male rats was given 1,000 ppm of WY 14,643 ([4-chloro-6-(2,3 xylidino)-2-pyrimidinylthio]acetic acid > 98% purity) in the diet for 13 weeks. Hepatocellular proliferation rates and biochemical analyses (protein concentration, cyanide insensitive palmitoyl-CoA oxidation and DNA concentration) were performed on 5-15 rats/sex sacrificed at selected intervals i.e. w-1, w-2, w-13, w-79 and/or w104 (Table 4.40).
Experimental procedure, results of serum chemistry, urine chemistry, haematology analysis, as well as body weight and organ weight changes, clinical in-life observations and food consumption were thoroughly described in repeated dose section. Results reported below only concerned neoplasic findings.
• Results Organ weight data, necropsy, and histopathological findings indicated that the liver and kidney were target organs:
Liver: In both sexes of rats of the mid high and high-dose groups, enlargement and/or granular/pitted/rough changes were observed (unscheduled deaths, killed at week 79 and at study termination) as well as, statistically significant increases in mean absolute and relative liver weights at weeks 1, 2, 13, 79 and at study termination (however, the liver enlargement appeared to be reversible, in that absolute and relative liver weights in the high recovery dose group were comparable to control values).
A treatment related excess of liver masses was only observed in the high-dose males (2/15 males at week 79; 10/32 males at week 105 and 2/34 in high recovery dose group males); no such increase of liver masses was observed in females.
After 1 week of treatment, significant increases of the numbers of mitotic cells, of mean labelling index for hepatocytes and of the palmitoyl-CoA oxidase activity were observed in the livers of all 5 males and 5 females of the high-dose group. After 2, 13 and 79 weeks, only diffuse hepatocellular enlargement and significantly increased palmitoyl-CoA oxidase activity were
214

CHAPTER 4. HUMAN HEALTH
evident in all high-dose males and females killed at this time interval (number mitotic cells and labelling index were no longer increased compared to controls, indicating that peroxisome proliferation but not cell proliferation was still occurring in both sexes of the high-dose group). At study termination (week 104), diffuse hepatocellular enlargement was observed only in high-dose males (14/32, mean severity = 0.9) and females (27/37; mean severity = 1.5) and palmitoyl-CoA oxidase activity was again significantly elevated in this group, but also in mid-high-dose females. Palmitoyl-CoA oxidase activity was not evaluated in the high recovery dose group, making the evaluation of reversibility not assessable. Large increases were observed in the positive controls animals at week 1, but questionable responses were observed at week 2 and 13. Concurrently, increased numbers of mitotic figures in the high-dose group and in positive control group at week 1, but not after, were mentioned in the histopathological report. Increases in Palmitoyl-CoA oxidase activity were observed in group 5 (12,000 ppm) rats at all time-points and in female rats at 6,000 ppm at week 104 (only time-point evaluated). Those results showed evidence of peroxisome proliferation associated with cell proliferation at week-1 only. It should be noted that the positive control has not given the expected results.
Increased cytoplasmic eosinophilia was observed in both sexes of the high-dose group (first detected at week-13 in all 5 males and in 2/5 females, and also seen at week-79 in 7/10 males and 8/10 females and at study termination in 26/32 males and 30/37 females). There was increased pigment in Kupffer cell/bile canaliculi (first detected at week-79 in 5/10 males and seen at study termination in 1/41, 0/36, 5/32 and 2/29 males and in 5/42, 5/38, 14/37 and 9/34 females of the control- 6,000 - 12,000 and 12,000 recovery groups, respectively). Spongiosis hepatitis was observed in male rats (33% and 56% incidence at 6,000 and 12,000 ppm, respectively vs. 2% incidence in the control males).
It seems therefore that in the high-dose group, the treatment-related liver enlargement was reversible, in that mean liver weights (absolute and relative) at study termination in the recovery group were comparable to control mean values, that histological liver changes were also reversible in that diffuse hepatocellular enlargement and the incidence of pigment in Kupffer cell/bile canaliculi was comparable to the control group incidence.
An increase incidence of hepatocellular neoplasia (31% in males versus 6% in controls) was observed in both sexes of the high-dose group. The hepatocellular neoplasms occurred late in the study, and were first detected at the 78-week interim sacrifice and subsequently observed in unscheduled deaths and in rats killed at study termination. There was a higher incidence of adenoma and carcinoma in males. This is consistent with the fact that male rats mostly have a higher metabolism rate than females. No significant increase was noted in high recovery dose group indicating that the neoplasm developed during the last 26 weeks of treatment.
Kidney: The only gross abnormal finding found at necropsy was the dark appearance of the kidneys in both sexes of the mid high and high-dose groups. Statistically significant increases in mean absolute and relative kidney weights were observed in these groups at week-79 and at study termination. However, the kidney enlargement appeared reversible, in that mean absolute and relative kidney weight values in the high recovery dose groups were comparable to control values.
Treatment-related histopathologic kidney changes consisted of increased incidence and severity of mineralization of the renal papilla in mid-high and high-dose group males (which was not reversible after a 26-week recovery period) and increased incidence and severity of tubule cell pigment in both sexes of the mid-high and high-dose groups (which seemed partially reversible in both sexes after a 26-week recovery period). Malignant tubule cell carcinomas were only seen
215

EU RISK ASSESSMENT REPORT – DINP FINAL REPORT, 2003
in the 2 and 4 males of the high and high recovery groups, respectively. The kidney findings were observed in the presence and absence of spontaneously occurring leukemia. Although no kidney neoplasms were detected in females, malignant tubule cell carcinomas were found in 4 of the high recovery group males, of which 3 were killed following the recovery phase). Histological features were consistent with the specific male rat nephropathy namely alpha 2u globulin nephropathy, confirmed by the retrospective evaluation of findings conducted by Caldwell (Caldwell, 1999b) and also hypothesised in the DIDP risk assessment. Exposure to DINP produced a dose-dependant alpha 2u globulin accumulation in male rat kidney’s, significant at a dietaty level of 0.6% (Exxon Biomedical Sciences, 1986; Hazleton, 1986; Lington et al., 1987; Lington et al., 1997) and a likely mechanism for the kidney tumours seen only in male rats administered the higher dose of 12,000 ppm in this study. The species and sex-specific alpha 2u globulin mechanism likely responsible for kidneys tumours seen in male rats administered excessively high dose of DINP in chronic studies is not regarded as relevant to humans (IARC, 1999).
Table 4.4 Hepatocellular neoplasms 0
Dose groups (ppm in diet)
1 2 3 4 5 6
Control 500 ppm 1,500 ppm 6,000 ppm 12,000 ppm 12,000 ppm Recovery
Males
Hepatocellular adenoma 2/41 2/35 1/39 4/36 8/32 4/29
1/41 0/35 0/39 1/36 9/32 1/29
Females
Hepatocellular adenoma 0/42 0/38 0/40 1/38 0/37 0/34
Hepatocellular carcinoma 1/42 0/38 0/40 1/38 3/37 1/34
Total incidence
80 50 50 65 80 50
Males
Hepatocellular adenoma 4 4 2 6 10 5
Hepatocellular carcinoma 1 0 0 1 11 2
Multiple neoplasms 0 0 0 1 4 0
Total rats with hepatocellular neoplasm
5 4 2 7 17 7
Females
Hepatocellular adenoma 0 1 0 1 3 1
Hepatocellular carcinoma 1 0 0 1 5 2
Multiple neoplasms 0 0 0 0 0 1
Total rats with hepatocellular neoplasm
1 1 0 2 8 2
Terminal sacrifice
Hepatocellular carcinoma
N° of animals examined/sex
216

CHAPTER 4. HUMAN HEALTH
Table 4.41 Kidney findings
Groups (ppm) 0 500 1,500 6,000 12,000 12,000 recovery
M F M F M F M F M F M F
Mineralization of renal papilla
N° examined 36 35 39 31 37 29
Minimal 6 11 9 6 2 0
Slight 0 0 0 24 1 2
Moderate 0 0 0 0 22 27
Total 6 11 9 30 25 29
Tubule cell pigment
N°examined 36 37 35 39 40 31 33 27 32 29 34
Minimal 24 21 18 0 0 0
Slight 10 12 21 23 7 26
Moderate 0 1 0 6 17 3
Moderately severe
0 1 0 2 3 0
Total 34 36 35 39 40 31 33 27 32 29 34
Kidney neoplasms
Number of animals examined
60 60 50 50 60 50
Malignant tubule cell carcinoma
0 0 0 0 2 4
Malignant transitional cell carcinoma
0 0 0 1 0 0
Mononuclear cell leukaemia: Incidence of mononuclear cell leukemia was increased in both sexes among mid-high, high and high-recovery doses groups, with the highest incidence in the high-recovery dose group and was the common cause of death in all groups, but was observed with a greater frequency in unscheduled deaths of the mid high and high-dose groups (including the recovery group). Correlating with the increased incidence of leukemia, statistically significant increases of mean absolute and relative spleen weights were observed in both sexes at study termination. The incidence of leukemia in group 6 (12,000 ppm R) is outside the historical range of spontaneous leukemias for the testing facility and the animal breeder in both male and female and outside the historical range of spontaneous leukemias reported by IARC for males only.
217

EU RISK ASSESSMENT REPORT – DINP FINAL REPORT, 2003
Table 4.4 Mononuclear cell leukemias 2
12,000 Dose groups (ppm)
0 500 1,500 6,000 12,000 recovery
M F M F M F M F M F M F
As cause of death
7 7 8 5 7 3 16 12 18 13 14 12
Terminal sacrifice
14/41 10/42 14/25 11/38 14/39 6/40 16/36 14/38 11/32 15/37 15/29 12/34
22/65 17/65 23 16 21 9 32/65 29/65 30/65 30/65 31/50 24/50
Total incidence
Table 4.4 Mononuclear cell leukemia frequency, historical data 3
Laboratory historic control
38.9% (36.2-46) in males (% and range) 30.3% (13.3-40) in females (% and range)
Charles River laboratory published spontaneous rate
16.5% (0-31.3) in males (% and range) 10.4% (0-26.4) in females (% and range)
IARC incidence data (%) a)
10-50%
NTP 1994 incidence data (%) (Caldwell 1996)
37-72% in males 14-52% in females
a) incidence data published by IARC (1990)
In males and females of mid-high, high and high-recovery dose groups (unscheduled deaths), gross pathology findings indicated small testes, small seminal vesicles, and uterine masses, however in at week 79 and at study termination, there were no statistically significant differences in mean absolute weights for testis/epididymis or uterus among groups. For all deaths combined, there was no histopathological evidence of an effect neither on spermatogenic activity (section of testes with epididymides) nor on the incidence of morphologic uterine changes.
It can be assumed from this study that the NOAEL for carcinogenic potential in rodents is 1,500 ppm (i.e. approximately to 88 mg/kg bw/d in males and to 109 mg/kg bw/d in females) based on increased incidence of mononuclear cell leukemia in males and females observed at 6,000 ppm. The dietary concentration of 12,000 ppm induced increased incidence of hepatocellular neoplasms in males and females and renal carcinomas in males. However those effects are of limited relevance to humans. Indeed, MNCL is a common neoplasm in the Fischer 344 rats and the increased incidence after chronic exposure to some substances is likely a strain specific effect with little relevance for humans. Pertaining to liver tumours, the mechanism of peroxisome proliferation by which DINP increased the incidence of liver tumours in rodents is considered species-specific: the current literature reported that only rats and mice are responsive to the carcinogenic effects of peroxisome proliferators while dogs, non-human primates and humans are essentially non-responsive or refractory. For kidney tumours, the species and sex-specific alpha 2u globulin mechanism likely responsible for kidney tumours seen in male rats is not regarded as relevant to humans.
218

CHAPTER 4. HUMAN HEALTH
Mice
104-week feeding study
Groups of 70 B6C3F1/Crl BR mice /sex were administered daily 0 – 500 – 1,500 – 4,000 and 8,000 ppm DINP (CAS 68515-48-0, > 99% purity) in the diet (70/sex/group) for at least 104 weeks (Aristech Chemical Corporation, 1995c; Butala et al., 1997); a recovery high-dose group of 55 mice/sex was also given 8,000 ppm DINP in the diet for 78 weeks, followed by a 26-week recovery period.
This study which was conducted in accordance with EPA guidelines, 40 CFR Part 798.3300, complied with EPA GLP Standards 40 CFR, Part 792. It was designed to assess the oncogenic potential of DINP when administered in the diet and to evaluate its ability to cause hepatocellular proliferation and peroxisomal proliferation.
Experimental procedure, results of serum chemistry, urine chemistry, haematology analysis, as well as body weight and organ weight changes, clinical in-life observations and food consumption are thoroughly described in repeated dose section. Results reported below only concerned neoplasic findings.
• Results Survival and common cause of death: adjusted mean survival rate (excluding interim sacrifice, accidental deaths and mice removed from the study) was significantly decreased for the high-dose males compared to the controls (calculated values were 87, 87, 76, 79, 63 and 81% for males and 81, 79, 81, 62, 77 and 75% for females from the control, low, mid-low, mid-high, high and recovery high-dose groups, respectively).
Table 4.4 Survival data and common cause of death 4
0 ppm 500 1,500 4,000 8,000 8,000 R
M F M F M F M F M F M F
Survival
Unscheduled deaths Week 1-78 Week 79-106
4 5
5 8
2 7
5
6 8
3 10
5 10
7 14
12 11
5 10
10 2
6 9
Total deaths 9 13 9 10 14 13 15 21 23 15 12 15
Terminal sacrifice 46 42 46 15 41 42 40 34 32 40 40 43
Total 70 40 70 70 70 70 70 70 70 70 55 55
Common cause of death
N° examined 9 13 9 15 14 13 15 21 23 15 12 15
Hepatocellular neoplasia 1 0 3 0 4 1 7 3 6 6 3 5
Lymphoma 1 5 0 6 0 3 1 7 2 0 0 1
Histiocytic sarcoma 1 3 1 0 0 3 3 1 0 0 1 2
Fibrosarcoma 2 2 1 1 1 0 0 3 0 1 4 0
Hemangiosarcoma 0 0 1 1 0 2 1 2 1 2 1 1
219

EU RISK ASSESSMENT REPORT – DINP FINAL REPORT, 2003
Histopathology: the most remarkable gross pathology findings at week 79 interim sacrifice were increased incidence of liver masses in the mid-low, mid-high and high-dose males and high-dose females, enlarged liver in high-dose females and distended urinary bladder in high-dose 5 males. At study termination, the most substantial gross changes were lung masses in all groups (primarily in males), liver masses (most frequently seen in mid-high, high and recovery high-dose groups; these masses corresponded to hepatocellular neoplasms or involvement by lymphoma or histiocytic sarcoma), enlarged spleen (all groups, predominantly in females; due to increased extramedullary hematopoiesis or to involvement by hemangioma and/or hemangiosarcome or hematopoietic neoplasia), granular pitted/rough kidneys in high-dose females (corresponding to increased incidence/severity of treatment-related nephropathy) and distended urinary bladder most frequently seen in mid-high and high-dose males, with no histological corrolate. Histological examinations revealed an increased incidence of hepatocellular neoplasia in high-dose males and females, in addition to non-neoplastic changes consisting of increased cytoplasmic eosinophilia, diffuse hepatocellular enlargement, and pigment. In recovery high-dose mice, the non-neoplastic changes were not present, although the incidence of hepatocellular neoplasia was increased in females (37%, 13/35) compared to controls (7%, 3/42) and lower dose groups. The total incidence of hepatocellular neoplasia in mid-high-dose males (47%, 28/60) was also greater than that observed in controls (23%, 16/70). There was no significant increases in the total incidence (all death combined) of liver adenoma in any of the treated male groups and it was only significantly increased in the high and recovery high-dose females (18/70 and 8/50, respectively). Hepatocellular carcinoma was significantly elevated compared to the respective controls in the mid-high and high-dose males (17/60 and 20/60, respectively) and in the mid-high, high and recovery high-dose females (7/60, 18/70 and 13/50, respectively). In the mid-low-dose females, although the incidence of hepatocellular adenoma or carcinoma were not statistically different compared to the incidences in control group, the incidence of total liver neoplasms (adenoma and carcinoma combined) was significantly greater that the total liver neoplasms in controls (10/60 versus 3/70). Other neoplasms were of the expected type and severity for mice of this age and strain and their frequencies were not affected by the test article administration.
Administration of the test substance did not induce significant increases in the mean labelling index for livers of high-dose mice compared to controls. After 78 weeks of treatment, the mean labelling index in liver for control and high-dose groups was 1.24 and 0.59% in the males and 0.30 and 0.12% in the females, respectively. After 104 weeks of treatment, the mean labelling index in the liver for control and high-dose groups was 0.59 and 1.90% in the males and 0.41 and 1.44% in the females, respectively. There was no evidence of sustained cell proliferation in the livers of male or female mice up to 8,000 ppm group compared to controls.
220

CHAPTER 4. HUMAN HEALTH
Table 4.4 Hepatocellular neoplasia 5
Dose groups (ppm in diet)
Control Low Mid low Mid high High Recovery high
0 ppm 500 ppm 1,500 ppm 4,000 ppm 8,000 ppm 8,000 ppm R
M F M F M F M F M F M F
Total incidence
N° examined 70 70 60 61 60 60 60 60 70 70 50 50
Hepatocellular:
adenoma 10 2 7 4 8 5 15 4 13 18 8 8
carcinoma 10 1 8 17 2 10 5 7 20 18 12 13
Total with hepatocellular neoplasms
16 3 13 5 18 10 28 11 31 32 19 18
Unscheduled deaths
N° examined 9 13 9 15 14 13 15 21 23 15 12 15
Hepatocellular:
Adenoma 0 0 2 0 0 2 1 0 2 1 0 1
Carcinoma 1 0 3 0 4 2 8 6 9 7 4 5
1 0 4 0 4 4 9 6 9 9 4 5
Terminal sacrifice
N° examined 46 42 35 41 36 36 37 35 29 32 40 38
Hepatocellular
9 2 4 4 5 2 12 4 10 15 8 7
Carcinoma 9 1 5 1 5 3 7 1 10 7 8 8
Total neoplasms 14 3 8 4 10 5 16 5 18 20 15 13
Total neoplasms
Adenoma
Peroxisome proliferation: after 78 weeks of treatment, the mean liver palmitoyl-CoA oxidase activity was significantly increased in all animals treated with 8,000 ppm compared to controls (36.07 and 37.09 NADH/minute/mg of protein in high-dose males and females, respectively versus 3.75 and 2.25 NADH/minute/mg of protein in corresponding controls). Comparable results were noted after 104 weeks of treatment: 53.79 and 52.82 NADH/minute/mg of protein in treated males and females versus 6.7 and 6.54 NADH/minute/mg of protein in respective controls. At the dose of 8,000 ppm, DINP exhibits a great level of peroxisome proliferation.
Analyses of liver DNA concentration did not detect any biologically relevant differences in mean values between control and high-dose males or females after 78 or 104 weeks of DINP administration. Conversely, liver mean protein concentration was significantly increased in the high-dose mice compared to controls (at 78 weeks, 156.2 and 153 mg/g liver in males and females versus 132.7 and 126 mg/g liver in respective controls and at 104 weeks: 179.8 and 149.2 mg/g liver in treated males and females versus 151.5 and 126.8 mg/g liver in respective controls).
Only the summary report was available for the assessment and it should be noted that analyses were only performed in high- dose group at weeks 78 and 104.
221
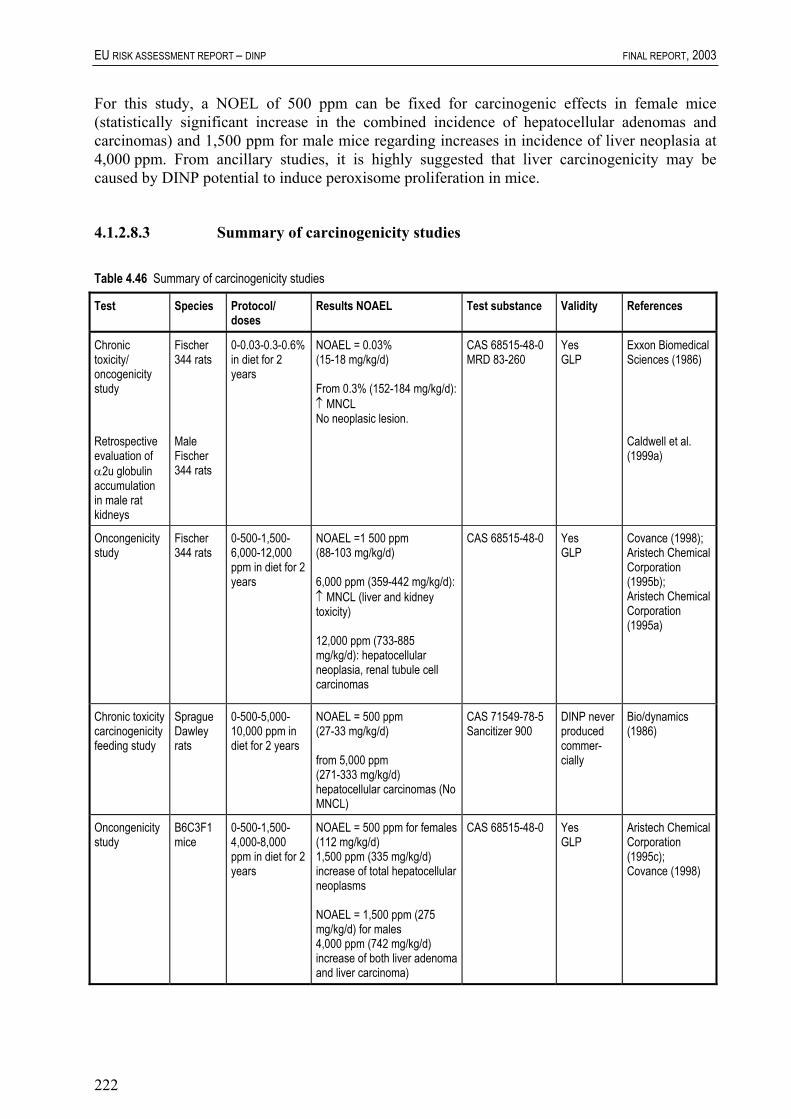
EU RISK ASSESSMENT REPORT – DINP FINAL REPORT, 2003
For this study, a NOEL of 500 ppm can be fixed for carcinogenic effects in female mice (statistically significant increase in the combined incidence of hepatocellular adenomas and carcinomas) and 1,500 ppm for male mice regarding increases in incidence of liver neoplasia at 4,000 ppm. From ancillary studies, it is highly suggested that liver carcinogenicity may be caused by DINP potential to induce peroxisome proliferation in mice.
4.1.2.8.3 Summary of carcinogenicity studies
Table 4.4 Summary of carcinogenicity studies 6
Test Species Protocol/ doses
Results NOAEL Test substance Validity References
Chronic toxicity/ oncogenicity study
Fischer 344 rats
0-0.03-0.3-0.6% in diet for 2 years
NOAEL = 0.03% (15-18 mg/kg/d) From 0.3% (152-184 mg/kg/d): ↑ MNCL No neoplasic lesion.
CAS 68515-48-0 MRD 83-260
Yes GLP
Exxon Biomedical Sciences (1986)
Retrospective evaluation of α2u globulin accumulation in male rat kidneys
Male Fischer 344 rats
Caldwell et al. (1999a)
Oncongenicity study
Fischer 344 rats
0-500-1,500-6,000-12,000 ppm in diet for 2 years
NOAEL =1 500 ppm (88-103 mg/kg/d) 6,000 ppm (359-442 mg/kg/d): ↑ MNCL (liver and kidney toxicity) 12,000 ppm (733-885 mg/kg/d): hepatocellular neoplasia, renal tubule cell carcinomas
CAS 68515-48-0 Yes GLP
Covance (1998); Aristech Chemical Corporation (1995b); Aristech Chemical Corporation (1995a)
Chronic toxicity carcinogenicity feeding study
Sprague Dawley rats
0-500-5,000-10,000 ppm in diet for 2 years
NOAEL = 500 ppm (27-33 mg/kg/d) from 5,000 ppm (271-333 mg/kg/d) hepatocellular carcinomas (No MNCL)
CAS 71549-78-5 Sancitizer 900
DINP never produced commer-cially
Bio/dynamics (1986)
Oncongenicity study
B6C3F1 mice
0-500-1,500-4,000-8,000 ppm in diet for 2 years
NOAEL = 500 ppm for females (112 mg/kg/d) 1,500 ppm (335 mg/kg/d) increase of total hepatocellular neoplasms NOAEL = 1,500 ppm (275 mg/kg/d) for males 4,000 ppm (742 mg/kg/d) increase of both liver adenoma and liver carcinoma)
CAS 68515-48-0 Yes GLP
Aristech Chemical Corporation (1995c); Covance (1998)
222

CHAPTER 4. HUMAN HEALTH
4.1.2.8.4 Other data
Peroxisome proliferation induction potential
Benford et al. (1986) investigated the peroxisome proliferation induction potential of FIDP monoester and DINP monoester (MiDP and MiNP, respectively) and DINP in primary monolayer cultures of rat and marmoset monkey hepatocytes. Mono-(2-ethylhexyl) phthalate (MEHP) was used as a positive control. The measured parameters were peroxisomal palmitoyl-CoA (PCoA) oxidation, laurate 11-12 hydroxylation (LAH) and the protein content of the homogenate. This study was not carried out in compliance with GLP standards.
In the rat hepatocytes culture, MiDP and MiNP were both peroxisome proliferators as indicated by marked dose-related increases in PCoA oxidation. The rank was in order MEHP > MiDP> MiNP >DINP. DINP caused much smaller increases as it is poorly converted to the monoester in the culture system. LAH appeared to be more sensitive to induction by MiDP and MiNP than by MEHP, the rank was in order MiDP> MiNP > MEHP.
In the marmoset hepatocytes culture, only minimal changes in PCoA oxidation activity were observed with MiDP, MiNP or DiNP with poor dose dependency and showed no changes with MEHP; MiDP and MiNP caused up to 4 and 3-fold increases in LAH activity (, respectively). MEHP has no effect. A marked species difference has been observed in peroxisomal proliferation by phthalates in culture hepatocytes.
Gap junctional intercellular communication (GJIC) effects
Baker et al. (1996) examined the Gap junctional intercellular communication (GJIC) effects in hepatocytes of 4 species (rats, mice, hamsters, humans) for 5 phthalate monoesters (MINP-M, MINP-S, MEHP, MNOP, M711P) which are metabolites of the following diesters: two types of diisononyl phthalate (DINP-1, CAS 68515-48-0 and DINP-A, CAS 71549-78-5, respectively) di-2-ethyl hexyl phthalate, di-n-octyl phthalate and diheptyl undecyl phthalate, respectively.
In rat hepatocytes, all 5 monoesters inhibit GIJC. In mouse hepatocytes MEHP, M711P and MINP-S inhibit GIJC but not MINP-M and MNOP. In hamster or human hepatocytes and in a human liver cell line, none of the 5 monoesters inhibited GIJC at non-cytoxic doses. According to the authors, GJIC assay has good cancer predictive potential for phthalates (Kalimi et al., 1995).
The short-term hepatic effects of DINP in rats and mice at tumorigenic and non-tumorigenic doses were evaluated for comparison with chronic studies and with data for other structurally similar dialkyl phthalate esters ranging from C7 to C11 (Smith et al., 1999; 2000). Hepatic GJIC was inhibited and DNA synthesis was increased at the high dose. These hepatic effects were not observed at the low doses. No more information is available on this study, only an abstract has been provided.
The role of the peroxisome proliferator -activated receptor α (PPARα) in hepatic responses to DINP was investigated in a study with SV 129 PPAR a-null mice (Valles et al., 1999). Male and female SV 129 PPAR a-null mice (-/-), SV 129 PPARα (+/+) and B6C3F1 mice were fed a control diet or a diet containing 8,000 ppm of DINP for 1 or 3 weeks. There was an increase of liver weights in male and female of the SV 129 PPARα (+/+) and B6C3F1 mice exposed for one week, whereas this increase was abolished in the 1-week treated SV 129 PPAR a-null (-/-) mice. Western blot analysis of liver protein extracts revealed that acyl-CoA oxidase and CYTP450 4a proteins were induced in PPAR α (+/+) but not in PPARα (-/-) female mice after 3-week exposure. It was also demonstrated that some genes involved in drug metabolism and protein
223

EU RISK ASSESSMENT REPORT – DINP FINAL REPORT, 2003
trafficking were altered in liver of female PPARα (+/+) mice but not in PPARα (-/-) mice. These data support the hypothesis that DINP like DEHP (Lee et al., 1995) or other peroxisome proliferators induces liver effects through a PPARα-dependent mechanism.
4.1.2.8.5 Summary of carcinogenicity
DINP Cell transformation studies give various results: 3/7 tests are negative, 3/7 tests are doubtful (slight increases of transforming activity without statistical significance) and 1/7 test is clearly positive. The experimental conditions are not quite identical and those results are not inconsistent and such positive results are in accordance with those of well-known peroxisome proliferators. Interestingly the three negative studies were done at higher doses.
In Chronic / Carcinogenicity studies DINP was found to induce significant excess of liver neoplasia in rat and mouse after oral administration: in the Fisher strain, incidence of hepatocellular neoplasic changes was significantly increased in both sexes at dietary levels of 12,000 ppm DINP. In mice, liver neoplasia were seen in males and females from dietary levels of 4,000 and 1,500 ppm, respectively and lead to a NOAEL of 500 ppm (112 mg/kg/d in females).
It was demonstrated that DINP induced peroxisome proliferation in rodents (as evidenced by histological and biochemical analysis). It should be noted that hepatic peroxisomal ß oxidation was not affected in monkeys after 14 days DINP administration (Pugh et al., 1999; 2000) neither in a 13-week study in which no changes related to peroxisome proliferation were reported (Huntington Life Sciences, 1998).
From the literature data, it is known that all peroxisome proliferators which were investigated, are able to induced increased cell proliferation which was sustained for several months for some compounds. In the Covance’s studies, aimed to assess cell proliferation, the mean labelling index was increased during the first week in both sexes of rats and mice at the 12,000 ppm dietary dose level and DNA synthesis was also increased in rats and mice after 2-4 weeks of treatment by dietary dose of 12,000 and 6,000 ppm, respectively. Interestingly, replicative DNA synthesis is not affected in the monkey-14 day-study.
From recent studies (Vanden Heuvel, 1999) it is assumed that PPARα was involved in hepatic tumour promotion as demonstrated in PPARα -knockout mouse (Valles et al., 1999) and that it was also implicated in apoptosis repression. In term of extrapolation, (or relevance) to human it is discussed as follow: “Based on the studies showing the importance of PPAR in cancer, the question may become: do humans possess PPARα in liver and cloned human PPARα functions in a manner similar to its rodent counterpart. However, it has been known for quite some time that human cells are refractory to peroxisome proliferation and induction of PPAR-responsive genes is less than that of rat or mouse cells; a partial explanation for decreased PP-responsiveness may be that PPAR expression is lower in human cells”. Most of the epidemiological data supports the fact that humans exposed to fibrate hypolipidemic drugs are not at increased cancer risk. The most recent information (Woodyatt, 1999) provides a possible explanation at the genomic level to the lack of response of human to hepatocarcinogenic effects of PPs. The data presented in this paper suggest that the human ACO (acyl coA oxidase) gene promoter, one of the -responsive genes, is inactive in most of the individuals.
It should be noted that recently, IARC gave a ruling on the carcinogenicity of DEHP and concluded that the mechanism (peroxisome proliferation and PPARα activation) by which DEHP increased the incidence of liver tumours in rodents was not relevant to humans.
224

CHAPTER 4. HUMAN HEALTH
Regarding MNCL, a clear increase incidence is observed in the two studies conducted with Fisher rats (outside the historical range of spontaneous leukemia), along with shortening of the onset of MNCL. However, MNCL is a common neoplasm in the Fischer 344 rats and the increased incidence after chronic exposure to some substances is likely a strain specific effect with little relevance for humans. Of interest, the IARC categorised MNCL as “an unclassified leukemia with no known human counterpart” and substances which increase MNCL frequency as “not classifiable as to carcinogenicity in humans” (IARC, 1990).
Pertaining to kidney tumours, the species and sex-specific alpha 2u globulin mechanism likely responsible for kidney tumours seen in male rats is not regarded as relevant to humans.
4.1.2.9 Toxicity for reproduction
4.1.2.9.1 Developmental toxicity and fertility
One-generation study in rats
In this reproduction toxicity study (Exxon Biomedical Sciences, 1996i), test material (undiluted DINP, MRD-92-455 CAS 68515-48-0) diet admixtures were administered ad libitum to 30 rats/sex/group at 3 dosage levels. Group 1 served as a control and received carrier only. Groups 2, 3 and 4 received 0.5%, 1.0% and 1.5% of DINP in feed, respectively. The mean measured dose rat (mg/kg/day) ranges for each group during the premating, gestation and postpartum periods were as indicated in Table 4.47.
P1 males and females received test material daily for at least ten weeks prior to mating and during the mating period. Additionally, P1 female animals received test material during the gestation and postpartum periods, until weaning of the F1 offspring on Postpartum Day (PPD) 21. All animals received test material daily until sacrificed.
Table 4.47 Actual dose related to concentration in diet
Actual dose in mg/kg/day Concentration in diet
Premating: males Premating: females
0.5% 301 - 591 363 - 624
1.0% 622 – 1,157 734 – 1,169
1.5% 966 – 1,676 1,114 – 1,694
Actual dose in mg/kg/day Concentration in diet
Gestation: Females Postpartum: Females
0.5% 377 - 404 490 - 923
1.0% 741 - 796 1,034 – 1,731
1.5% 1,087 – 1,186 1,274 – 2,246
Clinical inlife observations, body weight, and food consumption were recorded for all P1 animals at least weekly during the premating and mating periods (food consumption was not measured during mating due to cohabitation), and for females on Gestation Days (GD) 0, 7, 14
225

EU RISK ASSESSMENT REPORT – DINP FINAL REPORT, 2003
and 21 and on Postpartum Days (PPD) 0, 4, 7, 10 14 and 21 and/or at least weekly until sacrificed. Following birth, the offspring were counted and examined externally daily from Postnatal Day (PND) 0 to 21. Offspring were sexed and weighed on PND 0, 1, 4, 7, 14 and 21. P1 males were sacrificed following the birth of their last litter sired, while females were sacrificed following weaning of their litters on PPD 21. A gross necropsy was performed on all adult animals, selected F1 neonates and on all animals which died during the study. A full macroscopic examination was performed on these animals and selected organs and tissues were collected and weighed.
The results of this study were used to design a follow-up two-generation reproductive study of DINP.
Parental toxicity
There were no clinical signs in the parental animals which were judged to be directly related to treatment with DINP. The majority of animals in all groups had no adverse clinical signs during the premating/mating, postmating, gestation and/or postpartum periods.
Statistically significant lower mean body weights, as well as suppression in body weight gain, were observed primarily in the mid and high-dose parental animals compared with controls. These lower body weights were apparent as early as Week 1 or 2, and were observed during the majority of weighing intervals until scheduled study termination. The greatest decrease from controls (up to 23.3%) was observed during the postpartum period. Similarly, statistically significant lower mean food consumption was observed primarily in the mid and high-dose animals compared with controls. These findings were important in their apparent relationship to findings in the offspring and relative organ weights.
There were statistically significant increases in the mean absolute and/or mean relative liver and kidney weights of both male and female animals at all dose levels tested (0.5, 1.0 and 1.5%) compared with controls. Generally, these increases occurred in a dose-related fashion.
Pertaining to male organ toxicity, there was a statistically significant increase in the mean absolute and relative right testis weight, left testis and right epididymis weights and the mean relative left epididymis and seminal vesicle weights in the high-dose males compared with controls.
In females, there was a statistically significant decrease in the mean absolute and relative right ovarian and mean absolute left ovarian weights of the high-dose females compared with controls. Histopathological examination was not conducted to confirm if any structural changes occurred.
It was not determined if any structural changes occurred in reproductive organs at any dose level: microscopic evaluation was not performed on any organs in both sexes. Thus significance of organ weight changes could not be assessed because of the limitation of the study. However, there were no statistically significant differences in male mating, male fertility, female fertility, female fecundity, or female gestational indices between treated and control animals. Mean days of gestation of the treated and control groups were essentially equivalent. However, the mean litter size (12.5) and mean live offspring (11.9) of the high-dose animals were lower than controls (14.1 and 13.9, respectively), and the historical control range of this laboratory (16.8-12.6 and 16.1 and 12.2f, respectively). There were no statistically significant differences in the mean sex ratio of the treated offspring compared with controls.
226

CHAPTER 4. HUMAN HEALTH
There were no gross post-mortem findings in the parental animals judged to be related to treatment with DINP. The majority of animals in all groups were free of observable abnormalities at post-mortem examination. There were no significant post-mortem findings in the two animals which succumbed prior to scheduled study termination.
Offspring toxicity
The mean live birth index (95.2%), Day 4 survival index (85.6%), Day 14 survival index (92.7%) and lactation index (87.2%) of the high-dose offspring were statistically significantly decreased compared with controls (live birth: 98.2%, Day 4: 93.1%, Day 14: 98.5% and lactation index: 93.9%). The historical control range from this laboratory was the following: live birth: 99.1-95.2%, Day 4: 99.5-89.0%, Day 14: 100-93.7% and lactation index: 100-86.9%.
There were no treatment-related clinical findings observed in the offspring of any group. The majority of offspring in all groups were free of observable abnormalities from PND 0-21.
Dose-related decreases in mean offspring body weight were observed during the postnatal period (PND 0-21). There were statistically significant lower mean body weights in the high-dose males (10.2-46.0%) and females (11.3-46.9%), mid-dose females (7.9-26.9%) at all weighing intervals and in mean offspring body weight of the mid-dose males on PND 0, 1, 7, 14 and 21 (5.7-26.5%) compared with controls.
There were also statistically significant lower mean body weights in the low-dose males on PND 0, 1, 14 and 21 (6.9-11.2%) and low-dose females (7.5-10.1%) at all weighing intervals.
The majority of animals were free of observable abnormalities at the scheduled terminal sacrifice on PND 21. Similarly, the majority of animals which died prior to scheduled termination (PND 0-20) was free of observable abnormalities, or was too autolyzed to be examined at the necropsy.
For parental systemic toxicity, based on increases in liver and kidney weights from 0.5%, no NOAEL can be determined. Based on decreases in offspring body weight from the lower dose tested, no NOAEL can be determined. No effect was observed on fertility parameters but a decrease of life birth and survival indices occurred at 1.5% which led to a NOAEL of 1%.
Two-generation reproduction studies in rats
In a two-generation study (Exxon Biomedical Sciences, 1996j), four groups of Crl:CDBR, VAF Plus rats (30 rats/sex/group) were administered daily in the diet DINP (MRD 92-455, CAS 68515-48-0) at doses of 0-0.2%-0.4%-0.8%. The actual doses in mg/kg/day were given in Table 4.48. These doses were selected based on findings from the previous One-Generation Probe Study.
In this two-generation study (Exxon Biomedical Sciences, 1996j; Waterman et al., 2000), performed in accordance with GLP procedures, P1 males and females received test material daily for at least ten weeks prior to mating and during the mating period. Additionally, P1 female animals received test material during the gestation and postpartum periods, until weaning of the F1 offspring on Post Partum Day (PPD) 21. P2(F1) males were dosed from Post Natal Day (PND) 21 for at least 10 weeks prior to mating and through the mating period for F2 litters, until sacrificed following delivery of their last litter sired. P2(F1) females were dosed from PND 21 for at least 10 weeks prior to mating, during mating, gestation, lactation, and until they were sacrificed following weaning of the F2 animals on PPD 21.
227

EU RISK ASSESSMENT REPORT – DINP FINAL REPORT, 2003
Table 4.48 Actual dose related to concentration in diet
Actual dose in mg/kg/day Concentration in diet
Premating P1 generation Premating P2 generation
0.2% 118-215 mg/kg/d 114-264 mg/kg/d
0.4% 236-426 mg/kg/d 235-523 mg/kg/d
0.8% 477-852 mg/kg/d 467-1,090 mg/kg/d
Gestation P1 and P2 generations Post-Partum P1 and P2 generations
0.2% 133-153 mg/kg/d 159-395 mg/kg/d
0.4% 271-307 mg/kg/d 347-758 mg/kg/d
0.8% 543-577 mg/kg/d 673-1,541 mg/kg/d
Clinical inlife observations, body weight, and food consumption were recorded for all P1 and P2 animals at least weekly during the premating and mating periods (food consumption was not measured during mating due to cohabitation) and for females on gestation days 0, 7, 14, 21 and on PPD 0, 4, 7, 10, 14, and 21 and/or at least weekly until sacrificed. Following birth, the offspring were counted and examined externally daily from PND 0 to 21.
Offspring were sexed and weighed on PND 0, 1, 4, 7, 14, and 21.
Twice daily during the postnatal period, the litters were checked for dead offspring and unusual conditions, and the dams were examined for viability, nesting behaviour, and nursing behaviour. If intact, dead pups were examined externally and internally for anomalies.
P1/P2 males were sacrificed following the birth of their last litter sired, while females were sacrificed following weaning of their litters on PPD 21.
A gross necropsy was performed on all adult animals, selected F1 and F2 neonates (10 offspring/sex/group), and on all animals which died during the study. A full macroscopic examination was performed on these animals and selected organs and tissues were collected and weighed. A range of tissues (vagina, uterus (with cervix), ovaries, coagulating gland, mammary gland (females only), testes (preserved in Bouin's fixation), epididymides, seminal vesicles, prostate, pituitary, liver, kidneys and tissue masses/gross lesions) were examined microscopically for all high-dose and control P1 and P2 (F1) animals used for mating.
Culled pups that appeared normal received only an external examination and tissues were not saved. Culled pups that appeared abnormal were subjected to a visceral examination.
Parental effects
There were no treatment-related deaths and no clinical signs which were judged to be directly related to treatment with DINP in P1 and P2 parental animals.
During the premating period, there were several statistically significantly lower mean body weights in the high-dose males and females in the P2 parental animals compared with controls without an associated decrease of the body weight gain / food consumption. This lower mean body weights in the high-dose animals P2 during the premating period was attributed to lower body weights of the P2 animals at the start of the P2 generation (13% in males and 10% in females), rather than a treatment-related toxicological effect occurring during the P2 premating period.
228

CHAPTER 4. HUMAN HEALTH
During gestation, statistically significant lower mean food consumption in the P2 high-dose females compared with controls was recorded without an associated statistically significant decrease of the body weight change during gestation days 0-21.
During the postpartum period, parental toxicity was limited to a lower mean body weight in the high-dose P1 females (< 8%) compared with controls on post partum days 14 and 21 which corresponds to a statistically significant body weight gain suppression (84% decrease) compared with controls during the overall postpartum interval (PPD 0-21) associated with a decreased mean food consumption (9% during the overall postpartum period). Lower mean body weights (8-11%) were observed in the P2 high-dose females with an associated decrease of mean food consumption but without an associated decrease of the body weight gain compared with controls. These lower mean body weights may be due, at least in part, to the lower body weight of the P2 females at the start of the P2 generation (315 g at the high-dose level vs. 331g in the control group).
Biologically significant increases in the mean absolute and/or mean relative kidney weights were observed in the P1 and P2 males from 0.4% but no correlating histologic findings were observed. No gross post-mortem findings judged to be related to treatment were noted in the P1 parental animals. In the P2 generation, there was an increased incidence of dilated renal pelves from 0.2% in males which was mostly unilateral in the high and mid-dose male group.
Additionally, there were statistically significant increases in the mean absolute and mean relative liver weights in P1 and P2 in both sexes at 0.4% and/or 0.8%. Microscopic hepatic changes were noted from 0.2% in P1 and P2 parental animals: minimal to moderate increased cytoplasmic eosinophilia with a rarely enlargement of the affected hepatocytes.
A statistically significant decrease in the mean left ovary weight of the P1 females at 0.8% was observed but in the absence of a clear dose response, similar findings in the right ovary weights, consistent pattern of response between absolute and relative organ weights, or correlating microscopic findings, this decrease was considered incidental and unrelated to treatment. Several unconfirmed mated females were noted with red vaginal material approximately 2 weeks after overnight pairing. In high-dose males, there was a statistically significant increase of relative right and left epididymis weights in P2 generation with a concurrent but not statistically significant (by 7.5%) increase of absolute epididymis weight.
Reproductive effects
There were no statistically significant differences in male mating, male fertility, female fertility, female fecundity or female gestational indices in P1 generation. A slight decrease, not statistically significant, of male mating, male fertility, female fertility, female fecundity indices was observed in P2 generation. Mean days of gestation of the P1/P2 treated and control animals were essentially equivalent.
Offspring effects
No treatment-related clinical findings and no biologically significant differences in the F1 or F2 offspring survival indices were observed between the treated and control offspring nor gross post-mortem findings.
There were statistically significant, dose-related, lower mean offspring bodyweights in all treatment groups compared with controls during the F1 or F2 generations. However, when the litter size was taken into account (Waterman et al., 2000), effects were only significant in high-dose males on PND 0, in males and females of the mid and high-dose levels on PND 7 and 14
229

EU RISK ASSESSMENT REPORT – DINP FINAL REPORT, 2003
and in all treated animals on PND 21. In addition, the weights of all F1 and F2 treated offspring were within the historical control range of the laboratory with the exception of the F2 high-dose males and females on PND 0 and the F2 high-dose males on PND 1 (considering litter size). These findings were considered by the laboratory as the results of maternal stress and/or direct effects of DINP via exposure through lactation. Other studies with phthalates concluded that these decreases were apparently due to decreased food consumption by the dams and changes in the quality or quantity of milk (Dostal et al., 1987). Thus the laboratory concluded that the lower body weights in the pups might have resulted from decreased milk consumption.
Based on the microscopic liver changes observed from 0.2%, NOAEL for parental systemic toxicity is considered as lower than 0.2% (114 to 395 mg/kg bw/d seeing that received doses are widely dependent on the period considered). No NOAEL can be derived from this study, but a LOAEL for offspring might be considered as 0.2%, emphasizing a trend observed similarly in males and females, based on the dose dependent reduced mean body weights of the treated offspring. The LOAEL remained approximative since pups switched diet from milk to solid food between PND 14 and 21 but may be estimated 159 mg/kg/d, the lowest dose of the maternal estimated range (159 - 395 mg/kg/d) during post-partum.
No statistically significant differences were observed in reproduction indices.
LOAEL (parents, offspring) =0.2%
4.1.2.9.2 Developmental toxicity studies
(Nikiforov et al., 1994)
A range finding study was conducted to provide information for the selection of dose levels for developmental toxicity study on DINP (CAS 68515-48-0) in the rat. The test substance was administered by oral gavage to 5 groups (7 females/group) of Crl:CDBR mated female rats at doses of 0, 40, 200, 500 and 1,000 mg/kg/d on gestation day 6 through 15. Clinical observations were made daily during gestation, and body weights and food consumption were measured on gestation day 0, 6, 9, 9, 12, 15, 18 and 21. Caesarean sections and gross necropsies were performed, uterine weights with ovaries measured, uterine contents examined and uterine implantation data recorded on gestation day 21. Live foetuses were weighed, sexed, and examined externally for gross malformations.
Overt signs of maternal toxicity were not apparent at any dose level, indicated by the absence of adverse clinical, or post-mortem findings or adverse effects on body weight, food consumption, and/or uterine implantation data.
Similarly, there were no adverse effects for foetal observations or body weight at any dose level. No more information is available (an abstract is only available).
In this range-finding study, the maternal and foetal NOAELs were determined to be 1,000 mg/kg/d.
230

CHAPTER 4. HUMAN HEALTH
(Exxon Biomedical Science 1994, Waterman et al., 1999)
In a developmental toxicity study, four groups of 25 Sprague Dawley /Crl:CDBR rats were administered daily by gavage DINP (MRD 92-455, CAS 68515-48-0) at doses of 0 - 100 - 500 - 1000 mg/kg (in corn oil) on days 6-15 of gestation. The female rats were examined for viability and clinical signs throughout the study period. Body weight and food consumption were assessed on gestation day 0, 6, 9, 12, 15, 18 and 21. The dams were sacrificed at day 21 of gestation. Gross necropsies were performed, uterine weights with ovaries attached were measured, uterine contents were examined and uterine implantation data were recorded. All live foetuses were weighed, sexed externally and examined externally for gross malformations. One half of the foetuses were examined for visceral abnormalities and the remaining foetuses for skeletal abnormalities. This study was performed according to GLP procedures except that the analytical chemistry report was not provided as well as the other appendices.
Maternal effects: all dams survived, no treatment clinical signs were observed during gestation and the majority of dams were free of observable abnormalities.
Statistically significant, decreases of the body weight gain (42.6 g vs. 50 g in control group) and of the mean food consumption (178.6 g vs. 195.9 g in control group) were observed at 1,000 mg/kg/day during the treatment period (6-15 days of gestation). However, mean body weight gain of all treated group females was essentially equivalent for the overall gestation period and after correction for gravid uterine weight when compared with controls.
Developmental effects: no statistically significant differences in mean foetal body weight and no statistically significant increases in total or individual external, visceral or skeletal malformations between treated and controls were observed.
External and visceral malformations were observed in both treated and control foetuses during the study and included single or low incidences of anasarca, folded retina, filamentous tail and anal atresia. one mid-dose foetus had situs inversus viscerum totalis, unilobular lung and tetralogy of Fallot. Skeletal malformations observed throughout the groups included single or low incidences of vertebral agenesis and malformed sternebrae, ribs and/or vertebrae. These findings were considered incidental.
Dose-related increase in total foetuses with visceral (mainly dilated renal pelves) variations on a per foetus (7/190, 8/198, 9/178 at doses of 100- 500 - 1,000 mg/kg 1/194) as on a per litter basis (3/25, 4/24, 6/23 at doses of 0 - 100 - 500 - 1,000 mg/kg vs. 0/23 in controls). However, variations were only significantly increased at the high-dose level on a per litter basis (6/23 vs. 0/24 in controls. Skeletal variations, mainly rudimentary lumbar and cervical ribs showed a dose-response trend on a per litter as on per fœtus basis (32/191, 28/186, 55/194, 76/174 on a per foetus basis and 15/24, 16/25, 22/24, 20/23 on a per litter basis at doses of 0 - 100 - 500 -1000 mg/kg, respectively). A statistically significant difference from controls on a per litter basis was observed only at 1,000 mg/hg/d (22/24 vs. 15/24 in controls). When considered individually, only rudimentary lumbar ribs were statistically significantly different from controls on a per litter basis at the high dose of 1,000 mg/kg (18/23 vs. 6/24 in controls).
According to the laboratory, the incidences of rudimentary cervical and lumbar ribs at 1,000 mg/kg/d on a per foetus and per litter basis were not within the historical control ranges of this laboratory: percentages of rudimentary cervical and lumbar ribs on a per litter basis were, respectively 30% (historical control ranges: 4.35-16.67%) and 75% (historical control ranges: 29.17-61.90%), but it was considered by the laboratory that rudimentary ribs were probably related to transient maternal toxicity.
231

EU RISK ASSESSMENT REPORT – DINP FINAL REPORT, 2003
Administration of DINP (MRD 92-455, CAS No 68515-48-0) to the dams resulted in a statistically significant increases in foetuses with skeletal lumbar rudimentary ribs and with visceral (dilated renal pelves) variations at 1,000 mg/kg/d on a per litter basis, which remains the preferred unit of analysis for developmental toxicity studies (Waterman et al., 1999). Rudimentary ribs are common findings in rat foetuses and dilated pelves have been regarded as “normal” delay of renal development unlike hydronephrosis considered as renal malformation (Hayes et al., 1994). However, based on the clear dose-response profile, together with the fact that incidence of dilated pelves was zero in controls, a NOAEL of 500 mg/kg/d can be assumed for developmental toxicity. The NOAEL for the dams is 500 mg/kg/d. This is the most conservative value, since DINP produced transient signs of maternal toxicity at 1,000 mg/kg, as indicated by slight reductions in body weight gain and food consumption. However, normal weight and food consumption patterns were observed during the late gestation period, after exposure ceased, possibly indicating a recovery effect.
Rat prenatal screening toxicity study
In another rat prenatal screening toxicity study, carried out according to GLP procedures, three related forms of DINP (DINP1, DINP2 and DINP3) were investigated:
• DINP1 (CAS 68515-48-0) was of commercial origin. The alcohol moiety mainly consisted of roughly equivalent amounts of 3,4-,4,6-,3,6-,3,5-,4,5- and 5,6-dimethyl heptanol -1;
• DINP2 (CAS 28553-12-0) was produced by BASF with a purity of 99.8%. At least 95% of the main alcohol components was derived from n-butene (alkyl-substituted octanol or heptanol);
• DINP3 (CAS 28553-12-0) was also produced by BASF and synthesised from codimerbutene (n-; isobutene) resulting in at least 60% alkyl-substituted hexanols.
In this study, eight to ten pregnant Wistar rats (Chbb/THOM) were administered daily by gavage at doses of 0 - 40 - 200 - 1,000 mg/kg/d (in olive oil DAB 9/10) on days 6-15 post-coitum. Body weights were recorded on gestation day 0, 6, 10, 15 and 20. The dams were sacrificed at day 20 post-coitum and subjected to gross pathology. The uterus and ovaries were removed and the following data were recorded: weight of uterus, number of corpora lutea, number of implantations, pre/post implantation loss, live foetuses, early/late resorptions. Clinical signs/ symptoms were checked at least daily. Body weights were recorded on days 0, 1, 3, 6, 8, 10, 13, 15, 17 and 20 p.c. and corrected body weight gain was calculated. With the exception of day 0, food consumption was determined on the same days as was body weight. Conception rates, maternal relative liver and kidney weights were recorded. The foetuses were dissected from the uterus, weighed and investigated for external findings. One half of the foetuses were examined for soft tissue abnormalities and the remaining foetuses for skeletal abnormalities.
DINP CAS 68515-48-0 (DINP1) results: during the treatment period the dams at 1,000 mg/kg/d consumed less food (but no quantitative data are available, BASF 1995a; Hellwig et al., 1997b) without concurrent statistically significant decrease of the body weight (decrease around 3-4% compared to the control group). One animal at 1,000 mg/kg/d had vaginal haemorrhage and urine-smeared fur. At autopsy a statistically significant increase in relative kidney weights was recorded at 1,000 mg/kg/d; the relative liver weights were slightly, but not statistically significantly, increased. Absolute liver and kidney weights data were not reported.
232

CHAPTER 4. HUMAN HEALTH
The only foetal effects were an increased occurrence of foetal skeletal variations consisting mainly of rudimentary cervical (in 11 foetuses vs. 0 in the control group) and/or accessory 14th ribs (in 37 foetuses vs. 0 in the control group). No treatment-related effects occurred at 40 and 200 mg/kg/d.
Administration of DINP (CAS 68515-48-0, DINP1) resulted in an increased occurrence of foetal skeletal variations at 1,000 mg/kg/d consisting mainly of rudimentary cervical and/or accessory 14th ribs. It can be assumed that the NOAEL for the concept uses is 200 mg/kg/d and the NOAEL for the dams is considered 200 mg/kg/d, based on slight decrease of food consumption and a slight increase of relative kidney weights.
DINP CAS 28553-12-0 (Palatinol N, DINP2) results: the test substance was administered to 9 to 10 pregnant Wistar rats (laboratory report available, GLP study, BASF 1995b; Hellwig et al., 1997b). No significant decrease of food consumption, of the body weight, and of the corrected body weight gain was observed. One dam showed vaginal haemorrhage (gestation days 14 and 15) which might be substance-induced. Absolute and relative liver and kidney weights were not affected by the test substance.
There were no substance-related and /or statistically significant differences of biological relevance between the groups in conception rate, in the mean number of corpora lutea and implantation sites, in pre and post-implantation losses or in the number of resorptions, viable foetuses/dam. The mean foetal weights, placental weights and sex ratio were not influenced by the treatment.
The only substance-related foetal effect was a statistically significantly increased incidence of a skeletal variation namely accessory 14th rib(s): 5/10 vs. 0/10 in controls on a per litter basis at 1,000 mg/kg/d. The respective values are distinctly above the historical control values. Multiple malformations were seen in one foetus among 67 foetuses examined at 1,000 mg/kg/d, namely globular-shaped heart, unilobular lung, hydrocephaly, dilation of the aortic arch and anasarca. At 200 mg/kg/d, one foetus transposition of great vessels was observed in one foetus among 65 foetuses examined.
Administration of DINP (CAS 28553-12-0, DINP2) resulted in a slight increased incidence of a skeletal variation (accessory 14th rib(s)). It can be assumed that the NOAEL for the concept uses is 200 mg/kg/d and the NOAEL for the dams is 200 mg/kg/d.
DINP CAS 28553-12-0 (Palatinol DN, DINP3) results: results for DINP3 are reported here to show the difference among the others, but it is not included in the risk characterisation report, because not any more manufactured since 1995 (cf. Explanatory note).
The test substance was administered to 9 to 10 pregnant Wistar rats (laboratory report available, GLP study, BASF 1995a; Hellwig et al., 1997b). No mortalities were reported. The only clinical findings which occurred were vaginal haemorrhage at 40 mg/kg/d (2 dams), at 200 mg/kg/d (3 dams) and at 1,000 mg/kg/d (1 dam). However, there was no dose-response relationship and gestational parameters (like number of implantations, resorptions, and live foetuses/dam and post-implantation loss values) were not affected. At 1,000 mg/kg/d, food consumption of the dams was significantly reduced at days 8-13 p.c. Mean body weights were statistically significantly lower at days 13-15-17 p.c. at 1,000 mg/kg/d. At the end of the study, the animals weighed about 6% less than the concurrent control group and body weight gain was reduced (about 38% less than control weight). Relative liver weights were statistically significantly increased at this high dose without an associated increase of the absolute weight. Slight increase,
233

EU RISK ASSESSMENT REPORT – DINP FINAL REPORT, 2003
not statistically significant, of the relative kidney weight was observed from 40 mg/kg/d without an associated increase of the absolute weight.
There were no substance-related and/or statistically significant differences between the groups in conception rate, in the mean number of corpora lutea and implantation sites, in pre and post-implantation losses or in the number of resorptions, viable foetuses/dam. The mean foetal weights, placental weights and sex ratio were not influenced by the treatment.
Soft tissue malformations were exclusively found at 1,000 mg/kg/d; in total 5 out of 57 foetuses from 3 out of 9 litters (with a mean percentage of affected foetuses/litter of 10.2) showed malformations of the heart (dilatation of right ventricle, both ventricles: globular shaped heart), the urinary tract (agenesia of kidney(s) and ureter(s); uni- or bilateral) and the testes (abnormal position). While the described dilatation of the heart ventricles appears also sometimes in control foetuses (historical control data: globular shaped heart (0.1% foetuses affected with a range per study of 1.2%) and dilatation of right ventricle (0.02% foetuses affected with a range of 0.8%), the malformations of the urogenital system mentioned above are not within the historical control data base. Even if the rate of malformed foetuses is not increased with statistical significance, a substance-relationship concerning the soft tissue malformations, especially the ones of the urogenital tract cannot be ruled out.
Soft tissue variations (i.e. dilated renal pelvis and hydroureter) were observed most frequently at 1,000 mg/kg/d. Dilated renal pelvis were observed in 20 foetuses out of 57 foetuses from 9 out of 9 litters versus 12 foetuses out of 65 foetuses from 7 out of 9 litters in the control group and incidence of hydroureter was significantly increased at the high-dose level on a per litter basis (89% vs. 33% in controls); foetal and litter incidences are in the range of the historical control and thus not assessed by the laboratory as being associated with the treatment. A substance-relation ship, however, cannot be ruled out for hydroureter. This variation was observed in 12 foetuses out of 57 foetuses from 8 out of 9 litters versus 4 foetuses out of 65 foetuses from 3 out of 9 litters in the control group and appears at a frequency which is clearly outside the historical control range.
Some skeletal malformations (predominantly affecting the long bones) might be assumed to be substance related. No treatment-related effects occurred at 40 or 200 mg/kg/d either in the dams or the foetuses. The malformation rates in these two groups were in the same range as for sham-treated controls.
Developmental toxicity was present in the form of increased rates, of certain skeletal retardation (unossified or incompletely ossified sternebrae) and skeletal (rudimentary cervical and/or accessory 14th ribs) variations. The statistically significant increased occurrence of 1,000 mg/kg/d foetuses with rudimentary cervical (78% vs. 0 in controls on a per litter basis) and/or accessory 14th ribs (89% vs. 0 in controls on a per litter basis) has to be related to the test substance administration to the dams. The respective values are far above the actual and historical control values. Consequently the total number of foetuses with skeletal variations is clearly increased.
Similar studies were conducted on DEHP and reported in DEHP risk assessment. One of them was conducted by the same laboratory (BASF 1995; Hellwig et al., 1997a) and reported at 1,000 mg/kg/d: "a significant lower number of live foetuses/dam as well as a drastically increase rate of malformed fetus/litter". In Tyl et al. (1988), no malformed fetus was reported but the number of live fetus/litter was significantly decreased at 2%. This dose in mg/kg/d is not indicated but probably widely above 1,000 mg/kg/d.
234

CHAPTER 4. HUMAN HEALTH
(Hazleton, 1981b)
In a developmental toxicity study, four groups of 25 Sprague Dawley CD albino female rats were administered daily by gavage DINP (CAS not provided) at doses of 0 - 10 - 500 -1,000 mg/kg (in corn oil) on days 6-15 of gestation. The female rats were examined twice daily for mortality and daily on day 0 and days 6 through 20 of gestation for clinical signs. Body weight was assessed on gestation day 0, 6, 11, 15 and 20. A gross inspection of food consumption for inappetance was made daily. The dams were sacrificed at day 20 of gestation. The dams were examined for visceral gross pathology, the uteri and ovaries were examined. Number of corpora lutea per ovary, uterine implantation data, early and late resorptions, live and dead foetuses and any gross abnormalities were recorded. Foetuses were examined externally, weighed, and crown-rump distances were recorded. One third of the foetuses were examined for visceral abnormalities and the remaining foetuses for skeletal abnormalities. This study was performed according to GLP procedures.
Maternal effects: all dams survived. Inappetance was not observed during the study. No compound-related effects were observed with respect to maternal body weights, clinical signs, pregnancy rates, mean number of corpora lutea, implantation efficiencies, gross pathology or uterine weights changes were observed during gestation and the majority of dams were free of observable abnormalities.
Developmental effects: no treatment-related effects on mean foetal body weight and no visceral or skeletal malformations were observed. A slightly higher incidence of resorptions (10.2% at 1,000 mg/kg/d vs. 4.8% in the control group) and slightly lower foetal viability were noted at 1,000 mg/kg/d when compared to the control group, although no statistical significance was noted.
The incidence of visceral variations (dilated ureters and/or kidneys) was generally higher in the treated groups but this incidence was not statistically significant and did not appear to be compound-related.
In this developmental toxicity study, the maternal and foetal NOAELs were considered to be 1,000 mg/kg/d.
235

EU RISK ASSESSMENT REPORT – DINP FINAL REPORT, 2003
4.1.2.9.3 Summary of developmental studies
Table 4.4 Summary of developmental studies 9
Species Protocol/ doses Results NOAEL/LOAEL
Test substance References
One-generation studies
Rat Crl: CDBR
0.5-1-1.5% LOAEL Parents, offspring 0.5%
CAS 68515-48-0 MRD 92-455
Exxon Biomedical Sciences (1996i)
Two-generation studies (oral)
Rat Crl: CDBR
diet 0-0.2-0.4-0.8%
LOAEL parents, offspring 0.2% (159 mg/kg/d)
CAS 68515-48-0 MRD 92-455
Exxon Biomedical Sciences (1996j) Nikiforov et al. (1995)
Developmental toxicity studies
Rat Sprague Dawley
gavage 0-100-500-1,000 mg/kg/d
NOAEL (F, dams) 500 mg/kg/d
CAS 68515-48-0 MRD 92-455
Exxon Biomedical Sciences (1994)
Rat Crl: CDBR
range finding study by gavage 0-40-200-500-1,000 mg/kg/d
NOAEL (F, dams) 1,000 mg/kg/d
CAS 68515-48-0 Nikiforov and Koehler (1994)
Rat Wistar
screening study 0-40-200-1,000 mg/kg/d
NOAEL (F, dams) 200 mg/kg/d
DINP1 CAS 68515-48-0
Hellwig et al. (1997b)
Rat Wistar
screening study 0-40-200-1,000 mg/kg/d
NOAEL (F, dams) 200 mg/kg/d
CAS 28553-12-0 DINP 2, Palatinol N (91/26), purity: 99.8%
BASF (1995b) Hellwig et al. (1997b)
Rat Wistar
screening study 0-40-200-1,000 mg/kg/d
NOAEL (F, dams) 200 mg/kg/d
CAS 28553-12-0 DINP 3, Palatinol DN (92/64) purity: >99.9%
BASF (1995a) Hellwig et al. (1997b)
Rat Sprague Dawley
gavage 0-10-500-1,000 mg/kg/d
NOAEL (F, dams) 1,000 mg/kg/d
DINP Hazleton (1981)
F: fœtus
Prenatal toxicity of C7-9-11 alcohol and of isononanol type 1 and type 2 was assessed in a screening study as described by Hellwig and Jäckh (1997a).
• isononanol type 1 (CAS 68515-81-1) was of commercial origin and mainly consisted of roughly equivalent amounts 3,4-, 4,6-, 3,6-, 3,5-, 4,5- and 5,6-dimethylheptanol-1.
• isononanol type-2 (CAS 68515-81-1) was produced at BASF and mainly consisted of 4, 5-dimethyl-heptanol-1 (about 23%), 4-methyloctanol-1 (29%), 3-ethylheptanol-1 (3%), 6-methyloctanol-1 (15%) and 3-ethyl-4-methylhexanol-1 (1%).
• C7-9-11 alcohol was obtained from BASF, mainly consists of linear alcohols; α-methyl branching is the predominant branching type.
Equimolar dose levels (0, 1, 5 and 10 mmol/kg) were administered by gavage from gestation day 6 to 15 to 10 animals per group. 10 mmol/kg corresponds to 1,440 mg/kg/d for C7-9-11 alcohol and isononanol-2 and to 1,300 mg/kg/d for isononanol-1.
236

CHAPTER 4. HUMAN HEALTH
Both isononanols were also investigated in a supplementary experiment at 7.5 mmol/kg/d. Two control groups (distilled water/ distilled water with approximately 0.005% Cremophor EL) were employed.
C7-9-11 alcohol showed no maternal or developmental adverse effects at any dose levels.
Isononanol-1: because of intercurrent death of all dams at 10 mmol/kg, no foetal observations could be obtained.
At 5 mmol/kg maternal symptoms (reduced body weight gain during treatment, apathy, nasal discharge) were visible; foetal weights were numerically (3.60 gr. at 5 mmol/kg vs. 3.90-3.80 gr. in the control groups), but not statistically significantly reduced, and an increased number of skeletal retardations: unossified or incompletely ossified sternebrae (in 34 foetuses among 9 litters vs. 3(3) and 8(4) in the control groups and in 26 foetuses among 7 litters vs. 14(6) and 12(6) in the control groups, respectively) and of soft tissue variations: hydroureter (in 8 foetuses among 5 litters vs. 0 and 3(3) in the control groups) were noted.
At 1 mmol/kg, hydroureters were observed in 8 foetuses among 4 litters 0 and 3(3) in the control groups. The toxicological significance of the increase in hydroureters as an indication of marginal developmental toxicity at 1.0 mmol/kg was considered as debatable by the authors.
At 7.5 mmol/kg, in the supplementary study, severe maternal symptoms and decrease, statistically significant, of the body weights of the dams were noted. An increased number of resorptions (increased postimplantation losses 41.9% vs. 7.2 and 5.8 in the control groups), a decreased foetal weights (3.0 gr. vs. 3.8-3.8 gr. in the control groups) were observed and a statistically significant increase of the incidence of malformations (mainly related to the heart in 5 foetuses among 4 litters vs. 0 in the control groups) and skeletal retardations.
Isononanol-2: isononanol-2 was less toxic to the dams. At 10 mmol/kg, seven of 10 animals survived and in the six litters obtained a low frequency of malformations was found (one anedeous foetus and one foetus with meningocele); the number and percentage of foetuses with skeletal retardations also increased (40 foetuses among 6 litters vs. 30 (10) and 29 (7) in the control groups).
At 5 mmol/kg, slight maternal symptoms and slight decrease of the body weight gain were noted associated with a slight increased resorption rates (increased post-implantation losses 12% vs. 3.5 and 5.1 in the control groups) and a slight increased frequency of foetuses with hydroureter (5 foetuses among 3 litters at 10 mmol/kg, 5 (4) at 5mmol/kg, 3 (3) at 1 mmol/kg and, 0 and 3 (3) in the control groups).
At 7.5 mmol/kg, in the supplementary study, clear signs of maternal toxicity were observed associated with higher post-implantation losses (17.2% vs. 7.2% and 5.8% in the control groups) and an elevated number of foetuses with malformations (mainly concerning the thoracic vertebrae).
C7-9-11 alcohol: it showed no adverse effects at any dose levels. Isononanols type 1-2 exhibited a marked degree of maternal and foetal toxicity at 7.5 and 10 mmol/kg and slight foetal effects at 5 mmol/kg. Because of maternal toxicity in the top dose, a statistically significant increase in malformations was obtained only in the dose window of 7.5 mmol/kg, in the supplementary experiment. The authors recommended that the potential for developmental toxicity of primary aliphatic alcohols between 7 and 11 carbon atoms per molecule must be investigated case by case for each individual structure.
237

EU RISK ASSESSMENT REPORT – DINP FINAL REPORT, 2003
4.1.2.9.4 Summary of toxicity for reproduction
Fertility assessment may be inferred from effects on reproductive organs and the two-generation study.
In adult rats, some minor effects were observed not histologically confirmed in any of the studies mentioned: in the one-generation study, a statistically significant increase in the mean absolute and relative right testis, left testis and right epididymis weights and the mean relative left epididymis and seminal vesicle weights in the high-dose males were observed; in a few sub-acute and/or subchronic studies, slight increases (statistically significant) of relative testes weights were also noted at high doses. Taken as a whole, no overt toxicity was observed on reproductive organs in rats.
In mice, very high dose (5,770 mg/kg/d) leads to decrease in testicular weight with abnormal/immature sperm forms and uterus/ovaries atrophy in the 13-week study. In the 104-week chronic study, a NOAEL of 1,500 ppm (276 mg/kg/d) can be assumed for testicular effects, based on decrease in testicular weight (relative and absolute) observed from 742 mg/kg/d. The NOAEL for systemic toxicity in male is 1,500 ppm as well.
In the two-generation study no changes in reproductive indices are observed.
From those assays, no adverse effects on fertility may be anticipated.
In regard with offspring survival in rats, at 1.5% (corresponding to a range of 966-2,246 mg/kg/d), a decrease of life birth and survival indices was observed in the one-generation range-finding study but not observed in the two-generation study, conducted up to 0.8%. For decrease in life birth and survival indices a NOAEL of 622 mg/kg/d (the lowest dose of the estimated range) is determined and is taken into account in the risk characterisation.
In the developmental studies, visceral (dilated renal pelvis and hydroureter) and skeletal (rudimentary cervical and accessory 14th ribs) variations were significantly increased at 1,000 mg/kg/d this lead to a NOAEL of 500 mg/kg/d. Slight (1,000 mg/kg/d) or no (500 mg/kg/d) maternal toxicity was observed in those studies.
A decrease of mean offspring body weight was observed following parental administration of DINP in the one and two-generation studies from the lowest dose tested (0.2% in the two-generation study), leading to a estimated LOAEL of 159 mg/kg/d, the lowest value of the maternal dose range during post-partum. In the two-generation study parental toxicity was limited to lower mean body weight and hepatic changes from 0.2% (eosinophilia and rarely enlargement of the hepatocytes), thus a LOAEL of 114 mg/kg/d (the lowest level of the 0.2% dose) may be derived.
The NOAEL and LOAEL quoted above will be considered in risk characterisation for developmental effects.
Regarding fertility and development, the effects observed in the available studies, do not justify classification according to the EU classification criteria.
238

CHAPTER 4. HUMAN HEALTH
4.1.2.10 Additional studies
4.1.2.10.1 Examination of the in vitro and in vivo estrogenic activities
In vitro
A series of phthalate esters, including DINP and DIDP provided by Exxon, at a 99.9% purity, were screened for estrogenic activity using a recombinant yeast screen (Harris et al., 1997). 4-Nonylphenol, bisphenol A, o,p-DDT and genistein was used in order to demonstrate the activity and potency of some known xenooestrogens. In the recombinant yeast screen a gene for a human estrogen receptor has been integrated into the main yeast genome and was expressed in a form capable of binding to estrogen response elements and controlling the expression of the reporter gene lac-Z (when receptor is activated, the lac-Z is expressed).
These chemicals were tested at concentration ranging from 10-3 M to 5.10-7 M compared to 17β-estradiol. Of the six major volume used phthalates, three possessed a very weak estrogenic activity (BBP, DBP and DIBP), two did not (DEHP and DIDP) and one (DINP) behaved unreproducibly in the yeast screen.
A selection of these, including DINP and DIDP, was also tested for their ability to stimulate proliferation of human breast cancer cells (MCF-7 and ZR-75 cells). The results were mostly comparable to those obtained from the yeast screen. However, in the ZR-75 cells, DINP at concentration of 10-5, 10-6and 10-7 M induced proliferation to a significantly greater extent than the control, which is in contrast to the findings for this chemical using the yeast screen. All other results were consistent with those obtained using the yeast assay, DEHP and DIDP showed relatively little activity. It should be noted that those in vitro assays have investigated one mechanism of action only that is the ability of phthalates to act as estrogen agonists.
DINP was also tested in vitro by Zacharewski et al. (1998) in the following tests:
• Estrogen Receptor (ER) competitive ligand binding; DINP was tested at concentrations ranging from 1 to 1,000 µM in order to compete with tritiated E2 to the SD immature rat uterine ER.
• Mammalian and yeast-based gene expression assay; MCF-7 human breast cancer ER positive cells and stably transfected HeLa cells were exposed to 0.1-1 and 10 µM of DINP and incubated for 24-hours.
• ER mediated growth of yeast assay; PL3 Saccharomyces cervisiae was incubated with 10 µM of DINP at 30° C and photographed every 24-hours in order to monitoring growth.
In each test positive control (E2) and negative controls (DMSO, DMSO and uracil, respectively) were used.
For these three in vitro tests, no significant responses were observed with DINP.
239

EU RISK ASSESSMENT REPORT – DINP FINAL REPORT, 2003
In vivo
Uterotrophic assay/vaginal cell cornification assay
20, 200, 2,000 mg/kg/d of the three phthalate esters were administered by oral gavage once daily for a period of 4 days to ovariectomised Sprague-Dawley rats (10 females per dose, two experiments) (Zacharewski et al., 1998). Ethynyl Estradiol (EE) was used as a positive control. Body weight, uterine wet weight and percentage of vaginal epithelial cell cornification on each day were assessed. Statistically significant decreases in body weight were observed following treatment with DEHP, however these effects were not dose-dependant. In contrast statistically significant increases in body weight were observed with DIDP and DINP in experiment one only.
None of the phthalate esters tested had a reproducible, dose-dependant effect on uterine wet weight relative to vehicle control at any of the dose tested as indicated in the Table 4.50. Because of the variability of the responses, the value of this test questionable, but in any case, the test is considered negative. None of the phthalate esters tested significantly induced a vaginal cornification response at any of the dose tested.
Table 4.50 Effects of phthalate esters on uterine weight in ovariectomised Sprague-Dawley rats
Uterine Wet Wt (mg) mean ± SD
Uterine Wet Wt (mg/100 g b.w.) mean ± SD
Treatment Dose a) mg/kg
Exp. 1 Exp. 2 Exp. 1 Exp. 2
Sesame EE DEHP
0 1 20 200
2,000
13 ± 1 88 ± 15 **
15 ± 2 15 ± 2 20 ± 10
24 ± 6 105± 17 **
22 ± 5 17 ± 4 * 16 ± 4 **
12 ± 1 85 ± 13 14 ± 2 14 ± 2
19 ± 10 *
19 ± 5 92 ± 14 **
18 ± 4 14 ± 3 * 13 ± 7 **
Sesame EE DINP
0 1 (8) b)
20 200 (9) b)
2,000
13 ± 1 88 ± 15 **
16 ± 3 14 ± 3 13 ± 2
51 ± 55 114± 20 **
29 ± 5 33 ± 5
20 ± 3 **
12 ± 1 85 ± 13 14 ± 2 11 ± 2
11 ± 2 *
40 ± 46 98 ± 16 **
22 ± 4 24 ± 7
15 ± 2 **
Sesame EE DIDP
0 (9) b)
1 (9) b)
20 200
2,000
15 ± 3 73 ± 18 **
14 ± 2 16 ± 2 14 ± 2
21 ± 7 114± 11 **
23 ± 3 28 ± 10 18 ± 4
14 ± 3 73 ± 17 **
12 ± 2 13 ± 1
11 ± 1 *
14 ± 5 87 ± 11 16 ± 2 18 ± 6 12 ± 2
a) Ten animals were used per treatment group. However, note that during the course of the experiment some animals died and therefore were not included in the calculation of the mean and standard deviation.
b) Data from animals used in experiment 2 found to possess ovarian stubs were not included in the data set. The number in the brackets indicates the number of animals used to determine the mean ± standard deviation.
* statistically significant difference from control at p < 0.05 ** statistically significant difference from control at p < 0.01
Examination of the anti-/androgenic activities
In many recent studies (Earl Gray et al., 1999; Mylchreest et al., 1999; Ema et al., 2000) developmental toxicity focused on reproductive system of males was assessed with phthalates especially DBP and DEHP during late gestation in rats. This is considered to be a critical period for the induction of a broad range of effects on male genital tract that are assessed through
240

CHAPTER 4. HUMAN HEALTH
developmental landmarks for anti-androgenic effects (anogenital distance nipple retention/areolas, preputial separation). It has been currently demonstrated with DBP and DEHP. However the endocrine disrupter pattern is generally observed at quite high doses and along with irreversible effects which in case of DEHP have been readily assessed in the two-generation study (BASF, 1999b). In contrast, in the DINP two-generation studies, reproductive organs from the 2nd generation parent male (P2) were examined and no testicular damages were observed.
Recently a study on late gestational period was conducted with several phthalates among which DINP, DEHP, BBP and DBP: timed-pregnant rats were gavaged daily with DEHP, BBP, DINP, DEP, DMP and DOTP at single dose of 750 mg/kg/d in corn oil as vehicle from gravid day 14 through postnatal day 3. Males in the DEHP and BBP groups displayed a reduced anogenital distancy at day 2 of age and males with areolas were observed in the DEHP, BBP and DINP dose groups at day 13 of age but without details on the incidence of affected male pups in treated and control animals. Adult males exposed perinatally to DEP, DMP and DOTP were unaffected while males in the DEHP, (91%, p< 0.0001), BBP (84%, p< 0.0001) and DINP (7.7%, p<0.04) treatment groups had malformations of testis, epididymis, accessory reproductive organs and external genitalia (Earl Gray et al., 2000).
It is agreed that DINP has been shown to be less toxic than DEHP and DBP with respect to reprotoxicity findings (evidence of endocrine disruption effects and male sexual tract as specific targets for DEHP and DBP) and that risk assessment decisions could be made on the existing database. It should be noted that in a recent monograph, NTP reviewing the reprotoxicity of phthalates proposed further tests for DINP among which "a perinatal developmental study, in orally exposed rats, that adresses landmarks of sexual maturation such as nipple retention, anogenital distance, age at testes descent, age at prepuce separation and structure of the developing reprodutive system in pubertal or adult animals exposed through development" (NTP-CERHR, 2000). Therefore it is suggested that if NTP goes ahead with their proposal, the results of such study should be reviewed to consider whether there are any bases to revisit and update the Risk Assessment report of DINP.
In summary, in vitro, neither DEHP, DINP and DIDP show no activity in the different assays conducted to test the ability of binding to rodent or human estrogen receptors or to induce estrogen receptors-mediated gene expression. In contrast with other phthalates, DINP showed the ability to stimulate cell proliferation in one in vitro assay. In vivo response obtained with uterine wet weight is considered negative. Results of vaginal epithelial cell cornification assay also exhibit an absence of estrogen receptors-mediated estrogenic activity.
Vaginal haemorrhages observed in some reprotoxicity studies (developmental studies) might be indicative of a perturbation of the endocrine homeostasis.
Investigation on possible mechanisms of endocrine disruption for androgenic function are currently ongoing by investigating in vitro androgen-receptor binding for a number of phthalates and an adipate including DBP, DEHP, DIDP, DINP, DEHA and DNOP.
In addition, a recent study investigating the effects of several phthalates on neonatal rats indicated that DINP might have anti-androgenic potency (Earl Gray et al., 2000).
Recently, NTP reviewing the reprotoxicity of phthalates proposed further tests among which a perinatal developmental study that adresses landmarks of sexual maturation (NTP/CERHR, 2000). Therefore it is suggested that if NTP goes ahead with their proposal, the results of such study should be reviewed to consider whether there are any bases to revisit and update the Risk Assessment report of DINP.
241

EU RISK ASSESSMENT REPORT – DINP FINAL REPORT, 2003
4.1.3 Risk characterisation
4.1.3.1 General aspects
Only few significant human data are available so the assessment of the hazardous properties of DINP is based mainly on animal data.
Investigations on toxicokinetic and metabolism behaviour in rats are available by oral and dermal route: DINP is significantly absorbed from the gastrointestinal tract (at least 50%), and dermal absorption is very limited (<4% in 7 days) and still lower in humans based on in in vitro or in vivo skin penetration studies with various phthalates like DEHP and DIDP. By inhalation, biavailability may be estimated 75% by analogy with DIDP.
Following absorption, DINP is not accumulated in tissues and rapidly eliminated. In urine only metabolites are recovered and no radioactivity is associated with the parent compound. The data on end products indicate a cleavage to the monoester and an alcohol moiety. The oxidative monoester derivative and phthalic acid are also detected.
DINP has a low oral, dermal and inhalation toxicity.
There were only very slight signs of irritation on skin and eye in animal studies. There was no sign of respiratory irritation during acute inhalation studies.
In one test conducted according to Buehler a weak positive response was reported after re-challenge whereas another Buehler test (one challenge) gives negative results. No positive reactions were reported in a RIPT conducted in humans. The Sqwish Ball producer reported a few cases of dermatitis related to misuse of this material, but none of these cases was related directly to DINP. Moreover sensitising properties have not been demonstrated with any of the other phthalates and particularly with DEHP and DBP. Therefore a low sensitising potential can be anticipated.
The target organ for chronic toxicity appears to be the liver, the NOAEL of 88 mg/kg/d is derived from a two-year well-conducted study in rats (Aristech, 1994), based on liver toxicity at higher doses consisting of biochemical paramater changes (increased ALT, AST), liver weight changes (increase of absolute and relative liver weights) concurrenlty with histopathological findings. It should be mentioned that in monkeys, following oral administation of DINP for 13 weeks (Huntingdon Life Sciences, 1998), no changes in liver weights, in histologic examination or in biochemical paramaters were reported up to 2,500 mg/kg/d.
The kidney was also reported to be a target organ. In repeated dose toxicity studies, besides kidney weight changes, progressive nephropathy was observed in rats, mice and dogs. Whereas nephropathy findings were reported at high doses in mice (1,900 or 5,700 mg/kg/d) or in dogs (2,000 mg/kg/d), nephropathy findings were obtained at quite low doses in rats (about 300 mg/kg/d) and data provided the evidence of a male specificity. Indeed, histological findings in male rats seem to be related to male rat specific nephropathy namely α2u-globulin, with little relevance to humans.
For chronic effects on kidneys the lowest NOAEL of 88 mg/kg/d can be derived from a well-conducted 2-year toxicity study in rats (Aristech Chemical Corporation, 1994) based on kidney weight changes in both sexes (increase of absolute/relative kidney weights).
242

CHAPTER 4. HUMAN HEALTH
No study involving repeated inhalation route has been conducted. A dermal 6-week repeated dose study in rabbit does not reveal any systemic toxicity.
There is no evidence of genotoxic potential of DINP. The positive result obtained in cell transformation test in BALB/3T3 cell line is consistent with those of well-known peroxisome proliferators.
Concerning carcinogenicity in rat studies, incidence of mononuclear cell leukemia, only in Fischer rats, was clearly increased with a shortening of their onsets (Aristech Chemical Corporation, 1994). However, MNCL is a common neoplasm in the Fischer 344 rats and the increased incidence after chronic exposure to some substances is likely a strain specific effect with little relevance for humans. Of interest, the IARC categorised MNCL as “an unclassified leukemia with no known human counterpart” and substances which increase MNCL frequency as “not classifiable as to carcinogenicity in humans”.
DINP was found to induce significant excess of liver neoplasia in rat and mouse, after oral administration: in rats (Fischer 344 strain) in the 2-year studies (Aristech Chemical Corporation, 1994; Exxon Biomedical Sciences, 1986), and in mice, in the 2-year study (Aristech Chemical Corporation, 1995c).
On the basis of the information currently available, DINP is not mutagenic, thus there is no concern for carcinogenicity caused by a genotoxic mechanism. It can be assumed that hepatocellular tumours are related to a peroxisome proliferator mechanism and there is evidence of a threshold for this mechanism of action. A species difference in response to peroxisome proliferators could be foreseen. The current literature suggests that only rats and mice are responsive to the carcinogenic effects of peroxisome proliferator, while dogs, non-human primates and humans are essentially non-responsive or refractory. In this way, it should be noted that in monkey, following oral administation of DINP for 14 days or 13 weeks there was no evidence of peroxisome proliferation. This indicates that monkeys and subsequently probably humans are far less sensitive than rodents to peroxisome proliferation and its relative liver effects. It should be noted that recently IARC gave a ruling on the carcinogenicity of DEHP and concluded that the mechanism (peroxisome proliferation and PPARα activation) by which DEHP increased the incidence of liver tumours in rodents was not relevant to humans.
With respect to reprotoxicity, a decrease in live birth and survival indices is noted at a high-dose range level (966-2,246 mg/kg) in a one-generation study in rats (Exxon Biomedical Sciences 1996i), leading to a NOAEL of 622 mg/kg/d (the lowest value of the dose range). This finding was observed concurrently with parental systemic toxicity.
Concerning effects on reproductive organs in rats, there is no indication of effects evidenced by histological observation in the repeated dose toxicity studies and the two-generation study. No testicular atrophy in adult rats was observed, whereas DEHP induced clear testicular atrophy in comparable studies (Bouin's or Formalin fixation). There was only a slight increase of testis weight observed in different studies at quite high doses: increase of relative and absolute testis weight at 1.5% in the one generation study (Exxon Biomedical Sciences, 1996i), at 0.6% in the 2-year study (Exxon Biomedical Sciences, 1986), and slight significant increases of relative testis weight in a few sub-acute and/or sub-chronic studies. Taken as a whole, no overt toxicity was observed on reproductive organs in rats.
In mice, in the 104-week chronic study (Aristech Chemical Corporation, 1995c), a NOAEL of 276 mg/kg/d can be assumed, based on minor testicular effects observed from 742 mg/kg/d: decrease in testicular weight (absolute and relative to brain) without histological changes.
243

EU RISK ASSESSMENT REPORT – DINP FINAL REPORT, 2003
Concerning fertility in the one and two-generation studies in rats, fertility parameters are not affected by DINP treatment.
For developmental effects, in two comparable developmental rat studies conducted at different range of doses, skeletal variations (rudimentary lumbar or cervical ribs) were observed at 1,000 mg/kg/d, concurrently slight signs of maternal toxicity were reported, this allows to set up a NOAEL of 500 mg/kg/d for dams and foetus toxicity. In contrast, at the same high-dose level, DEHP induced malformations in rats.
Interestingly, in a developmental mouse study with DEHP, malformations are observed at lower doses than in rats. Seeing no comparable studies are available for DINP in mice, a developmental study in mice with DINP might be helpful to reassure the previous conclusion. A decrease of mean offspring body weight was observed following parental administration of DINP in the one and two-generation studies. In this way, a slight decrease of offspring body weight was observed from the lowest dose tested 0.2%, in the two-generation study. This leads to the estimated LOAEL of 159 mg/kg/d, the lowest value of the maternal dose range (159-395 mg/kg/d) during post-partum (Exxon Biomedical Sciences, 1996j).
DINP seems to be devoid of estrogenic activity in vivo and in vitro, except an extremely weak estrogen activity in vitro, indicated by its ability to stimulate ZR-75 cell proliferation. The available assays have investigated only one mechanism of action: potential estrogen activity.
Investigation on possible mechanisms of endocrine disruption for androgenic function are currently ongoing by investigating in vitro androgen-receptor binding for a number of phthalates and adipate including DBP, DEHP, DIDP, DINP, DEHA and DNOP.
In addition, a recent study investigating the effects of several phthalates on neonatal rats indicated that DINP might have anti-androgenic potency (Earl Gray et al., 2000). It should be noted that in a recent monograph, NTP reviewing the reprotoxicity of phthalates proposed further tests for DINP among which “a perinatal developmental study, in orally exposed rats, that adresses landmarks of sexual maturation such as nipple retention, anogenital distance, age at testes descent, age at prepuce separation and structure of the developing reprodutive system in pubertal or adults animals exposed through development” (NTP-CERHR, 2000). Therefore it is suggested that if NTP goes ahead with their proposal, the results of such study should be reviewed to consider whether there are any bases to revisit and update the Risk Assessment report of DINP.
Repeated dose toxicity and reproductive effects are considered to be the critical end points in the risk assessment of DINP.
244

CHAPTER 4. HUMAN HEALTH
Table 4.5 Studies showing the critical end points 1
End point Study Effects observed at LOAEL NOAEL Reference
Repeated dose toxicity 2 years, diet, rat 358-442 mg/kg/d (6,000 ppm) increased ALT, AST increased liver and kidney weights (abs./rel.) histopathological findings in liver
88 mg/kg/d (1,500 ppm)
Aristech (1994)
1-generation study, diet, rat
966 mg/kg/d (1.5%) decreased live birth and survival indices
622 mg/kg/d (1%)
Exxon Biomedical Sciences (1996i)
Reproductive toxicity
104 weeks, diet, mouse
742 mg/kg/d (4,000ppm) decreased testicular weight
276 mg/kg/d (1,500 ppm)
Aristech (1995c)
Developmental study, diet, rat
1,000 mg/kg/d skeletal and visceral variations
500 mg/kg/d Exxon Biomedical Sciences (1994)
Developmental toxicity
2-generation study, diet, rat
159 mg/kg/d (0.2%) decreased body weight in offspring
Exxon Biomedical Sciences (1996j)
Extrapolation of oral toxicity data (route-to-route extrapolation)
Inhalation and dermal route are relevant occupational and consumer routes of exposure. No adequate NOAEL is available for these routes. Therefore route-to-route extrapolation is necessary using the oral NOAELs.
Difference in bioavailability after oral, dermal and inhalation exposure might result in difference in toxicity between various routes. The following factors have been used to calculate the internal dose.
For oral route an absorption of 50% was defined for adults. For newborns and infants, an absorption of 100% was set up based on a study from Sjoberg et al. (1985) that seemed to show a greater absorption by oral route of an other phthalate DEHP in young Sprague Dawley rats than in older ones. The 100% bioavailability was also assumed by the CSTEE for calculation of oral exposure in children.
For inhalation route, a bioavailability of 75% for adults may be assumed by analogy with DIDP and a bioavailability of 100% for newborns and infants, considered to be in any case a vulnerable sub-population.
For dermal route, internal body burden in human has been calculated using an absorption factor derived from experimental studies.
4.1.3.2 Workers
Occupational exposure may occur by dermal or inhalation route during manufacture of DINP, manufacture of products containing DINP, use of end products containing DINP. The maximum potential airborne concentrations are when aerosol formation is possible especially at high temperatures and mechanical pressure.
Dermal route
The worst-case for external skin exposure is considered to occur when 5 mg/cm2 of pure DINP is applied during 8 hours on a skin surface of 840 cm2 (for both hands).
245

EU RISK ASSESSMENT REPORT – DINP FINAL REPORT, 2003
From Midwest Research Institute (1983), an in vivo GLP study performed with DINP in rats, with very good total recovery, a maximum absorption through the rat skin of ca. 4% of the applied dose may be assumed following a single application for a 7-day period with occlusive fittings. Assuming a quantity of 5 mg/cm2 DINP applied on 840 cm2 (4,200mg), this penetration rate would result in the absorption of 168 mg (4,200.0.04) in 7 days.
From comparative experiments, it is estimated that the human skin is between 4 and 30 times less permeable than the rat skin, the difference depending on the chemical. In the work from Mint and coworkers (Mint and Hotchkiss, 1993; Mint et al., 1994; cf. Table 4.20), several phthalates are compared on human (full thickness) and rat (full thickness) skins. The factors between steady state absorption rates (rats / humans) are, for DMP 6.2, for DEP 8.0, and for DBP 22.7. According to Melnick et al. (1987): “the dermal absorption of DEHP was slightly greater than that of DIDP and much less than that of DMP, DEP, DBP, DIBP, BBP or DNHP.” In this way, for DINP it seems realistic to assume that human skin is at least 10 times less permeable than rat skin. This leads to a human dermal intake of ca. 16.8 mg (168/10) in 7 days, corresponding to 2.4 mg per day. It is emphasised that this approach includes full consideration of the reservoir effect in vivo, which is certainly at its maximum in this case.
In conclusion, for worst-case situations, it is proposed to take a maximum dermal intake of 2.4 mg/day equivalent to 0.03 mg/kg/day for a 70-kg man.
Inhalation route
Based on available measured data on DINP and analogous, aerosol occupational worst-case exposure has been evaluated in 3 different scenarios, as: 5 mg/m3 (DINP manufacture), 10 mg/m3 (manufacture of end products containing DINP), and 10 mg/m3 (use of end products containing DINP). However there remain some uncertainties over the reliability of these estimates and there would be a need for a well-conducted survey on occupational exposure during use of DINP.
The corresponding internal doses are calculated assuming 10 m3 of air are inhaled in a 8-hour working day by a 70-kg worker and a 75% pulmonary absorption rate.
Combined routes
Table 4.5 Worst-case occupational exposure summary 2
Route of penetration
Inhalation Dermal 1)
Combined routes
Scenario External exposure mg/m3
Internal dose mg/kg/d
External exposure mg/cm2
Internal dose mg/kg/d
Internal dose mg/kg/d
DINP manufacture 5 0.53 5 0.03 0.56
Manufacture of end products containing DINP
10 1.07 5 0.03 1.10
Use of end products containing DINP
10 1.07 5 0.03 1.10
1) In view of the relatively very low penetration by the dermal route, the same worst-case evaluation has been retained for all scenario. Real quantities penetrating are in fact lower.
246

CHAPTER 4. HUMAN HEALTH
For the risk characterisation at the workplace, MOSs have to be determined for route-specific as well as combined inhalation and dermal exposure. Only MOSs derived from combined exposure are presented. As internal exposure by the dermal route is very low, much lower than by the inhalation route, the most significant contribution to the conclusions is via inhalation.
Acute toxicity
Acute dermal and inhalation toxicity is considered to be very low. There was no lethality at doses of 4.4 mg/l in rat inhalation studies and no overt toxic effects were noticed for a dermal exposure of 3,160 mg/kg in rabbits. Compared with the highest levels of exposure (scenarios 2 and 3), it clearly shows that acute toxicity risks are not considered of concern. Conclusion (ii) for all scenarios.
Irritation / Corrosivity
DINP may be considered as a very slight skin and eyes irritant, with rapidly reversible effects. Based on slight effects (clear nasal discharge) or no effect, together with the fact that DINP exhibits nonreactive nature across the other routes of exposure, it may be presumed that DINP does not induce respiratory irritation. Therefore effects are not considered of concern. Conclusion (ii) for all scenarios.
Sensitisation
One study conducted according to Buehler gives a positive response but after re-challenge, while another one (conducted according to Buehler) gives a negative response after one challenge. In humans relationship between DINP and reaction when observed was not established. Moreover sensitising properties have not been demonstrated with any of the phthalates and particularly with DEHP, DBP and DIDP. Therefore a low sensitising potential can be anticipated. Conclusion (ii) for all scenarios.
Repeated dose toxicity
Considering the estimated combined internal exposure (cf. Table 4.52) and comparing with the NOAELs of 88 mg/kg/d for hepatic effects and 88 mg/kg/d for kidney effects in rats the following MOSs can be calculated (see Table 4.53).
Table 4.5 MOS calculated for each scenario and for each RDT critical effect 3Scenario Internal Exposure Internal NOAEL
hepatic and renal effect MOS
hepatic and renal effect Conclusion
1 0.56 mg/kg/d 44 mg/kg/d 78 ii
2 1.10 mg/kg/d 44 mg/kg/d 40 ii
3 1.10 mg/kg/d 44 mg/kg/d 40 ii
For occupational exposure, these MOSs can be considered acceptable.
In the liver, the effects observed at the LOAEL in the 2-year chronic/carcinogenicity study consisted of biochemical changes (increased ALT, AST) in both sexes, associated with liver enlargement which appeared to be reversible. In the kidneys, the NOAEL derived from the
247

EU RISK ASSESSMENT REPORT – DINP FINAL REPORT, 2003
2-year rat study is defined from an increase of kidney weights in both sexes at the higher dose, concurrent histological findings in males are related the species- and sex-specific alpha 2u globulin mechanism, leading to the male rat specific nephropathy. Conclusion (ii) for all scenarios.
Mutagenicity
Available data do not reveal a genotoxic potential. Effects are not anticipated to occur. Conclusion (ii) for all scenarios.
Toxicity for reproduction
Fertility (testicular effects) and offspring survival
Considering the estimated combined internal exposure (cf. Table 4.52) and comparing with the NOAELs of 622 mg/kg/d (decrease of live birth and survival indices in the one-generation rat study) and 276 mg/kg/d (testicular effects in mice in a 104-week study), the following MOSs can be calculated (see Table 4.54).
Table 4.5 MOSs calculated for each scenario and for fertility 4
Internal exposure
Scenario Internal NOAEL ↓ live birth and
survival indices (rats)
Internal NOAEL testicular
effects (mice)
MOS ↓ live birth and
survival indices (rats)
MOS testicular
effects (mice)
Conclusion
1 0.56 mg/kg/d 311 mg/kg/d 138 mg/kg/d 555 246 ii
2 1.10 mg/kg/d 311 mg/kg/d 138 mg/kg/d 283 125 ii
3 1.10 mg/kg/d 311 mg/kg/d 138 mg/kg/d 283 125 ii
Concerning testicular effects, the MOSs are considered quite sufficient for occupational exposure, since only minor effects are observed at the LOAEL: a testicular weight decrease without histological findings. Concerning offspring survival, MOSs are considered quite sufficient for occupational exposure. Conclusion (ii) for fertility and offspring survival for all scenarios.
Developmental effects
Considering the estimated combined internal exposure (cf. Table 4.52) and the relevant NOAEL of 500 mg/kg/d (skeletal variations in developmental rat studies) and LOAEL of 159 mg/kg/d (decrease offspring body weight in the 2-generation rat study), the following MOSs can be calculated (see Table 4.55).
Table 4.5 MOS calculated for each scenario and for each developmental effect 5
Scenario Internal exposure
Internal NOAEL skeletal variations
Internal LOAEL ↓ bodyweight in
offspring
MOS skeletal
variations
MOS ↓ bodyweight in
offspring
Conclusion
1 0.56 mg/kg/d 250 mg/kg/d 79.5 mg/kg/d 446 142 ii
2 1.10 mg/kg/d 250 mg/kg/d 79.5 mg/kg/d 227 72 ii
3 1.10 mg/kg/d 250 mg/kg/d 79.5 mg/kg/d 227 72 ii
248

CHAPTER 4. HUMAN HEALTH
For skeletal variations in rats, the MOSs are considered sufficient for the occupational exposure, especially since the minor skeletal variations (supernumerary ribs: rudimentary cervicals and/or 14th rib) have been inconsistently interpreted so far and their relevance to humans is questionable. For decrease of offspring bodyweight in rats, the MOSs can be considered sufficient for occupational exposure, although based on a LOAEL. However, this LOAEL is based on slight effect showing a trend in the data, confirmed at higher dose. Conclusion (ii) for all scenarios.
Endocrine effects
DINP seems to be devoid of estrogenic activity, in vivo or in vitro. DINP shows no activity in assays neither to test the ability of binding to rodent or human estrogen receptors nor to induce estrogen receptors-mediated gene expression, but only shows the ability to stimulate ZR-75 cell proliferation in vitro. In vivo response obtained with uterine wet weight is considered negative, and results of vaginal epithelial cell cornification assay also exhibit an absence of estrogen receptors-mediated estrogenic activity.
It is agreed that DINP has been shown to be less toxic than DEHP and DBP with respect to reprotoxicity findings (evidence of endocrine disruption effects and male sexual tract as specific targets for DEHP and DBP) and that risk assessment decisions could be made on the existing database. Recently, NTP reviewing the reprotoxicity of phthalates proposed further tests among which a perinatal developmental study that addresses landmarks of sexual maturation (NTP/CERHR, 2000). Therefore it is suggested that if NTP goes ahead with their proposal, the results of such study should be reviewed to consider whether there are any bases to revisit and update the risk assessment report of DINP.
Conclusion (ii) for all scenarios
Summary of the risk assessment for workers
Conclusion (ii) for all scenarios.
4.1.3.3 Consumers
As DINP is present in several end products available to consumers, especially those in soft-PVC, consumer exposure can occur from various sources by different routes (inhalation, dermal, oral) in different situations.
Scenarios were built for three sub-populations:
• adults and children 3-15 years old, as these two groups undergo the same sources of exposure,
• infants 6 months to 3 years old, as specific sources of exposure to DIDP are available for this category of consumers (toys and teething rings for example),
• newborns 0 to 6 months old, as their diet is different from this of adults and older children.
Additional safety factors have been taken into account when determining the conclusions for newborns and infants compared to adults. Indeed, these sub-populations are considered in general as vulnerable sub-populations in respect with differences between adults and children in physiological, biochemical, genetical or anatomical parameters as well as in absorption,
249

EU RISK ASSESSMENT REPORT – DINP FINAL REPORT, 2003
metabolism and elimination capacity, which can make children more susceptible to toxicity. Differences in oral and inhalation uptake have been considered through differentiated bioavailabilities: oral internal exposure has been estimated 50% for adults and 100% for newborns and infants and inhalation internal exposure, 75% for adults and 100% for newborns and infants.
To conduct the risk characterisation for those different human populations, human internal exposure was compared with the internal NOAELs/LOAELs derived from animal data.
The risk characterisation considering the possible use of DINP as a substitute of DEHP in food packaging has been included in appendix B.
4.1.3.3.1 Adults and 3-15 years old children
The following exposure scenarios are considered as being of great importance for adults:
• food and food-related uses, • building materials and furniture, • clothes, gloves and footwear, • car and public transport interior.
The MOSs are calculated for multiple exposure pathways and include exposure from the four above scenarios (cf. Table 4.13).
Table 4.5 MOSs calculated for adults exposed to DINP from various matrixes and by multiple pathways 6
End point Internal exposure (mg/kg bw/d)
Internal NOAEL a)
(mg/kg bw/d) MOS Internal LOAEL a)
(mg/kg bw/d) MOS Conclusion
RDT/Hepatic/kidney 0.011 44 1) 4,000 ii
Decrease of live birth survival indices
0.011 311 2) 28,273 ii
0.011 138 3) 12,545 ii
Developmental: visceral and skeletal variations
0.011 250 4) 22,727 ii
Developmental: decrease of bodyweight in offspring
0.011 79.5 5) 7,227 ii
Reproductive toxicity: testicular effects
1) 2-year study by oral route in rats (Aristech, 1994) 2) 1-generation study in rat in diet (Exxon Biomedical Sciences, 1996i) 3) 104 weeks, diet, mouse (Aristech, 1995c) 4) Developmental study, diet, rat (Exxon Biomedical Sciences, 1994; BASF, 1995) 5) 2-generation study, diet, rat (Exxon Biomedical Sciences, 1996j) a) NOAEL and LOAEL are divided by a factor 2 to take into account the bioavailability of 50% by the oral route in animals MOSs are considered sufficient to protect adults. Conclusion (ii) for all end points.
250

CHAPTER 4. HUMAN HEALTH
4.1.3.3.2 Infants
The following exposure scenarios are considered as important for infants:
• food and food-related uses, • toys and baby equipment, • car and public transport interior, • building material and furniture.
The MOSs are calculated in two ways: with or without toy exposure (cf. Table 4.13).
Without toys
Table 4.5 MOSs calculated for infants exposed to DINP from various matrixes and by multiple pathways: without toys 7
End point Internal exposure (mg/kg bw/d)
Internal NOAEL a)
(mg/kg bw/d) MOS Conclusion
RDT/Hepatic/kidney 0.049 44 1) 898 ii
Reproductive toxicity: testicular effects 0.049 138 2) 2,816 ii
1) 2-year study by oral route in rats (Aristech, 1994) 2) 104 weeks, diet, mouse (Aristech, 1995c) a) NOAEL is divided by a factor 2 to take into account the bioavailability of 50% by the oral route in animals
For all end points the MOSs are considered sufficient. Conclusion (ii) applies for infants and combined exposure without toys.
Pertaining to reduced offspring survival observed in the one-generation rat study (Exxon Biomedical Sciences, 1996i), due to the uncertainty related to the relevance of this end point for infants, no formal conclusion could be drawn. Nevertheless, in spite of this uncertainty, reduced offspring survival might be taken into account for infants and considering the internal exposure of 0.049 mg/kg bw/d and the internal NOAEL of 311 mg/kg/d in rats, the MOS would be 6,347; this MOS would be considered sufficient to protect infants.
With toys
Table 4.5 MOSs calculated for infants exposed to DINP from various matrixes and by multiple pathways: with toys 8
MOS
End point Internal exposure (mg/kg bw/d)
Internal NOAEL a)
(mg/kg bw/d) Conclusion
RDT/Hepatic/kidney 0.25 44 1) 176 ii
Reproductive toxicity: testicular effects 0.25 138 2) 552 ii
1) 2-year study by oral route in rats (Aristech, 1994) 2) 104 weeks, diet, mouse (Aristech, 1995c) a) NOAEL is divided by a factor 2 to take into account the bioavailability of 50% by the oral route in animals
For all end points the MOSs are considered sufficient. Conclusion (ii) applies for infants and combined exposure with toys.
251

EU RISK ASSESSMENT REPORT – DINP FINAL REPORT, 2003
As the major way source of exposure is the oral route (exposures by toys and food), which represents 91% of the whole exposure for those specific consumers, it would be of interest to have valid analytical methods that allow to verify that exposures by food and toys are not higher for those populations as the MOS decrease very strongly (if we take into account the replacement of DEHP by DINP (cf Appendix B). So it would be of great interest to measure DINP in various infant formulas in different countries of Europe to assess the real exposure by food in this category of consumers.
4.1.3.3.3 Newborns
The following exposure scenarios are considered as important for newborn babies:
• food and food-related uses, • toys and baby equipment, • building material and furniture, • car and public transport interior.
The MOSs are calculated in two ways: with and without toys taking into account the whole internal exposure pathways for those specific consumers (cf. Table 4.13).
Table 4.5 MOSs calculated for newborns exposed to DINP from various matrixes and by multiple pathways: without toys 9
End point Internal exposure (mg/kg bw/d)
Internal NOAEL a)
(mg/kg bw/d) MOS Conclusion
RDT/Hepatic/kidney 0.049 44 1) 898 ii
Reproductive toxicity: testicular effects 0.049 138 2) 2,816 ii
1) 2-year study by oral route in rats (Aristech, 1994) 2)
0
104 weeks, diet, mouse (Aristech, 1995c) a) NOAEL is divided by a factor 2 to take into account the bioavailability of 50% by the oral route in animals
For all end points the MOSs are considered sufficient. Conclusion (ii) applies for newborn babies and combined exposure without toys.
Pertaining to reduced offspring survival observed in the one-generation rat study (Exxon Biomedical, 1996i), due to the uncertainty related to the relevance of this end point for newborns, no formal conclusion could be drawn. Nevertheless, in spite of this uncertainty, reduced offspring survival might be taken into account for newborns and considering the internal exposure of 0.049 mg/kg bw/d and the internal NOAEL of 311 mg/kg/d in rats, the MOS would be 6,347; this MOS would be considered sufficient to protect newborns.
Table 4.6 MOSs calculated for newborns exposed to DINP from various matrixes and by multiple pathways: with toys
End point Internal exposure (mg/kg bw/d)
Internal NOAEL a)
(mg/kg bw/d) MOS Conclusion
0.25 44 1) 176 ii
Fertility: testicular effects 0.25 138 2) 552 ii
RDT/Hepatic/kidney
1) 2-year study by oral route in rats (Aristech, 1994) 2) 104 weeks, diet, mouse (Aristech, 1995c) a) NOAEL is divided by a factor 2 to take into account the bioavailability of 50% by the oral route in animals
252

CHAPTER 4. HUMAN HEALTH
For all end points the MOSs are considered sufficient. Conclusion (ii) applies for newborn babies and combined exposure with toys.
Pertaining to reduced offspring survival observed in the one-generation rat study (Exxon Biomedical, 1996i), due to the uncertainty related to the relevance of this end point for newborns, no formal conclusion could be drawn. Nevertheless, in spite of this uncertainty, reduced offspring survival might be taken into account for newborns and considering the internal exposure of 0.25 mg/kg bw/d and the internal NOAEL of 311 mg/kg/d in rats, the MOS would be 1,244; this MOS would be considered sufficient to protect newborns.
4.1.3.3.4 Summary of the risk characterisation for consumers
Conclusion (ii) applies for all consumers.
4.1.3.4 Humans exposed via the environment
As seen above, repeated dose toxicity and reproductive effects are considered to be the critical end points in the risk assessment of DINP. The exposure assessment has shown that the main route of intake is by the oral route.
4.1.3.4.1 Repeated dose toxicity
Adults (corresponding to adults and children 3-15 years old)
The highest estimated total daily intake is 0.028 mg/kg bw/d, corresponding to an internal exposure of 0.014 mg/kg bw/d.
1
In Table 4.61, the MOS is calculated for the lowest NOAEL determined for repeated dose toxicity.
Table 4.6 MOS calculated for adults for repeated dose toxicity
Internal exposure Internal NOAEL hepatic and renal effect
MOS hepatic and renal effect
Conclusion
0. 014 mg/kg/d 44 mg/kg/d 1) 3,140 ii
1) 2-year study by oral route in rats (Aristech, 1994)
The above estimated MOS is considered sufficient for exposure of adults via the environment. Conclusion (ii).
Infants (0.5-3 years old)
The highest estimated total daily intake is 0.156 mg/kg bw/d. Assuming the bioavailablility of DINP in children is higher than in adults, an internal dose of 0.156 will be used. In Table 4.62, the MOS is calculated for the lowest NOAEL determined for repeated dose toxicity.
253

EU RISK ASSESSMENT REPORT – DINP FINAL REPORT, 2003
Table 4.6 MOS calculated for infants for repeated dose toxicity 2
Internal exposure Internal NOAEL hepatic and renal effect
MOS hepatic and renal effect
Conclusion
0.156 mg/kg/d 44 mg/kg/d 1) 282 ii
1) 2-year study by oral route in rats (Aristech, 1994)
In liver, the effects observed at the LOAEL in the 2-year chronic / carcinogenicity study consisted of biochemical changes (increased ALT, AST) in both sexes, associated with liver enlargement which appeared to be reversible. In kidneys, the NOAEL derived from the same study is defined from an increase of kidney weights in both sexes at the higher dose, concurrent histological findings in males are related to the species- and sex- specific alpha 2u globulin mechanism, leading to the male rat specific nephropathy.
The above estimated MOS is considered sufficient for exposure of infants via the environment, especially as the risk characterisation is specific for young children and not the overall population. Conclusion (ii).
4.1.3.4.2 Toxicity for reproduction
Adults
In Tables 4.63 and 4.64, the MOSs are calculated for the lowest NOAELs determined for fertility and developmental effects.
Table 4.6 MOS calculated for adults for fertility (testicular effects) and decrease in live birth and survival indices 3
Internal exposure Internal NOAEL ↓ live birth survival
indices (rats)
Internal NOAEL ↓ testicular weight
in mice
MOS ↓ live birth and
survival indices (rats)
MOS Testicular effects in
mice
Conclusion
0. 014 mg/kg/d 311 mg/kg/d 1) 138 mg/kg/d 2) 22,200 9,850 ii
1) 1-generation study in rat in diet (Exxon Biomedical Sciences, 1996i) 2) 104 weeks, diet, mouse (Aristech, 1995c)
Table 4.6 MOS calculated for adults for each developmental effect 4
Internal exposure Internal NOAEL skeletal variations
Internal LOAEL ↓bodyweight in
offspring
MOS skeletal variations
MOS ↓ bodyweight in
offspring
Conclusion
0. 014 mg/kg/d 250 mg/kg/d1) 79.5 mg/kg/d 2) 17,850 5,700 ii
1) Developmental study, diet, rat (Exxon Biomedical Sciences, 1994; BASF, 1995) 2) 2-generation study, diet, rat (Exxon, 1996j)
These MOSs are considered sufficient for exposure of adults via the environment. Conclusion (ii).
254

CHAPTER 4. HUMAN HEALTH
Infants
The highest estimated total daily intake is 0.156 mg/kg bw/d. Assuming the bioavailablility of DINP in children is higher than in adults, an internal dose of 0.156 will be used. In Table 4.65, the MOS are calculated for the lowest NOAELs determined for fertility (testicular effects) and decrease in live birth and survival indices.
Table 4.65 MOSs calculated for infants for fertility (testicular effects)
Internal exposure Internal NOAEL ↓testicular weight in mice
MOS testicular effects in mice
Conclusion
0.156 mg/kg/d 138 mg/kg/d 1) 885 ii 1) 104 weeks, diet, mouse (Aristech, 1995c)
Pertaining to reduced offspring survival observed in the one-generation rat study (Exxon Biomedical Sciences, 1996i), due to the uncertainty related to the relevance of this end point for infants, no formal conclusion could be drawn. Nevertheless, in spite of this uncertainty, reduced offspring survival might be taken into account for infantsand considering the internal exposure of 0.156 mg/kg bw/d and the internal NOAEL of 311 mg/kg/d in rats, the MOS would be 1,994; this MOS would be considered sufficient to protect infants.
The MOSs are considered sufficient for exposure of infants via the environment. Conclusion (ii).
4.1.3.4.3 Summary of the risk characterisation for humans exposed via the environment
For all end points, the MOSs are considered sufficient. Conclusion (ii).
4.1.3.5 Combined exposure
Adults
The MOSs calculated for the worst-case combined exposure are presented in Table 4.66.
255

EU RISK ASSESSMENT REPORT – DINP FINAL REPORT, 2003
Table 4.6 MOSs calculated for adults for combined exposure with occupational exposure 6
Effects Internal exposure mg/kg bw/d
Internal NOAEL mg/kg bw/d
Internal LOAEL mg/kg bw/d
MOS Conclusion
RDT (kidney and liver effects) 1.12 44 1) 39 ii
↓Live birth and survival indices 1.12 311 2) 278 ii
Testicular effects 1.12 138 3) 123 ii
Skeletal variations 1.12 250 4) 223 ii
↓Bbody weight in offspring 1.12 79.5 5) 71 ii
1) 2-year study by oral route in rats (Aristech, 1994) 2) 1-generation study in rat in diet (Exxon Biomedical Sciences, 1996i) 3) 4) 5)
7
104 weeks, diet, mouse (Aristech, 1995c) Developmental study, diet, rat (Exxon Biomedical Sciences, 1994; BASF, 1995) 2-generation study, diet, rat (Exxon Biomedical Sciences, 1996j)
Table 4.6 MOSs calculated for adults for combined exposure without occupational exposure
Effects Internal exposure mg/kg bw/d
Internal NOAEL mg/kg bw/d
Internal LOAEL mg/kg bw/d
MOS Conclusion
RDT (kidney and liver effects) 0.02 44 1) 2,200 ii
↓Live birth and survival indices 0.02 311 2) 15,550 ii
Testicular effects 0.02 ii 138 3) 6,900
Skeletal variations 0.02 250 4) 12,500 ii
↓ Body weight in offspring 0.02 79.5 5) 3,975 ii
1) 2-year study by oral route in rats (Aristech, 1994) 2) 1-generation study in rat in diet (Exxon Biomedical Sciences, 1996i) 3) 104 weeks, diet, mouse (Aristech, 1995c) 4) Developmental study, diet, rat (Exxon Biomedical Sciences, 1994; BASF, 1995) 5) 2-generation study, diet, rat (Exxon Biomedical Sciences, 1996j)
As combined exposure of adults is almost exclusively related to occupational exposure, the MOSs indicate no reason for concern. For all effects, conclusion (ii) applies with or without considering occupational exposure.
Children (3-15 years)
Table 4.6 MOSs calculated for children for combined exposure 8
Conclusion Effects Internal exposure mg/kg bw/d
Internal NOAEL mg/kg bw/d
Internal LOAEL mg/kg bw/d
MOSs
RDT (kidney and liver effects) 0.02 441) 2,200 ii
↓Live birth and survival indices 0.02 311 2) 15,550 ii
Testicular effects 0.02 138 3) 6,900 ii
1) 2-year study by oral route in rats (Aristech, 1994) 2) 1-generation study in rat in diet (Exxon Biomedical Sciences, 1996i) 3) 104 weeks, diet, mouse (Aristech, 1995c)
256

CHAPTER 4. HUMAN HEALTH
For children 3-15 years, the MOSs indicate no reason for concern. For all effects, conclusion (ii) applies.
Infants (0.5-3 years old)
Table 4.6 MOSs calculated for infants for combined exposure (with toys) 9
Effects Internal exposure mg/kg bw/d
Internal NOAEL mg/kg bw/d
MOSs Conclusion
RDT (kidney and liver effects in rats) 0.41 44 1) 107 ii
Testicular effects (mice) 0.41 138 2) 336 ii
1) 2-year study by oral route in rats (Aristech, 1994) 3) 104 weeks, diet, mouse (Aristech, 1995c)
The MOSs indicate no reason for concern. For all effects, conclusion (ii) applies.
Pertaining to reduced offspring survival observed in the one-generation rat study (Exxon Biomedical Sciences, 1996i), due to the uncertainty related to the relevance of this end point for infants, no formal conclusion could be drawn. Nevertheless, in spite of this uncertainty, reduced offspring survival might be taken into account for infants and considering the internal exposure of 0.41 mg/kg bw/d and the internal NOAEL of 311 mg/kg/d in rats, the MOS would be 758; this MOS would be considered sufficient to protect infants.
Summary of the risk characterisation for combined exposure
Conclusion (ii).
257

EU RISK ASSESSMENT REPORT – DINP FINAL REPORT, 2003
4.2 HUMAN HEALTH (PHYSICO-CHEMICAL PROPERTIES)
4.2.1 Exposure assessment
Workers
The exposure assessment, to the extent it is related to physico-chemical properties, has already been discussed. No specific exposure information is available.
4.2.2 Effects assessment: Hazard identification
Explosivity
DINP has no explosive properties.
Flammability
DINP has a very low degree of flammability (flash point >200°C).
Oxidising potential
DINP has no oxidising potential.
4.2.3 Risk characterisation
Workers
DINP has neither explosive nor oxidising properties. The likelihood of an adverse effect deriving from flammability is very low. Conclusion (ii) for all scenarios.
Consumers
Exposure is considered negligible with respect to this section of the risk assessment. Conclusion (ii) for all scenarios.
Humans exposed via the environment
Exposure is considered negligible with respect to this section of the risk assessment. Conclusion (ii).
Summary of the risk characterisation for physico-chemical properties
Conclusion (ii).
258

259
5 RESULTS
5.1 ENVIRONMENT
Conclusion (ii) There is at present no need for further information and/or testing and for risk reduction measures beyond those which are being applied already
This conclusion is reached for the aquatic compartment, the terrestrial compartment, the atmosphere, microorganisms in the sewage treatment plant as well as for secondary poisoning.
5.2 HUMAN HEALTH
5.2.1 Human health (Toxicity)
5.2.1.1 Workers
Conclusion (ii) There is at present no need for further information and/or testing and for risk reduction measures beyond those which are being applied already.
5.2.1.2 Consumers
Conclusion (ii) There is at present no need for further information and/or testing and for risk reduction measures beyond those which are being applied already.
5.2.1.3 Humans exposed via the environment
Conclusion (ii) There is at present no need for further information and/or testing and for risk reduction measures beyond those which are being applied already.
5.2.1.4 Combined exposure
Conclusion (ii) There is at present no need for further information and/or testing and for risk reduction measures beyond those which are being applied already.
5.2.2 Human health (risks from physico-chemical properties)
Conclusion (ii) There is at present no need for further information and/or testing and for risk reduction measures beyond those which are being applied already.

260
Adams WJ, Biddinger GR, Robillard KA, Gorsuch JW (1995). A summary of the acute toxicity of 14 phthalate esters to representative aquatic organisms. Environ. Toxicol. and Chem. 14(9), 1568-1574.
6 REFERENCES ACTS (1984). Advisory Committee on Toxic Substances (ACTS), as cited in King, 1996.
ALcontrol Biochem Laboratoria (1999). The Analysis of Phthalates in Soil and Sediment. Brief Concept Report of Validation Results. Unpublished Report, Draft June 1999.
Aranda JM, O’Connor GA, Eiceman GA (1989). Effects of sewage sludge on di-(2-Ethylhexyl) phthalate uptake by plants. J. Environ. Qual. 18, 45-50.
Arbejdstilsynet (1996). Information from the Danish Product Register. Personal communication, Poul Andersen, 11 November 1997.
Aristech Chemical Corporation (1994). 2-Year Dietary Oral Toxicity Study in Rats with Diisononyl Phthalate. TSCA 8(e) Submission 8EHQ-0794-13083. CAS Number 68515-48-0. Dated July 13, 1994.
Aristech Chemical Corporation (1995a). TSCA 8(e) Submission 8EHQ-0794-13083. Follow-up letter dated January 13, 1995.
Aristech Chemical Corporation (1995b). TSCA 8(e) Submission 8EHQ-0794-13083. Follow-up letter dated March 20, 1995.
Aristech Chemical Corporation (1995c). TSCA 8(e) Submission 8EHQ-0794-13083. Corroborative information in second species. Dated April 12, 1995.
Ashby et al. (1994). Mechanistically-based human hazard assessment peroxisome proliferators induced hepatocarcinogenesis. Hum. Exp. Toxicol. 13, 1-117.
Association of Plasticiser Industry (1994). Investigation Report on the Analysis of the Phthalates (PAE) Concentrations at Water Basins. Unpublished Report. November 1994, Tokyo, Japan.
Babich MA (1998). The Risk of Chronic Toxicity Associated with Exposure to DINP in Children's Products. Risk Assessment Report of the US Consumer Product Safety Commission December 1998, p 11.
Baker TK, Kalimi GH, Lington AW, Isenberg JS, Klaunig J and Nikiforov AI (1996). Gap junctional intercellular communication (GJIC) studies on 5 phthalate monoesters in hepatocytes of four species: implications for cancer risk assessment. The Toxicologist 30(1), Part 2, #1063.
Barber ED, Teetsel NM, Kolberg KF, Guest D (1992). A comparative study of the rates of in vitro percutaneous absorption of eight chemicals using rat and human skin. Fund. Appl. Toxicol. 19, 493–497.
Bartek MJ, LaBudde JA, Maibach HI (1972). Skin permeability in vivo: comparison in rat rabbit, pig and man. J. Investig. Dermatol. 58(3), 114-123.
BASF AG (1960a). Abschliessender Bericht über die Wirkung verschiedener Phthalsäureester im Fütterungsversuch, (Final report on the effects of various phthalates in feeding studies). July 11, 1960.
BASF AG (1960b). Bericht über die Prüfung von Aethylhexylphthalat, Dinonylphthalat und Paraffinöl im Fütterungsversuch mit Sprague-Dawley-Ratten. (VII/3-5), (Report on the study of ethylhexyl phthalate, dinonyl phthalate and paraffin oil in a feeding study with Sprague-Dawley rats).
BASF AG (1961). Bericht über die toxikologische Prüfung von Palatinol C, IC, AH, DN und Z. Subakute Toxizität für Kaninchen per os, (Report on the toxicological testing of Palatinol C, IC, AH, DN and Z). Unpublished Results (VII/3-6).
BASF AG (1981a). Gewerbetoxikologische Grundprüfung. Akutes Inhalationsrisiko (Ratte), (Report on the study of the acute toxicity of Palatinol CE 5250 by inhalation route in rats). Unpublished Results (80/266).
BASF AG (1981b). Gewerbetoxikologische Grundprüfung. Primäre Hautreizwirkung (kaninchen; Draize test), (Report on the study of the irritation to the intact and abraded dorsal skin of white rabbits based on Draize of Palatinol CE 5250. Unpublished Results (80/266).

CHAPTER 6. REFERENCES
BASF AG (1981c). Gewerbetoxikologische Grundprüfung. Primäre Schleimhautreizwirkung (Kaninchenauge; Draize-test), (Report on the study of the irritation to the eye of white rabbits based on Draize of Palatinol CE 5250. Unpublished Results (80/266).
BASF AG (1981d). Gewerbetoxikologische Grundprüfung. Akutes orale Toxizität (Ratte), (Report on the study of the acute oral toxicity of Palatinol CE 5250 by oral route in rats). Unpublished Results (80/266).
BASF AG (1982a). Palatinol DINP. Technical data sheet.
BASF AG (1982b). Dept. of toxicology, Unpublished Report 80/266, 3.24.82.
BASF AG (1983). Dampfdruck von Di-iso C9 (Palatinol DN) und di-iso C10 (Palatinol Z) Phthalaten. Unpublished Analytical Report BRU 83.178, 18.11.1983.
BASF AG (1985a). Technical data sheet Palatinol N. Ref. M 5807 d, October 1985.
BASF AG (1985b). Dampfdruck von zwei Diisononylphthalaten. Unpublished Analytical Report BRU 85.39.
BASF AG (1986a). Report on the Study of Palatinol N (ZNT test substance N° 85/513) in the Ames Test (standard plate test with Salmonella typhimurium) performed by BASF Aktiengesellschaft department of toxicology FRG. Project N° 40/1M0513/85, December 10, 1986.
BASF AG (1986b). Cytotoxicity Assessment in CHO Cells with the Test Substance Palatinol N. Unpublished Results.
BASF AG (1987a). Solubility of Palatinol N in Water and Solubility of Water in Palatinol N. Unpublished Internal Analytical Report ZET 187.0718.1, 13.07.87.
BASF AG (1987b). Safety data sheet Palatinol N. 11/87.
BASF AG (1987c). Dampfdruck Palatinol N. Unpublished Analytical Report BRU 87.194, 16.09.1987.
BASF AG (1989b). Labor Oekologie. Unpublished Results (1027/89).
BASF AG (1994a). Safety data sheet Palatinol N, CAS No. 28553-12-0. 13/04/1994.
BASF AG (1987d). Dampfdruck Palatinol DN, Unpublished Analytical Report BRU 87.192, 16.09.1987.
BASF AG (1987e). Vapour pressure of 10 Palatinol samples. Unpublished Internal Report BRU 87.200 (24.09.1987), (summary of reports BRU 87.185 to 87.195).
BASF AG (1987f). Bericht Prüfung der oralen Toxizität von Palatinol N an Ratten Verabreichung im Futter über 3 Monate, (Study of the oral toxicity of Palatinol N in rats. Administration in the diet over 3 months). Project No 31S0513/85103, Dec. 11, 1987.
BASF AG (1988). Labor Oekologie. Unpublished Results (1025/88).
BASF AG (1989a). Dept. of Toxicology. Unpublished Results (88/572), 05-17-89.
BASF AG (1990). Analytical laboratory. Unpublished results, Report BRU 90.242, 22.08.1990.
BASF AG (1991). Analytical laboratory. Unpublished Results, Report BRU 91.078, 07.11.1991.
BASF AG (1992a). Characterisierung von Diisononylphthalat 3. Unpublished Report 0/92/7062, 17.3.1992.
BASF AG (1992b). Technical data sheet Palatinol DINP, CAS No 28553-12-0. Reference M 5956 d, June 1992.
BASF AG (1993). Dichte von Palatinol DINP bei -40 C bis 160 C. Unpublished Analytical Report ZSZ/Analytik - 93A00262, 26.01.93.
BASF AG (1994b). Safety data sheet Palatinol DN, CAS No. 28553-12-0. 18/04/1994.
BASF AG (1995a). Study of the Prenatal Toxicity of Palatinol DN (test substance N° 92/64) in Rats after Oral Administration (gavage) performed by BASF Aktiengesellschaft Department of Toxicology, FRG. Project N° 10R0126/91088, Report dated 06 September 1995, Study carried out in 1992.
BASF AG (1995b). Study of the Prenatal Toxicity of Palatinol N (test substance N° 91/126) in Rats after Oral Administration (gavage) performed by BASF Aktiengesellschaft Department of Toxicology, FRG. Project N° 10R0126/91088, Report dated 04 May 1995, Study carried out in 1992.
261

EU RISK ASSESSMENT REPORT – DINP FINAL REPORT, 2003
BASF AG (1995c). Report on the Study of Diisononylphthalat IGS 21002 (ZHT test substance N° 95/91) in the Ames Test performed by BASF Aktiengesellschaft Department of Toxicology FRG. Project N° 40M0091/954045, April 13 1995.
BASF AG (1996a). Palatinol N. Weichmacher - Sortimentsübersicht. Ref. M 5989 d, Jan. 1996.
BASF AG (1996b). IUCLID data sheet di-"isononyl" phthalate 28553-12-0. 26-jan-96.
BASF AG (1999a). Risk assessment Bis(2-ethylhexyl)phthalate, CAS No 117-81-7. Update of Emission Data, Letter from C. Schwarz, 6/9/1999.
BASF AG (1999b) DEHP, Two-Generation Reproduction Toxicity Range Finding Study in Wistar Rats, Continuous Dietary Administration. Project identification, 15R0491/97096 completed on June 1999.
Benford DJ, Patel S and Reavy HJ (1986). Species differences in the response of cultured hepatocytes to phthalate esters. Food and Chemical Toxicology, 24(6-7), 799-800.
BIBRA (1986). Rat Liver and Lipid Effects of Representative Phthalate Esters with EPA Acknowledgement letter. British Industrial Biological Research Association (BIBRA), Unpublished Laboratory Report (BIBRA Project No 3.0542) submitted to the Chemical Manufacturers Association (CMA).
BGAA (1997). Di-(2-ethylhexyl)-phthalat expositions am Arbeitsplatz (Expositionsbeschreibung Nr. 22, V.7.0324). Berufsgenossenschaftlicher Arbeitskreis Altstoffe Bundesrepublik Deutschland (BGAA), Personal communication.
BIBRA (1985). A 21-Day Feeding Study of Diisononyl phthalate to Rats: Effects on the Liver and Liver Lipids. British Industrial Biological Research Association (BIBRA), Unpublished Laboratory Report, Report No 0495/6/85 submitted to the Chemical Manufacturers Association (CMA).
Bio/dynamics (1982a). One Week Prechronic Oral Feeding Study. Test Materials: MRD 8240, MRD 8241. Project number VO 4053, performed by Bio/dynamics, Inc., Unpublished Laboratory Report submitted to Exxon Biomedical Sciences, Inc., ¸ November 19, 1982.
Bio/dynamics (1982b). Thirteen Week Pre-chronic Oral Feeding Study in Fischer 344 Rats. Test Material: MRD-82-41. Project VO 4154-F, performed by Bio/Dynamics, Inc., Report submitted to Exxon Biomedical Sciences, Inc., December 8, 1982.
Bio/dynamics (1982c). Thirteen Week Pre-chronic Oral Feeding Study in Sprague-Dawley Rats. Test Material: MRD-82-41. Project No VO 4154-S, performed by Bio/Dynamics, Inc., Report submitted to Exxon Biomedical, Inc., December 8, 1982.
Bio/Dynamics (1986). A Chronic Toxicity Carcinogenicity Feeding Study in Rats with Santicizer 900 final report. Project N° 81-2572 (BD-81-244) performed by Bio/dynamics, Inc., Unpublished Laboratory Report (incomplete report, appendices not available) submitted to Monsanto Company, June 20, 1986.
Bird MG, Lington AW and Cockrell B (1987). Subchronic and chronic oral studies of diisononyl phthalate (DINP) in F-344 rats: effects on hepatic peroxisome induction. Toxicologist, 7(1), #225, 56 (abstract).
Birge WJ, Black JA, Westerman AG (1978). Effects of Polychlorinated Biphenyl Compounds and Proposed PCB-Replacement Products on Embryo-Larval Stages of Fish and Amphibians. University of Kentucky, Water Resources Research Institute, Research Report No 118, NTIS-PB-290 711, Lexington, KY, 33p.
BRE (1998). Use Category Document: Plastic additives. Building Research Establishment (BRE), Garston. UK.
Brodell RT, Torrence BP (1992). Sqwish Ball dermatitis, J. Am. Acad. Dermatol. 26(4), 641-2.
Brown D and Thompson RS (1982a). Phthalates and the aquatic environment: part 1. The effect of di-2-ethylhexyl phthalate (DEHP) and di-isodecyl phthalate (DIDP) on the reproduction of Daphnia magna and observations on their bioconcentration. Chemosphere 11(4), 417-426.
Brown D and Thompson RS (1982b). Phthalates and the squatic environment: part II. The bioconcentration and depuration of di-2-ethylhexyl phthalate (DEHP) and di-isodecyl phthalate (DIDP) in mussels (Mytilus edulis). Chemosphere 11(4), 427-435.
Brown D, Williams NJ (1994). Chronic Toxicity to Daphnia Magna. Brixham Environmental Laboratory, Zeneca, Report No. BL5213/B.
262

CHAPTER 6. REFERENCES
Brown D, Thompson RS, Stewart KM, Croudace CP, Gillings E (1996). The effect of phthalate ester plasticizers on the emergence of the Midge (Chironomus riparius) from treated sediments, Chemosphere 32(11), 2177-2187.
Butala JH, Moore MR, Cifone MA, Bankston JR, Astill B, 1996. Oncogenicity study of di(isononyl phthalate in rats. The Toxicologist 30(A1031), 202.
Butala JH, Moore MR, Cifone MA, Bankston JR, Astill B 1997. Oncogenicity study of di(isononyl phthalate in mice. The Toxicologist 36(A879), 173.
Cadogan DF, Papez M, Poppe AC, Pugh DM, Scheubel J (1994). An Assessment of the Release, Occurrence and Possible Effects of Plasticisers in the Environment. In: Progress in Rubber and Plastics Technology. Buist JM, Dr. (ed), Rappra Technology LTD, 10(1).
Caldwell DJ (1996). Relevance of Mononuclear Cell Leukemia in Fisher 344 Rats to Cancer Classification of DINP. Exxon Report n° 96MR911.
Caldwell DJ et al. (1999a). Restrospective evaluation of alpha 2u globulin accumulation in male rat kidneys following high doses of diisononyl phthalate. Toxicological Sciences 51(1), 153-160.
Caldwell DJ (1999b). Review of mononuclear cell leukemia in F-344 rat bioassays and its significance to human cancer risk: A case study using alkyl phthalates. Regulatory Toxicology and Pharmacology 30(1), 45-53.
Call DJ, Brooke LT, Markee TP, Cox DA, Geiger DL, Vande Venter FA, Polkinghorne, CN, Genisot KI (1997). Sediment Toxicity Testing Program for Phthalate Esters. Chemical Manufacturers Association (CMA), Unpublished Report PE-88.0-SED-WIS, May 2, 1997.
Cary GA, Doebbler GF, Spacie A, and Vilkas AG (1976). Acute and Chronic Toxicity of Di-2-Ethylhexyl Phthalate and Di-n-Butyl Phthalate to Fish and Invertebrates. US Environmental Protection Agency (US EPA), Office of Research and Monitoring, Washington, DC.
CEFIC (1982). Report to CEFIC on a 28-Day Dose and Time Response Study of DEHP in Rats. Univ. of Surrey, Robens Institute of Industrial and Environmental health Safety, Unpublished Results study n° 5/81/TX, 05-21-82.
CITI (1992). Biodegradation and Bioaccumulation Data of Existing Chemicals Based on the CSCL, Chemicals Inspection & Testing Institute (CITI), Japan.
CMA (1983a). Acute Toxicity of Fourteen Phthalate Esters to Fathead Minnows (Pimephales promelas). Chemical Manufacturers Association (CMA), CMA Contract Nr PE 16.PET-EGG, Report BW-83-3-1369.
CMA (1983b). Acute Toxicity of Thirteen Phthalate Esters to Fathead Minnows (Pimephales promelas). Chemical Manufacturers Association (CMA), CMA Contract Nr PE 16.PET-EGG, Report BW-83-3-1374, EPA OTS Doc. ID: 40-8326143.
CMA (1983c). Acute Toxicity of Thirteen Phthalate Esters to Bluegill (Lepomis macrochirus). Chemical Manufacturers Association (CMA), CMA Contract Nr PE 16.PET-EGG, Report BW-83-3-1368.
CMA (1983d). Acute Toxicity of Fourteen Phthalate Esters to the Rainbow Trout (Salmo gairdneri). Chemical Manufacturers Association (CMA), CMA Contract Nr PE 16.PET-EGG, Report BW-83-3-1873, EPA OTS Doc. ID: 0384-02865.
CMA (1984a). Acute Toxicity of Thirteen Phthalate Esters to the Sheephead Minnow (Cyprinodon variegatus). Chemical Manufacturers Association (CMA), CMA Contract Nr PE 16.PET-EGG, Report BW-83-3-1873, EPA OTS Doc. ID: 40-8426082.
CMA (1984b). Phthalate Esters Panel. Summary Report – Environmental Studies-Phase I. Generation of Environmental Fate and Effects Data Base on 14 Phthalate Esters. Chemical Manufacturers Association (CMA), Washington, DC, December 15, 1984.
CMA (1984c). Acute Toxicity of Twelve Phthalate Esters to Paratanytarsus Parthenogenica. Chemical Manufacturers Association (CMA), CMA Contract Nr PE 16.PET-EGG, Report BW-83-6-1424.
CMA (1984d). Acute Toxicity of Twelve Phthalate Esters to Mysid Shrimp (Mysidopsis bahia). Chemical Manufacturers Association (CMA), CMA Contract Nr PE 16.PET-EGG, Report BP-83-1-6.
CMA (1984e). Toxicity of Fourteen Phthalate Esters to the Freswater Green Alga Selenastrum Capricornutum. Chemical Manufacturers Association (CMA), CMA Contract Nr PE 16.PET-EGG, Report BP-84-1-4.
263

EU RISK ASSESSMENT REPORT – DINP FINAL REPORT, 2003
CMA (1984f). A 21 Day Dose-Relationship of Di(2-ethylhexyl)phthalate in Rats. TSCATS: OTS 0508501, Doc. I. D.: 40-8526196, 07-01-84, Chemical Manufacturers Association (CMA); TSCATS: OTS 0509537, Doc. I. D.: 40-8526206, 07-01-84, Chemical Manufacturers Association; TSCATS: OTS 0536220, New Doc. I. D.: 88-920002026, 07-01-84, Chemical Manufacturers Association.
Covance (1998). Oncogenicity Study in Rats with DINP Including Ancillary Hepatocellular Proliferation and Biochemical Analyses. Unpublished Report; Study number 2598-104, Final Report, May, 1998, 1-82.
CPSC (1998). The Risk of Chronic Toxicity Associated with Exposure to Diisononyl Phthalate (DINP) in Children's Products. Unpublished Report.
Croudace CP, Williams NJ, Shearing JM (1995). Chronic Toxicity to Daphnia Magna. Brixham Environmental Laboratories. Zeneca Ltd., Report No BL5607/B.
CSTEE (1998). Phthalate migration from soft PVC toys and child-care articles. EU Scientific Committee on Toxicity, Ecotoxicity and the Environment (CSTEE). Opinion expressed at the CSTEE third plenary meeting Brussels, 24 april 1998.
De Coste (1968). Soil burial resistance of vinyl chloride plastics. I & EC Product Research and Development 7(4), 238-247.
Deisinger PJ et al. (1998). In vivo percutaneous absorption of 14C DEHP from 14C DEHP plasticised polyvinyl chloride film in male Fisher 344 rats. Food Chem. Toxicol. 36(6), 521-527.
De Coste (1971). Effect of soil burial exposure on the properties of plastics for wire and cable. The Bell System Technical Journal 51(1), 63-86.
De Foe DL, Holcombe GW, Hammermeister DE, Biesinger KE (1990). Solubility and toxicity of eight phthalate esters to four aquatic organisms. Environ. Toxicol. Chem. 9, 623-636.
Dirven HAA, van den Broek PHH, Arends AMM, Nordkamp HH, de Lepper AJGM, Henderson PTh, Jongeneelen FJ (1993). Metabolites of the plasticiser di(2-ethylhexyl)phthalate in polyvinylchloride processing industries. Int. Arch. Occup. Environ. Health 64, 549-554.
Dostal A et al. (1987). Hepatic peroxisome proliferation and hypolipidemic effects of DEHP in neonatal and adult rats. Toxicol. Appl. Pharmacol. 87, 81-90.
Earl Gray Jr. L, Wolf C, Lambright C, Mann P, Price M, Cooper RL, Ostby J (1999). Administration of potentially antiandrogenic pesticides (Procymidone, linuron, iprodione, chlozolinate, p,p’-DDE and ketococonazole) and toxic substances (DBP and DEHP, PCB 19 and ethane dimethane sulphonate) during sexual differentiation produces diverse profile of reproductive malformations in the male rats. Toxicology and Industrial Health 15, 94-118.
Earl Gray Jr L, Ostby J, Furr J, Price M, Rao Veeramachaneni DN, Parks L (2000). Perinatal exposure to the phthalates DEHP, BBP, and DINP, but not DEP, DMP, or DOTP, alters sexual differentiation of the male rat. Toxicological Sciences 58, 350-365.
Eastman Kodak (1992). A subchronic (4-week) dietary oral toxicity study of di(2-ethylhexyl) phthalate in B6C3F1 mice.
EC (1996). Technical Guidance Document on Risk Assessment in support of Commission Directive 93/67/EEC on Risk assessment for new notified substances and Commission Regulation (EC) 1488/94 on Risk assessment for existing substances. Parts 1-4. European Commission (EC), Office for Official Publications of the EC, Luxembourg.
EC (1999). Risk Assessment of Dibutylphthalate, CAS-No: 84-74-2. European Commission (EC), DG XI, draft version of May 1999.
EC (2001). Risk Assessment of Bis(2-ethylhexyl)Phthalate, CAS-No: 117-81-7. European Commission (EC), DG XI, draft version of September 2001.
ECETOC (1993). Percutaneous Absorption. European Centre for Ecotoxicology and Toxicology of Chemicals (ECETOC), Monograph No. 20, Bruxelles, August 1993.
ECPI (1996). European Council for Plasticisers and Intermediates (ECPI), Personal Communication.
ECPI (1997a). Existing Substances Risk Assessment for Diisononylphthalate (DINP) - CAS N°s 68515-48-0; 28553-12-0. European Council for Plasticisers and Intermediates (ECPI), November 1997.
264

CHAPTER 6. REFERENCES
ECPI (1997b). European Council for Plasticizsers and Intermediates (ECPI), Information letter of D. Cadogan to the Ministère de l'Environnement and to the Institut National de Recherche et de Sécurité, on the differences between the various DINPs, Brussels, 22 sept. 1997.
ECPI (1998a). European Council for Plasticisers and Intermediates (ECPI). ECPI Position on Water Solubility, July 1998.
ECPI (1998b). European Council for Plasticisers and Intermediates (ECPI), ECPI Position and Response to KEMI preliminary draft DEHP Risk Assessment, Personal Communication from November 1998.
ECPI (1999). European Council for Plasticisers and Intermediates (ECPI), ECPI Position and Response to KEMI preliminary draft DEHP Risk Assessment, Personal Communication from May 1999.
EG&G Mason Research Institute (1980). Salmonella/Mammalian-Microsome Plate Incorporation Mutagenesis Assay. Unpublished Laboratory Report from EG&G Mason Res. Inst. submitted to Tenneco Chemicals, 12/10/80.
EG&G Mason Research Institute (1981). Evaluation of Test Article R-1218 (MRI#549) for Mutagenic Potential Employing the L5178Y TK+/- Mutagenesis Assay. Unpublished Laboratory Report from EG and G Mason Res. Inst. for Tenneco Chemicals, 2/12/81.
Elf Atochem (1997). Analyse des phthalates dans l’estuaire de la Seine. Centre d’application de Levallois, Service Analyse Environnement, Internal Report 97/SAE8/0544/PL, 10/04/1997.
Ellington JJ (1999). Determination of the octanol/water partition coefficients and water solubilities of di-n-hexyl, di-n-octyl and di-n-decyl phthalates by the "slow-stirring" and "no-stirring" methods. Chem. Eng. Data 44, 1414-1418.
Elsisi A, Carter DE, Sipes IG (1989). Dermal absorption of phthalate diesters in rats. Fund. Appl. Toxicol. 12, 70-77.
Ema M, Miyawaki E, Kawashima K (2000). Critical period for adverse effects on developmental of reproductive system in male offspring of rats given DBP during late pregnancy. Toxicology letter 111, 271-278.
Environ Corporation (1988). Indoor DEHP Air Concentrations Predicted after DEHP Volatilizes from Vinyl Products. Report prepared for CMA, Washington, DC.
Experimental Pathology Laboratories (1999). Histopathology Peer Review and Pathology Working Group Review of Selected Lesions of the Liver and Spleen in Male and in Female F344 Rats Exposed to DINP. EPL Project Number 303-013, Pathology Report.
Exxon Biomedical Sciences (1986). Chronic Toxicity/Oncogenicity Study in F-344 Rats. Test Material: MRD-83-260. Project No 326075 performed at Exxon Biomedical Sciences, Inc., Unpublished Laboratory Report, January 13, 1986.
Exxon Biomedical Sciences (1992). Dermal Sensitisation Test in the Guinea Pig (Buehler method). Project performed at Exxon Biomedical Sciences, Inc., Report submitted to Exxon Chemical International, Inc., October 8, 1992.
Exxon Biomedical Sciences (1994). Developmental Toxicity Study in Rats with Diisononyl Phthalate (DINP; MRD-92-455). Project No 145534 performed for Exxon Chemical Company and Exxon Chemical International, Inc., Unpublished Laboratory Report from Exxon Biomedical Sciences, Inc., November 30, 1994.
Exxon Biomedical Sciences (1995). Ready Biodegradability, Manometric Respirometry Test, Unpublished Report No. 199894A.
Exxon Biomedical Sciences (1996a). Water Solubility. Report No. 199638.
Exxon Biomedical Sciences (1996b). Ready Biodegradability, Modified Sturm Test. Unpublished Report No. 95#5A, 21.3.96.
Exxon Biomedical Sciences (1996c). Earthworm limit test. Unpublished Report 199692 (9/7/1996), East Millstone, NJ.
Exxon Biomedical Sciences (1996d). Seed Germination Limit Test with Rye Grass and Lettuce, East Millstone, NJ, Unpublished Report n° 199674.
265

EU RISK ASSESSMENT REPORT – DINP FINAL REPORT, 2003
Exxon Biomedical Sciences (1996c). Seed Germination Limit Test with Ryegrass and Lettuce. Unpublished Report 199674, 9/7/1996, East Millstone, NJ.
Exxon Biomedical Sciences (1996f). Primary Dermal Irritation Study in the Rabbit. Performed at Exxon Biomedical Sciences, Inc. for Exxon Chemical Europe, January 26, 1996.
Exxon Biomedical Sciences (1996g). Microbiological Mutagenesis in Salmonella Mammalian Microsome Plate Incorporation Assay (MRD 95-389). Project Number 138925, performed by Exxon Biomedical Sciences, Inc. for Exxon Chemical Europe, March 8, 1996.
Exxon Biomedical Sciences (1996h). In vitro Chromosomal Aberration Assay in Chinese Hamster Ovary (CHO) Cells (MRD 95-389). Project Number 138932, performed by Exxon Biomedical Sciences, Inc. for Exxon Chemical Europe, March 8, 1996.
Exxon Biomedical Sciences (1996i). Reproduction Toxicity Study in Rats with Diisononyl Phthalate (DINP; MRD-92-455). Project Number 145535 from Exxon Biomedical Sciences, Inc. submitted to Exxon Chemical company and Exxon Chemical Europe, Unpublished Laboratory Report, March 8, 1996.
Exxon Biomedical Sciences (1996j). Two Generation Reproduction Toxicity Study in Rats with Diisononyl Phthalate (DINP; MRD-92-455). Project from Exxon Biomedical Sciences Inc submitted to Exxon Chemical Company and Exxon Chemical Europe, Unpublished Laboratory Report, February 29, 1996.
Exxon Biomedical Sciences (1997a). Ready Biodegradability: OECD 301F. Manometric Respirometry Test. Unpublished Report 114994A, March 6, 1997.
Exxon Chemical Corporation (1997). Existing Substances Risk Assessment for Diisononyl Phthalate (DINP) - CAS n° 68515-48-0 and 28553-12-0. Unpublished Report.
Exxon Chemical Europe (1996c). Safety data sheet Jayflex DINP (March 21, 1996; 8 pages). Appendix 5 of the “Exxon Chemical confidential dossier”, Brussels, March 21, 1996.
Exxon Biomedical Sciences (1997b). Ready Biodegradability: OECD 301F. Manometric Respirometry Test. Unpublished Report 114794A, March 6, 1997.
Exxon Biomedical Sciences (1997c). An Assessment of the Microbial Toxicity of Di-iso-nonyl and Di-iso Decyl Phthalate Ester Plasticizer. Draft Report.
Exxon Biomedical Sciences (1999a). Lettuce, Seed Germination and Growth Test. Unpublished Draft Report 199674C, June 23, 1999.
Exxon Biomedical Sciences (1999b). Microbial Respiration Inhibition in Soil. Unpublished Draft Report 199694B. May 7, 1999.
Exxon Chemical (1995). Safety data sheet Jayflex DINP, Nov. 2, 95.
Exxon Chemical Europe (1992a). Technical data sheet Jayflex DINP-S (July 1992; 1 page). Appendix 3 of the “Exxon Chemical confidential dossier”, Brussels, March 21, 1996.
Exxon Chemical Europe (1992b). Safety data sheet Jayflex DINP-S (Aug. 16, 1992; 7 pages). Appendix 6 of the “Exxon Chemical confidential dossier”, Brussels, March 21, 1996.
Exxon Chemical Europe (1994). Technical data sheet Jayflex DINP (May 1994; 1 page). Appendix 2 of the “Exxon Chemical confidential dossier”, Brussels, March 21, 1996.
Exxon Chemical Europe (1996a). Proprietary Dossier. Appendix 1 of the “Exxon Chemical confidential dossier”, Brussels, March 21, 1996.
Exxon Chemical Europe (1996b). Letter of Exxon Chemical Holland to Exxon chemical ECE (March 18, 1996; 1 page) concerning exposure monitoring results. Appendix 13 of the “Exxon Chemical confidential dossier”, Brussels, March 21, 1996.
Exxon Chemical Europe (1996d). Phthalates emissions during DINP/DIDP production (1996; 2 pages). Unpublished document, Appendix 15 of the “Exxon Chemical confidential dossier”, Brussels, March 21, 1996.
Exxon Chemical Europe (1999). Personal communication by T Parkerton, 19/8/1999.
Exxon Corporation (1983). Representative Post and Area Monitoring for DHP, DIHP, DINP and DIDP at the OXO Loading Racks. Forbes SR, Phillips RD. Memorandum 781490 (Unpublished Document), May 2, 1983.
266

CHAPTER 6. REFERENCES
Fairbanks BC, O’Connor GA, Smith SE (1985). J. Environ. Qual. 14(4), 479-483.
Fawell, JK, Sheahan D, James HA, Hurst M, Scott S (2001). Oestrogens and oestrogenic activity in raw and treated water in Severn Trent water. Water Research 35(5), 1240-1244.
Forshaga (1996). Mjukgöraremission vid Tvätt av PVC-Golv. Rapport fran Forbo-Forshaga 1996-04-30 (in Swedish).
Furtmann K (1993). Phthalates in the Aquatic Environment, PhD dissertation, Regional Water and Wastewater Authority, Nordrhein-Westfalen.
Furtmann K (1994). Phthalates in surface water - A method for routine trace level analysis. Fresenius J. Anal. Chem. 348, 291-296.
Gilioli R, Bulgheroni C, Terrana T, Filippini G, Massetto N, Boeri R (1978). Studio neurologico trasversale e longitudinale di una popolazione operaia addetta alla produzione di ftalati. Dati preliminari. Med. Lavoro 69, 620-631.
Hazleton (1969). Repeated Dermal Application - Rabbits MRD-69-4. Final Report from Hazleton Laboratories, Inc. submitted to Esso Research and Engineering Company. Unpublished Results, Summary, August 1, 1969, Linden, New Jersey.
Hazleton (1972). Metabolism Study of 14C Phthalate Ester in Rats. Unpublished Laboratory Report from Hazleton Laboratories submitted to Esso Research and Engineering Company,. Final Report, September 25, 1972.
Guy RH, Hadgraft J (1988). Physicochemical aspects of percutaneous penetration and its enhancement. Pharmaceut. Res. 5(12), 753-758.
Haertel GH (1985). Low-volatility polar organic solvents for sulfur dioxide, hydrogen sulfide and carbonyl sulfide. J. Chem. Eng. Data 30, 57-61.
Hagedorn-Leweke U, Lippold BC (1995). Absorption of suscreens and other compounds through humand skin in vivo: derivation of a method to predict maximum fluxes. Pharmaceut. Res. 12(9), 1354-1360.
Hagmar L, Akesson B, Nielsen J, Andersson C, Linden K, Attewell R, Möller T (1990). Mortality and cancer morbidity in workers exposed to low levels of vinyl chloride monomer at a polyvinyl chloride processing plant. Am. J. Ind. Med. 17, 553-565.
Hannay JW and Millar DJ (1986). Phytotoxicity of phthalate plasticizers 1. Diagnosis and commercial implications. J. Exp. Bot. 37(179), 883-897.
Hardwick RC, Cole RA, Fyfield TP (1984). Injury to and death of cabbage (Brassica oleracea) seedlings caused by vapours of di butyl phthalate emitted from certain plastics. Ann. Appl. Biol. 105, 97-105.
Harris RS et al. (1997). The oestrogenic activty of phthalate esters in vitro. Environ. Health Perspect. 105(8), 802-811.
Hayes AW et al. (1994). Principles and Methods of Toxicology. Third edition. Raven Press New York, 989-1039.
Hazleton (1968a). Acute Dermal Application - Rabbits. MRD 68-27, MRD 68-28, MRD 68-29, MRD 68-30. Unpublished Laboratory Report from Hazleton Laboratories, Inc. submitted to Esso Research and Engineering Company, May 20, 1968.
Hazleton (1968b). Acute Eye Application - Rabbits. MRD 68-27, MRD 68-28, MRD 68-29, MRD 68-30. Unpublished Laboratory Report from Hazleton Laboratories, Inc. submitted to Esso Research and Engineering Company, May 20, 1968.
Hazleton (1968c). Acute Oral Administration - Rats. MRD 68-27, MRD 68-28, MRD 68-29, MRD 68-30. Unpublished Laboratory Report from Hazleton Laboratories, Inc. submitted to Esso Research and Engineering Company, May 20, 1968.
Hazleton (1971a). Thirteen Week Dietary Administration - Dogs. MRD-70-46 (Diisononyl phthalate). Unpublished Laboratory Report from Hazleton Laboratories, Inc. submitted to Esso Research and Engineering Company, January 28, 1971.
Hazleton (1971b). Three-Month Dietary Administration - Rats. MRD-70-46 (diisononyl phthalate). Project N° 145-475, performed by Hazleton Laboratories, Inc. and submitted to Esso Research and Engineering Company. January, 1971.
267

EU RISK ASSESSMENT REPORT – DINP FINAL REPORT, 2003
Hazleton (1980a). Acute Inhalation Toxicity Study in Rats, DINP. Final Report from Hazleton Laboratories America, Inc. submitted to Nissan Chemical Industries, Ltd.,Tokyo, Japan,. Unpublished Results, December 18, 1980.
Hazleton (1980b). Acute Oral Toxicity Study in Rats, DINP. Final Report. Project No 2096-101 performed by Hazleton Laboratories America, Inc. submitted to Nissan Chemical Industries, Ltd, Tokyo, Japan, Unpublished Laboratory Report, August 29, 1980.
Hazleton (1981a). Thirteen-Week Toxicity Study in Rats, DINP., Final Report submitted to Nissan Chemical Industries, Ltd., Tokyo, Japan, Unpublished Results, September 15, 1981.
Hazleton (1981b). Teratology Study in Rats DINP. Project N° 2096-103 from Hazleton Laboratories America, Inc. submitted to Nissan Chemical Industries, Ltd., Tokyo, Japan, Final Report, March 25, 1981.
Hazleton (1986a). Chronic Feeding Study in Fischer 344 Rats. MRD-83-260. Final Pathology Report from Hazleton Laboratories America, Inc. submitted to Exxon Biomedical Sciences Inc., April 3, 1986.
Hazleton (1986b). Four Final Mutagenicity Reports Regarding Diisononyl Phthalate, Di-(heptyl, nonyl, undecyl) Phthalates, Diisodecyl Phthalate and Diundecyl Phthalate. Mutagenicity of 1J in a Mouse Lymphoma Assay. HBC Unpublished Laboratory Report from Hazleton Biotechnologies Company submitted to the Chemical Manufacturers Association, Project No 20989, Genetics assay No 7158, Final Report, June 1986.
Hazleton (1991a). A Subchronic (13-week) Dietary Oral Toxicity Study of Di(isononyl)Phthalate in Fischer 344 Rats with attachments and cover letter dated 082291. Unpublished Laboratory Report from Hazleton Laboratories submitted to Aristech Chem. Corporation.
Hazleton (1991b). A Subchronic (4-week) Dietary Oral Toxicity Study of Di(isononyl)Phthalate in B6C3F1 Mice (final report) with cover sheet dated 052991. Unpublished Laboratory Report from Hazleton Laboratories submitted to Aristech Chemical Corporation. HWA study No 2598-100, Study completion date: April 22, 1991.
Hazleton (1992). A 13-Week Subchronic Dietary Oral Toxicity Study in Mice with Di(isononyl)Phthalate Including Ancillary Hepatocellular Proliferation and Biochemical Analyses. Hazleton Project HWA 2598-103. 1992.
Hellwig J, Jäckh R (1997a). Differential prenatal toxicity of one straight-chain and five branched-chain primary alcohols in rats. Food and Chemical Toxicology 35, 489-500.
Hellwig J, Freudenberg H, Jäckh R (1997b). Differential prenatal toxicity of branched phthalate esters in rats. Food and Chemical Toxicology 35, 501-512.
Hendriks AJ, Maas-Diepeveen, Noordsij A, Van der Gaag MA (1994). Monitoring response of XAD-concentrated water in the Rhine delta: a major part of the toxic compounds remains unidentified. Wat. Res. 28, 581-598.
Hoechst AG (1973). Genomoll 150. Di-(isononyl)-phthalat. Weichmacher für Polyvinylchlorid (PVC). Document mentioning WDP/LD C 6 Firmenschriftensammlung, 30. MRZ. 1973.
Howard PH, Banerjee S, Robillard KH (1985). Measurement of water solubilities, octanol/water partition coefficients and vapor pressures of commercial phthalate esters. Environ. Toxicol. Chem. 4, 653-661.
HSDB (1997). Diisodecylphthalate. Canadian Centre for Occupational Health and Ssafety, Hazardous Substances Data Bank (HSDB), Issue 97-3, August 1997.
Hill Top Research (1995a). Evaluation of Primary Irritation Potential in Humans (single 24-hour application). Performed by Hill Top Research, Inc. for Exxon Biomedical Sciences, Inc. July 20, 1995.
Hill Top Research (1995b). Repeated Insult Patch Test (Modified Draize Procedure). Performed by Hill Top Research, Inc. for Exxon Biomedical Sciences, Inc. Report No 95-1641-70B, C, October 1995.
Hoechst AG (1990). Review Hoechst Chemikalien, Genomoll 180 (11/1990).
Hoechst AG. Technical data sheet Genomoll 160 (CAS 28553-12-0). Undated and unreferenced document (> 14.03.1990).
Horne JD, Swirsky MA, Hollister TA, Oblad BR, Kennedy JH (1983). Aquatic Toxicity Studies of Five Priority Pollutants. NUS Corporation, Report No. 4398, Houston, TX.
HSE (1997a). Occupational Exposure Limits 1997. Health and Safety Executive (HSE), Publication EH 40/97.
268

CHAPTER 6. REFERENCES
HSE (1997b). Substance Di isooctylphthalate. Health and Safety Executive (HSE), Personal communication, Short Substance Report (11/3/97).
Hüls AG (1985a). Akute orale Toxizität von Vestinol (R)9 für Ratten. Bericht Nr. 0436.
Hüls AG (1985b). Prüfung der akuten Hautreizwirkung von Vestinol (R) 9 am Kaninchen. Bericht Nr. 0437, Unpublished Results.
Hüls AG (1985c). Prüfung der akuten Augen- und Schleimhautreizwirkung von Vestinol (R) 9 am Kaninchen. Bericht Nr. 0438, Unpublished Results.
Hüls AG (1986). Technical data sheet Vestinol 9 (07.86).
Hüls AG (1992). A 14-Days Oral Toxicity Study with Three Different Types of Di-isononylphthalates in Female Fischer 344 Rats; Final Report SA-92/0062. Enzyme Activities in Liver Fractions from Female Fischer-344 Rats Treated with Three Isomeric Di-isononyl Phthalates (14-day oral gavage study): Final Report BT-92/0062. Dodecanoic Acid 12-Hydroxylase Activity in Liver Microsomes from Female Fischer-344 Rats Treated with Three Isomeric Di-isononyl Phthalates (14-day oral gavage study) - Results of Individual Animals and Statistical Evaluation; Final Report BT-92/0062-1.
Hüls AG (1995a). EG-Sicherheitsdatenblatt Vestinol 9. Ref. DE 100 457/07, 08.06.95.
Hüls AG (1995b). Bestimmung der Biologischen Abbaubarkeit von Vestinol 9 im Modifizierten Sturm Test. Unpublished Report ST-91/95, 6.3.95.
Hüls AG (1995c). Bestimmung der Akuten Wirkungen von Vestinol 9 Gegenüber Fischen. Unpublished Report FK 1327, 8.6.95
Hüls AG (1995d). Determination of the Effects of Vestinol 9 on the Swimming Behaviour of Daphnia Magna. Unpublished Report DK 632, 3.4.95.
Hüls AG (1995e). Determination of the Effect of Vestinol 9 on the Growth of Scenedesmus Subspicatus. Unpublished Report AW 393, 21.1.95.
Hüls AG (1996a). Communication from the Department of Product Security, Data on Vapour Pressure. Unpublished Report DVT 3, 15.07.1996.
Hüls AG (1996b). EU Risk Assessment DINP / DIDP. Letter of 31 July 1996 to Exxon chemical France.
Hüls AG (1998). Acute Toxicity of DEHP Towards Earthworms (Eisenia foetida). Unpublished Report RW 71, 3/4/1998.
IARC (1995). Peroxisome Proliferation and its Role in Carcinogenesis. International Agency for Research on Cancer (IARC), Working Group of 7-11 December 1994, Report N° 24, Lyon, France, 11.
ICI PLC (1989). Hexaplas DIDP - Acute Toxicity to Rainbow Trout. BLS/B/0747.
ICI PLC (1994). Product Safety Data sheet Emkarate 9120 (Diisononyl phthalate). Revision 02, 08/94.
Huntingdon Life Sciences (1998). DINP: Toxicity Study by Oral Gavage Administration to Marmosets for 13 Weeks. Report n° 98 3532, October 1998.
Huntingdon Research Centre (1994). Jayflex DINP. Skin Sensitisation in the Guinea Pig. Performed at Huntingdon Research Centre and submitted to Exxon Chemical International, Inc. Report November 1994.
IARC (1990). Pathology of Tumours in Laboratory Animals, 1: Tumours of the Rat. V Turusov V, Mohr U (eds). International Agency for Research on Cancer (IARC), N°99, 2nd edition, Lyon, France.
IARC (1999). Species Differences in Thyroid, Kidney and Urinary Bladder Carcinogenesis. Capen CC et al. (ed), International Agency for Research on Cancer (IARC), Lyon, France, 147, 95-118.
ICI Group Environmental Laboratory (1990). Letter to ICI Chemicals and Polymers Limited. Dated 15.8.90, reference DB/LC.
ICI PLC (1984). Assessment of the Biodegradability of Di-2 Ethylhexyl Phthalate (DEHP) and Di-isodecyl Phthalate (DIDP) by a Modification of OECD Test Guideline 301C. Unpublished Study, Report No. BLS/B/0240, Brixham Laboratory.
269

EU RISK ASSESSMENT REPORT – DINP FINAL REPORT, 2003
Industrial Bio-test Laboratories (1975a). Acute Vapour Inhalation Toxicity Studies in Albino Rats. Unpublished Laboratory Report (IBT No 663-06262) from Industrial Bio-test Laboratories, Inc. submitted to Exxon Research and Engineering Company, April 18, 1975.
Industrial Bio-test Laboratories (1975b). Acute Vapour Inhalation Toxicity Studies in Mice. Unpublished Laboratory Report from Industrial Bio-test Laboratories, Inc. submitted to Exxon Research and Engineering Company, April 18, 1975.
Industrial Bio-test Laboratories (1975c). Acute Vapour Inhalation Toxicity Studies in Guinea Pigs. Unpublished Laboratory Report from Industrial Bio-test Laboratories, Inc. submitted to Exxon Research and Engineering Company, April 18, 1975.
INRS (1997). Occupational exposure to phthalates. COLCHIC national database query from 1987. Personal communication.
INRS (1998). Personal communication from M. Reynier.
IPCS (1997). Di-n-butyl phthalate. World Health Organisation (WHO), International Programme on Chemical Safety (IPCS), Environmental Health Criteria 189, Geneva.
Johnson BT, Heitkamp MA, Jones, JR (1984). Environmental and chemical factors Influencing the biodegradation of phthalic esters in freshwater sediments. Environmental Pollution (Series B) 8, 101-118.
Journal Officiel (1994). Arrêté du 9 novembre 1994 relatif aux matériaux et objets en caoutchouc au contact des denrées, produits et boissons alimentaires. Paris.
Kalimi GH, Lington AW, Nikiforov AI, Klaunig J (1995). Gap junction assay in rodent hepatocytes: a good predictor for liver cancer in rodents for phthalate esters. The Toxicologist 15(1) 1469.
Kamendulis LM, Isenberg JS, Smith JH, Ackley DC, Pugh G, Lington AW, Klaunig JE (2000). Dose-response and time course studies on DEHP on hepatic peroxisomal β-oxidation (PBOx), gap junction intercellular communication (GJIC) and DNA synthesis in the rat, mouse and hamster liver. Toxicological Sciences 56(1), 73-85.
KEMI (1997). Collection of exposure information on phase 5 chemicals. Swedish national chemicals inspectorate (KEMI), Letter of 24 March 1997 of I. Lundberg to SIDS contact points and OECD secretariat. Ref. 322-25-97, with annexes.
King DA (1996). Occupational exposure to phthalate esters with specific reference to di-ethyl hexyl phthalate (DEHP), di-butyl phthalate (DBP), di-isononyl phthalate (DINP), and di-isodecyl phthalate (DIDP). 17 May 1996.
Kirchmann H, Tengswed A (1991). Organic pollutants in sewage sludge. 2. Analysis of barley grains grown on sludge-fertilized soil, Swedish J. agric. Res. 21 115-119.
Kirchmann H, Aström H, Jönsäll G (1991). Organic pollutants in sewage sludge. Swedish J. Agric. Res. 21 107-113.
Knudsen FR and Pottinger TG (1999). Interaction of endocrine disrupting chemicals, singly and in combination with estrogen-, androgen-, and corticosteroid-binding sites in rainbow trout (Oncorhynchus mykiss). Aquatic Toxicology 44, 159-170.
Kolb M, Welte K, Mettenleiter S, Trinkmann A (1997). Bestimmung von Phthalsäureestern in Klärschlämmen mittels GC/MS. Wasser and Boden, 49. Jahrg. 5/1997, 57-60.
Larsson P, Thuren A, Gahnstrom G (1986). Phthalate esters inhibit microbial activity in aquatic sediments. Environ. Poll. (Series A) 42, 223-231.
Lee ST et al. (1995). Targeted disruption of the alpha isoform of the peroxisome proliferator activated-receptor gene in mice results in abolishment of the pleiotroic effects of the peroxisome proliferators. Mol. Cellular biol. 15, 3012-3022.
Legrand P (1996). Plasticizer Consumption and End-use Patterns in Western Europe. ECPI document, 18.03.1996.
Letinski DJ, Connelly MJ, Parkerton TF (1999). Slow-stir Water Solubility Measurements for Phthalate Ester Plasticisers. Proceedings SETAC-EUROPE, May 25-29, 1999, Leipzig, Germany.
270

CHAPTER 6. REFERENCES
LGC (1998). Laboratory-Based Agitation Methods for the Determination of Phthalate Plasticiser Migration from PVC Toys and Childcare Articles. Consumer Safety Research Report, LGC Technical Report Number LGC/1998/DTI/009.
Lin LI (1986). The Effect of 9 Different Plasticizers on Rat Hepatic Peroxisome Proliferation (21-day feeding studies). Unpublished Report of the Travenol Laboratories, Round lake.
Lin LI (1987). The use of multivariate analysis to compare peroxisome induction data on phthalate esters in rats. Toxicol. and Industrial Health 3(2), 25-48.
Lington A, Bird M, Plutnick R and Quance J (1987). Evaluation of the chronic oral toxicity and carcinogenic potential of diisononyl phthalate (DINP) in rats. Toxicologist 7(1), #405, 101.
Lington AW, Bird MG, Plutnick RT, Stubblefield WA, Scala RA (1997). Chronic toxicity and carcinogenic evaluation of diisononylphthalate in rats. Fundamental and Applied Toxicology 36(1), 79-89.
Lington AW, Kalimi GH, Nikiforov AI, Klaunig JE (1994). Effects of di-2-ethyl hexyl phthalate and four metabolites on rodent hepatocyte gap junctional intercellular communication. The Toxicologist 14(1), #136 (abstract).
Liss G, Albro PW, Hartle RW, Stringer WT (1985). Urine phthalate determinations as an index of occupational exposure to phthalic anhydride and di(2-ethylhexyl)phthalate. Scand. J. Work Environ. Health 11, 381-387.
Litton Bionetics (1981a). Evaluation of R-1218 in the Primary Rat Hepatocyte Unscheduled DNA Synthesis Assay. Unpublished Laboratory Report from Litton Bionetics submitted to Tenneco Chemicals Inc. LBI Project No 20991, Final Report, February 1981.
Litton Bionetics (1981b). Evaluation of R-1271 in the In Vitro Transformation of Balb/3T3 Cells Assay. Unpublished Laboratory Report from Litton Bionetics submitted to Tenneco Chemicals. Genetics assay No 5618, LBI Project N° 20992, Final Report, July 1981.
Litton Bionetics (1981c). Evaluation of R-1218 in the In Vitro Transformation of Balb/3T3 Cells Assay. Unpublished Laboratory Report from Litton Bionetics submitted to Tenneco Chemicals Company, LBI Project No 20992, Final Report, May 1981.
Litton Bionetics (1985a). Evaluation of 1J in the Mouse Lymphoma Toxicity Assay. Unpublished Laboratory Report from Litton Bionetics Inc. submitted to Chemical Manufacturers Association, Genetics Assay No 7158, LBI Project No 20989, Final report, July 1985.
Litton Bionetics (1985b). Evaluation of 1J in the In Vitro Transformation of Balb-3T3 Cells Assay. Unpublished Laboratory Report from Litton Bionetics Inc. submitted to Chemical Manufacturers Association. Genetics Assay No 7158, LBI Project No 20992, Final Report, April, 1985.
Lundberg P, Löf A, Johanson G, Wennberg A, Högberg J, Holmberg B (1991). New Swedish occupational standards for some organic solvents. Am. J. Ind. Med. 19, 559-567.
Maag J, Lökke H (1991). Land Treatment of DEHP-contaminated Soils. Altlastensanierung 90, Int. KfK/TNOc Kongr., 3rd, Meeting Date 1990, 1079-87. Arendt, Friedrich Hinsenveld M, Van der Brink WJ (eds), Bundesminist. Forsch. Technol., Bonn, Germany.
MAFF (1995). Phthalates in Paper and Board Packaging. Ministry of Agriculture, Fisheries and Food (MAFF), Food Surveillance Information Sheet No 60, UK.
MAFF (1996a). Phthalate in Food. Ministry of Agriculture, Fisheries and Food (MAFF), Food Surveillance Information Sheet No 82, UK.
MAFF (1996b). Phthalates in Infant Formulae. Ministry of Agriculture, Fisheries and Food (MAFF), Food Surveillance Information Sheet No 83, UK.
MAFF (1998). Phthalates in Infant Formulae – Follow-up Survey. Ministry of Agriculture, Fisheries and Food (MAFF), Food Surveillance Information Sheet No 168.
MAFF (2000). Ministry of Agriculture, Fisheries and Food (MAFF). Personal communication (e-mail) 07/20/2000, UK.
Mc Kee RH et al. (will be published). Species specificity for hepatic effects of DEHP on gap junction intercellular communication (GJIC), DNA synthesis and peroxisomal beta oxidation (PBOx).
271
EU RISK ASSESSMENT REPORT – DINP FINAL REPORT, 2003
Malisch R, Schultz E, Acker L (1981). Chloroganische Pestizide, polychlorierte Biphenyle und Phthalate in Sedimenten aus Rhein und Neckar, Chemiker Zeitung 105, 187-194.
Mayer FL, Mehrle PM, Schoettgen RA (1977). Collagen metabolism in fish exposed to organic chemicals. In: Recent Advances in Fish Toxicology. Taub RA (ed), US Environmental Protection Agency (EPA), Doc. EPA 600/3-77-085, Corvalles, OR, 31-54.
McCarthy JF and Whitmore DK (1985). Chronic toxicity of di-n-butyl and di-n-octyl phthalate to Daphnia magna and the fathead minnow, Environ. Toxicol. Chem. 4, 167-179.
Miljöstyrelsen (1996). Masseströmsanalyse for Phthalater. Miljöprojekt Nr. 320, 1996. fra Miljöstyrelsen, Denmark (in Danish).
Mehrle PM, Mayer FL (1976). Di-2-Ethyl hexyl phthalate: residue dynamics and biological effects in rainbow trout and fathead minnows. In: Proceedings of University of Missouri’s Annual Conference of Trace Substances in Environmental Health, University of Missouri, Columbia, MO, 10, 519-636.
Meki JC (1999). Plania AB Lulea (Swedish plastisol processor). Personal communication.
Melnick RL, Morrissey RE, Tomaszewski KE (1987). Studies by the national toxicology program on di(2-ethylhexyl)phthalate. Toxicol. Ind. Health 3(1), 99-118.
Menzel B (1996). Workplace exposure during car underbody coating operation. ECPI document, 21.03.1996 (internal document from Hüls, 07.06.1995).
Mersiowsky I, Stegmann R, Ejlertsson J, Svensson B (1999). Long-term Behaviour of PVC Products Under Soil-Buried and Landfill Conditions, Technical University of Hambourg-Harburg, Germany & Linkoeping University Sweden, June 1999.
Microbiological Associates (1981a). Activity of T1646 in the In Vitro Mammalian Cell Transformation Assay in the Presence of Exogenous Metabolic Activation. Unpublished Laboratory Report from Microbiological Associates submitted to Tenneco Chemicals Company, MA Project No T1646.109.
Microbiological Associates (1981b). Activity of T1646 in the In Vitro Mammalian Cell Transformation Assay in the Absence of Exogenous Metabolic Activation. Unpublished Laboratory Report from Microbiological Associates submitted to Tenneco Chemicals Company, MA study No T1646.108.
Microbiological Associates (1981c). Activity of T1677 in the In Vitro Mammalian Cell Transformation Assay in the Absence of Exogenous Metabolic Activation. Unpublished Laboratory Report from Microbiological Associates submitted to Tenneco Chemicals Company, MA Project No T1677.108.
Microbiological Associates (1981d). Activity of T1646 in the In Vitro Cytogenetics Assay in Rodents. Unpublished Laboratory Report from Microbiological Associates submitted to Tenneco Chemicals Company, MA study No T1646.112.
Microbiological Associates (1982). Activity of T1674 in the In Vitro Mammalian Cell Transformation Assay in the Absence of Exogenous Metabolic Activation. Unpublished Laboratory Report from Microbiological Associates submitted to Tenneco Chemicals, Inc, MA Project No T1674.108.
Midwest Research Institute (1981a). Repeated Dose 28-Day Toxicity Study with Rodents. Unpublished Laboratory Report from Midwest Res. Inst. submitted to Tenneco Chemicals, Inc., MRI Project No 7180-B(1), September 16, 1981.
Midwest Research Institute (1981b). Acute Oral Toxicity Study in Rats of TCI Compounds: R-1268, R-1272, R-1286 and R-1287, with cover letters and index. Unpublished Laboratory Report from Midwest Res. Inst. submitted to Tenneco Chemicals, Inc., MRI Project No 7180-B(1), June 2, 1981.
Midwest Research Institute (1983). Unpublished Report prepared for Exxon Corporation (ref. 83 MRL 138), 1-13.
Midwest Research Institute (1983a). Single and Repeated Oral Dose Pharmacokinetics of 14 C-Labeled Diisononyl Phthalate, with cover letter. Unpublished Laboratory Report from Midwest Research Institute prepared for Exxon Corporation, MRI Project No 7282-B, December 19, 1983.
Midwest Research Institute (1983b). Dermal Disposition of 14C-Di-isononyl Phthalate in Rats. Unpublished Laboratory Report from Midwest Res. Inst. prepared for Exxon Corporation, MRI Project No 7572-E, Final Report August 4, 1983.
272
CHAPTER 6. REFERENCES
Milkov LE, Aldireva MV, Popova TB, Lopukhova KA, Makarenko YUL, Malyar LM, Shakhova TK (1973). Health status of workers exposed to phthalate plasticizers in the manufacture of artificial leather and films based on PVC resins. Environ. Health Perspect. 3, 175-178 [translated from Gigiena Truda 13:14 (1969)].
Mint A, Hotchkiss SAM (1993). Percutaneous absorption of dimethyl phthalate and di-n-butyl phthalate through rat and human skin in vitro. In: Prediction of Percutaneous Penetration 3(B), 646-657.
Mint A, Hotchkiss SAM, Caldwell J (1994). Percutaneous absorption of diethyl phthalate through rat and human skin in vitro. Toxicol. in vitro 8(2), pp 251-256.
Montedison, (1972) S.p.A., Divisione Petrolchimica, Technical information Nr. 2193 G (12/1972).
Mylchreest E, Sar M, Cattley RC, Foster MD (1999). Disruption of androgen regulated reproductive development by DBP during late gestation in rats is different from flutamide. Toxicology and Applied Pharmacology 156, 81-95.
Ng KME., Chu I, Bronaugh RL, Franklin CA, Somers DA (1992). Percutaneous absorption and metabolism of pyrene, benzo[a]pyrene, and di(2-ethylhexyl) phthalate: comparison of in vitro and in vivo results in the hairless guinea pig. Toxicol. Appl. Pharmacol. 115, 316-223.
NIEHS (1988). Dermal Absorption and Excretion of Phthalate Diesters and Phthalic Acid.
Nielsen J, Akesson B, Skerfving S (1985). Phthalate ester exposure - Air levels and health of workers processing polyvinylchloride. Am. Ind. Hyg. Assoc. J. 46, 643-647/
Nikiforov AI, Keller LH, Harris SB (1995). Book of Abstracts. Eurotox'95. Toxicology Letters Supplement1/78, p 61. Two generation reproduction study in rats with diisononyl phthalate (DINP).
Nikiforov AI, Koehler GD (1994). Developmental toxicity studies on diisononyl phthalate (DINP) and di-isodecyl phthalate (DIDP). Book of Abstracts - Eurotox'94, p 57.
NTP (1983). National Toxicology Program (NTP), NTP Technical Bulletin 9.
NTP-CERHR (2000). NTP-CERHR Expert Panel Report on Di isononyl Phthalate. National Toxicology Program (NTP), Center for the Evaluation of Risks to Human Reproduction (CERHR), October 2000, 37 p.
OECD (1996). Percutaneous Absorption: in vivo Method. Organization for Economic Cooperation and Development (OECD), Environment Directorate, OECD Guideline for the Testing of Chemicals, Proposal for a new guideline, Draft document.
O'Grady DP, Howard PH, Werner AF (1985). Activated sludge biodegradation of 12 commercial phthalate esters. Appl. Environ. Micro. 49(2), 443-445.
Oie L, Hersoug LG, Madsen JO (1997). Residential exposure to plasticizers and its possible role in the pathogenesis of asthma. Environ. Health Perspectives 105(9), 972-978.
OMS (1994). Directives de qualité pour l'eau de boisson. Organisation mondiale de la Santé (OMS/WHO), Genève.
Overcash, MR, Webber, JB, Tucker, W (1986). Toxic and Priority Organics in Municipal Sludge Land Treatment Systems. Unpublished Report EPA/600/2-86/010, PB 86 150208.
Parkerton T, Bowes S (1999). A Refined Assessment of Local Predicted Exposure Concentrations for Di-isononyl and Di-isodecyl Phthalate Esters in Surface Water and Sediments at Processing Sites. Exxon Biomedical Sciences, Inc., Unpublished Report, March 1999.
Parkman H, Remberger M (1995). Phthalates in Swedish Sediments. Swedish Environmental Research Institute, Stockholm, Sweden.
Pastuska G, Just U (1990). Weichmacherverlust aus langjährig freibewitterten PVC-P-Dachbahnen. Kautschuk + Gummi, Kuststoffe 43(12), 1093-1094.
Pastuska G, Kerner-Gang W, Just U (1988) Langzeitverhalten von PVC-P-Dachbahnen. Kautschuk + Gummi, Kunststofffe 41(5), 451-454.
Patyna PJ, Parkerton TF, Brown RP, Davi RA, Thomas PE, Cooper KR (1999). Dietary Diisononyl Phthalate (DINP) and Diisodecyl Phthalate (DIDP) exposure in the Japanese Medaka (Oryzias latipes) multigeneration assay. Submitted.
Payan JP (1998). Personal communication.
273

EU RISK ASSESSMENT REPORT – DINP FINAL REPORT, 2003
Pelling D, Phillips JC, Cunninghame ME (1998). Absorption of hydrophilic and lipophilic compounds through epidermal and subepidermal strata of rat skin in vitro. Toxicol. in vitro 12, 47–55.
RIVM (1997). Risk Assessment Report for Dibutylphthalate. National Institute of Public Health and Environmental Protection (RIVM), RIVM Draft Report of 17 November 1997, Bilthoven, The Netherlands.
Sherma J, Dryer J, Bouvard JJ (1986). Determination of phthalate esters in water by solid phase extraction and quantitative HPTLC. Am. Lab. 28, 30-32.
Pfannhauser W, Leitner E, Mayer I, Schaffer A (1997). Phthalate in Süsswasserfischen Österreichischer Herkunft. Schriftenreihe des Bundesministerium für Umwelt, Jugend und Familie band 18/1997.
Potts RO, Guy RH (1992). Predicting skin permeability. Pharmaceut. Res. 9(5), 663-669.
Pugh G, Isenberg J, Kamendulis L, Clare L, Brown W, Lington A, Ackley D, Smith J, Klaunig J (1999). Absence of liver effects in Cynomolgus monkeys treated with peroxisomal proliferators. The Toxicologist 48(5).
Pugh G, Isenberg J, Kamendulis L, Clare L, Brown W, Lington A, Ackley D, Smith J, Klaunig J (2000). Effects of di-isononyl phthalate, di-2-ethylhexyl phthalates, and clofibrate in Cynomolgus monkeys. Toxicological Sciences 56(1), 181-188.
Rastogi SC (1998). Gas chromatographic analysis of phthalate esters in plastic toys. Chromatographia 47(784), 724–726.
Rathleff-Nielsen B (1999). Rapport rörande Plastisolbelagd Stålplåt (about repainting steel coated with plastisol). BRN-Service. 1998.06.25 (only in Swedish).
Remberger M (2000). Personal communication 7/3/2000.
Research Institute for Chromatography (2000). Report: Overview of Phthalate Measurements in Air. Research Institute for Chromatography, Ref. ECPI\2000-12-S, Kortrijk, Belgium.
Research Institute for Chromatography (2001). Phthalate Esters in the Environment. Monitoring Program for the Determination of Phthalates in Air, Vegetation, Cattle Feed, Milk and Fish in The Netherlands. Unpublished Report. Project: O. ref: ECPI-2001-10. Kortrijk. Belgium.
Research Institute for Chromatography (2001). Phthalate Esters in the Environment. Monitoring Program for the Determination of Phthalates in Air, Vegetation, Cattle Feed, Milk and Fish in The Netherlands. Research Institute for Chromatography, Unpublished Report, Ref. ECPI-2001-10, Kortrijk, Belgium.
RIVM (1998). Phthalate Release from Soft PVC Baby Toys. National Institute of Public Health and Environmental Protection (RIVM), Report from the Dutch Consensus Group. RIVM Report 31 3320 002, Könemann WH (ed), Bilthoven, The Netherlands.
Roberts R et al. (1998). Evidence for the suppression of apoptosis by the peroxisome proliferator activated receptor alpha (PPARalpha). Carcinogenesis 19, 43-48.
Scherf (1995) Partition Coefficient n-octanol/water and Water Solubility of Phthalic Acid Ester. Unpublished Report Sh/94-24, 18.9.95, CFB, Brunsbüttel, Germany.
Schmitzer JL, Scheunert I, Korte F (1988). Fate of bis(2-ethylhexyl) [14C]phthalate in laboratory and outdoor soil-plant systems. J. Agric. Food.Chem. 36, 210-215.
Schouten MJ, Peereboom JWC, Brinkman UAT (1979). Liquid chromatographic analysis of phthalate esters in Dutch river water. Intern.J. Environ. Anal. Chem. 7, 13-23.
Scott RC, Dugard PH, Ramsey JD, Rhodes C (1987). In vitro absorption of some o-phthalate diesters through human and rat skin. Environ. Health Perspect. 74, 223-227.
Sharman M, Read WA, Castle L, Gilbert J (1994). Levels of di-(2-ethylhexyl)phthalate and total phthalate esters in milk, cream, butter and cheese. Food Addit. Contamin. 11(3), 375-382.
Shellenberg et al. (1983). Comparative 28-day oral toxicity of selected phthalate esters (abstract). The Toxicologist 3, p.157.
Short et al. (1987). Metabolic and peroxisome proliferation studies with DEHP in rats and monkeys. Toxicol. Ind. Health 3, 185-195.
274

CHAPTER 6. REFERENCES
Sjoberg P, Bondesson U, Kjellen L, Lindquist NG, Plöen L (1985). Kinetics of di-(2-ethylhexyl) phthalate in immature and mature rats and effect on testis. Acta Pharmacol. Toxicol. 56, 30-37.
Skog PJ (1999), Letter from the City Real Estate Streets and Traffic Administration in the community of Stockholm, 27 Oct. 1999.
Sloof W (1993). Meetcampagne Ftalaten tbv. Scopingdocumenten Ftalaten. Unpublished RIVM-Report 670/92 LOC/EV, July 7, 1993.
Small PA, Small KW, Cowley P (1948). The vapour pressures of some high boiling esters. Trans. Far. Soc. 44, 810-816.
Smith JH et al. (1999). Peroxisomal Proliferating Agents and Gap Junction Intercellular Communication. Toxicology Forum Meeting, Communication.
Smith JH et al. (1999). The hepatic effects of diisononyl phthalate (DINP) and related analogs in rats and mice. Toxicological Sciences 48(15), 338.
Smith JH et al. (2000). Comparative in vivo hepatic effects of diisononyl phthalate (DINP) and related C7-C11 dialkyl phthalates on gap junctional intercellular communication (GJIC), peroxisomal beta-oxidation (PBOX), and DNA synthesis in rat and mouse liver. Toxicological Sciences 54, 312-321.
Solyom P, Remberger M, Victor T (2000). Further Investigations on the Influence of Sediment-Associated Phthalate Esters (DEHP and DINP) on Hatching and Survival of the Moorfrog Rana Arvalis. IVL. Swedish Environmental Research Institute, Unpublished Report A20173, 12/9/2000.
Sullivan KF, Atlas EL, Giam CS (1982). Adsorption of phthalic acid esters from seawater. Environ. Sci. Technol. 16, 428-432.
Vainiotalo S, Pfäffli P (1990). Air impurities in the PVC plastics processing industry. Ann. Occup. Hyg. 34 585-590.
Valles EG, Laugher A, Dunn C, Cattley RC, Corton JC (1999). Role of PPAR ALPHA in hepatic resposes to diisononyl phthalate (DINP. Personal communication, CIIT, 1999.
SRC (1994). Syracuse Research Corporation, (Q)SAR programs, LOGKOW, WS/KOW, AOP.
Staples CA, Peterson DR, Parkerton TF, Adams WJ (1997). A literature eview: The environmental fate of phthalate esters. Chemosphere 35, 667-749.
Steiner I, Kubesch K, Fialala (1998). Migration of DEHP and DINP from PVC articles. Preliminary Summary, Institute of Food Chemistry and Food Technology of Austria and Consumer Council Austrian Standards Institute, Vienna.
Sten K (1998). Personal communication, Rivners AB. Stockholm, Sweden.
Stolz et al. (1985). Dermal disposition of di-isononyl phthalate (DINP) in Fischer 344 rats. The toxicologist 5(1), 246.
Sugatt RH, Grady DO, Banerjee S, Howard PH, Gledhill WE (1984). Shake flask biodegradation of 14 commercial phthalate esters. Appl. Environ. Micro. 47(4), 601-606.
Tarkett-Sommer (1999). Personal communication with Okmark P. and others (floor producer), 37271 Ronneby, Sweden.
Tienpont B, David F, Sandra P, Vanwalleghem F (2000). Evaluation of sorptive enrichment for the analysis of phthalates in air samples. Journal of Microcolumn Separations 12(4), 194-203.
Tyl RW et al. (1988). Developmental toxicity evaluation of dietary DEHP in Fischer 344 rats and CD-1 mice. Fundam. Appl. Toxicol. 10, 395-412.
Van den Dikkenberg RP, Canton HH, Mathijssen-Spiekmann LAM, Roghair CJ (1989). Usefulness of Gasterosteus aculeatus - the three Spined Stickleback - as a Test Organism in Routine Toxicity Tests. National Institute of Public Health and Environmental Protection (RIVM), Bilthoven, The Netherlands, NTIS PB90-244989.
Van den Heuvel (1999). Peroxysome proliferator-activated receptors (PPARS) and carcinogenesis. Toxicological Sciences 47, p1-8.
275

EU RISK ASSESSMENT REPORT – DINP FINAL REPORT, 2003
Vikelsoe J, Thomsen M, Johansen E (1998). Sources of Phthalates and Nonylphenoles in Municipal Wastewater. Ministry of Environment and Energy, National Environmental Research Institute (NERI), NERI Technical Report No 225, February 1998.
Vikelsoe J, Thomsen M, Johansen E, Carlsen L (1999). Phthalates and Nonylphenols in Soil. Ministry of Environment and Energy, National Environmental Research Institute (NERI), NERI Technical Report No 268.
Wams TJ (1987). Diethylhexylphthalate as an environmental contaminant-a review. Sci. Tot. Env. 66, 1-16.
Waterman SJ et al. (1999). Developmental toxicity of DIDP and DINP in rats. Reproductive Toxicology 13(2), 131-136.
Waterman SJ et al. (2000). Two-generation reproduction study in rats given DINP in the diet. Reproductive Toxicology 14(1), 21-36.
Weisser M (1992). Untersuchungen zur Belastung kommunaler Klaerschlaemme durch organische Schadstoffe. Universität Karlsruhe, Institut für Siedlungswasserwirtschaft, Abschlussbericht zum BMFT-Forschungsvorhaben 02 WS 464/8, Schriftenreihe des ISWW Karlsruhe - Band 63.
Williams MD, Adams WJ, Parkerton TF, Biddinger GR, Robillard KA (1995). Sediment sorption coefficients for four phthalate esters: experimental results and Model Theory. Environ. Toxicol. Chem. 14. 1477-1486.
Woodyatt NJ et al. (1999). The Peroxisome Proliferator (PP) Response Element Upstream of the Human Acyl CoA Oxidase Gene is Inactive Among a Sample Human Population: Significance for Species Differences in Response to PPs. Carcinogenesis 20(3), 369-72.
Yoshizawa T, Tearaura M, Morooka N (1977). Inhibitory Effect of Phthalic Acid Esters on Multiplication of a Protozoan, Tetrahymena pyriformis. Kagawa University, Technical Bulletin of the Faculty of Agriculture 28, 149-155.
Zacharewski TR, Clemons JH, Meek MD, Wu ZF, Fielden MR, Matthews JB (1998). Examination of the in vitro and in vivo estrogenic activities of eight commercial phthalate esters. Toxicological Sciences 46(2), 282-293.
Zeiger E, Haworth S, Mortelmans K, Speck W (1985). Mutagenicity testing of di(2-ethylhexyl)phthalate and related chemicals in Salmonella. Environmental Mutagenesis 7, 213-232.
276

277
AF
CA
CAS Chemical Abstract Services
Commission of the European Communities
CEPE
Chemicals Manufacturers' Association
daily food intake
ABBREVIATIONS
ACTS Advisory Committee on Toxic Substances
ADI Acceptable Daily Intake
Assessment Factor
ASTM American Society for Testing and Materials
ATP Adaptation to Technical Progress
AUC Area Under The Curve
B Bioaccumulation
BBA Biologische Bundesanstalt für Land- und Forstwirtschaft
BBP Butylbenzyl phthalate
BCF Bioconcentration Factor
BMC Benchmark Concentration
BMD Benchmark Dose
BMF Biomagnification Factor
BOD Biochemical Oxygen Demand
bw body weight / Bw, bw
C Corrosive (Symbols and indications of danger for dangerous substances and preparations according to Annex III of Directive 67/548/EEC)
CA Chromosome Aberration
Competent Authority
CEC
CEN European Standards Organisation / European Committee for Normalisation
European Committee for Paints and Inks
CMA
CMR Carcinogenic, Mutagenic and toxic to Reproduction
CNS Central Nervous System
COD Chemical Oxygen Demand
CSTEE Scientific Committee for Toxicity, Ecotoxicity and the Environment (DG SANCO)
CT50 Clearance Time, elimination or depuration expressed as half-life
d.wt dry weight / dw
dfi
D79P Di-alkyl phthalate (C7 - C9 alkyl chains)
DBP Dibutyl phthalate
DEHP Diethylhexyl phthalate
DG Directorate General

EU RISK ASSESSMENT REPORT – DINP FINAL REPORT, 2003
DIAP Di-isoamyl phthalate
DIBP Di-isobutyl phthalate
DIDP Di-isodecyl phthalate
DIN Deutsche Industrie Norm (German norm)
DINP
Explosive (Symbols and indications of danger for dangerous substances and preparations according to Annex III of Directive 67/548/EEC)
Effect Concentration measured as 10% effect
Di-isononyl phthalate
DIOP Di-isooctyl phthalate
DMP Dimethyl phthalate
DNA DeoxyriboNucleic Acid
DNHP Di-n-hexyl phthalate
DOC Dissolved Organic Carbon
DOP Di-octyl phthalate
DT50 Degradation half-life or period required for 50 percent dissipation / degradation
DT90 Period required for 90 percent dissipation / degradation
E
EASE Estimation and Assessment of Substance Exposure Physico-chemical properties [Model]
EbC50 Effect Concentration measured as 50% reduction in biomass growth in algae tests
EC European Communities
EC10
EC50 median Effect Concentration
ECB European Chemicals Bureau
ECETOC European Centre for Ecotoxicology and Toxicology of Chemicals
ECPI European Council for Plasticisers & Intermediates
ECVAM European Centre for the Validation of Alternative Methods
EDC Endocrine Disrupting Chemical
EEC European Economic Communities
EINECS European Inventory of Existing Commercial Chemical Substances
ELINCS European List of New Chemical Substances
EN European Norm
EPA Environmental Protection Agency (USA)
ErC50 Effect Concentration measured as 50% reduction in growth rate in algae tests
ESD Emission Scenario Document
EU European Union
EUSES European Union System for the Evaluation of Substances [software tool in support of the Technical Guidance Document on risk assessment]
F(+) (Highly) flammable (Symbols and indications of danger for dangerous substances and preparations according to Annex III of Directive 67/548/EEC)
FAO Food and Agriculture Organisation of the United Nations
278

ABBREVIATIONS
FELS Fish Early Life Stage
foc Organic carbon factor (compartment depending)
GLP Good Laboratory Practice
HEDSET EC/OECD Harmonised Electronic Data Set (for data collection of existing substances)
HELCOM Helsinki Commission -Baltic Marine Environment Protection Commission
HPLC High Pressure Liquid Chromatography
HPVC High Production Volume Chemical (> 1000 t/a)
HSDB Hazardous Substances Data Bank
HSE Health and Safety Executive (UK)
IARC International Agency for Research on Cancer
IC Industrial Category
IC50 median Immobilisation Concentration or median Inhibitory Concentration
ILO International Labour Organisation
IPCS International Programme on Chemical Safety
ISO International Organisation for Standardisation
IUCLID
LOEC
International Uniform Chemical Information Database (existing substances)
IUPAC International Union for Pure and Applied Chemistry
JEFCA Joint FAO/WHO Expert Committee on Food Additives
JMPR Joint FAO/WHO Meeting on Pesticide Residues
Koc organic carbon normalised distribution coefficient
Kow octanol/water partition coefficient
Kp solids-water partition coefficient
L(E)C50 median Lethal (Effect) Concentration
LAEL Lowest Adverse Effect Level
LC50 median Lethal Concentration
LD50 median Lethal Dose
LEV Local Exhaust Ventilation
LLNA Local Lymph Node Assay
LOAEL Lowest Observed Adverse Effect Level
Lowest Observed Effect Concentration
LOED Lowest Observed Effect Dose
LOEL Lowest Observed Effect Level
MAC Maximum Allowable Concentration
MATC Maximum Acceptable Toxic Concentration
MC Main Category
MITI Ministry of International Trade and Industry, Japan
MOE Margin of Exposure
279

EU RISK ASSESSMENT REPORT – DINP FINAL REPORT, 2003
MOS Margin of Safety
MW Molecular Weight
N Dangerous for the environment (Symbols and indications of danger for dangerous substances and preparations according to Annex III of Directive 67/548/EEC
NAEL No Adverse Effect Level
NOAEL No Observed Adverse Effect Level
NOEL No Observed Effect Level
NOEC
pKb
RAR
No Observed Effect Concentration
NTP National Toxicology Program (USA)
O Oxidizing (Symbols and indications of danger for dangerous substances and preparations according to Annex III of Directive 67/548/EEC)
OC Organic Carbon content
OECD Organisation for Economic Cooperation and Development
OEL Occupational Exposure Limit
OJ Official Journal
OSPAR Oslo and Paris Convention for the protection of the marine environment of the Northeast Atlantic
P Persistent
PAE Phthalic acid ester
PBT Persistent, Bioaccumulative and Toxic
PBPK Physiologically Based PharmacoKinetic modelling
PBTK Physiologically Based ToxicoKinetic modelling
PEC Predicted Environmental Concentration
pH logarithm (to the base 10) (of the hydrogen ion concentration {H+}
pKa logarithm (to the base 10) of the acid dissociation constant
logarithm (to the base 10) of the base dissociation constant
PNEC Predicted No Effect Concentration
POP Persistent Organic Pollutant
PPE Personal Protective Equipment
PTFE Polytetrafluoroethylene
QSAR (Quantitative) Structure-Activity Relationship
R phrases Risk phrases according to Annex III of Directive 67/548/EEC
Risk Assessment Report
RC Risk Characterisation
RDT Repeated Dose Toxicity
RfC Reference Concentration
RfD Reference Dose
RIVM Rijksintituut voor volksgezondheid en milieu (NL)
280

ABBREVIATIONS
RNA RiboNucleic Acid
RPE
Species Sensitivity Distribution
UDS
UVCB
VOC
Respiratory Protective Equipment
RWC Reasonable Worst Case
S phrases Safety phrases according to Annex III of Directive 67/548/EEC
SAR Structure-Activity Relationships
SBR Standardised birth ratio
SCE Sister Chromatic Exchange
SDS Safety Data Sheet
SETAC Society of Environmental Toxicology And Chemistry
SNIF Summary Notification Interchange Format (new substances)
SSD
STP Sewage Treatment Plant
Sw Water solubility
T(+) (Very) Toxic (Symbols and indications of danger for dangerous substances and preparations according to Annex III of Directive 67/548/EEC)
TDI Tolerable Daily Intake
TG Test Guideline
TGD Technical Guidance Document
TNsG Technical Notes for Guidance (for Biocides)
TNO The Netherlands Organisation for Applied Scientific Research
ThOD Theoritical Oxygen Demand
TWA Time Weighted Average
UC Use Category
Unscheduled DNA Synthesis
UN United Nations
UNEP United Nations Environment Programme
US EPA Environmental Protection Agency, USA
UV Ultraviolet Region of Spectrum
Unknown or Variable composition, Complex reaction products of Biological material
vB very Bioaccumulative
Volatile Organic Compound
vP very Persistent
vPvB very Persistent and very Bioaccumulative
v/v volume per volume ratio
w/w weight per weight ratio
WHO World Health Organization
WWTP Wastewater Treatment Plant
281

EU RISK ASSESSMENT REPORT – DINP FINAL REPORT, 2003
Xn Harmful (Symbols and indications of danger for dangerous substances and preparations according to Annex III of Directive 67/548/EEC)
Xi Irritant (Symbols and indications of danger for dangerous substances and preparations according to Annex III of Directive 67/548/EEC)
282

283
Appendix A Hypothesis of replacement of DEHP by DINP in food contact materials (exposure assessment)
As DINP has been widely used as a substitute for DEHP, in particular in toys, it may be hypothesised that the same scenario is likely to occur in food packaging. Therefore a hypothetical scenario for replacement of DEHP by DINP in food contact materials has been included for the three categories of consumers.
Adults
Since samples contained 0.3-0.7 mg DEHP/kg of wet product (MAFF, 1996a), the high level dietary intake of DEHP was estimated to be 0.7 mg/person/day, which is 12 µg/kg bw/day for a 60 kg adult, leading to an internal exposure of 6 µg/kg bw/day.
Newborns and infants
The exposure to DINP is estimated from the maximum level of DEHP detected in samples in the study from MAFF (1998): 440 µg/kg dry powder. Indeed further arguments have been provided by the MAFF in favour of a decrease of phthalate concentrations in infant formulae since 1996 (MAFF, personal communication of 07/20/2000):
• In 1997, 10 samples of infant formulae based on cows milk or soja protein were analysed in a study organised by the Utrecht Inspectorate for Health Protection. Participating laboratories used analytical methods of their own choice. The total phthalate content of the samples were some 4 to 23 times lower than found in the 1996 MAFF survey.
• Results from the analysis of samples of infant formulae commissioned at CSL in 1997 by two European manufacturers were reported to MAFF. The concentrations of total phthalates were approximately 10-times lower than found in the 1996 MAFF survey. The levels of individual phthalates were about half those found in the 1996 MAFF survey. The levels found were similar to those in the raw ingredients (milk derived ingredients, vegetable oils, etc) indicating that further contamination does not occur during the powder manufacture or by migration from the packaging materials.
• MAFF-CSL continues (up to and including 2000) to get occasional requests from industry to test formulae and formulae ingredients for phthalates and levels remain low - similar or lower than the 1998 survey data and far lower than the 1996 data.
The Dutch study, the work commissioned by manufacturers, and the 1998 MAFF study, all support the manufacturers contention that concentrations of phthalates in infant formulae are much lower than those found in 1996. [Source a and b. UK Food Advisory Committee paper FdAC/Contaminants/34. 11th December 1997. Phthalates in infant formulae - update.]
Newborns
So, based on the level of 440 µg/kg dry powder (MAFF, 1998), the maximal exposure to DINP by infant formulae for a 5.5 kg child taking 0.131 kg dry powder per day (value estimated by the MAFF), corresponds to 10.5 µg/kg bw/day. The absorption by the oral route is considered as 100% in young children.

EU RISK ASSESSMENT REPORT – DINP FINAL REPORT, 2003
Infants
The exposure to DINP present in infant formulae is also estimated from the maximum level of DEHP detected in samples in the study of MAFF (1998): 440 µg/kg dry powder. The maximal exposure to DINP by infant formulae for an 8 kg infant taking 0.141 kg of dry powder each day, corresponds to 7.8 µg/kg bw/day.
Infants are in a phase of diversification of their diet. In complement of infant formulae, an infant eats the same type of food as an adult but in a smaller quantity. In this assessment, the hypothesis is that he eats three times less than an adult does.
The high level dietary intake of DINP was estimated to be 12 µg/kg bw/day for adult. This value is equivalent to 720 µg/adult/day. Assuming that an infant eats three times less than an adult, he eats 240 µg/day, corresponding to 30 µg/kg bw/day for a 8 kg infant.
For infants, the total DINP contribution of food to oral exposure will be: 37.8 µg/kg bw/day. The absorption by the oral route is considered as 100% in young children.
Table A.1 Sum of exposures in case of replacement of DEHP by DINP in food contact materials
Sources External and internal exposure
Adults Newborns 0 – 6 months old Infants 6 months - 3 years old
External exposure
Internal exposure µg/kg bw/d
Internal exposure µg/kg bw/d
External exposure
External exposure
Internal exposure µg/kg bw/d
Building materials and furniture 40 µg/m3* 8.3 a) 40 µg/m3* 40 µg/m3* 42.6 c) 42.6c
Car and public transport interiors 40 µg/m3* 1.7 a) 40 µg/m3* 3.9 c) 40 µg/m3* 3.9c
Clothes, Gloves and footwears 0.7 Not estimated
Food and food-related uses 12 µg/kg bw/d 6 b) 10.5 µg/kg bw/d 10.5 c) 37.8 µg/kg bw/d 37.8c
16.7 57 84.3
Toys and teething rings: oral exposure dermal exposure
200
200 c)
1
200
200 c)
1
258 285.3
Total without toys
Total with toys
a) A bioavailability of 75% is considered for the inhalation route in adults b) A bioavailability of 50% is considered for the oral route in adults
c) A bioavailability of 100% is considered for infants 6 months to 3 years old and for new-borns 0 to 6 months old by oral and respiratory routes
* Concentration in air
References: see Section 6
284

285
Appendix B Hypothesis of replacement of DEHP by DINP in food contact material (risk characterisation)
As DINP has been widely used as a substitute for DEHP, in particular in toys, it may be hypothesised that the same scenario is likely to occur in food packaging. Therefore an hypothetical scenario for replacement of DEHP by DINP in food has been included for the three categories of consumers.
Adults
Table B.1 MOSs calculated for adults from various matrixes and by multiple pathways
End points Internal exposure (mg/kg bw/d)
Internal NOAEL a)
(mg/kg bw/d) MOS Internal LOAEL
(mg/kg bw/d) MOS Conclusion
RDT/Hepatic/kidney 0.017 44 1) 2,588 ii
Decrease of live birth survival indices
0.017 311 2) 18,294 ii
Reproductive toxicity: testicular effects
0.017 138 3) 8,118 ii
Developmental: visceral and skeletal variations
0.017 250 4) 14,706 ii
Developmental: decrease of bodyweight in offspring
0.017 79.5 5) 4,676 ii
1) 2-year study by oral route in rats (Aristech, 1994) 2) 1-generation study in rat in diet (Exxon Biomedical Sciences, 1996i) 3) 104 weeks, diet, mouse (Aristech, 1995c) 4) Developmental study, diet, rat (Exxon Biomedical Sciences, 1994; BASF, 1995) 5) 2-generation study, diet, rat (Exxon Biomedical Sciences, 1996j) a) NOAEL are divided by a factor 2 to take into account the bioavailability by the oral route that was the route of exposure in adult
animals in studies For all endpoints the MOSs are considered sufficient and conclusion (ii) applies for adults.
Infants
Without toys (present situation)
Table B.2 MOSs calculated for infants from various matrixes and by multiple pathways: without toys
End points Internal exposure (mg/kg bw/d)
Internal NOAELa)
(mg/kg bw/d) MOS Conclusion
RDT/Hepatic/kidney 0.084 441) 524 ii
Reproductive toxicity: testicular effects 0.084 138 2) 1,643 ii
1) 2-year study by oral route in rats (Aristech, 1994)
2) 104 weeks, diet, mouse (Aristech, 1995c) a) NOAEL are divided by a factor 2 to take into account the bioavailability by the oral route that was the route of exposure in adult animals
in studies

EU RISK ASSESSMENT REPORT – DINP FINAL REPORT, 2003
For all endpoints the MOSs are considered sufficient and conclusion (ii) applies for infants and combined exposure without toys.
With toys (foreseeable situation)
Table B.3 MOSs calculated for infants from various matrixes and by multiple pathways: with toys
End points Internal exposure (mg/kg bw/d)
Internal NOAELa)
(mg/kg bw/d) MOS Conclusion
RDT/Hepatic/kidney 0.285 441) 154 ii
Reproductive toxicity: testicular effects 0.285 138 2) 484 ii
1) 2-year study by oral route in rats (Aristech, 1994)
2) 104 weeks, diet, mouse (Aristech, 1995c) a) NOAEL are divided by a factor 2 to take into account the bioavailability by the oral route that was the route of exposure in adult animals
in studies
For all endpoints the MOSs are considered sufficient and conclusion (ii) applies for infants and combined exposure with toys.
Pertaining to reduced offspring survival observed in the one-generation rat study (Exxon Biomedical, 1996i), due to the uncertainty related to the relevance of this endpoint for infants, no formal conclusion could be drawn. Nevertheless, in spite of this uncertainty, reduced offspring survival might be taken into account for infant and considering the internal exposure of 0.285 mg/kg bw/d and the internal NOAEL of 311 mg/kg/d in rats, the MOS would be 1091; this MOS would be considered sufficient to protect infants.
Newborns
Without toys (present situation)
Table B.4 MOSs calculated for newborns exposed to DINP from various matrixes and by multiple pathways: without toys
End points Internal exposure (mg/kg bw/d)
Internal NOAELa)
(mg/kg bw/d) MOS Conclusion
RDT/Hepatic/kidney 441) 454 ii
Fertility: testicular effects 0.057 138 2) 1,423 ii
1) 2-year study by oral route in rats (Aristech, 1994)
2) 104 weeks, diet, mouse (Aristech, 1995c) a) NOAEL are divided by a factor 2 to take into account the bioavailability by the oral route that was the route of exposure in adult animals
in studies
Pertaining to reduced offspring survival observed in the one-generation rat study (Exxon Biomedical, 1996f), due to the uncertainty related to the relevance of this endpoint for infants, no formal conclusion could be drawn. Nevertheless, in spite of this uncertainty, reduced offspring survival might be taken into account for infant and considering the internal exposure of 0.084 mg/kg bw/d and the internal NOAEL of 311 mg/kg/d in rats, the MOS would be 3,700; this MOS would be considered sufficient to protect infants.
0.057
286

APPENDIX B
For all endpoints the MOSs are considered sufficient and conclusion (ii) applies for newborns and combined exposure without toys.
Pertaining to reduced offspring survival observed in the one-generation rat study (Exxon Biomedical, 1996i), due to the uncertainty related to the relevance of this endpoint for newborns, no formal conclusion could be drawn. Nevertheless, in spite of this uncertainty, reduced offspring survival might be taken into account for new-borns and considering the internal exposure of 0.057 mg/kg bw/d and the internal NOAEL of 311 mg/kg/d in rats, the MOS would be 5,456; this MOS would be considered sufficient to protect newborns.
With toys (foreseeable situation)
Table B.5 MOSs calculated for newborns exposed to DINP from various matrixes and by multiple pathways: with toys
End points Internal exposure (mg/kg bw/d)
Internal NOAELa)
(mg/kg bw/d) MOS
Conclusion
RDT/Hepatic/kidney 0.258 441) 148 ii
Reproductive toxicity: testicular effects 0.258 138 2) 463 ii
1) 2-year study by oral route in rats (Aristech, 1994)
2) 104 weeks, diet, mouse (Aristech, 1995c) a) NOAEL are divided by a factor 2 to take into account the bioavailability by the oral route that was the route of exposure in adult animals
in studies
For all endpoints the MOSs are considered sufficient and conclusion (ii) applies for newborns and combined exposure with toys.
Pertaining to reduced offspring survival observed in the one-generation rat study (Exxon Biomedical, 1996i), due to the uncertainty related to the relevance of this endpoint for newborns, no formal conclusion could be drawn. Nevertheless, in spite of this uncertainty, reduced offspring survival might be taken into account for new-borns and considering the internal exposure of 0.258 mg/kg bw/d and the internal NOAEL of 311 mg/kg/d in rats, the MOS would be 1,205; this MOS would be considered sufficient to protect newborns.
Conclusion of the risk assessment for consumers considering replacement of DEHP by DINP
Conclusion (ii) would apply for all consumers.
References: see Section 6
287

288
Use Pattern 3
Use in non-PVC polymers
Appendix C EUSES Modelling
In the EUSES model the use pattern refer to the following scenarios in the risk assessment:
Use Pattern 1 Use as an additive in paints
Use Pattern 2 Use as an additive for inks
Use as an additive for adhesives, glues and sealing compounds
Use Pattern 4
Use Pattern 5 Use in PVC
Use Pattern 6 Disposal of end product
Euses Calculations can be viewed as part of the report at the website of the European Chemicals Bureau: http://ecb.jrc.it

European Commission EUR 20784EN European Union Risk Assessment Report 1,2-benzenedicarboxylic acid, di-C8-10-branched alkyl esters,
C9-rich and di-“isononyl” phthalate (DINP), Volume 35 Editors: S.J. Munn, R. Allanou, K. Aschberger, F. Berthault, J. de Bruijn, C. Musset, S. O’Connor, S. Pakalin, G. Pellegrini, S. Scheer, S. Vegro. Luxembourg: Office for Official Publications of the European Communities 2003 – X pp., 290 pp. – 17.0 x 24.0 cm Environment and quality of life series
The report provides the comprehensive risk assessment of the substances 1,2-benzenedicarboxylic acid, di-C8-10-branched alkyl esters, C9-rich and di-“isononyl” phthalate (DINP). It has been prepared by France in the frame of Council Regulation (EEC) No. 793/93 on the evaluation and control of the risks of existing substances, following the principles for assessment of the risks to humans and the environment, laid down in Commission Regulation (EC) No. 1488/94. The evaluation considers the emissions and the resulting exposure to the environment and the human populations in all life cycle steps. Following the exposure assessment, the environmental risk characterisation for each protection goal in the aquatic, terrestrial and atmospheric compartment has been determined. For human health the scenarios for occupational exposure, consumer exposure and humans exposed via the environment have been examined and the possible risks have been identified. The risk assessment for 1,2-benzenedicarboxylic acid, di-C8-10-branched alkyl esters, C9-rich and di-“isononyl” phthalate concludes that there is at present no concern for the environment or for human health. There is at present no need for further information or for risk reduction measures beyond those that are being applied already.
The mission of the JRC is to provide customer-driven scientific and technical supportfor the conception, development, implementation and monitoring of EU policies. As aservice of the European Commission, the JRC functions as a reference centre ofscience and technology for the Union. Close to the policy-making process, it serves thecommon interest of the Member States, while being independent of special interests,private or national.
European Commission – Joint Research Centre Institute for Health and Consumer Protection European Chemicals Bureau (ECB) European Union Risk Assessment Report 1,2-benzenedicarboxylic acid, di-C8-10-branchedalkyl esters, C9-rich and di-“isononyl” phthalate (DINP)
CAS Nos: 68515-48-0 & 28553-12-0 EINECS Nos: 271-090-9 & 249-079-5 Series: 2nd Priority List Volume: 35