Development of adherence metrics for caloric restriction interventions
19
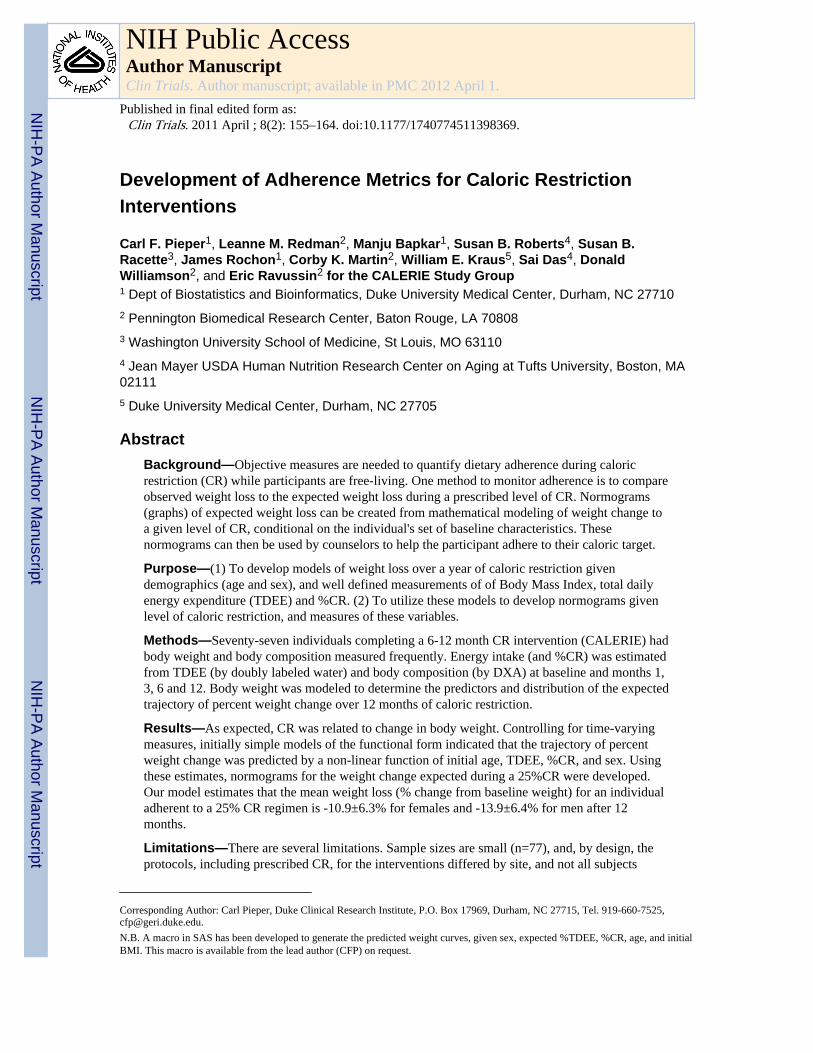
Development of Adherence Metrics for Caloric Restriction Interventions Carl F. Pieper 1 , Leanne M. Redman 2 , Manju Bapkar 1 , Susan B. Roberts 4 , Susan B. Racette 3 , James Rochon 1 , Corby K. Martin 2 , William E. Kraus 5 , Sai Das 4 , Donald Williamson 2 , and Eric Ravussin 2 for the CALERIE Study Group 1 Dept of Biostatistics and Bioinformatics, Duke University Medical Center, Durham, NC 27710 2 Pennington Biomedical Research Center, Baton Rouge, LA 70808 3 Washington University School of Medicine, St Louis, MO 63110 4 Jean Mayer USDA Human Nutrition Research Center on Aging at Tufts University, Boston, MA 02111 5 Duke University Medical Center, Durham, NC 27705 Abstract Background—Objective measures are needed to quantify dietary adherence during caloric restriction (CR) while participants are free-living. One method to monitor adherence is to compare observed weight loss to the expected weight loss during a prescribed level of CR. Normograms (graphs) of expected weight loss can be created from mathematical modeling of weight change to a given level of CR, conditional on the individual's set of baseline characteristics. These normograms can then be used by counselors to help the participant adhere to their caloric target. Purpose—(1) To develop models of weight loss over a year of caloric restriction given demographics (age and sex), and well defined measurements of of Body Mass Index, total daily energy expenditure (TDEE) and %CR. (2) To utilize these models to develop normograms given level of caloric restriction, and measures of these variables. Methods—Seventy-seven individuals completing a 6-12 month CR intervention (CALERIE) had body weight and body composition measured frequently. Energy intake (and %CR) was estimated from TDEE (by doubly labeled water) and body composition (by DXA) at baseline and months 1, 3, 6 and 12. Body weight was modeled to determine the predictors and distribution of the expected trajectory of percent weight change over 12 months of caloric restriction. Results—As expected, CR was related to change in body weight. Controlling for time-varying measures, initially simple models of the functional form indicated that the trajectory of percent weight change was predicted by a non-linear function of initial age, TDEE, %CR, and sex. Using these estimates, normograms for the weight change expected during a 25%CR were developed. Our model estimates that the mean weight loss (% change from baseline weight) for an individual adherent to a 25% CR regimen is -10.9±6.3% for females and -13.9±6.4% for men after 12 months. Limitations—There are several limitations. Sample sizes are small (n=77), and, by design, the protocols, including prescribed CR, for the interventions differed by site, and not all subjects Corresponding Author: Carl Pieper, Duke Clinical Research Institute, P.O. Box 17969, Durham, NC 27715, Tel. 919-660-7525, [email protected]. N.B. A macro in SAS has been developed to generate the predicted weight curves, given sex, expected %TDEE, %CR, age, and initial BMI. This macro is available from the lead author (CFP) on request. NIH Public Access Author Manuscript Clin Trials. Author manuscript; available in PMC 2012 April 1. Published in final edited form as: Clin Trials. 2011 April ; 8(2): 155–164. doi:10.1177/1740774511398369. NIH-PA Author Manuscript NIH-PA Author Manuscript NIH-PA Author Manuscript
-
Upload
independent -
Category
Documents
-
view
1 -
download
0
Transcript of Development of adherence metrics for caloric restriction interventions
Development of Adherence Metrics for Caloric RestrictionInterventions
Carl F. Pieper1, Leanne M. Redman2, Manju Bapkar1, Susan B. Roberts4, Susan B.Racette3, James Rochon1, Corby K. Martin2, William E. Kraus5, Sai Das4, DonaldWilliamson2, and Eric Ravussin2 for the CALERIE Study Group1 Dept of Biostatistics and Bioinformatics, Duke University Medical Center, Durham, NC 277102 Pennington Biomedical Research Center, Baton Rouge, LA 708083 Washington University School of Medicine, St Louis, MO 631104 Jean Mayer USDA Human Nutrition Research Center on Aging at Tufts University, Boston, MA021115 Duke University Medical Center, Durham, NC 27705
AbstractBackground—Objective measures are needed to quantify dietary adherence during caloricrestriction (CR) while participants are free-living. One method to monitor adherence is to compareobserved weight loss to the expected weight loss during a prescribed level of CR. Normograms(graphs) of expected weight loss can be created from mathematical modeling of weight change toa given level of CR, conditional on the individual's set of baseline characteristics. Thesenormograms can then be used by counselors to help the participant adhere to their caloric target.
Purpose—(1) To develop models of weight loss over a year of caloric restriction givendemographics (age and sex), and well defined measurements of of Body Mass Index, total dailyenergy expenditure (TDEE) and %CR. (2) To utilize these models to develop normograms givenlevel of caloric restriction, and measures of these variables.
Methods—Seventy-seven individuals completing a 6-12 month CR intervention (CALERIE) hadbody weight and body composition measured frequently. Energy intake (and %CR) was estimatedfrom TDEE (by doubly labeled water) and body composition (by DXA) at baseline and months 1,3, 6 and 12. Body weight was modeled to determine the predictors and distribution of the expectedtrajectory of percent weight change over 12 months of caloric restriction.
Results—As expected, CR was related to change in body weight. Controlling for time-varyingmeasures, initially simple models of the functional form indicated that the trajectory of percentweight change was predicted by a non-linear function of initial age, TDEE, %CR, and sex. Usingthese estimates, normograms for the weight change expected during a 25%CR were developed.Our model estimates that the mean weight loss (% change from baseline weight) for an individualadherent to a 25% CR regimen is -10.9±6.3% for females and -13.9±6.4% for men after 12months.
Limitations—There are several limitations. Sample sizes are small (n=77), and, by design, theprotocols, including prescribed CR, for the interventions differed by site, and not all subjects
Corresponding Author: Carl Pieper, Duke Clinical Research Institute, P.O. Box 17969, Durham, NC 27715, Tel. 919-660-7525,[email protected]. A macro in SAS has been developed to generate the predicted weight curves, given sex, expected %TDEE, %CR, age, and initialBMI. This macro is available from the lead author (CFP) on request.
NIH Public AccessAuthor ManuscriptClin Trials. Author manuscript; available in PMC 2012 April 1.
Published in final edited form as:Clin Trials. 2011 April ; 8(2): 155–164. doi:10.1177/1740774511398369.
NIH
-PA Author Manuscript
NIH
-PA Author Manuscript
NIH
-PA Author Manuscript

completed a year of follow-up. In addition, the inclusion of subjects by age and initial BMI wasconstricted so that these results may no generalize to other older, obese subjects.
Conclusions—The trajectory of percent weight change during CR interventions in the presenceof well measured covariates can be modeled using simple non-linear functions, and is related levelof CR, the percent change in TDEE, gender, and age. Displayed on a normogram, individuallytailored trajectories can be used by counselors and participants to monitor weight loss andadherence to a CR regimen.
It is difficult to determine adherence to dietary interventions in free-living individuals. Inter-individual weight change in response to calorie restriction (CR) is highly variable at a givenpoint in time, as well as over time. This variability is likely due to individual differences inphysiology and genetics(1) and, importantly, individual differences in adherence to theprescribed dietary intervention (2). However, change in body weight during CR is one easilymeasured and often used marker of adherence to the prescribed intervention (3-5). In animalexperiments, food intake can be controlled precisely and the effect of dietary manipulationson body weight and other endpoints can be objectively measured and modeled. In free-livinghumans, however, where the level of adherence and hence CR cannot be controlledprecisely, the observed changes in body weight are less well characterized. Whileinvestigators can enhance adherence with strategies such as controlled feeding undersupervised conditions (6, 7), this is not feasible in large long-term outpatient studies.
A common strategy to assess adherence to a prescribed CR diet in an outpatient setting is toestimate daily energy intake from 7-day food diaries or 24-hour dietary recall. These self-report methods, however, have questionable validity (8). For example, doubly labeled waterstudies have demonstrated that people under-report energy intake when using self-reportmethods to measure energy intake (9, 10).
Combining assessments of energy expenditure (i.e., doubly labeled water) and changes inbody composition (i.e., fat mass and fat-free mass) by dual x-ray absorptiometry (DXA)provides a more sophisticated determination of energy intake during CR (11). Validation ofthis method against 24–hour energy expenditure measured in a metabolic chamber indicatedthat this technique provides a good assessment of energy expenditure. Nevertheless, becausechanges in body energy stores are small and difficult to accurately quantify with DXA in theshort-term (within 1 month), energy intake and hence adherence, can only be accuratelydetermined over longer periods of negative energy balance (i.e., across months). Doublylabeled water studies are expensive, however, and not readily available in clinical settings.Body weight change is a widely acceptable metric for quantifying adherence to CRprograms and body weight can easily and accurately be obtained by study subjects,clinicians and investigators. The Comprehensive Assessment of the Long-term Effect ofReducing Intake of Energy (CALERIE) is performing the first clinical studies examining theeffects of CR on biomarkers of aging and longevity in non-obese human beings. Threeclinical sites are involved in this research program; Washington University in St. Louis,MO, Tufts University in Boston, MA and Pennington Biomedical Research Center in BatonRouge, LA; the Duke Clinical Research Institute, in Durham, NC, serves as theCoordinating Center. Phase 1 of the program was conceived as site-specific, short-term,pilot studies (12-14) to address specific design issues. These studies were of relatively shortduration (6-12 months) and varied in amount of CR prescribed. In each study however, CRwas prescribed on an individual basis as a percent reduction in energy intake measured by 4weeks of energy expenditure by doubly labeled water during weight maintenance. Using thelongitudinal weight change and adherence data (calculated %CR from doubly labeled waterand DXA) from the CALERIE Phase 1 studies, our goal was to develop prediction equationsto model percent weight change over time.
Pieper et al. Page 2
Clin Trials. Author manuscript; available in PMC 2012 April 1.
NIH
-PA Author Manuscript
NIH
-PA Author Manuscript
NIH
-PA Author Manuscript

The Phase 2 study of CALERIE is in progress and designed as a single-protocol, multi-center, randomized controlled trial (15). An important goal of this analysis, therefore, is toestablish boundaries for the expected percent change in body weight during a 25% CR toimplement during our Phase 2 study. Moreover, the equations and methodology wedeveloped might prove useful in other settings such as the prescription of CR diets for thetreatment of obesity. The weight change normograms or graphs allow investigators tomonitor individual adherence in real time and to counsel participants to better achieve theirprescribed calorie target.
MethodsSubjects
Eligible subjects (Age: 20-60 years) were generally healthy (BMI: 23.5 - 29.9 kg/m2) andnot engaged in regular exercise. Only subjects randomized to CR interventions without anexercise prescription were included in these analyses. Therefore, subjects randomized tocontrol groups (Pennington: 2, Washington U: 1) or exercise groups (Pennington: 1,Washington U: 1) were omitted from these analyses. The CR prescriptions and duration ofintervention differed by site; 20% CR for 12 months at Washington U, 10% and 30% CR for12 months at Tufts, and 25% CR for 6 months at Pennington. In addition, the CRinterventions at Tufts included a comparison of two types of diets (i.e., high and low-glycemic index), as described previously (12). Local Institutional Review Boards approvedthe site-specific studies and informed consent was obtained from each participant beforeenrollment. In total, 79 subjects were randomized, while 77 provided information on thecovariates the outcomes measures.
Body WeightMetabolic weight was determined by the mean of two consecutive measurements obtainedin the morning following a 12 hour fast and morning void and corrected for the weight of ahospital gown.
Body CompositionWhole body percent body fat was measured using DXA (Hologics QDR 4500A, Bedford,MA) at Pennington and Washington U and air displacement plethysmography (BOD POD®,Life Measurement, Inc. Concord, CA) at Tufts. Fat mass (FM) and fat-free mass (FFM)were calculated from percent body fat and metabolic body weight.
Total Daily Energy Expenditure (TDEE)TDEE was measured over 14-days by doubly labeled water (DLW). Two consecutivemeasures were conducted at baseline and single measures at months 3, 6, 9, and 12 of theCR interventions. Briefly, subjects provided 2 pre-dose urine samples, and then received anoral dose of DLW containing 2.0 g 10% H2
18O and 0.12 g 99.9% 2H2O per kg of estimatedtotal body water. Post-dose urine samples were collected at 1.5, 3, 4.5 and 6 hours on theday of dosing (the 1.5 and 3 hour samples were discarded). On days 7 and 14 after dosing,subjects provided 2 more timed urine samples. Each sample was analyzed for 18O and 2Habundance by isotope ratio mass spectrometry at a central laboratory (16). The isotopicenrichments of the post-dose urine samples were compared with the pre-dose samples tocalculate elimination rates of deuterium and oxygen-18 (kH and kO, respectively) usinglinear regression, and initial isotope dilution spaces were calculated by extrapolation to timezero. CO2 production rate (rCO2) was calculated using the equations of Schoeller et al. (17)as modified by Racette et al (18). Total daily energy expenditure was calculated bymultiplying rCO2 by the energy equivalent of CO2; RQ was estimated to be 0.86,
Pieper et al. Page 3
Clin Trials. Author manuscript; available in PMC 2012 April 1.
NIH
-PA Author Manuscript
NIH
-PA Author Manuscript
NIH
-PA Author Manuscript

corresponding to a diet containing 55% carbohydrate, 30% fat, and 15% protein. PercentTDEE was computed by comparing the follow-up TDEE to the baseline TDEE.
Percent Calorie Restriction (%CR)To estimate adherence, we calculated %CR from total daily energy expenditure (measuredby DLW) and changes in body composition (measured by DXA or BodPod) at several timepoints (months 1, 3, 6, and 12) during the intervention (19). The energy contents for fat andfat-free mass loss were assumed to be 9.3 and 1.1 kcal/g, respectively.
Development of Weight Change NormogramsTo develop normograms, as described below, a two-step analysis was utilized.
1. Modeling the functional form of weight change—First, we estimated thefunctional form of percent weight change during CR, controlling for time-varying effects(estimated %CR and TDEE) as well as time invariant effects (sex, age, and BMI). Second,to provide boundaries of adherence (similar to normograms in psychological experiments)for CR interventions (e.g., Phase 2 of the CALERIE trial), we modeled body weight against%CR as measured in CALERIE subjects, standardizing to a constant level of CR. Toaccomplish this, percent weight change during the intervention period was calculated foreach subject and the functional form of the curve was estimated across individualscontrolling for study duration, %CR, and %TDEE. Our objective was to estimate a single,simple monotonically decreasing curve which fit the observed data over the period of study.Models were estimated using non-linear repeated measures regression as implemented inSAS NLMIXED. The general form of the equation (with all terms) is:
(1)
where the subscript i represents an individual participant i, (i=1 to N), at time t, (t=0 to 365days). The ‘baseline’ weight was calculated several days before the initiation of CR, thusrequiring the subject specific random intercept, α0i which allows for the small individualchanges in weight occurring in the time between the measurement of TDEE and theinitiation of CR. It is expected to approximate 0. α1i is a random slope parameter for eachsubject measuring the trajectory of % weight change, Xj is a measurefor each of the 5covariates of interest (j=1,5), respectively, %CR, % of Baseline TDEE, sex, age, and BMI,and βj and βj* represent regression coefficients for respectively the main time varyingimpact on weight change for covariate j. Notice that the fixed-effect parameter, γ is a powerof time and thereby determines the shape of the curve. Each covariate and %CR is allowed aseparatepower (γ) indicating the process of change over time. The estimated individualchange parameter, α1i, for an individual is a random variable used in follow-up analysesdescribed below.
Through the modeling process, terms were included or excluded depending on theircontribution to the explanatory power and statistical significance. Initially simple modelsincluded only time, the exponents of time, and %CR, while subsequent models incorporatedmain and time varying effects for demographic variables,TDEE, and incorporated powers oftime beyond linear time. Percent CR and relative TDEE were entered into the equation astime dependent covariates with the value corresponding to the most proximal outcome,%weight change being predicted. Measures of likelihood and fit (by Bayes InformationCriteria, BIC) were compared for the various models and ultimately a final model was
Pieper et al. Page 4
Clin Trials. Author manuscript; available in PMC 2012 April 1.
NIH
-PA Author Manuscript
NIH
-PA Author Manuscript
NIH
-PA Author Manuscript

derived, deleting non-significant variables (p≥0.05). For the final model, we determined therelationship of the model estimates to demographic characteristics (sex and age), baselineadiposity (BMI), and %CR prescribed. As a final step, as a check of fit, a sensitivity analysiswas performed comparing the fitted and observed lines and the residuals were compared tothe fitted line.
2. Prediction of weight change for 25% CR—Using the relationship between thechange in weight over time and calculated %CR at 1 year in CALERIE Phase 1, a predictionequation was derived, setting the intercept, α0i, to 0, and the values of the covariates tocommon values. The estimate αi assumed a 25% CR, (the level of CR prescribed inCALERIE Phase 2) for each of the models. Since αi was a random effect, and hence had adistribution, as a second step, we assessed the distribution of these expected changes, fixingall covariates to common values. Finally, at pre-determined percentile values (80, 50 and10%) from this expected change, a normogram for boundaries of expected change wasdeveloped for use in CALERIE Phase 2.
ResultsStudy subjects
Seventy-seven subjects (out of a total of 152 enrolled at the three study sites) met the criteriafor inclusion in this analysis. The study cohort was an average 39.7±9.5 years, non-obese(BMI 27.7±1.7 kg/m2) and 68% female. Baseline demographic and body compositioncharacteristics by study site are shown in Table 1. Aside from the subjects being older bydesign at Washington University, the subjects did not differ with respect to BMI or sexdistribution.
Weight change and CRThe distribution of observed weight changes with CR across the 3 study sites is shown inFigure 1. As expected with these studies, there was some variability in the percent weightchange over time and while there was a general loss of weight throughout the intervention, afew subjects gained weight during the course of the trial, particularly, after about sixmonths.
1. Parameterization of weight change—A comparison of the estimates of increasinglyparameterized models is shown in Table 2. With only time (days) and %CR included in themodel (Table 2, Model 2), weight change occurred by a value close to the square root oftime (γ1=0.40). However, the impact of %CR over time (days) was closer to linear (Model3, (γ=0.85). We note that a power of time for time (days)*%CR interaction was morepredictive than linear time (comparison of BICs, Model 2 vs. Model 3), but the exponentialvalue differed between time (days) and the time (days)*%CR interaction parameters(comparison of BICs, Model 3 vs. 3a). In the full models, there were interactions betweenthe covariates, sex, TDEE and age with time, indicating, as expected, that the change overtime varied for these covariates. Baseline BMI did BMI impact the percent change inweight. When we tested if the time effect impact of the covariates was (a) different from thatof %CR and (b) from each other (model 4a), we found that the time-varying effect wasdifferent for TDEE, BMI, age and gender relative to %CR (λ=.81 for %CR, λ=1.65 for acommon power for the remaining 4 covariates, change in -2LL=16,df=1, p<0.05), but, thepowers were not different from one another among the 4 covariates (data not shown). Whennon-significant terms were eliminated, the BICs were substantively worse for the reducedmodel (model 5) relative to the full model (model 4a) (10644 vs. 10622), while thedifference in log-likelihoods (10541-10580=39, df=4 p<0.05) indicates possiblemediation(20) by one or more of the deleted variables. Therefore, the full model (Model 4a)
Pieper et al. Page 5
Clin Trials. Author manuscript; available in PMC 2012 April 1.
NIH
-PA Author Manuscript
NIH
-PA Author Manuscript
NIH
-PA Author Manuscript

was retained. This model included each of the 5 covariates as main effects, timecovariate*(days) interaction, and a time (days)*%CR interaction with a separate power oftime for %CR and a common power for the remaining covariates. In this model, lowerrelative levels of %TDEE change from baseline, males, and older subjects had higherestimated percentage weight loss. It is important to note that both %CR and %TDEE wererelated to %change in weight. Percent CR and %TDEE change from baseline are, of course,correlated (r=-0.32 across all observations), but, not so correlated as to create estimationproblems due to multi-colinearity.
Using the parameters listed in Model 4a (Table 2), the predicted weight loss for males andfemales at twenty-five percent CR over the course of a year is shown in Figure 2, controllingfor average age, initial BMI, and %TDEE change from baseline observed in the sample.
2. Estimation of bias in a monotonically decreasing model—The upswing inweight after several months of study observed in many participants in Figure 1 could lead tobias in a single-parameter model of weight loss in which monotonicity is assumed. Figure 3shows the observed and predicted marginal means during a 12 month period compared tothe estimated average change in weight (i.e., across all subjects and time points) derivedfrom the parameter values (i.e. controlling for %CR, sex, baseline BMI, %TDEE change,and age) in Model 4a. As observed in the comparison of these marginal means, nosystematic bias was discerned. Throughout the 12 months, the bias is slight, indicating thatthe observed upswing in weights in Figure 1 was due to a change in %CR and %TDEEchange from baseline.
3. Prediction of a range of weight change for 25% CR—The expected bounds forweight change for 25 %CR over 12 months was determined using regression parametersfrom Model 4a and the estimated variance in the random slope parameter, α1. The slopeparameters were adjusted to a fixed value of 25% CR with the covariates set to their meanvalues. The expected distribution of the adjusted predicted scores are shown in Figure 3,assuming the random variable, α1, was distributed normally. As expected, after adjustment,the variability of these predicted values decreases. The expected percent changes in weightat 30, 90, 180 and 360 days are shown in Table 3 for females.
Normograms: Using the regression parameters from Model 4a, normograms of expectedweight loss in response to a 25% CR are developed for each individual subject according totheir individual covariates. These normograms can be used by participants andinterventionists to follow the expected course of weight change relative to studyexpectations, which in this case is a 25% CR. For pedagogy, we created a normogram ofexpected change in body weight with CR for three subjects from CALERIE Phase 1 usingtheir individual covariate values (Figure 4); Subject 1: 25% CR (Figure 4A), Subject 2: 30%CR (Figure 4B), and Subject 3: 20% CR (Figure 4C), assuming they had been prescribed a25% CR diet. As shown, the actual percent weight change for subjects one and three (Figure4A and 4C) remained within the designated boundaries (10th and 80th percentile) throughoutthe course of the intervention. For subject two (Figure 4B) however, the percent change inbody weight followed a trajectory consistent with the 80th percentile line. If an adherencecriterion for weight change more than the 80th percentile were adopted in a study, counselorscould implement various behavioral strategies to bring this subject back into adherence withthe CR intervention. In addition, these figures also indicate that, early on, the first subjectmay have been losing weight at too fast a pace. A warning could also be issued to bring thissubject back into compliance as well, or, the weight change monitored very carefully.Finally, we note, that since falling below a BMI of 18.5 is considered as a serious adverseevent in the Phase 2 trial, the corresponding weight value for each subject could be includedto serve as a reminder for the interventionist.
Pieper et al. Page 6
Clin Trials. Author manuscript; available in PMC 2012 April 1.
NIH
-PA Author Manuscript
NIH
-PA Author Manuscript
NIH
-PA Author Manuscript

DiscussionA challenge during CR and weight loss is determining if the variability in weight change isowed to inter-individual differences in physiological responses or simply due intra-individual differences in adherence. Weight changes in 77 participants enrolled in the PhaseI CALERIE trial were compiled to develop prediction models for weight change at a givenlevel of CR. Using these prediction models, we have shown that investigators can develop anormogram of expected weight changes tailored to a given individual. We propose that thesenormograms can be adopted for use in ‘real time’ during a CR intervention to track theprogress and adherence of an individual following a CR prescription.
Previous investigators have shown that body weight is a good proxy for adherence duringstudies of CR (3-5). While a comprehensive mathematical model has been recentlydeveloped to predict changes in body weight, body composition and energy expenditure inresponse to CR (5), it is important to note that this model, while comprehensive was derivedfrom group estimates and therefore has limited application to individual subjects.
This analysis describes the methods applied to develop a simple set of weight curves for CRinterventions. Using weight change in the clinic from CALERIE Phase 1, we havedemonstrated important demographic and energy related predictors of the observed weightchange, and have developed a subject specific normogram which would allow aninterventionist and subject to chart the course of weight loss against expectation (and henceadherence to a 25% CR intervention).
Several additional points should be made. First, the functional form of the curve used toestimate the curves may be unfamiliar to many, but was necessitated by the requirement ofextrapolating to one (or more) year(s) from existing data. By design, some subjects in phase1 provided data of only 6 months in duration. The estimated curve had to demonstrate aninitial faster rate of weight loss, and continue to provide likely values over the period ofinterest. In CALERIE Phase 1, there was a great deal of variability in weight changebetween subjects, likely due to differences in adherence as well as prescribed CR. Weightincreases in the latter part of the intervention may be explained by study fatigue and acommensurate reduction in adherence (with a commensurate reduction in estimated %CRand %TDEE), as well as by increased metabolic efficiency that would reduce the rate ofweight loss and result in eventual weight stabilization. If we utilized only the 6 monthweight observations, a simpler, monotonically decreasing, single parameter exponentialestimate would have adequately fit the data.
In the development of the normogram for subsequent studies (including CALERIE Phase 2),interim CR measurements (from doubly labeled water and body composition) will beavailable for an individual but not considered. Utilization of these interim points into theanalytic structure might have increased the precision of the estimates, and, perhaps allowedfor adaptation of group averages to incorporate individual differences. This methodhowever, was rejected because: (1) such calculations at these interim points would have ledto distinct break in the smooth curves at the points of the interim points (3 months, 6months, 9 months), (2) in order to be useful, the data would have had to be available in realtime, which was not planned in the data management flow, and (3) if updated data in Phase2 was used to update projections, the delivery of the intervention might differ for subjectsenrolled in the early and late parts of the trial.
There are numerous limitations to the finding reported here. The sample sizes are small. Thesubjects come from 3 different sites and sampled with differing inclusion/exclusion criteria(most notably age) and were studied under several different protocols, including length oftime on study (by design, one site had subjects on study for 6 months, while, in the other 2
Pieper et al. Page 7
Clin Trials. Author manuscript; available in PMC 2012 April 1.
NIH
-PA Author Manuscript
NIH
-PA Author Manuscript
NIH
-PA Author Manuscript

sites, subjects were followed for a year) and, there were slight differences in the timing ofTDEE measurements varied by site. There was great variability in subject characteristics,subject adherence, the level of CR prescribed, and the CR interventions between study sites.Most notably, expected level of %CR varied by site, increasing the heterogeneity of theobserved weight curves and the resulting estimates. These factors necessitated statisticalcontrol to predict weight loss curves at 25% CR. The estimates reported here utilizedstatistical adjustment to control these factors, but this control likely resulted in largerestimates of variability than would have been observed had a uniform protocol for a givenCR been employed. While the model we employed indicated that adjusting for factorscontributing to heterogeneity of weight loss was precise (the correlation between calculated%CR and the change in weight parameter was -0.79), there were minimal subjects withwhich to investigate non-linearities in this relationship and sensitivity analyses based ondemographic and medical variables. Our small sample size and reliance on statisticaladjustment must temper the reliance on these curves to define ‘adherence’. Indeed, for thisand the reasons below, the projections shown in our model stop at one year, the limits of thePhase 1 data used to define the curves. Ultimately, whether these estimates can be extendedto, for example, more obese subjects, to other protocols for obtaining a given %CR, or oldersubjects will require validation in future studies.
Second, an important application of these predicted weight curves is in longer CRinterventions or interventions with prescribed energy deficits different from 25% frombaseline energy requirements. For example, CALERIE Phase 2 involves a 2-yearintervention, and assessing adherence beyond the first year is critical. If a more commonfunctional form (e.g., quadratic) were employed to develop the two year projections, thenthe observed upswing in weight at the end of the phase 1 study would result in an estimatedlarge increase in weight at the end of a two-year intervention, due to the upswing in thefinal months in the observed results being extrapolated over the two-year period. The cost ofthe use of the exponential estimate is that inspection of the observed and predicted dataacross a large number of individuals shows that the expected weight loss is overestimated inthe very initial days (two weeks) and, while the function slows as time increases, it iscontinually decreasing and does not asymptote. Thus, the values for the normogram areprobably less useful during the first two weeks of the intervention, and extrapolation beyondthe limits of the observed data is risky. Also, it should be noted that while these normogramsmay be useful for predicting under-adherence to a prescribed CR regimen, the actual degreeof under-adherence cannot be inferred by the observed distance from the expected meanprojection for a given CR level. Further, estimation of the curves require fixing the %CR,but also an estimate of expected %TDEE which will be obtained for the individual. Whilethe curves can be updated as future information becomes available, updates of TDEErequires expensive and intensive measures not available to all researchers and clinicians.
The normograms developed have been extended to 1 year of a 2 year trial, the limits of thedata in Phase 1. In any setting, projection of results beyond the observed data is alwaysproblematic, but the problem is acute in this setting. In Phase 1, many subjects gainedweight in the final months of the 1 year trial, possibly due to ‘study creep’ or physiologicadaptation leading to increased weight even in the presence of constant caloric restriction.Thus, three viable projections are possible – (1) the model proposed here (based on anexponential and linear function of time) would posit increased weight loss (albeit at a slowerpower pace) in the second year, (2) one might posit a constant weight in the second year,and (3) if the upswing observed in the final months in Phase I continued into the secondyear, weight would return to pre-intervention levels at the end of the second year, even inthe presence of true 25% CR.
Pieper et al. Page 8
Clin Trials. Author manuscript; available in PMC 2012 April 1.
NIH
-PA Author Manuscript
NIH
-PA Author Manuscript
NIH
-PA Author Manuscript

Finally, the calculations here were developed for a generally young, normal weightpopulation. While the methodology is straightforward, further analysis will be necessary toassess if the functional form and distribution of weight loss is applicable as a measure ofadherence in the treatment of obesity.
AcknowledgmentsFunding for this study was provided by NIA, grant number 2U01-AG022132, 5P30-AG028277, and by NationalInstitute on Aging Cooperative Agreements U01 AG 020487; U01 AG 020478; U01 AG020480, and U01AG022132. CFP is additionally supported by P30 AG028716 (NIA). LMR is supported by K99 HD060762(NICHD) and CKM by K23 DK068052 (NIDDK). We wish to acknowledge important contributions of otherCALERIE investigators to the intervention studies described in this paper: Pennington Biomedical ResearchCenter: Andrew Deutsch, Paula J. Geiselman, Frank Greenway, Leonie Heilbronn, Enette Larson-Meyer, MichaelLefevre, Marlene Most-Windhauser, Steve Smith; Tufts University: C.K. Gilhooly, Gerard E. Dallal; WashingtonUniversity: John O. Holloszy, Hassan Arif, Ali Ehsani, Luigi Fontana, Samuel Klein, Christopher Koenig,Kathleen A. Obert, Kenneth B. Schechtman, Morgan Schram, Karen Steger-May, Richard I. Stein, Dennis T.Villareal, Laura Weber, Edward P. Weiss; The Duke Clinical Research Institute: Connie Bales.
References1. Ravussin E, Swinburn BA. Metabolic predictors of obesity: Cross-sectional versus longitudinal data.
International Journal Obesity and Related Metabolomic Disorders. 1993; 17(supplement 3):S28–31.discussion S41-22.
2. Del Corral P, Chandler-Laney PC, Casazza K, Gower BA, Hunter GR. Effect of dietary adherencewith or without exercise on weight loss: a mechanistic approach to a global problem. J ClinEndocrinol Metab. 2009 May; 94(5):1602–7. [PubMed: 19258409]
3. Thomas DM, Ciesla A, Levine JA, Stevens JG, Martin CK. A mathematical model of weight changewith adaptation. Math Biosci Eng. 2009 Oct; 6(4):873–87.
4. Hall KD, Chow CC. Estimating the quantitative relation between food energy intake and changes inbody weight. Am J Clin Nutr Mar. 91(3):816.
5. Hall KD. Predicting metabolic adaptation, body weight change, and energy intake in humans. Am JPhysiol Endocrinol Metab Mar. 298(3):E449–66.
6. Most MM, Ershow AG, Clevidence BA. An overview of methodologies, proficiencies, and trainingresources for controlled feeding studies. J Am Diet Assoc. 2003 Jun; 103(6):729–35. [PubMed:12778045]
7. Windhauser MM, Evans MA, McCullough ML, Swain JF, Lin PH, Hoben KP, et al. Dietaryadherence in the Dietary Approaches to Stop Hypertension trial. DASH Collaborative ResearchGroup. J Am Diet Assoc. 1999 Aug; 99(8 Suppl):S76–83. [PubMed: 10450298]
8. Schoeller DA. How accurate is self-reported dietary energy intake? Nutr Rev. 1990 Oct; 48(10):373–9. [PubMed: 2082216]
9. Livingstone MB, Black AE. Markers of the validity of reported energy intake. J Nutr. 2003 Mar.1333:895S–920S. [PubMed: 12612176]
10. Trabulsi J, Schoeller DA. Evaluation of dietary assessment instruments against doubly labeledwater, a biomarker of habitual energy intake. Am J Physiol Endocrinol Metab. 2001 Nov;281(5):E891–9. [PubMed: 11595643]
11. de Jonge L, DeLany JP, Nguyen T, Howard J, Hadley EC, Redman LM, et al. Validation study ofenergy expenditure and intake during calorie restriction using doubly labeled water and changes inbody composition. Am J Clin Nutr. 2007 Jan; 85(1):73–9. [PubMed: 17209180]
12. Das SK, Gilhooly CH, Golden JK, Pittas AG, Fuss PJ, Cheatham RA, et al. Long-term effects of 2energy-restricted diets differing in glycemic load on dietary adherence, body composition, andmetabolism in CALERIE: a 1-y randomized controlled trial. Am J Clin Nutr. 2007 Apr; 85(4):1023–30. [PubMed: 17413101]
13. Heilbronn LK, de Jonge L, Frisard MI, DeLany JP, Larson-Meyer DE, Rood J, et al. Effect of 6-month calorie restriction on biomarkers of longevity, metabolic adaptation, and oxidative stress inoverweight individuals: a randomized controlled trial. JAMA. 2006 Apr 5; 295(13):1539–48.[PubMed: 16595757]
Pieper et al. Page 9
Clin Trials. Author manuscript; available in PMC 2012 April 1.
NIH
-PA Author Manuscript
NIH
-PA Author Manuscript
NIH
-PA Author Manuscript

14. Racette SB, Weiss EP, Villareal DT, Arif H, Steger-May K, Schechtman KB, et al. One year ofcaloric restriction in humans: feasibility and effects on body composition and abdominal adiposetissue. J Gerontol A Biol Sci Med Sci. 2006 Sep; 61(9):943–50. [PubMed: 16960025]
15. Rochon J, Holloszy J, Ravussin E, Roberts S, Romashkan S, Galan K, et al. Design and Conduct ofthe CALERIE Study: Comprehensive Assessment of the Long-Term Effects of Reducing Intake ofEnergy. Journals of Gerontology: Medical Sciences. 2010 in press.
16. Martin CK, Heilbronn LK, de Jonge L, DeLany JP, Volaufova J, Anton SD, et al. Effect of calorierestriction on resting metabolic rate and spontaneous physical activity. Obesity (Silver Spring).2007 Dec; 15(12):2964–73. [PubMed: 18198305]
17. Schoeller DA. Measurement of energy expenditure in free-living humans by using doubly labeledwater. J Nutr. 1988 Nov; 118(11):1278–89. [PubMed: 3142975]
18. Racette SB, Schoeller DA, Luke AH, Shay K, Hnilicka J, Kushner RF. Relative dilution spaces of2H- and 18O-labeled water in humans. Am J Physiol. 1994 Oct; 267(4 Pt 1):E585–90. [PubMed:7943308]
19. Hadley EC, Roberts SB, Ravussin E, Pieper C, Bhapkar MV, Racette SB, et al. Objectiveassessment of long-term reduction in energy intake. Am J Clin Nutr. 2010 Submitted.
20. Baron RM, Kenny DA. The moderator-mediator variable distinction in social psychologicalresearch: Conceptual, strategic and statistical considerations. Journal of Personality and SocialPsychology. 1986; 51:1173–82. [PubMed: 3806354]
Pieper et al. Page 10
Clin Trials. Author manuscript; available in PMC 2012 April 1.
NIH
-PA Author Manuscript
NIH
-PA Author Manuscript
NIH
-PA Author Manuscript

Figure 1. Observed trajectories of Weight ChangeActual percent change in weight in all subjects assigned to caloric restriction in CALERIE 1.The CR prescriptions and duration differed by site; 25% CR for 6 months at Pennington,10% and 30% CR for 12 months at Tufts, and 20% CR for 12 months at Washington U.
Pieper et al. Page 11
Clin Trials. Author manuscript; available in PMC 2012 April 1.
NIH
-PA Author Manuscript
NIH
-PA Author Manuscript
NIH
-PA Author Manuscript

Figure 2 a&b.Predicted change in body weight with 25% CR for 12 months. Parameter estimates werecalculated from Model 4a for a female and male subjects age 38y, BMI=28 kg/m2 andTDEE change 92% from baseline. If the subject is adherent to the intervention, on average,we expect the body weight change to follow the 50th percentile line (solid line). Also shownon the normogram is the expected trajectory for weight change at the 90th and 10th
percentiles (long dashed lines) and 75th and 25th percentiles (short dashed lines).Investigators have the flexibility to set their own boundaries of adherence.
Pieper et al. Page 12
Clin Trials. Author manuscript; available in PMC 2012 April 1.
NIH
-PA Author Manuscript
NIH
-PA Author Manuscript
NIH
-PA Author Manuscript

Figure 3. Assessment of Bias. Marginal Mean values Observed vs. Predicted changeComparison of Observed and Predicted Weight Change. Predicted values were calculatedfrom Model 4 parameters given the individual trajectory, intercept, sex, age, BMI, and timevarying %CR and %TDEE.
Pieper et al. Page 13
Clin Trials. Author manuscript; available in PMC 2012 April 1.
NIH
-PA Author Manuscript
NIH
-PA Author Manuscript
NIH
-PA Author Manuscript

Pieper et al. Page 14
Clin Trials. Author manuscript; available in PMC 2012 April 1.
NIH
-PA Author Manuscript
NIH
-PA Author Manuscript
NIH
-PA Author Manuscript

Figure 4.Normograms of expected and observed weight loss for 3 actual subjects from CALERIEPhase 1. Figure 4a shows the weight change of a 43y female with a starting BMI of 28.6 kg/m2. Figure 4b shows the weight change of a 27y male with a starting BMI of 27.8 kg/m2.Figure 4c shows the weight change of a 53y female with a starting BMI of 29.8 kg/m2. Theactual percent change in body weight is plotted as the solid dark line. A normogram of theexpected trajectory of weight change is shown with the 50th percentile line (solid line). InCALERIE 2, we set an upper adherence bound at the 10th percentile and a lower adherencebound at the 80th percentile (dashed lines).
Pieper et al. Page 15
Clin Trials. Author manuscript; available in PMC 2012 April 1.
NIH
-PA Author Manuscript
NIH
-PA Author Manuscript
NIH
-PA Author Manuscript

NIH
-PA Author Manuscript
NIH
-PA Author Manuscript
NIH
-PA Author Manuscript
Pieper et al. Page 16
Table 1Baseline characteristics of the study cohort
Washington U Pennington Tufts
20% CR 25% CR 30% CR 10% CR
N 19 12 34 12
Age (yrs) 55.4 ± 3.6 39.5 ± 5.3 34.8 ± 5.5 34.9 ± 5.5
% Female 63.2 50.0 76.5 66.7
Weight (kg) 78.7 ± 9.7 81.1 ± 11.3 79.2 ± 10.6 83.7 ± 10.0
BMI (kg/m2) 27.1 ± 2.4 27.9 ± 1.3 27.6 ± 1.6 28.6 ± 1.6
% White Race 89.5 58.3 85.3 75
Values represent mean (SD) or percentage of subjects.
Clin Trials. Author manuscript; available in PMC 2012 April 1.

NIH
-PA Author Manuscript
NIH
-PA Author Manuscript
NIH
-PA Author Manuscript
Pieper et al. Page 17
Tabl
e 2
Para
met
er E
stim
ates
for
Mod
els o
f Wei
ght C
hang
e un
der
CR
ove
r th
e co
urse
of 1
yea
r
%W
eigh
t Cha
nge=
α0 +
α1(
Day
s) γ1
+ β
1(%
CR
) + β
2(%
CR
* Day
s γ2 )
+ β
3(%
TDEE
) + β
4(%
TDEE
* Day
s γ) +
β5(
Age
) + β
6(A
ge* D
ays γ
) + β
7(Fe
mal
e) +
β 8(F
emal
e* Day
s γ) +
β9(
BM
I) +
β10
(BM
I* Day
s γ)
Para
met
erM
odel
0M
odel
1M
odel
2M
odel
3M
odel
3a
Mod
el 4
: Ful
l Mod
elT
able
4a:
Ful
l Mod
el2
Mod
el 5
: Red
uced
Mod
el
Inte
rcep
t (α 0
)3.
61 *
**1.
42 *
**1.
42**
*1.
13**
*0.
75**
*0.
45*
0.94
***
Day
s (α 1
)-1
.02
***
-3.6
7 **
*-1
.39
***
-1.3
8***
-1.2
0***
-1.1
5***
-0.9
6***
-1.1
8***
Pow
er D
ays (γ 1
)0.
41 *
**0.
22 *
**0.
40 *
**0.
40**
*0.
42**
*0.
43*
**0.
46**
*0.
43**
*
%C
R (β
1)-0
.002
80.
016*
**0.
14**
*0.
021
*0.
024*
*0.
016*
%C
R* D
ays (β 2
)-0
.001
3***
-0.0
030*
**-0
.044
***
-0.0
031*
**-0
.003
6***
-0.0
033*
**
Pow
er %
CR
(γ2)
0.85
***
0.42
***
0.84
***
0.81
***
0.82
***
%TD
EE (β
3)0.
038*
**0.
038
%TD
EE* D
ays(β 4
)-0
.000
12**
-0.0
0000
34*
-0.0
0000
070*
*
Age
(β5)
0.01
7*0.
0062
Age
* Day
s (β 6
)-0
.001
3***
-0.0
0002
0*-0
.000
070
Fem
ale
(β7)
0.28
0.41
*0.
41*
Fem
ale*
Day
s (β 8
)0.
0044
*0.
0001
6*0.
0004
4
BM
I (β 9
)0.
044
0.05
0
BM
I*D
ays (β 1
0)0.
0005
70.
0000
064
Pow
er (γ
)1.
65**
*1.
46**
*
-2LL
112
754
1234
910
814
1080
310
941
1055
710
541
1058
0
BIC
212
771
1236
310
852
1084
610
980
1063
410
622
1064
4
Mod
el 0
= u
ncon
trolle
d, n
o in
terc
ept
Mod
el 1
= u
ncon
trolle
d, in
terc
ept
Mod
el 2
= C
ontro
lling
for C
R a
nd %
CR
*tim
e (d
ays)
Mod
el 3
= C
ontro
lling
for C
R a
nd %
CR
*tim
e (d
ays)
γ1 ,
sepa
rate
pow
ers f
or %
CR
*tim
e (d
ays)
γ a
nd ti
me
(day
s) γ
.
Mod
el 3
a =
Con
trolli
ng fo
r CR
and
%C
R*t
ime
(day
s) γ
, com
mon
pow
er (γ
) for
%C
R*t
ime
(day
s) γ
and
tim
e (d
ays)
γ
Clin Trials. Author manuscript; available in PMC 2012 April 1.

NIH
-PA Author Manuscript
NIH
-PA Author Manuscript
NIH
-PA Author Manuscript
Pieper et al. Page 18M
odel
4 =
Ful
l mod
el, c
ontro
lling
for %
CR
, %TD
EE, A
ge, B
MI,
& S
ex
Mod
el 4
a=Fu
ll m
odel
, con
trolli
ng fo
r %C
R, %
TDEE
, Age
, BM
I, &
Sex
, sep
arat
e po
wer
s for
day
s, C
R, a
nd th
e 5
cova
riate
s.
Mod
el 5
= R
educ
ed m
odel
, rem
ovin
g no
n-si
gnifi
cant
cov
aria
tes f
rom
Mod
el 4
a.
Age
cen
tere
d at
38
year
s, B
MI c
ente
red
at 2
8 K
g/M
2 , %
TD
EE c
ente
red
at 9
2% o
f bas
elin
e.
* p<0.
05
**p<
0.01
*** p<
0.00
1
1 LL, L
og L
ikel
ihoo
d
2 BIC
, Bay
es In
form
atio
n C
riter
ion
Clin Trials. Author manuscript; available in PMC 2012 April 1.

NIH
-PA Author Manuscript
NIH
-PA Author Manuscript
NIH
-PA Author Manuscript
Pieper et al. Page 19
Tabl
e 3
Dis
trib
utio
n of
pre
dict
ed p
erce
nt w
eigh
t cha
nge
to a
25%
CR
die
t at 3
0, 9
0, 1
80 a
nd 3
60 d
ays
Fem
ales
Perc
entil
e
Day
90th
75th
50th
± S
td D
ev25
th10
th
30-1
.1-2
.3-3
.7 ±
2.0
-5.1
-6.3
90-2
.2-4
.2-6
.5 ±
3.3
-8.7
-10.
8
180
-2.8
-5.6
-8.8
± 4
.4-1
1.9
-14.
7
360
-2.7
-6.6
-10.
9 ±
6.3
-15.
2-1
9.0
Mal
es
Perc
entil
e
Day
90th
75th
50th
± S
td D
ev25
th10
th
30-1
.5-2
.8-4
.1 ±
2.1
-5.5
-6.7
90-2
.9-4
.9-7
.2 ±
3.3
-9.4
-11.
5
180
-4.1
-6.9
-10.
0 ±
4.6
-13.
1-1
5.9
360
-5.8
-9.7
-13.
9 ±
6.4
-18.
2-2
2.1
* Det
erm
ined
from
par
amet
er e
stim
ates
der
ived
in M
odel
4a
(tabl
e 2)
whe
re %
wei
ght c
hang
e is
adj
uste
d fo
r a 2
5% C
R, c
onst
ant 9
2% T
DEE
cha
nge
from
bas
elin
e, a
ge=3
8, a
nd b
asel
ine
BM
I=28
.
Clin Trials. Author manuscript; available in PMC 2012 April 1.