Effect of bicycle friendly roadway infrastructure on bicycling activities in urban India
10
Procedia - Social and Behavioral Sciences 104 (2013) 1139 – 1148 1877-0428 © 2013 The Authors. Published by Elsevier Ltd. Selection and peer-review under responsibility of International Scientific Committee. doi:10.1016/j.sbspro.2013.11.210 ScienceDirect 2 nd Conference of Transportation Research Group of India (2nd CTRG) Effect of bicycle friendly roadway infrastructure on bicycling activities in urban India Samyajit Basu a,* , Vinod Vasudevan b1 a M.Tech. Student, Indian Institute of Technology, Kanpur, Kanpur-208016, India b Assistant Professor, Indian Institute of Technology, Kanpur, Kanpur-208016, India Abstract Bicycling is considered as one of the most efficient mode of sustainable transportation for shorter commutes. European countries such as the Netherlands, Denmark, and Germany are the global leaders in this context with their high level of bicycling for commute. They achieved it by providing safe and efficient bicycling infrastructure over the years. On the contrary, modal share of bicycling is declining year by year in India. Although it is expected to be attractive option for short commute trips in India due to its extremely low cost of operation, it is not at all an attractive mode among commuter belonging to high and middle income group. Bicycle users in India are predominantly captive users like lower income group people and students. In order to promote bicycling, development/improvement of bicycle friendly infrastructure is highly essential. For a developing country like India, which depends heavily on imported fossil fuels for transportation, promoting bicycling for shorter commutes will have long term influence on its economy as well. This paper aims to find the effect of some of the bicycle friendly infrastructures on urban Indian bicycling from the user perspective. A questionnaire survey was conducted in four major Indian cities to collect data for this study. Later ordinal logistic regression model was used to form a public opinion model to rank some bicycle friendly infrastructures and policies based on public opinion using the data collected during the survey. Dedicated bicycle lane was found to be the most preferred bicycle friendly infrastructures based on the public opinion and whereas facility to carry bicycle on public transportation was found to be the least preferred one. The findings from this study could be used by various policy makers and stakeholders to improve bicycling in their region. Keywords: Bicycling in urban India; Questionnaire survey; Intercept interview; Sustainable transportation; Bicycle Friendly Infrastructure 1 * Corresponding author. Tel.: +91-8116305405. E-mail address: [email protected] Available online at www.sciencedirect.com © 2013 The Authors. Published by Elsevier Ltd. Selection and peer-review under responsibility of International Scientific Committee.
Transcript of Effect of bicycle friendly roadway infrastructure on bicycling activities in urban India

Procedia - Social and Behavioral Sciences 104 ( 2013 ) 1139 – 1148
1877-0428 © 2013 The Authors. Published by Elsevier Ltd.Selection and peer-review under responsibility of International Scientific Committee.doi: 10.1016/j.sbspro.2013.11.210
ScienceDirect
2nd Conference of Transportation Research Group of India (2nd CTRG)
Effect of bicycle friendly roadway infrastructure on bicycling activities in urban India
Samyajit Basua,*, Vinod Vasudevanb1 aM.Tech. Student, Indian Institute of Technology, Kanpur, Kanpur-208016, India
bAssistant Professor, Indian Institute of Technology, Kanpur, Kanpur-208016, India
Abstract
Bicycling is considered as one of the most efficient mode of sustainable transportation for shorter commutes. European countries such as the Netherlands, Denmark, and Germany are the global leaders in this context with their high level of bicycling for commute. They achieved it by providing safe and efficient bicycling infrastructure over the years. On the contrary, modal share of bicycling is declining year by year in India. Although it is expected to be attractive option for short commute trips in India due to its extremely low cost of operation, it is not at all an attractive mode among commuter belonging to high and middle income group. Bicycle users in India are predominantly captive users like lower income group people and students. In order to promote bicycling, development/improvement of bicycle friendly infrastructure is highly essential. For a developing country like India, which depends heavily on imported fossil fuels for transportation, promoting bicycling for shorter commutes will have long term influence on its economy as well. This paper aims to find the effect of some of the bicycle friendly infrastructures on urban Indian bicycling from the user perspective. A questionnaire survey was conducted in four major Indian cities to collect data for this study. Later ordinal logistic regression model was used to form a public opinion model to rank some bicycle friendly infrastructures and policies based on public opinion using the data collected during the survey. Dedicated bicycle lane was found to be the most preferred bicycle friendly infrastructures based on the public opinion and whereas facility to carry bicycle on public transportation was found to be the least preferred one. The findings from this study could be used by various policy makers and stakeholders to improve bicycling in their region. © 2013 The Authors. Published by Elsevier Ltd.
Selection and peer-review under responsibility of International Scientific Committee.
Keywords: Bicycling in urban India; Questionnaire survey; Intercept interview; Sustainable transportation; Bicycle Friendly Infrastructure
1 * Corresponding author. Tel.: +91-8116305405. E-mail address: [email protected]
Available online at www.sciencedirect.com
© 2013 The Authors. Published by Elsevier Ltd.Selection and peer-review under responsibility of International Scientific Committee.

1140 Samyajit Basu and Vinod Vasudevan / Procedia - Social and Behavioral Sciences 104 ( 2013 ) 1139 – 1148
1. Introduction
Sustainable transportation (also called as green transportation) refers to the modes of transport and systems of transport planning, which are consistent with wider concerns of sustainability like environmental, social and economic sustainability of the communities (specially in urban areas) which includes non-motorized transport like walking and cycling and concepts like transit oriented development, green vehicles, car sharing and building or protecting urban transport systems that are fuel-efficient, space-saving and promote healthy lifestyles etc. Among all sustainable transportation, bicycling is especially being promoted in many developed countries as bicycles are the most efficient mode of transportation for shorter commutes (ICLEI, 2001). Many steps like bicycle friendly infrastructure decelopemnt and policy implementation are being taken in many European countries including Netherlands, Germany, Denmark, USA, and UK to improve level of bicycling. It is not well documented what type of infrastructure is the most effective in increasing bicycling for daily commute (Dill, Handy & Pucher, 2003). In India, bicycle usage is decreasing year by year although India is the second largest producer of bicycle in the world (Bicycles produced in the world - Worldmeters, 2013). Bicycle riders in urban India are mosty lower income group people and students. They are predominantly captive riders. There is also a high level of safety concern among Indians regarding bicycling. In order to improve the bicycling level in India, development of bicycle friendly infrastructures and implementation of policies promiting bicycling is essential. This paper aims to address this issue from the user perspective. A questionnaire survey was conducted in four major Indian cities. People were asked to give opinion about six most common bicycle friendly infrastructures and policies with a goal to idenify the most preferred infrastructures which promote bicycling in urban India.
2. A brief literature review
Bicycles are typically appropriate in reducing the number of short trips up to five miles or so which constitute more than half of all driving (ICLEI, 2001). But bicycles can also serve longer trips, if they are successfully combined with other urban transportation modes like bus, rail, and ferry and in some cases on their own. Bicycle usage among various communities can be promoted by taking some steps like integrating bicycles seamlessly into transit system, providing financial incentives for bicycle use, building and maintain dedicated bicycle routes, using bicycle for minicipal operations, implementing spot improvement programmes, supplying bicycle for downtown use (ICLEI, 2001). Northern and Western European nations are front runners in bicycle related activities and infrastructure developments in global context. Share of all trips by bicycle are as high as 27 percent in Netherlands, followed by 18percent in Denmark, 10 percent in Germany compared to 1 percent in USA, UK, and Australia (Pucher & Buehler, 2007). Most of the bicycle trips in these European nations are for work and other utilitarian purposes and bicycle is popular among all age, gender and income groups. Fatality rates are also less in these countries which proves the fact that fatality rates fall for any given country or city as cycling levels rise (Jacobsen, 2003). But this is not due to widespread use of helmets, rather experts from those countries believe it makes bicycling less convenient, less comfortable, less fashionable and may give false sense of safety to bicyclists (Pucher & Buehler, 2007). High level of bicycling in these countries was a result of importance was given to infrastructure development and policy implementation like bicycle paths and lanes, traffic calming, intersection modifications, bicycle parking, integration with public transport, cyclist showers, racks to carry bicycle in buses, training and education, promotional events, complementary taxation, parking, and land-use policies commute by bicycle. Cycling share is influenced by the following factors: distance, function mixture (mixed land use), storage facilities, block size and density, the presence of bicycle infrastructure and its continuity, traffic lights and stop signs, land use, parking facilities and showers at work along with distance, weather, attitude, social environment and other socio-economic factors. India is highly lacking in the context of presence of bicycle friendly infrastructures and policies. But modal share of bicycle in India though declining is typically 13-21

1141 Samyajit Basu and Vinod Vasudevan / Procedia - Social and Behavioral Sciences 104 ( 2013 ) 1139 – 1148
percent (medium and large cities), 6-8 percent (mega cities) (Tiwari & Jain, 2008) which in not that bad compared to global scenario. Bicycle ownership is 33-65percent (Census of India 2001) in various cities and 44.8percent in total India (Census of India 2011). According to NSSO data, 37.1 percent, 39.0 percent, 41.7 percent and 41.1 percent of household possessed bicycle in 1993-94, 1999-2000, 2004-05, 2009-10 in urban India respectively. Bicycle ownership among lower income groups have been higher than those in higher income groups. Bicyclists are also a major victim of road accidents contributing almost 5-10 percent of the total road accidents (20-30 percent of those are severe injuries) (Tiwari & Jain, 2008). For 2001-05 in Delhi 10 percent of the accident victims were bicyclists (Mohan, 2009). During a survey conducted in a major Indian city 18 percent of student bicyclists said they met at least one Accident (33.33 percent carried injury) and 66 percent said they do not feel safe to ride bicycle again (Tiwari & Jain, 2008).One more important aspect is that although there are bicyclists of various age group in India but workplace and type of work determines bicycle ridership and it decreases rapidly with increasing income and literacy levels.
There is ample opportunity to promote bicycling in India. Average trip distances in India are 5-10 kms. Persons having trip length up to 5kms (which is 70-90 percent) can be the target group for promoting bicycling (Tiwari & Jain, 2008). Origins and destinations for bicyclists are almost same as those for motorists. So, to promote bicycle we must provide bicyclists a journey with minimum efforts, inconvenience and danger. Introduction of dedicated bicycle lane is necessary for that. Bicycle also can be promoted as feeder mode (saving money, time). Bicycle sharing service can be implemented. It will prompt bicycling and save large expense and space requirement for automobile parking. Special attention should also be given to maintain the lower income level group ridership and increase ridership of kids, parents and other groups of commuters.
Recently in some of the Indian cities initiatives were taken or are there in planning phase to promote bicycle as a non-motorized transport. Those cities are Bangalore, Delhi, Hyderabad, Pune, Chennai, Ahmedabad, Surat, Rajkot, Pimpri Chinchwad, Mumbai, Bhubaneswar, Cuttack, Jaipur, Mysore, Lucknow. Initiatives include introduction of dedicated bicycle lanes (e.g. along Delhi BRT, in Pune), bicycle sharing service (e.g. in some Delhi metro stations, BRT bus stops, Bangalore university, Pune), intersection modification and use of bicycle signage (e.g. in bicycle friendly street network of Jayanagar, Bangalore).
3. Data collection
In order to analyze the impact and effectiveness of any infrastructure or policy, it is important to gather information on conditions before and after the implementation. Since any bicycle friendly policy or infrastructure is yet to be implemented in India (except in a small part of area in a very few India cities)perspective about the possible policies or infrastructures can be collected. Required data for this study was collected by conducting a questionnaire survey in four major Indian cities namely Kolkata, Lucknow, Kanpur and Delhi. In total 712 people were surveyed. Sample size was 153, 154, 202, and 203 for Kolkata, Lucknow, Kanpur and Delhi respectively. Among the surveyed cities, only Delhi had some bicycle friendly infrastructures like dedicated bicycle lanes and bicycle sharing service in some areas of the city. Therefore, sample size of 102 was allotted for those areas out of the total sample size of 203 for Delhi to study the effect of those infrastructures on commuters. Method of intercept interview was adopted for this survey. Questions were explained to respondents in simple, not so technical words, for easy understanding. People from all categories and user of all transportation modes were targeted equally. Petrol pumps, bus stops, railway stations, tram stops, market areas, canteens in offices and colleges, restaurants, parks and gardens were used as survey locations. Respondents were asked to opine about some bicycle friendly infrastructures and policies like dedicated bicycle lanes, bicycle sharing service, congestion free safe bicycling path even a bit longer, facility to carry bicycle on public transportation, incentive from company for using bicycle, special/preferential treatment at intersections for bicycle users. Respondents who were not using bicycle as their mode of transport were asked if those infrastructures and policies are provided or implemented will they shift to bicycling or prefer bicycling over other modes. In the

1142 Samyajit Basu and Vinod Vasudevan / Procedia - Social and Behavioral Sciences 104 ( 2013 ) 1139 – 1148
similar way, respondents who were using bicycle as their mode of transport were asked if those infrastructures and policies are provided or implemented will that improve the riding quality or make bicycling more convenient or prompt them more to continue using bicycle as a mode of transport. These responses were recorded in a likert scale. They were also asked which infrastructure they think is the best or necessary among those listed is the questionnaire and if they can think of any other infrastructure which may help improving the situation and about their perception about bicycling. In the areas where some bicycle friendly infrastructures were available in Delhi, respondents were asked to compare the safety and feasibility of bicycling in those areas with safety and feasibility of bicycling in other parts of Delhi.
4. Descriptive statistics
Public opinion was largely positive about the bicycle friendly infrastructure and policies. Figure 1 shows the response of survey population for questions related to bicycle friendly infrastructures and policies. Dedicated bicycle lane was the most preferred infrastructures among the survey population. It hardly received any negative response. Figure 2 shows the share of positive response in favor of a bicycle friendly infrastructure or policy. Positive response was calculated by adding the definitely yes, yes and half of may be responses. Here also 'dedicated bicycle lanes' tops the chart followed by 'congestion free safe bicycling path even a bit longer', 'bicycle sharing service', 'incentive from company for using bicycle', and 'special/preferential treatment at intersections for bicycle users'. 'Facility to carry bicycle on public transportation' received minimum positive responses from survey population.
Figure 1: Opinion of survey population about some bicycle friendly infrastructures and policies
Figure 2: Positive response of surveyed population about bicycle friendly infrastructures and policies

1143 Samyajit Basu and Vinod Vasudevan / Procedia - Social and Behavioral Sciences 104 ( 2013 ) 1139 – 1148
Figure 3 shows the most necessary infrastructure or policy for bicycling according to survey population as dedicated bicycle lanes. This was preferred highly over other infrastructures or policies in this regard. Figure 4 shows the perception of survey population about bicycling when they were asked that if they are provided with excellent facilities for bicycling do they think that bicycling is a good idea considering environmental, health, fuel, monitory and other advantages of it. Response to this question was largely positive with almost 58% of respondent strongly agreed to the statement. Figure 5 shows that survey population thinks that safety and feasibility of bicycling in the areas with bicycle friendly facilities in Delhi is higher than that in other parts of Delhi. This clearly shows that bicycle friendly facilities introduced in Delhi had a positive impact on the commuters in those areas.
Figure 3: Most necessary infrastructure or policy for bicycling according to survey population
Figure 4: Perception of survey population about bicycling
Figure 5: Comparison of opinion of survey population of the area in Delhi where bicycle friendly facilities are available about safety and feasibility of bicycling in that part and entire Delhi

1144 Samyajit Basu and Vinod Vasudevan / Procedia - Social and Behavioral Sciences 104 ( 2013 ) 1139 – 1148
5. Model development
A public opinion model was developed with the basic aim to rank the alternatives i.e. the bicycle friendly infrastructures or policies makers or organizations, especially in case of time or monitory constraints. recorded on likert scale, it was ordinal in nature i.e. response variable (regressand) had more than more two categories and those categories were ordered. So, ordinal logistic regression model or cumulative logistic regression model was used to develop the public opinion model. General form of ordinal logistic regression can be written as equation number 1.
Where, y is the response variable, x1,x2 k are the explanatory variables. j
are the parameters related to each explanatory variable which explains the effect of that explanatory variable on the response variable, c is the number of categories for response variable, P( ) are the cumulative probabilities for jth category. As j increases, cumulative probability also increases, so do j. That is why it is required to separate j for each cumulative probability. This model further assumes the effect of x on y is same for each cumulative probability which is also called proportional odds assumption.
Total five public opinion models were formed. Each model was estimated with one explanatory variable and one dependent va s opinion about a bicycle friendly infrastructure or
. It takes value as 5, if the response is definitely yes, 4, if the response is yes, 3, if the response is maybe, 2, if the response is no, 1, if the response is definitely no. The explanatory variable is a binary variable. Table 1 shows the definitions of explanatory variables used in the models. It is also clear from table 1 that each ordinal logit model was formed to compare peoplany two of the infrastructures or policies. Figure 2 was used as a guide for choosing the pair of infrastructures or policies to form models so that ranking can be obtained using minimum number of models. This time Models were formed for any infrastructure or policy and the last infrastructure or policy in the ranking order. Finally, using the collective result from all five models ranking of the bicycle friendly infrastructures or policies was done.
Table 1: Definitions and nature of variables used in ordinal logit models
Model Number
Explanatory Variable
Definition
1 Bicycle friendly infrastructure
1, if it is dedicated bicycle lanes 0, if it is Facility to carry bicycle via main transportation
2 Bicycle friendly infrastructure
1, if it is congestion free safe cycling path even a bit more longer 0, if it is Facility to carry bicycle via main transportation
3 Bicycle friendly infrastructure
1, if it is bicycle sharing service at intersections for bicycle users 0, if it is Facility to carry bicycle via main transportation
4 Bicycle friendly infrastructure
1, if it is incentive from company for using bicycle 0, if it is Facility to carry bicycle via main transportation
5 Bicycle friendly infrastructure
1, if it is special/preferential treatment at intersections for bicycle users 0, if it is Facility to carry bicycle via main transportation
(1)

1145 Samyajit Basu and Vinod Vasudevan / Procedia - Social and Behavioral Sciences 104 ( 2013 ) 1139 – 1148
6. Results
Table 2 summarizes the result obtained from public opinion models. It is quite clear from table 2 that all the co-efficients are statistically highly significant. This shows explanatory variables i.e. bicycle friendly infrastructures
nion or response. Model fitting information also reveals similar results where all chi-square ( 2) values are statistically highly significant. This means introduction of explanatory variable caused statistically significant improvement from the threshold (intercept) only model. Goodness of fit test shows both Pearson and Deviance statistic to be statistically highly significant for model 2, 3, and 5 and statistically not significant for the rest considering cut-off p-values of 0.01. However, the overall results need to be looked in detail and not to be too dogmatic about these tests.
Table 2: Summary of useful information from public opinion models
Model Number 1 2 3 4 5
-3.292 -1.849
-1.820
-1.493
-1.238
.000 .000
.000
.000
.000
Model Fitting Information
-2 Log Likelihood (Intercept only)
845.498 450.755 409.112 241.133 224.779
-2 Log Likelihood (Full model)
46.928 128.458 96.187 55.014 67.708
Chi-square ( 2) 798.57 322.297 312.925 186.119 157.071 Significance level .000 .000
.000
.000
.000
Significance level (Goodness-of-Fit/Pearson)
.235 .000 .000 .025 .000
Significance level (Goodness-of-Fit/Deviance)
.210 .000 .000
.034
.000
Nagelkerke R2 0.464 0.215 0.210 0.151 0.111
Significance level (Test of Parallel Lines) .210
.000
.000
.034
.000
The chi-square is highly likely to be significant when sample size is large. In this case also, sample size is significantly large. So, the p-value was lowered for rejecting the assumption of a good fit from 0.05 to 0.01, but even after that some of the model did not satisfy p-value>0.01 condition. Moreover it must be kept in mind that here the aim of the study was not to predict probabilities and outcome of each threshold level but to rank the infrastructures and policies based on overall opinion about infrastructures and policies and more specifically positivity of public opinion about an infrastructure or policy over other. Other indexes of goodness of fit such as measures of association like pseudo R square (Nagelkerke) values are also shown in the table. They are 0.464, 0.215, 0.210, 0.151 and 0.111 for model 1-5 respectively. One observation can be made from these values and figure 1 and 2 that pseudo R2 values are high for those models which are associated with such two infrastructures or policies which generated relatively large difference in opinion from public. High pseudo R2 value shows that variation in response were explained by the model or in other words explanatory variable that is bicycle friendly infrastructure or policy has an impact on public response i.e. it is a good predictor of the public response. As

1146 Samyajit Basu and Vinod Vasudevan / Procedia - Social and Behavioral Sciences 104 ( 2013 ) 1139 – 1148
there is only one explanatory variable, test of parallel line statistic shows identical result as deviance statistic of Goodness of fit test. However the test of the proportional odds assumption has been described as anti-conservative, that is it nearly always results in rejection of the proportional odds assumption (O'Connell, 2006) particularly when the sample size is large (Allison, 1999) (Clogg & Shihadeh, 1994) or the number of explanatory variables is large (Brant, 1990) or there is a continuous explanatory variable in the model (Allison, 1999). It can be further shown that for model 2, 3 and 5 OR (odds ratio) from theses ordinal regression models underestimates the extent of different infrastructures or policies gap at some level of response while over estimates at other levels and differs from OR obtained from separate logistic regression considering different values for different threshold. Although mean value of those ORs are close to the OR value obtained from ordinal logistic regression and hence OR obtained from ordinal logistic regression model gives a reasonable summary of the trend across the data for this study purpose of ranking the infrastructures or policies. One more reason behind p-value being low for goodness of fit tests and test of parallel lines and pseudo R2 value being low for some of our model is that in every model explanatory variable is bicycle friendly infrastructure or policy while the related question is such that it is expected to generate positive response from public mostly. That could be the reason for opinion rather positivity in the opinion about different infrastructures or policies be considerably close or similar.
Table 3 shows the relative preference or popularity of the bicycle friendly infrastructures and policies, that is, how much preferable or popular an infrastructure/policy is/will be over facility to carry bicycle via main transportation. Numbers shown in this table are e values obtained from opinion models associated with corresponding infrastructures or policies. For example, first number in table 3, that is 26.90 is obtained from public opinion model 1and tells us that odds of getting a positive response rather than a negative response for dedicated bicycle lanes is 26.90 times the odds of getting a positive response rather than a negative response for facility to carry bicycle via main transportation. Similarly other values from both the tables can be interpreted. This table gives the ranking of the bicycle friendly infrastructures and policies which is shown is table 4. Order of the pseudo R square values shown in table 2 also must be noted in this regard. Dedicated bicycle lanes tops the ranking table followed by congestion free safe bicycling path even a bit longer, bicycle sharing service, incentive from company for using bicycle, special or preferential treatment at intersections for bicycle users. Facility to carry bicycle on public transportation is the entry in the ranking table.
Table 3: Relative preference/popularity of some bicycle friendly infrastructures and policies over Facility to carry bicycle on public transportation
Bicycle friendly infrastructures/policies
Relative preference factor
Dedicated bicycle lanes 26.90 Congestion free safe cycling path even a bit longer 6.35 Bicycle sharing service 6.17 Incentive from company for using bicycle 4.45 Special or preferential treatment at intersections for bicycle users 3.45
1147 Samyajit Basu and Vinod Vasudevan / Procedia - Social and Behavioral Sciences 104 ( 2013 ) 1139 – 1148
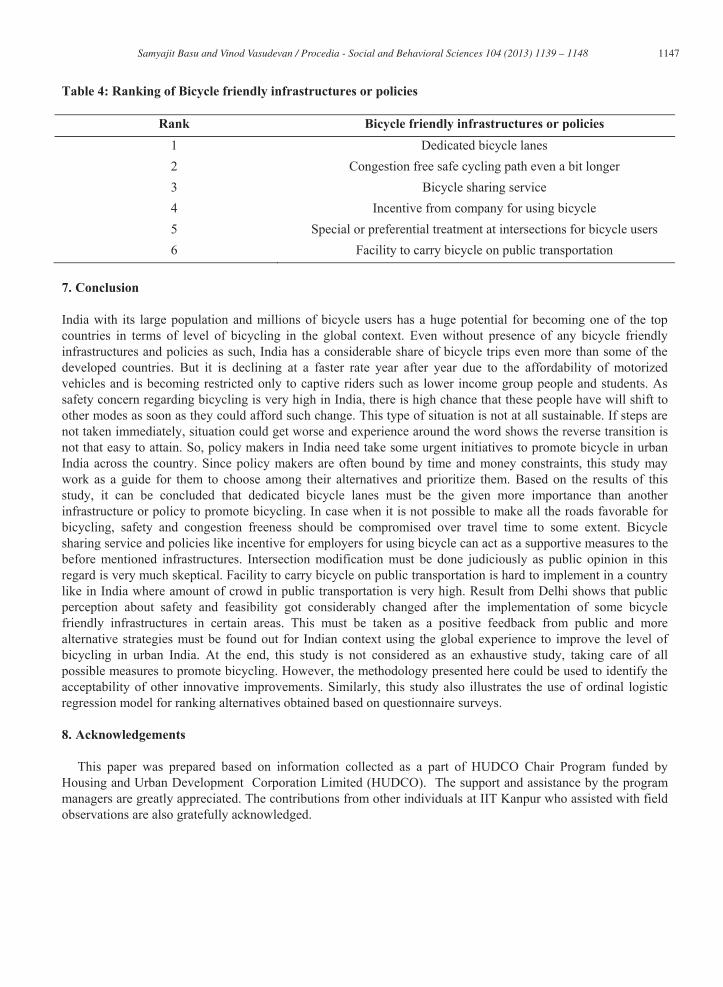
Table 4: Ranking of Bicycle friendly infrastructures or policies
Rank Bicycle friendly infrastructures or policies 1 Dedicated bicycle lanes 2 Congestion free safe cycling path even a bit longer 3 Bicycle sharing service 4 Incentive from company for using bicycle 5 Special or preferential treatment at intersections for bicycle users 6 Facility to carry bicycle on public transportation
7. Conclusion
India with its large population and millions of bicycle users has a huge potential for becoming one of the top countries in terms of level of bicycling in the global context. Even without presence of any bicycle friendly infrastructures and policies as such, India has a considerable share of bicycle trips even more than some of the developed countries. But it is declining at a faster rate year after year due to the affordability of motorized vehicles and is becoming restricted only to captive riders such as lower income group people and students. As safety concern regarding bicycling is very high in India, there is high chance that these people have will shift to other modes as soon as they could afford such change. This type of situation is not at all sustainable. If steps are not taken immediately, situation could get worse and experience around the word shows the reverse transition is not that easy to attain. So, policy makers in India need take some urgent initiatives to promote bicycle in urban India across the country. Since policy makers are often bound by time and money constraints, this study may work as a guide for them to choose among their alternatives and prioritize them. Based on the results of this study, it can be concluded that dedicated bicycle lanes must be the given more importance than another infrastructure or policy to promote bicycling. In case when it is not possible to make all the roads favorable for bicycling, safety and congestion freeness should be compromised over travel time to some extent. Bicycle sharing service and policies like incentive for employers for using bicycle can act as a supportive measures to the before mentioned infrastructures. Intersection modification must be done judiciously as public opinion in this regard is very much skeptical. Facility to carry bicycle on public transportation is hard to implement in a country like in India where amount of crowd in public transportation is very high. Result from Delhi shows that public perception about safety and feasibility got considerably changed after the implementation of some bicycle friendly infrastructures in certain areas. This must be taken as a positive feedback from public and more alternative strategies must be found out for Indian context using the global experience to improve the level of bicycling in urban India. At the end, this study is not considered as an exhaustive study, taking care of all possible measures to promote bicycling. However, the methodology presented here could be used to identify the acceptability of other innovative improvements. Similarly, this study also illustrates the use of ordinal logistic regression model for ranking alternatives obtained based on questionnaire surveys.
8. Acknowledgements
This paper was prepared based on information collected as a part of HUDCO Chair Program funded by Housing and Urban Development Corporation Limited (HUDCO). The support and assistance by the program managers are greatly appreciated. The contributions from other individuals at IIT Kanpur who assisted with field observations are also gratefully acknowledged.
1148 Samyajit Basu and Vinod Vasudevan / Procedia - Social and Behavioral Sciences 104 ( 2013 ) 1139 – 1148
9. References
Allison, P. D. (1999). Logistic regression using the SAS system: Theory and application. Cary, NC.: SAS Institute. Bicycles produced in the world - Worldmeters. (n.d.). Retrieved 7 13, 2013, from http://www.worldometers.info/bicycles Brant, R. (1990). Assessing proportionality in the proportional odds model for ordinal logistic regression. Biometrics. Census of India 2001. (n.d.). Retrieved 11 18, 2012, from http://www.censusindia.gov.in Census of India 2011. (n.d.). Retrieved 11 18, 2012, from http://www.censusindia.gov.in Clogg, C., & Shihadeh, E. S. (1994). Statistical models for ordinal variables. Thousand Oaks: Sage publications. Dill, J., Handy, S. L., & Pucher, J. (2003). How to Increase Bicycling for Daily Travel. Active Living Research . Heinen, E., Van Wee, B., & Maat, K. (2010). Bicycle use for commuting: a literature review. Transport Reviews 30 . ICLEI. (2001). Sustainable Transportation Options for Protecting the Climate. Berkeley, CA. Jacobsen, P. (2003). Safety in numbers: more walkers and bicyclists, safer walking and bicycling. Injury Prevention 9 . Ministry of Statistics and Programme Implementation - Government of India. (2012). Household Consumption of Various Goods and Services in India . Mohan, D. (2009). Road accidents in India. IATSS Research Vol.33 . O'Connell, A. (2006). Logistic regression models for ordinal response variables. Thousand Oaks: Sage publications. Pucher, J., & Buehler, R. (2007). At the Frontiers of Cycling: Policy Innovations in the Netherlands, Denmark, and Germany. World Transport Policy and Practice, Vol. 13 , 8-57. Tiwari, G., & Jain, H. (2008). Bicycles in urban India. Urban Transport journal .