Lighting and Vegetation for Energy-Efficient and Safe Roadway Travel
74
LIGHTING AND VEGETATION FOR ENERGY-EFFICIENT AND SAFE ROADWAY TRAVEL Final Report Prepared for THE NEW YORK STATE ENERGY RESEARCH AND DEVELOPMENT AUTHORITY Albany, NY Joseph D. Tario Senior Project Manager and THE NEW YORK STATE DEPARTMENT OF TRANSPORTATION Albany, NY Humayun Kabir Project Manager Prepared by THE LIGHTING RESEARCH CENTER, RENSSELAER POLYTECHNIC INSTITUTE Troy, NY John D. Bullough and Mark S. Rea Principal Investigators Jeremy D. Snyder, Leora C. Radetsky, Xin Zhang, Nicholas P. Skinner Project Team Members Contract Nos. 10628 / C-08-03 April 2009
Transcript of Lighting and Vegetation for Energy-Efficient and Safe Roadway Travel

LIGHTING AND VEGETATION FOR ENERGY-EFFICIENT AND SAFE ROADWAY TRAVEL
Final Report
Prepared for
THE NEW YORK STATE ENERGY RESEARCH AND DEVELOPMENT AUTHORITY Albany, NY
Joseph D. Tario
Senior Project Manager
and
THE NEW YORK STATE DEPARTMENT OF TRANSPORTATION Albany, NY
Humayun Kabir Project Manager
Prepared by
THE LIGHTING RESEARCH CENTER, RENSSELAER POLYTECHNIC INSTITUTE Troy, NY
John D. Bullough and Mark S. Rea
Principal Investigators
Jeremy D. Snyder, Leora C. Radetsky, Xin Zhang, Nicholas P. Skinner Project Team Members
Contract Nos. 10628 / C-08-03
April 2009

ii
NOTICE
This report was prepared by the Lighting Research Center at Rensselaer Polytechnic Institute in the course
of performing work contracted for and sponsored by the New York State Energy Research and
Development Authority and the New York State Department of Transportation (hereafter the "Sponsors").
The opinions expressed in this report do not necessarily reflect those of the Sponsors or the State of New
York, and reference to any specific product, service, process, or method does not constitute an implied or
expressed recommendation or endorsement of it. Further, the Sponsors and the State of New York make no
warranties or representations, expressed or implied, as to the fitness for particular purpose or
merchantability of any product, apparatus, or service, or the usefulness, completeness, or accuracy of any
processes, methods, or other information contained, described, disclosed, or referred to in this report. The
Sponsors, the State of New York, and the contractor make no representation that the use of any product,
apparatus, process, method, or other information will not infringe privately owned rights and will assume
no liability for any loss, injury, or damage resulting from, or occurring in connection with, the use of
information contained, described, disclosed, or referred to in this report.
DISCLAIMER
This report was funded in part through grant(s) from the Federal Highway Administration, United States
Department of Transportation, under the State Planning and Research Program, Section 505 of Title 23,
U.S. Code. The contents of this report do not necessarily reflect the official views or policy of the United
States Department of Transportation, the Federal Highway Administration or the New York State
Department of Transportation. This report does not constitute a standard, specification, regulation, product
endorsement, or an endorsement of manufacturers.

iii
Technical Report Documentation Page 1. Report No. C-08-03
2. Government Accession No.
3. Recipient's Catalog No. 5. Report Date May 2009
4. Title and Subtitle Lighting and Vegetation for Energy-Efficient and Safe Roadway Travel
6. Performing Organization Code
7. Author(s) J. D. Bullough, M. S. Rea, J. D. Snyder, L. C. Radetsky, Z. Xhang, N. P. Skinner
8. Performing Organization Report No. 10. Work Unit No. (TRAIS)
9. Performing Organization Name and Address Lighting Research Center, Rensselaer Polytechnic Institute, 21 Union Street, Troy, NY 12180 11. Contract or Grant No.
Contract No. 10628 13. Type of Report and Period Covered Final Report (2008-2009)
12. Sponsoring Agency Name and Address New York State Energy Research and Development Authority (NYSERDA), 17 Columbia Circle, Albany, NY 12203; New York State Department of Transportation (NYSDOT), 50 Wolf Road, Albany, NY 12232 14. Sponsoring Agency Code
15. Supplementary Notes Joseph D. Tario from NYSERDA and Humayun Kabir from NYSDOT served as project managers.
16. Abstract The objective of the present study was to identify and evaluate promising approaches to incorporating lighting and vegetation along roadways with the purpose of identifying the most promising application that could be incorporated into a demonstration project. The project team reviewed existing lighting, roadway delineation and vegetation practices in New York State and elsewhere to identify promising approaches combining these elements for roadway applications. Through a series of lighting simulations, the visibility of relevant objects along each of several roadway applications (roundabouts, curved exit ramps, and urban boulevards) were compared when they were illuminated using conventional roadway lighting without inclusion of vegetation as a visual element, and when they were designed with both lighting and vegetation as an integrated system. Economic analyses and energy use comparisons were also performed to identify the relative impact of the new lighting and vegetation approaches. Comparing the relative benefits of the proposed lighting and vegetation approaches for each roadway application, the roundabout application and the urban boulevard had the greatest estimated impact on safety, as characterized by the drivers' visual performance when detecting pedestrians and other potential hazards along the road. The roundabout application also had the greatest energy savings in terms of electricity use, and as a result, had the greatest reduction in operating costs. Based on the results of the analyses, the project team recommends that NYSERDA and NYSDOT consider implementing a demonstration project to integrate lighting and vegetation approaches to providing visual information at roundabouts. The report includes a work plan and schedule for conducting such a demonstration project.
17. Key Words Sustainability, visibility, lighting, vegetation, landscaping, ecoluminance
18. Distribution Statement
19. Security Classif. (of this report)
20. Security Classif. (of this page)
21. No. of Pages 74
22. Price
Form DOT F 1700.7 (8-72) Reproduction of completed page authorized

iv
ABSTRACT
The objective of the present study was to identify and evaluate promising approaches to incorporating
lighting and vegetation along roadways with the purpose of identifying the most promising application that
could be incorporated into a demonstration project. The project team reviewed existing lighting, roadway
delineation and vegetation practices in New York State and elsewhere to identify promising approaches
combining these elements for roadway applications. Through a series of lighting simulations, the visibility
of relevant objects along each of several roadway applications (roundabouts, curved exit ramps, and urban
boulevards) were compared when they were illuminated using conventional roadway lighting without
inclusion of vegetation as a visual element, and when they were designed with both lighting and vegetation
as an integrated system. Economic analyses and energy use comparisons were also performed to identify
the relative impact of the new lighting and vegetation approaches. Comparing the relative benefits of the
proposed lighting and vegetation approaches for each roadway application, the roundabout application and
the urban boulevard had the greatest estimated impact on safety, as characterized by the drivers' visual
performance when detecting pedestrians and other potential hazards along the road. The roundabout
application also had the greatest energy savings in terms of electricity use, and as a result, had the greatest
reduction in operating costs. Based on the results of the analyses, the project team recommends that
NYSERDA and NYSDOT consider implementing a demonstration project to integrate lighting and
vegetation approaches to providing visual information at roundabouts. The report includes a work plan and
schedule for conducting such a demonstration project.

v
ACKNOWLEDGMENTS
The members of the research team gratefully acknowledge sponsorship of this project by the New York
State Energy Research and Development Authority (NYSERDA) and the New York State Department of
Transportation (NYSDOT), under the direction of Joseph D. Tario of NYSERDA and Humayun Kabir of
NYSDOT. We also acknowledge the very helpful input throughout the course of the project provided by
Nancy Alexander, Peter Dunleavy, Gary Frederick, Laura Greninger, Marian Mudar and John Rowen of
NSYDOT; Richard Drake of NYSERDA; Emmett McDevitt and Roslyn Webber of the Federal Highway
Administration (FHWA); Dan Chambers from the Town of Colonie, NY; Margaret Fowler-McDowell of
Friedman Fisher; Sandy Misiewicz of the Capital District Transportation Committee; John Walter from
National Grid; Tom Lindberg from Mesa Reduction Engineering; Timothy Volk from the State University
of New York College of Environmental Sciences and Forestry; and Johannes Lehmann, Hilary Mayton and
Kelli Roberts from Cornell University.
vi
TABLE OF CONTENTS Section Page SUMMARY ................................................................................................................................................ S-1 1 INTRODUCTION................................................................................................................................ 1-1 2 REVIEW OF ROADWAY LIGHTING, DELINEATION AND VEGETATION PRACTICES........ 2-1 Roadway Lighting ................................................................................................................................ 2-1 Roadway Delineation ........................................................................................................................... 2-2 Roadway Vegetation ............................................................................................................................ 2-3 Summary ............................................................................................................................................ 2-18 3 ECOLUMINANCE CONCEPT........................................................................................................... 3-1 Explanation of Concept ........................................................................................................................ 3-1 Implementing Ecoluminance Solutions................................................................................................ 3-3 Ecoluminance Applications Considered for Evaluation....................................................................... 3-3 4 CRITERIA AND TOOLS FOR EVALUATION................................................................................. 4-1 Safety ............................................................................................................................................... 4-1 Energy and Environmental Impact ....................................................................................................... 4-6 Economic Analysis............................................................................................................................... 4-7 Appearance Criteria.............................................................................................................................. 4-7 5 RESULTS OF EVALUATION............................................................................................................ 5-1 Roundabouts......................................................................................................................................... 5-1 Curves and Exit Ramps ........................................................................................................................ 5-6 Urban Boulevards................................................................................................................................. 5-9 6 ROUNDTABLE MEETING SUMMARY .......................................................................................... 6-1 Narrative of Meeting Discussion.......................................................................................................... 6-1 Attendees.............................................................................................................................................. 6-6 7 RECOMMENDATIONS AND PROPOSED NEXT STEPS .............................................................. 7-1 Summary of Results ............................................................................................................................. 7-1 Recommendation.................................................................................................................................. 7-2 Proposed Work Plan............................................................................................................................. 7-2 Benefits for New York State ................................................................................................................ 7-5 8 REFERENCES..................................................................................................................................... 8-1 APPENDIX A Summary of Vegetation Species Comparison................................................................ A-1

vii
LIST OF FIGURES AND TABLES Figure 1 Bio-char resulting from the pyrolysis process. 2 Experimental setup for the spectral reflectance measurements. 3 Simulated appearance of vegetation at the end of a tee intersection, including reflected appearance in
wet pavement. 4 The four elements of the ecoluminance toolbox. 5 Ecoluminance concept sketches for a) roundabouts, b) curves and exit ramps, c) urban boulevards, and
d) highway rights-of-way. 6 RVP values (Rea and Ouellette, 1991) as a function of luminance (left abscissa) and contrast (right
abscissa). 7 Age-related reduction in retinal illuminance caused by lens thickening and yellowing and by pupil size
reductions (Rea and Ouellette, 1991). 8 Comparison of predicted visual performance (Rea and Ouellette, 1991) and measured performance for
an office data entry task (Eklund et al., 2001). 9 Measured visual response times for simulated highway sign stimuli (Goodspeed and Rea, 1999) and
predictions based on RVP (Rea and Ouellette, 1991). 10 Photograph of a roundabout in New York State, showing the use of pole-mounted lighting (from
NYSDOT website). 11 Plan view sketch of a roundabout used for photometric and visibility analyses. 12 Rendered image of the roundabout with conventional pole-mounted illumination. 13 Rendered image of the roundabout with the ecoluminance solution shown. 14 Plan view of a curved exit ramp, showing the location of a vehicle entering the curved section. 15 Curved exit ramp appearance with vegetation (and no additional lighting) present. 16 Curved exit ramp appearance with vegetation and landscape lighting present. 17 Plan view sketch of urban boulevard lined with trees and historical-appearing luminaires. 18 Rendered image of the urban boulevard showing the approach to a mid-block pedestrian crossing. 19 Rendered image of the urban boulevard lighting using the ecoluminance approach, showing the
approach to a mid-block pedestrian crossing. Table 1 New York roadway biomass crop options. More positive characteristics are in green. 2 Vegetation-related carbon sequestration methods.

viii
3 Carbon sequestration data for several vegetation types. 4 Photometric and visual performance (Rea and Ouellette, 1991) characteristics of relevant visual targets
while approaching the roundabout illuminated by conventional lighting. 5 Summary of energy use and initial and operation/maintenance costs for the conventional roundabout
lighting system. 6 Photometric and visual performance (Rea and Ouellette, 1991) characteristics of relevant visual targets
while approaching the roundabout illuminated only by the bollard component of the ecoluminance solution, with vegetation present.
7 Photometric and visual performance (Rea and Ouellette, 1991) characteristics of relevant visual targets
while approaching the roundabout illuminated using the ecoluminance approach by bollard luminaires and 5 W landscape lights for the vegetation.
8 Photometric and visual performance (Rea and Ouellette, 1991) characteristics of relevant visual targets
while approaching the roundabout illuminated using the ecoluminance approach by bollard luminaires and 15 W landscape lights for the vegetation.
9 Summary of energy use and initial and operation/maintenance costs for the recommended roundabout
ecoluminance system. 10 Photometric and visual performance (Rea and Ouellette, 1991) characteristics of relevant visual targets
while entering the curved section of an exit ramp. 11 Photometric and visual performance (Rea and Ouellette, 1991) characteristics of relevant visual targets
while entering the curved section of an exit ramp designed using an ecoluminance approach with 5 W LED landscape luminaires.
12 Photometric and visual performance (Rea and Ouellette, 1991) characteristics of relevant visual targets
while entering the curved section of an exit ramp designed using an ecoluminance approach with 15 W LED landscape luminaires.
13 Photometric and visual performance (Rea and Ouellette, 1991) characteristics of relevant visual targets
while approaching a mid-block crossing along an urban boulevard with conventional lighting. 14 Photometric and visual performance (Rea and Ouellette, 1991) characteristics of relevant visual targets
while approaching a mid-block crossing along an urban boulevard lighted using an ecoluminance approach.
15 Relative ranking for each ecoluminance application according to the three types of criteria used for
evaluation. 16 Proposed timeline for proposed Phase 2 roundabout ecoluminance demonstration.
S-1
SUMMARY
OBJECTIVES
The objective of the present study was to identify and evaluate promising approaches to incorporating
lighting and vegetation along roadways with the purpose of identifying the most promising application that
could be incorporated into a demonstration project.
RESEARCH APPROACH
The project team reviewed existing lighting, roadway delineation and vegetation practices in New York
State and elsewhere to identify promising approaches combining these elements for roadway applications.
Through a series of lighting simulations, the visibility of relevant objects along each of several roadway
applications (roundabouts, curved exit ramps, and urban boulevards) were compared when they were
illuminated using conventional roadway lighting without inclusion of vegetation as a visual element, and
when they were designed with both lighting and vegetation as an integrated system. Economic analyses and
energy use comparisons were also performed to identify the relative impact of the new lighting and
vegetation approaches.
ANALYSES AND RESULTS
Comparing the relative benefits of the proposed lighting and vegetation approaches for each roadway
application, the roundabout application and the urban boulevard had the greatest estimated impact on
safety, as characterized by the drivers' visual performance when detecting pedestrians and other potential
hazards along the road. The roundabout application also had the greatest energy savings in terms of
electricity use, and as a result, had the greatest reduction in operating costs.
CONCLUSIONS AND RECOMMENDATIONS
Based on the results of the analyses, the project team recommends that NYSERDA and NYSDOT consider
implementing a demonstration project to integrate lighting and vegetation approaches to providing visual
information at roundabouts. The report includes a work plan and schedule for conducting such a
demonstration project.

1-1
Section 1
INTRODUCTION
In response to a program opportunity notice (PON) issued jointly by the New York State Energy Research
and Development Authority (NYSERDA) and the New York State Department of Transportation
(NYSDOT) on sustainable transportation applications, the Lighting Research Center (LRC) at Rensselaer
Polytechnic Institute submitted a proposal to evaluate opportunities for integrating lighting and vegetation
systems along roadways to improve safety and visual information and to reduce energy and environmental
impacts.
The present report summarizes the findings of the LRC project team as part of a Phase 1 (feasibility
analysis) study, and presents its recommendations for conducting a demonstration integrating lighting and
vegetation at an actual roadway location in New York State as part of a proposed Phase 2 demonstration
project.
Current practices for roadway lighting, delineation and vegetation are provided, along with a unifying
concept for developing solutions that utilize both lighting and vegetation to provide visual information to
drivers. The criteria and methods for evaluating lighting/vegetation systems are provided, and using these
criteria and methods, several designs for specific roadway applications are evaluated. Based on the
evaluation results, the report recommends one application (i.e., roundabouts) for a subsequent proposed
demonstration project.

2-1
Section 2
REVIEW OF ROADWAY LIGHTING, DELINEATION AND VEGETATION PRACTICES
In this section of the report, practices for roadway lighting, delineation and vegetation are summarized.
ROADWAY LIGHTING
State agencies dealing with roadway lighting in New York include NYSDOT, the New York State
Thruway Authority (NYSTA) and the New York State Bridge Authority (NYSBA). These agencies, with
few exceptions, use the NYSDOT specifications for lighting.
In general, lighting practices refer to the use of pole-mounted, fixed lighting systems for producing
illumination onto the roadway surface in order to increase visibility of potential hazards along the roadway.
The NYSDOT publishes several standards documentations relating to roadway lighting:
• Policy on Highway Lighting (NYSDOT, 1979)
• Highway Design Manual (NYSDOT, 1995)
• Standard Specifications (NSYDOT, 2008)
The Policy on Highway Lighting (NYSDOT, 1979) serves primarily as NYSDOT's warranting procedure
for deciding when to install roadway lighting. For example, lighting is considered for locations that exhibit
high night-to-day crash ratios (when nighttime crashes form a larger-than-expected proportion of crashes
relative to the proportion of traffic occurring at night), when highway interchanges are spaced closely
together, and when many pedestrians are likely to be present. While NYSDOT generally pays for the
design and installation of lighting, operation and maintenance is supposed to be paid for by the
municipality in which the lighting is to be located. The Policy was developed in 1979.
The Highway Design Manual (NYSDOT, 1995) discussed issues related to the planning of lighting
installations by NYSDOT. Specifically, the Manual stipulates that illuminance criteria (as opposed to
luminance criteria) are to be used in the calculation and specification of light levels. This is important
because the recommended practices of the Illuminating Engineering Society of North America (IESNA,
2000), on which the American Association of State Highway and Transportation Officials (AASHTO,
2005) lighting guidelines are based, allow either illuminance or luminance to be used. The Manual further
states that HPS lamps are preferred for roadway lighting, in semi-cutoff luminaires (usually having the
characteristic "cobrahead" shape). When so-called "ornamental" lighting is to be used, any extra costs for
equipment in addition to maintenance and operation are to be borne by the municipality in which the
lighting will be located. The Manual was last updated in 1995.

2-2
The NYSDOT (2008) Standard Specifications that address lighting are mainly concerned with issues
regarding durability of equipment and electrical safety. It does list performance criteria required for lamps
and includes both HPS and mercury vapor lamps (the latter type is often used in overhead highway sign
lighting, although the ballasts for these lamps are being phased out by federal energy efficiency legislation,
which will effectively phase out use and availability of these lamps as well). The Specifications were last
updated in 2008.
ROADWAY DELINEATION
To augment drivers’ understanding of roadway geometry, departments of transportation (DOTs) often
install post mounted delineators (PMDs) and chevrons, especially at curves. The installation of such
devices is addressed by the Manual of Uniform Traffic Control Devices (MUTCD, online at
mutcd.fhwa.gov), which is the accepted standard for the application of roadway treatments. The MUTCD’s
language regarding the installation of such devices is fairly broad, and accordingly, there is wide variation
in the way in which individual DOTs design their deployment. PMDs are treated in section 3D of the
MUTCD, which describes them as guidance devices and that they may be used continuously (along
highway sections) or in specific regions (such as curves that warrant their use) at the discretion of the
governing DOT. The MUTCD recommends that PMDs should be installed “at locations where the
alignment might be confusing or unexpected, such as at lane reduction transitions and curves.” The
MUTCD also recommends their use where visibility is limited by darkness or inclement weather: “An
important advantage of [PMDs] in certain locations is that they remain visible when the roadway is wet or
snow covered.”
The design specification for PMDs is as follows: “Delineators shall be retroreflective devices mounted
above the roadway surface and along the side of the roadway in a series to indicate the alignment of the
roadway. Delineators shall consist of retroreflector units that are capable of clearly retroreflecting light
under normal atmospheric conditions from a distance of 300 meters (1,000 feet) when illuminated by the
high beams of standard automobile lights. Retroreflective elements for delineators shall have a minimum
dimension of 75 millimeters (3 inches).”
The MUTCD calls for placement of PMDs (of color consistent with the edge lines as prescribed in Section
3B.06 of the same) “on the right side of freeways and expressways and on at least one side of interchange
ramps.” The MUTCD also calls for the installation of red PMDs to mark truck escape ramps.
In addition to these standard locations, the MUTCD recommends the installation of PMDs on the outside
curve of interchange ramps, at median crossovers (for emergency services vehicle use), along acceleration

2-3
and deceleration lanes, and at narrowing lane transitions. It also states that PMDs may be provided on other
classes of roadways at the discretion of the governing DOT.
The MUTCD provides guidelines for the spatial parameters of installation. The manual specifies that PMDs
are to be mounted no higher than 1.2 meters, and should be mounted between 0.6 and 2.4 meters from the
shoulder’s paved edge. The MUTCD specifies that PMDs are to be installed no less than 60 meters and no
more than 120 meters apart on main tangent sections of roadway. The spacing of PMDs on curves is
specified as a linear distance from post to post along the circumference of the curve. The suggested spacing
is based on the radius of the curve, but should be no less than 6.1 meters and no more than 90 meters in the
curves. More closely spaced delineators should be closer to the curves.
ROADWAY VEGETATION
Practices for roadway vegetation differ according to the roadway application and the conditions at the
specific roadway location where vegetation is used. NYSDOT has an active vegetation management
system. Hundreds of species of vegetation grow alongside roads in NYS. Roadside vegetation includes
forest types, primarily northern hardwood trees in the northern part of the state, and oak and hickory in the
southern part of the state as well as along major river corridors. Most of the forest was cleared for
agriculture in the 17th through 19th centuries. In 1890, only 25% of the state was covered in forest; in
2005, 62% of the state was covered in forest as farmlands reverted back. Land that is not commercialized is
actively colonized by trees and shrubs, necessitating an active vegetation management program along
roadways by NYSDOT (Nowak, 2005).
Vegetation on roadsides is managed to:
• Provide adequate site visibility for drivers
• Prevent deadly fixed objects (e.g., trees)
• Maintain pavement by controlling drainage problems and pavement breakage by adjacent vegetation
Mowing is commonly used along areas away from the road; herbicides are used along roadway edges and
under guide rails and near signage where mowing is not feasible. Over 100,000 acres of roadside rights-of-
way (ROW) are mowed each year.
Living Snow Fences
Living snow fences (LSFs) employ trees or shrubbery to create a natural berm around which snow can
aggregate instead of drifting onto the roadway. Traditionally, snow fences create a barrier causing snow to
accumulate upwind of the snow fence. Blowing and drifting snow cause major problems for roadways and
DOTs that manage them in several ways. Snowdrifts can cause safety hazards such as reduced sight
2-4
distance around curves and at intersections, reduced effective roadway width and reduced effectiveness of
safety barriers (Tabler, 2003). Drifts that accumulate on roadways require increased resource use by
increasing snow removal costs. Mechanical snow removal costs are typically $3 per metric ton (Tabler,
2003). Snowdrifts may also contribute to pavement damage by allowing water to infiltrate under pavement
(Tabler, 2003). Blowing snow can reduce visibility for drivers on the roadway; reduced visibility may be a
factor in crash risk (Nixon et al., 2006). In Wyoming, studies done on Interstate 80, looking at a 10-year
period of data, indicated that 25% of all crashes occurred during blowing snow conditions in areas without
snow fences, compared to 11% in areas with snow fences (Tabler, 2003). Snow drifts can also dilute the
chemicals used to prevent ice build-up on roads, resulting in icy roadways (Nixon et al., 2006).
In Iowa, three years of testing showed that standing rows of corn could hold as much snow as traditional
(built) snow fences between four and six feet in height, and could be located much closer to the roadway.
The corn rows accumulate snow differently than traditional fences or trees in that the snow is stored
between the rows of corn. Allowing the corn rows to be placed along the roadway edge may increase the
willingness of adjacent farms to participate in LSF programs because it is more convenient for the farmer to
leave these rows standing at the edge of their field than in the middle of the field (outside the right of way
[ROW]). For the state of Iowa, a guideline of 16 to 24 rows of corn was recommended (with 22 inches
between each row) depending on the fetch (the distance over which snow can blow unimpeded) (Nixon et
al 2006). NYSDOT also uses corn rows as LSFs. Typically, farmers leave 8 to 12 rows of corn about 100
feet from the roadway edge. Farmers are paid above fair market value to leave such LSFs. An added benefit
to farmers is that these corn rows can reduce soil erosion and reduce wind speeds.
Iowa DOT conducted a study using switchgrass, in which a 40-foot wide section of grass, 60 feet from the
edge of the roadway, was planted and worked well as a LSF for the test year. The evaluation occurred
during a season of low average annual accumulation and it could not be determined whether such an LSF
could meet the needs of an average year or even an extreme year (Nixon et al., 2006).
LSFs take time to grow to full height, and more advanced planning is required when using LSFs as part of a
program to manage blowing snow. They require the DOT to lease the land from the owners for a longer
period time (Nixon et al., 2006).
Traditional snow fences constructed in New York are composed of wooden slates wired together and
supported by posts. They are often considered unattractive, are sensitive to weathering, and any broken
slats tend to leave a neglected appearance. As such, NYS uses an alternative LSF composed of densely
planted trees and shrubs in some locations. A mature LSF may capture up to twelve times more snow than
a traditional four-ft fence according to information published on the NYSDOT website.

2-5
Tree life (service life) is estimated at 50 to 75 years, versus five to seven years for a traditional snow fence.
Over a 50 year period span, installation and maintenance costs are four times less for a LSF than for a
traditional fence. The average costs for LSFs in NYS are $3/mile per year, compared to $185/mile per year
for a four-foot wood slat fence (NYSDOT website).
There are several disadvantages for LSFs. They require more real estate than traditional fences, new
plantings must be protected from grazing until they mature, and it takes five to seven years for LSFs to
provide effective control. LSFs are much more sensitive to soil conditions (such as pH, shallow soils and
salt tolerance). Temporary snow fences can be employed until component plantings reach effective
maturation (NYSDOT website).
Tree species is important to the effectiveness of the windbreak and to the compatibility with adjacent land
use, often farming. NYSDOT provides tree and shrub species recommendations and specifications on its
website. NYSDOT also uses corn rows as LSFs. LSFs incorporating trees and shrubs provide better
drainage than traditional snow fences and may reduce spring flooding. Trees in LSFs also improve / create
wildlife habitats.
Safety Issues that Trees Pose to Drivers
Although trees provide environmental benefits and provide aesthetic assets to communities, they also pose
a substantial risk to drivers if placed too close to the roadway. In 1999, FARS (Fatal Accident Reporting
System) reported that 8% of all fatal crashes involved trees. This percentage corresponds to 3,010 fatal
crashes. Fatal tree crashes occur most often on rural local roads, followed by rural major collectors
(NCHRP, 2003). Vehicular crashes with trees are strongly correlated with low traffic volume, roadway
geometry and overall roadside conditions (NCHRP, 2003).
Higher vehicular traffic volumes are correlated with fewer tree crashes. For ADT (average daily traffic)
categories of 1000 vpd (vehicles per day) and less, 22% to 24% of all crashes involving fixed objects are
caused by the vehicle striking trees. For roads with ADTs of 1000 to 4000 vpd, 16% of all crashes involve
trees, and for roads with ADTs of 7500 vpd, 11% of crashes involve trees. Conversely, crashes involving
guardrails, utility poles and signs increase as ADT increases.
On roads with high tree coverage, and with ADTs between 50 and 4000 vpd, the number of tree-related
accidents per mile per year goes down as the average distance from the travel lane to the tree line increases.
This reduction in the number of accidents is largest for roadways with little traffic (50 to 1000 vpd). On
roads with tree coverage between 1% and 15%, and with ADTs between 50 and 4000 vpd, the number of
tree-related accidents per mile per year decreases as a function of increasing distance only for roads with
ADTs between 2000 and 4000 vpd.

2-6
Records from the 1999 FARS database indicate that in 14% of all fatal accidents, trees were involved with
subsequent rollovers (NCHRP, 2003). Approximately 56% of all fatal tree crashes occurred at night, even
though there is typically more traffic during daylight hours than during non-daylight hours (NCHRP,
2003). Alcohol consumption is often cited as an influence of tree/vehicle crashes. More than 60% of drivers
involved in fatal vehicle/tree crashes had been drinking (Ziegler, 1986).
Drivers unfamiliar with the roads might also be correlated with tree and car accidents. In accident statistics
from Michigan, out-of-county residents were overrepresented in car/tree crash statistics (Ziegler, 1986).
Almost 50% of all tree crashes occur on curved roads (NCHRP, 2003), with 77% of these tree related
accidents occurring on the outside curve (Ziegler, 1986). Fatal tree accidents are correlated with larger tree
diameters. For fatal tree accidents, the median tree diameter at breast height (DBH) is 20 inches. In tree
crashes only sustaining injuries the DBH is 15 inches. However, hitting even a small tree (DBH of six
inches) does not guarantee safety (Ziegler, 1986).
An experimental program is underway in Pennsylvania in which trees are delineated by wrapping a 4-inch
reflective band around them at a height of 4 ft above the surface of the nearest traffic lane. This approach is
experimental and is only presently considered to be appropriate if removing the tree or placing a guardrail
in front of it is not an acceptable approach (NCHRP, 2003).
Protective Plantings
Planting dense shrubs along the roadway edge (in the clear zone) can help protect trees and cars in run-off-
the-road accidents (Huang, 1987); at the same time they can help prevent snow drifts on the roadway and
possibly, shield drivers from snow and oncoming headlight glare.
Shrubs have been used effectively to protect bridge piers located too close to the roadway. However, it may
take several years until shrubs are mature enough to be effective. Costs involved with protective plantings
are higher than with other mitigation techniques such as tree removal, delineators and advance warning
signs (Ziegler, 1986).
Creating an enclosed environment around streets can convey a feeling of narrowness to drivers and might
induce them to slow down and drive more carefully. In urban areas, street trees can protect pedestrians and
limit noise as well as delineate the roadway width, while creating a narrower space (Jaskiewicz, 2001).
The Wisconsin DOT Facilities Development Manual has information about using landscaping to provide a
functional purpose, not just an aesthetic one. Their recommendations are:

2-7
• Mitigation of Glare. Visual screens may partially or totally block oncoming headlight glare; however,
designers needs to balance drivers' needs to see and not hinder important information. Partial screens
may be better as they limit the amount of glare to flickering of light, which lets drivers know that the
screen divides the roadway. Evergreens are recommended as good visual screens.
• Visual Buffering. Visual buffers use smaller plantings to create a psychological separation between the
roadway and the surrounding environment.
• Noise Attenuation. Plantings are not effective as noise attenuators unless they are tall and very dense.
However, they can reduce the noise and sometimes create a perceived impression that the noise
problem has been reduced. It is important that the plants be high enough to exceed an imaginary line
between the noise source and the people affected.
• Impact Attenuation. Multi-stemmed shrubs can be used as supplemental impact attenuators (but the
Manual recommends they be used only in conjunction with other systems). Individual stems should
not exceed 4 inches, and plants should be spaced as densely as possible.
• Delineation. Plantings to be used as delineators where horizontal and vertical curvature might confuse
drivers (such as at the outside curve located at the top of a hill) or for tee intersections or cul-de-sacs,
where the road may end abruptly.
Traffic Calming
Traffic calming, defined as transportation techniques of slowing down traffic and decreasing traffic
volumes, is used to reduce vehicle speeds, as well as to make residents feel safer. In some cases, traffic
calming measured might reduce the need for enforcement (Corkle et al., 2001).
The City of Seattle has used traffic circles (which are larger than roundabouts) as traffic calming devices.
Over 700 traffic circles existed in Seattle in 1998. Landscaping is key in calming traffic as it shortens the
viewable vista and makes the space more attractive to residents. Bushes and shrubs are limited to 30 inches
in height, and trees have their limbs trimmed to 6 feet above ground. In Seattle, residents are responsible
for maintenance of the landscaping and must commit to maintaining it before it is constructed (Mundell,
1998).
Impacts on Animal Habitats
Barrier Effect. While roadkill is an obvious visible effect of roadside corridors, the effect of road
avoidance by animals caused by the presence of roadways is likely greater to the adjacent ecological
environment (Forman and Alexander, 1998). Road avoidance results in lower population densities for
many species. The effect distance, defined as the distance from a road at which a population decrease can
be detected, varies from 100 to 800 meters depending on the species (Forman and Alexander, 1998).
2-8
Roads serve as barriers to animal movement, with road width and traffic density being the greatest factors
in the barrier effect. The barrier effect causes distinct populations to arise on either side of the roadway
barrier; these populations tend to fluctuate more widely and have higher likelihood of extinction than larger
populations (Forman and Alexander, 1998).
Some species (such as whitetail deer) may be able to adapt by seeking out other habitats or by finding
better routes and times to cross roads. Other animals may not be able to alter their paths, specifically
migration paths, which might head directly across roads. For example, spotted salamanders migrate from
uplands to wet breeding areas at certain times and will not change their route (Forman, 2000).
The barrier effect impacts more species negatively and extends over a larger geographic area, than does the
effect of roadkill or road avoidance. Making roads more permeable to diminish barriers reduces the
demographic consequence, even though it may increase the amount of roadkill (Forman and Alexander,
1998).
Plant Diversity Effects. Plant diversity can greatly affect wildlife habitats. Soil adjacent to the roadway is
affected in many ways by construction practices. It is homogenized, leveled and filled in to create smooth
verges, and often compacted. Large rocks are removed and the soil profile is mixed both vertically and
horizontally. Air temperatures and soil temperatures alongside roadways are raised and relative humidity is
lower due to higher impact of solar insolation, creating a road microclimate (Forman, 2007; Coffin, 2007).
Road corridors are a source of chemical spread, such as road salt and heavy metals, as well as a corridor for
seed transport, from mechanisms such as vehicles, wind and wildlife (Coffin, 2007; Forman, 2007).
Fast growing, shade intolerant species often have competitive advantages along the roadway edge. As a
result, plant diversity can be reduced with only a few species dominating. Species density has been found to
be negatively correlated with road density and positively correlated with setback from the road edge
(Coffin, 2007). Methods used for vegetation management (e.g., mowing, herbicide, wood cutting, or fire)
also impact plant diversity (Forman, 2007).
Most roadside verges are mowed and can be characterized as “grassy.” Grassy verges are not conducive to
supporting animal habitats. Deadwood, a characteristic of shrubland and woody vegetation, is necessary to
support vertebrate and invertebrate biodiversity. Dead branches and logs provide habitat and food for
numerous species and the decomposing matter enriches the soil (Forman, 2007).
Vehicular Crashes Involving Deer. Estimates indicate that 1.5 million deer-vehicles crashes (DVCs)
occur each year nationwide (Kolb, 2006). More than $1 billion in vehicle damage and approximately 150

2-9
human fatalities are incurred each year. In New York State, in 2006, there were over 11,000 animal-vehicle
crashes, accounting for four fatalities and 780 injuries (Deer Crash New York State Data, 2006).
Research studies have not shown a quantitative relationship between vegetation management practices and
the number of DVCs. Research studies have shown relationships between numbers of white-tailed deer
(common east of the Rocky Mountains) and specific types of vegetation (Knapp, 2004).
A 1998 study from the West Virginia Department of Highways investigated animal activity around
deliberately planted highway right-of-way areas, planted with crown vetch, Sericea lespedaza and fescue.
The study found a statistically significant preference for crown vetch by white-tailed deer.
A Ball State University study undertaken in the mid-1980s evaluated potential animal vehicle collisions
and their relationships to specific types of shrubs. Fourteen shrub types were planted over 79 plots and
compared to 77 grassy areas as controls. There was no statistically significant difference between the
shrubby sites and grassy sites in the number of animal carcasses found at each type of location. In addition,
the number of live birds and rabbits found was increased in the shrubby areas. Researchers concluded that
right-of-ways can be managed with shrubby vegetation to increase wildlife use without increasing the
number of animal vehicle collisions.
Research studies investigating the connection, if any, between roadway lighting and DVCs are limited.
Two studies cited by Reed et al. from the late 1970s and early 1980s did not show a significant difference
between illuminated and non-illuminated roads and the number of crashes per deer crossings (Knapp 2004).
Recommendations for Various Roadside Types. According to Forman (2007), there are five roadside
vegetation choices appropriate for lining a roadside, in a 10 meter zone from the road edge:
• Mowed grass (typical height of 0.3 meters)
• Meadow grass (typical height of 1 meter)
• Tall shrubs (typical height of 2.5 meters)
• Small trees (typical height of 0.5 to 15 meters)
• Forest/wooded (typical height of 5 to 30 meters)
Maintenance requirements and cost are lowest for wooded areas and highest for mowed grass areas.
Wildlife cover for large animals is greatest for tall shrubs and forest/wooded areas, and small scale wildlife
are provided cover by meadows and small shrubs. These roadside vegetation types may increase animal-
related vehicle collisions. Increasing the setbacks of shrubs from the roadway edge can increase driver
visibility and might help reduce roadkill (Forman, 2007).

2-10
Tall shrubs are recommended by Forman (2007) as the preferred vegetation type for most median strips,
because they offer glare control via headlight screening of oncoming traffic, they provide cover to many
forms of wildlife, and they can assist in decreasing erosion and sedimentation along roadways.
Biomass
Introduction. Biomass refers to using plant material to make electricity or fuels. The primary ways to use
biomass for energy are:
• Corn Ethanol. Food crops such as corn and sugar cane are used to produce ethanol. More generally,
microorganisms and enzymes are used to ferment sugars or starches to produce alcohols.
• Cellulosic Ethanol. Non-food crops such as switchgrass and wood are used to produce ethanol.
Microorganisms or enzymes convert cellulose into alcohols.
• Biodiesel. Oily seeds such as soybean or sunflower are used to produce “transesterified lipids” which
can be used in the same engines and boilers as diesel fuel. On a smaller scale, used vegetable oil from
restaurants can be the feedstock.
• Electricity and/or Heat. Woody crops are burned in power plants or combined heat and power (CHP)
plants, alone or co-fired with coal.
Crops. Biomass crops are often divided by “generation,” but there are different systems in use, which
creates some confusion. The system used by the federal government is (R. Rausch, NYS Department of
Agriculture & Markets, personal communication, October 2008):
• First Generation. Biomass crops that can also be used as food for people or animals, e.g., corn for
ethanol or soybean or sunflower seeds for biodiesel.
• Second Generation. Agricultural byproducts, e.g., low grade timber cast off from logging practices.
• Third Generation. Dedicated energy crops, e.g., fast growing salix willow hybrids, switchgrass, and
miscanthus.
First generation crops probably cannot be grown at highway medians. They require intensive farming
practices such as irrigation, pesticides, and regular use of farm machinery, all of which are difficult to
implement on highway medians. They are more sensitive to the polluted runoff from the roads (R. Rausch,
NYS Department of Agriculture & Markets, personal communication, October 2008). (Medians are
designed to double as road drainage areas.) And they require good soil to grow. Highway medians are
engineered for their structural strength, typically constructed of hard packed material that are then covered
with a thin layer of soil and planted for erosion control. This creates one of the “poorest conditions possible
to grow anything in,” and it is unlikely that corn or other first generation crops would grow well in these
2-11
conditions (T. Kilcer, Rensselaer County Cornell Cooperative Extension, personal communication, October
2008)
Third generation crops, on the other hand, could be grown at highway medians. Further, they can serve
purposes other than as biofuels, as discussed above; for example, NYSDOT is conducting a three-year
research program to examine the use of fast growing willows as a snow fence, and the New York State
Thruway Authority has expressed an interest in willows for light deflection, snow fencing, and crash
barriers. The Thruway Authority has planted a test patch of willows along I-90 in Silver Creek, south of
Buffalo (T. Volk, SUNY-ESF, personal communication, October 2008).
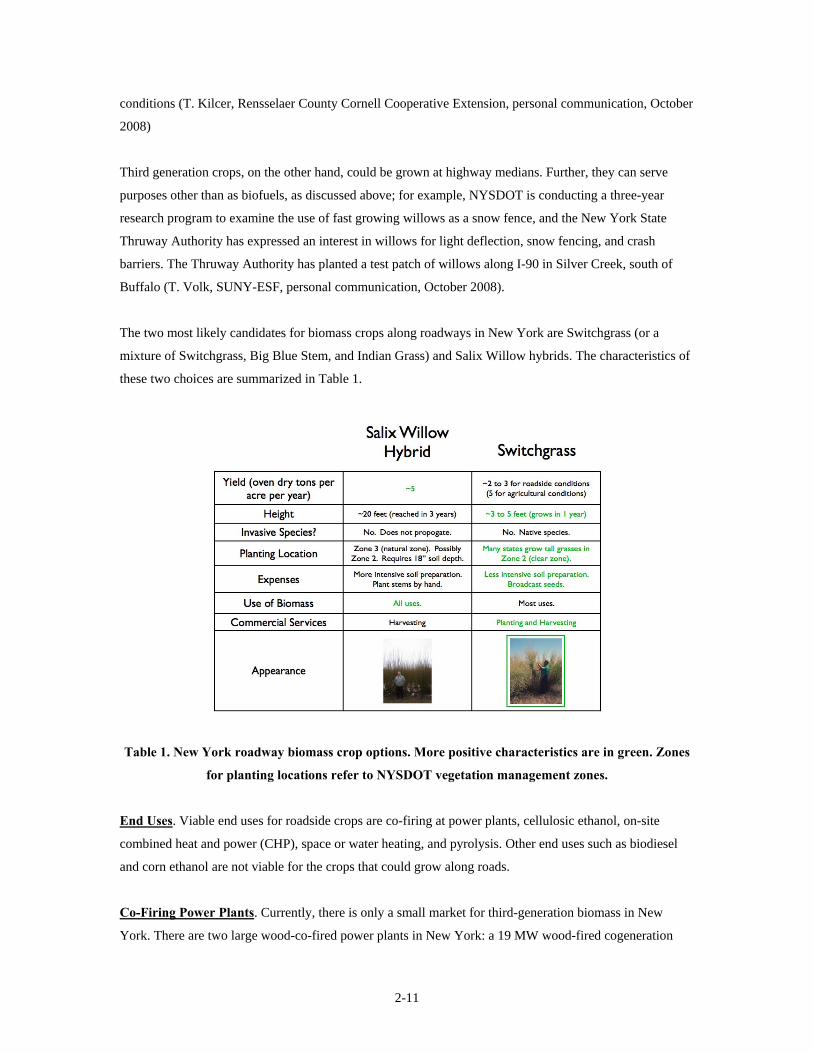
The two most likely candidates for biomass crops along roadways in New York are Switchgrass (or a
mixture of Switchgrass, Big Blue Stem, and Indian Grass) and Salix Willow hybrids. The characteristics of
these two choices are summarized in Table 1.
Table 1. New York roadway biomass crop options. More positive characteristics are in green. Zones
for planting locations refer to NYSDOT vegetation management zones.
End Uses. Viable end uses for roadside crops are co-firing at power plants, cellulosic ethanol, on-site
combined heat and power (CHP), space or water heating, and pyrolysis. Other end uses such as biodiesel
and corn ethanol are not viable for the crops that could grow along roads.
Co-Firing Power Plants. Currently, there is only a small market for third-generation biomass in New
York. There are two large wood-co-fired power plants in New York: a 19 MW wood-fired cogeneration

2-12
power plant in Lyonsdale, NY (northeast of Syracuse) owned by Catalyst Renewables Corp., and a
similarly sized plant in Chateaugay, NY owned by Boralex Inc. Double A Willow, a commercial nursery,
signed a contract with Catalyst Renewables to supply shrub willow energy crop cuttings to the plant
(according to www.catalystrc.com), but both plants primarily burn wood residue (second generation
biomass). There are many smaller combined heat and power plants in New York that also burn wood (a list
is online at www.dec.ny.gov/lands/46935.html). Willow growers could expect to receive the going rate for
wood chips when selling to these plants.
Co-firing of biomass is anticipated to increase in New York also, including at NRG Energy’s Dunkirk coal
plant. NRG’s Dunkirk facility has a 100 MW boiler which has been modified to burn up to 20% wood.
Three large-scale tests were conducted in the 1990s (when the plant was owned by Niagara Mohawk), and
NRG has recently indicated plans to begin burning wood there. NRG also has plans to convert part of its
380 MW Huntley plant in Tonawanda, NY to burn wood. The anticipated price for fast growing willow at
these plants is over $35/wet ton. In typical field conditions, willows can produce about 10 wet tons per acre
per year, for a revenue of about $350 per acre per year (L. Abrahamson, SUNY-ESF, personal
communication, October 2008). This compares with about $631 per acre for corn and $389 per acre for
soybeans in 2008 in Illinois (Schnitkey and Good, 2008).
Cellulosic Ethanol. Because median strip crop harvesting would take some years to develop, it makes
sense to anticipate future biomass markets. There is a great deal of R&D effort on cellulosic ethanol
production. The New York State Department of Agriculture & Markets has invested over $25 million in the
development and construction of two cellulosic ethanol facilities in New York. One of the recipients is
Catalyst Renewables Corp., which will build the plant next to its existing Lyonsdale facility (mentioned
above). The other company is Massachusetts-based Mascoma Corp., which will build a plant in Greece,
NY (north of Rochester). These companies are taking advantage of research programs at Cornell University
and the State University of New York (SUNY) College of Environmental Science and Forestry (ESF).
Cellulosic ethanol will be able to use switchgrass (Burden, 2008) and miscanthus, two crops that are
probably well suited for median strips, as feedstock.
Combined Heat and Power and Boilers. CHP equipment is used to provide electricity on site. Waste heat
is used for space or water heating. Currently, gasification CHP and direct-combustion boilers are viable end
use for willows or other woody biomass. Commercially available CHP equipment includes Community
Power Corporation’s BioMax system. In another application, boilers are used to capture only the heat, but
they can still be up to 90% efficient.
2-13
Promising tests have been conducted on using switchgrass in CHP and boiler equipment, but the grass first
needs to be pelletized and equipment must be modified to accommodate the high ash content of the grass
(Cornell University, 2008).
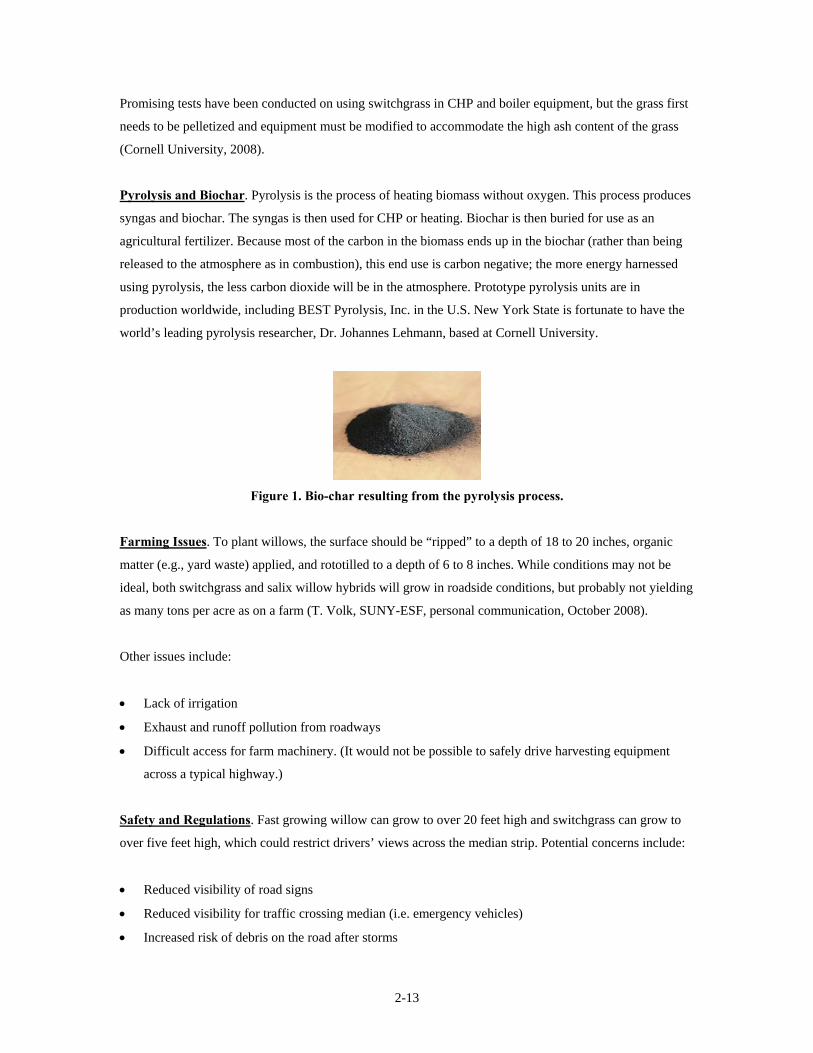
Pyrolysis and Biochar. Pyrolysis is the process of heating biomass without oxygen. This process produces
syngas and biochar. The syngas is then used for CHP or heating. Biochar is then buried for use as an
agricultural fertilizer. Because most of the carbon in the biomass ends up in the biochar (rather than being
released to the atmosphere as in combustion), this end use is carbon negative; the more energy harnessed
using pyrolysis, the less carbon dioxide will be in the atmosphere. Prototype pyrolysis units are in
production worldwide, including BEST Pyrolysis, Inc. in the U.S. New York State is fortunate to have the
world’s leading pyrolysis researcher, Dr. Johannes Lehmann, based at Cornell University.
Figure 1. Bio-char resulting from the pyrolysis process.
Farming Issues. To plant willows, the surface should be “ripped” to a depth of 18 to 20 inches, organic
matter (e.g., yard waste) applied, and rototilled to a depth of 6 to 8 inches. While conditions may not be
ideal, both switchgrass and salix willow hybrids will grow in roadside conditions, but probably not yielding
as many tons per acre as on a farm (T. Volk, SUNY-ESF, personal communication, October 2008).
Other issues include:
• Lack of irrigation
• Exhaust and runoff pollution from roadways
• Difficult access for farm machinery. (It would not be possible to safely drive harvesting equipment
across a typical highway.)
Safety and Regulations. Fast growing willow can grow to over 20 feet high and switchgrass can grow to
over five feet high, which could restrict drivers’ views across the median strip. Potential concerns include:
• Reduced visibility of road signs
• Reduced visibility for traffic crossing median (i.e. emergency vehicles)
• Increased risk of debris on the road after storms
2-14
• Increased risk of wildlife/vehicle encounters
NYSDOT and the Thruway Authority both require setbacks from roads for solid objects in case of car
crashes. However, there is uncertainty among NYSDOT engineers as to whether willows should be
considered solid objects or something that can dissipate energy. There is one known case of a car running
off the road and hitting a row of willows in New York, and the willows acted to dissipate energy (T. Volk,
SUNY-ESF, personal communication, October 2008).
Bonnie Harper-Lore, an employee of the Federal Highway Administration (FHWA), promotes the planting
of native grasses in highway “clear zones.” Michigan and Minnesota both legislated that along rural
highways, grasses would be mowed only once a year beyond 8 to 10 feet from the road edge. These states
have not noted an increase in deer-car collisions. Over half the states have policies limiting mowing so as
not to maintain the traditional 30-foot clear zone. Currently, five states are participating in the first large-
scale study of planting native grasses along highways, involving the planting of 100 acres of native grass
along I-35 (B. Harper-Lore, FHWA, personal communication, December 2008).
Environmental. Different biofuels have different environmental impacts. For example, some scientists
have calculated that fuels made from biomass require more energy to produce than is contained in the
resulting fuel, resulting in a negative energy balance (Patzek, 2004; Pimentel and Patzek, 2005). There
seems to be a consensus that biomass electricity and cellulosic ethanol are more environmentally beneficial
than corn ethanol.
Demonstration Projects. New York State could demonstrate the use of biomass along roadways in two
ways. First, a for-profit business could be hired to plant and harvest switchgrass along roadways at no cost
to the state in exchange for owning the biomass crop. The biomass would be sold to a co-firing power
plant. This would reduce New York’s mowing expenses (beyond 10 feet from the road). One company, for
example, Mesa Reduction Engineering of Auburn, NY, expressed a willingness to enter into such an
arrangement (M. McArdle, Mesa Reduction Engineering, personal communication, December 2008).
Second, a similar for-profit business could be hired to plant and harvest switchgrass along highways. A
New York State agency or authority could then use this biomass in a pyrolysis unit at a building facility or
rest stop. The syngas produced could be used for heating or CHP. The resulting bio-char could be used for
fertilizer, such as in wetland creation.
Alternatives to Biomass. An alternative method of harvesting energy on median strips is to install solar
photovoltaic (PV) panels there. They would have the advantage of avoiding all farming, market, safety, and
environmental issues faced by biomass. If a 4 m wide array of PV panels were installed along the entire
2-15
length of the NY Thruway system, it would generate about 500 million kWh per year, based on a length of
798 km, solar radiation of about 3.6 kWh/m2/day, and PV efficiency of 12%. This amount of energy is
about 0.3% of the state's annual electricity use.
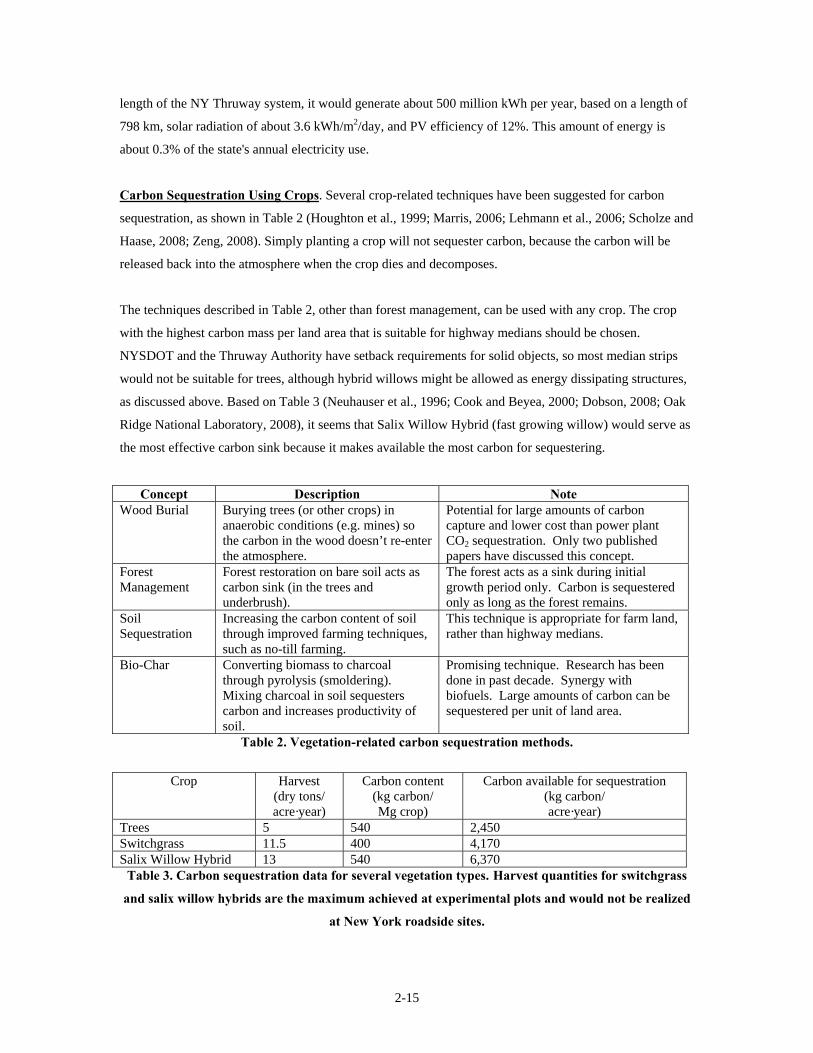
Carbon Sequestration Using Crops. Several crop-related techniques have been suggested for carbon
sequestration, as shown in Table 2 (Houghton et al., 1999; Marris, 2006; Lehmann et al., 2006; Scholze and
Haase, 2008; Zeng, 2008). Simply planting a crop will not sequester carbon, because the carbon will be
released back into the atmosphere when the crop dies and decomposes.
The techniques described in Table 2, other than forest management, can be used with any crop. The crop
with the highest carbon mass per land area that is suitable for highway medians should be chosen.
NYSDOT and the Thruway Authority have setback requirements for solid objects, so most median strips
would not be suitable for trees, although hybrid willows might be allowed as energy dissipating structures,
as discussed above. Based on Table 3 (Neuhauser et al., 1996; Cook and Beyea, 2000; Dobson, 2008; Oak
Ridge National Laboratory, 2008), it seems that Salix Willow Hybrid (fast growing willow) would serve as
the most effective carbon sink because it makes available the most carbon for sequestering.
Concept Description Note Wood Burial Burying trees (or other crops) in
anaerobic conditions (e.g. mines) so the carbon in the wood doesn’t re-enter the atmosphere.
Potential for large amounts of carbon capture and lower cost than power plant CO2 sequestration. Only two published papers have discussed this concept.
Forest Management
Forest restoration on bare soil acts as carbon sink (in the trees and underbrush).
The forest acts as a sink during initial growth period only. Carbon is sequestered only as long as the forest remains.
Soil Sequestration
Increasing the carbon content of soil through improved farming techniques, such as no-till farming.
This technique is appropriate for farm land, rather than highway medians.
Bio-Char Converting biomass to charcoal through pyrolysis (smoldering). Mixing charcoal in soil sequesters carbon and increases productivity of soil.
Promising technique. Research has been done in past decade. Synergy with biofuels. Large amounts of carbon can be sequestered per unit of land area.
Table 2. Vegetation-related carbon sequestration methods.
Crop Harvest
(dry tons/ acre·year)
Carbon content (kg carbon/ Mg crop)
Carbon available for sequestration (kg carbon/ acre·year)
Trees 5 540 2,450 Switchgrass 11.5 400 4,170 Salix Willow Hybrid 13 540 6,370
Table 3. Carbon sequestration data for several vegetation types. Harvest quantities for switchgrass
and salix willow hybrids are the maximum achieved at experimental plots and would not be realized
at New York roadside sites.

2-16
Of the four techniques described in Table 2, it seems the biochar concept is most promising in the short
term, while wood sequestration probably deserves further investigation and field trials. Forest growth is not
realistic on a highway median, and it acts as a carbon sink only during the initial growth phase. Soil
sequestration is more appropriate for farms than highway medians.
The bio-char concept has received a lot of academic attention recently. The biochar technique was used
first used by natives of the Amazon 7000 years ago to increase the productivity of their soil. The “terra
preta” (black land) they created was 9% carbon, compared with 0.5% carbon of surrounding soil. The
technique was discovered by western culture in 1879, pioneered by Wim Sombroek in the 1950s, and is
now being actively researched by academics such as Johannes Lehmann of Cornell University. Lehmann
estimates that bio-char could eventually store up to 9.5 billion tons of carbon per year, which is more than
is emitted through fossil fuel use today (Marris, 2006).
Alternatives to Carbon Sequestration. It may be possible to use vegetation to absorb pollution other than
carbon dioxide. For example, research sponsored by the National Aeronautics and Space Administration
(NASA) identified houseplants that could filter pollutants from indoor air (Wolverton and Wolverton,
1996). It is possible that these or other plants could absorb pollutants along highways.
Spectral Reflectance Measurement of Vegetation
As described before, one of the aims of this study is to investigate the possibility of using roadside
vegetation to reinforce the visual information on highway. In order to assess the performance of lighting
and vegetation roadway systems, attention must be given to the optical characteristics of vegetation, such as
spectral reflectance, density and light diffusion. For a number of different plant species, each candidate
species was evaluated in terms of sunshine requirements, moisture use, height, width, geographic
requirements, maintenance costs, and spectral reflectance properties. Several species of vegetation that
featured low maintenance requirements and were capable of growing along the roadside in New York State
were selected for further evaluation. Samples of each species, including the leaves, stems and flowers
(when applicable) were collected from a local plant nursery (Faddegon’s, Latham, NY ) and spectral
reflectance measurements were made on the same day that the samples were collected to ensure that they
were still fresh.
As shown in Figure 2, the experimental apparatus setup consisted of a wooden box with white diffuse paint
(17 by 16 by 27 inches), an incandescent lamp (Osram Sylvania, 100W), a D75 fluorescent lamp
(GretagMacbeth, 40W) and a spectroradiometer (SpectraScan, PR705) connected to a computer for data
storage. A standard lambertian reflection plate (Labsphere) with known spectral reflectance properties was
used for comparison purposes. An incandescent lamp was chosen as the light source because of its

2-17
continuous spectral power distribution. The D75 fluorescent source was applied to supplement the
incandescent light source due to its lack of energy in the short wavelength portion of the visible spectrum.
Figure 2. Experimental setup for the spectral reflectance measurements.
The samples and the standard plate were placed at the same location inside the box and the spectral power
distributions (SPDs) of the light reflected from the objects were measured by the SpectraScan. Then, the
spectral reflectance of the sample could be obtained according to the positive correlation between the SPD
and the spectral reflectance (using Equation 1). Spectral reflectance measurements were conducted under
both incandescent light and D75 light, and the reflectance values of each type of vegetation under different
types of light sources with known SPDs were also calculated (using Equation 2). These latter values were
considered as a criterion of light source selection for subsequent analysis.
plate
sample
plate
sample
eReflectanc
eReflectanc
SPD
SPD= (Equation 1)
∫
∫
××
×××=
780
380lamp
780
380lamp
d)V(SPD
d)V(flectanceSpectralReSPD
eReflectanc
λλ
λλ (Equation 2)
The data on habitat and the optical characteristics of each species that was evaluated are tabulated in
Appendix A. It is important to mention that the samples (e.g., leaves, stems or flowers) are not lambertian

2-18
(diffusely reflecting) materials, and the incandescent lamp (a point source) and the D75 fluorescent lamp (a
diffuse source) are geometrically different. Therefore, specular reflections sometimes were present on the
sample surfaces, resulting in more light reflected into the spectroradiometer. This effect sometimes caused
there to be different reflectance curves for some materials under the incandescent and D75 illumination.
The spectral reflectance curves of the leaves of all the samples featured the same trends, reaching a peak
around 550 nm and having higher reflectance values in the longer wavelength region (longer than 700 nm).
The reflectance calculations for different light sources did not show any substantial differences under metal
halide (MH), high pressure sodium (HPS) and incandescent lamp (INC) illumination. Using the spectral
distribution of a green light emitting diode (LED) with a peak wavelength 535 nm, there tended to be
slightly higher reflectance values (around 1% to 3% higher) than the reflectance values under the other
light sources. Overall, the reflectance values of the leaves tended to range from about 10% to 30%, but
most were typically around 20%, and this latter value was used in subsequent calculations of light levels
described below.
A caveat about the data presented in Appendix A is that they represent living plants during the growing
season; during wintertime, plants might be expected to turn brown, usually increasing in reflectance but
decreasing in overall density because of leaf loss. Some plant species will fall to the ground as they die in
wintertime while others will remain standing.
SUMMARY
In general, lighting practices for roadway applications are focused on the provision of illuminance using
fixed, pole-mounted systems consisting of a relatively small subset of equipment types (e.g., luminaires,
lamps, poles) to facilitate ease of maintenance and avoid impossibly large product inventories. Lighting
systems, both along the roadway and from vehicle-mounted headlights, are supplemented by roadway
delineators, pavement markings to take advantage of illumination from headlights, since it would be
prohibitively expensive to illuminate all roadways. Vegetation management practices are important
components of the roadway design and engineering process, but vegetation is not generally considered to
be a deliberate part of the roadway visibility system, except in certain cases such as trimming of trees when
branches begin to obscure roadway lighting, mowing or cutting when vegetation might block views of
signage along the road, or using vegetation in highway medians as glare shields. Subsequent sections of
this report discuss ways in which lighting and vegetation might be integrated for the benefit of the roadway
user and of transportation agencies in terms of cost and energy use.
3-1
Section 3
ECOLUMINANCE CONCEPT
As described above, roadway lighting primarily uses fixed, pole-mounted lighting systems to provide
illuminance (defined as the density of light flux falling on a surface) on and around the roadway, for the
purpose of illuminating potential hazards that might not be able to be seen with conventional vehicle
headlights. There is evidence that roadway illumination practices improve nighttime driving safety by
contributing to reduced crashes (IESNA, 1989; CIE, 1992). Current research at the Lighting Research
Center for the National Cooperative Highway Research Program (NCHRP) is looking at identifying
nighttime crash reduction values associated with roadway lighting. Roadway delineation practices also
suggest that providing luminance (analogous to the brightness of a surface or object, regardless of the
amount of light falling on it) and not only illuminance can be an efficient way to provide visual
information. Roadway delineator patterns help drivers identify roadway edge locations, information about
curves, and lane positions, even though these systems do not provide illumination that makes other objects
visible. In a similar manner, roadside vegetation could serve as a form of delineation to provide information
about the geometrical characteristics of roads. In combination with vehicle headlamps, vertical surfaces of
roadside vegetation could be an energy-efficient delineation system that provides luminance for drivers.
The concept of using vegetation to provide luminance information to drivers is termed, in this report,
ecoluminance. The prefix of this term, "eco-" denotes environmental stewardship.
EXPLANATION OF CONCEPT
Compared with many general roadway illumination systems that provide illuminance, applications and
systems that provide luminance can result in substantially lower energy use. The reasons for this are two-
fold. One reason for the relatively high power of lamps used for roadway lighting (e.g., 250 to 400 W)
relative to those used in interior lighting (e.g., 32 to 40 W) is that the former lamps are utilized on very tall
poles (typically 10 to 15 m in height) in order to avoid glare and excessive fluctuations in light level on the
roadway surface, whereas interior lighting systems are mounted at ceiling heights that are typically only 3
m, and glare for interior lighting is less critical than for roadway lighting. Higher mounting heights,
coupled with the inverse-square law (Rea, 2000), means a light source that doubles in height must
quadruple in output to produce the same illuminance on the roadway. By using luminaires with controlled
optical distributions to illuminate only the objects of interest and thereby to increase only their luminance,
energy efficiency is increased, as characterized by application efficacy (Rea and Bullough, 2001).
When illuminating vegetation, for example, one could use relatively small and low-wattage landscape
lighting equipment. Since these luminaires are designed to light a relatively small area from a relatively
close distance, they can do so using low wattages. Further, if vegetation is located in an area where vehicle
3-2
headlights can illuminate it, it could be possible to make the vegetation highly visible without any electric
lighting whatsoever.
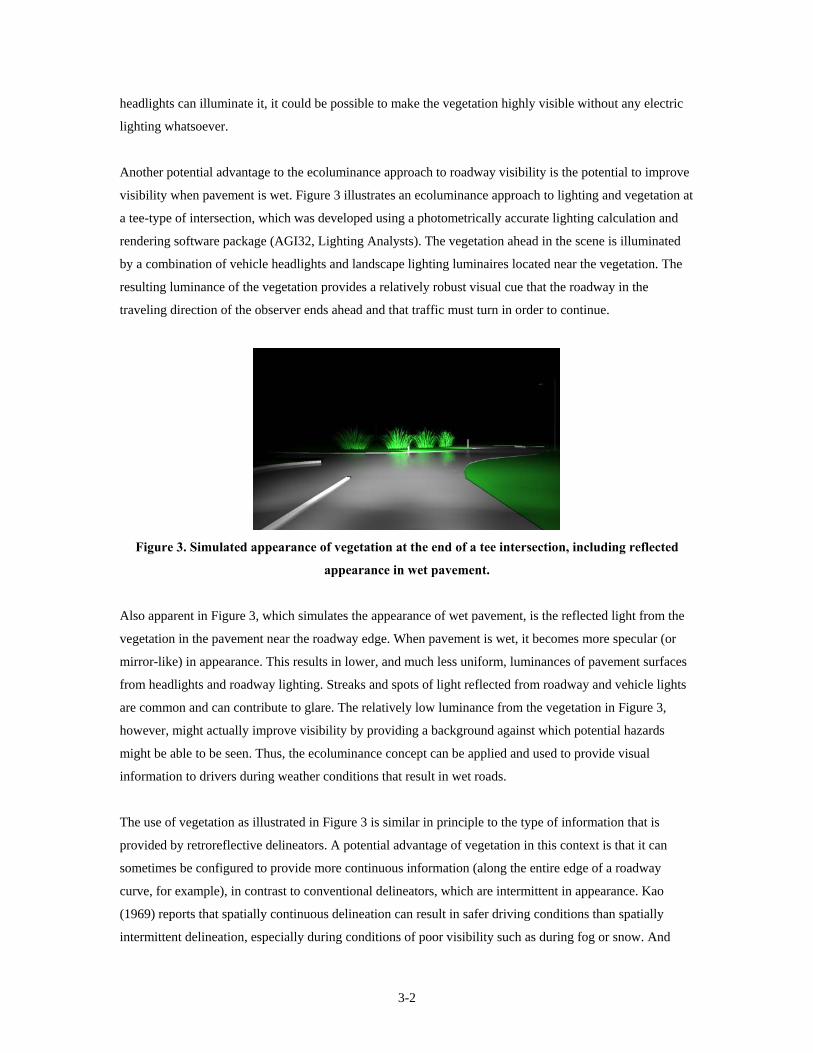
Another potential advantage to the ecoluminance approach to roadway visibility is the potential to improve
visibility when pavement is wet. Figure 3 illustrates an ecoluminance approach to lighting and vegetation at
a tee-type of intersection, which was developed using a photometrically accurate lighting calculation and
rendering software package (AGI32, Lighting Analysts). The vegetation ahead in the scene is illuminated
by a combination of vehicle headlights and landscape lighting luminaires located near the vegetation. The
resulting luminance of the vegetation provides a relatively robust visual cue that the roadway in the
traveling direction of the observer ends ahead and that traffic must turn in order to continue.
Figure 3. Simulated appearance of vegetation at the end of a tee intersection, including reflected
appearance in wet pavement.
Also apparent in Figure 3, which simulates the appearance of wet pavement, is the reflected light from the
vegetation in the pavement near the roadway edge. When pavement is wet, it becomes more specular (or
mirror-like) in appearance. This results in lower, and much less uniform, luminances of pavement surfaces
from headlights and roadway lighting. Streaks and spots of light reflected from roadway and vehicle lights
are common and can contribute to glare. The relatively low luminance from the vegetation in Figure 3,
however, might actually improve visibility by providing a background against which potential hazards
might be able to be seen. Thus, the ecoluminance concept can be applied and used to provide visual
information to drivers during weather conditions that result in wet roads.
The use of vegetation as illustrated in Figure 3 is similar in principle to the type of information that is
provided by retroreflective delineators. A potential advantage of vegetation in this context is that it can
sometimes be configured to provide more continuous information (along the entire edge of a roadway
curve, for example), in contrast to conventional delineators, which are intermittent in appearance. Kao
(1969) reports that spatially continuous delineation can result in safer driving conditions than spatially
intermittent delineation, especially during conditions of poor visibility such as during fog or snow. And

3-3
certainly, the use of vegetation along roadway edges in this case does not preclude the use of conventional
delineators.
IMPLEMENTING ECOLUMINANCE SOLUTIONS
Cognizant that a nearly infinite number of combinations of lighting equipment could be used to create
visual effects such as that illustrated in Figure 3, a limited set of equipment and materials is proposed, with
which roadway lighting applications can be devised using the ecolumiance concept. These include (Figure
4):
• Vegetation species suitable for use in the local region of New York State (Weston et al., 2008)
• Retroreflective delineators
• Small, low-wattage luminaires designed to focus light toward vegetation (e.g., landscape lighting
luminaires) to produce luminance
• Luminaires with controlled optical systems (e.g., similar in concept to the reflector and projector
systems used to produce cutoff beam patterns in vehicle headlights) for providing localized
illuminance at locations such as crosswalks or vehicle merge/diverge areas where visibility of possible
hazards is important
a) b) c) d)
Figure 4. The four elements of the ecoluminance toolbox.
ECOLUMINANCE APPLICATIONS CONSIDERED FOR EVALUATION
Based on discussions among project team members, with NYSERDA and NYSDOT project managers, and
with members of NYSDOT staff in the areas of vegetation management and landscape architecture, four
roadway applications were selected for further refinement based on the ecoluminance approach defined
above, and were evaluated. These applications were:
• Roundabouts
• Curves along interchanges and exit/entrance ramps
• Urban boulevards
• Highway rights-of-way

3-4
Figure 5 provides thumbnail sketches of ecoluminance concepts (in plan or perspective view) for each of
these roadway applications. In this figure, vegetation is represented by olive green elements, retroreflective
delineators are represented by orange elements, luminance-producing lighting systems are shown in bright
green, and illuminance-producing lighting systems are represented by cyan elements.
a) b)
c) d)
Figure 5. Ecoluminance concept sketches for a) roundabouts, b) curves and exit ramps, c) urban
boulevards, and d) highway rights-of-way.
For the roundabout application (Figure 5a), vegetation in the central portion of the roundabout can serve a
delineation function to identify the inner edge of the roadway beyond which traffic should not proceed, and
might also serve to reduce glare from oncoming traffic at the opposite end of the roundabout. Low level
landscape luminaires could illuminate the vegetation to increase its luminance if vehicle headlights were
not sufficient, and illumination of the travel lanes within the roundabout would be accomplished using
cutoff-type luminaires, providing directional illumination that makes objects in the travel lanes appear
brighter than their surrounding backgrounds. The use of cutoff optics for these luminaires would be
important in order to avoid glare to traffic approaching and waiting to enter the roundabout.
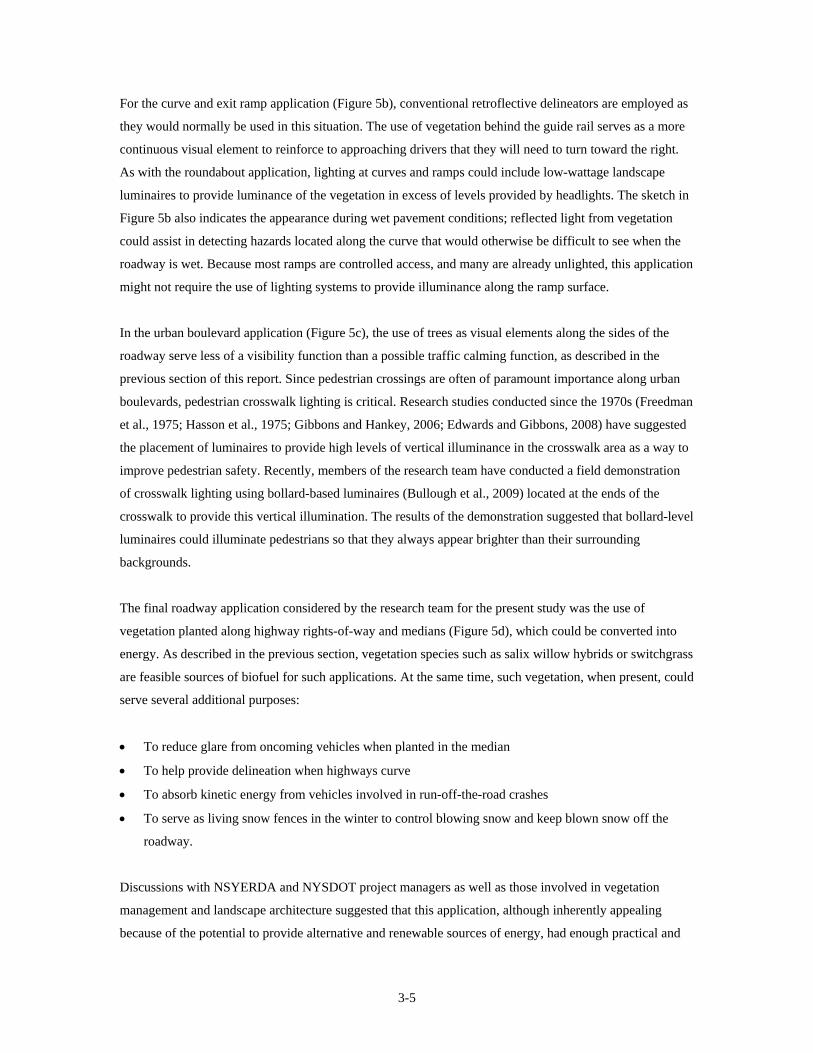
3-5
For the curve and exit ramp application (Figure 5b), conventional retroflective delineators are employed as
they would normally be used in this situation. The use of vegetation behind the guide rail serves as a more
continuous visual element to reinforce to approaching drivers that they will need to turn toward the right.
As with the roundabout application, lighting at curves and ramps could include low-wattage landscape
luminaires to provide luminance of the vegetation in excess of levels provided by headlights. The sketch in
Figure 5b also indicates the appearance during wet pavement conditions; reflected light from vegetation
could assist in detecting hazards located along the curve that would otherwise be difficult to see when the
roadway is wet. Because most ramps are controlled access, and many are already unlighted, this application
might not require the use of lighting systems to provide illuminance along the ramp surface.
In the urban boulevard application (Figure 5c), the use of trees as visual elements along the sides of the
roadway serve less of a visibility function than a possible traffic calming function, as described in the
previous section of this report. Since pedestrian crossings are often of paramount importance along urban
boulevards, pedestrian crosswalk lighting is critical. Research studies conducted since the 1970s (Freedman
et al., 1975; Hasson et al., 1975; Gibbons and Hankey, 2006; Edwards and Gibbons, 2008) have suggested
the placement of luminaires to provide high levels of vertical illuminance in the crosswalk area as a way to
improve pedestrian safety. Recently, members of the research team have conducted a field demonstration
of crosswalk lighting using bollard-based luminaires (Bullough et al., 2009) located at the ends of the
crosswalk to provide this vertical illumination. The results of the demonstration suggested that bollard-level
luminaires could illuminate pedestrians so that they always appear brighter than their surrounding
backgrounds.
The final roadway application considered by the research team for the present study was the use of
vegetation planted along highway rights-of-way and medians (Figure 5d), which could be converted into
energy. As described in the previous section, vegetation species such as salix willow hybrids or switchgrass
are feasible sources of biofuel for such applications. At the same time, such vegetation, when present, could
serve several additional purposes:
• To reduce glare from oncoming vehicles when planted in the median
• To help provide delineation when highways curve
• To absorb kinetic energy from vehicles involved in run-off-the-road crashes
• To serve as living snow fences in the winter to control blowing snow and keep blown snow off the
roadway.
Discussions with NSYERDA and NYSDOT project managers as well as those involved in vegetation
management and landscape architecture suggested that this application, although inherently appealing
because of the potential to provide alternative and renewable sources of energy, had enough practical and

3-6
legal limitations that it should probably not be considered further as one of the ecoluminance applications.
For this reason, ecoluminance concepts for the first three applications: roundabouts, curves and exit ramps,
and urban boulevards, were developed and evaluated. Subsequent sections describe the criteria and tools
used for evaluation, and the results of those evaluations.
4-1
Section 4
CRITERIA AND TOOLS FOR EVALUATION
Any system used along the roadway must meet several important criteria in order to be successful. Safety
of drivers and other roadway users (e.g., pedestrians) is arguably the most important concern about any
roadway-related system. Following safety, the impact on energy use and the environment is another
important criterion for sustainable roadway engineering practices. Related to energy and environmental
impact is the economic cost of roadway systems, particularly in the present economic climate. Limited state
and municipal budgets for highway maintenance require cost-effective solutions, which result in the lowest
possible life-cycle costs, and ideally, low initial costs as well.
In the present section of the report, the methods for evaluating the ecoluminance applications for roadway
lighting and vegetation systems are discussed.
SAFETY
Visual Performance
In simplest terms, the safety of a roadway is characterized in terms of the number of crashes that occur
along that roadway in a given amount of time. However, since crashes are (hopefully) rare events, with
perhaps only one or two crashes in a given location every year (and fewer in some locations), it can be very
difficult to use crashes to successfully estimate the effects of specific roadway treatments on safety. For this
reason, most studies of the effectiveness of different roadway engineering treatments use a surrogate
measure of safety. In the context of lighting systems, visibility and visual performance is probably the most
common surrogate for safety. This is reasonable because crashes are more likely during hours of darkness
(CIE, 1992; IESNA, 2000). Limited evidence (Scott, 1980) indicates that the relative rate of occurrence of
crashes at night along roadways with lighting is reduced in a manner that is related to the pavement
luminance produced by the lighting. If, as would be expected, the luminance of the road is related to
visibility, such evidence would be consistent with a safety effect of roadway lighting.
However, luminance alone is not the only indicator of how visible an object is. The visibility analyses
summarized in this report use the relative visual performance (RVP) model developed by Rea and Ouellette
(1991). The RVP model provides a method for determining the speed and accuracy with which visual
information can be processed, given several relevant parameters:
• The size of the target
• The luminance of the background surrounding the target
• The luminance contrast between the target and its background

4-2
• The age of the observer
The RVP model (Rea and Ouellette, 1991) was developed from the results of two experiments - one which
measured response times to flashed targets varying in size and luminance contrast against surrounding
backgrounds varying in luminance, and one which measured the speed and accuracy with which people
could perform a numerical verification task. This task consisted of reading pages printed with two columns,
each containing twenty five-digit numbers. All of the five-digit numbers on each page matched, except
there was a single mismatched digit in zero to six of the five-digit numbers. Subjects in the experiment
were asked to locate these mismatch errors on each page. The numerical verification task was performed
under a range of lighting and luminance contrast conditions. Importantly, the results of each experiment
were nearly identical, despite the very different forms the experiments took, when the results were
converted to the speed and accuracy of visual processing.
The RVP value is compared to the speed and accuracy of a reference condition corresponding to high light
levels (such as those found in offices), high luminance contrast (such as that found on white laser-printed
paper using black ink) and large size (such as 10- or 12-point type). This reference condition is defined to
have an RVP value of one. RVP values close to one are expected to result in similar speeds and accuracy
rates as the reference visual task would produce. RVP values of zero correspond to the legibility threshold
(in other words, the point at which an object can be identified), and negative RVP values correspond to
visual targets that can be detected but not identified (such as a shape in the road that could be an animal or
a blowing item of trash but is not visible enough for someone to make the distinction).
Figure 6 shows a three-dimensional surface plot of RVP values for 10-point type varying in luminance
contrast (i.e., having different ink lightnesses) and against a background varying in luminance (i.e., under
different light levels). When both luminance and luminance contrast are low (i.e., reading light gray print
on white paper under low light levels), visual performance drops precipitously. Once both luminance and
luminance contrast have reached nearly asymptotic values (resulting in RVP values close to one), further
increases in either luminance or luminance contrast will not substantially increase visual performance. This
"plateau and escarpment" characteristic of visual performance has been illustrated in many other
experiments as well. An RVP value of 0.9 is one that would result in excellent visibility, along the
"plateau" of visual performance.
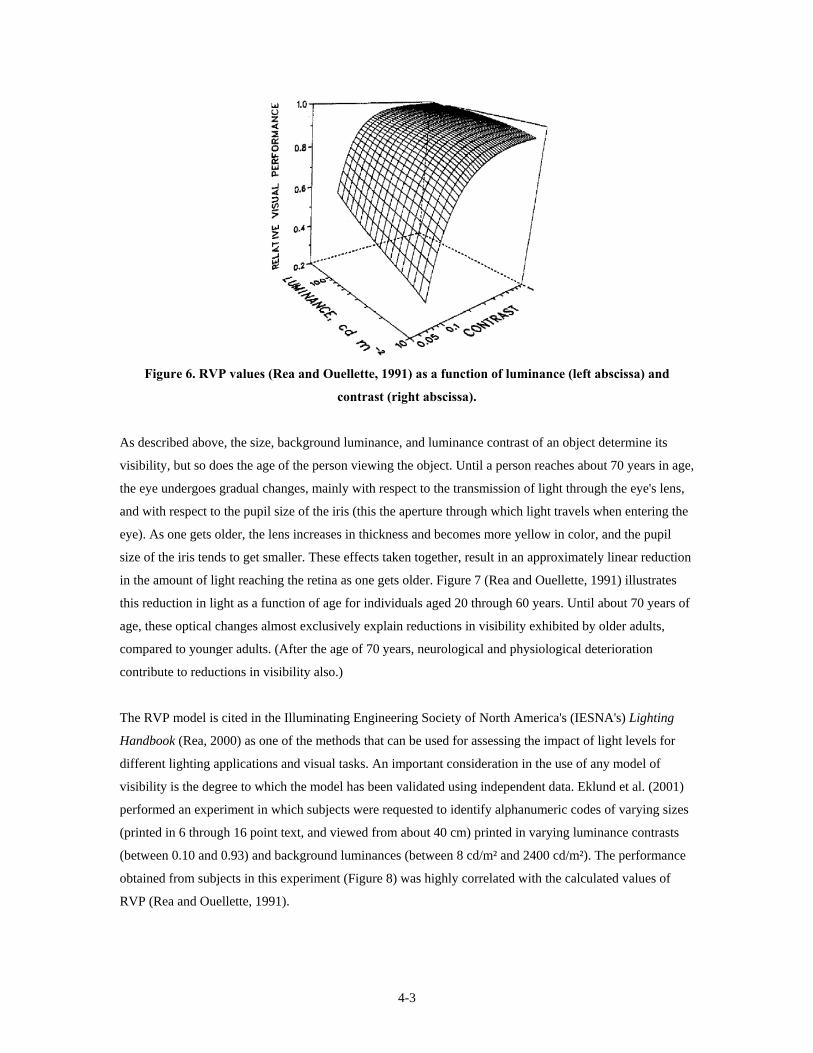
4-3
Figure 6. RVP values (Rea and Ouellette, 1991) as a function of luminance (left abscissa) and
contrast (right abscissa).
As described above, the size, background luminance, and luminance contrast of an object determine its
visibility, but so does the age of the person viewing the object. Until a person reaches about 70 years in age,
the eye undergoes gradual changes, mainly with respect to the transmission of light through the eye's lens,
and with respect to the pupil size of the iris (this the aperture through which light travels when entering the
eye). As one gets older, the lens increases in thickness and becomes more yellow in color, and the pupil
size of the iris tends to get smaller. These effects taken together, result in an approximately linear reduction
in the amount of light reaching the retina as one gets older. Figure 7 (Rea and Ouellette, 1991) illustrates
this reduction in light as a function of age for individuals aged 20 through 60 years. Until about 70 years of
age, these optical changes almost exclusively explain reductions in visibility exhibited by older adults,
compared to younger adults. (After the age of 70 years, neurological and physiological deterioration
contribute to reductions in visibility also.)
The RVP model is cited in the Illuminating Engineering Society of North America's (IESNA's) Lighting
Handbook (Rea, 2000) as one of the methods that can be used for assessing the impact of light levels for
different lighting applications and visual tasks. An important consideration in the use of any model of
visibility is the degree to which the model has been validated using independent data. Eklund et al. (2001)
performed an experiment in which subjects were requested to identify alphanumeric codes of varying sizes
(printed in 6 through 16 point text, and viewed from about 40 cm) printed in varying luminance contrasts
(between 0.10 and 0.93) and background luminances (between 8 cd/m² and 2400 cd/m²). The performance
obtained from subjects in this experiment (Figure 8) was highly correlated with the calculated values of
RVP (Rea and Ouellette, 1991).

4-4
Figure 7. Age-related reduction in retinal illuminance caused by lens thickening and yellowing and
by pupil size reductions (Rea and Ouellette, 1991).
Figure 8. Comparison of predicted visual performance (Rea and Ouellette, 1991) and measured
performance for an office data entry task (Eklund et al., 2001).
In a study related to highway sign visibility, Goodspeed and Rea (1999) evaluated the effects of luminance
contrast and background luminance on the ability of individuals to accurately identify the orientation of
Landolt "C" ring symbols. For simulated highway sign displays, subjects were asked to identify the
direction of the gap in the symbol (for a properly oriented "C" the gap is to the right). Subjects viewed
conditions under several different levels of surround complexity in addition to different background
luminance and luminance contrast conditions. Goodspeed and Rea (1999) compared their data to
predictions of response time generated using the RVP model, and the RVP model closely predicted the
measured response times (Figure 9) measured by Goodspeed and Rea (1999) except at the lowest
luminance contrast level. This close correspondence reinforced the ability of the RVP model to develop
meaningful predictions of visual responses in a variety of contexts.

4-5
Figure 9. Measured visual response times for simulated highway sign stimuli (Goodspeed and Rea,
1999) and predictions based on RVP (Rea and Ouellette, 1991).
As stated above, the RVP model (Rea and Ouellette, 1991) provides estimates of the visual processing
times required for specific visual objects. Lower values of RVP are associated with longer visual response
times.
Because the luminances of relevant objects in and along the roadway, and their surrounding backgrounds
are important input variables for the RVP model (Rea and Ouellette, 1991) a tool for estimating these
values under different kinds of lighting conditions is required. The photometrically accurate lighting
calculation and simulation software package AGI32 (Lighting Analysts) was used to provide these
estimates. This software package is widely used in the lighting industry for performing lighting
calculations, and has been demonstrated to closely agree with actual field measurements of light levels
when compared to physical mock-ups (Zhang, 2006). Input data include the reflectances of the roadway
surface, surrounding grassy areas, and the vegetation (using the spectral measurements summarized
previously as the basis for these values), and the luminous intensity distributions of the light sources (e.g.,
streetlights, landscape lights, and vehicle headlights) in the environment. Using the luminances of objects,
their surrounding backgrounds, the size of the object and an assumed age of a driver, RVP values can be
determined for different lighting and ecoluminance scenarios.
Crash Attenuation
Another safety-related characteristic of roadway engineering systems is the mechanical absorption of such
systems if they are struck by a vehicle. There are few data in the literature that address the ability of
roadside vegetation other than the analyses of tree trunk diameters and their relationships to the likelihood
of crashing into one resulting in a fatality or injury, as described in a previous chapter of this report.
Clearly, if vegetation could absorb kinetic energy from vehicles without injuring the driver, if it could
prevent vehicles from traveling too far through the clear zone and subsequently into a tree, or if it could
assist a driver in returning to the road, it could serve a useful safety function.
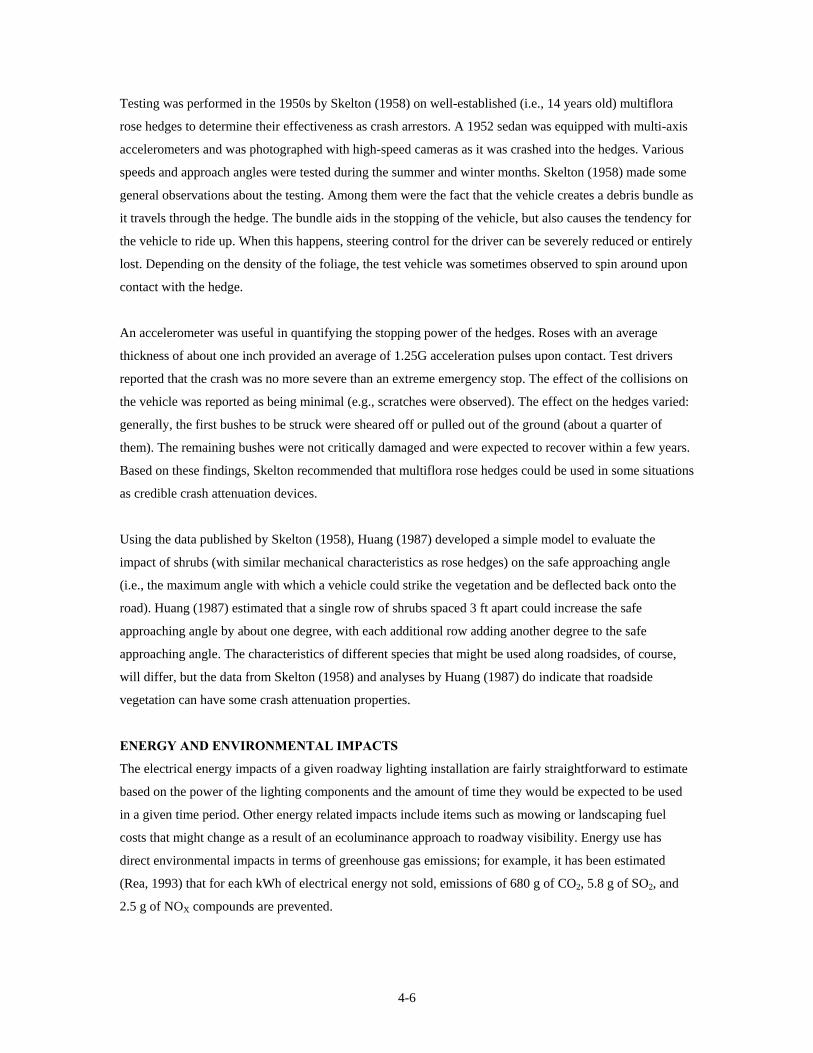
4-6
Testing was performed in the 1950s by Skelton (1958) on well-established (i.e., 14 years old) multiflora
rose hedges to determine their effectiveness as crash arrestors. A 1952 sedan was equipped with multi-axis
accelerometers and was photographed with high-speed cameras as it was crashed into the hedges. Various
speeds and approach angles were tested during the summer and winter months. Skelton (1958) made some
general observations about the testing. Among them were the fact that the vehicle creates a debris bundle as
it travels through the hedge. The bundle aids in the stopping of the vehicle, but also causes the tendency for
the vehicle to ride up. When this happens, steering control for the driver can be severely reduced or entirely
lost. Depending on the density of the foliage, the test vehicle was sometimes observed to spin around upon
contact with the hedge.
An accelerometer was useful in quantifying the stopping power of the hedges. Roses with an average
thickness of about one inch provided an average of 1.25G acceleration pulses upon contact. Test drivers
reported that the crash was no more severe than an extreme emergency stop. The effect of the collisions on
the vehicle was reported as being minimal (e.g., scratches were observed). The effect on the hedges varied:
generally, the first bushes to be struck were sheared off or pulled out of the ground (about a quarter of
them). The remaining bushes were not critically damaged and were expected to recover within a few years.
Based on these findings, Skelton recommended that multiflora rose hedges could be used in some situations
as credible crash attenuation devices.
Using the data published by Skelton (1958), Huang (1987) developed a simple model to evaluate the
impact of shrubs (with similar mechanical characteristics as rose hedges) on the safe approaching angle
(i.e., the maximum angle with which a vehicle could strike the vegetation and be deflected back onto the
road). Huang (1987) estimated that a single row of shrubs spaced 3 ft apart could increase the safe
approaching angle by about one degree, with each additional row adding another degree to the safe
approaching angle. The characteristics of different species that might be used along roadsides, of course,
will differ, but the data from Skelton (1958) and analyses by Huang (1987) do indicate that roadside
vegetation can have some crash attenuation properties.
ENERGY AND ENVIRONMENTAL IMPACTS
The electrical energy impacts of a given roadway lighting installation are fairly straightforward to estimate
based on the power of the lighting components and the amount of time they would be expected to be used
in a given time period. Other energy related impacts include items such as mowing or landscaping fuel
costs that might change as a result of an ecoluminance approach to roadway visibility. Energy use has
direct environmental impacts in terms of greenhouse gas emissions; for example, it has been estimated
(Rea, 1993) that for each kWh of electrical energy not sold, emissions of 680 g of CO2, 5.8 g of SO2, and
2.5 g of NOX compounds are prevented.
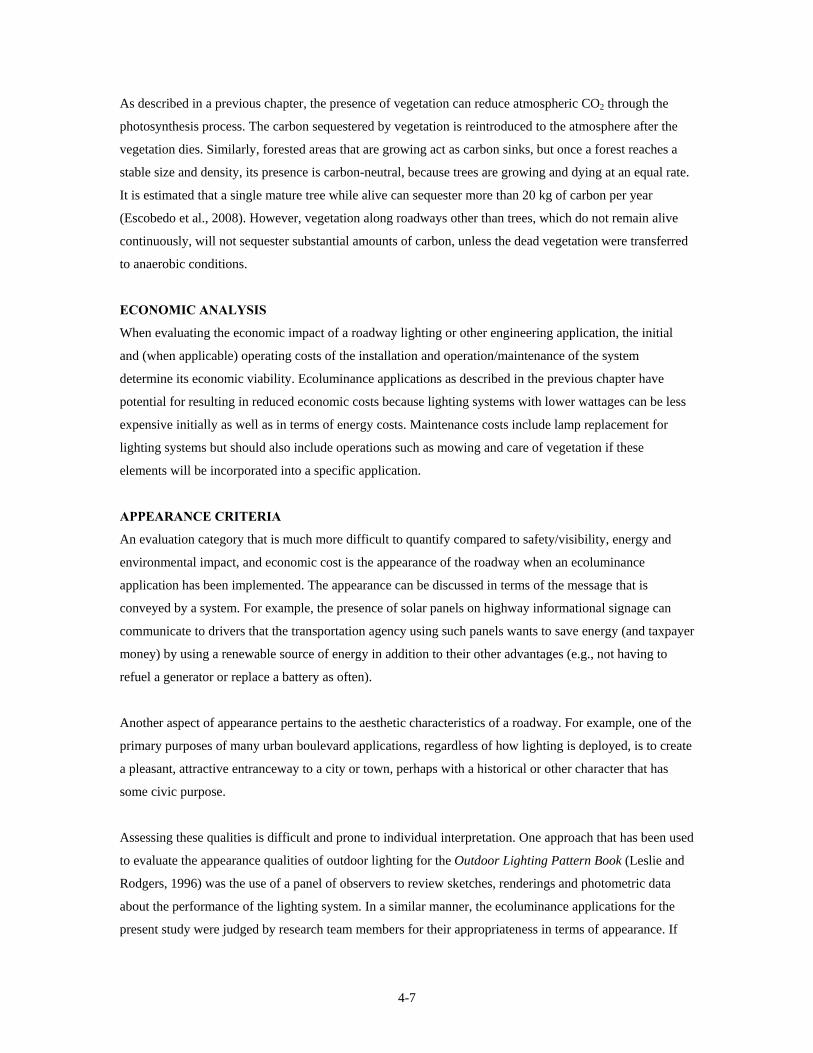
4-7
As described in a previous chapter, the presence of vegetation can reduce atmospheric CO2 through the
photosynthesis process. The carbon sequestered by vegetation is reintroduced to the atmosphere after the
vegetation dies. Similarly, forested areas that are growing act as carbon sinks, but once a forest reaches a
stable size and density, its presence is carbon-neutral, because trees are growing and dying at an equal rate.
It is estimated that a single mature tree while alive can sequester more than 20 kg of carbon per year
(Escobedo et al., 2008). However, vegetation along roadways other than trees, which do not remain alive
continuously, will not sequester substantial amounts of carbon, unless the dead vegetation were transferred
to anaerobic conditions.
ECONOMIC ANALYSIS
When evaluating the economic impact of a roadway lighting or other engineering application, the initial
and (when applicable) operating costs of the installation and operation/maintenance of the system
determine its economic viability. Ecoluminance applications as described in the previous chapter have
potential for resulting in reduced economic costs because lighting systems with lower wattages can be less
expensive initially as well as in terms of energy costs. Maintenance costs include lamp replacement for
lighting systems but should also include operations such as mowing and care of vegetation if these
elements will be incorporated into a specific application.
APPEARANCE CRITERIA
An evaluation category that is much more difficult to quantify compared to safety/visibility, energy and
environmental impact, and economic cost is the appearance of the roadway when an ecoluminance
application has been implemented. The appearance can be discussed in terms of the message that is
conveyed by a system. For example, the presence of solar panels on highway informational signage can
communicate to drivers that the transportation agency using such panels wants to save energy (and taxpayer
money) by using a renewable source of energy in addition to their other advantages (e.g., not having to
refuel a generator or replace a battery as often).
Another aspect of appearance pertains to the aesthetic characteristics of a roadway. For example, one of the
primary purposes of many urban boulevard applications, regardless of how lighting is deployed, is to create
a pleasant, attractive entranceway to a city or town, perhaps with a historical or other character that has
some civic purpose.
Assessing these qualities is difficult and prone to individual interpretation. One approach that has been used
to evaluate the appearance qualities of outdoor lighting for the Outdoor Lighting Pattern Book (Leslie and
Rodgers, 1996) was the use of a panel of observers to review sketches, renderings and photometric data
about the performance of the lighting system. In a similar manner, the ecoluminance applications for the
present study were judged by research team members for their appropriateness in terms of appearance. If

4-8
team members did not agree that the resulting appearance of a given design was acceptable, it was revised
until it was judged as acceptable.
SUMMARY
The criteria described in this section, and the methods for evaluating the ecoluminance applications
developed in this study in terms of safety, energy and environmental impacts, economic costs, and
appearance, provide a basis for comparing alternative solutions for enhancing roadway safety in as efficient
a manner as possible. In the following section, specific configurations of lighting and vegetation are
described and the results of evaluations using the methods described here are presented.
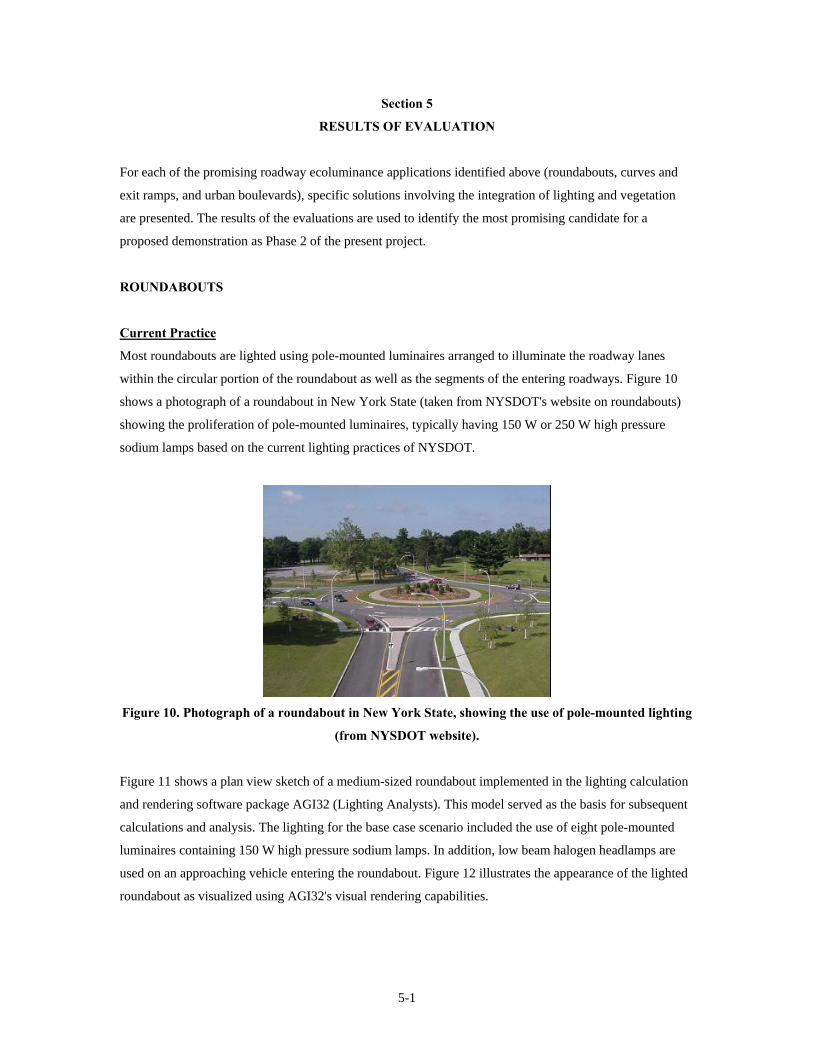
5-1
Section 5
RESULTS OF EVALUATION
For each of the promising roadway ecoluminance applications identified above (roundabouts, curves and
exit ramps, and urban boulevards), specific solutions involving the integration of lighting and vegetation
are presented. The results of the evaluations are used to identify the most promising candidate for a
proposed demonstration as Phase 2 of the present project.
ROUNDABOUTS
Current Practice
Most roundabouts are lighted using pole-mounted luminaires arranged to illuminate the roadway lanes
within the circular portion of the roundabout as well as the segments of the entering roadways. Figure 10
shows a photograph of a roundabout in New York State (taken from NYSDOT's website on roundabouts)
showing the proliferation of pole-mounted luminaires, typically having 150 W or 250 W high pressure
sodium lamps based on the current lighting practices of NYSDOT.
Figure 10. Photograph of a roundabout in New York State, showing the use of pole-mounted lighting
(from NYSDOT website).
Figure 11 shows a plan view sketch of a medium-sized roundabout implemented in the lighting calculation
and rendering software package AGI32 (Lighting Analysts). This model served as the basis for subsequent
calculations and analysis. The lighting for the base case scenario included the use of eight pole-mounted
luminaires containing 150 W high pressure sodium lamps. In addition, low beam halogen headlamps are
used on an approaching vehicle entering the roundabout. Figure 12 illustrates the appearance of the lighted
roundabout as visualized using AGI32's visual rendering capabilities.
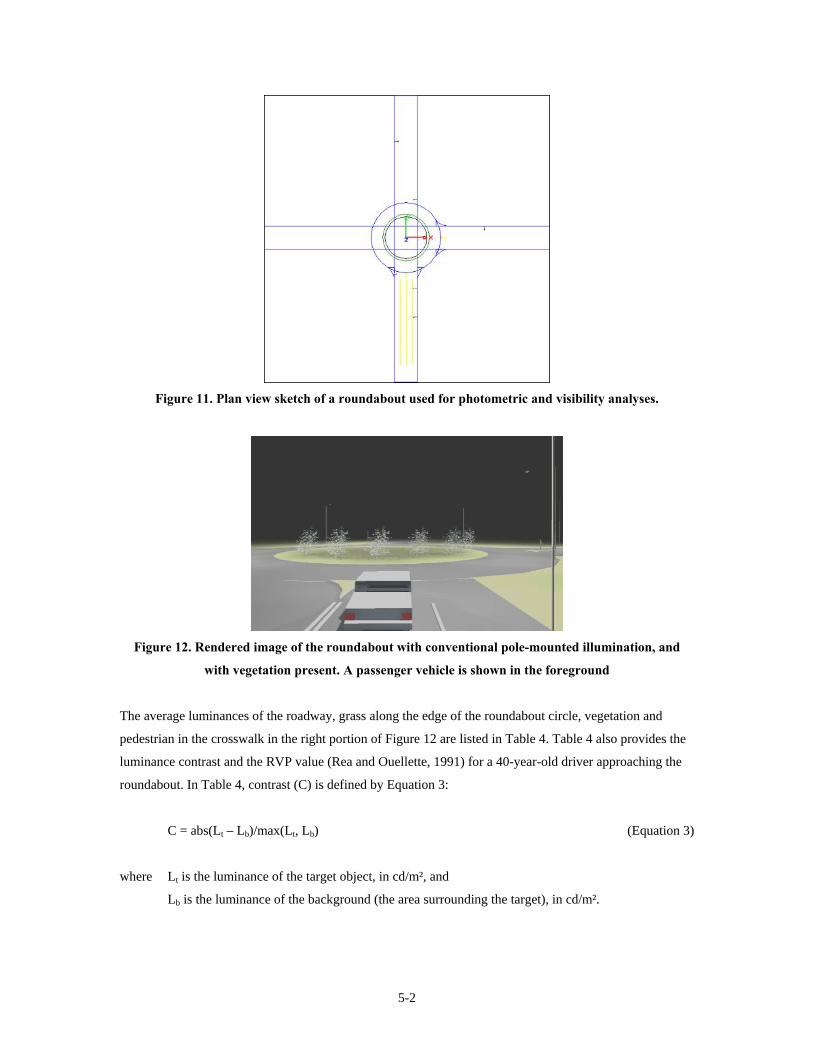
5-2
Figure 11. Plan view sketch of a roundabout used for photometric and visibility analyses.
Figure 12. Rendered image of the roundabout with conventional pole-mounted illumination, and
with vegetation present. A passenger vehicle is shown in the foreground
The average luminances of the roadway, grass along the edge of the roundabout circle, vegetation and
pedestrian in the crosswalk in the right portion of Figure 12 are listed in Table 4. Table 4 also provides the
luminance contrast and the RVP value (Rea and Ouellette, 1991) for a 40-year-old driver approaching the
roundabout. In Table 4, contrast (C) is defined by Equation 3:
C = abs(Lt – Lb)/max(Lt, Lb) (Equation 3)
where Lt is the luminance of the target object, in cd/m², and
Lb is the luminance of the background (the area surrounding the target), in cd/m².

5-3
Object Average Luminance
(cd/m²)
Contrast RVP Value
Roadway 1.2 n/a n/a
Grass 2.2 0.45 0.945
Vegetation n/a n/a n/a Pedestrian 0.95 0.21 0.902
Table 4. Photometric and visual performance (Rea and Ouellette, 1991) characteristics of relevant
visual targets while approaching the roundabout illuminated by conventional lighting.
With respect to the energy use and economic cost of the baseline roundabout lighting condition, Table 5
summarizes the initial and operation/maintenance costs, as well as the energy use, of the conventional
illumination system shown in Figure 12. Installation costs for the pole-mounted luminaires are estimated at
approximately $29,000, with annual operating and maintenance costs of about $900/year.
Unit price Total Unit price Total1 Pole 8 EA $1,825.00 $14,600.00 $1,125.00 $9,000.002 Fixture 8 EA $475.00 $3,800.00 $153.00 $1,224.003 150 W HPS lamp 8 EA $20.00 $160.00 $0.004 Ballast for 150 W HPS lamp 8 EA $50.00 $400.00 $0.00
Initial cost $29,184.00
Operating time per year: 4662 hrsAverage rated lamp life: 15000 hrsLamps used/year: 2.49Relamping labor cost: $20.35Lamp replacement cost: $40.35Average ballast life: 20000Ballasts used/year: 1.86Ballast replacement labor cost: $44.95Ballast replacement cost: $94.95Maintenance cost/year: $277.39Input power/luminaire: 180.00 WEnergy use/year: 6713.28 kWhElectricity cost: $0.09 /kWhAnnual energy cost: $622.17Annual operating cost $899.56
Material LaborItem No. Description Quantity Unit
Table 5. Summary of energy use and initial and operation/maintenance costs for the conventional
roundabout lighting system.
Ecoluminance Alternative
Figure 13 shows a rendering of the same roundabout that has one section of the interior circular area
planted with vegetation (reflectance 20%), which is illuminated by landscape lighting (either 5 W or 15 W
luminaires) and directional "bollard" luminaires oriented to light the roadway lanes in the roundabout and
to provide vertical illumination in the crosswalk areas.
Table 6 provides a summary of the photometric and visual performance (Rea and Ouellette, 1991)
characteristics of the site with only the bollard type luminaires installed (with vegetation lighted only by
approaching vehicle headlights). Although the roadway luminance is reduced, the contrast between the road

5-4
and grass is actually increased, and although there is a small reduction in the RVP value for the road-grass
boundary, the visibility of the pedestrian is improved and the presence of the vegetation, even when only
illuminated by headlamps, adds another very visible element to the scene that otherwise would not have
been present.
Figure 13. Rendered image of the roundabout with the ecoluminance solution shown.
Object Average Luminance
(cd/m²)
Contrast RVP Value
Roadway 0.3 n/a n/a
Grass 0.1 0.67 0.929
Vegetation 0.05 0.5 0.916 Pedestrian 4 0.93 0.939
Table 6. Photometric and visual performance (Rea and Ouellette, 1991) characteristics of relevant
visual targets while approaching the roundabout illuminated only by the bollard component of the
ecoluminance solution, with vegetation present.
Object Average Luminance
(cd/m²)
Contrast RVP Value
Roadway 0.3 n/a n/a
Grass 0.1 0.67 0.929
Vegetation 0.5 0.8 0.935 Pedestrian 4 0.93 0.939
Table 7. Photometric and visual performance (Rea and Ouellette, 1991) characteristics of relevant
visual targets while approaching the roundabout illuminated using the ecoluminance approach by
bollard luminaires and 5 W landscape lights for the vegetation.
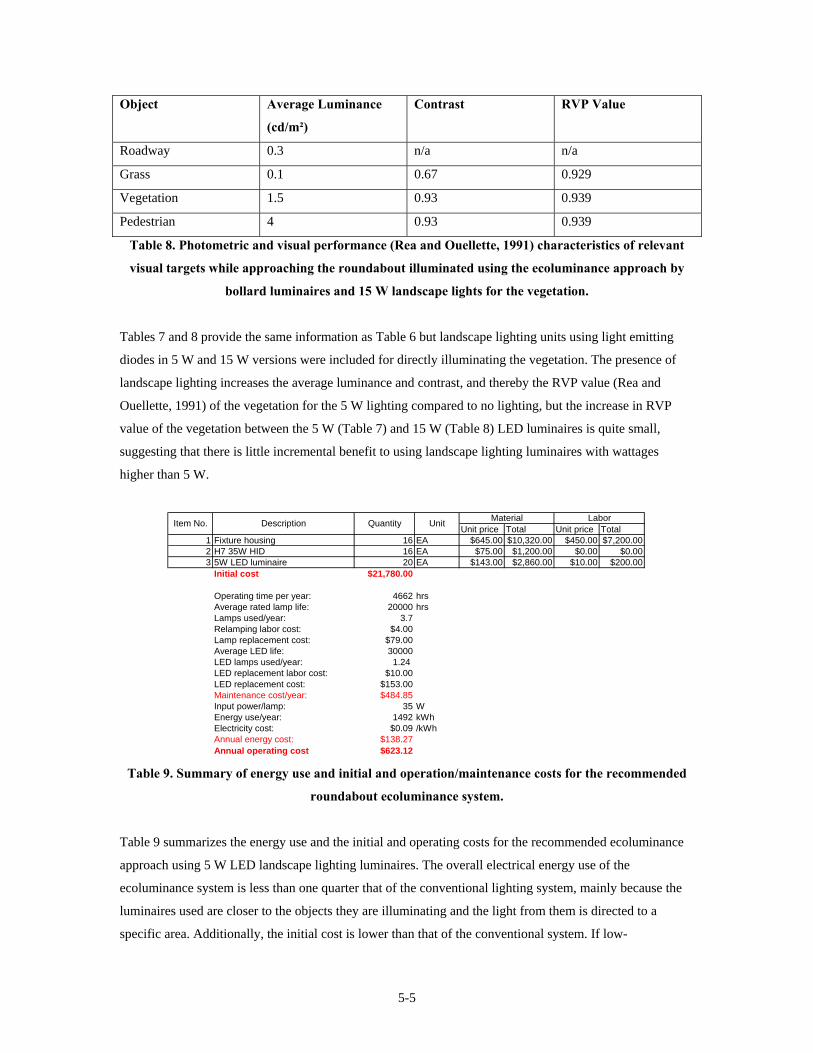
5-5
Object Average Luminance
(cd/m²)
Contrast RVP Value
Roadway 0.3 n/a n/a
Grass 0.1 0.67 0.929
Vegetation 1.5 0.93 0.939 Pedestrian 4 0.93 0.939
Table 8. Photometric and visual performance (Rea and Ouellette, 1991) characteristics of relevant
visual targets while approaching the roundabout illuminated using the ecoluminance approach by
bollard luminaires and 15 W landscape lights for the vegetation.
Tables 7 and 8 provide the same information as Table 6 but landscape lighting units using light emitting
diodes in 5 W and 15 W versions were included for directly illuminating the vegetation. The presence of
landscape lighting increases the average luminance and contrast, and thereby the RVP value (Rea and
Ouellette, 1991) of the vegetation for the 5 W lighting compared to no lighting, but the increase in RVP
value of the vegetation between the 5 W (Table 7) and 15 W (Table 8) LED luminaires is quite small,
suggesting that there is little incremental benefit to using landscape lighting luminaires with wattages
higher than 5 W.
Unit price Total Unit price Total1 Fixture housing 16 EA $645.00 $10,320.00 $450.00 $7,200.002 H7 35W HID 16 EA $75.00 $1,200.00 $0.00 $0.003 5W LED luminaire 20 EA $143.00 $2,860.00 $10.00 $200.00
Initial cost $21,780.00
Operating time per year: 4662 hrsAverage rated lamp life: 20000 hrsLamps used/year: 3.7Relamping labor cost: $4.00Lamp replacement cost: $79.00Average LED life: 30000LED lamps used/year: 1.24LED replacement labor cost: $10.00LED replacement cost: $153.00Maintenance cost/year: $484.85Input power/lamp: 35 WEnergy use/year: 1492 kWhElectricity cost: $0.09 /kWhAnnual energy cost: $138.27Annual operating cost $623.12
LaborDescriptionItem No. MaterialQuantity Unit
Table 9. Summary of energy use and initial and operation/maintenance costs for the recommended
roundabout ecoluminance system.
Table 9 summarizes the energy use and the initial and operating costs for the recommended ecoluminance
approach using 5 W LED landscape lighting luminaires. The overall electrical energy use of the
ecoluminance system is less than one quarter that of the conventional lighting system, mainly because the
luminaires used are closer to the objects they are illuminating and the light from them is directed to a
specific area. Additionally, the initial cost is lower than that of the conventional system. If low-
5-6
maintenance vegetation species can be used in the application, there could also be reduced requirements for
mowing in the center of the roundabout, although this might not be a cost savings for NYSDOT because it
is very common for roundabout landscaping to be performed by the local municipality rather than
NYSDOT in New York State.
NYSDOT is currently in the process designing new roundabouts so that the entering travel lanes reach the
circular portion of the roundabout at angles smaller than the near perpendicular angles at which traffic
would enter the circular lanes in Figure 11. To determine the effect of reducing this angle as will be more
common in new and future roundabouts, the photometric values in Tables 4, 6, 7 and 8 were re-calculated
with the approaching vehicle oriented toward the right by ten degrees. These calculations indicated that the
average luminances of the road and other roadway objects (grass, vegetation and pedestrian) did not change
to two significant digits, although the location of the luminance "hot spot" on the road and grass, for
example, was shifted toward the right. Changing the approach angle into the roundabout does not
substantially alter the visual performance characteristics of the lighting and vegetation.
CURVES AND EXIT RAMPS
Current Practice
Many exit ramps are not illuminated. For example, according to lighting presence data for all interchanges
involving state or U.S. highways in the state of Minnesota, about 80% of interchanges in rural areas are
unlighted, and about 50% in urban areas are unlighted (NCHRP Project 5-19). Many such ramps consist of
narrow-radius turns to allow traffic along one roadway to merge onto a perpendicular roadway. NYSDOT
has reported (Project C-06-36) that some exit ramp locations appear to be prone to rollover crashes.
Nationwide, about 10,000 fatalities and 225,000 injuries occur annually because of rollover and run-off-
the-road crashes.
In a field study of delineator size, spacing and height along curves, Skinner and Bullough (2009) found that
drivers could be made to perceive that such curves were sharper if delineators were larger and mounted
higher than conventional delineators; increased sharpness perceptions in turn reduced speeds of vehicles
approaching and navigating curves. These results suggest that vegetation, if it can be integrated into the
curve, could help reinforce the visual information along the outer edge of the curve. Figure 14 shows a plan
view of a curve with a vehicle driving along it. Typically, this curve would be treated with delineators and
perhaps chevron signs to help drivers identify the direction and extent of curvature.

5-7
Figure 14. Plan view of a curved exit ramp, showing the location of a vehicle entering the curved
section.
Table 10 lists the photometric and visual performance (Rea and Ouellette, 1991) characteristics of the
relevant objects along the curved exit ramp, when the only illumination is provided by vehicle headlamps.
Note that just planting vegetation along the outside edge of the curve will provide a visual element with
high visibility and continuous appearance (Figure 15). This can be important because such a curve would
contain retroreflective delineators, but these elements are spatially intermittent whereas vegetation is more
spatially continuous, providing more useful supplemental visual information to drivers (Kao, 1969).
Object Average Luminance
(cd/m²)
Contrast RVP Value
Roadway 0.03 n/a n/a
Grass 0.15 0.8 0.891
Vegetation 0.58 0.95 0.923
Table 10. Photometric and visual performance (Rea and Ouellette, 1991) characteristics of relevant
visual targets while entering the curved section of an exit ramp.
Since curves such as the one illustrated in Figure 14 are likely not to be illuminated, of course, the energy
use and economic cost is relatively minimal in terms of lighting and would only include costs of mowing
along the edge to ensure visibility of delineators. If selection of vegetation could result in a low-
maintenance species that would not grow beyond a maximum height of two to three feet, it could result in
little incremental cost over the base case.

5-8
Figure 15. Curved exit ramp appearance with vegetation (and no additional lighting) present.
Ecoluminance Alternative
While the presence of vegetation alone improves the visual information substantially by providing a more
continuous form of delineation (Kao, 1969), the research team evaluated the use of LED landscape lighting
luminaires to illuminate the vegetation to provide low level luminances of the plantings to improve visual
information (Figure 16). Both 5 W and 15 W luminaires were evaluated. Tables 11 and 12 summarize the
photometric and visual performance of the curve treated with the 5W and 15 W ecoluminance systems.
Figure 16. Curved exit ramp appearance with vegetation and landscape lighting (5 W) present.
Object Average Luminance
(cd/m²)
Contrast RVP Value
Roadway 0.03 n/a n/a
Grass 0.2 0.85 0.906
Vegetation 0.9 0.97 0.927
Table 11. Photometric and visual performance (Rea and Ouellette, 1991) characteristics of relevant
visual targets while entering the curved section of an exit ramp designed using an ecoluminance
approach with 5 W LED landscape luminaires.
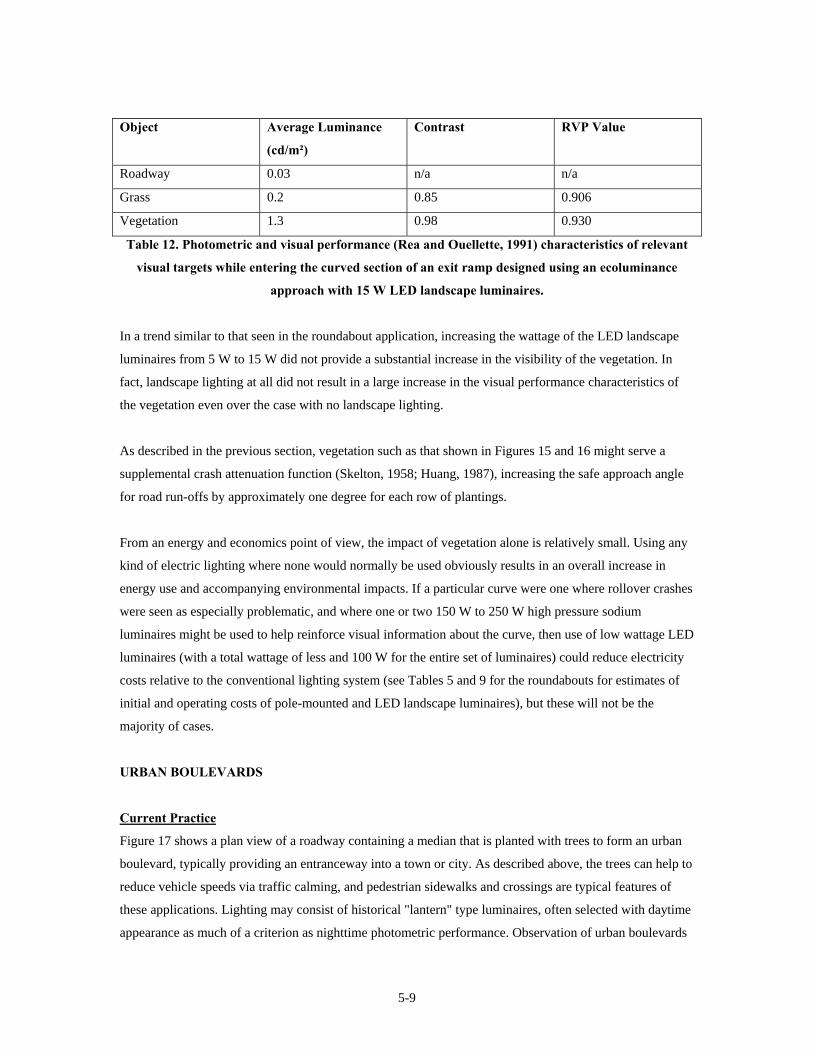
5-9
Object Average Luminance
(cd/m²)
Contrast RVP Value
Roadway 0.03 n/a n/a
Grass 0.2 0.85 0.906
Vegetation 1.3 0.98 0.930
Table 12. Photometric and visual performance (Rea and Ouellette, 1991) characteristics of relevant
visual targets while entering the curved section of an exit ramp designed using an ecoluminance
approach with 15 W LED landscape luminaires.
In a trend similar to that seen in the roundabout application, increasing the wattage of the LED landscape
luminaires from 5 W to 15 W did not provide a substantial increase in the visibility of the vegetation. In
fact, landscape lighting at all did not result in a large increase in the visual performance characteristics of
the vegetation even over the case with no landscape lighting.
As described in the previous section, vegetation such as that shown in Figures 15 and 16 might serve a
supplemental crash attenuation function (Skelton, 1958; Huang, 1987), increasing the safe approach angle
for road run-offs by approximately one degree for each row of plantings.
From an energy and economics point of view, the impact of vegetation alone is relatively small. Using any
kind of electric lighting where none would normally be used obviously results in an overall increase in
energy use and accompanying environmental impacts. If a particular curve were one where rollover crashes
were seen as especially problematic, and where one or two 150 W to 250 W high pressure sodium
luminaires might be used to help reinforce visual information about the curve, then use of low wattage LED
luminaires (with a total wattage of less and 100 W for the entire set of luminaires) could reduce electricity
costs relative to the conventional lighting system (see Tables 5 and 9 for the roundabouts for estimates of
initial and operating costs of pole-mounted and LED landscape luminaires), but these will not be the
majority of cases.
URBAN BOULEVARDS
Current Practice
Figure 17 shows a plan view of a roadway containing a median that is planted with trees to form an urban
boulevard, typically providing an entranceway into a town or city. As described above, the trees can help to
reduce vehicle speeds via traffic calming, and pedestrian sidewalks and crossings are typical features of
these applications. Lighting may consist of historical "lantern" type luminaires, often selected with daytime
appearance as much of a criterion as nighttime photometric performance. Observation of urban boulevards

5-10
such as Route 9 south of Saratoga Springs, NY, suggests that luminaires produce a significant proportion of
their output at upward angles. Lighting for pedestrian crosswalks such as mid-block crossings us usually
provided by the general roadway lighting system. Figure 18 shows a rendered view of such a roadway.
Figure 17. Plan view sketch of urban boulevard lined with trees and historical-appearing luminaires.
Figure 18. Rendered image of the urban boulevard showing the approach to a mid-block pedestrian
crossing.
Power of the lamps in the luminaires are typically between 100 W and 150 W as these are often mounted
on 20-foot poles, lower than the 30 to 40 foot poles on which conventional "cobrahead" luminaires (e.g.,
those illustrated in Figure 10). Table 13 lists the photometric and visual performance of detecting the
pedestrian in Figure 18 crossing the road along a mid-clock crossing.

5-11
Object Average Luminance
(cd/m²)
Contrast RVP Value
Roadway 0.2 n/a n/a
Pedestrian 0.25 0.26 0.878
Table 13. Photometric and visual performance (Rea and Ouellette, 1991) characteristics of relevant
visual targets while approaching a mid-block crossing along an urban boulevard with conventional
lighting.
Ecoluminance Alternative
The use of trees for traffic calming in this application appears to be beneficial in slowing traffic, which
should increase pedestrian safety and bring vehicles closer to the slower speeds appropriate for a city or
town urban area. Unlike the roundabout or curved exit ramp applications, where delineation of roadway
edges and curves is critical, general illuminance in the urban boulevard may be seen as beneficial to help
drivers detect and identify pedestrians along sidewalks and especially in crosswalks such as the mid-block
crossing. Figure 19 shows a rendered image of the same urban boulevard illuminated using an
ecoluminance approach, using luminaires with very little light directed upward (but still having a historical
"lantern" appearance), and adjusted in terms of their spacing to be located ahead of a mid-block crossing.
This approach (Freedman et al., 1975; Hasson et al., 2002; Gibbons and Hankey, 2006; Edwards and
Gibbons, 2008) increases the vertical illuminance on the pedestrians and thereby can result in higher
contrast and visual performance (Rea and Ouellette).
Figure 19. Rendered image of the urban boulevard lighting using the ecoluminance approach,
showing the approach to a mid-block pedestrian crossing.
As illustrated in Table 14, which summarizes the photometric and visual performance characteristics of the
revised urban boulevard, the luminance of the pedestrian is increased substantially by ensuring that the
luminaires are providing sufficient vertical illuminance onto pedestrians, although the average luminance of
the roadway surface has not changed. The RVP value for the pedestrian has increase substantially between
the base case and the ecoluminance alternative.

5-12
Object Average Luminance
(cd/m²)
Contrast RVP Value
Roadway 0.2 n/a n/a
Pedestrian 0.5 0.6 0.953
Table 14. Photometric and visual performance (Rea and Ouellette, 1991) characteristics of relevant
visual targets while approaching a mid-block crossing along an urban boulevard lighted using an
ecoluminance approach.
Regarding energy use, the number and power of luminaires in the ecoluminance example have not changed
from the baseline conventional case, resulting in no difference in terms of electrical energy use, or in
operating and maintenance costs. The trees could provide environmental benefits in terms of traffic
calming, which might also result in reduced fuel costs (these benefits would apply to the conventional
baseline case as well). By using luminaires that produce very little direct upward light, another
environmental benefit could be reductions in light that could contribute to sky glow. Zhang (2006) showed
that using luminaires with little to no direct upward component could result in less light leaving the entire
roadway area. Such benefits could be quantified using the outdoor site-lighting performance (OSP) metrics
(Brons et al., 2008) developed by the Lighting Research Center to evaluate outdoor and roadway lighting in
terms of quantities related to sky glow, light trespass and discomfort glare.
6-1
Section 6
ROUNDTABLE MEETING SUMMARY
NARRATIVE OF MEETING DISCUSSION
The LRC at Rensselaer Polytechnic Institute hosted a stakeholder roundtable meeting on Wednesday,
March 11, 2009 to present its findings and obtain feedback. (See the end of this section for a list of
participating individuals.)
M. Rea from the LRC welcomed the participants and after participants introduced themselves, J. Tario
from NYSERDA provided a brief discussion of the Program Opportunity Notice in Sustainable
Transportation Systems jointly offered by NYSERDA and NYSDOT. The particular project under
discussion is a "Phase 1" study to identify opportunities for sustainability in the context of lighting and
vegetation. Other Phase 1 projects along with the present one will be evaluated by NYSERDA and
NYSDOT in deciding whether they will pursue a Phase 2 demonstration project based on the results from
Phase 1.
J. Bullough from the LRC introduced the objectives of the meeting and of the project in general, stating the
overall conclusion that roundabouts appeared to provide some opportunities for integrating lighting and
vegetation to improve visual information while reducing energy use. The meeting would be focused on the
criteria and methods/tools for evaluating different roadway situations with opportunity for meeting
participants to provide feedback.
L. Radetsky from the LRC provided an overview of current lighting, roadway delineation and vegetation
practices in New York State, focusing on the existing practices of NYSDOT. With respect to lighting, other
New York State transportation agencies (such as the Thruway Authority and the Bridge Authority) use the
NYSDOT specifications as the basis for their own practices. NYSDOT's Policy on Lighting (updated in
1979) describes warranting procedures for lighting, the Highway Design Manual (updated in 1995)
describes the design procedures for lighting, and the Standard Specifications (updated in 2008) describes
the equipment for lighting. In summary, NYSDOT practices for lighting involve the provision of
illuminance from pole-mounted, semi-cutoff (i.e., "cobrahead" style) luminaires containing mainly high-
pressure sodium (HPS) lamps. It was discussed that the Policy on Lighting and sections of the Highway
Design Manual pertaining to lighting are probably due for revision soon to account for the current state of
technologies and industry practices.
Roadway delineation practices are derived primarily from the Federal Highway Administration (FHWA)
Manual of Uniform Traffic Control Devices and involve post-mounted delineators to delineate roadway
edges and chevron signs for curve warnings. Regarding roadside vegetation, vegetation can improve the

6-2
roadway by providing control for erosion and drainage, but care must be taken to ensure clear lines of sight
and to avoid large-diameter vegetation close to the roadway that might contribute to injury or death upon
collision with a vehicle. Other applications for roadside vegetation include glare screening, control of snow
drifting and traffic calming. Wildlife management was also associated with roadside vegetation.
J. Tario asked if there were any databases describing animal-related collisions on roadways. J. Rowen from
NYSDOT replied that there was relatively little information. J. Bullough speculated that for crashes
involving smaller animals the threshold for damage might result in many of these being unreported. P.
Dunleavy of NYSDOT stated that the agency does consider where animals cross the roadway in deciding
how to develop the landscaping and vegetation along a highway.
P. Dunleavy also stated that larger trees should not be located within the clear zone surrounding a highway
and emphasized that NYSDOT practice would not allow large trees very close to a highway. He also
pointed out that limbs of shrubs could be quite large, and that it is possible that they could grow in random
patterns or shapes that make them dangerous upon collision, so that one might need to take caution when
recommending planting these near the roadway edge as well as trees. E. McDevitt from FHWA stated that
in urban areas where driving speeds tend to be lower than on divided highways, trees are more likely to be
located close to the road. He also pointed out the possibility of using vegetation as a barrier in addition to or
in place of guide rails, especially close to driveways. Some shrubs or other types of vegetation might grow
in more regular patterns (e.g., cornstalks or willows, which tend to have all limbs vertically oriented).
J. Rowen pointed out that in addition to trimming trees for street lighting purposes, that herbicides were
also used along roadways to ensure lines of sight to signage and that this was another interaction between
visibility and vegetation systems. He also pointed out that different vegetation species can be better or
worse because of their native or invasive character, quite apart from their characteristics in terms of crash
absorption or their appearance or color.
J. Bullough introduced the "ecoluminance" or "green luminance" concept as a way to consider the
interactions between lighting and vegetation. Lower-height and lower-power luminaires than typically used
for roadway illumination could be used to illuminate and provide reflected "luminance" of objects such as
vegetation, and sometimes, light from vehicle headlamps could be sufficient to make a row of vegetation
highly visible. In many cases, one might be able to use less energy by directing light only toward such
objects, rather than providing a general "blanket" of illuminance throughout a location. Using light to make
vertical surfaces of objects such as vegetation visible could also be effective when pavement is wet, which
is when vehicle and current roadway lighting often results in reduced visibility.

6-3
Using four basic elements: 1) vegetation, 2) retroreflective delineators, 3) low-level directed luminaires for
lighting vegetation, and 4) luminaires with controlled optics to provide illuminance when needed to detect
hazards such as pedestrians or other vehicles, J. Bullough summarized the four basic applications that were
evaluated by the LRC: 1) roundabouts, 2) curves and exit ramps, 3) urban boulevards with pedestrian
crossings, and 4) along highway rights-of-way.
Criteria for evaluation included: 1) safety, primarily defined by visibility and secondarily by glare
attenuation, crash attenuation and control of blowing snow; 2) energy and environment, primarily defined
by energy use and secondarily by measures such as offset of atmospheric carbon dioxide; 3) economics,
primarily defined by operating and maintenance costs; and 4) appearance, defined by aesthetics and by
communicating environmental priority to drivers.
The primary tool for evaluating safety/visibility was through photometrically accurate simulations of
lighting and light levels in and along a roadway scene. Such simulations can also provide "photorealistic"
images of roadway scenes that can provide some sense of appearance (e.g., during conditions of wet
pavement) in addition to containing accurate underlying light level data. One exercise conducted by the
research team to ensure accurate input regarding the photometric characteristics of vegetation was the
spectral reflectance measurement of several dozen vegetation species used along New York State
roadways. Typically, these species had reflectances between about 10% (for evergreens) and 30% (for
some sumacs and pepperbushes). Of interest, reflectances of green vegetation were not much higher for
green light-emitting diode (LED) light sources than under "white" incandescent or metal halide lamps, and
were similar as well under "yellowish" HPS lamps. As a result, visual performance calculations differed
very little for the resulting range of reflectances, and analyses conducted for the present study used a value
of 20% for vegetation reflectance. M. Fowler-McDowell of Friedman-Fisher asked whether the project
team had identified possible species (or hybrids) of vegetation with bioluminescent characteristics; M. Rea
replied that it had not. J. Tario asked if any work to develop high-reflectance plant hybrids might result in
more visible vegetation; J. Bullough mentioned that during a site visit to the state College of Environmental
Science and Forestry (ESF) that Dr. T. Volk was breeding willows for biomass fuel applications, but noted
that some of the hybrids had "yellowish" color while others had darker, "reddish" color.
From photometric simulations, it is possible to calculate the visibility using the Relative Visual
Performance (RVP) model, which expresses visibility of an object as a function of its luminance
(brightness), contrast against its background, and size. Once an object is highly visible, increasing light
level, or increasing its contrast or size will not improve visibility much further, providing a basis for upper
limits on light levels (and resulting energy use). There is little direct evidence linking improved visibility to
reduced crashes at night, despite the logical connection between them. Ongoing research at the LRC for the
National Cooperative Highway Research Program (NCHRP) found that there are strong correlations

6-4
between visibility improvements (characterized through RVP) and crash reductions. R. Drake of
NYSERDA asked whether the crash reductions measured isolated only nighttime crashes, when lighting
would be expected to result in a benefit; J. Bullough confirmed that the effects of lighting were only for
nighttime crashes; if the presence of lighting had been associated with differences in daytime crashes, then
that would indicate that the data were unreliable or incomplete.
J. Bullough pointed out that statistical modeling from the NCHRP study is showing that the nighttime crash
reduction associated with lighting may be closer to 10% rather than the value of 30% that is often
associated with roadway lighting. This will have implications for benefit-cost analyses supporting the use
of lighting. Nonetheless, having a link between visual performance improvements and nighttime crash
reduction provides a framework for analyzing other situations such as the integration of lighting and
vegetation.
The results of analyses for the four roadway applications discussed earlier were presented by J. Bullough.
Present NYSDOT requirements for lighting roundabouts involve a large number of pole-mounted
luminaires to provide illuminance throughout the location and renderings showing conventional lighting in
comparison to an ecoluminance approach with vegetation and optically controlled, low-mounted luminaires
for providing light along the roundabout and pedestrian crosswalks. The contrast (and resulting RVP
values) of vegetation and of a pedestrian target in an adjacent crosswalk was higher under the
ecoluminance lighting system even though the overall energy use was reduced by more than two-thirds.
Operational costs were also about 30% lower.
E. McDevitt cautioned that anecdotal evidence suggested that vegetation in the center of the roundabout
might need to be controlled for height because it was observed that safety problems occurred if drivers
could not see traffic at the opposite end of the roundabout. J. Tario, M. Rea and S. Misiewicz from the
Capital District Transportation Committee (CDTC) questioned this, saying such information might not be
needed by drivers, and J. Bullough stated that perhaps because roundabouts are new to many drivers, they
may not know what information they really need to safely navigate through them, and so perhaps not
having visual access to the opposite end results in more hesitant driving behavior that could lead to minor
fender-benders. S. Misiewicz pointed out that a demonstration to help understand what information drivers
really need could be helpful. P. Dunleavy cautioned that the specific geometries of the roundabouts,
particularly for the entrances and exits should be carefully defined since vehicles do not enter roundabouts
at close to right angles, but along more smooth approaches. J. Bullough replied that the final report will
make sure that such conditions are taken into account.
J. Bullough next showed an example of an ecoluminance approach along an exit ramp curve, where merely
planting vegetation along the outer edge of the curve provided a substantial and highly visible visual

6-5
barrier. Lighting of vegetation had small visual performance improvements, but using 15-watt landscaping
lights was not superior to using 5-watt lights. Such vegetation barriers were estimated to provide an
increased maximum safe approach angle (the angle at which a vehicle leaving the road might be able to be
deflected back onto the road, rather than continuing off the roadway edge) by about 1 degree. Vegetation
alone might reduce mowing if low-maintenance plant materials can be identified (a recent NYSDOT report,
Plant Materials for Vegetation Management Along New York State Roadsides, might be a helpful
reference). But as most of these types of curves are already unlighted, any addition of electric lighting
would by definition increase maintenance and operating costs.
The next application discussed was urban boulevards with pedestrian crossings. Here, planting trees is a
common strategy to reduce driving speeds, with lighting sometimes provided more as a visual amenity than
a safety element. Luminaire selection can be driven as much by daytime appearance as by nighttime
performance. The ecoluminance approach was similar in appearance but utilized luminaires with more
downward light output and the relative placement of the luminaire and crosswalk to provide increased
vertical illuminance on pedestrians (from 0.9 to 3 footcandles) in the crosswalk with a resulting increase in
the RVP value for such pedestrian targets. In this example, the overall energy use was similar because the
number and wattage of the luminaires did not change, only the distribution of light did. J. Bullough
described ongoing research for the New Jersey Department of Transportation to use bollard-level lights
along crosswalks, which could provide a daytime visual element as well as efficient production of vertical
illuminances on pedestrians in crosswalks, which might be appropriate for ecoluminance applications. Such
systems tended to have reduced initial and operating costs because of smaller luminaires and reduced
wattages.
The final application mentioned was the use of planting vegetation along roadway rights-of-way such as
roadsides and highway medians with an objective of harvesting the plant material for biomass applications,
with NYSDOT either using the material itself to power or heat facilities or working with a private
contractor to plant, maintain and harvest such materials on a fee basis. While some visual information
improvements such as glare reduction on medians, control of blowing snow, and some of the visual
benefits addressed for roadway curves, the primary thrust of this application toward biomass was seen by
NYSERDA and NYSDOT as outside the main scope for the present project; the LRC will compile the
information it obtained during site visits to ESF (visiting Dr. T. Volk) and Cornell University (visiting Dr.
J. Lehmann and Dr. H. Mayton) into its report.
The primary conclusion from all of the analyses appeared to favor roundabout applications as a promising
candidate for subsequent demonstration. Following J. Bullough's presentation, he asked the participants for
general comments and feedback regarding the analyses and conclusions. P. Dunleavy mentioned that the
ecoluminance approach and evaluation methods seemed to be able to apply not only to lighting and

6-6
vegetation but also other elements of the landscaped environment, such as statues, or other elements such
as benches that could be found along many of the roadway applications under discussion. J. Tario
mentioned that the project scope as originally conceived by NYSERDA and NYSDOT requested an
emphasis on lighting and vegetation, and M. Rea pointed out that the general principles identified here
would surely be applicable to other elements including landscaping and that the concepts and tools
described in the project report should be able to be applied to each of these elements.
E. McDevitt stated that the use of vegetation as a roadside barrier might be an underappreciated solution for
some roadways and that even guide rails currently used are tested only in a limited fashion. J. Bullough
pointed out that data upon which to evaluate the potential for vegetation to absorb crashes is very limited
and based on assumptions which may be overly simplistic. M. Rea also pointed out that vegetation in some
areas could be a way to provide visual interest along otherwise monotonous highways and that this might
be a benefit to vegetation.
S. Misiewicz concurred that roundabouts were good candidates for demonstration, pointing out that many
roundabouts tend to have relatively high light levels, especially in rural areas or near residential
communities where there is little existing roadway lighting. S. Misiewicz also pointed out that many
communities have requested information from CDTC regarding the type of urban boulevard lighting and
landscaping treatments used south of Saratoga Springs along Route 9, and that the level of interest among
local municipalities may be very high. This application should not be dismissed. J. Tario expressed some
surprise that daytime luminaire appearance was often a basis for selecting a particular type of luminaire.
J. Tario asked participants whether there might be opportunities where presentation of the information
discussed during this meeting might be suitable. Several of the participants from NYSDOT and FHWA
mentioned that the Institute of Transportation Engineers was holding a meeting in the Capital District in
Spring 2009, and P. Dunleavy mentioned the International Conference on Ecology and Transportation. J.
Bullough thanked all of the participants for attending and participating in the discussion, and stated that
notes from the roundtable meeting would be distributed among all participants.
ATTENDEES
• J. Bullough, Lighting Research Center, Rensselaer Polytechnic Institute
• D. Chambers, Town of Colonie
• R. Drake, New York State Energy Research and Development Authority
• P. Dunleavy, New York State Department of Transportation
• M. Fowler-McDowell, Friedman Fisher
• H. Kabir, New York State Department of Transportation
• E. McDevitt, Federal Highway Administration

6-7
• S. Misiewicz, Capital District Transportation Committee
• L. Radetsky, Lighting Research Center, Rensselaer Polytechnic Institute
• M. Rea, Lighting Research Center, Rensselaer Polytechnic Institute
• J. Rowen, New York State Department of Transportation
• N. Skinner, Lighting Research Center, Rensselaer Polytechnic Institute
• J. Tario, New York State Energy Research and Development Authority
• J. Walter, National Grid
• R. Webber, Federal Highway Administration
• X. Zhang, Lighting Research Center, Rensselaer Polytechnic Institute

7-1
Section 7
RECOMMENDATIONS AND PROPOSED NEXT STEPS
SUMMARY OF RESULTS
The results of the analyses presented in the previous section indicate that for several criteria (safety, energy
and environmental impact, and economic costs), approaches to lighting and vegetation using the
ecoluminance approach devised in this report can have significant potential for improving visual
information for several roadway applications. Depending upon the application, there can also be reduced
electrical energy use and corresponding reductions in environmental impacts.
Table 15 lists each of the three primary roadway lighting applications that were evaluated (excluding the
use of vegetation along highway rights-of-way and medians for generating renewable energy), and the three
objective criteria (safety, energy/environmental, and economics). Each ecoluminance application was rated
as having high, medium or low promise for improving performance relative to the base case using
conventional lighting approaches.
Application →
Criteria ↓
Roundabouts
Curves and Exit
Ramps
Urban Boulevards
Safety/Visibility High High High
Energy/Environmental Medium Low Low
Economics/Cost Medium Low Low
Table 15. Relative ranking (in terms of promise for improving performance) for each ecoluminance
application according to the three types of criteria used for evaluation.
The roundabout and urban boulevard applications were rated high in terms of safety and visibility, mainly
because of the relatively large increases in pedestrian visibility provided by the ecoluminance solutions. For
curves and ramps, the presence of vegetation to reinforce existing delineation is probably also beneficial
because it provides a warning of the curve's presence. Regarding both the energy/environmental criteria and
the economics/cost criteria, the results of the evaluation above suggest that using the ecoluminance
approach, combining vegetation with more controlled lighting systems rather than using a large number of
pole mounted luminaires, can result in lower energy use (and less associated carbon emissions) and have a
lower initial and operation/maintenance cost than the conventional lighting typically found at roundabouts.
For the curves and exit ramps, these locations often do not have lighting, so the net result might be an
increase in electricity use and therefore operating costs. The ecoluminance solution proposed for urban
boulevards would not use substantially different amounts of electrical energy (and therefore would have
similar operating costs) than the conventional lighting used in many such roadways.

7-2
RECOMMENDATION
Based on reviewing the relative rankings in Table 15, roundabout applications are proposed as the most
promising one in which an ecoluminance approach, integrating lighting and vegetation, could provide the
greatest benefit in terms of safety, energy and environmental impact, and economic cost. Furthermore,
NYSDOT has been increasing the number of roundabouts in New York State because of the overall
beneficial impacts of these facilities on traffic flow and on safety (e.g., the reduced likelihood of high-speed
and head-on or perpendicular crashes).
A demonstration of the ecoluminance concept illustrated in Figure 13 could be implemented in a relatively
straightforward manner. For example, the existing conventional lighting could be switched off following
planting of vegetation and installation of landscape lighting and bollard level lighting. Importantly, such a
demonstration could be carried out in steps, starting with a temporary installation using battery powered
lighting systems to make final refinements to the lighting system before a larger effort to provide electrical
power was needed.
The following section presents a proposed Phase 2 work plan and schedule for an 18-month period to
develop a roundabout ecoluminance system demonstration, integrating lighting and vegetation at a location
in NYSDOT Region 1 (around Albany, NY). Such a demonstration will include observation of traffic and
pedestrian behavior, photometric measurements of light levels, assessments of energy use and maintenance
requirements, and the successful growth and maintenance of vegetation. The following work plan serves as
an addendum to the original proposal for PON 1173 submitted by the project team to NYSERDA in
October 2007.
PROPOSED WORK PLAN
An 18-month period is proposed for conducting the demonstration project of an ecoluminance design
solution for a roundabout in NYSDOT Region 1. The following section of the report outlines the tasks and
timeline that is envisioned for conducting the proposed Phase 2 demonstration.
Task 1: Identify Test Location
Working in cooperation with NYSDOT engineers, particularly in Region 1 (around Albany, NY), the
project team will identify a suitable roundabout location for conducting the evaluation. It is expected that
the process will also include discussions with local municipalities in order to identify the most practical
location for evaluating the proposed ecoluminance solution.
Deliverable. A memorandum to project sponsors (NYSERDA and NYSDOT) recommending the most
promising location, including agreements with the locality.

7-3
Task 2: Develop Equipment for Temporary Demonstration
As described above, a temporary (e.g., one or two nights) demonstration of lighting and vegetation
approaches is envisioned before a more permanent installation will be designed and implemented. The
lighting equipment will use battery and/or generator operation to avoid the relatively large expenses of
permanent electrical wiring. (This approach has worked successfully in a recent field demonstration of a
crosswalk lighting system installed for a one-night test in Old Bridge, NJ for the New Jersey Department of
Transportation.) The project team will also obtain vegetation species and specimens that can be planted
(temporarily, if necessary) in the central area of a roundabout. It is anticipated that to the extent possible,
the lighting equipment (luminaires, poles, lamps) will be used as part of the eventual longer-term
demonstration in Tasks 5 and 6.
Deliverable. A specification of the lighting equipment and vegetation that is proposed for the temporary
demonstration.
Task 3: Conduct Temporary Demonstration
Working in cooperation with the NYSDOT and the municipality hosting the test roundabout, the project
team will install and evaluate the short-term performance of the lighting and vegetation system by
measuring photometric characteristics, inviting and surveying relevant stakeholders, such as officials from
the local municipality, resident and business owners in the local neighborhood, local police and public
safety officers, DOT engineers, individuals from local transit authorities (i.e., CDTA), to obtain their input
and feedback during the short-term installation. This feedback will be used in subsequent tasks to refine
and finalize the proposed ecoluminance solution using lighting and vegetation.
Deliverable. An interim report to the project sponsors describing the installed ecoluminance system,
summarizing the evaluation results in terms of light levels, subjective impressions from invited participants,
and recommendations for the final ecoluminance design.
Task 4: Submit Final Design Plans
Before the longer-term installation and demonstration is set up, the project team will submit final plans for
the lighting and vegetation to NYSDOT for review and approval. This plan will include all of the
equipment that will be needed and will include a request to NYSDOT regarding assistance required to
complete installation (e.g., traffic control for installation, assistance with connecting to electrical power).
Deliverable. The final specification for the proposed lighting equipment, vegetation, including the final
locations for each component and requirements for installation.
Task 5: Installation of Ecoluminance System
7-4
Following approval of the submitted plans by NYSDOT the project team will work with the locality and
NYSDOT to install the lighting system at the specified roundabout location according to those plans.
Deliverable. A working ecoluminance system consisting of lighting and vegetation that will serve as an
alternative to conventional lighting at the roundabout location.
Task 6: Evaluation of Ecoluminance System
Once installation has been performed successfully, the conventional lighting system at the roundabout
location (assuming there is one) will be switched off and the ecoluminance system will be switched on.
LRC project team members will conduct a sample of photometric measurements periodically (e.g.,
monthly) during the duration of the demonstration, and will conduct a survey of a sample of drivers and
pedestrians using the roundabout during the evaluation period. Project team members will also make
observations of traffic and driver behavior, and record interactions between vehicles and pedestrians in
crosswalk areas. The project team will also monitor energy use through field measurement devices. The
evaluation will also include observations and measurements of the roundabout location before installation
of the proposed ecoluminance solution so that any changes in performance can be identified.
Deliverable. A progress report to the sponsors summarizing the results and findings from the evaluation.
Task 7. Documentation of Findings and Development of Recommendations
Following the evaluation period, the project team will complete its final report to NYSERDA and
NYSDOT, describing the development and design of the demonstrated ecoluminance concept, its
performance in the short-term and longer-term field demonstrations, and develop a specification for
integrating lighting and vegetation at roundabouts that could be used by agencies such as NYSDOT in
determining where and when to apply the ecoluminance approach elsewhere.
Deliverable. A final report containing a summary of all project findings and results, and recommendations
to NSYDOT including specifications for ecoluminance approaches to roundabout lighting and vegetation.
SCHEDULE
The proposed Phase 2 tasks are planned to be conducted according to the schedule chart in Table 16. Once
a firm start date has been identified, the project team will submit a final schedule (keeping within a total
project period of 18 months) that will ensure that installation does not fall during winter months.

7-5
1 2 3 4 5 6 7 8 9 10 11 12 13 14 15 16 17 18
1. Identify location
2. Develop equipment
3. Temporary demonstration
4. Submit final design
5. Installation
6. Evaluation of site
7. Documentation and report
MonthTask
Table 16. Proposed timeline for proposed Phase 2 roundabout ecoluminance demonstration.
BENEFITS FOR NEW YORK STATE
Present practices for lighting along roundabouts in New York State are energy intensive, primarily because
of the relative "newness" of these types of roadway facilities. Understand ways in which visual information
can be provided to result in increased pedestrian visibility, while maintaining traffic flow by providing
drivers with the visual guidance they need to quickly and safely navigate roundabouts, can result in reduced
energy use and the associated environmental benefits that accompany reduced energy use.
We believe that the proposed demonstration can serve as a beachhead for considering an ecoluminance
approach to other roadway types and facilities, possibly including curved exit ramps and urban boulevards.
It is anticipated that a successful completion of the Phase 2 demonstration will result in a proven
methodology for determining when such approaches are likely to be offer the most benefits, and which
evaluation tools are most useful in quantifying those benefits.

8-1
Section 8
REFERENCES
American Association of State Highway and Transportation Officials. 2005. Roadway Lighting Design
Guide. Washington, DC: American Association of State Highway and Transportation Officials.
Brons JA., Bullough JD, Rea MS. 2008. Outdoor site-lighting performance: A comprehensive and
quantitative framework for assessing light pollution. Lighting Research and Technology 40(3): 201-224.
Bullough JD et al. 2009. Design and Evaluation of Effective Crosswalk Illumination. Trenton, NJ: New
Jersey Department of Transportation.
Burden D. 2008. Switchgrass Profile. Ames, IA: Agricultural Marketing Resource Center, Iowa State
University.
Coffin AW. 2007. From roadkill to road ecology: A review of the ecological effects of roads. Journal of
Transport Geography 15: 396–406.
Commission International de l'Éclairage. 1992. Roadway Lighting as an Accident Countermeasure. Vienna,
Austria: Commission International de l'Éclairage.
Cook J, Beyea J. 2000. Bioenergy in the United States: Progress and possibilities. Biomass and Bioenergy
18: 441-455.
Corkle J, Giese JL, Marti MM. 2001. Investigating the Effectiveness of Traffic Calming Strategies on
Driver Behavior, Traffic Flow and Speed, MN/RC –2002-02. St. Paul, MN: Minnesota Department of
Transportation.
Cornell University. 2008. Pellet Stove Demonstrations. Ithaca, NY: Cornell University.
Dobson L. 2008. Biomass for Biofuel = Net Energy Loss or Gain. Available at
http://www.enviroalternatives.com/biomass.html#Loss/Gain. Accessed 10-17-08.
Edwards C, Gibbons R. 2008. The relationship of vertical illuminance to pedestrian visibility in crosswalks.
Transportation Research Record (2056): 9.

8-2
Eklund NH, Boyce PR, Simpson SN. 2001. Lighting and sustained performance: Modeling data-entry task
performance. Journal of the Illuminating Engineering Society 30: 126.
Escobedo FJ, Seitz JA, Zipperer WC. 2008. Carbon Sequestration and Storage by Gainesville's Urban
Forest. Gainesville, FL: University of Florida.
Forman RT, Deblinger RD. 2000. The ecological road-effect of a Massachusetts (USA) suburban highway.
Conservation Biology 14(1): 36-46.
Forman RT. 2007. A massive increase in roadside woody vegetation: Goals, pros and cons. In Proceedings
of the 2007 International Conference on Ecology and Transportation. Raleigh, NC: Center for
Transportation and the Environment, North Carolina University.
Forman R, Alexander LE. 1998. Roads and their major ecological effects. Annual Reviews on Ecological
Systems 29: 207-231.
Freedman M, Janoff MS, Koth BW, McCunney W. 1975. Fixed Illumination for Pedestrian Protection:
User’s Manual, FHWA-RD-76-9. Washington, DC: Federal Highway Administration.
Gibbons R, Hankey J. 2006. Influence of vertical illuminance on pedestrian visibility in crosswalks.
Transportation Research Record (1973): 105.
Goodspeed CH, Rea MS. 1999. The significance of surround conditions for roadway signs. Journal of the
Illuminating Engineering Society 28(1): 164.
Hasson P, Lutkevich P, Ananthanarayanan B, Watson P, Knoblauch R. 2002. Field test for lighting to
improve safety at pedestrian crosswalks. TRB Visibility Symposium, Iowa City, IA.
Houghton RA., Hackler JL, Lawrence KT. 1999. The U.S. carbon budget: Contributions from land-use
change. Science 285(5427): 574.
Huang B. 1987. Dynamic simulation of a vehicle interacting with biological and physical systems. In
Proceedings of the American Control Conference. New York, NY: Institute of Electrical and Electronics
Engineers.
Illuminating Engineering Society of North America. 2000. American National Standard Practice for
Roadway Lighting, RP-8-00. New York, NY: Illuminating Engineering Society of North America.
8-3
Illuminating Engineering Society of North America. 1989. Value of Public Lighting. New York, NY:
Illuminating Engineering Society of North America.
Jaskiewicz F. 2001. Pedestrian level of service based on trip quality. In Transportation Research Board
Circular E-C019. Washington, DC: Transportation Research Board.
Kao H. 1969. Feedback concepts of driver behavior and the highway information system. Accident
Analysis and Prevention 1(1): 65-76.
Knapp KK, Yi X, Oakasa T, Thimm W, Hudson E, Rathmann C. 2004. Deer-Vehicle Crash
Countermeasure Toolbox: A Decision and Choice. College Station, TX: Texas Transportation Institute.
Kolb E. 2006. Composting roadkilled deer. Public Roads 70(1): 2.
Lehmann J, Gaunt J, Rondon M. 2006. Bio-char sequestration in terrestrial ecosystems: A review.
Mitigation and Adaptation Strategies for Global Change 11: 403–427.
Leslie RP, Rodgers PA. 1996. The Outdoor Lighting Pattern Book. New York, NY: McGraw-Hill.
Marris E. 2006. Putting the carbon back: Black is the new green. Nature 442: 624-626.
Mundell J. 1998. Construction and maintaining traffic calming devices. In ITE Annual Meeting
Compendium. Washington, DC: Institute of Transportation Engineers.
National Cooperative Highway Research Program (Neuman TR et al.). 2003. Guidance for Implementation
of the AASHTO Strategic Highway Safety Plan, Volume 3: A Guide for Addressing Collisions with Trees
in Hazardous Locations. Washington, DC: Transportation Research Board.
Neuhauser EF et al. 1996. Northeast energy perspective: Willow biomass - Bioenergy industry
development. In First Conference of the Short Rotation Woody Crops Operations Working Group.
Paducah, KY: Short Rotation Woody Crops Operations Working Group.
New York State Department of Transportation. 1979. Policy on Highway Lighting. Albany, NY: New York
State Department of Transportation.
8-4
New York State Department of Transportation. 1995. Highway Design Manual. Albany, NY: New York
State Department of Transportation.
New York State Department of Transportation. 2008. Standard Specifications. Albany, NY: New York
State Department of Transportation.
Nixon WA, Davison M, Kochumman G. 2006. Living Snow Fences. Des Moines, IA: Iowa Highway
Research Board.
Nowak CA. 2005. Right-of-Way Vegetation Management Program Assessment Report. Albany, NY: New
York State Department of Transportation.
Oak Ridge National Laboratory. 2008. Biofuels from Switchgrass: Greener Energy Pastures.” Available at
http://bioenergy.ornl.gov/papers/misc/switgrs.html. Accessed 10-17-08.
Patzek T. 2004. Critical Reviews in Plant Sciences 23: 519.
Pimentel D, Patzek T. 2005. Natural Resource Research 14: 65.
Rea MS (editor). 1993. Lighting Handbook: Reference and Application, 8th Edition. New York, NY:
Illuminating Engineering Society of North America.
Rea MS (editor). 2000. IESNA Lighting Handbook: Reference and Application, 9th Edition. New York,
NY: Illuminating Engineering Society of North America.
Rea MS, Bullough JD. 2001. Application efficacy. Journal of the Illuminating Engineering Society 30(2):
73-96.
Rea MS, Ouellette MJ. 1991. Relative visual performance: A basis for application. Lighting Research and
Technology 23(3).
Schnitkey G, Good D. 2008. Corn Versus Soybean Returns in 2008, FEFO 08-06. Champaign-Urbana,IL:
University of Illinois.
Scholz F, Hasse U. Permanent wood sequestration: The solution to the global carbon dioxide problem.
ChemSusChem 1(5): 381–384.

8-5
Scott PP. 1980. The Relationship Between Road Lighting Quality and Accident Frequency, TRRL Report
29. Crowthorne, UK: Transport and Road Research Laboratory.
Skelton RR. 1958. Crash barrier tests on multiflora rose hedges. Highway Research Board Bulletin (185):
1-14.
Skinner NP, Bullough JD. 2009. Effects of roadway delineator spacing, size, and height on drivers'
perception and behavior. Transportation Research Board 88th Annual Meeting. Washington, DC:
Transportation Research Board.
Tabler RD. 2003. Controlling Blowing and Drifting Snow with Snow Fences and Road Design.
Washington, DC: National Cooperative Highway Research Program.
Weston LA, Senesac AF, Weston PA. 2008. Plant Materials for Vegetation Management along New York
State Roadsides. Albany, NY: New York State Department of Transportation.
Wolverton BC, Wolverton JD. 1996. Interior plants: Their influence on airborne microbes inside energy-
efficient buildings. Journal of the Mississippi Academy of Sciences 41(2): 99-105.
Zeigler A.J et al. 1986. Guide to Management of Roadside Trees, FHWA-IP-86-17. Washington, DC:
Federal Highway Administration.
Zeng N. 2008. Carbon sequestration via wood burial. Carbon Balance and Management 3: 1.
Zhang C. 2006. Performance of Luminaire Metrics for Roadway Lighting Systems [M.S. thesis, lighting].
Troy, NY: Rensselaer Polytechnic Institute.

A-1
APPENDIX A
ROADSIDE VEGETATION ANALYSIS SUMMARY
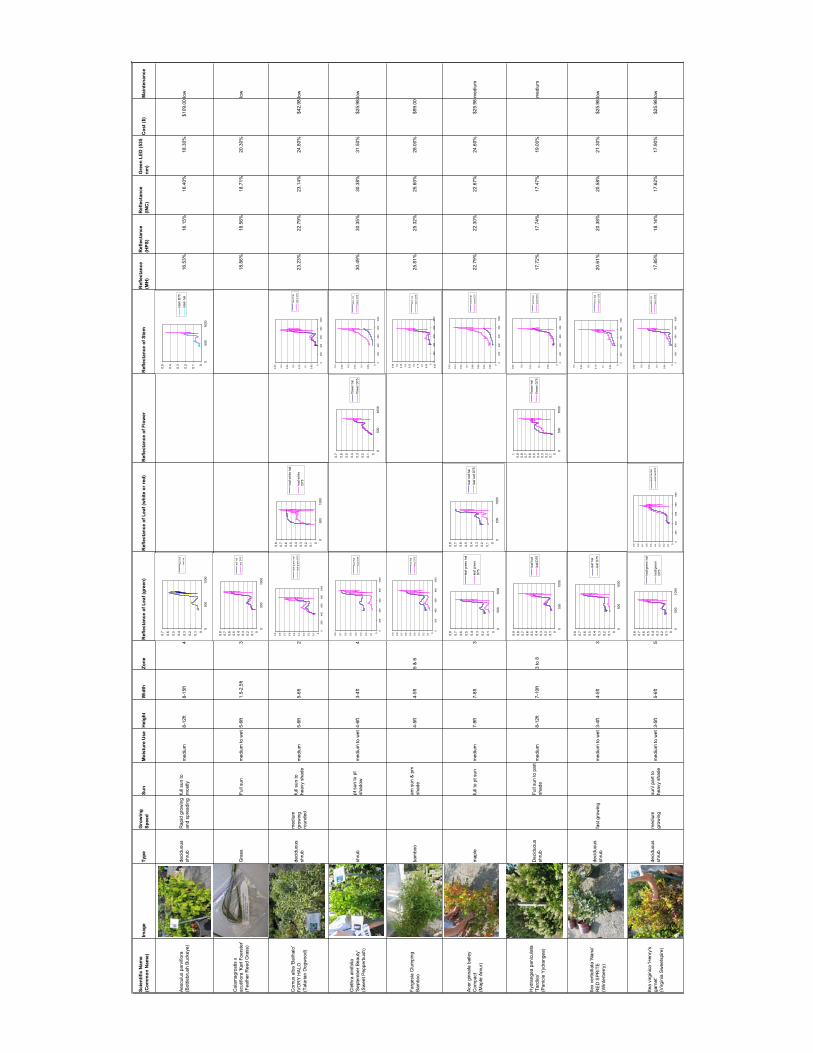
Scie
ntifi
c N
ame
(Com
mon
Nam
e)Im
age
Type
Gro
win
gSp
eed
Sun
Moi
stur
e U
seH
eigh
tW
idth
Zone
Ref
lect
ance
of L
eaf (
gree
n)R
efle
ctan
ce o
f Lea
f (w
hite
or r
ed)
Ref
lect
ance
of F
low
erR
efle
ctan
ce o
f Ste
mR
efle
ctan
ce(M
H)
Ref
lect
ance
(HPS
)R
efle
ctan
ce(IN
C)
Gre
en L
ED (5
35
nm)
Cos
t ($)
Mai
nten
ance
Aes
culu
s pa
rvifl
ora
(Bot
tlebr
ush
Buc
keye
)de
cidu
ous
shru
bR
apid
gro
win
g an
d sp
read
ing
full
sun
to
mos
tlym
ediu
m8-
12ft
8-15
ft4
16.5
3%16
.15%
16.4
0%18
.30%
$109
.00
low
Cal
amag
rost
is x
ac
utifl
ora
'Kar
l Foe
rste
r' (F
eath
er R
eed
Gra
ss)
Gra
ssFu
ll su
nm
ediu
m to
wet
5-6f
t1.
5-2.
5ft
318
.86%
18.5
6%18
.71%
20.3
0%lo
w
Cor
nus
alba
'Bai
lhal
o'
IVO
RY
HA
LO
(Tat
aria
n D
ogw
ood)
deci
duou
ssh
rub
med
ium
grow
ing
roun
ded
full
sun
to
heav
y sh
ade
med
ium
5-6f
t5-
6ft
223
.23%
22.7
9%23
.14%
24.8
0%$4
2.98
low
Cle
thra
aln
ifolia
'S
epte
mbe
r Bea
uty'
(Sw
eet P
eppe
rbus
h)sh
rub
pt s
un to
pt
shad
owm
ediu
m to
wet
4-6f
t3-
4ft
430
.49%
30.3
5%30
.38%
31.5
0%$2
5.98
low
Farg
esia
Clu
mpi
ng
Bam
boo
bam
boo
am s
un &
pm
sh
ade
4-5f
t4-
5ft
5 &
625
.81%
25.3
2%25
.60%
28.0
0%$9
9.00
Ace
r gin
nala
bai
ley
Com
pact
(Map
le A
mur
)m
aple
full
to p
t sun
med
ium
7-9f
t7-
8ft
322
.79%
22.3
0%22
.67%
24.6
0%$2
5.98
med
ium
Hyd
rang
ea p
anic
ulat
a 'T
ardi
va'
(Pan
icle
Yyd
rang
ea)
Dec
iduo
ussh
rub
Full
sun
to p
art
shad
em
ediu
m8-
12ft
7-10
ft3
to 8
17.7
2%17
.74%
17.4
7%19
.00%
med
ium
Ilex
verti
cilla
ta 'N
ana'
R
ED
SP
RIT
E(W
inte
rber
ry)
deci
duou
ssh
rub
fast
gro
win
gm
ediu
m to
wet
3-4f
t4-
5ft
320
.61%
20.3
8%20
.58%
21.3
0%$2
5.98
low
Itea
virg
inic
a 'H
enry
's
garn
et'
(Virg
inia
Sw
eets
pire
)
deci
duou
ssh
rub
med
ium
grow
ing
sun/
par
t to
heav
y sh
ade
med
ium
to w
et3-
5ft
5-6f
t5
17.8
5%18
.14%
17.6
2%17
.90%
$25.
98lo
w
0
0.1
0.2
0.3
0.4
0.5
0.6
0.7
050
010
00
leaf
D75
leaf
hal
0
0.1
0.2
0.3
0.4
0.5
050
010
00
stem
D75
stem
hal
00.
10.
20.
30.
40.
50.
60.
70.
8
050
010
00
leaf
hal
leaf
D75
0
0.1
0.2
0.3
0.4
0.5
0.6
0.7
0.8
0.9
020
040
060
080
010
00
leaf
gre
en h
al
leaf
gre
en D
75
00.
10.
20.
30.
40.
50.
60.
70.
8
050
010
00
leaf
whi
te h
al
leaf
whi
teD
75
0
0.050.
1
0.150.
2
0.250.
3
0.35
020
040
060
080
010
00
stem
hal
stem
D75
0
0.1
0.2
0.3
0.4
0.5
0.6
0.7
0.8
020
040
060
080
010
00
leaf
hal
leaf
D75
0
0.050.
1
0.150.
2
0.250.
3
020
040
060
080
010
00
stem
hal
stem
D75
0
0.1
0.2
0.3
0.4
0.5
0.6
0.7
050
010
00
flow
er h
alflo
wer
D75
0
0.1
0.2
0.3
0.4
0.5
0.6
0.7
0.8
0.9
020
040
060
080
010
00
leaf
hal
leaf
D75
-0.0
50
0.050.
1
0.150.
2
0.250.
3
0.350.
4
0.45
020
040
060
080
010
00
stem
hal
stem
D75
0
0.1
0.2
0.3
0.4
0.5
0.6
0.7
0.8
050
010
00
leaf
gre
en h
al
leaf
gre
enD
75
00.
1
0.2
0.3
0.4
0.5
0.6
0.7
0.8
050
010
00
leaf
red
hal
leaf
red
D75
0
0.02
0.04
0.06
0.080.
1
0.12
0.14
0.16
020
040
060
080
010
00
stem
hal
stem
D75
00.
10.
20.
30.
40.
50.
60.
70.
80.
91
050
010
00
flow
er h
alflo
wer
D75
00.
10.
20.
30.
40.
50.
60.
70.
80.
9
050
010
00
leaf
hal
leaf
D75
0
0.050.
1
0.150.
2
0.25
020
040
060
080
010
00
stem
hal
stem
D75
00.
10.
20.
30.
40.
50.
60.
70.
8
050
010
00
leaf
hal
leaf
D75
0
0.050.
1
0.150.
2
0.250.
3
020
040
060
080
010
00
stem
hal
stem
D75
00.
10.
20.
30.
40.
50.
60.
70.
8
050
010
00
leaf
gre
en h
al
leaf
gre
enD
75
0
0.1
0.2
0.3
0.4
0.5
0.6
0.7
0.8
0.9
020
040
060
080
010
00
leaf
red
hal
leaf
red
D75
0
0.050.
1
0.150.
2
0.25
020
040
060
080
010
00
stem
hal
stem
D75

Scie
ntifi
c N
ame
(Com
mon
Nam
e)Im
age
Type
Gro
win
gSp
eed
Sun
Moi
stur
e U
seH
eigh
tW
idth
Zone
Ref
lect
ance
of L
eaf (
gree
n)R
efle
ctan
ce o
f Lea
f (w
hite
or r
ed)
Ref
lect
ance
of F
low
erR
efle
ctan
ce o
f Ste
mR
efle
ctan
ce(M
H)
Ref
lect
ance
(HPS
)R
efle
ctan
ce(IN
C)
Gre
en L
ED (5
35
nm)
Cos
t ($)
Mai
nten
ance
Eup
ator
ium
(Joe
Pye
Wee
d)H
erba
ceou
spe
renn
ial
Full
sun
to p
art
shad
em
ediu
m5-
7ft
2-4f
t4
12.3
8%12
.29%
12.3
0%12
.90%
low
mis
cant
hus
giga
nteu
mgr
ass
5ft
16.7
7%16
.59%
16.6
5%17
.90%
Phy
soca
rpus
opu
lifol
ius
(Nin
ebar
k N
ugge
t)de
cidu
ous
shru
bfu
ll su
ndr
y tp
med
ium
6-8f
t6-
8ft
330
.95%
31.3
0%30
.51%
31.9
0%$2
8.98
med
ium
Rud
eshe
im h
albe
rsta
m6f
t21
.93%
21.7
8%21
.90%
22.5
0%
Spi
raea
x v
anho
utte
i (S
pire
a)de
cidu
ous
shru
bm
ediu
mgr
owin
gfu
ll su
nm
ediu
m6-
8ft
10-1
2ft
325
.73%
25.3
7%25
.66%
27.1
0%$2
5.98
low
Rhu
s ty
phin
a 'B
ailti
ger'
TIG
ER
EY
ES
(S
umac
Tig
er E
yes)
deci
duou
ssh
rub
mei
dum
grow
ing
full
sun
dry
to m
ediu
m10
-12f
t6-
8ft
439
.41%
40.1
3%38
.57%
39.9
0%$2
5.98
med
ium
Mis
cant
hus
sine
nsis
'Z
ebrin
us'
(Zeb
ra G
rass
)
Orn
amen
tal
gras
sFu
ll su
n to
par
t sh
ade
med
ium
5-8f
t4-
6ft
511
.85%
11.6
1%11
.78%
12.8
0%lo
w
Mis
cant
hus
sine
nsis
A
nder
ss (C
hine
se S
ilver
G
rass
)
Orn
amen
tal
gras
sFu
ll su
n to
par
t sh
ade
med
ium
5-8f
t5
15.8
0%15
.63%
15.6
6%16
.70%
low
Yuc
ca fi
lam
ento
sa(A
dam
Nee
dle)
ever
gree
nsh
rub
slow
gro
win
gfu
ll su
ndr
y to
med
ium
2-3f
t2-
3ft
410
.13%
9.88
%9.
98%
11.4
0%$2
5.98
low
0
0.1
0.2
0.3
0.4
0.5
0.6
0.7
050
010
00
leaf
hal
leaf
D75
0
0.050.
1
0.150.
2
0.250.
3
0.35
020
040
060
080
010
00
stem
hal
stem
D75
0
0.2
0.4
0.6
0.81
1.2
020
040
060
080
010
00
leaf
hal
leaf
D75
0
0.02
0.04
0.06
0.080.
1
0.12
0.14
0.16
0.18
020
040
060
080
010
00
stem
hal
stem
D75
00.
10.
20.
30.
40.
50.
60.
70.
80.
91
020
040
060
080
010
00
flow
er h
al
flow
er D
75
0
0.2
0.4
0.6
0.81
1.2
050
010
00
leaf
hal
leaf
D75
0
0.050.
1
0.150.
2
0.250.
3
0.350.
4
020
040
060
080
010
00
stem
hal
stem
D75
0
0.2
0.4
0.6
0.81
050
010
00
leaf
hal
leaf
D75
0
0.02
0.04
0.06
0.080.
1
0.12
0.14
0.16
0.18
020
040
060
080
010
00
stem
hal
stem
D75
0
0.2
0.4
0.6
0.81
050
010
00
leaf
hal
leaf
D75
0
0.050.
1
0.150.
2
0.250.
3
0.35
020
040
060
080
010
00
stem
hal
stem
D75
0
0.2
0.4
0.6
0.81
050
010
00
leaf
hal
leaf
D75
00.
10.
20.
30.
40.
50.
60.
70.
8
050
010
00
leaf
gre
en h
al
leaf
gre
enD
75
00.
10.
20.
30.
40.
50.
60.
70.
80.
91
020
040
060
080
010
00
leaf
whi
te h
al
leaf
whi
te D
75
0
0.1
0.2
0.3
0.4
0.5
0.6
050
010
00
flow
er h
alflo
wer
D75
00.
10.
20.
30.
40.
50.
60.
70.
8
050
010
00
leaf
hal
leaf
D75
0
0.050.
1
0.150.
2
0.25
020
040
060
080
010
00
stem
hal
stem
D75
00.
10.
20.
30.
40.
50.
60.
7
050
010
00
leaf
gre
en h
al
leaf
whi
teD
75
00.
10.
20.
30.
40.
50.
60.
70.
8
050
010
00
leaf
whi
te h
al
leaf
whi
teD
75
0
0.050.
1
0.150.
2
0.25
020
040
060
080
010
00
stem
hal
stem
D75
0
0.1
0.2
0.3
0.4
0.5
050
010
00
wee
ds h
alw
eeds
D75